


Description
Focus on
inclusion
MEASURING FINANCIAL
INCLUSION IN TURKEY
This brief summarizes the current state of financial inclusion in Turkey in terms of financial
service usage and the level of access to financial services for individuals and small and
medium-sized enterprises (SMEs).
INTRODUCTION
Turkey is the 16th largest economy in the world in terms of GDP, a member of G20, OECD and a candidate
for European Union membership. Its population is technologically well-connected, with mobile and
smartphone penetration close to that of major EU nations, yet fewer than 60% of adults have a bank
account at a formal financial institution — less than across the EU and much less than the Turkish financial
infrastructure could potentially accommodate. The Microfinance Centre (MFC), with support from the
MetLife Foundation, carried out a short-term research project to explore financial inclusion issues in Turkey,
specifically to:
ï‚·
map information sources on usage and access to financial services and the availability of data
ï‚·
assess the level and quality of financial inclusion of individuals and SMEs.
METHODOLOGY
The MFC uses its own diagnostic methodology (the “Access to Finance Scorecard”, or AFS) to
comprehensively assess the state of financial inclusion at a country level. Research findings provide
detailed evidence of the current state of inclusion and conditions that constitute access, and as such can
be utilized to develop strategies to broaden and deepen national access to finance.
With support from
.
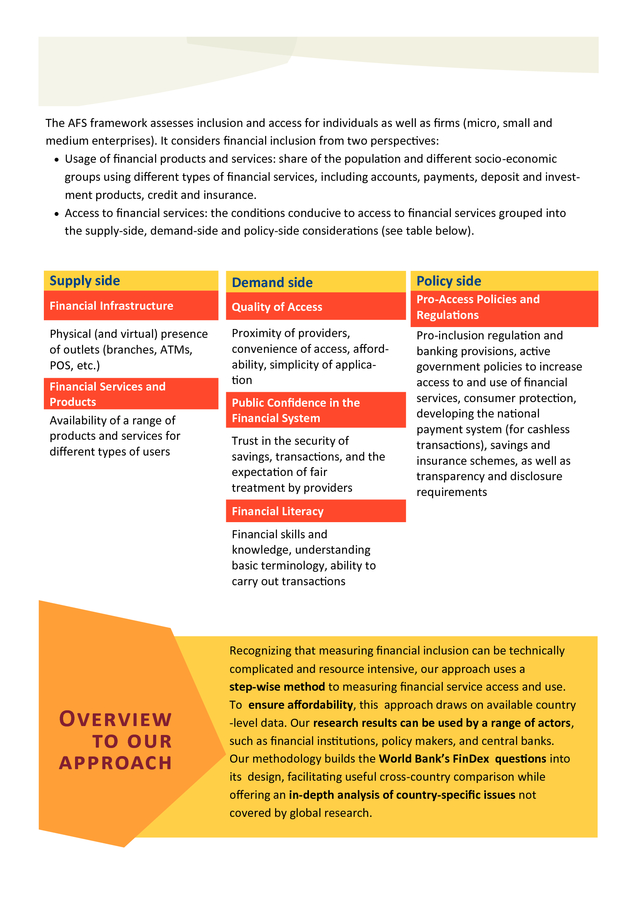
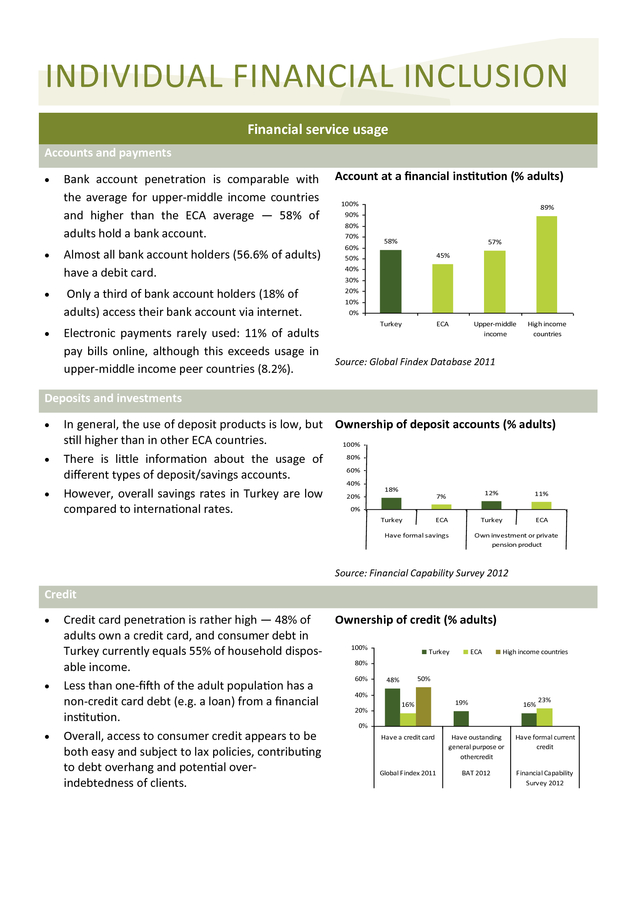
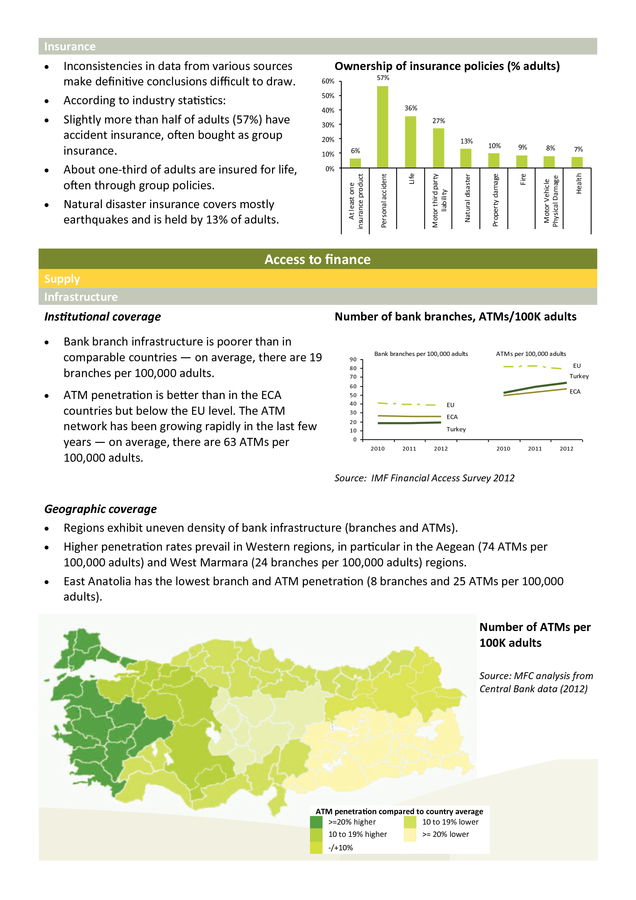
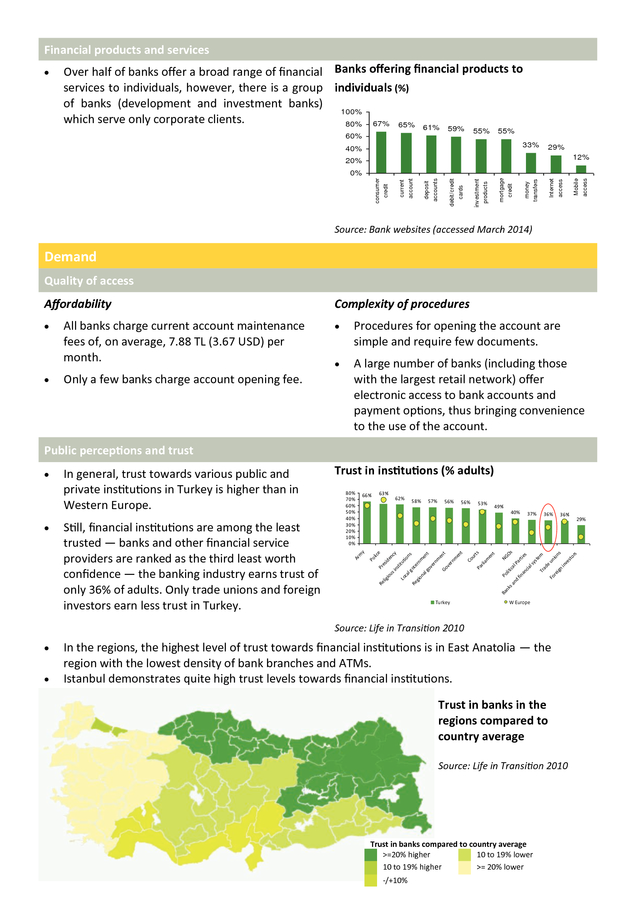
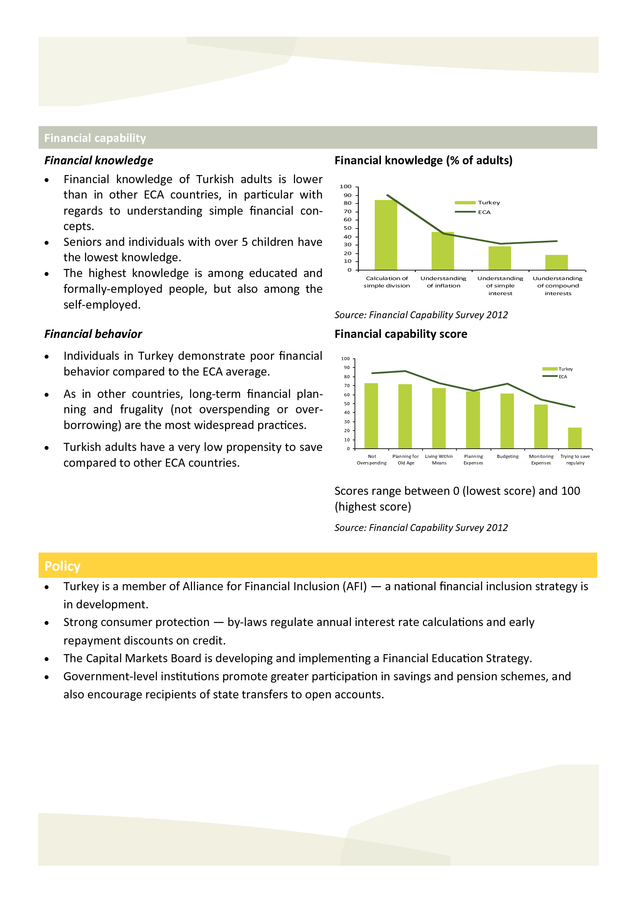
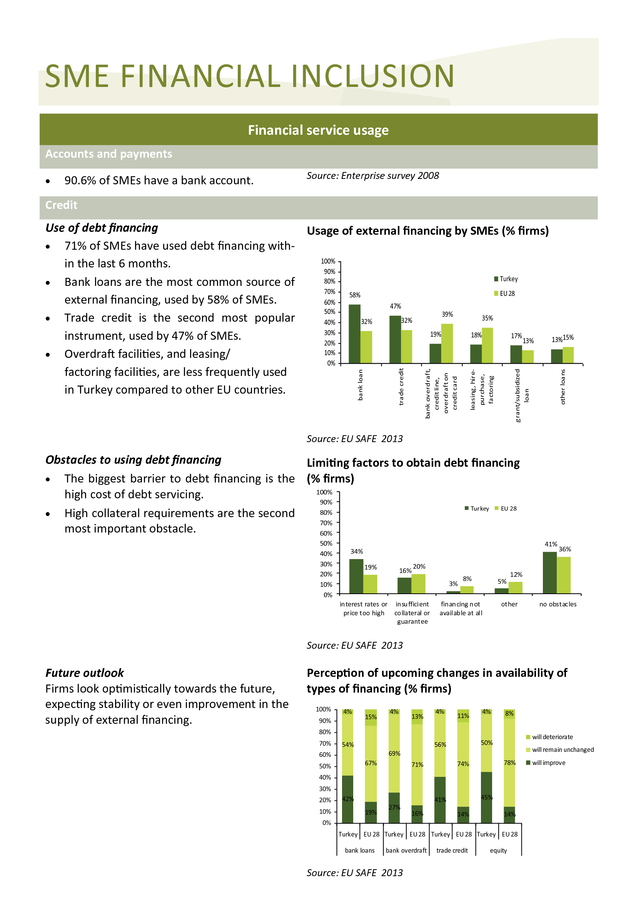
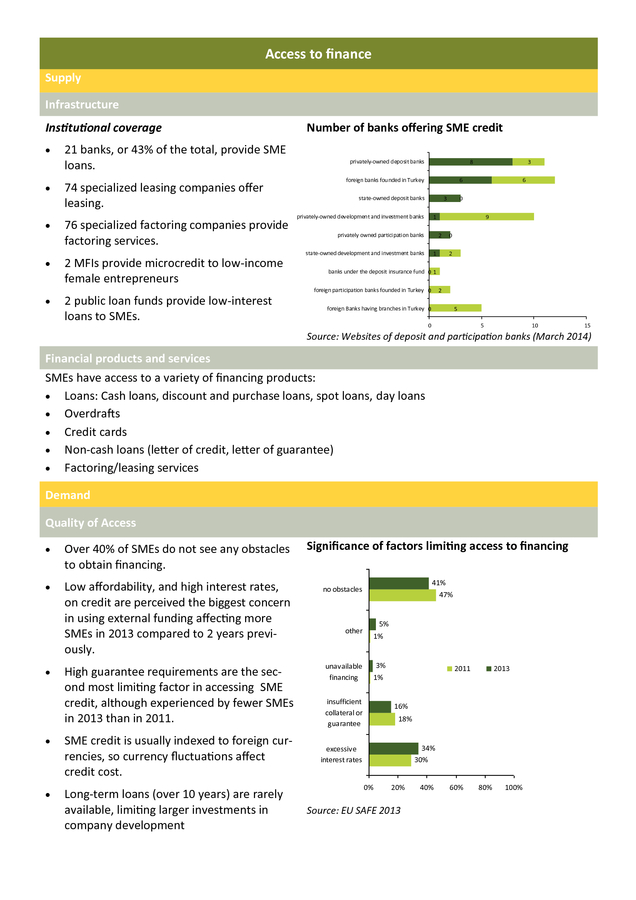
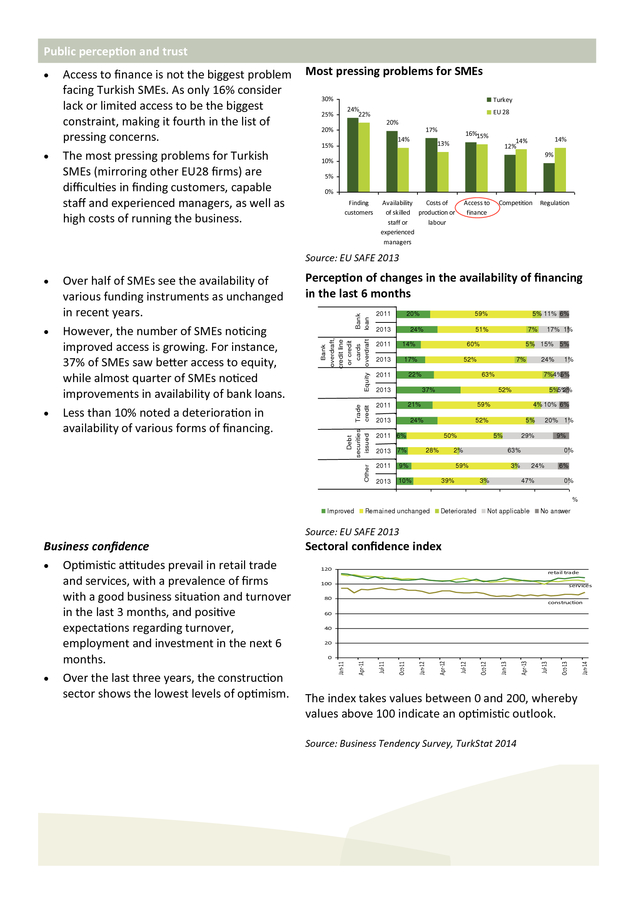
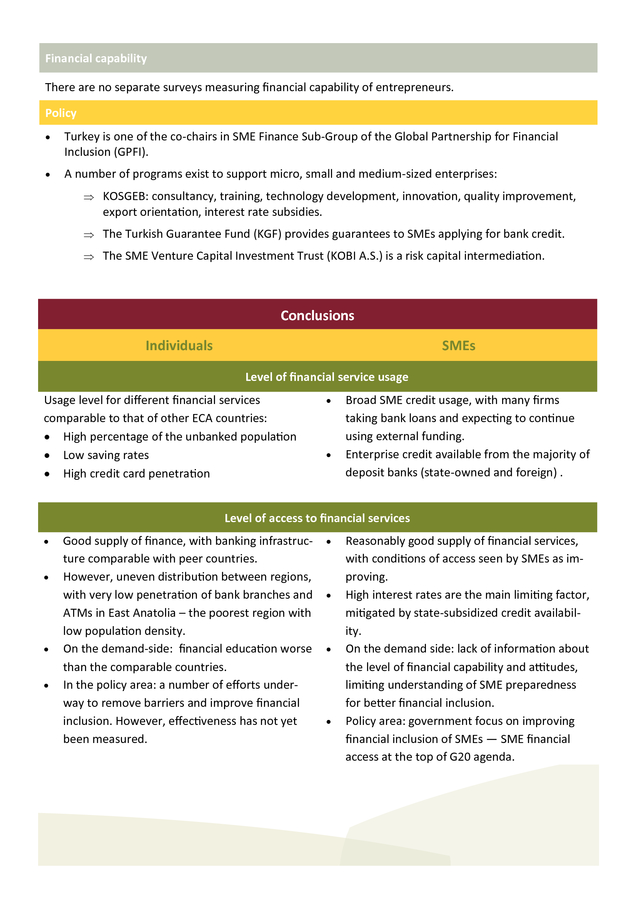
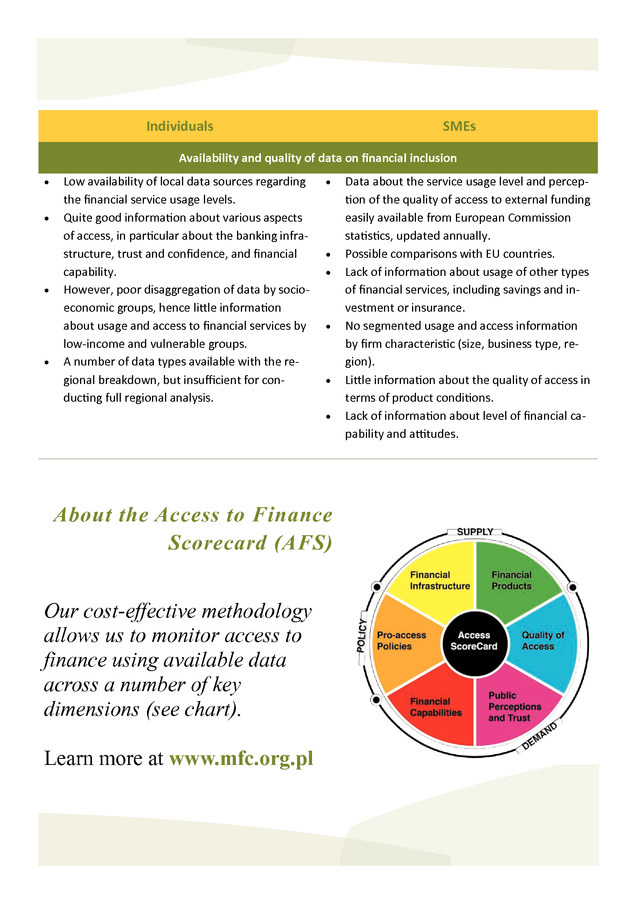
The AFS framework assesses inclusion and access for individuals as well as firms (micro, small and medium enterprises). It considers financial inclusion from two perspectives: ï‚· Usage of financial products and services: share of the population and different socio-economic groups using different types of financial services, including accounts, payments, deposit and investment products, credit and insurance. ï‚· Access to financial services: the conditions conducive to access to financial services grouped into the supply-side, demand-side and policy-side considerations (see table below). Supply side Demand side Policy side Financial Infrastructure Quality of Access Pro-Access Policies and Regulations Physical (and virtual) presence of outlets (branches, ATMs, POS, etc.) Proximity of providers, convenience of access, affordability, simplicity of application Financial Services and Products Availability of a range of products and services for different types of users Public Confidence in the Financial System Trust in the security of savings, transactions, and the expectation of fair treatment by providers Pro-inclusion regulation and banking provisions, active government policies to increase access to and use of financial services, consumer protection, developing the national payment system (for cashless transactions), savings and insurance schemes, as well as transparency and disclosure requirements Financial Literacy Financial skills and knowledge, understanding basic terminology, ability to carry out transactions Overview to our approach Recognizing that measuring financial inclusion can be technically complicated and resource intensive, our approach uses a step-wise method to measuring financial service access and use. To ensure affordability, this approach draws on available country -level data. Our research results can be used by a range of actors, such as financial institutions, policy makers, and central banks. Our methodology builds the World Bank’s FinDex questions into its design, facilitating useful cross-country comparison while offering an in-depth analysis of country-specific issues not covered by global research. . INDIVIDUAL FINANCIAL INCLUSION Financial service usage Accounts and payments ï‚· ï‚· ï‚· ï‚· Bank account penetration is comparable with the average for upper-middle income countries and higher than the ECA average — 58% of adults hold a bank account. Almost all bank account holders (56.6% of adults) have a debit card. Only a third of bank account holders (18% of adults) access their bank account via internet. Electronic payments rarely used: 11% of adults pay bills online, although this exceeds usage in upper-middle income peer countries (8.2%). Account at a financial institution (% adults) 100% 90% 89% 80% 70% 60% 58% 57% 45% 50% 40% 30% 20% 10% 0% Turkey ECA Upper-middle income High income countries Source: Global Findex Database 2011 Deposits and investments ï‚· ï‚· ï‚· In general, the use of deposit products is low, but Ownership of deposit accounts (% adults) still higher than in other ECA countries. 100% 80% There is little information about the usage of 60% different types of deposit/savings accounts. 40% 18% 12% 11% However, overall savings rates in Turkey are low 20% 7% 0% compared to international rates. Turkey ECA Have formal savings Turkey ECA Own investment or private pension product Source: Financial Capability Survey 2012 Credit ï‚· ï‚· ï‚· Credit card penetration is rather high — 48% of Ownership of credit (% adults) adults own a credit card, and consumer debt in 100% Turkey ECA High income countries Turkey currently equals 55% of household dispos80% able income. 60% 50% 48% Less than one-fifth of the adult population has a 40% 23% 19% non-credit card debt (e.g. a loan) from a financial 16% 16% 20% institution. 0% Have a credit card Have oustanding Have formal current Overall, access to consumer credit appears to be general purpose or credit both easy and subject to lax policies, contributing othercredit to debt overhang and potential overGlobal Findex 2011 BAT 2012 Financial Capability Survey 2012 indebtedness of clients. . Insurance 36% 40% 13% 10% 6% 9% 8% Property damage 10% Motor Vehicle Physical Damage 20% Fire 27% 30% 7% Financial Capability Survey 2012 Health 0% Natural disaster ï‚· 50% Motor third party liability ï‚· 57% Life ï‚· Ownership of insurance policies (% adults) 60% Personal accident ï‚· Inconsistencies in data from various sources make definitive conclusions difficult to draw. According to industry statistics: Slightly more than half of adults (57%) have accident insurance, often bought as group insurance. About one-third of adults are insured for life, often through group policies. Natural disaster insurance covers mostly earthquakes and is held by 13% of adults. At least one insurance product ï‚· Insurance Association of Turkey, 2012 Access to finance Supply Infrastructure Institutional coverage ï‚· ï‚· Number of bank branches, ATMs/100K adults Bank branch infrastructure is poorer than in comparable countries — on average, there are 19 branches per 100,000 adults. ATM penetration is better than in the ECA countries but below the EU level. The ATM network has been growing rapidly in the last few years — on average, there are 63 ATMs per 100,000 adults. 90 80 70 Bank branches per 100,000 adults ATMs per 100,000 adults EU Turkey 60 50 40 30 ECA EU ECA 20 10 0 Turkey 2010 2011 2012 2010 2011 2012 Source: IMF Financial Access Survey 2012 Geographic coverage ï‚· Regions exhibit uneven density of bank infrastructure (branches and ATMs). ï‚· Higher penetration rates prevail in Western regions, in particular in the Aegean (74 ATMs per 100,000 adults) and West Marmara (24 branches per 100,000 adults) regions. ï‚· East Anatolia has the lowest branch and ATM penetration (8 branches and 25 ATMs per 100,000 adults). Number of ATMs per 100K adults Source: MFC analysis from Central Bank data (2012) ATM penetration compared to country average >=20% higher 10 to 19% lower 10 to 19% higher >= 20% lower -/+10% . Financial products and services ï‚· Over half of banks offer a broad range of financial Banks offering financial products to services to individuals, however, there is a group individuals (%) of banks (development and investment banks) 100% which serve only corporate clients. 80% 67% 65% 61% 59% 60% 55% 55% 33% 40% 29% 12% 20% Mobile access Internet access money transfers mortgage credit investment products debit/credit cards deposit accounts current account consumer credit 0% Source: Bank websites (accessed March 2014) Demand Quality of access Affordability Complexity of procedures ï‚· ï‚· Procedures for opening the account are simple and require few documents. ï‚· A large number of banks (including those with the largest retail network) offer electronic access to bank accounts and payment options, thus bringing convenience to the use of the account. ï‚· All banks charge current account maintenance fees of, on average, 7.88 TL (3.67 USD) per month. Only a few banks charge account opening fee. Public perceptions and trust 80% 70% 60% 50% 40% 30% 20% 10% 0% 63% 66% 62% 58% 57% 56% 56% 53% 49% 36% ca l lit i Ba nk Turkey W Europe Source: Life in Transition 2010 ï‚· ï‚· In the regions, the highest level of trust towards financial institutions is in East Anatolia — the region with the lowest density of bank branches and ATMs. Istanbul demonstrates quite high trust levels towards financial institutions. Trust in banks in the regions compared to country average . Source: Life in Transition 2010 Trust in banks compared to country average >=20% higher 10 to 19% lower 10 to 19% higher >= 20% lower -/+10% 29% NG Os Pa fin rti an es cia ls ys te m Tr ad e un Fo io re ns ig n in ve st or s 36% Po lig io u Re 37% sa nd Pr es id en si cy ns tit ut Lo io ca ns lg oc Re er gio nm na en lg t ov er nm en Go t ve rn m en t Co ur ts Pa rli am en t y 40% lic e Still, financial institutions are among the least trusted — banks and other financial service providers are ranked as the third least worth confidence — the banking industry earns trust of only 36% of adults. Only trade unions and foreign investors earn less trust in Turkey. Trust in institutions (% adults) Ar m ï‚· In general, trust towards various public and private institutions in Turkey is higher than in Western Europe. Po ï‚· . Financial capability Financial knowledge Financial knowledge (% of adults) ï‚· Financial knowledge of Turkish adults is lower 100 90 than in other ECA countries, in particular with Turkey 80 70 ECA regards to understanding simple financial con60 50 cepts. 40 ï‚· Seniors and individuals with over 5 children have 30 20 the lowest knowledge. 10 0 ï‚· The highest knowledge is among educated and Calculation of Understanding Understanding simple division of inflation of simple formally-employed people, but also among the interest self-employed. Uunderstanding of compound interests Source: Financial Capability Survey 2012 Financial behavior ï‚· ï‚· ï‚· Individuals in Turkey demonstrate poor financial behavior compared to the ECA average. As in other countries, long-term financial planning and frugality (not overspending or overborrowing) are the most widespread practices. Turkish adults have a very low propensity to save compared to other ECA countries. Financial capability score 100 90 Turkey 80 ECA 70 60 50 40 30 20 10 0 Not Overspending Planning for Old Age Living Within Means Planning Expenses Budgeting Monitoring Expenses Trying to save regulalry Scores range between 0 (lowest score) and 100 (highest score) Source: Financial Capability Survey 2012 Policy ï‚· ï‚· ï‚· ï‚· Turkey is a member of Alliance for Financial Inclusion (AFI) — a national financial inclusion strategy is in development. Strong consumer protection — by-laws regulate annual interest rate calculations and early repayment discounts on credit. The Capital Markets Board is developing and implementing a Financial Education Strategy. Government-level institutions promote greater participation in savings and pension schemes, and also encourage recipients of state transfers to open accounts. . SME FINANCIAL INCLUSION Financial service usage Accounts and payments ï‚· 90.6% of SMEs have a bank account. Source: Enterprise survey 2008 Credit other loans grant/subsidized loan leasing, hirepurchase, factoring bank overdraft, credit line, overdraft on credit card bank loan trade credit Use of debt financing Usage of external financing by SMEs (% firms) ï‚· 71% of SMEs have used debt financing with100% in the last 6 months. 90% Turkey 80% ï‚· Bank loans are the most common source of 70% EU 28 58% external financing, used by 58% of SMEs. 60% 47% 50% 39% 35% ï‚· Trade credit is the second most popular 32% 32% 40% 30% 19% 18% 17% instrument, used by 47% of SMEs. 13%15% 13% 20% 10% ï‚· Overdraft facilities, and leasing/ 0% factoring facilities, are less frequently used in Turkey compared to other EU countries. Source: EU SAFE 2013 Obstacles to using debt financing Limiting factors to obtain debt financing ï‚· The biggest barrier to debt financing is the (% firms) 100% high cost of debt servicing. 90% Turkey EU 28 80% ï‚· High collateral requirements are the second 70% most important obstacle. 60% 50% 40% 30% 20% 10% 0% 41% 34% 19% 16% 36% 20% 3% interest rates or insufficient price too high collateral or guarantee 8% 5% financing not available at all 12% other no obstacles Source: EU SAFE 2013 Future outlook Firms look optimistically towards the future, expecting stability or even improvement in the supply of external financing. Perception of upcoming changes in availability of types of financing (% firms) 100% 4% 90% 15% 4% 13% 4% 11% 4% 8% 80% 70% 54% will deteriorate 50% 56% will remain unchanged 69% 60% 67% 50% 78% 74% 71% 40% 30% 20% 10% 42% 45% 41% 19% 27% 16% 14% 14% 0% Turkey EU 28 Turkey EU 28 Turkey EU 28 Turkey EU 28 bank loans bank overdraft Source: EU SAFE 2013 trade credit equity will improve . Access to finance Supply Infrastructure Institutional coverage ï‚· ï‚· ï‚· 21 banks, or 43% of the total, provide SME loans. 74 specialized leasing companies offer leasing. 76 specialized factoring companies provide factoring services. Number of banks offering SME credit privately-owned deposit banks 8 foreign banks founded in Turkey 6 state-owned deposit banks 3 privately-owned development and investment banks 2 MFIs provide microcredit to low-income female entrepreneurs ï‚· 2 public loan funds provide low-interest loans to SMEs. 6 0 1 privately owned participation banks 9 2 state-owned development and investment banks ï‚· 3 1 0 2 banks under the deposit insurance fund 0 1 foreign participation banks founded in Turkey 0 2 foreign Banks having branches in Turkey 0 5 0 5 10 15 Source: Websites of deposit and participation banks (March 2014) Financial products and services SMEs have access to a variety of financing products: ï‚· Loans: Cash loans, discount and purchase loans, spot loans, day loans ï‚· Overdrafts ï‚· Credit cards ï‚· Non-cash loans (letter of credit, letter of guarantee) ï‚· Factoring/leasing services Demand Quality of Access ï‚· Over 40% of SMEs do not see any obstacles to obtain financing. ï‚· Low affordability, and high interest rates, on credit are perceived the biggest concern in using external funding affecting more SMEs in 2013 compared to 2 years previously. ï‚· ï‚· ï‚· High guarantee requirements are the second most limiting factor in accessing SME credit, although experienced by fewer SMEs in 2013 than in 2011. SME credit is usually indexed to foreign currencies, so currency fluctuations affect credit cost. Long-term loans (over 10 years) are rarely available, limiting larger investments in company development Significance of factors limiting access to financing 41% no obstacles other unavailable financing 47% 5% 1% 3% 2011 2013 1% insufficient collateral or guarantee 16% 18% 34% excessive interest rates 30% 0% 20% Source: EU SAFE 2013 40% 60% 80% 100% . Public perception and trust ï‚· ï‚· Access to finance is not the biggest problem facing Turkish SMEs. As only 16% consider lack or limited access to be the biggest constraint, making it fourth in the list of pressing concerns. The most pressing problems for Turkish SMEs (mirroring other EU28 firms) are difficulties in finding customers, capable staff and experienced managers, as well as high costs of running the business. Most pressing problems for SMEs 30% Turkey 24% 22% 25% EU 28 20% 20% 17% 14% 15% 16%15% 14% 14% 12% 13% 9% 10% 5% 0% Finding customers Availability Costs of of skilled production or staff or labour experienced managers Access to finance Competition Regulation Source: EU SAFE 2013 Bank loan Trade credit Other ï‚· Perception of changes in the availability of financing in the last 6 months Debt securities issued ï‚· Over half of SMEs see the availability of various funding instruments as unchanged in recent years. However, the number of SMEs noticing improved access is growing. For instance, 37% of SMEs saw better access to equity, while almost quarter of SMEs noticed improvements in availability of bank loans. Less than 10% noted a deterioration in availability of various forms of financing. Bank overdraft, credit line or credit cards Equity overdraft ï‚· 2011 20% 2013 24% 2011 2013 17% 7% 50% 28% 10% 5% 5% 2% 9% 2013 4% 10% 6% 52% 2011 6% 2011 5%5% 2% 59% 24% 20% Remained unchanged 29% 9% 0% 3% 3% 40% Deteriorated 20% 1% 63% 59% 39% 1% 7%4% 5% 52% 21% 2013 7% 24% 63% 37% 2013 17% 1% 5% 15% 5% 52% 2013 2011 7% 60% 22% 2011 5% 11% 6% 51% 14% 0% Improved 59% 24% 6% 47% 60% 0% 80% Not applicable 100% No answer Source: EU SAFE 2013 Sectoral confidence index 120 retail trade 100 services 80 construction 60 40 20 The index takes values between 0 and 200, whereby values above 100 indicate an optimistic outlook. Source: Business Tendency Survey, TurkStat 2014 Jan-14 Oct-13 Jul-13 Apr-13 Jan-13 Oct-12 Jul-12 Apr-12 Jan-12 Oct-11 Jul-11 Apr-11 0 Jan-11 Business confidence ï‚· Optimistic attitudes prevail in retail trade and services, with a prevalence of firms with a good business situation and turnover in the last 3 months, and positive expectations regarding turnover, employment and investment in the next 6 months. ï‚· Over the last three years, the construction sector shows the lowest levels of optimism. . Financial capability There are no separate surveys measuring financial capability of entrepreneurs. Policy ï‚· Turkey is one of the co-chairs in SME Finance Sub-Group of the Global Partnership for Financial Inclusion (GPFI). ï‚· A number of programs exist to support micro, small and medium-sized enterprises:  KOSGEB: consultancy, training, technology development, innovation, quality improvement, export orientation, interest rate subsidies.  The Turkish Guarantee Fund (KGF) provides guarantees to SMEs applying for bank credit.  The SME Venture Capital Investment Trust (KOBI A.S.) is a risk capital intermediation. Conclusions Individuals SMEs Level of financial service usage Usage level for different financial services comparable to that of other ECA countries: ï‚· High percentage of the unbanked population ï‚· Low saving rates ï‚· High credit card penetration ï‚· ï‚· Broad SME credit usage, with many firms taking bank loans and expecting to continue using external funding. Enterprise credit available from the majority of deposit banks (state-owned and foreign) . Level of access to financial services ï‚· ï‚· ï‚· ï‚· Good supply of finance, with banking infrastructure comparable with peer countries. However, uneven distribution between regions, with very low penetration of bank branches and ATMs in East Anatolia – the poorest region with low population density. On the demand-side: financial education worse than the comparable countries. In the policy area: a number of efforts underway to remove barriers and improve financial inclusion. However, effectiveness has not yet been measured. ï‚· ï‚· ï‚· ï‚· Reasonably good supply of financial services, with conditions of access seen by SMEs as improving. High interest rates are the main limiting factor, mitigated by state-subsidized credit availability. On the demand side: lack of information about the level of financial capability and attitudes, limiting understanding of SME preparedness for better financial inclusion. Policy area: government focus on improving financial inclusion of SMEs — SME financial access at the top of G20 agenda. . Individuals SMEs Availability and quality of data on financial inclusion ï‚· ï‚· ï‚· ï‚· Low availability of local data sources regarding the financial service usage levels. Quite good information about various aspects of access, in particular about the banking infrastructure, trust and confidence, and financial capability. However, poor disaggregation of data by socioeconomic groups, hence little information about usage and access to financial services by low-income and vulnerable groups. A number of data types available with the regional breakdown, but insufficient for conducting full regional analysis. ï‚· ï‚· ï‚· ï‚· ï‚· ï‚· About the Access to Finance Scorecard (AFS) Our cost-effective methodology allows us to monitor access to finance using available data across a number of key dimensions (see chart). Learn more at www.mfc.org.pl Data about the service usage level and perception of the quality of access to external funding easily available from European Commission statistics, updated annually. Possible comparisons with EU countries. Lack of information about usage of other types of financial services, including savings and investment or insurance. No segmented usage and access information by firm characteristic (size, business type, region). Little information about the quality of access in terms of product conditions. Lack of information about level of financial capability and attitudes. . About MetLife Foundation (MLF) MetLife Foundation was created in 1976 to continue MetLife’s long tradition of corporate contributions and community involvement. Today, the Foundation is dedicated to advancing financial inclusion, committing $200 million over the next five years to help build a secure future for individuals and communities around the world. MetLife Foundation is affiliated to MetLife, Inc. a leading global provider of insurance, annuities and employee benefit programs, serving 90 million customers. Through its subsidiaries and affiliates, MetLife holds leading market positions in the United States, Japan, Latin America, Asia, Europe and the Middle East. For more information visit www.metlife.org About the MFC The Microfinance Centre (MFC) is a regional microfinance resource center and network. Our mission is to contribute to poverty reduction and the development of human potential by promoting a socially-oriented and sustainable microfinance sector that provides adequate financial and non-financial services to a large numbers of poor families and micro-entrepreneurs. Our 104 members are committed to advancing the mission of MFC throughout Europe and Central Asia. They represent a diverse range of institutional types along the microfinance value chain: from non-bank and bank service microfinance providers, support organizations (including national and international networks), investors and donors.
Together, they work in 33 countries and deliver financial services (mainly credit) to well over 5 million micro-entrepreneurs, small and medium enterprises or/and low-income households. Contact us to learn more: Microfinance Centre (MFC) Ul. Noakowskiego 10/38 00-666 Warsaw, Poland tel: + 48 22 622 34 65 justyna@mfc.org.pl www.mfc.org.pl .


