


Description
City Financial Inclusion
Efforts: A National Overview
FINDINGS FROM THE CITY SCAN OF LOCAL FINANCIAL INCLUSION EFFORTS
CONDUCTED BY THE NATIONAL LEAGUE OF CITIES
. Copyright © 2015
National League of Cities
Cover photo credits (left to right):
Top row: Getty Images, Digital Vision;
Getty Images, Creatas
Bottom row: Getty Images, Digital Vision;
Getty Images, BananaStock
. ACKNOWLEDGMENTS
The National League of Cities (NLC) Institute for Youth, Education and Families (YEF
Institute) gratefully acknowledges the many local elected officials, senior municipal
staff, United Way representatives and other community leaders from cities across the
country who participated in the City Scan of Local Financial Inclusion Efforts and provided
valuable information and promising city examples for this report.
Leah Gjertson of the Center for Financial Security at the University of WisconsinMadison provided research support for the survey development and data analysis. Abby
Hughes Holsclaw served as an independent consultant on this project and developed the
report’s early draft. Carla Uriona was responsible for the report’s design and layout.
Several NLC YEF Institute staff contributed to this report. Heidi Goldberg, director of
economic opportunity and financial empowerment, prepared the report’s final drafts and
with Clifford M.
Johnson, executive director of the NLC YEF Institute, provided overall editorial direction for the report. Denise Belser, program manager for family economic success, Jamie Nash, senior associate for benefit outreach and financial empowerment, and Anthony Santiago, senior fellow, conducted the Scan’s interviews and helped shape the report’s content. Emily Pickren, principal associate for communications, served as the primary editor and provided design assistance. The City Scan of Local Financial Inclusion Efforts and this report were made possible by MetLife Foundation. About the National League of Cities The National League of Cities (NLC) is dedicated to helping city leaders build better communities.
NLC is a resource and advocate for 19,000 cities, towns and villages, representing more than 218 million Americans. About the Institute for Youth, Education, and Families The National League of Cities Institute for Youth, Education, and Families (YEF Institute) helps municipal leaders take action on behalf of the children, youth, and families in their communities. NLC launched the YEF Institute in January 2000 in recognition of the unique and influential roles that mayors, city councilmembers and other local leaders play in strengthening families and improving outcomes for children and youth. . TABLE OF CONTENTS Executive Summary.................................................................... 1 Introduction............................................................................... 5 Key Findings.............................................................................. 7 1.
Growth of financial inclusion programs....................... 7 2. “Building blocks” of a financial inclusion agenda.......
13 3. “Pillar” financial inclusion programs.......................... 18 4.
Broader array of programs.......................................... 25 5. Dedicated “home” for programs.................................
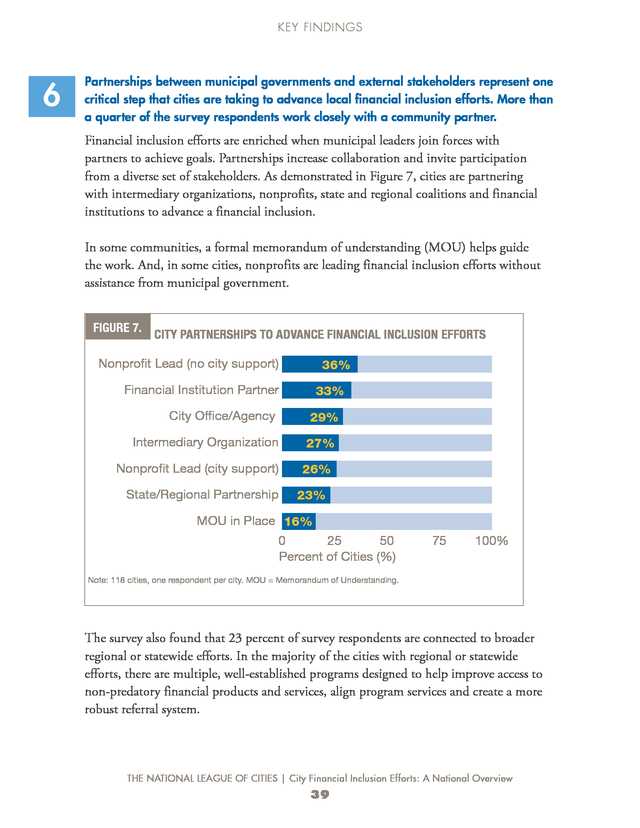
32 6. Partnerships with community stakeholders................ 39 7.
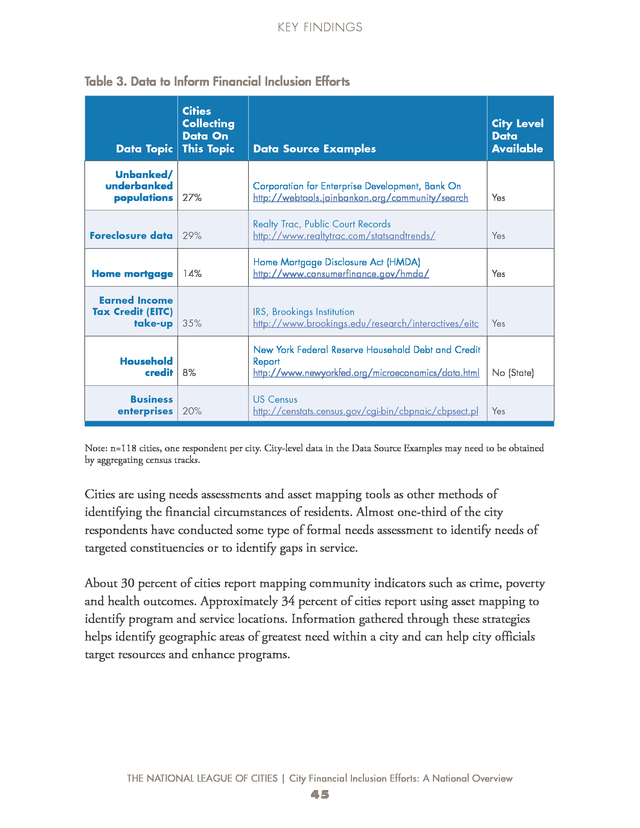
Data collection and evaluation................................... 43 Conclusion............................................................................... 53 Appendix A: Methodology.......................................................
56 . EXECUTIVE SUMMARY Despite our nation’s relative wealth, many Americans are financially insecure, lacking the financial means to pay all of their monthly bills or the necessary savings to cover unexpected expenses. Inadequate household incomes, coupled with a lack of financial assets, leave many families in a position where even one unexpected crisis or setback, such as a sudden illness or job loss, can trigger far-reaching and sometimes catastrophic consequences for parents and their children. Mayors and other city leaders know that financial insecurity and hardship can threaten the well-being of families and undermine local economic development, create blighted neighborhoods and jeopardize public safety. Local leaders are increasingly focusing their attention on and committing resources to a comprehensive set of financial inclusion programs that help residents achieve greater financial stability, build assets and gain access to safe and affordable financial services. While the idea of addressing economic insecurity is not new to city leaders, a growing number of cities are pursuing innovative strategies to help low-income individuals and families build savings and assets, improve credit scores, expand access to credit as well as safe and affordable loan products, connect families to benefits for which they are eligible and increase the availability of financial coaching and literacy programs. To explore the various ways elected officials and their community partners are promoting financial inclusion, the National League of Cities (NLC) Institute for Youth, Education, and Families developed the City Scan of Local Financial Inclusion Efforts (Scan) in collaboration with United Way Worldwide and the Center for Financial Security at the University of Wisconsin-Madison. Financial inclusion refers to access to quality, affordable financial services in a convenient manner and with dignity for the customer. Financial inclusion programs expand access to financial services by empowering low-income residents to take advantage of available benefits and tax credits, manage money more effectively and build assets to increase their financial stability. THE NATIONAL LEAGUE OF CITIES | City Financial Inclusion Efforts: A National Overview 1 .
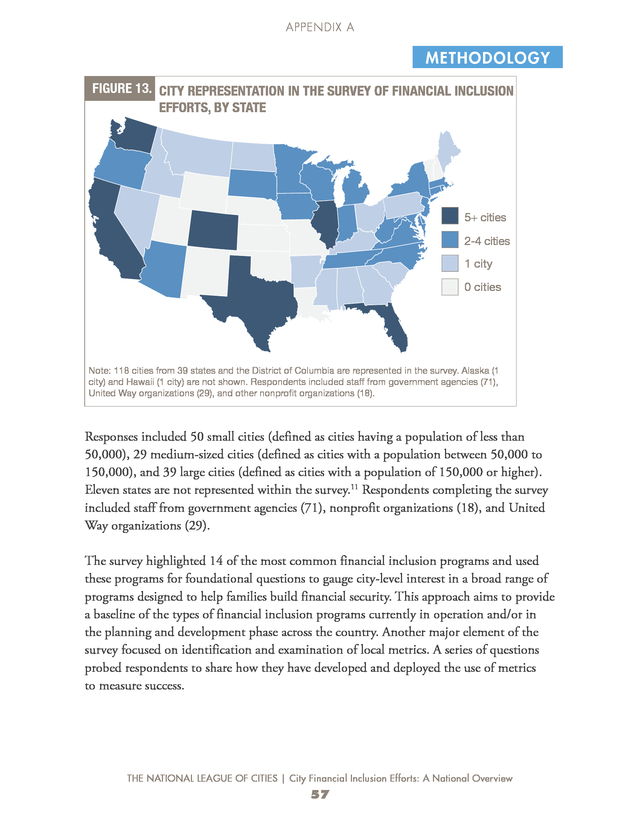
EXECUTIVE SUMMARY The Scan included three parts: an in-depth, online survey of 118 cities about their financial inclusion efforts, a series of follow-up telephone interviews with a subset of 23 survey respondents and a day-long, NLC-sponsored roundtable focused on municipal financial inclusion efforts that included city officials and community partners from 13 cities across the country. This report summarizes the major findings that have emerged from the Scan. It offers numerous examples of ways that cities are promoting and implementing financial inclusion efforts to help residents become more financially secure. It also highlights opportunities that are missed when financial inclusion programs are implemented in silos or not effectively supported by city leaders and agencies. Finally, the report identifies areas in which municipal officials may be able to expand their leadership roles and describes the financial inclusion strategies being implemented in cities, with the hope that these insights will inspire municipal leaders to take further action. SUMMARY OF KEY FINDINGS NLC’s Scan of Local Financial Inclusion Efforts revealed that cities across the country are pursuing diverse and innovative strategies to improve the financial well-being of their residents.
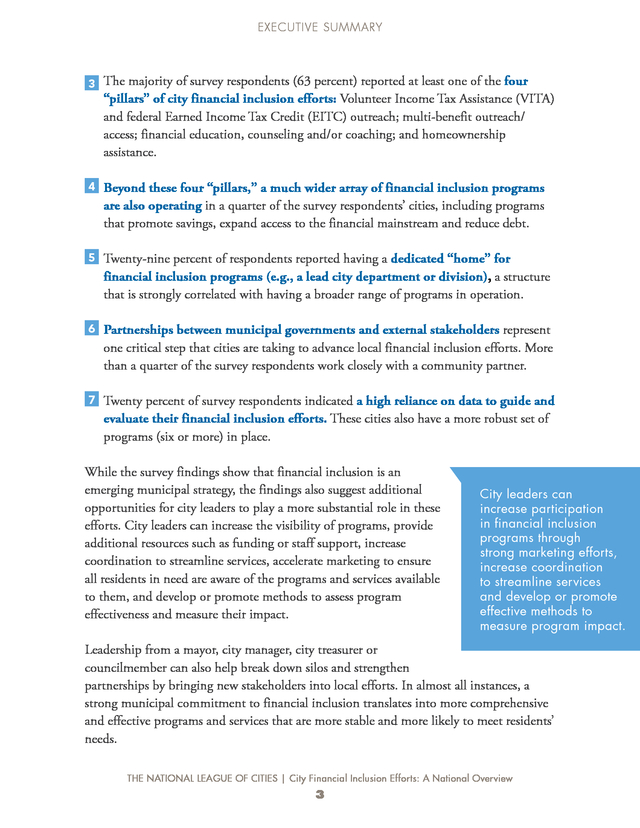
An in-depth analysis of the extensive data generated by the Scan, the majority of which is from the 118 cities that completed the survey, yielded seven key findings: 1 Financial inclusion programs are emerging as an important priority for many city leaders, with various types now common in cities across America. Sixty-five percent of survey respondents have financial inclusion programs in place. 2 A strong cohort of 25 cities (over one-fifth of survey respondents) has assembled at least six out of seven key “building blocks” that appear necessary for sustained progress toward a comprehensive financial inclusion system. THE NATIONAL LEAGUE OF CITIES | City Financial Inclusion Efforts: A National Overview 2 . EXECUTIVE SUMMARY 3 The majority of survey respondents (63 percent) reported at least one of the four “pillars” of city financial inclusion efforts: Volunteer Income Tax Assistance (VITA) and federal Earned Income Tax Credit (EITC) outreach; multi-benefit outreach/ access; financial education, counseling and/or coaching; and homeownership assistance. 4 Beyond these four “pillars,” a much wider array of financial inclusion programs are also operating in a quarter of the survey respondents’ cities, including programs that promote savings, expand access to the financial mainstream and reduce debt. 5 Twenty-nine percent of respondents reported having a dedicated “home” for financial inclusion programs (e.g., a lead city department or division), a structure that is strongly correlated with having a broader range of programs in operation. 6 Partnerships between municipal governments and external stakeholders represent one critical step that cities are taking to advance local financial inclusion efforts. More than a quarter of the survey respondents work closely with a community partner. 7 Twenty percent of survey respondents indicated a high reliance on data to guide and evaluate their financial inclusion efforts. These cities also have a more robust set of programs (six or more) in place. While the survey findings show that financial inclusion is an emerging municipal strategy, the findings also suggest additional opportunities for city leaders to play a more substantial role in these efforts. City leaders can increase the visibility of programs, provide additional resources such as funding or staff support, increase coordination to streamline services, accelerate marketing to ensure all residents in need are aware of the programs and services available to them, and develop or promote methods to assess program effectiveness and measure their impact. City leaders can increase participation in financial inclusion programs through strong marketing efforts, increase coordination to streamline services and develop or promote effective methods to measure program impact. Leadership from a mayor, city manager, city treasurer or councilmember can also help break down silos and strengthen partnerships by bringing new stakeholders into local efforts.
In almost all instances, a strong municipal commitment to financial inclusion translates into more comprehensive and effective programs and services that are more stable and more likely to meet residents’ needs. THE NATIONAL LEAGUE OF CITIES | City Financial Inclusion Efforts: A National Overview 3 . EXECUTIVE SUMMARY Dozens of cities now have a range of programs in place to advance elements of a financial inclusion agenda. Few cities have what could be clearly identified as a well-organized and coherent system to drive and sustain progress over time. Sustained efforts to build local financial inclusion systems with strong municipal leadership are now essential to advance and strengthen the field. By adopting a system-building approach, cities will be better able to map current resources, identify service gaps or other unmet needs, set standards and provide the supports necessary to improve program quality and create the metrics and data systems to drive continuous improvement. This is the next frontier for mayors and other city officials who seek to achieve the goal of financial inclusion for all city residents. In almost all instances, having strong municipal commitment to financial inclusion efforts means programs and services are stronger, more likely to meet residents’ needs and more stable through diversified funding.
Going forward, city leaders will continue to see a need to design creative and comprehensive solutions to equalize access to financial opportunities for all residents. THE NATIONAL LEAGUE OF CITIES | City Financial Inclusion Efforts: A National Overview 4 . INTRODUCTION As the United States economy continues to recover from the Great Recession, many Americans still find themselves facing financial barriers and challenges. Through strong leadership and strategic partnerships, municipal leaders from across the country are stepping in to address the financial struggles of their residents. Recently, a surge of interest in financial inclusion programs at the national level has seen more local leaders focus their attention and commit resources to helping residents become more financially capable and gain access to safe and affordable financial services. These efforts are spawning innovation and inspiring other local leaders to take action in their communities. Mayors and city council members can play important roles in expanding residents’ access to financial opportunities that are safe, affordable and build assets. Many innovative financial inclusion strategies are already being implemented at the local level that municipal leaders can customize and replicate.1 Because just as each city is unique, so are the financial inclusion needs of its residents. To explore the various ways mayors and other city leaders can expand residents’ access to financial opportunities, NLC, in collaboration with United Way Worldwide and the Center for Financial Security at the University of Wisconsin-Madison, initiated the City Scan of Local Financial Inclusion Efforts. The Scan examines the landscape of municipal financial inclusion programs around the country.
It was specifically designed to understand the role and depth of municipal leader engagement as well as pinpoint local metrics used by municipal governments and their community partners to monitor and assess progress toward financial inclusion goals over time. Financial inclusion refers to access to quality, affordable financial services in a convenient manner and with dignity for the customer. Financial inclusion programs expand access to financial services by empowering low-income residents to take advantage of available benefits and tax credits, manage money more effectively and build assets to increase their financial stability. THE NATIONAL LEAGUE OF CITIES | City Financial Inclusion Efforts: A National Overview 5 . INTRODUCTION This report documents the findings of NLC’s City Scan of Local Financial Inclusion Efforts and offers promising examples of municipalities taking action to help residents move toward financial inclusion. As more city leaders develop an interest in offering a continuum of options to help families build financial security, this report serves as a resource to encourage municipal leaders to continue to share emerging insights with other leaders and inspire them to innovate as they work to reach financially underserved residents. METHODOLOGY The City Scan of Local Financial Inclusion Efforts included three components – an in-depth, online survey of cities about their financial inclusion efforts; a day-long examination and discussion of preliminary findings with city officials and community partners from 13 cities at an NLC-sponsored Municipal Financial Inclusion Roundtable; and a series of follow-up telephone interviews with a subset of 23 survey respondents. This report draws on information from all three of these components, although the majority of information is derived from the self-reported survey responses from the 118 responding cities. Respondents completing the survey included staff from government agencies (71), nonprofit organizations (18), and United Way organizations (29). See Appendix A for a detailed description of the methodology. THE NATIONAL LEAGUE OF CITIES | City Financial Inclusion Efforts: A National Overview 6 . KEY FINDINGS 1 Financial inclusion programs are emerging as an important priority for many city leaders, with various types now common in cities across America. Sixty-five percent of survey respondents have financial inclusion programs in place. City leaders are increasingly taking a stand to combat poverty and embrace financial empowerment strategies to move individuals and their families toward better futures. They understand that remaining neutral or silent on the financial well-being of lowincome residents can cost cities a great deal. These costs can include diminished health and education outcomes, increased crime, higher likelihood of generational poverty, neighborhood blight, higher foreclosure rates and decreased property tax revenues. Nearly half of survey respondents reported that financial inclusion programs are a high priority for their mayor and/or city councilmembers (Figure 1). The mayor was most frequently cited as a champion for financial inclusion programs and services (by nearly half of all respondents), but city councilmembers and city managers often step into this role as well. Not surprisingly, strong support from a municipal champion is highly correlated with the presence of a robust and varied set of programs in the community.
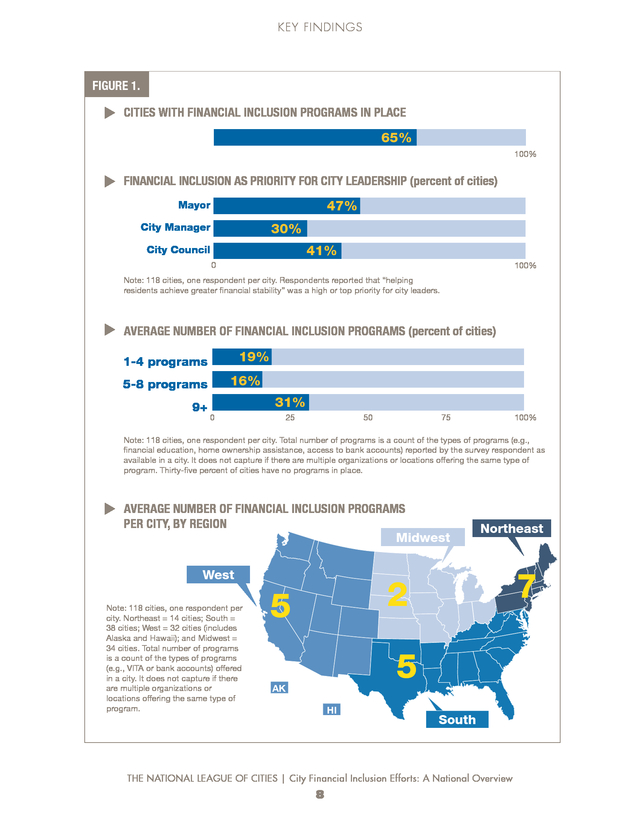
While there are many elements that contribute to effective financial inclusion programming, the tipping point tends to be one or two committed city leaders who are using their authority and influence to create and support financial inclusion efforts. In Savannah, Georgia, for example, three consecutive mayors have supported a master plan to reduce citywide poverty rates, and the current mayor, city manager and city council support the city’s financial inclusion work because of its basis in a deeply-rooted, broad anti-poverty agenda of city leaders and stakeholders in Savannah. While there are many elements that contribute to effective financial inclusion programming, the tipping point tends to be one or two committed city leaders who are using their authority and influence to create and support financial inclusion efforts. THE NATIONAL LEAGUE OF CITIES | City Financial Inclusion Efforts: A National Overview 7 . KEY FINDINGS FIGURE 1. CITIES WITH FINANCIAL INCLUSION PROGRAMS IN PLACE 65% 100% FINANCIAL INCLUSION AS PRIORITY FOR CITY LEADERSHIP (percent of cities) 47% Mayor 30% City Manager 41% City Council 0 100% Note: 118 cities, one respondent per city. Respondents reported that “helping residents achieve greater financial stability” was a high or top priority for city leaders. AVERAGE NUMBER OF FINANCIAL INCLUSION PROGRAMS (percent of cities) 19% 1-4 programs 16% 5-8 programs 9+ 31% 0 25 50 75 100% Note: 118 cities, one respondent per city. Total number of programs is a count of the types of programs (e.g., financial education, home ownership assistance, access to bank accounts) reported by the survey respondent as available in a city. It does not capture if there are multiple organizations or locations offering the same type of program.
Thirty-five percent of cities have no programs in place. AVERAGE NUMBER OF FINANCIAL INCLUSION PROGRAMS PER CITY, BY REGION Midwest West Note: 118 cities, one respondent per city. Northeast = 14 cities; South = 38 cities; West = 32 cities (includes Alaska and Hawaii); and Midwest = 34 cities. Total number of programs is a count of the types of programs (e.g., VITA or bank accounts) offered in a city.
It does not capture if there are multiple organizations or locations offering the same type of program. Northeast 7 2 5 5 AK HI South THE NATIONAL LEAGUE OF CITIES | City Financial Inclusion Efforts: A National Overview 8 . KEY FINDINGS No doubt in part due to this leadership commitment by top city officials, nearly twothirds of cities (65 percent) that responded to the survey reported that they had financial inclusion programs in place, either operated by the municipality or another organization. Almost one-quarter of cities responding (23 percent) indicated their municipality operates financial inclusion programs. In other cities, financial inclusion programs are operated by partner community organizations. The average number of programs currently operating in communities responding to the survey is four to five, and the median number of programs in place in communities is three, with one additional program in planning or under discussion. Cities in which financial inclusion was a high priority for elected officials also had the greatest number of programs and/or activities operating in the community. This finding signals that municipal leaders and their partners understand that a multi-faceted approach is needed to meet residents’ diverse financial needs. For example, Columbia, South Carolina seeks to address the multiple needs of public housing residents by incorporating financial inclusion programs into the city’s historical housing assistance programs.
Local leaders launched a campaign in partnership with Wells Fargo Bank, targeted the largest public housing facility for financial education workshops and as a market to promote no- and low-cost bank accounts. Columbia’s city manager hired a dedicated employee to further integrate financial inclusion programming into other city programs and services. Service integration in Columbia serves to create a more ingrained culture of financial inclusion within all aspects of city government. Cities reporting the highest numbers of financial inclusion programs are concentrated primarily in the Northeast, while communities in the Midwest reported having smaller numbers of programs in place (Figure 1).
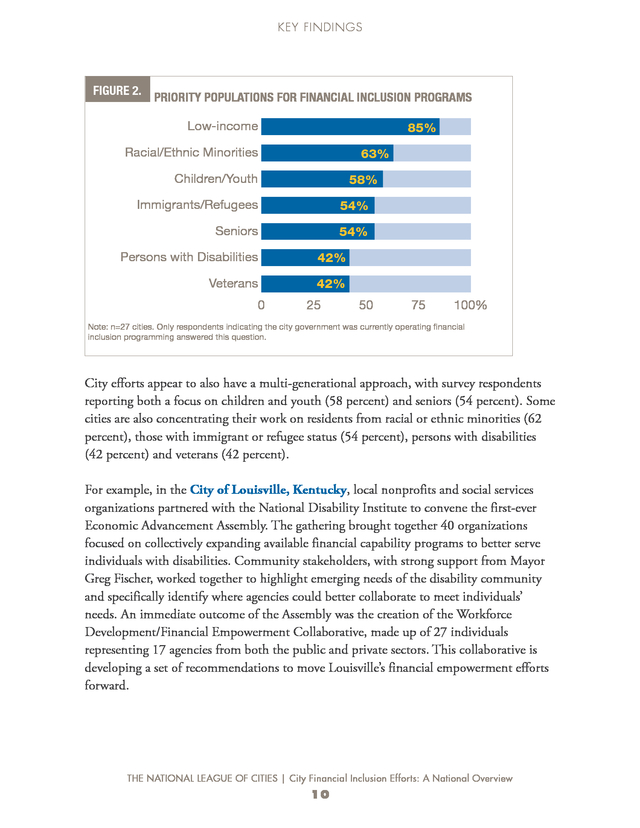
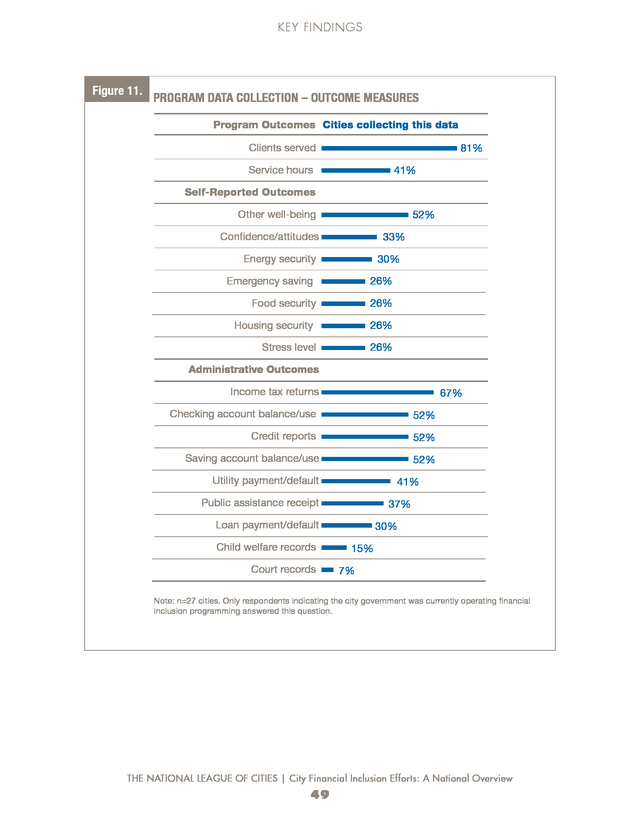
The more pronounced levels of activity in the Northeast may reflect the higher concentration of financial institutions with headquarters in the region and its status as a geographical target market for many larger banks. Several large financial institutions actively support financial inclusion programs and may have a tendency to focus those investments in geographical areas that mirror their institutional footprint. Within cities responding to the survey, financial inclusion efforts tend to be focused on specific demographic groups and/or on low-income neighborhoods. Among the 27 cities that are currently operating financial inclusion programming, 81 percent reported they had identified at least one priority population for financial inclusion programming (Figure 2). THE NATIONAL LEAGUE OF CITIES | City Financial Inclusion Efforts: A National Overview 9 .
KEY FINDINGS FIGURE 2. PRIORITY POPULATIONS FOR FINANCIAL INCLUSION PROGRAMS Low-income 85% Racial/Ethnic Minorities 63% Children/Youth 58% Immigrants/Refugees 54% Seniors 54% Persons with Disabilities 42% Veterans 42% 0 25 50 75 100% Note: n=27 cities. Only respondents indicating the city government was currently operating financial inclusion programming answered this question. City efforts appear to also have a multi-generational approach, with survey respondents reporting both a focus on children and youth (58 percent) and seniors (54 percent). Some cities are also concentrating their work on residents from racial or ethnic minorities (62 percent), those with immigrant or refugee status (54 percent), persons with disabilities (42 percent) and veterans (42 percent). For example, in the City of Louisville, Kentucky, local nonprofits and social services organizations partnered with the National Disability Institute to convene the first-ever Economic Advancement Assembly. The gathering brought together 40 organizations focused on collectively expanding available financial capability programs to better serve individuals with disabilities.
Community stakeholders, with strong support from Mayor Greg Fischer, worked together to highlight emerging needs of the disability community and specifically identify where agencies could better collaborate to meet individuals’ needs. An immediate outcome of the Assembly was the creation of the Workforce Development/Financial Empowerment Collaborative, made up of 27 individuals representing 17 agencies from both the public and private sectors. This collaborative is developing a set of recommendations to move Louisville’s financial empowerment efforts forward. THE NATIONAL LEAGUE OF CITIES | City Financial Inclusion Efforts: A National Overview 10 .
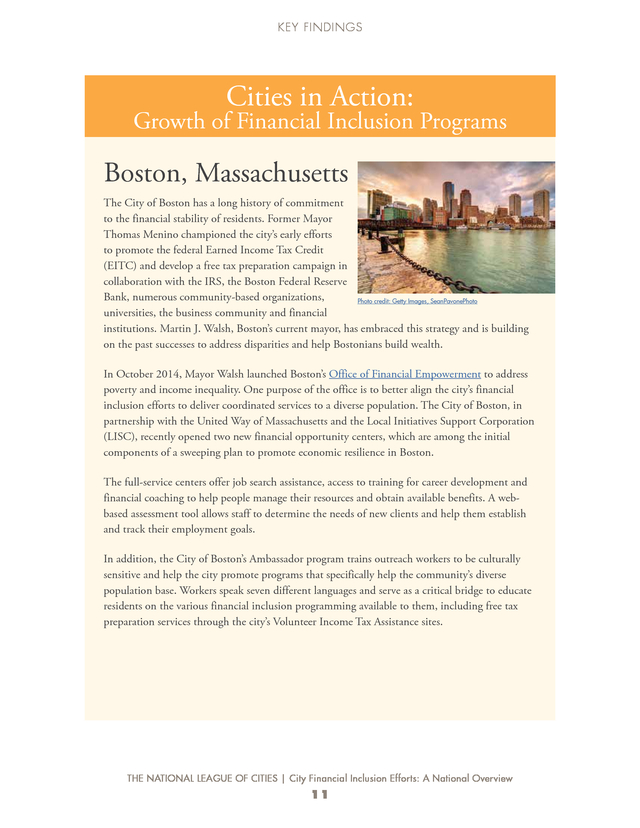
KEY FINDINGS Cities in Action: Growth of Financial Inclusion Programs Boston, Massachusetts The City of Boston has a long history of commitment to the financial stability of residents. Former Mayor Thomas Menino championed the city’s early efforts to promote the federal Earned Income Tax Credit (EITC) and develop a free tax preparation campaign in collaboration with the IRS, the Boston Federal Reserve Bank, numerous community-based organizations, Photo credit: Getty Images, SeanPavonePhoto universities, the business community and financial institutions. Martin J. Walsh, Boston’s current mayor, has embraced this strategy and is building on the past successes to address disparities and help Bostonians build wealth. In October 2014, Mayor Walsh launched Boston’s Office of Financial Empowerment to address poverty and income inequality.
One purpose of the office is to better align the city’s financial inclusion efforts to deliver coordinated services to a diverse population. The City of Boston, in partnership with the United Way of Massachusetts and the Local Initiatives Support Corporation (LISC), recently opened two new financial opportunity centers, which are among the initial components of a sweeping plan to promote economic resilience in Boston. The full-service centers offer job search assistance, access to training for career development and financial coaching to help people manage their resources and obtain available benefits. A webbased assessment tool allows staff to determine the needs of new clients and help them establish and track their employment goals. In addition, the City of Boston’s Ambassador program trains outreach workers to be culturally sensitive and help the city promote programs that specifically help the community’s diverse population base.
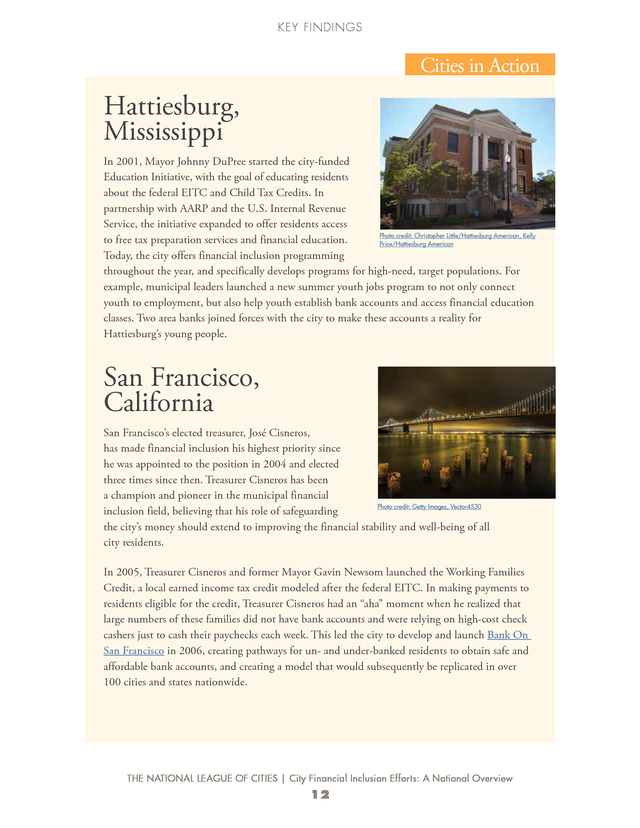
Workers speak seven different languages and serve as a critical bridge to educate residents on the various financial inclusion programming available to them, including free tax preparation services through the city’s Volunteer Income Tax Assistance sites. THE NATIONAL LEAGUE OF CITIES | City Financial Inclusion Efforts: A National Overview 11 . KEY FINDINGS Cities in Action Hattiesburg, Mississippi In 2001, Mayor Johnny DuPree started the city-funded Education Initiative, with the goal of educating residents about the federal EITC and Child Tax Credits. In partnership with AARP and the U.S. Internal Revenue Service, the initiative expanded to offer residents access Photo credit: Christopher Little/Hattiesburg American, Kelly to free tax preparation services and financial education. Price/Hattiesburg American Today, the city offers financial inclusion programming throughout the year, and specifically develops programs for high-need, target populations. For example, municipal leaders launched a new summer youth jobs program to not only connect youth to employment, but also help youth establish bank accounts and access financial education classes.
Two area banks joined forces with the city to make these accounts a reality for Hattiesburg’s young people. San Francisco, California San Francisco’s elected treasurer, José Cisneros, has made financial inclusion his highest priority since he was appointed to the position in 2004 and elected three times since then. Treasurer Cisneros has been a champion and pioneer in the municipal financial Photo credit: Getty Images, Vector4530 inclusion field, believing that his role of safeguarding the city’s money should extend to improving the financial stability and well-being of all city residents. In 2005, Treasurer Cisneros and former Mayor Gavin Newsom launched the Working Families Credit, a local earned income tax credit modeled after the federal EITC. In making payments to residents eligible for the credit, Treasurer Cisneros had an “aha” moment when he realized that large numbers of these families did not have bank accounts and were relying on high-cost check cashers just to cash their paychecks each week.
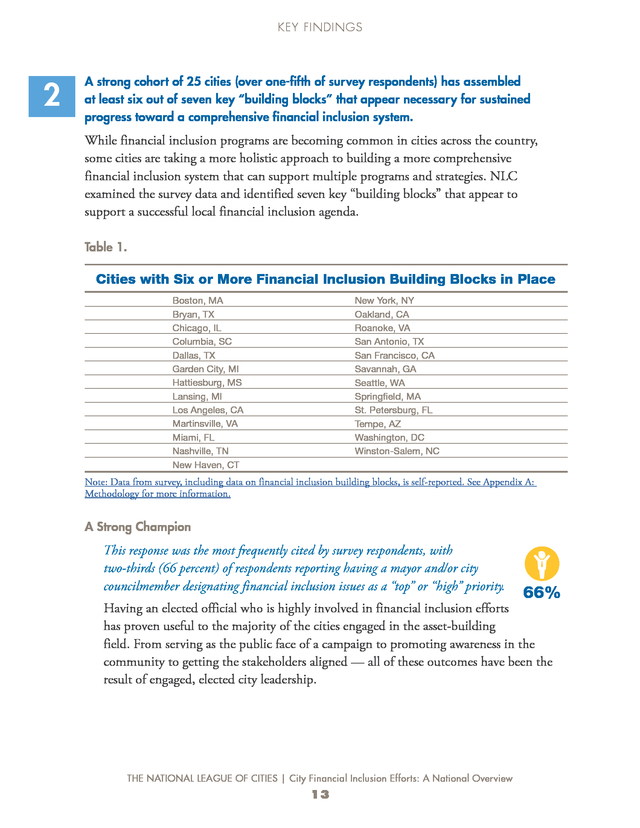
This led the city to develop and launch Bank On San Francisco in 2006, creating pathways for un- and under-banked residents to obtain safe and affordable bank accounts, and creating a model that would subsequently be replicated in over 100 cities and states nationwide. THE NATIONAL LEAGUE OF CITIES | City Financial Inclusion Efforts: A National Overview 12 . KEY FINDINGS 2 A strong cohort of 25 cities (over one-fifth of survey respondents) has assembled at least six out of seven key “building blocks” that appear necessary for sustained progress toward a comprehensive financial inclusion system. While financial inclusion programs are becoming common in cities across the country, some cities are taking a more holistic approach to building a more comprehensive financial inclusion system that can support multiple programs and strategies. NLC examined the survey data and identified seven key “building blocks” that appear to support a successful local financial inclusion agenda. Table 1. Cities with Six or More Financial Inclusion Building Blocks in Place Boston, MA Bryan, TX Chicago, IL Columbia, SC Dallas, TX Garden City, MI Hattiesburg, MS Lansing, MI Los Angeles, CA Martinsville, VA Miami, FL Nashville, TN New Haven, CT New York, NY Oakland, CA Roanoke, VA San Antonio, TX San Francisco, CA Savannah, GA Seattle, WA Springfield, MA St. Petersburg, FL Tempe, AZ Washington, DC Winston-Salem, NC Note: Data from survey, including data on financial inclusion building blocks, is self-reported. See Appendix A: Methodology for more information. STRONG CHAMPION A Strong Champion This response was the most frequently cited by survey respondents, with two-thirds (66 percent) of respondents reporting having a mayor and/or city councilmember designating financial inclusion issues as a “top” or “high” priority. 66% Having an elected official who is highly involved in financial inclusion efforts has proven useful to the majority of the cities engaged in the asset-building field.
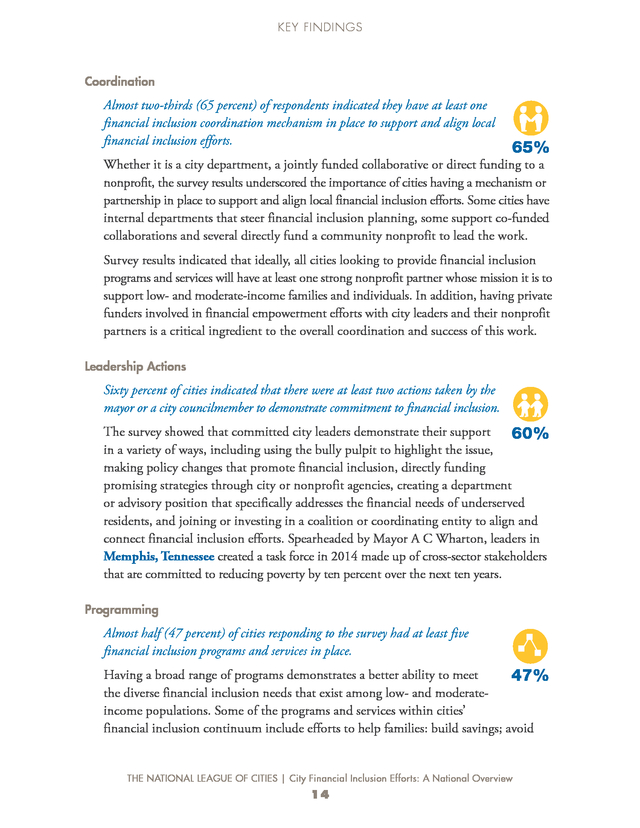
From serving as the public face of a campaign to promoting awareness in the community to getting the stakeholders aligned — all of these outcomes have been the result of engaged, elected city leadership. THE NATIONAL LEAGUE OF CITIES | City Financial Inclusion Efforts: A National Overview 13 COORDINATI 65% . KEY FINDINGS STRONG CHAMPION Coordination COORDINATION ACTION 65% 60% Almost two-thirds (65 percent) of respondents indicated they have at least one financial inclusion coordination mechanism in place to support and align local financial inclusion efforts. 66% Whether it is a city department, a jointly funded collaborative or direct funding to a nonprofit, the survey results underscored the importance of cities having a mechanism or partnership in place to support and align local financial inclusion efforts. Some cities have internal departments that steer financial inclusion planning, some support co-funded collaborations and several directly fund a community nonprofit to lead the work. Survey results indicated that ideally, all cities looking to provide financial inclusion programs and services will have at least one strong nonprofit partner whose mission it is to support low- and moderate-income families and individuals. In addition, having private funders involved in financial empowerment efforts with city leaders and their nonprofit partners is a critical ingredient to the overall coordination and success of this work. STRONG CHAMPION Leadership Actions COORDINATION ACTION PROGRAMMIN Sixty percent of cities indicated that there were at least two actions taken by the mayor or a city councilmember to demonstrate commitment to financial inclusion. The survey showed that committed city leaders66% demonstrate their support 65% 60% in a variety of ways, including using the bully pulpit to highlight the issue, making policy changes that promote financial inclusion, directly funding promising strategies through city or nonprofit agencies, creating a department or advisory position that specifically addresses the financial needs of underserved residents, and joining or investing in a coalition or coordinating entity to align and connect financial inclusion efforts. Spearheaded by Mayor A C Wharton, leaders in Memphis, Tennessee created a task force in 2014 made up of cross-sector stakeholders that are committed to reducing poverty by ten percent over the next ten years. Programming STRONG CHAMPION COORDINATION ACTION PROGRAMMING 47% COMMUNITY COMMITMENT Almost half (47 percent) of cities responding to the survey had at least five financial inclusion programs and services in place. Having a broad range of programs demonstrates a better ability to meet 66% 65% 60% 47% the diverse financial inclusion needs that exist among low- and moderateincome populations.
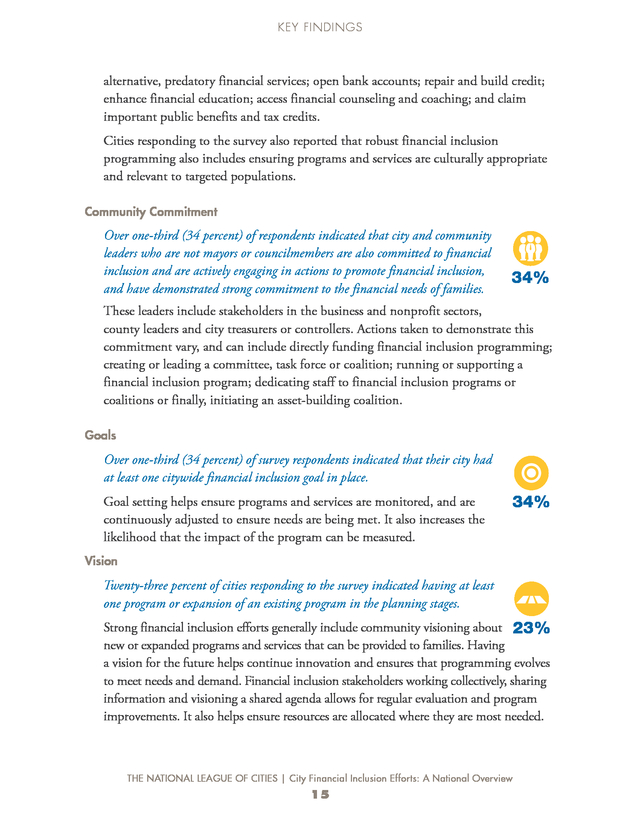
Some of the programs and services within cities’ financial inclusion continuum include efforts to help families: build savings; avoid THE NATIONAL LEAGUE OF CITIES | City Financial Inclusion Efforts: A National Overview 14 34% . KEY FINDINGS alternative, predatory financial services; open bank accounts; repair and build credit; enhance financial education; access financial counseling and coaching; and claim important public benefits and tax credits. Cities responding to the survey also reported that robust financial inclusion programming also includes ensuring programs and services are culturally appropriate and relevant to targeted populations. STRONG Community Commitment CHAMPION COORDINATION ACTION PROGRAMMING Over one-third (34 percent) of respondents indicated that city and community leaders who are not mayors or councilmembers are also committed to financial inclusion and are actively engaging in actions to promote financial inclusion, 66% 65% 60% 47% and have demonstrated strong commitment to the financial needs of families. COMMUNITY COMMITMENT GOALS 34% 34% These leaders include stakeholders in the business and nonprofit sectors, county leaders and city treasurers or controllers. Actions taken to demonstrate this commitment vary, and can include directly funding financial inclusion programming; creating or leading a committee, task force or coalition; running or supporting a financial inclusion program; dedicating staff to financial inclusion programs or coalitions or finally, initiating an asset-building coalition. STRONG Goals CHAMPION COORDINATION ACTION PROGRAMMING COMMUNITY COMMITMENT GOALS VISION 34% 23% Over one-third (34 percent) of survey respondents indicated that their city had at least one citywide financial inclusion goal in place. Goal setting helps ensure programs and services 47% are monitored, and are 66% 65% 60% 34% continuously adjusted to ensure needs are being met. It also increases the likelihood that the impact of the program can be measured. STRONG CHAMPION Vision COORDINATION ACTION PROGRAMMING COMMUNITY COMMITMENT GOALS VISION Twenty-three percent of cities responding to the survey indicated having at least one program or expansion of an existing program in the planning stages. 66% Strong financial inclusion efforts generally include34% community visioning about 23% 65% 60% 47% 34% new or expanded programs and services that can be provided to families. Having a vision for the future helps continue innovation and ensures that programming evolves to meet needs and demand.
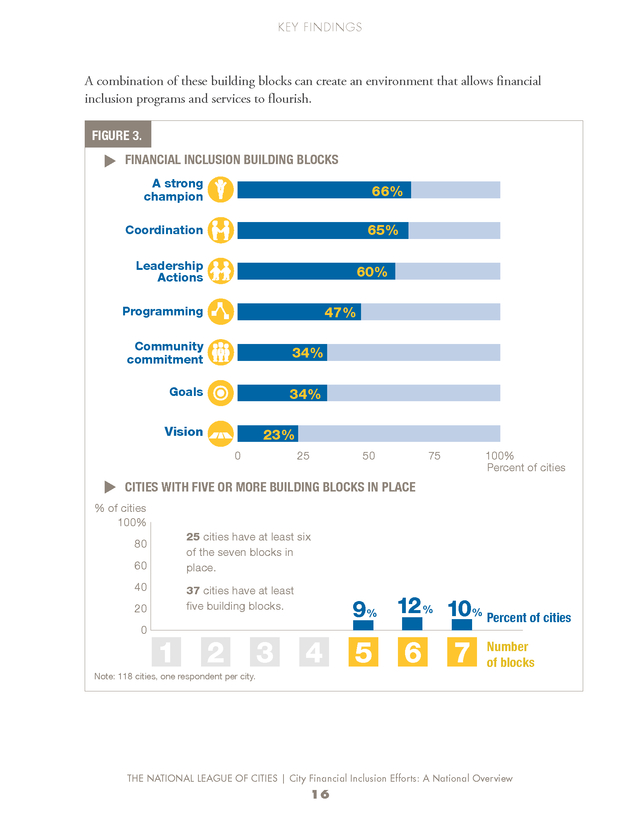
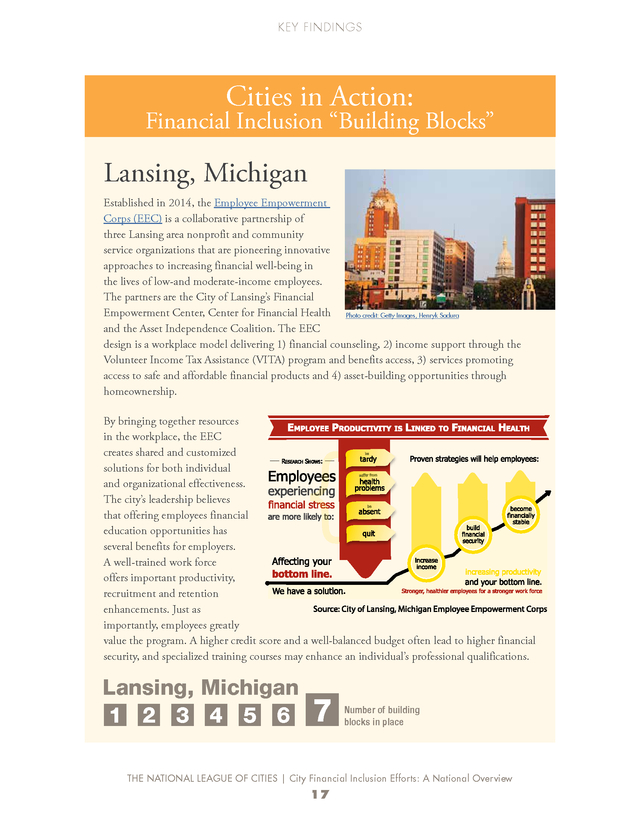
Financial inclusion stakeholders working collectively, sharing information and visioning a shared agenda allows for regular evaluation and program improvements. It also helps ensure resources are allocated where they are most needed. THE NATIONAL LEAGUE OF CITIES | City Financial Inclusion Efforts: A National Overview 15 . KEY FINDINGS A combination of these building blocks can create an environment that allows financial inclusion programs and services to flourish. FIGURE 3. FINANCIAL INCLUSION BUILDING BLOCKS A strong champion 66% 65% Coordination Leadership Actions 60% Programming 47% Community commitment 34% Goals 34% Vision 23% 0 25 50 75 100% Percent of cities CITIES WITH FIVE OR MORE BUILDING BLOCKS IN PLACE % of cities 100% 25 cities have at least six of the seven blocks in place. 80 60 40 37 cities have at least five building blocks. 20 0 1 2 3 9% 12 % 10% Percent of cities 4 5 6 7 Number of blocks Note: 118 cities, one respondent per city. THE NATIONAL LEAGUE OF CITIES | City Financial Inclusion Efforts: A National Overview 16 . KEY FINDINGS Cities in Action: Financial Inclusion “Building Blocks” Lansing, Michigan Established in 2014, the Employee Empowerment Corps (EEC) is a collaborative partnership of three Lansing area nonprofit and community service organizations that are pioneering innovative approaches to increasing financial well-being in the lives of low-and moderate-income employees. The partners are the City of Lansing’s Financial Empowerment Center, Center for Financial Health Photo credit: Getty Images, Henryk Sadura and the Asset Independence Coalition. The EEC design is a workplace model delivering 1) financial counseling, 2) income support through the Volunteer Income Tax Assistance (VITA) program and benefits access, 3) services promoting access to safe and affordable financial products and 4) asset-building opportunities through homeownership. By bringing together resources in the workplace, the EEC creates shared and customized solutions for both individual and organizational effectiveness. The city’s leadership believes that offering employees financial education opportunities has several benefits for employers. A well-trained work force offers important productivity, recruitment and retention enhancements. Just as importantly, employees greatly value the program. A higher credit score and a well-balanced budget often lead to higher financial security, and specialized training courses may enhance an individual’s professional qualifications. Lansing, Michigan 1 2 3 4 5 6 7 Number of building blocks in place THE NATIONAL LEAGUE OF CITIES | City Financial Inclusion Efforts: A National Overview 17 .
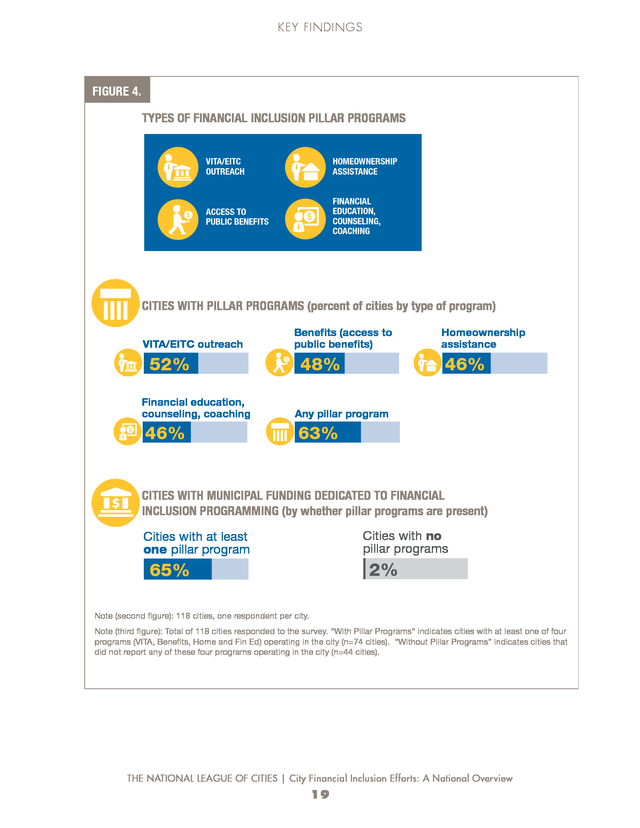
KEY FINDINGS 3 The majority of survey respondents (63 percent) reported at least one of the four “pillars” of financial inclusion city efforts: Volunteer Income Tax Assistance (VITA) and federal Earned Income Tax Credit (EITC) outreach; multi-benefit outreach/access; financial education, counseling and/or coaching; and homeownership assistance. These four specific types of programs were most frequently cited by survey respondents. Taken together, they often form the “pillars” of a strong city infrastructure for financial inclusion efforts. The survey found that the four pillar programs were more likely than other financial inclusion programs to receive city funding. For example, almost one-fifth of cities directly funded financial education and/or homeownership programs. Moreover, cities that had these four pillar programs in place were much more likely to contribute city funds to any financial inclusion program. Among the 44 survey respondents without pillar programs in place, only three have any financial inclusion programs at all. And only one city out of these 44 has city funds to advance financial inclusion programs. Sixty-five percent of cities with at least one pillar program have city funds dedicated to financial inclusion programs (Figure 4). 65% of cities with at least one pillar program have city funds dedicated to financial inclusion programs. These programs often have local, state and federal funding opportunities that make them more attractive for additional city investments.
Investment in pillar programs may be more common due to the fact these programs are likely more frequent, may offer proven results that increase credibility, and garner additional support from strategic community partners engaged in financial inclusion efforts. Photo credit: Getty Images, cabania Photo credit: Getty Images, mrdoomits THE NATIONAL LEAGUE OF CITIES | City Financial Inclusion Efforts: A National Overview 18 . KEY FINDINGS FIGURE 4. TYPES OF FINANCIAL INCLUSION PILLAR PROGRAMS VITA/EITC OUTREACH HOMEOWNERSHIP ASSISTANCE ACCESS TO PUBLIC BENEFITS FINANCIAL EDUCATION, COUNSELING, COACHING CITIES WITH PILLAR PROGRAMS (percent of cities by type of program) VITA/EITC outreach 52% Financial education, counseling, coaching 46% Beneï¬ts (access to public beneï¬ts) 48% Homeownership assistance 46% Any pillar program 63% CITIES WITH MUNICIPAL FUNDING DEDICATED TO FINANCIAL INCLUSION PROGRAMMING (by whether pillar programs are present) Cities with no pillar programs Cities with at least one pillar program 2% 65% Note (second figure): 118 cities, one respondent per city. Note (third figure): Total of 118 cities responded to the survey. “With Pillar Programs” indicates cities with at least one of four programs (VITA, Benefits, Home and Fin Ed) operating in the city (n=74 cities). “Without Pillar Programs” indicates cities that did not report any of these four programs operating in the city (n=44 cities). THE NATIONAL LEAGUE OF CITIES | City Financial Inclusion Efforts: A National Overview 19 . KEY FINDINGS Volunteer Income Tax Assistance (VITA) and Earned Income Tax Credit Outreach (EITC) A majority of all cities polled confirmed that VITA programming continues to be a fundamental element of a municipal financial inclusion strategy. VITA work has grown tremendously in recent years as cities work to ensure that all eligible residents know about and claim the federal, and in some areas, state EITC. The EITC is a federal refundable tax credit for low- and moderate-income working people. Currently, 25 states and the District of Columbia have established their own EITCs to supplement the federal credit. Over the past decade, numerous municipalities have joined with their community partners to provide free tax preparation services and conduct outreach about the availability of the EITC. According to the IRS, income tax forms prepared through VITA sites grew by over 200 percent since 2000.2 The EITC is a federal refundable tax credit for low- and moderate-income working people. 6.5 million In 2012, the EITC lifted about 6.5 million people out of poverty, including 3.3 million children. The Center on Budget and Policy Priorities reports that in 2012, the EITC lifted about 6.5 million people out of poverty, including 3.3 million children.
Given the potential of supplementing so many low- and moderate-income families’ incomes and spurring economic activity (as the EITC brings millions of dollars back to local economies), it is no surprise that municipal leaders invest in free tax preparation and EITC marketing and outreach strategies.3 Further, leaders continue to help eligible residents protect and keep their EITC refunds by working to offer free tax preparation so individuals do not fall prey to predatory tax services or rapid refund anticipation loan products. For example, Chicago directly funds VITA and EITC outreach efforts, and city officials actively lend support by attending press events and promoting services to residents. Overall, VITA and EITC programming led all other programs currently in operation in the survey (Figure 4). Multi-Benefit Outreach and Access In addition to VITA programming, three other financial inclusion programs appear to be vital elements of a broader municipal effort.
These include helping residents access public benefits such as the Supplemental Nutrition Assistance Program (SNAP) and Medicaid; providing homeownership assistance; and offering financial education, counseling, and/ or coaching. Over half (63 percent) of all survey respondents indicated their city is operating and has operated at least one of these financial inclusion programs (Figure 4). THE NATIONAL LEAGUE OF CITIES | City Financial Inclusion Efforts: A National Overview 20 . KEY FINDINGS Over the past decade, city leaders have continued to see residents working but struggling to make ends meet. Promoting key work supports such as SNAP, Medicaid, the LowIncome Energy Assistance Program and free- or low-cost health care, to name a few, are additional ways municipal governments are helping individuals stretch their paychecks. Cities often join forces with local nonprofits to help individuals complete and/or navigate sometimes complicated federal and state benefit applications. Financial Education, Counseling and Coaching The survey findings show that city support for financial education, counseling and coaching is strong. Financial education is defined as Key components of the ability to use knowledge and skills to manage financial resources financial education include learning basics effectively. Key components of financial education include learning in creating a budget, basics in creating a budget, balancing a checkbook, identifying balancing a checkbook, financial services that fit one’s needs and using a bank account. identifying financial Financial counseling focuses on helping individuals who face a services that fit one’s needs and using a bank financial problem and may deem their situation as a “crisis.” It is account. typically a short-term opportunity to help a person with an immediate need.
Financial coaching, an approach that is growing significantly in the asset-building field, typically involves a coach who works one-on-one with a person to identify behaviors, design a plan for improvement and help the individual work toward solutions. Photo credit: Getty Images, Joe Raedle Photo credit: Getty Images, Chris Hondros Photo credit: Getty Images, Joe Raedle THE NATIONAL LEAGUE OF CITIES | City Financial Inclusion Efforts: A National Overview 21 . KEY FINDINGS Garden City, Michigan offers the Financial Peace University curriculum (which focuses on paying off debt, building savings, and planning for retirement) for adult residents. The city’s Community Resources Department has embedded the program into existing city services, and staff are working to become trained financial coaches. The city also offers Financial Peace University-Teen & Junior, which include a focus on savings and understanding credit. Homeownership Assistance Municipalities have historically been active in housing development and homeownership assistance. Some cities own and operate public housing, and through city planning and zoning departments they advocate for mixed-used housing and smart growth development practices. Overseeing city planning and development offers city leaders a natural entrée into creating pathways to homeownership for residents.
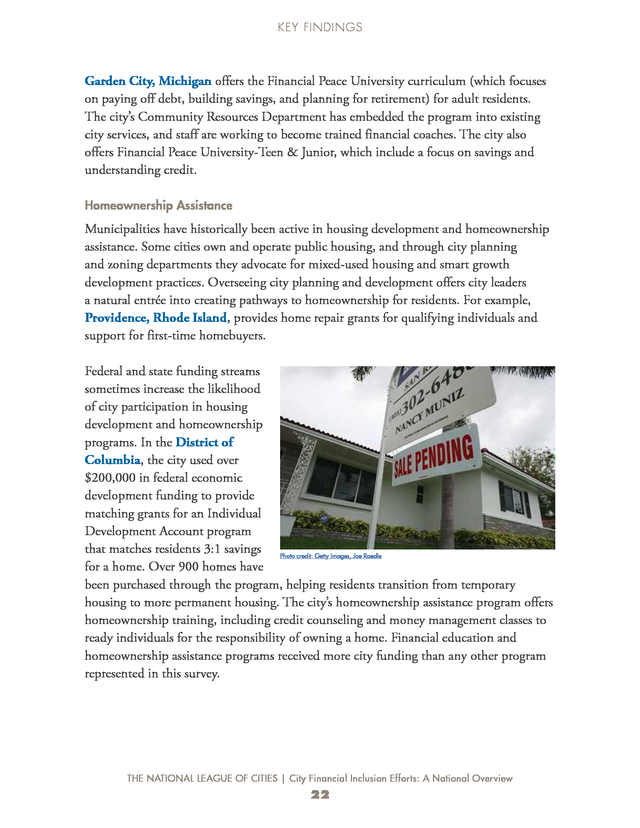
For example, Providence, Rhode Island, provides home repair grants for qualifying individuals and support for first-time homebuyers. Federal and state funding streams sometimes increase the likelihood of city participation in housing development and homeownership programs. In the District of Columbia, the city used over $200,000 in federal economic development funding to provide matching grants for an Individual Development Account program that matches residents 3:1 savings Photo credit: Getty Images, Joe Raedle for a home. Over 900 homes have been purchased through the program, helping residents transition from temporary housing to more permanent housing.
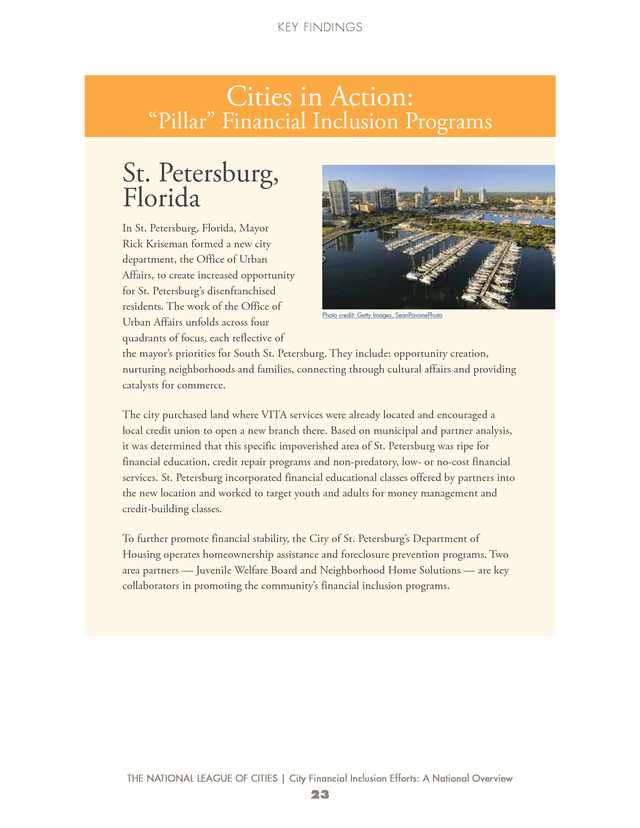
The city’s homeownership assistance program offers homeownership training, including credit counseling and money management classes to ready individuals for the responsibility of owning a home. Financial education and homeownership assistance programs received more city funding than any other program represented in this survey. THE NATIONAL LEAGUE OF CITIES | City Financial Inclusion Efforts: A National Overview 22 . KEY FINDINGS Cities in Action: “Pillar” Financial Inclusion Programs St. Petersburg, Florida In St. Petersburg, Florida, Mayor Rick Kriseman formed a new city department, the Office of Urban Affairs, to create increased opportunity for St. Petersburg’s disenfranchised residents.
The work of the Office of Photo credit: Getty Images, SeanPavonePhoto Urban Affairs unfolds across four quadrants of focus, each reflective of the mayor’s priorities for South St. Petersburg. They include: opportunity creation, nurturing neighborhoods and families, connecting through cultural affairs and providing catalysts for commerce. The city purchased land where VITA services were already located and encouraged a local credit union to open a new branch there.
Based on municipal and partner analysis, it was determined that this specific impoverished area of St. Petersburg was ripe for financial education, credit repair programs and non-predatory, low- or no-cost financial services. St.
Petersburg incorporated financial educational classes offered by partners into the new location and worked to target youth and adults for money management and credit-building classes. To further promote financial stability, the City of St. Petersburg’s Department of Housing operates homeownership assistance and foreclosure prevention programs. Two area partners — Juvenile Welfare Board and Neighborhood Home Solutions — are key collaborators in promoting the community’s financial inclusion programs. THE NATIONAL LEAGUE OF CITIES | City Financial Inclusion Efforts: A National Overview 23 .
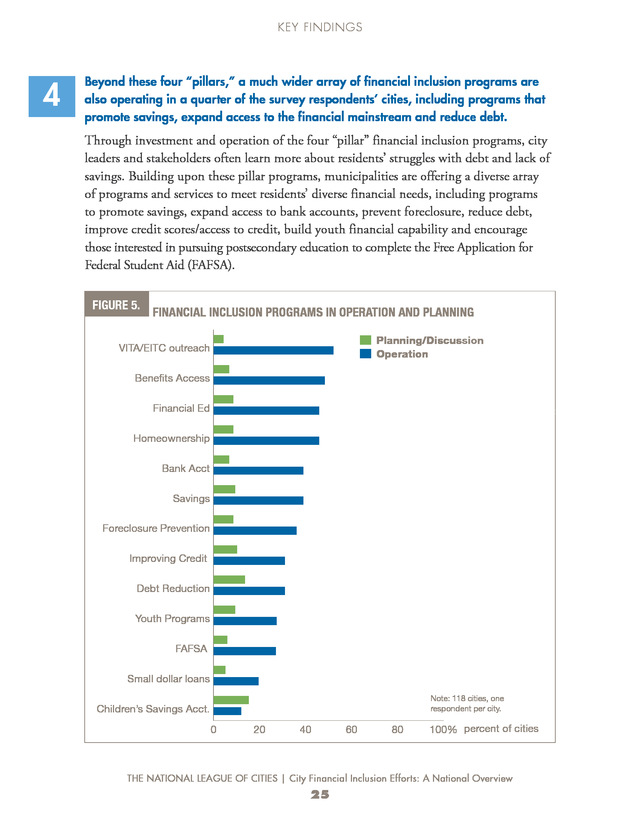
KEY FINDINGS Cities in Action Savannah, Georgia In 2005, the City of Savannah created a nonprofit collaborative, Step Up Savannah, to reduce citywide poverty and lead the city’s financial inclusion work. As a collaborative, Step Up Savannah convenes and provides resources to over 90 partners across the city and serves as the primary cornerstone for the city’s financial empowerment efforts. Photo credit: Getty Images, Natalia Bratslavsky To further its financial inclusion efforts, the city invested time and resources to create an Affordable Housing Trust Fund in early 2014 as a solution to some of Savannah’s housing issues — it is the only housing trust fund in the State of Georgia. In addition, the city has expanded its capacity to ensure residents have access to the resources they need to maximize their paychecks. The Center for Working Families, a network of five community center sites offering VITA services, adult education classes and access to multiple local, state and federal benefits, is funded by the City of Savannah. THE NATIONAL LEAGUE OF CITIES | City Financial Inclusion Efforts: A National Overview 24 . KEY FINDINGS 4 Beyond these four “pillars,” a much wider array of financial inclusion programs are also operating in a quarter of the survey respondents’ cities, including programs that promote savings, expand access to the financial mainstream and reduce debt. Through investment and operation of the four “pillar” financial inclusion programs, city leaders and stakeholders often learn more about residents’ struggles with debt and lack of savings. Building upon these pillar programs, municipalities are offering a diverse array of programs and services to meet residents’ diverse financial needs, including programs to promote savings, expand access to bank accounts, prevent foreclosure, reduce debt, improve credit scores/access to credit, build youth financial capability and encourage those interested in pursuing postsecondary education to complete the Free Application for Federal Student Aid (FAFSA). FIGURE 5. FINANCIAL INCLUSION PROGRAMS IN OPERATION AND PLANNING Planning/Discussion Operation VITA/EITC outreach Operation Benefits Access Financial Ed Planning/Discussion Homeownership Bank Acct Savings Foreclosure Prevention Improving Credit Debt Reduction Youth Programs FAFSA Small dollar loans Note: 118 cities, one respondent per city. Children’s Savings Acct. 0 20 40 60 80 100% percent of cities THE NATIONAL LEAGUE OF CITIES | City Financial Inclusion Efforts: A National Overview 25 . KEY FINDINGS Cities are taking action to help families protect assets by providing access to safe and affordable products, coupled with appropriate financial counseling. Approximately 40 percent of survey respondents are conducting programs that promoting savings. About the same number are also helping residents access non-predatory accounts at financial institutions. Over half of Americans (56 percent) lack emergency savings to weather a financial crisis.4 This statistic, among others, confirms what many city officials see first-hand in their communities individual financial crises compound and sometimes lead to devastating consequences for area business, deterioration of once thriving neighborhoods and decreased city tax and sales revenues. Perhaps because of this, the survey found that initiatives to promote savings and reduce debt are popular among cities. 56% Over half of Americans (56 percent) lack emergency savings to weather a financial crisis. In the Jackson Heights section of Queens, a local New York City partner operates a culturally appropriate savings program targeted at immigrant women that includes an emphasis on peer-to-peer sharing about effective savings strategies. One specific strategy many cities use to promote savings is Individual Development Accounts (IDAs). An IDA is an asset-building tool designed to enable low-income families to save towards a targeted amount of money that is usually used for building assets in the form of homeownership, education or small business ownership.
IDA participant savings are usually matched one to four times the amount of the individual’s initial deposit. While federal funds are available to support IDA programs, many cities and their partners have created innovative IDA initiatives not subject to federal guidelines. For example, Columbia, South Carolina operates the largest IDA program in the state, with a city-funded 3:1 match. Chicago’s IDA program is specially designed to help improve participants’ credit scores in addition to savings toward a designated goal. Helping residents gain access to mainstream financial services such as checking and savings accounts helps ensure individuals and their families have a vehicle by which to save and reduce debt. THE NATIONAL LEAGUE OF CITIES | City Financial Inclusion Efforts: A National Overview 26 .
KEY FINDINGS According to a Federal Deposit Insurance Corporation 2014 Survey of Unbanked and Underbanked households, 7.7 percent of U.S. households are unbanked, meaning they do not have any bank account, and 20 percent of households are underbanked, meaning they may have an account but still rely on costly alternative financial services. Research estimates that in 2012, the alternative financial services market generated $89 billion in fees and interest.5 7.7 percent of U.S. households are unbanked: They do not have any bank account. 20 percent of households are underbanked: They may have an account but still rely on costly alternative financial services. One strategy adopted by city leaders across the country is the Bank On model initiated by City of San Francisco Treasurer José Cisneros and former Mayor Gavin Newsom to help ensure individuals have access to free or low-cost bank accounts. Bank On programs are locally-led coalitions of government agencies, financial institutions and community organizations aiming to connect un- and underbanked individuals to safe and affordable financial services and products and financial education.
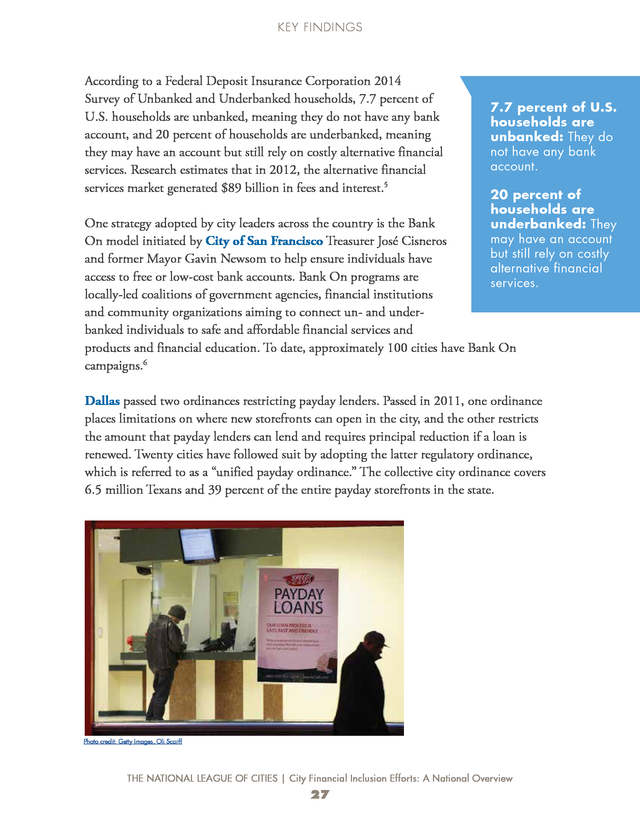
To date, approximately 100 cities have Bank On campaigns.6 Dallas passed two ordinances restricting payday lenders. Passed in 2011, one ordinance places limitations on where new storefronts can open in the city, and the other restricts the amount that payday lenders can lend and requires principal reduction if a loan is renewed. Twenty cities have followed suit by adopting the latter regulatory ordinance, which is referred to as a “unified payday ordinance.” The collective city ordinance covers 6.5 million Texans and 39 percent of the entire payday storefronts in the state. Photo credit: Getty Images, Oli Scarff THE NATIONAL LEAGUE OF CITIES | City Financial Inclusion Efforts: A National Overview 27 .
KEY FINDINGS Other popular financial inclusion programs include efforts to improve or build credit and prevent foreclosures. The Brookings Institution reported that approximately 25 percent of American consumers have subprime credit scores, defined as below 620, while another 25 percent do not have a credit score at all.7 The survey indicates that cities are dedicating resources — time and money — to providing residents access to credit building workshops. City leaders also have a vested interest in reducing foreclosure rates and helping prevent housing crises, as municipalities are negatively impacted from high foreclosures rates. Over 35 percent of survey respondents offer foreclosure prevention assistance. Youth-focused financial inclusion programs and programs to help with Free Application for Federal Student Aid (FAFSA) completion represent two areas of focus that are gaining traction at the city level as a way to help families be better prepared financially in the future. In both cases, 27 percent of survey respondents indicated these initiatives are in place in their cities.
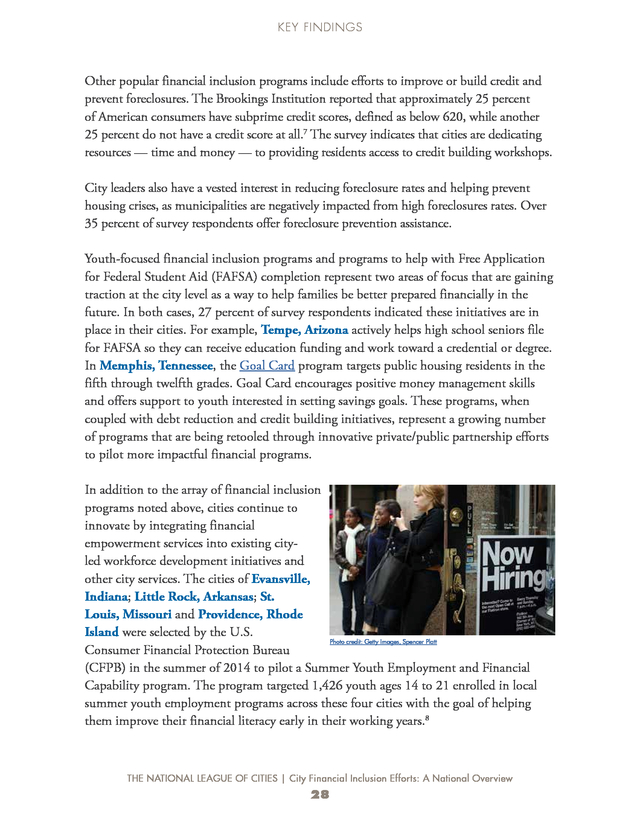
For example, Tempe, Arizona actively helps high school seniors file for FAFSA so they can receive education funding and work toward a credential or degree. In Memphis, Tennessee, the Goal Card program targets public housing residents in the fifth through twelfth grades. Goal Card encourages positive money management skills and offers support to youth interested in setting savings goals. These programs, when coupled with debt reduction and credit building initiatives, represent a growing number of programs that are being retooled through innovative private/public partnership efforts to pilot more impactful financial programs. In addition to the array of financial inclusion programs noted above, cities continue to innovate by integrating financial empowerment services into existing cityled workforce development initiatives and other city services.
The cities of Evansville, Indiana; Little Rock, Arkansas; St. Louis, Missouri and Providence, Rhode Island were selected by the U.S. Photo credit: Getty Images, Spencer Platt Consumer Financial Protection Bureau (CFPB) in the summer of 2014 to pilot a Summer Youth Employment and Financial Capability program. The program targeted 1,426 youth ages 14 to 21 enrolled in local summer youth employment programs across these four cities with the goal of helping them improve their financial literacy early in their working years.8 THE NATIONAL LEAGUE OF CITIES | City Financial Inclusion Efforts: A National Overview 28 . KEY FINDINGS Financial Inclusion Programs Under Development The survey also asked cities what financial inclusion programs were in planning stages or under discussion. The findings indicated that cities with at least one financial inclusion program tend to have more than one program under development. A number of survey respondents indicated that emerging financial inclusion strategies, such as children’s savings accounts, are in the development stage or under discussion in their cities. Children’s savings account (CSA) programs most often include the following components: a savings account, parent/guardian engagement in helping with deposits, incentives to save, such as cash matches and financial education for children and their parents or guardians. CSA programs often help connect families who may otherwise be unbanked to bank accounts and can help them avoid relying on alternative financial services.
Research and practice have shown that family ownership of even a few thousand dollars in assets can give children not only a measure of economic security, but also a transformative sense of possibility and hope for the future.9 It was these aspirations that led the City of San Francisco’s Office of Financial Empowerment to begin the Kindergarten to College program in 2010. Kindergarten to College (K2C) is the first publicly funded, universal children’s college savings account program in the U.S. In 2012, every incoming San Francisco public kindergarten student (a total of over 4,500 students) received a college savings account with a $50 deposit, and the opportunity to receive bonus incentives.
To date, more than 18,000 accounts have been opened. San Francisco Treasurer José Cisneros is the champion behind many of the city’s financial inclusion strategies. Along with Jonathan Mintz, former commissioner of the New York City Department of Consumer Affairs, Treasurer Cisneros chairs the Cities for Financial Empowerment (CFE) Coalition. Many innovative financial inclusion programs have emerged from the 14 cities that make up CFE, which first came together in 2008 after many of its founding members met and learned from one another through an NLCsponsored technical assistance project focused on asset-building.
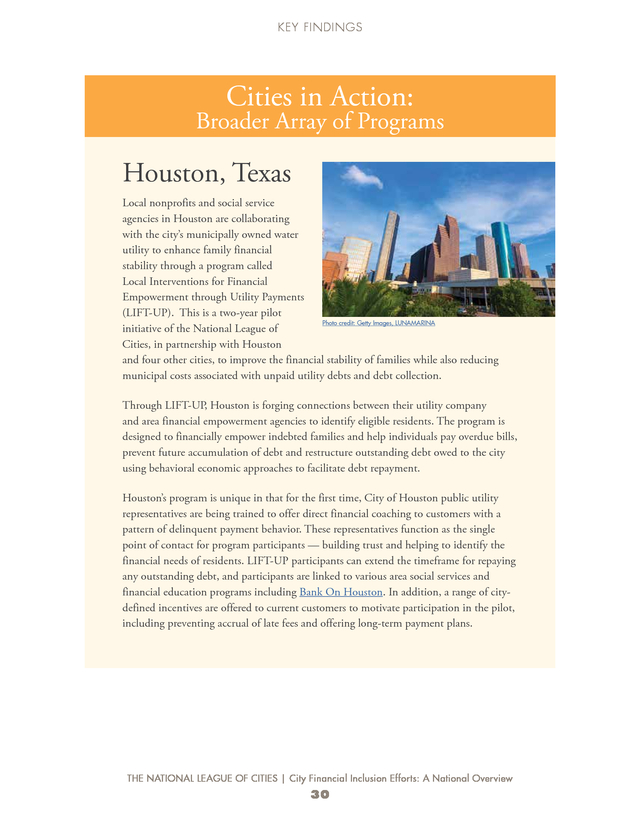
Several of these cities’ efforts are highlighted in this report. Other programs that survey respondents reported were in the planning or development stages include debt reduction programs. For example, for municipalities that own and operate public utilities, forgiving or helping residents with a utility payment plan ensures families have working utilities and reduce their debt. THE NATIONAL LEAGUE OF CITIES | City Financial Inclusion Efforts: A National Overview 29 . KEY FINDINGS Cities in Action: Broader Array of Programs Houston, Texas Local nonprofits and social service agencies in Houston are collaborating with the city’s municipally owned water utility to enhance family financial stability through a program called Local Interventions for Financial Empowerment through Utility Payments (LIFT-UP). This is a two-year pilot Photo credit: Getty Images, LUNAMARINA initiative of the National League of Cities, in partnership with Houston and four other cities, to improve the financial stability of families while also reducing municipal costs associated with unpaid utility debts and debt collection. Through LIFT-UP, Houston is forging connections between their utility company and area financial empowerment agencies to identify eligible residents. The program is designed to financially empower indebted families and help individuals pay overdue bills, prevent future accumulation of debt and restructure outstanding debt owed to the city using behavioral economic approaches to facilitate debt repayment. Houston’s program is unique in that for the first time, City of Houston public utility representatives are being trained to offer direct financial coaching to customers with a pattern of delinquent payment behavior. These representatives function as the single point of contact for program participants — building trust and helping to identify the financial needs of residents. LIFT-UP participants can extend the timeframe for repaying any outstanding debt, and participants are linked to various area social services and financial education programs including Bank On Houston.
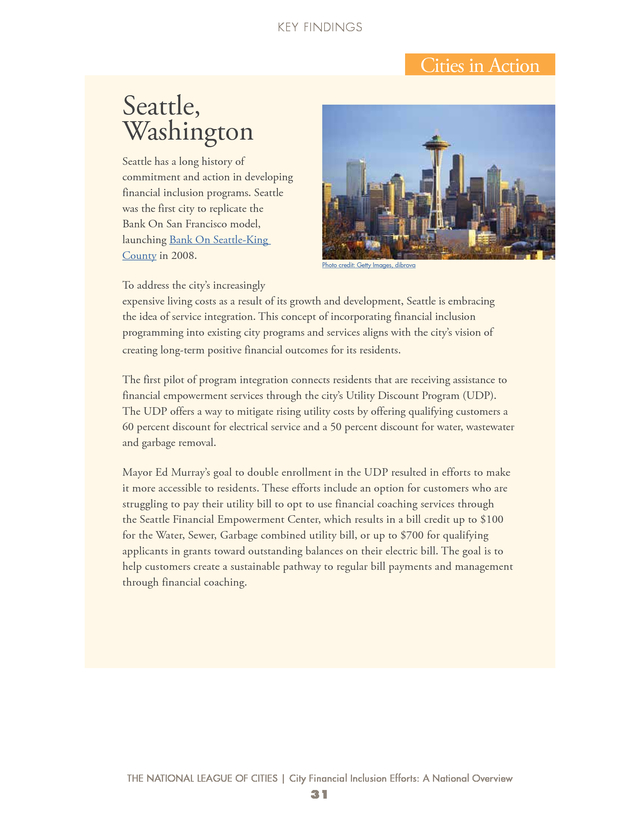
In addition, a range of citydefined incentives are offered to current customers to motivate participation in the pilot, including preventing accrual of late fees and offering long-term payment plans. THE NATIONAL LEAGUE OF CITIES | City Financial Inclusion Efforts: A National Overview 30 . KEY FINDINGS Cities in Action Seattle, Washington Seattle has a long history of commitment and action in developing financial inclusion programs. Seattle was the first city to replicate the Bank On San Francisco model, launching Bank On Seattle-King County in 2008. Photo credit: Getty Images, dibrova To address the city’s increasingly expensive living costs as a result of its growth and development, Seattle is embracing the idea of service integration. This concept of incorporating financial inclusion programming into existing city programs and services aligns with the city’s vision of creating long-term positive financial outcomes for its residents. The first pilot of program integration connects residents that are receiving assistance to financial empowerment services through the city’s Utility Discount Program (UDP). The UDP offers a way to mitigate rising utility costs by offering qualifying customers a 60 percent discount for electrical service and a 50 percent discount for water, wastewater and garbage removal. Mayor Ed Murray’s goal to double enrollment in the UDP resulted in efforts to make it more accessible to residents. These efforts include an option for customers who are struggling to pay their utility bill to opt to use financial coaching services through the Seattle Financial Empowerment Center, which results in a bill credit up to $100 for the Water, Sewer, Garbage combined utility bill, or up to $700 for qualifying applicants in grants toward outstanding balances on their electric bill. The goal is to help customers create a sustainable pathway to regular bill payments and management through financial coaching. THE NATIONAL LEAGUE OF CITIES | City Financial Inclusion Efforts: A National Overview 31 .
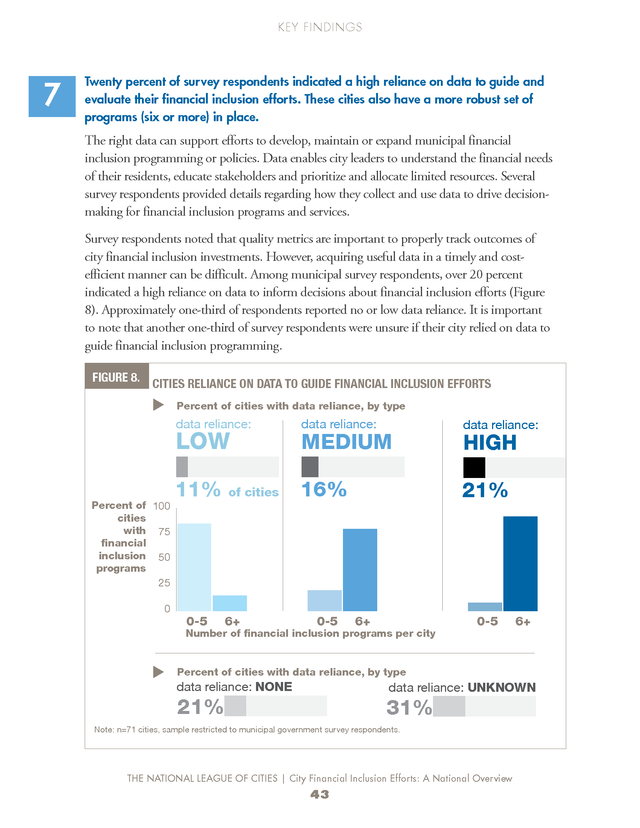
KEY FINDINGS 5 Twenty-nine percent of survey respondents reported having a dedicated “home” for financial inclusion programs (e.g., a lead city department or division), a structure that is strongly correlated with a broader range of programs in operation. Residents’ diverse financial challenges, coupled with city leaders’ efforts to provide a continuum of financial inclusion services and programs often lead to a strong need for cities to work collaboratively with nonprofits and other stakeholders to coordinate resources, realign policies and strive for increased efficiencies — all in an effort to maximize impact. To most effectively accomplish coordination, several municipalities have created “homes” for city-led and/or city-supported financial inclusion efforts. While there are several approaches, the most common “homes” reported by survey respondents included a dedicated city employee within an existing city division, a dedicated, new city division often referred to as an office of financial empowerment or financial inclusion or a quasi-governmental agency or collaboration. Of the survey respondents, 34 indicated that their city had a dedicated office or agency coordinating financial inclusion programs. In some instances, this is an entire city department focused on financial inclusion, and in other cities it may be a division within a city department. The survey revealed a high correlation between cities with five or more financial inclusion programs and cities where there is a dedicated staff person spearheading the city’s efforts. It is reasonable that cities with dedicated staff participating in financial inclusion work have a deeper understanding of the issues impacting residents and a greater chance that relationships with the nonprofit sector are stronger and less duplicative. The ability to have consistent representation at local stakeholder meetings helps ensure city officials are informed and better able to keep city programs and services relevant. Dedicated City Staff within an Existing Division Many cities often initiate engagement in financial inclusion work by designating at least one person who is either dedicated part- or full-time to the topic and serves as the city’s coordinating liaison with other financial inclusion stakeholders.
Most often this role is found within existing city departments such as departments of families, youth, and children; community resources; community development; or human services. THE NATIONAL LEAGUE OF CITIES | City Financial Inclusion Efforts: A National Overview 32 . KEY FINDINGS The City of San Antonio leads its financial inclusion work through the city’s Department of Human Services. The city partnered with the Family Service Association, the United Way of San Antonio and Bexar County to open two Financial Empowerment Centers (FECs) in the city. The FEC counselors are trained to help residents manage debt, deal with debt collectors, improve their credit, build savings, create a budget and find safe and affordable financial products. The FECs were developed through the support of the Cities For Financial Empowerment Fund’s Financial Empowerment Center Replication Initiative, a three-year project that provides funding and technical assistance to a group of cities to replicate the original New York City FEC model.
In addition, San Antonio’s Department of Human Services provides financial counseling directly to its clients seeking assistance with adult learning, housing counseling and job training, as well as parents of children attending the Head Start early childhood education program. Depending on the city’s management structure, the department in which a dedicated financial inclusion city staffer is housed can vary. In Los Angeles, the city’s financial empowerment efforts are an initiative concentrated inside two departments — the Economic and Workforce Development Department and the Housing and Community Investment Department. In the Village of Niles, Illinois; Garden City, Michigan; and Charlotte, North Carolina, the Department of Family Services, the Community Resource Department and the Neighborhood and Business Services Department, respectively, oversee their municipality’s financial inclusion programs. Regardless of the specific location within an organizational chart, cities reported three important considerations when dedicating a role (or part of a role) to financial inclusion work: 1) access to the mayor, city council and/or senior policy makers, 2) power to affect change across multiple departments to ensure action and impact and 3) formalizing financial inclusion work into a city job description to institutionalize the work and create sustainability. Offices of Financial Empowerment/Financial Inclusion To maximize the strength and reach of city government to advance financial inclusion, several cities have evolved from having a city employee(s) dedicated to financial inclusion.
They have opted instead to create a new city division or office dedicated to promoting and implementing these programs. To maximize the strength and reach of city government to advance financial inclusion, several cities have evolved from having a city employee(s) dedicated to financial inclusion. They have opted instead to create a new city division or office dedicated to promoting and implementing these programs. THE NATIONAL LEAGUE OF CITIES | City Financial Inclusion Efforts: A National Overview 33 . KEY FINDINGS Modeled after New York City’s office, the most common title for these divisions are offices of financial empowerment. While cities’ names for such a department might be similar, the depth and scope of offices for financial empowerment vary widely. The Scan revealed that cities with offices of financial empowerment are customizing this model to reflect their community’s individual needs and vision. Some city efforts include a strong focus on consumer protection; this is more common in bigger cities than medium and smaller sized cities.
For example, New York City’s Office of Financial Empowerment includes a strong focus on consumer protection, as the city has regulatory power for consumer protection. One commonality, however, among dedicated offices of financial empowerment is that they usually focus on financial empowerment for residents of all ages — children, young people, adults and seniors. In Columbia, South Carolina, Mayor Steve Benjamin and Councilmember Tameika Isaac Devine created the Office of Family Financial Stability, which is housed in the city’s Community Development Department. The city funds several financial inclusion programs including an individual development account program, homeownership assistance and workshops, credit counseling, a pilot Bank On Columbia initiative, and Access Columbia – which is a fair housing seminar that offers financial education to residents ages five and up. Quasi-Governmental Agencies/ Collaborations The survey responses identified that some cities have created quasi-governmental agencies and/or formed a strategic, collaborative partnership with community nonprofits to promote financial empowerment.
In 2005, Savannah, Georgia created a nonprofit collaborative, Step Up Savannah, to lead their financial inclusion work. Step Up Savannah is similar to some municipal offices of financial empowerment, but is unique as it is a quasi-city government entity located within the city’s Bureau for Planning and Development with a position on the mayor’s leadership team. As a collaborative, Step Up convenes and provides resources to over 90 partners across the city and serves as the primary cornerstone for the city’s financial empowerment efforts. It should be noted that although these “homes” are widely seen as effective strategies in aligning financial inclusion resources, informing policy decisions and heightening collaboration with community partners, the majority of survey respondents have not created a specific city department or office to address the financial needs of underserved residents.
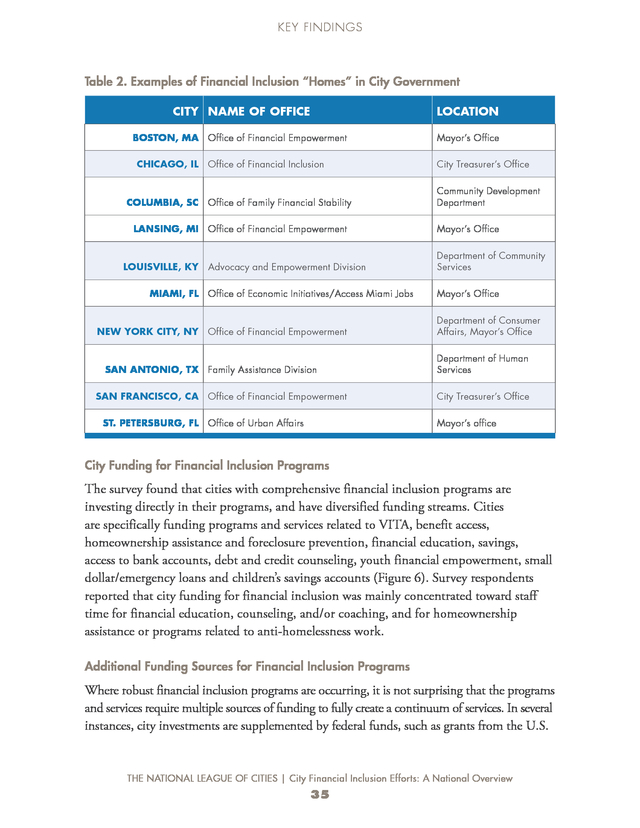
In the majority of respondent cities without dedicated departments or staff specifically dedicated to advancing financial inclusion, the survey found municipal leaders often participate, and in some cases lead, coalitions to bring financial empowerment partners together. THE NATIONAL LEAGUE OF CITIES | City Financial Inclusion Efforts: A National Overview 34 . KEY FINDINGS Table 2. Examples of Financial Inclusion “Homes” in City Government CITY NAME OF OFFICE LOCATION BOSTON, MA Office of Financial Empowerment Mayor’s Office CHICAGO, IL Office of Financial Inclusion COLUMBIA, SC LANSING, MI LOUISVILLE, KY MIAMI, FL NEW YORK CITY, NY City Treasurer’s Office Office of Family Financial Stability Community Development Department Office of Financial Empowerment Mayor’s Office Advocacy and Empowerment Division Department of Community Services Office of Economic Initiatives/Access Miami Jobs Mayor’s Office Office of Financial Empowerment Department of Consumer Affairs, Mayor’s Office SAN ANTONIO, TX Family Assistance Division SAN FRANCISCO, CA Office of Financial Empowerment ST. PETERSBURG, FL Office of Urban Affairs Department of Human Services City Treasurer’s Office Mayor’s office City Funding for Financial Inclusion Programs The survey found that cities with comprehensive financial inclusion programs are investing directly in their programs, and have diversified funding streams. Cities are specifically funding programs and services related to VITA, benefit access, homeownership assistance and foreclosure prevention, financial education, savings, access to bank accounts, debt and credit counseling, youth financial empowerment, small dollar/emergency loans and children’s savings accounts (Figure 6).
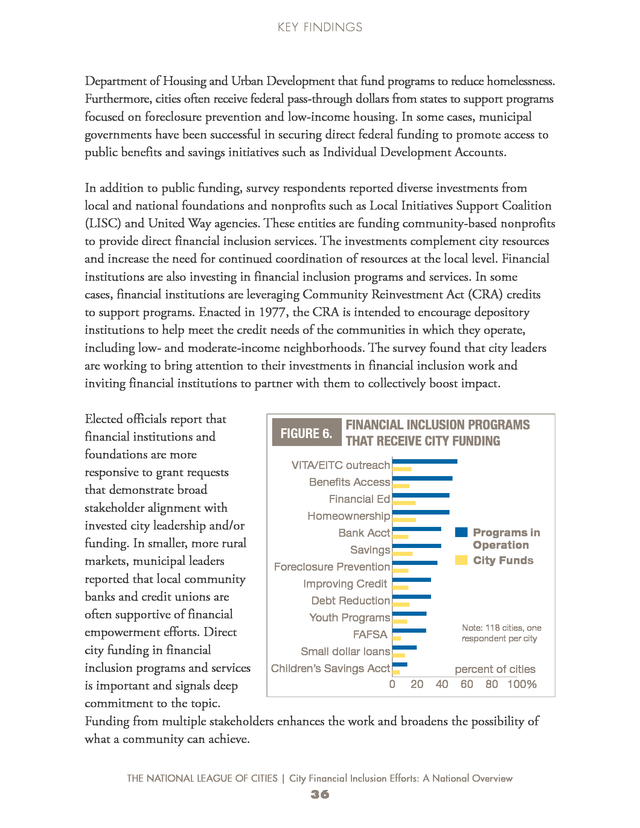
Survey respondents reported that city funding for financial inclusion was mainly concentrated toward staff time for financial education, counseling, and/or coaching, and for homeownership assistance or programs related to anti-homelessness work. Additional Funding Sources for Financial Inclusion Programs Where robust financial inclusion programs are occurring, it is not surprising that the programs and services require multiple sources of funding to fully create a continuum of services. In several instances, city investments are supplemented by federal funds, such as grants from the U.S. THE NATIONAL LEAGUE OF CITIES | City Financial Inclusion Efforts: A National Overview 35 . KEY FINDINGS Department of Housing and Urban Development that fund programs to reduce homelessness. Furthermore, cities often receive federal pass-through dollars from states to support programs focused on foreclosure prevention and low-income housing. In some cases, municipal governments have been successful in securing direct federal funding to promote access to public benefits and savings initiatives such as Individual Development Accounts. In addition to public funding, survey respondents reported diverse investments from local and national foundations and nonprofits such as Local Initiatives Support Coalition (LISC) and United Way agencies. These entities are funding community-based nonprofits to provide direct financial inclusion services. The investments complement city resources and increase the need for continued coordination of resources at the local level.
Financial institutions are also investing in financial inclusion programs and services. In some cases, financial institutions are leveraging Community Reinvestment Act (CRA) credits to support programs. Enacted in 1977, the CRA is intended to encourage depository institutions to help meet the credit needs of the communities in which they operate, including low- and moderate-income neighborhoods.
The survey found that city leaders are working to bring attention to their investments in financial inclusion work and inviting financial institutions to partner with them to collectively boost impact. Elected officials report that FINANCIAL INCLUSION PROGRAMS FIGURE 6. financial institutions and THAT RECEIVE CITY FUNDING foundations are more VITA/EITC outreach responsive to grant requests Benefits Access that demonstrate broad Financial Ed stakeholder alignment with Homeownership City Funds invested city leadership and/or Programs in Bank Acct funding. In smaller, more rural Operation Savings City Funds Operation markets, municipal leaders Foreclosure Prevention reported that local community Improving Credit banks and credit unions are Debt Reduction often supportive of financial Youth Programs Note: 118 cities, one empowerment efforts. Direct FAFSA respondent per city city funding in financial Small dollar loans inclusion programs and services Children’s Savings Acct percent of cities 0 20 40 60 80 100% is important and signals deep commitment to the topic. Funding from multiple stakeholders enhances the work and broadens the possibility of what a community can achieve. THE NATIONAL LEAGUE OF CITIES | City Financial Inclusion Efforts: A National Overview 36 .
KEY FINDINGS Cities in Action: Dedicated “Home” for Programs New York City, New York New York City’s Office of Financial Empowerment (OFE) was launched by former Mayor Michael R. Bloomberg and the Center for Economic Opportunity at the end of 2006 as the first local government initiative in the country with the specific mission to educate, empower and protect individuals and families with low incomes. Photo credit: Getty Images, mjbs With strong city leadership, OFE creates innovative programs, products and services for New Yorkers to help them build assets and make the most of their financial resources. OFE’s goal is to increase access to high-quality, low-cost financial education and counseling; connect individuals to safe and affordable mainstream banking products and services; improve access to income-boosting tax credits, savings and other asset-building opportunities and enforce and improve consumer financial protections to safeguard financial stability. OFE’s key initiatives include: • Launching and coordinating large-scale public awareness campaigns. OFE spearheads public awareness campaigns to help New Yorkers get, save, manage and protect their money — including the EITC Coalition Campaign. • Increasing the availability of free, one-on-one financial counseling residents through the Financial Empowerment Center initiative. Financial empowerment services are available to the public by calling 311. THE NATIONAL LEAGUE OF CITIES | City Financial Inclusion Efforts: A National Overview 37 . KEY FINDINGS Cities in Action • Establishing a dynamic network of financial education providers. OFE established the Financial Education Network (FEN), a network of government, nonprofit and financial sector partners working to provide high-quality financial education and technical assistance. A cornerstone of the FEN is an easy-to-search online directory available on the OFE Web site that enables consumers to find conveniently located financial education services. • Identifying and implementing innovative asset-building practices. OFE works to identify, strengthen and implement innovative practices from across the nation to help New Yorkers build assets and achieve lifelong financial well-being. OFE partners with the city’s many financial institutions to pilot safe and affordable products and services such as NYC SafeStart (low-cost, savings accounts), NYC Direct Deposit (free employer-based checking accounts) and SaveUSA (tax-time matched savings accounts). • Protecting residents with low incomes from unfair and predatory practices. Located within the Department of Consumer Affairs (DCA), OFE helps target strategic enforcement work to protect New Yorkers with low incomes through innovative initiatives in debt collection, used car sales and tax preparation.
OFE coordinates its enforcement and advocacy efforts with DCA’s public awareness and education campaigns. Photo credit: Getty Images, David Crespo Nieto THE NATIONAL LEAGUE OF CITIES | City Financial Inclusion Efforts: A National Overview 38 . KEY FINDINGS 6 Partnerships between municipal governments and external stakeholders represent one critical step that cities are taking to advance local financial inclusion efforts. More than a quarter of the survey respondents work closely with a community partner. Financial inclusion efforts are enriched when municipal leaders join forces with partners to achieve goals. Partnerships increase collaboration and invite participation from a diverse set of stakeholders. As demonstrated in Figure 7, cities are partnering with intermediary organizations, nonprofits, state and regional coalitions and financial institutions to advance a financial inclusion. In some communities, a formal memorandum of understanding (MOU) helps guide the work.
And, in some cities, nonprofits are leading financial inclusion efforts without assistance from municipal government. FIGURE 7. CITY PARTNERSHIPS TO ADVANCE FINANCIAL INCLUSION EFFORTS Nonprofit Lead (no city support) Financial Institution Partner City Office/Agency Intermediary Organization Nonprofit Lead (city support) State/Regional Partnership 36% 33% 29% 27% 26% 23% MOU in Place 16% 0 25 50 Percent of Cities (%) 75 100% Note: 118 cities, one respondent per city. MOU = Memorandum of Understanding. The survey also found that 23 percent of survey respondents are connected to broader regional or statewide efforts. In the majority of the cities with regional or statewide efforts, there are multiple, well-established programs designed to help improve access to non-predatory financial products and services, align program services and create a more robust referral system. THE NATIONAL LEAGUE OF CITIES | City Financial Inclusion Efforts: A National Overview 39 .
KEY FINDINGS In New York City, residents can call the city’s 311 line and request an appointment with a trained, professional financial counselor at a number of Financial Empowerment Centers throughout the city. The Financial Empowerment Center initiative was developed in 2011 and is characterized by comprehensive, standardized financial counselor trainings, meaningful client outcomes measured through a rigorous data tracking system and a number of integrated partnerships with nonprofits and city agencies. Asset-building coalitions, anti-poverty coalitions and free tax preparation (VITA) coalitions make up the majority of financial inclusion networks. These collaboratives often bring together a diverse set of partners including government, nonprofit and corporate entities that complement or augment city investments in financial inclusion programs and services. While these partnerships have great potential for success, based on survey responses it is clear they require a combination of factors to be effective. These include: g A shared vision g Agreement upon how results will be measured g Established outcomes and performance measures for people served g Commitment to data sharing g Regular review of partner outcomes and activities g Dedication to actively participate and continually review and adjust strategies as needed As is common in most partnerships, it takes ongoing dedication and relationship building among partners to succeed.
Challenges are commonplace and expected. The survey reflected that the aforementioned coalitions tend to experience challenges with city participation when: g Proper buy-in is not present from city departments, g Top city leadership is not effectively integrating the work within city department work flow, and g City resources are not allocated to support the work. THE NATIONAL LEAGUE OF CITIES | City Financial Inclusion Efforts: A National Overview 40 . KEY FINDINGS Another common partner for municipal governments is financial institutions. Onethird of survey respondents reported working directly with financial institutions to lead financial inclusion efforts (Figure 7). Many cities specifically suggested that Bank On initiatives have helped municipalities and other stakeholders build partnerships with financial institutions, and underscored the importance of broader collaborations to enhance program effectiveness and reach target populations. The survey results indicate that city partners also help promote awareness about financial inclusion programs and services throughout the community. Even if a formalized coalition is not present, many cities support community-based organizations’ efforts to deliver services to low- and moderate-income residents. Examples of ways cities are promoting financial inclusion services through partnerships include: g Co-branded literature outlining the services that are available, hours of operation and locations, g Public service announcements on local cable access channels, g Incorporating messages in water/utility bill invoices, g Posting partner literature in common city government areas frequented by residents, g Presentations to community groups and public places such as libraries, and g Promoting special events such as Financial Literacy Month. THE NATIONAL LEAGUE OF CITIES | City Financial Inclusion Efforts: A National Overview 41 .
KEY FINDINGS Cities in Action: Partnerships Denver, Colorado In 2008, Denver Mayor John Hickenlooper formed the Denver Economic Prosperity Task Force to coordinate the city’s response to residents’ economic self-sufficiency challenges. Made up of 35 members representing local government, policy makers and community and business leaders, one of the group’s recommendations laid the groundwork for Photo credit: Getty Images, senaiaksoy the development of the Bank On Denver initiative. Key partnerships the city developed with financial institutions, community organizations, and educational institutions allowed over 100 stakeholders to help shape the Bank On Denver program for the city and its residents. Financial institution partners contributed funding and financial services expertise, and community organizations helped the city understand the needs of the underbanked and provided valuable outreach to residents. Current Mayor Michael B.
Hancock’s administration continues to support this agenda as the Denver Financial Empowerment Center galvanizes a new approach to combining financial coaching with banking underserved residents. Los Angeles, California Hire LA’s Youth is a summer jobs program that provides job readiness training, on the job experience and a paycheck to youth in what is often their first job. Through this program, Los Angeles Mayor Eric Garcetti set and achieved the goal of helping 10,000 youth gain summer employment and sharpen their Photo credit: Getty Images, Chris Rogers financial capability skills. Working with public and private sector partners, the program doubled the number of jobs available to youth ages 14-24. Partnering with the Los Angeles Area Chamber of Commerce, the program provides job application, resume writing and interview skills training, as well as financial literacy training to help create healthy financial habits for these first-time wage earners.
The youth worked for an average of 100-120 hours over six weeks and earned $9 per hour. THE NATIONAL LEAGUE OF CITIES | City Financial Inclusion Efforts: A National Overview 42 . KEY FINDINGS 7 Twenty percent of survey respondents indicated a high reliance on data to guide and evaluate their financial inclusion efforts. These cities also have a more robust set of programs (six or more) in place. The right data can support efforts to develop, maintain or expand municipal financial inclusion programming or policies. Data enables city leaders to understand the financial needs of their residents, educate stakeholders and prioritize and allocate limited resources. Several survey respondents provided details regarding how they collect and use data to drive decisionmaking for financial inclusion programs and services. Survey respondents noted that quality metrics are important to properly track outcomes of city financial inclusion investments.
However, acquiring useful data in a timely and costefficient manner can be difficult. Among municipal survey respondents, over 20 percent indicated a high reliance on data to inform decisions about financial inclusion efforts (Figure 8). Approximately one-third of respondents reported no or low data reliance.
It is important to note that another one-third of survey respondents were unsure if their city relied on data to guide financial inclusion programming. FIGURE 8. CITIES RELIANCE ON DATA TO GUIDE FINANCIAL INCLUSION EFFORTS Percent of cities with data reliance, by type data reliance: data reliance: data reliance: 11% 16% 21% LOW Percent of 100 cities with 75 ï¬nancial inclusion 50 programs 25 0 0-5 of cities 6+ MEDIUM 0-5 6+ Number of ï¬nancial inclusion programs per city HIGH 0-5 6+ Percent of cities with data reliance, by type data reliance: NONE data reliance: UNKNOWN 21% 31% Note: n=71 cities, sample restricted to municipal government survey respondents. THE NATIONAL LEAGUE OF CITIES | City Financial Inclusion Efforts: A National Overview 43 . KEY FINDINGS Data-Driven Decision Making Of the cities with a high reliance on data, the survey found a correlation to those cities that also have a high number of financial inclusion programs (Figure 8). This may be due to a heightened awareness of community needs and, thus, more programs to meet those needs. The larger number of programs could be a direct reflection that cities relying heavily on data are better able to pinpoint resources and use funds efficiently, which allows remaining resources for additional programs/services. The survey found that cities both large and small have developed effective strategies for data collection and utilization. Gathering Data to Make the Case for Financial Inclusion Several cities reported using existing data sources to describe the issues or provide quantitative information about the magnitude of a problem or challenge in a city.
Such data is also used to track the progress of programs or policy changes. In the cities of Columbia, South Carolina and Hattiesburg, Mississippi, city officials rely on data from the Internal Revenue Service and U.S. Census Bureau to help guide their financial inclusion programming. Table 3 lists examples of existing data sources that help describe the financial circumstances of city residents.
Approximately one-third of survey respondents report using data related to the federal EITC and unbanked and underbanked populations. Data sources about household credit, business enterprise and home mortgages were used less frequently among survey respondents. In some cases, these sources offer regional and/or city level data. Some information is also broken down to show data at the census track level. THE NATIONAL LEAGUE OF CITIES | City Financial Inclusion Efforts: A National Overview 44 .
KEY FINDINGS Table 3. Data to Inform Financial Inclusion Efforts Cities Collecting Data On Data Topic This Topic Data Source Examples City Level Data Available Corporation for Enterprise Development, Bank On http://webtools.joinbankon.org/community/search Yes Foreclosure data 29% Realty Trac, Public Court Records http://www.realtytrac.com/statsandtrends/ Yes Home mortgage 14% Home Mortgage Disclosure Act (HMDA) http://www.consumerfinance.gov/hmda/ Yes Earned Income Tax Credit (EITC) take-up 35% IRS, Brookings Institution http://www.brookings.edu/research/interactives/eitc Yes Household credit 8% New York Federal Reserve Household Debt and Credit Report http://www.newyorkfed.org/microeconomics/data.html No (State) Business enterprises US Census http://censtats.census.gov/cgi-bin/cbpnaic/cbpsect.pl Yes Unbanked/ underbanked populations 27% 20% Note: n=118 cities, one respondent per city. City-level data in the Data Source Examples may need to be obtained by aggregating census tracks. Cities are using needs assessments and asset mapping tools as other methods of identifying the financial circumstances of residents. Almost one-third of the city respondents have conducted some type of formal needs assessment to identify needs of targeted constituencies or to identify gaps in service. About 30 percent of cities report mapping community indicators such as crime, poverty and health outcomes.
Approximately 34 percent of cities report using asset mapping to identify program and service locations. Information gathered through these strategies helps identify geographic areas of greatest need within a city and can help city officials target resources and enhance programs. THE NATIONAL LEAGUE OF CITIES | City Financial Inclusion Efforts: A National Overview 45 . KEY FINDINGS Measuring Results To truly understand if financial inclusion programs and services are making a difference in the lives of residents, cities and their partners must be able to measure results. Survey respondents with financial inclusion programs in operation reported one or a combination of the following measurement strategies: participation, achievement, and internal or external evaluation (Figure 9). Almost all of these respondents noted they collect program participation measures, such as the number of clients served. Just fewer than 80 percent also collect program achievement measures, such as the number of bank accounts opened. Internal program evaluations were most common, while almost 40 percent reported having used an external, third party evaluator to measure program results.
External evaluators are likely less used due to associated costs. FIGURE 9. To truly understand if financial inclusion programs and services are making a difference in the lives of residents, cities and their partners must be able to measure results. Results are commonly measured through participation, achievement, and internal or external evaluation. FINANCIAL INCLUSION PROGRAMMING EVALUATION TOOLS Program Participation 89% Program Achievement 78% Internal Evaluation 74% External Evaluation 37% 0 25 50 75 100% Percent of Cities Note: n=27 cities. Only respondents indicating the city government was currently operating financial inclusion programming answered this question. THE NATIONAL LEAGUE OF CITIES | City Financial Inclusion Efforts: A National Overview 46 . KEY FINDINGS The survey found that financial inclusion programs frequently collect information on the characteristics of program participants. This data provides baseline information about participant circumstances and is typically used by program administrators and partners to guide program evolution and enhancements. Some cities rely on software management systems to help collect and analyze data as well as evaluate program results and impact. Several survey respondents, including the cities of Nashville, Los Angeles, New York and Denver, use Efforts to Outcomes® (ETO) to collect real-time client information and share data across multiple city agencies and with community partners. ETO is performance management software for human services agencies. Survey respondents reported using participant data to examine if target populations’ needs are being met and identify gaps in services.
Figure 10 details the most common participant data gathered by survey respondents and details the percentage of survey respondents collecting the specific data category. Figure 10. PROGRAM DATA COLLECTION – CLIENT CHARACTERISTICS Client Characteristics Cities collecting this data Income 74% Race/ethnicity 63% Gender 63% Household structure 60% Education attainment 52% Employment status 63% Public assistance receipt 52% Service need 56% Service goal 57% Note: n=27 cities. Only respondents indicating the city government was currently operating financial inclusion programming answered this question. THE NATIONAL LEAGUE OF CITIES | City Financial Inclusion Efforts: A National Overview 47 . KEY FINDINGS Program outcome measures are crucial to tracking client outcomes and establishing program impact. Three types of outcomes measures most commonly used by survey respondents are program service, self-reported outcomes and administrative outcomes. Program service measures are counts of service provision such as the number of clients or number of service hours performed. Self-reported client outcomes can help track client progress and provide insights into a program’s impact. Examples of self-reported outcomes include: client attitudes, stress level, or reports of food or housing insecurity. Self-reported data is largely based on the perceptions and intentions of the client, and as such, is limited by a client’s knowledge, understanding of what is being asked of them and truthfulness. In Virginia Beach, Virginia, Bank On Virginia Beach relies on participant surveys to self-report financial practices, and also on a pre- and post- financial assessment where participants report income, savings, debt, and credit scores.
This information is tracked by participant ZIP code using ZIP code data from the IRS to help with targeted outreach to most vulnerable populations and, ultimately, guide program improvements. The information is also used to help identify likely partners such as faith-based organizations and community centers in vulnerable neighborhoods. Depending on the program’s purpose, administrative records can be an important source of objective data about client outcomes. Respondents report using a range of administrative data including income tax returns, bank account use and balances, utility or loan payments, and court records to inform program results and impact.
Gaining access to such records often requires a data sharing agreement or memorandum of understanding between entities. THE NATIONAL LEAGUE OF CITIES | City Financial Inclusion Efforts: A National Overview 48 . KEY FINDINGS Figure 11. PROGRAM DATA COLLECTION – OUTCOME MEASURES Program Outcomes Cities collecting this data Clients served 81% Service hours 41% Self-Reported Outcomes Other well-being 52% Confidence/attitudes 33% Energy security 30% Emergency saving 26% Food security 26% Housing security 26% Stress level 26% Administrative Outcomes Income tax returns 67% Checking account balance/use 52% Credit reports 52% Saving account balance/use 52% Utility payment/default 41% Public assistance receipt 37% Loan payment/default Child welfare records Court records 30% 15% 7% Note: n=27 cities. Only respondents indicating the city government was currently operating financial inclusion programming answered this question. THE NATIONAL LEAGUE OF CITIES | City Financial Inclusion Efforts: A National Overview 49 . KEY FINDINGS Sharing Data among Partners Survey responses revealed that 19 of the responding cities had a formal MOU related to data and resource sharing with their partner agencies. Several cities have agreements with financial institutions to provide data from Bank On accounts. Survey respondents noted frequent challenges in data collection efforts when the municipality was dependent on financial institutions for information, such as data for the number of accounts opened or average balances. Some financial institutions are unable to work within the context of their internal structures to meet partner data needs.
Despite these challenges, financial institutions remain a strong ally to municipalities working to advance financial inclusion work. Using Data to Advance Financial Inclusion Goals Data collection can be driven by existing program models, municipal interests or funder mandates. Bank On and the Cities for Financial Empowerment Fund, among others, were cited as program models that shaped data collection efforts among cities responding to the survey. Despite the use of data among respondents, only one in three cities responding to the survey has established at least one measurable citywide goal related to financial inclusion, indicating another key area for future improvement. It is encouraging that cities of all sizes have implemented models of data collection related to financial inclusion programs and services.
Further, survey respondents overwhelmingly reported that having the ability to use data to offer city officials, funders and community organizations information about the return on investment is a powerful tool to solicit additional buy-in and funding. City financial inclusion goals varied among survey respondents (Figure 12). The most common financial inclusion goals centered on the number of VITA returns completed and the number of bank accounts opened. Providing financial education, coaching and counseling also ranked high among survey respondents reporting citywide financial inclusion goals.
Setting and measuring goals can also prove to be particularly effective in getting continued support for important programs and services from external stakeholders. Virginia Beach has a citywide goal to “connect 500 low-income families to mainstream financial institutions and help these families avoid foreclosure, avoid predatory lenders and stretch budgets in tough economic times, insuring they are financially fit for the future.” Access to valuable and reliable data allows city government and its partners to regularly monitor success and reallocate resources based on needs and program outcomes. THE NATIONAL LEAGUE OF CITIES | City Financial Inclusion Efforts: A National Overview 50 . KEY FINDINGS FIGURE 12. CITY FINANCIAL INCLUSION GOALS Percent of Cities (%) VITA Returns Completed 27% Bank Accounts Opened 26% 24% Financial Education Provided Financial Coaching Provided 23% Financial Counseling Provided 22% 19% Bank Accounts Maintained Credit Scores Improved 14% 0 25 50 75 100% Note: n=118 cities, one respondent per city. Respondents could identify multiple goals. THE NATIONAL LEAGUE OF CITIES | City Financial Inclusion Efforts: A National Overview 51 . KEY FINDINGS Cities in Action: Data Collection and Evaluation New York City, New York New York City’s Office of Financial Empowerment (OFE) began data collection efforts upon the realization that long-term success and program sustainability requires accurate evidence of program outcomes. As a result city leaders identified metrics that moved Photo credit: Getty Images, mjbs beyond simply counting (e.g., clients served or website hits) towards measures of program impacts (e.g., changes in credit scores, debt owed and saving account balances). As the OFE program model has evolved over time, city officials and program operators monitor data collection, and adjust metrics accordingly so the program can develop in response to increased understanding of clients’ characteristics. For example, the NYC OFE’s programs moved from measuring savings account success with a specific benchmark ($250) to a new measure set at two percent of a program participant’s annual income. The new savings metrics allowed the savings goal to be responsive to a client’s financial situation while also providing a consistent benchmark across program participants. NYC OFE shares its model and helps other cities replicate its programs through the Cities for Financial Empowerment Fund.
New York City’s lessons learned relating to data collection efforts include: • Cities looking to begin or expand data collection efforts should aim to integrate data collection from the beginning of program development and implementation, with a a focus on metrics that can be tracked over time. • To the extent possible, use database systems with the ability to quickly analyze program data to allow for the sharing of real-time data reports with city leadership. • Be strategic about what data points to collect, and focus only on those that will be most useful as evidence of program impacts. Monitor the data collection process and communicate with program staff responsible for the data collection to ensure the process is not too demanding of staff time. • Leadership transitions can provide an opportunity to heighten financial inclusion on a city’s agenda and to deepen data collection/measurement efforts. THE NATIONAL LEAGUE OF CITIES | City Financial Inclusion Efforts: A National Overview 52 . CONCLUSION The findings in this report document municipal leaders’ interest in and willingness to take action to develop and implement a financial inclusion agenda. While the idea of addressing economic insecurity is not new to city leaders, a growing number of cities are pursuing innovative strategies designed to help families manage their finances and improve their financial stability. With recent attention at the national level focused on the financial needs of underserved consumers, this is a time of great opportunity for city leaders. National debates about financial inclusion challenges have underscored the need for creating a more equitable playing field in the financial services marketplace. Leaders at all levels of government are beginning to make strides in addressing these challenges, but nowhere is the impact felt more than at the local level, where elected officials, city staff and their community partners see families struggle every day to make ends meet. The City Scan of Local Financial Inclusion Efforts identified new ways that cities are becoming involved or taking the lead in financial inclusion efforts, but also highlighted missed opportunities.
Even as financial inclusion programs continue to gain traction, too often they are implemented in silos or not effectively supported by city leaders and agencies. As municipal leaders and their community partners set out to enhance and/ or build financial empowerment programs and services for residents, this report offers insights and examples meant to inspire elected officials to take action and bridge the gap between missed opportunities and goals fulfilled. Several lessons emerging from the Scan build on this report’s key findings and can help guide city leaders in their efforts: Partnerships are paramount. Partnerships between city government and other community entities are crucial to the success of financial inclusion efforts. Partnerships will only be strengthened by continued municipal engagement, and city leadership can be very effective in helping promote the steady growth and sustainability of local community organizations. THE NATIONAL LEAGUE OF CITIES | City Financial Inclusion Efforts: A National Overview 53 .
CONCLUSION Municipal leaders can also play an important role in convening stakeholders and helping ensure that they have complementary strategies. For partnerships or coalitions to be successful, it is essential that all partners work together toward a shared goal. City officials – through funding levers, leadership and convening power – can encourage all stakeholders to commit to a shared vision and common metrics for success. Navigating leadership changes can be challenging. When term limits or election results lead to changes in city leadership, municipal agendas and priorities also change. Financial inclusion initiatives can falter in these periods of transition, particularly if a results-driven approach with strong accountability mechanisms has not generated a strong evidence base to support their continuation. Strategies to institutionalize financial inclusion programs so that they draw support from diverse stakeholders and become part of how municipal government does business also can help these programs withstand leadership shifts and any threat of future budget cuts. Use of data to document program success is crucial for sustainability. Making the case for continued support of financial inclusion efforts requires evidence of their impact.
For example, EITC data showing that millions of dollars are coming back into the local economy and that families are saving tax filing fees by relying upon free tax preparation services can have a big influence on policymakers’ decisions regarding investments in EITC/VITA campaigns. Community engagement and ongoing research keep the focus on residents’ needs. As financial inclusion programs in cities develop and expand, ongoing efforts to engage residents and gather information about their changing needs are essential. Every program should include mechanisms for eliciting client/customer feedback that can guide continuous improvement, and explore potential partnerships with universities or nonprofit organizations to shed light on the needs of families not reached by current program offerings. In a rapidly changing financial landscape, this combination of community engagement and targeted research represents a key safeguard to ensure that residents’ needs are being met. THE NATIONAL LEAGUE OF CITIES | City Financial Inclusion Efforts: A National Overview 54 .
CONCLUSION As this report illustrates, dozens of cities now have a range of programs in place to advance elements of a financial inclusion agenda. Few cities have what could be clearly identified as a well-organized and coherent system to drive and sustain progress over time. Sustained efforts to build local financial inclusion systems with strong municipal leadership are now essential to advance and strengthen the field. By adopting a system-building approach, cities will be better able to map current resources, identify service gaps or other unmet needs, set standards and provide the supports necessary to improve program quality and create the metrics and data systems to drive continuous improvement. This is the next frontier for mayors and other city officials who seek to achieve the goal of financial inclusion for all city residents. THE NATIONAL LEAGUE OF CITIES | City Financial Inclusion Efforts: A National Overview 55 .
APPENDIX A Methodology To explore the various ways elected officials and their community partners are promoting financial inclusion addressing economic insecurity and expanding access to financial opportunities, the National League of Cities (NLC) Institute for Youth, Education, and Families developed the City Scan of Local Financial Inclusion Efforts (Scan) in collaboration with United Way Worldwide and the Center for Financial Security at the University of Wisconsin-Madison. The Scan included three parts: an in-depth, online survey of 118 cities about their financial inclusion efforts, a series of follow-up telephone interviews with a subset of 23 survey respondents and a day-long, NLC-sponsored roundtable focused on municipal financial inclusion efforts that included city officials and community partners from 13 cities across the country. From March through May 2014, the Survey of Financial Inclusion Efforts (www.nlc.org/financial-inclusion-scan) was disseminated to city leaders and their partners through several NLC communication venues. It was shared with NLC’s membership through its Weekly newsletter, various peer network listservs, and disseminated at NLC’s annual Congressional Cities Conference in March 2014. The survey was also shared through national partner organizations such as United Way Worldwide. Over 400 responses to the survey were received, and a total of 144 of those surveys representing 118 different cities were completed. The results in this report are derived from the self-reported responses of the representatives from the 118 responding cities.10 Cities in 39 states and the District of Columbia are represented in the survey findings, with the majority of respondents from Southern and Midwest states.
Six states had five or more cities represented within the responses. These included Washington, California, Texas, Colorado, Illinois, and Florida (Figure 13). THE NATIONAL LEAGUE OF CITIES | City Financial Inclusion Efforts: A National Overview 56 . APPENDIX A METHODOLOGY FIGURE 13. CITY REPRESENTATION IN THE SURVEY OF FINANCIAL INCLUSION EFFORTS, BY STATE 5+ cities 2-4 cities 1 city 0 cities Note: 118 cities from 39 states and the District of Columbia are represented in the survey. Alaska (1 city) and Hawaii (1 city) are not shown. Respondents included staff from government agencies (71), United Way organizations (29), and other nonprofit organizations (18). Responses included 50 small cities (defined as cities having a population of less than 50,000), 29 medium-sized cities (defined as cities with a population between 50,000 to 150,000), and 39 large cities (defined as cities with a population of 150,000 or higher). Eleven states are not represented within the survey.11 Respondents completing the survey included staff from government agencies (71), nonprofit organizations (18), and United Way organizations (29). The survey highlighted 14 of the most common financial inclusion programs and used these programs for foundational questions to gauge city-level interest in a broad range of programs designed to help families build financial security.
This approach aims to provide a baseline of the types of financial inclusion programs currently in operation and/or in the planning and development phase across the country. Another major element of the survey focused on identification and examination of local metrics. A series of questions probed respondents to share how they have developed and deployed the use of metrics to measure success. THE NATIONAL LEAGUE OF CITIES | City Financial Inclusion Efforts: A National Overview 57 .
APPENDIX A METHODOLOGY Financial Inclusion Roundtable To provide a deeper examination into some of the municipal financial inclusion initiatives that were described in the survey, NLC hosted the Municipal Financial Inclusion Roundtable in May 2014. The gathering brought together municipal leaders and local United Way partners from 13 cities who had responded to the survey: Chicago, Illinois; Columbia, South Carolina; Dallas, Texas; Denver, Colorado; Hattiesburg, Mississippi; Houston, Texas; Lansing, Michigan; Los Angeles, California; Louisville, Kentucky; Nashville, Tennessee; New York City, New York; San Francisco, California; and Virginia Beach, Virginia. Some of these cities had been extensively involved in NLC’s work on financial inclusion and empowerment in the past. Convened in Washington, D.C., the event generated feedback and guidance on the key financial access challenges facing families. It also allowed NLC to gather more in-depth information about these cities’ financial inclusion initiatives and their goals for the future. The conversation allowed NLC to develop a more comprehensive understanding of municipal action in the financial inclusion field and a deeper appreciation for how leaders are measuring their success. Follow-Up Interviews As part of the data analysis process, NLC staff conducted follow-up telephone interviews with 23 city leaders who responded to the survey.12 The cities represented diversity in size, geography and financial inclusion programming.
The goal of the interviews was to gain a deeper understanding of best practices and challenges in financial inclusion programs and to eliminate or understand any data discrepancies that arose in the data for that city’s response. Interviews were conducted between July and November 2014. Information from the follow-up interviews and the city discussions at the Municipal Financial Inclusion Roundtable was synthesized and incorporated into the findings along with the survey data. City examples highlighted in the report were developed from the follow-up interviews and subsequent contact with city respondents for further information and verification. THE NATIONAL LEAGUE OF CITIES | City Financial Inclusion Efforts: A National Overview 58 .
ENDNOTES ENDNOTES For more information about steps city leaders can take to implement financial inclusion programs, see Taking the First Step: Six Ways to Start Building Financial Security and Opportunity at the Local Level. 1 Email communication with the Stakeholder Partnerships, Education and Communication Department at the Internal Revenue Service. January 15, 2015. 2 For detailed information about how city leaders can develop VITA programs and EITC outreach campaigns, see Maximizing the Earned Income Tax Credit in Your Community: A Toolkit for Municipal Leaders. 3 Bowdler, Janis L. and Lucy S. Gorham (2014).
“All In: Building the Path to Global Prosperity through Financial Capability and Inclusion.” UNC Center for Community Capital and JPMorgan Chase & CO. 4 5 Collins, Dr. Michael J (2014). “Financial Coaching: An Asset Building Strategy.” The National League of Cities has helped numerous cities to replicate the Bank On model.
For more information, see http://www.nlc.org/find-city-solutions/institute-for-youth-education-andfamilies/family-economic-success/financial-empowerment/bank-on-cities-campaign. 6 Horan, Janice (December 15, 2005). “FICO score and the Credit Underserved Market.” Presentation at Brookings Institution Roundtable on Using Alternative Data Sources in Credit Scoring: Challenges and Opportunities. Washington, D.C. 7 Consumer Financial Protection Bureau.
(November 2014). Summer Youth Employment and Financial Capability Pilot. 8 9 Children’s Savings Accounts. Retrieved December 4, 2014 from: http://cfed.org/programs/csa/. A total of 144 surveys representing 118 cities were submitted.
For cities with multiple respondents a decision rule was used to select a single respondent per city that gave preference to (1) fully completed survey responses, (2) municipal government respondents, if multiple respondents remained, and (3) a survey response was randomly selected. 10 The states not represented in the survey are Kansas, Louisiana, Missouri, Nebraska, New Hampshire, New Mexico, Oklahoma, Utah, Vermont and Wyoming. 11 Interviews were conducted with city leaders in the following cities: Boston, MA; Bryan, TX; Chicago, IL; Columbia, SC; Dallas, TX; Denver, CO; Garden City, MI; Hattiesburg, MS; Jackson Heights, NY; Lansing, MI; Louisville, KY; Martinsville, VA; Memphis, TN; New Haven, CT; Oakland, CA; Providence, RI; San Francisco, CA; Savannah, GA; Seattle, WA; St. Petersburg, FL; Tempe, AZ; Washington, DC; and Winston-Salem, NC. 12 THE NATIONAL LEAGUE OF CITIES | City Financial Inclusion Efforts: A National Overview 59 . 1301 Pennsylvania Avenue NW Suite 550, Washington, DC 20004 Metropolitan Life Insurance Company, 200 Park Ave., New York, NY 10166 .
Johnson, executive director of the NLC YEF Institute, provided overall editorial direction for the report. Denise Belser, program manager for family economic success, Jamie Nash, senior associate for benefit outreach and financial empowerment, and Anthony Santiago, senior fellow, conducted the Scan’s interviews and helped shape the report’s content. Emily Pickren, principal associate for communications, served as the primary editor and provided design assistance. The City Scan of Local Financial Inclusion Efforts and this report were made possible by MetLife Foundation. About the National League of Cities The National League of Cities (NLC) is dedicated to helping city leaders build better communities.
NLC is a resource and advocate for 19,000 cities, towns and villages, representing more than 218 million Americans. About the Institute for Youth, Education, and Families The National League of Cities Institute for Youth, Education, and Families (YEF Institute) helps municipal leaders take action on behalf of the children, youth, and families in their communities. NLC launched the YEF Institute in January 2000 in recognition of the unique and influential roles that mayors, city councilmembers and other local leaders play in strengthening families and improving outcomes for children and youth. . TABLE OF CONTENTS Executive Summary.................................................................... 1 Introduction............................................................................... 5 Key Findings.............................................................................. 7 1.
Growth of financial inclusion programs....................... 7 2. “Building blocks” of a financial inclusion agenda.......
13 3. “Pillar” financial inclusion programs.......................... 18 4.
Broader array of programs.......................................... 25 5. Dedicated “home” for programs.................................
32 6. Partnerships with community stakeholders................ 39 7.
Data collection and evaluation................................... 43 Conclusion............................................................................... 53 Appendix A: Methodology.......................................................
56 . EXECUTIVE SUMMARY Despite our nation’s relative wealth, many Americans are financially insecure, lacking the financial means to pay all of their monthly bills or the necessary savings to cover unexpected expenses. Inadequate household incomes, coupled with a lack of financial assets, leave many families in a position where even one unexpected crisis or setback, such as a sudden illness or job loss, can trigger far-reaching and sometimes catastrophic consequences for parents and their children. Mayors and other city leaders know that financial insecurity and hardship can threaten the well-being of families and undermine local economic development, create blighted neighborhoods and jeopardize public safety. Local leaders are increasingly focusing their attention on and committing resources to a comprehensive set of financial inclusion programs that help residents achieve greater financial stability, build assets and gain access to safe and affordable financial services. While the idea of addressing economic insecurity is not new to city leaders, a growing number of cities are pursuing innovative strategies to help low-income individuals and families build savings and assets, improve credit scores, expand access to credit as well as safe and affordable loan products, connect families to benefits for which they are eligible and increase the availability of financial coaching and literacy programs. To explore the various ways elected officials and their community partners are promoting financial inclusion, the National League of Cities (NLC) Institute for Youth, Education, and Families developed the City Scan of Local Financial Inclusion Efforts (Scan) in collaboration with United Way Worldwide and the Center for Financial Security at the University of Wisconsin-Madison. Financial inclusion refers to access to quality, affordable financial services in a convenient manner and with dignity for the customer. Financial inclusion programs expand access to financial services by empowering low-income residents to take advantage of available benefits and tax credits, manage money more effectively and build assets to increase their financial stability. THE NATIONAL LEAGUE OF CITIES | City Financial Inclusion Efforts: A National Overview 1 .
EXECUTIVE SUMMARY The Scan included three parts: an in-depth, online survey of 118 cities about their financial inclusion efforts, a series of follow-up telephone interviews with a subset of 23 survey respondents and a day-long, NLC-sponsored roundtable focused on municipal financial inclusion efforts that included city officials and community partners from 13 cities across the country. This report summarizes the major findings that have emerged from the Scan. It offers numerous examples of ways that cities are promoting and implementing financial inclusion efforts to help residents become more financially secure. It also highlights opportunities that are missed when financial inclusion programs are implemented in silos or not effectively supported by city leaders and agencies. Finally, the report identifies areas in which municipal officials may be able to expand their leadership roles and describes the financial inclusion strategies being implemented in cities, with the hope that these insights will inspire municipal leaders to take further action. SUMMARY OF KEY FINDINGS NLC’s Scan of Local Financial Inclusion Efforts revealed that cities across the country are pursuing diverse and innovative strategies to improve the financial well-being of their residents.
An in-depth analysis of the extensive data generated by the Scan, the majority of which is from the 118 cities that completed the survey, yielded seven key findings: 1 Financial inclusion programs are emerging as an important priority for many city leaders, with various types now common in cities across America. Sixty-five percent of survey respondents have financial inclusion programs in place. 2 A strong cohort of 25 cities (over one-fifth of survey respondents) has assembled at least six out of seven key “building blocks” that appear necessary for sustained progress toward a comprehensive financial inclusion system. THE NATIONAL LEAGUE OF CITIES | City Financial Inclusion Efforts: A National Overview 2 . EXECUTIVE SUMMARY 3 The majority of survey respondents (63 percent) reported at least one of the four “pillars” of city financial inclusion efforts: Volunteer Income Tax Assistance (VITA) and federal Earned Income Tax Credit (EITC) outreach; multi-benefit outreach/ access; financial education, counseling and/or coaching; and homeownership assistance. 4 Beyond these four “pillars,” a much wider array of financial inclusion programs are also operating in a quarter of the survey respondents’ cities, including programs that promote savings, expand access to the financial mainstream and reduce debt. 5 Twenty-nine percent of respondents reported having a dedicated “home” for financial inclusion programs (e.g., a lead city department or division), a structure that is strongly correlated with having a broader range of programs in operation. 6 Partnerships between municipal governments and external stakeholders represent one critical step that cities are taking to advance local financial inclusion efforts. More than a quarter of the survey respondents work closely with a community partner. 7 Twenty percent of survey respondents indicated a high reliance on data to guide and evaluate their financial inclusion efforts. These cities also have a more robust set of programs (six or more) in place. While the survey findings show that financial inclusion is an emerging municipal strategy, the findings also suggest additional opportunities for city leaders to play a more substantial role in these efforts. City leaders can increase the visibility of programs, provide additional resources such as funding or staff support, increase coordination to streamline services, accelerate marketing to ensure all residents in need are aware of the programs and services available to them, and develop or promote methods to assess program effectiveness and measure their impact. City leaders can increase participation in financial inclusion programs through strong marketing efforts, increase coordination to streamline services and develop or promote effective methods to measure program impact. Leadership from a mayor, city manager, city treasurer or councilmember can also help break down silos and strengthen partnerships by bringing new stakeholders into local efforts.
In almost all instances, a strong municipal commitment to financial inclusion translates into more comprehensive and effective programs and services that are more stable and more likely to meet residents’ needs. THE NATIONAL LEAGUE OF CITIES | City Financial Inclusion Efforts: A National Overview 3 . EXECUTIVE SUMMARY Dozens of cities now have a range of programs in place to advance elements of a financial inclusion agenda. Few cities have what could be clearly identified as a well-organized and coherent system to drive and sustain progress over time. Sustained efforts to build local financial inclusion systems with strong municipal leadership are now essential to advance and strengthen the field. By adopting a system-building approach, cities will be better able to map current resources, identify service gaps or other unmet needs, set standards and provide the supports necessary to improve program quality and create the metrics and data systems to drive continuous improvement. This is the next frontier for mayors and other city officials who seek to achieve the goal of financial inclusion for all city residents. In almost all instances, having strong municipal commitment to financial inclusion efforts means programs and services are stronger, more likely to meet residents’ needs and more stable through diversified funding.
Going forward, city leaders will continue to see a need to design creative and comprehensive solutions to equalize access to financial opportunities for all residents. THE NATIONAL LEAGUE OF CITIES | City Financial Inclusion Efforts: A National Overview 4 . INTRODUCTION As the United States economy continues to recover from the Great Recession, many Americans still find themselves facing financial barriers and challenges. Through strong leadership and strategic partnerships, municipal leaders from across the country are stepping in to address the financial struggles of their residents. Recently, a surge of interest in financial inclusion programs at the national level has seen more local leaders focus their attention and commit resources to helping residents become more financially capable and gain access to safe and affordable financial services. These efforts are spawning innovation and inspiring other local leaders to take action in their communities. Mayors and city council members can play important roles in expanding residents’ access to financial opportunities that are safe, affordable and build assets. Many innovative financial inclusion strategies are already being implemented at the local level that municipal leaders can customize and replicate.1 Because just as each city is unique, so are the financial inclusion needs of its residents. To explore the various ways mayors and other city leaders can expand residents’ access to financial opportunities, NLC, in collaboration with United Way Worldwide and the Center for Financial Security at the University of Wisconsin-Madison, initiated the City Scan of Local Financial Inclusion Efforts. The Scan examines the landscape of municipal financial inclusion programs around the country.
It was specifically designed to understand the role and depth of municipal leader engagement as well as pinpoint local metrics used by municipal governments and their community partners to monitor and assess progress toward financial inclusion goals over time. Financial inclusion refers to access to quality, affordable financial services in a convenient manner and with dignity for the customer. Financial inclusion programs expand access to financial services by empowering low-income residents to take advantage of available benefits and tax credits, manage money more effectively and build assets to increase their financial stability. THE NATIONAL LEAGUE OF CITIES | City Financial Inclusion Efforts: A National Overview 5 . INTRODUCTION This report documents the findings of NLC’s City Scan of Local Financial Inclusion Efforts and offers promising examples of municipalities taking action to help residents move toward financial inclusion. As more city leaders develop an interest in offering a continuum of options to help families build financial security, this report serves as a resource to encourage municipal leaders to continue to share emerging insights with other leaders and inspire them to innovate as they work to reach financially underserved residents. METHODOLOGY The City Scan of Local Financial Inclusion Efforts included three components – an in-depth, online survey of cities about their financial inclusion efforts; a day-long examination and discussion of preliminary findings with city officials and community partners from 13 cities at an NLC-sponsored Municipal Financial Inclusion Roundtable; and a series of follow-up telephone interviews with a subset of 23 survey respondents. This report draws on information from all three of these components, although the majority of information is derived from the self-reported survey responses from the 118 responding cities. Respondents completing the survey included staff from government agencies (71), nonprofit organizations (18), and United Way organizations (29). See Appendix A for a detailed description of the methodology. THE NATIONAL LEAGUE OF CITIES | City Financial Inclusion Efforts: A National Overview 6 . KEY FINDINGS 1 Financial inclusion programs are emerging as an important priority for many city leaders, with various types now common in cities across America. Sixty-five percent of survey respondents have financial inclusion programs in place. City leaders are increasingly taking a stand to combat poverty and embrace financial empowerment strategies to move individuals and their families toward better futures. They understand that remaining neutral or silent on the financial well-being of lowincome residents can cost cities a great deal. These costs can include diminished health and education outcomes, increased crime, higher likelihood of generational poverty, neighborhood blight, higher foreclosure rates and decreased property tax revenues. Nearly half of survey respondents reported that financial inclusion programs are a high priority for their mayor and/or city councilmembers (Figure 1). The mayor was most frequently cited as a champion for financial inclusion programs and services (by nearly half of all respondents), but city councilmembers and city managers often step into this role as well. Not surprisingly, strong support from a municipal champion is highly correlated with the presence of a robust and varied set of programs in the community.
While there are many elements that contribute to effective financial inclusion programming, the tipping point tends to be one or two committed city leaders who are using their authority and influence to create and support financial inclusion efforts. In Savannah, Georgia, for example, three consecutive mayors have supported a master plan to reduce citywide poverty rates, and the current mayor, city manager and city council support the city’s financial inclusion work because of its basis in a deeply-rooted, broad anti-poverty agenda of city leaders and stakeholders in Savannah. While there are many elements that contribute to effective financial inclusion programming, the tipping point tends to be one or two committed city leaders who are using their authority and influence to create and support financial inclusion efforts. THE NATIONAL LEAGUE OF CITIES | City Financial Inclusion Efforts: A National Overview 7 . KEY FINDINGS FIGURE 1. CITIES WITH FINANCIAL INCLUSION PROGRAMS IN PLACE 65% 100% FINANCIAL INCLUSION AS PRIORITY FOR CITY LEADERSHIP (percent of cities) 47% Mayor 30% City Manager 41% City Council 0 100% Note: 118 cities, one respondent per city. Respondents reported that “helping residents achieve greater financial stability” was a high or top priority for city leaders. AVERAGE NUMBER OF FINANCIAL INCLUSION PROGRAMS (percent of cities) 19% 1-4 programs 16% 5-8 programs 9+ 31% 0 25 50 75 100% Note: 118 cities, one respondent per city. Total number of programs is a count of the types of programs (e.g., financial education, home ownership assistance, access to bank accounts) reported by the survey respondent as available in a city. It does not capture if there are multiple organizations or locations offering the same type of program.
Thirty-five percent of cities have no programs in place. AVERAGE NUMBER OF FINANCIAL INCLUSION PROGRAMS PER CITY, BY REGION Midwest West Note: 118 cities, one respondent per city. Northeast = 14 cities; South = 38 cities; West = 32 cities (includes Alaska and Hawaii); and Midwest = 34 cities. Total number of programs is a count of the types of programs (e.g., VITA or bank accounts) offered in a city.
It does not capture if there are multiple organizations or locations offering the same type of program. Northeast 7 2 5 5 AK HI South THE NATIONAL LEAGUE OF CITIES | City Financial Inclusion Efforts: A National Overview 8 . KEY FINDINGS No doubt in part due to this leadership commitment by top city officials, nearly twothirds of cities (65 percent) that responded to the survey reported that they had financial inclusion programs in place, either operated by the municipality or another organization. Almost one-quarter of cities responding (23 percent) indicated their municipality operates financial inclusion programs. In other cities, financial inclusion programs are operated by partner community organizations. The average number of programs currently operating in communities responding to the survey is four to five, and the median number of programs in place in communities is three, with one additional program in planning or under discussion. Cities in which financial inclusion was a high priority for elected officials also had the greatest number of programs and/or activities operating in the community. This finding signals that municipal leaders and their partners understand that a multi-faceted approach is needed to meet residents’ diverse financial needs. For example, Columbia, South Carolina seeks to address the multiple needs of public housing residents by incorporating financial inclusion programs into the city’s historical housing assistance programs.
Local leaders launched a campaign in partnership with Wells Fargo Bank, targeted the largest public housing facility for financial education workshops and as a market to promote no- and low-cost bank accounts. Columbia’s city manager hired a dedicated employee to further integrate financial inclusion programming into other city programs and services. Service integration in Columbia serves to create a more ingrained culture of financial inclusion within all aspects of city government. Cities reporting the highest numbers of financial inclusion programs are concentrated primarily in the Northeast, while communities in the Midwest reported having smaller numbers of programs in place (Figure 1).
The more pronounced levels of activity in the Northeast may reflect the higher concentration of financial institutions with headquarters in the region and its status as a geographical target market for many larger banks. Several large financial institutions actively support financial inclusion programs and may have a tendency to focus those investments in geographical areas that mirror their institutional footprint. Within cities responding to the survey, financial inclusion efforts tend to be focused on specific demographic groups and/or on low-income neighborhoods. Among the 27 cities that are currently operating financial inclusion programming, 81 percent reported they had identified at least one priority population for financial inclusion programming (Figure 2). THE NATIONAL LEAGUE OF CITIES | City Financial Inclusion Efforts: A National Overview 9 .
KEY FINDINGS FIGURE 2. PRIORITY POPULATIONS FOR FINANCIAL INCLUSION PROGRAMS Low-income 85% Racial/Ethnic Minorities 63% Children/Youth 58% Immigrants/Refugees 54% Seniors 54% Persons with Disabilities 42% Veterans 42% 0 25 50 75 100% Note: n=27 cities. Only respondents indicating the city government was currently operating financial inclusion programming answered this question. City efforts appear to also have a multi-generational approach, with survey respondents reporting both a focus on children and youth (58 percent) and seniors (54 percent). Some cities are also concentrating their work on residents from racial or ethnic minorities (62 percent), those with immigrant or refugee status (54 percent), persons with disabilities (42 percent) and veterans (42 percent). For example, in the City of Louisville, Kentucky, local nonprofits and social services organizations partnered with the National Disability Institute to convene the first-ever Economic Advancement Assembly. The gathering brought together 40 organizations focused on collectively expanding available financial capability programs to better serve individuals with disabilities.
Community stakeholders, with strong support from Mayor Greg Fischer, worked together to highlight emerging needs of the disability community and specifically identify where agencies could better collaborate to meet individuals’ needs. An immediate outcome of the Assembly was the creation of the Workforce Development/Financial Empowerment Collaborative, made up of 27 individuals representing 17 agencies from both the public and private sectors. This collaborative is developing a set of recommendations to move Louisville’s financial empowerment efforts forward. THE NATIONAL LEAGUE OF CITIES | City Financial Inclusion Efforts: A National Overview 10 .
KEY FINDINGS Cities in Action: Growth of Financial Inclusion Programs Boston, Massachusetts The City of Boston has a long history of commitment to the financial stability of residents. Former Mayor Thomas Menino championed the city’s early efforts to promote the federal Earned Income Tax Credit (EITC) and develop a free tax preparation campaign in collaboration with the IRS, the Boston Federal Reserve Bank, numerous community-based organizations, Photo credit: Getty Images, SeanPavonePhoto universities, the business community and financial institutions. Martin J. Walsh, Boston’s current mayor, has embraced this strategy and is building on the past successes to address disparities and help Bostonians build wealth. In October 2014, Mayor Walsh launched Boston’s Office of Financial Empowerment to address poverty and income inequality.
One purpose of the office is to better align the city’s financial inclusion efforts to deliver coordinated services to a diverse population. The City of Boston, in partnership with the United Way of Massachusetts and the Local Initiatives Support Corporation (LISC), recently opened two new financial opportunity centers, which are among the initial components of a sweeping plan to promote economic resilience in Boston. The full-service centers offer job search assistance, access to training for career development and financial coaching to help people manage their resources and obtain available benefits. A webbased assessment tool allows staff to determine the needs of new clients and help them establish and track their employment goals. In addition, the City of Boston’s Ambassador program trains outreach workers to be culturally sensitive and help the city promote programs that specifically help the community’s diverse population base.
Workers speak seven different languages and serve as a critical bridge to educate residents on the various financial inclusion programming available to them, including free tax preparation services through the city’s Volunteer Income Tax Assistance sites. THE NATIONAL LEAGUE OF CITIES | City Financial Inclusion Efforts: A National Overview 11 . KEY FINDINGS Cities in Action Hattiesburg, Mississippi In 2001, Mayor Johnny DuPree started the city-funded Education Initiative, with the goal of educating residents about the federal EITC and Child Tax Credits. In partnership with AARP and the U.S. Internal Revenue Service, the initiative expanded to offer residents access Photo credit: Christopher Little/Hattiesburg American, Kelly to free tax preparation services and financial education. Price/Hattiesburg American Today, the city offers financial inclusion programming throughout the year, and specifically develops programs for high-need, target populations. For example, municipal leaders launched a new summer youth jobs program to not only connect youth to employment, but also help youth establish bank accounts and access financial education classes.
Two area banks joined forces with the city to make these accounts a reality for Hattiesburg’s young people. San Francisco, California San Francisco’s elected treasurer, José Cisneros, has made financial inclusion his highest priority since he was appointed to the position in 2004 and elected three times since then. Treasurer Cisneros has been a champion and pioneer in the municipal financial Photo credit: Getty Images, Vector4530 inclusion field, believing that his role of safeguarding the city’s money should extend to improving the financial stability and well-being of all city residents. In 2005, Treasurer Cisneros and former Mayor Gavin Newsom launched the Working Families Credit, a local earned income tax credit modeled after the federal EITC. In making payments to residents eligible for the credit, Treasurer Cisneros had an “aha” moment when he realized that large numbers of these families did not have bank accounts and were relying on high-cost check cashers just to cash their paychecks each week.
This led the city to develop and launch Bank On San Francisco in 2006, creating pathways for un- and under-banked residents to obtain safe and affordable bank accounts, and creating a model that would subsequently be replicated in over 100 cities and states nationwide. THE NATIONAL LEAGUE OF CITIES | City Financial Inclusion Efforts: A National Overview 12 . KEY FINDINGS 2 A strong cohort of 25 cities (over one-fifth of survey respondents) has assembled at least six out of seven key “building blocks” that appear necessary for sustained progress toward a comprehensive financial inclusion system. While financial inclusion programs are becoming common in cities across the country, some cities are taking a more holistic approach to building a more comprehensive financial inclusion system that can support multiple programs and strategies. NLC examined the survey data and identified seven key “building blocks” that appear to support a successful local financial inclusion agenda. Table 1. Cities with Six or More Financial Inclusion Building Blocks in Place Boston, MA Bryan, TX Chicago, IL Columbia, SC Dallas, TX Garden City, MI Hattiesburg, MS Lansing, MI Los Angeles, CA Martinsville, VA Miami, FL Nashville, TN New Haven, CT New York, NY Oakland, CA Roanoke, VA San Antonio, TX San Francisco, CA Savannah, GA Seattle, WA Springfield, MA St. Petersburg, FL Tempe, AZ Washington, DC Winston-Salem, NC Note: Data from survey, including data on financial inclusion building blocks, is self-reported. See Appendix A: Methodology for more information. STRONG CHAMPION A Strong Champion This response was the most frequently cited by survey respondents, with two-thirds (66 percent) of respondents reporting having a mayor and/or city councilmember designating financial inclusion issues as a “top” or “high” priority. 66% Having an elected official who is highly involved in financial inclusion efforts has proven useful to the majority of the cities engaged in the asset-building field.
From serving as the public face of a campaign to promoting awareness in the community to getting the stakeholders aligned — all of these outcomes have been the result of engaged, elected city leadership. THE NATIONAL LEAGUE OF CITIES | City Financial Inclusion Efforts: A National Overview 13 COORDINATI 65% . KEY FINDINGS STRONG CHAMPION Coordination COORDINATION ACTION 65% 60% Almost two-thirds (65 percent) of respondents indicated they have at least one financial inclusion coordination mechanism in place to support and align local financial inclusion efforts. 66% Whether it is a city department, a jointly funded collaborative or direct funding to a nonprofit, the survey results underscored the importance of cities having a mechanism or partnership in place to support and align local financial inclusion efforts. Some cities have internal departments that steer financial inclusion planning, some support co-funded collaborations and several directly fund a community nonprofit to lead the work. Survey results indicated that ideally, all cities looking to provide financial inclusion programs and services will have at least one strong nonprofit partner whose mission it is to support low- and moderate-income families and individuals. In addition, having private funders involved in financial empowerment efforts with city leaders and their nonprofit partners is a critical ingredient to the overall coordination and success of this work. STRONG CHAMPION Leadership Actions COORDINATION ACTION PROGRAMMIN Sixty percent of cities indicated that there were at least two actions taken by the mayor or a city councilmember to demonstrate commitment to financial inclusion. The survey showed that committed city leaders66% demonstrate their support 65% 60% in a variety of ways, including using the bully pulpit to highlight the issue, making policy changes that promote financial inclusion, directly funding promising strategies through city or nonprofit agencies, creating a department or advisory position that specifically addresses the financial needs of underserved residents, and joining or investing in a coalition or coordinating entity to align and connect financial inclusion efforts. Spearheaded by Mayor A C Wharton, leaders in Memphis, Tennessee created a task force in 2014 made up of cross-sector stakeholders that are committed to reducing poverty by ten percent over the next ten years. Programming STRONG CHAMPION COORDINATION ACTION PROGRAMMING 47% COMMUNITY COMMITMENT Almost half (47 percent) of cities responding to the survey had at least five financial inclusion programs and services in place. Having a broad range of programs demonstrates a better ability to meet 66% 65% 60% 47% the diverse financial inclusion needs that exist among low- and moderateincome populations.
Some of the programs and services within cities’ financial inclusion continuum include efforts to help families: build savings; avoid THE NATIONAL LEAGUE OF CITIES | City Financial Inclusion Efforts: A National Overview 14 34% . KEY FINDINGS alternative, predatory financial services; open bank accounts; repair and build credit; enhance financial education; access financial counseling and coaching; and claim important public benefits and tax credits. Cities responding to the survey also reported that robust financial inclusion programming also includes ensuring programs and services are culturally appropriate and relevant to targeted populations. STRONG Community Commitment CHAMPION COORDINATION ACTION PROGRAMMING Over one-third (34 percent) of respondents indicated that city and community leaders who are not mayors or councilmembers are also committed to financial inclusion and are actively engaging in actions to promote financial inclusion, 66% 65% 60% 47% and have demonstrated strong commitment to the financial needs of families. COMMUNITY COMMITMENT GOALS 34% 34% These leaders include stakeholders in the business and nonprofit sectors, county leaders and city treasurers or controllers. Actions taken to demonstrate this commitment vary, and can include directly funding financial inclusion programming; creating or leading a committee, task force or coalition; running or supporting a financial inclusion program; dedicating staff to financial inclusion programs or coalitions or finally, initiating an asset-building coalition. STRONG Goals CHAMPION COORDINATION ACTION PROGRAMMING COMMUNITY COMMITMENT GOALS VISION 34% 23% Over one-third (34 percent) of survey respondents indicated that their city had at least one citywide financial inclusion goal in place. Goal setting helps ensure programs and services 47% are monitored, and are 66% 65% 60% 34% continuously adjusted to ensure needs are being met. It also increases the likelihood that the impact of the program can be measured. STRONG CHAMPION Vision COORDINATION ACTION PROGRAMMING COMMUNITY COMMITMENT GOALS VISION Twenty-three percent of cities responding to the survey indicated having at least one program or expansion of an existing program in the planning stages. 66% Strong financial inclusion efforts generally include34% community visioning about 23% 65% 60% 47% 34% new or expanded programs and services that can be provided to families. Having a vision for the future helps continue innovation and ensures that programming evolves to meet needs and demand.
Financial inclusion stakeholders working collectively, sharing information and visioning a shared agenda allows for regular evaluation and program improvements. It also helps ensure resources are allocated where they are most needed. THE NATIONAL LEAGUE OF CITIES | City Financial Inclusion Efforts: A National Overview 15 . KEY FINDINGS A combination of these building blocks can create an environment that allows financial inclusion programs and services to flourish. FIGURE 3. FINANCIAL INCLUSION BUILDING BLOCKS A strong champion 66% 65% Coordination Leadership Actions 60% Programming 47% Community commitment 34% Goals 34% Vision 23% 0 25 50 75 100% Percent of cities CITIES WITH FIVE OR MORE BUILDING BLOCKS IN PLACE % of cities 100% 25 cities have at least six of the seven blocks in place. 80 60 40 37 cities have at least five building blocks. 20 0 1 2 3 9% 12 % 10% Percent of cities 4 5 6 7 Number of blocks Note: 118 cities, one respondent per city. THE NATIONAL LEAGUE OF CITIES | City Financial Inclusion Efforts: A National Overview 16 . KEY FINDINGS Cities in Action: Financial Inclusion “Building Blocks” Lansing, Michigan Established in 2014, the Employee Empowerment Corps (EEC) is a collaborative partnership of three Lansing area nonprofit and community service organizations that are pioneering innovative approaches to increasing financial well-being in the lives of low-and moderate-income employees. The partners are the City of Lansing’s Financial Empowerment Center, Center for Financial Health Photo credit: Getty Images, Henryk Sadura and the Asset Independence Coalition. The EEC design is a workplace model delivering 1) financial counseling, 2) income support through the Volunteer Income Tax Assistance (VITA) program and benefits access, 3) services promoting access to safe and affordable financial products and 4) asset-building opportunities through homeownership. By bringing together resources in the workplace, the EEC creates shared and customized solutions for both individual and organizational effectiveness. The city’s leadership believes that offering employees financial education opportunities has several benefits for employers. A well-trained work force offers important productivity, recruitment and retention enhancements. Just as importantly, employees greatly value the program. A higher credit score and a well-balanced budget often lead to higher financial security, and specialized training courses may enhance an individual’s professional qualifications. Lansing, Michigan 1 2 3 4 5 6 7 Number of building blocks in place THE NATIONAL LEAGUE OF CITIES | City Financial Inclusion Efforts: A National Overview 17 .
KEY FINDINGS 3 The majority of survey respondents (63 percent) reported at least one of the four “pillars” of financial inclusion city efforts: Volunteer Income Tax Assistance (VITA) and federal Earned Income Tax Credit (EITC) outreach; multi-benefit outreach/access; financial education, counseling and/or coaching; and homeownership assistance. These four specific types of programs were most frequently cited by survey respondents. Taken together, they often form the “pillars” of a strong city infrastructure for financial inclusion efforts. The survey found that the four pillar programs were more likely than other financial inclusion programs to receive city funding. For example, almost one-fifth of cities directly funded financial education and/or homeownership programs. Moreover, cities that had these four pillar programs in place were much more likely to contribute city funds to any financial inclusion program. Among the 44 survey respondents without pillar programs in place, only three have any financial inclusion programs at all. And only one city out of these 44 has city funds to advance financial inclusion programs. Sixty-five percent of cities with at least one pillar program have city funds dedicated to financial inclusion programs (Figure 4). 65% of cities with at least one pillar program have city funds dedicated to financial inclusion programs. These programs often have local, state and federal funding opportunities that make them more attractive for additional city investments.
Investment in pillar programs may be more common due to the fact these programs are likely more frequent, may offer proven results that increase credibility, and garner additional support from strategic community partners engaged in financial inclusion efforts. Photo credit: Getty Images, cabania Photo credit: Getty Images, mrdoomits THE NATIONAL LEAGUE OF CITIES | City Financial Inclusion Efforts: A National Overview 18 . KEY FINDINGS FIGURE 4. TYPES OF FINANCIAL INCLUSION PILLAR PROGRAMS VITA/EITC OUTREACH HOMEOWNERSHIP ASSISTANCE ACCESS TO PUBLIC BENEFITS FINANCIAL EDUCATION, COUNSELING, COACHING CITIES WITH PILLAR PROGRAMS (percent of cities by type of program) VITA/EITC outreach 52% Financial education, counseling, coaching 46% Beneï¬ts (access to public beneï¬ts) 48% Homeownership assistance 46% Any pillar program 63% CITIES WITH MUNICIPAL FUNDING DEDICATED TO FINANCIAL INCLUSION PROGRAMMING (by whether pillar programs are present) Cities with no pillar programs Cities with at least one pillar program 2% 65% Note (second figure): 118 cities, one respondent per city. Note (third figure): Total of 118 cities responded to the survey. “With Pillar Programs” indicates cities with at least one of four programs (VITA, Benefits, Home and Fin Ed) operating in the city (n=74 cities). “Without Pillar Programs” indicates cities that did not report any of these four programs operating in the city (n=44 cities). THE NATIONAL LEAGUE OF CITIES | City Financial Inclusion Efforts: A National Overview 19 . KEY FINDINGS Volunteer Income Tax Assistance (VITA) and Earned Income Tax Credit Outreach (EITC) A majority of all cities polled confirmed that VITA programming continues to be a fundamental element of a municipal financial inclusion strategy. VITA work has grown tremendously in recent years as cities work to ensure that all eligible residents know about and claim the federal, and in some areas, state EITC. The EITC is a federal refundable tax credit for low- and moderate-income working people. Currently, 25 states and the District of Columbia have established their own EITCs to supplement the federal credit. Over the past decade, numerous municipalities have joined with their community partners to provide free tax preparation services and conduct outreach about the availability of the EITC. According to the IRS, income tax forms prepared through VITA sites grew by over 200 percent since 2000.2 The EITC is a federal refundable tax credit for low- and moderate-income working people. 6.5 million In 2012, the EITC lifted about 6.5 million people out of poverty, including 3.3 million children. The Center on Budget and Policy Priorities reports that in 2012, the EITC lifted about 6.5 million people out of poverty, including 3.3 million children.
Given the potential of supplementing so many low- and moderate-income families’ incomes and spurring economic activity (as the EITC brings millions of dollars back to local economies), it is no surprise that municipal leaders invest in free tax preparation and EITC marketing and outreach strategies.3 Further, leaders continue to help eligible residents protect and keep their EITC refunds by working to offer free tax preparation so individuals do not fall prey to predatory tax services or rapid refund anticipation loan products. For example, Chicago directly funds VITA and EITC outreach efforts, and city officials actively lend support by attending press events and promoting services to residents. Overall, VITA and EITC programming led all other programs currently in operation in the survey (Figure 4). Multi-Benefit Outreach and Access In addition to VITA programming, three other financial inclusion programs appear to be vital elements of a broader municipal effort.
These include helping residents access public benefits such as the Supplemental Nutrition Assistance Program (SNAP) and Medicaid; providing homeownership assistance; and offering financial education, counseling, and/ or coaching. Over half (63 percent) of all survey respondents indicated their city is operating and has operated at least one of these financial inclusion programs (Figure 4). THE NATIONAL LEAGUE OF CITIES | City Financial Inclusion Efforts: A National Overview 20 . KEY FINDINGS Over the past decade, city leaders have continued to see residents working but struggling to make ends meet. Promoting key work supports such as SNAP, Medicaid, the LowIncome Energy Assistance Program and free- or low-cost health care, to name a few, are additional ways municipal governments are helping individuals stretch their paychecks. Cities often join forces with local nonprofits to help individuals complete and/or navigate sometimes complicated federal and state benefit applications. Financial Education, Counseling and Coaching The survey findings show that city support for financial education, counseling and coaching is strong. Financial education is defined as Key components of the ability to use knowledge and skills to manage financial resources financial education include learning basics effectively. Key components of financial education include learning in creating a budget, basics in creating a budget, balancing a checkbook, identifying balancing a checkbook, financial services that fit one’s needs and using a bank account. identifying financial Financial counseling focuses on helping individuals who face a services that fit one’s needs and using a bank financial problem and may deem their situation as a “crisis.” It is account. typically a short-term opportunity to help a person with an immediate need.
Financial coaching, an approach that is growing significantly in the asset-building field, typically involves a coach who works one-on-one with a person to identify behaviors, design a plan for improvement and help the individual work toward solutions. Photo credit: Getty Images, Joe Raedle Photo credit: Getty Images, Chris Hondros Photo credit: Getty Images, Joe Raedle THE NATIONAL LEAGUE OF CITIES | City Financial Inclusion Efforts: A National Overview 21 . KEY FINDINGS Garden City, Michigan offers the Financial Peace University curriculum (which focuses on paying off debt, building savings, and planning for retirement) for adult residents. The city’s Community Resources Department has embedded the program into existing city services, and staff are working to become trained financial coaches. The city also offers Financial Peace University-Teen & Junior, which include a focus on savings and understanding credit. Homeownership Assistance Municipalities have historically been active in housing development and homeownership assistance. Some cities own and operate public housing, and through city planning and zoning departments they advocate for mixed-used housing and smart growth development practices. Overseeing city planning and development offers city leaders a natural entrée into creating pathways to homeownership for residents.
For example, Providence, Rhode Island, provides home repair grants for qualifying individuals and support for first-time homebuyers. Federal and state funding streams sometimes increase the likelihood of city participation in housing development and homeownership programs. In the District of Columbia, the city used over $200,000 in federal economic development funding to provide matching grants for an Individual Development Account program that matches residents 3:1 savings Photo credit: Getty Images, Joe Raedle for a home. Over 900 homes have been purchased through the program, helping residents transition from temporary housing to more permanent housing.
The city’s homeownership assistance program offers homeownership training, including credit counseling and money management classes to ready individuals for the responsibility of owning a home. Financial education and homeownership assistance programs received more city funding than any other program represented in this survey. THE NATIONAL LEAGUE OF CITIES | City Financial Inclusion Efforts: A National Overview 22 . KEY FINDINGS Cities in Action: “Pillar” Financial Inclusion Programs St. Petersburg, Florida In St. Petersburg, Florida, Mayor Rick Kriseman formed a new city department, the Office of Urban Affairs, to create increased opportunity for St. Petersburg’s disenfranchised residents.
The work of the Office of Photo credit: Getty Images, SeanPavonePhoto Urban Affairs unfolds across four quadrants of focus, each reflective of the mayor’s priorities for South St. Petersburg. They include: opportunity creation, nurturing neighborhoods and families, connecting through cultural affairs and providing catalysts for commerce. The city purchased land where VITA services were already located and encouraged a local credit union to open a new branch there.
Based on municipal and partner analysis, it was determined that this specific impoverished area of St. Petersburg was ripe for financial education, credit repair programs and non-predatory, low- or no-cost financial services. St.
Petersburg incorporated financial educational classes offered by partners into the new location and worked to target youth and adults for money management and credit-building classes. To further promote financial stability, the City of St. Petersburg’s Department of Housing operates homeownership assistance and foreclosure prevention programs. Two area partners — Juvenile Welfare Board and Neighborhood Home Solutions — are key collaborators in promoting the community’s financial inclusion programs. THE NATIONAL LEAGUE OF CITIES | City Financial Inclusion Efforts: A National Overview 23 .
KEY FINDINGS Cities in Action Savannah, Georgia In 2005, the City of Savannah created a nonprofit collaborative, Step Up Savannah, to reduce citywide poverty and lead the city’s financial inclusion work. As a collaborative, Step Up Savannah convenes and provides resources to over 90 partners across the city and serves as the primary cornerstone for the city’s financial empowerment efforts. Photo credit: Getty Images, Natalia Bratslavsky To further its financial inclusion efforts, the city invested time and resources to create an Affordable Housing Trust Fund in early 2014 as a solution to some of Savannah’s housing issues — it is the only housing trust fund in the State of Georgia. In addition, the city has expanded its capacity to ensure residents have access to the resources they need to maximize their paychecks. The Center for Working Families, a network of five community center sites offering VITA services, adult education classes and access to multiple local, state and federal benefits, is funded by the City of Savannah. THE NATIONAL LEAGUE OF CITIES | City Financial Inclusion Efforts: A National Overview 24 . KEY FINDINGS 4 Beyond these four “pillars,” a much wider array of financial inclusion programs are also operating in a quarter of the survey respondents’ cities, including programs that promote savings, expand access to the financial mainstream and reduce debt. Through investment and operation of the four “pillar” financial inclusion programs, city leaders and stakeholders often learn more about residents’ struggles with debt and lack of savings. Building upon these pillar programs, municipalities are offering a diverse array of programs and services to meet residents’ diverse financial needs, including programs to promote savings, expand access to bank accounts, prevent foreclosure, reduce debt, improve credit scores/access to credit, build youth financial capability and encourage those interested in pursuing postsecondary education to complete the Free Application for Federal Student Aid (FAFSA). FIGURE 5. FINANCIAL INCLUSION PROGRAMS IN OPERATION AND PLANNING Planning/Discussion Operation VITA/EITC outreach Operation Benefits Access Financial Ed Planning/Discussion Homeownership Bank Acct Savings Foreclosure Prevention Improving Credit Debt Reduction Youth Programs FAFSA Small dollar loans Note: 118 cities, one respondent per city. Children’s Savings Acct. 0 20 40 60 80 100% percent of cities THE NATIONAL LEAGUE OF CITIES | City Financial Inclusion Efforts: A National Overview 25 . KEY FINDINGS Cities are taking action to help families protect assets by providing access to safe and affordable products, coupled with appropriate financial counseling. Approximately 40 percent of survey respondents are conducting programs that promoting savings. About the same number are also helping residents access non-predatory accounts at financial institutions. Over half of Americans (56 percent) lack emergency savings to weather a financial crisis.4 This statistic, among others, confirms what many city officials see first-hand in their communities individual financial crises compound and sometimes lead to devastating consequences for area business, deterioration of once thriving neighborhoods and decreased city tax and sales revenues. Perhaps because of this, the survey found that initiatives to promote savings and reduce debt are popular among cities. 56% Over half of Americans (56 percent) lack emergency savings to weather a financial crisis. In the Jackson Heights section of Queens, a local New York City partner operates a culturally appropriate savings program targeted at immigrant women that includes an emphasis on peer-to-peer sharing about effective savings strategies. One specific strategy many cities use to promote savings is Individual Development Accounts (IDAs). An IDA is an asset-building tool designed to enable low-income families to save towards a targeted amount of money that is usually used for building assets in the form of homeownership, education or small business ownership.
IDA participant savings are usually matched one to four times the amount of the individual’s initial deposit. While federal funds are available to support IDA programs, many cities and their partners have created innovative IDA initiatives not subject to federal guidelines. For example, Columbia, South Carolina operates the largest IDA program in the state, with a city-funded 3:1 match. Chicago’s IDA program is specially designed to help improve participants’ credit scores in addition to savings toward a designated goal. Helping residents gain access to mainstream financial services such as checking and savings accounts helps ensure individuals and their families have a vehicle by which to save and reduce debt. THE NATIONAL LEAGUE OF CITIES | City Financial Inclusion Efforts: A National Overview 26 .
KEY FINDINGS According to a Federal Deposit Insurance Corporation 2014 Survey of Unbanked and Underbanked households, 7.7 percent of U.S. households are unbanked, meaning they do not have any bank account, and 20 percent of households are underbanked, meaning they may have an account but still rely on costly alternative financial services. Research estimates that in 2012, the alternative financial services market generated $89 billion in fees and interest.5 7.7 percent of U.S. households are unbanked: They do not have any bank account. 20 percent of households are underbanked: They may have an account but still rely on costly alternative financial services. One strategy adopted by city leaders across the country is the Bank On model initiated by City of San Francisco Treasurer José Cisneros and former Mayor Gavin Newsom to help ensure individuals have access to free or low-cost bank accounts. Bank On programs are locally-led coalitions of government agencies, financial institutions and community organizations aiming to connect un- and underbanked individuals to safe and affordable financial services and products and financial education.
To date, approximately 100 cities have Bank On campaigns.6 Dallas passed two ordinances restricting payday lenders. Passed in 2011, one ordinance places limitations on where new storefronts can open in the city, and the other restricts the amount that payday lenders can lend and requires principal reduction if a loan is renewed. Twenty cities have followed suit by adopting the latter regulatory ordinance, which is referred to as a “unified payday ordinance.” The collective city ordinance covers 6.5 million Texans and 39 percent of the entire payday storefronts in the state. Photo credit: Getty Images, Oli Scarff THE NATIONAL LEAGUE OF CITIES | City Financial Inclusion Efforts: A National Overview 27 .
KEY FINDINGS Other popular financial inclusion programs include efforts to improve or build credit and prevent foreclosures. The Brookings Institution reported that approximately 25 percent of American consumers have subprime credit scores, defined as below 620, while another 25 percent do not have a credit score at all.7 The survey indicates that cities are dedicating resources — time and money — to providing residents access to credit building workshops. City leaders also have a vested interest in reducing foreclosure rates and helping prevent housing crises, as municipalities are negatively impacted from high foreclosures rates. Over 35 percent of survey respondents offer foreclosure prevention assistance. Youth-focused financial inclusion programs and programs to help with Free Application for Federal Student Aid (FAFSA) completion represent two areas of focus that are gaining traction at the city level as a way to help families be better prepared financially in the future. In both cases, 27 percent of survey respondents indicated these initiatives are in place in their cities.
For example, Tempe, Arizona actively helps high school seniors file for FAFSA so they can receive education funding and work toward a credential or degree. In Memphis, Tennessee, the Goal Card program targets public housing residents in the fifth through twelfth grades. Goal Card encourages positive money management skills and offers support to youth interested in setting savings goals. These programs, when coupled with debt reduction and credit building initiatives, represent a growing number of programs that are being retooled through innovative private/public partnership efforts to pilot more impactful financial programs. In addition to the array of financial inclusion programs noted above, cities continue to innovate by integrating financial empowerment services into existing cityled workforce development initiatives and other city services.
The cities of Evansville, Indiana; Little Rock, Arkansas; St. Louis, Missouri and Providence, Rhode Island were selected by the U.S. Photo credit: Getty Images, Spencer Platt Consumer Financial Protection Bureau (CFPB) in the summer of 2014 to pilot a Summer Youth Employment and Financial Capability program. The program targeted 1,426 youth ages 14 to 21 enrolled in local summer youth employment programs across these four cities with the goal of helping them improve their financial literacy early in their working years.8 THE NATIONAL LEAGUE OF CITIES | City Financial Inclusion Efforts: A National Overview 28 . KEY FINDINGS Financial Inclusion Programs Under Development The survey also asked cities what financial inclusion programs were in planning stages or under discussion. The findings indicated that cities with at least one financial inclusion program tend to have more than one program under development. A number of survey respondents indicated that emerging financial inclusion strategies, such as children’s savings accounts, are in the development stage or under discussion in their cities. Children’s savings account (CSA) programs most often include the following components: a savings account, parent/guardian engagement in helping with deposits, incentives to save, such as cash matches and financial education for children and their parents or guardians. CSA programs often help connect families who may otherwise be unbanked to bank accounts and can help them avoid relying on alternative financial services.
Research and practice have shown that family ownership of even a few thousand dollars in assets can give children not only a measure of economic security, but also a transformative sense of possibility and hope for the future.9 It was these aspirations that led the City of San Francisco’s Office of Financial Empowerment to begin the Kindergarten to College program in 2010. Kindergarten to College (K2C) is the first publicly funded, universal children’s college savings account program in the U.S. In 2012, every incoming San Francisco public kindergarten student (a total of over 4,500 students) received a college savings account with a $50 deposit, and the opportunity to receive bonus incentives.
To date, more than 18,000 accounts have been opened. San Francisco Treasurer José Cisneros is the champion behind many of the city’s financial inclusion strategies. Along with Jonathan Mintz, former commissioner of the New York City Department of Consumer Affairs, Treasurer Cisneros chairs the Cities for Financial Empowerment (CFE) Coalition. Many innovative financial inclusion programs have emerged from the 14 cities that make up CFE, which first came together in 2008 after many of its founding members met and learned from one another through an NLCsponsored technical assistance project focused on asset-building.
Several of these cities’ efforts are highlighted in this report. Other programs that survey respondents reported were in the planning or development stages include debt reduction programs. For example, for municipalities that own and operate public utilities, forgiving or helping residents with a utility payment plan ensures families have working utilities and reduce their debt. THE NATIONAL LEAGUE OF CITIES | City Financial Inclusion Efforts: A National Overview 29 . KEY FINDINGS Cities in Action: Broader Array of Programs Houston, Texas Local nonprofits and social service agencies in Houston are collaborating with the city’s municipally owned water utility to enhance family financial stability through a program called Local Interventions for Financial Empowerment through Utility Payments (LIFT-UP). This is a two-year pilot Photo credit: Getty Images, LUNAMARINA initiative of the National League of Cities, in partnership with Houston and four other cities, to improve the financial stability of families while also reducing municipal costs associated with unpaid utility debts and debt collection. Through LIFT-UP, Houston is forging connections between their utility company and area financial empowerment agencies to identify eligible residents. The program is designed to financially empower indebted families and help individuals pay overdue bills, prevent future accumulation of debt and restructure outstanding debt owed to the city using behavioral economic approaches to facilitate debt repayment. Houston’s program is unique in that for the first time, City of Houston public utility representatives are being trained to offer direct financial coaching to customers with a pattern of delinquent payment behavior. These representatives function as the single point of contact for program participants — building trust and helping to identify the financial needs of residents. LIFT-UP participants can extend the timeframe for repaying any outstanding debt, and participants are linked to various area social services and financial education programs including Bank On Houston.
In addition, a range of citydefined incentives are offered to current customers to motivate participation in the pilot, including preventing accrual of late fees and offering long-term payment plans. THE NATIONAL LEAGUE OF CITIES | City Financial Inclusion Efforts: A National Overview 30 . KEY FINDINGS Cities in Action Seattle, Washington Seattle has a long history of commitment and action in developing financial inclusion programs. Seattle was the first city to replicate the Bank On San Francisco model, launching Bank On Seattle-King County in 2008. Photo credit: Getty Images, dibrova To address the city’s increasingly expensive living costs as a result of its growth and development, Seattle is embracing the idea of service integration. This concept of incorporating financial inclusion programming into existing city programs and services aligns with the city’s vision of creating long-term positive financial outcomes for its residents. The first pilot of program integration connects residents that are receiving assistance to financial empowerment services through the city’s Utility Discount Program (UDP). The UDP offers a way to mitigate rising utility costs by offering qualifying customers a 60 percent discount for electrical service and a 50 percent discount for water, wastewater and garbage removal. Mayor Ed Murray’s goal to double enrollment in the UDP resulted in efforts to make it more accessible to residents. These efforts include an option for customers who are struggling to pay their utility bill to opt to use financial coaching services through the Seattle Financial Empowerment Center, which results in a bill credit up to $100 for the Water, Sewer, Garbage combined utility bill, or up to $700 for qualifying applicants in grants toward outstanding balances on their electric bill. The goal is to help customers create a sustainable pathway to regular bill payments and management through financial coaching. THE NATIONAL LEAGUE OF CITIES | City Financial Inclusion Efforts: A National Overview 31 .
KEY FINDINGS 5 Twenty-nine percent of survey respondents reported having a dedicated “home” for financial inclusion programs (e.g., a lead city department or division), a structure that is strongly correlated with a broader range of programs in operation. Residents’ diverse financial challenges, coupled with city leaders’ efforts to provide a continuum of financial inclusion services and programs often lead to a strong need for cities to work collaboratively with nonprofits and other stakeholders to coordinate resources, realign policies and strive for increased efficiencies — all in an effort to maximize impact. To most effectively accomplish coordination, several municipalities have created “homes” for city-led and/or city-supported financial inclusion efforts. While there are several approaches, the most common “homes” reported by survey respondents included a dedicated city employee within an existing city division, a dedicated, new city division often referred to as an office of financial empowerment or financial inclusion or a quasi-governmental agency or collaboration. Of the survey respondents, 34 indicated that their city had a dedicated office or agency coordinating financial inclusion programs. In some instances, this is an entire city department focused on financial inclusion, and in other cities it may be a division within a city department. The survey revealed a high correlation between cities with five or more financial inclusion programs and cities where there is a dedicated staff person spearheading the city’s efforts. It is reasonable that cities with dedicated staff participating in financial inclusion work have a deeper understanding of the issues impacting residents and a greater chance that relationships with the nonprofit sector are stronger and less duplicative. The ability to have consistent representation at local stakeholder meetings helps ensure city officials are informed and better able to keep city programs and services relevant. Dedicated City Staff within an Existing Division Many cities often initiate engagement in financial inclusion work by designating at least one person who is either dedicated part- or full-time to the topic and serves as the city’s coordinating liaison with other financial inclusion stakeholders.
Most often this role is found within existing city departments such as departments of families, youth, and children; community resources; community development; or human services. THE NATIONAL LEAGUE OF CITIES | City Financial Inclusion Efforts: A National Overview 32 . KEY FINDINGS The City of San Antonio leads its financial inclusion work through the city’s Department of Human Services. The city partnered with the Family Service Association, the United Way of San Antonio and Bexar County to open two Financial Empowerment Centers (FECs) in the city. The FEC counselors are trained to help residents manage debt, deal with debt collectors, improve their credit, build savings, create a budget and find safe and affordable financial products. The FECs were developed through the support of the Cities For Financial Empowerment Fund’s Financial Empowerment Center Replication Initiative, a three-year project that provides funding and technical assistance to a group of cities to replicate the original New York City FEC model.
In addition, San Antonio’s Department of Human Services provides financial counseling directly to its clients seeking assistance with adult learning, housing counseling and job training, as well as parents of children attending the Head Start early childhood education program. Depending on the city’s management structure, the department in which a dedicated financial inclusion city staffer is housed can vary. In Los Angeles, the city’s financial empowerment efforts are an initiative concentrated inside two departments — the Economic and Workforce Development Department and the Housing and Community Investment Department. In the Village of Niles, Illinois; Garden City, Michigan; and Charlotte, North Carolina, the Department of Family Services, the Community Resource Department and the Neighborhood and Business Services Department, respectively, oversee their municipality’s financial inclusion programs. Regardless of the specific location within an organizational chart, cities reported three important considerations when dedicating a role (or part of a role) to financial inclusion work: 1) access to the mayor, city council and/or senior policy makers, 2) power to affect change across multiple departments to ensure action and impact and 3) formalizing financial inclusion work into a city job description to institutionalize the work and create sustainability. Offices of Financial Empowerment/Financial Inclusion To maximize the strength and reach of city government to advance financial inclusion, several cities have evolved from having a city employee(s) dedicated to financial inclusion.
They have opted instead to create a new city division or office dedicated to promoting and implementing these programs. To maximize the strength and reach of city government to advance financial inclusion, several cities have evolved from having a city employee(s) dedicated to financial inclusion. They have opted instead to create a new city division or office dedicated to promoting and implementing these programs. THE NATIONAL LEAGUE OF CITIES | City Financial Inclusion Efforts: A National Overview 33 . KEY FINDINGS Modeled after New York City’s office, the most common title for these divisions are offices of financial empowerment. While cities’ names for such a department might be similar, the depth and scope of offices for financial empowerment vary widely. The Scan revealed that cities with offices of financial empowerment are customizing this model to reflect their community’s individual needs and vision. Some city efforts include a strong focus on consumer protection; this is more common in bigger cities than medium and smaller sized cities.
For example, New York City’s Office of Financial Empowerment includes a strong focus on consumer protection, as the city has regulatory power for consumer protection. One commonality, however, among dedicated offices of financial empowerment is that they usually focus on financial empowerment for residents of all ages — children, young people, adults and seniors. In Columbia, South Carolina, Mayor Steve Benjamin and Councilmember Tameika Isaac Devine created the Office of Family Financial Stability, which is housed in the city’s Community Development Department. The city funds several financial inclusion programs including an individual development account program, homeownership assistance and workshops, credit counseling, a pilot Bank On Columbia initiative, and Access Columbia – which is a fair housing seminar that offers financial education to residents ages five and up. Quasi-Governmental Agencies/ Collaborations The survey responses identified that some cities have created quasi-governmental agencies and/or formed a strategic, collaborative partnership with community nonprofits to promote financial empowerment.
In 2005, Savannah, Georgia created a nonprofit collaborative, Step Up Savannah, to lead their financial inclusion work. Step Up Savannah is similar to some municipal offices of financial empowerment, but is unique as it is a quasi-city government entity located within the city’s Bureau for Planning and Development with a position on the mayor’s leadership team. As a collaborative, Step Up convenes and provides resources to over 90 partners across the city and serves as the primary cornerstone for the city’s financial empowerment efforts. It should be noted that although these “homes” are widely seen as effective strategies in aligning financial inclusion resources, informing policy decisions and heightening collaboration with community partners, the majority of survey respondents have not created a specific city department or office to address the financial needs of underserved residents.
In the majority of respondent cities without dedicated departments or staff specifically dedicated to advancing financial inclusion, the survey found municipal leaders often participate, and in some cases lead, coalitions to bring financial empowerment partners together. THE NATIONAL LEAGUE OF CITIES | City Financial Inclusion Efforts: A National Overview 34 . KEY FINDINGS Table 2. Examples of Financial Inclusion “Homes” in City Government CITY NAME OF OFFICE LOCATION BOSTON, MA Office of Financial Empowerment Mayor’s Office CHICAGO, IL Office of Financial Inclusion COLUMBIA, SC LANSING, MI LOUISVILLE, KY MIAMI, FL NEW YORK CITY, NY City Treasurer’s Office Office of Family Financial Stability Community Development Department Office of Financial Empowerment Mayor’s Office Advocacy and Empowerment Division Department of Community Services Office of Economic Initiatives/Access Miami Jobs Mayor’s Office Office of Financial Empowerment Department of Consumer Affairs, Mayor’s Office SAN ANTONIO, TX Family Assistance Division SAN FRANCISCO, CA Office of Financial Empowerment ST. PETERSBURG, FL Office of Urban Affairs Department of Human Services City Treasurer’s Office Mayor’s office City Funding for Financial Inclusion Programs The survey found that cities with comprehensive financial inclusion programs are investing directly in their programs, and have diversified funding streams. Cities are specifically funding programs and services related to VITA, benefit access, homeownership assistance and foreclosure prevention, financial education, savings, access to bank accounts, debt and credit counseling, youth financial empowerment, small dollar/emergency loans and children’s savings accounts (Figure 6).
Survey respondents reported that city funding for financial inclusion was mainly concentrated toward staff time for financial education, counseling, and/or coaching, and for homeownership assistance or programs related to anti-homelessness work. Additional Funding Sources for Financial Inclusion Programs Where robust financial inclusion programs are occurring, it is not surprising that the programs and services require multiple sources of funding to fully create a continuum of services. In several instances, city investments are supplemented by federal funds, such as grants from the U.S. THE NATIONAL LEAGUE OF CITIES | City Financial Inclusion Efforts: A National Overview 35 . KEY FINDINGS Department of Housing and Urban Development that fund programs to reduce homelessness. Furthermore, cities often receive federal pass-through dollars from states to support programs focused on foreclosure prevention and low-income housing. In some cases, municipal governments have been successful in securing direct federal funding to promote access to public benefits and savings initiatives such as Individual Development Accounts. In addition to public funding, survey respondents reported diverse investments from local and national foundations and nonprofits such as Local Initiatives Support Coalition (LISC) and United Way agencies. These entities are funding community-based nonprofits to provide direct financial inclusion services. The investments complement city resources and increase the need for continued coordination of resources at the local level.
Financial institutions are also investing in financial inclusion programs and services. In some cases, financial institutions are leveraging Community Reinvestment Act (CRA) credits to support programs. Enacted in 1977, the CRA is intended to encourage depository institutions to help meet the credit needs of the communities in which they operate, including low- and moderate-income neighborhoods.
The survey found that city leaders are working to bring attention to their investments in financial inclusion work and inviting financial institutions to partner with them to collectively boost impact. Elected officials report that FINANCIAL INCLUSION PROGRAMS FIGURE 6. financial institutions and THAT RECEIVE CITY FUNDING foundations are more VITA/EITC outreach responsive to grant requests Benefits Access that demonstrate broad Financial Ed stakeholder alignment with Homeownership City Funds invested city leadership and/or Programs in Bank Acct funding. In smaller, more rural Operation Savings City Funds Operation markets, municipal leaders Foreclosure Prevention reported that local community Improving Credit banks and credit unions are Debt Reduction often supportive of financial Youth Programs Note: 118 cities, one empowerment efforts. Direct FAFSA respondent per city city funding in financial Small dollar loans inclusion programs and services Children’s Savings Acct percent of cities 0 20 40 60 80 100% is important and signals deep commitment to the topic. Funding from multiple stakeholders enhances the work and broadens the possibility of what a community can achieve. THE NATIONAL LEAGUE OF CITIES | City Financial Inclusion Efforts: A National Overview 36 .
KEY FINDINGS Cities in Action: Dedicated “Home” for Programs New York City, New York New York City’s Office of Financial Empowerment (OFE) was launched by former Mayor Michael R. Bloomberg and the Center for Economic Opportunity at the end of 2006 as the first local government initiative in the country with the specific mission to educate, empower and protect individuals and families with low incomes. Photo credit: Getty Images, mjbs With strong city leadership, OFE creates innovative programs, products and services for New Yorkers to help them build assets and make the most of their financial resources. OFE’s goal is to increase access to high-quality, low-cost financial education and counseling; connect individuals to safe and affordable mainstream banking products and services; improve access to income-boosting tax credits, savings and other asset-building opportunities and enforce and improve consumer financial protections to safeguard financial stability. OFE’s key initiatives include: • Launching and coordinating large-scale public awareness campaigns. OFE spearheads public awareness campaigns to help New Yorkers get, save, manage and protect their money — including the EITC Coalition Campaign. • Increasing the availability of free, one-on-one financial counseling residents through the Financial Empowerment Center initiative. Financial empowerment services are available to the public by calling 311. THE NATIONAL LEAGUE OF CITIES | City Financial Inclusion Efforts: A National Overview 37 . KEY FINDINGS Cities in Action • Establishing a dynamic network of financial education providers. OFE established the Financial Education Network (FEN), a network of government, nonprofit and financial sector partners working to provide high-quality financial education and technical assistance. A cornerstone of the FEN is an easy-to-search online directory available on the OFE Web site that enables consumers to find conveniently located financial education services. • Identifying and implementing innovative asset-building practices. OFE works to identify, strengthen and implement innovative practices from across the nation to help New Yorkers build assets and achieve lifelong financial well-being. OFE partners with the city’s many financial institutions to pilot safe and affordable products and services such as NYC SafeStart (low-cost, savings accounts), NYC Direct Deposit (free employer-based checking accounts) and SaveUSA (tax-time matched savings accounts). • Protecting residents with low incomes from unfair and predatory practices. Located within the Department of Consumer Affairs (DCA), OFE helps target strategic enforcement work to protect New Yorkers with low incomes through innovative initiatives in debt collection, used car sales and tax preparation.
OFE coordinates its enforcement and advocacy efforts with DCA’s public awareness and education campaigns. Photo credit: Getty Images, David Crespo Nieto THE NATIONAL LEAGUE OF CITIES | City Financial Inclusion Efforts: A National Overview 38 . KEY FINDINGS 6 Partnerships between municipal governments and external stakeholders represent one critical step that cities are taking to advance local financial inclusion efforts. More than a quarter of the survey respondents work closely with a community partner. Financial inclusion efforts are enriched when municipal leaders join forces with partners to achieve goals. Partnerships increase collaboration and invite participation from a diverse set of stakeholders. As demonstrated in Figure 7, cities are partnering with intermediary organizations, nonprofits, state and regional coalitions and financial institutions to advance a financial inclusion. In some communities, a formal memorandum of understanding (MOU) helps guide the work.
And, in some cities, nonprofits are leading financial inclusion efforts without assistance from municipal government. FIGURE 7. CITY PARTNERSHIPS TO ADVANCE FINANCIAL INCLUSION EFFORTS Nonprofit Lead (no city support) Financial Institution Partner City Office/Agency Intermediary Organization Nonprofit Lead (city support) State/Regional Partnership 36% 33% 29% 27% 26% 23% MOU in Place 16% 0 25 50 Percent of Cities (%) 75 100% Note: 118 cities, one respondent per city. MOU = Memorandum of Understanding. The survey also found that 23 percent of survey respondents are connected to broader regional or statewide efforts. In the majority of the cities with regional or statewide efforts, there are multiple, well-established programs designed to help improve access to non-predatory financial products and services, align program services and create a more robust referral system. THE NATIONAL LEAGUE OF CITIES | City Financial Inclusion Efforts: A National Overview 39 .
KEY FINDINGS In New York City, residents can call the city’s 311 line and request an appointment with a trained, professional financial counselor at a number of Financial Empowerment Centers throughout the city. The Financial Empowerment Center initiative was developed in 2011 and is characterized by comprehensive, standardized financial counselor trainings, meaningful client outcomes measured through a rigorous data tracking system and a number of integrated partnerships with nonprofits and city agencies. Asset-building coalitions, anti-poverty coalitions and free tax preparation (VITA) coalitions make up the majority of financial inclusion networks. These collaboratives often bring together a diverse set of partners including government, nonprofit and corporate entities that complement or augment city investments in financial inclusion programs and services. While these partnerships have great potential for success, based on survey responses it is clear they require a combination of factors to be effective. These include: g A shared vision g Agreement upon how results will be measured g Established outcomes and performance measures for people served g Commitment to data sharing g Regular review of partner outcomes and activities g Dedication to actively participate and continually review and adjust strategies as needed As is common in most partnerships, it takes ongoing dedication and relationship building among partners to succeed.
Challenges are commonplace and expected. The survey reflected that the aforementioned coalitions tend to experience challenges with city participation when: g Proper buy-in is not present from city departments, g Top city leadership is not effectively integrating the work within city department work flow, and g City resources are not allocated to support the work. THE NATIONAL LEAGUE OF CITIES | City Financial Inclusion Efforts: A National Overview 40 . KEY FINDINGS Another common partner for municipal governments is financial institutions. Onethird of survey respondents reported working directly with financial institutions to lead financial inclusion efforts (Figure 7). Many cities specifically suggested that Bank On initiatives have helped municipalities and other stakeholders build partnerships with financial institutions, and underscored the importance of broader collaborations to enhance program effectiveness and reach target populations. The survey results indicate that city partners also help promote awareness about financial inclusion programs and services throughout the community. Even if a formalized coalition is not present, many cities support community-based organizations’ efforts to deliver services to low- and moderate-income residents. Examples of ways cities are promoting financial inclusion services through partnerships include: g Co-branded literature outlining the services that are available, hours of operation and locations, g Public service announcements on local cable access channels, g Incorporating messages in water/utility bill invoices, g Posting partner literature in common city government areas frequented by residents, g Presentations to community groups and public places such as libraries, and g Promoting special events such as Financial Literacy Month. THE NATIONAL LEAGUE OF CITIES | City Financial Inclusion Efforts: A National Overview 41 .
KEY FINDINGS Cities in Action: Partnerships Denver, Colorado In 2008, Denver Mayor John Hickenlooper formed the Denver Economic Prosperity Task Force to coordinate the city’s response to residents’ economic self-sufficiency challenges. Made up of 35 members representing local government, policy makers and community and business leaders, one of the group’s recommendations laid the groundwork for Photo credit: Getty Images, senaiaksoy the development of the Bank On Denver initiative. Key partnerships the city developed with financial institutions, community organizations, and educational institutions allowed over 100 stakeholders to help shape the Bank On Denver program for the city and its residents. Financial institution partners contributed funding and financial services expertise, and community organizations helped the city understand the needs of the underbanked and provided valuable outreach to residents. Current Mayor Michael B.
Hancock’s administration continues to support this agenda as the Denver Financial Empowerment Center galvanizes a new approach to combining financial coaching with banking underserved residents. Los Angeles, California Hire LA’s Youth is a summer jobs program that provides job readiness training, on the job experience and a paycheck to youth in what is often their first job. Through this program, Los Angeles Mayor Eric Garcetti set and achieved the goal of helping 10,000 youth gain summer employment and sharpen their Photo credit: Getty Images, Chris Rogers financial capability skills. Working with public and private sector partners, the program doubled the number of jobs available to youth ages 14-24. Partnering with the Los Angeles Area Chamber of Commerce, the program provides job application, resume writing and interview skills training, as well as financial literacy training to help create healthy financial habits for these first-time wage earners.
The youth worked for an average of 100-120 hours over six weeks and earned $9 per hour. THE NATIONAL LEAGUE OF CITIES | City Financial Inclusion Efforts: A National Overview 42 . KEY FINDINGS 7 Twenty percent of survey respondents indicated a high reliance on data to guide and evaluate their financial inclusion efforts. These cities also have a more robust set of programs (six or more) in place. The right data can support efforts to develop, maintain or expand municipal financial inclusion programming or policies. Data enables city leaders to understand the financial needs of their residents, educate stakeholders and prioritize and allocate limited resources. Several survey respondents provided details regarding how they collect and use data to drive decisionmaking for financial inclusion programs and services. Survey respondents noted that quality metrics are important to properly track outcomes of city financial inclusion investments.
However, acquiring useful data in a timely and costefficient manner can be difficult. Among municipal survey respondents, over 20 percent indicated a high reliance on data to inform decisions about financial inclusion efforts (Figure 8). Approximately one-third of respondents reported no or low data reliance.
It is important to note that another one-third of survey respondents were unsure if their city relied on data to guide financial inclusion programming. FIGURE 8. CITIES RELIANCE ON DATA TO GUIDE FINANCIAL INCLUSION EFFORTS Percent of cities with data reliance, by type data reliance: data reliance: data reliance: 11% 16% 21% LOW Percent of 100 cities with 75 ï¬nancial inclusion 50 programs 25 0 0-5 of cities 6+ MEDIUM 0-5 6+ Number of ï¬nancial inclusion programs per city HIGH 0-5 6+ Percent of cities with data reliance, by type data reliance: NONE data reliance: UNKNOWN 21% 31% Note: n=71 cities, sample restricted to municipal government survey respondents. THE NATIONAL LEAGUE OF CITIES | City Financial Inclusion Efforts: A National Overview 43 . KEY FINDINGS Data-Driven Decision Making Of the cities with a high reliance on data, the survey found a correlation to those cities that also have a high number of financial inclusion programs (Figure 8). This may be due to a heightened awareness of community needs and, thus, more programs to meet those needs. The larger number of programs could be a direct reflection that cities relying heavily on data are better able to pinpoint resources and use funds efficiently, which allows remaining resources for additional programs/services. The survey found that cities both large and small have developed effective strategies for data collection and utilization. Gathering Data to Make the Case for Financial Inclusion Several cities reported using existing data sources to describe the issues or provide quantitative information about the magnitude of a problem or challenge in a city.
Such data is also used to track the progress of programs or policy changes. In the cities of Columbia, South Carolina and Hattiesburg, Mississippi, city officials rely on data from the Internal Revenue Service and U.S. Census Bureau to help guide their financial inclusion programming. Table 3 lists examples of existing data sources that help describe the financial circumstances of city residents.
Approximately one-third of survey respondents report using data related to the federal EITC and unbanked and underbanked populations. Data sources about household credit, business enterprise and home mortgages were used less frequently among survey respondents. In some cases, these sources offer regional and/or city level data. Some information is also broken down to show data at the census track level. THE NATIONAL LEAGUE OF CITIES | City Financial Inclusion Efforts: A National Overview 44 .
KEY FINDINGS Table 3. Data to Inform Financial Inclusion Efforts Cities Collecting Data On Data Topic This Topic Data Source Examples City Level Data Available Corporation for Enterprise Development, Bank On http://webtools.joinbankon.org/community/search Yes Foreclosure data 29% Realty Trac, Public Court Records http://www.realtytrac.com/statsandtrends/ Yes Home mortgage 14% Home Mortgage Disclosure Act (HMDA) http://www.consumerfinance.gov/hmda/ Yes Earned Income Tax Credit (EITC) take-up 35% IRS, Brookings Institution http://www.brookings.edu/research/interactives/eitc Yes Household credit 8% New York Federal Reserve Household Debt and Credit Report http://www.newyorkfed.org/microeconomics/data.html No (State) Business enterprises US Census http://censtats.census.gov/cgi-bin/cbpnaic/cbpsect.pl Yes Unbanked/ underbanked populations 27% 20% Note: n=118 cities, one respondent per city. City-level data in the Data Source Examples may need to be obtained by aggregating census tracks. Cities are using needs assessments and asset mapping tools as other methods of identifying the financial circumstances of residents. Almost one-third of the city respondents have conducted some type of formal needs assessment to identify needs of targeted constituencies or to identify gaps in service. About 30 percent of cities report mapping community indicators such as crime, poverty and health outcomes.
Approximately 34 percent of cities report using asset mapping to identify program and service locations. Information gathered through these strategies helps identify geographic areas of greatest need within a city and can help city officials target resources and enhance programs. THE NATIONAL LEAGUE OF CITIES | City Financial Inclusion Efforts: A National Overview 45 . KEY FINDINGS Measuring Results To truly understand if financial inclusion programs and services are making a difference in the lives of residents, cities and their partners must be able to measure results. Survey respondents with financial inclusion programs in operation reported one or a combination of the following measurement strategies: participation, achievement, and internal or external evaluation (Figure 9). Almost all of these respondents noted they collect program participation measures, such as the number of clients served. Just fewer than 80 percent also collect program achievement measures, such as the number of bank accounts opened. Internal program evaluations were most common, while almost 40 percent reported having used an external, third party evaluator to measure program results.
External evaluators are likely less used due to associated costs. FIGURE 9. To truly understand if financial inclusion programs and services are making a difference in the lives of residents, cities and their partners must be able to measure results. Results are commonly measured through participation, achievement, and internal or external evaluation. FINANCIAL INCLUSION PROGRAMMING EVALUATION TOOLS Program Participation 89% Program Achievement 78% Internal Evaluation 74% External Evaluation 37% 0 25 50 75 100% Percent of Cities Note: n=27 cities. Only respondents indicating the city government was currently operating financial inclusion programming answered this question. THE NATIONAL LEAGUE OF CITIES | City Financial Inclusion Efforts: A National Overview 46 . KEY FINDINGS The survey found that financial inclusion programs frequently collect information on the characteristics of program participants. This data provides baseline information about participant circumstances and is typically used by program administrators and partners to guide program evolution and enhancements. Some cities rely on software management systems to help collect and analyze data as well as evaluate program results and impact. Several survey respondents, including the cities of Nashville, Los Angeles, New York and Denver, use Efforts to Outcomes® (ETO) to collect real-time client information and share data across multiple city agencies and with community partners. ETO is performance management software for human services agencies. Survey respondents reported using participant data to examine if target populations’ needs are being met and identify gaps in services.
Figure 10 details the most common participant data gathered by survey respondents and details the percentage of survey respondents collecting the specific data category. Figure 10. PROGRAM DATA COLLECTION – CLIENT CHARACTERISTICS Client Characteristics Cities collecting this data Income 74% Race/ethnicity 63% Gender 63% Household structure 60% Education attainment 52% Employment status 63% Public assistance receipt 52% Service need 56% Service goal 57% Note: n=27 cities. Only respondents indicating the city government was currently operating financial inclusion programming answered this question. THE NATIONAL LEAGUE OF CITIES | City Financial Inclusion Efforts: A National Overview 47 . KEY FINDINGS Program outcome measures are crucial to tracking client outcomes and establishing program impact. Three types of outcomes measures most commonly used by survey respondents are program service, self-reported outcomes and administrative outcomes. Program service measures are counts of service provision such as the number of clients or number of service hours performed. Self-reported client outcomes can help track client progress and provide insights into a program’s impact. Examples of self-reported outcomes include: client attitudes, stress level, or reports of food or housing insecurity. Self-reported data is largely based on the perceptions and intentions of the client, and as such, is limited by a client’s knowledge, understanding of what is being asked of them and truthfulness. In Virginia Beach, Virginia, Bank On Virginia Beach relies on participant surveys to self-report financial practices, and also on a pre- and post- financial assessment where participants report income, savings, debt, and credit scores.
This information is tracked by participant ZIP code using ZIP code data from the IRS to help with targeted outreach to most vulnerable populations and, ultimately, guide program improvements. The information is also used to help identify likely partners such as faith-based organizations and community centers in vulnerable neighborhoods. Depending on the program’s purpose, administrative records can be an important source of objective data about client outcomes. Respondents report using a range of administrative data including income tax returns, bank account use and balances, utility or loan payments, and court records to inform program results and impact.
Gaining access to such records often requires a data sharing agreement or memorandum of understanding between entities. THE NATIONAL LEAGUE OF CITIES | City Financial Inclusion Efforts: A National Overview 48 . KEY FINDINGS Figure 11. PROGRAM DATA COLLECTION – OUTCOME MEASURES Program Outcomes Cities collecting this data Clients served 81% Service hours 41% Self-Reported Outcomes Other well-being 52% Confidence/attitudes 33% Energy security 30% Emergency saving 26% Food security 26% Housing security 26% Stress level 26% Administrative Outcomes Income tax returns 67% Checking account balance/use 52% Credit reports 52% Saving account balance/use 52% Utility payment/default 41% Public assistance receipt 37% Loan payment/default Child welfare records Court records 30% 15% 7% Note: n=27 cities. Only respondents indicating the city government was currently operating financial inclusion programming answered this question. THE NATIONAL LEAGUE OF CITIES | City Financial Inclusion Efforts: A National Overview 49 . KEY FINDINGS Sharing Data among Partners Survey responses revealed that 19 of the responding cities had a formal MOU related to data and resource sharing with their partner agencies. Several cities have agreements with financial institutions to provide data from Bank On accounts. Survey respondents noted frequent challenges in data collection efforts when the municipality was dependent on financial institutions for information, such as data for the number of accounts opened or average balances. Some financial institutions are unable to work within the context of their internal structures to meet partner data needs.
Despite these challenges, financial institutions remain a strong ally to municipalities working to advance financial inclusion work. Using Data to Advance Financial Inclusion Goals Data collection can be driven by existing program models, municipal interests or funder mandates. Bank On and the Cities for Financial Empowerment Fund, among others, were cited as program models that shaped data collection efforts among cities responding to the survey. Despite the use of data among respondents, only one in three cities responding to the survey has established at least one measurable citywide goal related to financial inclusion, indicating another key area for future improvement. It is encouraging that cities of all sizes have implemented models of data collection related to financial inclusion programs and services.
Further, survey respondents overwhelmingly reported that having the ability to use data to offer city officials, funders and community organizations information about the return on investment is a powerful tool to solicit additional buy-in and funding. City financial inclusion goals varied among survey respondents (Figure 12). The most common financial inclusion goals centered on the number of VITA returns completed and the number of bank accounts opened. Providing financial education, coaching and counseling also ranked high among survey respondents reporting citywide financial inclusion goals.
Setting and measuring goals can also prove to be particularly effective in getting continued support for important programs and services from external stakeholders. Virginia Beach has a citywide goal to “connect 500 low-income families to mainstream financial institutions and help these families avoid foreclosure, avoid predatory lenders and stretch budgets in tough economic times, insuring they are financially fit for the future.” Access to valuable and reliable data allows city government and its partners to regularly monitor success and reallocate resources based on needs and program outcomes. THE NATIONAL LEAGUE OF CITIES | City Financial Inclusion Efforts: A National Overview 50 . KEY FINDINGS FIGURE 12. CITY FINANCIAL INCLUSION GOALS Percent of Cities (%) VITA Returns Completed 27% Bank Accounts Opened 26% 24% Financial Education Provided Financial Coaching Provided 23% Financial Counseling Provided 22% 19% Bank Accounts Maintained Credit Scores Improved 14% 0 25 50 75 100% Note: n=118 cities, one respondent per city. Respondents could identify multiple goals. THE NATIONAL LEAGUE OF CITIES | City Financial Inclusion Efforts: A National Overview 51 . KEY FINDINGS Cities in Action: Data Collection and Evaluation New York City, New York New York City’s Office of Financial Empowerment (OFE) began data collection efforts upon the realization that long-term success and program sustainability requires accurate evidence of program outcomes. As a result city leaders identified metrics that moved Photo credit: Getty Images, mjbs beyond simply counting (e.g., clients served or website hits) towards measures of program impacts (e.g., changes in credit scores, debt owed and saving account balances). As the OFE program model has evolved over time, city officials and program operators monitor data collection, and adjust metrics accordingly so the program can develop in response to increased understanding of clients’ characteristics. For example, the NYC OFE’s programs moved from measuring savings account success with a specific benchmark ($250) to a new measure set at two percent of a program participant’s annual income. The new savings metrics allowed the savings goal to be responsive to a client’s financial situation while also providing a consistent benchmark across program participants. NYC OFE shares its model and helps other cities replicate its programs through the Cities for Financial Empowerment Fund.
New York City’s lessons learned relating to data collection efforts include: • Cities looking to begin or expand data collection efforts should aim to integrate data collection from the beginning of program development and implementation, with a a focus on metrics that can be tracked over time. • To the extent possible, use database systems with the ability to quickly analyze program data to allow for the sharing of real-time data reports with city leadership. • Be strategic about what data points to collect, and focus only on those that will be most useful as evidence of program impacts. Monitor the data collection process and communicate with program staff responsible for the data collection to ensure the process is not too demanding of staff time. • Leadership transitions can provide an opportunity to heighten financial inclusion on a city’s agenda and to deepen data collection/measurement efforts. THE NATIONAL LEAGUE OF CITIES | City Financial Inclusion Efforts: A National Overview 52 . CONCLUSION The findings in this report document municipal leaders’ interest in and willingness to take action to develop and implement a financial inclusion agenda. While the idea of addressing economic insecurity is not new to city leaders, a growing number of cities are pursuing innovative strategies designed to help families manage their finances and improve their financial stability. With recent attention at the national level focused on the financial needs of underserved consumers, this is a time of great opportunity for city leaders. National debates about financial inclusion challenges have underscored the need for creating a more equitable playing field in the financial services marketplace. Leaders at all levels of government are beginning to make strides in addressing these challenges, but nowhere is the impact felt more than at the local level, where elected officials, city staff and their community partners see families struggle every day to make ends meet. The City Scan of Local Financial Inclusion Efforts identified new ways that cities are becoming involved or taking the lead in financial inclusion efforts, but also highlighted missed opportunities.
Even as financial inclusion programs continue to gain traction, too often they are implemented in silos or not effectively supported by city leaders and agencies. As municipal leaders and their community partners set out to enhance and/ or build financial empowerment programs and services for residents, this report offers insights and examples meant to inspire elected officials to take action and bridge the gap between missed opportunities and goals fulfilled. Several lessons emerging from the Scan build on this report’s key findings and can help guide city leaders in their efforts: Partnerships are paramount. Partnerships between city government and other community entities are crucial to the success of financial inclusion efforts. Partnerships will only be strengthened by continued municipal engagement, and city leadership can be very effective in helping promote the steady growth and sustainability of local community organizations. THE NATIONAL LEAGUE OF CITIES | City Financial Inclusion Efforts: A National Overview 53 .
CONCLUSION Municipal leaders can also play an important role in convening stakeholders and helping ensure that they have complementary strategies. For partnerships or coalitions to be successful, it is essential that all partners work together toward a shared goal. City officials – through funding levers, leadership and convening power – can encourage all stakeholders to commit to a shared vision and common metrics for success. Navigating leadership changes can be challenging. When term limits or election results lead to changes in city leadership, municipal agendas and priorities also change. Financial inclusion initiatives can falter in these periods of transition, particularly if a results-driven approach with strong accountability mechanisms has not generated a strong evidence base to support their continuation. Strategies to institutionalize financial inclusion programs so that they draw support from diverse stakeholders and become part of how municipal government does business also can help these programs withstand leadership shifts and any threat of future budget cuts. Use of data to document program success is crucial for sustainability. Making the case for continued support of financial inclusion efforts requires evidence of their impact.
For example, EITC data showing that millions of dollars are coming back into the local economy and that families are saving tax filing fees by relying upon free tax preparation services can have a big influence on policymakers’ decisions regarding investments in EITC/VITA campaigns. Community engagement and ongoing research keep the focus on residents’ needs. As financial inclusion programs in cities develop and expand, ongoing efforts to engage residents and gather information about their changing needs are essential. Every program should include mechanisms for eliciting client/customer feedback that can guide continuous improvement, and explore potential partnerships with universities or nonprofit organizations to shed light on the needs of families not reached by current program offerings. In a rapidly changing financial landscape, this combination of community engagement and targeted research represents a key safeguard to ensure that residents’ needs are being met. THE NATIONAL LEAGUE OF CITIES | City Financial Inclusion Efforts: A National Overview 54 .
CONCLUSION As this report illustrates, dozens of cities now have a range of programs in place to advance elements of a financial inclusion agenda. Few cities have what could be clearly identified as a well-organized and coherent system to drive and sustain progress over time. Sustained efforts to build local financial inclusion systems with strong municipal leadership are now essential to advance and strengthen the field. By adopting a system-building approach, cities will be better able to map current resources, identify service gaps or other unmet needs, set standards and provide the supports necessary to improve program quality and create the metrics and data systems to drive continuous improvement. This is the next frontier for mayors and other city officials who seek to achieve the goal of financial inclusion for all city residents. THE NATIONAL LEAGUE OF CITIES | City Financial Inclusion Efforts: A National Overview 55 .
APPENDIX A Methodology To explore the various ways elected officials and their community partners are promoting financial inclusion addressing economic insecurity and expanding access to financial opportunities, the National League of Cities (NLC) Institute for Youth, Education, and Families developed the City Scan of Local Financial Inclusion Efforts (Scan) in collaboration with United Way Worldwide and the Center for Financial Security at the University of Wisconsin-Madison. The Scan included three parts: an in-depth, online survey of 118 cities about their financial inclusion efforts, a series of follow-up telephone interviews with a subset of 23 survey respondents and a day-long, NLC-sponsored roundtable focused on municipal financial inclusion efforts that included city officials and community partners from 13 cities across the country. From March through May 2014, the Survey of Financial Inclusion Efforts (www.nlc.org/financial-inclusion-scan) was disseminated to city leaders and their partners through several NLC communication venues. It was shared with NLC’s membership through its Weekly newsletter, various peer network listservs, and disseminated at NLC’s annual Congressional Cities Conference in March 2014. The survey was also shared through national partner organizations such as United Way Worldwide. Over 400 responses to the survey were received, and a total of 144 of those surveys representing 118 different cities were completed. The results in this report are derived from the self-reported responses of the representatives from the 118 responding cities.10 Cities in 39 states and the District of Columbia are represented in the survey findings, with the majority of respondents from Southern and Midwest states.
Six states had five or more cities represented within the responses. These included Washington, California, Texas, Colorado, Illinois, and Florida (Figure 13). THE NATIONAL LEAGUE OF CITIES | City Financial Inclusion Efforts: A National Overview 56 . APPENDIX A METHODOLOGY FIGURE 13. CITY REPRESENTATION IN THE SURVEY OF FINANCIAL INCLUSION EFFORTS, BY STATE 5+ cities 2-4 cities 1 city 0 cities Note: 118 cities from 39 states and the District of Columbia are represented in the survey. Alaska (1 city) and Hawaii (1 city) are not shown. Respondents included staff from government agencies (71), United Way organizations (29), and other nonprofit organizations (18). Responses included 50 small cities (defined as cities having a population of less than 50,000), 29 medium-sized cities (defined as cities with a population between 50,000 to 150,000), and 39 large cities (defined as cities with a population of 150,000 or higher). Eleven states are not represented within the survey.11 Respondents completing the survey included staff from government agencies (71), nonprofit organizations (18), and United Way organizations (29). The survey highlighted 14 of the most common financial inclusion programs and used these programs for foundational questions to gauge city-level interest in a broad range of programs designed to help families build financial security.
This approach aims to provide a baseline of the types of financial inclusion programs currently in operation and/or in the planning and development phase across the country. Another major element of the survey focused on identification and examination of local metrics. A series of questions probed respondents to share how they have developed and deployed the use of metrics to measure success. THE NATIONAL LEAGUE OF CITIES | City Financial Inclusion Efforts: A National Overview 57 .
APPENDIX A METHODOLOGY Financial Inclusion Roundtable To provide a deeper examination into some of the municipal financial inclusion initiatives that were described in the survey, NLC hosted the Municipal Financial Inclusion Roundtable in May 2014. The gathering brought together municipal leaders and local United Way partners from 13 cities who had responded to the survey: Chicago, Illinois; Columbia, South Carolina; Dallas, Texas; Denver, Colorado; Hattiesburg, Mississippi; Houston, Texas; Lansing, Michigan; Los Angeles, California; Louisville, Kentucky; Nashville, Tennessee; New York City, New York; San Francisco, California; and Virginia Beach, Virginia. Some of these cities had been extensively involved in NLC’s work on financial inclusion and empowerment in the past. Convened in Washington, D.C., the event generated feedback and guidance on the key financial access challenges facing families. It also allowed NLC to gather more in-depth information about these cities’ financial inclusion initiatives and their goals for the future. The conversation allowed NLC to develop a more comprehensive understanding of municipal action in the financial inclusion field and a deeper appreciation for how leaders are measuring their success. Follow-Up Interviews As part of the data analysis process, NLC staff conducted follow-up telephone interviews with 23 city leaders who responded to the survey.12 The cities represented diversity in size, geography and financial inclusion programming.
The goal of the interviews was to gain a deeper understanding of best practices and challenges in financial inclusion programs and to eliminate or understand any data discrepancies that arose in the data for that city’s response. Interviews were conducted between July and November 2014. Information from the follow-up interviews and the city discussions at the Municipal Financial Inclusion Roundtable was synthesized and incorporated into the findings along with the survey data. City examples highlighted in the report were developed from the follow-up interviews and subsequent contact with city respondents for further information and verification. THE NATIONAL LEAGUE OF CITIES | City Financial Inclusion Efforts: A National Overview 58 .
ENDNOTES ENDNOTES For more information about steps city leaders can take to implement financial inclusion programs, see Taking the First Step: Six Ways to Start Building Financial Security and Opportunity at the Local Level. 1 Email communication with the Stakeholder Partnerships, Education and Communication Department at the Internal Revenue Service. January 15, 2015. 2 For detailed information about how city leaders can develop VITA programs and EITC outreach campaigns, see Maximizing the Earned Income Tax Credit in Your Community: A Toolkit for Municipal Leaders. 3 Bowdler, Janis L. and Lucy S. Gorham (2014).
“All In: Building the Path to Global Prosperity through Financial Capability and Inclusion.” UNC Center for Community Capital and JPMorgan Chase & CO. 4 5 Collins, Dr. Michael J (2014). “Financial Coaching: An Asset Building Strategy.” The National League of Cities has helped numerous cities to replicate the Bank On model.
For more information, see http://www.nlc.org/find-city-solutions/institute-for-youth-education-andfamilies/family-economic-success/financial-empowerment/bank-on-cities-campaign. 6 Horan, Janice (December 15, 2005). “FICO score and the Credit Underserved Market.” Presentation at Brookings Institution Roundtable on Using Alternative Data Sources in Credit Scoring: Challenges and Opportunities. Washington, D.C. 7 Consumer Financial Protection Bureau.
(November 2014). Summer Youth Employment and Financial Capability Pilot. 8 9 Children’s Savings Accounts. Retrieved December 4, 2014 from: http://cfed.org/programs/csa/. A total of 144 surveys representing 118 cities were submitted.
For cities with multiple respondents a decision rule was used to select a single respondent per city that gave preference to (1) fully completed survey responses, (2) municipal government respondents, if multiple respondents remained, and (3) a survey response was randomly selected. 10 The states not represented in the survey are Kansas, Louisiana, Missouri, Nebraska, New Hampshire, New Mexico, Oklahoma, Utah, Vermont and Wyoming. 11 Interviews were conducted with city leaders in the following cities: Boston, MA; Bryan, TX; Chicago, IL; Columbia, SC; Dallas, TX; Denver, CO; Garden City, MI; Hattiesburg, MS; Jackson Heights, NY; Lansing, MI; Louisville, KY; Martinsville, VA; Memphis, TN; New Haven, CT; Oakland, CA; Providence, RI; San Francisco, CA; Savannah, GA; Seattle, WA; St. Petersburg, FL; Tempe, AZ; Washington, DC; and Winston-Salem, NC. 12 THE NATIONAL LEAGUE OF CITIES | City Financial Inclusion Efforts: A National Overview 59 . 1301 Pennsylvania Avenue NW Suite 550, Washington, DC 20004 Metropolitan Life Insurance Company, 200 Park Ave., New York, NY 10166 .


