Artisan Partners - The Quest for Yield - The Case for Non-Investment Grade Credit - Insights
Artisan Partners


Description
The Quest for Yield
The Case for Non-Investment Grade Credit
ARTISAN PARTNERS
Insights
. The Quest for Yield
For the past several years, the investment landscape has been
In 2016, the Bank of Japan announced it was introducing negative interest
characterized by low interest rates and low yields. The quest for
rates on reserves. Not to be outdone, the ECB surprised markets with an
yield has investors contemplating the opportunities available in the
array of stimulus measures including lowering the deposit rate further
non-investment grade credit space. Here we explain why in our view
into negative territory from -0.30% to -0.40% and expanding its monthly
the asset class remains attractive on a relative basis and detail how we
bond purchases from €60 billion to €80 billion as well as broadening
believe our strategy positions us for success in today’s environment.
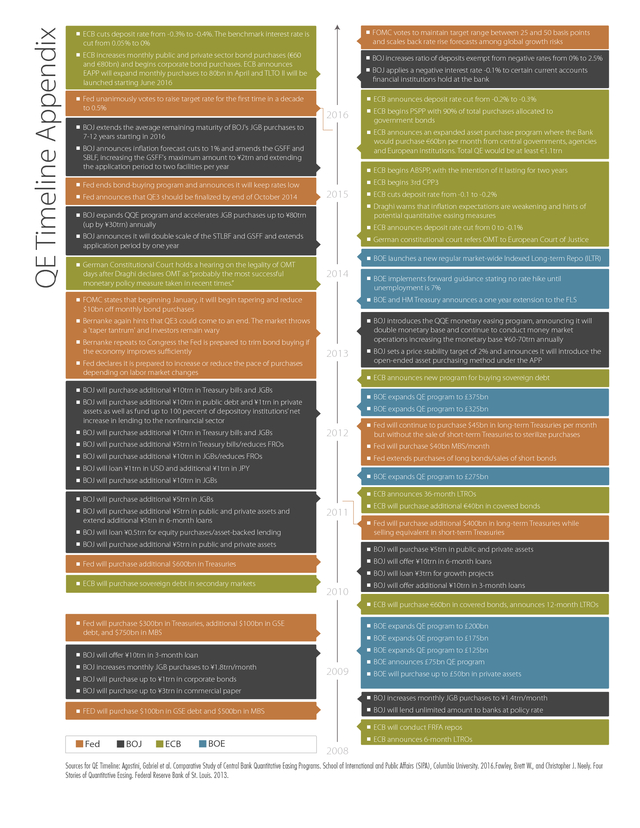
asset purchases to include corporate bonds (see the Appendix for a
As a reflection of our high degrees of freedom, we consider both the
timeline of central bank QE since 2008).
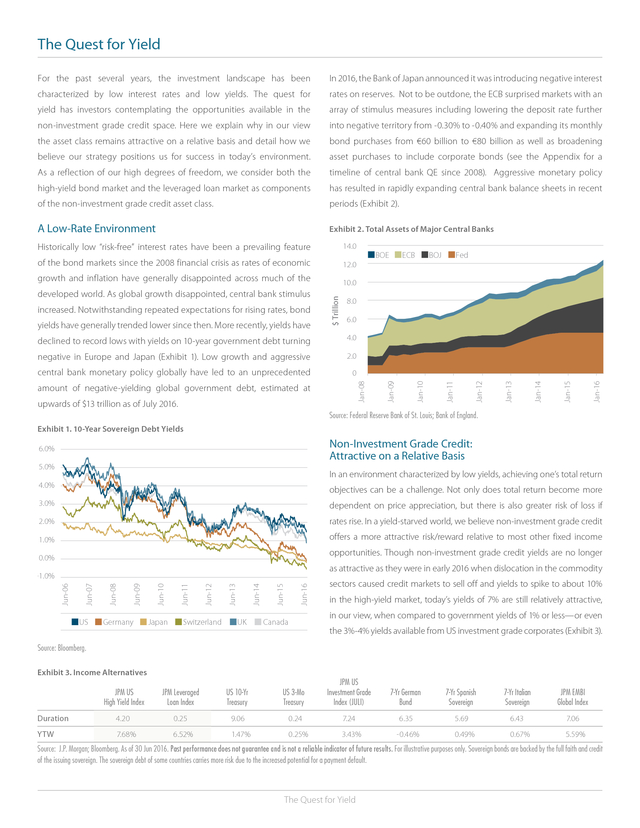
Aggressive monetary policy high-yield bond market and the leveraged loan market as components has resulted in rapidly expanding central bank balance sheets in recent of the non-investment grade credit asset class. periods (Exhibit 2). A Low-Rate Environment Exhibit 2. Total Assets of Major Central Banks 14.0 of the bond markets since the 2008 financial crisis as rates of economic 12.0 growth and inflation have generally disappointed across much of the 10.0 developed world. As global growth disappointed, central bank stimulus increased.
Notwithstanding repeated expectations for rising rates, bond yields have generally trended lower since then. More recently, yields have $ Trillion Historically low “risk-free” interest rates have been a prevailing feature BOE ECB BOJ Fed 8.0 6.0 Jan-16 Jan-15 upwards of $13 trillion as of July 2016. Jan-14 amount of negative-yielding global government debt, estimated at Jan-13 0 Jan-12 central bank monetary policy globally have led to an unprecedented Jan-11 2.0 Jan-10 negative in Europe and Japan (Exhibit 1). Low growth and aggressive Jan-09 4.0 Jan-08 declined to record lows with yields on 10-year government debt turning Source: Federal Reserve Bank of St.
Louis; Bank of England. Exhibit 1. 10-Year Sovereign Debt Yields Non-Investment Grade Credit: Attractive on a Relative Basis 6.0% 5.0% In an environment characterized by low yields, achieving one’s total return 4.0% objectives can be a challenge. Not only does total return become more 3.0% dependent on price appreciation, but there is also greater risk of loss if 2.0% rates rise.
In a yield-starved world, we believe non-investment grade credit 1.0% offers a more attractive risk/reward relative to most other fixed income opportunities. Though non-investment grade credit yields are no longer 0.0% as attractive as they were in early 2016 when dislocation in the commodity US Germany Japan Switzerland UK Canada Jun-16 Jun-15 Jun-14 Jun-13 Jun-12 Jun-11 Jun-10 Jun-09 Jun-08 Jun-07 Jun-06 -1.0% sectors caused credit markets to sell off and yields to spike to about 10% in the high-yield market, today’s yields of 7% are still relatively attractive, in our view, when compared to government yields of 1% or less—or even the 3%-4% yields available from US investment grade corporates (Exhibit 3). Source: Bloomberg. Exhibit 3. Income Alternatives US JPM JPM US JPM Leveraged US 10-Yr US 3-Mo Investment Grade 7-Yr German 7-Yr Spanish 7-Yr Italian JPM EMBI High Yield Index Loan Index Treasury Treasury Index (JULI) Bund Sovereign Sovereign Global Index Duration 4.20 0.25 9.06 0.24 7.24 6.35 5.69 6.43 7.06 YTW 7.68% 6.52% 1.47% 0.25% 3.43% -0.46% 0.49% 0.67% 5.59% Source: J.P.
Morgan; Bloomberg. As of 30 Jun 2016. Past performance does not guarantee and is not a reliable indicator of future results.
For illustrative purposes only. Sovereign bonds are backed by the full faith and credit of the issuing sovereign. The sovereign debt of some countries carries more risk due to the increased potential for a payment default. The Quest for Yield .
When considering the fixed income space and the array of opportunities, Historically Less Volatile than Equities investors must weigh the various risks, such as credit risk and duration In the context of risk-adjusted returns, it is also worth noting that both risk. Higher yields seek to compensate investors for higher risk. The leveraged loans and high-yield bonds are historically less volatile than task for the fixed income portfolio manager is to identify investments equities. According to J.P.
Morgan, over the past 25 years through where yields may overstate potential risk. Yields are naturally higher December 2015, high-yield credit (J.P. Morgan US High Yield Index) has in non-investment grade credit as compensation for the higher credit experienced roughly half the annualized return volatility of the S&P 500 risk associated with weaker balance sheets.
However, in our view, there (8.0% vs 14.4%), while providing in-line annualized returns (9.4% vs 10.0%). are several pockets of the market, such as Spanish or Italian sovereign Additionally, high-yield bonds have historically outperformed equities debt, where investors are receiving substantially lower compensation for during down years. Although past performance is not indicative of future different, but possibly very significant, credit risk. results, this reinforces our position that the non-investment grade asset The same line of thinking applies to duration risk. The common assumption class is attractive on a relative basis versus other investment alternatives. that rising rates will result in poor performance across the board for Correlation metrics are a useful way to examine the relationships fixed income instruments is a misconception in our view.
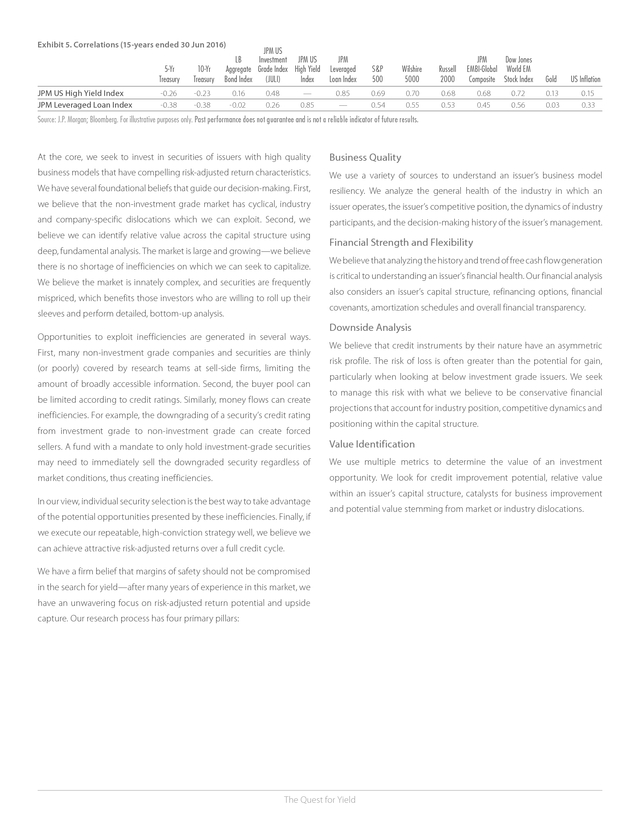
Historically in between non-investment grade securities and other asset classes from rising-rate environments, high-yield bonds and leveraged loans posted a diversification perspective, and also another tool for examining the positive returns on average, while investment grade bonds experienced market’s relationship to rates. The non-investment grade market has negative average returns.1 In this environment, absolute levels of yield are historically low correlations to many other fixed income asset classes much lower, so it is unclear if this will hold true in the future. and has been considerably less sensitive to moves in interest rates, What are the mechanics behind this resilience in the face of rising rates? From a fundamental perspective, non-investment grade assets typically do better when the economy is healthy. Rising rates often as evidenced by the negative correlations of high-yield bonds and leveraged loans to 5-year and 10-year Treasuries (Exhibit 5). go hand-in-hand with economic expansion, rising corporate profits Our Strategy for Success: Bottom-Up, Fundamental Selection and healthier balance sheets, which reduce default rates and lead to Although we believe there are several arguments in favor of the spread compression, all of which are favorable for the non-investment non-investment grade credit market, we fully recognize that the grade asset class.
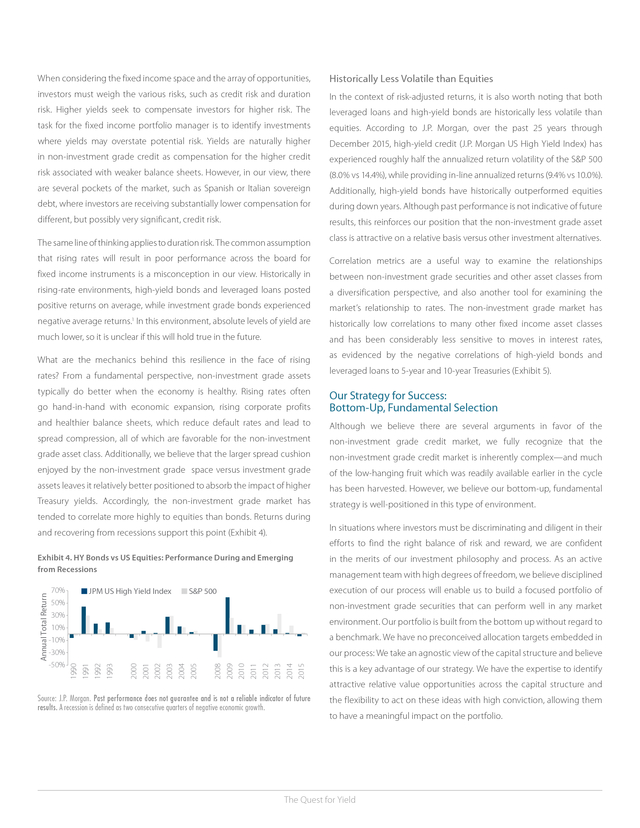
Additionally, we believe that the larger spread cushion non-investment grade credit market is inherently complex—and much enjoyed by the non-investment grade space versus investment grade of the low-hanging fruit which was readily available earlier in the cycle assets leaves it relatively better positioned to absorb the impact of higher has been harvested. However, we believe our bottom-up, fundamental Treasury yields. Accordingly, the non-investment grade market has strategy is well-positioned in this type of environment. tended to correlate more highly to equities than bonds.
Returns during In situations where investors must be discriminating and diligent in their and recovering from recessions support this point (Exhibit 4). efforts to find the right balance of risk and reward, we are confident 70% JPM US High Yield Index in the merits of our investment philosophy and process. As an active management team with high degrees of freedom, we believe disciplined execution of our process will enable us to build a focused portfolio of S&P 500 50% non-investment grade securities that can perform well in any market 30% environment. Our portfolio is built from the bottom up without regard to 10% our process: We take an agnostic view of the capital structure and believe -50% 2008 2009 2010 2011 2012 2013 2014 2015 a benchmark.
We have no preconceived allocation targets embedded in -30% 2000 2001 2002 2003 2004 2005 -10% 1990 1991 1992 1993 Annual Total Return Exhibit 4. HY Bonds vs US Equities: Performance During and Emerging from Recessions Source: J.P. Morgan.
Past performance does not guarantee and is not a reliable indicator of future results. A recession is defined as two consecutive quarters of negative economic growth. this is a key advantage of our strategy. We have the expertise to identify attractive relative value opportunities across the capital structure and the flexibility to act on these ideas with high conviction, allowing them to have a meaningful impact on the portfolio. The Quest for Yield .
Exhibit 5. Correlations (15-years ended 30 Jun 2016) JPM US LB Investment JPM US JPM JPM Dow Jones 5-Yr 10-Yr Aggregate Grade Index High Yield Leveraged S&P Wilshire Russell EMBI-Global World EM Treasury Treasury Bond Index (JULI) Index Loan Index 500 5000 2000 Composite Stock Index Gold US Inflation JPM US High Yield Index -0.26 -0.23 0.16 0.48 — 0.85 0.69 0.70 0.68 0.68 0.72 0.13 0.15 JPM Leveraged Loan Index -0.38 -0.38 -0.02 0.26 0.85 — 0.54 0.55 0.53 0.45 0.56 0.03 0.33 Source: J.P. Morgan; Bloomberg. For illustrative purposes only.
Past performance does not guarantee and is not a reliable indicator of future results. At the core, we seek to invest in securities of issuers with high quality Business Quality business models that have compelling risk-adjusted return characteristics. We use a variety of sources to understand an issuer’s business model We have several foundational beliefs that guide our decision-making. First, resiliency. We analyze the general health of the industry in which an we believe that the non-investment grade market has cyclical, industry issuer operates, the issuer’s competitive position, the dynamics of industry and company-specific dislocations which we can exploit.
Second, we participants, and the decision-making history of the issuer’s management. believe we can identify relative value across the capital structure using deep, fundamental analysis. The market is large and growing—we believe there is no shortage of inefficiencies on which we can seek to capitalize. We believe the market is innately complex, and securities are frequently mispriced, which benefits those investors who are willing to roll up their sleeves and perform detailed, bottom-up analysis. Opportunities to exploit inefficiencies are generated in several ways. First, many non-investment grade companies and securities are thinly (or poorly) covered by research teams at sell-side firms, limiting the amount of broadly accessible information. Second, the buyer pool can be limited according to credit ratings.
Similarly, money flows can create inefficiencies. For example, the downgrading of a security’s credit rating from investment grade to non-investment grade can create forced Financial Strength and Flexibility We believe that analyzing the history and trend of free cash flow generation is critical to understanding an issuer’s financial health. Our financial analysis also considers an issuer’s capital structure, refinancing options, financial covenants, amortization schedules and overall financial transparency. Downside Analysis We believe that credit instruments by their nature have an asymmetric risk profile.
The risk of loss is often greater than the potential for gain, particularly when looking at below investment grade issuers. We seek to manage this risk with what we believe to be conservative financial projections that account for industry position, competitive dynamics and positioning within the capital structure. sellers. A fund with a mandate to only hold investment-grade securities Value Identification may need to immediately sell the downgraded security regardless of We use multiple metrics to determine the value of an investment market conditions, thus creating inefficiencies. opportunity.
We look for credit improvement potential, relative value In our view, individual security selection is the best way to take advantage of the potential opportunities presented by these inefficiencies. Finally, if within an issuer’s capital structure, catalysts for business improvement and potential value stemming from market or industry dislocations. we execute our repeatable, high-conviction strategy well, we believe we can achieve attractive risk-adjusted returns over a full credit cycle. We have a firm belief that margins of safety should not be compromised in the search for yield—after many years of experience in this market, we have an unwavering focus on risk-adjusted return potential and upside capture. Our research process has four primary pillars: The Quest for Yield .
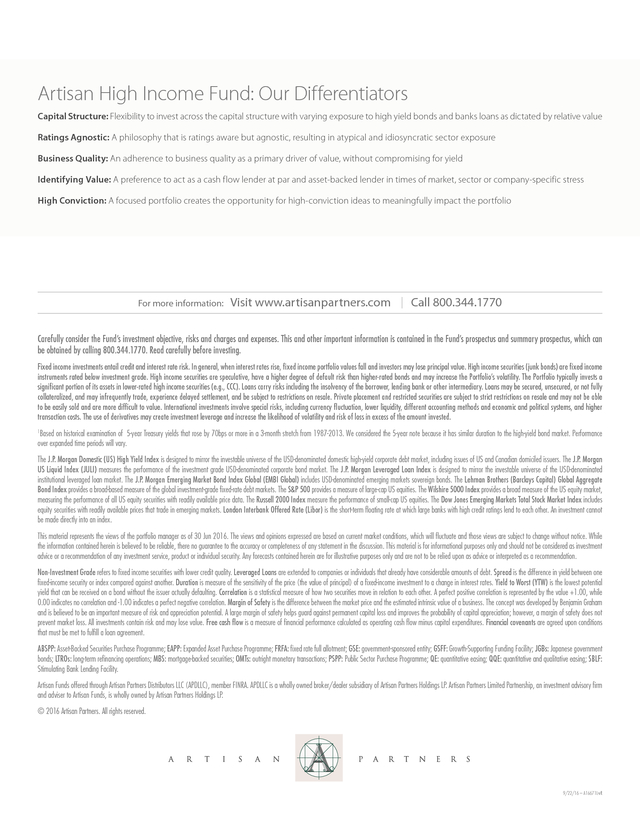
Artisan High Income Fund: Our Differentiators Capital Structure: Flexibility to invest across the capital structure with varying exposure to high yield bonds and banks loans as dictated by relative value Ratings Agnostic: A philosophy that is ratings aware but agnostic, resulting in atypical and idiosyncratic sector exposure Business Quality: An adherence to business quality as a primary driver of value, without compromising for yield Identifying Value: A preference to act as a cash flow lender at par and asset-backed lender in times of market, sector or company-specific stress High Conviction: A focused portfolio creates the opportunity for high-conviction ideas to meaningfully impact the portfolio For more information: Visit www.artisanpartners.com | Call 800.344.1770 Carefully consider the Fund’s investment objective, risks and charges and expenses. This and other important information is contained in the Fund’s prospectus and summary prospectus, which can be obtained by calling 800.344.1770. Read carefully before investing. Fixed income investments entail credit and interest rate risk. In general, when interest rates rise, fixed income portfolio values fall and investors may lose principal value.
High income securities (junk bonds) are fixed income instruments rated below investment grade. High income securities are speculative, have a higher degree of default risk than higher-rated bonds and may increase the Portfolio’s volatility. The Portfolio typically invests a significant portion of its assets in lower-rated high income securities (e.g., CCC).
Loans carry risks including the insolvency of the borrower, lending bank or other intermediary. Loans may be secured, unsecured, or not fully collateralized, and may infrequently trade, experience delayed settlement, and be subject to restrictions on resale. Private placement and restricted securities are subject to strict restrictions on resale and may not be able to be easily sold and are more difficult to value.
International investments involve special risks, including currency fluctuation, lower liquidity, different accounting methods and economic and political systems, and higher transaction costs. The use of derivatives may create investment leverage and increase the likelihood of volatility and risk of loss in excess of the amount invested. Based on historical examination of 5-year Treasury yields that rose by 70bps or more in a 3-month stretch from 1987-2013. We considered the 5-year note because it has similar duration to the high-yield bond market.
Performance over expanded time periods will vary. 1 The J.P. Morgan Domestic (US) High Yield Index is designed to mirror the investable universe of the USD-denominated domestic high-yield corporate debt market, including issues of US and Canadian domiciled issuers. The J.P.
Morgan US Liquid Index (JULI) measures the performance of the investment grade USD-denominated corporate bond market. The J.P. Morgan Leveraged Loan Index is designed to mirror the investable universe of the USD-denominated institutional leveraged loan market.
The J.P. Morgan Emerging Market Bond Index Global (EMBI Global) includes USD-denominated emerging markets sovereign bonds. The Lehman Brothers (Barclays Capital) Global Aggregate Bond Index provides a broad-based measure of the global investment-grade fixed-rate debt markets.
The S&P 500 provides a measure of large-cap US equities. The Wilshire 5000 Index provides a broad measure of the US equity market, measuring the performance of all US equity securities with readily available price data. The Russell 2000 Index measure the performance of small-cap US equities.
The Dow Jones Emerging Markets Total Stock Market Index includes equity securities with readily available prices that trade in emerging markets. London Interbank Offered Rate (Libor) is the short-term floating rate at which large banks with high credit ratings lend to each other. An investment cannot be made directly into an index. This material represents the views of the portfolio manager as of 30 Jun 2016.
The views and opinions expressed are based on current market conditions, which will fluctuate and those views are subject to change without notice. While the information contained herein is believed to be reliable, there no guarantee to the accuracy or completeness of any statement in the discussion. This material is for informational purposes only and should not be considered as investment advice or a recommendation of any investment service, product or individual security.
Any forecasts contained herein are for illustrative purposes only and are not to be relied upon as advice or interpreted as a recommendation. Non-Investment Grade refers to fixed income securities with lower credit quality. Leveraged Loans are extended to companies or individuals that already have considerable amounts of debt. Spread is the difference in yield between one fixed-income security or index compared against another.
Duration is measure of the sensitivity of the price (the value of principal) of a fixed-income investment to a change in interest rates. Yield to Worst (YTW) is the lowest potential yield that can be received on a bond without the issuer actually defaulting. Correlation is a statistical measure of how two securities move in relation to each other.
A perfect positive correlation is represented by the value +1.00, while 0.00 indicates no correlation and -1.00 indicates a perfect negative correlation. Margin of Safety is the difference between the market price and the estimated intrinsic value of a business. The concept was developed by Benjamin Graham and is believed to be an important measure of risk and appreciation potential.
A large margin of safety helps guard against permanent capital loss and improves the probability of capital appreciation; however, a margin of safety does not prevent market loss. All investments contain risk and may lose value. Free cash flow is a measure of financial performance calculated as operating cash flow minus capital expenditures.
Financial covenants are agreed upon conditions that must be met to fulfill a loan agreement. ABSPP: Asset-Backed Securities Purchase Programme; EAPP: Expanded Asset Purchase Programme; FRFA: fixed rate full allotment; GSE: government-sponsored entity; GSFF: Growth-Supporting Funding Facility; JGBs: Japanese government bonds; LTROs: long-term refinancing operations; MBS: mortgage-backed securities; OMTs: outright monetary transactions; PSPP: Public Sector Purchase Programme; QE: quantitative easing; QQE: quantitative and qualitative easing; SBLF: Stimulating Bank Lending Facility. Artisan Funds offered through Artisan Partners Distributors LLC (APDLLC), member FINRA. APDLLC is a wholly owned broker/dealer subsidiary of Artisan Partners Holdings LP. Artisan Partners Limited Partnership, an investment advisory firm and adviser to Artisan Funds, is wholly owned by Artisan Partners Holdings LP. © 2016 Artisan Partners.
All rights reserved. 9/22/16 – A16671L-vR . QE Timeline Appendix â– â– Fed unanimously votes to raise target rate for the ï¬rst time in a decade to 0.5% â– â– Fed ends bond-buying program and announces it will keep rates low â– Fed announces that QE3 should be ï¬nalized by end of October 2014 â– â– â– German Constitutional Court holds a hearing on the legality of OMT days after Draghi declares OMT as “probably the most successful monetary policy measure taken in recent times.” ECB cuts deposit rate from -0.1 to -0.2% Draghi warns that inflation expectations are weakening and hints of potential quantitative easing measures ECB announces deposit rate cut from 0 to -0.1% German constitutional court refers OMT to European Court of Justice â– 2014 ECB begins 3rd CPP3 â– â– BOJ announces it will double scale of the STLBF and GSFF and extends application period by one year ECB begins ABSPP, with the intention of it lasting for two years â– BOJ expands QQE program and accelerates JGB purchases up to ¥80trn (up by ¥30trn) annually ECB announces an expanded asset purchase program where the Bank would purchase €60bn per month from central governments, agencies and European institutions. Total QE would be at least €1.1trn â– 2015 ECB begins PSPP with 90% of total purchases allocated to government bonds â– BOJ announces inflation forecast cuts to 1% and amends the GSFF and SBLF, increasing the GSFF's maximum amount to ¥2trn and extending the application period to two facilities per year ECB announces deposit rate cut from -0.2% to -0.3% â– â– BOJ extends the average remaining maturity of BOJ's JGB purchases to 7-12 years starting in 2016 BOJ applies a negative interest rate -0.1% to certain current accounts ï¬nancial institutions hold at the bank â– 2016 BOJ increases ratio of deposits exempt from negative rates from 0% to 2.5% â– ECB increases monthly public and private sector bond purchases (€60 and €80bn) and begins corporate bond purchases. ECB announces EAPP will expand monthly purchases to 80bn in April and TLTO II will be launched starting June 2016 FOMC votes to maintain target range between 25 and 50 basis points and scales back rate rise forecasts among global growth risks â– ECB cuts deposit rate from -0.3% to -0.4%. The benchmark interest rate is cut from 0.05% to 0% â– â– â– â– BOE launches a new regular market-wide Indexed Long-term Repo (ILTR) â– BOE implements forward guidance stating no rate hike until unemployment is 7% â– FOMC states that beginning January, it will begin tapering and reduce $10bn off monthly bond purchases â– BOE and HM Treasury announces a one year extension to the FLS â– Bernanke again hints that QE3 could come to an end.
The market throws a 'taper tantrum' and investors remain wary â– â– Bernanke repeats to Congress the Fed is prepared to trim bond buying if the economy improves sufficiently BOJ introduces the QQE monetary easing program, announcing it will double monetary base and continue to conduct money market operations increasing the monetary base ¥60-70trn annually â– â– Fed declares it is prepared to increase or reduce the pace of purchases depending on labor market changes BOJ sets a price stability target of 2% and announces it will introduce the open-ended asset purchasing method under the APP â– ECB announces new program for buying sovereign debt â– BOJ will purchase additional ¥10trn in Treasury bills and JGBs BOJ will purchase additional ¥10trn in public debt and ¥1trn in private assets as well as fund up to 100 percent of depository institutions’ net increase in lending to the nonï¬nancial sector â– â– BOE expands QE program to £375bn â– BOE expands QE program to £325bn â– Fed will continue to purchase $45bn in long-term Treasuries per month but without the sale of short-term Treasuries to sterilize purchases 2013 2012 â– BOJ will purchase additional ¥10trn in Treasury bills and JGBs â– BOJ will purchase additional ¥5trn in Treasury bills/reduces FROs â– Fed will purchase $40bn MBS/month â– BOJ will purchase additional ¥10trn in JGBs/reduces FROs â– Fed extends purchases of long bonds/sales of short bonds â– BOJ will loan ¥1trn in USD and additional ¥1trn in JPY â– BOJ will purchase additional ¥10trn in JGBs â– BOE expands QE program to £275bn BOJ will purchase additional ¥5trn in JGBs â– â– ECB announces 36-month LTROs â– ECB will purchase additional €40bn in covered bonds â– Fed will purchase additional $400bn in long-term Treasuries while selling equivalent in short-term Treasuries â– BOJ will purchase ¥5trn in public and private assets â– BOJ will offer ¥10trn in 6-month loans â– BOJ will loan ¥3trn for growth projects â– BOJ will offer additional ¥10trn in 3-month loans â– ECB will purchase €60bn in covered bonds, announces 12-month LTROs â– BOE expands QE program to £200bn â– BOE expands QE program to £175bn â– BOE expands QE program to £125bn â– BOE announces £75bn QE program â– BOE will purchase up to £50bn in private assets â– BOJ increases monthly JGB purchases to ¥1.4trn/month â– BOJ will lend unlimited amount to banks at policy rate â– ECB will conduct FRFA repos â– ECB announces 6-month LTROs â– BOJ will purchase additional ¥5trn in public and private assets and extend additional ¥5trn in 6-month loans â– BOJ will loan ¥0.5trn for equity purchases/asset-backed lending â– 2011 BOJ will purchase additional ¥5trn in public and private assets â– â– â– â– â– Fed will purchase additional $600bn in Treasuries ECB will purchase sovereign debt in secondary markets 2010 Fed will purchase $300bn in Treasuries, additional $100bn in GSE debt, and $750bn in MBS BOJ will offer ¥10trn in 3-month loan BOJ increases monthly JGB purchases to ¥1.8trn/month â– BOJ will purchase up to ¥1trn in corporate bonds â– BOJ will purchase up to ¥3trn in commercial paper â– 2009 FED will purchase $100bn in GSE debt and $500bn in MBS Fed BOJ ECB BOE 2008 Sources for QE Timeline: Agostini, Gabriel et al. Comparative Study of Central Bank Quantitative Easing Programs. School of International and Public Affairs (SIPA), Columbia University.
2016.Fawley, Brett W., and Christopher J. Neely. Four Stories of Quantitative Easing.
Federal Reserve Bank of St. Louis. 2013. .
Aggressive monetary policy high-yield bond market and the leveraged loan market as components has resulted in rapidly expanding central bank balance sheets in recent of the non-investment grade credit asset class. periods (Exhibit 2). A Low-Rate Environment Exhibit 2. Total Assets of Major Central Banks 14.0 of the bond markets since the 2008 financial crisis as rates of economic 12.0 growth and inflation have generally disappointed across much of the 10.0 developed world. As global growth disappointed, central bank stimulus increased.
Notwithstanding repeated expectations for rising rates, bond yields have generally trended lower since then. More recently, yields have $ Trillion Historically low “risk-free” interest rates have been a prevailing feature BOE ECB BOJ Fed 8.0 6.0 Jan-16 Jan-15 upwards of $13 trillion as of July 2016. Jan-14 amount of negative-yielding global government debt, estimated at Jan-13 0 Jan-12 central bank monetary policy globally have led to an unprecedented Jan-11 2.0 Jan-10 negative in Europe and Japan (Exhibit 1). Low growth and aggressive Jan-09 4.0 Jan-08 declined to record lows with yields on 10-year government debt turning Source: Federal Reserve Bank of St.
Louis; Bank of England. Exhibit 1. 10-Year Sovereign Debt Yields Non-Investment Grade Credit: Attractive on a Relative Basis 6.0% 5.0% In an environment characterized by low yields, achieving one’s total return 4.0% objectives can be a challenge. Not only does total return become more 3.0% dependent on price appreciation, but there is also greater risk of loss if 2.0% rates rise.
In a yield-starved world, we believe non-investment grade credit 1.0% offers a more attractive risk/reward relative to most other fixed income opportunities. Though non-investment grade credit yields are no longer 0.0% as attractive as they were in early 2016 when dislocation in the commodity US Germany Japan Switzerland UK Canada Jun-16 Jun-15 Jun-14 Jun-13 Jun-12 Jun-11 Jun-10 Jun-09 Jun-08 Jun-07 Jun-06 -1.0% sectors caused credit markets to sell off and yields to spike to about 10% in the high-yield market, today’s yields of 7% are still relatively attractive, in our view, when compared to government yields of 1% or less—or even the 3%-4% yields available from US investment grade corporates (Exhibit 3). Source: Bloomberg. Exhibit 3. Income Alternatives US JPM JPM US JPM Leveraged US 10-Yr US 3-Mo Investment Grade 7-Yr German 7-Yr Spanish 7-Yr Italian JPM EMBI High Yield Index Loan Index Treasury Treasury Index (JULI) Bund Sovereign Sovereign Global Index Duration 4.20 0.25 9.06 0.24 7.24 6.35 5.69 6.43 7.06 YTW 7.68% 6.52% 1.47% 0.25% 3.43% -0.46% 0.49% 0.67% 5.59% Source: J.P.
Morgan; Bloomberg. As of 30 Jun 2016. Past performance does not guarantee and is not a reliable indicator of future results.
For illustrative purposes only. Sovereign bonds are backed by the full faith and credit of the issuing sovereign. The sovereign debt of some countries carries more risk due to the increased potential for a payment default. The Quest for Yield .
When considering the fixed income space and the array of opportunities, Historically Less Volatile than Equities investors must weigh the various risks, such as credit risk and duration In the context of risk-adjusted returns, it is also worth noting that both risk. Higher yields seek to compensate investors for higher risk. The leveraged loans and high-yield bonds are historically less volatile than task for the fixed income portfolio manager is to identify investments equities. According to J.P.
Morgan, over the past 25 years through where yields may overstate potential risk. Yields are naturally higher December 2015, high-yield credit (J.P. Morgan US High Yield Index) has in non-investment grade credit as compensation for the higher credit experienced roughly half the annualized return volatility of the S&P 500 risk associated with weaker balance sheets.
However, in our view, there (8.0% vs 14.4%), while providing in-line annualized returns (9.4% vs 10.0%). are several pockets of the market, such as Spanish or Italian sovereign Additionally, high-yield bonds have historically outperformed equities debt, where investors are receiving substantially lower compensation for during down years. Although past performance is not indicative of future different, but possibly very significant, credit risk. results, this reinforces our position that the non-investment grade asset The same line of thinking applies to duration risk. The common assumption class is attractive on a relative basis versus other investment alternatives. that rising rates will result in poor performance across the board for Correlation metrics are a useful way to examine the relationships fixed income instruments is a misconception in our view.
Historically in between non-investment grade securities and other asset classes from rising-rate environments, high-yield bonds and leveraged loans posted a diversification perspective, and also another tool for examining the positive returns on average, while investment grade bonds experienced market’s relationship to rates. The non-investment grade market has negative average returns.1 In this environment, absolute levels of yield are historically low correlations to many other fixed income asset classes much lower, so it is unclear if this will hold true in the future. and has been considerably less sensitive to moves in interest rates, What are the mechanics behind this resilience in the face of rising rates? From a fundamental perspective, non-investment grade assets typically do better when the economy is healthy. Rising rates often as evidenced by the negative correlations of high-yield bonds and leveraged loans to 5-year and 10-year Treasuries (Exhibit 5). go hand-in-hand with economic expansion, rising corporate profits Our Strategy for Success: Bottom-Up, Fundamental Selection and healthier balance sheets, which reduce default rates and lead to Although we believe there are several arguments in favor of the spread compression, all of which are favorable for the non-investment non-investment grade credit market, we fully recognize that the grade asset class.
Additionally, we believe that the larger spread cushion non-investment grade credit market is inherently complex—and much enjoyed by the non-investment grade space versus investment grade of the low-hanging fruit which was readily available earlier in the cycle assets leaves it relatively better positioned to absorb the impact of higher has been harvested. However, we believe our bottom-up, fundamental Treasury yields. Accordingly, the non-investment grade market has strategy is well-positioned in this type of environment. tended to correlate more highly to equities than bonds.
Returns during In situations where investors must be discriminating and diligent in their and recovering from recessions support this point (Exhibit 4). efforts to find the right balance of risk and reward, we are confident 70% JPM US High Yield Index in the merits of our investment philosophy and process. As an active management team with high degrees of freedom, we believe disciplined execution of our process will enable us to build a focused portfolio of S&P 500 50% non-investment grade securities that can perform well in any market 30% environment. Our portfolio is built from the bottom up without regard to 10% our process: We take an agnostic view of the capital structure and believe -50% 2008 2009 2010 2011 2012 2013 2014 2015 a benchmark.
We have no preconceived allocation targets embedded in -30% 2000 2001 2002 2003 2004 2005 -10% 1990 1991 1992 1993 Annual Total Return Exhibit 4. HY Bonds vs US Equities: Performance During and Emerging from Recessions Source: J.P. Morgan.
Past performance does not guarantee and is not a reliable indicator of future results. A recession is defined as two consecutive quarters of negative economic growth. this is a key advantage of our strategy. We have the expertise to identify attractive relative value opportunities across the capital structure and the flexibility to act on these ideas with high conviction, allowing them to have a meaningful impact on the portfolio. The Quest for Yield .
Exhibit 5. Correlations (15-years ended 30 Jun 2016) JPM US LB Investment JPM US JPM JPM Dow Jones 5-Yr 10-Yr Aggregate Grade Index High Yield Leveraged S&P Wilshire Russell EMBI-Global World EM Treasury Treasury Bond Index (JULI) Index Loan Index 500 5000 2000 Composite Stock Index Gold US Inflation JPM US High Yield Index -0.26 -0.23 0.16 0.48 — 0.85 0.69 0.70 0.68 0.68 0.72 0.13 0.15 JPM Leveraged Loan Index -0.38 -0.38 -0.02 0.26 0.85 — 0.54 0.55 0.53 0.45 0.56 0.03 0.33 Source: J.P. Morgan; Bloomberg. For illustrative purposes only.
Past performance does not guarantee and is not a reliable indicator of future results. At the core, we seek to invest in securities of issuers with high quality Business Quality business models that have compelling risk-adjusted return characteristics. We use a variety of sources to understand an issuer’s business model We have several foundational beliefs that guide our decision-making. First, resiliency. We analyze the general health of the industry in which an we believe that the non-investment grade market has cyclical, industry issuer operates, the issuer’s competitive position, the dynamics of industry and company-specific dislocations which we can exploit.
Second, we participants, and the decision-making history of the issuer’s management. believe we can identify relative value across the capital structure using deep, fundamental analysis. The market is large and growing—we believe there is no shortage of inefficiencies on which we can seek to capitalize. We believe the market is innately complex, and securities are frequently mispriced, which benefits those investors who are willing to roll up their sleeves and perform detailed, bottom-up analysis. Opportunities to exploit inefficiencies are generated in several ways. First, many non-investment grade companies and securities are thinly (or poorly) covered by research teams at sell-side firms, limiting the amount of broadly accessible information. Second, the buyer pool can be limited according to credit ratings.
Similarly, money flows can create inefficiencies. For example, the downgrading of a security’s credit rating from investment grade to non-investment grade can create forced Financial Strength and Flexibility We believe that analyzing the history and trend of free cash flow generation is critical to understanding an issuer’s financial health. Our financial analysis also considers an issuer’s capital structure, refinancing options, financial covenants, amortization schedules and overall financial transparency. Downside Analysis We believe that credit instruments by their nature have an asymmetric risk profile.
The risk of loss is often greater than the potential for gain, particularly when looking at below investment grade issuers. We seek to manage this risk with what we believe to be conservative financial projections that account for industry position, competitive dynamics and positioning within the capital structure. sellers. A fund with a mandate to only hold investment-grade securities Value Identification may need to immediately sell the downgraded security regardless of We use multiple metrics to determine the value of an investment market conditions, thus creating inefficiencies. opportunity.
We look for credit improvement potential, relative value In our view, individual security selection is the best way to take advantage of the potential opportunities presented by these inefficiencies. Finally, if within an issuer’s capital structure, catalysts for business improvement and potential value stemming from market or industry dislocations. we execute our repeatable, high-conviction strategy well, we believe we can achieve attractive risk-adjusted returns over a full credit cycle. We have a firm belief that margins of safety should not be compromised in the search for yield—after many years of experience in this market, we have an unwavering focus on risk-adjusted return potential and upside capture. Our research process has four primary pillars: The Quest for Yield .
Artisan High Income Fund: Our Differentiators Capital Structure: Flexibility to invest across the capital structure with varying exposure to high yield bonds and banks loans as dictated by relative value Ratings Agnostic: A philosophy that is ratings aware but agnostic, resulting in atypical and idiosyncratic sector exposure Business Quality: An adherence to business quality as a primary driver of value, without compromising for yield Identifying Value: A preference to act as a cash flow lender at par and asset-backed lender in times of market, sector or company-specific stress High Conviction: A focused portfolio creates the opportunity for high-conviction ideas to meaningfully impact the portfolio For more information: Visit www.artisanpartners.com | Call 800.344.1770 Carefully consider the Fund’s investment objective, risks and charges and expenses. This and other important information is contained in the Fund’s prospectus and summary prospectus, which can be obtained by calling 800.344.1770. Read carefully before investing. Fixed income investments entail credit and interest rate risk. In general, when interest rates rise, fixed income portfolio values fall and investors may lose principal value.
High income securities (junk bonds) are fixed income instruments rated below investment grade. High income securities are speculative, have a higher degree of default risk than higher-rated bonds and may increase the Portfolio’s volatility. The Portfolio typically invests a significant portion of its assets in lower-rated high income securities (e.g., CCC).
Loans carry risks including the insolvency of the borrower, lending bank or other intermediary. Loans may be secured, unsecured, or not fully collateralized, and may infrequently trade, experience delayed settlement, and be subject to restrictions on resale. Private placement and restricted securities are subject to strict restrictions on resale and may not be able to be easily sold and are more difficult to value.
International investments involve special risks, including currency fluctuation, lower liquidity, different accounting methods and economic and political systems, and higher transaction costs. The use of derivatives may create investment leverage and increase the likelihood of volatility and risk of loss in excess of the amount invested. Based on historical examination of 5-year Treasury yields that rose by 70bps or more in a 3-month stretch from 1987-2013. We considered the 5-year note because it has similar duration to the high-yield bond market.
Performance over expanded time periods will vary. 1 The J.P. Morgan Domestic (US) High Yield Index is designed to mirror the investable universe of the USD-denominated domestic high-yield corporate debt market, including issues of US and Canadian domiciled issuers. The J.P.
Morgan US Liquid Index (JULI) measures the performance of the investment grade USD-denominated corporate bond market. The J.P. Morgan Leveraged Loan Index is designed to mirror the investable universe of the USD-denominated institutional leveraged loan market.
The J.P. Morgan Emerging Market Bond Index Global (EMBI Global) includes USD-denominated emerging markets sovereign bonds. The Lehman Brothers (Barclays Capital) Global Aggregate Bond Index provides a broad-based measure of the global investment-grade fixed-rate debt markets.
The S&P 500 provides a measure of large-cap US equities. The Wilshire 5000 Index provides a broad measure of the US equity market, measuring the performance of all US equity securities with readily available price data. The Russell 2000 Index measure the performance of small-cap US equities.
The Dow Jones Emerging Markets Total Stock Market Index includes equity securities with readily available prices that trade in emerging markets. London Interbank Offered Rate (Libor) is the short-term floating rate at which large banks with high credit ratings lend to each other. An investment cannot be made directly into an index. This material represents the views of the portfolio manager as of 30 Jun 2016.
The views and opinions expressed are based on current market conditions, which will fluctuate and those views are subject to change without notice. While the information contained herein is believed to be reliable, there no guarantee to the accuracy or completeness of any statement in the discussion. This material is for informational purposes only and should not be considered as investment advice or a recommendation of any investment service, product or individual security.
Any forecasts contained herein are for illustrative purposes only and are not to be relied upon as advice or interpreted as a recommendation. Non-Investment Grade refers to fixed income securities with lower credit quality. Leveraged Loans are extended to companies or individuals that already have considerable amounts of debt. Spread is the difference in yield between one fixed-income security or index compared against another.
Duration is measure of the sensitivity of the price (the value of principal) of a fixed-income investment to a change in interest rates. Yield to Worst (YTW) is the lowest potential yield that can be received on a bond without the issuer actually defaulting. Correlation is a statistical measure of how two securities move in relation to each other.
A perfect positive correlation is represented by the value +1.00, while 0.00 indicates no correlation and -1.00 indicates a perfect negative correlation. Margin of Safety is the difference between the market price and the estimated intrinsic value of a business. The concept was developed by Benjamin Graham and is believed to be an important measure of risk and appreciation potential.
A large margin of safety helps guard against permanent capital loss and improves the probability of capital appreciation; however, a margin of safety does not prevent market loss. All investments contain risk and may lose value. Free cash flow is a measure of financial performance calculated as operating cash flow minus capital expenditures.
Financial covenants are agreed upon conditions that must be met to fulfill a loan agreement. ABSPP: Asset-Backed Securities Purchase Programme; EAPP: Expanded Asset Purchase Programme; FRFA: fixed rate full allotment; GSE: government-sponsored entity; GSFF: Growth-Supporting Funding Facility; JGBs: Japanese government bonds; LTROs: long-term refinancing operations; MBS: mortgage-backed securities; OMTs: outright monetary transactions; PSPP: Public Sector Purchase Programme; QE: quantitative easing; QQE: quantitative and qualitative easing; SBLF: Stimulating Bank Lending Facility. Artisan Funds offered through Artisan Partners Distributors LLC (APDLLC), member FINRA. APDLLC is a wholly owned broker/dealer subsidiary of Artisan Partners Holdings LP. Artisan Partners Limited Partnership, an investment advisory firm and adviser to Artisan Funds, is wholly owned by Artisan Partners Holdings LP. © 2016 Artisan Partners.
All rights reserved. 9/22/16 – A16671L-vR . QE Timeline Appendix â– â– Fed unanimously votes to raise target rate for the ï¬rst time in a decade to 0.5% â– â– Fed ends bond-buying program and announces it will keep rates low â– Fed announces that QE3 should be ï¬nalized by end of October 2014 â– â– â– German Constitutional Court holds a hearing on the legality of OMT days after Draghi declares OMT as “probably the most successful monetary policy measure taken in recent times.” ECB cuts deposit rate from -0.1 to -0.2% Draghi warns that inflation expectations are weakening and hints of potential quantitative easing measures ECB announces deposit rate cut from 0 to -0.1% German constitutional court refers OMT to European Court of Justice â– 2014 ECB begins 3rd CPP3 â– â– BOJ announces it will double scale of the STLBF and GSFF and extends application period by one year ECB begins ABSPP, with the intention of it lasting for two years â– BOJ expands QQE program and accelerates JGB purchases up to ¥80trn (up by ¥30trn) annually ECB announces an expanded asset purchase program where the Bank would purchase €60bn per month from central governments, agencies and European institutions. Total QE would be at least €1.1trn â– 2015 ECB begins PSPP with 90% of total purchases allocated to government bonds â– BOJ announces inflation forecast cuts to 1% and amends the GSFF and SBLF, increasing the GSFF's maximum amount to ¥2trn and extending the application period to two facilities per year ECB announces deposit rate cut from -0.2% to -0.3% â– â– BOJ extends the average remaining maturity of BOJ's JGB purchases to 7-12 years starting in 2016 BOJ applies a negative interest rate -0.1% to certain current accounts ï¬nancial institutions hold at the bank â– 2016 BOJ increases ratio of deposits exempt from negative rates from 0% to 2.5% â– ECB increases monthly public and private sector bond purchases (€60 and €80bn) and begins corporate bond purchases. ECB announces EAPP will expand monthly purchases to 80bn in April and TLTO II will be launched starting June 2016 FOMC votes to maintain target range between 25 and 50 basis points and scales back rate rise forecasts among global growth risks â– ECB cuts deposit rate from -0.3% to -0.4%. The benchmark interest rate is cut from 0.05% to 0% â– â– â– â– BOE launches a new regular market-wide Indexed Long-term Repo (ILTR) â– BOE implements forward guidance stating no rate hike until unemployment is 7% â– FOMC states that beginning January, it will begin tapering and reduce $10bn off monthly bond purchases â– BOE and HM Treasury announces a one year extension to the FLS â– Bernanke again hints that QE3 could come to an end.
The market throws a 'taper tantrum' and investors remain wary â– â– Bernanke repeats to Congress the Fed is prepared to trim bond buying if the economy improves sufficiently BOJ introduces the QQE monetary easing program, announcing it will double monetary base and continue to conduct money market operations increasing the monetary base ¥60-70trn annually â– â– Fed declares it is prepared to increase or reduce the pace of purchases depending on labor market changes BOJ sets a price stability target of 2% and announces it will introduce the open-ended asset purchasing method under the APP â– ECB announces new program for buying sovereign debt â– BOJ will purchase additional ¥10trn in Treasury bills and JGBs BOJ will purchase additional ¥10trn in public debt and ¥1trn in private assets as well as fund up to 100 percent of depository institutions’ net increase in lending to the nonï¬nancial sector â– â– BOE expands QE program to £375bn â– BOE expands QE program to £325bn â– Fed will continue to purchase $45bn in long-term Treasuries per month but without the sale of short-term Treasuries to sterilize purchases 2013 2012 â– BOJ will purchase additional ¥10trn in Treasury bills and JGBs â– BOJ will purchase additional ¥5trn in Treasury bills/reduces FROs â– Fed will purchase $40bn MBS/month â– BOJ will purchase additional ¥10trn in JGBs/reduces FROs â– Fed extends purchases of long bonds/sales of short bonds â– BOJ will loan ¥1trn in USD and additional ¥1trn in JPY â– BOJ will purchase additional ¥10trn in JGBs â– BOE expands QE program to £275bn BOJ will purchase additional ¥5trn in JGBs â– â– ECB announces 36-month LTROs â– ECB will purchase additional €40bn in covered bonds â– Fed will purchase additional $400bn in long-term Treasuries while selling equivalent in short-term Treasuries â– BOJ will purchase ¥5trn in public and private assets â– BOJ will offer ¥10trn in 6-month loans â– BOJ will loan ¥3trn for growth projects â– BOJ will offer additional ¥10trn in 3-month loans â– ECB will purchase €60bn in covered bonds, announces 12-month LTROs â– BOE expands QE program to £200bn â– BOE expands QE program to £175bn â– BOE expands QE program to £125bn â– BOE announces £75bn QE program â– BOE will purchase up to £50bn in private assets â– BOJ increases monthly JGB purchases to ¥1.4trn/month â– BOJ will lend unlimited amount to banks at policy rate â– ECB will conduct FRFA repos â– ECB announces 6-month LTROs â– BOJ will purchase additional ¥5trn in public and private assets and extend additional ¥5trn in 6-month loans â– BOJ will loan ¥0.5trn for equity purchases/asset-backed lending â– 2011 BOJ will purchase additional ¥5trn in public and private assets â– â– â– â– â– Fed will purchase additional $600bn in Treasuries ECB will purchase sovereign debt in secondary markets 2010 Fed will purchase $300bn in Treasuries, additional $100bn in GSE debt, and $750bn in MBS BOJ will offer ¥10trn in 3-month loan BOJ increases monthly JGB purchases to ¥1.8trn/month â– BOJ will purchase up to ¥1trn in corporate bonds â– BOJ will purchase up to ¥3trn in commercial paper â– 2009 FED will purchase $100bn in GSE debt and $500bn in MBS Fed BOJ ECB BOE 2008 Sources for QE Timeline: Agostini, Gabriel et al. Comparative Study of Central Bank Quantitative Easing Programs. School of International and Public Affairs (SIPA), Columbia University.
2016.Fawley, Brett W., and Christopher J. Neely. Four Stories of Quantitative Easing.
Federal Reserve Bank of St. Louis. 2013. .


