


Description
FOR INSTITUTIONAL OR REGISTERED REPRESENTATIVE USE ONLY. NOT FOR PUBLIC USE OR VIEWING.
WisdomTree Fund Characteristics Report
4th Quarter 2015
The WisdomTree Characteristics report was compiled to give a framework to analyze the characteristics of WisdomTree Funds relative to 1) funds that track the market
capitalization weighted benchmark of each WisdomTree Fund when such Funds are available and 2) the largest funds by assets under management --at the time of the report-that provide the most similar exposure as the WisdomTree Funds. Characteristics included in this report include: fundamental data items such as P/E ratios, Price/Book ratios,
Price/Sales ratios and market capitalization statistics to help determine size characteristics, sector weights, and REIT allocations. All information is provided strictly for
educational and illustrative purposes only.
No representation is being made that any investment will achieve performance similar to those shown.
The information provided is not intended for trading purposes, and should not be considered investment advice. All information for the Funds found in this report is based on Funds' Indicated Optimized Portfolio Value or "ETF IOPV". An ETF IOPV represents the fund constituents being used to calculate IOPV, which is the intraday NAV of the Fund.
This value is intended to approximate the value of the securities held in the portfolio by the ETF and should closely represent the value of the Fund throughout the day. ETF IOPV constituents may differ from actual Fund constituents. The ETF IOPV represents a measure of fair value of the ETF's underlying securities at a specific point in time. The ETF IOPV is not a direct market price of the ETF; market prices typically incorporate bid/ask spreads over estimates of ETF IOPVs or other fair value measures of an ETF's underlying holdings. Page 1 of 19 .
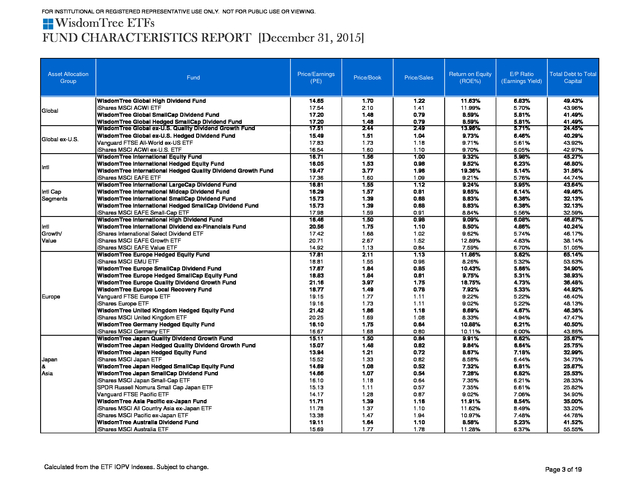
FOR INSTITUTIONAL OR REGISTERED REPRESENTATIVE USE ONLY. NOT FOR PUBLIC USE OR VIEWING. WisdomTree ETFs FUND CHARACTERISTICS REPORT [December 31, 2015] ETF FUNDAMENTAL CHARACTERISTICS OF ETF IOPV INFORMATION Asset Allocation Group Fund Broad US Market WisdomTree Total Dividend Fund WisdomTree Total Earnings Fund iShares Russell 3000 ETF Vanguard Total Stock Market ETF WisdomTree LargeCap Dividend Fund Large Cap WisdomTree Earnings 500 Fund US iShares Russell 1000 ETF iShares Core S&P 500 ETF US Local Economy vsWisdomTree Strong Dollar U.S. Equity Fund Exporters WisdomTree Weak Dollar U.S. Equity Fund WisdomTree LargeCap Value Fund iShares S&P 500 Value ETF Large Cap iShares S&P 500 Growth ETF US iShares Russell 1000 Value ETF Growth/Value iShares Russell 1000 Growth ETF iShares Core U.S.
Value ETF iShares Core U.S. Growth ETF WisdomTree Dynamic Long/Short U.S. Equity Fund* Alternative SPDR S&P 500 ETF WisdomTree High Dividend Fund WisdomTree Dividend ex-Financials Fund Equity Income/ iShares Select Dividend ETF Dividend Growth WisdomTree U.S.
Quality Dividend Growth Fund Vanguard Dividend Appreciation Fund SPDR S&P Dividend ETF WisdomTree Midcap Dividend Fund WisdomTree Midcap Earnings Fund Vanguard Mid-Cap ETF Mid Cap iShares Russell Mid-Cap ETF US iShares Core S&P Mid-Cap ETF iShares Russell Mid-Cap Value ETF iShares Russell Mid-Cap Growth ETF iShares S&P Mid-Cap 400 Value ETF iShares S&P Mid-Cap 400 Growth ETF WisdomTree SmallCap Dividend Fund WisdomTree SmallCap Earnings Fund WisdomTree U.S. SmallCap Quality Dividend Growth Fund Small Cap iShares Russell 2000 ETF US iShares Russell 2000 Value ETF iShares Russell 2000 Growth ETF iShares Core S&P Small-Cap ETF iShares S&P SmallCap 600 Value ETF iShares S&P SmallCap 600 Growth ETF Vanguard Small-Cap ETF Vanguard Small-Cap Value ETF Vanguard Small-Cap Growth ETF *WisdomTree Dynamic Long/Short U.S. Equity Fund - all information is for the Long portion only. Calculated from the ETF IOPV Indexes.
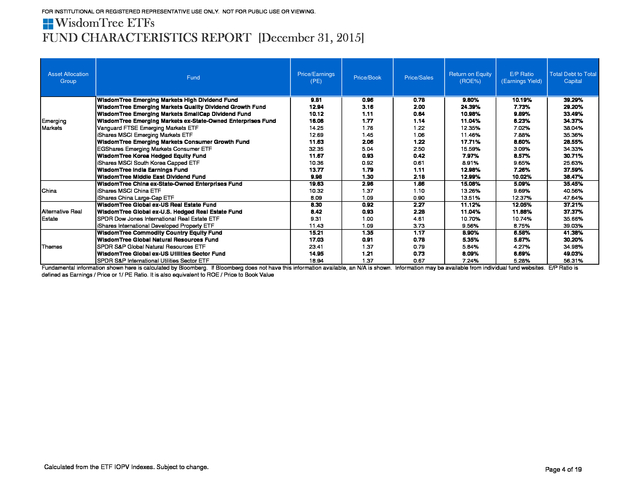
Subject to change. Price/Earnings (PE) Price/Book Price/Sales Return on Equity (ROE%) E/P Ratio (Earnings Yield) Total Debt to Total Capital 16.83 15.08 19.37 19.33 16.54 14.76 19.10 18.65 20.23 19.86 16.20 15.57 22.97 16.78 21.91 16.95 21.01 15.36 18.69 16.95 14.84 16.85 16.73 18.35 19.05 18.71 15.30 20.75 20.66 19.55 18.40 23.51 16.17 24.40 17.36 11.98 14.02 23.46 19.25 29.69 21.67 18.78 25.14 22.10 17.26 33.08 2.42 2.33 2.73 2.74 2.55 2.39 2.81 2.86 2.44 3.21 2.53 1.98 4.97 1.82 5.74 1.77 5.24 3.22 2.87 2.27 2.14 2.10 4.62 3.81 2.66 2.25 2.02 2.56 2.52 2.22 1.66 5.19 1.58 3.60 1.60 1.32 1.95 2.02 1.35 3.89 1.93 1.45 2.74 2.12 1.66 3.12 1.57 1.40 1.72 1.72 1.66 1.47 1.79 1.85 1.45 1.84 0.85 1.37 2.77 1.51 2.15 1.45 2.02 1.62 1.85 1.45 1.12 1.51 1.69 1.46 1.58 1.23 0.95 1.52 1.51 1.14 1.29 1.81 0.78 2.03 0.78 0.78 0.84 1.17 0.97 1.47 1.08 0.74 1.86 1.19 0.85 2.22 14.36% 15.43% 14.09% 14.16% 15.43% 16.18% 14.73% 15.32% 12.09% 16.17% 15.61% 12.70% 21.63% 10.83% 26.21% 10.45% 24.94% 20.94% 15.39% 13.37% 14.43% 12.43% 27.63% 20.79% 13.94% 12.04% 13.22% 12.32% 12.22% 11.36% 9.03% 22.06% 9.79% 14.74% 9.24% 11.01% 13.92% 8.63% 7.02% 13.11% 8.92% 7.74% 10.90% 9.58% 9.64% 9.43% 5.94% 6.63% 5.16% 5.17% 6.05% 6.78% 5.24% 5.36% 4.94% 5.04% 6.17% 6.42% 4.35% 5.96% 4.56% 5.90% 4.76% 6.51% 5.35% 5.90% 6.74% 5.93% 5.98% 5.45% 5.25% 5.35% 6.54% 4.82% 4.84% 5.11% 5.44% 4.25% 6.19% 4.10% 5.76% 8.35% 7.13% 4.26% 5.19% 3.37% 4.61% 5.33% 3.98% 4.52% 5.80% 3.02% 47.17% 44.92% 42.21% 42.51% 46.96% 45.20% 42.64% 42.20% 52.11% 40.28% 40.33% 44.91% 39.63% 42.35% 42.92% 42.19% 45.03% 46.13% 42.25% 51.67% 47.59% 52.15% 46.70% 39.50% 42.04% 48.56% 45.30% 44.16% 44.97% 39.85% 42.15% 47.75% 38.14% 41.48% 41.96% 35.55% 30.52% 37.00% 40.25% 33.88% 32.11% 32.21% 32.03% 42.41% 46.01% 38.18% Page 2 of 19 . FOR INSTITUTIONAL OR REGISTERED REPRESENTATIVE USE ONLY. NOT FOR PUBLIC USE OR VIEWING. WisdomTree ETFs FUND CHARACTERISTICS REPORT [December 31, 2015] Asset Allocation Group Global Global ex-U.S. Intl Intl Cap Segments Intl Growth/ Value Europe Japan & Asia Fund WisdomTree Global High Dividend Fund iShares MSCI ACWI ETF WisdomTree Global SmallCap Dividend Fund WisdomTree Global Hedged SmallCap Dividend Fund WisdomTree Global ex-U.S. Quality Dividend Growth Fund WisdomTree Global ex-U.S. Hedged Dividend Fund Vanguard FTSE All-World ex-US ETF iShares MSCI ACWI ex-U.S.
ETF WisdomTree International Equity Fund WisdomTree International Hedged Equity Fund WisdomTree International Hedged Quality Dividend Growth Fund iShares MSCI EAFE ETF WisdomTree International LargeCap Dividend Fund WisdomTree International Midcap Dividend Fund WisdomTree International SmallCap Dividend Fund WisdomTree International Hedged SmallCap Dividend Fund iShares MSCI EAFE Small-Cap ETF WisdomTree International High Dividend Fund WisdomTree International Dividend ex-Financials Fund iShares International Select Dividend ETF iShares MSCI EAFE Growth ETF iShares MSCI EAFE Value ETF WisdomTree Europe Hedged Equity Fund iShares MSCI EMU ETF WisdomTree Europe SmallCap Dividend Fund WisdomTree Europe Hedged SmallCap Equity Fund WisdomTree Europe Quality Dividend Growth Fund WisdomTree Europe Local Recovery Fund Vanguard FTSE Europe ETF iShares Europe ETF WisdomTree United Kingdom Hedged Equity Fund iShares MSCI United Kingdom ETF WisdomTree Germany Hedged Equity Fund iShares MSCI Germany ETF WisdomTree Japan Quality Dividend Growth Fund WisdomTree Japan Hedged Quality Dividend Growth Fund WisdomTree Japan Hedged Equity Fund iShares MSCI Japan ETF WisdomTree Japan Hedged SmallCap Equity Fund WisdomTree Japan SmallCap Dividend Fund iShares MSCI Japan Small-Cap ETF SPDR Russell Nomura Small Cap Japan ETF Vanguard FTSE Pacific ETF WisdomTree Asia Pacific ex-Japan Fund iShares MSCI All Country Asia ex-Japan ETF iShares MSCI Pacific ex-Japan ETF WisdomTree Australia Dividend Fund iShares MSCI Australia ETF Calculated from the ETF IOPV Indexes. Subject to change. Price/Earnings (PE) Price/Book Price/Sales Return on Equity (ROE%) E/P Ratio (Earnings Yield) Total Debt to Total Capital 14.65 17.54 17.20 17.20 17.51 15.49 17.83 16.54 16.71 16.05 19.47 17.36 16.81 16.29 15.73 15.73 17.98 16.46 20.56 17.42 20.71 14.92 17.81 18.81 17.67 18.83 21.16 18.77 19.15 19.16 21.42 20.25 16.10 16.67 15.11 15.07 13.94 15.52 14.69 14.66 16.10 15.13 14.17 11.71 11.78 13.38 19.11 15.69 1.70 2.10 1.48 1.48 2.44 1.51 1.73 1.60 1.56 1.53 3.77 1.60 1.55 1.57 1.39 1.39 1.59 1.50 1.75 1.68 2.67 1.13 2.11 1.55 1.84 1.84 3.97 1.49 1.77 1.73 1.86 1.69 1.75 1.68 1.50 1.48 1.21 1.33 1.08 1.07 1.18 1.11 1.28 1.39 1.37 1.47 1.64 1.77 1.22 1.41 0.79 0.79 2.49 1.04 1.18 1.10 1.00 0.98 1.96 1.09 1.12 0.81 0.68 0.68 0.91 0.98 1.10 1.02 1.52 0.84 1.13 0.96 0.85 0.81 1.75 0.78 1.11 1.11 1.18 1.08 0.64 0.80 0.84 0.82 0.72 0.82 0.52 0.54 0.64 0.57 0.87 1.16 1.10 1.94 1.10 1.78 11.63% 11.99% 8.59% 8.59% 13.96% 9.73% 9.71% 9.70% 9.32% 9.52% 19.36% 9.21% 9.24% 9.65% 8.83% 8.83% 8.84% 9.09% 8.50% 9.62% 12.89% 7.59% 11.86% 8.26% 10.43% 9.75% 18.75% 7.92% 9.22% 9.02% 8.69% 8.33% 10.88% 10.11% 9.91% 9.84% 8.67% 8.58% 7.32% 7.28% 7.35% 7.35% 9.02% 11.91% 11.62% 10.97% 8.58% 11.28% 6.83% 5.70% 5.81% 5.81% 5.71% 6.46% 5.61% 6.05% 5.98% 6.23% 5.14% 5.76% 5.95% 6.14% 6.36% 6.36% 5.56% 6.08% 4.86% 5.74% 4.83% 6.70% 5.62% 5.32% 5.66% 5.31% 4.73% 5.33% 5.22% 5.22% 4.67% 4.94% 6.21% 6.00% 6.62% 6.64% 7.18% 6.44% 6.81% 6.82% 6.21% 6.61% 7.06% 8.54% 8.49% 7.48% 5.23% 6.37% 49.43% 43.96% 41.49% 41.49% 24.45% 40.29% 43.92% 42.97% 45.27% 46.80% 31.56% 44.74% 43.64% 49.46% 32.13% 32.13% 32.59% 46.87% 40.24% 46.17% 38.14% 51.05% 65.14% 53.63% 34.90% 38.93% 36.48% 44.92% 46.40% 48.13% 46.36% 47.47% 40.50% 43.86% 25.67% 25.75% 32.99% 34.75% 25.87% 25.53% 28.33% 25.82% 34.90% 35.00% 33.20% 44.78% 41.52% 55.55% Page 3 of 19 . FOR INSTITUTIONAL OR REGISTERED REPRESENTATIVE USE ONLY. NOT FOR PUBLIC USE OR VIEWING. WisdomTree ETFs FUND CHARACTERISTICS REPORT [December 31, 2015] Asset Allocation Group Fund Price/Earnings (PE) Price/Book Price/Sales Return on Equity (ROE%) E/P Ratio (Earnings Yield) Total Debt to Total Capital WisdomTree Emerging Markets High Dividend Fund 9.81 0.96 0.78 9.80% 10.19% 39.29% WisdomTree Emerging Markets Quality Dividend Growth Fund 12.94 3.16 2.00 24.39% 7.73% 29.20% WisdomTree Emerging Markets SmallCap Dividend Fund 10.12 1.11 0.64 10.98% 9.89% 33.49% Emerging WisdomTree Emerging Markets ex-State-Owned Enterprises Fund 16.06 1.77 1.14 11.04% 6.23% 34.37% Markets Vanguard FTSE Emerging Markets ETF 14.25 1.76 1.22 12.35% 7.02% 38.04% iShares MSCI Emerging Markets ETF 12.69 1.45 1.06 11.46% 7.88% 35.36% WisdomTree Emerging Markets Consumer Growth Fund 11.63 2.06 1.22 17.71% 8.60% 28.55% EGShares Emerging Markets Consumer ETF 32.35 5.04 2.50 15.59% 3.09% 34.33% WisdomTree Korea Hedged Equity Fund 11.67 0.93 0.42 7.97% 8.57% 30.71% iShares MSCI South Korea Capped ETF 10.36 0.92 0.61 8.91% 9.65% 25.63% WisdomTree India Earnings Fund 13.77 1.79 1.11 12.98% 7.26% 37.59% WisdomTree Middle East Dividend Fund 9.98 1.30 2.18 12.99% 10.02% 38.47% WisdomTree China ex-State-Owned Enterprises Fund 19.63 2.96 1.86 15.08% 5.09% 35.45% China iShares MSCI China ETF 10.32 1.37 1.10 13.26% 9.69% 40.56% iShares China Large-Cap ETF 8.09 1.09 0.90 13.51% 12.37% 47.64% WisdomTree Global ex-US Real Estate Fund 8.30 0.92 2.27 11.12% 12.05% 37.21% Alternative Real WisdomTree Global ex-U.S. Hedged Real Estate Fund 8.42 0.93 2.28 11.04% 11.88% 37.37% SPDR Dow Jones International Real Estate ETF 9.31 1.00 4.61 10.70% 10.74% 35.66% Estate iShares International Developed Property ETF 11.43 1.09 3.73 9.56% 8.75% 39.03% WisdomTree Commodity Country Equity Fund 15.21 1.35 1.17 8.90% 6.58% 41.38% WisdomTree Global Natural Resources Fund 17.03 0.91 0.78 5.35% 5.87% 30.20% Themes SPDR S&P Global Natural Resources ETF 23.41 1.37 0.79 5.84% 4.27% 34.98% WisdomTree Global ex-US Utilities Sector Fund 14.95 1.21 0.73 8.09% 6.69% 49.03% SPDR S&P International Utilities Sector ETF 18.94 1.37 0.67 7.24% 5.28% 56.31% Fundamental information shown here is calculated by Bloomberg. If Bloomberg does not have this information available, an N/A is shown.
Information may be available from individual fund websites. E/P Ratio is defined as Earnings / Price or 1/ PE Ratio. It is also equivalent to ROE / Price to Book Value Calculated from the ETF IOPV Indexes.
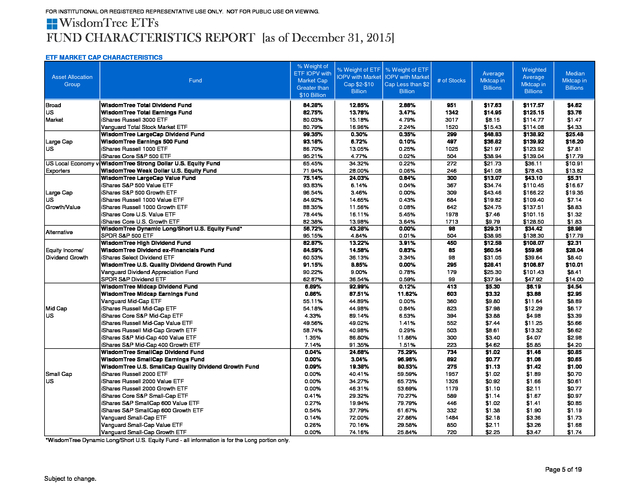
Subject to change. Page 4 of 19 . FOR INSTITUTIONAL OR REGISTERED REPRESENTATIVE USE ONLY. NOT FOR PUBLIC USE OR VIEWING. WisdomTree ETFs FUND CHARACTERISTICS REPORT [as of December 31, 2015] ETF MARKET CAP CHARACTERISTICS Asset Allocation Group Broad US Market Fund WisdomTree Total Dividend Fund WisdomTree Total Earnings Fund iShares Russell 3000 ETF Vanguard Total Stock Market ETF WisdomTree LargeCap Dividend Fund Large Cap WisdomTree Earnings 500 Fund US iShares Russell 1000 ETF iShares Core S&P 500 ETF US Local Economy vsWisdomTree Strong Dollar U.S. Equity Fund Exporters WisdomTree Weak Dollar U.S. Equity Fund WisdomTree LargeCap Value Fund iShares S&P 500 Value ETF Large Cap iShares S&P 500 Growth ETF US iShares Russell 1000 Value ETF Growth/Value iShares Russell 1000 Growth ETF iShares Core U.S.
Value ETF iShares Core U.S. Growth ETF WisdomTree Dynamic Long/Short U.S. Equity Fund* Alternative SPDR S&P 500 ETF WisdomTree High Dividend Fund Equity Income/ WisdomTree Dividend ex-Financials Fund Dividend Growth iShares Select Dividend ETF WisdomTree U.S.
Quality Dividend Growth Fund Vanguard Dividend Appreciation Fund SPDR S&P Dividend ETF WisdomTree Midcap Dividend Fund WisdomTree Midcap Earnings Fund Vanguard Mid-Cap ETF Mid Cap iShares Russell Mid-Cap ETF US iShares Core S&P Mid-Cap ETF iShares Russell Mid-Cap Value ETF iShares Russell Mid-Cap Growth ETF iShares S&P Mid-Cap 400 Value ETF iShares S&P Mid-Cap 400 Growth ETF WisdomTree SmallCap Dividend Fund WisdomTree SmallCap Earnings Fund WisdomTree U.S. SmallCap Quality Dividend Growth Fund Small Cap iShares Russell 2000 ETF US iShares Russell 2000 Value ETF iShares Russell 2000 Growth ETF iShares Core S&P Small-Cap ETF iShares S&P SmallCap 600 Value ETF iShares S&P SmallCap 600 Growth ETF Vanguard Small-Cap ETF Vanguard Small-Cap Value ETF Vanguard Small-Cap Growth ETF *WisdomTree Dynamic Long/Short U.S. Equity Fund - all information is for the Long portion only. % Weight of % Weight of ETF % Weight of ETF ETF IOPV with IOPV with Market IOPV with Market Market Cap Cap Less than $2 Cap $2-$10 Greater than Billion Billion $10 Billion 84.28% 82.75% 80.03% 80.79% 99.35% 93.18% 86.70% 95.21% 65.45% 71.94% 75.14% 93.83% 96.54% 84.92% 88.35% 78.44% 82.38% 56.72% 95.15% 82.87% 84.59% 60.53% 91.15% 90.22% 62.87% 6.89% 0.86% 55.11% 54.18% 4.33% 49.56% 58.74% 1.35% 7.14% 0.04% 0.00% 0.09% 0.00% 0.00% 0.00% 0.41% 0.27% 0.54% 0.14% 0.26% 0.00% 12.85% 13.78% 15.18% 16.96% 0.30% 6.72% 13.05% 4.77% 34.32% 28.00% 24.03% 6.14% 3.46% 14.65% 11.56% 16.11% 13.98% 43.28% 4.84% 13.22% 14.58% 36.13% 8.85% 9.00% 36.54% 92.99% 87.51% 44.89% 44.98% 89.14% 49.02% 40.98% 86.80% 91.35% 24.68% 3.04% 19.38% 40.41% 34.27% 46.31% 29.32% 19.94% 37.79% 72.00% 70.16% 74.16% 2.88% 3.47% 4.79% 2.24% 0.35% 0.10% 0.25% 0.02% 0.22% 0.06% 0.84% 0.04% 0.00% 0.43% 0.08% 5.45% 3.64% 0.00% 0.01% 3.91% 0.83% 3.34% 0.00% 0.78% 0.59% 0.12% 11.62% 0.00% 0.84% 6.53% 1.41% 0.29% 11.86% 1.51% 75.29% 96.96% 80.53% 59.59% 65.73% 53.69% 70.27% 79.79% 61.67% 27.86% 29.58% 25.84% # of Stocks Average Mktcap in Billions Weighted Average Mktcap in Billions Median Mktcap in Billions 951 1342 3017 1520 299 497 1025 504 272 246 300 367 309 684 642 1978 1713 98 504 450 85 98 295 179 99 413 603 360 823 394 552 503 300 223 734 892 275 1957 1326 1179 589 446 332 1484 850 720 $17.63 $14.95 $8.15 $15.43 $48.83 $36.82 $21.97 $38.94 $21.73 $41.08 $13.07 $34.74 $43.46 $19.82 $24.75 $7.46 $9.79 $29.31 $38.95 $12.58 $60.54 $31.05 $28.41 $25.30 $37.94 $5.30 $3.32 $9.80 $7.98 $3.88 $7.44 $8.61 $3.40 $4.62 $1.02 $0.77 $1.13 $1.02 $0.92 $1.10 $1.14 $1.02 $1.38 $2.18 $2.11 $2.25 $117.57 $125.15 $114.77 $114.08 $138.92 $139.92 $123.92 $139.04 $36.11 $78.43 $43.10 $110.45 $166.22 $109.40 $137.51 $101.15 $128.50 $34.42 $138.30 $108.07 $59.96 $39.64 $106.87 $101.43 $47.92 $6.19 $3.88 $11.64 $12.29 $4.98 $11.25 $13.32 $4.07 $5.85 $1.46 $1.06 $1.42 $1.89 $1.66 $2.11 $1.67 $1.41 $1.90 $3.36 $3.26 $3.47 $4.62 $3.76 $1.47 $4.33 $25.48 $16.20 $7.81 $17.79 $10.91 $13.82 $5.31 $16.67 $19.35 $7.14 $8.83 $1.32 $1.83 $8.98 $17.79 $2.31 $28.04 $8.40 $10.01 $8.41 $14.00 $4.54 $2.95 $8.89 $6.17 $3.39 $5.66 $6.62 $2.98 $4.20 $0.85 $0.65 $1.00 $0.70 $0.61 $0.77 $0.97 $0.85 $1.19 $1.73 $1.68 $1.74 Page 5 of 19 Subject to change. .
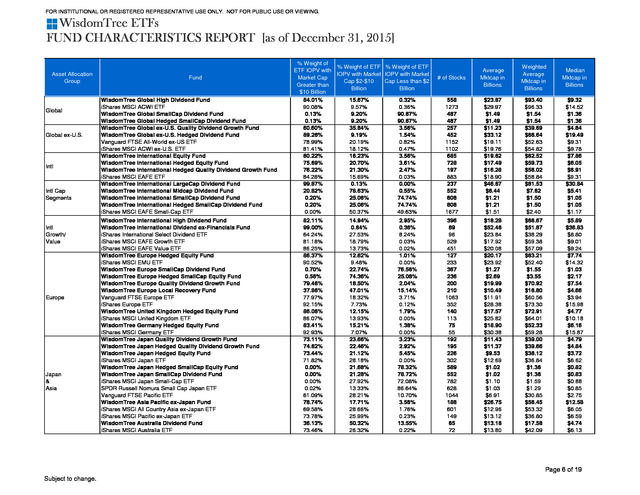
FOR INSTITUTIONAL OR REGISTERED REPRESENTATIVE USE ONLY. NOT FOR PUBLIC USE OR VIEWING. WisdomTree ETFs FUND CHARACTERISTICS REPORT [as of December 31, 2015] Asset Allocation Group Global Global ex-U.S. Intl Intl Cap Segments Intl Growth/ Value Europe Japan & Asia Fund WisdomTree Global High Dividend Fund iShares MSCI ACWI ETF WisdomTree Global SmallCap Dividend Fund WisdomTree Global Hedged SmallCap Dividend Fund WisdomTree Global ex-U.S. Quality Dividend Growth Fund WisdomTree Global ex-U.S. Hedged Dividend Fund Vanguard FTSE All-World ex-US ETF iShares MSCI ACWI ex-U.S.
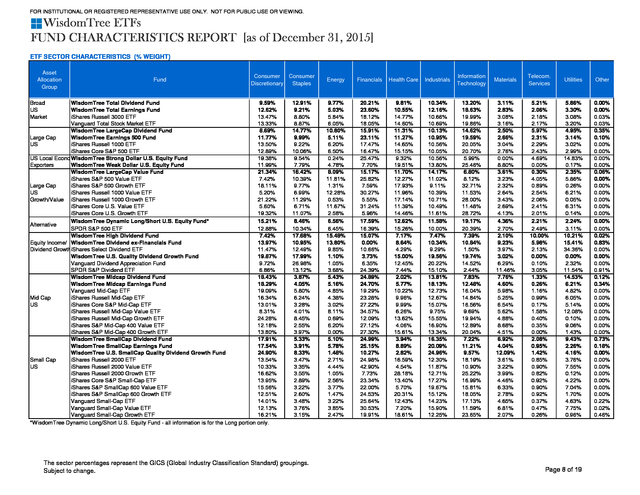
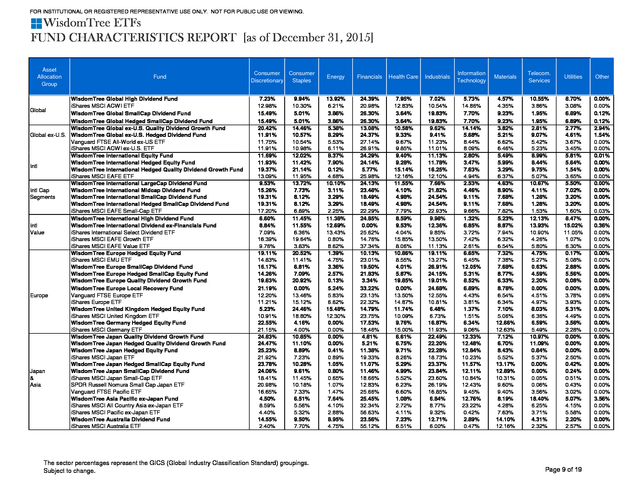
ETF WisdomTree International Equity Fund WisdomTree International Hedged Equity Fund WisdomTree International Hedged Quality Dividend Growth Fund iShares MSCI EAFE ETF WisdomTree International LargeCap Dividend Fund WisdomTree International Midcap Dividend Fund WisdomTree International SmallCap Dividend Fund WisdomTree International Hedged SmallCap Dividend Fund iShares MSCI EAFE Small-Cap ETF WisdomTree International High Dividend Fund WisdomTree International Dividend ex-Financials Fund iShares International Select Dividend ETF iShares MSCI EAFE Growth ETF iShares MSCI EAFE Value ETF WisdomTree Europe Hedged Equity Fund iShares MSCI EMU ETF WisdomTree Europe SmallCap Dividend Fund WisdomTree Europe Hedged SmallCap Equity Fund WisdomTree Europe Quality Dividend Growth Fund WisdomTree Europe Local Recovery Fund Vanguard FTSE Europe ETF iShares Europe ETF WisdomTree United Kingdom Hedged Equity Fund iShares MSCI United Kingdom ETF WisdomTree Germany Hedged Equity Fund iShares MSCI Germany ETF WisdomTree Japan Quality Dividend Growth Fund WisdomTree Japan Hedged Quality Dividend Growth Fund WisdomTree Japan Hedged Equity Fund iShares MSCI Japan ETF WisdomTree Japan Hedged SmallCap Equity Fund WisdomTree Japan SmallCap Dividend Fund iShares MSCI Japan Small-Cap ETF SPDR Russell Nomura Small Cap Japan ETF Vanguard FTSE Pacific ETF WisdomTree Asia Pacific ex-Japan Fund iShares MSCI All Country Asia ex-Japan ETF iShares MSCI Pacific ex-Japan ETF WisdomTree Australia Dividend Fund iShares MSCI Australia ETF % Weight of % Weight of ETF % Weight of ETF ETF IOPV with IOPV with Market IOPV with Market Market Cap Cap Less than $2 Cap $2-$10 Greater than Billion Billion $10 Billion 84.01% 15.67% 0.32% 90.08% 9.57% 0.36% 0.13% 9.20% 90.67% 0.13% 9.20% 90.67% 60.60% 35.84% 3.56% 89.26% 9.19% 1.54% 78.99% 20.19% 0.82% 81.41% 18.12% 0.47% 80.22% 16.23% 3.56% 75.69% 20.70% 3.61% 76.22% 21.30% 2.47% 84.28% 15.69% 0.03% 99.87% 0.13% 0.00% 20.82% 78.63% 0.55% 0.20% 25.06% 74.74% 0.20% 25.06% 74.74% 0.00% 50.37% 49.63% 82.11% 99.00% 64.24% 81.18% 86.25% 86.37% 90.52% 0.70% 0.56% 79.46% 37.86% 77.97% 92.15% 86.06% 86.07% 83.41% 92.93% 73.11% 74.62% 73.44% 71.82% 0.00% 0.00% 0.00% 0.02% 61.09% 78.74% 69.58% 73.78% 36.13% 73.46% 14.94% 0.64% 27.53% 18.79% 13.73% 12.62% 9.48% 22.74% 74.36% 18.50% 47.01% 18.32% 7.73% 12.15% 13.93% 15.21% 7.07% 23.66% 22.46% 21.12% 28.18% 21.68% 21.28% 27.92% 13.33% 28.21% 17.71% 28.66% 25.99% 50.32% 26.32% 2.95% 0.36% 8.24% 0.03% 0.02% 1.01% 0.00% 76.56% 25.08% 2.04% 15.14% 3.71% 0.12% 1.79% 0.00% 1.38% 0.00% 3.23% 2.92% 5.45% 0.00% 78.32% 78.72% 72.08% 86.64% 10.70% 3.56% 1.76% 0.23% 13.55% 0.22% # of Stocks Average Mktcap in Billions Weighted Average Mktcap in Billions Median Mktcap in Billions 558 1273 487 487 257 452 1152 1102 685 728 197 883 237 552 808 808 1677 $23.87 $29.97 $1.49 $1.49 $11.23 $33.12 $19.11 $19.76 $19.62 $17.49 $16.28 $18.90 $46.67 $6.44 $1.21 $1.21 $1.51 $93.40 $96.33 $1.54 $1.54 $39.69 $66.64 $52.63 $54.82 $62.52 $59.73 $56.02 $58.84 $81.53 $7.62 $1.50 $1.50 $2.40 $9.32 $14.52 $1.36 $1.36 $4.84 $19.49 $9.31 $9.78 $7.86 $6.05 $6.91 $9.31 $30.84 $5.41 $1.05 $1.05 $1.17 396 89 96 529 451 127 233 367 236 200 210 1063 352 140 113 75 55 192 195 226 302 589 552 782 628 1044 188 601 149 65 72 $18.28 $52.46 $23.84 $17.92 $20.08 $20.17 $23.92 $1.27 $2.69 $19.99 $10.49 $11.91 $28.38 $17.57 $25.82 $18.90 $30.38 $11.43 $11.37 $9.53 $12.69 $1.02 $1.02 $1.10 $1.03 $6.91 $26.75 $12.96 $13.12 $13.16 $13.80 $66.67 $51.87 $38.29 $59.38 $57.09 $63.21 $52.40 $1.55 $3.55 $70.92 $16.80 $60.56 $73.30 $72.91 $64.01 $52.33 $59.28 $39.00 $39.66 $38.12 $36.84 $1.36 $1.36 $1.59 $1.29 $30.85 $56.45 $53.32 $36.80 $17.58 $42.09 $5.89 $36.83 $8.80 $9.01 $9.24 $7.74 $14.32 $1.03 $2.17 $7.54 $4.66 $3.94 $15.98 $4.77 $10.18 $6.16 $15.87 $4.79 $4.84 $3.72 $6.62 $0.82 $0.83 $0.88 $0.85 $2.75 $12.58 $6.05 $6.59 $4.74 $6.13 Page 6 of 19 Subject to change. . FOR INSTITUTIONAL OR REGISTERED REPRESENTATIVE USE ONLY. NOT FOR PUBLIC USE OR VIEWING. WisdomTree ETFs FUND CHARACTERISTICS REPORT [as of December 31, 2015] Asset Allocation Group Emerging Markets China Alternative Real Estate Themes Fund WisdomTree Emerging Markets High Dividend Fund WisdomTree Emerging Markets Quality Dividend Growth Fund WisdomTree Emerging Markets SmallCap Dividend Fund WisdomTree Emerging Markets ex-State-Owned Enterprises Fund Vanguard FTSE Emerging Markets ETF iShares MSCI Emerging Markets ETF WisdomTree Emerging Markets Consumer Growth Fund EGShares Emerging Markets Consumer ETF WisdomTree Korea Hedged Equity Fund iShares MSCI South Korea Capped ETF WisdomTree India Earnings Fund WisdomTree Middle East Dividend Fund WisdomTree China ex-State-Owned Enterprises Fund iShares MSCI China ETF iShares China Large-Cap ETF WisdomTree Global ex-US Real Estate Fund WisdomTree Global ex-U.S. Hedged Real Estate Fund SPDR Dow Jones International Real Estate ETF iShares International Developed Property ETF WisdomTree Commodity Country Equity Fund WisdomTree Global Natural Resources Fund SPDR S&P Global Natural Resources ETF WisdomTree Global ex-US Utilities Sector Fund SPDR S&P International Utilities Sector ETF % Weight of % Weight of ETF % Weight of ETF ETF IOPV with IOPV with Market IOPV with Market Market Cap Cap Less than $2 Cap $2-$10 Greater than Billion Billion $10 Billion 48.40% 35.57% 16.03% 42.97% 35.48% 21.55% 1.07% 15.98% 82.95% 60.37% 37.20% 2.43% 58.50% 34.90% 6.60% 64.45% 33.05% 2.51% 48.56% 32.97% 18.47% 74.58% 25.42% 0.00% 41.24% 48.84% 9.92% 65.38% 31.50% 3.12% 60.97% 26.52% 12.51% 31.85% 58.04% 10.11% 63.05% 35.43% 1.52% 78.31% 21.69% 0.00% 100.00% 0.00% 0.00% 38.87% 46.62% 14.51% 39.91% 45.69% 14.41% 40.79% 45.20% 14.01% 37.78% 40.48% 21.74% 63.25% 28.42% 8.34% 65.85% 32.98% 1.17% 76.11% 23.89% 0.00% 37.96% 50.32% 11.72% 68.22% 27.45% 4.32% # of Stocks Average Mktcap in Billions Weighted Average Mktcap in Billions Median Mktcap in Billions 319 250 593 426 1061 805 207 30 45 106 229 68 65 159 49 176 179 129 384 158 93 90 97 126 $6.85 $5.05 $1.30 $9.99 $9.02 $11.19 $6.91 $17.16 $9.03 $8.06 $4.60 $4.62 $16.04 $24.14 $57.19 $5.09 $5.32 $4.03 $2.51 $14.81 $27.90 $30.00 $9.17 $6.68 $27.45 $21.64 $1.60 $43.24 $42.05 $47.86 $25.45 $23.86 $22.31 $42.13 $22.01 $8.95 $55.28 $100.77 $115.00 $10.39 $10.64 $10.36 $10.04 $24.68 $37.38 $53.30 $11.29 $21.56 $1.53 $1.63 $0.85 $5.48 $3.71 $5.56 $2.11 $12.39 $3.50 $4.11 $1.54 $2.81 $5.31 $8.27 $29.36 $2.75 $2.75 $2.39 $1.16 $7.48 $12.58 $12.93 $6.15 $2.89 Page 7 of 19 Subject to change. . FOR INSTITUTIONAL OR REGISTERED REPRESENTATIVE USE ONLY. NOT FOR PUBLIC USE OR VIEWING. WisdomTree ETFs FUND CHARACTERISTICS REPORT [as of December 31, 2015] ETF SECTOR CHARACTERISTICS (% WEIGHT) Asset Allocation Group Broad US Market Fund Consumer Consumer Discretionary Staples WisdomTree Total Dividend Fund 9.59% WisdomTree Total Earnings Fund 12.62% iShares Russell 3000 ETF 13.47% Vanguard Total Stock Market ETF 13.33% WisdomTree LargeCap Dividend Fund 8.69% Large Cap WisdomTree Earnings 500 Fund 11.77% US iShares Russell 1000 ETF 13.50% iShares Core S&P 500 ETF 12.89% US Local Econo WisdomTree Strong Dollar U.S. Equity Fund 19.38% Exporters WisdomTree Weak Dollar U.S. Equity Fund 11.99% WisdomTree LargeCap Value Fund 21.34% iShares S&P 500 Value ETF 7.42% Large Cap iShares S&P 500 Growth ETF 18.11% US iShares Russell 1000 Value ETF 5.20% Growth/Value iShares Russell 1000 Growth ETF 21.22% iShares Core U.S.
Value ETF 5.60% iShares Core U.S. Growth ETF 19.32% WisdomTree Dynamic Long/Short U.S. Equity Fund* 15.21% Alternative SPDR S&P 500 ETF 12.88% WisdomTree High Dividend Fund 7.42% Equity Income/ WisdomTree Dividend ex-Financials Fund 13.97% Dividend GrowthiShares Select Dividend ETF 11.47% WisdomTree U.S.
Quality Dividend Growth Fund 19.87% Vanguard Dividend Appreciation Fund 9.72% SPDR S&P Dividend ETF 6.86% WisdomTree Midcap Dividend Fund 18.43% WisdomTree Midcap Earnings Fund 18.29% Vanguard Mid-Cap ETF 19.09% Mid Cap iShares Russell Mid-Cap ETF 16.34% US iShares Core S&P Mid-Cap ETF 13.01% iShares Russell Mid-Cap Value ETF 8.31% iShares Russell Mid-Cap Growth ETF 24.28% iShares S&P Mid-Cap 400 Value ETF 12.18% iShares S&P Mid-Cap 400 Growth ETF 13.80% WisdomTree SmallCap Dividend Fund 17.91% WisdomTree SmallCap Earnings Fund 17.54% WisdomTree U.S. SmallCap Quality Dividend Growth Fund 24.90% Small Cap iShares Russell 2000 ETF 13.54% US iShares Russell 2000 Value ETF 10.33% iShares Russell 2000 Growth ETF 16.62% iShares Core S&P Small-Cap ETF 13.95% iShares S&P SmallCap 600 Value ETF 15.56% iShares S&P SmallCap 600 Growth ETF 12.51% Vanguard Small-Cap ETF 14.01% Vanguard Small-Cap Value ETF 12.13% Vanguard Small-Cap Growth ETF 16.21% *WisdomTree Dynamic Long/Short U.S. Equity Fund - all information is for the Long portion only. 12.91% 9.21% 8.80% 8.87% 14.77% 9.99% 9.22% 10.06% 9.54% 7.79% 16.42% 10.39% 9.77% 6.99% 11.29% 6.71% 11.07% 8.46% 10.34% 17.68% 10.95% 12.49% 17.99% 26.98% 13.12% 3.87% 4.05% 5.80% 6.24% 3.28% 4.01% 8.45% 2.55% 3.97% 5.33% 3.91% 8.33% 3.47% 3.35% 3.55% 2.89% 3.22% 2.60% 3.48% 3.76% 3.15% The sector percentages represent the GICS (Global Industry Classification Standard) groupings. Subject to change. Energy Financials Health Care Industrials Information Technology Materials Telecom. Services Utilities Other 9.77% 5.03% 5.84% 6.05% 10.80% 5.11% 6.20% 6.50% 0.24% 4.78% 8.09% 11.81% 1.31% 12.28% 0.53% 11.67% 2.58% 6.56% 6.45% 15.48% 13.80% 9.85% 1.10% 1.05% 3.68% 5.43% 5.16% 4.85% 4.38% 3.02% 8.11% 0.69% 6.20% 0.00% 5.10% 5.78% 1.48% 2.71% 4.44% 1.05% 2.56% 3.77% 1.47% 3.22% 3.85% 2.47% 20.21% 23.60% 18.12% 18.05% 15.91% 23.11% 17.47% 16.47% 25.47% 7.70% 15.17% 25.82% 7.59% 30.27% 5.55% 31.24% 5.96% 17.59% 16.39% 15.07% 0.00% 10.66% 3.73% 6.35% 24.39% 24.89% 24.70% 19.29% 23.28% 27.22% 34.57% 12.09% 27.12% 27.30% 24.99% 25.15% 10.27% 24.98% 42.90% 7.73% 23.34% 22.00% 24.53% 25.64% 30.53% 19.91% 9.81% 10.55% 14.77% 14.60% 11.31% 11.27% 14.65% 15.15% 9.32% 19.51% 11.70% 12.27% 17.93% 11.96% 17.14% 11.39% 14.46% 12.62% 15.26% 7.17% 8.64% 4.29% 15.00% 12.45% 7.44% 2.02% 5.77% 10.22% 9.96% 9.99% 6.26% 13.62% 4.06% 15.61% 3.94% 8.89% 2.82% 16.59% 4.54% 28.18% 13.40% 5.70% 20.31% 12.43% 7.20% 18.61% 10.34% 12.16% 10.66% 10.69% 10.13% 10.95% 10.56% 10.05% 10.56% 13.80% 14.17% 11.02% 9.11% 10.39% 10.71% 10.49% 11.61% 11.58% 10.00% 7.47% 10.34% 9.29% 19.56% 20.22% 15.10% 13.81% 18.13% 12.73% 12.67% 15.07% 9.75% 15.55% 16.90% 13.34% 16.35% 20.09% 24.96% 12.30% 11.87% 12.71% 17.27% 19.67% 15.12% 14.23% 15.90% 12.25% 13.20% 18.63% 19.99% 19.86% 14.62% 19.59% 20.05% 20.70% 5.99% 25.46% 6.80% 8.12% 32.71% 11.53% 28.00% 11.48% 28.72% 19.17% 20.39% 7.39% 10.84% 1.50% 19.74% 14.52% 2.44% 7.83% 12.48% 16.04% 14.84% 16.56% 9.69% 19.94% 12.89% 20.04% 7.22% 11.21% 9.57% 18.19% 10.90% 25.22% 16.99% 15.81% 18.05% 17.13% 11.59% 23.65% 3.11% 2.83% 3.08% 3.16% 2.50% 2.66% 3.04% 2.76% 0.00% 8.80% 3.61% 3.23% 2.32% 2.64% 3.43% 2.69% 4.13% 4.36% 2.70% 2.10% 9.23% 3.97% 3.02% 6.29% 11.46% 7.76% 4.60% 5.98% 5.25% 6.54% 5.62% 4.88% 8.68% 4.51% 6.92% 4.04% 12.09% 3.61% 3.22% 3.99% 4.46% 6.33% 2.78% 4.65% 6.81% 2.07% 5.21% 2.06% 2.18% 2.17% 5.97% 2.31% 2.29% 2.43% 4.69% 0.00% 0.30% 4.05% 0.89% 2.54% 2.06% 2.41% 2.01% 2.21% 2.49% 10.00% 5.98% 2.13% 0.00% 0.10% 3.05% 1.33% 0.26% 1.16% 0.99% 0.17% 1.58% 0.40% 0.35% 0.00% 2.08% 0.95% 1.42% 0.85% 0.90% 0.82% 0.92% 0.90% 0.92% 0.37% 0.47% 0.26% 5.86% 3.30% 3.08% 3.20% 4.95% 3.14% 3.02% 2.99% 14.83% 0.17% 2.35% 5.86% 0.26% 6.21% 0.05% 6.31% 0.14% 2.24% 3.11% 10.21% 15.41% 34.36% 0.00% 2.32% 11.54% 14.53% 6.21% 4.82% 6.05% 5.14% 12.08% 0.10% 9.06% 1.43% 9.43% 2.26% 4.16% 3.76% 7.55% 0.12% 4.22% 7.04% 1.70% 4.63% 7.75% 0.96% 0.00% 0.00% 0.03% 0.03% 0.35% 0.10% 0.00% 0.00% 0.00% 0.00% 0.06% 0.00% 0.00% 0.00% 0.00% 0.00% 0.00% 0.00% 0.00% 0.02% 0.83% 0.00% 0.00% 0.00% 0.91% 0.12% 0.34% 0.00% 0.00% 0.00% 0.00% 0.00% 0.00% 0.00% 0.73% 0.18% 0.00% 0.00% 0.00% 0.00% 0.00% 0.00% 0.00% 0.22% 0.02% 0.46% Page 8 of 19 .
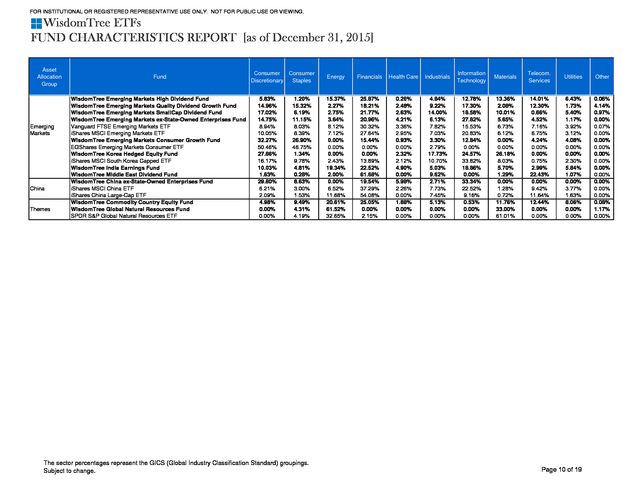
FOR INSTITUTIONAL OR REGISTERED REPRESENTATIVE USE ONLY. NOT FOR PUBLIC USE OR VIEWING. WisdomTree ETFs FUND CHARACTERISTICS REPORT [as of December 31, 2015] Asset Allocation Group Fund WisdomTree Global High Dividend Fund iShares MSCI ACWI ETF WisdomTree Global SmallCap Dividend Fund WisdomTree Global Hedged SmallCap Dividend Fund WisdomTree Global ex-U.S. Quality Dividend Growth Fund Global ex-U.S. WisdomTree Global ex-U.S.
Hedged Dividend Fund Vanguard FTSE All-World ex-US ETF iShares MSCI ACWI ex-U.S. ETF WisdomTree International Equity Fund WisdomTree International Hedged Equity Fund Intl WisdomTree International Hedged Quality Dividend Growth Fund iShares MSCI EAFE ETF WisdomTree International LargeCap Dividend Fund Intl Cap WisdomTree International Midcap Dividend Fund Segments WisdomTree International SmallCap Dividend Fund WisdomTree International Hedged SmallCap Dividend Fund iShares MSCI EAFE Small-Cap ETF WisdomTree International High Dividend Fund Intl WisdomTree International Dividend ex-Financials Fund Value iShares International Select Dividend ETF iShares MSCI EAFE Growth ETF iShares MSCI EAFE Value ETF WisdomTree Europe Hedged Equity Fund iShares MSCI EMU ETF WisdomTree Europe SmallCap Dividend Fund WisdomTree Europe Hedged SmallCap Equity Fund WisdomTree Europe Quality Dividend Growth Fund WisdomTree Europe Local Recovery Fund Europe Vanguard FTSE Europe ETF iShares Europe ETF WisdomTree United Kingdom Hedged Equity Fund iShares MSCI United Kingdom ETF WisdomTree Germany Hedged Equity Fund iShares MSCI Germany ETF WisdomTree Japan Quality Dividend Growth Fund WisdomTree Japan Hedged Quality Dividend Growth Fund WisdomTree Japan Hedged Equity Fund iShares MSCI Japan ETF WisdomTree Japan Hedged SmallCap Equity Fund Japan WisdomTree Japan SmallCap Dividend Fund & iShares MSCI Japan Small-Cap ETF Asia SPDR Russell Nomura Small Cap Japan ETF Vanguard FTSE Pacific ETF WisdomTree Asia Pacific ex-Japan Fund iShares MSCI All Country Asia ex-Japan ETF iShares MSCI Pacific ex-Japan ETF WisdomTree Australia Dividend Fund iShares MSCI Australia ETF Global Consumer Consumer Discretionary Staples 7.23% 12.98% 15.49% 15.49% 20.42% 11.91% 11.75% 11.91% 11.69% 11.93% 19.37% 13.09% 9.53% 15.26% 19.31% 19.31% 17.20% 6.60% 8.84% 7.09% 16.39% 9.76% 19.11% 14.83% 16.17% 14.26% 19.63% 21.19% 12.20% 11.21% 5.23% 10.91% 22.55% 21.15% 24.83% 24.47% 25.23% 21.92% 23.78% 24.06% 18.41% 20.98% 16.65% 4.50% 8.59% 4.40% 14.55% 2.40% 9.94% 10.30% 5.01% 5.01% 14.46% 10.57% 10.54% 10.98% 12.02% 11.42% 21.14% 11.95% 13.72% 7.73% 8.12% 8.12% 6.89% 11.45% 11.55% 6.36% 19.64% 3.83% 20.52% 11.41% 6.81% 7.09% 20.92% 0.00% 13.46% 15.12% 24.46% 18.80% 4.16% 4.00% 10.85% 11.10% 8.89% 7.23% 10.28% 9.61% 11.45% 10.18% 7.33% 6.51% 5.56% 5.32% 9.50% 7.70% The sector percentages represent the GICS (Global Industry Classification Standard) groupings. Subject to change. Energy Financials Health Care Industrials Information Technology Materials Telecom. Services Utilities Other 13.92% 6.21% 3.86% 3.86% 5.38% 8.29% 5.53% 6.11% 8.37% 7.90% 0.12% 4.68% 10.10% 3.11% 3.29% 3.29% 2.25% 11.38% 12.69% 13.43% 0.80% 8.62% 1.39% 4.75% 3.36% 2.57% 0.13% 5.24% 5.83% 6.62% 15.48% 12.30% 0.00% 0.00% 0.00% 0.00% 0.41% 0.89% 1.05% 0.80% 0.65% 1.07% 1.47% 7.64% 4.10% 2.88% 8.95% 4.75% 24.39% 20.98% 26.30% 26.30% 13.08% 24.37% 27.14% 26.91% 24.29% 24.14% 5.77% 25.98% 24.13% 23.48% 18.49% 18.49% 22.29% 24.85% 0.00% 25.62% 14.76% 37.34% 10.13% 23.01% 19.50% 21.83% 3.34% 33.22% 23.13% 22.32% 14.79% 23.75% 17.53% 18.46% 4.81% 5.21% 11.38% 19.33% 11.07% 11.46% 18.66% 12.83% 25.66% 25.45% 32.34% 56.63% 23.56% 55.12% 7.95% 12.83% 3.64% 3.64% 10.58% 9.33% 9.67% 9.85% 9.40% 9.28% 15.14% 12.16% 11.55% 4.10% 4.98% 4.98% 7.79% 8.59% 9.53% 4.04% 15.85% 8.06% 10.86% 8.55% 4.01% 5.87% 19.85% 0.00% 13.50% 14.87% 11.74% 10.09% 9.76% 15.00% 6.61% 6.75% 9.71% 8.26% 5.29% 4.99% 5.52% 6.23% 6.60% 1.08% 2.72% 4.11% 7.23% 6.51% 7.02% 10.54% 19.83% 19.83% 9.62% 9.41% 11.23% 11.01% 11.13% 11.78% 16.25% 12.10% 7.66% 21.82% 24.54% 24.54% 22.93% 9.98% 12.36% 9.85% 13.50% 11.13% 19.11% 13.27% 26.91% 24.15% 19.01% 24.68% 12.55% 10.81% 6.48% 6.73% 16.87% 11.93% 22.49% 22.20% 22.28% 18.73% 23.37% 23.84% 23.60% 26.19% 16.85% 6.84% 8.77% 9.32% 12.71% 6.00% 5.73% 14.86% 7.70% 7.70% 14.14% 5.68% 8.44% 8.09% 2.80% 3.47% 7.63% 4.94% 2.53% 4.46% 9.11% 9.11% 9.66% 1.32% 6.85% 3.72% 7.42% 2.61% 6.65% 6.45% 12.05% 5.31% 8.52% 6.89% 4.43% 3.81% 1.37% 1.51% 6.34% 9.06% 12.33% 12.48% 12.84% 10.23% 11.57% 12.11% 10.84% 12.43% 9.45% 12.76% 23.22% 0.42% 2.89% 0.47% 4.57% 4.35% 9.23% 9.23% 3.82% 5.21% 6.62% 6.46% 5.49% 5.99% 3.29% 6.37% 4.63% 8.90% 7.68% 7.68% 7.82% 5.23% 8.87% 7.94% 6.32% 6.54% 7.32% 7.38% 7.68% 8.77% 6.33% 8.78% 6.54% 6.34% 7.10% 5.06% 12.66% 12.63% 7.12% 6.70% 8.43% 5.52% 13.17% 12.89% 10.31% 9.60% 9.40% 8.19% 4.28% 7.63% 14.10% 12.16% 10.55% 3.86% 1.95% 1.95% 2.81% 9.07% 5.42% 5.23% 8.99% 8.44% 9.75% 5.07% 10.67% 4.11% 1.28% 1.28% 1.53% 12.13% 13.93% 10.90% 4.26% 5.80% 4.75% 5.27% 0.63% 4.59% 2.20% 0.00% 4.51% 4.97% 8.03% 6.36% 6.59% 5.49% 10.97% 11.09% 0.84% 5.37% 0.00% 0.00% 0.05% 0.06% 3.56% 18.40% 6.25% 3.71% 4.31% 2.32% 8.70% 3.08% 6.89% 6.89% 2.77% 4.61% 3.67% 3.45% 5.81% 5.64% 1.54% 3.65% 5.50% 7.02% 3.20% 3.20% 1.60% 8.47% 15.02% 11.05% 1.07% 6.30% 0.17% 5.08% 2.88% 5.56% 0.08% 0.00% 3.78% 3.93% 5.31% 4.49% 3.56% 2.28% 0.00% 0.00% 0.00% 2.50% 0.42% 0.24% 0.51% 0.43% 3.02% 5.07% 4.15% 5.58% 2.20% 2.57% 0.00% 0.00% 0.12% 0.12% 2.94% 1.54% 0.00% 0.00% 0.01% 0.00% 0.00% 0.00% 0.00% 0.00% 0.00% 0.00% 0.03% 0.00% 0.36% 0.00% 0.00% 0.00% 0.00% 0.00% 0.00% 0.00% 0.00% 0.00% 0.06% 0.00% 0.00% 0.00% 0.00% 0.00% 0.00% 0.00% 0.00% 0.00% 0.00% 0.00% 0.00% 0.00% 0.00% 3.56% 0.00% 0.00% 0.00% 0.00% Page 9 of 19 . FOR INSTITUTIONAL OR REGISTERED REPRESENTATIVE USE ONLY. NOT FOR PUBLIC USE OR VIEWING. WisdomTree ETFs FUND CHARACTERISTICS REPORT [as of December 31, 2015] Asset Allocation Group Emerging Markets China Themes Fund WisdomTree Emerging Markets High Dividend Fund WisdomTree Emerging Markets Quality Dividend Growth Fund WisdomTree Emerging Markets SmallCap Dividend Fund WisdomTree Emerging Markets ex-State-Owned Enterprises Fund Vanguard FTSE Emerging Markets ETF iShares MSCI Emerging Markets ETF WisdomTree Emerging Markets Consumer Growth Fund EGShares Emerging Markets Consumer ETF WisdomTree Korea Hedged Equity Fund iShares MSCI South Korea Capped ETF WisdomTree India Earnings Fund WisdomTree Middle East Dividend Fund WisdomTree China ex-State-Owned Enterprises Fund iShares MSCI China ETF iShares China Large-Cap ETF WisdomTree Commodity Country Equity Fund WisdomTree Global Natural Resources Fund SPDR S&P Global Natural Resources ETF Consumer Consumer Discretionary Staples 5.83% 14.96% 17.02% 14.75% 8.94% 10.05% 32.27% 50.46% 27.86% 16.17% 10.03% 1.63% 29.80% 6.21% 2.09% 4.98% 0.00% 0.00% 1.20% 15.32% 6.19% 11.15% 8.03% 8.39% 26.90% 46.75% 1.34% 9.78% 4.81% 0.28% 8.63% 3.00% 1.53% 9.49% 4.31% 4.19% The sector percentages represent the GICS (Global Industry Classification Standard) groupings. Subject to change. Energy Financials Health Care Industrials Information Technology Materials Telecom. Services Utilities Other 15.37% 2.27% 2.75% 3.64% 8.12% 7.12% 0.00% 0.00% 0.00% 2.43% 19.34% 2.00% 0.00% 6.52% 11.68% 20.61% 61.52% 32.65% 25.87% 18.21% 21.77% 20.96% 30.32% 27.64% 15.44% 0.00% 0.00% 13.89% 22.52% 61.68% 19.54% 37.29% 54.08% 25.05% 0.00% 2.15% 0.26% 2.48% 2.63% 4.21% 3.36% 2.95% 0.93% 0.00% 2.32% 2.12% 4.90% 0.00% 5.98% 2.26% 0.00% 1.88% 0.00% 0.00% 4.84% 9.22% 14.00% 6.13% 7.82% 7.03% 3.30% 2.79% 17.73% 10.70% 5.03% 9.62% 2.71% 7.73% 7.45% 5.13% 0.00% 0.00% 12.78% 17.30% 18.58% 27.82% 15.53% 20.83% 12.84% 0.00% 24.57% 33.82% 18.86% 0.00% 33.34% 22.52% 9.16% 0.53% 0.00% 0.00% 13.36% 2.08% 10.01% 5.65% 6.73% 6.12% 0.00% 0.00% 26.18% 8.03% 5.70% 1.29% 0.00% 1.28% 0.72% 11.76% 33.00% 61.01% 14.01% 12.30% 0.66% 4.52% 7.16% 6.75% 4.24% 0.00% 0.00% 0.75% 2.99% 22.43% 0.00% 9.42% 11.64% 12.44% 0.00% 0.00% 6.43% 1.73% 5.40% 1.17% 3.92% 3.12% 4.08% 0.00% 0.00% 2.30% 5.84% 1.07% 0.00% 3.77% 1.63% 8.06% 0.00% 0.00% 0.06% 4.14% 0.97% 0.00% 0.07% 0.00% 0.00% 0.00% 0.00% 0.00% 0.00% 0.00% 0.00% 0.00% 0.00% 0.08% 1.17% 0.00% Page 10 of 19 . FOR INSTITUTIONAL OR REGISTERED REPRESENTATIVE USE ONLY. NOT FOR PUBLIC USE OR VIEWING. WisdomTree ETFs FUND CHARACTERISTICS REPORT [as of December 31, 2015] ETF REIT CHARACTERISTICS (% WEIGHT) Asset Allocation Group Broad US Market Fund WisdomTree Total Dividend Fund WisdomTree Total Earnings Fund iShares Russell 3000 ETF Vanguard Total Stock Market ETF WisdomTree LargeCap Dividend Fund Large Cap WisdomTree Earnings 500 Fund US iShares Russell 1000 ETF iShares Core S&P 500 ETF US Local Economy WisdomTree Strong Dollar U.S. Equity Fund Exporters WisdomTree Weak Dollar U.S. Equity Fund WisdomTree LargeCap Value Fund iShares S&P 500 Value ETF Large Cap iShares S&P 500 Growth ETF US iShares Russell 1000 Value ETF Growth/Value iShares Russell 1000 Growth ETF iShares Core U.S.
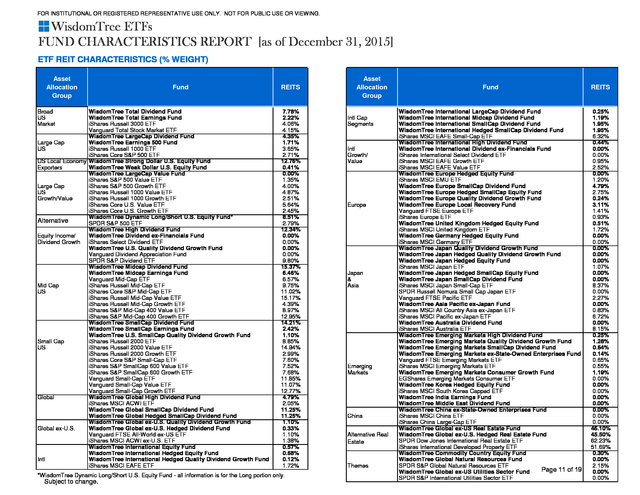
Value ETF iShares Core U.S. Growth ETF WisdomTree Dynamic Long/Short U.S. Equity Fund* Alternative SPDR S&P 500 ETF WisdomTree High Dividend Fund Equity Income/ WisdomTree Dividend ex-Financials Fund Dividend Growth iShares Select Dividend ETF WisdomTree U.S.
Quality Dividend Growth Fund Vanguard Dividend Appreciation Fund SPDR S&P Dividend ETF WisdomTree Midcap Dividend Fund WisdomTree Midcap Earnings Fund Vanguard Mid-Cap ETF Mid Cap iShares Russell Mid-Cap ETF US iShares Core S&P Mid-Cap ETF iShares Russell Mid-Cap Value ETF iShares Russell Mid-Cap Growth ETF iShares S&P Mid-Cap 400 Value ETF iShares S&P Mid-Cap 400 Growth ETF WisdomTree SmallCap Dividend Fund WisdomTree SmallCap Earnings Fund WisdomTree U.S. SmallCap Quality Dividend Growth Fund Small Cap iShares Russell 2000 ETF US iShares Russell 2000 Value ETF iShares Russell 2000 Growth ETF iShares Core S&P Small-Cap ETF iShares S&P SmallCap 600 Value ETF iShares S&P SmallCap 600 Growth ETF Vanguard Small-Cap ETF Vanguard Small-Cap Value ETF Vanguard Small-Cap Growth ETF Global WisdomTree Global High Dividend Fund iShares MSCI ACWI ETF WisdomTree Global SmallCap Dividend Fund WisdomTree Global Hedged SmallCap Dividend Fund WisdomTree Global ex-U.S. Quality Dividend Growth Fund Global ex-U.S. WisdomTree Global ex-U.S.
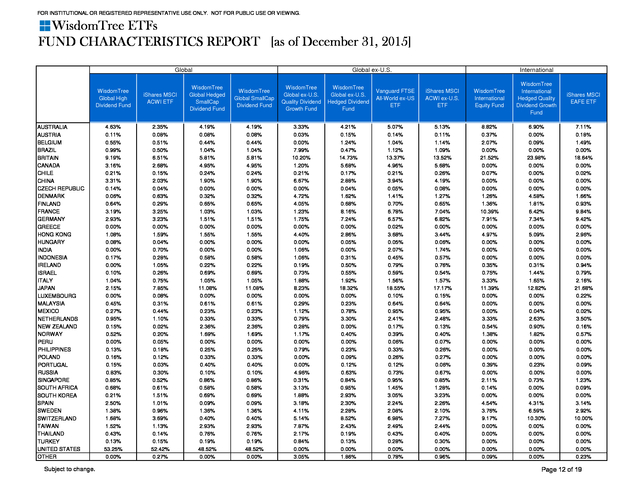
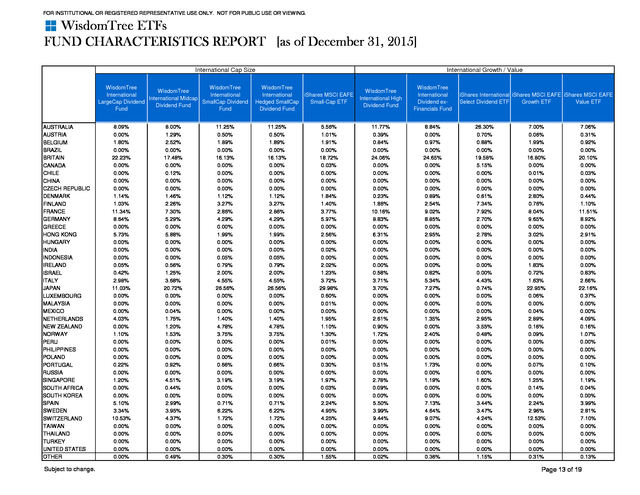
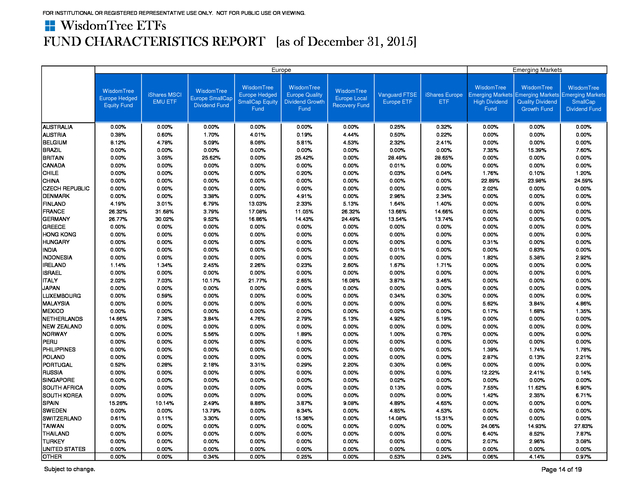
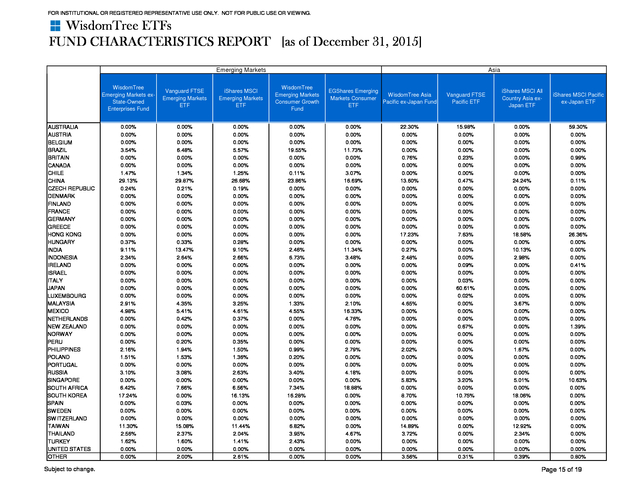
Hedged Dividend Fund Vanguard FTSE All-World ex-US ETF iShares MSCI ACWI ex-U.S. ETF WisdomTree International Equity Fund WisdomTree International Hedged Equity Fund Intl WisdomTree International Hedged Quality Dividend Growth Fund iShares MSCI EAFE ETF REITS 7.78% 2.22% 4.06% 4.15% 4.35% 1.71% 3.65% 2.71% 12.76% 0.41% 0.00% 1.35% 4.00% 4.87% 2.51% 5.64% 2.45% 8.51% 2.79% 12.34% 0.00% 0.00% 0.00% 0.00% 9.80% 15.37% 6.46% 6.57% 9.75% 11.02% 15.17% 4.39% 8.97% 12.95% 14.21% 2.42% 1.10% 8.85% 14.94% 2.99% 7.60% 7.52% 7.68% 11.85% 11.07% 12.77% 4.79% 2.05% 11.25% 11.25% 1.10% 0.33% 1.10% 1.38% 0.57% 0.68% 0.12% 1.72% *WisdomTree Dynamic Long/Short U.S. Equity Fund - all information is for the Long portion only. Subject to change. Asset Allocation Group Intl Cap Segments Intl Growth/ Value Europe Japan & Asia Emerging Markets China Alternative Real Estate Themes Fund REITS WisdomTree International LargeCap Dividend Fund WisdomTree International Midcap Dividend Fund WisdomTree International SmallCap Dividend Fund WisdomTree International Hedged SmallCap Dividend Fund iShares MSCI EAFE Small-Cap ETF WisdomTree International High Dividend Fund WisdomTree International Dividend ex-Financials Fund iShares International Select Dividend ETF iShares MSCI EAFE Growth ETF iShares MSCI EAFE Value ETF WisdomTree Europe Hedged Equity Fund iShares MSCI EMU ETF WisdomTree Europe SmallCap Dividend Fund WisdomTree Europe Hedged SmallCap Equity Fund WisdomTree Europe Quality Dividend Growth Fund WisdomTree Europe Local Recovery Fund Vanguard FTSE Europe ETF iShares Europe ETF WisdomTree United Kingdom Hedged Equity Fund iShares MSCI United Kingdom ETF WisdomTree Germany Hedged Equity Fund iShares MSCI Germany ETF WisdomTree Japan Quality Dividend Growth Fund WisdomTree Japan Hedged Quality Dividend Growth Fund WisdomTree Japan Hedged Equity Fund iShares MSCI Japan ETF WisdomTree Japan Hedged SmallCap Equity Fund WisdomTree Japan SmallCap Dividend Fund iShares MSCI Japan Small-Cap ETF SPDR Russell Nomura Small Cap Japan ETF Vanguard FTSE Pacific ETF WisdomTree Asia Pacific ex-Japan Fund iShares MSCI All Country Asia ex-Japan ETF iShares MSCI Pacific ex-Japan ETF WisdomTree Australia Dividend Fund iShares MSCI Australia ETF WisdomTree Emerging Markets High Dividend Fund WisdomTree Emerging Markets Quality Dividend Growth Fund WisdomTree Emerging Markets SmallCap Dividend Fund WisdomTree Emerging Markets ex-State-Owned Enterprises Fund Vanguard FTSE Emerging Markets ETF iShares MSCI Emerging Markets ETF WisdomTree Emerging Markets Consumer Growth Fund EGShares Emerging Markets Consumer ETF WisdomTree Korea Hedged Equity Fund iShares MSCI South Korea Capped ETF WisdomTree India Earnings Fund WisdomTree Middle East Dividend Fund WisdomTree China ex-State-Owned Enterprises Fund iShares MSCI China ETF iShares China Large-Cap ETF WisdomTree Global ex-US Real Estate Fund WisdomTree Global ex-U.S.
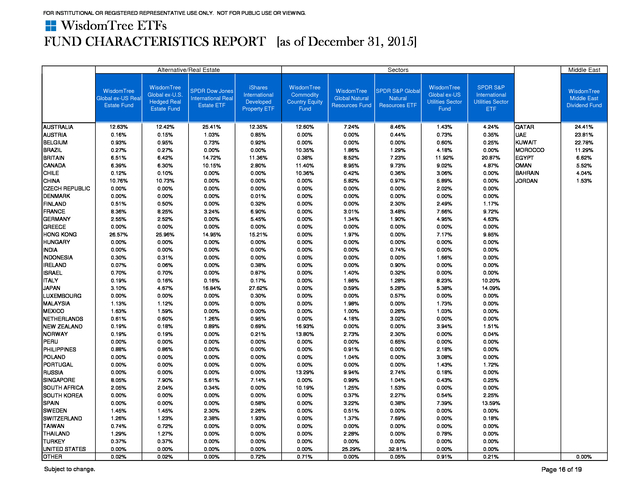
Hedged Real Estate Fund SPDR Dow Jones International Real Estate ETF iShares International Developed Property ETF WisdomTree Commodity Country Equity Fund WisdomTree Global Natural Resources Fund SPDR S&P Global Natural Resources ETF Page 11 of 19 WisdomTree Global ex-US Utilities Sector Fund SPDR S&P International Utilities Sector ETF 0.25% 1.19% 1.95% 1.95% 6.32% 0.44% 0.00% 0.00% 0.95% 2.52% 0.00% 1.20% 4.79% 2.75% 0.24% 3.11% 1.41% 0.93% 0.51% 1.72% 0.00% 0.00% 0.00% 0.00% 0.00% 1.07% 0.00% 0.00% 8.37% 0.00% 2.27% 0.00% 0.83% 6.72% 0.00% 8.15% 0.25% 1.28% 0.64% 0.14% 0.65% 0.55% 1.19% 0.00% 0.00% 0.00% 0.00% 0.00% 0.00% 0.00% 0.00% 46.10% 45.50% 62.23% 51.69% 0.30% 0.00% 2.15% 0.00% 0.00% . FOR INSTITUTIONAL OR REGISTERED REPRESENTATIVE USE ONLY. NOT FOR PUBLIC USE OR VIEWING. WisdomTree ETFs FUND CHARACTERISTICS REPORT [as of December 31, 2015] Global Global ex-U.S. International WisdomTree Global High Dividend Fund AUSTRALIA AUSTRIA BELGIUM BRAZIL BRITAIN CANADA CHILE CHINA CZECH REPUBLIC DENMARK FINLAND FRANCE GERMANY GREECE HONG KONG HUNGARY INDIA INDONESIA IRELAND ISRAEL ITALY JAPAN LUXEMBOURG MALAYSIA MEXICO NETHERLANDS NEW ZEALAND NORWAY PERU PHILIPPINES POLAND PORTUGAL RUSSIA SINGAPORE SOUTH AFRICA SOUTH KOREA SPAIN SWEDEN SWITZERLAND TAIWAN THAILAND TURKEY UNITED STATES OTHER Subject to change. iShares MSCI ACWI ETF WisdomTree Global Hedged SmallCap Dividend Fund WisdomTree Global SmallCap Dividend Fund WisdomTree Global ex-U.S. Quality Dividend Growth Fund WisdomTree Global ex-U.S. Hedged Dividend Fund Vanguard FTSE All-World ex-US ETF iShares MSCI ACWI ex-U.S. ETF WisdomTree International Equity Fund WisdomTree International Hedged Quality Dividend Growth Fund iShares MSCI EAFE ETF 4.63% 0.11% 0.55% 0.99% 9.19% 3.16% 0.21% 3.31% 0.14% 0.06% 0.64% 3.19% 2.93% 0.00% 1.08% 0.08% 0.00% 0.17% 0.00% 0.10% 1.04% 2.15% 0.00% 0.45% 0.27% 0.95% 0.15% 0.52% 0.00% 0.13% 0.16% 0.15% 0.83% 0.85% 0.68% 0.21% 2.50% 1.38% 1.68% 1.52% 0.43% 0.13% 53.25% 0.00% 2.35% 0.08% 0.51% 0.50% 6.51% 2.68% 0.15% 2.03% 0.04% 0.63% 0.29% 3.25% 3.23% 0.00% 1.59% 0.04% 0.70% 0.28% 1.05% 0.26% 0.75% 7.85% 0.08% 0.31% 0.44% 1.10% 0.02% 0.20% 0.05% 0.18% 0.12% 0.03% 0.30% 0.52% 0.61% 1.51% 1.01% 0.96% 3.69% 1.13% 0.14% 0.15% 52.42% 0.27% 4.19% 0.08% 0.44% 1.04% 5.81% 4.95% 0.24% 1.90% 0.00% 0.32% 0.65% 1.03% 1.51% 0.00% 1.55% 0.00% 0.00% 0.58% 0.22% 0.69% 1.05% 11.08% 0.00% 0.61% 0.23% 0.33% 2.36% 1.69% 0.00% 0.25% 0.33% 0.40% 0.10% 0.86% 0.58% 0.69% 0.09% 1.36% 0.40% 2.93% 0.76% 0.19% 48.52% 0.00% 4.19% 0.08% 0.44% 1.04% 5.81% 4.95% 0.24% 1.90% 0.00% 0.32% 0.65% 1.03% 1.51% 0.00% 1.55% 0.00% 0.00% 0.58% 0.22% 0.69% 1.05% 11.08% 0.00% 0.61% 0.23% 0.33% 2.36% 1.69% 0.00% 0.25% 0.33% 0.40% 0.10% 0.86% 0.58% 0.69% 0.09% 1.36% 0.40% 2.93% 0.76% 0.19% 48.52% 0.00% 3.33% 0.03% 0.00% 7.99% 10.20% 1.20% 0.21% 6.67% 0.00% 4.72% 4.05% 1.23% 1.75% 0.00% 4.40% 0.00% 1.06% 1.06% 0.19% 0.73% 1.88% 8.23% 0.00% 0.29% 1.12% 0.79% 0.28% 1.17% 0.00% 0.79% 0.00% 0.00% 4.96% 0.31% 3.13% 1.88% 3.18% 4.11% 5.14% 7.87% 2.17% 0.84% 0.00% 3.05% 4.21% 0.15% 1.24% 0.47% 14.73% 5.68% 0.17% 2.88% 0.04% 1.62% 0.68% 8.16% 7.24% 0.00% 2.86% 0.05% 0.00% 0.31% 0.50% 0.55% 1.92% 18.32% 0.00% 0.23% 0.78% 3.30% 0.00% 0.40% 0.00% 0.23% 0.09% 0.12% 0.63% 0.84% 0.95% 2.93% 2.30% 2.28% 8.52% 2.43% 0.19% 0.13% 0.00% 1.86% 5.07% 0.14% 1.04% 1.12% 13.37% 4.96% 0.21% 3.94% 0.05% 1.41% 0.70% 6.78% 6.57% 0.02% 3.68% 0.05% 2.07% 0.45% 0.79% 0.59% 1.56% 18.55% 0.10% 0.64% 0.95% 2.41% 0.17% 0.39% 0.06% 0.33% 0.26% 0.12% 0.73% 0.95% 1.45% 3.05% 2.24% 2.08% 6.98% 2.49% 0.43% 0.28% 0.00% 0.78% 5.13% 0.11% 1.14% 1.09% 13.52% 5.68% 0.26% 4.19% 0.08% 1.27% 0.65% 7.04% 6.82% 0.00% 3.44% 0.06% 1.74% 0.57% 0.76% 0.54% 1.57% 17.17% 0.15% 0.64% 0.95% 2.48% 0.13% 0.40% 0.07% 0.26% 0.27% 0.06% 0.67% 0.85% 1.28% 3.23% 2.26% 2.10% 7.27% 2.44% 0.40% 0.30% 0.00% 0.96% 8.82% 0.37% 2.07% 0.00% 21.52% 0.00% 0.07% 0.00% 0.00% 1.26% 1.36% 10.39% 7.91% 0.00% 4.97% 0.00% 0.00% 0.00% 0.35% 0.75% 3.33% 11.39% 0.00% 0.00% 0.00% 3.33% 0.54% 1.38% 0.00% 0.00% 0.00% 0.39% 0.00% 2.11% 0.14% 0.00% 4.54% 3.76% 9.17% 0.00% 0.00% 0.00% 0.00% 0.09% 6.90% 0.00% 0.09% 0.00% 23.98% 0.00% 0.00% 0.00% 0.00% 4.58% 1.81% 6.42% 7.34% 0.00% 5.09% 0.00% 0.00% 0.00% 0.31% 1.44% 1.65% 12.82% 0.00% 0.00% 0.04% 2.63% 0.90% 1.82% 0.00% 0.00% 0.00% 0.23% 0.00% 0.73% 0.00% 0.00% 4.31% 6.59% 10.30% 0.00% 0.00% 0.00% 0.00% 0.00% 7.11% 0.18% 1.49% 0.00% 18.64% 0.00% 0.02% 0.00% 0.00% 1.66% 0.93% 9.84% 9.42% 0.00% 2.96% 0.00% 0.00% 0.00% 0.94% 0.79% 2.16% 21.68% 0.22% 0.00% 0.02% 3.50% 0.16% 0.57% 0.00% 0.00% 0.00% 0.09% 0.00% 1.23% 0.09% 0.00% 3.14% 2.92% 10.00% 0.00% 0.00% 0.00% 0.00% 0.23% Page 12 of 19 . FOR INSTITUTIONAL OR REGISTERED REPRESENTATIVE USE ONLY. NOT FOR PUBLIC USE OR VIEWING. WisdomTree ETFs FUND CHARACTERISTICS REPORT [as of December 31, 2015] International Cap Size WisdomTree WisdomTree WisdomTree International International International Midcap LargeCap Dividend SmallCap Dividend Dividend Fund Fund Fund AUSTRALIA AUSTRIA BELGIUM BRAZIL BRITAIN CANADA CHILE CHINA CZECH REPUBLIC DENMARK FINLAND FRANCE GERMANY GREECE HONG KONG HUNGARY INDIA INDONESIA IRELAND ISRAEL ITALY JAPAN LUXEMBOURG MALAYSIA MEXICO NETHERLANDS NEW ZEALAND NORWAY PERU PHILIPPINES POLAND PORTUGAL RUSSIA SINGAPORE SOUTH AFRICA SOUTH KOREA SPAIN SWEDEN SWITZERLAND TAIWAN THAILAND TURKEY UNITED STATES OTHER Subject to change. 8.09% 0.00% 1.80% 0.00% 22.23% 0.00% 0.00% 0.00% 0.00% 1.14% 1.03% 11.34% 8.64% 0.00% 5.73% 0.00% 0.00% 0.00% 0.05% 0.42% 2.98% 11.03% 0.00% 0.00% 0.00% 4.03% 0.00% 1.10% 0.00% 0.00% 0.00% 0.22% 0.00% 1.20% 0.00% 0.00% 5.10% 3.34% 10.53% 0.00% 0.00% 0.00% 0.00% 0.00% 8.00% 1.29% 2.52% 0.00% 17.48% 0.00% 0.12% 0.00% 0.00% 1.46% 2.26% 7.30% 5.29% 0.00% 5.88% 0.00% 0.00% 0.00% 0.56% 1.25% 3.68% 20.72% 0.00% 0.00% 0.04% 1.75% 1.20% 1.53% 0.00% 0.00% 0.00% 0.92% 0.00% 4.51% 0.44% 0.00% 2.99% 3.95% 4.37% 0.00% 0.00% 0.00% 0.00% 0.49% 11.25% 0.50% 1.89% 0.00% 16.13% 0.00% 0.00% 0.00% 0.00% 1.12% 3.27% 2.86% 4.29% 0.00% 1.99% 0.00% 0.00% 0.05% 0.79% 2.00% 4.55% 26.56% 0.00% 0.00% 0.00% 1.40% 4.78% 3.75% 0.00% 0.00% 0.00% 0.66% 0.00% 3.19% 0.00% 0.00% 0.71% 6.22% 1.72% 0.00% 0.00% 0.00% 0.00% 0.30% International Growth / Value WisdomTree International Hedged SmallCap Dividend Fund iShares MSCI EAFE Small-Cap ETF WisdomTree International High Dividend Fund WisdomTree International Dividend exFinancials Fund 11.25% 0.50% 1.89% 0.00% 16.13% 0.00% 0.00% 0.00% 0.00% 1.12% 3.27% 2.86% 4.29% 0.00% 1.99% 0.00% 0.00% 0.05% 0.79% 2.00% 4.55% 26.56% 0.00% 0.00% 0.00% 1.40% 4.78% 3.75% 0.00% 0.00% 0.00% 0.66% 0.00% 3.19% 0.00% 0.00% 0.71% 6.22% 1.72% 0.00% 0.00% 0.00% 0.00% 0.30% 5.56% 1.01% 1.91% 0.00% 18.72% 0.03% 0.00% 0.00% 0.00% 1.84% 1.40% 3.77% 5.97% 0.00% 2.56% 0.00% 0.02% 0.00% 2.02% 1.23% 3.72% 29.98% 0.60% 0.01% 0.00% 1.95% 1.10% 1.30% 0.01% 0.00% 0.00% 0.30% 0.00% 1.97% 0.03% 0.00% 2.24% 4.95% 4.25% 0.00% 0.00% 0.00% 0.00% 1.55% 11.77% 0.39% 0.84% 0.00% 24.06% 0.00% 0.00% 0.00% 0.00% 0.23% 1.86% 10.16% 8.83% 0.00% 6.31% 0.00% 0.00% 0.00% 0.00% 0.58% 3.71% 3.70% 0.00% 0.00% 0.00% 2.61% 0.90% 1.72% 0.00% 0.00% 0.00% 0.51% 0.00% 2.78% 0.09% 0.00% 5.50% 3.99% 9.44% 0.00% 0.00% 0.00% 0.00% 0.02% 8.84% 0.00% 0.97% 0.00% 24.65% 0.00% 0.00% 0.00% 0.00% 0.89% 2.54% 9.02% 8.85% 0.00% 2.95% 0.00% 0.00% 0.00% 0.00% 0.82% 5.34% 7.27% 0.00% 0.00% 0.00% 1.35% 0.00% 2.40% 0.00% 0.00% 0.00% 1.73% 0.00% 1.19% 0.00% 0.00% 7.13% 4.64% 9.07% 0.00% 0.00% 0.00% 0.00% 0.36% iShares International iShares MSCI EAFE iShares MSCI EAFE Select Dividend ETF Growth ETF Value ETF 26.30% 0.70% 0.88% 0.00% 19.58% 5.15% 0.00% 0.00% 0.00% 0.61% 7.34% 7.92% 2.70% 0.00% 2.78% 0.00% 0.00% 0.00% 0.00% 0.00% 4.43% 0.74% 0.00% 0.00% 0.00% 2.95% 3.55% 0.48% 0.00% 0.00% 0.00% 0.00% 0.00% 1.60% 0.00% 0.00% 3.44% 3.47% 4.24% 0.00% 0.00% 0.00% 0.00% 1.15% 7.00% 0.06% 1.99% 0.00% 16.80% 0.00% 0.01% 0.00% 0.00% 2.80% 0.76% 8.04% 9.65% 0.00% 3.02% 0.00% 0.00% 0.00% 1.83% 0.72% 1.63% 22.95% 0.06% 0.00% 0.04% 2.89% 0.16% 0.09% 0.00% 0.00% 0.00% 0.07% 0.00% 1.25% 0.14% 0.00% 2.24% 2.96% 12.53% 0.00% 0.00% 0.00% 0.00% 0.31% 7.06% 0.31% 0.92% 0.00% 20.10% 0.00% 0.03% 0.00% 0.00% 0.44% 1.10% 11.51% 8.92% 0.00% 2.91% 0.00% 0.00% 0.00% 0.00% 0.83% 2.66% 22.16% 0.37% 0.00% 0.00% 4.09% 0.16% 1.07% 0.00% 0.00% 0.00% 0.10% 0.00% 1.19% 0.04% 0.00% 3.99% 2.81% 7.10% 0.00% 0.00% 0.00% 0.00% 0.13% Page 13 of 19 . FOR INSTITUTIONAL OR REGISTERED REPRESENTATIVE USE ONLY. NOT FOR PUBLIC USE OR VIEWING. WisdomTree ETFs FUND CHARACTERISTICS REPORT [as of December 31, 2015] Europe Emerging Markets WisdomTree Europe Hedged Equity Fund AUSTRALIA AUSTRIA BELGIUM BRAZIL BRITAIN CANADA CHILE CHINA CZECH REPUBLIC DENMARK FINLAND FRANCE GERMANY GREECE HONG KONG HUNGARY INDIA INDONESIA IRELAND ISRAEL ITALY JAPAN LUXEMBOURG MALAYSIA MEXICO NETHERLANDS NEW ZEALAND NORWAY PERU PHILIPPINES POLAND PORTUGAL RUSSIA SINGAPORE SOUTH AFRICA SOUTH KOREA SPAIN SWEDEN SWITZERLAND TAIWAN THAILAND TURKEY UNITED STATES OTHER Subject to change. iShares MSCI EMU ETF WisdomTree Europe SmallCap Dividend Fund WisdomTree Europe Hedged SmallCap Equity Fund WisdomTree Europe Quality Dividend Growth Fund WisdomTree Europe Local Recovery Fund Vanguard FTSE Europe ETF iShares Europe ETF 0.00% 0.38% 8.12% 0.00% 0.00% 0.00% 0.00% 0.00% 0.00% 0.00% 4.19% 26.32% 26.77% 0.00% 0.00% 0.00% 0.00% 0.00% 1.14% 0.00% 2.02% 0.00% 0.00% 0.00% 0.00% 14.66% 0.00% 0.00% 0.00% 0.00% 0.00% 0.52% 0.00% 0.00% 0.00% 0.00% 15.26% 0.00% 0.61% 0.00% 0.00% 0.00% 0.00% 0.00% 0.00% 0.60% 4.78% 0.00% 3.05% 0.00% 0.00% 0.00% 0.00% 0.00% 3.01% 31.68% 30.02% 0.00% 0.00% 0.00% 0.00% 0.00% 1.34% 0.00% 7.03% 0.00% 0.59% 0.00% 0.00% 7.38% 0.00% 0.00% 0.00% 0.00% 0.00% 0.28% 0.00% 0.00% 0.00% 0.00% 10.14% 0.00% 0.11% 0.00% 0.00% 0.00% 0.00% 0.00% 0.00% 1.70% 5.09% 0.00% 25.62% 0.00% 0.00% 0.00% 0.00% 3.38% 6.79% 3.79% 9.52% 0.00% 0.00% 0.00% 0.00% 0.00% 2.45% 0.00% 10.17% 0.00% 0.00% 0.00% 0.00% 3.84% 0.00% 5.56% 0.00% 0.00% 0.00% 2.18% 0.00% 0.00% 0.00% 0.00% 2.49% 13.79% 3.30% 0.00% 0.00% 0.00% 0.00% 0.34% 0.00% 4.01% 8.06% 0.00% 0.00% 0.00% 0.00% 0.00% 0.00% 0.00% 13.03% 17.08% 16.86% 0.00% 0.00% 0.00% 0.00% 0.00% 2.26% 0.00% 21.77% 0.00% 0.00% 0.00% 0.00% 4.76% 0.00% 0.00% 0.00% 0.00% 0.00% 3.31% 0.00% 0.00% 0.00% 0.00% 8.86% 0.00% 0.00% 0.00% 0.00% 0.00% 0.00% 0.00% 0.00% 0.19% 5.81% 0.00% 25.42% 0.00% 0.20% 0.00% 0.00% 4.91% 2.33% 11.05% 14.43% 0.00% 0.00% 0.00% 0.00% 0.00% 0.23% 0.00% 2.65% 0.00% 0.00% 0.00% 0.00% 2.79% 0.00% 1.89% 0.00% 0.00% 0.00% 0.29% 0.00% 0.00% 0.00% 0.00% 3.87% 8.34% 15.36% 0.00% 0.00% 0.00% 0.00% 0.25% 0.00% 4.44% 4.53% 0.00% 0.00% 0.00% 0.00% 0.00% 0.00% 0.00% 5.13% 26.32% 24.49% 0.00% 0.00% 0.00% 0.00% 0.00% 2.60% 0.00% 16.08% 0.00% 0.00% 0.00% 0.00% 5.13% 0.00% 0.00% 0.00% 0.00% 0.00% 2.20% 0.00% 0.00% 0.00% 0.00% 9.08% 0.00% 0.00% 0.00% 0.00% 0.00% 0.00% 0.00% 0.25% 0.50% 2.32% 0.00% 28.49% 0.01% 0.03% 0.00% 0.00% 2.96% 1.64% 13.66% 13.54% 0.00% 0.00% 0.00% 0.01% 0.00% 1.67% 0.00% 3.87% 0.00% 0.34% 0.00% 0.02% 4.92% 0.00% 1.00% 0.00% 0.00% 0.00% 0.30% 0.00% 0.02% 0.13% 0.00% 4.89% 4.85% 14.08% 0.00% 0.00% 0.00% 0.00% 0.53% 0.32% 0.22% 2.41% 0.00% 28.65% 0.00% 0.04% 0.00% 0.00% 2.34% 1.40% 14.66% 13.74% 0.00% 0.00% 0.00% 0.00% 0.00% 1.71% 0.00% 3.46% 0.00% 0.30% 0.00% 0.00% 5.19% 0.00% 0.76% 0.00% 0.00% 0.00% 0.06% 0.00% 0.00% 0.00% 0.00% 4.65% 4.53% 15.31% 0.00% 0.00% 0.00% 0.00% 0.24% WisdomTree WisdomTree WisdomTree Emerging Markets Emerging Markets Emerging Markets High Dividend Quality Dividend SmallCap Fund Growth Fund Dividend Fund 0.00% 0.00% 0.00% 7.35% 0.00% 0.00% 1.76% 22.89% 2.02% 0.00% 0.00% 0.00% 0.00% 0.00% 0.00% 0.31% 0.00% 1.82% 0.00% 0.00% 0.00% 0.00% 0.00% 5.62% 0.17% 0.00% 0.00% 0.00% 0.00% 1.39% 2.87% 0.00% 12.22% 0.00% 7.55% 1.42% 0.00% 0.00% 0.00% 24.06% 6.40% 2.07% 0.00% 0.06% 0.00% 0.00% 0.00% 15.39% 0.00% 0.00% 0.10% 23.98% 0.00% 0.00% 0.00% 0.00% 0.00% 0.00% 0.00% 0.00% 0.83% 5.38% 0.00% 0.00% 0.00% 0.00% 0.00% 3.84% 1.68% 0.00% 0.00% 0.00% 0.00% 1.74% 0.13% 0.00% 2.41% 0.00% 11.62% 2.35% 0.00% 0.00% 0.00% 14.93% 8.52% 2.96% 0.00% 4.14% 0.00% 0.00% 0.00% 7.60% 0.00% 0.00% 1.20% 24.59% 0.00% 0.00% 0.00% 0.00% 0.00% 0.00% 0.00% 0.00% 0.00% 2.92% 0.00% 0.00% 0.00% 0.00% 0.00% 4.86% 1.35% 0.00% 0.00% 0.00% 0.00% 1.78% 2.21% 0.00% 0.14% 0.00% 6.90% 6.71% 0.00% 0.00% 0.00% 27.83% 7.87% 3.08% 0.00% 0.97% Page 14 of 19 . FOR INSTITUTIONAL OR REGISTERED REPRESENTATIVE USE ONLY. NOT FOR PUBLIC USE OR VIEWING. WisdomTree ETFs FUND CHARACTERISTICS REPORT [as of December 31, 2015] Emerging Markets Asia WisdomTree Emerging Markets exState-Owned Enterprises Fund AUSTRALIA AUSTRIA BELGIUM BRAZIL BRITAIN CANADA CHILE CHINA CZECH REPUBLIC DENMARK FINLAND FRANCE GERMANY GREECE HONG KONG HUNGARY INDIA INDONESIA IRELAND ISRAEL ITALY JAPAN LUXEMBOURG MALAYSIA MEXICO NETHERLANDS NEW ZEALAND NORWAY PERU PHILIPPINES POLAND PORTUGAL RUSSIA SINGAPORE SOUTH AFRICA SOUTH KOREA SPAIN SWEDEN SW ITZERLAND TAIWAN THAILAND TURKEY UNITED STATES OTHER Subject to change. Vanguard FTSE Emerging Markets ETF iShares MSCI Emerging Markets ETF WisdomTree Emerging Markets Consumer Growth Fund 0.00% 0.00% 0.00% 3.54% 0.00% 0.00% 1.47% 29.13% 0.24% 0.00% 0.00% 0.00% 0.00% 0.00% 0.00% 0.37% 9.11% 2.34% 0.00% 0.00% 0.00% 0.00% 0.00% 2.91% 4.98% 0.00% 0.00% 0.00% 0.00% 2.16% 1.51% 0.00% 3.10% 0.00% 6.42% 17.24% 0.00% 0.00% 0.00% 11.30% 2.56% 1.62% 0.00% 0.00% 0.00% 0.00% 0.00% 6.48% 0.00% 0.00% 1.34% 29.87% 0.21% 0.00% 0.00% 0.00% 0.00% 0.00% 0.00% 0.33% 13.47% 2.64% 0.00% 0.00% 0.00% 0.00% 0.00% 4.35% 5.41% 0.42% 0.00% 0.00% 0.20% 1.94% 1.53% 0.00% 3.08% 0.00% 7.66% 0.00% 0.03% 0.00% 0.00% 15.08% 2.37% 1.60% 0.00% 2.00% 0.00% 0.00% 0.00% 5.57% 0.00% 0.00% 1.25% 26.68% 0.19% 0.00% 0.00% 0.00% 0.00% 0.00% 0.00% 0.28% 9.10% 2.66% 0.00% 0.00% 0.00% 0.00% 0.00% 3.25% 4.61% 0.37% 0.00% 0.00% 0.35% 1.50% 1.36% 0.00% 2.63% 0.00% 6.56% 16.13% 0.00% 0.00% 0.00% 11.44% 2.04% 1.41% 0.00% 2.61% 0.00% 0.00% 0.00% 19.55% 0.00% 0.00% 0.11% 23.86% 0.00% 0.00% 0.00% 0.00% 0.00% 0.00% 0.00% 0.00% 2.46% 6.73% 0.00% 0.00% 0.00% 0.00% 0.00% 1.33% 4.55% 0.00% 0.00% 0.00% 0.00% 0.99% 0.20% 0.00% 3.40% 0.00% 7.34% 16.28% 0.00% 0.00% 0.00% 6.82% 3.95% 2.43% 0.00% 0.00% EGShares Emerging WisdomTree Asia Markets Consumer Pacific ex-Japan Fund ETF 0.00% 0.00% 0.00% 11.73% 0.00% 0.00% 3.07% 16.69% 0.00% 0.00% 0.00% 0.00% 0.00% 0.00% 0.00% 0.00% 11.34% 3.48% 0.00% 0.00% 0.00% 0.00% 0.00% 2.10% 16.33% 4.76% 0.00% 0.00% 0.00% 2.79% 0.00% 0.00% 4.18% 0.00% 18.88% 0.00% 0.00% 0.00% 0.00% 0.00% 4.67% 0.00% 0.00% 0.00% 22.30% 0.00% 0.00% 0.00% 0.76% 0.00% 0.00% 13.60% 0.00% 0.00% 0.00% 0.00% 0.00% 0.00% 17.23% 0.00% 0.27% 2.48% 0.00% 0.00% 0.00% 0.00% 0.00% 4.65% 0.00% 0.00% 0.00% 0.00% 0.00% 2.02% 0.00% 0.00% 0.00% 5.83% 0.00% 8.70% 0.00% 0.00% 0.00% 14.89% 3.72% 0.00% 0.00% 3.56% Vanguard FTSE Pacific ETF iShares MSCI All Country Asia exJapan ETF iShares MSCI Pacific ex-Japan ETF 15.98% 0.00% 0.00% 0.00% 0.23% 0.00% 0.00% 0.47% 0.00% 0.00% 0.00% 0.00% 0.00% 0.00% 7.63% 0.00% 0.00% 0.00% 0.09% 0.00% 0.03% 60.61% 0.02% 0.00% 0.00% 0.00% 0.67% 0.00% 0.00% 0.00% 0.00% 0.00% 0.00% 3.20% 0.00% 10.75% 0.00% 0.00% 0.00% 0.00% 0.00% 0.00% 0.00% 0.31% 0.00% 0.00% 0.00% 0.00% 0.00% 0.00% 0.00% 24.24% 0.00% 0.00% 0.00% 0.00% 0.00% 0.00% 18.58% 0.00% 10.13% 2.98% 0.00% 0.00% 0.00% 0.00% 0.00% 3.67% 0.00% 0.00% 0.00% 0.00% 0.00% 1.67% 0.00% 0.00% 0.00% 5.01% 0.00% 18.06% 0.00% 0.00% 0.00% 12.92% 2.34% 0.00% 0.00% 0.39% 59.30% 0.00% 0.00% 0.00% 0.99% 0.00% 0.00% 0.11% 0.00% 0.00% 0.00% 0.00% 0.00% 0.00% 26.36% 0.00% 0.00% 0.00% 0.41% 0.00% 0.00% 0.00% 0.00% 0.00% 0.00% 0.00% 1.39% 0.00% 0.00% 0.00% 0.00% 0.00% 0.00% 10.63% 0.00% 0.00% 0.00% 0.00% 0.00% 0.00% 0.00% 0.00% 0.00% 0.80% Page 15 of 19 . FOR INSTITUTIONAL OR REGISTERED REPRESENTATIVE USE ONLY. NOT FOR PUBLIC USE OR VIEWING. WisdomTree ETFs FUND CHARACTERISTICS REPORT [as of December 31, 2015] Alternative/Real Estate Sectors WisdomTree Global ex-US Real Estate Fund AUSTRALIA AUSTRIA BELGIUM BRAZIL BRITAIN CANADA CHILE CHINA CZECH REPUBLIC DENMARK FINLAND FRANCE GERMANY GREECE HONG KONG HUNGARY INDIA INDONESIA IRELAND ISRAEL ITALY JAPAN LUXEMBOURG MALAYSIA MEXICO NETHERLANDS NEW ZEALAND NORWAY PERU PHILIPPINES POLAND PORTUGAL RUSSIA SINGAPORE SOUTH AFRICA SOUTH KOREA SPAIN SWEDEN SWITZERLAND TAIWAN THAILAND TURKEY UNITED STATES OTHER Subject to change. WisdomTree Global ex-U.S. Hedged Real Estate Fund SPDR Dow Jones International Real Estate ETF iShares International Developed Property ETF WisdomTree Commodity Country Equity Fund 12.63% 0.16% 0.93% 0.27% 6.51% 6.39% 0.12% 10.76% 0.00% 0.00% 0.51% 8.36% 2.55% 0.00% 26.57% 0.00% 0.00% 0.30% 0.07% 0.70% 0.19% 3.10% 0.00% 1.13% 1.63% 0.61% 0.19% 0.19% 0.00% 0.88% 0.00% 0.00% 0.00% 8.05% 2.05% 0.00% 0.00% 1.45% 1.26% 0.74% 1.29% 0.37% 0.00% 0.02% 12.42% 0.15% 0.95% 0.27% 6.42% 6.30% 0.10% 10.73% 0.00% 0.00% 0.50% 8.25% 2.52% 0.00% 25.96% 0.00% 0.00% 0.31% 0.06% 0.70% 0.16% 4.67% 0.00% 1.12% 1.59% 0.60% 0.18% 0.19% 0.00% 0.86% 0.00% 0.00% 0.00% 7.90% 2.04% 0.00% 0.00% 1.45% 1.23% 0.72% 1.27% 0.37% 0.00% 0.02% 25.41% 1.03% 0.73% 0.00% 14.72% 10.15% 0.00% 0.00% 0.00% 0.00% 0.00% 3.24% 0.00% 0.00% 14.95% 0.00% 0.00% 0.00% 0.00% 0.00% 0.16% 16.84% 0.00% 0.00% 0.00% 1.26% 0.89% 0.00% 0.00% 0.00% 0.00% 0.00% 0.00% 5.61% 0.34% 0.00% 0.00% 2.30% 2.38% 0.00% 0.00% 0.00% 0.00% 0.00% 12.35% 0.85% 0.92% 0.00% 11.36% 2.80% 0.00% 0.00% 0.00% 0.01% 0.32% 6.90% 5.45% 0.00% 15.21% 0.00% 0.00% 0.00% 0.38% 0.87% 0.17% 27.62% 0.30% 0.00% 0.00% 0.95% 0.69% 0.21% 0.00% 0.00% 0.00% 0.00% 0.00% 7.14% 0.00% 0.00% 0.58% 2.26% 1.93% 0.00% 0.00% 0.00% 0.00% 0.72% 12.60% 0.00% 0.00% 10.35% 0.38% 11.40% 10.36% 0.00% 0.00% 0.00% 0.00% 0.00% 0.00% 0.00% 0.00% 0.00% 0.00% 0.00% 0.00% 0.00% 0.00% 0.00% 0.00% 0.00% 0.00% 0.00% 16.93% 13.80% 0.00% 0.00% 0.00% 0.00% 13.29% 0.00% 10.19% 0.00% 0.00% 0.00% 0.00% 0.00% 0.00% 0.00% 0.00% 0.71% WisdomTree SPDR S&P Global Global Natural Natural Resources Fund Resources ETF 7.24% 0.00% 0.00% 1.86% 8.52% 8.95% 0.42% 5.82% 0.00% 0.00% 0.00% 3.01% 1.34% 0.00% 1.97% 0.00% 0.00% 0.00% 0.00% 1.40% 1.86% 0.59% 0.00% 1.98% 1.00% 4.18% 0.00% 2.73% 0.00% 0.91% 1.04% 0.00% 9.94% 0.99% 1.25% 0.37% 3.22% 0.51% 1.37% 0.00% 2.28% 0.00% 25.29% 0.00% 8.46% 0.44% 0.00% 1.29% 7.23% 9.73% 0.36% 0.97% 0.00% 0.00% 2.30% 3.48% 1.90% 0.00% 0.00% 0.00% 0.74% 0.00% 0.90% 0.32% 1.28% 5.28% 0.57% 0.00% 0.26% 3.02% 0.00% 2.30% 0.65% 0.00% 0.00% 0.00% 2.74% 1.04% 1.53% 2.27% 0.38% 0.00% 7.69% 0.00% 0.00% 0.00% 32.81% 0.05% Middle East WisdomTree Global ex-US Utilities Sector Fund SPDR S&P International Utilities Sector ETF 1.43% 0.73% 0.60% 4.18% 11.92% 9.02% 3.06% 5.89% 2.02% 0.00% 2.49% 7.66% 4.95% 0.00% 7.17% 0.00% 0.00% 1.66% 0.00% 0.00% 8.23% 5.38% 0.00% 1.73% 1.03% 0.00% 3.94% 0.00% 0.00% 2.18% 3.08% 1.43% 0.18% 0.43% 0.00% 0.54% 7.39% 0.00% 0.00% 0.00% 0.78% 0.00% 0.00% 0.91% 4.24% 0.35% 0.25% 0.00% 20.87% 4.87% 0.00% 0.00% 0.00% 0.00% 1.17% 9.72% 4.63% 0.00% 9.85% 0.00% 0.00% 0.00% 0.00% 0.00% 10.20% 14.09% 0.00% 0.00% 0.00% 0.00% 1.51% 0.04% 0.00% 0.00% 0.00% 1.72% 0.00% 0.25% 0.00% 2.25% 13.59% 0.00% 0.18% 0.00% 0.00% 0.00% 0.00% 0.21% WisdomTree Middle East Dividend Fund QATAR UAE KUWAIT MOROCCO EGYPT OMAN BAHRAIN JORDAN 24.41% 23.81% 22.78% 11.29% 6.62% 5.52% 4.04% 1.53% 0.00% Page 16 of 19 . FOR INSTITUTIONAL OR REGISTERED REPRESENTATIVE USE ONLY. NOT FOR PUBLIC USE OR VIEWING. WisdomTree Funds There are risks associated with investing including possible loss of principal. In addition to the normal risks of investing, foreign investing involves special risks, such as risk of loss from currency fluctuation or political or economic uncertainty. Investments in real estate involve additional special risks, such as credit risk, interest rate fluctuations and the effect of varied economic conditions.
Funds that focus its investments in one country increase the impact of events and developments associated with the region which can adversely affect performance. Funds focusing on a single country, sector and/or smaller companies generally experience greater price volatility. Investments in emerging, offshore or frontier markets are generally less liquid and less efficient than developed markets. Investments in currency involve additional special risks, such as credit risk, interest rate fluctuations, derivative investment risk, which can be volatile and may be less liquid than other securities and the effect of varied economic conditions.
As these Funds can have a high concentration in some issuers the Funds can be adversely impacted by changes affecting issuers. Unlike typical exchange-traded Funds, there are no indexes that the currency Funds attempt to track or replicate. Thus, the ability of the currency Funds to achieve its objectives will depend on the effectiveness of the portfolio manager.
Due to the investment strategy of certain Fund’s they may make higher capital gain distributions than other ETFs. Please read the Fund’s prospectus for specific details regarding the Fund’s risk profile. Investors should consider the investment objectives, risks, charges and expenses of the Funds carefully before investing. A prospectus, containing this and other information, is available at wisdomtree.com or by calling 1-866-909-WISE (9473).
Investors should read the prospectus carefully before investing. WisdomTree Funds are distributed by Foreside Fund Services, LLC in the US only. © 2015 WisdomTree Investments, Inc. Foreside Fund Services, LLC.
is not affiliated with SEI Investments Distribution Co. (SEI), State Street Global Markets, LLC and Vanguard Marketing Corporation. iShares Funds Investing involves risk, including possible loss of principal. International investments may involve risk of capital loss from unfavorable fluctuation in currency values, from differences in generally accepted accounting principles or from economic or political instability in other nations.
Emerging markets involve heightened risks related to the same factors as well as increased volatility and lower trading volume. Carefully consider the iShares Funds’ investment objectives, risk factors and charges and expenses before investing. The iShares Funds (“Funds”) are distributed by BlackRock Investments, LLC. StateStreet Funds Before investing, consider the funds’ investment objectives, risks, charges and expenses. Foreign investments involve greater risks than US investments, including political and economic risks and the risk of currency fluctuations, all of which may be magnified in emerging markets. Because of their narrow focus, sector funds tend to be more volatile than broadly diversified funds and generally result in greater price fluctuations than the overall market. In general, ETFs can be expected to move up or down in value with the value of the applicable index. Although ETF shares may be bought and sold on the exchange through any brokerage account, ETF shares are not individually redeemable from the Fund. Investors may acquire ETFs and tender them for redemption through the Fund in Creation Unit Aggregations only.
Please see the prospectus for more details. ETFs trade like stocks, are subject to investment risk and will fluctuate in market value. StateStreet Funds are distributed by State Street Global Markets, LLC. SPDR funds are distributed by ALPS Distributors Inc. Page 17 of 19 . FOR INSTITUTIONAL OR REGISTERED REPRESENTATIVE USE ONLY. NOT FOR PUBLIC USE OR VIEWING. Vanguard Funds Vanguard ETFs are not redeemable with an Applicant Fund other than in Creating Unit aggregations. Instead, investors must buy or sell Vanguard ETF Shares in the secondary market with the assistance of a stockbroker. In doing so, the investor will incur brokerage commissions and may pay more than net asset value when buying and receive less than net asset value when selling. All ETF products are subject to stock market risk, which may result in the loss of principal.
International ETF products involve additional risks, including currency fluctuations and the potential for adverse developments in specific countries or regions. ETF products that invest in emerging markets are generally more risky than those that invest in developed countries. Vanguard Funds are distributed by Vanguard Marketing Corporation. EG Shares Funds Emerging market investments involve risk of capital loss from unfavorable fluctuation in currency values, from differences in generally accepted accounting principles, from economic or political instability in other nations or increased volatility and lower trading volume. This fund will concentrate its investments in issuers of one or more particular industries to the same extent that its Underlying Index is so concentrated and to the extent permitted by applicable regulatory guidance.
Concentration risk results from maintaining exposure to issuers conducting business in a specific industry. Small cap and mid cap companies generally will have greater volatility in price than the stocks of large companies due to limited product lines or resources or a dependency upon a particular market niche. The EGShares Emerging Markets Consumer ETF ("the Fund") is distributed by ALPS Distributors, Inc. Emerging Global Advisors acts as the investment advisor to the Fund.
ALPS and Emerging Global Advisors are unaffiliated entities. Fundamental Data Points: A number of valuation points in this report— Price / Earnings, Price / Book, Price / Sales. Return on Equity, and Total Debt To capital – are calculated using a weighted average of each firm’s individual data points for that specific ratio of the ETF IOPV. The weighted average ratio for the ETF IOPV is calculated by multiplying each firm’s specific ratio (such as the Price / Earnings) with their relative weight in the fund and summing the product of those two numbers (weight in fund and Price / Earnings). -- The price to earnings ratio for each ETF IOPV represents a weighted average price to earnings ratio of the constituents of the ETF IOPV.
Price/Earnings Ratio is a valuation ratio of a company's current share price compared to its per-share earnings. --E/P Ratio (earnings/price) is defined as Earnings / Price or 1 / PE Ratio. -- The price to sales ratio for each ETF IOPV represents a weighted average price to sales ratio of the constituents of the ETF IOPV. Price/Sales Ratio is a valuation ratio of a company's current share price compared to its per-share sales. -- The price to book value ratio for each ETF IOPV represents a weighted average price to book value ratio of the constituents of the ETF IOPV. Price/Book value Ratio is a valuation ratio of a company's current share price compared to its per-share book value. --Total Debt to Capital ratio for each ETF IOPV represents a weighted average debt to capital ratio of the constituents of the ETF IOPV.
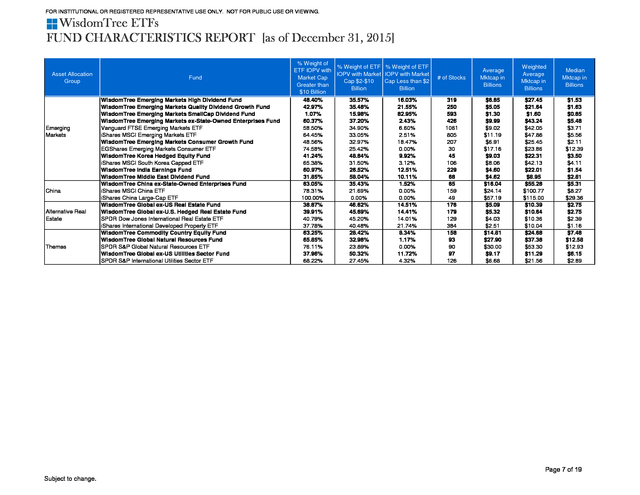
The higher debt to capital ratio for each firm, the more reliant that firm is on debt financing. --Return on Equity (ROE) is defined as the Earnings /Price ratio of each firm multiplied by its Price / Book Ratio. The ROE of the ETF IOPV represents the weight average ratio of each constituents earnings measured relative to their book values. Market Cap Data Points: A number of data points in the report cover statistics on the market Capitalization (price times shares outstanding) of the ETF IOPV Constituents. % Weight of ETF IOPV with Market Cap Greater than $10 Billion – Reflects aggregate weight of the ETF IOPV of companies with market caps greater than $10 billion % Weight of ETF IOPV with Market Cap $2-$10 Billion - Reflects aggregate weight of the ETF IOPV of companies with market caps between $2-10 billion. % Weight of ETF IOPV with Market Cap Less than $2 Billion - aggregate weight of the ETF IOPV of companies with market caps less than $2 billion Average Market Cap, Median Market Cap, and Weighted Average Market Cap are statistical summary measures of the market capitalization of constituents in each ETF IOPV. Page 18 of 19 . FOR INSTITUTIONAL OR REGISTERED REPRESENTATIVE USE ONLY. NOT FOR PUBLIC USE OR VIEWING. The Global Industry Classification Standard (“GICS”) was developed by and is the exclusive property and a service mark of Morgan Stanley Capital International Inc. (“MSCI”) and Standard & Poor’s, a division of The McGraw-Hill Companies, Inc. (“S&P”) and is licensed for use by WisdomTree Investments, Inc.
Neither MSCI, S&P, nor any other party involved in making or compiling the GICS or any GICS classifications makes any express or implied warranties or representations with respect to such standard or classification (or the results to be obtained by the use thereof), and all such parties hereby expressly disclaim all warranties of originality, accuracy, completeness, merchantability and fitness for a particular purpose with respect to any of such standard or classification. Without limiting any of the foregoing, in no event shall MSCI, S&P, any of their affiliates or any third party involved in making or compiling the GICS or any GICS classifications have any liability for any direct, indirect, special, punitive, consequential or any other damages (including lost profits) even if notified of the possibility of such damages. WTIR-0080 Page 19 of 19 .
The information provided is not intended for trading purposes, and should not be considered investment advice. All information for the Funds found in this report is based on Funds' Indicated Optimized Portfolio Value or "ETF IOPV". An ETF IOPV represents the fund constituents being used to calculate IOPV, which is the intraday NAV of the Fund.
This value is intended to approximate the value of the securities held in the portfolio by the ETF and should closely represent the value of the Fund throughout the day. ETF IOPV constituents may differ from actual Fund constituents. The ETF IOPV represents a measure of fair value of the ETF's underlying securities at a specific point in time. The ETF IOPV is not a direct market price of the ETF; market prices typically incorporate bid/ask spreads over estimates of ETF IOPVs or other fair value measures of an ETF's underlying holdings. Page 1 of 19 .
FOR INSTITUTIONAL OR REGISTERED REPRESENTATIVE USE ONLY. NOT FOR PUBLIC USE OR VIEWING. WisdomTree ETFs FUND CHARACTERISTICS REPORT [December 31, 2015] ETF FUNDAMENTAL CHARACTERISTICS OF ETF IOPV INFORMATION Asset Allocation Group Fund Broad US Market WisdomTree Total Dividend Fund WisdomTree Total Earnings Fund iShares Russell 3000 ETF Vanguard Total Stock Market ETF WisdomTree LargeCap Dividend Fund Large Cap WisdomTree Earnings 500 Fund US iShares Russell 1000 ETF iShares Core S&P 500 ETF US Local Economy vsWisdomTree Strong Dollar U.S. Equity Fund Exporters WisdomTree Weak Dollar U.S. Equity Fund WisdomTree LargeCap Value Fund iShares S&P 500 Value ETF Large Cap iShares S&P 500 Growth ETF US iShares Russell 1000 Value ETF Growth/Value iShares Russell 1000 Growth ETF iShares Core U.S.
Value ETF iShares Core U.S. Growth ETF WisdomTree Dynamic Long/Short U.S. Equity Fund* Alternative SPDR S&P 500 ETF WisdomTree High Dividend Fund WisdomTree Dividend ex-Financials Fund Equity Income/ iShares Select Dividend ETF Dividend Growth WisdomTree U.S.
Quality Dividend Growth Fund Vanguard Dividend Appreciation Fund SPDR S&P Dividend ETF WisdomTree Midcap Dividend Fund WisdomTree Midcap Earnings Fund Vanguard Mid-Cap ETF Mid Cap iShares Russell Mid-Cap ETF US iShares Core S&P Mid-Cap ETF iShares Russell Mid-Cap Value ETF iShares Russell Mid-Cap Growth ETF iShares S&P Mid-Cap 400 Value ETF iShares S&P Mid-Cap 400 Growth ETF WisdomTree SmallCap Dividend Fund WisdomTree SmallCap Earnings Fund WisdomTree U.S. SmallCap Quality Dividend Growth Fund Small Cap iShares Russell 2000 ETF US iShares Russell 2000 Value ETF iShares Russell 2000 Growth ETF iShares Core S&P Small-Cap ETF iShares S&P SmallCap 600 Value ETF iShares S&P SmallCap 600 Growth ETF Vanguard Small-Cap ETF Vanguard Small-Cap Value ETF Vanguard Small-Cap Growth ETF *WisdomTree Dynamic Long/Short U.S. Equity Fund - all information is for the Long portion only. Calculated from the ETF IOPV Indexes.
Subject to change. Price/Earnings (PE) Price/Book Price/Sales Return on Equity (ROE%) E/P Ratio (Earnings Yield) Total Debt to Total Capital 16.83 15.08 19.37 19.33 16.54 14.76 19.10 18.65 20.23 19.86 16.20 15.57 22.97 16.78 21.91 16.95 21.01 15.36 18.69 16.95 14.84 16.85 16.73 18.35 19.05 18.71 15.30 20.75 20.66 19.55 18.40 23.51 16.17 24.40 17.36 11.98 14.02 23.46 19.25 29.69 21.67 18.78 25.14 22.10 17.26 33.08 2.42 2.33 2.73 2.74 2.55 2.39 2.81 2.86 2.44 3.21 2.53 1.98 4.97 1.82 5.74 1.77 5.24 3.22 2.87 2.27 2.14 2.10 4.62 3.81 2.66 2.25 2.02 2.56 2.52 2.22 1.66 5.19 1.58 3.60 1.60 1.32 1.95 2.02 1.35 3.89 1.93 1.45 2.74 2.12 1.66 3.12 1.57 1.40 1.72 1.72 1.66 1.47 1.79 1.85 1.45 1.84 0.85 1.37 2.77 1.51 2.15 1.45 2.02 1.62 1.85 1.45 1.12 1.51 1.69 1.46 1.58 1.23 0.95 1.52 1.51 1.14 1.29 1.81 0.78 2.03 0.78 0.78 0.84 1.17 0.97 1.47 1.08 0.74 1.86 1.19 0.85 2.22 14.36% 15.43% 14.09% 14.16% 15.43% 16.18% 14.73% 15.32% 12.09% 16.17% 15.61% 12.70% 21.63% 10.83% 26.21% 10.45% 24.94% 20.94% 15.39% 13.37% 14.43% 12.43% 27.63% 20.79% 13.94% 12.04% 13.22% 12.32% 12.22% 11.36% 9.03% 22.06% 9.79% 14.74% 9.24% 11.01% 13.92% 8.63% 7.02% 13.11% 8.92% 7.74% 10.90% 9.58% 9.64% 9.43% 5.94% 6.63% 5.16% 5.17% 6.05% 6.78% 5.24% 5.36% 4.94% 5.04% 6.17% 6.42% 4.35% 5.96% 4.56% 5.90% 4.76% 6.51% 5.35% 5.90% 6.74% 5.93% 5.98% 5.45% 5.25% 5.35% 6.54% 4.82% 4.84% 5.11% 5.44% 4.25% 6.19% 4.10% 5.76% 8.35% 7.13% 4.26% 5.19% 3.37% 4.61% 5.33% 3.98% 4.52% 5.80% 3.02% 47.17% 44.92% 42.21% 42.51% 46.96% 45.20% 42.64% 42.20% 52.11% 40.28% 40.33% 44.91% 39.63% 42.35% 42.92% 42.19% 45.03% 46.13% 42.25% 51.67% 47.59% 52.15% 46.70% 39.50% 42.04% 48.56% 45.30% 44.16% 44.97% 39.85% 42.15% 47.75% 38.14% 41.48% 41.96% 35.55% 30.52% 37.00% 40.25% 33.88% 32.11% 32.21% 32.03% 42.41% 46.01% 38.18% Page 2 of 19 . FOR INSTITUTIONAL OR REGISTERED REPRESENTATIVE USE ONLY. NOT FOR PUBLIC USE OR VIEWING. WisdomTree ETFs FUND CHARACTERISTICS REPORT [December 31, 2015] Asset Allocation Group Global Global ex-U.S. Intl Intl Cap Segments Intl Growth/ Value Europe Japan & Asia Fund WisdomTree Global High Dividend Fund iShares MSCI ACWI ETF WisdomTree Global SmallCap Dividend Fund WisdomTree Global Hedged SmallCap Dividend Fund WisdomTree Global ex-U.S. Quality Dividend Growth Fund WisdomTree Global ex-U.S. Hedged Dividend Fund Vanguard FTSE All-World ex-US ETF iShares MSCI ACWI ex-U.S.
ETF WisdomTree International Equity Fund WisdomTree International Hedged Equity Fund WisdomTree International Hedged Quality Dividend Growth Fund iShares MSCI EAFE ETF WisdomTree International LargeCap Dividend Fund WisdomTree International Midcap Dividend Fund WisdomTree International SmallCap Dividend Fund WisdomTree International Hedged SmallCap Dividend Fund iShares MSCI EAFE Small-Cap ETF WisdomTree International High Dividend Fund WisdomTree International Dividend ex-Financials Fund iShares International Select Dividend ETF iShares MSCI EAFE Growth ETF iShares MSCI EAFE Value ETF WisdomTree Europe Hedged Equity Fund iShares MSCI EMU ETF WisdomTree Europe SmallCap Dividend Fund WisdomTree Europe Hedged SmallCap Equity Fund WisdomTree Europe Quality Dividend Growth Fund WisdomTree Europe Local Recovery Fund Vanguard FTSE Europe ETF iShares Europe ETF WisdomTree United Kingdom Hedged Equity Fund iShares MSCI United Kingdom ETF WisdomTree Germany Hedged Equity Fund iShares MSCI Germany ETF WisdomTree Japan Quality Dividend Growth Fund WisdomTree Japan Hedged Quality Dividend Growth Fund WisdomTree Japan Hedged Equity Fund iShares MSCI Japan ETF WisdomTree Japan Hedged SmallCap Equity Fund WisdomTree Japan SmallCap Dividend Fund iShares MSCI Japan Small-Cap ETF SPDR Russell Nomura Small Cap Japan ETF Vanguard FTSE Pacific ETF WisdomTree Asia Pacific ex-Japan Fund iShares MSCI All Country Asia ex-Japan ETF iShares MSCI Pacific ex-Japan ETF WisdomTree Australia Dividend Fund iShares MSCI Australia ETF Calculated from the ETF IOPV Indexes. Subject to change. Price/Earnings (PE) Price/Book Price/Sales Return on Equity (ROE%) E/P Ratio (Earnings Yield) Total Debt to Total Capital 14.65 17.54 17.20 17.20 17.51 15.49 17.83 16.54 16.71 16.05 19.47 17.36 16.81 16.29 15.73 15.73 17.98 16.46 20.56 17.42 20.71 14.92 17.81 18.81 17.67 18.83 21.16 18.77 19.15 19.16 21.42 20.25 16.10 16.67 15.11 15.07 13.94 15.52 14.69 14.66 16.10 15.13 14.17 11.71 11.78 13.38 19.11 15.69 1.70 2.10 1.48 1.48 2.44 1.51 1.73 1.60 1.56 1.53 3.77 1.60 1.55 1.57 1.39 1.39 1.59 1.50 1.75 1.68 2.67 1.13 2.11 1.55 1.84 1.84 3.97 1.49 1.77 1.73 1.86 1.69 1.75 1.68 1.50 1.48 1.21 1.33 1.08 1.07 1.18 1.11 1.28 1.39 1.37 1.47 1.64 1.77 1.22 1.41 0.79 0.79 2.49 1.04 1.18 1.10 1.00 0.98 1.96 1.09 1.12 0.81 0.68 0.68 0.91 0.98 1.10 1.02 1.52 0.84 1.13 0.96 0.85 0.81 1.75 0.78 1.11 1.11 1.18 1.08 0.64 0.80 0.84 0.82 0.72 0.82 0.52 0.54 0.64 0.57 0.87 1.16 1.10 1.94 1.10 1.78 11.63% 11.99% 8.59% 8.59% 13.96% 9.73% 9.71% 9.70% 9.32% 9.52% 19.36% 9.21% 9.24% 9.65% 8.83% 8.83% 8.84% 9.09% 8.50% 9.62% 12.89% 7.59% 11.86% 8.26% 10.43% 9.75% 18.75% 7.92% 9.22% 9.02% 8.69% 8.33% 10.88% 10.11% 9.91% 9.84% 8.67% 8.58% 7.32% 7.28% 7.35% 7.35% 9.02% 11.91% 11.62% 10.97% 8.58% 11.28% 6.83% 5.70% 5.81% 5.81% 5.71% 6.46% 5.61% 6.05% 5.98% 6.23% 5.14% 5.76% 5.95% 6.14% 6.36% 6.36% 5.56% 6.08% 4.86% 5.74% 4.83% 6.70% 5.62% 5.32% 5.66% 5.31% 4.73% 5.33% 5.22% 5.22% 4.67% 4.94% 6.21% 6.00% 6.62% 6.64% 7.18% 6.44% 6.81% 6.82% 6.21% 6.61% 7.06% 8.54% 8.49% 7.48% 5.23% 6.37% 49.43% 43.96% 41.49% 41.49% 24.45% 40.29% 43.92% 42.97% 45.27% 46.80% 31.56% 44.74% 43.64% 49.46% 32.13% 32.13% 32.59% 46.87% 40.24% 46.17% 38.14% 51.05% 65.14% 53.63% 34.90% 38.93% 36.48% 44.92% 46.40% 48.13% 46.36% 47.47% 40.50% 43.86% 25.67% 25.75% 32.99% 34.75% 25.87% 25.53% 28.33% 25.82% 34.90% 35.00% 33.20% 44.78% 41.52% 55.55% Page 3 of 19 . FOR INSTITUTIONAL OR REGISTERED REPRESENTATIVE USE ONLY. NOT FOR PUBLIC USE OR VIEWING. WisdomTree ETFs FUND CHARACTERISTICS REPORT [December 31, 2015] Asset Allocation Group Fund Price/Earnings (PE) Price/Book Price/Sales Return on Equity (ROE%) E/P Ratio (Earnings Yield) Total Debt to Total Capital WisdomTree Emerging Markets High Dividend Fund 9.81 0.96 0.78 9.80% 10.19% 39.29% WisdomTree Emerging Markets Quality Dividend Growth Fund 12.94 3.16 2.00 24.39% 7.73% 29.20% WisdomTree Emerging Markets SmallCap Dividend Fund 10.12 1.11 0.64 10.98% 9.89% 33.49% Emerging WisdomTree Emerging Markets ex-State-Owned Enterprises Fund 16.06 1.77 1.14 11.04% 6.23% 34.37% Markets Vanguard FTSE Emerging Markets ETF 14.25 1.76 1.22 12.35% 7.02% 38.04% iShares MSCI Emerging Markets ETF 12.69 1.45 1.06 11.46% 7.88% 35.36% WisdomTree Emerging Markets Consumer Growth Fund 11.63 2.06 1.22 17.71% 8.60% 28.55% EGShares Emerging Markets Consumer ETF 32.35 5.04 2.50 15.59% 3.09% 34.33% WisdomTree Korea Hedged Equity Fund 11.67 0.93 0.42 7.97% 8.57% 30.71% iShares MSCI South Korea Capped ETF 10.36 0.92 0.61 8.91% 9.65% 25.63% WisdomTree India Earnings Fund 13.77 1.79 1.11 12.98% 7.26% 37.59% WisdomTree Middle East Dividend Fund 9.98 1.30 2.18 12.99% 10.02% 38.47% WisdomTree China ex-State-Owned Enterprises Fund 19.63 2.96 1.86 15.08% 5.09% 35.45% China iShares MSCI China ETF 10.32 1.37 1.10 13.26% 9.69% 40.56% iShares China Large-Cap ETF 8.09 1.09 0.90 13.51% 12.37% 47.64% WisdomTree Global ex-US Real Estate Fund 8.30 0.92 2.27 11.12% 12.05% 37.21% Alternative Real WisdomTree Global ex-U.S. Hedged Real Estate Fund 8.42 0.93 2.28 11.04% 11.88% 37.37% SPDR Dow Jones International Real Estate ETF 9.31 1.00 4.61 10.70% 10.74% 35.66% Estate iShares International Developed Property ETF 11.43 1.09 3.73 9.56% 8.75% 39.03% WisdomTree Commodity Country Equity Fund 15.21 1.35 1.17 8.90% 6.58% 41.38% WisdomTree Global Natural Resources Fund 17.03 0.91 0.78 5.35% 5.87% 30.20% Themes SPDR S&P Global Natural Resources ETF 23.41 1.37 0.79 5.84% 4.27% 34.98% WisdomTree Global ex-US Utilities Sector Fund 14.95 1.21 0.73 8.09% 6.69% 49.03% SPDR S&P International Utilities Sector ETF 18.94 1.37 0.67 7.24% 5.28% 56.31% Fundamental information shown here is calculated by Bloomberg. If Bloomberg does not have this information available, an N/A is shown.
Information may be available from individual fund websites. E/P Ratio is defined as Earnings / Price or 1/ PE Ratio. It is also equivalent to ROE / Price to Book Value Calculated from the ETF IOPV Indexes.
Subject to change. Page 4 of 19 . FOR INSTITUTIONAL OR REGISTERED REPRESENTATIVE USE ONLY. NOT FOR PUBLIC USE OR VIEWING. WisdomTree ETFs FUND CHARACTERISTICS REPORT [as of December 31, 2015] ETF MARKET CAP CHARACTERISTICS Asset Allocation Group Broad US Market Fund WisdomTree Total Dividend Fund WisdomTree Total Earnings Fund iShares Russell 3000 ETF Vanguard Total Stock Market ETF WisdomTree LargeCap Dividend Fund Large Cap WisdomTree Earnings 500 Fund US iShares Russell 1000 ETF iShares Core S&P 500 ETF US Local Economy vsWisdomTree Strong Dollar U.S. Equity Fund Exporters WisdomTree Weak Dollar U.S. Equity Fund WisdomTree LargeCap Value Fund iShares S&P 500 Value ETF Large Cap iShares S&P 500 Growth ETF US iShares Russell 1000 Value ETF Growth/Value iShares Russell 1000 Growth ETF iShares Core U.S.
Value ETF iShares Core U.S. Growth ETF WisdomTree Dynamic Long/Short U.S. Equity Fund* Alternative SPDR S&P 500 ETF WisdomTree High Dividend Fund Equity Income/ WisdomTree Dividend ex-Financials Fund Dividend Growth iShares Select Dividend ETF WisdomTree U.S.
Quality Dividend Growth Fund Vanguard Dividend Appreciation Fund SPDR S&P Dividend ETF WisdomTree Midcap Dividend Fund WisdomTree Midcap Earnings Fund Vanguard Mid-Cap ETF Mid Cap iShares Russell Mid-Cap ETF US iShares Core S&P Mid-Cap ETF iShares Russell Mid-Cap Value ETF iShares Russell Mid-Cap Growth ETF iShares S&P Mid-Cap 400 Value ETF iShares S&P Mid-Cap 400 Growth ETF WisdomTree SmallCap Dividend Fund WisdomTree SmallCap Earnings Fund WisdomTree U.S. SmallCap Quality Dividend Growth Fund Small Cap iShares Russell 2000 ETF US iShares Russell 2000 Value ETF iShares Russell 2000 Growth ETF iShares Core S&P Small-Cap ETF iShares S&P SmallCap 600 Value ETF iShares S&P SmallCap 600 Growth ETF Vanguard Small-Cap ETF Vanguard Small-Cap Value ETF Vanguard Small-Cap Growth ETF *WisdomTree Dynamic Long/Short U.S. Equity Fund - all information is for the Long portion only. % Weight of % Weight of ETF % Weight of ETF ETF IOPV with IOPV with Market IOPV with Market Market Cap Cap Less than $2 Cap $2-$10 Greater than Billion Billion $10 Billion 84.28% 82.75% 80.03% 80.79% 99.35% 93.18% 86.70% 95.21% 65.45% 71.94% 75.14% 93.83% 96.54% 84.92% 88.35% 78.44% 82.38% 56.72% 95.15% 82.87% 84.59% 60.53% 91.15% 90.22% 62.87% 6.89% 0.86% 55.11% 54.18% 4.33% 49.56% 58.74% 1.35% 7.14% 0.04% 0.00% 0.09% 0.00% 0.00% 0.00% 0.41% 0.27% 0.54% 0.14% 0.26% 0.00% 12.85% 13.78% 15.18% 16.96% 0.30% 6.72% 13.05% 4.77% 34.32% 28.00% 24.03% 6.14% 3.46% 14.65% 11.56% 16.11% 13.98% 43.28% 4.84% 13.22% 14.58% 36.13% 8.85% 9.00% 36.54% 92.99% 87.51% 44.89% 44.98% 89.14% 49.02% 40.98% 86.80% 91.35% 24.68% 3.04% 19.38% 40.41% 34.27% 46.31% 29.32% 19.94% 37.79% 72.00% 70.16% 74.16% 2.88% 3.47% 4.79% 2.24% 0.35% 0.10% 0.25% 0.02% 0.22% 0.06% 0.84% 0.04% 0.00% 0.43% 0.08% 5.45% 3.64% 0.00% 0.01% 3.91% 0.83% 3.34% 0.00% 0.78% 0.59% 0.12% 11.62% 0.00% 0.84% 6.53% 1.41% 0.29% 11.86% 1.51% 75.29% 96.96% 80.53% 59.59% 65.73% 53.69% 70.27% 79.79% 61.67% 27.86% 29.58% 25.84% # of Stocks Average Mktcap in Billions Weighted Average Mktcap in Billions Median Mktcap in Billions 951 1342 3017 1520 299 497 1025 504 272 246 300 367 309 684 642 1978 1713 98 504 450 85 98 295 179 99 413 603 360 823 394 552 503 300 223 734 892 275 1957 1326 1179 589 446 332 1484 850 720 $17.63 $14.95 $8.15 $15.43 $48.83 $36.82 $21.97 $38.94 $21.73 $41.08 $13.07 $34.74 $43.46 $19.82 $24.75 $7.46 $9.79 $29.31 $38.95 $12.58 $60.54 $31.05 $28.41 $25.30 $37.94 $5.30 $3.32 $9.80 $7.98 $3.88 $7.44 $8.61 $3.40 $4.62 $1.02 $0.77 $1.13 $1.02 $0.92 $1.10 $1.14 $1.02 $1.38 $2.18 $2.11 $2.25 $117.57 $125.15 $114.77 $114.08 $138.92 $139.92 $123.92 $139.04 $36.11 $78.43 $43.10 $110.45 $166.22 $109.40 $137.51 $101.15 $128.50 $34.42 $138.30 $108.07 $59.96 $39.64 $106.87 $101.43 $47.92 $6.19 $3.88 $11.64 $12.29 $4.98 $11.25 $13.32 $4.07 $5.85 $1.46 $1.06 $1.42 $1.89 $1.66 $2.11 $1.67 $1.41 $1.90 $3.36 $3.26 $3.47 $4.62 $3.76 $1.47 $4.33 $25.48 $16.20 $7.81 $17.79 $10.91 $13.82 $5.31 $16.67 $19.35 $7.14 $8.83 $1.32 $1.83 $8.98 $17.79 $2.31 $28.04 $8.40 $10.01 $8.41 $14.00 $4.54 $2.95 $8.89 $6.17 $3.39 $5.66 $6.62 $2.98 $4.20 $0.85 $0.65 $1.00 $0.70 $0.61 $0.77 $0.97 $0.85 $1.19 $1.73 $1.68 $1.74 Page 5 of 19 Subject to change. .
FOR INSTITUTIONAL OR REGISTERED REPRESENTATIVE USE ONLY. NOT FOR PUBLIC USE OR VIEWING. WisdomTree ETFs FUND CHARACTERISTICS REPORT [as of December 31, 2015] Asset Allocation Group Global Global ex-U.S. Intl Intl Cap Segments Intl Growth/ Value Europe Japan & Asia Fund WisdomTree Global High Dividend Fund iShares MSCI ACWI ETF WisdomTree Global SmallCap Dividend Fund WisdomTree Global Hedged SmallCap Dividend Fund WisdomTree Global ex-U.S. Quality Dividend Growth Fund WisdomTree Global ex-U.S. Hedged Dividend Fund Vanguard FTSE All-World ex-US ETF iShares MSCI ACWI ex-U.S.
ETF WisdomTree International Equity Fund WisdomTree International Hedged Equity Fund WisdomTree International Hedged Quality Dividend Growth Fund iShares MSCI EAFE ETF WisdomTree International LargeCap Dividend Fund WisdomTree International Midcap Dividend Fund WisdomTree International SmallCap Dividend Fund WisdomTree International Hedged SmallCap Dividend Fund iShares MSCI EAFE Small-Cap ETF WisdomTree International High Dividend Fund WisdomTree International Dividend ex-Financials Fund iShares International Select Dividend ETF iShares MSCI EAFE Growth ETF iShares MSCI EAFE Value ETF WisdomTree Europe Hedged Equity Fund iShares MSCI EMU ETF WisdomTree Europe SmallCap Dividend Fund WisdomTree Europe Hedged SmallCap Equity Fund WisdomTree Europe Quality Dividend Growth Fund WisdomTree Europe Local Recovery Fund Vanguard FTSE Europe ETF iShares Europe ETF WisdomTree United Kingdom Hedged Equity Fund iShares MSCI United Kingdom ETF WisdomTree Germany Hedged Equity Fund iShares MSCI Germany ETF WisdomTree Japan Quality Dividend Growth Fund WisdomTree Japan Hedged Quality Dividend Growth Fund WisdomTree Japan Hedged Equity Fund iShares MSCI Japan ETF WisdomTree Japan Hedged SmallCap Equity Fund WisdomTree Japan SmallCap Dividend Fund iShares MSCI Japan Small-Cap ETF SPDR Russell Nomura Small Cap Japan ETF Vanguard FTSE Pacific ETF WisdomTree Asia Pacific ex-Japan Fund iShares MSCI All Country Asia ex-Japan ETF iShares MSCI Pacific ex-Japan ETF WisdomTree Australia Dividend Fund iShares MSCI Australia ETF % Weight of % Weight of ETF % Weight of ETF ETF IOPV with IOPV with Market IOPV with Market Market Cap Cap Less than $2 Cap $2-$10 Greater than Billion Billion $10 Billion 84.01% 15.67% 0.32% 90.08% 9.57% 0.36% 0.13% 9.20% 90.67% 0.13% 9.20% 90.67% 60.60% 35.84% 3.56% 89.26% 9.19% 1.54% 78.99% 20.19% 0.82% 81.41% 18.12% 0.47% 80.22% 16.23% 3.56% 75.69% 20.70% 3.61% 76.22% 21.30% 2.47% 84.28% 15.69% 0.03% 99.87% 0.13% 0.00% 20.82% 78.63% 0.55% 0.20% 25.06% 74.74% 0.20% 25.06% 74.74% 0.00% 50.37% 49.63% 82.11% 99.00% 64.24% 81.18% 86.25% 86.37% 90.52% 0.70% 0.56% 79.46% 37.86% 77.97% 92.15% 86.06% 86.07% 83.41% 92.93% 73.11% 74.62% 73.44% 71.82% 0.00% 0.00% 0.00% 0.02% 61.09% 78.74% 69.58% 73.78% 36.13% 73.46% 14.94% 0.64% 27.53% 18.79% 13.73% 12.62% 9.48% 22.74% 74.36% 18.50% 47.01% 18.32% 7.73% 12.15% 13.93% 15.21% 7.07% 23.66% 22.46% 21.12% 28.18% 21.68% 21.28% 27.92% 13.33% 28.21% 17.71% 28.66% 25.99% 50.32% 26.32% 2.95% 0.36% 8.24% 0.03% 0.02% 1.01% 0.00% 76.56% 25.08% 2.04% 15.14% 3.71% 0.12% 1.79% 0.00% 1.38% 0.00% 3.23% 2.92% 5.45% 0.00% 78.32% 78.72% 72.08% 86.64% 10.70% 3.56% 1.76% 0.23% 13.55% 0.22% # of Stocks Average Mktcap in Billions Weighted Average Mktcap in Billions Median Mktcap in Billions 558 1273 487 487 257 452 1152 1102 685 728 197 883 237 552 808 808 1677 $23.87 $29.97 $1.49 $1.49 $11.23 $33.12 $19.11 $19.76 $19.62 $17.49 $16.28 $18.90 $46.67 $6.44 $1.21 $1.21 $1.51 $93.40 $96.33 $1.54 $1.54 $39.69 $66.64 $52.63 $54.82 $62.52 $59.73 $56.02 $58.84 $81.53 $7.62 $1.50 $1.50 $2.40 $9.32 $14.52 $1.36 $1.36 $4.84 $19.49 $9.31 $9.78 $7.86 $6.05 $6.91 $9.31 $30.84 $5.41 $1.05 $1.05 $1.17 396 89 96 529 451 127 233 367 236 200 210 1063 352 140 113 75 55 192 195 226 302 589 552 782 628 1044 188 601 149 65 72 $18.28 $52.46 $23.84 $17.92 $20.08 $20.17 $23.92 $1.27 $2.69 $19.99 $10.49 $11.91 $28.38 $17.57 $25.82 $18.90 $30.38 $11.43 $11.37 $9.53 $12.69 $1.02 $1.02 $1.10 $1.03 $6.91 $26.75 $12.96 $13.12 $13.16 $13.80 $66.67 $51.87 $38.29 $59.38 $57.09 $63.21 $52.40 $1.55 $3.55 $70.92 $16.80 $60.56 $73.30 $72.91 $64.01 $52.33 $59.28 $39.00 $39.66 $38.12 $36.84 $1.36 $1.36 $1.59 $1.29 $30.85 $56.45 $53.32 $36.80 $17.58 $42.09 $5.89 $36.83 $8.80 $9.01 $9.24 $7.74 $14.32 $1.03 $2.17 $7.54 $4.66 $3.94 $15.98 $4.77 $10.18 $6.16 $15.87 $4.79 $4.84 $3.72 $6.62 $0.82 $0.83 $0.88 $0.85 $2.75 $12.58 $6.05 $6.59 $4.74 $6.13 Page 6 of 19 Subject to change. . FOR INSTITUTIONAL OR REGISTERED REPRESENTATIVE USE ONLY. NOT FOR PUBLIC USE OR VIEWING. WisdomTree ETFs FUND CHARACTERISTICS REPORT [as of December 31, 2015] Asset Allocation Group Emerging Markets China Alternative Real Estate Themes Fund WisdomTree Emerging Markets High Dividend Fund WisdomTree Emerging Markets Quality Dividend Growth Fund WisdomTree Emerging Markets SmallCap Dividend Fund WisdomTree Emerging Markets ex-State-Owned Enterprises Fund Vanguard FTSE Emerging Markets ETF iShares MSCI Emerging Markets ETF WisdomTree Emerging Markets Consumer Growth Fund EGShares Emerging Markets Consumer ETF WisdomTree Korea Hedged Equity Fund iShares MSCI South Korea Capped ETF WisdomTree India Earnings Fund WisdomTree Middle East Dividend Fund WisdomTree China ex-State-Owned Enterprises Fund iShares MSCI China ETF iShares China Large-Cap ETF WisdomTree Global ex-US Real Estate Fund WisdomTree Global ex-U.S. Hedged Real Estate Fund SPDR Dow Jones International Real Estate ETF iShares International Developed Property ETF WisdomTree Commodity Country Equity Fund WisdomTree Global Natural Resources Fund SPDR S&P Global Natural Resources ETF WisdomTree Global ex-US Utilities Sector Fund SPDR S&P International Utilities Sector ETF % Weight of % Weight of ETF % Weight of ETF ETF IOPV with IOPV with Market IOPV with Market Market Cap Cap Less than $2 Cap $2-$10 Greater than Billion Billion $10 Billion 48.40% 35.57% 16.03% 42.97% 35.48% 21.55% 1.07% 15.98% 82.95% 60.37% 37.20% 2.43% 58.50% 34.90% 6.60% 64.45% 33.05% 2.51% 48.56% 32.97% 18.47% 74.58% 25.42% 0.00% 41.24% 48.84% 9.92% 65.38% 31.50% 3.12% 60.97% 26.52% 12.51% 31.85% 58.04% 10.11% 63.05% 35.43% 1.52% 78.31% 21.69% 0.00% 100.00% 0.00% 0.00% 38.87% 46.62% 14.51% 39.91% 45.69% 14.41% 40.79% 45.20% 14.01% 37.78% 40.48% 21.74% 63.25% 28.42% 8.34% 65.85% 32.98% 1.17% 76.11% 23.89% 0.00% 37.96% 50.32% 11.72% 68.22% 27.45% 4.32% # of Stocks Average Mktcap in Billions Weighted Average Mktcap in Billions Median Mktcap in Billions 319 250 593 426 1061 805 207 30 45 106 229 68 65 159 49 176 179 129 384 158 93 90 97 126 $6.85 $5.05 $1.30 $9.99 $9.02 $11.19 $6.91 $17.16 $9.03 $8.06 $4.60 $4.62 $16.04 $24.14 $57.19 $5.09 $5.32 $4.03 $2.51 $14.81 $27.90 $30.00 $9.17 $6.68 $27.45 $21.64 $1.60 $43.24 $42.05 $47.86 $25.45 $23.86 $22.31 $42.13 $22.01 $8.95 $55.28 $100.77 $115.00 $10.39 $10.64 $10.36 $10.04 $24.68 $37.38 $53.30 $11.29 $21.56 $1.53 $1.63 $0.85 $5.48 $3.71 $5.56 $2.11 $12.39 $3.50 $4.11 $1.54 $2.81 $5.31 $8.27 $29.36 $2.75 $2.75 $2.39 $1.16 $7.48 $12.58 $12.93 $6.15 $2.89 Page 7 of 19 Subject to change. . FOR INSTITUTIONAL OR REGISTERED REPRESENTATIVE USE ONLY. NOT FOR PUBLIC USE OR VIEWING. WisdomTree ETFs FUND CHARACTERISTICS REPORT [as of December 31, 2015] ETF SECTOR CHARACTERISTICS (% WEIGHT) Asset Allocation Group Broad US Market Fund Consumer Consumer Discretionary Staples WisdomTree Total Dividend Fund 9.59% WisdomTree Total Earnings Fund 12.62% iShares Russell 3000 ETF 13.47% Vanguard Total Stock Market ETF 13.33% WisdomTree LargeCap Dividend Fund 8.69% Large Cap WisdomTree Earnings 500 Fund 11.77% US iShares Russell 1000 ETF 13.50% iShares Core S&P 500 ETF 12.89% US Local Econo WisdomTree Strong Dollar U.S. Equity Fund 19.38% Exporters WisdomTree Weak Dollar U.S. Equity Fund 11.99% WisdomTree LargeCap Value Fund 21.34% iShares S&P 500 Value ETF 7.42% Large Cap iShares S&P 500 Growth ETF 18.11% US iShares Russell 1000 Value ETF 5.20% Growth/Value iShares Russell 1000 Growth ETF 21.22% iShares Core U.S.
Value ETF 5.60% iShares Core U.S. Growth ETF 19.32% WisdomTree Dynamic Long/Short U.S. Equity Fund* 15.21% Alternative SPDR S&P 500 ETF 12.88% WisdomTree High Dividend Fund 7.42% Equity Income/ WisdomTree Dividend ex-Financials Fund 13.97% Dividend GrowthiShares Select Dividend ETF 11.47% WisdomTree U.S.
Quality Dividend Growth Fund 19.87% Vanguard Dividend Appreciation Fund 9.72% SPDR S&P Dividend ETF 6.86% WisdomTree Midcap Dividend Fund 18.43% WisdomTree Midcap Earnings Fund 18.29% Vanguard Mid-Cap ETF 19.09% Mid Cap iShares Russell Mid-Cap ETF 16.34% US iShares Core S&P Mid-Cap ETF 13.01% iShares Russell Mid-Cap Value ETF 8.31% iShares Russell Mid-Cap Growth ETF 24.28% iShares S&P Mid-Cap 400 Value ETF 12.18% iShares S&P Mid-Cap 400 Growth ETF 13.80% WisdomTree SmallCap Dividend Fund 17.91% WisdomTree SmallCap Earnings Fund 17.54% WisdomTree U.S. SmallCap Quality Dividend Growth Fund 24.90% Small Cap iShares Russell 2000 ETF 13.54% US iShares Russell 2000 Value ETF 10.33% iShares Russell 2000 Growth ETF 16.62% iShares Core S&P Small-Cap ETF 13.95% iShares S&P SmallCap 600 Value ETF 15.56% iShares S&P SmallCap 600 Growth ETF 12.51% Vanguard Small-Cap ETF 14.01% Vanguard Small-Cap Value ETF 12.13% Vanguard Small-Cap Growth ETF 16.21% *WisdomTree Dynamic Long/Short U.S. Equity Fund - all information is for the Long portion only. 12.91% 9.21% 8.80% 8.87% 14.77% 9.99% 9.22% 10.06% 9.54% 7.79% 16.42% 10.39% 9.77% 6.99% 11.29% 6.71% 11.07% 8.46% 10.34% 17.68% 10.95% 12.49% 17.99% 26.98% 13.12% 3.87% 4.05% 5.80% 6.24% 3.28% 4.01% 8.45% 2.55% 3.97% 5.33% 3.91% 8.33% 3.47% 3.35% 3.55% 2.89% 3.22% 2.60% 3.48% 3.76% 3.15% The sector percentages represent the GICS (Global Industry Classification Standard) groupings. Subject to change. Energy Financials Health Care Industrials Information Technology Materials Telecom. Services Utilities Other 9.77% 5.03% 5.84% 6.05% 10.80% 5.11% 6.20% 6.50% 0.24% 4.78% 8.09% 11.81% 1.31% 12.28% 0.53% 11.67% 2.58% 6.56% 6.45% 15.48% 13.80% 9.85% 1.10% 1.05% 3.68% 5.43% 5.16% 4.85% 4.38% 3.02% 8.11% 0.69% 6.20% 0.00% 5.10% 5.78% 1.48% 2.71% 4.44% 1.05% 2.56% 3.77% 1.47% 3.22% 3.85% 2.47% 20.21% 23.60% 18.12% 18.05% 15.91% 23.11% 17.47% 16.47% 25.47% 7.70% 15.17% 25.82% 7.59% 30.27% 5.55% 31.24% 5.96% 17.59% 16.39% 15.07% 0.00% 10.66% 3.73% 6.35% 24.39% 24.89% 24.70% 19.29% 23.28% 27.22% 34.57% 12.09% 27.12% 27.30% 24.99% 25.15% 10.27% 24.98% 42.90% 7.73% 23.34% 22.00% 24.53% 25.64% 30.53% 19.91% 9.81% 10.55% 14.77% 14.60% 11.31% 11.27% 14.65% 15.15% 9.32% 19.51% 11.70% 12.27% 17.93% 11.96% 17.14% 11.39% 14.46% 12.62% 15.26% 7.17% 8.64% 4.29% 15.00% 12.45% 7.44% 2.02% 5.77% 10.22% 9.96% 9.99% 6.26% 13.62% 4.06% 15.61% 3.94% 8.89% 2.82% 16.59% 4.54% 28.18% 13.40% 5.70% 20.31% 12.43% 7.20% 18.61% 10.34% 12.16% 10.66% 10.69% 10.13% 10.95% 10.56% 10.05% 10.56% 13.80% 14.17% 11.02% 9.11% 10.39% 10.71% 10.49% 11.61% 11.58% 10.00% 7.47% 10.34% 9.29% 19.56% 20.22% 15.10% 13.81% 18.13% 12.73% 12.67% 15.07% 9.75% 15.55% 16.90% 13.34% 16.35% 20.09% 24.96% 12.30% 11.87% 12.71% 17.27% 19.67% 15.12% 14.23% 15.90% 12.25% 13.20% 18.63% 19.99% 19.86% 14.62% 19.59% 20.05% 20.70% 5.99% 25.46% 6.80% 8.12% 32.71% 11.53% 28.00% 11.48% 28.72% 19.17% 20.39% 7.39% 10.84% 1.50% 19.74% 14.52% 2.44% 7.83% 12.48% 16.04% 14.84% 16.56% 9.69% 19.94% 12.89% 20.04% 7.22% 11.21% 9.57% 18.19% 10.90% 25.22% 16.99% 15.81% 18.05% 17.13% 11.59% 23.65% 3.11% 2.83% 3.08% 3.16% 2.50% 2.66% 3.04% 2.76% 0.00% 8.80% 3.61% 3.23% 2.32% 2.64% 3.43% 2.69% 4.13% 4.36% 2.70% 2.10% 9.23% 3.97% 3.02% 6.29% 11.46% 7.76% 4.60% 5.98% 5.25% 6.54% 5.62% 4.88% 8.68% 4.51% 6.92% 4.04% 12.09% 3.61% 3.22% 3.99% 4.46% 6.33% 2.78% 4.65% 6.81% 2.07% 5.21% 2.06% 2.18% 2.17% 5.97% 2.31% 2.29% 2.43% 4.69% 0.00% 0.30% 4.05% 0.89% 2.54% 2.06% 2.41% 2.01% 2.21% 2.49% 10.00% 5.98% 2.13% 0.00% 0.10% 3.05% 1.33% 0.26% 1.16% 0.99% 0.17% 1.58% 0.40% 0.35% 0.00% 2.08% 0.95% 1.42% 0.85% 0.90% 0.82% 0.92% 0.90% 0.92% 0.37% 0.47% 0.26% 5.86% 3.30% 3.08% 3.20% 4.95% 3.14% 3.02% 2.99% 14.83% 0.17% 2.35% 5.86% 0.26% 6.21% 0.05% 6.31% 0.14% 2.24% 3.11% 10.21% 15.41% 34.36% 0.00% 2.32% 11.54% 14.53% 6.21% 4.82% 6.05% 5.14% 12.08% 0.10% 9.06% 1.43% 9.43% 2.26% 4.16% 3.76% 7.55% 0.12% 4.22% 7.04% 1.70% 4.63% 7.75% 0.96% 0.00% 0.00% 0.03% 0.03% 0.35% 0.10% 0.00% 0.00% 0.00% 0.00% 0.06% 0.00% 0.00% 0.00% 0.00% 0.00% 0.00% 0.00% 0.00% 0.02% 0.83% 0.00% 0.00% 0.00% 0.91% 0.12% 0.34% 0.00% 0.00% 0.00% 0.00% 0.00% 0.00% 0.00% 0.73% 0.18% 0.00% 0.00% 0.00% 0.00% 0.00% 0.00% 0.00% 0.22% 0.02% 0.46% Page 8 of 19 .
FOR INSTITUTIONAL OR REGISTERED REPRESENTATIVE USE ONLY. NOT FOR PUBLIC USE OR VIEWING. WisdomTree ETFs FUND CHARACTERISTICS REPORT [as of December 31, 2015] Asset Allocation Group Fund WisdomTree Global High Dividend Fund iShares MSCI ACWI ETF WisdomTree Global SmallCap Dividend Fund WisdomTree Global Hedged SmallCap Dividend Fund WisdomTree Global ex-U.S. Quality Dividend Growth Fund Global ex-U.S. WisdomTree Global ex-U.S.
Hedged Dividend Fund Vanguard FTSE All-World ex-US ETF iShares MSCI ACWI ex-U.S. ETF WisdomTree International Equity Fund WisdomTree International Hedged Equity Fund Intl WisdomTree International Hedged Quality Dividend Growth Fund iShares MSCI EAFE ETF WisdomTree International LargeCap Dividend Fund Intl Cap WisdomTree International Midcap Dividend Fund Segments WisdomTree International SmallCap Dividend Fund WisdomTree International Hedged SmallCap Dividend Fund iShares MSCI EAFE Small-Cap ETF WisdomTree International High Dividend Fund Intl WisdomTree International Dividend ex-Financials Fund Value iShares International Select Dividend ETF iShares MSCI EAFE Growth ETF iShares MSCI EAFE Value ETF WisdomTree Europe Hedged Equity Fund iShares MSCI EMU ETF WisdomTree Europe SmallCap Dividend Fund WisdomTree Europe Hedged SmallCap Equity Fund WisdomTree Europe Quality Dividend Growth Fund WisdomTree Europe Local Recovery Fund Europe Vanguard FTSE Europe ETF iShares Europe ETF WisdomTree United Kingdom Hedged Equity Fund iShares MSCI United Kingdom ETF WisdomTree Germany Hedged Equity Fund iShares MSCI Germany ETF WisdomTree Japan Quality Dividend Growth Fund WisdomTree Japan Hedged Quality Dividend Growth Fund WisdomTree Japan Hedged Equity Fund iShares MSCI Japan ETF WisdomTree Japan Hedged SmallCap Equity Fund Japan WisdomTree Japan SmallCap Dividend Fund & iShares MSCI Japan Small-Cap ETF Asia SPDR Russell Nomura Small Cap Japan ETF Vanguard FTSE Pacific ETF WisdomTree Asia Pacific ex-Japan Fund iShares MSCI All Country Asia ex-Japan ETF iShares MSCI Pacific ex-Japan ETF WisdomTree Australia Dividend Fund iShares MSCI Australia ETF Global Consumer Consumer Discretionary Staples 7.23% 12.98% 15.49% 15.49% 20.42% 11.91% 11.75% 11.91% 11.69% 11.93% 19.37% 13.09% 9.53% 15.26% 19.31% 19.31% 17.20% 6.60% 8.84% 7.09% 16.39% 9.76% 19.11% 14.83% 16.17% 14.26% 19.63% 21.19% 12.20% 11.21% 5.23% 10.91% 22.55% 21.15% 24.83% 24.47% 25.23% 21.92% 23.78% 24.06% 18.41% 20.98% 16.65% 4.50% 8.59% 4.40% 14.55% 2.40% 9.94% 10.30% 5.01% 5.01% 14.46% 10.57% 10.54% 10.98% 12.02% 11.42% 21.14% 11.95% 13.72% 7.73% 8.12% 8.12% 6.89% 11.45% 11.55% 6.36% 19.64% 3.83% 20.52% 11.41% 6.81% 7.09% 20.92% 0.00% 13.46% 15.12% 24.46% 18.80% 4.16% 4.00% 10.85% 11.10% 8.89% 7.23% 10.28% 9.61% 11.45% 10.18% 7.33% 6.51% 5.56% 5.32% 9.50% 7.70% The sector percentages represent the GICS (Global Industry Classification Standard) groupings. Subject to change. Energy Financials Health Care Industrials Information Technology Materials Telecom. Services Utilities Other 13.92% 6.21% 3.86% 3.86% 5.38% 8.29% 5.53% 6.11% 8.37% 7.90% 0.12% 4.68% 10.10% 3.11% 3.29% 3.29% 2.25% 11.38% 12.69% 13.43% 0.80% 8.62% 1.39% 4.75% 3.36% 2.57% 0.13% 5.24% 5.83% 6.62% 15.48% 12.30% 0.00% 0.00% 0.00% 0.00% 0.41% 0.89% 1.05% 0.80% 0.65% 1.07% 1.47% 7.64% 4.10% 2.88% 8.95% 4.75% 24.39% 20.98% 26.30% 26.30% 13.08% 24.37% 27.14% 26.91% 24.29% 24.14% 5.77% 25.98% 24.13% 23.48% 18.49% 18.49% 22.29% 24.85% 0.00% 25.62% 14.76% 37.34% 10.13% 23.01% 19.50% 21.83% 3.34% 33.22% 23.13% 22.32% 14.79% 23.75% 17.53% 18.46% 4.81% 5.21% 11.38% 19.33% 11.07% 11.46% 18.66% 12.83% 25.66% 25.45% 32.34% 56.63% 23.56% 55.12% 7.95% 12.83% 3.64% 3.64% 10.58% 9.33% 9.67% 9.85% 9.40% 9.28% 15.14% 12.16% 11.55% 4.10% 4.98% 4.98% 7.79% 8.59% 9.53% 4.04% 15.85% 8.06% 10.86% 8.55% 4.01% 5.87% 19.85% 0.00% 13.50% 14.87% 11.74% 10.09% 9.76% 15.00% 6.61% 6.75% 9.71% 8.26% 5.29% 4.99% 5.52% 6.23% 6.60% 1.08% 2.72% 4.11% 7.23% 6.51% 7.02% 10.54% 19.83% 19.83% 9.62% 9.41% 11.23% 11.01% 11.13% 11.78% 16.25% 12.10% 7.66% 21.82% 24.54% 24.54% 22.93% 9.98% 12.36% 9.85% 13.50% 11.13% 19.11% 13.27% 26.91% 24.15% 19.01% 24.68% 12.55% 10.81% 6.48% 6.73% 16.87% 11.93% 22.49% 22.20% 22.28% 18.73% 23.37% 23.84% 23.60% 26.19% 16.85% 6.84% 8.77% 9.32% 12.71% 6.00% 5.73% 14.86% 7.70% 7.70% 14.14% 5.68% 8.44% 8.09% 2.80% 3.47% 7.63% 4.94% 2.53% 4.46% 9.11% 9.11% 9.66% 1.32% 6.85% 3.72% 7.42% 2.61% 6.65% 6.45% 12.05% 5.31% 8.52% 6.89% 4.43% 3.81% 1.37% 1.51% 6.34% 9.06% 12.33% 12.48% 12.84% 10.23% 11.57% 12.11% 10.84% 12.43% 9.45% 12.76% 23.22% 0.42% 2.89% 0.47% 4.57% 4.35% 9.23% 9.23% 3.82% 5.21% 6.62% 6.46% 5.49% 5.99% 3.29% 6.37% 4.63% 8.90% 7.68% 7.68% 7.82% 5.23% 8.87% 7.94% 6.32% 6.54% 7.32% 7.38% 7.68% 8.77% 6.33% 8.78% 6.54% 6.34% 7.10% 5.06% 12.66% 12.63% 7.12% 6.70% 8.43% 5.52% 13.17% 12.89% 10.31% 9.60% 9.40% 8.19% 4.28% 7.63% 14.10% 12.16% 10.55% 3.86% 1.95% 1.95% 2.81% 9.07% 5.42% 5.23% 8.99% 8.44% 9.75% 5.07% 10.67% 4.11% 1.28% 1.28% 1.53% 12.13% 13.93% 10.90% 4.26% 5.80% 4.75% 5.27% 0.63% 4.59% 2.20% 0.00% 4.51% 4.97% 8.03% 6.36% 6.59% 5.49% 10.97% 11.09% 0.84% 5.37% 0.00% 0.00% 0.05% 0.06% 3.56% 18.40% 6.25% 3.71% 4.31% 2.32% 8.70% 3.08% 6.89% 6.89% 2.77% 4.61% 3.67% 3.45% 5.81% 5.64% 1.54% 3.65% 5.50% 7.02% 3.20% 3.20% 1.60% 8.47% 15.02% 11.05% 1.07% 6.30% 0.17% 5.08% 2.88% 5.56% 0.08% 0.00% 3.78% 3.93% 5.31% 4.49% 3.56% 2.28% 0.00% 0.00% 0.00% 2.50% 0.42% 0.24% 0.51% 0.43% 3.02% 5.07% 4.15% 5.58% 2.20% 2.57% 0.00% 0.00% 0.12% 0.12% 2.94% 1.54% 0.00% 0.00% 0.01% 0.00% 0.00% 0.00% 0.00% 0.00% 0.00% 0.00% 0.03% 0.00% 0.36% 0.00% 0.00% 0.00% 0.00% 0.00% 0.00% 0.00% 0.00% 0.00% 0.06% 0.00% 0.00% 0.00% 0.00% 0.00% 0.00% 0.00% 0.00% 0.00% 0.00% 0.00% 0.00% 0.00% 0.00% 3.56% 0.00% 0.00% 0.00% 0.00% Page 9 of 19 . FOR INSTITUTIONAL OR REGISTERED REPRESENTATIVE USE ONLY. NOT FOR PUBLIC USE OR VIEWING. WisdomTree ETFs FUND CHARACTERISTICS REPORT [as of December 31, 2015] Asset Allocation Group Emerging Markets China Themes Fund WisdomTree Emerging Markets High Dividend Fund WisdomTree Emerging Markets Quality Dividend Growth Fund WisdomTree Emerging Markets SmallCap Dividend Fund WisdomTree Emerging Markets ex-State-Owned Enterprises Fund Vanguard FTSE Emerging Markets ETF iShares MSCI Emerging Markets ETF WisdomTree Emerging Markets Consumer Growth Fund EGShares Emerging Markets Consumer ETF WisdomTree Korea Hedged Equity Fund iShares MSCI South Korea Capped ETF WisdomTree India Earnings Fund WisdomTree Middle East Dividend Fund WisdomTree China ex-State-Owned Enterprises Fund iShares MSCI China ETF iShares China Large-Cap ETF WisdomTree Commodity Country Equity Fund WisdomTree Global Natural Resources Fund SPDR S&P Global Natural Resources ETF Consumer Consumer Discretionary Staples 5.83% 14.96% 17.02% 14.75% 8.94% 10.05% 32.27% 50.46% 27.86% 16.17% 10.03% 1.63% 29.80% 6.21% 2.09% 4.98% 0.00% 0.00% 1.20% 15.32% 6.19% 11.15% 8.03% 8.39% 26.90% 46.75% 1.34% 9.78% 4.81% 0.28% 8.63% 3.00% 1.53% 9.49% 4.31% 4.19% The sector percentages represent the GICS (Global Industry Classification Standard) groupings. Subject to change. Energy Financials Health Care Industrials Information Technology Materials Telecom. Services Utilities Other 15.37% 2.27% 2.75% 3.64% 8.12% 7.12% 0.00% 0.00% 0.00% 2.43% 19.34% 2.00% 0.00% 6.52% 11.68% 20.61% 61.52% 32.65% 25.87% 18.21% 21.77% 20.96% 30.32% 27.64% 15.44% 0.00% 0.00% 13.89% 22.52% 61.68% 19.54% 37.29% 54.08% 25.05% 0.00% 2.15% 0.26% 2.48% 2.63% 4.21% 3.36% 2.95% 0.93% 0.00% 2.32% 2.12% 4.90% 0.00% 5.98% 2.26% 0.00% 1.88% 0.00% 0.00% 4.84% 9.22% 14.00% 6.13% 7.82% 7.03% 3.30% 2.79% 17.73% 10.70% 5.03% 9.62% 2.71% 7.73% 7.45% 5.13% 0.00% 0.00% 12.78% 17.30% 18.58% 27.82% 15.53% 20.83% 12.84% 0.00% 24.57% 33.82% 18.86% 0.00% 33.34% 22.52% 9.16% 0.53% 0.00% 0.00% 13.36% 2.08% 10.01% 5.65% 6.73% 6.12% 0.00% 0.00% 26.18% 8.03% 5.70% 1.29% 0.00% 1.28% 0.72% 11.76% 33.00% 61.01% 14.01% 12.30% 0.66% 4.52% 7.16% 6.75% 4.24% 0.00% 0.00% 0.75% 2.99% 22.43% 0.00% 9.42% 11.64% 12.44% 0.00% 0.00% 6.43% 1.73% 5.40% 1.17% 3.92% 3.12% 4.08% 0.00% 0.00% 2.30% 5.84% 1.07% 0.00% 3.77% 1.63% 8.06% 0.00% 0.00% 0.06% 4.14% 0.97% 0.00% 0.07% 0.00% 0.00% 0.00% 0.00% 0.00% 0.00% 0.00% 0.00% 0.00% 0.00% 0.08% 1.17% 0.00% Page 10 of 19 . FOR INSTITUTIONAL OR REGISTERED REPRESENTATIVE USE ONLY. NOT FOR PUBLIC USE OR VIEWING. WisdomTree ETFs FUND CHARACTERISTICS REPORT [as of December 31, 2015] ETF REIT CHARACTERISTICS (% WEIGHT) Asset Allocation Group Broad US Market Fund WisdomTree Total Dividend Fund WisdomTree Total Earnings Fund iShares Russell 3000 ETF Vanguard Total Stock Market ETF WisdomTree LargeCap Dividend Fund Large Cap WisdomTree Earnings 500 Fund US iShares Russell 1000 ETF iShares Core S&P 500 ETF US Local Economy WisdomTree Strong Dollar U.S. Equity Fund Exporters WisdomTree Weak Dollar U.S. Equity Fund WisdomTree LargeCap Value Fund iShares S&P 500 Value ETF Large Cap iShares S&P 500 Growth ETF US iShares Russell 1000 Value ETF Growth/Value iShares Russell 1000 Growth ETF iShares Core U.S.
Value ETF iShares Core U.S. Growth ETF WisdomTree Dynamic Long/Short U.S. Equity Fund* Alternative SPDR S&P 500 ETF WisdomTree High Dividend Fund Equity Income/ WisdomTree Dividend ex-Financials Fund Dividend Growth iShares Select Dividend ETF WisdomTree U.S.
Quality Dividend Growth Fund Vanguard Dividend Appreciation Fund SPDR S&P Dividend ETF WisdomTree Midcap Dividend Fund WisdomTree Midcap Earnings Fund Vanguard Mid-Cap ETF Mid Cap iShares Russell Mid-Cap ETF US iShares Core S&P Mid-Cap ETF iShares Russell Mid-Cap Value ETF iShares Russell Mid-Cap Growth ETF iShares S&P Mid-Cap 400 Value ETF iShares S&P Mid-Cap 400 Growth ETF WisdomTree SmallCap Dividend Fund WisdomTree SmallCap Earnings Fund WisdomTree U.S. SmallCap Quality Dividend Growth Fund Small Cap iShares Russell 2000 ETF US iShares Russell 2000 Value ETF iShares Russell 2000 Growth ETF iShares Core S&P Small-Cap ETF iShares S&P SmallCap 600 Value ETF iShares S&P SmallCap 600 Growth ETF Vanguard Small-Cap ETF Vanguard Small-Cap Value ETF Vanguard Small-Cap Growth ETF Global WisdomTree Global High Dividend Fund iShares MSCI ACWI ETF WisdomTree Global SmallCap Dividend Fund WisdomTree Global Hedged SmallCap Dividend Fund WisdomTree Global ex-U.S. Quality Dividend Growth Fund Global ex-U.S. WisdomTree Global ex-U.S.
Hedged Dividend Fund Vanguard FTSE All-World ex-US ETF iShares MSCI ACWI ex-U.S. ETF WisdomTree International Equity Fund WisdomTree International Hedged Equity Fund Intl WisdomTree International Hedged Quality Dividend Growth Fund iShares MSCI EAFE ETF REITS 7.78% 2.22% 4.06% 4.15% 4.35% 1.71% 3.65% 2.71% 12.76% 0.41% 0.00% 1.35% 4.00% 4.87% 2.51% 5.64% 2.45% 8.51% 2.79% 12.34% 0.00% 0.00% 0.00% 0.00% 9.80% 15.37% 6.46% 6.57% 9.75% 11.02% 15.17% 4.39% 8.97% 12.95% 14.21% 2.42% 1.10% 8.85% 14.94% 2.99% 7.60% 7.52% 7.68% 11.85% 11.07% 12.77% 4.79% 2.05% 11.25% 11.25% 1.10% 0.33% 1.10% 1.38% 0.57% 0.68% 0.12% 1.72% *WisdomTree Dynamic Long/Short U.S. Equity Fund - all information is for the Long portion only. Subject to change. Asset Allocation Group Intl Cap Segments Intl Growth/ Value Europe Japan & Asia Emerging Markets China Alternative Real Estate Themes Fund REITS WisdomTree International LargeCap Dividend Fund WisdomTree International Midcap Dividend Fund WisdomTree International SmallCap Dividend Fund WisdomTree International Hedged SmallCap Dividend Fund iShares MSCI EAFE Small-Cap ETF WisdomTree International High Dividend Fund WisdomTree International Dividend ex-Financials Fund iShares International Select Dividend ETF iShares MSCI EAFE Growth ETF iShares MSCI EAFE Value ETF WisdomTree Europe Hedged Equity Fund iShares MSCI EMU ETF WisdomTree Europe SmallCap Dividend Fund WisdomTree Europe Hedged SmallCap Equity Fund WisdomTree Europe Quality Dividend Growth Fund WisdomTree Europe Local Recovery Fund Vanguard FTSE Europe ETF iShares Europe ETF WisdomTree United Kingdom Hedged Equity Fund iShares MSCI United Kingdom ETF WisdomTree Germany Hedged Equity Fund iShares MSCI Germany ETF WisdomTree Japan Quality Dividend Growth Fund WisdomTree Japan Hedged Quality Dividend Growth Fund WisdomTree Japan Hedged Equity Fund iShares MSCI Japan ETF WisdomTree Japan Hedged SmallCap Equity Fund WisdomTree Japan SmallCap Dividend Fund iShares MSCI Japan Small-Cap ETF SPDR Russell Nomura Small Cap Japan ETF Vanguard FTSE Pacific ETF WisdomTree Asia Pacific ex-Japan Fund iShares MSCI All Country Asia ex-Japan ETF iShares MSCI Pacific ex-Japan ETF WisdomTree Australia Dividend Fund iShares MSCI Australia ETF WisdomTree Emerging Markets High Dividend Fund WisdomTree Emerging Markets Quality Dividend Growth Fund WisdomTree Emerging Markets SmallCap Dividend Fund WisdomTree Emerging Markets ex-State-Owned Enterprises Fund Vanguard FTSE Emerging Markets ETF iShares MSCI Emerging Markets ETF WisdomTree Emerging Markets Consumer Growth Fund EGShares Emerging Markets Consumer ETF WisdomTree Korea Hedged Equity Fund iShares MSCI South Korea Capped ETF WisdomTree India Earnings Fund WisdomTree Middle East Dividend Fund WisdomTree China ex-State-Owned Enterprises Fund iShares MSCI China ETF iShares China Large-Cap ETF WisdomTree Global ex-US Real Estate Fund WisdomTree Global ex-U.S.
Hedged Real Estate Fund SPDR Dow Jones International Real Estate ETF iShares International Developed Property ETF WisdomTree Commodity Country Equity Fund WisdomTree Global Natural Resources Fund SPDR S&P Global Natural Resources ETF Page 11 of 19 WisdomTree Global ex-US Utilities Sector Fund SPDR S&P International Utilities Sector ETF 0.25% 1.19% 1.95% 1.95% 6.32% 0.44% 0.00% 0.00% 0.95% 2.52% 0.00% 1.20% 4.79% 2.75% 0.24% 3.11% 1.41% 0.93% 0.51% 1.72% 0.00% 0.00% 0.00% 0.00% 0.00% 1.07% 0.00% 0.00% 8.37% 0.00% 2.27% 0.00% 0.83% 6.72% 0.00% 8.15% 0.25% 1.28% 0.64% 0.14% 0.65% 0.55% 1.19% 0.00% 0.00% 0.00% 0.00% 0.00% 0.00% 0.00% 0.00% 46.10% 45.50% 62.23% 51.69% 0.30% 0.00% 2.15% 0.00% 0.00% . FOR INSTITUTIONAL OR REGISTERED REPRESENTATIVE USE ONLY. NOT FOR PUBLIC USE OR VIEWING. WisdomTree ETFs FUND CHARACTERISTICS REPORT [as of December 31, 2015] Global Global ex-U.S. International WisdomTree Global High Dividend Fund AUSTRALIA AUSTRIA BELGIUM BRAZIL BRITAIN CANADA CHILE CHINA CZECH REPUBLIC DENMARK FINLAND FRANCE GERMANY GREECE HONG KONG HUNGARY INDIA INDONESIA IRELAND ISRAEL ITALY JAPAN LUXEMBOURG MALAYSIA MEXICO NETHERLANDS NEW ZEALAND NORWAY PERU PHILIPPINES POLAND PORTUGAL RUSSIA SINGAPORE SOUTH AFRICA SOUTH KOREA SPAIN SWEDEN SWITZERLAND TAIWAN THAILAND TURKEY UNITED STATES OTHER Subject to change. iShares MSCI ACWI ETF WisdomTree Global Hedged SmallCap Dividend Fund WisdomTree Global SmallCap Dividend Fund WisdomTree Global ex-U.S. Quality Dividend Growth Fund WisdomTree Global ex-U.S. Hedged Dividend Fund Vanguard FTSE All-World ex-US ETF iShares MSCI ACWI ex-U.S. ETF WisdomTree International Equity Fund WisdomTree International Hedged Quality Dividend Growth Fund iShares MSCI EAFE ETF 4.63% 0.11% 0.55% 0.99% 9.19% 3.16% 0.21% 3.31% 0.14% 0.06% 0.64% 3.19% 2.93% 0.00% 1.08% 0.08% 0.00% 0.17% 0.00% 0.10% 1.04% 2.15% 0.00% 0.45% 0.27% 0.95% 0.15% 0.52% 0.00% 0.13% 0.16% 0.15% 0.83% 0.85% 0.68% 0.21% 2.50% 1.38% 1.68% 1.52% 0.43% 0.13% 53.25% 0.00% 2.35% 0.08% 0.51% 0.50% 6.51% 2.68% 0.15% 2.03% 0.04% 0.63% 0.29% 3.25% 3.23% 0.00% 1.59% 0.04% 0.70% 0.28% 1.05% 0.26% 0.75% 7.85% 0.08% 0.31% 0.44% 1.10% 0.02% 0.20% 0.05% 0.18% 0.12% 0.03% 0.30% 0.52% 0.61% 1.51% 1.01% 0.96% 3.69% 1.13% 0.14% 0.15% 52.42% 0.27% 4.19% 0.08% 0.44% 1.04% 5.81% 4.95% 0.24% 1.90% 0.00% 0.32% 0.65% 1.03% 1.51% 0.00% 1.55% 0.00% 0.00% 0.58% 0.22% 0.69% 1.05% 11.08% 0.00% 0.61% 0.23% 0.33% 2.36% 1.69% 0.00% 0.25% 0.33% 0.40% 0.10% 0.86% 0.58% 0.69% 0.09% 1.36% 0.40% 2.93% 0.76% 0.19% 48.52% 0.00% 4.19% 0.08% 0.44% 1.04% 5.81% 4.95% 0.24% 1.90% 0.00% 0.32% 0.65% 1.03% 1.51% 0.00% 1.55% 0.00% 0.00% 0.58% 0.22% 0.69% 1.05% 11.08% 0.00% 0.61% 0.23% 0.33% 2.36% 1.69% 0.00% 0.25% 0.33% 0.40% 0.10% 0.86% 0.58% 0.69% 0.09% 1.36% 0.40% 2.93% 0.76% 0.19% 48.52% 0.00% 3.33% 0.03% 0.00% 7.99% 10.20% 1.20% 0.21% 6.67% 0.00% 4.72% 4.05% 1.23% 1.75% 0.00% 4.40% 0.00% 1.06% 1.06% 0.19% 0.73% 1.88% 8.23% 0.00% 0.29% 1.12% 0.79% 0.28% 1.17% 0.00% 0.79% 0.00% 0.00% 4.96% 0.31% 3.13% 1.88% 3.18% 4.11% 5.14% 7.87% 2.17% 0.84% 0.00% 3.05% 4.21% 0.15% 1.24% 0.47% 14.73% 5.68% 0.17% 2.88% 0.04% 1.62% 0.68% 8.16% 7.24% 0.00% 2.86% 0.05% 0.00% 0.31% 0.50% 0.55% 1.92% 18.32% 0.00% 0.23% 0.78% 3.30% 0.00% 0.40% 0.00% 0.23% 0.09% 0.12% 0.63% 0.84% 0.95% 2.93% 2.30% 2.28% 8.52% 2.43% 0.19% 0.13% 0.00% 1.86% 5.07% 0.14% 1.04% 1.12% 13.37% 4.96% 0.21% 3.94% 0.05% 1.41% 0.70% 6.78% 6.57% 0.02% 3.68% 0.05% 2.07% 0.45% 0.79% 0.59% 1.56% 18.55% 0.10% 0.64% 0.95% 2.41% 0.17% 0.39% 0.06% 0.33% 0.26% 0.12% 0.73% 0.95% 1.45% 3.05% 2.24% 2.08% 6.98% 2.49% 0.43% 0.28% 0.00% 0.78% 5.13% 0.11% 1.14% 1.09% 13.52% 5.68% 0.26% 4.19% 0.08% 1.27% 0.65% 7.04% 6.82% 0.00% 3.44% 0.06% 1.74% 0.57% 0.76% 0.54% 1.57% 17.17% 0.15% 0.64% 0.95% 2.48% 0.13% 0.40% 0.07% 0.26% 0.27% 0.06% 0.67% 0.85% 1.28% 3.23% 2.26% 2.10% 7.27% 2.44% 0.40% 0.30% 0.00% 0.96% 8.82% 0.37% 2.07% 0.00% 21.52% 0.00% 0.07% 0.00% 0.00% 1.26% 1.36% 10.39% 7.91% 0.00% 4.97% 0.00% 0.00% 0.00% 0.35% 0.75% 3.33% 11.39% 0.00% 0.00% 0.00% 3.33% 0.54% 1.38% 0.00% 0.00% 0.00% 0.39% 0.00% 2.11% 0.14% 0.00% 4.54% 3.76% 9.17% 0.00% 0.00% 0.00% 0.00% 0.09% 6.90% 0.00% 0.09% 0.00% 23.98% 0.00% 0.00% 0.00% 0.00% 4.58% 1.81% 6.42% 7.34% 0.00% 5.09% 0.00% 0.00% 0.00% 0.31% 1.44% 1.65% 12.82% 0.00% 0.00% 0.04% 2.63% 0.90% 1.82% 0.00% 0.00% 0.00% 0.23% 0.00% 0.73% 0.00% 0.00% 4.31% 6.59% 10.30% 0.00% 0.00% 0.00% 0.00% 0.00% 7.11% 0.18% 1.49% 0.00% 18.64% 0.00% 0.02% 0.00% 0.00% 1.66% 0.93% 9.84% 9.42% 0.00% 2.96% 0.00% 0.00% 0.00% 0.94% 0.79% 2.16% 21.68% 0.22% 0.00% 0.02% 3.50% 0.16% 0.57% 0.00% 0.00% 0.00% 0.09% 0.00% 1.23% 0.09% 0.00% 3.14% 2.92% 10.00% 0.00% 0.00% 0.00% 0.00% 0.23% Page 12 of 19 . FOR INSTITUTIONAL OR REGISTERED REPRESENTATIVE USE ONLY. NOT FOR PUBLIC USE OR VIEWING. WisdomTree ETFs FUND CHARACTERISTICS REPORT [as of December 31, 2015] International Cap Size WisdomTree WisdomTree WisdomTree International International International Midcap LargeCap Dividend SmallCap Dividend Dividend Fund Fund Fund AUSTRALIA AUSTRIA BELGIUM BRAZIL BRITAIN CANADA CHILE CHINA CZECH REPUBLIC DENMARK FINLAND FRANCE GERMANY GREECE HONG KONG HUNGARY INDIA INDONESIA IRELAND ISRAEL ITALY JAPAN LUXEMBOURG MALAYSIA MEXICO NETHERLANDS NEW ZEALAND NORWAY PERU PHILIPPINES POLAND PORTUGAL RUSSIA SINGAPORE SOUTH AFRICA SOUTH KOREA SPAIN SWEDEN SWITZERLAND TAIWAN THAILAND TURKEY UNITED STATES OTHER Subject to change. 8.09% 0.00% 1.80% 0.00% 22.23% 0.00% 0.00% 0.00% 0.00% 1.14% 1.03% 11.34% 8.64% 0.00% 5.73% 0.00% 0.00% 0.00% 0.05% 0.42% 2.98% 11.03% 0.00% 0.00% 0.00% 4.03% 0.00% 1.10% 0.00% 0.00% 0.00% 0.22% 0.00% 1.20% 0.00% 0.00% 5.10% 3.34% 10.53% 0.00% 0.00% 0.00% 0.00% 0.00% 8.00% 1.29% 2.52% 0.00% 17.48% 0.00% 0.12% 0.00% 0.00% 1.46% 2.26% 7.30% 5.29% 0.00% 5.88% 0.00% 0.00% 0.00% 0.56% 1.25% 3.68% 20.72% 0.00% 0.00% 0.04% 1.75% 1.20% 1.53% 0.00% 0.00% 0.00% 0.92% 0.00% 4.51% 0.44% 0.00% 2.99% 3.95% 4.37% 0.00% 0.00% 0.00% 0.00% 0.49% 11.25% 0.50% 1.89% 0.00% 16.13% 0.00% 0.00% 0.00% 0.00% 1.12% 3.27% 2.86% 4.29% 0.00% 1.99% 0.00% 0.00% 0.05% 0.79% 2.00% 4.55% 26.56% 0.00% 0.00% 0.00% 1.40% 4.78% 3.75% 0.00% 0.00% 0.00% 0.66% 0.00% 3.19% 0.00% 0.00% 0.71% 6.22% 1.72% 0.00% 0.00% 0.00% 0.00% 0.30% International Growth / Value WisdomTree International Hedged SmallCap Dividend Fund iShares MSCI EAFE Small-Cap ETF WisdomTree International High Dividend Fund WisdomTree International Dividend exFinancials Fund 11.25% 0.50% 1.89% 0.00% 16.13% 0.00% 0.00% 0.00% 0.00% 1.12% 3.27% 2.86% 4.29% 0.00% 1.99% 0.00% 0.00% 0.05% 0.79% 2.00% 4.55% 26.56% 0.00% 0.00% 0.00% 1.40% 4.78% 3.75% 0.00% 0.00% 0.00% 0.66% 0.00% 3.19% 0.00% 0.00% 0.71% 6.22% 1.72% 0.00% 0.00% 0.00% 0.00% 0.30% 5.56% 1.01% 1.91% 0.00% 18.72% 0.03% 0.00% 0.00% 0.00% 1.84% 1.40% 3.77% 5.97% 0.00% 2.56% 0.00% 0.02% 0.00% 2.02% 1.23% 3.72% 29.98% 0.60% 0.01% 0.00% 1.95% 1.10% 1.30% 0.01% 0.00% 0.00% 0.30% 0.00% 1.97% 0.03% 0.00% 2.24% 4.95% 4.25% 0.00% 0.00% 0.00% 0.00% 1.55% 11.77% 0.39% 0.84% 0.00% 24.06% 0.00% 0.00% 0.00% 0.00% 0.23% 1.86% 10.16% 8.83% 0.00% 6.31% 0.00% 0.00% 0.00% 0.00% 0.58% 3.71% 3.70% 0.00% 0.00% 0.00% 2.61% 0.90% 1.72% 0.00% 0.00% 0.00% 0.51% 0.00% 2.78% 0.09% 0.00% 5.50% 3.99% 9.44% 0.00% 0.00% 0.00% 0.00% 0.02% 8.84% 0.00% 0.97% 0.00% 24.65% 0.00% 0.00% 0.00% 0.00% 0.89% 2.54% 9.02% 8.85% 0.00% 2.95% 0.00% 0.00% 0.00% 0.00% 0.82% 5.34% 7.27% 0.00% 0.00% 0.00% 1.35% 0.00% 2.40% 0.00% 0.00% 0.00% 1.73% 0.00% 1.19% 0.00% 0.00% 7.13% 4.64% 9.07% 0.00% 0.00% 0.00% 0.00% 0.36% iShares International iShares MSCI EAFE iShares MSCI EAFE Select Dividend ETF Growth ETF Value ETF 26.30% 0.70% 0.88% 0.00% 19.58% 5.15% 0.00% 0.00% 0.00% 0.61% 7.34% 7.92% 2.70% 0.00% 2.78% 0.00% 0.00% 0.00% 0.00% 0.00% 4.43% 0.74% 0.00% 0.00% 0.00% 2.95% 3.55% 0.48% 0.00% 0.00% 0.00% 0.00% 0.00% 1.60% 0.00% 0.00% 3.44% 3.47% 4.24% 0.00% 0.00% 0.00% 0.00% 1.15% 7.00% 0.06% 1.99% 0.00% 16.80% 0.00% 0.01% 0.00% 0.00% 2.80% 0.76% 8.04% 9.65% 0.00% 3.02% 0.00% 0.00% 0.00% 1.83% 0.72% 1.63% 22.95% 0.06% 0.00% 0.04% 2.89% 0.16% 0.09% 0.00% 0.00% 0.00% 0.07% 0.00% 1.25% 0.14% 0.00% 2.24% 2.96% 12.53% 0.00% 0.00% 0.00% 0.00% 0.31% 7.06% 0.31% 0.92% 0.00% 20.10% 0.00% 0.03% 0.00% 0.00% 0.44% 1.10% 11.51% 8.92% 0.00% 2.91% 0.00% 0.00% 0.00% 0.00% 0.83% 2.66% 22.16% 0.37% 0.00% 0.00% 4.09% 0.16% 1.07% 0.00% 0.00% 0.00% 0.10% 0.00% 1.19% 0.04% 0.00% 3.99% 2.81% 7.10% 0.00% 0.00% 0.00% 0.00% 0.13% Page 13 of 19 . FOR INSTITUTIONAL OR REGISTERED REPRESENTATIVE USE ONLY. NOT FOR PUBLIC USE OR VIEWING. WisdomTree ETFs FUND CHARACTERISTICS REPORT [as of December 31, 2015] Europe Emerging Markets WisdomTree Europe Hedged Equity Fund AUSTRALIA AUSTRIA BELGIUM BRAZIL BRITAIN CANADA CHILE CHINA CZECH REPUBLIC DENMARK FINLAND FRANCE GERMANY GREECE HONG KONG HUNGARY INDIA INDONESIA IRELAND ISRAEL ITALY JAPAN LUXEMBOURG MALAYSIA MEXICO NETHERLANDS NEW ZEALAND NORWAY PERU PHILIPPINES POLAND PORTUGAL RUSSIA SINGAPORE SOUTH AFRICA SOUTH KOREA SPAIN SWEDEN SWITZERLAND TAIWAN THAILAND TURKEY UNITED STATES OTHER Subject to change. iShares MSCI EMU ETF WisdomTree Europe SmallCap Dividend Fund WisdomTree Europe Hedged SmallCap Equity Fund WisdomTree Europe Quality Dividend Growth Fund WisdomTree Europe Local Recovery Fund Vanguard FTSE Europe ETF iShares Europe ETF 0.00% 0.38% 8.12% 0.00% 0.00% 0.00% 0.00% 0.00% 0.00% 0.00% 4.19% 26.32% 26.77% 0.00% 0.00% 0.00% 0.00% 0.00% 1.14% 0.00% 2.02% 0.00% 0.00% 0.00% 0.00% 14.66% 0.00% 0.00% 0.00% 0.00% 0.00% 0.52% 0.00% 0.00% 0.00% 0.00% 15.26% 0.00% 0.61% 0.00% 0.00% 0.00% 0.00% 0.00% 0.00% 0.60% 4.78% 0.00% 3.05% 0.00% 0.00% 0.00% 0.00% 0.00% 3.01% 31.68% 30.02% 0.00% 0.00% 0.00% 0.00% 0.00% 1.34% 0.00% 7.03% 0.00% 0.59% 0.00% 0.00% 7.38% 0.00% 0.00% 0.00% 0.00% 0.00% 0.28% 0.00% 0.00% 0.00% 0.00% 10.14% 0.00% 0.11% 0.00% 0.00% 0.00% 0.00% 0.00% 0.00% 1.70% 5.09% 0.00% 25.62% 0.00% 0.00% 0.00% 0.00% 3.38% 6.79% 3.79% 9.52% 0.00% 0.00% 0.00% 0.00% 0.00% 2.45% 0.00% 10.17% 0.00% 0.00% 0.00% 0.00% 3.84% 0.00% 5.56% 0.00% 0.00% 0.00% 2.18% 0.00% 0.00% 0.00% 0.00% 2.49% 13.79% 3.30% 0.00% 0.00% 0.00% 0.00% 0.34% 0.00% 4.01% 8.06% 0.00% 0.00% 0.00% 0.00% 0.00% 0.00% 0.00% 13.03% 17.08% 16.86% 0.00% 0.00% 0.00% 0.00% 0.00% 2.26% 0.00% 21.77% 0.00% 0.00% 0.00% 0.00% 4.76% 0.00% 0.00% 0.00% 0.00% 0.00% 3.31% 0.00% 0.00% 0.00% 0.00% 8.86% 0.00% 0.00% 0.00% 0.00% 0.00% 0.00% 0.00% 0.00% 0.19% 5.81% 0.00% 25.42% 0.00% 0.20% 0.00% 0.00% 4.91% 2.33% 11.05% 14.43% 0.00% 0.00% 0.00% 0.00% 0.00% 0.23% 0.00% 2.65% 0.00% 0.00% 0.00% 0.00% 2.79% 0.00% 1.89% 0.00% 0.00% 0.00% 0.29% 0.00% 0.00% 0.00% 0.00% 3.87% 8.34% 15.36% 0.00% 0.00% 0.00% 0.00% 0.25% 0.00% 4.44% 4.53% 0.00% 0.00% 0.00% 0.00% 0.00% 0.00% 0.00% 5.13% 26.32% 24.49% 0.00% 0.00% 0.00% 0.00% 0.00% 2.60% 0.00% 16.08% 0.00% 0.00% 0.00% 0.00% 5.13% 0.00% 0.00% 0.00% 0.00% 0.00% 2.20% 0.00% 0.00% 0.00% 0.00% 9.08% 0.00% 0.00% 0.00% 0.00% 0.00% 0.00% 0.00% 0.25% 0.50% 2.32% 0.00% 28.49% 0.01% 0.03% 0.00% 0.00% 2.96% 1.64% 13.66% 13.54% 0.00% 0.00% 0.00% 0.01% 0.00% 1.67% 0.00% 3.87% 0.00% 0.34% 0.00% 0.02% 4.92% 0.00% 1.00% 0.00% 0.00% 0.00% 0.30% 0.00% 0.02% 0.13% 0.00% 4.89% 4.85% 14.08% 0.00% 0.00% 0.00% 0.00% 0.53% 0.32% 0.22% 2.41% 0.00% 28.65% 0.00% 0.04% 0.00% 0.00% 2.34% 1.40% 14.66% 13.74% 0.00% 0.00% 0.00% 0.00% 0.00% 1.71% 0.00% 3.46% 0.00% 0.30% 0.00% 0.00% 5.19% 0.00% 0.76% 0.00% 0.00% 0.00% 0.06% 0.00% 0.00% 0.00% 0.00% 4.65% 4.53% 15.31% 0.00% 0.00% 0.00% 0.00% 0.24% WisdomTree WisdomTree WisdomTree Emerging Markets Emerging Markets Emerging Markets High Dividend Quality Dividend SmallCap Fund Growth Fund Dividend Fund 0.00% 0.00% 0.00% 7.35% 0.00% 0.00% 1.76% 22.89% 2.02% 0.00% 0.00% 0.00% 0.00% 0.00% 0.00% 0.31% 0.00% 1.82% 0.00% 0.00% 0.00% 0.00% 0.00% 5.62% 0.17% 0.00% 0.00% 0.00% 0.00% 1.39% 2.87% 0.00% 12.22% 0.00% 7.55% 1.42% 0.00% 0.00% 0.00% 24.06% 6.40% 2.07% 0.00% 0.06% 0.00% 0.00% 0.00% 15.39% 0.00% 0.00% 0.10% 23.98% 0.00% 0.00% 0.00% 0.00% 0.00% 0.00% 0.00% 0.00% 0.83% 5.38% 0.00% 0.00% 0.00% 0.00% 0.00% 3.84% 1.68% 0.00% 0.00% 0.00% 0.00% 1.74% 0.13% 0.00% 2.41% 0.00% 11.62% 2.35% 0.00% 0.00% 0.00% 14.93% 8.52% 2.96% 0.00% 4.14% 0.00% 0.00% 0.00% 7.60% 0.00% 0.00% 1.20% 24.59% 0.00% 0.00% 0.00% 0.00% 0.00% 0.00% 0.00% 0.00% 0.00% 2.92% 0.00% 0.00% 0.00% 0.00% 0.00% 4.86% 1.35% 0.00% 0.00% 0.00% 0.00% 1.78% 2.21% 0.00% 0.14% 0.00% 6.90% 6.71% 0.00% 0.00% 0.00% 27.83% 7.87% 3.08% 0.00% 0.97% Page 14 of 19 . FOR INSTITUTIONAL OR REGISTERED REPRESENTATIVE USE ONLY. NOT FOR PUBLIC USE OR VIEWING. WisdomTree ETFs FUND CHARACTERISTICS REPORT [as of December 31, 2015] Emerging Markets Asia WisdomTree Emerging Markets exState-Owned Enterprises Fund AUSTRALIA AUSTRIA BELGIUM BRAZIL BRITAIN CANADA CHILE CHINA CZECH REPUBLIC DENMARK FINLAND FRANCE GERMANY GREECE HONG KONG HUNGARY INDIA INDONESIA IRELAND ISRAEL ITALY JAPAN LUXEMBOURG MALAYSIA MEXICO NETHERLANDS NEW ZEALAND NORWAY PERU PHILIPPINES POLAND PORTUGAL RUSSIA SINGAPORE SOUTH AFRICA SOUTH KOREA SPAIN SWEDEN SW ITZERLAND TAIWAN THAILAND TURKEY UNITED STATES OTHER Subject to change. Vanguard FTSE Emerging Markets ETF iShares MSCI Emerging Markets ETF WisdomTree Emerging Markets Consumer Growth Fund 0.00% 0.00% 0.00% 3.54% 0.00% 0.00% 1.47% 29.13% 0.24% 0.00% 0.00% 0.00% 0.00% 0.00% 0.00% 0.37% 9.11% 2.34% 0.00% 0.00% 0.00% 0.00% 0.00% 2.91% 4.98% 0.00% 0.00% 0.00% 0.00% 2.16% 1.51% 0.00% 3.10% 0.00% 6.42% 17.24% 0.00% 0.00% 0.00% 11.30% 2.56% 1.62% 0.00% 0.00% 0.00% 0.00% 0.00% 6.48% 0.00% 0.00% 1.34% 29.87% 0.21% 0.00% 0.00% 0.00% 0.00% 0.00% 0.00% 0.33% 13.47% 2.64% 0.00% 0.00% 0.00% 0.00% 0.00% 4.35% 5.41% 0.42% 0.00% 0.00% 0.20% 1.94% 1.53% 0.00% 3.08% 0.00% 7.66% 0.00% 0.03% 0.00% 0.00% 15.08% 2.37% 1.60% 0.00% 2.00% 0.00% 0.00% 0.00% 5.57% 0.00% 0.00% 1.25% 26.68% 0.19% 0.00% 0.00% 0.00% 0.00% 0.00% 0.00% 0.28% 9.10% 2.66% 0.00% 0.00% 0.00% 0.00% 0.00% 3.25% 4.61% 0.37% 0.00% 0.00% 0.35% 1.50% 1.36% 0.00% 2.63% 0.00% 6.56% 16.13% 0.00% 0.00% 0.00% 11.44% 2.04% 1.41% 0.00% 2.61% 0.00% 0.00% 0.00% 19.55% 0.00% 0.00% 0.11% 23.86% 0.00% 0.00% 0.00% 0.00% 0.00% 0.00% 0.00% 0.00% 2.46% 6.73% 0.00% 0.00% 0.00% 0.00% 0.00% 1.33% 4.55% 0.00% 0.00% 0.00% 0.00% 0.99% 0.20% 0.00% 3.40% 0.00% 7.34% 16.28% 0.00% 0.00% 0.00% 6.82% 3.95% 2.43% 0.00% 0.00% EGShares Emerging WisdomTree Asia Markets Consumer Pacific ex-Japan Fund ETF 0.00% 0.00% 0.00% 11.73% 0.00% 0.00% 3.07% 16.69% 0.00% 0.00% 0.00% 0.00% 0.00% 0.00% 0.00% 0.00% 11.34% 3.48% 0.00% 0.00% 0.00% 0.00% 0.00% 2.10% 16.33% 4.76% 0.00% 0.00% 0.00% 2.79% 0.00% 0.00% 4.18% 0.00% 18.88% 0.00% 0.00% 0.00% 0.00% 0.00% 4.67% 0.00% 0.00% 0.00% 22.30% 0.00% 0.00% 0.00% 0.76% 0.00% 0.00% 13.60% 0.00% 0.00% 0.00% 0.00% 0.00% 0.00% 17.23% 0.00% 0.27% 2.48% 0.00% 0.00% 0.00% 0.00% 0.00% 4.65% 0.00% 0.00% 0.00% 0.00% 0.00% 2.02% 0.00% 0.00% 0.00% 5.83% 0.00% 8.70% 0.00% 0.00% 0.00% 14.89% 3.72% 0.00% 0.00% 3.56% Vanguard FTSE Pacific ETF iShares MSCI All Country Asia exJapan ETF iShares MSCI Pacific ex-Japan ETF 15.98% 0.00% 0.00% 0.00% 0.23% 0.00% 0.00% 0.47% 0.00% 0.00% 0.00% 0.00% 0.00% 0.00% 7.63% 0.00% 0.00% 0.00% 0.09% 0.00% 0.03% 60.61% 0.02% 0.00% 0.00% 0.00% 0.67% 0.00% 0.00% 0.00% 0.00% 0.00% 0.00% 3.20% 0.00% 10.75% 0.00% 0.00% 0.00% 0.00% 0.00% 0.00% 0.00% 0.31% 0.00% 0.00% 0.00% 0.00% 0.00% 0.00% 0.00% 24.24% 0.00% 0.00% 0.00% 0.00% 0.00% 0.00% 18.58% 0.00% 10.13% 2.98% 0.00% 0.00% 0.00% 0.00% 0.00% 3.67% 0.00% 0.00% 0.00% 0.00% 0.00% 1.67% 0.00% 0.00% 0.00% 5.01% 0.00% 18.06% 0.00% 0.00% 0.00% 12.92% 2.34% 0.00% 0.00% 0.39% 59.30% 0.00% 0.00% 0.00% 0.99% 0.00% 0.00% 0.11% 0.00% 0.00% 0.00% 0.00% 0.00% 0.00% 26.36% 0.00% 0.00% 0.00% 0.41% 0.00% 0.00% 0.00% 0.00% 0.00% 0.00% 0.00% 1.39% 0.00% 0.00% 0.00% 0.00% 0.00% 0.00% 10.63% 0.00% 0.00% 0.00% 0.00% 0.00% 0.00% 0.00% 0.00% 0.00% 0.80% Page 15 of 19 . FOR INSTITUTIONAL OR REGISTERED REPRESENTATIVE USE ONLY. NOT FOR PUBLIC USE OR VIEWING. WisdomTree ETFs FUND CHARACTERISTICS REPORT [as of December 31, 2015] Alternative/Real Estate Sectors WisdomTree Global ex-US Real Estate Fund AUSTRALIA AUSTRIA BELGIUM BRAZIL BRITAIN CANADA CHILE CHINA CZECH REPUBLIC DENMARK FINLAND FRANCE GERMANY GREECE HONG KONG HUNGARY INDIA INDONESIA IRELAND ISRAEL ITALY JAPAN LUXEMBOURG MALAYSIA MEXICO NETHERLANDS NEW ZEALAND NORWAY PERU PHILIPPINES POLAND PORTUGAL RUSSIA SINGAPORE SOUTH AFRICA SOUTH KOREA SPAIN SWEDEN SWITZERLAND TAIWAN THAILAND TURKEY UNITED STATES OTHER Subject to change. WisdomTree Global ex-U.S. Hedged Real Estate Fund SPDR Dow Jones International Real Estate ETF iShares International Developed Property ETF WisdomTree Commodity Country Equity Fund 12.63% 0.16% 0.93% 0.27% 6.51% 6.39% 0.12% 10.76% 0.00% 0.00% 0.51% 8.36% 2.55% 0.00% 26.57% 0.00% 0.00% 0.30% 0.07% 0.70% 0.19% 3.10% 0.00% 1.13% 1.63% 0.61% 0.19% 0.19% 0.00% 0.88% 0.00% 0.00% 0.00% 8.05% 2.05% 0.00% 0.00% 1.45% 1.26% 0.74% 1.29% 0.37% 0.00% 0.02% 12.42% 0.15% 0.95% 0.27% 6.42% 6.30% 0.10% 10.73% 0.00% 0.00% 0.50% 8.25% 2.52% 0.00% 25.96% 0.00% 0.00% 0.31% 0.06% 0.70% 0.16% 4.67% 0.00% 1.12% 1.59% 0.60% 0.18% 0.19% 0.00% 0.86% 0.00% 0.00% 0.00% 7.90% 2.04% 0.00% 0.00% 1.45% 1.23% 0.72% 1.27% 0.37% 0.00% 0.02% 25.41% 1.03% 0.73% 0.00% 14.72% 10.15% 0.00% 0.00% 0.00% 0.00% 0.00% 3.24% 0.00% 0.00% 14.95% 0.00% 0.00% 0.00% 0.00% 0.00% 0.16% 16.84% 0.00% 0.00% 0.00% 1.26% 0.89% 0.00% 0.00% 0.00% 0.00% 0.00% 0.00% 5.61% 0.34% 0.00% 0.00% 2.30% 2.38% 0.00% 0.00% 0.00% 0.00% 0.00% 12.35% 0.85% 0.92% 0.00% 11.36% 2.80% 0.00% 0.00% 0.00% 0.01% 0.32% 6.90% 5.45% 0.00% 15.21% 0.00% 0.00% 0.00% 0.38% 0.87% 0.17% 27.62% 0.30% 0.00% 0.00% 0.95% 0.69% 0.21% 0.00% 0.00% 0.00% 0.00% 0.00% 7.14% 0.00% 0.00% 0.58% 2.26% 1.93% 0.00% 0.00% 0.00% 0.00% 0.72% 12.60% 0.00% 0.00% 10.35% 0.38% 11.40% 10.36% 0.00% 0.00% 0.00% 0.00% 0.00% 0.00% 0.00% 0.00% 0.00% 0.00% 0.00% 0.00% 0.00% 0.00% 0.00% 0.00% 0.00% 0.00% 0.00% 16.93% 13.80% 0.00% 0.00% 0.00% 0.00% 13.29% 0.00% 10.19% 0.00% 0.00% 0.00% 0.00% 0.00% 0.00% 0.00% 0.00% 0.71% WisdomTree SPDR S&P Global Global Natural Natural Resources Fund Resources ETF 7.24% 0.00% 0.00% 1.86% 8.52% 8.95% 0.42% 5.82% 0.00% 0.00% 0.00% 3.01% 1.34% 0.00% 1.97% 0.00% 0.00% 0.00% 0.00% 1.40% 1.86% 0.59% 0.00% 1.98% 1.00% 4.18% 0.00% 2.73% 0.00% 0.91% 1.04% 0.00% 9.94% 0.99% 1.25% 0.37% 3.22% 0.51% 1.37% 0.00% 2.28% 0.00% 25.29% 0.00% 8.46% 0.44% 0.00% 1.29% 7.23% 9.73% 0.36% 0.97% 0.00% 0.00% 2.30% 3.48% 1.90% 0.00% 0.00% 0.00% 0.74% 0.00% 0.90% 0.32% 1.28% 5.28% 0.57% 0.00% 0.26% 3.02% 0.00% 2.30% 0.65% 0.00% 0.00% 0.00% 2.74% 1.04% 1.53% 2.27% 0.38% 0.00% 7.69% 0.00% 0.00% 0.00% 32.81% 0.05% Middle East WisdomTree Global ex-US Utilities Sector Fund SPDR S&P International Utilities Sector ETF 1.43% 0.73% 0.60% 4.18% 11.92% 9.02% 3.06% 5.89% 2.02% 0.00% 2.49% 7.66% 4.95% 0.00% 7.17% 0.00% 0.00% 1.66% 0.00% 0.00% 8.23% 5.38% 0.00% 1.73% 1.03% 0.00% 3.94% 0.00% 0.00% 2.18% 3.08% 1.43% 0.18% 0.43% 0.00% 0.54% 7.39% 0.00% 0.00% 0.00% 0.78% 0.00% 0.00% 0.91% 4.24% 0.35% 0.25% 0.00% 20.87% 4.87% 0.00% 0.00% 0.00% 0.00% 1.17% 9.72% 4.63% 0.00% 9.85% 0.00% 0.00% 0.00% 0.00% 0.00% 10.20% 14.09% 0.00% 0.00% 0.00% 0.00% 1.51% 0.04% 0.00% 0.00% 0.00% 1.72% 0.00% 0.25% 0.00% 2.25% 13.59% 0.00% 0.18% 0.00% 0.00% 0.00% 0.00% 0.21% WisdomTree Middle East Dividend Fund QATAR UAE KUWAIT MOROCCO EGYPT OMAN BAHRAIN JORDAN 24.41% 23.81% 22.78% 11.29% 6.62% 5.52% 4.04% 1.53% 0.00% Page 16 of 19 . FOR INSTITUTIONAL OR REGISTERED REPRESENTATIVE USE ONLY. NOT FOR PUBLIC USE OR VIEWING. WisdomTree Funds There are risks associated with investing including possible loss of principal. In addition to the normal risks of investing, foreign investing involves special risks, such as risk of loss from currency fluctuation or political or economic uncertainty. Investments in real estate involve additional special risks, such as credit risk, interest rate fluctuations and the effect of varied economic conditions.
Funds that focus its investments in one country increase the impact of events and developments associated with the region which can adversely affect performance. Funds focusing on a single country, sector and/or smaller companies generally experience greater price volatility. Investments in emerging, offshore or frontier markets are generally less liquid and less efficient than developed markets. Investments in currency involve additional special risks, such as credit risk, interest rate fluctuations, derivative investment risk, which can be volatile and may be less liquid than other securities and the effect of varied economic conditions.
As these Funds can have a high concentration in some issuers the Funds can be adversely impacted by changes affecting issuers. Unlike typical exchange-traded Funds, there are no indexes that the currency Funds attempt to track or replicate. Thus, the ability of the currency Funds to achieve its objectives will depend on the effectiveness of the portfolio manager.
Due to the investment strategy of certain Fund’s they may make higher capital gain distributions than other ETFs. Please read the Fund’s prospectus for specific details regarding the Fund’s risk profile. Investors should consider the investment objectives, risks, charges and expenses of the Funds carefully before investing. A prospectus, containing this and other information, is available at wisdomtree.com or by calling 1-866-909-WISE (9473).
Investors should read the prospectus carefully before investing. WisdomTree Funds are distributed by Foreside Fund Services, LLC in the US only. © 2015 WisdomTree Investments, Inc. Foreside Fund Services, LLC.
is not affiliated with SEI Investments Distribution Co. (SEI), State Street Global Markets, LLC and Vanguard Marketing Corporation. iShares Funds Investing involves risk, including possible loss of principal. International investments may involve risk of capital loss from unfavorable fluctuation in currency values, from differences in generally accepted accounting principles or from economic or political instability in other nations.
Emerging markets involve heightened risks related to the same factors as well as increased volatility and lower trading volume. Carefully consider the iShares Funds’ investment objectives, risk factors and charges and expenses before investing. The iShares Funds (“Funds”) are distributed by BlackRock Investments, LLC. StateStreet Funds Before investing, consider the funds’ investment objectives, risks, charges and expenses. Foreign investments involve greater risks than US investments, including political and economic risks and the risk of currency fluctuations, all of which may be magnified in emerging markets. Because of their narrow focus, sector funds tend to be more volatile than broadly diversified funds and generally result in greater price fluctuations than the overall market. In general, ETFs can be expected to move up or down in value with the value of the applicable index. Although ETF shares may be bought and sold on the exchange through any brokerage account, ETF shares are not individually redeemable from the Fund. Investors may acquire ETFs and tender them for redemption through the Fund in Creation Unit Aggregations only.
Please see the prospectus for more details. ETFs trade like stocks, are subject to investment risk and will fluctuate in market value. StateStreet Funds are distributed by State Street Global Markets, LLC. SPDR funds are distributed by ALPS Distributors Inc. Page 17 of 19 . FOR INSTITUTIONAL OR REGISTERED REPRESENTATIVE USE ONLY. NOT FOR PUBLIC USE OR VIEWING. Vanguard Funds Vanguard ETFs are not redeemable with an Applicant Fund other than in Creating Unit aggregations. Instead, investors must buy or sell Vanguard ETF Shares in the secondary market with the assistance of a stockbroker. In doing so, the investor will incur brokerage commissions and may pay more than net asset value when buying and receive less than net asset value when selling. All ETF products are subject to stock market risk, which may result in the loss of principal.
International ETF products involve additional risks, including currency fluctuations and the potential for adverse developments in specific countries or regions. ETF products that invest in emerging markets are generally more risky than those that invest in developed countries. Vanguard Funds are distributed by Vanguard Marketing Corporation. EG Shares Funds Emerging market investments involve risk of capital loss from unfavorable fluctuation in currency values, from differences in generally accepted accounting principles, from economic or political instability in other nations or increased volatility and lower trading volume. This fund will concentrate its investments in issuers of one or more particular industries to the same extent that its Underlying Index is so concentrated and to the extent permitted by applicable regulatory guidance.
Concentration risk results from maintaining exposure to issuers conducting business in a specific industry. Small cap and mid cap companies generally will have greater volatility in price than the stocks of large companies due to limited product lines or resources or a dependency upon a particular market niche. The EGShares Emerging Markets Consumer ETF ("the Fund") is distributed by ALPS Distributors, Inc. Emerging Global Advisors acts as the investment advisor to the Fund.
ALPS and Emerging Global Advisors are unaffiliated entities. Fundamental Data Points: A number of valuation points in this report— Price / Earnings, Price / Book, Price / Sales. Return on Equity, and Total Debt To capital – are calculated using a weighted average of each firm’s individual data points for that specific ratio of the ETF IOPV. The weighted average ratio for the ETF IOPV is calculated by multiplying each firm’s specific ratio (such as the Price / Earnings) with their relative weight in the fund and summing the product of those two numbers (weight in fund and Price / Earnings). -- The price to earnings ratio for each ETF IOPV represents a weighted average price to earnings ratio of the constituents of the ETF IOPV.
Price/Earnings Ratio is a valuation ratio of a company's current share price compared to its per-share earnings. --E/P Ratio (earnings/price) is defined as Earnings / Price or 1 / PE Ratio. -- The price to sales ratio for each ETF IOPV represents a weighted average price to sales ratio of the constituents of the ETF IOPV. Price/Sales Ratio is a valuation ratio of a company's current share price compared to its per-share sales. -- The price to book value ratio for each ETF IOPV represents a weighted average price to book value ratio of the constituents of the ETF IOPV. Price/Book value Ratio is a valuation ratio of a company's current share price compared to its per-share book value. --Total Debt to Capital ratio for each ETF IOPV represents a weighted average debt to capital ratio of the constituents of the ETF IOPV.
The higher debt to capital ratio for each firm, the more reliant that firm is on debt financing. --Return on Equity (ROE) is defined as the Earnings /Price ratio of each firm multiplied by its Price / Book Ratio. The ROE of the ETF IOPV represents the weight average ratio of each constituents earnings measured relative to their book values. Market Cap Data Points: A number of data points in the report cover statistics on the market Capitalization (price times shares outstanding) of the ETF IOPV Constituents. % Weight of ETF IOPV with Market Cap Greater than $10 Billion – Reflects aggregate weight of the ETF IOPV of companies with market caps greater than $10 billion % Weight of ETF IOPV with Market Cap $2-$10 Billion - Reflects aggregate weight of the ETF IOPV of companies with market caps between $2-10 billion. % Weight of ETF IOPV with Market Cap Less than $2 Billion - aggregate weight of the ETF IOPV of companies with market caps less than $2 billion Average Market Cap, Median Market Cap, and Weighted Average Market Cap are statistical summary measures of the market capitalization of constituents in each ETF IOPV. Page 18 of 19 . FOR INSTITUTIONAL OR REGISTERED REPRESENTATIVE USE ONLY. NOT FOR PUBLIC USE OR VIEWING. The Global Industry Classification Standard (“GICS”) was developed by and is the exclusive property and a service mark of Morgan Stanley Capital International Inc. (“MSCI”) and Standard & Poor’s, a division of The McGraw-Hill Companies, Inc. (“S&P”) and is licensed for use by WisdomTree Investments, Inc.
Neither MSCI, S&P, nor any other party involved in making or compiling the GICS or any GICS classifications makes any express or implied warranties or representations with respect to such standard or classification (or the results to be obtained by the use thereof), and all such parties hereby expressly disclaim all warranties of originality, accuracy, completeness, merchantability and fitness for a particular purpose with respect to any of such standard or classification. Without limiting any of the foregoing, in no event shall MSCI, S&P, any of their affiliates or any third party involved in making or compiling the GICS or any GICS classifications have any liability for any direct, indirect, special, punitive, consequential or any other damages (including lost profits) even if notified of the possibility of such damages. WTIR-0080 Page 19 of 19 .


