TRS-Care Sustainability and TRS-ActiveCare Affordability Study
Teacher Retirement System of Texas


Description
TRS-Care Sustainability and
TRS-ActiveCare Affordability Study
November 18, 2014
Teacher Retirement System of Texas
. TEACHER RETIREMENT SYSTEM OF TEXAS
TRS-Care Sustainability
and
TRS-ActiveCare Affordability Study
November 18, 2014
. Table of Contents
I. Executive Summary ............................................................................................................... 3
II. Study Background .................................................................................................................
7 III. TRS-Care ................................................................................................................................ 7 A.
Eligibility ............................................................................................................................ 8 B. Plan Options/Enrollment.....................................................................................................
8 C. Funding ............................................................................................................................... 8 D.
Prior Solutions .................................................................................................................... 9 E. TRS initiatives ..................................................................................................................
10 F. Options to Improve Solvency ........................................................................................... 11 Option 1: Pre-fund the long-term liability .......................................................................
13 Option 2: Fund on a pay-as-you-go basis for the biennium............................................. 13 Option 3: Fund for a 10-year solvency ............................................................................ 17 Option 4: Retiree pays full cost for optional coverage ....................................................
19 Option 5: Require purchase of Medicare Part B; Mandatory participation in Medicare Advantage and Medicare Part D plans.............................................................................. 20 Option 6: Fixed contribution............................................................................................ 23 Option 7: Consumer driven plan for the non-Medicare population .................................
25 G. Conclusion for TRS-Care ................................................................................................. 27 IV.
TRS-ActiveCare ................................................................................................................... 29 A. Plan Options/Enrollment...................................................................................................
30 B. Funding ............................................................................................................................. 31 C.
Options .............................................................................................................................. 35 Option 1: Reinstate funding ratios to FY 2003 level ........................................................ 35 Option 2: Offer only a high deductible plan with a Health Savings Account (HSA) .......
36 Option 3: Offer only a self-funded EPO plan ................................................................... 37 Option 4: Eliminate uniform statewide coverage ............................................................. 38 Option 5: Eliminate coverage for spouses ........................................................................
38 D. Conclusion for TRS-ActiveCare ....................................................................................... 39 V.
Combine TRS-Care and TRS-ActiveCare ........................................................................ 39 Option 1: Offer the same benefit as HealthSelect ................................................................. 40 Option 2: Increase employer funding to $400 per participant ...............................................
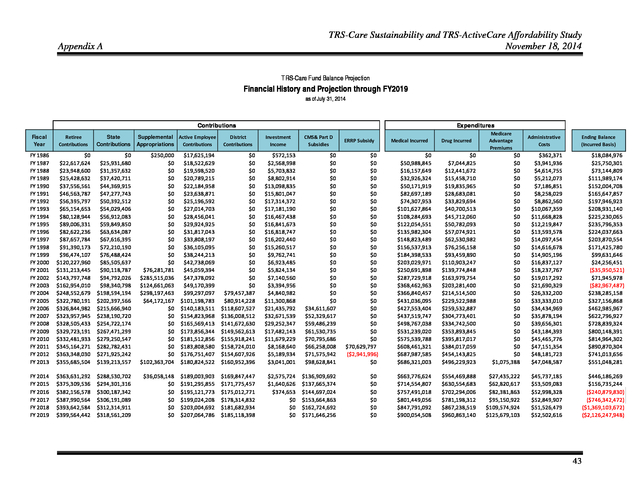
42 Appendix A:................................................................................................................................. 43 Appendix B: ................................................................................................................................. 44 2 .
TRS-Care Sustainability and TRS-ActiveCare Affordability Study November 18, 2014 I. Executive Summary In 2011, during the 82nd Texas Legislative session, funding projections for TRS-Care, the health care program for retired public educators, indicated that under the current funding structure the program would be solvent through the 2012-2013 biennium. At that time the financial shortfall for the 2014-2015 biennium was projected to be greater than $800 million. To begin to address this near-term insolvency, the Legislature directed the Teacher Retirement System of Texas (TRS) to conduct a study.
The study was to include a comprehensive review of potential plan designs and other changes that would improve the sustainability of the program with a report of the findings and recommendations due by September 1, 2012. Because of a series of initiatives implemented by TRS in FY 2013, the TRS-Care fund was then projected to be solvent for the 2014-2015 biennium and, therefore, no significant immediate action was necessary during the 83rd Texas Legislative session. Current projections as of July 2014 indicate that there will be a financial shortfall for the 2016-2017 biennium in the amount of $746.3 million. This updated study again introduces various strategies that can improve the sustainability of the retiree health care program.
The current funding projection as of July 2014 for TRS-Care is included in Appendix A of this report. TRS-ActiveCare, the health care program for active public education employees, is also facing financial challenges. Since its inception in FY 2003, state and minimum required district funding for the program has remained static. Increasing costs have necessitated premium increases, which have largely been passed on to employees.
Without an increase in state and district funding, it remains questionable whether TRS-ActiveCare will be able to offer an affordable health coverage option. This study introduces various strategies that can improve the affordability of health care coverage for active public school employees and their families. A. TRS-Care Key Findings • TRS-Care is facing a severe projected funding shortage for 2016-2017 of $746.3 million. • Without additional funding, the sustainability of the program in its current structure is at significant risk. • District and employee contributions as a Many of the options presented in percentage of active employee payroll are this study are not mutually funding streams for TRS-Care.
Districts and exclusive. Some options may be employees are also funding sources for TRScombined to increase the positive ActiveCare. financial impact on TRS-Care. • TRS extended the life of TRS-Care by offering the Medicare Advantage and Medicare Part D plans, and competitive vendor management. • There is no correlation between funding streams and health care claims cost. • Non-Medicare retirees are the biggest cost driver to the program. 3 . TRS-Care Sustainability and TRS-ActiveCare Affordability Study November 18, 2014 • • With provider and benefit level choice, comes additional cost. There is a disparity between TRS-Care benefits and premiums in comparison to what is available to Texas state retirees. The premium for Retiree Only coverage for Texas state retirees is 100% funded by the state. Plan Options Chapter 1575 of the Texas Insurance Code requires that a basic health care plan be offered at no cost to the retiree. Optional plans may be offered, including coverage for eligible dependents. Retirees selecting an optional plan pay a premium based on the plan selected, years of service, number of dependents and Medicare status.
TRS-Care currently offers three standard plan options. TRS-Care 1, the basic plan, provides catastrophic coverage. TRSCare 2 and TRS-Care 3 offer more comprehensive benefits, including a carve-out prescription drug benefit.
TRS-Care also offers two Medicare Advantage and Medicare Part D plan options. Funding • Funding for TRS-Care comes from a variety of sources: • The law provides the following contributions: o The state contributes 1.0% of active district payroll. o School districts contribute between 0.25% and 0.75% of active district payroll. The current contribution rate is 0.55%. o Active school district employees contribute 0.65% of payroll. • Retirees pay premiums for any plan option other than TRS-Care 1 Retiree Only coverage. • Prescription drug subsidies. • Investment income. Considerations TRS-Care solvency can be looked upon as a three-legged stool representing the options available for extending the life of the program: • • • Benefits/eligibility (including how benefits are managed) Retiree premiums Other contributions (state, school district, active employee, federal) Non-Medicare participants cost significantly more than Medicare eligible participants. Taking into consideration the savings attributable to the new Medicare Part D (prescription drug coverage) and Medicare Advantage plans, the plan costs for non-Medicare retirees are 4.5 times the costs of retirees with Medicare Parts A (hospitalization) and B (other medical coverage). Therefore, some of the options in the study focus separately on the two populations. 4 .
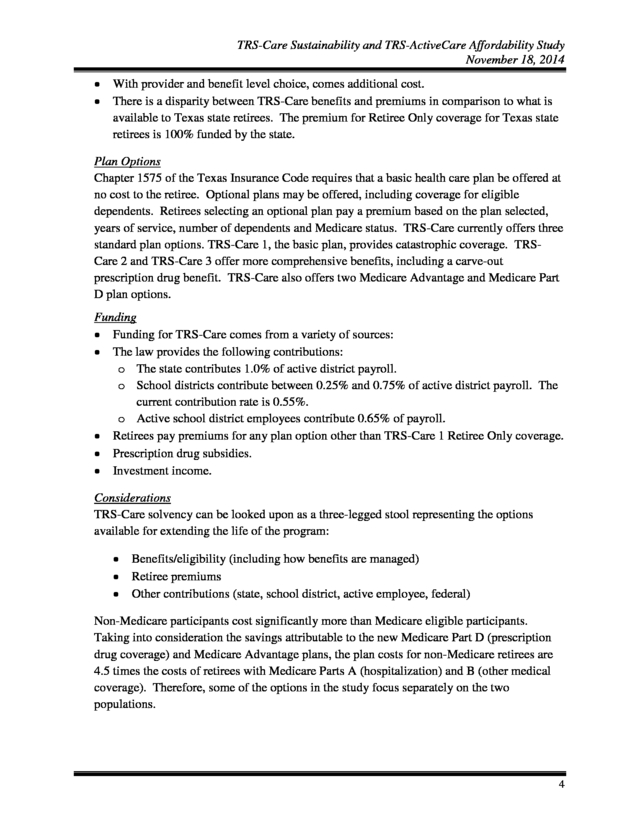
TRS-Care Sustainability and TRS-ActiveCare Affordability Study November 18, 2014 Summary of Options The following is a summary of the options considered in the study and their impact on the financial condition of TRS-Care: 1. 2. 3. 4. 5. Pre-fund the long-term liability Fund on a pay-as-you-go basis for the biennium Fund for a 10-year solvency Retiree pays full cost for optional coverage Require purchase of Medicare Part B; mandatory participation in Medicare Advantage and Medicare Part D plans 6. Fixed contribution 7. Consumer driven plan for the non-Medicare population CHART 1 Many of the options presented in this study are not mutually exclusive. Some options may be combined to increase the positive financial impact on TRS-Care. B.
TRS-ActiveCare Key Findings • TRS-ActiveCare has an affordability issue. • State and minimum district contributions have not changed since the inception of the program in FY 2003. • The employee’s share of the total premium cost has increased significantly. 5 . TRS-Care Sustainability and TRS-ActiveCare Affordability Study November 18, 2014 • • As premiums have increased, employees have selected plans providing a reduced level of benefits. There is a disparity between TRS-ActiveCare benefits and premiums in comparison to what is available to Texas state employees. The premium for Employee Only coverage for Texas state employees is 100% funded by the state. Plan Options TRS, as trustee, administers TRS-ActiveCare, the health care program for active public educators. Chapter 1579 of the Texas Insurance Code requires that at least two plans, including a catastrophic plan, be offered to active public educators. TRS-ActiveCare currently offers three self-funded plan options, ActiveCare 1-HD is a high deductible health plan.
ActiveCare Select, and ActiveCare 2 offer more comprehensive benefits, including a carve-out prescription drug benefit. There are also three fully-insured HMOs offered in certain service areas. Funding The program is funded by premiums for the level of coverage selected. The district must contribute a minimum of $150 and the state provides $75 per employee per month (PEPM) through school finance formulas.
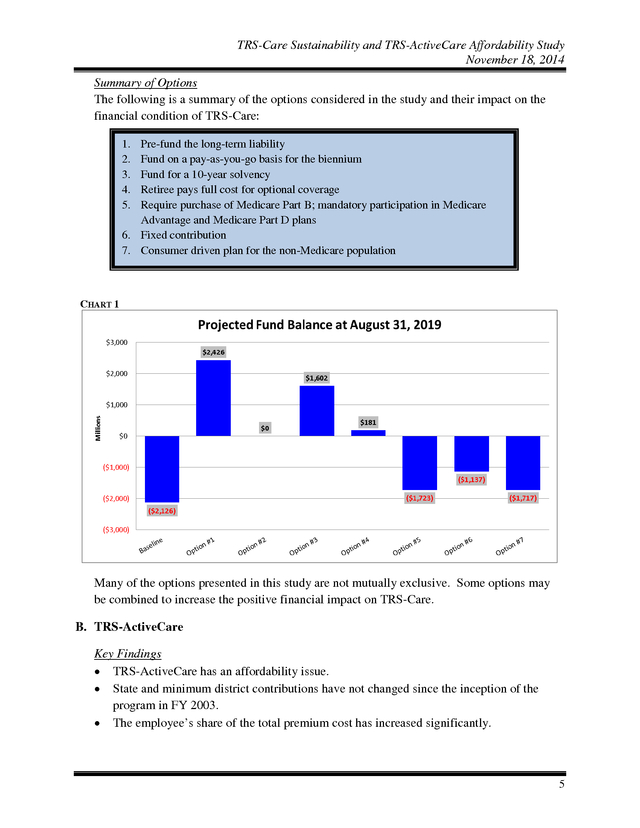
The employee then pays the balance of the premium due. The focus of this study is not on the long term fund balance, but rather on funding and plan design options that make the plan more affordable for employees. The following summarizes the options considered in the study. 1. 2. 3. 4. 5. Reinstate funding ratios to FY 2003 levels Offer only a High Deductible Health Plan with a Health Savings Account (HSA) Offer only a self–funded EPO plan Eliminate uniform, statewide coverage Eliminate coverage for spouses TABLE 1 Coverage Tier State & District Contribution Employee Contribution Total Premium* Projected FY 2016 Employee Only Premium Option #1 Option #2 Option #3 Option #4 Option #5 $414 $400** $225 N/A $225 $169 $583 $37 $437 $208 $433 N/A $N/A $355 $580 * Premiums shown for Options #1 and #5 above are those for ActiveCare-2. $350 PEPM towards the premium coverage plus $50 contribution to the employee’s HSA. ** 6 . TRS-Care Sustainability and TRS-ActiveCare Affordability Study November 18, 2014 II. Study Background In 2011, during the 82nd Texas Legislative session, funding projections for TRS-Care, the health care program for retired public educators, indicated that under the current funding structure the program would be solvent through the 2012-2013 biennium. At that time the financial shortfall for the 2014-2015 biennium was projected to be greater than $800 million. To begin to address this near-term insolvency, the Legislature directed the Teacher Retirement System of Texas (TRS) to conduct a study. The study was to include a comprehensive review of potential plan designs and other changes that would improve the sustainability of the program with a report of the findings and recommendations due by September 1, 2012. Because of a series of initiatives implemented by TRS in FY 2013, the TRS-Care fund was then projected to be solvent for the 2014-2015 biennium and, therefore, no significant immediate action was necessary during the 83rd Texas Legislative session.
Current projections as of July 2014 indicate that there will be a financial shortfall for the 2016-2017 biennium in the amount of $746.3 million. This updated study again introduces various strategies that can improve the sustainability of the retiree health care program. The current funding projection as of July 2014 for TRS-Care is included in Appendix A of this report. TRS-ActiveCare, the health care program for active public education employees, is also facing financial challenges.
Since its inception in FY 2003, state and minimum required district funding for the program has remained static. Increasing costs have necessitated premium increases, which have largely been passed on to employees. Without an increase in state and district funding, it remains questionable whether TRS-ActiveCare will be able to offer an affordable health coverage option.
This study introduces various strategies that would improve the affordability of health care coverage for active public school employees and their families. III. TRS-Care TRS, as trustee, administers the Texas Public School Employees Group Benefits Program, TRS-Care. At the inception of TRS-Care in FY 1986, funding was projected to last 10 years, through FY 1995.
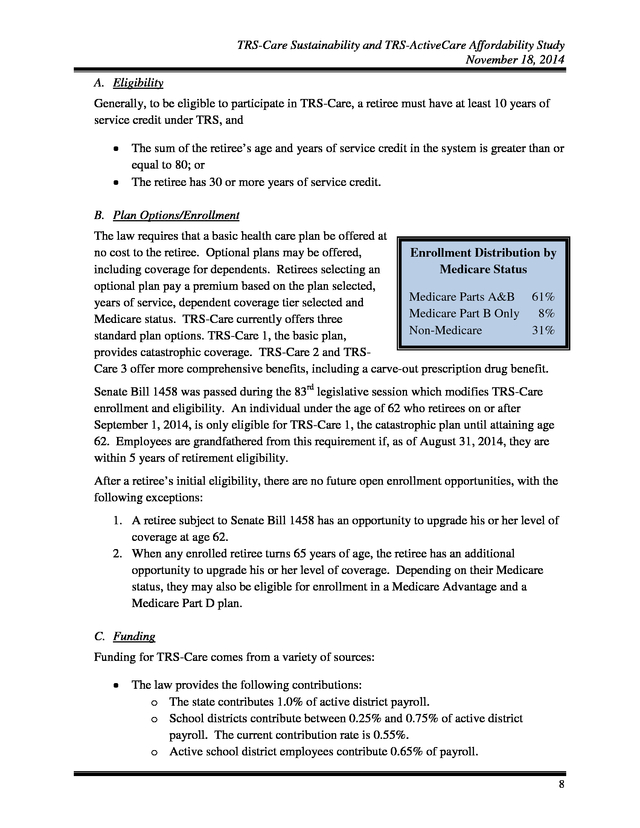
The original funding was sufficient to maintain solvency of the fund through FY 2000. Since that time, sufficient appropriations and contributions have been established to provide benefits through the current 2014-2015 biennium. August 2014 Enrollment TRS-Care 1 TRS-Care 2* TRS-Care 3* TOTAL 29,996 56,210 158,362 244,568 *Includes Medicare Advantage Enrollment 7 . TRS-Care Sustainability and TRS-ActiveCare Affordability Study November 18, 2014 A. Eligibility Generally, to be eligible to participate in TRS-Care, a retiree must have at least 10 years of service credit under TRS, and • • The sum of the retiree’s age and years of service credit in the system is greater than or equal to 80; or The retiree has 30 or more years of service credit. B. Plan Options/Enrollment The law requires that a basic health care plan be offered at no cost to the retiree. Optional plans may be offered, Enrollment Distribution by including coverage for dependents.
Retirees selecting an Medicare Status optional plan pay a premium based on the plan selected, Medicare Parts A&B 61% years of service, dependent coverage tier selected and Medicare Part B Only 8% Medicare status. TRS-Care currently offers three Non-Medicare 31% standard plan options. TRS-Care 1, the basic plan, provides catastrophic coverage.
TRS-Care 2 and TRSCare 3 offer more comprehensive benefits, including a carve-out prescription drug benefit. Senate Bill 1458 was passed during the 83rd legislative session which modifies TRS-Care enrollment and eligibility. An individual under the age of 62 who retirees on or after September 1, 2014, is only eligible for TRS-Care 1, the catastrophic plan until attaining age 62. Employees are grandfathered from this requirement if, as of August 31, 2014, they are within 5 years of retirement eligibility. After a retiree’s initial eligibility, there are no future open enrollment opportunities, with the following exceptions: 1.
A retiree subject to Senate Bill 1458 has an opportunity to upgrade his or her level of coverage at age 62. 2. When any enrolled retiree turns 65 years of age, the retiree has an additional opportunity to upgrade his or her level of coverage. Depending on their Medicare status, they may also be eligible for enrollment in a Medicare Advantage and a Medicare Part D plan. C.
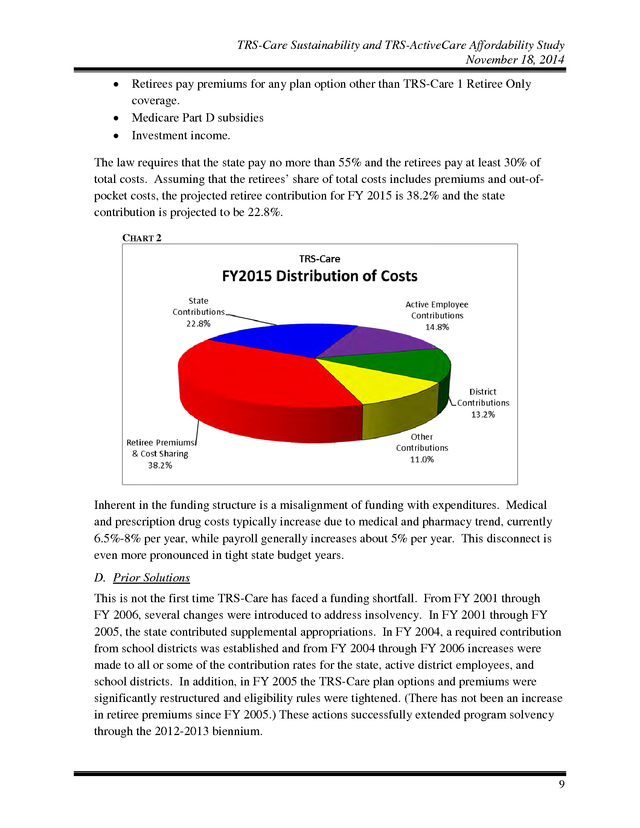
Funding Funding for TRS-Care comes from a variety of sources: • The law provides the following contributions: o The state contributes 1.0% of active district payroll. o School districts contribute between 0.25% and 0.75% of active district payroll. The current contribution rate is 0.55%. o Active school district employees contribute 0.65% of payroll. 8 . TRS-Care Sustainability and TRS-ActiveCare Affordability Study November 18, 2014 • • • Retirees pay premiums for any plan option other than TRS-Care 1 Retiree Only coverage. Medicare Part D subsidies Investment income. The law requires that the state pay no more than 55% and the retirees pay at least 30% of total costs. Assuming that the retirees’ share of total costs includes premiums and out-ofpocket costs, the projected retiree contribution for FY 2015 is 38.2% and the state contribution is projected to be 22.8%. CHART 2 Inherent in the funding structure is a misalignment of funding with expenditures. Medical and prescription drug costs typically increase due to medical and pharmacy trend, currently 6.5%-8% per year, while payroll generally increases about 5% per year. This disconnect is even more pronounced in tight state budget years. D.
Prior Solutions This is not the first time TRS-Care has faced a funding shortfall. From FY 2001 through FY 2006, several changes were introduced to address insolvency. In FY 2001 through FY 2005, the state contributed supplemental appropriations.
In FY 2004, a required contribution from school districts was established and from FY 2004 through FY 2006 increases were made to all or some of the contribution rates for the state, active district employees, and school districts. In addition, in FY 2005 the TRS-Care plan options and premiums were significantly restructured and eligibility rules were tightened. (There has not been an increase in retiree premiums since FY 2005.) These actions successfully extended program solvency through the 2012-2013 biennium. 9 .
TRS-Care Sustainability and TRS-ActiveCare Affordability Study November 18, 2014 E. TRS initiatives To help address the imminent shortfall projected for the 2014-2015 biennium, TRS undertook two initiatives for FY 2013: • • Issued a Request for Proposal (RFP) for a Pharmacy Benefits Manager (PBM) to determine whether better pricing was available in the market and also explored an alternative to the Retiree Drug Subsidy (RDS) option under Medicare Part D. Drug manufacturers are now required to provide funding to phase out the Medicare Part D plan coverage gap, which is often called the “donut hole”. This additional funding made the option of instituting a Medicare Part D plan potentially a better choice than the RDS option. Issued an RFP for fully-insured Medicare Advantage plan offerings. As a result of these efforts, a new PBM was selected, achieving more favorable prescription drug pricing effective September 1, 2012.
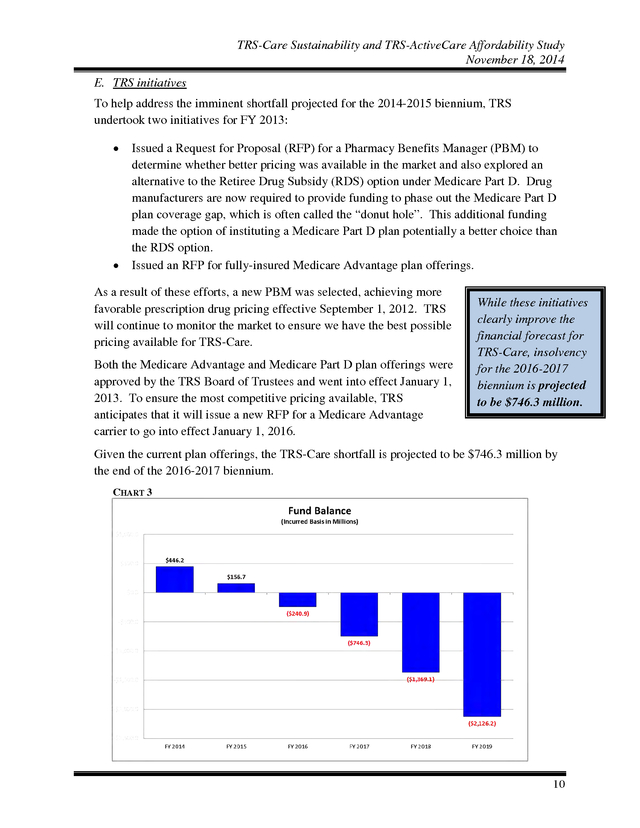
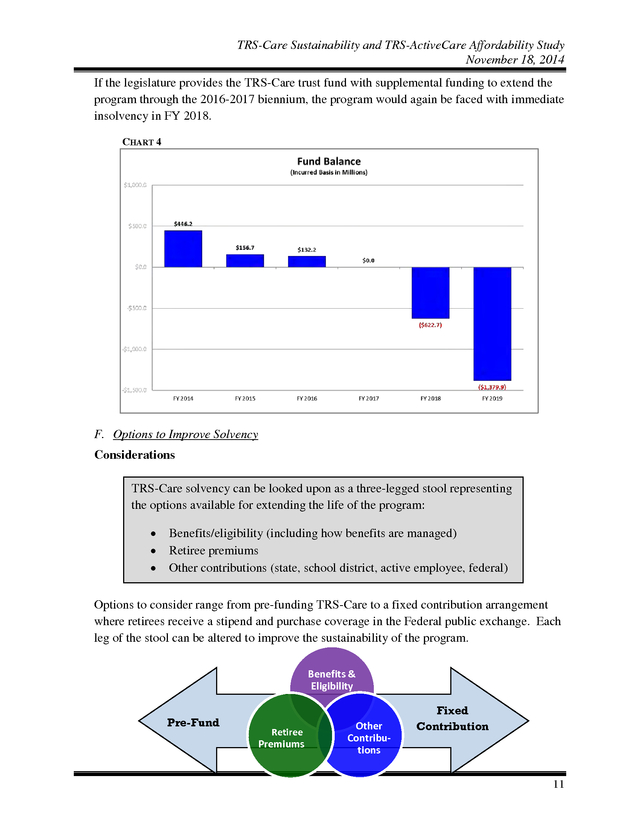
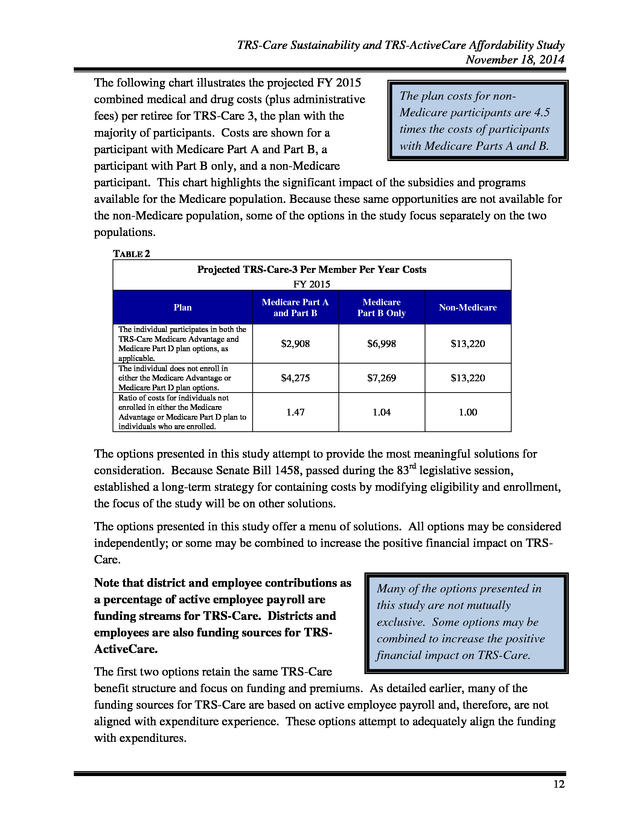
TRS will continue to monitor the market to ensure we have the best possible pricing available for TRS-Care. Both the Medicare Advantage and Medicare Part D plan offerings were approved by the TRS Board of Trustees and went into effect January 1, 2013. To ensure the most competitive pricing available, TRS anticipates that it will issue a new RFP for a Medicare Advantage carrier to go into effect January 1, 2016. While these initiatives clearly improve the financial forecast for TRS-Care, insolvency for the 2016-2017 biennium is projected to be $746.3 million. Given the current plan offerings, the TRS-Care shortfall is projected to be $746.3 million by the end of the 2016-2017 biennium. CHART 3 10 . TRS-Care Sustainability and TRS-ActiveCare Affordability Study November 18, 2014 If the legislature provides the TRS-Care trust fund with supplemental funding to extend the program through the 2016-2017 biennium, the program would again be faced with immediate insolvency in FY 2018. CHART 4 F. Options to Improve Solvency Considerations TRS-Care solvency can be looked upon as a three-legged stool representing the options available for extending the life of the program: • • • Benefits/eligibility (including how benefits are managed) Retiree premiums Other contributions (state, school district, active employee, federal) Options to consider range from pre-funding TRS-Care to a fixed contribution arrangement where retirees receive a stipend and purchase coverage in the Federal public exchange. Each leg of the stool can be altered to improve the sustainability of the program. Benefits & Eligibility Pre-Fund Retiree Premiums Other Contributions Fixed Contribution 11 . TRS-Care Sustainability and TRS-ActiveCare Affordability Study November 18, 2014 The following chart illustrates the projected FY 2015 The plan costs for noncombined medical and drug costs (plus administrative Medicare participants are 4.5 fees) per retiree for TRS-Care 3, the plan with the times the costs of participants majority of participants. Costs are shown for a with Medicare Parts A and B. participant with Medicare Part A and Part B, a participant with Part B only, and a non-Medicare participant. This chart highlights the significant impact of the subsidies and programs available for the Medicare population. Because these same opportunities are not available for the non-Medicare population, some of the options in the study focus separately on the two populations. TABLE 2 Projected TRS-Care-3 Per Member Per Year Costs FY 2015 Plan The individual participates in both the TRS-Care Medicare Advantage and Medicare Part D plan options, as applicable. The individual does not enroll in either the Medicare Advantage or Medicare Part D plan options. Ratio of costs for individuals not enrolled in either the Medicare Advantage or Medicare Part D plan to individuals who are enrolled. Medicare Part A and Part B Medicare Part B Only Non-Medicare $2,908 $6,998 $13,220 $4,275 $7,269 $13,220 1.47 1.04 1.00 The options presented in this study attempt to provide the most meaningful solutions for consideration.
Because Senate Bill 1458, passed during the 83rd legislative session, established a long-term strategy for containing costs by modifying eligibility and enrollment, the focus of the study will be on other solutions. The options presented in this study offer a menu of solutions. All options may be considered independently; or some may be combined to increase the positive financial impact on TRSCare. Note that district and employee contributions as a percentage of active employee payroll are funding streams for TRS-Care. Districts and employees are also funding sources for TRSActiveCare. Many of the options presented in this study are not mutually exclusive.
Some options may be combined to increase the positive financial impact on TRS-Care. The first two options retain the same TRS-Care benefit structure and focus on funding and premiums. As detailed earlier, many of the funding sources for TRS-Care are based on active employee payroll and, therefore, are not aligned with expenditure experience. These options attempt to adequately align the funding with expenditures. 12 .
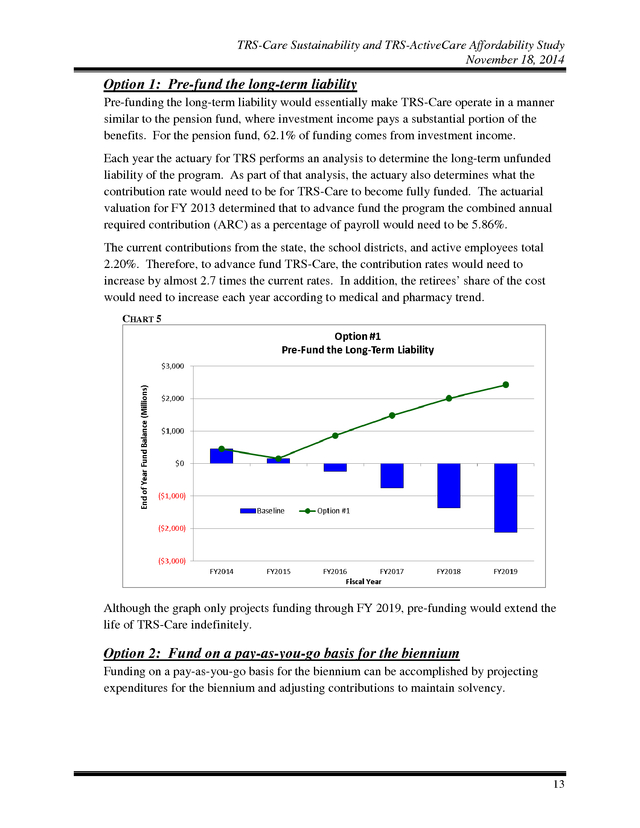
TRS-Care Sustainability and TRS-ActiveCare Affordability Study November 18, 2014 Option 1: Pre-fund the long-term liability Pre-funding the long-term liability would essentially make TRS-Care operate in a manner similar to the pension fund, where investment income pays a substantial portion of the benefits. For the pension fund, 62.1% of funding comes from investment income. Each year the actuary for TRS performs an analysis to determine the long-term unfunded liability of the program. As part of that analysis, the actuary also determines what the contribution rate would need to be for TRS-Care to become fully funded. The actuarial valuation for FY 2013 determined that to advance fund the program the combined annual required contribution (ARC) as a percentage of payroll would need to be 5.86%. The current contributions from the state, the school districts, and active employees total 2.20%.
Therefore, to advance fund TRS-Care, the contribution rates would need to increase by almost 2.7 times the current rates. In addition, the retirees’ share of the cost would need to increase each year according to medical and pharmacy trend. CHART 5 Although the graph only projects funding through FY 2019, pre-funding would extend the life of TRS-Care indefinitely. Option 2: Fund on a pay-as-you-go basis for the biennium Funding on a pay-as-you-go basis for the biennium can be accomplished by projecting expenditures for the biennium and adjusting contributions to maintain solvency. 13 . TRS-Care Sustainability and TRS-ActiveCare Affordability Study November 18, 2014 Option 2(a) Under option 2(a), the only funding change would be the contribution from the state. There would be no change in the contributions from active employees or school districts, and no change in premiums for retirees. For TRS-Care to be solvent through the 2016-2017 biennium, the state contribution rate would need to increase to 2.23% of active employee payroll for each year of the biennium. Instead of a percentage of payroll, funding from the state could be based on a fixed amount per retiree. For the 2016-2017 biennium the state contribution would be $289 per retiree. Having a fixed amount per retiree would guard against decreased state funding in the event payroll does not grow as projected.
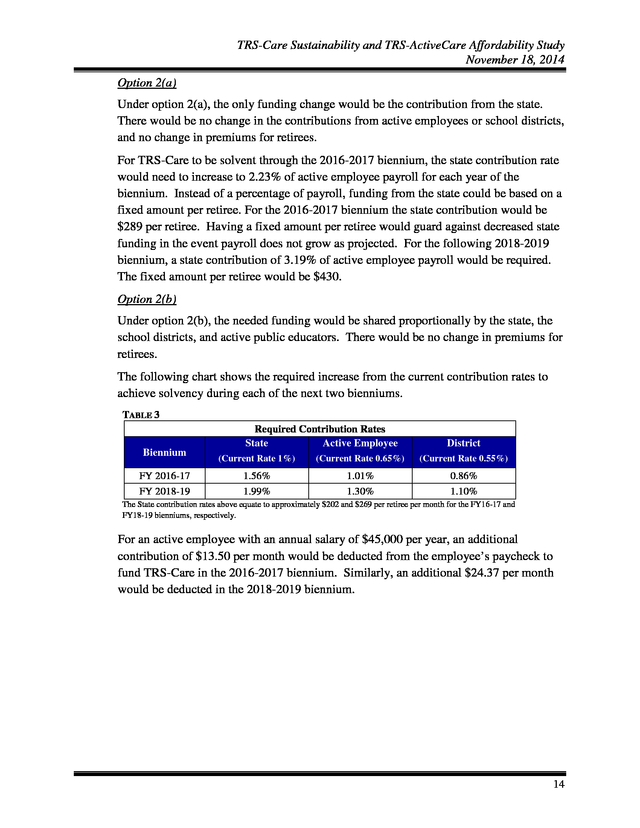
For the following 2018-2019 biennium, a state contribution of 3.19% of active employee payroll would be required. The fixed amount per retiree would be $430. Option 2(b) Under option 2(b), the needed funding would be shared proportionally by the state, the school districts, and active public educators. There would be no change in premiums for retirees. The following chart shows the required increase from the current contribution rates to achieve solvency during each of the next two bienniums. TABLE 3 Required Contribution Rates State Active Employee Biennium FY 2016-17 FY 2018-19 District (Current Rate 1%) (Current Rate 0.65%) (Current Rate 0.55%) 1.56% 1.99% 1.01% 1.30% 0.86% 1.10% The State contribution rates above equate to approximately $202 and $269 per retiree per month for the FY16-17 and FY18-19 bienniums, respectively. For an active employee with an annual salary of $45,000 per year, an additional contribution of $13.50 per month would be deducted from the employee’s paycheck to fund TRS-Care in the 2016-2017 biennium. Similarly, an additional $24.37 per month would be deducted in the 2018-2019 biennium. 14 .
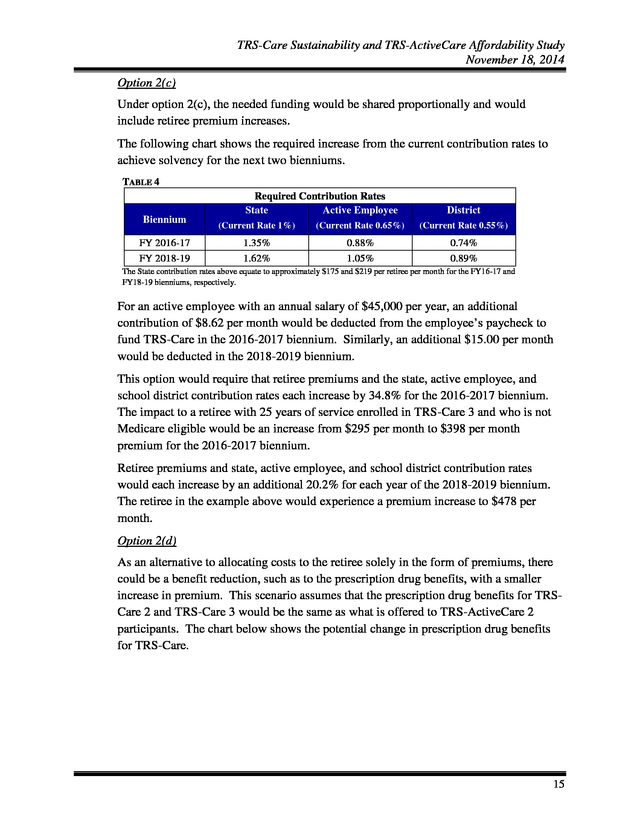
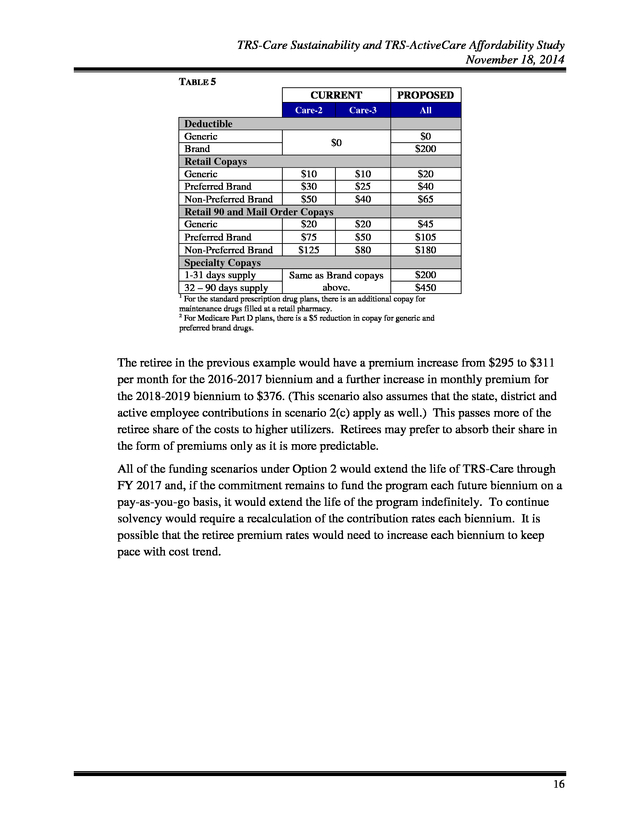
TRS-Care Sustainability and TRS-ActiveCare Affordability Study November 18, 2014 Option 2(c) Under option 2(c), the needed funding would be shared proportionally and would include retiree premium increases. The following chart shows the required increase from the current contribution rates to achieve solvency for the next two bienniums. TABLE 4 Required Contribution Rates State Active Employee Biennium FY 2016-17 FY 2018-19 District (Current Rate 1%) (Current Rate 0.65%) (Current Rate 0.55%) 1.35% 1.62% 0.88% 1.05% 0.74% 0.89% The State contribution rates above equate to approximately $175 and $219 per retiree per month for the FY16-17 and FY18-19 bienniums, respectively. For an active employee with an annual salary of $45,000 per year, an additional contribution of $8.62 per month would be deducted from the employee’s paycheck to fund TRS-Care in the 2016-2017 biennium. Similarly, an additional $15.00 per month would be deducted in the 2018-2019 biennium. This option would require that retiree premiums and the state, active employee, and school district contribution rates each increase by 34.8% for the 2016-2017 biennium. The impact to a retiree with 25 years of service enrolled in TRS-Care 3 and who is not Medicare eligible would be an increase from $295 per month to $398 per month premium for the 2016-2017 biennium. Retiree premiums and state, active employee, and school district contribution rates would each increase by an additional 20.2% for each year of the 2018-2019 biennium. The retiree in the example above would experience a premium increase to $478 per month. Option 2(d) As an alternative to allocating costs to the retiree solely in the form of premiums, there could be a benefit reduction, such as to the prescription drug benefits, with a smaller increase in premium. This scenario assumes that the prescription drug benefits for TRSCare 2 and TRS-Care 3 would be the same as what is offered to TRS-ActiveCare 2 participants. The chart below shows the potential change in prescription drug benefits for TRS-Care. 15 .
TRS-Care Sustainability and TRS-ActiveCare Affordability Study November 18, 2014 TABLE 5 CURRENT Care-2 Care-3 Deductible Generic $0 Brand Retail Copays Generic $10 $10 Preferred Brand $30 $25 Non-Preferred Brand $50 $40 Retail 90 and Mail Order Copays Generic $20 $20 Preferred Brand $75 $50 Non-Preferred Brand $125 $80 Specialty Copays 1-31 days supply Same as Brand copays above. 32 – 90 days supply PROPOSED All $0 $200 $20 $40 $65 $45 $105 $180 $200 $450 1 For the standard prescription drug plans, there is an additional copay for maintenance drugs filled at a retail pharmacy. For Medicare Part D plans, there is a $5 reduction in copay for generic and preferred brand drugs. 2 The retiree in the previous example would have a premium increase from $295 to $311 per month for the 2016-2017 biennium and a further increase in monthly premium for the 2018-2019 biennium to $376. (This scenario also assumes that the state, district and active employee contributions in scenario 2(c) apply as well.) This passes more of the retiree share of the costs to higher utilizers. Retirees may prefer to absorb their share in the form of premiums only as it is more predictable. All of the funding scenarios under Option 2 would extend the life of TRS-Care through FY 2017 and, if the commitment remains to fund the program each future biennium on a pay-as-you-go basis, it would extend the life of the program indefinitely. To continue solvency would require a recalculation of the contribution rates each biennium.
It is possible that the retiree premium rates would need to increase each biennium to keep pace with cost trend. 16 . TRS-Care Sustainability and TRS-ActiveCare Affordability Study November 18, 2014 CHART 6 Option 3: Fund for a 10-year solvency As mentioned earlier, this is not the first time TRS-Care has faced a funding shortfall. From FY 2001 through FY 2006, several changes were introduced to address insolvency. In FY 2001 through FY 2005, the state contributed supplemental appropriations. In FY 2004, a required contribution from school districts was established and from FY 2004 through FY 2006 increases were made to all or some of the contribution rates for the state, active employees, and school districts. In addition, in FY 2005 the TRS-Care plan options and premiums were significantly restructured and eligibility rules were tightened. Solvency for the next 10 years can be accomplished by projecting expenditures for that period and adjusting contributions. Option 3(a) Under option 3(a), the only funding change would be the contribution from the state. There would be no change in the contributions from active employees or school districts, and no change in premiums for retirees. For TRS-Care to be solvent through FY 2025, the state contribution rate would need to increase to 3.87% of active employee payroll. Option 3(b) Under option 3(b), the needed funding would be shared proportionally by the state, the school districts, and active public educators. There would be no change in premiums for retirees. 17 .
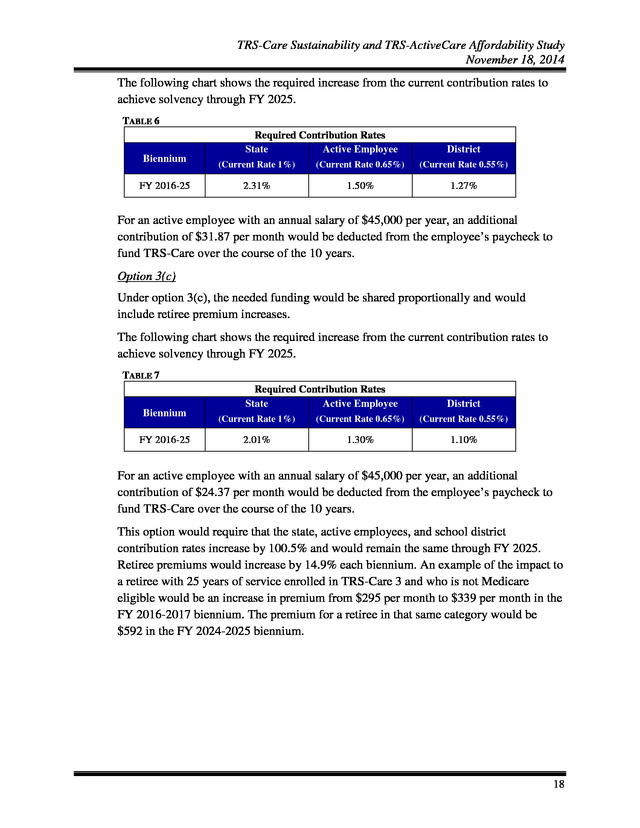
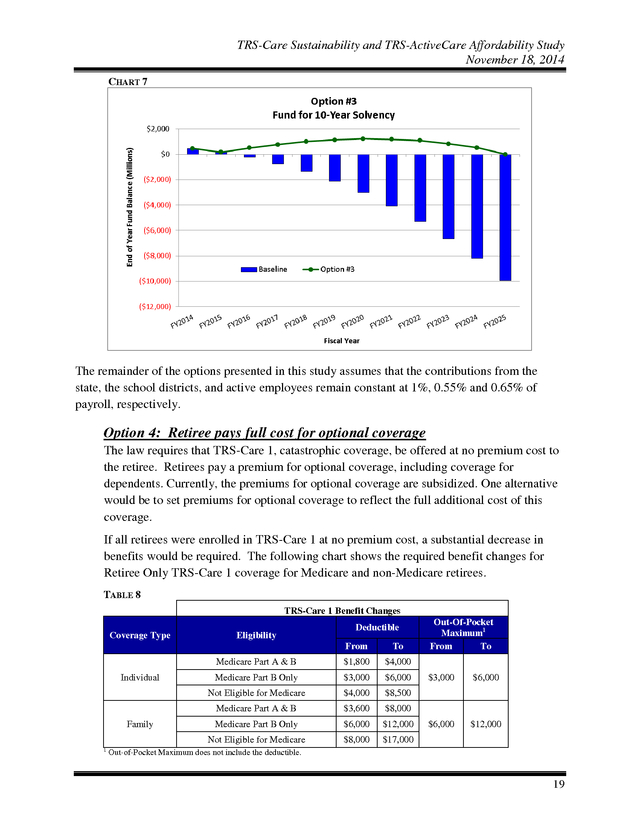
TRS-Care Sustainability and TRS-ActiveCare Affordability Study November 18, 2014 The following chart shows the required increase from the current contribution rates to achieve solvency through FY 2025. TABLE 6 Required Contribution Rates State Active Employee Biennium FY 2016-25 District (Current Rate 1%) (Current Rate 0.65%) (Current Rate 0.55%) 2.31% 1.50% 1.27% For an active employee with an annual salary of $45,000 per year, an additional contribution of $31.87 per month would be deducted from the employee’s paycheck to fund TRS-Care over the course of the 10 years. Option 3(c) Under option 3(c), the needed funding would be shared proportionally and would include retiree premium increases. The following chart shows the required increase from the current contribution rates to achieve solvency through FY 2025. TABLE 7 Required Contribution Rates State Active Employee Biennium FY 2016-25 District (Current Rate 1%) (Current Rate 0.65%) (Current Rate 0.55%) 2.01% 1.30% 1.10% For an active employee with an annual salary of $45,000 per year, an additional contribution of $24.37 per month would be deducted from the employee’s paycheck to fund TRS-Care over the course of the 10 years. This option would require that the state, active employees, and school district contribution rates increase by 100.5% and would remain the same through FY 2025. Retiree premiums would increase by 14.9% each biennium. An example of the impact to a retiree with 25 years of service enrolled in TRS-Care 3 and who is not Medicare eligible would be an increase in premium from $295 per month to $339 per month in the FY 2016-2017 biennium. The premium for a retiree in that same category would be $592 in the FY 2024-2025 biennium. 18 . TRS-Care Sustainability and TRS-ActiveCare Affordability Study November 18, 2014 CHART 7 The remainder of the options presented in this study assumes that the contributions from the state, the school districts, and active employees remain constant at 1%, 0.55% and 0.65% of payroll, respectively. Option 4: Retiree pays full cost for optional coverage The law requires that TRS-Care 1, catastrophic coverage, be offered at no premium cost to the retiree. Retirees pay a premium for optional coverage, including coverage for dependents. Currently, the premiums for optional coverage are subsidized. One alternative would be to set premiums for optional coverage to reflect the full additional cost of this coverage. If all retirees were enrolled in TRS-Care 1 at no premium cost, a substantial decrease in benefits would be required.
The following chart shows the required benefit changes for Retiree Only TRS-Care 1 coverage for Medicare and non-Medicare retirees. TABLE 8 TRS-Care 1 Benefit Changes Coverage Type Eligibility Deductible From $1,800 $4,000 Medicare Part B Only $3,000 $6,000 Not Eligible for Medicare Individual To Medicare Part A & B $4,000 $8,500 Medicare Part A & B 1 $3,600 $6,000 $12,000 $8,000 $3,000 $6,000 $6,000 $12,000 $8,000 Medicare Part B Only Not Eligible for Medicare Family Out-Of-Pocket Maximum1 From To $17,000 Out-of-Pocket Maximum does not include the deductible. 19 . TRS-Care Sustainability and TRS-ActiveCare Affordability Study November 18, 2014 In addition to the benefit reductions for TRS-Care 1, the premiums for optional coverage would need to be substantially increased. For example, the premium in FY 2016 for TRSCare 3 Retiree Only coverage for a non-Medicare retiree with 25 years of service would be increased from the current $295 per month to $616 per month and the monthly premium for TRS-Care 3 coverage for a retiree and spouse, both non-Medicare, would be increased from $635 per month to $1,811. Premium increases for optional coverage would be required each year to keep pace with cost trend. This option would build a funding surplus for the short term, but over time this surplus would be depleted and further benefit reductions would be necessary. It should also be noted that this option would create additional adverse selection as only those retirees who expect to have claims that exceed the high annual premiums would choose optional coverage. CHART 8 The chart on page 12 clearly shows the significant difference in TRS-Care exposure for the Medicare population in contrast with the non-Medicare population.
The remaining options address these two populations separately. Option 5 addresses the Medicare population. Option 5: Require purchase of Medicare Part B; Mandatory participation in Medicare Advantage and Medicare Part D plans TRS does not currently require that Medicare-eligible participants purchase Part B. However, to be financially neutral, TRS-Care processes claims assuming that participants have Part B. The table on page 8 does not distinguish those individuals who purchased Part B from those who could have, but did not, purchase Part B.
Approximately 1% of Medicare eligible participants in TRS-Care have not actually purchased Part B. 20 . TRS-Care Sustainability and TRS-ActiveCare Affordability Study November 18, 2014 Medicare imposes a late enrollment penalty for people who do not purchase Part B when they are first eligible. The standard Part B premium is $104.90 per month for 2014, with those individuals classified as higher income paying an additional premium. The penalty is 10% for each twelve-month period that an individual was eligible for, but did not purchase Part B. In order to be eligible to participate in a Medicare Advantage plan, a retiree or dependent must have both Medicare Part A (hospital benefits) and Part B (other medical benefits). To participate in a Medicare Part D plan, a retiree or dependent must have Medicare Part A and/or Part B. Effective January 1, 2013, TRS implemented the fully-insured Medicare Advantage plans and the Medicare Part D plans as optional offerings.
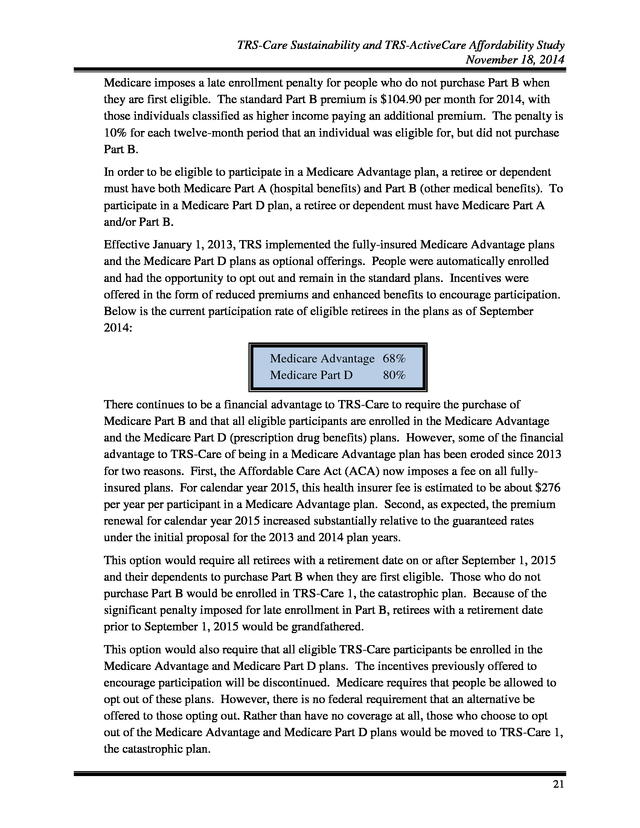
People were automatically enrolled and had the opportunity to opt out and remain in the standard plans. Incentives were offered in the form of reduced premiums and enhanced benefits to encourage participation. Below is the current participation rate of eligible retirees in the plans as of September 2014: Medicare Advantage 68% Medicare Part D 80% There continues to be a financial advantage to TRS-Care to require the purchase of Medicare Part B and that all eligible participants are enrolled in the Medicare Advantage and the Medicare Part D (prescription drug benefits) plans. However, some of the financial advantage to TRS-Care of being in a Medicare Advantage plan has been eroded since 2013 for two reasons.
First, the Affordable Care Act (ACA) now imposes a fee on all fullyinsured plans. For calendar year 2015, this health insurer fee is estimated to be about $276 per year per participant in a Medicare Advantage plan. Second, as expected, the premium renewal for calendar year 2015 increased substantially relative to the guaranteed rates under the initial proposal for the 2013 and 2014 plan years. This option would require all retirees with a retirement date on or after September 1, 2015 and their dependents to purchase Part B when they are first eligible.
Those who do not purchase Part B would be enrolled in TRS-Care 1, the catastrophic plan. Because of the significant penalty imposed for late enrollment in Part B, retirees with a retirement date prior to September 1, 2015 would be grandfathered. This option would also require that all eligible TRS-Care participants be enrolled in the Medicare Advantage and Medicare Part D plans. The incentives previously offered to encourage participation will be discontinued.
Medicare requires that people be allowed to opt out of these plans. However, there is no federal requirement that an alternative be offered to those opting out. Rather than have no coverage at all, those who choose to opt out of the Medicare Advantage and Medicare Part D plans would be moved to TRS-Care 1, the catastrophic plan. 21 .
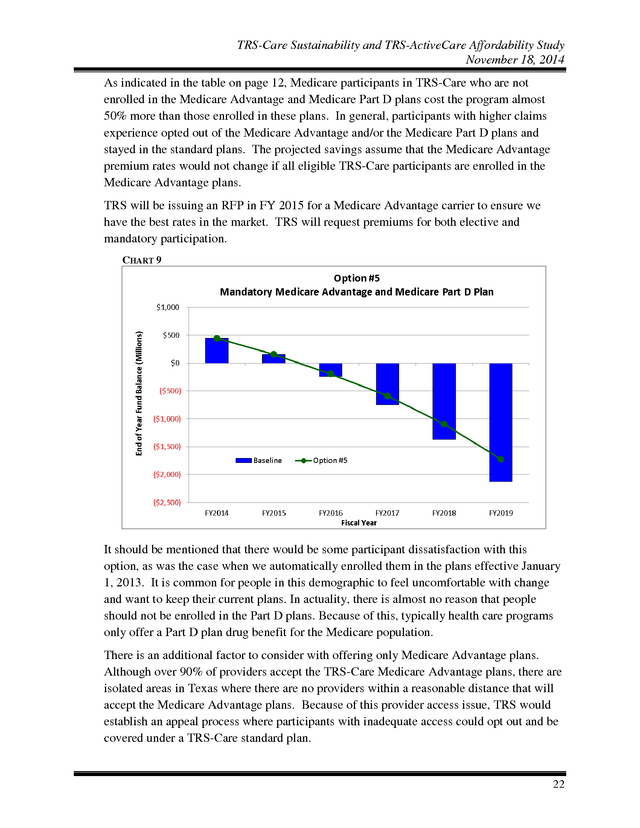
TRS-Care Sustainability and TRS-ActiveCare Affordability Study November 18, 2014 As indicated in the table on page 12, Medicare participants in TRS-Care who are not enrolled in the Medicare Advantage and Medicare Part D plans cost the program almost 50% more than those enrolled in these plans. In general, participants with higher claims experience opted out of the Medicare Advantage and/or the Medicare Part D plans and stayed in the standard plans. The projected savings assume that the Medicare Advantage premium rates would not change if all eligible TRS-Care participants are enrolled in the Medicare Advantage plans. TRS will be issuing an RFP in FY 2015 for a Medicare Advantage carrier to ensure we have the best rates in the market. TRS will request premiums for both elective and mandatory participation. CHART 9 It should be mentioned that there would be some participant dissatisfaction with this option, as was the case when we automatically enrolled them in the plans effective January 1, 2013.
It is common for people in this demographic to feel uncomfortable with change and want to keep their current plans. In actuality, there is almost no reason that people should not be enrolled in the Part D plans. Because of this, typically health care programs only offer a Part D plan drug benefit for the Medicare population. There is an additional factor to consider with offering only Medicare Advantage plans. Although over 90% of providers accept the TRS-Care Medicare Advantage plans, there are isolated areas in Texas where there are no providers within a reasonable distance that will accept the Medicare Advantage plans.
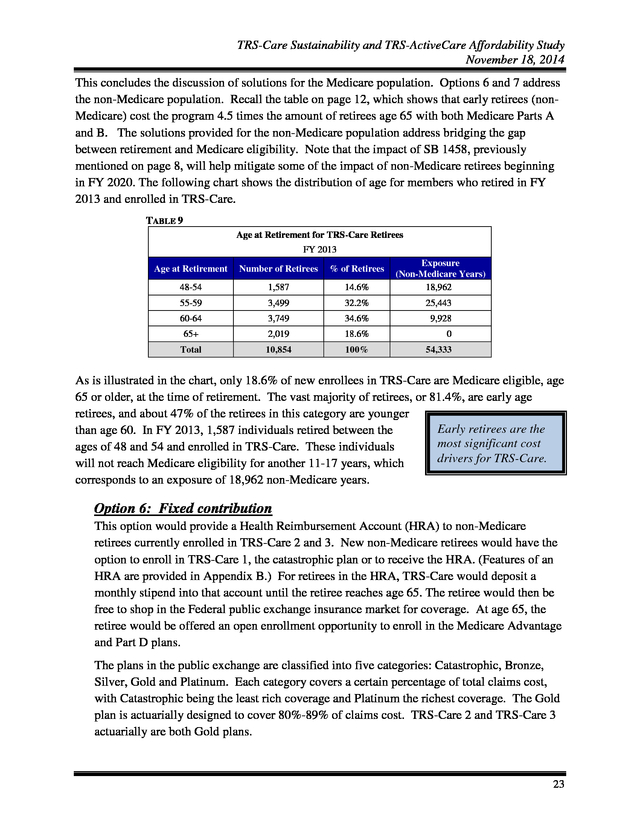
Because of this provider access issue, TRS would establish an appeal process where participants with inadequate access could opt out and be covered under a TRS-Care standard plan. 22 . TRS-Care Sustainability and TRS-ActiveCare Affordability Study November 18, 2014 This concludes the discussion of solutions for the Medicare population. Options 6 and 7 address the non-Medicare population. Recall the table on page 12, which shows that early retirees (nonMedicare) cost the program 4.5 times the amount of retirees age 65 with both Medicare Parts A and B. The solutions provided for the non-Medicare population address bridging the gap between retirement and Medicare eligibility.
Note that the impact of SB 1458, previously mentioned on page 8, will help mitigate some of the impact of non-Medicare retirees beginning in FY 2020. The following chart shows the distribution of age for members who retired in FY 2013 and enrolled in TRS-Care. TABLE 9 Age at Retirement for TRS-Care Retirees FY 2013 Age at Retirement Number of Retirees % of Retirees 48-54 1,587 14.6% Exposure (Non-Medicare Years) 18,962 55-59 3,499 32.2% 25,443 60-64 3,749 34.6% 9,928 65+ 2,019 18.6% 0 Total 10,854 100% 54,333 As is illustrated in the chart, only 18.6% of new enrollees in TRS-Care are Medicare eligible, age 65 or older, at the time of retirement. The vast majority of retirees, or 81.4%, are early age retirees, and about 47% of the retirees in this category are younger Early retirees are the than age 60.
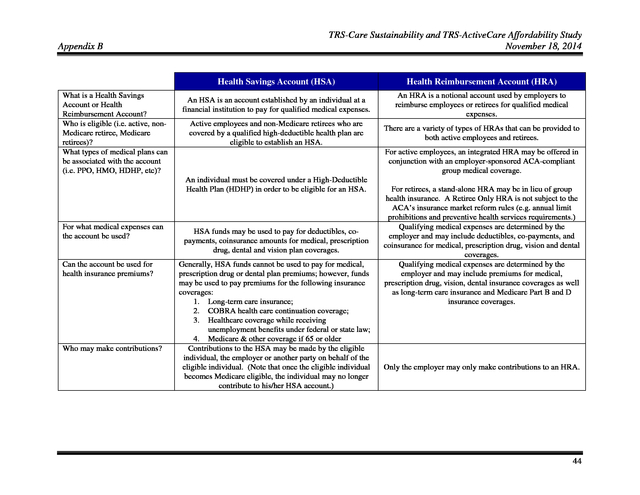
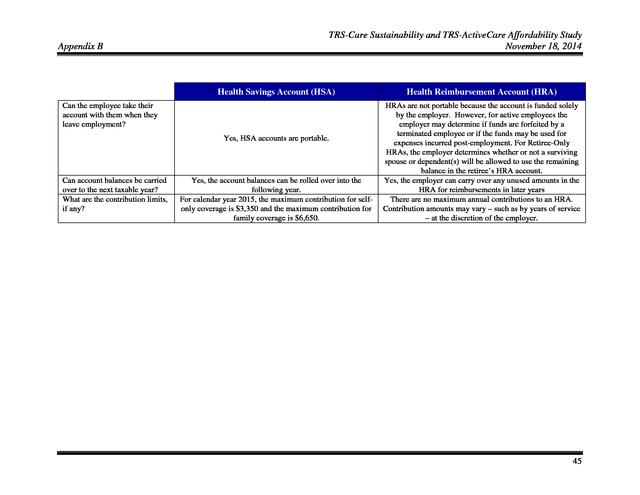
In FY 2013, 1,587 individuals retired between the most significant cost ages of 48 and 54 and enrolled in TRS-Care. These individuals drivers for TRS-Care. will not reach Medicare eligibility for another 11-17 years, which corresponds to an exposure of 18,962 non-Medicare years. Option 6: Fixed contribution This option would provide a Health Reimbursement Account (HRA) to non-Medicare retirees currently enrolled in TRS-Care 2 and 3. New non-Medicare retirees would have the option to enroll in TRS-Care 1, the catastrophic plan or to receive the HRA.
(Features of an HRA are provided in Appendix B.) For retirees in the HRA, TRS-Care would deposit a monthly stipend into that account until the retiree reaches age 65. The retiree would then be free to shop in the Federal public exchange insurance market for coverage. At age 65, the retiree would be offered an open enrollment opportunity to enroll in the Medicare Advantage and Part D plans. The plans in the public exchange are classified into five categories: Catastrophic, Bronze, Silver, Gold and Platinum.
Each category covers a certain percentage of total claims cost, with Catastrophic being the least rich coverage and Platinum the richest coverage. The Gold plan is actuarially designed to cover 80%-89% of claims cost. TRS-Care 2 and TRS-Care 3 actuarially are both Gold plans. 23 .
TRS-Care Sustainability and TRS-ActiveCare Affordability Study November 18, 2014 The Affordable Care Act (ACA) imposes a limitation on how much of a risk adjustment can be applied to participants based on age. This limitation is what drives the cost savings for this option. Currently, the maximum adjustment is three times the lowest premium for that same plan. For example, if a plan on the exchange for a 21 year old non-smoking participant is $300 per month, that same plan for someone 64 years old cannot exceed $900 per month. Using Travis County as an example, there is a wide range of Gold plan options available on the public exchange, including HMOs and PPOs, with varying premiums, deductibles, and out of pocket maximums.
Because TRS-Care 2 and 3 are PPO plans, a specific PPO plan offered on the exchange, myCigna Copay Assure Gold, will be used for this illustration. This plan has a $0 deductible, a $5,000 out of pocket maximum and costs $696 per month for a 60 year old in 2014. 1 Assuming the rates will increase in the public exchange by at least 7% per calendar year, the premium for the Cigna plan in this example would be $797 per month in calendar year 2016. Currently, a TRS-Care retiree with 25 years of service who is not Medicare eligible contributes $295 per month toward the cost of coverage. In this specific case, the contribution to the HRA would need to be $502 per month, or $6,024 per year to purchase the Cigna plan on the public exchange and keep this retiree in a financially neutral status with regard to premiums.
As stated on page 12, the projected FY 2015 TRS-Care cost per non-Medicare retiree in TRS-Care 3 is $13,220 per year. Assuming a 7% trend, the cost in FY 2016 will be $14,145 per year. Of this, $3,540 is currently paid by the retiree in premiums, leaving a $10,605 net cost to the plan.
By shifting the retiree to the public exchange, the projected FY 2016 savings to TRS-Care, net of the HRA administrative fees, for this specific retiree to TRS-Care would be approximately $4,521. Each year the HRA would be funded to maintain the retiree’s original $295 share of the premium. Note that this option does not contemplate any direct contribution to the HRA for dependent coverage. Instead of obtaining a Gold plan, the retiree could use the HRA contribution to obtain less rich retiree and spouse coverage, such as a Silver plan option. Under the Affordable Care Act, low income retirees may be eligible for subsidized coverage in the Federal public exchange.
However, they would need to forfeit the HRA to be eligible for the subsidy. Retirees would need to evaluate whether the HRA or the Federal exchange subsidy would be the most financially beneficial to them based on their income status. 1 Source: Current premium quotes found on www.healthcare.gov for an individual age 60 located in Travis County, Texas. Premiums shown do not reflect any federal subsidies for which an individual may qualify. 24 .
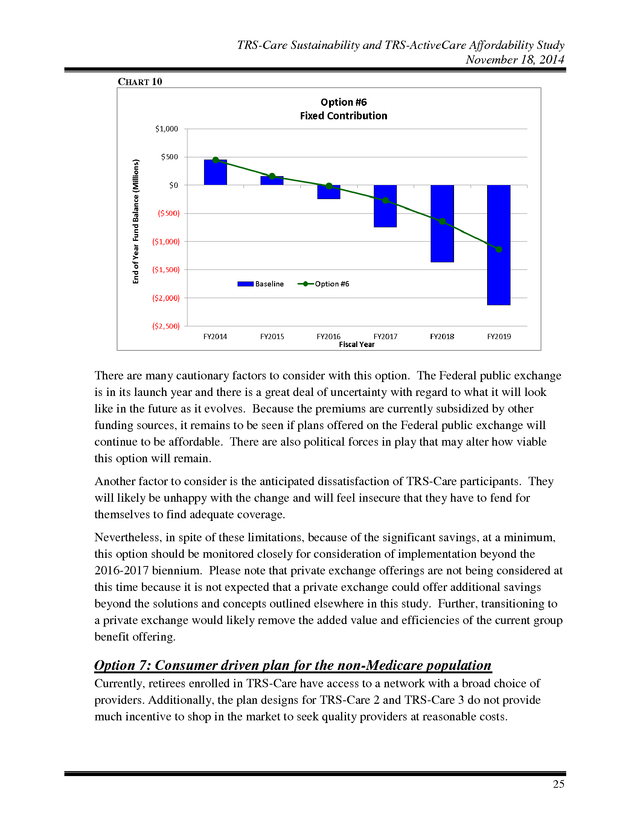
TRS-Care Sustainability and TRS-ActiveCare Affordability Study November 18, 2014 CHART 10 There are many cautionary factors to consider with this option. The Federal public exchange is in its launch year and there is a great deal of uncertainty with regard to what it will look like in the future as it evolves. Because the premiums are currently subsidized by other funding sources, it remains to be seen if plans offered on the Federal public exchange will continue to be affordable. There are also political forces in play that may alter how viable this option will remain. Another factor to consider is the anticipated dissatisfaction of TRS-Care participants.
They will likely be unhappy with the change and will feel insecure that they have to fend for themselves to find adequate coverage. Nevertheless, in spite of these limitations, because of the significant savings, at a minimum, this option should be monitored closely for consideration of implementation beyond the 2016-2017 biennium. Please note that private exchange offerings are not being considered at this time because it is not expected that a private exchange could offer additional savings beyond the solutions and concepts outlined elsewhere in this study. Further, transitioning to a private exchange would likely remove the added value and efficiencies of the current group benefit offering. Option 7: Consumer driven plan for the non-Medicare population Currently, retirees enrolled in TRS-Care have access to a network with a broad choice of providers.
Additionally, the plan designs for TRS-Care 2 and TRS-Care 3 do not provide much incentive to shop in the market to seek quality providers at reasonable costs. 25 . TRS-Care Sustainability and TRS-ActiveCare Affordability Study November 18, 2014 This option eliminates TRS-Care 2 and TRS-Care 3 for the non-Medicare population and introduces a new plan using consumerism as a tool for lowering claims trends for the nonMedicare population. It gives participants information and steers them to making the best choice. It also requires that those participants with complex conditions be engaged with the health plan administrator in managing their conditions. This option introduces preferred networks. Enrollees in certain urban areas would be required to participate in an Accountable Care Organization (ACO).
These organizations share in the risk of cost and must meet quality of care metrics. Those retirees residing in non-urban areas would have access to a broader network, but the plan design would include a tiered network with copay differentials that would steer them to providers with performance based contracts. In addition to tiered networks, this plan option assumes reference based pricing, which refers to the reimbursement of a fixed amount for certain medical services. Examples of such services include but are not limited to CT scanning, MRI, cataract removal, tonsillectomy/adenoidectomy and colonoscopy procedures. TABLE 10 Out-of-Network Benefits In-Network Benefits ACO & High Performance Networks Deductible (Individual/Family) Out-of-Pocket Maximum1 (Individual/Family) Coinsurance2 Office Visit PCP Specialist Prescription Drug Retail Generic Preferred Brand Non-Preferred Brand Retail 90 & Mail Order Generic Preferred Brand Non-Preferred Brand 1 Broad Network (Excluding ACO Service Areas) $500/$1,000 $1,000/$2,000 $1,800/$3,600 $4,000/$8,000 $6,000/$12,000 $8,500/$17,000 80/20% after deductible 70/30% after deductible 60/40% after deductible $30 $30 $45 $60 60/40% after deductible 60/40% after deductible $10 $30 $45 $20 $60 $90 N/A N/A Includes deductible, coinsurance and copays. 2 Coinsurance applies for most services not specifically listed. Under this option, retiree premiums are set to be equal to the current contributions for TRSCare 3 enrollees with 30+ years of service, $280 per month per a non-Medicare retiree. 26 .
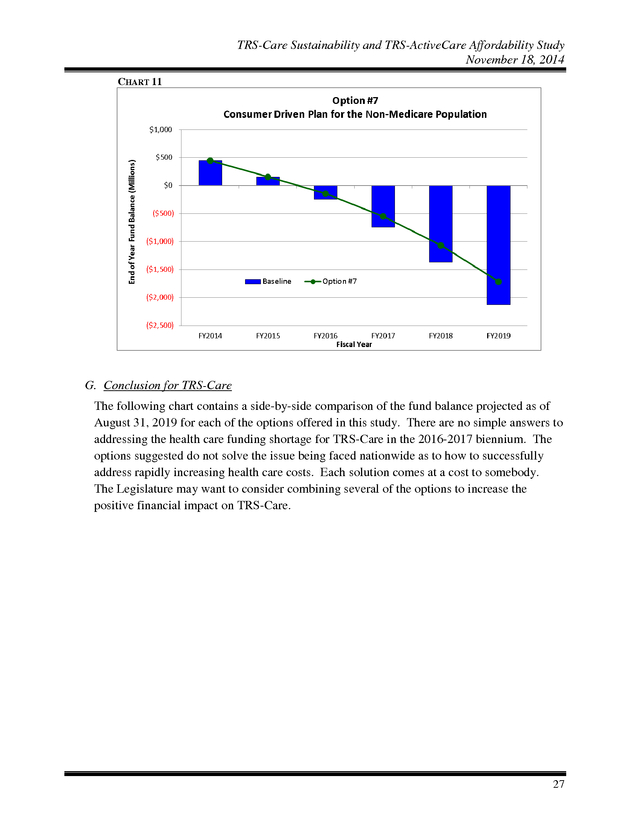
TRS-Care Sustainability and TRS-ActiveCare Affordability Study November 18, 2014 CHART 11 G. Conclusion for TRS-Care The following chart contains a side-by-side comparison of the fund balance projected as of August 31, 2019 for each of the options offered in this study. There are no simple answers to addressing the health care funding shortage for TRS-Care in the 2016-2017 biennium. The options suggested do not solve the issue being faced nationwide as to how to successfully address rapidly increasing health care costs.
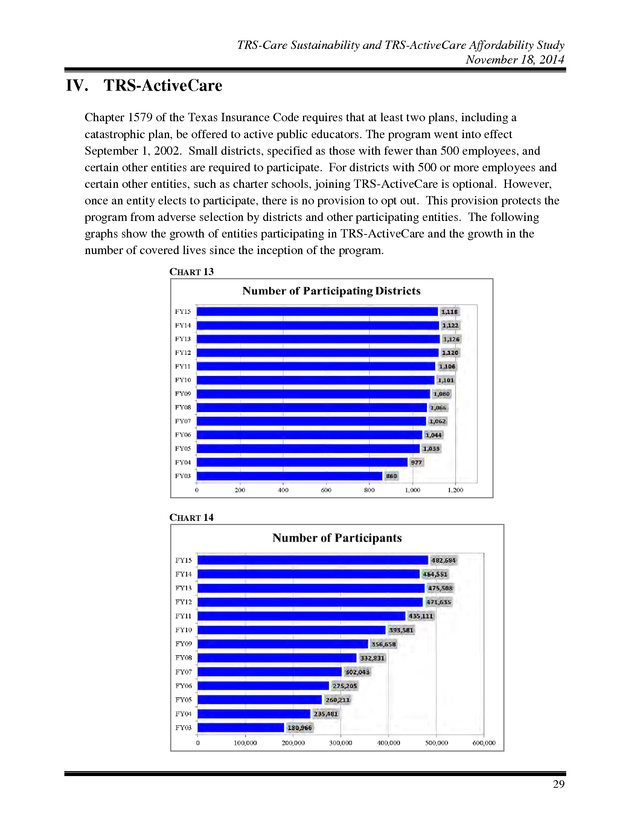
Each solution comes at a cost to somebody. The Legislature may want to consider combining several of the options to increase the positive financial impact on TRS-Care. 27 . TRS-Care Sustainability and TRS-ActiveCare Affordability Study November 18, 2014 CHART 12 TABLE 11 District Active Employees Option #1: Option #2: Pre-fund the long-term liability Fund on a pay-as-you-go basis thru FY2019 ï ï ï Option 2(a) Option 2(b) Option 2(c) Option 2(d) ï ï ï ï Option #3: Option #5: Option #6 Option #7: ï ï ï ï ï $928,089,752 ï ï $685,352,994 $311,524,089 $193,987,116 $193,987,116 ï ï $1,602,625,932 $728,466,333 $560,754,574 ï ï $0 ï $0 ï ï Fund on a pay-as-you-go basis thru FY2025 Option 3(a) Option 3(b) Option 3(c) Option #4: ï ï ï Medicare Retirees Description Impact on State Appropriations for the 2016-2017 Biennium NonMedicare Retirees Option State Impacted Parties Retiree pays full cost for optional coverage Require purchase of Medicare Part B; mandatory participation in Medicare Advantage and Medicare Part D plans Fixed Contribution for NonMedicare Retirees Consumer driven plan design for Care-2 and Care-3 nonMedicare enrollees ï ï ï ï ï ï ï ï $0 ï $0 28 . TRS-Care Sustainability and TRS-ActiveCare Affordability Study November 18, 2014 IV. TRS-ActiveCare Chapter 1579 of the Texas Insurance Code requires that at least two plans, including a catastrophic plan, be offered to active public educators. The program went into effect September 1, 2002. Small districts, specified as those with fewer than 500 employees, and certain other entities are required to participate.
For districts with 500 or more employees and certain other entities, such as charter schools, joining TRS-ActiveCare is optional. However, once an entity elects to participate, there is no provision to opt out. This provision protects the program from adverse selection by districts and other participating entities.
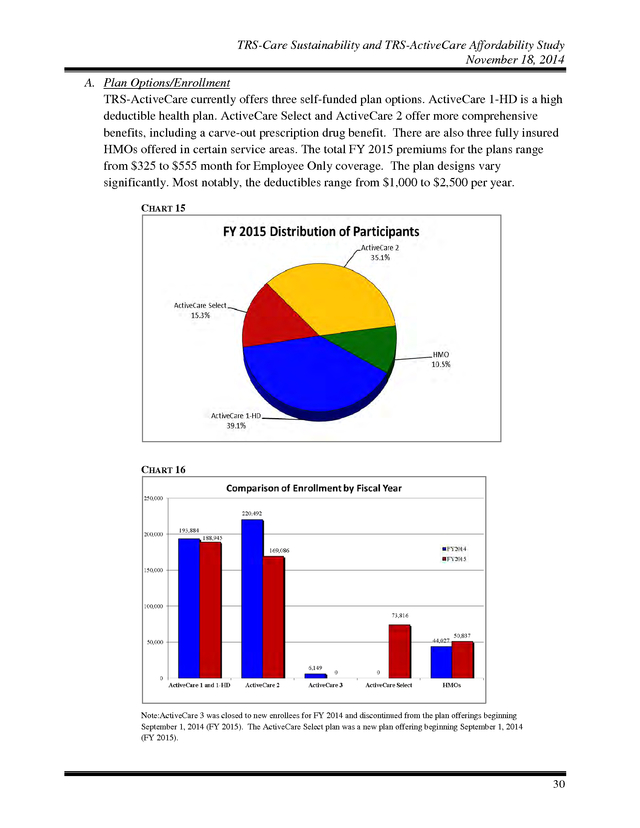
The following graphs show the growth of entities participating in TRS-ActiveCare and the growth in the number of covered lives since the inception of the program. CHART 13 CHART 14 29 . TRS-Care Sustainability and TRS-ActiveCare Affordability Study November 18, 2014 A. Plan Options/Enrollment TRS-ActiveCare currently offers three self-funded plan options. ActiveCare 1-HD is a high deductible health plan. ActiveCare Select and ActiveCare 2 offer more comprehensive benefits, including a carve-out prescription drug benefit.
There are also three fully insured HMOs offered in certain service areas. The total FY 2015 premiums for the plans range from $325 to $555 month for Employee Only coverage. The plan designs vary significantly.
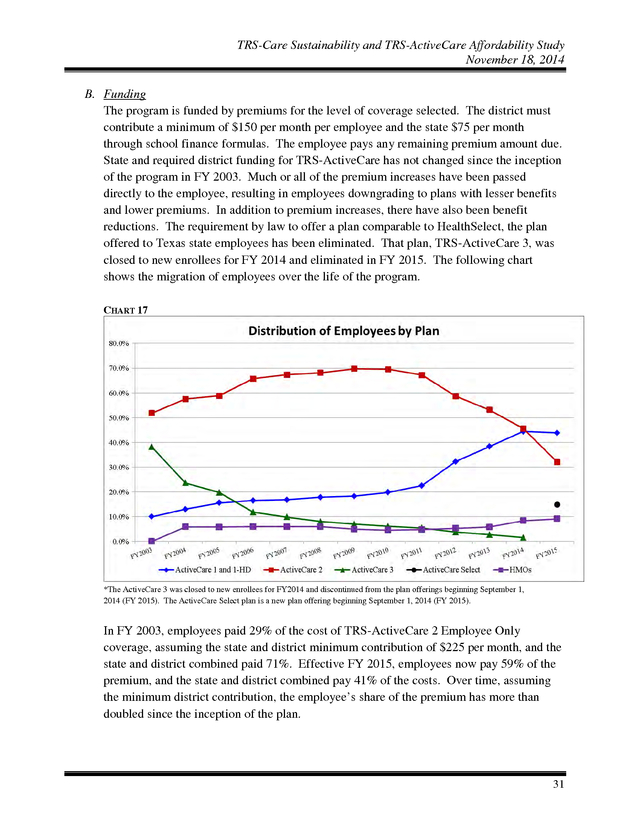
Most notably, the deductibles range from $1,000 to $2,500 per year. CHART 15 CHART 16 Note:ActiveCare 3 was closed to new enrollees for FY 2014 and discontinued from the plan offerings beginning September 1, 2014 (FY 2015). The ActiveCare Select plan was a new plan offering beginning September 1, 2014 (FY 2015). 30 . TRS-Care Sustainability and TRS-ActiveCare Affordability Study November 18, 2014 B. Funding The program is funded by premiums for the level of coverage selected. The district must contribute a minimum of $150 per month per employee and the state $75 per month through school finance formulas. The employee pays any remaining premium amount due. State and required district funding for TRS-ActiveCare has not changed since the inception of the program in FY 2003.
Much or all of the premium increases have been passed directly to the employee, resulting in employees downgrading to plans with lesser benefits and lower premiums. In addition to premium increases, there have also been benefit reductions. The requirement by law to offer a plan comparable to HealthSelect, the plan offered to Texas state employees has been eliminated.
That plan, TRS-ActiveCare 3, was closed to new enrollees for FY 2014 and eliminated in FY 2015. The following chart shows the migration of employees over the life of the program. CHART 17 *The ActiveCare 3 was closed to new enrollees for FY2014 and discontinued from the plan offerings beginning September 1, 2014 (FY 2015). The ActiveCare Select plan is a new plan offering beginning September 1, 2014 (FY 2015). In FY 2003, employees paid 29% of the cost of TRS-ActiveCare 2 Employee Only coverage, assuming the state and district minimum contribution of $225 per month, and the state and district combined paid 71%.
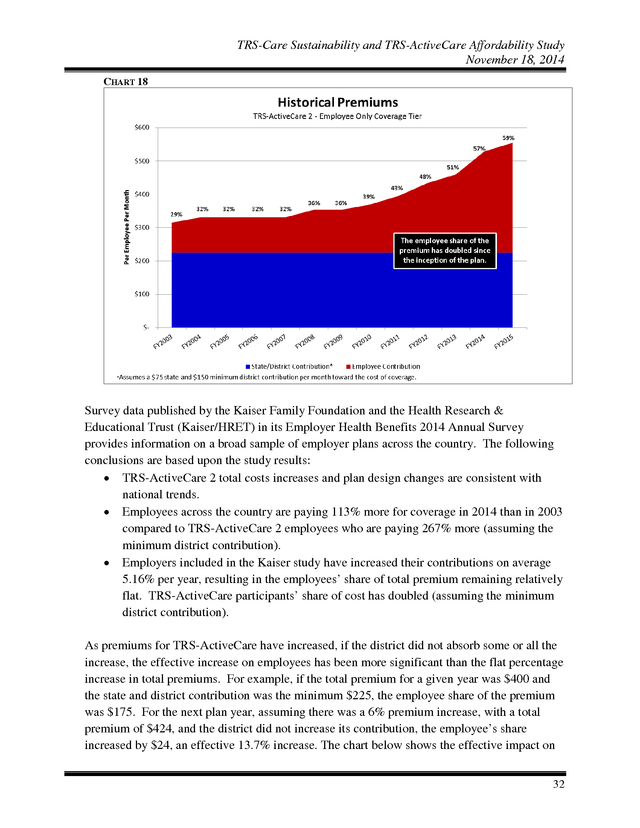
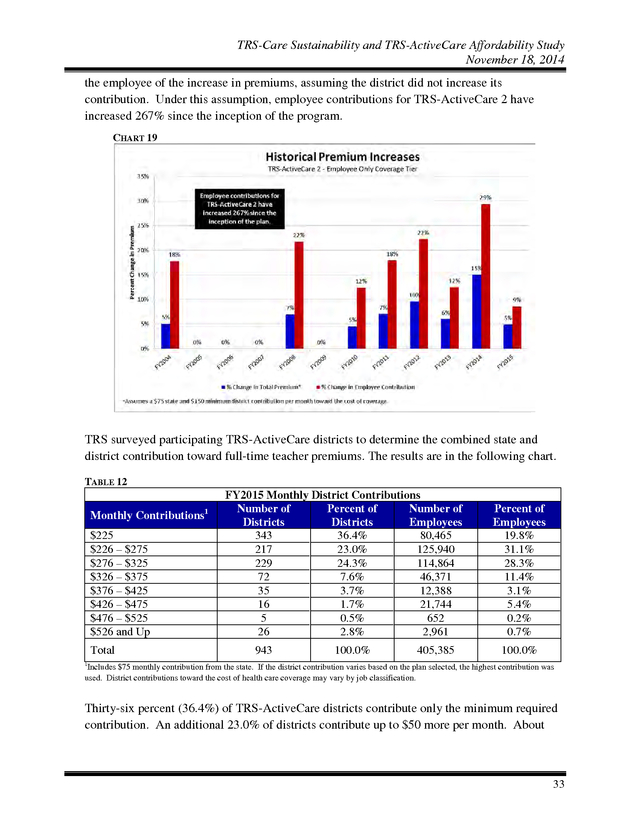
Effective FY 2015, employees now pay 59% of the premium, and the state and district combined pay 41% of the costs. Over time, assuming the minimum district contribution, the employee’s share of the premium has more than doubled since the inception of the plan. 31 . TRS-Care Sustainability and TRS-ActiveCare Affordability Study November 18, 2014 CHART 18 Survey data published by the Kaiser Family Foundation and the Health Research & Educational Trust (Kaiser/HRET) in its Employer Health Benefits 2014 Annual Survey provides information on a broad sample of employer plans across the country. The following conclusions are based upon the study results: • TRS-ActiveCare 2 total costs increases and plan design changes are consistent with national trends. • Employees across the country are paying 113% more for coverage in 2014 than in 2003 compared to TRS-ActiveCare 2 employees who are paying 267% more (assuming the minimum district contribution). • Employers included in the Kaiser study have increased their contributions on average 5.16% per year, resulting in the employees’ share of total premium remaining relatively flat. TRS-ActiveCare participants’ share of cost has doubled (assuming the minimum district contribution). As premiums for TRS-ActiveCare have increased, if the district did not absorb some or all the increase, the effective increase on employees has been more significant than the flat percentage increase in total premiums. For example, if the total premium for a given year was $400 and the state and district contribution was the minimum $225, the employee share of the premium was $175.
For the next plan year, assuming there was a 6% premium increase, with a total premium of $424, and the district did not increase its contribution, the employee’s share increased by $24, an effective 13.7% increase. The chart below shows the effective impact on 32 . TRS-Care Sustainability and TRS-ActiveCare Affordability Study November 18, 2014 the employee of the increase in premiums, assuming the district did not increase its contribution. Under this assumption, employee contributions for TRS-ActiveCare 2 have increased 267% since the inception of the program. CHART 19 TRS surveyed participating TRS-ActiveCare districts to determine the combined state and district contribution toward full-time teacher premiums. The results are in the following chart. TABLE 12 Monthly Contributions $225 $226 – $275 $276 – $325 $326 – $375 $376 – $425 $426 – $475 $476 – $525 $526 and Up Total 1 FY2015 Monthly District Contributions Number of Percent of Number of Districts Districts Employees 343 36.4% 80,465 217 23.0% 125,940 229 24.3% 114,864 72 7.6% 46,371 35 3.7% 12,388 16 1.7% 21,744 5 0.5% 652 26 2.8% 2,961 943 100.0% 405,385 Percent of Employees 19.8% 31.1% 28.3% 11.4% 3.1% 5.4% 0.2% 0.7% 100.0% 1 Includes $75 monthly contribution from the state. If the district contribution varies based on the plan selected, the highest contribution was used.
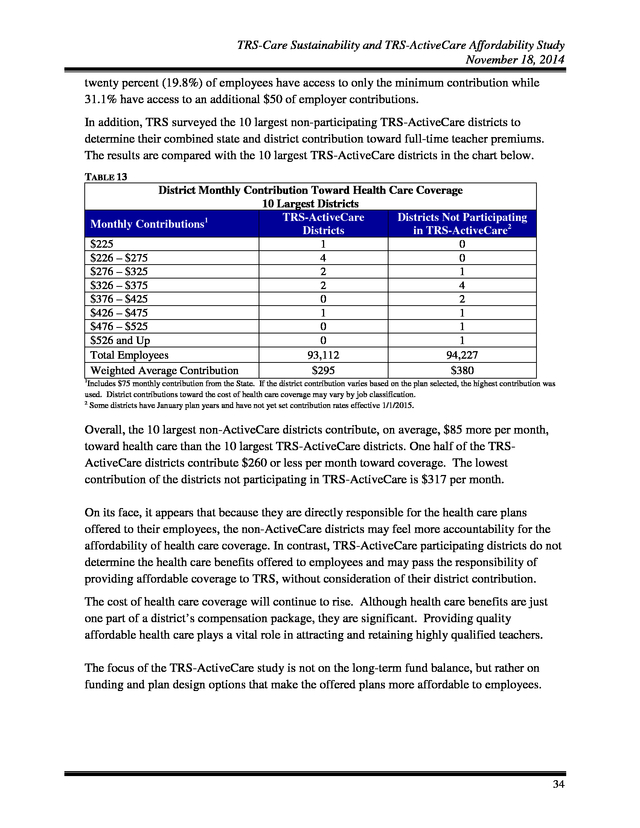
District contributions toward the cost of health care coverage may vary by job classification. Thirty-six percent (36.4%) of TRS-ActiveCare districts contribute only the minimum required contribution. An additional 23.0% of districts contribute up to $50 more per month. About 33 .
TRS-Care Sustainability and TRS-ActiveCare Affordability Study November 18, 2014 twenty percent (19.8%) of employees have access to only the minimum contribution while 31.1% have access to an additional $50 of employer contributions. In addition, TRS surveyed the 10 largest non-participating TRS-ActiveCare districts to determine their combined state and district contribution toward full-time teacher premiums. The results are compared with the 10 largest TRS-ActiveCare districts in the chart below. TABLE 13 District Monthly Contribution Toward Health Care Coverage 10 Largest Districts TRS-ActiveCare Districts Not Participating Monthly Contributions1 Districts in TRS-ActiveCare2 $225 1 0 $226 – $275 4 0 $276 – $325 2 1 $326 – $375 2 4 $376 – $425 0 2 $426 – $475 1 1 $476 – $525 0 1 $526 and Up 0 1 Total Employees 93,112 94,227 Weighted Average Contribution $295 $380 1 Includes $75 monthly contribution from the State. If the district contribution varies based on the plan selected, the highest contribution was used. District contributions toward the cost of health care coverage may vary by job classification. 2 Some districts have January plan years and have not yet set contribution rates effective 1/1/2015. Overall, the 10 largest non-ActiveCare districts contribute, on average, $85 more per month, toward health care than the 10 largest TRS-ActiveCare districts. One half of the TRSActiveCare districts contribute $260 or less per month toward coverage.
The lowest contribution of the districts not participating in TRS-ActiveCare is $317 per month. On its face, it appears that because they are directly responsible for the health care plans offered to their employees, the non-ActiveCare districts may feel more accountability for the affordability of health care coverage. In contrast, TRS-ActiveCare participating districts do not determine the health care benefits offered to employees and may pass the responsibility of providing affordable coverage to TRS, without consideration of their district contribution. The cost of health care coverage will continue to rise. Although health care benefits are just one part of a district’s compensation package, they are significant.
Providing quality affordable health care plays a vital role in attracting and retaining highly qualified teachers. The focus of the TRS-ActiveCare study is not on the long-term fund balance, but rather on funding and plan design options that make the offered plans more affordable to employees. 34 . TRS-Care Sustainability and TRS-ActiveCare Affordability Study November 18, 2014 C. Options In the following options, the employer contribution will be considered the combined state and district contribution. Option 1: Reinstate funding ratios to FY 2003 level As previously stated, the state and required minimum district funding for TRS-ActiveCare has not increased since the inception of the program in FY 2003. The state contributes $75 a month, through school finance formulas, and the district is required to make a minimum contribution of $150 per month, but may choose to contribute more. The total required $225 state and district contribution, from this point forward called the “employer contribution”, has not changed since the beginning of the program 13 years ago.
As previously presented on page 33, a survey of districts indicates that 36.4% of districts continue to contribute the minimum and an additional 23.0% contribute up to only $50 more than the minimum. The graph on page 32 shows that in FY 2003, assuming the district contributed only the minimum required, employees paid 29% of the cost of Employee Only coverage for TRSActiveCare 2. In FY 2015, their share is now 59% of the cost, a little more than double their FY 2003 share. A 4.8% increase in employer contributions would have been required each year to maintain the employee cost share of 29%.
In FY 2015, the premium for employee coverage for ActiveCare 2 is $555 per month. Assuming a 5% trend for FY 2015, the premium would be $583 for FY 2016. To do a catch up alignment to FY 2003 premium share levels, the required minimum employer contribution for FY 2016 is estimated to be $414 per month, an increase of $189, or 84% above the current employer contribution. Premiums are only one part of the costs that have shifted to the employee since the inception of the program.
TRS-ActiveCare 2 benefits have been decreased over time as well. For example, in FY 2003, TRS-ActiveCare 2 had a $500 medical deductible and no drug deductible. For FY 2015, the medical deductible is $1,000 and there is a $200 deductible for brand-name drugs.
If TRS-ActiveCare 2 benefits were actuarially equivalent to FY 2003 benefits and assuming a 5% trend for FY 2015, the premium for FY 2016 would need to be $659 per month. To align the premium share to FY 2003 levels, the required minimum employer contribution for FY 2016 would need to be $461 per month, an increase of $236, or 104.9% above the current employer contribution. Note that if TRS-ActiveCare 2 employer contributions had been increased each year by the CPI-U Medical Care index, the FY 2015 employee share of the premium would have been 38%. This falls short of maintaining the employer cost share of 29%.
However, this could periodically be evaluated to determine if it is the most relevant index to determine employer contributions. 35 . TRS-Care Sustainability and TRS-ActiveCare Affordability Study November 18, 2014 Option 2: Offer only a high deductible plan with a Health Savings Account (HSA) This option would eliminate the three current plans and the fully insured HMOs currently offered under TRS-ActiveCare. The sole plan offered would be a high deductible plan and an employer funded Health Savings Account (HSA). (Features of an HSA are provided in Appendix B.) As has been the case since the inception of the program, by offering multiple options, along with an annual open enrollment opportunity, there is inherent adverse selection. Generally, the employees with the most complex medical conditions enroll in the richest plan and as premiums increase, the healthier employees migrate to a less expensive plan as indicated in the chart on page 31.
This creates a “death spiral” for the plan with the richest benefits in which only the sickest people are enrolled and eventually becomes unaffordable. This phenomenon took place with TRS-ActiveCare 3, a plan that, until FY 2014, was required by law to be offered and be comparable in benefits to ERS HealthSelect, the plan for Texas state employees. Because the required employer contributions have not increased since FY 2003, that plan over time became unsustainable and was eliminated effective FY 2015. TRS anticipates that the same scenario will play out over time with TRS-ActiveCare 2, currently the richest plan offered under the program. Additionally, there is adverse selection in offering fully-insured HMOs.
Typically younger, healthier employees enroll in these plans. Because the HMOs are fully-insured, the premiums for this coverage leave the program and are therefore not part of the pool to pay claims for the less healthy remaining population in those service areas. Under the HSA option, the employer contribution to the premium and to the HSA would total a minimum of $400 per month, with a $350 contribution to the premium and at least a $50 contribution to the HSA. The employees would contribute $37 per month toward the cost of Employee Only coverage.
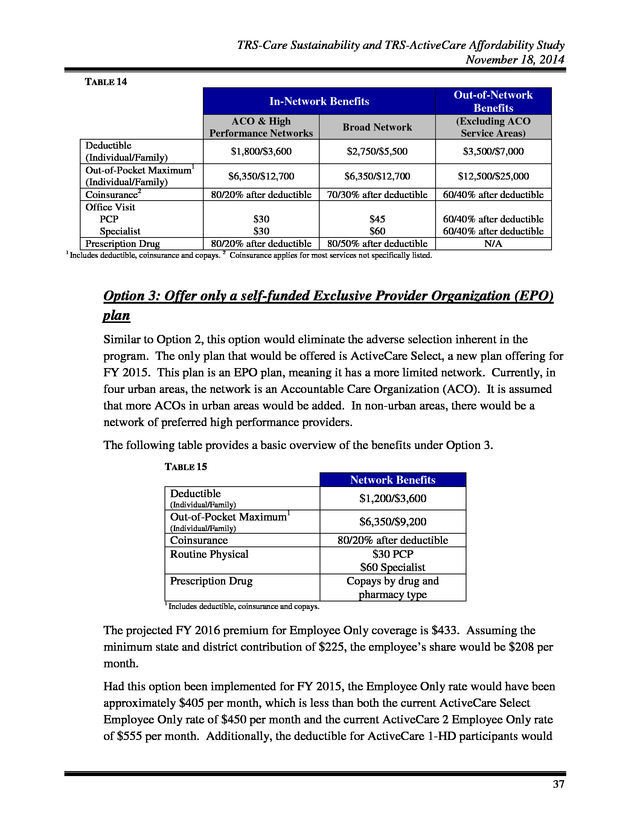
Employees would have the option to contribute additional funds to their HSA. This option assumes that same steerage and consumerism components as in Option 7 of the TRS-Care study. The plan design of the high-deductible plan is outlined in the following table. 36 . TRS-Care Sustainability and TRS-ActiveCare Affordability Study November 18, 2014 TABLE 14 Out-of-Network Benefits In-Network Benefits ACO & High Performance Networks Deductible (Individual/Family) Out-of-Pocket Maximum1 (Individual/Family) Coinsurance2 Office Visit PCP Specialist Prescription Drug 1 Broad Network (Excluding ACO Service Areas) $1,800/$3,600 $2,750/$5,500 $3,500/$7,000 $6,350/$12,700 $6,350/$12,700 $12,500/$25,000 80/20% after deductible 70/30% after deductible 60/40% after deductible $30 $30 80/20% after deductible $45 $60 80/50% after deductible 60/40% after deductible 60/40% after deductible N/A Includes deductible, coinsurance and copays. 2 Coinsurance applies for most services not specifically listed. Option 3: Offer only a self-funded Exclusive Provider Organization (EPO) plan Similar to Option 2, this option would eliminate the adverse selection inherent in the program. The only plan that would be offered is ActiveCare Select, a new plan offering for FY 2015. This plan is an EPO plan, meaning it has a more limited network.
Currently, in four urban areas, the network is an Accountable Care Organization (ACO). It is assumed that more ACOs in urban areas would be added. In non-urban areas, there would be a network of preferred high performance providers. The following table provides a basic overview of the benefits under Option 3. TABLE 15 Network Benefits Deductible $1,200/$3,600 (Individual/Family) 1 Out-of-Pocket Maximum (Individual/Family) Coinsurance Routine Physical Prescription Drug 1 $6,350/$9,200 80/20% after deductible $30 PCP $60 Specialist Copays by drug and pharmacy type Includes deductible, coinsurance and copays. The projected FY 2016 premium for Employee Only coverage is $433.
Assuming the minimum state and district contribution of $225, the employee’s share would be $208 per month. Had this option been implemented for FY 2015, the Employee Only rate would have been approximately $405 per month, which is less than both the current ActiveCare Select Employee Only rate of $450 per month and the current ActiveCare 2 Employee Only rate of $555 per month. Additionally, the deductible for ActiveCare 1-HD participants would 37 . TRS-Care Sustainability and TRS-ActiveCare Affordability Study November 18, 2014 be reduced by more than 50%. ActiveCare 2 participants would pay $150 per month less in premiums with only a $200 increase in annual deductible. This illustrates the impact of offering a single plan option to all ActiveCare participating districts. Option 4: Eliminate uniform statewide coverage Under current law, TRS-ActiveCare is required to offer uniform statewide coverage. No consideration is given for age or geographic location.
In the current market, the plans offered in the Federal public exchange develop premiums with consideration of both. It is anticipated that over time, some younger employees and many younger spouses, will drop TRS-ActiveCare coverage and go to the exchange. This will leave TRS-ActiveCare with a high concentration of enrollees with higher claims and fewer younger and healthier enrollees to offset costs. This option would allow TRS-ActiveCare to consider age and geographic location in establishing premiums and would allow TRS-ActiveCare to compete with the public exchange for younger, healthier individuals.
This of course would mean older, higher cost employees would pay more. It is estimated that if TRS-ActiveCare rates were based on age, a 30 year old teacher would be charged 33% less, while charges for a 64 year old employee would need a 76% increase. Therefore, another consideration in establishing premiums could be years of service, which would potentially lessen the impact of agebased premiums. It also may mean that certain geographic locations would pay more than others.
For example, based on an analysis of rates for actuarially similar plans offered on the Federal public exchange, if rates were based on geographic location, the cost of coverage in Tarrant County would exceed the cost in Hidalgo County by approximately 41%. However, in some parts of the state, this may be offset by regional differences in salaries, potentially leveling the percentage of pay that goes toward health care premiums. Option 5: Eliminate coverage for spouses Based on a survey of TRS-ActiveCare districts and charter schools, very few (4.6%) provide a contribution toward dependent coverage. Therefore, it appears that providing affordable dependent coverage is not an important recruitment or retention consideration. The ACA requires that employers offer coverage for children up to age 26, but it is not a requirement to offer coverage for spouses.
As previously stated in Option 4, the premiums for plans offered on the Federal public exchange are age-based and TRS-ActiveCare does not currently have that flexibility. TRS-ActiveCare anticipates that younger, healthier spouses will drop TRS-ActiveCare coverage and obtain coverage in the Federal public exchange. Already, employee and spouse coverage in TRS-ActiveCare is subsidized by other coverage tiers.
Because of the anticipated adverse selection of spouses, this subsidy will increase over time as the healthy spouses leave. If the cost of coverage for spouses is not subsidized, it will soon become unsustainable. Continuing to subsidize the increasing 38 .
TRS-Care Sustainability and TRS-ActiveCare Affordability Study November 18, 2014 costs of coverage for less healthy spouses has a direct impact on the affordability of Employee Only coverage. Another factor to consider is that under the ACA, if coverage is offered but the spouse declines, the spouse is not eligible for a subsidy on the Federal exchange. However, if an employer does not offer coverage for spouses, low income spouses may qualify for a subsidy on the Federal exchange. If Active-Care coverage for spouses were eliminated, the premiums for all other coverage tiers would be reduced by 2.3%. In the case of TRS-ActiveCare 2, instead of a monthly premium of $555 for Employee Only coverage, the premium for FY 2015 would have been $542. Assuming a 7% annual trend, the total premium in FY 2016 would be $580. D.
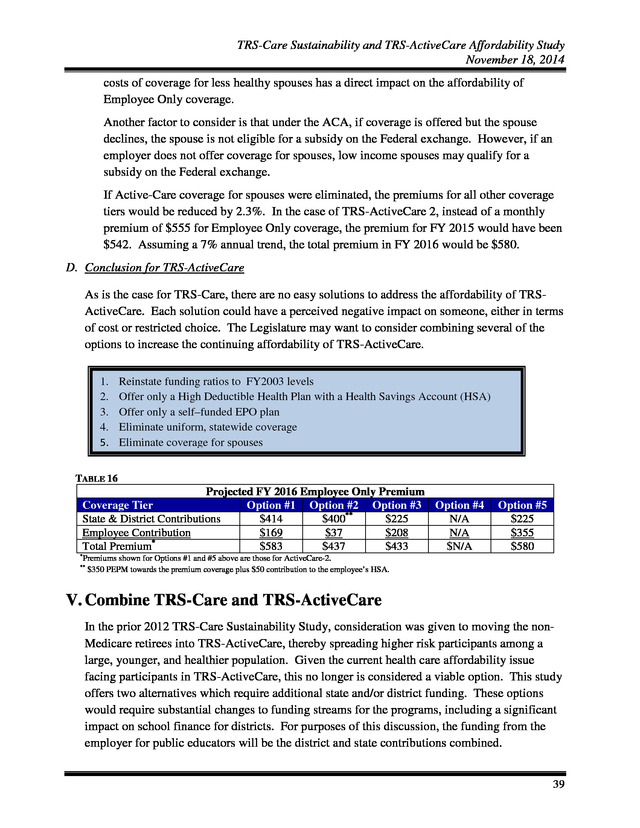
Conclusion for TRS-ActiveCare As is the case for TRS-Care, there are no easy solutions to address the affordability of TRSActiveCare. Each solution could have a perceived negative impact on someone, either in terms of cost or restricted choice. The Legislature may want to consider combining several of the options to increase the continuing affordability of TRS-ActiveCare. 1. 2. 3. 4. 5. Reinstate funding ratios to FY2003 levels Offer only a High Deductible Health Plan with a Health Savings Account (HSA) Offer only a self–funded EPO plan Eliminate uniform, statewide coverage Eliminate coverage for spouses TABLE 16 Projected FY 2016 Employee Only Premium Coverage Tier Option #1 Option #2 Option #3 Option #4 State & District Contributions $414 $400** $225 N/A Employee Contribution $169 $37 $208 N/A Total Premium* $583 $437 $433 $N/A Option #5 $225 $355 $580 * Premiums shown for Options #1 and #5 above are those for ActiveCare-2. $350 PEPM towards the premium coverage plus $50 contribution to the employee’s HSA. ** V.
Combine TRS-Care and TRS-ActiveCare In the prior 2012 TRS-Care Sustainability Study, consideration was given to moving the nonMedicare retirees into TRS-ActiveCare, thereby spreading higher risk participants among a large, younger, and healthier population. Given the current health care affordability issue facing participants in TRS-ActiveCare, this no longer is considered a viable option. This study offers two alternatives which require additional state and/or district funding.
These options would require substantial changes to funding streams for the programs, including a significant impact on school finance for districts. For purposes of this discussion, the funding from the employer for public educators will be the district and state contributions combined. 39 . TRS-Care Sustainability and TRS-ActiveCare Affordability Study November 18, 2014 Option 1: Offer the same benefit as HealthSelect HealthSelect, the health care coverage for Texas state employees, covers both active and retired members. The state pays 100% of Employee Only and Retiree Only premiums and 50% of dependent coverage (as a participation incentive, the state pays more than 50% of dependent coverage for those enrolled in the HealthSelect Medicare Advantage plan). There is a significant difference in the level of funding per employee/retiree per month provided by the employer for the ERS health plan when compared to the TRS health plans. This difference is illustrated in the following chart that compares the employer’s FY 2015 contribution for Employee Only coverage between the ERS and TRS health plans. Employer contributions for the TRS plans include both the state and district contribution. The chart below shows the average FY 2015 employer contribution per employee/retiree: TABLE 17 Entity Monthly ERS TRS-Care TRS-ActiveCare $535 $189** $225 Annual $6,425* $2,268** $2,700*** * Does not foot due to rounding. Based on the 1% state and 0.55% district contribution to TRS-Care. *** Assumes $75 state contribution and $150 minimum district contribution. Districts may contribute more. ** The following table shows the required monthly premium for Employee Only or Retiree Only coverage for Care 3 (standard plan), ActiveCare 1 HD, ActiveCare 2 and ERS’ HealthSelect. There are additional plans offered under TRS-ActiveCare and TRS-Care, but the plans selected for the comparison have the majority of enrollees. TABLE 18 Employee Only / Retiree Only Share of Premium TRS-Care-3 TRS-AC 1-HD ERS HealthSelect Monthly Premium $90-$310* $330** $100** $-0- Annual Premium * TRS-AC 2 $1,080-$3,720* $3,960** $1,200** $-0- Premium range based on years of service and Medicare eligibility. Assumes $75 state contribution and $150 minimum district contribution.
Districts can contribute more to lower employee costs. ** The following table shows a high level plan design comparison for the same plans. 40 . TRS-Care Sustainability and TRS-ActiveCare Affordability Study November 18, 2014 TABLE 19 TRS-Care-3 TRS-AC 2 TRS-AC 1-HD ERS HealthSelect $300 $1,000 $2,400 $-0- $3,700 $6,000 $6,350 $6,350 Drug Deductible $-0- $200 brand-name drugs Combined with medical deductible $50 Retail short term1 Generic Brand preferred Brand non-preferred $10 $25 $40 $20 $40 $65 20% after deductible $5 $35 $60 $20 $50 $80 $45 $105 $180 20% after deductible $15 $105 $180 Medical Deductible Out-of-pocket maximum Mail Order and Retail-Plus (90 day supply) Generic Brand preferred Brand non-preferred 1 Enrollees in TRS-ActiveCare 2 and ERS HealthSelect pay an additional copay if filling a maintenance drug at a retail pharmacy. These comparisons show that there would need to be significant increases in both benefits and funding to provide coverage at the same cost to public educators as what is offered to state employees. There are several assumptions made for this option: • • • • • • All districts would participate; Retirees who previously declined coverage would have an open enrollment opportunity; No employee or retiree would decline coverage; Current employer contributions for TRS-ActiveCare are the minimum $225 per month per covered employee; Employer contributions for TRS-Care are an average of $189 per month per covered retiree; and Active employee contributions for TRS-Care would discontinue. Assuming a cost trend of 7.0%, to provide a benefit comparable to public educators for Employee Only/Retiree Only coverage that is comparable to HealthSelect, the employer contribution would need to increase by $2.74 billion and $3.05 billion for ActiveCare participants and by $0.94 billion and $1.06 billion for TRS-Care participants, respectively for FY 2016 and FY 2017. This would require additional employer funding of $7.8 billion for the 2016-2017 biennium. (The current employer contributions of $4.5 billion would be increased to $12.3 billion.) Note that because we have a more costly, predominantly female population, benefits may need to be reduced from those offered under HealthSelect to maintain solvency. The required funding would be greater if the employer also provided a 50% contribution toward the cost of the dependent coverage. 41 . TRS-Care Sustainability and TRS-ActiveCare Affordability Study November 18, 2014 Option 2: Increase employer funding to $400 per participant This option combines TRS-Care and TRS-ActiveCare and increases funding from the employer from $189 per retiree and $225 per active employee to $400 per month. The approach for this option was to begin with a plan design that would provide valuable benefits at a reasonable premium cost. For non-Medicare participants, it assumes that both the ActiveCare 1-HD and ActiveCare 2 plans are offered. In addition the only option available to Medicare eligible participants would be a Medicare Advantage plan and the Medicare Part D plan with the same benefits as Care 2. There are several assumptions made for this option: • • • • • • All districts would participate; Retirees who declined coverage would have an open enrollment opportunity; 20% of employees and retirees would decline coverage; Current employer contributions for TRS-ActiveCare are the minimum $225 per month per covered employee; Employer contributions for TRS-Care are an average of $189 per month per covered retiree; and Active employee contributions for TRS-Care would discontinue. With the $400 per month contribution per participant and the plan design just described, Employee Only and Retiree Only coverage for the FY 2016-2017 biennium could be offered at a premium of $58 per month. The following table shows the impact to state and district contributions for the two options just described. The amounts shown are based on funding on a per employee/retiree basis.
The cost of contributing towards dependent coverage would be in addition to the amounts shown below. TABLE 20 Option Option #1: Offer ERS’ HealthSelect plan options Option #2: Offer ActiveCare-2 for NonMedicare participants and Medicare Advantage Care-2 for Medicare participants 1 Current State1 & District Funding Additional Funding Total Funds Required $4,479,400,432 $7,797,429,475 $12,276,829,908 $3,714,948,352 $3,207,009,940 $6,921,958,292 Includes funds from all sources. 42 . TRS-Care Sustainability and TRS-ActiveCare Affordability Study November 18, 2014 Appendix A TRS-Care Fund Balance Projection Financial History and Projection through FY2019 as of July 31, 2014 Contributions Fiscal Year Retiree Contributions State Contributions FY 1986 FY 1987 FY 1988 FY 1989 FY 1990 FY 1991 FY 1992 FY 1993 FY 1994 FY 1995 FY 1996 FY 1997 FY 1998 FY 1999 FY 2000 FY 2001 FY 2002 FY 2003 FY 2004 FY 2005 FY 2006 FY 2007 FY 2008 FY 2009 FY 2010 FY 2011 FY 2012 FY 2013 $0 $22,617,624 $23,948,600 $25,428,632 $37,556,561 $46,563,787 $56,395,797 $65,154,653 $80,128,944 $89,006,331 $82,622,236 $87,657,784 $91,390,173 $96,474,107 $120,227,960 $131,213,445 $143,797,748 $162,954,010 $248,552,679 $322,780,191 $326,844,982 $323,957,945 $328,505,433 $329,723,191 $332,481,933 $345,164,271 $363,348,030 $355,685,504 $0 $25,931,680 $31,357,632 $37,420,711 $44,369,915 $47,277,743 $50,392,512 $54,029,406 $56,912,083 $59,849,850 $63,634,087 $67,616,395 $72,210,190 $76,488,424 $85,505,637 $90,118,787 $94,792,026 $98,340,798 $198,594,194 $202,397,566 $215,666,940 $238,190,720 $254,722,174 $267,471,299 $279,250,547 $282,782,431 $271,925,242 $139,213,557 $250,000 $0 $0 $0 $0 $0 $0 $0 $0 $0 $0 $0 $0 $0 $0 $76,281,781 $285,515,036 $124,661,063 $298,197,463 $64,172,167 $0 $0 $0 $0 $0 $0 $0 $102,363,704 $17,625,194 $18,522,629 $19,598,520 $20,789,215 $22,184,958 $23,638,871 $25,196,592 $27,014,703 $28,456,041 $29,924,925 $31,817,043 $33,808,197 $36,105,095 $38,244,213 $42,738,069 $45,059,394 $47,378,092 $49,170,399 $99,297,097 $101,198,783 $140,183,511 $154,823,968 $165,569,413 $173,856,344 $181,512,856 $183,808,580 $176,751,407 $180,824,522 FY 2014 FY 2015 FY 2016 FY 2017 FY 2018 FY 2019 $363,631,292 $375,309,536 $382,156,578 $387,990,564 $393,642,584 $399,564,442 $288,530,702 $294,301,316 $300,187,342 $306,191,089 $312,314,911 $318,561,209 $36,058,148 $0 $0 $0 $0 $0 $189,003,903 $191,295,855 $195,121,773 $199,024,208 $203,004,692 $207,064,786 Supplemental Active Employee Appropriations Contributions District Contributions Expenditures Investment Income CMS& Part D Subsidies ERRP Subsidy $0 $0 $0 $0 $0 $0 $0 $0 $0 $0 $0 $0 $0 $0 $0 $0 $0 $0 $79,457,387 $80,914,228 $118,607,527 $136,008,512 $141,672,630 $149,562,613 $155,918,241 $158,724,010 $154,607,926 $160,952,396 $572,153 $2,568,998 $5,703,832 $8,802,914 $13,098,835 $15,801,047 $17,314,372 $17,181,190 $16,467,438 $16,841,673 $16,818,747 $16,202,440 $15,260,517 $9,762,741 $6,923,485 $5,824,134 $7,140,560 $3,394,956 $4,840,982 $11,300,868 $21,435,792 $32,671,539 $29,252,347 $17,482,143 $11,679,229 $8,168,640 $5,189,934 $3,041,001 $0 $0 $0 $0 $0 $0 $0 $0 $0 $0 $0 $0 $0 $0 $0 $0 $0 $0 $0 $0 $34,611,607 $52,329,617 $59,486,239 $61,530,735 $70,795,686 $66,258,008 $71,575,942 $98,628,841 $0 $0 $0 $0 $0 $0 $0 $0 $0 $0 $0 $0 $0 $0 $0 $0 $0 $0 $0 $0 $0 $0 $0 $0 $0 $70,629,797 ($2,941,996) $0 $169,847,447 $171,775,457 $175,012,771 $178,314,832 $181,682,934 $185,118,398 $2,575,724 $1,640,626 $374,653 $0 $0 $0 $136,909,692 $137,665,374 $144,697,024 $153,664,863 $162,724,692 $171,646,256 $0 $0 $0 $0 $0 $0 Medical Incurred Drug Incurred Medicare Advantage Premiums Administrative Costs Ending Balance (Incurred Basis) $0 $50,988,845 $16,157,649 $32,926,324 $50,171,919 $82,697,189 $74,307,953 $101,627,864 $108,284,693 $122,054,551 $135,982,304 $148,823,489 $156,537,913 $184,398,533 $203,029,971 $250,691,898 $287,729,918 $368,462,963 $366,840,457 $431,036,095 $427,553,404 $437,519,747 $498,767,038 $531,239,020 $575,539,788 $608,461,321 $687,987,585 $686,321,003 $0 $7,044,825 $12,441,672 $15,458,710 $19,835,965 $28,683,081 $33,829,694 $40,700,513 $45,712,060 $50,782,093 $57,074,921 $62,530,982 $76,256,158 $93,459,890 $110,903,247 $139,774,848 $163,979,754 $203,281,400 $214,514,500 $229,522,988 $259,532,887 $304,773,401 $334,742,500 $353,893,845 $395,817,017 $384,017,059 $454,143,825 $496,229,923 $0 $0 $0 $0 $0 $0 $0 $0 $0 $0 $0 $0 $0 $0 $0 $0 $0 $0 $0 $0 $0 $0 $0 $0 $0 $0 $0 $1,075,388 $362,371 $3,941,936 $4,614,755 $5,212,073 $7,186,851 $8,258,029 $8,862,560 $10,067,359 $11,668,828 $12,219,847 $13,593,578 $14,097,454 $14,616,678 $14,905,196 $16,837,127 $18,237,767 $19,017,292 $21,690,329 $26,332,200 $33,333,010 $34,434,969 $35,878,194 $39,656,301 $43,184,393 $45,465,776 $47,151,354 $48,181,723 $47,048,587 $18,084,976 $25,750,301 $73,144,809 $111,989,174 $152,004,708 $165,647,857 $197,946,923 $208,931,140 $225,230,065 $235,796,353 $224,037,663 $203,870,554 $171,425,780 $99,631,646 $24,256,451 ($35,950,521) $71,945,978 ($82,967,487) $238,285,158 $327,156,868 $462,985,967 $622,796,927 $728,839,324 $800,148,391 $814,964,302 $890,870,304 $741,013,656 $551,048,281 $663,776,624 $714,554,807 $757,491,018 $801,449,056 $847,791,092 $900,054,508 $554,469,888 $630,554,683 $702,294,006 $781,198,312 $867,238,519 $960,863,140 $27,435,222 $62,820,617 $82,381,863 $95,150,922 $109,574,924 $125,679,103 $45,737,185 $53,509,083 $52,998,328 $52,849,907 $51,526,479 $52,502,616 $446,186,269 $156,735,244 ($240,879,830) ($746,342,472) ($1,369,103,672) ($2,126,247,948) 43 . Appendix B TRS-Care Sustainability and TRS-ActiveCare Affordability Study November 18, 2014 Health Savings Account (HSA) What is a Health Savings Account or Health Reimbursement Account? Who is eligible (i.e. active, nonMedicare retiree, Medicare retirees)? What types of medical plans can be associated with the account (i.e. PPO, HMO, HDHP, etc)? Health Reimbursement Account (HRA) An HSA is an account established by an individual at a financial institution to pay for qualified medical expenses. An HRA is a notional account used by employers to reimburse employees or retirees for qualified medical expenses. Active employees and non-Medicare retirees who are covered by a qualified high-deductible health plan are eligible to establish an HSA. There are a variety of types of HRAs that can be provided to both active employees and retirees. For active employees, an integrated HRA may be offered in conjunction with an employer-sponsored ACA-compliant group medical coverage. An individual must be covered under a High-Deductible Health Plan (HDHP) in order to be eligible for an HSA. For what medical expenses can the account be used? Can the account be used for health insurance premiums? Who may make contributions? HSA funds may be used to pay for deductibles, copayments, coinsurance amounts for medical, prescription drug, dental and vision plan coverages. Generally, HSA funds cannot be used to pay for medical, prescription drug or dental plan premiums; however, funds may be used to pay premiums for the following insurance coverages: 1. Long-term care insurance; 2.
COBRA health care continuation coverage; 3. Healthcare coverage while receiving unemployment benefits under federal or state law; 4. Medicare & other coverage if 65 or older Contributions to the HSA may be made by the eligible individual, the employer or another party on behalf of the eligible individual.
(Note that once the eligible individual becomes Medicare eligible, the individual may no longer contribute to his/her HSA account.) For retirees, a stand-alone HRA may be in lieu of group health insurance. A Retiree Only HRA is not subject to the ACA’s insurance market reform rules (e.g. annual limit prohibitions and preventive health services requirements.) Qualifying medical expenses are determined by the employer and may include deductibles, co-payments, and coinsurance for medical, prescription drug, vision and dental coverages. Qualifying medical expenses are determined by the employer and may include premiums for medical, prescription drug, vision, dental insurance coverages as well as long-term care insurance and Medicare Part B and D insurance coverages. Only the employer may only make contributions to an HRA. 44 .
Appendix B TRS-Care Sustainability and TRS-ActiveCare Affordability Study November 18, 2014 Health Savings Account (HSA) Can the employee take their account with them when they leave employment? Yes, HSA accounts are portable. Can account balances be carried over to the next taxable year? What are the contribution limits, if any? Yes, the account balances can be rolled over into the following year. For calendar year 2015, the maximum contribution for selfonly coverage is $3,350 and the maximum contribution for family coverage is $6,650. Health Reimbursement Account (HRA) HRAs are not portable because the account is funded solely by the employer. However, for active employees the employer may determine if funds are forfeited by a terminated employee or if the funds may be used for expenses incurred post-employment. For Retiree-Only HRAs, the employer determines whether or not a surviving spouse or dependent(s) will be allowed to use the remaining balance in the retiree’s HRA account. Yes, the employer can carry over any unused amounts in the HRA for reimbursements in later years There are no maximum annual contributions to an HRA. Contribution amounts may vary – such as by years of service – at the discretion of the employer. 45 . Teacher Retirement System of Texas www.trs.state.tx.us 1000 Red River Street, Austin, Texas 78701 - 2698 1-800-223-8778 .
7 III. TRS-Care ................................................................................................................................ 7 A.
Eligibility ............................................................................................................................ 8 B. Plan Options/Enrollment.....................................................................................................
8 C. Funding ............................................................................................................................... 8 D.
Prior Solutions .................................................................................................................... 9 E. TRS initiatives ..................................................................................................................
10 F. Options to Improve Solvency ........................................................................................... 11 Option 1: Pre-fund the long-term liability .......................................................................
13 Option 2: Fund on a pay-as-you-go basis for the biennium............................................. 13 Option 3: Fund for a 10-year solvency ............................................................................ 17 Option 4: Retiree pays full cost for optional coverage ....................................................
19 Option 5: Require purchase of Medicare Part B; Mandatory participation in Medicare Advantage and Medicare Part D plans.............................................................................. 20 Option 6: Fixed contribution............................................................................................ 23 Option 7: Consumer driven plan for the non-Medicare population .................................
25 G. Conclusion for TRS-Care ................................................................................................. 27 IV.
TRS-ActiveCare ................................................................................................................... 29 A. Plan Options/Enrollment...................................................................................................
30 B. Funding ............................................................................................................................. 31 C.
Options .............................................................................................................................. 35 Option 1: Reinstate funding ratios to FY 2003 level ........................................................ 35 Option 2: Offer only a high deductible plan with a Health Savings Account (HSA) .......
36 Option 3: Offer only a self-funded EPO plan ................................................................... 37 Option 4: Eliminate uniform statewide coverage ............................................................. 38 Option 5: Eliminate coverage for spouses ........................................................................
38 D. Conclusion for TRS-ActiveCare ....................................................................................... 39 V.
Combine TRS-Care and TRS-ActiveCare ........................................................................ 39 Option 1: Offer the same benefit as HealthSelect ................................................................. 40 Option 2: Increase employer funding to $400 per participant ...............................................
42 Appendix A:................................................................................................................................. 43 Appendix B: ................................................................................................................................. 44 2 .
TRS-Care Sustainability and TRS-ActiveCare Affordability Study November 18, 2014 I. Executive Summary In 2011, during the 82nd Texas Legislative session, funding projections for TRS-Care, the health care program for retired public educators, indicated that under the current funding structure the program would be solvent through the 2012-2013 biennium. At that time the financial shortfall for the 2014-2015 biennium was projected to be greater than $800 million. To begin to address this near-term insolvency, the Legislature directed the Teacher Retirement System of Texas (TRS) to conduct a study.
The study was to include a comprehensive review of potential plan designs and other changes that would improve the sustainability of the program with a report of the findings and recommendations due by September 1, 2012. Because of a series of initiatives implemented by TRS in FY 2013, the TRS-Care fund was then projected to be solvent for the 2014-2015 biennium and, therefore, no significant immediate action was necessary during the 83rd Texas Legislative session. Current projections as of July 2014 indicate that there will be a financial shortfall for the 2016-2017 biennium in the amount of $746.3 million. This updated study again introduces various strategies that can improve the sustainability of the retiree health care program.
The current funding projection as of July 2014 for TRS-Care is included in Appendix A of this report. TRS-ActiveCare, the health care program for active public education employees, is also facing financial challenges. Since its inception in FY 2003, state and minimum required district funding for the program has remained static. Increasing costs have necessitated premium increases, which have largely been passed on to employees.
Without an increase in state and district funding, it remains questionable whether TRS-ActiveCare will be able to offer an affordable health coverage option. This study introduces various strategies that can improve the affordability of health care coverage for active public school employees and their families. A. TRS-Care Key Findings • TRS-Care is facing a severe projected funding shortage for 2016-2017 of $746.3 million. • Without additional funding, the sustainability of the program in its current structure is at significant risk. • District and employee contributions as a Many of the options presented in percentage of active employee payroll are this study are not mutually funding streams for TRS-Care.
Districts and exclusive. Some options may be employees are also funding sources for TRScombined to increase the positive ActiveCare. financial impact on TRS-Care. • TRS extended the life of TRS-Care by offering the Medicare Advantage and Medicare Part D plans, and competitive vendor management. • There is no correlation between funding streams and health care claims cost. • Non-Medicare retirees are the biggest cost driver to the program. 3 . TRS-Care Sustainability and TRS-ActiveCare Affordability Study November 18, 2014 • • With provider and benefit level choice, comes additional cost. There is a disparity between TRS-Care benefits and premiums in comparison to what is available to Texas state retirees. The premium for Retiree Only coverage for Texas state retirees is 100% funded by the state. Plan Options Chapter 1575 of the Texas Insurance Code requires that a basic health care plan be offered at no cost to the retiree. Optional plans may be offered, including coverage for eligible dependents. Retirees selecting an optional plan pay a premium based on the plan selected, years of service, number of dependents and Medicare status.
TRS-Care currently offers three standard plan options. TRS-Care 1, the basic plan, provides catastrophic coverage. TRSCare 2 and TRS-Care 3 offer more comprehensive benefits, including a carve-out prescription drug benefit.
TRS-Care also offers two Medicare Advantage and Medicare Part D plan options. Funding • Funding for TRS-Care comes from a variety of sources: • The law provides the following contributions: o The state contributes 1.0% of active district payroll. o School districts contribute between 0.25% and 0.75% of active district payroll. The current contribution rate is 0.55%. o Active school district employees contribute 0.65% of payroll. • Retirees pay premiums for any plan option other than TRS-Care 1 Retiree Only coverage. • Prescription drug subsidies. • Investment income. Considerations TRS-Care solvency can be looked upon as a three-legged stool representing the options available for extending the life of the program: • • • Benefits/eligibility (including how benefits are managed) Retiree premiums Other contributions (state, school district, active employee, federal) Non-Medicare participants cost significantly more than Medicare eligible participants. Taking into consideration the savings attributable to the new Medicare Part D (prescription drug coverage) and Medicare Advantage plans, the plan costs for non-Medicare retirees are 4.5 times the costs of retirees with Medicare Parts A (hospitalization) and B (other medical coverage). Therefore, some of the options in the study focus separately on the two populations. 4 .
TRS-Care Sustainability and TRS-ActiveCare Affordability Study November 18, 2014 Summary of Options The following is a summary of the options considered in the study and their impact on the financial condition of TRS-Care: 1. 2. 3. 4. 5. Pre-fund the long-term liability Fund on a pay-as-you-go basis for the biennium Fund for a 10-year solvency Retiree pays full cost for optional coverage Require purchase of Medicare Part B; mandatory participation in Medicare Advantage and Medicare Part D plans 6. Fixed contribution 7. Consumer driven plan for the non-Medicare population CHART 1 Many of the options presented in this study are not mutually exclusive. Some options may be combined to increase the positive financial impact on TRS-Care. B.
TRS-ActiveCare Key Findings • TRS-ActiveCare has an affordability issue. • State and minimum district contributions have not changed since the inception of the program in FY 2003. • The employee’s share of the total premium cost has increased significantly. 5 . TRS-Care Sustainability and TRS-ActiveCare Affordability Study November 18, 2014 • • As premiums have increased, employees have selected plans providing a reduced level of benefits. There is a disparity between TRS-ActiveCare benefits and premiums in comparison to what is available to Texas state employees. The premium for Employee Only coverage for Texas state employees is 100% funded by the state. Plan Options TRS, as trustee, administers TRS-ActiveCare, the health care program for active public educators. Chapter 1579 of the Texas Insurance Code requires that at least two plans, including a catastrophic plan, be offered to active public educators. TRS-ActiveCare currently offers three self-funded plan options, ActiveCare 1-HD is a high deductible health plan.
ActiveCare Select, and ActiveCare 2 offer more comprehensive benefits, including a carve-out prescription drug benefit. There are also three fully-insured HMOs offered in certain service areas. Funding The program is funded by premiums for the level of coverage selected. The district must contribute a minimum of $150 and the state provides $75 per employee per month (PEPM) through school finance formulas.
The employee then pays the balance of the premium due. The focus of this study is not on the long term fund balance, but rather on funding and plan design options that make the plan more affordable for employees. The following summarizes the options considered in the study. 1. 2. 3. 4. 5. Reinstate funding ratios to FY 2003 levels Offer only a High Deductible Health Plan with a Health Savings Account (HSA) Offer only a self–funded EPO plan Eliminate uniform, statewide coverage Eliminate coverage for spouses TABLE 1 Coverage Tier State & District Contribution Employee Contribution Total Premium* Projected FY 2016 Employee Only Premium Option #1 Option #2 Option #3 Option #4 Option #5 $414 $400** $225 N/A $225 $169 $583 $37 $437 $208 $433 N/A $N/A $355 $580 * Premiums shown for Options #1 and #5 above are those for ActiveCare-2. $350 PEPM towards the premium coverage plus $50 contribution to the employee’s HSA. ** 6 . TRS-Care Sustainability and TRS-ActiveCare Affordability Study November 18, 2014 II. Study Background In 2011, during the 82nd Texas Legislative session, funding projections for TRS-Care, the health care program for retired public educators, indicated that under the current funding structure the program would be solvent through the 2012-2013 biennium. At that time the financial shortfall for the 2014-2015 biennium was projected to be greater than $800 million. To begin to address this near-term insolvency, the Legislature directed the Teacher Retirement System of Texas (TRS) to conduct a study. The study was to include a comprehensive review of potential plan designs and other changes that would improve the sustainability of the program with a report of the findings and recommendations due by September 1, 2012. Because of a series of initiatives implemented by TRS in FY 2013, the TRS-Care fund was then projected to be solvent for the 2014-2015 biennium and, therefore, no significant immediate action was necessary during the 83rd Texas Legislative session.
Current projections as of July 2014 indicate that there will be a financial shortfall for the 2016-2017 biennium in the amount of $746.3 million. This updated study again introduces various strategies that can improve the sustainability of the retiree health care program. The current funding projection as of July 2014 for TRS-Care is included in Appendix A of this report. TRS-ActiveCare, the health care program for active public education employees, is also facing financial challenges.
Since its inception in FY 2003, state and minimum required district funding for the program has remained static. Increasing costs have necessitated premium increases, which have largely been passed on to employees. Without an increase in state and district funding, it remains questionable whether TRS-ActiveCare will be able to offer an affordable health coverage option.
This study introduces various strategies that would improve the affordability of health care coverage for active public school employees and their families. III. TRS-Care TRS, as trustee, administers the Texas Public School Employees Group Benefits Program, TRS-Care. At the inception of TRS-Care in FY 1986, funding was projected to last 10 years, through FY 1995.
The original funding was sufficient to maintain solvency of the fund through FY 2000. Since that time, sufficient appropriations and contributions have been established to provide benefits through the current 2014-2015 biennium. August 2014 Enrollment TRS-Care 1 TRS-Care 2* TRS-Care 3* TOTAL 29,996 56,210 158,362 244,568 *Includes Medicare Advantage Enrollment 7 . TRS-Care Sustainability and TRS-ActiveCare Affordability Study November 18, 2014 A. Eligibility Generally, to be eligible to participate in TRS-Care, a retiree must have at least 10 years of service credit under TRS, and • • The sum of the retiree’s age and years of service credit in the system is greater than or equal to 80; or The retiree has 30 or more years of service credit. B. Plan Options/Enrollment The law requires that a basic health care plan be offered at no cost to the retiree. Optional plans may be offered, Enrollment Distribution by including coverage for dependents.
Retirees selecting an Medicare Status optional plan pay a premium based on the plan selected, Medicare Parts A&B 61% years of service, dependent coverage tier selected and Medicare Part B Only 8% Medicare status. TRS-Care currently offers three Non-Medicare 31% standard plan options. TRS-Care 1, the basic plan, provides catastrophic coverage.
TRS-Care 2 and TRSCare 3 offer more comprehensive benefits, including a carve-out prescription drug benefit. Senate Bill 1458 was passed during the 83rd legislative session which modifies TRS-Care enrollment and eligibility. An individual under the age of 62 who retirees on or after September 1, 2014, is only eligible for TRS-Care 1, the catastrophic plan until attaining age 62. Employees are grandfathered from this requirement if, as of August 31, 2014, they are within 5 years of retirement eligibility. After a retiree’s initial eligibility, there are no future open enrollment opportunities, with the following exceptions: 1.
A retiree subject to Senate Bill 1458 has an opportunity to upgrade his or her level of coverage at age 62. 2. When any enrolled retiree turns 65 years of age, the retiree has an additional opportunity to upgrade his or her level of coverage. Depending on their Medicare status, they may also be eligible for enrollment in a Medicare Advantage and a Medicare Part D plan. C.
Funding Funding for TRS-Care comes from a variety of sources: • The law provides the following contributions: o The state contributes 1.0% of active district payroll. o School districts contribute between 0.25% and 0.75% of active district payroll. The current contribution rate is 0.55%. o Active school district employees contribute 0.65% of payroll. 8 . TRS-Care Sustainability and TRS-ActiveCare Affordability Study November 18, 2014 • • • Retirees pay premiums for any plan option other than TRS-Care 1 Retiree Only coverage. Medicare Part D subsidies Investment income. The law requires that the state pay no more than 55% and the retirees pay at least 30% of total costs. Assuming that the retirees’ share of total costs includes premiums and out-ofpocket costs, the projected retiree contribution for FY 2015 is 38.2% and the state contribution is projected to be 22.8%. CHART 2 Inherent in the funding structure is a misalignment of funding with expenditures. Medical and prescription drug costs typically increase due to medical and pharmacy trend, currently 6.5%-8% per year, while payroll generally increases about 5% per year. This disconnect is even more pronounced in tight state budget years. D.
Prior Solutions This is not the first time TRS-Care has faced a funding shortfall. From FY 2001 through FY 2006, several changes were introduced to address insolvency. In FY 2001 through FY 2005, the state contributed supplemental appropriations.
In FY 2004, a required contribution from school districts was established and from FY 2004 through FY 2006 increases were made to all or some of the contribution rates for the state, active district employees, and school districts. In addition, in FY 2005 the TRS-Care plan options and premiums were significantly restructured and eligibility rules were tightened. (There has not been an increase in retiree premiums since FY 2005.) These actions successfully extended program solvency through the 2012-2013 biennium. 9 .
TRS-Care Sustainability and TRS-ActiveCare Affordability Study November 18, 2014 E. TRS initiatives To help address the imminent shortfall projected for the 2014-2015 biennium, TRS undertook two initiatives for FY 2013: • • Issued a Request for Proposal (RFP) for a Pharmacy Benefits Manager (PBM) to determine whether better pricing was available in the market and also explored an alternative to the Retiree Drug Subsidy (RDS) option under Medicare Part D. Drug manufacturers are now required to provide funding to phase out the Medicare Part D plan coverage gap, which is often called the “donut hole”. This additional funding made the option of instituting a Medicare Part D plan potentially a better choice than the RDS option. Issued an RFP for fully-insured Medicare Advantage plan offerings. As a result of these efforts, a new PBM was selected, achieving more favorable prescription drug pricing effective September 1, 2012.
TRS will continue to monitor the market to ensure we have the best possible pricing available for TRS-Care. Both the Medicare Advantage and Medicare Part D plan offerings were approved by the TRS Board of Trustees and went into effect January 1, 2013. To ensure the most competitive pricing available, TRS anticipates that it will issue a new RFP for a Medicare Advantage carrier to go into effect January 1, 2016. While these initiatives clearly improve the financial forecast for TRS-Care, insolvency for the 2016-2017 biennium is projected to be $746.3 million. Given the current plan offerings, the TRS-Care shortfall is projected to be $746.3 million by the end of the 2016-2017 biennium. CHART 3 10 . TRS-Care Sustainability and TRS-ActiveCare Affordability Study November 18, 2014 If the legislature provides the TRS-Care trust fund with supplemental funding to extend the program through the 2016-2017 biennium, the program would again be faced with immediate insolvency in FY 2018. CHART 4 F. Options to Improve Solvency Considerations TRS-Care solvency can be looked upon as a three-legged stool representing the options available for extending the life of the program: • • • Benefits/eligibility (including how benefits are managed) Retiree premiums Other contributions (state, school district, active employee, federal) Options to consider range from pre-funding TRS-Care to a fixed contribution arrangement where retirees receive a stipend and purchase coverage in the Federal public exchange. Each leg of the stool can be altered to improve the sustainability of the program. Benefits & Eligibility Pre-Fund Retiree Premiums Other Contributions Fixed Contribution 11 . TRS-Care Sustainability and TRS-ActiveCare Affordability Study November 18, 2014 The following chart illustrates the projected FY 2015 The plan costs for noncombined medical and drug costs (plus administrative Medicare participants are 4.5 fees) per retiree for TRS-Care 3, the plan with the times the costs of participants majority of participants. Costs are shown for a with Medicare Parts A and B. participant with Medicare Part A and Part B, a participant with Part B only, and a non-Medicare participant. This chart highlights the significant impact of the subsidies and programs available for the Medicare population. Because these same opportunities are not available for the non-Medicare population, some of the options in the study focus separately on the two populations. TABLE 2 Projected TRS-Care-3 Per Member Per Year Costs FY 2015 Plan The individual participates in both the TRS-Care Medicare Advantage and Medicare Part D plan options, as applicable. The individual does not enroll in either the Medicare Advantage or Medicare Part D plan options. Ratio of costs for individuals not enrolled in either the Medicare Advantage or Medicare Part D plan to individuals who are enrolled. Medicare Part A and Part B Medicare Part B Only Non-Medicare $2,908 $6,998 $13,220 $4,275 $7,269 $13,220 1.47 1.04 1.00 The options presented in this study attempt to provide the most meaningful solutions for consideration.
Because Senate Bill 1458, passed during the 83rd legislative session, established a long-term strategy for containing costs by modifying eligibility and enrollment, the focus of the study will be on other solutions. The options presented in this study offer a menu of solutions. All options may be considered independently; or some may be combined to increase the positive financial impact on TRSCare. Note that district and employee contributions as a percentage of active employee payroll are funding streams for TRS-Care. Districts and employees are also funding sources for TRSActiveCare. Many of the options presented in this study are not mutually exclusive.
Some options may be combined to increase the positive financial impact on TRS-Care. The first two options retain the same TRS-Care benefit structure and focus on funding and premiums. As detailed earlier, many of the funding sources for TRS-Care are based on active employee payroll and, therefore, are not aligned with expenditure experience. These options attempt to adequately align the funding with expenditures. 12 .
TRS-Care Sustainability and TRS-ActiveCare Affordability Study November 18, 2014 Option 1: Pre-fund the long-term liability Pre-funding the long-term liability would essentially make TRS-Care operate in a manner similar to the pension fund, where investment income pays a substantial portion of the benefits. For the pension fund, 62.1% of funding comes from investment income. Each year the actuary for TRS performs an analysis to determine the long-term unfunded liability of the program. As part of that analysis, the actuary also determines what the contribution rate would need to be for TRS-Care to become fully funded. The actuarial valuation for FY 2013 determined that to advance fund the program the combined annual required contribution (ARC) as a percentage of payroll would need to be 5.86%. The current contributions from the state, the school districts, and active employees total 2.20%.
Therefore, to advance fund TRS-Care, the contribution rates would need to increase by almost 2.7 times the current rates. In addition, the retirees’ share of the cost would need to increase each year according to medical and pharmacy trend. CHART 5 Although the graph only projects funding through FY 2019, pre-funding would extend the life of TRS-Care indefinitely. Option 2: Fund on a pay-as-you-go basis for the biennium Funding on a pay-as-you-go basis for the biennium can be accomplished by projecting expenditures for the biennium and adjusting contributions to maintain solvency. 13 . TRS-Care Sustainability and TRS-ActiveCare Affordability Study November 18, 2014 Option 2(a) Under option 2(a), the only funding change would be the contribution from the state. There would be no change in the contributions from active employees or school districts, and no change in premiums for retirees. For TRS-Care to be solvent through the 2016-2017 biennium, the state contribution rate would need to increase to 2.23% of active employee payroll for each year of the biennium. Instead of a percentage of payroll, funding from the state could be based on a fixed amount per retiree. For the 2016-2017 biennium the state contribution would be $289 per retiree. Having a fixed amount per retiree would guard against decreased state funding in the event payroll does not grow as projected.
For the following 2018-2019 biennium, a state contribution of 3.19% of active employee payroll would be required. The fixed amount per retiree would be $430. Option 2(b) Under option 2(b), the needed funding would be shared proportionally by the state, the school districts, and active public educators. There would be no change in premiums for retirees. The following chart shows the required increase from the current contribution rates to achieve solvency during each of the next two bienniums. TABLE 3 Required Contribution Rates State Active Employee Biennium FY 2016-17 FY 2018-19 District (Current Rate 1%) (Current Rate 0.65%) (Current Rate 0.55%) 1.56% 1.99% 1.01% 1.30% 0.86% 1.10% The State contribution rates above equate to approximately $202 and $269 per retiree per month for the FY16-17 and FY18-19 bienniums, respectively. For an active employee with an annual salary of $45,000 per year, an additional contribution of $13.50 per month would be deducted from the employee’s paycheck to fund TRS-Care in the 2016-2017 biennium. Similarly, an additional $24.37 per month would be deducted in the 2018-2019 biennium. 14 .
TRS-Care Sustainability and TRS-ActiveCare Affordability Study November 18, 2014 Option 2(c) Under option 2(c), the needed funding would be shared proportionally and would include retiree premium increases. The following chart shows the required increase from the current contribution rates to achieve solvency for the next two bienniums. TABLE 4 Required Contribution Rates State Active Employee Biennium FY 2016-17 FY 2018-19 District (Current Rate 1%) (Current Rate 0.65%) (Current Rate 0.55%) 1.35% 1.62% 0.88% 1.05% 0.74% 0.89% The State contribution rates above equate to approximately $175 and $219 per retiree per month for the FY16-17 and FY18-19 bienniums, respectively. For an active employee with an annual salary of $45,000 per year, an additional contribution of $8.62 per month would be deducted from the employee’s paycheck to fund TRS-Care in the 2016-2017 biennium. Similarly, an additional $15.00 per month would be deducted in the 2018-2019 biennium. This option would require that retiree premiums and the state, active employee, and school district contribution rates each increase by 34.8% for the 2016-2017 biennium. The impact to a retiree with 25 years of service enrolled in TRS-Care 3 and who is not Medicare eligible would be an increase from $295 per month to $398 per month premium for the 2016-2017 biennium. Retiree premiums and state, active employee, and school district contribution rates would each increase by an additional 20.2% for each year of the 2018-2019 biennium. The retiree in the example above would experience a premium increase to $478 per month. Option 2(d) As an alternative to allocating costs to the retiree solely in the form of premiums, there could be a benefit reduction, such as to the prescription drug benefits, with a smaller increase in premium. This scenario assumes that the prescription drug benefits for TRSCare 2 and TRS-Care 3 would be the same as what is offered to TRS-ActiveCare 2 participants. The chart below shows the potential change in prescription drug benefits for TRS-Care. 15 .
TRS-Care Sustainability and TRS-ActiveCare Affordability Study November 18, 2014 TABLE 5 CURRENT Care-2 Care-3 Deductible Generic $0 Brand Retail Copays Generic $10 $10 Preferred Brand $30 $25 Non-Preferred Brand $50 $40 Retail 90 and Mail Order Copays Generic $20 $20 Preferred Brand $75 $50 Non-Preferred Brand $125 $80 Specialty Copays 1-31 days supply Same as Brand copays above. 32 – 90 days supply PROPOSED All $0 $200 $20 $40 $65 $45 $105 $180 $200 $450 1 For the standard prescription drug plans, there is an additional copay for maintenance drugs filled at a retail pharmacy. For Medicare Part D plans, there is a $5 reduction in copay for generic and preferred brand drugs. 2 The retiree in the previous example would have a premium increase from $295 to $311 per month for the 2016-2017 biennium and a further increase in monthly premium for the 2018-2019 biennium to $376. (This scenario also assumes that the state, district and active employee contributions in scenario 2(c) apply as well.) This passes more of the retiree share of the costs to higher utilizers. Retirees may prefer to absorb their share in the form of premiums only as it is more predictable. All of the funding scenarios under Option 2 would extend the life of TRS-Care through FY 2017 and, if the commitment remains to fund the program each future biennium on a pay-as-you-go basis, it would extend the life of the program indefinitely. To continue solvency would require a recalculation of the contribution rates each biennium.
It is possible that the retiree premium rates would need to increase each biennium to keep pace with cost trend. 16 . TRS-Care Sustainability and TRS-ActiveCare Affordability Study November 18, 2014 CHART 6 Option 3: Fund for a 10-year solvency As mentioned earlier, this is not the first time TRS-Care has faced a funding shortfall. From FY 2001 through FY 2006, several changes were introduced to address insolvency. In FY 2001 through FY 2005, the state contributed supplemental appropriations. In FY 2004, a required contribution from school districts was established and from FY 2004 through FY 2006 increases were made to all or some of the contribution rates for the state, active employees, and school districts. In addition, in FY 2005 the TRS-Care plan options and premiums were significantly restructured and eligibility rules were tightened. Solvency for the next 10 years can be accomplished by projecting expenditures for that period and adjusting contributions. Option 3(a) Under option 3(a), the only funding change would be the contribution from the state. There would be no change in the contributions from active employees or school districts, and no change in premiums for retirees. For TRS-Care to be solvent through FY 2025, the state contribution rate would need to increase to 3.87% of active employee payroll. Option 3(b) Under option 3(b), the needed funding would be shared proportionally by the state, the school districts, and active public educators. There would be no change in premiums for retirees. 17 .
TRS-Care Sustainability and TRS-ActiveCare Affordability Study November 18, 2014 The following chart shows the required increase from the current contribution rates to achieve solvency through FY 2025. TABLE 6 Required Contribution Rates State Active Employee Biennium FY 2016-25 District (Current Rate 1%) (Current Rate 0.65%) (Current Rate 0.55%) 2.31% 1.50% 1.27% For an active employee with an annual salary of $45,000 per year, an additional contribution of $31.87 per month would be deducted from the employee’s paycheck to fund TRS-Care over the course of the 10 years. Option 3(c) Under option 3(c), the needed funding would be shared proportionally and would include retiree premium increases. The following chart shows the required increase from the current contribution rates to achieve solvency through FY 2025. TABLE 7 Required Contribution Rates State Active Employee Biennium FY 2016-25 District (Current Rate 1%) (Current Rate 0.65%) (Current Rate 0.55%) 2.01% 1.30% 1.10% For an active employee with an annual salary of $45,000 per year, an additional contribution of $24.37 per month would be deducted from the employee’s paycheck to fund TRS-Care over the course of the 10 years. This option would require that the state, active employees, and school district contribution rates increase by 100.5% and would remain the same through FY 2025. Retiree premiums would increase by 14.9% each biennium. An example of the impact to a retiree with 25 years of service enrolled in TRS-Care 3 and who is not Medicare eligible would be an increase in premium from $295 per month to $339 per month in the FY 2016-2017 biennium. The premium for a retiree in that same category would be $592 in the FY 2024-2025 biennium. 18 . TRS-Care Sustainability and TRS-ActiveCare Affordability Study November 18, 2014 CHART 7 The remainder of the options presented in this study assumes that the contributions from the state, the school districts, and active employees remain constant at 1%, 0.55% and 0.65% of payroll, respectively. Option 4: Retiree pays full cost for optional coverage The law requires that TRS-Care 1, catastrophic coverage, be offered at no premium cost to the retiree. Retirees pay a premium for optional coverage, including coverage for dependents. Currently, the premiums for optional coverage are subsidized. One alternative would be to set premiums for optional coverage to reflect the full additional cost of this coverage. If all retirees were enrolled in TRS-Care 1 at no premium cost, a substantial decrease in benefits would be required.
The following chart shows the required benefit changes for Retiree Only TRS-Care 1 coverage for Medicare and non-Medicare retirees. TABLE 8 TRS-Care 1 Benefit Changes Coverage Type Eligibility Deductible From $1,800 $4,000 Medicare Part B Only $3,000 $6,000 Not Eligible for Medicare Individual To Medicare Part A & B $4,000 $8,500 Medicare Part A & B 1 $3,600 $6,000 $12,000 $8,000 $3,000 $6,000 $6,000 $12,000 $8,000 Medicare Part B Only Not Eligible for Medicare Family Out-Of-Pocket Maximum1 From To $17,000 Out-of-Pocket Maximum does not include the deductible. 19 . TRS-Care Sustainability and TRS-ActiveCare Affordability Study November 18, 2014 In addition to the benefit reductions for TRS-Care 1, the premiums for optional coverage would need to be substantially increased. For example, the premium in FY 2016 for TRSCare 3 Retiree Only coverage for a non-Medicare retiree with 25 years of service would be increased from the current $295 per month to $616 per month and the monthly premium for TRS-Care 3 coverage for a retiree and spouse, both non-Medicare, would be increased from $635 per month to $1,811. Premium increases for optional coverage would be required each year to keep pace with cost trend. This option would build a funding surplus for the short term, but over time this surplus would be depleted and further benefit reductions would be necessary. It should also be noted that this option would create additional adverse selection as only those retirees who expect to have claims that exceed the high annual premiums would choose optional coverage. CHART 8 The chart on page 12 clearly shows the significant difference in TRS-Care exposure for the Medicare population in contrast with the non-Medicare population.
The remaining options address these two populations separately. Option 5 addresses the Medicare population. Option 5: Require purchase of Medicare Part B; Mandatory participation in Medicare Advantage and Medicare Part D plans TRS does not currently require that Medicare-eligible participants purchase Part B. However, to be financially neutral, TRS-Care processes claims assuming that participants have Part B. The table on page 8 does not distinguish those individuals who purchased Part B from those who could have, but did not, purchase Part B.
Approximately 1% of Medicare eligible participants in TRS-Care have not actually purchased Part B. 20 . TRS-Care Sustainability and TRS-ActiveCare Affordability Study November 18, 2014 Medicare imposes a late enrollment penalty for people who do not purchase Part B when they are first eligible. The standard Part B premium is $104.90 per month for 2014, with those individuals classified as higher income paying an additional premium. The penalty is 10% for each twelve-month period that an individual was eligible for, but did not purchase Part B. In order to be eligible to participate in a Medicare Advantage plan, a retiree or dependent must have both Medicare Part A (hospital benefits) and Part B (other medical benefits). To participate in a Medicare Part D plan, a retiree or dependent must have Medicare Part A and/or Part B. Effective January 1, 2013, TRS implemented the fully-insured Medicare Advantage plans and the Medicare Part D plans as optional offerings.
People were automatically enrolled and had the opportunity to opt out and remain in the standard plans. Incentives were offered in the form of reduced premiums and enhanced benefits to encourage participation. Below is the current participation rate of eligible retirees in the plans as of September 2014: Medicare Advantage 68% Medicare Part D 80% There continues to be a financial advantage to TRS-Care to require the purchase of Medicare Part B and that all eligible participants are enrolled in the Medicare Advantage and the Medicare Part D (prescription drug benefits) plans. However, some of the financial advantage to TRS-Care of being in a Medicare Advantage plan has been eroded since 2013 for two reasons.
First, the Affordable Care Act (ACA) now imposes a fee on all fullyinsured plans. For calendar year 2015, this health insurer fee is estimated to be about $276 per year per participant in a Medicare Advantage plan. Second, as expected, the premium renewal for calendar year 2015 increased substantially relative to the guaranteed rates under the initial proposal for the 2013 and 2014 plan years. This option would require all retirees with a retirement date on or after September 1, 2015 and their dependents to purchase Part B when they are first eligible.
Those who do not purchase Part B would be enrolled in TRS-Care 1, the catastrophic plan. Because of the significant penalty imposed for late enrollment in Part B, retirees with a retirement date prior to September 1, 2015 would be grandfathered. This option would also require that all eligible TRS-Care participants be enrolled in the Medicare Advantage and Medicare Part D plans. The incentives previously offered to encourage participation will be discontinued.
Medicare requires that people be allowed to opt out of these plans. However, there is no federal requirement that an alternative be offered to those opting out. Rather than have no coverage at all, those who choose to opt out of the Medicare Advantage and Medicare Part D plans would be moved to TRS-Care 1, the catastrophic plan. 21 .
TRS-Care Sustainability and TRS-ActiveCare Affordability Study November 18, 2014 As indicated in the table on page 12, Medicare participants in TRS-Care who are not enrolled in the Medicare Advantage and Medicare Part D plans cost the program almost 50% more than those enrolled in these plans. In general, participants with higher claims experience opted out of the Medicare Advantage and/or the Medicare Part D plans and stayed in the standard plans. The projected savings assume that the Medicare Advantage premium rates would not change if all eligible TRS-Care participants are enrolled in the Medicare Advantage plans. TRS will be issuing an RFP in FY 2015 for a Medicare Advantage carrier to ensure we have the best rates in the market. TRS will request premiums for both elective and mandatory participation. CHART 9 It should be mentioned that there would be some participant dissatisfaction with this option, as was the case when we automatically enrolled them in the plans effective January 1, 2013.
It is common for people in this demographic to feel uncomfortable with change and want to keep their current plans. In actuality, there is almost no reason that people should not be enrolled in the Part D plans. Because of this, typically health care programs only offer a Part D plan drug benefit for the Medicare population. There is an additional factor to consider with offering only Medicare Advantage plans. Although over 90% of providers accept the TRS-Care Medicare Advantage plans, there are isolated areas in Texas where there are no providers within a reasonable distance that will accept the Medicare Advantage plans.
Because of this provider access issue, TRS would establish an appeal process where participants with inadequate access could opt out and be covered under a TRS-Care standard plan. 22 . TRS-Care Sustainability and TRS-ActiveCare Affordability Study November 18, 2014 This concludes the discussion of solutions for the Medicare population. Options 6 and 7 address the non-Medicare population. Recall the table on page 12, which shows that early retirees (nonMedicare) cost the program 4.5 times the amount of retirees age 65 with both Medicare Parts A and B. The solutions provided for the non-Medicare population address bridging the gap between retirement and Medicare eligibility.
Note that the impact of SB 1458, previously mentioned on page 8, will help mitigate some of the impact of non-Medicare retirees beginning in FY 2020. The following chart shows the distribution of age for members who retired in FY 2013 and enrolled in TRS-Care. TABLE 9 Age at Retirement for TRS-Care Retirees FY 2013 Age at Retirement Number of Retirees % of Retirees 48-54 1,587 14.6% Exposure (Non-Medicare Years) 18,962 55-59 3,499 32.2% 25,443 60-64 3,749 34.6% 9,928 65+ 2,019 18.6% 0 Total 10,854 100% 54,333 As is illustrated in the chart, only 18.6% of new enrollees in TRS-Care are Medicare eligible, age 65 or older, at the time of retirement. The vast majority of retirees, or 81.4%, are early age retirees, and about 47% of the retirees in this category are younger Early retirees are the than age 60.
In FY 2013, 1,587 individuals retired between the most significant cost ages of 48 and 54 and enrolled in TRS-Care. These individuals drivers for TRS-Care. will not reach Medicare eligibility for another 11-17 years, which corresponds to an exposure of 18,962 non-Medicare years. Option 6: Fixed contribution This option would provide a Health Reimbursement Account (HRA) to non-Medicare retirees currently enrolled in TRS-Care 2 and 3. New non-Medicare retirees would have the option to enroll in TRS-Care 1, the catastrophic plan or to receive the HRA.
(Features of an HRA are provided in Appendix B.) For retirees in the HRA, TRS-Care would deposit a monthly stipend into that account until the retiree reaches age 65. The retiree would then be free to shop in the Federal public exchange insurance market for coverage. At age 65, the retiree would be offered an open enrollment opportunity to enroll in the Medicare Advantage and Part D plans. The plans in the public exchange are classified into five categories: Catastrophic, Bronze, Silver, Gold and Platinum.
Each category covers a certain percentage of total claims cost, with Catastrophic being the least rich coverage and Platinum the richest coverage. The Gold plan is actuarially designed to cover 80%-89% of claims cost. TRS-Care 2 and TRS-Care 3 actuarially are both Gold plans. 23 .
TRS-Care Sustainability and TRS-ActiveCare Affordability Study November 18, 2014 The Affordable Care Act (ACA) imposes a limitation on how much of a risk adjustment can be applied to participants based on age. This limitation is what drives the cost savings for this option. Currently, the maximum adjustment is three times the lowest premium for that same plan. For example, if a plan on the exchange for a 21 year old non-smoking participant is $300 per month, that same plan for someone 64 years old cannot exceed $900 per month. Using Travis County as an example, there is a wide range of Gold plan options available on the public exchange, including HMOs and PPOs, with varying premiums, deductibles, and out of pocket maximums.
Because TRS-Care 2 and 3 are PPO plans, a specific PPO plan offered on the exchange, myCigna Copay Assure Gold, will be used for this illustration. This plan has a $0 deductible, a $5,000 out of pocket maximum and costs $696 per month for a 60 year old in 2014. 1 Assuming the rates will increase in the public exchange by at least 7% per calendar year, the premium for the Cigna plan in this example would be $797 per month in calendar year 2016. Currently, a TRS-Care retiree with 25 years of service who is not Medicare eligible contributes $295 per month toward the cost of coverage. In this specific case, the contribution to the HRA would need to be $502 per month, or $6,024 per year to purchase the Cigna plan on the public exchange and keep this retiree in a financially neutral status with regard to premiums.
As stated on page 12, the projected FY 2015 TRS-Care cost per non-Medicare retiree in TRS-Care 3 is $13,220 per year. Assuming a 7% trend, the cost in FY 2016 will be $14,145 per year. Of this, $3,540 is currently paid by the retiree in premiums, leaving a $10,605 net cost to the plan.
By shifting the retiree to the public exchange, the projected FY 2016 savings to TRS-Care, net of the HRA administrative fees, for this specific retiree to TRS-Care would be approximately $4,521. Each year the HRA would be funded to maintain the retiree’s original $295 share of the premium. Note that this option does not contemplate any direct contribution to the HRA for dependent coverage. Instead of obtaining a Gold plan, the retiree could use the HRA contribution to obtain less rich retiree and spouse coverage, such as a Silver plan option. Under the Affordable Care Act, low income retirees may be eligible for subsidized coverage in the Federal public exchange.
However, they would need to forfeit the HRA to be eligible for the subsidy. Retirees would need to evaluate whether the HRA or the Federal exchange subsidy would be the most financially beneficial to them based on their income status. 1 Source: Current premium quotes found on www.healthcare.gov for an individual age 60 located in Travis County, Texas. Premiums shown do not reflect any federal subsidies for which an individual may qualify. 24 .
TRS-Care Sustainability and TRS-ActiveCare Affordability Study November 18, 2014 CHART 10 There are many cautionary factors to consider with this option. The Federal public exchange is in its launch year and there is a great deal of uncertainty with regard to what it will look like in the future as it evolves. Because the premiums are currently subsidized by other funding sources, it remains to be seen if plans offered on the Federal public exchange will continue to be affordable. There are also political forces in play that may alter how viable this option will remain. Another factor to consider is the anticipated dissatisfaction of TRS-Care participants.
They will likely be unhappy with the change and will feel insecure that they have to fend for themselves to find adequate coverage. Nevertheless, in spite of these limitations, because of the significant savings, at a minimum, this option should be monitored closely for consideration of implementation beyond the 2016-2017 biennium. Please note that private exchange offerings are not being considered at this time because it is not expected that a private exchange could offer additional savings beyond the solutions and concepts outlined elsewhere in this study. Further, transitioning to a private exchange would likely remove the added value and efficiencies of the current group benefit offering. Option 7: Consumer driven plan for the non-Medicare population Currently, retirees enrolled in TRS-Care have access to a network with a broad choice of providers.
Additionally, the plan designs for TRS-Care 2 and TRS-Care 3 do not provide much incentive to shop in the market to seek quality providers at reasonable costs. 25 . TRS-Care Sustainability and TRS-ActiveCare Affordability Study November 18, 2014 This option eliminates TRS-Care 2 and TRS-Care 3 for the non-Medicare population and introduces a new plan using consumerism as a tool for lowering claims trends for the nonMedicare population. It gives participants information and steers them to making the best choice. It also requires that those participants with complex conditions be engaged with the health plan administrator in managing their conditions. This option introduces preferred networks. Enrollees in certain urban areas would be required to participate in an Accountable Care Organization (ACO).
These organizations share in the risk of cost and must meet quality of care metrics. Those retirees residing in non-urban areas would have access to a broader network, but the plan design would include a tiered network with copay differentials that would steer them to providers with performance based contracts. In addition to tiered networks, this plan option assumes reference based pricing, which refers to the reimbursement of a fixed amount for certain medical services. Examples of such services include but are not limited to CT scanning, MRI, cataract removal, tonsillectomy/adenoidectomy and colonoscopy procedures. TABLE 10 Out-of-Network Benefits In-Network Benefits ACO & High Performance Networks Deductible (Individual/Family) Out-of-Pocket Maximum1 (Individual/Family) Coinsurance2 Office Visit PCP Specialist Prescription Drug Retail Generic Preferred Brand Non-Preferred Brand Retail 90 & Mail Order Generic Preferred Brand Non-Preferred Brand 1 Broad Network (Excluding ACO Service Areas) $500/$1,000 $1,000/$2,000 $1,800/$3,600 $4,000/$8,000 $6,000/$12,000 $8,500/$17,000 80/20% after deductible 70/30% after deductible 60/40% after deductible $30 $30 $45 $60 60/40% after deductible 60/40% after deductible $10 $30 $45 $20 $60 $90 N/A N/A Includes deductible, coinsurance and copays. 2 Coinsurance applies for most services not specifically listed. Under this option, retiree premiums are set to be equal to the current contributions for TRSCare 3 enrollees with 30+ years of service, $280 per month per a non-Medicare retiree. 26 .
TRS-Care Sustainability and TRS-ActiveCare Affordability Study November 18, 2014 CHART 11 G. Conclusion for TRS-Care The following chart contains a side-by-side comparison of the fund balance projected as of August 31, 2019 for each of the options offered in this study. There are no simple answers to addressing the health care funding shortage for TRS-Care in the 2016-2017 biennium. The options suggested do not solve the issue being faced nationwide as to how to successfully address rapidly increasing health care costs.
Each solution comes at a cost to somebody. The Legislature may want to consider combining several of the options to increase the positive financial impact on TRS-Care. 27 . TRS-Care Sustainability and TRS-ActiveCare Affordability Study November 18, 2014 CHART 12 TABLE 11 District Active Employees Option #1: Option #2: Pre-fund the long-term liability Fund on a pay-as-you-go basis thru FY2019 ï ï ï Option 2(a) Option 2(b) Option 2(c) Option 2(d) ï ï ï ï Option #3: Option #5: Option #6 Option #7: ï ï ï ï ï $928,089,752 ï ï $685,352,994 $311,524,089 $193,987,116 $193,987,116 ï ï $1,602,625,932 $728,466,333 $560,754,574 ï ï $0 ï $0 ï ï Fund on a pay-as-you-go basis thru FY2025 Option 3(a) Option 3(b) Option 3(c) Option #4: ï ï ï Medicare Retirees Description Impact on State Appropriations for the 2016-2017 Biennium NonMedicare Retirees Option State Impacted Parties Retiree pays full cost for optional coverage Require purchase of Medicare Part B; mandatory participation in Medicare Advantage and Medicare Part D plans Fixed Contribution for NonMedicare Retirees Consumer driven plan design for Care-2 and Care-3 nonMedicare enrollees ï ï ï ï ï ï ï ï $0 ï $0 28 . TRS-Care Sustainability and TRS-ActiveCare Affordability Study November 18, 2014 IV. TRS-ActiveCare Chapter 1579 of the Texas Insurance Code requires that at least two plans, including a catastrophic plan, be offered to active public educators. The program went into effect September 1, 2002. Small districts, specified as those with fewer than 500 employees, and certain other entities are required to participate.
For districts with 500 or more employees and certain other entities, such as charter schools, joining TRS-ActiveCare is optional. However, once an entity elects to participate, there is no provision to opt out. This provision protects the program from adverse selection by districts and other participating entities.
The following graphs show the growth of entities participating in TRS-ActiveCare and the growth in the number of covered lives since the inception of the program. CHART 13 CHART 14 29 . TRS-Care Sustainability and TRS-ActiveCare Affordability Study November 18, 2014 A. Plan Options/Enrollment TRS-ActiveCare currently offers three self-funded plan options. ActiveCare 1-HD is a high deductible health plan. ActiveCare Select and ActiveCare 2 offer more comprehensive benefits, including a carve-out prescription drug benefit.
There are also three fully insured HMOs offered in certain service areas. The total FY 2015 premiums for the plans range from $325 to $555 month for Employee Only coverage. The plan designs vary significantly.
Most notably, the deductibles range from $1,000 to $2,500 per year. CHART 15 CHART 16 Note:ActiveCare 3 was closed to new enrollees for FY 2014 and discontinued from the plan offerings beginning September 1, 2014 (FY 2015). The ActiveCare Select plan was a new plan offering beginning September 1, 2014 (FY 2015). 30 . TRS-Care Sustainability and TRS-ActiveCare Affordability Study November 18, 2014 B. Funding The program is funded by premiums for the level of coverage selected. The district must contribute a minimum of $150 per month per employee and the state $75 per month through school finance formulas. The employee pays any remaining premium amount due. State and required district funding for TRS-ActiveCare has not changed since the inception of the program in FY 2003.
Much or all of the premium increases have been passed directly to the employee, resulting in employees downgrading to plans with lesser benefits and lower premiums. In addition to premium increases, there have also been benefit reductions. The requirement by law to offer a plan comparable to HealthSelect, the plan offered to Texas state employees has been eliminated.
That plan, TRS-ActiveCare 3, was closed to new enrollees for FY 2014 and eliminated in FY 2015. The following chart shows the migration of employees over the life of the program. CHART 17 *The ActiveCare 3 was closed to new enrollees for FY2014 and discontinued from the plan offerings beginning September 1, 2014 (FY 2015). The ActiveCare Select plan is a new plan offering beginning September 1, 2014 (FY 2015). In FY 2003, employees paid 29% of the cost of TRS-ActiveCare 2 Employee Only coverage, assuming the state and district minimum contribution of $225 per month, and the state and district combined paid 71%.
Effective FY 2015, employees now pay 59% of the premium, and the state and district combined pay 41% of the costs. Over time, assuming the minimum district contribution, the employee’s share of the premium has more than doubled since the inception of the plan. 31 . TRS-Care Sustainability and TRS-ActiveCare Affordability Study November 18, 2014 CHART 18 Survey data published by the Kaiser Family Foundation and the Health Research & Educational Trust (Kaiser/HRET) in its Employer Health Benefits 2014 Annual Survey provides information on a broad sample of employer plans across the country. The following conclusions are based upon the study results: • TRS-ActiveCare 2 total costs increases and plan design changes are consistent with national trends. • Employees across the country are paying 113% more for coverage in 2014 than in 2003 compared to TRS-ActiveCare 2 employees who are paying 267% more (assuming the minimum district contribution). • Employers included in the Kaiser study have increased their contributions on average 5.16% per year, resulting in the employees’ share of total premium remaining relatively flat. TRS-ActiveCare participants’ share of cost has doubled (assuming the minimum district contribution). As premiums for TRS-ActiveCare have increased, if the district did not absorb some or all the increase, the effective increase on employees has been more significant than the flat percentage increase in total premiums. For example, if the total premium for a given year was $400 and the state and district contribution was the minimum $225, the employee share of the premium was $175.
For the next plan year, assuming there was a 6% premium increase, with a total premium of $424, and the district did not increase its contribution, the employee’s share increased by $24, an effective 13.7% increase. The chart below shows the effective impact on 32 . TRS-Care Sustainability and TRS-ActiveCare Affordability Study November 18, 2014 the employee of the increase in premiums, assuming the district did not increase its contribution. Under this assumption, employee contributions for TRS-ActiveCare 2 have increased 267% since the inception of the program. CHART 19 TRS surveyed participating TRS-ActiveCare districts to determine the combined state and district contribution toward full-time teacher premiums. The results are in the following chart. TABLE 12 Monthly Contributions $225 $226 – $275 $276 – $325 $326 – $375 $376 – $425 $426 – $475 $476 – $525 $526 and Up Total 1 FY2015 Monthly District Contributions Number of Percent of Number of Districts Districts Employees 343 36.4% 80,465 217 23.0% 125,940 229 24.3% 114,864 72 7.6% 46,371 35 3.7% 12,388 16 1.7% 21,744 5 0.5% 652 26 2.8% 2,961 943 100.0% 405,385 Percent of Employees 19.8% 31.1% 28.3% 11.4% 3.1% 5.4% 0.2% 0.7% 100.0% 1 Includes $75 monthly contribution from the state. If the district contribution varies based on the plan selected, the highest contribution was used.
District contributions toward the cost of health care coverage may vary by job classification. Thirty-six percent (36.4%) of TRS-ActiveCare districts contribute only the minimum required contribution. An additional 23.0% of districts contribute up to $50 more per month. About 33 .
TRS-Care Sustainability and TRS-ActiveCare Affordability Study November 18, 2014 twenty percent (19.8%) of employees have access to only the minimum contribution while 31.1% have access to an additional $50 of employer contributions. In addition, TRS surveyed the 10 largest non-participating TRS-ActiveCare districts to determine their combined state and district contribution toward full-time teacher premiums. The results are compared with the 10 largest TRS-ActiveCare districts in the chart below. TABLE 13 District Monthly Contribution Toward Health Care Coverage 10 Largest Districts TRS-ActiveCare Districts Not Participating Monthly Contributions1 Districts in TRS-ActiveCare2 $225 1 0 $226 – $275 4 0 $276 – $325 2 1 $326 – $375 2 4 $376 – $425 0 2 $426 – $475 1 1 $476 – $525 0 1 $526 and Up 0 1 Total Employees 93,112 94,227 Weighted Average Contribution $295 $380 1 Includes $75 monthly contribution from the State. If the district contribution varies based on the plan selected, the highest contribution was used. District contributions toward the cost of health care coverage may vary by job classification. 2 Some districts have January plan years and have not yet set contribution rates effective 1/1/2015. Overall, the 10 largest non-ActiveCare districts contribute, on average, $85 more per month, toward health care than the 10 largest TRS-ActiveCare districts. One half of the TRSActiveCare districts contribute $260 or less per month toward coverage.
The lowest contribution of the districts not participating in TRS-ActiveCare is $317 per month. On its face, it appears that because they are directly responsible for the health care plans offered to their employees, the non-ActiveCare districts may feel more accountability for the affordability of health care coverage. In contrast, TRS-ActiveCare participating districts do not determine the health care benefits offered to employees and may pass the responsibility of providing affordable coverage to TRS, without consideration of their district contribution. The cost of health care coverage will continue to rise. Although health care benefits are just one part of a district’s compensation package, they are significant.
Providing quality affordable health care plays a vital role in attracting and retaining highly qualified teachers. The focus of the TRS-ActiveCare study is not on the long-term fund balance, but rather on funding and plan design options that make the offered plans more affordable to employees. 34 . TRS-Care Sustainability and TRS-ActiveCare Affordability Study November 18, 2014 C. Options In the following options, the employer contribution will be considered the combined state and district contribution. Option 1: Reinstate funding ratios to FY 2003 level As previously stated, the state and required minimum district funding for TRS-ActiveCare has not increased since the inception of the program in FY 2003. The state contributes $75 a month, through school finance formulas, and the district is required to make a minimum contribution of $150 per month, but may choose to contribute more. The total required $225 state and district contribution, from this point forward called the “employer contribution”, has not changed since the beginning of the program 13 years ago.
As previously presented on page 33, a survey of districts indicates that 36.4% of districts continue to contribute the minimum and an additional 23.0% contribute up to only $50 more than the minimum. The graph on page 32 shows that in FY 2003, assuming the district contributed only the minimum required, employees paid 29% of the cost of Employee Only coverage for TRSActiveCare 2. In FY 2015, their share is now 59% of the cost, a little more than double their FY 2003 share. A 4.8% increase in employer contributions would have been required each year to maintain the employee cost share of 29%.
In FY 2015, the premium for employee coverage for ActiveCare 2 is $555 per month. Assuming a 5% trend for FY 2015, the premium would be $583 for FY 2016. To do a catch up alignment to FY 2003 premium share levels, the required minimum employer contribution for FY 2016 is estimated to be $414 per month, an increase of $189, or 84% above the current employer contribution. Premiums are only one part of the costs that have shifted to the employee since the inception of the program.
TRS-ActiveCare 2 benefits have been decreased over time as well. For example, in FY 2003, TRS-ActiveCare 2 had a $500 medical deductible and no drug deductible. For FY 2015, the medical deductible is $1,000 and there is a $200 deductible for brand-name drugs.
If TRS-ActiveCare 2 benefits were actuarially equivalent to FY 2003 benefits and assuming a 5% trend for FY 2015, the premium for FY 2016 would need to be $659 per month. To align the premium share to FY 2003 levels, the required minimum employer contribution for FY 2016 would need to be $461 per month, an increase of $236, or 104.9% above the current employer contribution. Note that if TRS-ActiveCare 2 employer contributions had been increased each year by the CPI-U Medical Care index, the FY 2015 employee share of the premium would have been 38%. This falls short of maintaining the employer cost share of 29%.
However, this could periodically be evaluated to determine if it is the most relevant index to determine employer contributions. 35 . TRS-Care Sustainability and TRS-ActiveCare Affordability Study November 18, 2014 Option 2: Offer only a high deductible plan with a Health Savings Account (HSA) This option would eliminate the three current plans and the fully insured HMOs currently offered under TRS-ActiveCare. The sole plan offered would be a high deductible plan and an employer funded Health Savings Account (HSA). (Features of an HSA are provided in Appendix B.) As has been the case since the inception of the program, by offering multiple options, along with an annual open enrollment opportunity, there is inherent adverse selection. Generally, the employees with the most complex medical conditions enroll in the richest plan and as premiums increase, the healthier employees migrate to a less expensive plan as indicated in the chart on page 31.
This creates a “death spiral” for the plan with the richest benefits in which only the sickest people are enrolled and eventually becomes unaffordable. This phenomenon took place with TRS-ActiveCare 3, a plan that, until FY 2014, was required by law to be offered and be comparable in benefits to ERS HealthSelect, the plan for Texas state employees. Because the required employer contributions have not increased since FY 2003, that plan over time became unsustainable and was eliminated effective FY 2015. TRS anticipates that the same scenario will play out over time with TRS-ActiveCare 2, currently the richest plan offered under the program. Additionally, there is adverse selection in offering fully-insured HMOs.
Typically younger, healthier employees enroll in these plans. Because the HMOs are fully-insured, the premiums for this coverage leave the program and are therefore not part of the pool to pay claims for the less healthy remaining population in those service areas. Under the HSA option, the employer contribution to the premium and to the HSA would total a minimum of $400 per month, with a $350 contribution to the premium and at least a $50 contribution to the HSA. The employees would contribute $37 per month toward the cost of Employee Only coverage.
Employees would have the option to contribute additional funds to their HSA. This option assumes that same steerage and consumerism components as in Option 7 of the TRS-Care study. The plan design of the high-deductible plan is outlined in the following table. 36 . TRS-Care Sustainability and TRS-ActiveCare Affordability Study November 18, 2014 TABLE 14 Out-of-Network Benefits In-Network Benefits ACO & High Performance Networks Deductible (Individual/Family) Out-of-Pocket Maximum1 (Individual/Family) Coinsurance2 Office Visit PCP Specialist Prescription Drug 1 Broad Network (Excluding ACO Service Areas) $1,800/$3,600 $2,750/$5,500 $3,500/$7,000 $6,350/$12,700 $6,350/$12,700 $12,500/$25,000 80/20% after deductible 70/30% after deductible 60/40% after deductible $30 $30 80/20% after deductible $45 $60 80/50% after deductible 60/40% after deductible 60/40% after deductible N/A Includes deductible, coinsurance and copays. 2 Coinsurance applies for most services not specifically listed. Option 3: Offer only a self-funded Exclusive Provider Organization (EPO) plan Similar to Option 2, this option would eliminate the adverse selection inherent in the program. The only plan that would be offered is ActiveCare Select, a new plan offering for FY 2015. This plan is an EPO plan, meaning it has a more limited network.
Currently, in four urban areas, the network is an Accountable Care Organization (ACO). It is assumed that more ACOs in urban areas would be added. In non-urban areas, there would be a network of preferred high performance providers. The following table provides a basic overview of the benefits under Option 3. TABLE 15 Network Benefits Deductible $1,200/$3,600 (Individual/Family) 1 Out-of-Pocket Maximum (Individual/Family) Coinsurance Routine Physical Prescription Drug 1 $6,350/$9,200 80/20% after deductible $30 PCP $60 Specialist Copays by drug and pharmacy type Includes deductible, coinsurance and copays. The projected FY 2016 premium for Employee Only coverage is $433.
Assuming the minimum state and district contribution of $225, the employee’s share would be $208 per month. Had this option been implemented for FY 2015, the Employee Only rate would have been approximately $405 per month, which is less than both the current ActiveCare Select Employee Only rate of $450 per month and the current ActiveCare 2 Employee Only rate of $555 per month. Additionally, the deductible for ActiveCare 1-HD participants would 37 . TRS-Care Sustainability and TRS-ActiveCare Affordability Study November 18, 2014 be reduced by more than 50%. ActiveCare 2 participants would pay $150 per month less in premiums with only a $200 increase in annual deductible. This illustrates the impact of offering a single plan option to all ActiveCare participating districts. Option 4: Eliminate uniform statewide coverage Under current law, TRS-ActiveCare is required to offer uniform statewide coverage. No consideration is given for age or geographic location.
In the current market, the plans offered in the Federal public exchange develop premiums with consideration of both. It is anticipated that over time, some younger employees and many younger spouses, will drop TRS-ActiveCare coverage and go to the exchange. This will leave TRS-ActiveCare with a high concentration of enrollees with higher claims and fewer younger and healthier enrollees to offset costs. This option would allow TRS-ActiveCare to consider age and geographic location in establishing premiums and would allow TRS-ActiveCare to compete with the public exchange for younger, healthier individuals.
This of course would mean older, higher cost employees would pay more. It is estimated that if TRS-ActiveCare rates were based on age, a 30 year old teacher would be charged 33% less, while charges for a 64 year old employee would need a 76% increase. Therefore, another consideration in establishing premiums could be years of service, which would potentially lessen the impact of agebased premiums. It also may mean that certain geographic locations would pay more than others.
For example, based on an analysis of rates for actuarially similar plans offered on the Federal public exchange, if rates were based on geographic location, the cost of coverage in Tarrant County would exceed the cost in Hidalgo County by approximately 41%. However, in some parts of the state, this may be offset by regional differences in salaries, potentially leveling the percentage of pay that goes toward health care premiums. Option 5: Eliminate coverage for spouses Based on a survey of TRS-ActiveCare districts and charter schools, very few (4.6%) provide a contribution toward dependent coverage. Therefore, it appears that providing affordable dependent coverage is not an important recruitment or retention consideration. The ACA requires that employers offer coverage for children up to age 26, but it is not a requirement to offer coverage for spouses.
As previously stated in Option 4, the premiums for plans offered on the Federal public exchange are age-based and TRS-ActiveCare does not currently have that flexibility. TRS-ActiveCare anticipates that younger, healthier spouses will drop TRS-ActiveCare coverage and obtain coverage in the Federal public exchange. Already, employee and spouse coverage in TRS-ActiveCare is subsidized by other coverage tiers.
Because of the anticipated adverse selection of spouses, this subsidy will increase over time as the healthy spouses leave. If the cost of coverage for spouses is not subsidized, it will soon become unsustainable. Continuing to subsidize the increasing 38 .
TRS-Care Sustainability and TRS-ActiveCare Affordability Study November 18, 2014 costs of coverage for less healthy spouses has a direct impact on the affordability of Employee Only coverage. Another factor to consider is that under the ACA, if coverage is offered but the spouse declines, the spouse is not eligible for a subsidy on the Federal exchange. However, if an employer does not offer coverage for spouses, low income spouses may qualify for a subsidy on the Federal exchange. If Active-Care coverage for spouses were eliminated, the premiums for all other coverage tiers would be reduced by 2.3%. In the case of TRS-ActiveCare 2, instead of a monthly premium of $555 for Employee Only coverage, the premium for FY 2015 would have been $542. Assuming a 7% annual trend, the total premium in FY 2016 would be $580. D.
Conclusion for TRS-ActiveCare As is the case for TRS-Care, there are no easy solutions to address the affordability of TRSActiveCare. Each solution could have a perceived negative impact on someone, either in terms of cost or restricted choice. The Legislature may want to consider combining several of the options to increase the continuing affordability of TRS-ActiveCare. 1. 2. 3. 4. 5. Reinstate funding ratios to FY2003 levels Offer only a High Deductible Health Plan with a Health Savings Account (HSA) Offer only a self–funded EPO plan Eliminate uniform, statewide coverage Eliminate coverage for spouses TABLE 16 Projected FY 2016 Employee Only Premium Coverage Tier Option #1 Option #2 Option #3 Option #4 State & District Contributions $414 $400** $225 N/A Employee Contribution $169 $37 $208 N/A Total Premium* $583 $437 $433 $N/A Option #5 $225 $355 $580 * Premiums shown for Options #1 and #5 above are those for ActiveCare-2. $350 PEPM towards the premium coverage plus $50 contribution to the employee’s HSA. ** V.
Combine TRS-Care and TRS-ActiveCare In the prior 2012 TRS-Care Sustainability Study, consideration was given to moving the nonMedicare retirees into TRS-ActiveCare, thereby spreading higher risk participants among a large, younger, and healthier population. Given the current health care affordability issue facing participants in TRS-ActiveCare, this no longer is considered a viable option. This study offers two alternatives which require additional state and/or district funding.
These options would require substantial changes to funding streams for the programs, including a significant impact on school finance for districts. For purposes of this discussion, the funding from the employer for public educators will be the district and state contributions combined. 39 . TRS-Care Sustainability and TRS-ActiveCare Affordability Study November 18, 2014 Option 1: Offer the same benefit as HealthSelect HealthSelect, the health care coverage for Texas state employees, covers both active and retired members. The state pays 100% of Employee Only and Retiree Only premiums and 50% of dependent coverage (as a participation incentive, the state pays more than 50% of dependent coverage for those enrolled in the HealthSelect Medicare Advantage plan). There is a significant difference in the level of funding per employee/retiree per month provided by the employer for the ERS health plan when compared to the TRS health plans. This difference is illustrated in the following chart that compares the employer’s FY 2015 contribution for Employee Only coverage between the ERS and TRS health plans. Employer contributions for the TRS plans include both the state and district contribution. The chart below shows the average FY 2015 employer contribution per employee/retiree: TABLE 17 Entity Monthly ERS TRS-Care TRS-ActiveCare $535 $189** $225 Annual $6,425* $2,268** $2,700*** * Does not foot due to rounding. Based on the 1% state and 0.55% district contribution to TRS-Care. *** Assumes $75 state contribution and $150 minimum district contribution. Districts may contribute more. ** The following table shows the required monthly premium for Employee Only or Retiree Only coverage for Care 3 (standard plan), ActiveCare 1 HD, ActiveCare 2 and ERS’ HealthSelect. There are additional plans offered under TRS-ActiveCare and TRS-Care, but the plans selected for the comparison have the majority of enrollees. TABLE 18 Employee Only / Retiree Only Share of Premium TRS-Care-3 TRS-AC 1-HD ERS HealthSelect Monthly Premium $90-$310* $330** $100** $-0- Annual Premium * TRS-AC 2 $1,080-$3,720* $3,960** $1,200** $-0- Premium range based on years of service and Medicare eligibility. Assumes $75 state contribution and $150 minimum district contribution.
Districts can contribute more to lower employee costs. ** The following table shows a high level plan design comparison for the same plans. 40 . TRS-Care Sustainability and TRS-ActiveCare Affordability Study November 18, 2014 TABLE 19 TRS-Care-3 TRS-AC 2 TRS-AC 1-HD ERS HealthSelect $300 $1,000 $2,400 $-0- $3,700 $6,000 $6,350 $6,350 Drug Deductible $-0- $200 brand-name drugs Combined with medical deductible $50 Retail short term1 Generic Brand preferred Brand non-preferred $10 $25 $40 $20 $40 $65 20% after deductible $5 $35 $60 $20 $50 $80 $45 $105 $180 20% after deductible $15 $105 $180 Medical Deductible Out-of-pocket maximum Mail Order and Retail-Plus (90 day supply) Generic Brand preferred Brand non-preferred 1 Enrollees in TRS-ActiveCare 2 and ERS HealthSelect pay an additional copay if filling a maintenance drug at a retail pharmacy. These comparisons show that there would need to be significant increases in both benefits and funding to provide coverage at the same cost to public educators as what is offered to state employees. There are several assumptions made for this option: • • • • • • All districts would participate; Retirees who previously declined coverage would have an open enrollment opportunity; No employee or retiree would decline coverage; Current employer contributions for TRS-ActiveCare are the minimum $225 per month per covered employee; Employer contributions for TRS-Care are an average of $189 per month per covered retiree; and Active employee contributions for TRS-Care would discontinue. Assuming a cost trend of 7.0%, to provide a benefit comparable to public educators for Employee Only/Retiree Only coverage that is comparable to HealthSelect, the employer contribution would need to increase by $2.74 billion and $3.05 billion for ActiveCare participants and by $0.94 billion and $1.06 billion for TRS-Care participants, respectively for FY 2016 and FY 2017. This would require additional employer funding of $7.8 billion for the 2016-2017 biennium. (The current employer contributions of $4.5 billion would be increased to $12.3 billion.) Note that because we have a more costly, predominantly female population, benefits may need to be reduced from those offered under HealthSelect to maintain solvency. The required funding would be greater if the employer also provided a 50% contribution toward the cost of the dependent coverage. 41 . TRS-Care Sustainability and TRS-ActiveCare Affordability Study November 18, 2014 Option 2: Increase employer funding to $400 per participant This option combines TRS-Care and TRS-ActiveCare and increases funding from the employer from $189 per retiree and $225 per active employee to $400 per month. The approach for this option was to begin with a plan design that would provide valuable benefits at a reasonable premium cost. For non-Medicare participants, it assumes that both the ActiveCare 1-HD and ActiveCare 2 plans are offered. In addition the only option available to Medicare eligible participants would be a Medicare Advantage plan and the Medicare Part D plan with the same benefits as Care 2. There are several assumptions made for this option: • • • • • • All districts would participate; Retirees who declined coverage would have an open enrollment opportunity; 20% of employees and retirees would decline coverage; Current employer contributions for TRS-ActiveCare are the minimum $225 per month per covered employee; Employer contributions for TRS-Care are an average of $189 per month per covered retiree; and Active employee contributions for TRS-Care would discontinue. With the $400 per month contribution per participant and the plan design just described, Employee Only and Retiree Only coverage for the FY 2016-2017 biennium could be offered at a premium of $58 per month. The following table shows the impact to state and district contributions for the two options just described. The amounts shown are based on funding on a per employee/retiree basis.
The cost of contributing towards dependent coverage would be in addition to the amounts shown below. TABLE 20 Option Option #1: Offer ERS’ HealthSelect plan options Option #2: Offer ActiveCare-2 for NonMedicare participants and Medicare Advantage Care-2 for Medicare participants 1 Current State1 & District Funding Additional Funding Total Funds Required $4,479,400,432 $7,797,429,475 $12,276,829,908 $3,714,948,352 $3,207,009,940 $6,921,958,292 Includes funds from all sources. 42 . TRS-Care Sustainability and TRS-ActiveCare Affordability Study November 18, 2014 Appendix A TRS-Care Fund Balance Projection Financial History and Projection through FY2019 as of July 31, 2014 Contributions Fiscal Year Retiree Contributions State Contributions FY 1986 FY 1987 FY 1988 FY 1989 FY 1990 FY 1991 FY 1992 FY 1993 FY 1994 FY 1995 FY 1996 FY 1997 FY 1998 FY 1999 FY 2000 FY 2001 FY 2002 FY 2003 FY 2004 FY 2005 FY 2006 FY 2007 FY 2008 FY 2009 FY 2010 FY 2011 FY 2012 FY 2013 $0 $22,617,624 $23,948,600 $25,428,632 $37,556,561 $46,563,787 $56,395,797 $65,154,653 $80,128,944 $89,006,331 $82,622,236 $87,657,784 $91,390,173 $96,474,107 $120,227,960 $131,213,445 $143,797,748 $162,954,010 $248,552,679 $322,780,191 $326,844,982 $323,957,945 $328,505,433 $329,723,191 $332,481,933 $345,164,271 $363,348,030 $355,685,504 $0 $25,931,680 $31,357,632 $37,420,711 $44,369,915 $47,277,743 $50,392,512 $54,029,406 $56,912,083 $59,849,850 $63,634,087 $67,616,395 $72,210,190 $76,488,424 $85,505,637 $90,118,787 $94,792,026 $98,340,798 $198,594,194 $202,397,566 $215,666,940 $238,190,720 $254,722,174 $267,471,299 $279,250,547 $282,782,431 $271,925,242 $139,213,557 $250,000 $0 $0 $0 $0 $0 $0 $0 $0 $0 $0 $0 $0 $0 $0 $76,281,781 $285,515,036 $124,661,063 $298,197,463 $64,172,167 $0 $0 $0 $0 $0 $0 $0 $102,363,704 $17,625,194 $18,522,629 $19,598,520 $20,789,215 $22,184,958 $23,638,871 $25,196,592 $27,014,703 $28,456,041 $29,924,925 $31,817,043 $33,808,197 $36,105,095 $38,244,213 $42,738,069 $45,059,394 $47,378,092 $49,170,399 $99,297,097 $101,198,783 $140,183,511 $154,823,968 $165,569,413 $173,856,344 $181,512,856 $183,808,580 $176,751,407 $180,824,522 FY 2014 FY 2015 FY 2016 FY 2017 FY 2018 FY 2019 $363,631,292 $375,309,536 $382,156,578 $387,990,564 $393,642,584 $399,564,442 $288,530,702 $294,301,316 $300,187,342 $306,191,089 $312,314,911 $318,561,209 $36,058,148 $0 $0 $0 $0 $0 $189,003,903 $191,295,855 $195,121,773 $199,024,208 $203,004,692 $207,064,786 Supplemental Active Employee Appropriations Contributions District Contributions Expenditures Investment Income CMS& Part D Subsidies ERRP Subsidy $0 $0 $0 $0 $0 $0 $0 $0 $0 $0 $0 $0 $0 $0 $0 $0 $0 $0 $79,457,387 $80,914,228 $118,607,527 $136,008,512 $141,672,630 $149,562,613 $155,918,241 $158,724,010 $154,607,926 $160,952,396 $572,153 $2,568,998 $5,703,832 $8,802,914 $13,098,835 $15,801,047 $17,314,372 $17,181,190 $16,467,438 $16,841,673 $16,818,747 $16,202,440 $15,260,517 $9,762,741 $6,923,485 $5,824,134 $7,140,560 $3,394,956 $4,840,982 $11,300,868 $21,435,792 $32,671,539 $29,252,347 $17,482,143 $11,679,229 $8,168,640 $5,189,934 $3,041,001 $0 $0 $0 $0 $0 $0 $0 $0 $0 $0 $0 $0 $0 $0 $0 $0 $0 $0 $0 $0 $34,611,607 $52,329,617 $59,486,239 $61,530,735 $70,795,686 $66,258,008 $71,575,942 $98,628,841 $0 $0 $0 $0 $0 $0 $0 $0 $0 $0 $0 $0 $0 $0 $0 $0 $0 $0 $0 $0 $0 $0 $0 $0 $0 $70,629,797 ($2,941,996) $0 $169,847,447 $171,775,457 $175,012,771 $178,314,832 $181,682,934 $185,118,398 $2,575,724 $1,640,626 $374,653 $0 $0 $0 $136,909,692 $137,665,374 $144,697,024 $153,664,863 $162,724,692 $171,646,256 $0 $0 $0 $0 $0 $0 Medical Incurred Drug Incurred Medicare Advantage Premiums Administrative Costs Ending Balance (Incurred Basis) $0 $50,988,845 $16,157,649 $32,926,324 $50,171,919 $82,697,189 $74,307,953 $101,627,864 $108,284,693 $122,054,551 $135,982,304 $148,823,489 $156,537,913 $184,398,533 $203,029,971 $250,691,898 $287,729,918 $368,462,963 $366,840,457 $431,036,095 $427,553,404 $437,519,747 $498,767,038 $531,239,020 $575,539,788 $608,461,321 $687,987,585 $686,321,003 $0 $7,044,825 $12,441,672 $15,458,710 $19,835,965 $28,683,081 $33,829,694 $40,700,513 $45,712,060 $50,782,093 $57,074,921 $62,530,982 $76,256,158 $93,459,890 $110,903,247 $139,774,848 $163,979,754 $203,281,400 $214,514,500 $229,522,988 $259,532,887 $304,773,401 $334,742,500 $353,893,845 $395,817,017 $384,017,059 $454,143,825 $496,229,923 $0 $0 $0 $0 $0 $0 $0 $0 $0 $0 $0 $0 $0 $0 $0 $0 $0 $0 $0 $0 $0 $0 $0 $0 $0 $0 $0 $1,075,388 $362,371 $3,941,936 $4,614,755 $5,212,073 $7,186,851 $8,258,029 $8,862,560 $10,067,359 $11,668,828 $12,219,847 $13,593,578 $14,097,454 $14,616,678 $14,905,196 $16,837,127 $18,237,767 $19,017,292 $21,690,329 $26,332,200 $33,333,010 $34,434,969 $35,878,194 $39,656,301 $43,184,393 $45,465,776 $47,151,354 $48,181,723 $47,048,587 $18,084,976 $25,750,301 $73,144,809 $111,989,174 $152,004,708 $165,647,857 $197,946,923 $208,931,140 $225,230,065 $235,796,353 $224,037,663 $203,870,554 $171,425,780 $99,631,646 $24,256,451 ($35,950,521) $71,945,978 ($82,967,487) $238,285,158 $327,156,868 $462,985,967 $622,796,927 $728,839,324 $800,148,391 $814,964,302 $890,870,304 $741,013,656 $551,048,281 $663,776,624 $714,554,807 $757,491,018 $801,449,056 $847,791,092 $900,054,508 $554,469,888 $630,554,683 $702,294,006 $781,198,312 $867,238,519 $960,863,140 $27,435,222 $62,820,617 $82,381,863 $95,150,922 $109,574,924 $125,679,103 $45,737,185 $53,509,083 $52,998,328 $52,849,907 $51,526,479 $52,502,616 $446,186,269 $156,735,244 ($240,879,830) ($746,342,472) ($1,369,103,672) ($2,126,247,948) 43 . Appendix B TRS-Care Sustainability and TRS-ActiveCare Affordability Study November 18, 2014 Health Savings Account (HSA) What is a Health Savings Account or Health Reimbursement Account? Who is eligible (i.e. active, nonMedicare retiree, Medicare retirees)? What types of medical plans can be associated with the account (i.e. PPO, HMO, HDHP, etc)? Health Reimbursement Account (HRA) An HSA is an account established by an individual at a financial institution to pay for qualified medical expenses. An HRA is a notional account used by employers to reimburse employees or retirees for qualified medical expenses. Active employees and non-Medicare retirees who are covered by a qualified high-deductible health plan are eligible to establish an HSA. There are a variety of types of HRAs that can be provided to both active employees and retirees. For active employees, an integrated HRA may be offered in conjunction with an employer-sponsored ACA-compliant group medical coverage. An individual must be covered under a High-Deductible Health Plan (HDHP) in order to be eligible for an HSA. For what medical expenses can the account be used? Can the account be used for health insurance premiums? Who may make contributions? HSA funds may be used to pay for deductibles, copayments, coinsurance amounts for medical, prescription drug, dental and vision plan coverages. Generally, HSA funds cannot be used to pay for medical, prescription drug or dental plan premiums; however, funds may be used to pay premiums for the following insurance coverages: 1. Long-term care insurance; 2.
COBRA health care continuation coverage; 3. Healthcare coverage while receiving unemployment benefits under federal or state law; 4. Medicare & other coverage if 65 or older Contributions to the HSA may be made by the eligible individual, the employer or another party on behalf of the eligible individual.
(Note that once the eligible individual becomes Medicare eligible, the individual may no longer contribute to his/her HSA account.) For retirees, a stand-alone HRA may be in lieu of group health insurance. A Retiree Only HRA is not subject to the ACA’s insurance market reform rules (e.g. annual limit prohibitions and preventive health services requirements.) Qualifying medical expenses are determined by the employer and may include deductibles, co-payments, and coinsurance for medical, prescription drug, vision and dental coverages. Qualifying medical expenses are determined by the employer and may include premiums for medical, prescription drug, vision, dental insurance coverages as well as long-term care insurance and Medicare Part B and D insurance coverages. Only the employer may only make contributions to an HRA. 44 .
Appendix B TRS-Care Sustainability and TRS-ActiveCare Affordability Study November 18, 2014 Health Savings Account (HSA) Can the employee take their account with them when they leave employment? Yes, HSA accounts are portable. Can account balances be carried over to the next taxable year? What are the contribution limits, if any? Yes, the account balances can be rolled over into the following year. For calendar year 2015, the maximum contribution for selfonly coverage is $3,350 and the maximum contribution for family coverage is $6,650. Health Reimbursement Account (HRA) HRAs are not portable because the account is funded solely by the employer. However, for active employees the employer may determine if funds are forfeited by a terminated employee or if the funds may be used for expenses incurred post-employment. For Retiree-Only HRAs, the employer determines whether or not a surviving spouse or dependent(s) will be allowed to use the remaining balance in the retiree’s HRA account. Yes, the employer can carry over any unused amounts in the HRA for reimbursements in later years There are no maximum annual contributions to an HRA. Contribution amounts may vary – such as by years of service – at the discretion of the employer. 45 . Teacher Retirement System of Texas www.trs.state.tx.us 1000 Red River Street, Austin, Texas 78701 - 2698 1-800-223-8778 .