


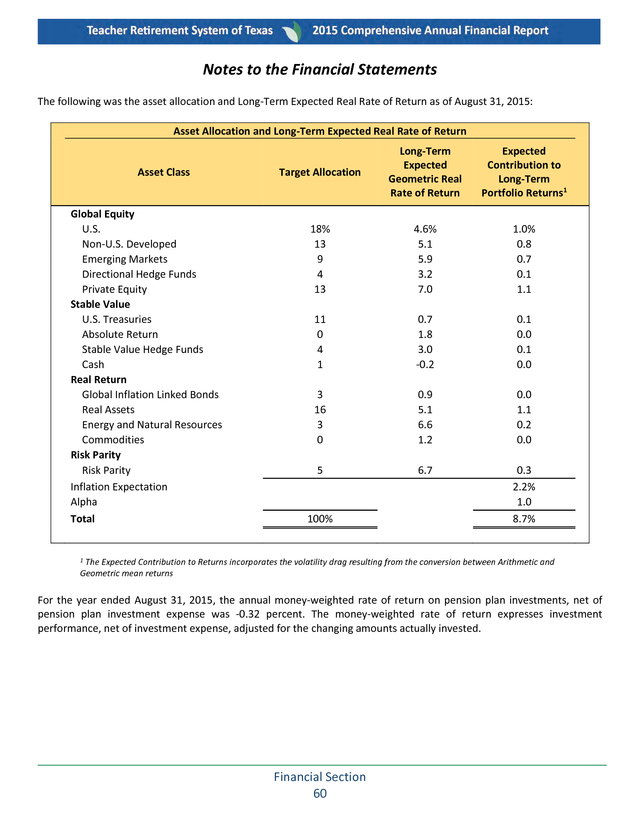


Description
2015
Teacher Retirement System of Texas
Comprehensive
Annual
Financial
Report
A Component Unit of the State of Texas
Fiscal Year Ended August 31, 2015
NN
WI
1st
E
PLAC
ER
TRS o
rher
Supe her
Teac
Art
st
onte
C
. TRS Mission Statement
The mission of the Teacher Retirement System of Texas is:
Improving the retirement security of Texas educators
by prudently investing and managing trust assets
and delivering benefits that make a positive difference
in members’ lives.
R
WINNE
2nd
PLACE
TRS
Superh
ero
Teache
r
Art
Contes
t
This year’s Comprehensive Annual Financial Report (CAFR) features some amazing artwork submitted by K-5 students from across Texas. More
than 3,500 students participated in TRS’ “My Superhero Teacher Art Contest.” Top entries were then placed on our Facebook page for voting. The
art reflects how the students view their teachers as superheroes, and we’re proud to share the contest winners’ artwork with you in this
publication.
First place was awarded to a 3rd grader from Clark Elementary in Laredo, whose artwork appears on our cover. Second place went to a 4th grader from Roosevelt Elementary in San Antonio, whose artwork is on the inside cover, and 3rd place went to a 3rd grader from Live Oak Learning
Center in Rockport, whose artwork is on the document’s title page.
A 4th grader from Ramirez Elementary in Lubbock, received an Honorable Mention. That artwork is on the back of the CAFR. Top ten artwork from Facebook is featured throughout the CAFR; however, we feel that every participant is a winner. We plan to recognize them and their teachers in other publications and on our website. .
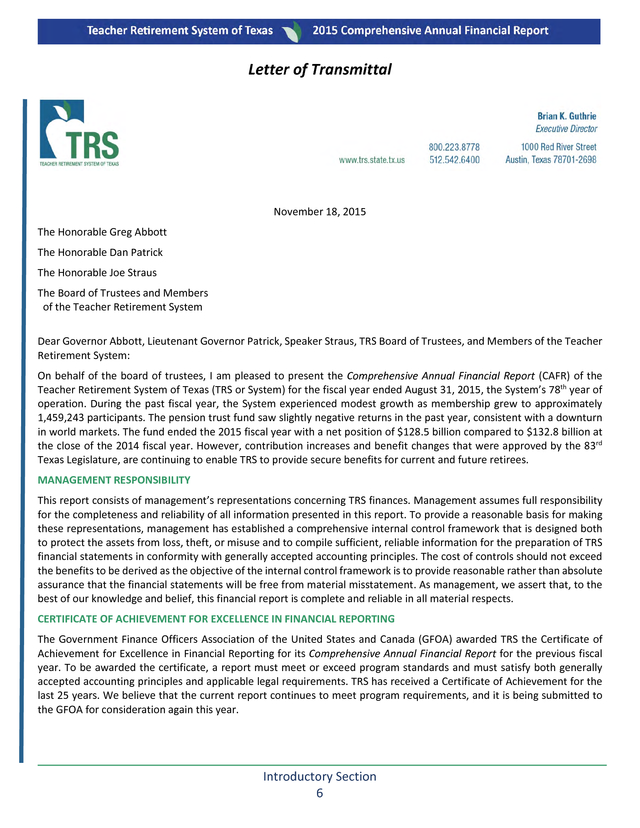
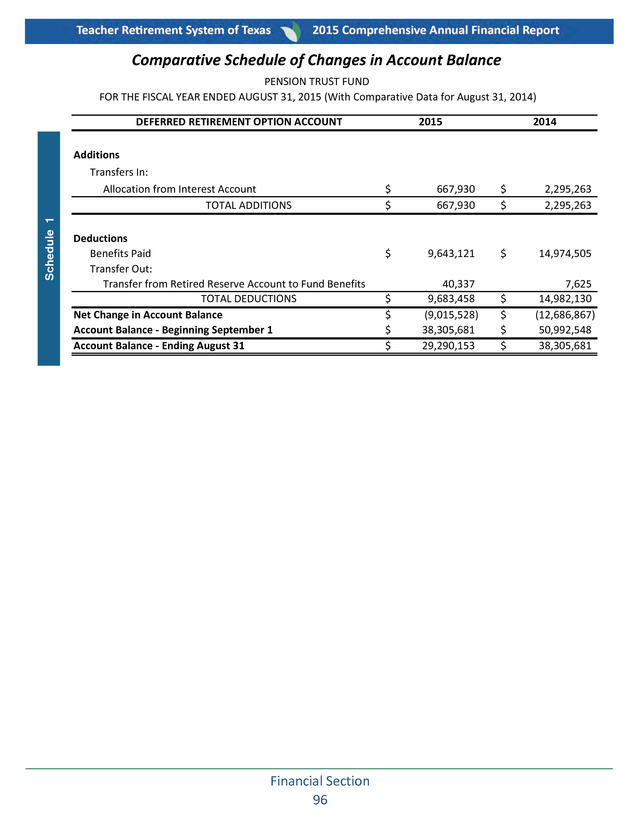
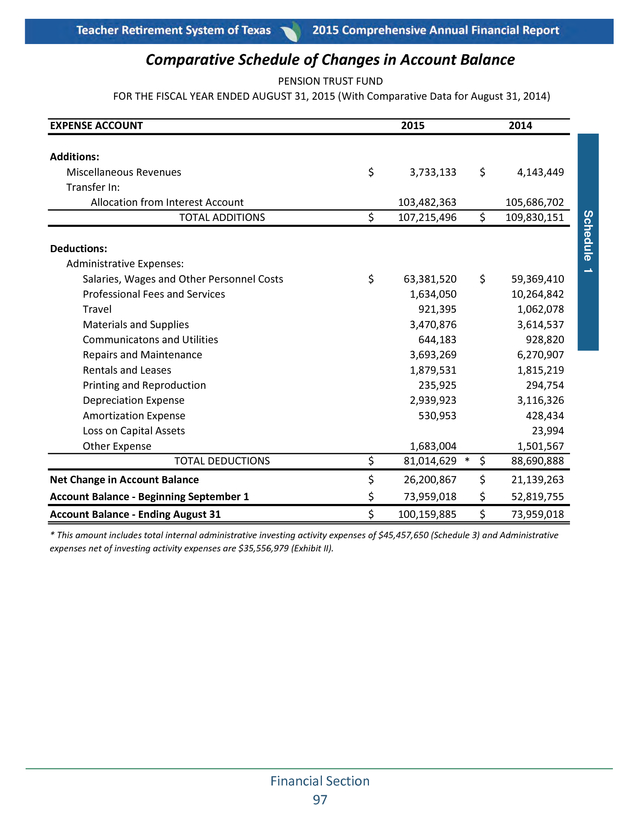
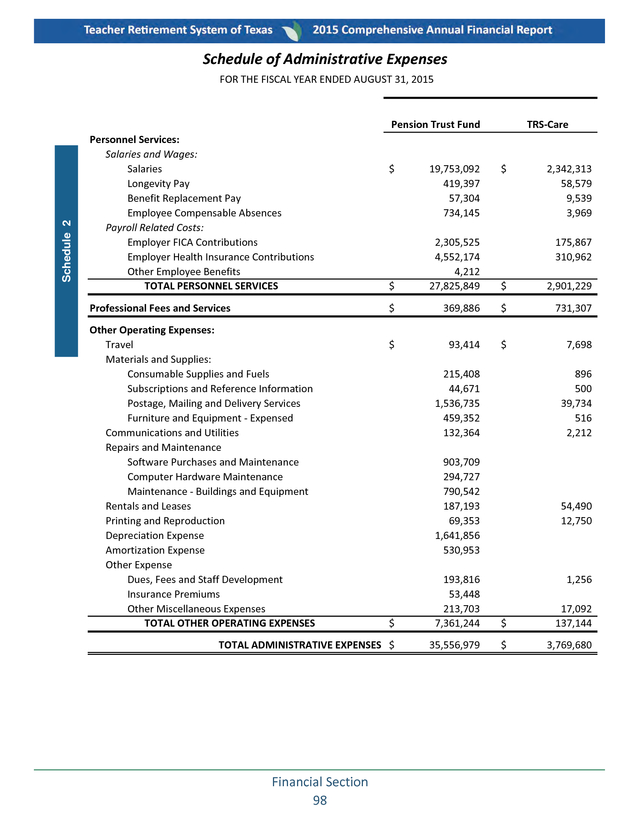
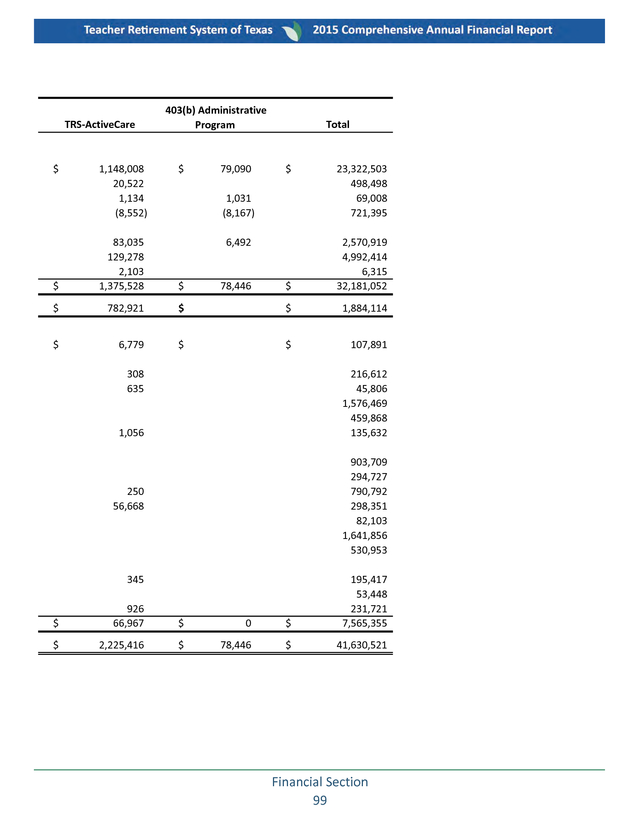
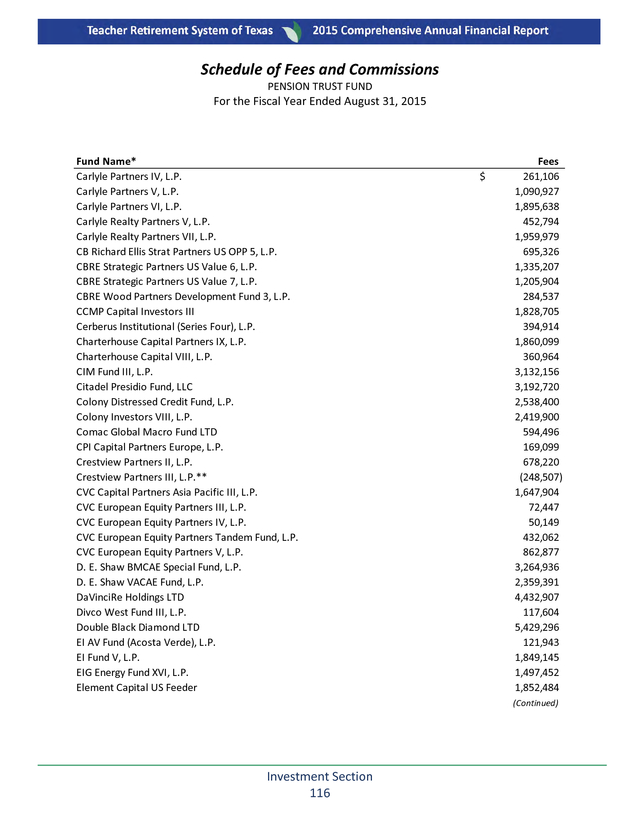
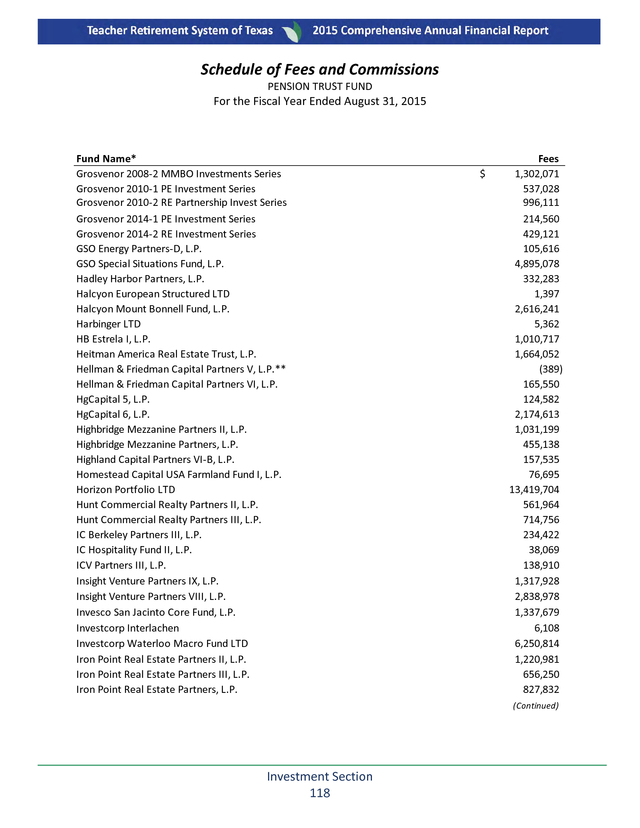
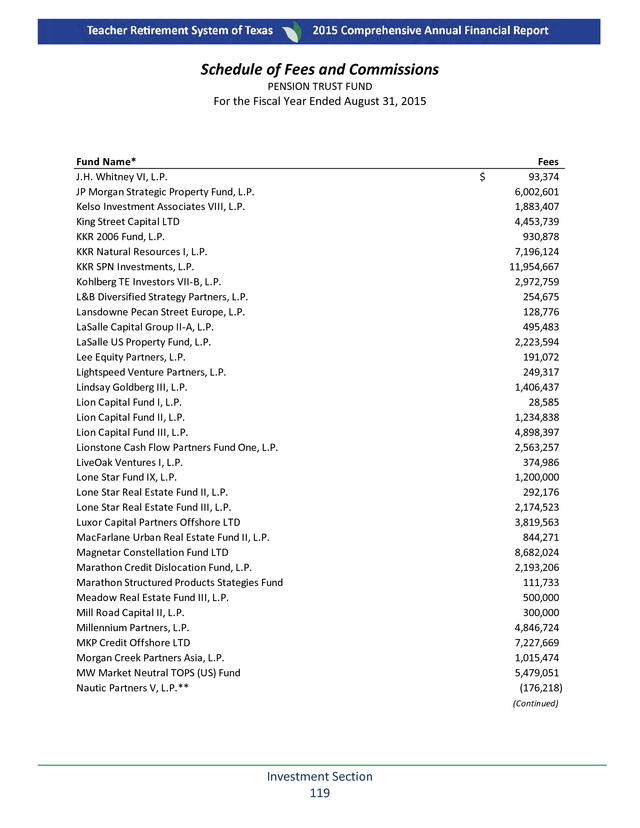
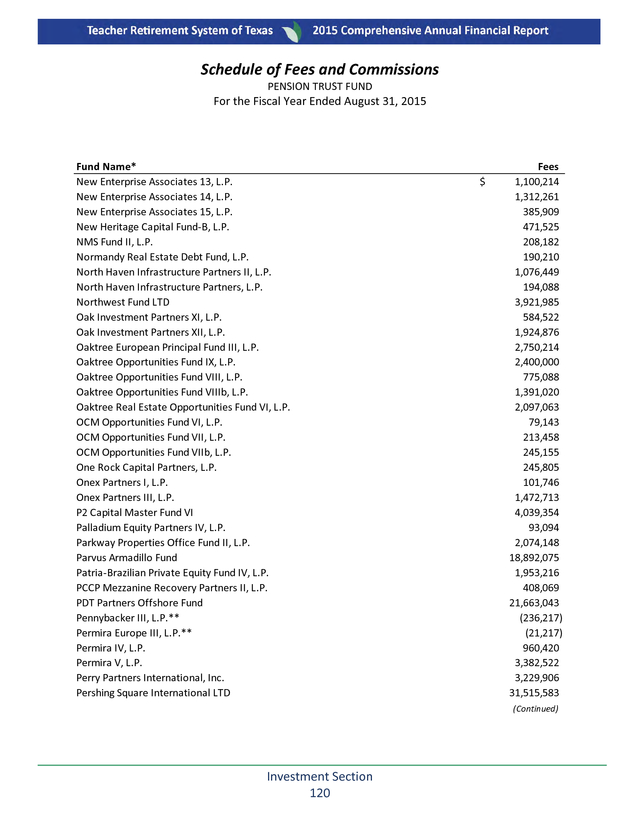
Teacher Retirement System of Texas COMPREHENSIVE ANNUAL FINANCIAL REPORT A Component Unit of the State of Texas Fiscal Year Ended August 31, 2015 Prepared by Teacher Retirement System of Texas 1000 Red River Street Austin, Texas 78701-2698 (512) 542-6400 1-800-223-8778 R WINNE 3rd PLACE TRS Superh ero Teache r Art Contes t Brian K. Guthrie, Executive Director www.trs.texas.gov . INTRODUCTORY SECTION Board of Trustees..........................................................................................................................................3 Professional Awards .....................................................................................................................................4 Le er of Transmi al .....................................................................................................................................6 Organiza on Chart......................................................................................................................................10 Staff and Advisors .......................................................................................................................................11 Membership ...............................................................................................................................................12 Communica ons.........................................................................................................................................14 FINANCIAL SECTION Independent Auditor’s Report....................................................................................................................19 Management’s Discussion and Analysis .....................................................................................................23 Basic Financial Statements Exhibit I - Statement of Fiduciary Net Posi on ...................................................................................36 Exhibit II - Statement of Changes in Fiduciary Net Posi on................................................................40 Exhibit III - Statement of Net Posi on - Proprietary Funds .................................................................44 Exhibit IV - Statement of Revenues, Expenses, and Changes in Net Posi on - Proprietary Funds .....46 Exhibit V - Statement of Cash Flows - Proprietary Funds....................................................................48 Notes to the Financial Statements .............................................................................................................50 Required Supplementary Informa on ........................................................................................................84 Exhibit A - Statement of Changes in Assets and Liabili es - Agency Funds ................................................91 Suppor ng Schedules Schedule 1 - Compara ve Schedule of Changes in Account Balance - Pension Trust Fund Interest Account .........................................................................................................................92 Member Savings Account ...........................................................................................................93 State Contribu on Account ........................................................................................................94 Re red Reserve Account ............................................................................................................95 Deferred Re rement Op on Account.........................................................................................96 Expense Account ........................................................................................................................97 Schedule 2 - Schedule of Administra ve Expenses - All Funds ...........................................................98 Schedule 3 - Compara ve Schedule of Inves ng Ac vity Expenses - Pension Trust Fund................100 Schedule 4 - Schedule of Professional and Consul ng Fees - All Funds ...........................................101 INVESTMENT SECTION Investment Overview ...............................................................................................................................104 Total Time-Weighted Returns ...................................................................................................................106 Asset Alloca on ........................................................................................................................................109 Investment Summary ...............................................................................................................................110 Largest Holdings .......................................................................................................................................112 Schedule of Fees and Commissions..........................................................................................................114 ACTUARIAL SECTION Pension Trust Fund Actuary’s Cer ï¬ca on Le er ............................................................................................................136 Actuarial Present Value of Future Beneï¬ts.......................................................................................141 Actuarial Methods and Assump ons ...............................................................................................142 TRS-Care Actuary’s Cer ï¬ca on Le er ............................................................................................................150 Actuarial Present Value of Future Beneï¬ts.......................................................................................152 Actuarial Methods and Assump ons ...............................................................................................152 STATISTICAL SECTION Sta s cal Sec on Overview .....................................................................................................................157 Financial Trends Informa on Ten-Year Summary Changes in Fiduciary Net Posi on and Revenues, Expenses, and Changes in Net Posi on ..............................................................................................................................158 Beneï¬t and Refund Deduc ons from Net Posi on by Type .............................................................166 Opera ng Informa on Average Beneï¬t Payments ................................................................................................................168 Re red Members by Type of Beneï¬t and Health Beneï¬t Payments by Range .................................172 Principal Par cipa ng Employers .....................................................................................................174 List of Par cipa ng Employers ................................................................................................................. 176 BENEFITS SECTION Changes in the Law...................................................................................................................................188 Summary of Beneï¬ts ................................................................................................................................191 . INTRODUCTORY SECTION . This page is intentionally left blank. Introductory Section 2 . Board of Trustees R. David Kelly, Chair Nanette Sissney Vice Chair Managing Partner Straight Line Realty Partners, Plano Direct appointment of the governor Term expires 2017 School Counselor Whitesboro ISD, Whitesboro Active public education position Term expires 2015 Todd Barth Karen Charleston President Bowers Properties Inc., Houston Direct appointment of the governor Term expires 2015 Space Management Assistant Prairie View A&M University, Houston Higher education position Term expires 2017 Joe Colonnetta David Corpus Private Investor Dallas Direct appointment of the governor Term expires 2019 Senior Vice President CommunityBank of Texas, Humble Position nominated by the State Board of Education Term expires 2019 Christopher Moss Vice President The Advanced Financial Group, Lufkin Position nominated by the State Board of Education Term expires 2015 Anita Palmer Former Texas Public School Teacher, Administrator and University Adjunct Professor Jacksboro Retiree position Term expires 2017 Dolores Ramirez Teacher San Benito CISD, San Benito Active public education position Term expires 2019 For information on the board election process, please refer to Note 1 in the Financial Section. Introductory Section 3 . Professional Awards Government Finance Officers Association Certificate of Achievement for Excellence in Financial Reporting Presented to Teacher Retirement System of Texas For its Comprehensive Annual Financial Report for the Fiscal Year Ended August 31, 2014 Executive Director/CEO Introductory Section 4 . Professional Awards PC PC Public Pension Coordinating Council Recognition Award for Administration 2014 Presented to Teacher Retirement System of Texas In recognition of meeting professional standards for plan administration as set forth in the Public Pension Standards. Presented by the Public Pension Coordinating Council, a confederation of National Association of State Retirement Administrators (NASRA) National Conference on Public Employee Retirement Systems (NCPERS) National Council on Teacher Retirement (NCTR) Alan H. Winkle Program Administrator Introductory Section 5 . Letter of Transmittal November 18, 2015 The Honorable Greg Abbott The Honorable Dan Patrick The Honorable Joe Straus The Board of Trustees and Members   of the Teacher Retirement System Dear Governor Abbott, Lieutenant Governor Patrick, Speaker Straus, TRS Board of Trustees, and Members of the Teacher Retirement System: On behalf of the board of trustees, I am pleased to present the Comprehensive Annual Financial Report (CAFR) of the Teacher Retirement System of Texas (TRS or System) for the fiscal year ended August 31, 2015, the System’s 78th year of operation. During the past fiscal year, the System experienced modest growth as membership grew to approximately 1,459,243 participants. The pension trust fund saw slightly negative returns in the past year, consistent with a downturn in world markets. The fund ended the 2015 fiscal year with a net position of $128.5 billion compared to $132.8 billion at the close of the 2014 fiscal year.
However, contribution increases and benefit changes that were approved by the 83rd Texas Legislature, are continuing to enable TRS to provide secure benefits for current and future retirees. MANAGEMENT RESPONSIBILITY This report consists of management’s representations concerning TRS finances. Management assumes full responsibility for the completeness and reliability of all information presented in this report. To provide a reasonable basis for making these representations, management has established a comprehensive internal control framework that is designed both to protect the assets from loss, theft, or misuse and to compile sufficient, reliable information for the preparation of TRS financial statements in conformity with generally accepted accounting principles.
The cost of controls should not exceed the benefits to be derived as the objective of the internal control framework is to provide reasonable rather than absolute assurance that the financial statements will be free from material misstatement. As management, we assert that, to the best of our knowledge and belief, this financial report is complete and reliable in all material respects. CERTIFICATE OF ACHIEVEMENT FOR EXCELLENCE IN FINANCIAL REPORTING The Government Finance Officers Association of the United States and Canada (GFOA) awarded TRS the Certificate of Achievement for Excellence in Financial Reporting for its Comprehensive Annual Financial Report for the previous fiscal year. To be awarded the certificate, a report must meet or exceed program standards and must satisfy both generally accepted accounting principles and applicable legal requirements.
TRS has received a Certificate of Achievement for the last 25 years. We believe that the current report continues to meet program requirements, and it is being submitted to the GFOA for consideration again this year. Introductory Section 6 . Letter of Transmittal FINANCIAL INFORMATION The basic financial statements have been prepared in accordance with generally accepted accounting principles applied on a consistent basis as promulgated by the Governmental Accounting Standards Board. The Management’s Discussion and Analysis (MD&A) includes a narrative introduction, overview and analysis to accompany the basic financial statements. This transmittal letter is designed to complement the MD&A and should be read in conjunction with it. The MD&A can be found immediately following the report of the independent auditors. During the past year, TRS also embarked on a program of auditing reporting entity reports submitted by reporting entities to TRS in response to GASB accounting and AICPA auditing guidance. TRS Internal Audit staff has been testing employer census data and controls pertaining to census data reporting process for active members.
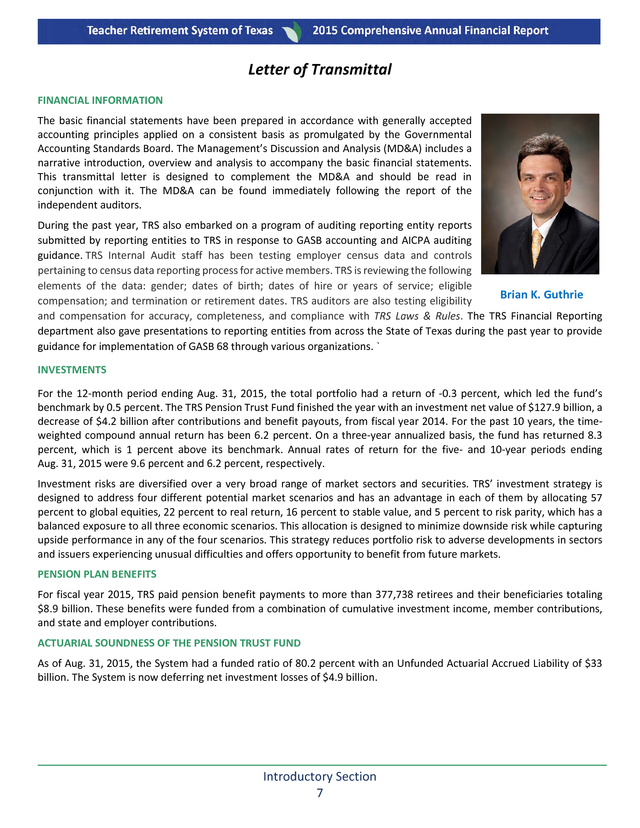
TRS is reviewing the following elements of the data: gender; dates of birth; dates of hire or years of service; eligible Brian K. Guthrie compensation; and termination or retirement dates. TRS auditors are also testing eligibility and compensation for accuracy, completeness, and compliance with TRS Laws & Rules.
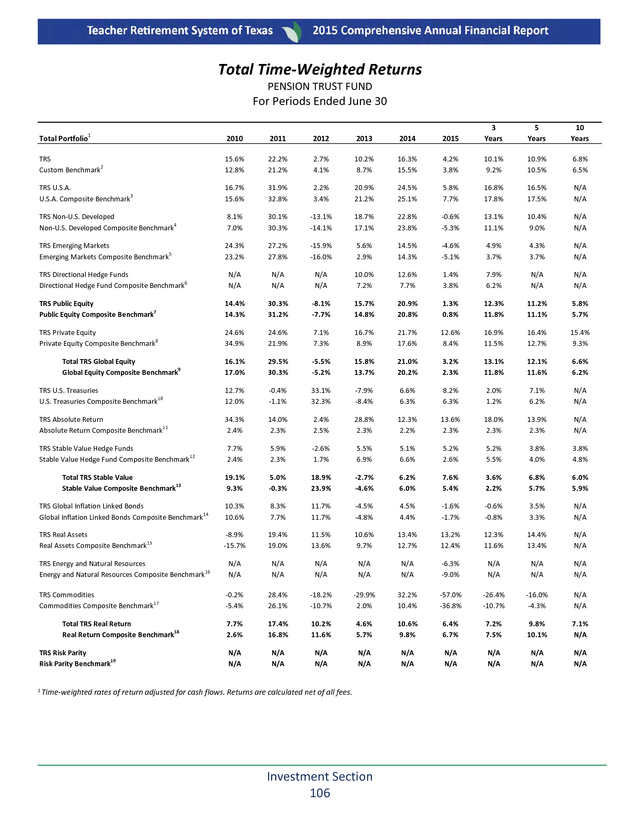
The TRS Financial Reporting department also gave presentations to reporting entities from across the State of Texas during the past year to provide guidance for implementation of GASB 68 through various organizations. ` INVESTMENTS For the 12-month period ending Aug. 31, 2015, the total portfolio had a return of -0.3 percent, which led the fund’s benchmark by 0.5 percent.
The TRS Pension Trust Fund finished the year with an investment net value of $127.9 billion, a decrease of $4.2 billion after contributions and benefit payouts, from fiscal year 2014. For the past 10 years, the timeweighted compound annual return has been 6.2 percent. On a three-year annualized basis, the fund has returned 8.3 percent, which is 1 percent above its benchmark.
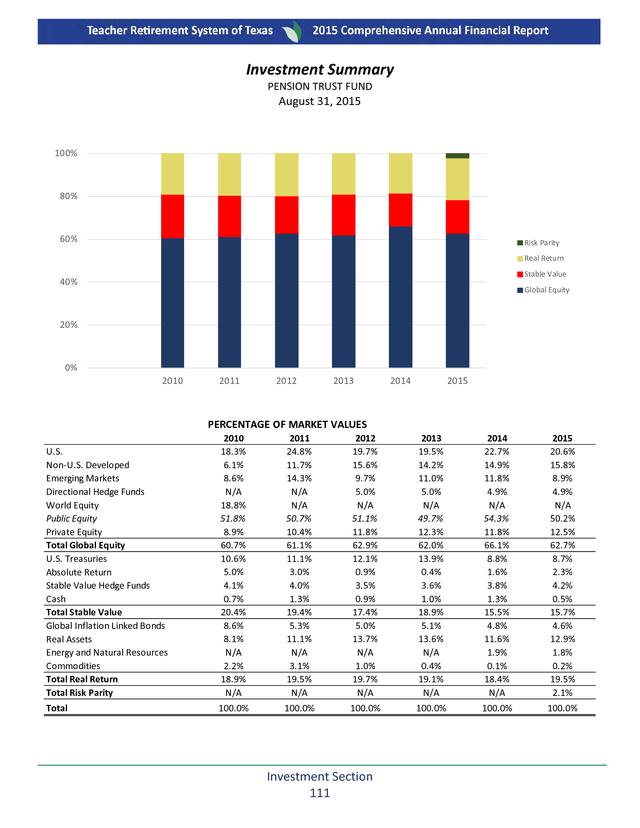
Annual rates of return for the five- and 10-year periods ending Aug. 31, 2015 were 9.6 percent and 6.2 percent, respectively. Investment risks are diversified over a very broad range of market sectors and securities. TRS’ investment strategy is designed to address four different potential market scenarios and has an advantage in each of them by allocating 57 percent to global equities, 22 percent to real return, 16 percent to stable value, and 5 percent to risk parity, which has a balanced exposure to all three economic scenarios.
This allocation is designed to minimize downside risk while capturing upside performance in any of the four scenarios. This strategy reduces portfolio risk to adverse developments in sectors and issuers experiencing unusual difficulties and offers opportunity to benefit from future markets. PENSION PLAN BENEFITS For fiscal year 2015, TRS paid pension benefit payments to more than 377,738 retirees and their beneficiaries totaling $8.9 billion. These benefits were funded from a combination of cumulative investment income, member contributions, and state and employer contributions. ACTUARIAL SOUNDNESS OF THE PENSION TRUST FUND As of Aug.
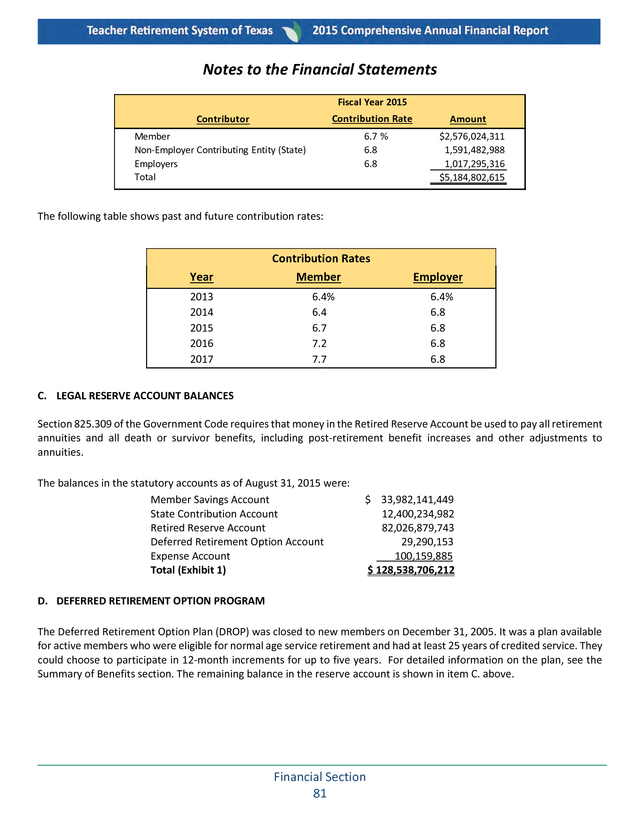
31, 2015, the System had a funded ratio of 80.2 percent with an Unfunded Actuarial Accrued Liability of $33 billion. The System is now deferring net investment losses of $4.9 billion. Introductory Section 7 . Letter of Transmittal The period of time necessary to amortize the unfunded liability has increased from 29.8 years to 33.3 years. Given that current contributions cannot amortize the unfunded liability in less than 31 years, the System does not meet the definition for actuarial soundness. The increase in the period of time necessary to amortize the unfunded liability was anticipated and is partially due to the phasing in of contribution rate increases adopted by the 83rd Texas Legislature. In 2013, the Legislature adopted Senate Bill 1458 that provided a stair-step increase in the member contribution rate from 6.4 percent in FY 2014 to 7.7 percent in FY 2017.
The member contribution rate for FY 2015 was 6.7 percent. While the increased contribution rates are an actuarial gain to the System, the phased-in approach has partially contributed to the funding period and unfunded liability growth. The state contribution rate for FY 2015 was 6.8 percent, and in FY 2015 school districts that do not participate in Social Security began paying a 1.5 percent contribution rate to the System. Also impacting the growth of the unfunded liability are lower than expected investment returns for FY 2015 and the adoption of a new mortality assumption based on the increased life expectancy of System members.
Adoption of the new mortality assumption was part of a larger study of System experience for the last five years. Texas Government Code Section 825.206 requires TRS to conduct an actuarial experience study at least once every five years to examine the mortality, service, and compensation experience of the members and beneficiaries of the retirement system. The TRS Board is then required to review and adopt the System’s actuarial assumptions in light of the relevant experience.
In September 2015, TRS concluded the experience study for the four-year period ending Aug. 31, 2014 and adopted a new assumption set. In addition to updating the mortality assumption, the board kept the assumed investment return rate at 8 percent and lowered the assumptions for inflation, real wage growth, and payroll growth.
The new assumption set more accurately portrays the actuarial condition of the System given that it incorporates System experience for FY 2011 to FY 2014. It is estimated that the unfunded liability and the funding period will both continue to increase over the next few years before beginning to once again decline. However, the funding period is anticipated to remain a finite number until the unfunded liability is amortized and the pension fund is fully funded. Several important legislative changes were enacted by the 84th Texas Legislature during the past year. Some of the bills that most directly impacted TRS members included House Bill 2, a supplemental funding bill, which provided biennial funding for TRS-Care in the amount of roughly $768 million.
House Bill 2168 stipulated that monthly annuity payments be paid on the last working day of the month for which the payment accrues. House Bill 2974 contained a variety of selected omnibus provisions covering several important areas. It also created a joint interim committee to study TRS-Care and TRSActiveCare.
TRS-related legislation is covered in more detail in the “Changes in the Law” section of this report. RETIREE HEALTH BENEFITS PROGRAM TRS administers TRS-Care, a health benefits program for retirees that was established in 1985. TRS-Care is the source of health benefits coverage, which almost all retired public school employees rely upon. Funding is provided by premium payments from retiree participants and contributions from the state, school districts and active employees.
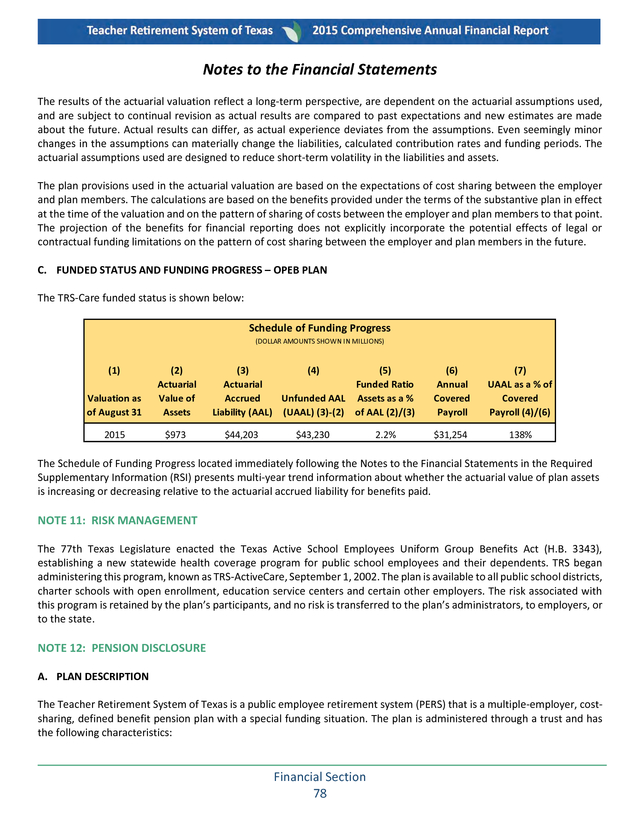
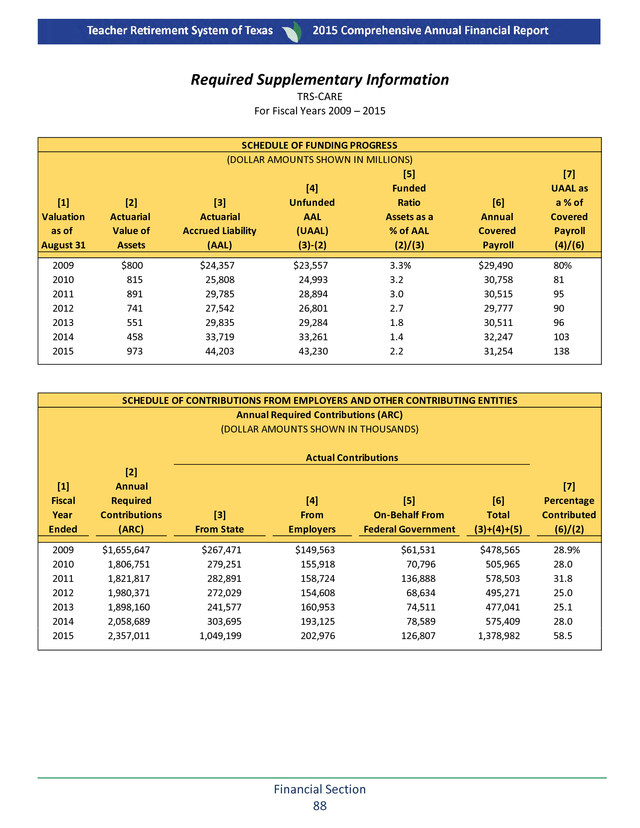
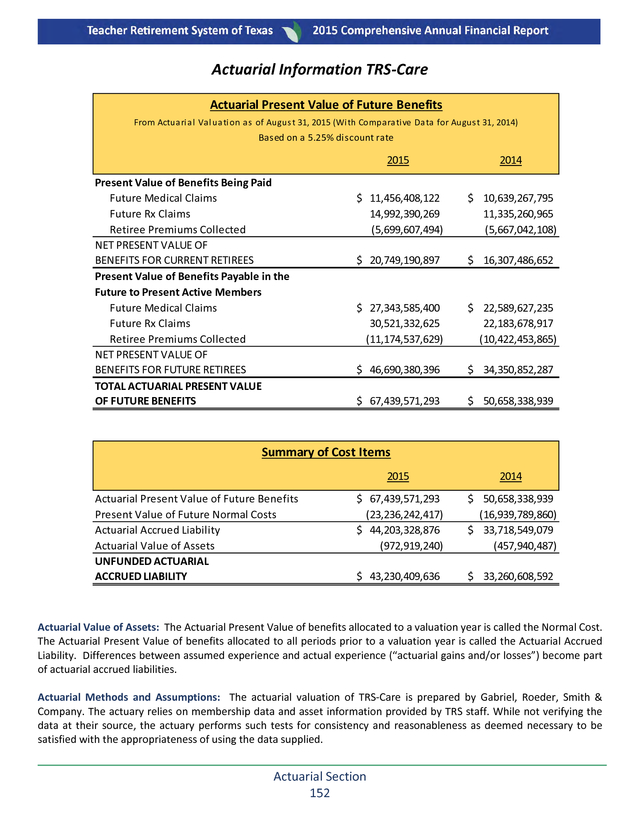
TRS-Care also receives additional revenue from the Medicare Part D prescription drug program. An actuarial valuation for TRS-Care was conducted as of Aug. 31, 2015. The valuation results indicate that TRS-Care has an Unfunded Actuarial Accrued Liability of $44.2 billion.
The plan was 2.2 percent funded as of the end of the Fiscal Year 2015. More detailed information about the valuation results is included in the Notes to the Financial Statements and the Required Supplementary Information. The current funding formula of 1 percent of public school payroll from the State, .55 percent from the district and .65 percent from the member is insufficient to sustain the, TRS-Care Program. The state legislature infused $768 million into the program as a measure intended to ensure solvency of the TRS-Care fund through the FY 16-17 Biennium.
The 84th Legislature also created a joint interim committee to study TRS-Care and also TRS-ActiveCare. TRS will be supporting the work of the committee to address the ongoing solvency and affordability of the TRS-Care and TRS-ActiveCare programs. Introductory Section 8 . Letter of Transmittal ACTIVE MEMBER HEALTH BENEFITS PROGRAM TRS-ActiveCare, initiated in 2002, is a self-funded health benefits program that offers options ranging from catastrophic coverage with reduced premiums to a comprehensive plan at higher premiums. TRS-ActiveCare covers members currently employed by public education employers that participate in the plan. TRS establishes premiums to pay for the cost of the program. The TRS Board of Trustees approved an additional increase in premiums for fiscal year 2014 and froze TRSActiveCare 3 for new enrollment.
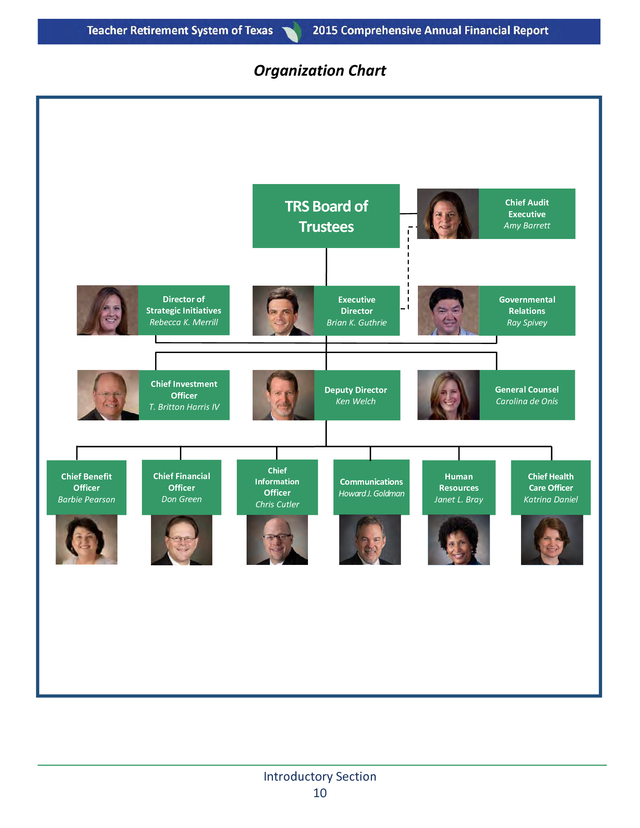
As noted above, TRS also updated an earlier study submitted to the 83rd Legislature of options for improving the sustainability of TRS-Care and expanded the study to also include options to improve the affordability of TRS-ActiveCare. ORGANIZATIONAL CHANGE During the past year, TRS named three new chief officers. Chris Cutler became TRS’ new chief information officer, Barbie Pearson was named chief benefit officer, and Katrina Daniel joined TRS as the agency’s new chief health care officer. Over the past year, we have also made a handful of other organizational changes to focus on our key challenges moving forward: health care fund solvency, pension trust fund sustainability, long-term investment returns, and replacing legacy technology systems.
These changes are reflected in the updated organizational chart on the following page. During the past year, TRS increased its focus on the agency’s core values: Customer Satisfaction; Collaboration and Teamwork; Accountability; Respect; Ethics; Excellence; and Employee Fulfillment. These values continue to be incorporated throughout TRS’ work environment, including in performance evaluations, employee recognition programs and communications. They also continuously focus our efforts on how to best serve our members. Thanks to the hard work and dedication of its employees, TRS was named a “Top Workplace” by the Austin AmericanStatesman for the fourth year in a row. ACKNOWLEDGMENTS We wish to express our appreciation for the support of the Governor’s, Lieutenant Governor’s, and Speaker’s Offices, as well as members of the legislature, in maintaining a strong retirement system, which provides valuable benefits for public education employees and retirees. We are grateful for the dedicated service of all of our trustees.
Trustee willingness to accept the substantial responsibilities of directing system administration is a great service to the state and to the members served by TRS. TRS trustees and staff are keenly focused on prudent pension trust fund portfolio management and efficient, serviceoriented delivery of valuable retirement and related benefits for public education employees and retirees. We are pleased to report on operational results for the year and to acknowledge the substantial support of state leadership, trustees, members, interested associations, and TRS staff. Respectfully submitted, Brian K. Guthrie Executive Director Introductory Section 9 .
Organization Chart Chief Audit Executive Amy Barrett TRS Board of Trustees Director of Strategic Initiatives Rebecca K. Merrill Governmental Relations Ray Spivey Chief Investment Officer T. Britton Harris IV Chief Benefit Officer Barbie Pearson Executive Director Brian K. Guthrie Deputy Director Ken Welch General Counsel Carolina de Onís Chief Financial Officer Don Green Chief Information Officer Chris Cutler Communications Howard J. Goldman Introductory Section 10 Human Resources Janet L. Bray Chief Health Care Officer Katrina Daniel . Staff and Advisors EXECUTIVE ADMINISTRATIVE STAFF Brian K. Guthrie, Executive Director INVESTMENT ADVISORS Ken Welch, Deputy Director Keith C. Brown, Ph.D., Austin T. Britton Harris IV, Chief Investment Officer Carolina de Onís, General Counsel AUDIT SERVICES Amy L.
Barrett, Chief Audit Executive Texas State Auditor’s Office, Austin Barbie Pearson, Chief Benefit Officer Don Green, Chief Financial Officer FIDUCIARY COUNSEL Chris Cutler, Chief Information Officer Reinhart Boerner Van Deuren, S.C., Howard J. Goldman, Director, Communications Milwaukee, WI Ray Spivey, Director, Governmental Relations Janet L. Bray, Director, Human Resources MEDICAL BOARD Katrina Daniel, Chief Health Care Officer Dr.
Alice Cox, Fredericksburg Rebecca K. Merrill, Director, Strategic Initiatives Dr. James Reinarz, Austin Dr.
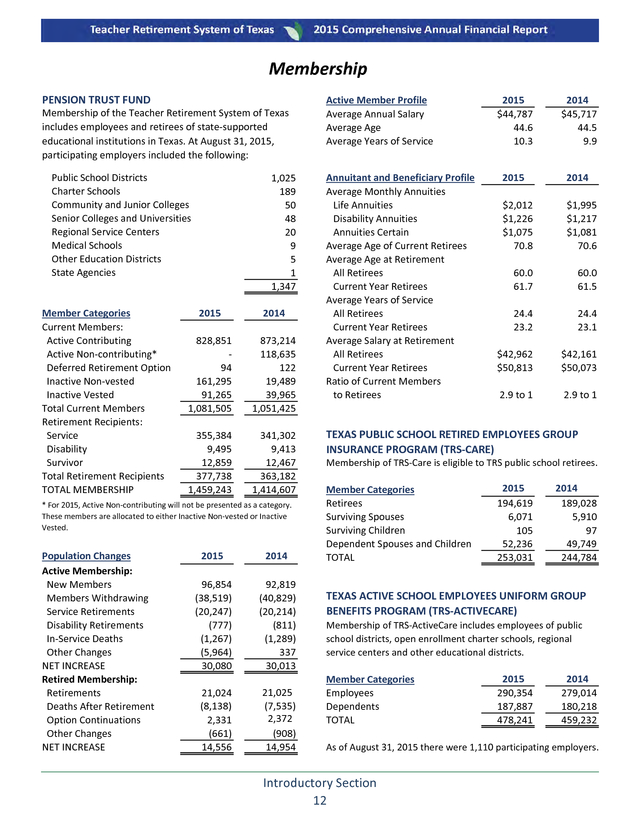
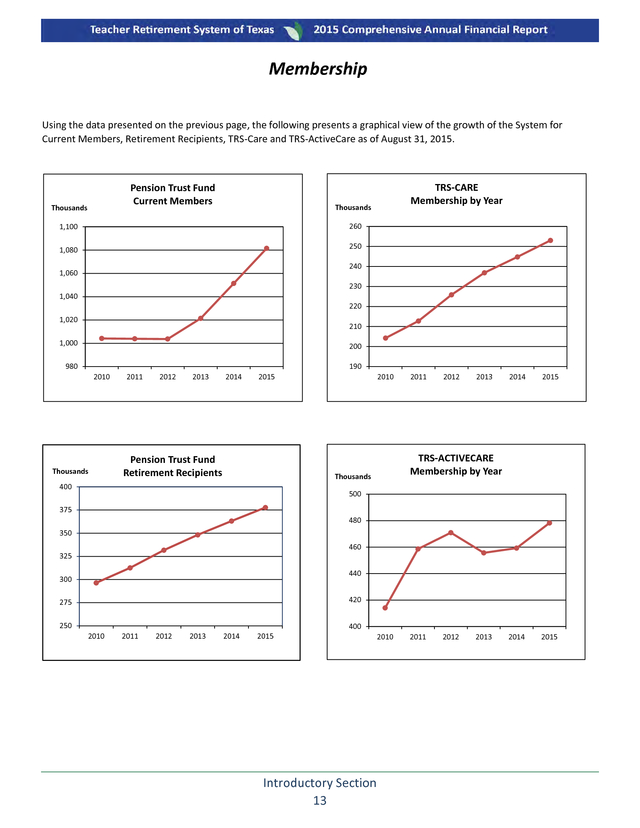
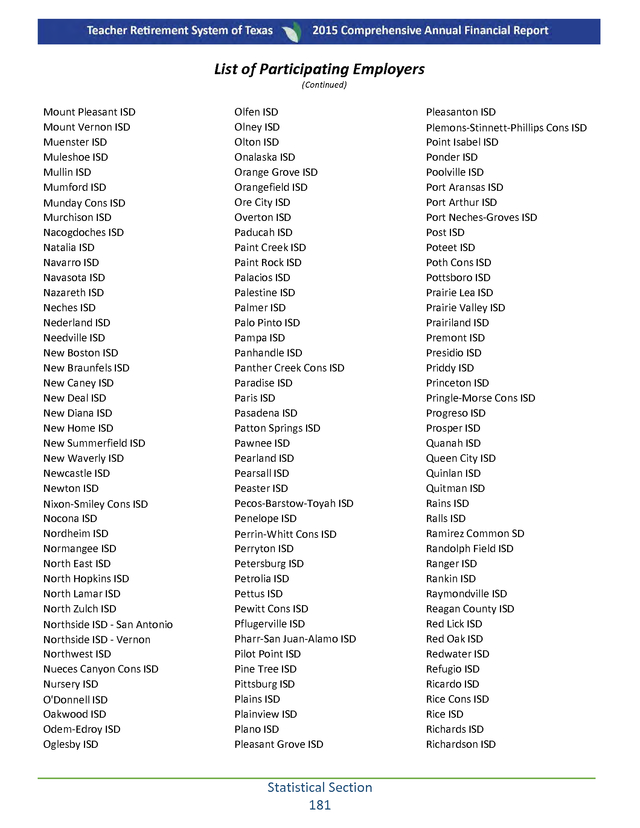
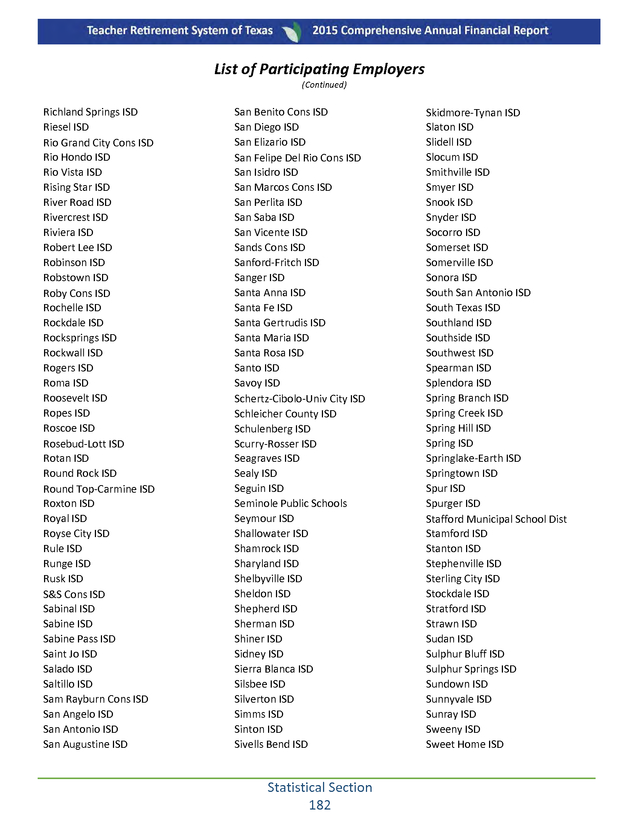
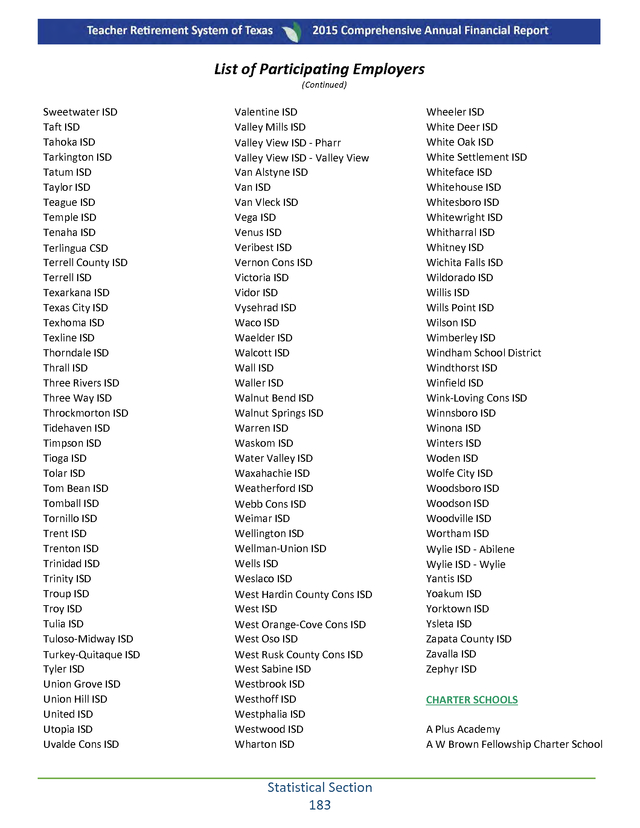
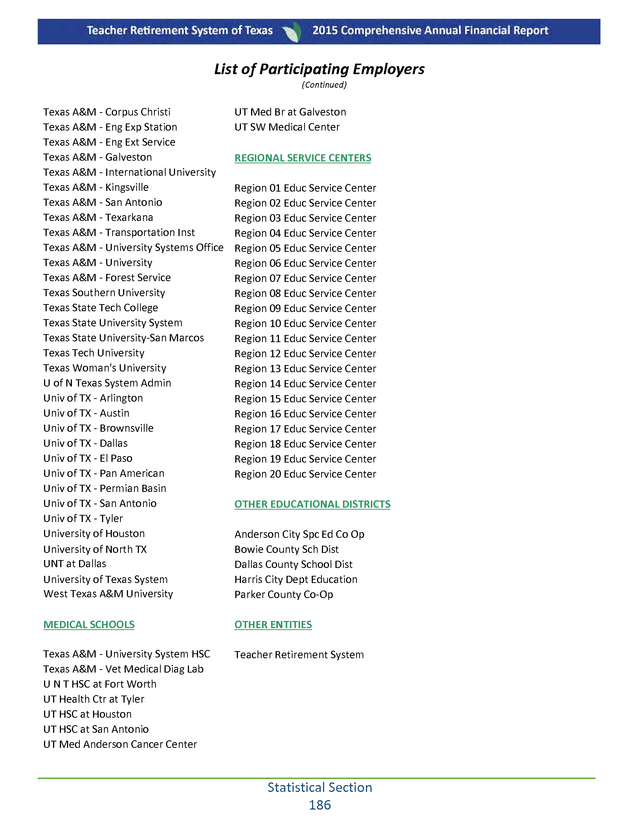
Larry D. Wilson, Austin GENERAL INVESTMENT CONSULTANT Aon Hewitt Investment Consulting, Inc. TEXAS PUBLIC SCHOOL RETIRED EMPLOYEES GROUP INSURANCE PROGRAM ADVISORY COMMITTEE Chicago, IL Bill Barnes, Haslet CONSULTING ACTUARY Donnie Breedlove, Ed.D., Dallas Gabriel, Roeder, Smith & Company, Dallas Sunday McAdams, Seymour Marcia McNeil, Austin INVESTMENT CONSULTANTS Glenna Purcell, Eagle Pass Albourne America, L.L.C., San Francisco, CA Active Teacher Position, Vacant (Absolute Return) Active Administrator Position, Vacant BlackRock Investment Management, L.L.C., New York, NY (Private Equity Co-investments) Active Auxiliary Staff Position, Vacant Retired Auxiliary Staff Position, Vacant Green Street Advisors, Inc., Newport Beach, CA (Real Estate) HEALTH CARE CONSULTANT Hamilton Lane Advisors, L.L.C., San Francisco, CA and Bala Cynwyd, PA Gabriel, Roeder, Smith & Company, Dallas (Private Equity) Leading Edge Investment Advisors, L.L.C., San Francisco, CA (Emerging Managers) The Townsend Group, Inc., Cleveland, OH (Real Estate) Tudor Pickering Holt & Co., L.L.C., Houston, TX (Energy and Natural Resources) MASTER CUSTODIAN AND SECURITIES LENDING AGENT State Street Bank and Trust Company, Boston, MA PERFORMANCE MEASUREMENT State Street Bank and Trust Company, Boston, MA Introductory Section 11 . Membership PENSION TRUST FUND Membership of the Teacher Retirement System of Texas includes employees and retirees of state-supported educational institutions in Texas. At August 31, 2015, participating employers included the following: Public School Districts Charter Schools Community and Junior Colleges Senior Colleges and Universities Regional Service Centers Medical Schools Other Education Districts State Agencies Member Categories Current Members: Active Contributing Active Non-contributing* Deferred Retirement Option Inactive Non-vested Inactive Vested Total Current Members Retirement Recipients: Service Disability Survivor Total Retirement Recipients TOTAL MEMBERSHIP 1,025 189 50 48 20 9 5 1 1,347 2015 2014 828,851 94 161,295 91,265 1,081,505 873,214 118,635 122 19,489 39,965 1,051,425 355,384 9,495 12,859 377,738 1,459,243 341,302 9,413 12,467 363,182 1,414,607 * For 2015, Active Non-contributing will not be presented as a category. These members are allocated to either Inactive Non-vested or Inactive Vested. Population Changes Active Membership: New Members Members Withdrawing Service Retirements Disability Retirements In-Service Deaths Other Changes NET INCREASE Retired Membership: Retirements Deaths After Retirement Option Continuations Other Changes NET INCREASE 2015 2014 96,854 (38,519) (20,247) (777) (1,267) (5,964) 30,080 92,819 (40,829) (20,214) (811) (1,289) 337 30,013 21,024 (8,138) 2,331 (661) 14,556 21,025 (7,535) 2,372 (908) 14,954 Active Member Profile Average Annual Salary Average Age Average Years of Service Annuitant and Beneficiary Profile Average Monthly Annuities Life Annuities Disability Annuities Annuities Certain Average Age of Current Retirees Average Age at Retirement All Retirees Current Year Retirees Average Years of Service All Retirees Current Year Retirees Average Salary at Retirement All Retirees Current Year Retirees Ratio of Current Members to Retirees 2015 $44,787 44.6 10.3 2014 $45,717 44.5 9.9 2015 2014 $2,012 $1,226 $1,075 70.8 $1,995 $1,217 $1,081 70.6 60.0 61.7 60.0 61.5 24.4 23.2 24.4 23.1 $42,962 $50,813 $42,161 $50,073 2.9 to 1 2.9 to 1 TEXAS PUBLIC SCHOOL RETIRED EMPLOYEES GROUP INSURANCE PROGRAM (TRS-CARE) Membership of TRS-Care is eligible to TRS public school retirees. Member Categories Retirees Surviving Spouses Surviving Children Dependent Spouses and Children TOTAL 2015 194,619 6,071 105 52,236 253,031 2014 189,028 5,910 97 49,749 244,784 TEXAS ACTIVE SCHOOL EMPLOYEES UNIFORM GROUP BENEFITS PROGRAM (TRS-ACTIVECARE) Membership of TRS-ActiveCare includes employees of public school districts, open enrollment charter schools, regional service centers and other educational districts. Member Categories Employees Dependents TOTAL 2015 290,354 187,887 478,241 2014 279,014 180,218 459,232 As of August 31, 2015 there were 1,110 participating employers. Introductory Section 12 . Membership Using the data presented on the previous page, the following presents a graphical view of the growth of the System for Current Members, Retirement Recipients, TRS-Care and TRS-ActiveCare as of August 31, 2015. Pension Trust Fund Current Members Thousands TRS-CARE Membership by Year Thousands 1,100 260 1,080 250 240 1,060 230 1,040 220 1,020 210 1,000 200 190 980 2010 Thousands 2011 2012 2013 2014 2010 2015 Pension Trust Fund Retirement Recipients 2012 2013 2014 2015 2014 2015 TRS-ACTIVECARE Membership by Year Thousands 400 2011 500 375 480 350 460 325 440 300 420 275 250 2010 2011 2012 2013 2014 2015 400 Introductory Section 13 2010 2011 2012 2013 . Communications During fiscal year 2015, TRS communicated with members, retirees, participating employers, and the general public over the telephone as well as through group presentations, one-on-one meetings, print publications, webcasts, videos, social media, the agency’s website, and email. TRS staff also spoke at conferences across the state to update members and retirees on their pension and health care benefits as well as TRS investment performance. Major communications from the past year are summarized below: PRINT PUBLICATIONS During fiscal year 2015, TRS published three TRS News issues to provide members and retirees with important information relating to their benefits. The summer 2015 issue described TRS-related legislative changes enacted into law. Employers received TRS-related information through nine Update newsletters.
Annual statements were distributed in October 2014 to all active members of the system. TRS also published a number of publications for members and retirees, including brochures and other materials related to TRS pension and health care benefits. THE INTERNET Over the past year, the TRS website received a total of 3,328,859 visits, representing a 9.7 percent increase from 3,033,862 visits in the previous fiscal year. In addition, 1,732,348 unique visitors used the site during fiscal year 2015 — a 9.6 percent increase from 1,580,841 visitors in fiscal year 2014. MyTRS was promoted during the year through email, newsletter articles, social media, and the agency website. As of Aug. 31, 2015, 490,739 members and retirees had registered to participate in MyTRS, nearly 70,000 more than in the previous year. In 2015, significant online improvements were being developed through the TRS Enterprise Application Modernization (TEAM), a multi-year initiative to update business processes and core technologies used by TRS.
While TEAM will ultimately bring enhanced customer service, members experienced temporary, minimal reductions in MyTRS functionality during the year as work on TEAM progressed. As a result, it was temporarily not possible to access the following information online in 2015: • members’ beneficiary information • service purchase forms (once they have been created for a bill) and • replacement retirement packets (still available by contacting TRS directly) During the past year, TRS also developed a detailed approach to guide a redesign of the TRS website. A contract to develop and implement a redesigned website was awarded to a contractor in the fall of 2015. SOCIAL MEDIA In 2014-15, TRS broadened its engagement through social media with a growing number of members, retirees, and others. In fiscal year 2015, TRS recorded more than 7,860 Facebook likes, 2,200 followers on LinkedIn and 1,800 followers on Twitter.
In addition, TRS videos were viewed 81,334 times on YouTube. During the year, TRS expanded its use of LinkedIn to attract and recruit new employees through a new Career Page managed by Human Resources. At fiscal year-end, TRS heavily promoted a student art contest (kindergarten through fifth grade) to select art work for use in this publication. Submission of art work was slated for September, and voting on Facebook for best art among finalists was scheduled for October. Introductory Section 14 .
Communications WEBCASTING OF BOARD MEETINGS As part of its commitment to open and transparent communication, TRS continued to webcast board meetings during the past year. All board meetings are streamed live so members and others can watch the proceedings as they take place from anywhere in Texas or around the world. Each meeting is also recorded for on-demand playback. All TRS board meetings are archived on the TRS website where individual agenda items can be easily accessed through an online catalog.
In late fiscal year 2015, TRS announced plans to conduct an October webcast town hall meeting to discuss the sustainability and affordability of TRS-Care and TRS-ActiveCare. ASSOCIATION MEETINGS Early in the fiscal year, TRS continued its outreach to members and retirees through a series of Texas Retired Teacher Association meetings. TRS officials spoke to retirees at more than 20 conventions around the state and provided updates on TRS developments. These meetings provide an opportunity for TRS representatives to meet with members and retirees face-to-face and answer any questions they may have.
Legislators or their representatives from the area also frequently attend the meetings. GROUP PRESENTATIONS AND INDIVIDUAL RETIREMENT COUNSELING SESSIONS Over the past year, TRS made a number of group presentations to professional associations, employee and retiree groups and at regional education service centers. Presentations focused on retirement options, health care benefits for active and retired members, long-term care insurance, employment after retirement, and other TRS benefits. A total of 11,405 people attended 173 group presentations, and 20,800 people attended five conventions where TRS was represented.
In addition, 9,300 people visited individually with a TRS counselor – 8,883 in Austin and 417 in field office visit locations. Fiscal year 2015 was the ninth year that one-on-one retirement counseling sessions were offered in limited field locations throughout Texas (450 available appointments in 10 cities). TELECOMMUNICATIONS In fiscal year 2015, the agency’s Benefit Counseling department handled a total of 486,572 calls. In addition, 181,117 calls were completed during the past year within the agency’s automated telephone system. TRS and its contractors also provided telephone assistance to a large number of members seeking health care-related information. TRS-ActiveCare staff and contractors responded to 460,407 calls, and TRS-Care staff and contractors responded to 589,547 calls. COORDINATION WITH REPORTING ENTITIES The TRS Reporting and Query System (TRAQS), the agency’s internet-based reporting system for employers, had 1,362 reporting entities submit monthly reports to TRS by year end.
During the year, eight professional association and software user group presentations were attended by 420 people. One conference exhibit booth was attended by more than 2,000 school business staff, and one webinar was recorded and posted to the TRS website. In addition, a webinar in partnership with TASBO (Texas Association of School Business Officials) was recorded.
One participating employer traveled to TRS for onsite training, and one face-to-face conference training session was conducted with a reporting official. Twenty-six TRS-ActiveCare training seminars were conducted around the state for more than 1,200 benefit administrators of TRS-ActiveCare participating employers. Additionally, 10 webinars were conducted with 185 registered participants. For 2015, YouTube tutorials were also offered with 3,245 total views, as well as, on-demand voiceover webinars were offered to plan participants. There were 2,643 people who viewed the English version and 261 people who viewed the Spanish version.
These seminars/webinars provided information regarding enrollment, changes and ongoing administrative issues for TRS-ActiveCare. Introductory Section 15 . This page is intentionally left blank. Introductory Section 16 . FINANCIAL SECTION . This page is intentionally left blank. Financial Section 18 . Financial Section 19 . Financial Section 20 . Financial Section 21 . Financial Section 22 . Management’s Discussion and Analysis The following is Management’s Discussion and Analysis (MD&A) of the Teacher Retirement System’s (TRS or system) financial performance for the fiscal year ended August 31, 2015. The information presented here should be considered in conjunction with other areas of the Financial Section as well as information presented in the Executive Director’s Letter of Transmittal in the Introductory Section of the TRS Comprehensive Annual Financial Report. FINANCIAL HIGHLIGHTS The net position of the TRS Pension Trust Fund was $128.5 billion as of August 31, 2015, a decrease of 3.2%, in fiscal year 2015. ï‚· As of August 31, 2015, the date of the most recent actuarial valuation, the TRS Pension Trust Fund’s ratio of actuarial assets, as a percentage of actuarial liabilities, was 80.2%, which is the same as the level at August 31, 2014. The unfunded actuarial accrued liability was $33 billion, which is more than the $31.6 billion reported at August 31, 2014. ï‚· The annual rate of return on investments for the pension fund for the year ended August 31, 2015 was (0.27%). The rate of return for fiscal year 2014 was 16.9%. ï‚· The net position of TRS-Care was $972.9 million as of August 31, 2015, an increase of $515 million from fiscal year end 2014. ï‚· As of August 31, 2015, the date of the most recent actuarial valuation, TRS-Care trust fund’s unfunded actuarial accrued liability was $43.2 billion, which is more than the $33.3 billion reported at August 31, 2014. ï‚· TRS-ActiveCare had a net position of $87.8 million as of August 31, 2015, an increase of $65.0 million or 285% in fiscal year 2015. OVERVIEW OF THE FINANCIAL STATEMENTS This discussion and analysis is intended to serve as an introduction to the TRS financial presentation, which consists of the following components: ï‚· Fund financial statements ï‚· Notes to the financial statements ï‚· Required supplementary information ï‚· Other supplementary schedules Collectively, this information presents the net position available for pension and other post-employment benefits, health care benefits, and other purposes as of August 31, 2015, and summarizes any changes in net position for the year then ended. The information available in each of these sections is summarized as follows: Fund Financial Statements Individual fund financial statements are presented for all fiduciary and proprietary funds as of August 31, 2015 and for the year then ended.
Comparative data in total as of August 31, 2014, and for the year then ended has also been presented with the exception of agency funds. These financial statements reflect the resources available to pay benefits to retirees Financial Section 23 . Management’s Discussion and Analysis and other beneficiaries, to pay health care benefits for covered participants, and to administer the 403(b) Administrative Program. Fiduciary funds presented include the Pension Trust Fund, TRS-Care and Agency Funds. Fiduciary funds are used to account for resources held for the benefit of parties outside of TRS. Proprietary funds account for business-type activities and include the TRS-ActiveCare and the non-major 403(b) Administrative Program enterprise funds. Notes to the Financial Statements The financial statement notes provide additional information that is essential to a full understanding of the data provided in the fund financial statements.
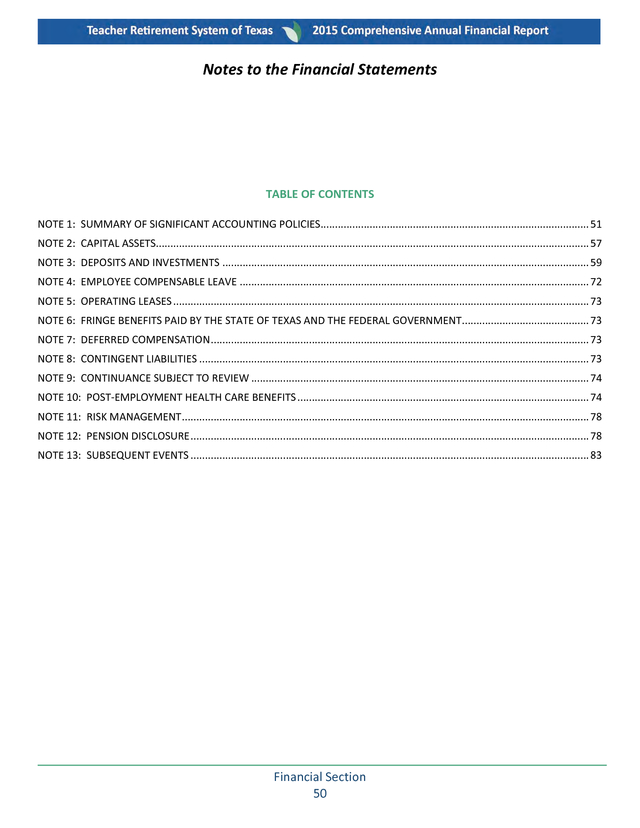
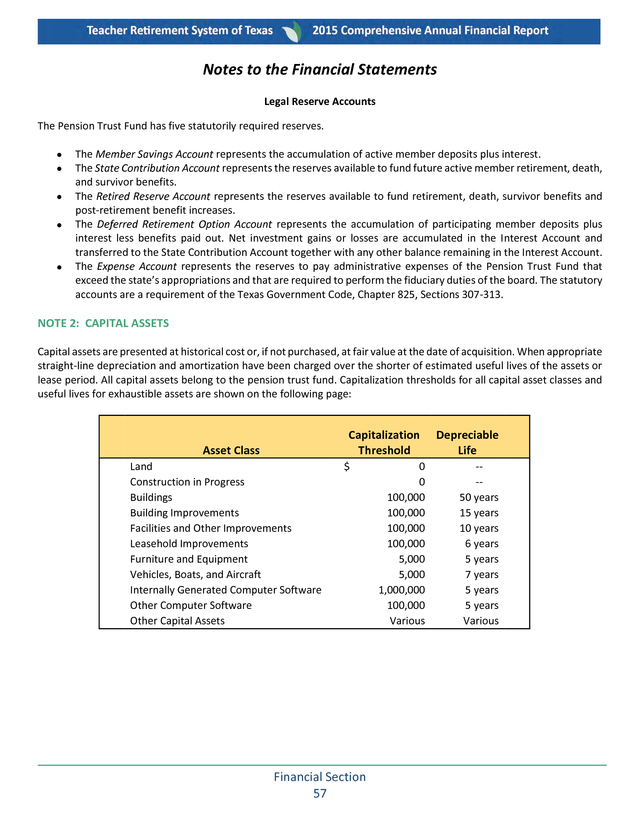
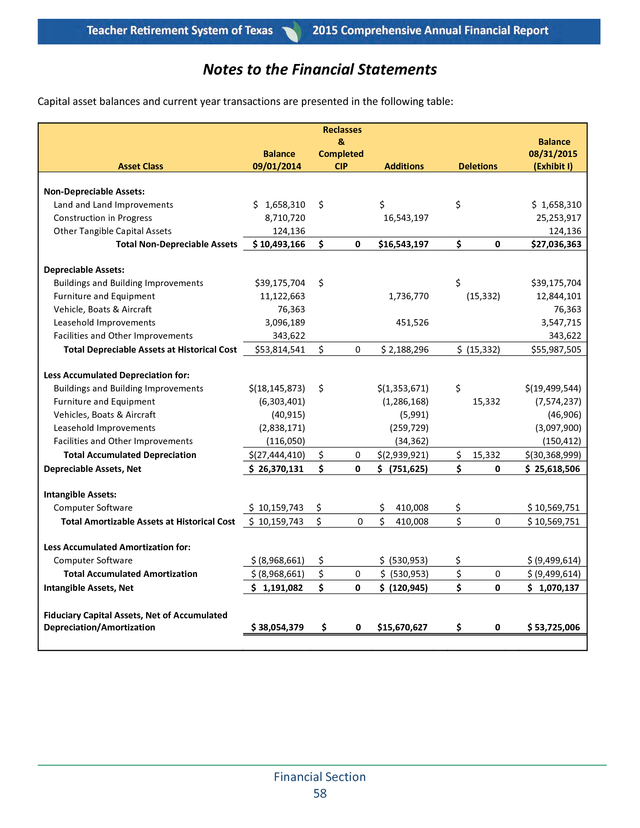
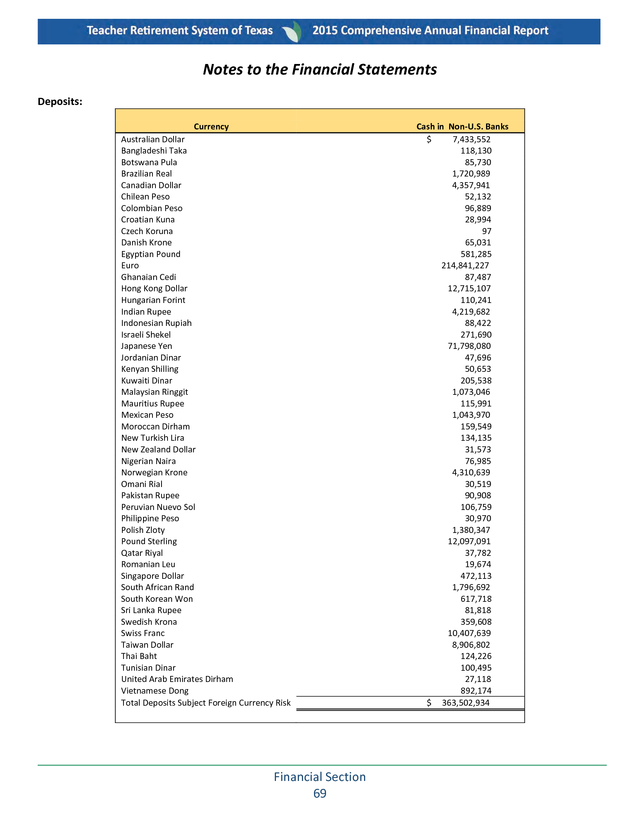
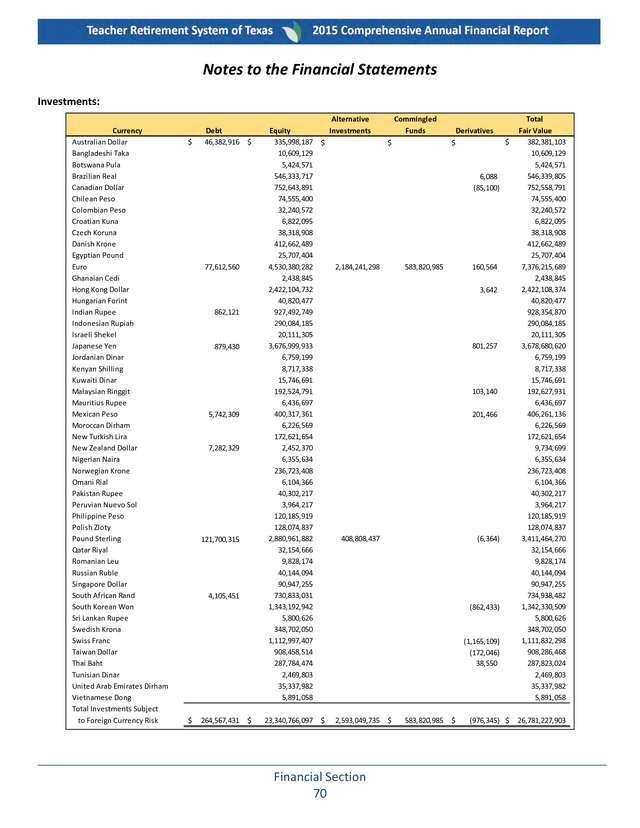
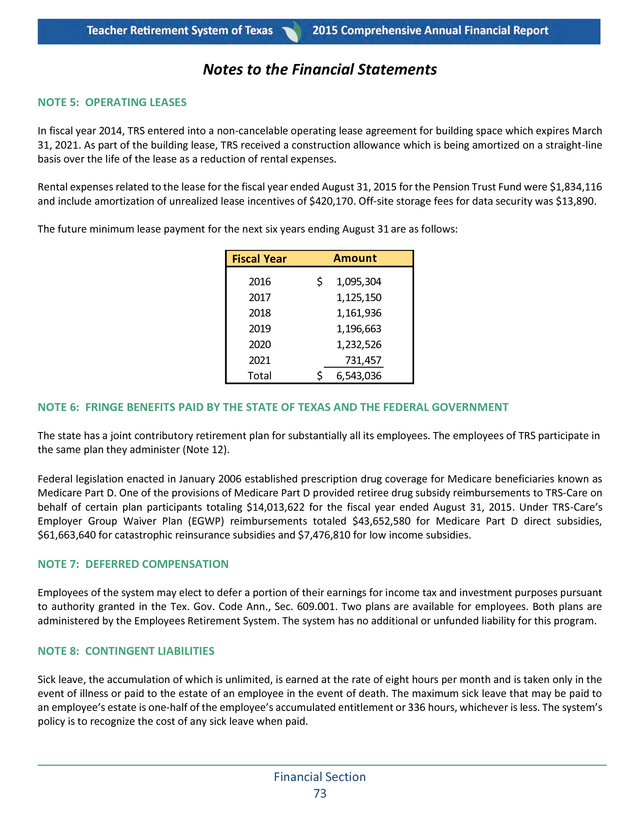
Information available in the notes to the financial statements is described below: ï‚· Note 1 provides a summary of significant accounting policies, including the basis of accounting, budgets and appropriations, explanations of major asset and liability classes, and legal reserve account information. Also included is a general description of TRS as well as a description of each of the funds administered by TRS. ï‚· Note 2 provides information on capital assets. ï‚· Note 3 describes deposits and investments, including investing authority, investment risk categorizations, and additional information about cash, derivatives, securities lending, alternative investments and contingent commitments. ï‚· Note 4 provides information on employee compensable leave. ï‚· Note 5 provides information on the operating lease. ï‚· Note 6 provides information on fringe benefits paid by the state and federal government on behalf of employees and participants of the health care plans. ï‚· Note 7 describes deferred compensation plans available to TRS employees. ï‚· Note 8 provides information on contingent liabilities such as TRS employees’ accumulated sick leave, lump sum death benefits, incentive compensation, retiree benefits and any pending litigation. ï‚· Note 9 addresses TRS’ continuance subject to review under the Texas Sunset Act. ï‚· Note 10 describes other post-employment health care benefits provided to TRS’ employees and retired public school employees, contributions to the plan and its funded status. ï‚· Note 11 addresses risk management issues related to the health benefits program for active school district employees. ï‚· Note 12 provides pension disclosure information including detailed data on the plan description, contributions, legal reserve balances and the net pension liability. ï‚· Note 13 provides information on subsequent events. Required Supplementary Information Required supplementary information for the pension plan consists of schedules related to the net pension liability, contributions from employers and the non-employer contributing entity, and the annual money weighted rate of return on pension plan investments. RSI for the other employee benefit plan administered by TRS includes schedules related to the funding progress and the contributions from the participating employers.
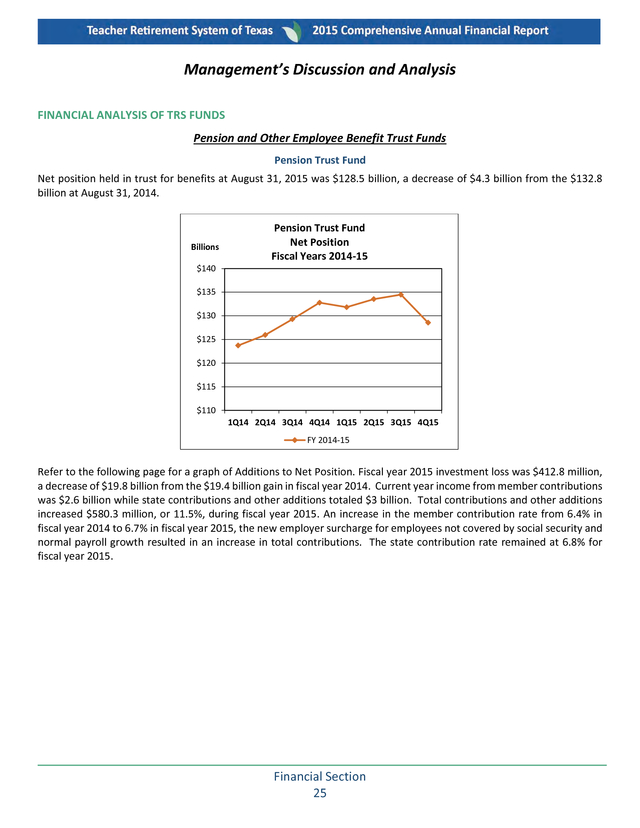
Also included in this component is Management’s Discussion and Analysis. Other Supplementary Schedules Other schedules include information on agency funds, changes in statutory reserve account balances, schedule of administrative expenses, investing activity expenses, and payments to consultants. Financial Section 24 . Management’s Discussion and Analysis FINANCIAL ANALYSIS OF TRS FUNDS Pension and Other Employee Benefit Trust Funds Pension Trust Fund Net position held in trust for benefits at August 31, 2015 was $128.5 billion, a decrease of $4.3 billion from the $132.8 billion at August 31, 2014. Billions Pension Trust Fund Net Position Fiscal Years 2014-15 $140 $135 $130 $125 $120 $115 $110 1Q14 2Q14 3Q14 4Q14 1Q15 2Q15 3Q15 4Q15 FY 2014-15 Refer to the following page for a graph of Additions to Net Position. Fiscal year 2015 investment loss was $412.8 million, a decrease of $19.8 billion from the $19.4 billion gain in fiscal year 2014. Current year income from member contributions was $2.6 billion while state contributions and other additions totaled $3 billion. Total contributions and other additions increased $580.3 million, or 11.5%, during fiscal year 2015.
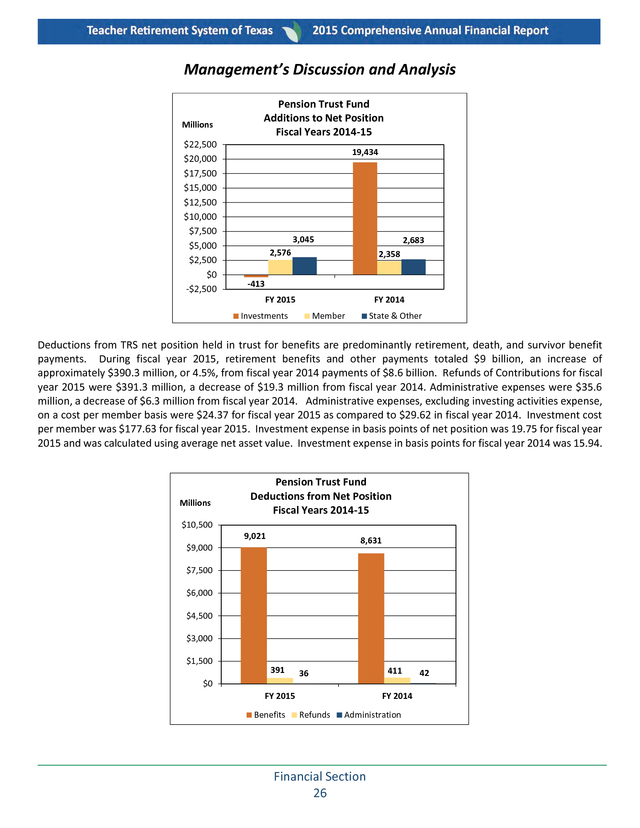
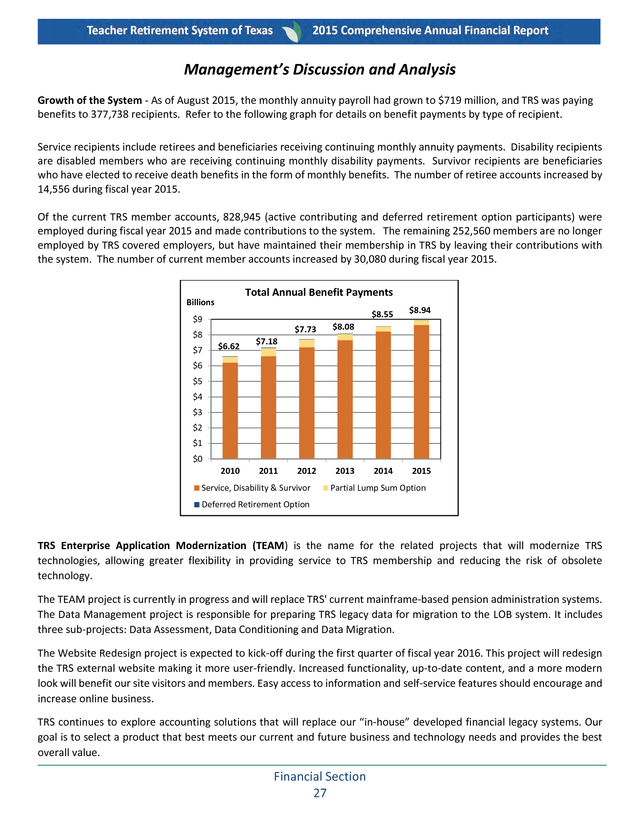
An increase in the member contribution rate from 6.4% in fiscal year 2014 to 6.7% in fiscal year 2015, the new employer surcharge for employees not covered by social security and normal payroll growth resulted in an increase in total contributions. The state contribution rate remained at 6.8% for fiscal year 2015. Financial Section 25 . Management’s Discussion and Analysis Millions $22,500 $20,000 $17,500 $15,000 $12,500 $10,000 $7,500 $5,000 $2,500 $0 -$2,500 Pension Trust Fund Additions to Net Position Fiscal Years 2014-15 19,434 3,045 2,683 2,576 2,358 FY 2015 FY 2014 -413 Investments Member State & Other Deductions from TRS net position held in trust for benefits are predominantly retirement, death, and survivor benefit payments. During fiscal year 2015, retirement benefits and other payments totaled $9 billion, an increase of approximately $390.3 million, or 4.5%, from fiscal year 2014 payments of $8.6 billion. Refunds of Contributions for fiscal year 2015 were $391.3 million, a decrease of $19.3 million from fiscal year 2014. Administrative expenses were $35.6 million, a decrease of $6.3 million from fiscal year 2014.
Administrative expenses, excluding investing activities expense, on a cost per member basis were $24.37 for fiscal year 2015 as compared to $29.62 in fiscal year 2014. Investment cost per member was $177.63 for fiscal year 2015. Investment expense in basis points of net position was 19.75 for fiscal year 2015 and was calculated using average net asset value.
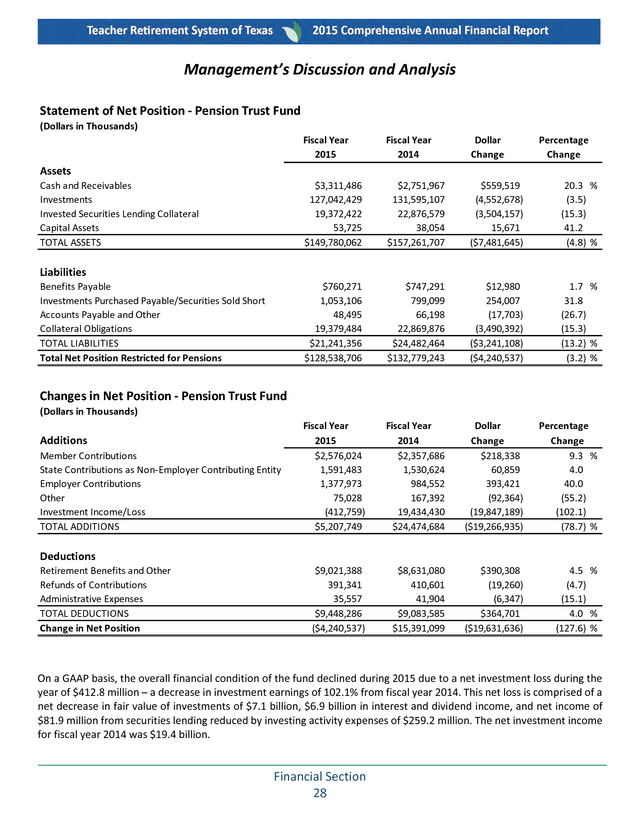
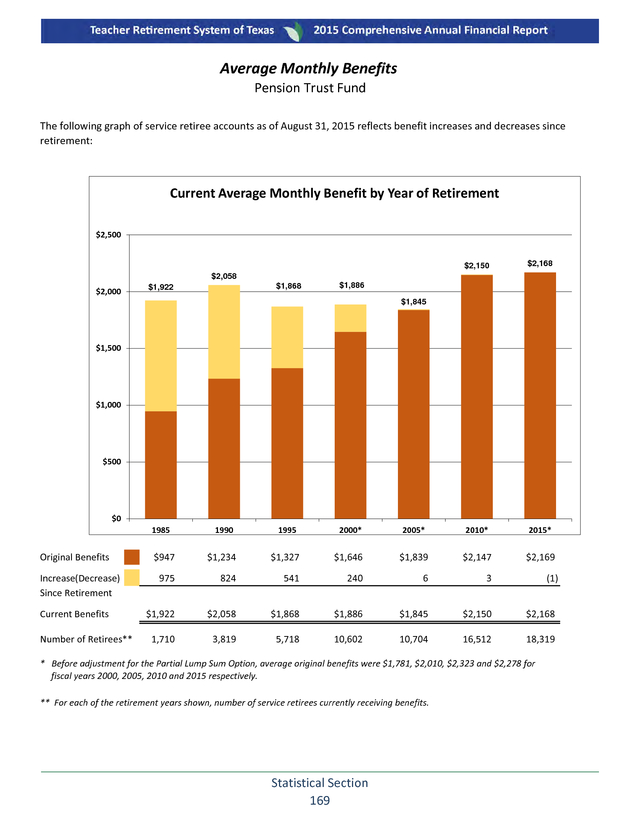
Investment expense in basis points for fiscal year 2014 was 15.94. Millions Pension Trust Fund Deductions from Net Position Fiscal Years 2014-15 $10,500 9,021 8,631 $9,000 $7,500 $6,000 $4,500 $3,000 $1,500 391 411 36 $0 FY 2015 Benefits FY 2014 Refunds Administration Financial Section 26 42 . Management’s Discussion and Analysis Growth of the System - As of August 2015, the monthly annuity payroll had grown to $719 million, and TRS was paying benefits to 377,738 recipients. Refer to the following graph for details on benefit payments by type of recipient. Service recipients include retirees and beneficiaries receiving continuing monthly annuity payments. Disability recipients are disabled members who are receiving continuing monthly disability payments. Survivor recipients are beneficiaries who have elected to receive death benefits in the form of monthly benefits.
The number of retiree accounts increased by 14,556 during fiscal year 2015. Of the current TRS member accounts, 828,945 (active contributing and deferred retirement option participants) were employed during fiscal year 2015 and made contributions to the system. The remaining 252,560 members are no longer employed by TRS covered employers, but have maintained their membership in TRS by leaving their contributions with the system. The number of current member accounts increased by 30,080 during fiscal year 2015. Total Annual Benefit Payments Billions $8.55 $9 $7.73 $8 $7 $6.62 2013 2014 2015 $8.08 2012 $8.94 $7.18 $6 $5 $4 $3 $2 $1 $0 2010 2011 Service, Disability & Survivor Partial Lump Sum Option Deferred Retirement Option TRS Enterprise Application Modernization (TEAM) is the name for the related projects that will modernize TRS technologies, allowing greater flexibility in providing service to TRS membership and reducing the risk of obsolete technology. The TEAM project is currently in progress and will replace TRS' current mainframe-based pension administration systems. The Data Management project is responsible for preparing TRS legacy data for migration to the LOB system.
It includes three sub-projects: Data Assessment, Data Conditioning and Data Migration. The Website Redesign project is expected to kick-off during the first quarter of fiscal year 2016. This project will redesign the TRS external website making it more user-friendly. Increased functionality, up-to-date content, and a more modern look will benefit our site visitors and members.
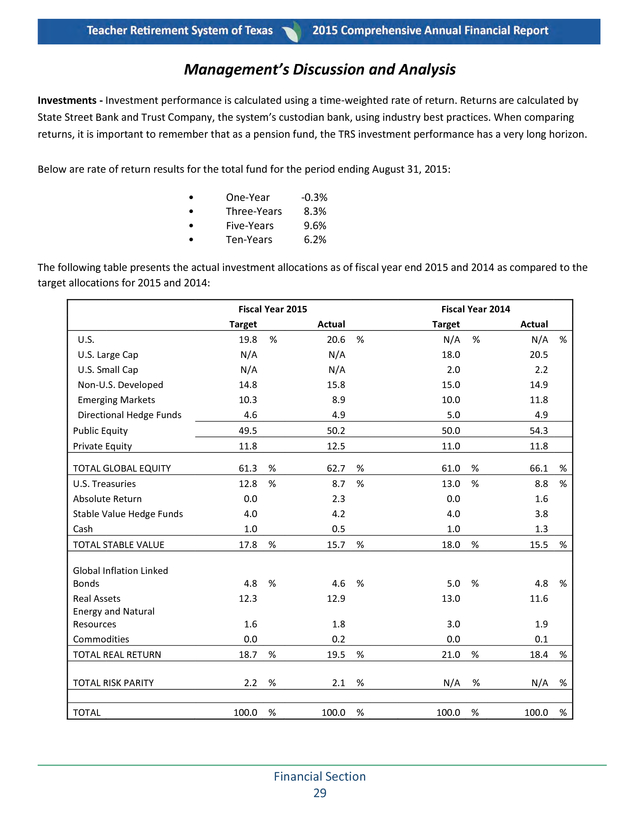
Easy access to information and self-service features should encourage and increase online business. TRS continues to explore accounting solutions that will replace our “in-house” developed financial legacy systems. Our goal is to select a product that best meets our current and future business and technology needs and provides the best overall value. Financial Section 27 . Management’s Discussion and Analysis Statement of Net Position - Pension Trust Fund (Dollars in Thousands) Fiscal Year 2015 Fiscal Year 2014 Dollar Change Percentage Change $3,311,486 127,042,429 19,372,422 53,725 $149,780,062 $2,751,967 131,595,107 22,876,579 38,054 $157,261,707 $559,519 (4,552,678) (3,504,157) 15,671 ($7,481,645) 20.3 % (3.5) (15.3) 41.2 (4.8) % $760,271 1,053,106 48,495 19,379,484 $21,241,356 $128,538,706 $747,291 799,099 66,198 22,869,876 $24,482,464 $132,779,243 $12,980 254,007 (17,703) (3,490,392) ($3,241,108) ($4,240,537) 1.7 % 31.8 (26.7) (15.3) (13.2) % (3.2) % Fiscal Year 2015 $2,576,024 1,591,483 1,377,973 75,028 (412,759) $5,207,749 Fiscal Year 2014 $2,357,686 1,530,624 984,552 167,392 19,434,430 $24,474,684 Dollar Change $218,338 60,859 393,421 (92,364) (19,847,189) ($19,266,935) Percentage Change 9.3 % 4.0 40.0 (55.2) (102.1) (78.7) % $9,021,388 391,341 35,557 $9,448,286 ($4,240,537) $8,631,080 410,601 41,904 $9,083,585 $15,391,099 $390,308 (19,260) (6,347) $364,701 ($19,631,636) 4.5 % (4.7) (15.1) 4.0 % (127.6) % Assets Cash and Receivables Investments Invested Securities Lending Collateral Capital Assets TOTAL ASSETS Liabilities Benefits Payable Investments Purchased Payable/Securities Sold Short Accounts Payable and Other Collateral Obligations TOTAL LIABILITIES Total Net Position Restricted for Pensions Changes in Net Position - Pension Trust Fund (Dollars in Thousands) Additions Member Contributions State Contributions as Non-Employer Contributing Entity Employer Contributions Other Investment Income/Loss TOTAL ADDITIONS Deductions Retirement Benefits and Other Refunds of Contributions Administrative Expenses TOTAL DEDUCTIONS Change in Net Position On a GAAP basis, the overall financial condition of the fund declined during 2015 due to a net investment loss during the year of $412.8 million – a decrease in investment earnings of 102.1% from fiscal year 2014. This net loss is comprised of a net decrease in fair value of investments of $7.1 billion, $6.9 billion in interest and dividend income, and net income of $81.9 million from securities lending reduced by investing activity expenses of $259.2 million. The net investment income for fiscal year 2014 was $19.4 billion. Financial Section 28 . Management’s Discussion and Analysis Investments - Investment performance is calculated using a time-weighted rate of return. Returns are calculated by State Street Bank and Trust Company, the system’s custodian bank, using industry best practices. When comparing returns, it is important to remember that as a pension fund, the TRS investment performance has a very long horizon. Below are rate of return results for the total fund for the period ending August 31, 2015: • • • • One-Year Three-Years Five-Years Ten-Years -0.3% 8.3% 9.6% 6.2% The following table presents the actual investment allocations as of fiscal year end 2015 and 2014 as compared to the target allocations for 2015 and 2014: U.S. U.S. Large Cap U.S.
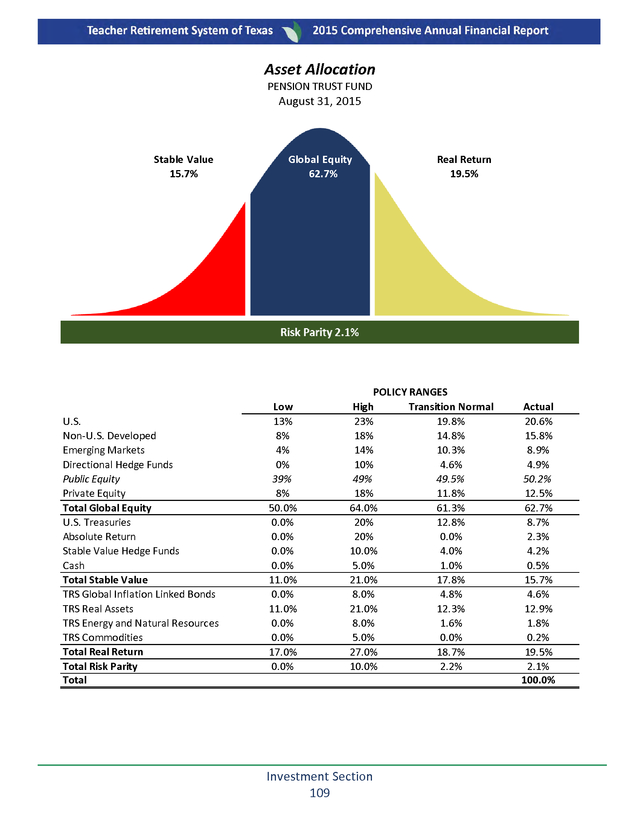
Small Cap Non-U.S. Developed Emerging Markets Directional Hedge Funds Fiscal Year 2015 Target Actual 19.8 % 20.6 N/A N/A N/A N/A 14.8 15.8 10.3 8.9 4.6 4.9 Public Equity Private Equity 49.5 11.8 TOTAL GLOBAL EQUITY U.S. Treasuries Absolute Return Stable Value Hedge Funds Cash TOTAL STABLE VALUE 61.3 12.8 0.0 4.0 1.0 17.8 % % 4.8 12.3 % Global Inflation Linked Bonds Real Assets Energy and Natural Resources Commodities TOTAL REAL RETURN TOTAL RISK PARITY TOTAL 1.6 0.0 18.7 % 50.2 12.5 % 50.0 11.0 62.7 8.7 2.3 4.2 0.5 15.7 % % 4.6 12.9 % % 1.8 0.2 19.5 2.2 % 100.0 % Fiscal Year 2014 Target Actual N/A % N/A 18.0 20.5 2.0 2.2 15.0 14.9 10.0 11.8 5.0 4.9 % % % 5.0 13.0 % % 2.1 % 100.0 % Financial Section 29 54.3 11.8 61.0 13.0 0.0 4.0 1.0 18.0 3.0 0.0 21.0 % % 66.1 8.8 1.6 3.8 1.3 15.5 % % 4.8 11.6 % % % 1.9 0.1 18.4 % N/A % N/A % 100.0 % 100.0 % .
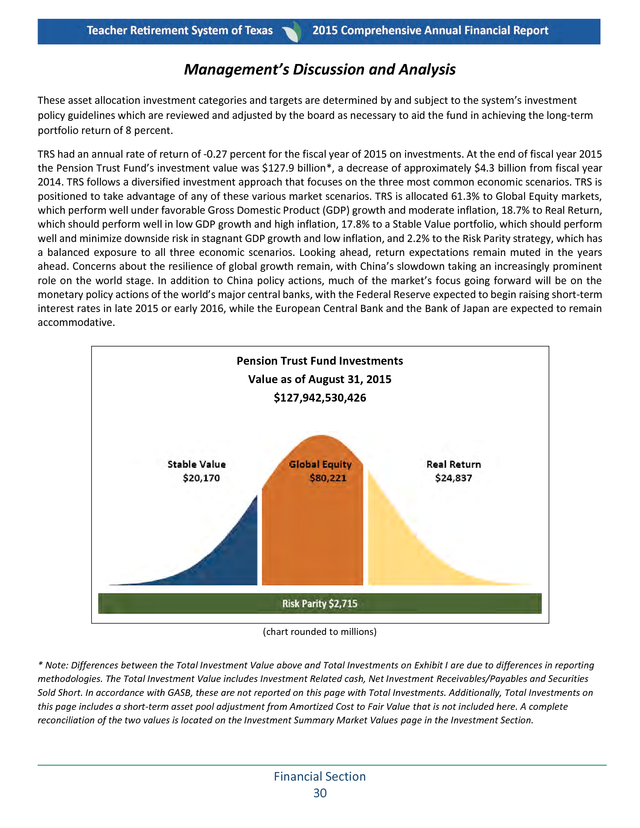
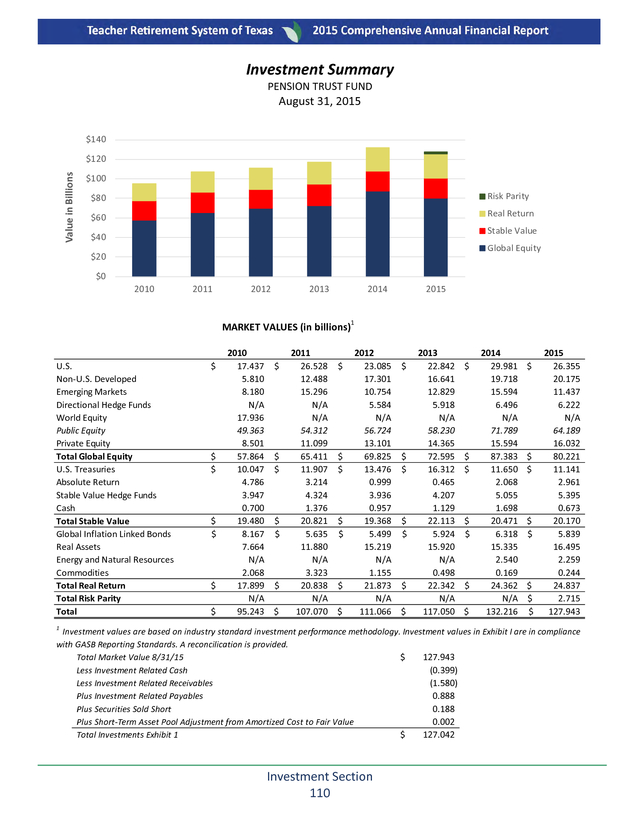
Management’s Discussion and Analysis These asset allocation investment categories and targets are determined by and subject to the system’s investment policy guidelines which are reviewed and adjusted by the board as necessary to aid the fund in achieving the long-term portfolio return of 8 percent. TRS had an annual rate of return of -0.27 percent for the fiscal year of 2015 on investments. At the end of fiscal year 2015 the Pension Trust Fund’s investment value was $127.9 billion*, a decrease of approximately $4.3 billion from fiscal year 2014. TRS follows a diversified investment approach that focuses on the three most common economic scenarios. TRS is positioned to take advantage of any of these various market scenarios.
TRS is allocated 61.3% to Global Equity markets, which perform well under favorable Gross Domestic Product (GDP) growth and moderate inflation, 18.7% to Real Return, which should perform well in low GDP growth and high inflation, 17.8% to a Stable Value portfolio, which should perform well and minimize downside risk in stagnant GDP growth and low inflation, and 2.2% to the Risk Parity strategy, which has a balanced exposure to all three economic scenarios. Looking ahead, return expectations remain muted in the years ahead. Concerns about the resilience of global growth remain, with China’s slowdown taking an increasingly prominent role on the world stage.
In addition to China policy actions, much of the market’s focus going forward will be on the monetary policy actions of the world’s major central banks, with the Federal Reserve expected to begin raising short-term interest rates in late 2015 or early 2016, while the European Central Bank and the Bank of Japan are expected to remain accommodative. Pension Trust Fund Investments Value as of August 31, 2015 $127,942,530,426 (chart rounded to millions) * Note: Differences between the Total Investment Value above and Total Investments on Exhibit I are due to differences in reporting methodologies. The Total Investment Value includes Investment Related cash, Net Investment Receivables/Payables and Securities Sold Short. In accordance with GASB, these are not reported on this page with Total Investments.
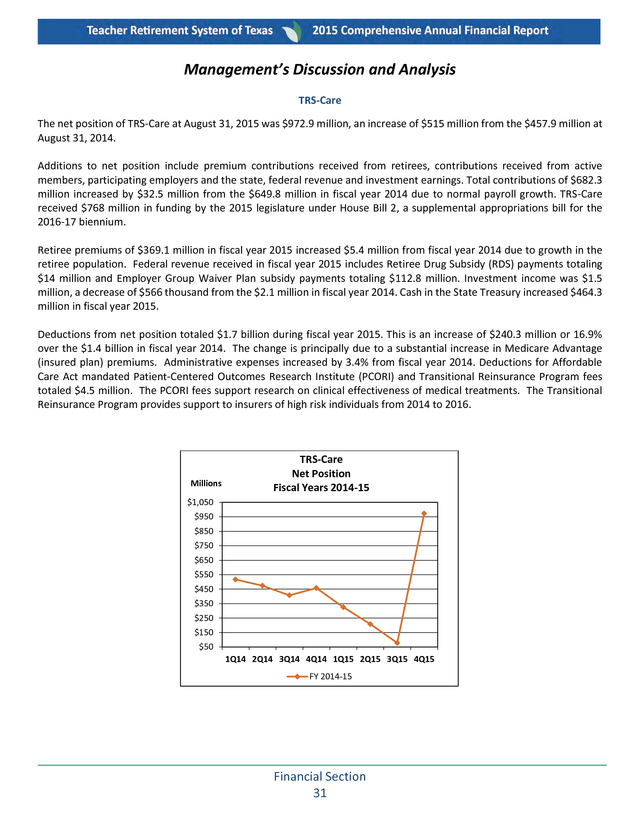
Additionally, Total Investments on this page includes a short-term asset pool adjustment from Amortized Cost to Fair Value that is not included here. A complete reconciliation of the two values is located on the Investment Summary Market Values page in the Investment Section. Financial Section 30 . Management’s Discussion and Analysis TRS-Care The net position of TRS-Care at August 31, 2015 was $972.9 million, an increase of $515 million from the $457.9 million at August 31, 2014. Additions to net position include premium contributions received from retirees, contributions received from active members, participating employers and the state, federal revenue and investment earnings. Total contributions of $682.3 million increased by $32.5 million from the $649.8 million in fiscal year 2014 due to normal payroll growth. TRS-Care received $768 million in funding by the 2015 legislature under House Bill 2, a supplemental appropriations bill for the 2016-17 biennium. Retiree premiums of $369.1 million in fiscal year 2015 increased $5.4 million from fiscal year 2014 due to growth in the retiree population. Federal revenue received in fiscal year 2015 includes Retiree Drug Subsidy (RDS) payments totaling $14 million and Employer Group Waiver Plan subsidy payments totaling $112.8 million.
Investment income was $1.5 million, a decrease of $566 thousand from the $2.1 million in fiscal year 2014. Cash in the State Treasury increased $464.3 million in fiscal year 2015. Deductions from net position totaled $1.7 billion during fiscal year 2015. This is an increase of $240.3 million or 16.9% over the $1.4 billion in fiscal year 2014.
The change is principally due to a substantial increase in Medicare Advantage (insured plan) premiums. Administrative expenses increased by 3.4% from fiscal year 2014. Deductions for Affordable Care Act mandated Patient-Centered Outcomes Research Institute (PCORI) and Transitional Reinsurance Program fees totaled $4.5 million.
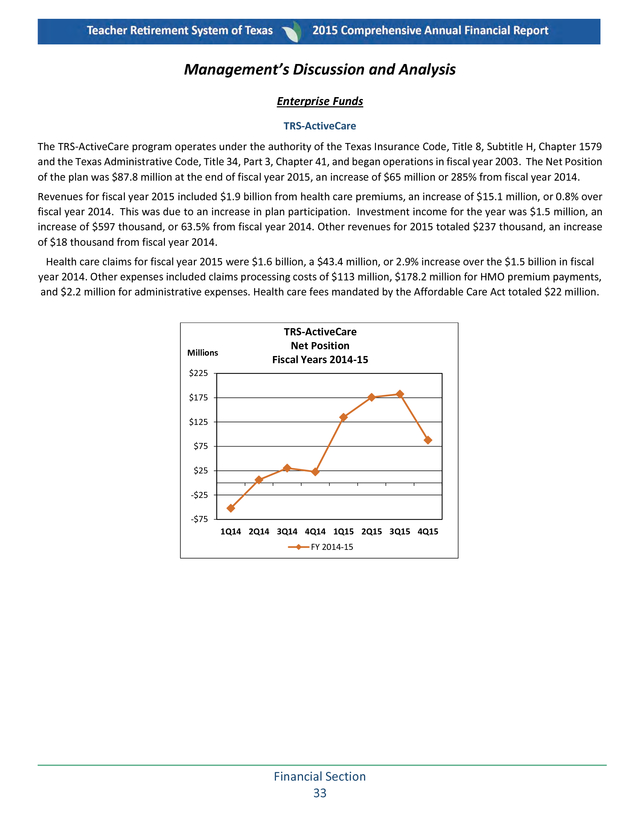
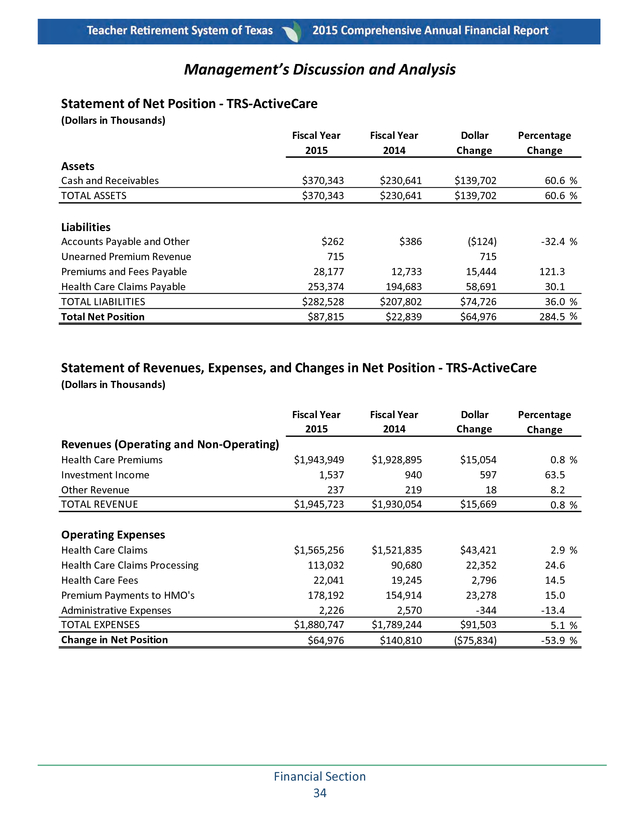
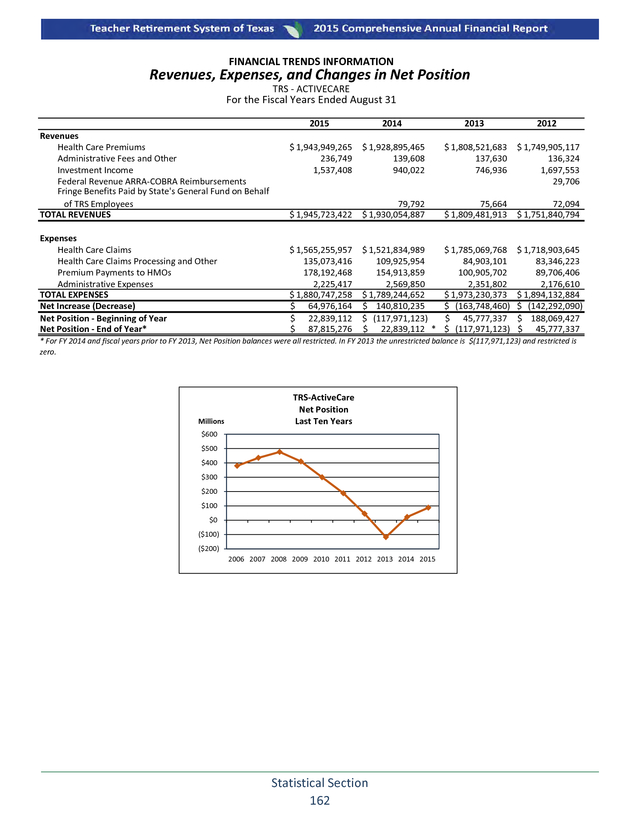
The PCORI fees support research on clinical effectiveness of medical treatments. The Transitional Reinsurance Program provides support to insurers of high risk individuals from 2014 to 2016. Millions TRS-Care Net Position Fiscal Years 2014-15 $1,050 $950 $850 $750 $650 $550 $450 $350 $250 $150 $50 1Q14 2Q14 3Q14 4Q14 1Q15 2Q15 3Q15 4Q15 FY 2014-15 Financial Section 31 . Management’s Discussion and Analysis Statement of Net Position - TRS-Care (Dollars in Thousands) Fiscal Year 2015 Fiscal Year 2014 Dollar Change Percentage Change Assets Cash and Receivables TOTAL ASSETS $1,134,174 $1,134,174 $594,921 $594,921 $539,253 $539,253 90.6 % 90.6 % $2,651 158,604 $161,255 $972,919 $770 136,211 $136,981 $457,940 $1,881 22,393 $24,274 $514,979 244.3 % 16.4 17.7 % 112.5 % Liabilities Accounts Payables and Other Health Care Claims Payables TOTAL LIABILITIES Total Net Position Changes in Net Position - TRS-Care (Dollars in Thousands) Fiscal Year 2015 Fiscal Year 2014 Dollar Change Percentage Change Additions Member Contributions State Contributions Participating Employers and Other Contributions Health Care Premiums Rebates and Discount Income Federal Revenue Investment Income Supplemental Appropriation from State TOTAL ADDITIONS $198,196 281,098 $189,004 267,498 $9,192 13,600 4.9 % 5.1 202,977 369,066 231,569 126,807 1,496 768,101 $2,179,310 193,264 363,631 200,860 78,589 2,062 36,058 $1,330,966 9,713 5,435 30,709 48,218 (566) 732,043 $848,344 5.0 1.5 15.3 61.4 (27.4) 2,030.2 63.7 % $1,613,181 42,873 4,508 3,769 $1,664,331 $514,979 $1,375,040 41,912 3,476 3,646 $1,424,074 ($93,108) $238,141 961 1,032 123 $240,257 $608,087 17.3 % 2.3 29.7 3.4 16.9 % 653.1 % Deductions Health Care / Insurance Premium and Payments Health Care Claims Processing Health Care Fees Administrative Expenses TOTAL DEDUCTIONS Change in Net Position Financial Section 32 . Management’s Discussion and Analysis Enterprise Funds TRS-ActiveCare The TRS-ActiveCare program operates under the authority of the Texas Insurance Code, Title 8, Subtitle H, Chapter 1579 and the Texas Administrative Code, Title 34, Part 3, Chapter 41, and began operations in fiscal year 2003. The Net Position of the plan was $87.8 million at the end of fiscal year 2015, an increase of $65 million or 285% from fiscal year 2014. Revenues for fiscal year 2015 included $1.9 billion from health care premiums, an increase of $15.1 million, or 0.8% over fiscal year 2014. This was due to an increase in plan participation. Investment income for the year was $1.5 million, an increase of $597 thousand, or 63.5% from fiscal year 2014.
Other revenues for 2015 totaled $237 thousand, an increase of $18 thousand from fiscal year 2014. Health care claims for fiscal year 2015 were $1.6 billion, a $43.4 million, or 2.9% increase over the $1.5 billion in fiscal year 2014. Other expenses included claims processing costs of $113 million, $178.2 million for HMO premium payments, and $2.2 million for administrative expenses. Health care fees mandated by the Affordable Care Act totaled $22 million. Millions TRS-ActiveCare Net Position Fiscal Years 2014-15 $225 $175 $125 $75 $25 -$25 -$75 1Q14 2Q14 3Q14 4Q14 1Q15 2Q15 3Q15 4Q15 FY 2014-15 Financial Section 33 .
Management’s Discussion and Analysis Statement of Net Position - TRS-ActiveCare (Dollars in Thousands) Fiscal Year 2015 Fiscal Year 2014 Dollar Change Percentage Change Assets Cash and Receivables TOTAL ASSETS $370,343 $370,343 $230,641 $230,641 $139,702 $139,702 60.6 % 60.6 % $262 715 28,177 253,374 $282,528 $87,815 $386 ($124) 715 15,444 58,691 $74,726 $64,976 -32.4 % Liabilities Accounts Payable and Other Unearned Premium Revenue Premiums and Fees Payable Health Care Claims Payable TOTAL LIABILITIES Total Net Position 12,733 194,683 $207,802 $22,839 121.3 30.1 36.0 % 284.5 % Statement of Revenues, Expenses, and Changes in Net Position - TRS-ActiveCare (Dollars in Thousands) Fiscal Year 2015 Fiscal Year 2014 Dollar Change Percentage Change $1,943,949 1,537 237 $1,945,723 $1,928,895 940 219 $1,930,054 $15,054 597 18 $15,669 0.8 % 63.5 8.2 0.8 % $1,565,256 113,032 22,041 178,192 2,226 $1,880,747 $64,976 $1,521,835 90,680 19,245 154,914 2,570 $1,789,244 $140,810 $43,421 22,352 2,796 23,278 -344 $91,503 ($75,834) 2.9 % 24.6 14.5 15.0 -13.4 5.1 % -53.9 % Revenues (Operating and Non-Operating) Health Care Premiums Investment Income Other Revenue TOTAL REVENUE Operating Expenses Health Care Claims Health Care Claims Processing Health Care Fees Premium Payments to HMO's Administrative Expenses TOTAL EXPENSES Change in Net Position Financial Section 34 . Management’s Discussion and Analysis REQUEST FOR INFORMATION This financial report is designed to provide a general overview of the Teacher Retirement System for those with an interest in the system’s finances. Questions concerning any of the information provided in this report or requests for additional information should be addressed to the Communications Department of the Teacher Retirement System, 1000 Red River Street, Austin, Texas 78701. Please also refer to our website at www.trs.texas.gov. Financial Section 35 . Statement of Fiduciary Net Position AS OF AUGUST 31, 2015 (With Comparative Data for August 31, 2014) Fiduciary Fund Types Pension and Other Employee Benefit Trust Funds Exhibit I Pension Trust Fund ASSETS Cash Cash in State Treasury Cash in Bank (Note 3A) Cash on Hand (Note 3B) TOTAL CASH $ Invested Securities Lending Collateral Capital Assets (Note 2) Intangible Assets Less Accumulated Amortization Depreciable Assets Less Accumulated Depreciation Non-Depreciable Assets TOTAL CAPITAL ASSETS TOTAL ASSETS 967,123,065 398,825,412 3,087,674 1,369,036,151 $ 860,109,505 $ 860,109,505 1,364,937,789 214,892,040 1,117,028 26,393,340 204,844,527 128,204,905 1,711,632 66,819 281,662 1,942,449,742 $ $ $ 3,373,532,192 86,385 47,167,558,671 21,563,259,009 48,186,507,871 65,340,265 6,686,145,072 127,042,429,465 $ 0 $ 19,372,421,460 $ 0 $ 10,569,751 (9,499,614) 55,987,505 (30,368,999) 27,036,363 53,725,006 149,780,061,824 $ $ Receivables (Note 1F) Sale of Investments Interest and Dividends Member and Retiree Service Credit Purchases Participating Employers Due from State's General Fund Due from Employees Retirement System of Texas Prepaid Expenses and Deposits Other TOTAL RECEIVABLES Investments (Note 1F and 3E) Short-Term Short-Term Foreign Currency Contracts Equities Fixed Income Alternative Investments Derivative Investments Pooled Investments TOTAL INVESTMENTS TRS-Care $ $ $ $ $ Financial Section 36 317,174 47,103,564 10,836,320 33,566,874 $ $ $ 182,240,712 274,064,644 0 1,134,174,149 . Fiduciary Fund Types Total Pension and Other Employee Benefit Trust Funds 2015 $ 2014 1,827,232,570 398,825,412 3,087,674 2,229,145,656 $ 1,364,937,789 215,209,214 48,220,592 26,393,340 215,680,847 161,771,779 1,711,632 66,819 182,522,374 2,216,514,386 $ $ $ 3,373,532,192 86,385 47,167,558,671 21,563,259,009 48,186,507,871 65,340,265 6,686,145,072 127,042,429,465 $ $ $ $ $ $ $ $ $ $ Agency Funds Child Support Employee Deductions 1,332,743,714 297,354,404 2,526,510 1,632,624,628 $ 6,599 $ 6,599 949,152,042 217,654,084 45,422,289 42,096,484 204,151,629 129,084,870 1,540,855 $ 125,162,030 1,714,264,283 $ 0 $ $ 3,932,153,291 (37,174) 52,316,260,451 23,475,157,395 44,345,750,419 93,701,725 7,432,120,860 131,595,106,967 $ 0 19,372,421,460 $ 22,876,578,455 $ 0 10,569,751 (9,499,614) 55,987,505 (30,368,999) 27,036,363 53,725,006 150,914,235,973 $ 10,159,743 (8,968,661) 53,814,541 (27,444,410) 10,493,166 38,054,379 157,856,628,712 $ $ $ $ 0 $ 6,599 (to next page) Financial Section 37 . Statement of Fiduciary Net Position AS OF AUGUST 31, 2015 (With Comparative Data for August 31, 2014) Fiduciary Fund Types Pension and Other Employee Benefit Trust Funds Exhibit I (Concluded) Pension Trust Fund LIABILITIES (Note 1F) Accounts Payable Payroll Payable External Manager Fees Payable Benefits Payable Health Care Claims Payable Investments Purchased Payable Securities Sold Short Collateral Obligations Due to Employees Retirement System of Texas Employee Compensable Absences Payable (Note 4) Unrealized Lease Incentives Funds Held for Others TOTAL LIABILITIES NET POSITION Net Investment in Capital Assets Restricted for Pensions/Other Employee Benefits NET POSITION RESTRICTED FOR PENSIONS AND OTHER EMPLOYEE BENEFITS $ 5,185,910 5,005,826 23,235,445 760,271,035 TRS-Care $ 2,087,258 248,231 158,604,093 865,498,021 187,607,731 19,379,483,580 7,065,544 7,729,025 273,495 315,327 $ 21,241,355,612 $ $ 53,725,006 128,484,981,206 $ 128,538,706,212 $ $ 972,919,240 The accompanying Notes to the Financial Statements are an integral part of this financial statement. Financial Section 38 161,254,909 972,919,240 . Fiduciary Fund Types Total Pension and Other Employee Benefit Trust Funds 2015 2014 Agency Funds Child Support Employee Deductions $ 7,273,168 5,254,057 23,235,445 760,271,035 158,604,093 865,498,021 187,607,731 19,379,483,580 7,065,544 8,044,352 273,495 $ 9,741,611 4,610,218 38,222,531 747,290,981 136,210,995 646,945,719 152,153,586 22,869,875,747 6,845,375 7,306,238 242,139 $ $ 21,402,610,521 $ 24,619,445,140 $ $ 53,725,006 129,457,900,446 $ 38,054,379 133,199,129,193 $ $ 129,511,625,452 $ 133,237,183,572 $ 6,599 6,599 0 Financial Section 39 . Statement of Changes in Fiduciary Net Position FOR THE FISCAL YEAR ENDED AUGUST 31, 2015 (With Comparative Data for August 31, 2014) Pension and Other Employee Benefit Trust Funds Pension Trust Fund TRS-Care Exhibit II ADDITIONS Contributions Member State's General Fund - Non-Employer Contributing Entity Employer State's General Fund Participating Employer Contributions Surcharges Employment after Retirement-Employee Employment after Retirement-Employer Non-OASDI Participating Employers Purchase of Service Credit-Refundable Purchase of Service Credit - Non-Refundable State Contributions for 415 Excess Benefit Arrangement Employees Retirement System of Texas: For Service Contributions For 415 Excess Benefit Arrangement Health Care Premiums Federal Revenue (Note 6) Rebate and Discount Income Supplemental Appropriation from State Paid by State's General Fund on Behalf of TRS Employees (Note 6) TOTAL CONTRIBUTIONS AND PREMIUMS Investment Income From Investing Activities: Net Increase/(Decrease) in Fair Value of Investments Interest Dividends Total Investing Activities Income/(Loss) Less: Investing Activity Expenses (Schedule 3) Net Income/(Loss) from Investing Activities From Securities Lending Activities: Securities Lending Income Securities Lending Expenses: Borrower Rebates Management Fees Net Income from Securities Lending Activities TOTAL NET INVESTMENT INCOME/(LOSS) Other Additions Miscellaneous Revenue $ 2,576,024,311 1,591,482,988 $ 93,079,033 924,216,283 198,196,273 281,098,358 191,517,780 7,481,714 8,339,748 344,855,875 23,508,475 26,580,631 2,151,359 11,458,690 18,989,008 65,227 369,066,459 126,806,652 231,569,472 768,100,754 $ 5,616,774,652 $ $ (7,107,642,634) 623,717,202 6,248,497,146 (235,428,286) (259,203,853) (494,632,139) $ $ $ 2,177,814,438 1,495,680 $ 1,495,680 $ 1,495,680 $ 120,970,871 $ $ $ (30,143,454) (8,954,378) 81,873,039 (412,759,100) $ $ 0 1,495,680 Financial Section 40 3,733,133 $ 0 $ TOTAL ADDITIONS $ 5,207,748,685 $ 2,179,310,118 . Pension and Other Employee Benefit Trust Funds 2015 $ 2,774,220,584 1,872,581,346 2014 $ 2,546,689,903 1,798,121,739 93,079,033 1,115,734,063 120,206,921 1,035,151,832 7,481,714 19,798,438 344,855,875 23,508,475 26,580,631 2,151,359 6,247,139 16,071,271 18,989,008 65,227 369,066,459 126,806,652 231,569,472 768,100,754 17,440,313 71,240 363,631,292 78,589,415 200,859,859 36,058,148 $ 7,794,589,090 $ 139,422 6,365,015,177 $ (7,107,642,634) 625,212,882 6,248,497,146 (233,932,606) (259,203,853) (493,136,459) $ $ $ $ 120,970,871 $ $ (30,143,454) (8,954,378) 81,873,039 (411,263,420) 67,386,116 76,147,975 2,202,592 $ $ $ $ $ 16,443,655,756 1,866,157,795 1,254,816,385 19,564,629,936 (200,672,176) 19,363,957,760 122,114,760 (17,464,911) (32,115,830) 72,534,019 19,436,491,779 $ 3,733,133 $ 4,143,449 $ 7,387,058,803 $ 25,805,650,405 (to next page) Financial Section 41 . Statement of Changes in Fiduciary Net Position FOR THE FISCAL YEAR ENDED AUGUST 31, 2015 (With Comparative Data for August 31, 2014) Pension and Other Employee Benefit Trust Funds Exhibit II (Concluded) Pension Trust Fund DEDUCTIONS Benefits Refunds of Contributions - Active Refunds of Contributions - Death 415 Excess Benefit Arrangement Benefits Paid to Employees Retirement System of Texas: For Service Contributions For 415 Excess Benefit Arrangement Health Care Claims and Insurance Premium Payments Health Care Claims Processing Patient-Centered Outcomes Research Institute Fee Transitional Reinsurance Fee Administrative Expenses, Excluding Investing Activity Expenses: Salaries and Wages Payroll Related Costs Professional Fees and Services Travel Materials and Supplies Communications and Utilities Repairs and Maintenance Rentals and Leases Printing and Reproduction Depreciation Expense Amortization Expense Loss on Capital Asset Other Expense $ 8,935,111,459 385,866,706 5,474,475 1,929,315 TRS-Care $ 84,059,353 287,271 1,613,181,278 42,872,769 337,148 4,170,490 20,963,938 6,861,911 369,886 93,414 2,256,166 132,364 1,988,978 187,193 69,353 1,641,856 530,953 2,414,400 486,829 731,307 7,698 41,646 2,212 460,967 18,348 54,490 12,750 TOTAL DEDUCTIONS $ 9,448,285,558 $ 1,664,331,365 Net Increase (Decrease) in Net Position $ (4,240,536,873) $ 514,978,753 NET POSITION: RESTRICTED FOR PENSIONS/OTHER EMPLOYEE BENEFITS - BEGINNING OF YEAR $ 132,779,243,085 $ 457,940,487 NET POSITION: RESTRICTED FOR PENSIONS/OTHER EMPLOYEE BENEFITS - END OF YEAR $ 128,538,706,212 $ 972,919,240 The accompanying Notes to the Financial Statements are an integral part of this financial statement. Financial Section 42 . Pension and Other Employee Benefit Trust Funds 2015 $ 8,935,111,459 385,866,706 5,474,475 1,929,315 2014 $ 8,548,642,525 405,144,490 5,455,829 1,971,677 84,059,353 287,271 1,613,181,278 42,872,769 337,148 4,170,490 80,163,847 302,155 1,375,039,945 41,911,930 475,839 3,000,000 23,378,338 7,348,740 1,101,193 101,112 2,297,812 134,576 1,988,978 241,683 82,103 1,641,856 530,953 21,331,482 8,199,006 5,912,940 193,398 2,672,698 270,011 3,880,469 199,021 149,769 1,868,689 428,434 23,994 420,825 479,315 $ 11,112,616,923 $ 10,507,658,973 $ (3,725,558,120) $ 15,297,991,432 $ 133,237,183,572 $ 117,939,192,140 $ 129,511,625,452 $ 133,237,183,572 Financial Section 43 . Statement of Net Position PROPRIETARY FUNDS AS OF AUGUST 31, 2015 (With Comparative Data for August 31, 2014) Enterprise Funds Major Fund Non-Major Fund TRS-ActiveCare Exhibit III ASSETS Current Assets Cash Cash In State Treasury 403(b) Administrative Program $ 370,204,982 $ 307,266 138,076 $ 107 $ $ LIABILITIES (Note 1F) Current Liabilities Accounts Payable Payroll Payable Unearned Premium Revenue Fees Payable Premiums Payable to HMOs Health Care Claims Payable Employee Compensable Absences Payable (Note 4) TOTAL CURRENT LIABILITIES 307,266 $ Receivables Interest Health Care Premiums TOTAL RECEIVABLES TOTAL ASSETS $ $ TOTAL CASH 370,204,982 138,076 370,343,058 $ $ 107 307,373 $ $ 370 6,168 $ 1,496 120,506 714,480 13,508,000 14,669,296 253,374,387 100,022 282,488,187 $ $ $ $ $ 0 8,303 87,815,276 $ $ NET POSITION Restricted for Health Care Programs Restricted for Administrative Expenses TOTAL NET POSITION 39,595 39,595 282,527,782 $ Non-Current Liabilities Employee Compensable Absences Payable (Note 4) TOTAL NON-CURRENT LIABILITIES TOTAL LIABILITIES $ 1,765 8,303 87,815,276 $ The accompanying Notes to the Financial Statements are an integral part of this financial statement. Financial Section 44 299,070 299,070 . Total Enterprise Funds 2015 2014 $ 370,512,248 $ 230,331,707 $ 370,512,248 $ 230,331,707 $ 138,183 0 138,183 370,650,431 $ 75,182 576,694 651,876 230,983,583 $ $ 1,866 126,674 714,480 13,508,000 14,669,296 253,374,387 101,787 282,496,490 $ 18,800,000 12,733,152 175,883,104 105,757 207,763,970 $ $ $ 39,595 39,595 282,536,085 $ $ $ 52,345 52,345 207,816,315 $ 87,815,276 299,070 88,114,346 $ 22,839,112 328,156 23,167,268 $ $ $ $ $ $ $ 128,338 113,619 Financial Section 45 . Statement of Revenues, Expenses and Changes in Net Position PROPRIETARY FUNDS FOR THE FISCAL YEAR ENDED AUGUST 31, 2015 (With Comparative Data for August 31, 2014) Enterprise Funds Major Fund Non-major Fund Exhibit IV TRS-ActiveCare OPERATING REVENUES Health Care Premiums Administrative Fees Certification Fees Product Registration Fees TOTAL OPERATING REVENUES OPERATING EXPENSES Health Care Claims Health Care Claims Processing Premium Payments to HMOs Patient-Centered Outcomes Research Institute Fees Transitional Reinsurance Fee Administrative Expenses: Salaries and Wages Payroll Related Costs Professional Fees and Services Travel Materials and Supplies Communications and Utilities Repairs and Maintenance Rentals and Leases Other Operating Expense TOTAL EXPENDITURES TOTAL OPERATING EXPENSES $ 1,943,949,265 141,534 403(b) Administrative Program $ $ 1,944,090,799 $ $ 1,565,255,957 113,032,001 178,192,468 939,522 21,101,894 27,000 21,000 48,000 $ 1,161,112 214,416 782,921 6,779 943 1,056 250 56,668 1,271 71,954 6,492 $ 1,880,747,258 $ 78,446 $ 63,343,541 $ (30,446) $ 1,537,408 95,215 $ 1,360 $ 1,632,623 $ 1,360 Change in Net Position $ 64,976,164 $ (29,086) TOTAL NET POSITION - BEGINNING OF YEAR $ 22,839,112 $ 328,156 TOTAL NET POSITION - END OF YEAR $ 87,815,276 $ 299,070 OPERATING INCOME (LOSS) NON-OPERATING REVENUE Investment Income Other Non-operating Revenue Fringe Benefits Paid by State's General Fund on Behalf of TRS Employees (Note 6) TOTAL NON-OPERATING REVENUES The accompanying Notes to the Financial Statements are an integral part of this financial statement. Financial Section 46 . Total Enterprise Funds 2015 $ $ $ 2014 1,943,949,265 141,534 27,000 21,000 1,944,138,799 $ 1,565,255,957 113,032,001 178,192,468 939,522 21,101,894 $ $ 1,233,066 220,908 782,921 6,779 943 1,056 250 56,668 1,271 1,928,895,465 139,608 15,000 15,000 1,929,065,073 1,521,834,989 90,680,328 154,913,859 1,245,626 18,000,000 1,211,715 336,450 1,020,179 8,230 2,913 771 0 46,684 5,544 $ 1,880,825,704 $ 1,789,307,288 $ 63,313,095 $ 139,757,785 $ 1,538,768 95,215 $ 941,346 $ 1,633,983 $ 82,923 1,024,269 $ 64,947,078 $ 140,782,054 $ 23,167,268 $ (117,614,786) $ 88,114,346 $ 23,167,268 Financial Section 47 . Statement of Cash Flows PROPRIETARY FUNDS FOR THE FISCAL YEAR ENDED AUGUST 31, 2015 (With Comparative Data for August 31, 2014) Enterprise Funds Major Fund Exhibit V TRS-ActiveCare CASH FLOWS FROM OPERATING ACTIVITIES Receipts from Health Care Premiums Receipts from Long-Term Care Administrative Fees Receipts from Certification/Product Registration Fees Payments for Administrative Expenses Payments for Health Care Claims Payments for Health Care Claims Processing Payments for HMO Premiums Payments for Affordable Care Act Fees NET CASH PROVIDED (USED) BY OPERATING ACTIVITIES CASH FLOWS FROM NON-CAPITAL FINANCING ACTIVITIES Proceeds from Other Non-Operating Revenue $ 1,945,240,439 141,534 Non-major Fund 403(b) Administrative Program $ 48,000 (84,122) (2,349,876) (1,487,764,675) (113,032,001) (176,256,324) (27,333,416) $ 138,645,681 $ 95,215 $ 95,215 $ 0 $ 1,474,411 $ 1,356 $ 1,474,411 $ 1,356 Net Increase (Decrease) in Cash $ 140,215,307 $ (34,766) CASH AND CASH EQUIVALENTS - SEPTEMBER 1 $ 229,989,675 $ 342,032 CASH AND CASH EQUIVALENTS - AUGUST 31 $ 370,204,982 $ 307,266 $ 63,343,541 $ (30,446) $ 1,291,174 1,936,144 77,491,282 (5,292,000) (126,841) 10,934 (8,553) $ 75,302,140 $ (5,676) NET CASH PROVIDED (USED) BY OPERATING ACTIVITIES $ 138,645,681 $ The accompanying Notes to the Financial Statements are an integral part of this financial statement. * During 2015, $18,800,000 was reclassified from Health Care Claims Payable to Fees Payable for 2014. (36,122) NET CASH PROVIDED BY NON-CAPITAL FINANCING ACTIVITIES CASH FLOWS FROM INVESTING ACTIVITIES Interest Received NET CASH PROVIDED BY INVESTING ACTIVITIES $ (36,122) RECONCILIATION OF OPERATING INCOME (LOSS) TO NET CASH PROVIDED (USED) BY OPERATING ACTIVITIES Operating Income (Loss) Adjustments to Reconcile Operating Income (Loss) to Net Cash Provided (Used) by Operating Activities: Changes in Assets & Liabilities: Decrease in Health Care Premiums Receivable/ Unearned Premium Revenue Increase in Premiums Payable to HMOs Increase (Decrease) in Health Care Claims Payable* (Decrease) in Affordable Care Act Fees Payable* Increase (Decrease) in Accounts Payable Increase (Decrease) in Payroll Payable Increase (Decrease) in Employee Compensable Absences Payable NonCash Transactions: Proceeds from Fringe Benefits Paid by the State's General Fund on Behalf of TRS Employees Total Adjustments $ Financial Section 48 370 2,121 (8,167) . Total Enterprise Funds 2015 $ 2014 1,945,240,439 141,534 48,000 (2,433,998) (1,487,764,675) (113,032,001) (176,256,324) (27,333,416) $ 2,020,390,239 139,608 30,000 (2,587,879) (1,575,470,963) (90,680,328) (150,691,609) (19,245,626) $ 138,609,559 $ 181,883,442 $ 95,215 $ 0 $ 95,215 $ 0 $ 1,475,767 $ 892,291 $ 1,475,767 $ 892,291 $ 140,180,541 $ 182,775,733 $ 230,331,707 $ 47,555,974 $ 370,512,248 $ 230,331,707 $ 63,313,095 $ 139,757,785 $ 1,291,174 1,936,144 77,491,282 (5,292,000) (126,471) 13,055 (16,720) $ 91,494,774 4,222,250 (34,835,974) (18,800,000) (27,426) (12,899) 2,009 0 82,923 $ 75,296,464 $ 42,125,657 $ 138,609,559 $ 181,883,442 Financial Section 49 . Notes to the Financial Statements TABLE OF CONTENTS NOTE 1: SUMMARY OF SIGNIFICANT ACCOUNTING POLICIES............................................................................................. 51 NOTE 2: CAPITAL ASSETS...................................................................................................................................................... 57 NOTE 3: DEPOSITS AND INVESTMENTS ............................................................................................................................... 59 NOTE 4: EMPLOYEE COMPENSABLE LEAVE .........................................................................................................................
72 NOTE 5: OPERATING LEASES ................................................................................................................................................ 73 NOTE 6: FRINGE BENEFITS PAID BY THE STATE OF TEXAS AND THE FEDERAL GOVERNMENT............................................ 73 NOTE 7: DEFERRED COMPENSATION ...................................................................................................................................
73 NOTE 8: CONTINGENT LIABILITIES ....................................................................................................................................... 73 NOTE 9: CONTINUANCE SUBJECT TO REVIEW ..................................................................................................................... 74 NOTE 10: POST-EMPLOYMENT HEALTH CARE BENEFITS .....................................................................................................
74 NOTE 11: RISK MANAGEMENT ............................................................................................................................................. 78 NOTE 12: PENSION DISCLOSURE .......................................................................................................................................... 78 NOTE 13: SUBSEQUENT EVENTS ..........................................................................................................................................
83 Financial Section 50 . Notes to the Financial Statements NOTE 1: SUMMARY OF SIGNIFICANT ACCOUNTING POLICIES A. REPORTING ENTITY The Teacher Retirement System of Texas (TRS or system) is a separate legal entity and considered a discrete component unit of the State of Texas. The system is governed by a nine member board of trustees which has significant independence in the operation and management of the system under the provisions of the state constitution and laws. The trustees serve staggered six-year terms that expire on August 31 of odd numbered years and are all appointed by the governor. The trustees are appointed as follows: ï‚· Three are direct appointments by the Governor. ï‚· Two appointments are from a list nominated by the State Board of Education. ï‚· Two appointments are from three public school district active members nominated by employees of public school districts. ï‚· One appointment is from three higher education active members nominated by employees of institutions of higher education. ï‚· One appointment is from three retired member candidates nominated by TRS retirees. The state legislature confirms trustees appointed by the governor, establishes laws with regard to structure, benefits and contributions, and authorizes Pension Trust Fund administrative expenses. State contributions and appropriations received by TRS are determined by the legislature. This report includes all activities and programs for which TRS exercises fiscal control and responsibility and includes all funds that comprise the system’s legal entity.
TRS administers retirement and related benefits to employees and beneficiaries of employees of the public, state-supported, educational institutions of Texas. It operates primarily under the provisions of the Texas Constitution, Article XVI, Section 67 and Texas Government Code, Title 8, Subtitle C. The pension trust fund is a defined benefit retirement plan that is a qualified pension trust under Section 401(a) of the Internal Revenue Code. The system administers the Texas Public School Retired Employees Group Insurance Program and the Texas Active School Employees Uniform Group Benefits Program.
These programs provide two separate health care plans, TRS-Care and TRSActiveCare, respectively. TRS-Care is considered an employee benefit trust fund and provides health care coverage for certain persons (and their dependents) who retire under TRS. The statutory authority for the program is Texas Insurance Code, Chapter 1575 and Texas Administrative Code, Title 34, Part 3, Chapter 41. The inception of the plan was fiscal year 1986. TRS-ActiveCare provides health care coverage to employees (and their dependents) of participating public education entities.
Optional life and long-term care insurance, which are provided to active members and retirees, are also accounted for in the fund. Authority for the plan can be found in the Texas Insurance Code, Title 8, Subtitle H, Chapter 1579 and in the Texas Administrative Code, Title 34, Part 3, Chapter 41. The plan began operations on September 1, 2002. The system also administers a 403(b) Administrative Program in which companies must be certified by TRS to offer qualified investment products to public education employees through payroll deductions in accordance with Internal Revenue Code section 403(b).
Authority for the program can be found in Vernon’s Civil Statutes, Title 109, Article 6228a5, Sections 4-8A and in the Texas Administrative Code, Title 34, Part 3, Chapter 53. The program began operations on September 1, 2001. An Agency Fund is used to account for garnishments of salaries and wages for child support payments from TRS employees. Financial Section 51 . Notes to the Financial Statements B. MEASUREMENT FOCUS, BASIS OF ACCOUNTING, AND BASIS OF PRESENTATION The system’s accounts are organized on the basis of funds, each of which is considered a separate accounting entity. The operations of each fund are accounted for with a self-balancing set of accounts that comprise its assets, liabilities, additions/revenues and deductions/expenses. The following fund types are used to reflect the system’s transactions: ï‚· ï‚· Fiduciary Funds – include the Pension Trust Fund, TRS-Care (employee benefits trust fund) and the Agency Fund. Proprietary Funds – include TRS-ActiveCare and the 403(b) Administrative Program which are both Enterprise funds.
TRS ActiveCare is considered a major fund. Fiduciary funds are used to report assets held in a trustee or agency capacity on behalf of others. The reporting focus is on net position and changes in net position. The pension and other employee benefit trust funds are used to report resources held in trust for the members and beneficiaries of the defined benefit pension plan and the other employee benefit plan.
Agency funds are used to report resources held in a purely custodial capacity by the reporting government. Proprietary, enterprise funds account for business-type activities or those for which a fee is charged to external users for goods or services. The reporting focus is on the determination of operating income, changes in net position, financial position, and cash flows. Proprietary funds distinguish operating activities from non-operating.
Operating activities generally result from providing services and producing or delivering goods. Operating revenues for the system’s proprietary funds are derived from self-insurance premiums and providing plan and product certification services to qualified 403(b) plans. Operating expenses include the costs of claims, costs of certification/product services and related administrative expenses.
Non-operating revenues and expenses are those items that do not meet any of the above definitions. Separate financial statements are provided for each fund. The fiduciary (excluding agency funds) and proprietary financial statements are reported using the economic resources measurement focus and the accrual basis of accounting. Additions are recognized when earned, and deductions are recognized when the liability is incurred, regardless of the timing of related cash flows.
Contributions are recognized in the period in which amounts are due, pursuant to state law. Benefits and refunds of contributions are recognized when due and payable in accordance with the terms of the plan. All economic resources, including financial and capital assets, and related liabilities, both current and long-term, and the changes therein are reported in each fund’s financial statements.
Capital assets are depreciated or amortized on a straight-line basis, if appropriate. Agency funds are custodial in nature and do not measure the results of operations. Assets and liabilities are recorded using the accrual basis of accounting. Agency funds are used to report assets collected and transferred to the state or other entities. C.
NEW ACCOUNTING PRONOUNCEMENTS The accompanying financial statements were prepared in conformity with generally accepted accounting principles (GAAP) as prescribed by the Governmental Accounting Standards Board (GASB). GASB Statement No. 68 Accounting and Financial Reporting for Pensions, relates to governmental employers that provide pensions through trusts and is effective for fiscal years beginning after June 15, 2014.
TRS issued GASB 68 Allocation Schedules for the first time for use by employers participating in the TRS pension plan. Financial Section 52 . Notes to the Financial Statements D. COMPARATIVE DATA IN TOTAL The basic financial statements include certain prior year summarized comparative data in total but not at the level of detail required for a presentation in conformity with generally accepted accounting principles. Accordingly, such information should be read in conjunction with the system’s financial statements for the fiscal year ended August 31, 2014, from which the summarized information was derived. These reclassifications had no effect on previously reported net positions. Certain items from the prior year’s financial statements have been reclassified to conform to the presentation in the current year’s financial statements.
For the fiscal year 2015, the Statement of Changes in Fiduciary Net Position for the Pension Trust Fund includes a reclassification from Net Increase in Fair Value of Investments to Dividends. For TRS-Care, the $36 million Supplemental Appropriation received from the state in 2014 was presented separately this year due to the size of the amount received in 2015. It was previously presented as State’s General Fund – Non Employer Contributing Entity in 2014.
For TRS ActiveCare on the Statement of Net Position, Fees Payable were presented in Health Care Claims Payable in 2014 and are now shown separately. Pension Surcharges for Employment after Retirement were combined in 2014 and have been separated in 2015 for the employee and employer rates. E. BUDGETS AND APPROPRIATIONS The administrative costs and capital asset outlay for each of the system’s funds and programs are controlled by annual budgets approved by the board of trustees. The Pension Trust Fund receives state contributions for retirement benefits from general revenue appropriations.
In fiscal years 2015 and 2014, contributions were made by the State of Texas to the retirement system at the rate of 6.8% of the aggregate compensation paid to active retirement system members for each year. Although appropriated by the legislature, administrative expenses and capital outlay for the Pension Trust Fund are paid from the fund’s Expense Account, and not from the state’s General Fund. The 83rd Texas Legislature enacted Senate Bill 1458 which reduced the annual interest paid on member account balances from five percent to two percent effective September 1, 2014. TRS-Care received contributions from the state’s General Fund equal to one percent of salaries paid to public education employees in fiscal year 2015. Administrative expenses for this program are paid from the trust fund.
House Bill 2 provided an additional $768 million in funding for TRS-Care. The funding was transferred in fiscal year 2015. The two Enterprise Funds, TRS-ActiveCare and the 403(b) Administrative Program are supported by fees and receive no appropriations from the state for administrative expenses. Effective September 1, 1997, legislation authorized TRS to administer a governmental excess benefit arrangement under section 415(m) of the Internal Revenue Code of 1986 (26 U.S.C.). This legislation created a separate, nonqualified, unfunded excess benefit arrangement outside the trust fund of the retirement system.
Contributions to this arrangement are made from the state’s general revenue appropriations. These contributions are not held in trust and may not be commingled with other funds of the retirement system. They yield no net position; therefore, for reporting purposes only the contributions and benefits are reflected on Exhibit II, Statement of Changes in Fiduciary Net Position. Financial Section 53 .
Notes to the Financial Statements F. ASSETS, LIABILITIES AND LEGAL RESERVES Receivables Receivables represent the amount of money owed to TRS for goods or services delivered or used that have not been received at fiscal year-end. ï‚· ï‚· ï‚· ï‚· ï‚· ï‚· Sale of Investments receivables occur when the trade date is before the fiscal year-end and the settlement date is in the next fiscal year. Interest and Dividend receivables represent distributions of income made on bank accounts and other investments that TRS earned in the current fiscal year but did not receive until after fiscal year-end. Member and Retiree receivables represent contributions that are due from members for the current fiscal year but not received until after fiscal year-end. Reporting Entity receivables represent contributions that are due from reporting entities for the current fiscal year which are not received until after fiscal year-end. Service Credit Purchase receivables represent the outstanding balance due from members on service credit purchase installment contracts at fiscal year-end. Payments can be made on a monthly basis for up to five years for purchasing additional creditable service. Receivables are recognized when an agreement is signed. Other receivables represent amounts owed to TRS such as refund or annuity repayments at fiscal year-end but not received until the next fiscal year. Investments Investments are reported at fair value. The framework for measuring fair value is based on a hierarchy that gives the highest priority to the use of observable inputs in an active market and the lowest priority to the use of unobservable inputs.
Management’s estimated market values for investments without readily ascertainable market values could differ significantly if a ready market for these assets existed. Because of the inherent uncertainties in estimating fair value, it is at least reasonably possible that the estimates will change in the near-term. Global foreign exchange holdings are translated using the London 4 O’clock Closing Spot Rate from a third party vendor. Short-Term Investments are those maturing within one year of purchase date.
Included in short-term investments are foreign currency contracts. These foreign exchange contracts are reported at the spot rate and the net difference between the value of the foreign currency and the U.S. dollar is reported in the net increase (decrease) in fair value of investments. Risks associated with such contracts include movement in the value of the foreign currency related to the U.S.
dollar and the ability of the counterparty to perform. Transactions involving foreign currency are accounted for in accordance with FASB Accounting Standards Codification (ASC) 946-830; the subtopic “Foreign Currency Matters” of the topic “Financial Services – Investment Companies”. The fair value of equity investments is measured based on the primary exchange last sale price or the official close price from the pricing vendor for all exchange listed equities. For delisted securities, the last available close price is utilized.
The fair value of local access products, including equity-linked certificates and participation notes which replicate the performance of an underlying security, index, or market for which investing in the local market or in the American Depository Receipt (ADR) or Global Depository Receipt (GDR), or the total return swap market would be difficult or costly, or both, is estimated using a proprietary pricing service. The fair value of fixed income investments is measured based on exchange quotes or vendor sourced evaluated bid prices. Where constituent data is available, the system will also use a benchmark source. Mortgage backed securities are priced on a pool specific basis or, if not available, using the income method which considers the prepayment speed. Financial Section 54 . Notes to the Financial Statements The system has Alternative Investments in the form of Limited Partnerships (LP) and other non-publicly traded equities. These LPs include interests in private equity, real asset, hedge fund, and other absolute return partnership arrangements. These investments are generally illiquid, and the system’s ability to gain insight into the underlying portfolios of some of the LPs may be limited. The fair value of these LP’s is measured based on the Net Asset Value (NAV) of the entity as provided from the General Partner (GP). The system determines whether the NAV is in accordance with the Investment Companies Guide and is in phase with TRS’ fiscal year end. If these conditions are not met, the system adjusts the NAV accordingly or performs further analysis to estimate fair value of its LP interest.
A NAV that is out of phase may be adjusted for subsequent contributions, distributions, management fees and reserves, material changes in fair value of the underlying investments which make up the NAV, or an updated valuation obtained from the GP. A commingled fund is a pool of assets from multiple investors which are under the direction of an external fund manager. These instruments are typically entered into by executing an Investment Management Agreement or are registered, publicly traded pools that are accessible by many investors. The fair value of commingled funds is generally estimated by the fund administrator retained by the fund manager. Investment derivative instruments are reported at fair value. When the fund holds investment derivatives with offsetting market risks, it nets the offsetting positions.
Derivative instruments associated with investments that are already reported at fair value are classified as investment derivative instruments. Changes in fair value of investment derivative instruments are reported as net increase (decrease) in fair value of investments, a component of investment income. The fair value of option and future contracts traded in active markets is estimated based on the current exchange close price. For option contracts, if a current day close price is not available, a fully vetted valuation model to estimate fair value is discerned through coordination with the portfolio manager and/or the independent clearing broker.
For future contracts, if a current day close price is not available, the last price or settlement price may also be used, depending on availability; or if quoted prices are not available, a fully vetted valuation model to estimate fair value is discerned through coordination with the portfolio manager and/or the independent clearing broker. Futures contracts are marked to market daily. The net offsetting positions are reported as accruals, with a daily variation margin (the gain or loss) recorded between the daily value of the contracts and the value on the previous day. The fair value of fairly generic credit default swap and interest rate swap arrangements are estimated using appropriate pricing models.
At each day’s close, if the variables required to successfully complete the pricing model are not available, the system utilizes a “proxy price” to estimate the fair value at the closing day. Once the variables are available, the system corrects the proxy price. These arrangements are priced “clean” meaning the fair values do not include accrued interest. The fair value of total return and other more complex swap arrangements are estimated using a pricing model or a proprietary pricing agent. The fair value of forward contracts is estimated by adding the forward points to the corresponding spot rate.
These rates are then applied to the outstanding currency exchange to derive a change in valuation. Securities Lending The system reports loaned securities, the invested cash collateral, and the related liabilities resulting from securities lending transactions on Exhibit I, Statement of Fiduciary Net Position. The system also reports the earned income from securities lending on Exhibit II, Statement of Changes in Fiduciary Net Position. Both the loaned securities and the invested cash collateral are reported at quoted market prices. Financial Section 55 .
Notes to the Financial Statements Other Assets Prepaid deposits and rent expense reflects payment for rental costs applicable to a future accounting period. Capital Assets Capital assets associated with the funds’ activities are included in the statement of net position. Purchases of capital assets by the fund are reported at cost on the acquisition date. Depreciation of all exhaustible capital assets is charged as an expense against the fund’s operations. Depreciation is calculated using the straight-line method over the asset’s useful life.
Note 2 includes a table identifying the capitalization threshold and estimated useful life by asset type. Liabilities Accounts Payable represents the liability for assets or services received at fiscal year-end for which payment has not been made. Benefits Payable for the Pension Trust Fund represents the liability for retirement, disability, and death benefits due at fiscal year-end and payable within the next 30 days. Health care claims payable for TRS-Care and TRS-ActiveCare includes an estimate for health care claims incurred but not reported to the system at fiscal year-end. Investments Purchased Payable represents the liability for securities purchased prior to fiscal year-end that has not been made. Foreign investments purchased payable is reported at current exchange rates. Securities Sold Short represent obligations to deliver securities.
The system may sell equity securities short in anticipation of a decline in fair value. In a short sale, the system borrows the securities from another party and delivers the securities to the buyer. The system is required to “cover” its short sale in the future through the purchase of the security in the market at the prevailing market price and deliver it to the counterparty from which it borrowed.
The system is exposed to market risk to the extent that the security price increases during the time from when the security is borrowed to the time when the system purchases it in the market to cover the short sale. Collateral Obligations represent both collateral associated with securities lending, and that associated with payables to brokers for collateral held related to derivative instrument-activity. Employee Compensable Absences Payable represents the liability that becomes due upon the resignation, retirement and use of leave balances by employees. These obligations are normally paid from the same funding source from which each employee’s salary or wage compensation was paid. Liabilities are reported separately as either current or non-current in the statement of net position for enterprise funds, if appropriate. Unrealized Lease Incentives represent a reduction to rental expenses for the rent abatement and incentives received from the non-cancelable operating lease that are being amortized over the lease term. Interfund/Interagency Transactions and Balances The Pension Trust Fund provides various administrative services to other TRS programs and accounts for these services as reciprocal interfund activity.
These transactions are reported using the appropriate classification accounts for additions/revenues or deductions/expenses as if transacted with parties external to the state, i.e., they are not presented as transfers. The interfund receivables and payables related to reciprocal interfund activity are classified as receivables and accounts payable on the financial statements. Interagency transactions have been classified using the above criteria for reciprocal inter-fund activity. Financial Section 56 . Notes to the Financial Statements Legal Reserve Accounts The Pension Trust Fund has five statutorily required reserves. ï‚· ï‚· ï‚· ï‚· ï‚· The Member Savings Account represents the accumulation of active member deposits plus interest. The State Contribution Account represents the reserves available to fund future active member retirement, death, and survivor benefits. The Retired Reserve Account represents the reserves available to fund retirement, death, survivor benefits and post-retirement benefit increases. The Deferred Retirement Option Account represents the accumulation of participating member deposits plus interest less benefits paid out. Net investment gains or losses are accumulated in the Interest Account and transferred to the State Contribution Account together with any other balance remaining in the Interest Account. The Expense Account represents the reserves to pay administrative expenses of the Pension Trust Fund that exceed the state’s appropriations and that are required to perform the fiduciary duties of the board. The statutory accounts are a requirement of the Texas Government Code, Chapter 825, Sections 307-313. NOTE 2: CAPITAL ASSETS Capital assets are presented at historical cost or, if not purchased, at fair value at the date of acquisition. When appropriate straight-line depreciation and amortization have been charged over the shorter of estimated useful lives of the assets or lease period.
All capital assets belong to the pension trust fund. Capitalization thresholds for all capital asset classes and useful lives for exhaustible assets are shown on the following page: Capitalization Threshold Asset Class Land Construction in Progress Buildings Building Improvements Facilities and Other Improvements Leasehold Improvements Furniture and Equipment Vehicles, Boats, and Aircraft Internally Generated Computer Software Other Computer Software Other Capital Assets $ Financial Section 57 0 0 100,000 100,000 100,000 100,000 5,000 5,000 1,000,000 100,000 Various Depreciable Life --50 years 15 years 10 years 6 years 5 years 7 years 5 years 5 years Various . Notes to the Financial Statements Capital asset balances and current year transactions are presented in the following table: Reclasses & Completed CIP Asset Class Balance 09/01/2014 Non-Depreciable Assets: Land and Land Improvements Construction in Progress Other Tangible Capital Assets Total Non-Depreciable Assets $ 1,658,310 8,710,720 124,136 $ 10,493,166 $ Depreciable Assets: Buildings and Building Improvements Furniture and Equipment Vehicle, Boats & Aircraft Leasehold Improvements Facilities and Other Improvements Total Depreciable Assets at Historical Cost $39,175,704 11,122,663 76,363 3,096,189 343,622 $53,814,541 $ Less Accumulated Depreciation for: Buildings and Building Improvements Furniture and Equipment Vehicles, Boats & Aircraft Leasehold Improvements Facilities and Other Improvements Total Accumulated Depreciation Depreciable Assets, Net $(18,145,873) (6,303,401) (40,915) (2,838,171) (116,050) $(27,444,410) $ 26,370,131 $ Intangible Assets: Computer Software Total Amortizable Assets at Historical Cost $ Additions Deletions $ 16,543,197 0 $ $16,543,197 $ 0 $ 1,736,770 (15,332) 451,526 $ $ 1,658,310 25,253,917 124,136 $27,036,363 $39,175,704 12,844,101 76,363 3,547,715 343,622 $55,987,505 0 $ 2,188,296 $ $ $ 0 0 $(1,353,671) (1,286,168) (5,991) (259,729) (34,362) $(2,939,921) $ (751,625) $ $ 15,332 0 $(19,499,544) (7,574,237) (46,906) (3,097,900) (150,412) $(30,368,999) $ 25,618,506 $ 10,159,743 $ 10,159,743 $ $ 0 $ $ 410,008 410,008 $ $ 0 $ 10,569,751 $ 10,569,751 Less Accumulated Amortization for: Computer Software Total Accumulated Amortization Intangible Assets, Net $ (8,968,661) $ (8,968,661) $ 1,191,082 $ $ $ 0 0 $ (530,953) $ (530,953) $ (120,945) $ $ $ 0 0 $ (9,499,614) $ (9,499,614) $ 1,070,137 Fiduciary Capital Assets, Net of Accumulated Depreciation/Amortization $ 38,054,379 $ 0 $15,670,627 $ 0 $ 53,725,006 Financial Section 58 $ (15,332) Balance 08/31/2015 (Exhibit I) 15,332 . Notes to the Financial Statements NOTE 3: DEPOSITS AND INVESTMENTS A. CASH IN BANK AND DEPOSITS Cash and deposits of the system are maintained in bank accounts or in the State Treasury. Foreign bank deposits are reported at current exchange rates. At August 31, 2015, the carrying amount totaled $398,825,412 and the bank balance totaled $398,824,726.
The State Treasury invests funds in time deposits, repurchase and reverse repurchase agreements, obligations of the United States, and obligations of various federal credit organizations. The State Treasury has an arrangement with financial institutions to collateralize state deposits in excess of depository insurance. B. CASH ON HAND AND CASH EQUIVALENTS At August 31, 2015, the system had $3,087,674 in cash on hand.
This total is related to checks for purchases of special service that were being held pending approval of rollover transfer forms. Investments with an original maturity of three months or less and that are used for cash management rather than investing activities are considered cash equivalents. Highly liquid investments invested as part of a short-term investment fund are not considered cash equivalents. C. CUSTODY OF INVESTMENTS The system has contracted with State Street Bank and Trust Company and Goldman Sachs to serve as custodians for the system’s investments. D.
INVESTMENT ALLOCATION, LEGAL PROVISIONS, AND OTHER CONSTRAINTS Under the Texas Property Code, Section 117.003, a trustee of the board owes a duty to the beneficiaries of the trust to comply with the prudent investor rule. In making investments, the board shall exercise the judgment and care under the circumstances then prevailing that persons of ordinary prudence, discretion, and intelligence exercise in the management of their own affairs, not in regard to speculation, but in regard to the permanent disposition of their funds, considering the probable income therefrom as well as the probable safety of their capital. Texas Government Code, Section 825.301(a), Texas Property Code, Section 117.004, and the Texas Constitution, Article XVI, Section 67(a)(3) apply in determining whether a trustee has exercised prudence with respect to an investment decision.
Determination shall be made taking into consideration the investment of all the assets of the trust, or the assets of the collective investment vehicle, over which the trustee had management and control. Trustees establish and may amend the guidelines provided by the TRS Investment Policy Statement in establishing specific asset allocations, benchmarks, eligible investments and quantitative criteria with the assistance of their investment counsel and investment advisors. Trustees utilize asset allocations and portfolio standards they believe are prudent and appropriate for the long-term objectives of the fund. The Investment Division assists the Board in engaging in an assetliability study for the pension plan at least once every five years to review asset classes, return-risk assumptions, and correlation of returns with applicable benchmarks and across asset classes.
The most recent study was completed in fiscal year 2015 and the adopted asset allocation was effective October 1, 2014. A key objective of the asset-liability study shall be the development through statistical modeling techniques of a diversified portfolio that specifies ranges of prudent portfolio exposures and a “long-term normal” position for each asset class. The normal portfolio mix will represent the portfolio that is expected to meet the Board's actuarial return objectives for the pension plan within specific risk tolerances. Financial Section 59 .
Notes to the Financial Statements The following was the asset allocation and Long-Term Expected Real Rate of Return as of August 31, 2015: Asset Allocation and Long-Term Expected Real Rate of Return Asset Class Global Equity U.S. Non-U.S. Developed Emerging Markets Directional Hedge Funds Private Equity Stable Value U.S. Treasuries Absolute Return Stable Value Hedge Funds Cash Real Return Global Inflation Linked Bonds Real Assets Energy and Natural Resources Commodities Risk Parity Risk Parity Inflation Expectation Alpha Total Target Allocation Long-Term Expected Geometric Real Rate of Return Expected Contribution to Long-Term Portfolio Returns1 18% 13 9 4 13 4.6% 5.1 5.9 3.2 7.0 1.0% 0.8 0.7 0.1 1.1 11 0 4 1 0.7 1.8 3.0 -0.2 0.1 0.0 0.1 0.0 3 16 3 0 0.9 5.1 6.6 1.2 0.0 1.1 0.2 0.0 5 6.7 0.3 2.2% 1.0 8.7% 100% 1 The Expected Contribution to Returns incorporates the volatility drag resulting from the conversion between Arithmetic and Geometric mean returns For the year ended August 31, 2015, the annual money-weighted rate of return on pension plan investments, net of pension plan investment expense was -0.32 percent. The money-weighted rate of return expresses investment performance, net of investment expense, adjusted for the changing amounts actually invested. Financial Section 60 .
Notes to the Financial Statements E. INVESTMENTS The fair values of investments at August 31, 2015, are shown in the following table: Pension Trust Fund Investment Type Fair Value Short-Term Investment Fund U.S. Treasury Bill Other Short-Term Short-Term Foreign Currency Contracts Equities: Domestic Equities: Equity Securities Equity Commingled Funds International Equities: Equity Securities Equity Commingled Funds Equity Mutual Funds Debt Securities: Domestic Debt Securities: Asset and Mortgage Backed Corporate U.S. Treasury U.S.
Treasury STRIPS U.S. Treasury TIPS U.S. Government Agency Debt Commingled Funds International Debt Securities: Government Corporate Debt Commingled Funds Alternative Investments: Domestic Alternative Investments: Private Equity Real Assets Hedge Funds Absolute Return Energy and Natural Resources Risk Parity International Alternative Investments: Private Equity Real Assets Hedge Funds $ 2,813,074,520 9,596,171 550,861,501 86,385 20,646,085,075 2,871,308,066 26,521,473,596 3,488,680,255 91,908,027 185,705,826 43,271,751 14,784,523,332 242,603,869 6,004,020,596 36,178,295 173,017,818 263,705,310 3,250,030 31,571,803 12,997,417,625 13,327,277,730 11,158,758,163 173,654,091 2,250,960,367 1,757,759,921 3,413,830,007 2,648,964,608 457,885,359 to next page Financial Section 61 .
Notes to the Financial Statements Pension Trust Fund (concluded) Investment Type Investment Derivatives: Domestic Investment Derivatives: Forward Contracts Options Swap Contracts Warrants International Investment Derivatives: Swap Contracts Fair Value 6,960,269 (2,570,953) (14,081,051) 22,919,926 (785,112) 52,897,186 Warrants Other Investments: Other Commingled Funds - Domestic Total Investments (Exhibit I) 29,659,103 $127,042,429,465 Invested Securities Lending Collateral: Securities Lending Pooled Investments Total Securities Lending Collateral (Exhibit I) $ 19,372,421,460 $ 19,372,421,460 Categories of permissible investments include equities, debt securities, cash equivalents, alternative investments including private equity, real assets, absolute return, hedge funds, other absolute return investments, derivative instruments authorized by law, mutual funds, closed-end funds, exchange-traded funds, and commingled funds. Investment categories are based on the risk profiles exhibited by those investments. The objectives of the Private Equity and Real Asset investments is to provide diversification to the Total Fund, and provide for enhanced returns and diversification within the portfolio by allocating assets among the various strategies. Private equity funds build portfolios of private investments in the equity or equity-rights securities of privately-owned operating companies. Real assets focus on private or public real estate equity, private or public real estate debt, infrastructure, timber, agricultural real estate, oil and gas, real asset mezzanine debt or equity, mortgage-related investments, entitylevel investments, REITS, MLPs, non-fixed assets and other opportunistic investments in real assets.
Funding of committed capital in either the Private Equity or the Real Asset Portfolio will occur over an extended time period and may take several years before the total allocation to each asset class is fully invested. Because an individual investment may begin to return capital to the investor prior to the full funding of the investor’s commitment, the outstanding invested capital of a Private Equity or Real Asset investment might at times be substantially less than the total commitment. Hedge funds are private commingled investment vehicles with the general characteristics as set forth in Texas Government Code, Section 825.3012.
Hedge funds include private investment fund of funds or a commingled vehicle that itself invests in hedge funds. TRS investment policy establishes criteria to analyze and determine whether a private investment fund should be classified as a hedge fund. The permissible hedge fund allocation is a maximum of 10% of the market value of the total fund on the date of each hedge fund investment. Absolute Return investments include credit sensitive investments as well as other limited partnerships that are not hedge funds, private equity, or real assets.
A commingled fund is a fund which is (i) exempt under the provisions of Section 501(a) of the Internal Revenue Code of 1986, (ii) is not required to be registered as an investment company under Section 3(c)(1), 3(c)(7) or other provisions of the Investment Company Act of 1940, or (iii) is an investment company registered under the Investment Company Act of 1940, as amended, provided that investment and reinvestment of assets complies with the investment guidelines in all respects. Energy and Natural Resources investments include private and public energy or natural resource related securities either directly or through funds. Risk Parity portfolios are asset allocation strategies that focus upon equalizing the risk contributions of the asset Financial Section 62 .
Notes to the Financial Statements classes or risk factors comprising the portfolio. Risk Parity then uses leverage to scale the resulting portfolio to target a stated level of portfolio risk/return commensurate with typical pension fund unlevered asset allocation strategies. F. DERIVATIVES Derivatives are financial instruments the value of which are derived, in whole or part, from the value of any one or more underlying securities or assets, or index of securities or assets (such as bonds, stocks, financial commodities, and currencies). Derivatives include futures contracts, options, options on futures contracts, forward contracts, swap contracts, and any instrument or contract intended to manage transaction or currency exchange risk in purchasing, selling or holding investments.
A forward contract is a non-standardized contract for the physical or electronic (through a bookkeeping entry) delivery of a commodity or financial instrument at a specified price at some point in the future. The system’s swap contracts are a financial contract in that the parties agree to exchange cash flows of defined investment assets in amounts and times specified by the contract. An interest rate swap is structured such that one stream of future interest payments is exchanged for another based on the notional amount.
A total return swap is a contract in which one counterparty agrees to either pay to or receive from the other counterparty cash flows based on changes in the value of an underlying asset. A credit default swap is a contract that provides credit protection against a specified credit event such as the default or bankruptcy of the underlying financial instrument (reference asset). The purchaser (buyer) pays a premium to the writer (seller) in return for payment, which is contingent on a credit event affecting the referenced asset. An option contract provides the right, but not the obligation, to buy or sell a specific amount of a specific security within a predetermined time period.
A futures contract is a commitment to buy or sell a specified quantity of a commodity or financial instrument at a specified price with payment and delivery occurring at a specified future date. The fair value balances and notional amounts of investment derivative instruments outstanding at August 31, 2015, classified by type, and the changes in fair value of such investment derivative instruments for the fiscal year ended August 31, 2015 were as follows: Changes in Fair Value Classification Amount Gain/(Loss) Fair Value at August 31, 2015 Classification Amount Notional Fiduciary Funds Investment Derivatives: Forward Contracts Futures Contracts Swap Contracts Warrants Options Investment Revenue Investment Revenue Investment Revenue Investment Revenue Investment Revenue $ $ $ $ $ 478,858,356 (754,028,134) (110,042,846) (18,782,173) (13,113,747) Investment Investment Investment Investment Investment $ $ $ $ $ 6,960,269 0 (14,866,163) 75,817,112 (2,570,953) $ $ $ $ $ 15,804,273,155 3,438,884,458 815,710,774 30,631,554 2,674,236 The methods and significant assumptions used to estimate fair value of the system’s investment derivative instruments are presented in Note 1: Summary of Significant Accounting Policies, Section F. Assets, Liabilities and Legal Reserves. The system’s investment policy states that derivatives may only be used to efficiently manage and reduce the risk of the overall investment portfolio in accordance with applicable law, and must comply with the fiduciary standard of prudence set forth in the Texas Constitution, Article XVI, Section 67(a)(3). Consistent with these objectives, derivative applications may be used to implement investment strategies in a lower cost and efficient manner; efficiently manage the fund’s portfolio by altering the portfolio’s market exposure in lieu of trading the underlying cash market securities through purchases or short sales, or both, of appropriate derivatives; construct portfolios with risk and return characteristics that could not be created with cash market securities consistently with the objectives in the investment policy and in Financial Section 63 .
Notes to the Financial Statements compliance with applicable law; hedge and control risks so that the fund’s risk-return profile is more closely aligned with the fund’s targeted risk-return profile through purchases or short sales, or both, of appropriate derivatives; and facilitate transition trading when holdings must be rebalanced or reallocated among permissible investments as a result of changes to applicable benchmark indexes or investment policy changes. Derivatives may not be used for any activity a primary purpose of which is speculation or to profit while materially increasing risk to the system. Derivative applications may not be used to invest in asset classes that are not consistent with the system’s legally permissible and policy asset categories, implementation strategies, and risk-return characteristics. Investment managers or sponsors of Real Asset Funds investments in commodities are limited to swaps and instruments that constitute a security that is underlain by a financial instrument as opposed to a physical commodity unless such derivatives are cash-settled whether by its contract terms, by rolling the position, or by trading out of the position before a delivery obligation can arise. Any counterparty to an over-the-counter derivative transaction must have a credit rating of at least A- (Standard & Poor’s or Fitch) or A3 (Moody’s) and is subject to established ISDA Master Agreements.
All ISDA Master Agreements provide that netting applies. The system and external managers may also use collateral arrangements to mitigate counterparty credit or performance risk. The net market value of all over-the-counter derivative positions, less collateral posted, for any individual counterparty may not exceed $500 million.
If the over-the-counter derivative transaction is a type of contract that must be centrally cleared as mandated by the Dodd-Frank Wall Street Reform and Consumer Protection Act, it is subject to clearing agreements. G. DEPOSITS AND INVESTMENTS RISK FACTORS Deposits and investments of state and local governments are exposed to risks that have the potential to result in losses. GASB Statement No. 40, Deposit and Investment Risk Disclosures - an amendment to GASB Statement No. 3 updated the custodial credit risk disclosure requirements of Statement 3 and established more comprehensive disclosure requirements addressing other common risks of deposits and investments such as credit risk, concentration of credit risk, interest rate risk and foreign currency risk.
The required disclosures related to these risks are presented on the following pages. Custodial Credit Risk – Deposits The custodial credit risk for deposits is the risk that, in the event of bank failure, the government will not be able to recover deposits or will not be able to recover collateral securities that are in the possession of an outside party. The system does not have a formal deposit policy for custodial credit risk. The State Treasury has specific guidelines for cash and deposits that are maintained in the State Treasury. The deposits in the bank in excess of the insured amount are uninsured and uncollateralized.
As of August 31, 2015, the balance of uncollateralized cash in U.S. and non-U.S. banks for investments pending settlement was $398,530,412. Custodial Credit Risk – Investments The custodial credit risk for investments (including exchange traded investment derivative instruments) is the risk that, in the event of a failure of the counterparty, the government will not be able to recover the value of investment or collateral securities that are in the possession of an outside party.
The system does not have a formal investment policy for custodial credit risk. Short-Term investments totaling $550,861,501 are held by the custodian’s agent in an investment pool not evidenced by a security, and are not exposed to custodial credit risk. All other investments (including exchange traded investment derivative instruments) are registered in the name of Teacher Retirement System or in the name of the system’s custodian Financial Section 64 . Notes to the Financial Statements which is established through a master trust custodial agreement. The securities are held by the custodian in the name of the system. Any cash collateral received associated with investment derivative activity is invested in an agent managed pool that is not evidenced by securities that exist in physical or book entry form, and are not exposed to custodial credit risk. At August 31, 2015, the system held no collateral associated with investment derivative activity. At August 31, 2015, the deposits with broker on exchange-traded investment derivative instruments and investment derivative instruments subject to mandatory clearing through a designated clearing organization in the amount of $578,819,254 were uninsured and uncollateralized. Credit Risk of Investment Derivative Instruments and Debt Securities The credit risk for the system’s investments in debt securities, Short-Term Investment Funds, and over-the-counter investment derivative instruments in asset positions is the risk that an issuer or other counterparty to an investment will not fulfill its obligations. The system’s primary sources of credit risk are derivative counterparty credit risk, the risk from repurchase agreements, and securities lending. The system does not have a formal credit risk policy relating to its investments in Short-Term Investment Funds.
For over-the-counter (OTC) derivatives, any counterparty in a transaction with TRS must have a credit rating of at least A- (Standard & Poor’s or Fitch) or A3 (Moody’s) or better at the inception of the contract. All OTC derivative transactions, including those managed through Agency Agreements, must be subject to established ISDA Master Agreements and have full documentation of all legal obligations of TRS under the transactions. All ISDA Master Agreements provide that netting applies.
To minimize the system’s exposure to loss related to credit risk, the system may use collateral arrangements to mitigate counterparty credit risk. The system has negotiated thresholds for each counterparty above which collateral must be posted. The net market value of all over-the-counter derivative positions, less collateral posted, for any individual counterparty may not exceed $500 million.
The net market value of all over-thecounter derivative positions, without consideration collateral, may not exceed five percent of the total market value of the fund. The system’s investment policy clarifies that termination of the transaction is allowed. Repurchase transactions and tri-party repurchase transactions may not exceed five percent of the market value of the total investment portfolio, including cash and cash equivalents, unless those transactions are covered by a third-party indemnification agreement by an organization that bears a long-term NRSRO credit rating of A- or better and is enhanced by acceptable collateral.
A securities lending agent must be an organization rated A- or better by a NRSRO. The system’s rated counterparties on investment derivative instruments in an asset position, and rated debt investments as of August 31, 2015, using the Standard & Poor’s (S&P) rating scale, are as follows and on the following page. Investment Derivative Instruments: the aggregate fair value of investment derivative instruments in asset positions at August 31, 2015, was $136,406,437. This represents the maximum loss that would be recognized at August 31, 2015, if all counterparties failed to perform as contracted. This maximum exposure is reduced by $119,329,395 of liabilities included in netting arrangements with those counterparties resulting in a net exposure of investment derivative instruments to credit risk of $17,077,042. At August 31, 2015, approximately 98.5% of the net exposure to credit risk of $17,077,042 are held with three counterparties, all with an S&P rating of A.
Approximately 1.5% of the net exposure to credit risk is held with one counterparty with an S&P rating of AA. Financial Section 65 . Notes to the Financial Statements Debt Securities: Investment Type S&P Rating Short-Term Investment Fund Other Short-Term Total Credit Risk of Short-Term U.S. Treasury Bill** Short-Term Foreign Currency Contracts Total Short-Term (Exhibit I) U.S. Government Agency Obligations Total U.S. Government Agency Obligations* Asset and Mortgage Backed Obligations Asset and Mortgage Backed Obligations Asset and Mortgage Backed Obligations Asset and Mortgage Backed Obligations Asset and Mortgage Backed Obligations Asset and Mortgage Backed Obligations Asset and Mortgage Backed Obligations Asset and Mortgage Backed Obligations Asset and Mortgage Backed Obligations Asset and Mortgage Backed Obligations Total Asset and Mortgage Backed Obligations Corporate Obligations Corporate Obligations Corporate Obligations Corporate Obligations Corporate Obligations Corporate Obligations Total Corporate Obligations International Government Obligations International Government Obligations International Government Obligations International Government Obligations International Government Obligations Total International Government Obligations International Corporate Obligations International Corporate Obligations Total International Corporate Obligations Total Credit Risk of Debt Securities (excluding Short-Term) U.S.
Government Obligations and U.S. Government Agency Obligations** $ 2,813,074,520 550,861,501 3,363,936,021 9,596,171 86,385 3,373,618,577 36,178,295 36,178,295 4,223,232 4,806,261 6,626,343 12,417,184 37,061,321 38,060,394 47,700,317 1,350,917 9,555,653 23,904,204 185,705,826 1,303,854 17,676,184 15,001,045 1,321,250 690,031 7,279,387 43,271,751 7,282,329 5,742,309 4,949,034 5,325,646 240,405,992 263,705,310 2,387,910 862,120 3,250,030 $ 532,111,212 $ 21,031,147,797 $ Total Fixed Income (Exhibit I) NR NR Fair Value $ 21,563,259,009 $ $ AA AAA AA A BBB BB B CCC CC D NR BBB BB B CCC D NR AA A BBB CCC NR CCC NR $ $ $ $ $ $ $ $ $ $ *U.S. Government Agency Obligations with a credit rating are investments implicitly guaranteed by the U.S.
Government. **U.S. Treasury Bill, U.S. Government Obligations, and U.S.
Government Agency Obligations without a credit rating are investments explicitly guaranteed by the U.S. Government. Financial Section 66 . Notes to the Financial Statements Interest Rate Risk of Investment Derivative Instruments and Debt Securities Interest rate risk is the risk that changes in interest rates will adversely affect the fair value of an investment. Duration is a measure of a debt investment’s exposure to fair value changes arising from changes in interest rates. It uses the present value of cash flows, weighted for those cash flows as a percentage of the investment’s full price. The system does not have a formal interest rate risk policy. The table below shows the maturities of the system’s Swap contracts at August 31, 2015. Less than 1 Year $ (9,197,502) $ Maturities in Years 1-5 6-10 561,087 $ (159,612) $ Total (8,796,027) The table below shows the long-term fixed income investments by investment type, fair value, and the effective weighted duration rate as of August 31, 2015. Investment Type U.S.
Government Obligations U.S. Government STRIPS and TIPS U.S. Government Agency Obligations Asset and Mortgage Backed Obligations Corporate Obligations International Government Obligations International Corporate Obligations Total Fixed Income (Exhibit I) $ $ Fair Value 14,784,523,332 6,246,624,465 36,178,295 185,705,826 43,271,751 263,705,310 3,250,030 21,563,259,009 Effective Weighted Duration Rate 17.620 5.873 4.453 1.139 4.289 8.184 5.664 13.909 Investments Highly Sensitive to Interest Rate Changes The system’s investments in long-term Asset and Mortgage Backed Obligations are subject to prepayments by the obligees of the underlying assets in periods of decreasing interest rates.
The resultant reduction in expected cash flows will affect the fair value of these securities. Prepayments by the obligee of the underlying assets in periods of declining interest rates could reduce or eliminate the stream of income that would have been received. As of August 31, 2015, these securities totaled $185,705,826. The system invests in Commingled Funds which hold a preponderance of investments with fair values that are highly sensitive to market conditions.
The fair value of the Commingled Fund fluctuates as market conditions fluctuate. Interest rate changes are a part of changes in market conditions. As of August 31, 2015, these funds totaled $204,589,621. The system’s investments in Swap contracts have various reference rates based on various interbank offered rates.
As these reference rates fluctuate, the payments due to/from the system fluctuate. Financial Section 67 . Notes to the Financial Statements At August 31, 2015, the notional amount and fair value of these contracts were as follows: Terms ICE LIBOR GBP 3 month ICE LIBOR USD 3 month ICE LIBOR USD 1 month ICE LIBOR CHF 3 month CAD Interbank 3 month CAD Interbank 1 month MXN Interbank 1 month U.S. Fed Funds Effective Rate $ JPY BOJ Estimated Unsecured Overnight Call Rate Total Notional 805,898 146,603,946 2,040,352 17,208,572 7,399,766 2,072,180 196,565,197 21,855,162 Fair Value $ (6,364) (7,547,130) (1,138,393) (1,165,109) 45,922 (131,022) 201,466 654,916 1,390,799 $ 289,687 395,941,872 $ (8,796,027) Foreign Currency Risk – Deposits and Investments Foreign currency risk is the risk that changes in exchange rates will adversely affect the fair value of a deposit or an investment. The system does not have a formal deposit policy for foreign currency risk. The risk of holding investments in foreign currency is managed by applying currency hedge ratios to foreign exposures and potentially engaging in currency overlay strategies.
When engaging in currency overlay strategies, the maximum notional exposure of the fund to any single non-U.S. dollar developed market currency and any emerging market currency will be limited to 2% and 1% of the market value of the fund respectively. The system’s exposure to foreign currency risk at August 31, 2015, is presented in the tables on the following pages. Financial Section 68 .
Notes to the Financial Statements Deposits: Currency Australian Dollar Bangladeshi Taka Botswana Pula Brazilian Real Canadian Dollar Chilean Peso Colombian Peso Croatian Kuna Czech Koruna Danish Krone Egyptian Pound Euro Ghanaian Cedi Hong Kong Dollar Hungarian Forint Indian Rupee Indonesian Rupiah Israeli Shekel Japanese Yen Jordanian Dinar Kenyan Shilling Kuwaiti Dinar Malaysian Ringgit Mauritius Rupee Mexican Peso Moroccan Dirham New Turkish Lira New Zealand Dollar Nigerian Naira Norwegian Krone Omani Rial Pakistan Rupee Peruvian Nuevo Sol Philippine Peso Polish Zloty Pound Sterling Qatar Riyal Romanian Leu Singapore Dollar South African Rand South Korean Won Sri Lanka Rupee Swedish Krona Swiss Franc Taiwan Dollar Thai Baht Tunisian Dinar United Arab Emirates Dirham Vietnamese Dong Total Deposits Subject Foreign Currency Risk Financial Section 69 Cash in Non-U.S. Banks $ 7,433,552 118,130 85,730 1,720,989 4,357,941 52,132 96,889 28,994 97 65,031 581,285 214,841,227 87,487 12,715,107 110,241 4,219,682 88,422 271,690 71,798,080 47,696 50,653 205,538 1,073,046 115,991 1,043,970 159,549 134,135 31,573 76,985 4,310,639 30,519 90,908 106,759 30,970 1,380,347 12,097,091 37,782 19,674 472,113 1,796,692 617,718 81,818 359,608 10,407,639 8,906,802 124,226 100,495 27,118 892,174 $ 363,502,934 . Notes to the Financial Statements Investments: Currency Australian Dollar Bangladeshi Taka Botswana Pula Brazilian Real Canadian Dollar Chilean Peso Colombian Peso Croatian Kuna Czech Koruna Danish Krone Egyptian Pound Euro Ghanaian Cedi Hong Kong Dollar Hungarian Forint Indian Rupee Indonesian Rupiah Israeli Shekel Japanese Yen Jordanian Dinar Kenyan Shilling Kuwaiti Dinar Malaysian Ringgit Mauritius Rupee Mexican Peso Moroccan Dirham New Turkish Lira New Zealand Dollar Nigerian Naira Norwegian Krone Omani Rial Pakistan Rupee Peruvian Nuevo Sol Philippine Peso Polish Zloty Pound Sterling Qatar Riyal Romanian Leu Russian Ruble Singapore Dollar South African Rand South Korean Won Sri Lankan Rupee Swedish Krona Swiss Franc Taiwan Dollar Thai Baht Tunisian Dinar United Arab Emirates Dirham Vietnamese Dong Total Investments Subject to Foreign Currency Risk $ Debt 46,382,916 $ 77,612,560 862,121 879,430 5,742,309 7,282,329 121,700,315 4,105,451 $ 264,567,431 $ Alternative Commingled Equity Investments Funds Derivatives 335,998,187 $ $ $ $ 10,609,129 5,424,571 546,333,717 6,088 752,643,891 (85,100) 74,555,400 32,240,572 6,822,095 38,318,908 412,662,489 25,707,404 4,530,380,282 2,184,241,298 583,820,985 160,564 2,438,845 2,422,104,732 3,642 40,820,477 927,492,749 290,084,185 20,111,305 3,676,999,933 801,257 6,759,199 8,717,338 15,746,691 192,524,791 103,140 6,436,697 400,317,361 201,466 6,226,569 172,621,654 2,452,370 6,355,634 236,723,408 6,104,366 40,302,217 3,964,217 120,185,919 128,074,837 2,880,961,882 408,808,437 (6,364) 32,154,666 9,828,174 40,144,094 90,947,255 730,833,031 1,343,192,942 (862,433) 5,800,626 348,702,050 1,112,997,407 (1,165,109) 908,458,514 (172,046) 287,784,474 38,550 2,469,803 35,337,982 5,891,058 23,340,766,097 $ 2,593,049,735 $ Financial Section 70 583,820,985 $ (976,345) $ Total Fair Value 382,381,103 10,609,129 5,424,571 546,339,805 752,558,791 74,555,400 32,240,572 6,822,095 38,318,908 412,662,489 25,707,404 7,376,215,689 2,438,845 2,422,108,374 40,820,477 928,354,870 290,084,185 20,111,305 3,678,680,620 6,759,199 8,717,338 15,746,691 192,627,931 6,436,697 406,261,136 6,226,569 172,621,654 9,734,699 6,355,634 236,723,408 6,104,366 40,302,217 3,964,217 120,185,919 128,074,837 3,411,464,270 32,154,666 9,828,174 40,144,094 90,947,255 734,938,482 1,342,330,509 5,800,626 348,702,050 1,111,832,298 908,286,468 287,823,024 2,469,803 35,337,982 5,891,058 26,781,227,903 . Notes to the Financial Statements H. SECURITIES LENDING The system is authorized by Texas Government Code, Section 825.303 to contractually lend securities to borrowers in accordance with policy established by the board of trustees and as required by statute. The system has a contract with State Street Bank and Trust Company to administer its securities lending program for domestic and international equity and fixed income securities. Authorized collateral for the program consists of cash or government securities eligible for book entry in either the Federal Reserve System or Participants Trust Company.
The required collateral is based upon the lent security’s fair value plus accrued income. At a loan’s inception, the value of the collateral must be at least 102% of the value of domestic lent securities and at least 105% for international lent securities. Collateral is marked to market daily, and in the case it falls below 100% for domestic or 105% for international, it is reinstated to the original requirements by the borrower. Cash collateral can be invested in a cash collateral pool, U.S.
government or U.S. government sponsored entity securities, time deposits, bank certificates of deposit, bankers’ acceptances, master notes, repurchase agreements, bank and corporate notes, commercial paper, asset backed securities, and derivative instruments. The system’s policies for securities lending provide investment guidelines for different asset classes to limit its exposure to different types of risks. The par value, dollar-weighted average maturity of the collective cash collateral investment may not exceed 120 days.
The expected final maturity of any individual fixed-rate instrument has a limit of 36 months and any floating-rate instrument has a limit of seven years. Each instrument having a maturity of 13 months or less at the time of purchase must qualify as “first tier securities” within Rule 2a-7 under the Investment Company Act of 1940 and any instrument over 13 months must be rated within the highest major, long-term rating category of an NRSRO, or, if unrated, be determined to be of comparable quality by the trustees. The system does not have a formal custodial credit risk policy relating to its securities lending program. All cash collateral received is invested in an unrated cash collateral pool held by the counterparty, the system’s securities lending agent and is not exposed to custodial credit risk. The following table shows the underlying securities for non-cash collateral loans which are also held by the counterparty, the securities lending agent, but not in the system’s name and are not insured. Investment Type Domestic Obligations Domestic Equities International Equities Total $ $ Fair Value 3,913,935 417,952,146 44,404,802 466,270,883 The system earns income from fees paid by the borrowers and interest earned from investing the cash collateral.
The contract requires the custodian to indemnify the system if the borrower fails to return the securities or income distributions made while the securities are on loan. Non-cash collateral cannot be pledged or sold unless the borrower defaults. Substantially all securities loans can be terminated on demand either by the system or the borrower, although, as of August 31, 2015, the weighted average term of these loans was five days.
As of August 31, 2015, the weighted average maturity of the invested cash collateral was 30 days, and there was no credit risk exposure to borrowers because the amounts owed to borrowers exceeded the amounts owed to the system. During the year there were no significant violations of contractual provisions, no borrower or custodian default losses and no recoveries of prior period losses. The total market value of all loans cannot exceed 30% of the portfolio. Financial Section 71 .
Notes to the Financial Statements The following table represents the fair market values of the securities lending transactions based on type of collateral received as of August 31, 2015: Cash $ 18,870,536,867 $ 19,379,483,580 $ 19,372,421,460 Securities on Loan Collateral Received Reinvested Collateral Non-Cash $ 466,270,883 $ 477,599,005 Total $ 19,336,807,750 $ 19,857,082,585 $ 19,372,421,460 For fiscal year 2015, the system earned income of $81,873,041 from securities lending. I. OTHER INVESTMENTS AND CONTINGENT COMMITMENTS The system’s investment derivative instruments include provisions that require the system to post collateral in the event that the fair value surpasses a specified contractual threshold. If the collateral posting thresholds of all these investments derivative instruments did not exist at August 31, 2015, the system would be required to post the aggregate amount of $43,789,055 in collateral to its counterparties. Where none of the contractual thresholds were surpassed, the system has posted no collateral at August 31, 2015. The system’s investments in certain limited partnerships commit the system to possible future capital contributions.
At August 31, 2015, the remaining commitment was $26,223,477,366. NOTE 4: EMPLOYEE COMPENSABLE LEAVE Salary costs related to employees’ rights to be compensated for leave balances are accrued as expenses in the period in which the services are rendered. Accumulated compensable leave liabilities are reported in the Statement of Fiduciary Net Position for the Pension and Other Employee Benefit Trust Funds and in the Statement of Net Position for the Enterprise Funds. The employees’ compensable leave activity for fiscal year 2015 is shown in the table below. Beginning Balance 09/01/14 Additions Amounts Due Within One Year Ending Balance 08/31/15 Reductions Amounts Due Thereafter Fiduciary Funds: Pension Trust Fund TRS-Care $ $ 7,531,766 $ (6,797,621) $ 7,729,025 $ 4,865,394 $ 2,863,631 311,358 $ (297,901) 315,327 187,267 128,060 149,176 (157,729) 139,617 100,022 39,595 9,932 403(b) Administrative Program 301,870 148,170 Proprietary Funds: TRS-ActiveCare Total 6,994,880 24,402 (32,569) 1,765 1,765 7,464,340 $ 8,007,214 $ (7,285,820) Financial Section 72 $ 8,185,734 $ 5,154,448 $ 3,031,286 .
Notes to the Financial Statements NOTE 5: OPERATING LEASES In fiscal year 2014, TRS entered into a non-cancelable operating lease agreement for building space which expires March 31, 2021. As part of the building lease, TRS received a construction allowance which is being amortized on a straight-line basis over the life of the lease as a reduction of rental expenses. Rental expenses related to the lease for the fiscal year ended August 31, 2015 for the Pension Trust Fund were $1,834,116 and include amortization of unrealized lease incentives of $420,170. Off-site storage fees for data security was $13,890. The future minimum lease payment for the next six years ending August 31 are as follows: Amount Fiscal Year 2016 2017 2018 2019 2020 2021 Total $ $ 1,095,304 1,125,150 1,161,936 1,196,663 1,232,526 731,457 6,543,036 NOTE 6: FRINGE BENEFITS PAID BY THE STATE OF TEXAS AND THE FEDERAL GOVERNMENT The state has a joint contributory retirement plan for substantially all its employees. The employees of TRS participate in the same plan they administer (Note 12). Federal legislation enacted in January 2006 established prescription drug coverage for Medicare beneficiaries known as Medicare Part D.
One of the provisions of Medicare Part D provided retiree drug subsidy reimbursements to TRS-Care on behalf of certain plan participants totaling $14,013,622 for the fiscal year ended August 31, 2015. Under TRS-Care’s Employer Group Waiver Plan (EGWP) reimbursements totaled $43,652,580 for Medicare Part D direct subsidies, $61,663,640 for catastrophic reinsurance subsidies and $7,476,810 for low income subsidies. NOTE 7: DEFERRED COMPENSATION Employees of the system may elect to defer a portion of their earnings for income tax and investment purposes pursuant to authority granted in the Tex. Gov.
Code Ann., Sec. 609.001. Two plans are available for employees.
Both plans are administered by the Employees Retirement System. The system has no additional or unfunded liability for this program. NOTE 8: CONTINGENT LIABILITIES Sick leave, the accumulation of which is unlimited, is earned at the rate of eight hours per month and is taken only in the event of illness or paid to the estate of an employee in the event of death. The maximum sick leave that may be paid to an employee’s estate is one-half of the employee’s accumulated entitlement or 336 hours, whichever is less.
The system’s policy is to recognize the cost of any sick leave when paid. Financial Section 73 . Notes to the Financial Statements The system is contingently liable for benefits payable to retiring members who remain in a pending status longer than 30 days after fiscal year end. In addition, under Texas Insurance Code, Article 3.51-7, the system is contingently liable to pay a lump-sum death benefit not to exceed $5,000 when added to the death benefit authorized under Texas Government Code, Title 8, Chapter 824, to the beneficiaries of deceased, retired employees. A Performance Incentive Compensation Plan was adopted effective October 1, 2007 and modified October 1, 2008 to enable the system to remain competitive in its efforts to attract, retain and motivate high caliber investment division staff. The purpose of the Plan is to provide the opportunity for investment division employees to earn performance incentive pay based on the fund’s investment performance and the employee’s job performance. The performance incentive pay is paid over the subsequent 2 years. For the incentive pay plan year ending September 30, 2015 the liability is estimated not to exceed $ 16 million.
Payments can only be earned following years in which the fund experiences a positive return, and employees must be employed by TRS on the designated dates in the Plan to earn and receive payment. The board of trustees may cancel or modify the Plan at any time. TRS is a defendant in litigation involving issues arising from its normal activities. The outcome of this litigation cannot be determined at this time.
Based upon consultation with legal counsel, management believes there will be no material adverse effect on the basic financial statements as a result of the ultimate outcome of these matters. NOTE 9: CONTINUANCE SUBJECT TO REVIEW As provided by Texas Government Code, Title 8, Section 825.006, “The board of trustees of the Teacher Retirement System of Texas is subject to review under Chapter 325 (Texas Sunset Act), but is not abolished under that chapter. The board shall be reviewed during the period in which state agencies abolished in 2019, and every 12th year after that year, are reviewed.” NOTE 10: POST-EMPLOYMENT HEALTH CARE BENEFITS A. PLAN DESCRIPTION TRS Employees Employees of the system who retire with 10 or more years of eligible service credit and meet the Rule of 80 or are at least 65 years of age continue to receive health care and basic life insurance benefits through the Group Benefits Program of the State Retiree Health Plan (SRHP) in accordance with Texas Insurance Code, Chapter 1551.
The SRHP is maintained and administered through the Employees Retirement System (ERS) of Texas and is considered a cost-sharing, multipleemployer, defined benefit post-employment health care plan. ERS issues a publicly available financial report that includes financial statements and required supplementary information for the SRHP. That report may be obtained by visiting the ERS website at www.ers.state.tx.us, by writing to the Finance Division of the Employees Retirement System of Texas at 200 East 18th Street, Austin, Texas 78701, or by calling 1-877-275-4377. Benefits and contribution provisions of the SRHP are not actuarially determined, but are authorized by state law and may be amended by the Texas Legislature.
For the year ended August 31, 2015, the system contributed up to a maximum monthly amount on a pay-as-you-go basis toward a retiree’s health and basic life insurance premiums as follows: Financial Section 74 . Notes to the Financial Statements Employer Contribution Rates Retiree Health and Basic Life Premium Type of Coverage FY 2015 FY 2014 FY 2013 Member Only Member/Spouse Member/Children Member/Family $ 537.66 $ 503.14 $ 470.38 845.54 791.16 739.58 743.80 696.00 650.62 1,051.68 984.02 919.82 The system covers 100% of a Member Only premium and 50% of their additional premiums for family coverage. The basic plan includes up to $2,500 for life insurance for the retiree. The retiree contributes any premium over and above the system’s contribution for additional coverage. The board has adopted contributions based on rates set by the Texas Legislature on a biennial basis.
At August 31, 2015, there were 255 retirees and their beneficiaries receiving postemployment health care and basic life insurance benefits. Contractually required contributions to the SRHP are currently based on the annual pay-as-you-go expenses of the SRHP. For the year ended August 31, 2015, 2014, and 2013 the system recognized expenditures of $1,822,022, $1,649,877, and $1,426,887, respectively, for these benefits.
The system has annually made 100 percent of its contractually required contributions to the SRHP. Public School Employees TRS, as trustee, administers the Texas Public School Retired Employees Group Insurance Program (TRS-Care) and the related fund in accordance with Texas Insurance Code, Chapter 1575. Sections 1575.202 to 204 establish state, active employee, and public school contribution rates. Section 1575.052 grants the board the authority to establish basic and optional group insurance coverage for participants.
Charter Schools in the TRS system are considered “open enrollment” and receive the same treatment as public school employees. TRS-Care is a cost-sharing, multiple-employer, defined benefit, other post-employment benefit (OPEB) plan that is currently funded on a pay-as-you-go basis and is subject to change based on available funding. The Texas Legislature determines the funding of benefits and has no continuing obligation to provide benefits beyond each fiscal year. At the inception of the plan in fiscal year 1986, funding was projected to last 10 years through fiscal year 1995. The original funding was sufficient to maintain the solvency of the fund through fiscal year 2000.
Since that time, appropriations and contributions have been established to be sufficient to provide benefits for the biennium. To alleviate a funding shortfall for the 2016-17 biennium, the 84th Texas legislature, House Bill 2 appropriated $768 million in supplemental funding that was paid in August 2015. Eligibility generally includes TRS public school retirees with more than 10 years of service and their dependents. Retirees can receive a free basic level of coverage, and optional coverage is also available.
All dependent coverage is optional. Basic coverage is a comprehensive major medical group health insurance plan. During fiscal year 2015, deductibles were $1,800 for those enrolled in Medicare Part A and eligible for Part B, $3,000 for those not enrolled in Medicare Part A, but eligible for Part B, and $4,000 for those not enrolled in Medicare. Financial Section 75 .
Notes to the Financial Statements At August 31, 2015, the number of reporting entities is summarized in the chart below. Other contributing entities include the State of Texas and the Federal Government. Independent School Districts Charter Schools (open enrollment only) Regional Education Service Centers Other Educational Districts Total 1,025* 189 20 5 1,239 *Excludes Windham School District which is not covered by OPEB. At August 31, 2015, OPEB membership consisted of the following: Retirees and beneficiaries receiving Benefits Active Plan Members Total 259,578 684,578 944,156 B. CONTRIBUTIONS Funding for free basic coverage is provided by the program based upon public school district payroll. The State of Texas, active public school employee and reporting entities contribution rates and amounts collected are reflected in the table below for fiscal year 2015.
Per Texas Insurance Code, Chapter 1575.204, the public school contribution may not be less than 0.25% or greater than 0.75% of the salary of each active employee of the public school. Funding for optional coverage is provided by those participants selecting the optional coverage. Actuarial implications of the overall funding are determined by the system’s actuary. The following table shows past and future contribution rates: Financial Section 76 .
Notes to the Financial Statements The contributions shown above and premium contributions of $369,066,459 contribute toward the total plan expenditures of $1,664,331,365. Expenses for TRS-Care are recognized as retirees report claims and include a provision for estimated claims incurred but not yet received. The actuarial valuation of TRS-Care is similar to the actuarial valuations performed for the pension plan, except that the OPEB valuation is more complex. All of the demographic assumptions and most of the economic assumptions are identical to those which were adopted by the Board in 2015 based on the 2015 actuarial experience study of TRS. Additional valuation information follows: Valuation Date ..................................................... August 31, 2015 Actuarial Cost Method .................................
Projected Unit Credit Amortization Method ....................................Level Percent, Open Remaining Amortization Period ...................................... 30 Years Asset Valuation Method .................................................... Market Actuarial Assumptions: Investment Rate of Return * .........................................
5.25% Payroll Growth Rate ...................................................... 2.50% Projected Salary Increases *........................... 3.50% to 9.50% Weighted-Average at Valuation Date .......................
4.79% Healthcare Trend Rates *..............................10.00% to 4.20%** *Includes Inflation at 2.50% **Initial rates are 7.50% for medical and 10.00% for prescriptions. Certain economic and behavioral assumptions are unique to medical benefits. The following assumptions used for members of TRS are identical to the assumptions employed in the August 31, 2015 TRS annual actuarial valuation: Rate of Mortality General Inflation Rates of Retirement Wage Inflation Rates of Termination Expected Payroll Growth Rates of Disability Incidence The following assumptions which are specific to TRS-Care were updated from the prior year’s report: ï‚· The trend rates were reset to better reflect the plan’s anticipated experience. The new trend assumptions assume: o Faster growth in prescription drug costs than the prior assumption o Retiree premiums will not increase in FY 2017 o A lower ultimate trend assumption based on the revised inflation assumption ï‚· The ultimate trend assumption was increased by 0.2% to reflect the anticipated costs associated with the “Cadillac Tax”.
This is an excise tax on high cost health plans offered by employers. Beginning in 2018, health plans that cost more than $10,200 for an individual or $27,500 for a family plan will be subject to the tax, which is 40% of the amount that exceeds those thresholds. Financial Section 77 . Notes to the Financial Statements The results of the actuarial valuation reflect a long-term perspective, are dependent on the actuarial assumptions used, and are subject to continual revision as actual results are compared to past expectations and new estimates are made about the future. Actual results can differ, as actual experience deviates from the assumptions. Even seemingly minor changes in the assumptions can materially change the liabilities, calculated contribution rates and funding periods. The actuarial assumptions used are designed to reduce short-term volatility in the liabilities and assets. The plan provisions used in the actuarial valuation are based on the expectations of cost sharing between the employer and plan members.
The calculations are based on the benefits provided under the terms of the substantive plan in effect at the time of the valuation and on the pattern of sharing of costs between the employer and plan members to that point. The projection of the benefits for financial reporting does not explicitly incorporate the potential effects of legal or contractual funding limitations on the pattern of cost sharing between the employer and plan members in the future. C. FUNDED STATUS AND FUNDING PROGRESS – OPEB PLAN The TRS-Care funded status is shown below: Schedule of Funding Progress (DOLLAR AMOUNTS SHOWN IN MILLIONS) (1) Valuation as of August 31 (2) Actuarial Value of Assets 2015 $973 (3) (4) (5) Actuarial Funded Ratio Accrued Unfunded AAL Assets as a % Liability (AAL) (UAAL) (3)-(2) of AAL (2)/(3) $44,203 $43,230 2.2% (6) Annual Covered Payroll (7) UAAL as a % of Covered Payroll (4)/(6) $31,254 138% The Schedule of Funding Progress located immediately following the Notes to the Financial Statements in the Required Supplementary Information (RSI) presents multi-year trend information about whether the actuarial value of plan assets is increasing or decreasing relative to the actuarial accrued liability for benefits paid. NOTE 11: RISK MANAGEMENT The 77th Texas Legislature enacted the Texas Active School Employees Uniform Group Benefits Act (H.B. 3343), establishing a new statewide health coverage program for public school employees and their dependents.
TRS began administering this program, known as TRS-ActiveCare, September 1, 2002. The plan is available to all public school districts, charter schools with open enrollment, education service centers and certain other employers. The risk associated with this program is retained by the plan’s participants, and no risk is transferred to the plan’s administrators, to employers, or to the state. NOTE 12: PENSION DISCLOSURE A.
PLAN DESCRIPTION The Teacher Retirement System of Texas is a public employee retirement system (PERS) that is a multiple-employer, costsharing, defined benefit pension plan with a special funding situation. The plan is administered through a trust and has the following characteristics: Financial Section 78 . Notes to the Financial Statements ï‚· Contributions from employers and non-employer contributing entities to the pension plan and earnings on the plan are irrevocable, ï‚· Pension plan assets are dedicated to providing pensions to plan members in accordance with benefit terms, and ï‚· Pension plan assets are legally protected from the creditors of employers, non-employer contributing entities, and the pension plan administrator. Plan assets are also legally protected from creditors of the plan members. Benefits are established or amended primarily under the authority of the provisions of the Texas Constitution, Article XVI, Section 67 and by the Legislature in the Texas Government Code, Title 8, Subtitle C. The pension’s board of trustees does not have the authority to establish or amend benefits. The normal service retirement is at age 65 with 5 years of credited service or when the sum of the member’s age and years of credited service equals or exceeds 80 years.
The benefit formula is 2.3 percent (multiplier) times the average of the five highest annual creditable salaries times years of credited service to equal the annual standard annuity. For members who are grandfathered, the three highest annual salaries are used. To be eligible for disability retirement, a member must have a physical or mental disability that precludes the member’s continued performance of current duties, and the disability must be certified by the TRS Medical Board as probably permanent.
Reduced service retirement is at age 55 with 5 years of credited service and any age below 50 with 30 years of credited service. A member is fully vested after 5 years of creditable service and entitled to any benefit for which eligibility requirements have been met. The plan does not provide automatic cost of living adjustments (COLA’s).
Death and Survivor retirement benefits are available to the beneficiary of an active member. For more detail about benefits see the Summary of Benefits section in this report. Contributors to the plan include members, employers and the State of Texas as the only non-employer contributing entity. The State is also the employer for senior colleges, medical schools and state agencies including TRS. In each respective role, the State contributes to the plan in accordance with state statutes and the General Appropriations Act. As of August 31, 2015, the numbers of participating employers were as follows: Independent School Districts Charter Schools (open enrollment only) Community and Junior Colleges Senior Colleges and Universities Regional Service Centers Medical Schools Educational Districts State Agencies Total 1,025 189 50 48 20 9 5 ___ 1 1,347 All employees of public, state-supported educational institutions in Texas who are employed for one-half or more of the standard work load and who are not exempted from membership under Texas Government Code, Title 8, Section 822.002, are covered by the system. As of August 31, 2015, TRS gross membership consisted of the following: Retired plan members or beneficiaries currently receiving benefits Inactive plan members entitled to but not yet receiving benefits Active plan members Total Financial Section 79 377,738 252,560 828,945 1,459,243 .
Notes to the Financial Statements The Average Expected Remaining Service Life (AERSL) of 6.9029 is based on the membership information as of the beginning of the fiscal year. B. CONTRIBUTIONS Contribution requirements are established or amended pursuant to the following state laws: (1) Article 16, section 67 of the Texas Constitution requires the legislature to establish a member contribution rate of not less than 6% of the member’s annual compensation and a state contribution rate of not less than 6% and not more than 10% of the aggregate annual compensation paid to members of the system during the fiscal year. Government Code section 821.006 prohibits benefit improvements, if as a result of the particular action, the time required to amortize TRS’ unfunded actuarial liabilities would be increased to a period that exceeds 31 years, or, if the amortization period already exceeds 31 years, the period would be increased by such action. Actuarial implications of the funding provided in this manner are determined by the system’s actuary. As the non-employer contributing entity, the State of Texas contributes to the retirement system an amount equal to the current employer contribution rate times the aggregate annual compensation of all members of the pension trust fund during that fiscal year reduced by the amounts described below which are paid by the employers. Employers (public school, junior college, other entities or the State of Texas as the employer for senior universities and medical schools) are required to pay the employer contribution rate in the following instances: • On the portion of the member's salary that exceeds the statutory minimum for members entitled to the statutory minimum under Section 21.402 of the Texas Education Code. ï‚· During a new member’s first 90 days of employment. ï‚· When any part or all of an employee’s salary is paid by federal funding sources, a privately sponsored source, from non-educational and general, or local funds. ï‚· When the employing district is a public junior college or junior college district, the employer shall contribute to the retirement system an amount equal to 50% of the state contribution rate for certain instructional or administrative employees; and 100% of the state contribution rate for all other employees. Employers are also required to pay surcharges in the following cases: • When a school district or charter school does not contribute to the Federal Old-Age, Survivors and Disability Insurance (OASDI) Program for certain employees, they must contribute 1.5% of the applicable salary.
Senate Bill 1458 of the 83rd Texas Legislature amended the Government Code section 825.402 to add the 1.5% contribution for those school districts and charter schools. • When employing a retiree of the Teacher Retirement System, the employer shall pay an amount equal to the member contribution and the state contribution as an employment after retirement surcharge. Employee contribution rates are set in state statute, Texas Government Code 825.402. Senate Bill 1458 of the 83rd Texas Legislature amended Texas Government Code 825.402 for member contributions and established employee contribution rates for fiscal years 2015 thru 2017. The 83rd Texas Legislature, General Appropriations Act established the employer contribution rate for fiscal year 2015.
Contribution rates and amounts for fiscal year 2015 are as follows: Financial Section 80 . Notes to the Financial Statements Fiscal Year 2015 Contribution Rate Contributor Member Non-Employer Contributing Entity (State) Employers Total 6.7 % 6.8 6.8 Amount $2,576,024,311 1,591,482,988 1,017,295,316 $5,184,802,615 The following table shows past and future contribution rates: Year Contribution Rates Member 2013 2014 2015 2016 2017 6.4% 6.4 6.7 7.2 7.7 Employer 6.4% 6.8 6.8 6.8 6.8 C. LEGAL RESERVE ACCOUNT BALANCES Section 825.309 of the Government Code requires that money in the Retired Reserve Account be used to pay all retirement annuities and all death or survivor benefits, including post-retirement benefit increases and other adjustments to annuities. The balances in the statutory accounts as of August 31, 2015 were: Member Savings Account State Contribution Account Retired Reserve Account Deferred Retirement Option Account Expense Account Total (Exhibit 1) $ 33,982,141,449 12,400,234,982 82,026,879,743 29,290,153 100,159,885 $ 128,538,706,212 D. DEFERRED RETIREMENT OPTION PROGRAM The Deferred Retirement Option Plan (DROP) was closed to new members on December 31, 2005. It was a plan available for active members who were eligible for normal age service retirement and had at least 25 years of credited service.
They could choose to participate in 12-month increments for up to five years. For detailed information on the plan, see the Summary of Benefits section. The remaining balance in the reserve account is shown in item C.
above. Financial Section 81 . Notes to the Financial Statements E. PENSION LIABILITY Components of the Liability – Components of the Net Pension Liability of the pension plan as of August 31, 2015 are as follows: Components of Liability Total Pension Liability Less: Plan Fiduciary Net Position Net Pension Liability Net Position as a Percentage of Total Pension Liability Amount $163,887,375,172 (128,538,706,212) $ 35,348,668,960 78.43 % Actuarial Assumptions – The total pension liability is determined by an annual actuarial valuation. The actuarial methods and assumptions have been selected by the Board of Trustees based upon analysis and recommendations by the System’s actuary. The Board of Trustees has sole authority to determine the actuarial assumptions used for the plan.
The actuarial methods and assumptions are primarily based on a study of actual experience for the four year period ending August 31, 2014 and were adopted in September 2015. The active mortality rates were based on 90% of the RP 2014 Employee Mortality Tables for males and females. The Postretirement mortality rates were based on the 2015 TRS Healthy Pensioner Mortality Tables. Discount Rate – A single discount rate of 8.0 % was used to measure the total pension liability. There was no change in the discount rate since the previous fiscal year.
This single discount rate was based on the expected rate of return on pension plan investments of 8.0%. The projection of cash flows used to determine this single discount rate assumed that contributions from plan members and those of the contributing employers and the non-employer contributing entity will be made at the rates set by the legislature during the 2013 legislative session and continued in the 2015 session. Based on those assumptions, the pension plan’s fiduciary net position was projected to be available to make all future benefit payments of current plan members. Therefore, the long-term expected rate of return on pension plan investments was applied to all periods of projected benefit payments to determine the total pension liability with no cross-over point to a municipal bond rate. The long-term expected rate of return on pension plan investments is 8.0%.
The long-term expected rate of return on pension plan investments was determined using a building-block method in which best estimate ranges of expected future real rates of return (expected returns, net of pension plan investment expense and inflation) are developed for each major asset class. These ranges are combined to produce the long-term expected rate of return by weighting the expected future real rates of return by the target asset allocation percentage and by adding expected inflation. Best estimates of geometric real rates of return for each major asset class included in the System’s target asset allocation as of August 31, 2015 are summarized in Note 3. Financial Section 82 .
Notes to the Financial Statements The following assumptions were applied to this measurement period: Valuation Date Actuarial Cost Method Asset Valuation Method Actuarial Assumptions: Single Discount Rate Long-term expected Investment Rate of Return Municipal Bond Rate* Last year ending August 31 in the 2015 to 2114 projection period (100 years) Inflation Salary Increases Benefit Changes during the year Ad hoc post-employment benefit changes * August 31, 2015 Individual Entry Age Normal Market Value 8.00 % 8.00 % N/A* 2114 2.50 % 3.50 % to 9.50 % including inflation None None If a municipal bond rate was to be used, the rate would be 3.790% as of August 2015 (i.e. the weekly rate closest to but not later than the Measurement Date). The source for the rate is the Federal Reserve Statistical Release H.15, citing the Bond Buyer Index of general obligation bonds with 20 years to maturity and an average AA credit rating. Sensitivity of the Net Pension Liability – The following presents the net pension liability of the plan using the discount rate of 8 percent, as well as what the net pension liability would be if it were calculated using a discount rate that is onepercentage point lower (7%) or one-percentage point higher (9%) than the current rate: Sensitivity of the Net Pension Liability to the Single Discount Rate Assumptions 1% Decrease Current Single Discount Rate 1% Increase 7% 8% 9% $55,384,701,778 $35,348,668,960 $18,659,898,872 NOTE 13: SUBSEQUENT EVENTS Teacher Retirement System formed a “private limited company” or subsidiary in the United Kingdom. The name of the subsidiary is “Teacher Retirement Investment Company of Texas Ltd.” The subsidiary was created for the purpose of opening a London investment office and is expected to be operational in November 2015.
The primary purpose of the office is to increase the size and number of investment opportunities for the TRS portfolio, especially in private equity funds and co-investments. Financial Section 83 . Required Supplementary Information PENSION TRUST FUND Fiscal Years 2006-2015 SCHEDULE OF CHANGES IN THE EMPLOYERS' NET PENSION LIABILITY AND RELATED RATIOS LAST TEN FISCAL YEARS (DOLLAR AMOUNTS SHOWN IN THOUSANDS) 2015 Total Pension Liability* Service Cost Interest on Net Pension Liability Differences between Expected and Actual Experience Changes of Actuarial Assumptions Benefit Payments Refunds of Member Accounts Net Change in Total Pension Liability Total Pension Liability--Beginning Total Pension Liability--Ending (a) Plan Fiduciary Net Position Contributions--Employer Contributions--Member Non-Employer Contributing Entity Net Investment Income Benefit Payments Refunds of Member Accounts Administrative Expense Other Net Change in Plan Fiduciary Net Position $ 4,225,449 $ 12,555,646 2014 2013 3,965,994 $ 11,813,446 $ (1,588,619) 482,639 (1,474,724) 2,028,541 (8,935,112) (8,548,643) (391,341) (410,600) $ 4,391,299 $ 9,331,377 159,496,076 150,164,699 $ 163,887,375 $ 159,496,076 $ 150,164,699 $ $ 1,377,973 $ 2,576,024 1,591,483 (412,759) (8,935,112) (391,341) (35,557) (11,248) (4,240,537) $ 984,552 $ 2,357,686 1,530,624 19,434,430 (8,548,643) (410,600) (41,904) 84,954 15,391,099 $ 2012 $ 925,694 $ 2,252,095 1,337,215 9,834,136 (8,075,209) (391,292) (36,264) 91,882 5,938,257 $ 0 760,838 2,188,020 1,299,078 7,847,298 (7,723,622) (381,231) (33,074) 71,793 4,029,100 Plan Fiduciary Net Position--Beginning Plan Fiduciary Net Position--Ending (b) $ 132,779,243 $ 117,388,144 $ 111,449,887 $ 107,420,787 $ 128,538,706 $ 132,779,243 $ 117,388,144 $ 111,449,887 Net Pension Liability--Ending (a)-(b) $ 35,348,669 $ 26,716,833 $ 32,776,555 Plan Fiduciary Net Position as a Percentage of the total Pension Liability* Covered-Employee Payroll Net Pension Liability as a percentage of Covered - Employee Payroll $ 78.43% 38,448,124 $ 83.25% 36,654,291 $ 78.17% 35,188,983 91.94% 72.89% 93.14% *Total pension liability is calculated using a new methodology, and will be presented on a prospective basis in accordance with GASB 67, paragraph 50. Financial Section 84 . Required Supplementary Information PENSION TRUST FUND Fiscal Years 2006-2015 2011 2010 $ $ $ $ 2009 $ 0 $ 856,220 $ 2,243,955 1,484,286 14,636,935 (7,173,505) (334,269) (35,850) 54,610 11,732,382 $ $ 95,688,405 $ $ 107,420,787 $ 2008 $ 0 $ 2007 $ 0 $ 835,605 $ 791,450 $ 2,205,017 2,107,058 1,461,035 1,378,304 9,411,447 (13,971,869) (6,617,397) (6,294,434) (265,187) (266,695) (29,993) (28,310) 34,906 26,970 7,035,433 $ (16,257,526) $ 2006 $ 0 $ 703,723 $ 1,998,139 1,352,243 (4,604,972) (6,406,645) (278,003) (26,124) 43,335 (7,218,304) $ $ 0 $ 469,568 $ 1,862,596 1,283,642 14,298,547 (5,762,885) (280,006) (27,503) 45,878 11,889,837 $ 0 432,811 1,700,415 1,166,690 8,950,870 (5,540,134) (267,810) (26,444) 114,749 6,531,147 88,652,972 $ 104,910,498 $ 112,128,780 $ 100,238,963 $ 93,707,816 95,688,405 $ 88,652,972 $ 104,910,498 $ 112,128,780 $ 100,238,963 Financial Section 85 . Required Supplementary Information PENSION TRUST FUND For Fiscal Years Ending August 31 Fiscal Year Ended August 31 2013 2014 2015 SCHEDULE OF THE EMPLOYERS' NET PENSION LIABILITY (HISTORICAL) (DOLLAR AMOUNTS IN THOUSANDS) Plan Net Position as a % of Total Total Pension Plan Net Net Pension Covered Pension Liability Liability Position Liability Payroll $150,164,699 159,496,076 163,887,375 $117,388,144 132,779,243 128,538,706 $32,776,555 26,716,833 35,348,669 78.17% 83.25 78.43 NPL as a % of Covered Payroll $35,188,983 36,654,291 38,448,124 93.14% 72.89 91.94 *Total pension liability is calculated using a new methodology, and will be presented on a prospective basis in accordance with GASB 67, paragraph 50. SCHEDULE OF EMPLOYER AND NON-EMPLOYER CONTRIBUTING ENTITY ACTUARIALLY DETERMINED CONTRIBUTIONS (ADC) Fiscal Year Ending August 31 Actuarially Determined Contribution 2014 2015 $3,177,927,012 3,171,970,234 Actual Contribution $2,515,176,220 2,969,455,641 Contribution Deficiency (Excess) Covered Payroll $662,750,792 202,514,593 Actual Contribution as a % of Covered Payroll $36,654,290,800 38,448,124,045 6.86% 7.72 *This schedule will be presented on a prospective basis in accordance with GASB 67, paragraph 50. NOTE 1 Actuarial Assumptions – The information presented in the preceding table was used in the actuarial valuation for determining the actuarially determined contribution rate. The assumptions are as follows: Valuation Date Actuarial Cost Method Amortization Method Remaining Amortization Period Asset Valuation Method Actuarial Assumptions: Inflation Salary Increases Investment Rate of Return Ad hoc post-employment benefit changes Benefit Changes during the year August 31, 2015 Ultimate Entry Age Normal Level Percentage of Payroll, Open 33 years 5 year Smoothed Market 2.5 % 3.5% to 9.50% including inflation 8.00% None None Financial Section 86 . Required Supplementary Information PENSION TRUST FUND For Fiscal Years Ending August 31 SCHEDULE OF INVESTMENT RETURNS Annual Money-Weighted Rate of Return, Net of Investment Expense 2015 2014 2013 2012 2011 2010 2009 -0.27% 16.90% 9.00% 7.46% 15.57% 10.80% (13.57%) *This schedule will be presented on a prospective basis in accordance with GASB 67, paragraph 50. Financial Section 87 . Required Supplementary Information TRS-CARE For Fiscal Years 2009 – 2015 [1] Valuation as of August 31 [2] Actuarial Value of Assets 2009 2010 2011 2012 2013 2014 2015 $800 815 891 741 551 458 973 SCHEDULE OF FUNDING PROGRESS (DOLLAR AMOUNTS SHOWN IN MILLIONS) [5] [4] Funded [3] Unfunded Ratio Actuarial AAL Assets as a Accrued Liability (UAAL) % of AAL (AAL) (3)-(2) (2)/(3) $24,357 25,808 29,785 27,542 29,835 33,719 44,203 $23,557 24,993 28,894 26,801 29,284 33,261 43,230 3.3% 3.2 3.0 2.7 1.8 1.4 2.2 [6] Annual Covered Payroll [7] UAAL as a % of Covered Payroll (4)/(6) $29,490 30,758 30,515 29,777 30,511 32,247 31,254 80% 81 95 90 96 103 138 SCHEDULE OF CONTRIBUTIONS FROM EMPLOYERS AND OTHER CONTRIBUTING ENTITIES Annual Required Contributions (ARC) (DOLLAR AMOUNTS SHOWN IN THOUSANDS) Actual Contributions [1] Fiscal Year Ended 2009 2010 2011 2012 2013 2014 2015 [2] Annual Required Contributions (ARC) $1,655,647 1,806,751 1,821,817 1,980,371 1,898,160 2,058,689 2,357,011 [3] From State [4] From Employers $267,471 279,251 282,891 272,029 241,577 303,695 1,049,199 [5] On-Behalf From Federal Government $149,563 155,918 158,724 154,608 160,953 193,125 202,976 Financial Section 88 $61,531 70,796 136,888 68,634 74,511 78,589 126,807 [6] Total (3)+(4)+(5) [7] Percentage Contributed (6)/(2) $478,565 505,965 578,503 495,271 477,041 575,409 1,378,982 28.9% 28.0 31.8 25.0 25.1 28.0 58.5 . Notes to Required Supplemental Information TRS-CARE Fiscal Years 2009 - 2015 NOTE 1 The employer ARC was determined by netting the active employee contributions (0.65%) out of the total ARC (8.38%). The ARC for FY2015 was determined by applying the Employer ARC determined in the 2014 valuation as a percentage of payroll (7.73%) to the actual payroll paid in FY2015 ($30.5 billion). Financial Section 89 . This page is intentionally left blank. Financial Section 90 . Statement of Changes in Assets and Liabilities Agency Funds For the Fiscal Year Ended August 31, 2015 Balances September 1, 2014 Additions Deductions Balances August 31, 2015 Child Support Employee Deductions Total Assets: Cash in State Treasury $5,387 $72,715 $71,503 $6,599 TOTAL ASSETS $5,387 $72,715 $71,503 $6,599 5,387 $72,715 $71,503 $6,599 TOTAL LIABILITIES 5,387 $72,715 $71,503 $6,599 The accompanying Notes to the Financial Statements are an integral part of this financial statement. Financial Section 91 Exhibit A Total Liabilities: Funds Held for Others . Comparative Schedule of Changes in Account Balance PENSION TRUST FUND FOR THE FISCAL YEAR ENDED AUGUST 31, 2015 (With Comparative Data for August 31, 2014) Schedule 1 INTEREST ACCOUNT 2015 Additions Interest, Dividends and Other Income: Short-Term Equities Fixed Income Derivatives Securities Lending Program Net Increase/ (Decrease) in Fair Value of Investments Transfer from State Contribution Account for: Investment Income* Net Depreciation in Fair Value of Investments TOTAL ADDITIONS Deductions Bank Fees External Manager Fees External Legal Fees External Custodial Fees Transfers Out: Allocation of Interest to (from): Member Savings Account Retired Reserve Account Deferred Retirement Option Account Expense Account Transfer to State Contribution Account for Net Appreciation in Fair Value of Investments TOTAL DEDUCTIONS $ 2014 3,296,668 6,248,497,146 620,420,534 $ 81,873,039 18,897,780 1,254,816,385 1,851,686,895 (6,488,625) 72,534,019 (7,107,642,634) 16,443,655,756 212,729,627 7,107,642,634 7,166,817,014 4,463,894,756 $ $ 7,150,913 181,939,993 2,655,297 22,000,000 $ 24,098,996,966 $ 930,643 152,954,835 659,595,576 6,189,324,942 667,930 103,482,363 1,568,996,846 5,824,476,921 2,295,263 105,686,702 $ 7,166,817,014 $ 16,443,655,756 24,098,996,966 Net Change in Account Balance Account Balance - Beginning September 1 $ $ 0 0 $ $ 0 0 Account Balance - Ending August 31 $ 0 $ 0 * The prior year transfer of $4,463,894,756 from State Contributions for Investment Income was reported in the Deductions section in 2014. Financial Section 92 . Comparative Schedule of Changes in Account Balance PENSION TRUST FUND FOR THE FISCAL YEAR ENDED AUGUST 31, 2015 (With Comparative Data for August 31, 2014) MEMBER SAVINGS ACCOUNT $ 2,576,024,311 2014 $ 2,357,686,000 23,508,475 6,247,139 67,386,116 $ 659,595,576 3,259,128,362 $ 1,568,996,846 4,000,316,101 $ 385,866,706 $ 405,144,490 $ 24,054,441 2,037,001,787 2,446,922,934 $ 21,531,326 1,926,583,284 2,353,259,100 Net Change in Account Balance Account Balance - Beginning September 1 $ 812,205,428 $ 33,169,936,021 $ $ 1,647,057,001 31,522,879,020 Account Balance - Ending August 31 $ 33,982,141,449 $ 33,169,936,021 Deductions Refund of Contributions-Active Transfers Out: Transfer to Retired Reserve Account: For Dormant Accounts To Fund Benefits TOTAL DEDUCTIONS Financial Section 93 Schedule 1 Additions Contributions: Contributions Paid by Member Employment After Retirement Surcharge Paid by Employers - Employee Purchase of Service Credit-Refundable Transfer In: Allocation from Interest Account TOTAL ADDITIONS 2015 . Comparative Schedule of Changes in Account Balance PENSION TRUST FUND FOR THE FISCAL YEAR ENDED AUGUST 31, 2015 (With Comparative Data for August 31, 2014) Schedule 1 STATE CONTRIBUTION ACCOUNT 2015 Additions Contributions: State's General Fund - Non-Employer Contributing Entity State's General Fund - Employer Participating Employer Surcharges: Employment after Retirement - Employee Employment after Retirement - Employer Non-OASDI Participating Employers Purchase of Service Credit-Non-Refundable Transfers In: Transfers from Interest Account for Net Increase in Fair Value of Investments Transfers from Retired Reserve Account: For Retirement Benefits Forfeited While Member Returned to Teaching For Retirement Benefits Waived by Member TOTAL ADDITIONS $ 2014 1,591,482,988 93,079,033 924,216,283 $ 1,530,623,829 120,206,921 851,936,793 7,481,714 8,339,748 344,855,875 26,580,631 6,161,538 76,147,975 16,443,655,756 Net Change in Account Balance Account Balance - Beginning September 1 654,798 38,940 $ 19,029,426,550 212,729,627 7,107,642,634 $ 4,463,894,756 4,339,063,087 556,680,791.0 $ 12,216,116,139 4,186,949,487 1,320,132,885 $ 9,970,977,128 $ (9,218,949,080) $ 21,619,184,062 Deductions Transfers Out: Transfers to Interest Account: For Investment Income For Net Decrease in Fair Value of Investments Transfers to Retired Reserve Account: To Fund Benefits Based on Actuarial Valuation as of August 31 TOTAL DEDUCTIONS 1,096,898 33,889 2,997,167,059 $ 9,058,449,422 $ 12,560,734,640 $ $ Account Balance - Ending August 31 $ 12,400,234,982 $ 21,619,184,062 * The prior year transfer of $4,463,894,756 to the Interest Account for Investment Income was reported in the Additions section in 2014. Financial Section 94 . Comparative Schedule of Changes in Account Balance PENSION TRUST FUND FOR THE FISCAL YEAR ENDED AUGUST 31, 2015 (With Comparative Data for August 31, 2014) RETIRED RESERVE ACCOUNT Additions Contributions Transferred in from Employees Retirement System of Texas $ 18,989,008 2014 $ 17,440,313 6,189,324,942 5,824,476,921 24,054,441 2,037,001,787 21,531,326 1,926,583,284 4,339,063,087 556,680,791 4,186,949,487 1,320,132,885 40,337 13,165,154,393 7,625 $ 13,297,121,841 8,215,765,876 288,923,266 169,318,064 $ 7,795,690,586 322,033,388 164,299,506 39,574,595 100,150,048 90,563,081 14,443,193 6,730,215 5,474,475 44,846,010 97,822,817 89,547,742 13,415,885 6,012,086 5,455,829 84,059,353 80,163,847 $ 1,096,898 33,889 9,016,132,953 654,798 38,940 $ 8,619,981,434 Net Change in Account Balance Account Balance - Beginning September 1 $ $ 4,149,021,440 77,877,858,303 $ 4,677,140,407 $ 73,200,717,896 Account Balance - Ending August 31 $ 82,026,879,743 $ 77,877,858,303 Deductions Benefits Paid: Service Retirement Annuities Partial Lump Sums Disability Retirement Annuities Death and Survivor Benefits: Annual Salary Survivor Annuities Life Annuities 60 Monthly Payments Remainder of Contributions Refund of Contributions-Death Benefits Transferred to Employees Retirement System of Texas Retirement Benefits Forfeited While Member: Returned to Teaching For Retirement Benefits Waived by Member TOTAL DEDUCTIONS $ $ Financial Section 95 Schedule 1 Transfers In: Allocation from Interest Account Transfer from Member Savings Account: For Dormant Accounts To Fund Benefits Transfer from State Contribution Account: To Fund Benefits Based on Actuarial Valuation as of August 31 Transfer from Deferred Retirement Option Account to Fund Benefits TOTAL ADDITIONS 2015 . Comparative Schedule of Changes in Account Balance PENSION TRUST FUND FOR THE FISCAL YEAR ENDED AUGUST 31, 2015 (With Comparative Data for August 31, 2014) DEFERRED RETIREMENT OPTION ACCOUNT Schedule 1 Additions Transfers In: Allocation from Interest Account TOTAL ADDITIONS Deductions Benefits Paid Transfer Out: Transfer from Retired Reserve Account to Fund Benefits TOTAL DEDUCTIONS Net Change in Account Balance Account Balance - Beginning September 1 Account Balance - Ending August 31 Financial Section 96 2015 2014 $ $ 667,930 667,930 $ $ 2,295,263 2,295,263 $ 9,643,121 $ 14,974,505 $ $ $ $ 40,337 9,683,458 (9,015,528) 38,305,681 29,290,153 $ $ $ $ 7,625 14,982,130 (12,686,867) 50,992,548 38,305,681 . Comparative Schedule of Changes in Account Balance PENSION TRUST FUND FOR THE FISCAL YEAR ENDED AUGUST 31, 2015 (With Comparative Data for August 31, 2014) EXPENSE ACCOUNT 2015 $ $ 4,143,449 $ Deductions: Administrative Expenses: Salaries, Wages and Other Personnel Costs Professional Fees and Services Travel Materials and Supplies Communicatons and Utilities Repairs and Maintenance Rentals and Leases Printing and Reproduction Depreciation Expense Amortization Expense Loss on Capital Assets Other Expense TOTAL DEDUCTIONS 3,733,133 103,482,363 107,215,496 $ 105,686,702 109,830,151 $ 63,381,520 1,634,050 921,395 3,470,876 644,183 3,693,269 1,879,531 235,925 2,939,923 530,953 $ $ 1,683,004 81,014,629 * $ 59,369,410 10,264,842 1,062,078 3,614,537 928,820 6,270,907 1,815,219 294,754 3,116,326 428,434 23,994 1,501,567 88,690,888 Net Change in Account Balance Account Balance - Beginning September 1 $ $ 26,200,867 73,959,018 $ $ 21,139,263 52,819,755 Account Balance - Ending August 31 $ 100,159,885 $ 73,959,018 * This amount includes total internal administrative investing activity expenses of $45,457,650 (Schedule 3) and Administrative expenses net of investing activity expenses are $35,556,979 (Exhibit II). Financial Section 97 Schedule 1 Additions: Miscellaneous Revenues Transfer In: Allocation from Interest Account TOTAL ADDITIONS 2014 . Schedule of Administrative Expenses FOR THE FISCAL YEAR ENDED AUGUST 31, 2015 Schedule 2 Pension Trust Fund Personnel Services: Salaries and Wages: Salaries Longevity Pay Benefit Replacement Pay Employee Compensable Absences Payroll Related Costs: Employer FICA Contributions Employer Health Insurance Contributions Other Employee Benefits TOTAL PERSONNEL SERVICES $ 19,753,092 419,397 57,304 734,145 TRS-Care $ 2,342,313 58,579 9,539 3,969 Other Operating Expenses: Travel Materials and Supplies: Consumable Supplies and Fuels Subscriptions and Reference Information Postage, Mailing and Delivery Services Furniture and Equipment - Expensed Communications and Utilities Repairs and Maintenance Software Purchases and Maintenance Computer Hardware Maintenance Maintenance - Buildings and Equipment Rentals and Leases Printing and Reproduction Depreciation Expense Amortization Expense Other Expense Dues, Fees and Staff Development Insurance Premiums Other Miscellaneous Expenses TOTAL OTHER OPERATING EXPENSES $ 2,901,229 $ Professional Fees and Services $ 2,305,525 4,552,174 4,212 27,825,849 175,867 310,962 369,886 $ 731,307 $ 93,414 $ 7,698 215,408 44,671 1,536,735 459,352 132,364 896 500 39,734 516 2,212 903,709 294,727 790,542 187,193 69,353 1,641,856 530,953 54,490 12,750 $ 193,816 53,448 213,703 7,361,244 $ 17,092 137,144 TOTAL ADMINISTRATIVE EXPENSES $ 35,556,979 $ 3,769,680 Financial Section 98 1,256 . TRS-ActiveCare $ 1,148,008 20,522 1,134 (8,552) 403(b) Administrative Program $ 79,090 Total $ 1,031 (8,167) $ 83,035 129,278 2,103 1,375,528 6,492 $ $ 782,921 $ 6,779 23,322,503 498,498 69,008 721,395 $ 2,570,919 4,992,414 6,315 32,181,052 $ $ 1,884,114 $ $ 107,891 78,446 308 635 216,612 45,806 1,576,469 459,868 135,632 1,056 903,709 294,727 790,792 298,351 82,103 1,641,856 530,953 250 56,668 345 $ 926 66,967 $ 0 $ 195,417 53,448 231,721 7,565,355 $ 2,225,416 $ 78,446 $ 41,630,521 Financial Section 99 . Comparative Schedule of Investing Activity Expenses PENSION TRUST FUND FOR THE FISCAL YEAR ENDED AUGUST 31, 2015 (With Comparative Data for August 31, 2014) Schedule 3 2015 Direct Expenses: Salaries and Other Personnel Costs Professional Fees and Services Consumable Supplies Travel Building Lease Copier Rentals Dues, Fees and Staff Development Subscriptions and Reference Materials Reproduction and Printing Services Software Upgrades Telecommunication and Data Services Furniture and Equipment - Expensed Depreciation - Leasehold Improvements Total Direct Expenses Indirect Expenses: Depreciation Executive Management Support Legal Support Audit Support Human Resources Support Fiscal Management Support Information Technology Support Staff Services Support Other Support Services Total Indirect Expenses Total Internal Administrative Investing Activity Expenses* Bank Fees** External Manager Fees** External Legal Fees** External Custodial Fees** Total Investing Activity Expenses (Exh. II)*** $ 30,504,075 254,558 14,709 720,295 1,430,445 97,441 42,641 63,092 12,565 110,545 300,894 83,661 259,729 33,894,650 $ 350,965 2,860,773 2,257,077 623,865 786,448 1,261,884 2,008,639 1,032,172 381,177 11,563,000 45,457,650 7,150,913 181,939,993 2,655,297 22,000,000 259,203,853 $ $ $ $ $ $ $ 2014 $ $ $ 25,389,603 4,094,014 20,568 780,085 1,347,329 92,937 32,165 49,660 9,361 128,291 400,761 58,677 516,031 32,919,482 326,386 2,829,854 3,086,944 596,652 661,321 1,220,623 3,514,812 1,176,764 453,860 13,867,216 46,786,698 152,954,835 930,643 $ 200,672,176 * Total is not netted against or included in performance calculations. ** Performance calculations are net of Bank Fees, External Legal Fees, External Manager Fees and External Custodial Fees. *** The investing activity expenses do not include the following expenditures: During fiscal year 2015, the system paid commissions to various brokers totaling $67,337,677. A portion of the total commissions was paid through various Commission Sharing Arrangements (CSA) generating $22,409,961 in CSA proceeds. These proceeds were used in accordance with Section 28(e) of the Securities Exchange Act of 1934 to acquire research services from various investment related firms totaling $21,069,278.
Unspent CSA proceeds (totaling $5,221,095) are held by State Street Bank and Trust Company as the system’s CSA Administrator. During fiscal year 2015, the system paid commissions through various external managers totaling $831,289. A portion of the total commissions was paid through various Commission Recapture Arrangements (CRA) generating $453,328 in CRA proceeds. These proceeds were used to acquire services totaling $194,018.
Unspent CRA proceeds (totaling $479,693) are held by State Street Bank and Trust Company as the system's CRA Administrator. Through its contractual agreements with various firms, the system benefited from $5,041,965 in vendor paid expenses and contractual allowances. Vendor paid expenses are legal arrangements that are used to acquire investment related items other than those paid for with soft dollar credits and CSA proceeds. In addition to the commission expenses mentioned above, $695,661,445 was paid to various Alternative and Pooled Investment General Partners for a total of $762,999,122 in fees and commissions, which are not included in Investing Activities Expense on Exhibit II. These amounts are reported in the Schedule of Fees and Commissions and are netted against investment performance on Exhibit II in the Net Increase/(Decrease) in Fair Value of Investments.
Custodial management fees were netted against income from securities lending activities. Financial Section 100 . Schedule of Professional and Consulting Fees ALL FUNDS FOR THE FISCAL YEAR ENDED AUGUST 31, 2015 Nature of Service Consulting Services Consulting Services Actuarial Services Investment Consulting Services Investment Consulting Services Legal Services Consulting Services Investment Consulting Services Financial and Accounting Services Investment Consulting Services Temporary Employment Services Other Professional Services Temporary Employment Services Legal Services Temporary Employment Services Consulting Services Investment Consulting Services Financial and Accounting Services Financial and Accounting Services Temporary Employment Services Consulting Services Consulting Services Board Election Services Consulting Services Investment Consulting Services Investment Consulting Services Investment Consulting Services Consulting Services Consulting Services Consulting Services Consulting Services Legal Services Consulting Services Consulting Services Medical Services Medical Services Medical Services Financial and Accounting Services Consulting Services Consulting Services Consulting Services Temporary Employment Services Consulting Services Consulting Services Other Professional Services Temporary Employment Services Consulting Services Other Professional Services Other Professional Services Prior Year Expenditure Adjustment TOTAL PROFESSIONAL AND CONSULTING FEES Financial Section 101 Amount $ 15,200,000 1,588,216 1,502,211 1,350,000 1,133,333 864,488 645,000 600,000 440,424 400,000 362,061 283,481 266,356 262,342 228,707 175,808 157,500 145,573 134,700 129,600 122,485 115,000 111,486 109,000 95,301 95,000 80,000 75,000 65,394 51,000 47,500 45,000 43,514 41,800 36,630 36,630 36,630 33,225 31,200 29,000 28,756 23,770 22,740 18,092 16,051 15,276 12,310 11,350 55,916 $ 27,374,856 (1,966,840) $ 25,408,016 Schedule 4 Individual or Firm Hewlett Packard Allied Consultants Inc Gabriel, Roeder, Smith, & Company Hamilton Lane Advisors LLC Hewitt Ennis Knupp, Inc Jackson Walker LLP Cognizant Technology Solutions Townsend Group, The Ernst & Young LLP Albourne America Teksystems Austin Ribbon & Computer Supplies Inc Loblolly Consulting LLC Katten Muchin Rosenman LLP Soal Technologies LLC Focus Consulting Group Inc Green Street Advisors Sagebrush Solutions Inc State Auditors Office Rhyan Technology Services Gartner Group CEM Benchmarking Inc Vr Election Services Dba Voice Retrieval Forrester Research, Inc State Street Bank And Trust Company Rosen Consulting Group Brown, Keith C. Momentum Search Partner LLC Mobius Partners Inc Customer Relationship Metrics LC Corporate Executive Board Cohen Milstein Sellers & Toll, PLLC Franklin Covey Co Perryman Group Cox, Alice D. Md Reinarz, James Allen Md Wilson, Larry Md Protiviti Inc Adjacent Technologies Inc Planet Technologies Inc Myers And Stauffer LC TIBH Industries Inc Unify Inc Workers Assistance Program Inc Lyris Technologies Unboundid Corp Texas Facilities Commission API Productions LLC Aggregate Payees less than $10,000 . This page is intentionally left blank. Financial Section 102 . INVESTMENT SECTION . Investment Overview PORTFOLIO STRUCTURE TRS follows a diversified investment approach that focuses on the three most common economic scenarios. Scenario One is characterized by favorable Gross Domestic Product (GDP) growth and moderate inflation as measured by the Consumer Price Index (CPI), which has been the prevailing economic condition 68 percent of the time since 1948. Scenario Two is one of low GDP growth and high inflation, which has occurred 18 percent of the time. Finally, Scenario Three is characterized by stagnant GDP growth and low inflation, which has occurred 14 percent of the time.
TRS is positioned to take advantage of any of these various market scenarios. TRS’s long-term asset allocation target is 57 percent to Global Equity markets, which perform well under Scenario One, 22 percent to Real Return, which should perform well in Scenario Two, 16 percent to a Stable Value portfolio, which should perform well and minimize downside risk in Scenario Three, and 5 percent to the Risk Parity strategy, which has a balanced exposure to all three economic scenarios. INVESTMENT PORTFOLIO PERFORMANCE For the year ending Aug. 31, 2015, the TRS Pension Fund (Trust) delivered investment returns of -0.3 percent, which led the fund’s benchmark by 0.5 percent.
Global Equity returned -3.1 percent, but was largely counterbalanced by returns of 6.2 percent in Stable Value and 6.1 percent in Real Return. On a three-year annualized basis, the fund has returned 8.3 percent, which is 1.0 percent above its benchmark. As a result, the total investment value of the fund as of August 31 was $127.9 billion, or $4.3 billion less than this time last year, after contributions and benefit payouts.
Annual rates of return for the five- and 10-year periods ending Aug. 31, 2015 were 9.6 percent and 6.2 percent, respectively. Additional performance information is included on the Total Time-Weighted Returns and Asset Allocation charts on the following pages. The Total Time-Weighted Returns shown are for the 12-month period ended June 30, 2015 and include comparisons with established benchmarks for the same period. Investment performance is calculated using a time-weighted rate of return.
Returns are calculated by State Street Bank and Trust Company, the fund’s custodian bank, independently and using industry best practices. STRATEGIC INITIATIVES The year 2015 marked the seventh anniversary of the TRS Public Strategic Partnership Network (SPN). At its outset, four managers (JP Morgan, Neuberger Berman, Morgan Stanley, and BlackRock) were funded with $1 billion each to invest globally across the same public asset classes as the Trust. As of Aug.
31, 2015, the total Public SPN is valued at $6.3 billion. In addition, each year, the SPN collaborates to produce several research projects used to benefit the Trust and to provide valuable insights into asset allocation. TRS also replicated the SPN concept in the private markets in 2012, establishing long-term partnerships with Apollo and KKR to manage assets in private equity, real assets, and credit markets. In early 2015, TRS committed another $1 billion each to KKR and Apollo to be directed toward tactical opportunities, including non-traditional credit investments.
As of Aug. 31, 2015, the total Private SPN has a net asset value of $2.6 billion and commitments total $10 billion. These partnerships remain in their early stages, but are already proving beneficial to the Trust. The past year saw continued growth in the successful Principal Investments Program, which seeks to take advantage of TRS’s competitive advantages as a large, long-term investor by initiating high-transparency, low-fee, alpha-producing investment arrangements with select investment partners.
Since the beginning of the program in 2009, the fund has committed $6 billion in more than 50 principal investments across Private Equity, Real Assets, Energy and Natural Resources, Special Opportunities, and Internal Public Markets. In addition, the Investment Management Division (IMD) Investment Section 104 . Investment Overview has committed another $1.2 billion across nearly 70 smaller principal investments in separate dedicated vehicles managed by select general partners, as well as an even greater volume of principal investments in side-car vehicles. In late 2014, the IMD executed an initiative called “Preferred Destination” to further increase general partner awareness of IMD’s desire to make TRS one of the world’s primary destinations for large, attractive principal investment opportunities. This effort was highly successful and has resulted in an even greater level of high quality deal flow for TRS, which will continue to make principal investments a greater portion of IMD’s private market investments. To date, this effort has been highly accretive to the Trust’s returns and it should continue to be in the future. To further support the “Preferred Destination” effort, the IMD also announced the opening of an office in London.
The office, which is expected to open in November of 2015, is TRS’s first international office. With a presence in London, the IMD hopes to be a better investment partner, have greater access to attractive deal flow, and be more knowledgeable about markets in the United Kingdom and Europe. TRS will continue to build upon its reputation as a leading institutional investor and strengthen investment relationships with key players overseas. The IMD has a dedicated risk management function.
The Risk group monitors the risk of the fund versus its risk objectives, performs an independent risk certification for every new manager commitment, and monitors the performance of each manager and portfolio monthly with a risk signals review. During the last 12 months, the Risk group continued to refine its suite of tools and reports, including expanding existing risk signals to incorporate additional performance data, Trust holdings data, macro indicators, and risk indicators. They also performed an in-depth review of best practices for stress testing various Trust exposures.
In addition to risk management, the Risk group is also increasingly active in managing certain quantitative investment strategies, with a goal of generating alpha that is uncorrelated to the alpha generated by the rest of the Trust. Looking ahead, return expectations remain muted in the years ahead. Concerns about the resilience of global growth remain, with China’s slowdown taking an increasingly prominent role on the world stage. In addition to China’s policy actions, much of the market’s focus going forward will be on the monetary policy actions of the world’s major central banks, with the Federal Reserve expected to begin raising short-term interest rates in late 2015 or early 2016, while the European Central Bank and the Bank of Japan are expected to remain accommodative. Prepared by: Investment staff of the system Investment Section 105 .
Total Time-Weighted Returns PENSION TRUST FUND For Periods Ended June 30 2010 2011 2012 2013 2014 2015 3 Years 5 Years 10 Years TRS Custom Benchmark2 15.6% 12.8% 22.2% 21.2% 2.7% 4.1% 10.2% 8.7% 16.3% 15.5% 4.2% 3.8% 10.1% 9.2% 10.9% 10.5% 6.8% 6.5% TRS U.S.A. U.S.A. Composite Benchmark3 16.7% 15.6% 31.9% 32.8% 2.2% 3.4% 20.9% 21.2% 24.5% 25.1% 5.8% 7.7% 16.8% 17.8% 16.5% 17.5% N/A N/A TRS Non-U.S. Developed Non-U.S. Developed Composite Benchmark4 8.1% 7.0% 30.1% 30.3% -13.1% -14.1% 18.7% 17.1% 22.8% 23.8% -0.6% -5.3% 13.1% 11.1% 10.4% 9.0% N/A N/A TRS Emerging Markets Emerging Markets Composite Benchmark5 24.3% 23.2% 27.2% 27.8% -15.9% -16.0% 5.6% 2.9% 14.5% 14.3% -4.6% -5.1% 4.9% 3.7% 4.3% 3.7% N/A N/A N/A N/A N/A N/A N/A N/A 10.0% 7.2% 12.6% 7.7% 1.4% 3.8% 7.9% 6.2% N/A N/A N/A N/A TRS Public Equity Public Equity Composite Benchmark7 14.4% 14.3% 30.3% 31.2% -8.1% -7.7% 15.7% 14.8% 20.9% 20.8% 1.3% 0.8% 12.3% 11.8% 11.2% 11.1% 5.8% 5.7% TRS Private Equity Private Equity Composite Benchmark8 24.6% 34.9% 24.6% 21.9% 7.1% 7.3% 16.7% 8.9% 21.7% 17.6% 12.6% 8.4% 16.9% 11.5% 16.4% 12.7% 15.4% 9.3% 16.1% 17.0% 29.5% 30.3% -5.5% -5.2% 15.8% 13.7% 21.0% 20.2% 3.2% 2.3% 13.1% 11.8% 12.1% 11.6% 6.6% 6.2% TRS U.S.
Treasuries U.S. Treasuries Composite Benchmark10 12.7% 12.0% -0.4% -1.1% 33.1% 32.3% -7.9% -8.4% 6.6% 6.3% 8.2% 6.3% 2.0% 1.2% 7.1% 6.2% N/A N/A TRS Absolute Return Absolute Return Composite Benchmark11 34.3% 2.4% 14.0% 2.3% 2.4% 2.5% 28.8% 2.3% 12.3% 2.2% 13.6% 2.3% 18.0% 2.3% 13.9% 2.3% N/A N/A TRS Stable Value Hedge Funds Stable Value Hedge Fund Composite Benchmark12 7.7% 2.4% 5.9% 2.3% -2.6% 1.7% 5.5% 6.9% 5.1% 6.6% 5.2% 2.6% 5.2% 5.5% 3.8% 4.0% 3.8% 4.8% Total TRS Stable Value Stable Value Composite Benchmark13 19.1% 9.3% 5.0% -0.3% 18.9% 23.9% -2.7% -4.6% 6.2% 6.0% 7.6% 5.4% 3.6% 2.2% 6.8% 5.7% 6.0% 5.9% TRS Global Inflation Linked Bonds Global Inflation Linked Bonds Composite Benchmark14 10.3% 10.6% 8.3% 7.7% 11.7% 11.7% -4.5% -4.8% 4.5% 4.4% -1.6% -1.7% -0.6% -0.8% 3.5% 3.3% N/A N/A TRS Real Assets Real Assets Composite Benchmark15 -8.9% -15.7% 19.4% 19.0% 11.5% 13.6% 10.6% 9.7% 13.4% 12.7% 13.2% 12.4% 12.3% 11.6% 14.4% 13.4% N/A N/A N/A N/A N/A N/A N/A N/A N/A N/A N/A N/A -6.3% -9.0% N/A N/A N/A N/A N/A N/A -0.2% -5.4% 28.4% 26.1% -18.2% -10.7% -29.9% 2.0% 32.2% 10.4% -57.0% -36.8% -26.4% -10.7% -16.0% -4.3% N/A N/A 7.7% 2.6% 17.4% 16.8% 10.2% 11.6% 4.6% 5.7% 10.6% 9.8% 6.4% 6.7% 7.2% 7.5% 9.8% 10.1% 7.1% N/A N/A N/A N/A N/A N/A N/A N/A N/A N/A N/A N/A N/A N/A N/A N/A N/A N/A N/A Total Portfolio 1 TRS Directional Hedge Funds Directional Hedge Fund Composite Benchmark6 Total TRS Global Equity Global Equity Composite Benchmark9 TRS Energy and Natural Resources Energy and Natural Resources Composite Benchmark16 TRS Commodities Commodities Composite Benchmark17 Total TRS Real Return Real Return Composite Benchmark18 TRS Risk Parity Risk Parity Benchmark19 1 Time-weighted rates of return adjusted for cash flows. Returns are calculated net of all fees. Investment Section 106 .
Total Time-Weighted Returns PENSION TRUST FUND For Periods Ended June 30 2 42% S&P 500/ 7.5% S&P 400/ 3% S&P 600/ 13% MS ACWI Free Ex-US/ 28.5% LB Aggregate/ 1% SB High Yield Market Index/ 3% Private Equity Composite (3 years at 0, then Russell 2000 + 500 bps)/ 1.5% Absolute Return Composite (70% 3-month LIBOR/ 30% S&P 500)/ 0.5% 91-day T-Bill through 01/05, 50% Total Domestic Equity Composite/ 13.4% MS ACWI Ex-US/ 28.35% LB Aggregate/ 2.06% Citigroup High Yield Index/ 4.12% Private Equity Composite (3 years at 0, then Russell 2000 + 500 bps)/ 1.55% Absolute Return Composite (70% 3-month LIBOR/ 30% S&P 500)/ 0.52% 91-day T-Bill through 9/07, 15% Russell 1000 Growth/ 15% Russell 1000 Value/ 5% Russell 2000/ 15% MSCI EAFE + Canada/ 5% MSCI EM/5 % Russell 3000 + 5%/ 10% Lehman Long Treasuries/ 4% 3 month LIBOR + 2%/ 5% Lehman Intermediate Gov-Credit/ 1% Citigroup 90 day US Treasury/ 10% Lehman Global Inflation Linked Bonds/ 4% Real Estate Composite/ 1% US Core CPI + 5%/ 3% Goldman Sachs Commodity Index/ 2% NAREIT through 9/08, 10% Russell 1000 Growth/ 10% Russell 1000 Value/ 5% Russell 2000/ 8% MSCI EAFE + Canada/ 5% MSCI EM/ 15% MSCI World/ 7% Russell 3000 + 5%/ 12% BC Long Treasuries/ 4% 3 month LIBOR + 2%/ 3% BC Intermediate Gov-Credit/ 1% Citigroup 90 day US Treasury/ 5% BC Global Inflation Linked Bonds/ 5% BC US TIPS/ 5% Real Estate Composite/ 1% US Core CPI + 5%/ 2% Goldman Sachs Commodity Index/ 2% NAREIT through 9/09, 5% MSCI USA Small Cap/ 8% MSCI USA Large Cap/ 33% MSCI World Net/ 6% MSCI EM Net/ 4% 3 month LIBOR + 2%/ 15% BC Long Treasury/ 2% Goldman Sachs Commodity/ 8% BC US TIPS/ 8% SSPEI 1 QTR lagged/ 8% NCREIF ODCE Net lagged/ 2% MSCI US REIT/ 1% 90 day US Treasury through 9/10, 5% MSCI Small Cap/ 20% MSCI USA/ 15% MSCI EAFE + Canada/ 10% MSCI EM/ 15% BC Long Treasuries/ 4% 3 month LIBOR + 2%/ 1% Citigroup 90 day US Treasury/ 8% BC US TIPS/ 2% MSCI US REIT/ 10% SSPEI 1 QTR lagged/ 2% Goldman Sachs Commodity Index/ 8% NCREIF Open Ended fund lagged through 9/11, 2% MSCI Small Cap/ 18% MSCI USA/ 15% MSCI EAFE + Canada/ 10% MSCI EM/ 13% BC Long Treasuries/ 4% HFRI FOF: Conservative Index/ 5% HFRI Fund of Funds Composite/ 1% Citigroup 90 day US Treasury/ 5% BC US TIPS/ 2% MSCI US REIT/ 12% SSPEI 1 QTR lagged/ 13% NCREIF Open Ended fund lagged through 9/12, 2% MSCI Small Cap/ 18% MSCI USA/ 15% MSCI EAFE + Canada/ 10% MSCI EM/ 13% BC Long Treasuries/ 4% HFRI FOF: Conservative Index/ 5% HFRI Fund of Funds Composite/ 1% Citigroup 90 day US Treasury/ 5% BC US TIPS/ 12% SSPEI 1 QTR lagged/ 15% NCREIF Open Ended fund lagged through 9/13, 2% MSCI Small Cap/ 18% MSCI USA/ 15% MSCI EAFE + Canada/ 10% MSCI EM/ 13% BC Long Treasuries/ 4% HFRI FOF: Conservative Index/ 5% HFRI Fund of Funds Composite/ 1% Citigroup 90 day US Treasury/ 5% BC US TIPS/ 11% SSPEI Adj 1 QTR lagged/ 13% NCREIF Open Ended fund lagged/ 3% (75% Cambridge Associates Natural Resources (reweighted)/ 25% quarterly Consumer Price Index lagged 1 quarter) through 9/14, 20.13% MSCI USA Investible Market/ 15.13% MSCI EAFE + Canada/ 10.24% MSCI EM/ 13.13% BC Long Treasuries/ 4% HFRI FOF: Conservative Index/ 4.89% HFRI Fund of Funds Composite/ 1% Citigroup 90 day US Treasury/ 5.13% BC US TIPS/ 11.97% SSPEI Adj 1 QTR lagged/ 11.84% NCREIF Open Ended fund lagged/ 1.99% (75% Cambridge Associates Natural Resources (reweighted)/ 25% quarterly Consumer Price Index lagged 1 quarter)/ 0.55% Risk Parity Benchmark through 12/14, 20.03% MSCI USA Investible Market/ 15.03% MSCI EAFE + Canada/ 10.25% MSCI EM/ 13.03% BC Long Treasuries/ 4% HFRI FOF: Conservative Index/ 4.78% HFRI Fund of Funds Composite/ 1% Citigroup 90 day US Treasury/ 5.03% BC US TIPS/ 11.77% SSPEI Adj 1 QTR lagged/ 12.01% NCREIF Open Ended fund lagged/ 1.96% (75% Cambridge Associates Natural Resources (reweighted)/25% quarterly Consumer Price Index lagged 1 quarter)/ 1.11% Risk Parity Benchmark through 3/15, currently 19.97% MSCI USA Investible Market/ 14.97% MSCI EAFE + Canada/ 10.31% MSCI EM/ 12.97% BC Long Treasuries/ 4% HFRI FOF: Conservative Index/ 4.66% HFRI Fund of Funds Composite/ 1% Citigroup 90 day US Treasury/ 4.97% BC US TIPS/ 11.43% SSPEI Adj 1 QTR lagged/ 12.17% NCREIF Open Ended fund lagged/ 1.85% (75% Cambridge Associates Natural Resources (reweighted)/ 25% quarterly Consumer Price Index lagged 1 quarter)/ 1.7% Risk Parity Benchmark. 43% Russell 1000 Growth/ 43% Russell 1000 Value/ 14% Russell 2000 through 9/08, 40% Russell 1000 Growth/ 40% Russell 1000 Value/ 20% Russell 2000 through 9/09, 81% MSCI Large Cap/ 19% MSCI Small Cap through 9/10, 80% MSCI USA/ 20% MSCI Small Cap through 9/11, 90% MSCI USA/ 10% MSCI Small Cap through 9/14, Currently MSCI USA Investible Market. 3 4 100% MSCI EAFE + Canada Index. 5 100% MSCI EM Index. 6 100% HFRI Fund of Funds Composite. 7 61% S&P 500/ 12% S&P 400/ 6% S&P 600, 21% MSCI ACWI free ex-US through 6/05, 60.16% S&P 500/ 12.22% S&P 400/ 6.5% S&P 600, 21.12% MSCI ACWI free ex-US through 3/06, 59.82% S&P 500/ 11.97% S&P 400/ 5.99% S&P 600/ 22.22% MSCI ACWI free ex-US through 9/07, 27.28% Russell 1000 Growth/ 27.27% Russell 1000 Value/ 9.09% Russell 2000/ 27.27% MSCI EAFE + Canada/ 9.09% MSCI EM through 9/08, 18.9% Russell 1000 Growth/ 18.9% Russell 1000 Value/ 9.4% Russell 2000/ 15.1% MSCI EAFE + Canada/ 9.4% MSCI EM/ 28.3% MSCI World through 9/09, 11.5% MSCI EM/ 63.5% MSCI All-Country World Net/ 9.6% MSCI USA Small Cap/ 15.4% MSCI USA Large Cap through 9/10, 20% MSCI EM/ 30% MSCI EAFE + Canada/ 40% MSCI USA Gross/ 10% MSCI USA Small Cap through 9/11, 20% MSCI EM/ 30% MSCI EAFE + Canada/ 36% MSCI USA Gross/ 4% MSCI USA Small Cap/ 10% HFRI Fund of Funds Composite through 9/14, 20.32% MSCI EM/ 30.03% MSCI EAFE + Canada/ 39.95% MSCI USA Investible Market/ 9.7% HFRI Fund of Funds Composite through 12/14, 20.45% MSCI EM/ 30.01% MSCI EAFE + Canada/ 39.99% MSCI USA Investible Market/ 9.55% HFRI Fund of Funds Composite through 3/15, currently 20.66% MSCI EM/ 29.99% MSCI EAFE + Canada/ 40.01% MSCI USA Investible Market/ 9.34% HFRI Fund of Funds Composite 83 years at 0, then Russell 2000 + 500 bps through 9/07, Russell 3000 + 5% through 9/09, SSPEI 1 QTR lagged through 9/13, currently SSPEI Adj 1 QTR lagged. Investment Section 107 . Total Time-Weighted Returns PENSION TRUST FUND For Periods Ended June 30 9 57% S&P 500/ 11% S&P 400/ 6% S&P 600, 20% MSCI ACWI free ex-US/ 6% Russell 2000+5% through 6/05, 56.49% S&P 500/ 11.44% S&P 400/ 6.11% S&P 600, 19.85% MSCI ACWI free ex-US/ 6.11% Russell 2000 + 5% through 3/06, 56% S&P 500/ 11.21% S&P 400/ 5.6% S&P 600, 20.8% MSCI ACWI free ex-US/ 6.39% Russell 2000 + 5% through 9/07, 25% Russell 1000 Growth/ 25% Russell 1000 Value/ 8.33% Russell 2000/ 25% MSCI EAFE + Canada/ 8.33% MSCI EM/ 8.34% Russell 3000 + 5% through 9/08, 16.67% Russell 1000 Growth/ 16.67% Russell 1000 Value/ 8.33% Russell 2000/ 13.33% MSCI EAFE + Canada/ 8.33% MSCI EM/ 25% MSCI World/ 11.67% Russell 3000 + 5% through 9/09, 10% MSCI EM Net/ 55% AC World Net/ 13.33% SSPEI 1 QTR lagged/ 8.33% MSCI USA Small Cap/ 13.34% MSCI USA Large Cap through 9/10, 16.7% MSCI EM/ 25% MSCI EAFE + Canada/ 8.3% MSCI USA Small Cap/ 33.3% MSCI USA Gross/ 16.7% SSPEI 1 QTR lagged through 9/11, 16.1% MSCI EM/ 24.2% MSCI EAFE + Canada/ 3.2% MSCI USA Small Cap/ 29% MSCI USA Gross/ 8.1% HFRI Fund of Funds Composite/ 19.4% SSPEI 1 QTR lagged through 9/13, 16.4% MSCI EM/ 24.6% MSCI EAFE + Canada/ 3.3% MSCI USA Small Cap/ 29.5% MSCI USA Gross/ 8.2% HFRI Fund of Funds Composite/ 18% SSPEI Adj 1 QTR lagged through 9/14, 16.42% MSCI EM/ 24.26% MSCI EAFE + Canada/ 32.28% MSCI USA Investible Market/ 7.84% HFRI Fund of Funds Composite/ 19.2% SSPEI Adj 1 QTR lagged through 12/14, 16.57% MSCI EM/ 24.30% MSCI EAFE + Canada/ 32.38% MSCI USA Investible Market/ 7.72% HFRI Fund of Funds Composite/ 19.03% SSPEI Adj 1 QTR lagged through 3/15, currently 16.81% MSCI EM/ 24.4% MSCI EAFE + Canada/ 32.56% MSCI USA Investible Market/ 7.6% HFRI Fund of Funds Composite/ 18.63% SSPEI Adj 1 QTR lagged. 10 100% BC Long Treasuries Index. 11 100% 3 month LIBOR + 2%. 12 70% 3-month LIBOR/ 30% S&P 500 through 9/07, 3 Month LIBOR + 2% through 9/11, currently 100% HFRI FOF: Conservative Index. 13 87.3% LB Aggregate/ 6.35% Citigroup High Yield Index / 4.76% Hedge Fund Composite/ 1.59% 91 day T-Bill through 03/05, 87.3% LB Aggregate/ 6.35% Lehman High Yield/ 4.76% Hedge Fund Composite/ 1.59% 91 day T-Bill through 03/06, 93.63% LB Aggregate/ 4.77% Hedge Fund Composite/ 1.6% 91 day T-Bill through 9/07, 50% Lehman Long Treasury/ 25% Lehman Intermediate Gov-Credit/ 20% Hedge Fund Composite/ 5% 91 day T-Bill through 9/08, 60% BC Long Treasury/ 15% BC Intermediate Gov-Credit/ 20% Hedge Fund Composite/ 5% 91 day T-Bill through 9/09, 75% BC Long Treasury/ 20% Hedge Fund Composite/ 5% 91 day T-Bill through 9/11, 72.2% BC Long Treasury/ 22.2% HFRI FOF: Conservative Index/ 5.6% Citigroup 91 day T-Bill through 9/14, 72.42% BC Long Treasury/ 22.06% HFRI FOF: Conservative Index/ 5.52% Citigroup 91 day T-Bill through 12/14, 72.27% BC Long Treasury/ 22.18% HFRI FOF: Conservative Index/ 5.55% Citigroup 91 day T-Bill through 3/15, currently 72.17% BC Long Treasury/ 22.26% HFRI FOF: Conservative Index/ 5.57% Citigroup 91 day T-Bill. 14 BC Global Inflation Linked Bonds through 9/08, 50% BC Global Inflation Linked Bonds/ 50% BC US TIPS through 9/09, currently BC US TIPS. Index established 4/2006, NCREIF Property Index (1 quarter lag) + 200 bps through 9/07, 80% Real Estate Composite Index/ 20% US Core CPI + 5% through 9/08, 83% Real Estate Composite Index/ 17% US Core CPI + 5% through 9/09, currently NCREIF Open Ended Net 1 QTR lagged. 15 16 75% Cambridge Associates Natural Resources (reweighted)/ 25% quarterly Consumer Price Index lagged 1 quarter. 17 100% Goldman Sachs Commodity Index. Index established 4/2006, NCREIF Property Index (1 quarter lag) + 200 bps through 9/07, 50% LB Global Inflation Linked Bond Index/ 20% Real Estate Composite Index/ 5% US Core CPI + 5%/ 15% Goldman Sachs Commodity Index/ 10% NAREIT Index through 9/08, 25% BC Global Inflation Linked Bond Index/ 25% BC US TIPS Index/ 25% Real Estate Composite Index/ 5% US Core CPI + 5%/ 10% Goldman Sachs Commodity Index/ 10% NAREIT Index through 9/09, 40% BC Global Inflation Linked Bond Index/ 40% NCREIF Open Ended Net 1 QTR lagged/ 10% Goldman Sachs Commodity Index/ 10% MSCI US REIT through 9/11, 25% BC US TIPS/ 65% NCREIF Open Ended Net 1 QTR lagged/ 10% MSCI US REIT through 9/12, 25% BC US TIPS/ 75% NCREIF Open Ended Net 1 QTR lagged through 9/13, 23.8% BC US TIPS/ 61.9% NCREIF Open Ended Net 1 QTR lagged/ 14.3% (75% Cambridge Associates Natural Resources (reweighted)/ 25% quarterly Consumer Price Index lagged 1 quarter) through 9/14, 27.06% BC US TIPS/ 62.45% NCREIF Open Ended Net 1 QTR lagged/ 10.49% (75% Cambridge Associates Natural Resources (reweighted)/ 25% quarterly Consumer Price Index lagged 1 quarter) through 12/14, 26.47% BC US TIPS/ 63.21% NCREIF Open Ended Net 1 QTR lagged/ 10.32% (75% Cambridge Associates Natural Resources (reweighted)/ 25% quarterly Consumer Price Index lagged 1 quarter) through 3/15, currently 26.17% BC US TIPS/ 64.11% NCREIF Open Ended Net 1 QTR lagged/ 9.72% (75% Cambridge Associates Natural Resources (reweighted)/ 25% quarterly Consumer Price Index lagged 1 quarter). 18 19 No performance data is available because this asset classes is new and was not established for the entire 1 year period. Investment Section 108 . Asset Allocation PENSION TRUST FUND August 31, 2015 Stable Value 15.7% U.S. Non-U.S. Developed Emerging Markets Directional Hedge Funds Public Equity Private Equity Total Global Equity U.S. Treasuries Absolute Return Stable Value Hedge Funds Cash Total Stable Value TRS Global Inflation Linked Bonds TRS Real Assets TRS Energy and Natural Resources TRS Commodities Total Real Return Total Risk Parity Total Global Equity 62.7% Low 13% 8% 4% 0% 39% 8% 50.0% 0.0% 0.0% 0.0% 0.0% 11.0% 0.0% 11.0% 0.0% 0.0% 17.0% 0.0% Real Return 19.5% POLICY RANGES High Transition Normal 23% 19.8% 18% 14.8% 14% 10.3% 10% 4.6% 49% 49.5% 18% 11.8% 64.0% 61.3% 20% 12.8% 20% 0.0% 10.0% 4.0% 5.0% 1.0% 21.0% 17.8% 8.0% 4.8% 21.0% 12.3% 8.0% 1.6% 5.0% 0.0% 27.0% 18.7% 10.0% 2.2% Investment Section 109 Actual 20.6% 15.8% 8.9% 4.9% 50.2% 12.5% 62.7% 8.7% 2.3% 4.2% 0.5% 15.7% 4.6% 12.9% 1.8% 0.2% 19.5% 2.1% 100.0% . Investment Summary PENSION TRUST FUND August 31, 2015 $140 Value in Billions $120 $100 $80 Risk Parity $60 Real Return Stable Value $40 Global Equity $20 $0 2010 2011 2012 2013 2014 2015 MARKET VALUES (in billions)1 U.S. Non-U.S. Developed Emerging Markets Directional Hedge Funds World Equity Public Equity Private Equity Total Global Equity U.S. Treasuries Absolute Return Stable Value Hedge Funds Cash Total Stable Value Global Inflation Linked Bonds Real Assets Energy and Natural Resources Commodities Total Real Return Total Risk Parity Total $ $ $ $ $ $ $ 2010 17.437 $ 5.810 8.180 N/A 17.936 49.363 8.501 57.864 $ 10.047 $ 4.786 3.947 0.700 19.480 $ 8.167 $ 7.664 N/A 2.068 17.899 $ N/A 95.243 $ 2011 26.528 $ 12.488 15.296 N/A N/A 54.312 11.099 65.411 $ 11.907 $ 3.214 4.324 1.376 20.821 $ 5.635 $ 11.880 N/A 3.323 20.838 $ N/A 107.070 $ 2012 23.085 $ 17.301 10.754 5.584 N/A 56.724 13.101 69.825 $ 13.476 $ 0.999 3.936 0.957 19.368 $ 5.499 $ 15.219 N/A 1.155 21.873 $ N/A 111.066 $ 1 2013 22.842 16.641 12.829 5.918 N/A 58.230 14.365 72.595 16.312 0.465 4.207 1.129 22.113 5.924 15.920 N/A 0.498 22.342 N/A 117.050 $ $ $ $ $ $ $ 2014 29.981 19.718 15.594 6.496 N/A 71.789 15.594 87.383 11.650 2.068 5.055 1.698 20.471 6.318 15.335 2.540 0.169 24.362 N/A 132.216 $ $ $ $ $ $ $ $ 2015 26.355 20.175 11.437 6.222 N/A 64.189 16.032 80.221 11.141 2.961 5.395 0.673 20.170 5.839 16.495 2.259 0.244 24.837 2.715 127.943 Investment values are based on industry standard investment performance methodology. Investment values in Exhibit I are in compliance with GASB Reporting Standards.
A reconcilication is provided. $ 127.943 Total Market Value 8/31/15 (0.399) Less Investment Related Cash Less Investment Related Receivables (1.580) Plus Investment Related Payables 0.888 Plus Securities Sold Short 0.188 Plus Short-Term Asset Pool Adjustment from Amortized Cost to Fair Value 0.002 Total Investments Exhibit 1 $ 127.042 Investment Section 110 . Investment Summary PENSION TRUST FUND August 31, 2015 100% 80% 60% Risk Parity Real Return Stable Value 40% Global Equity 20% 0% 2010 2011 2012 2013 2014 2015 PERCENTAGE OF MARKET VALUES U.S. Non-U.S. Developed Emerging Markets Directional Hedge Funds World Equity Public Equity Private Equity Total Global Equity U.S. Treasuries Absolute Return Stable Value Hedge Funds Cash Total Stable Value Global Inflation Linked Bonds Real Assets Energy and Natural Resources Commodities Total Real Return Total Risk Parity 2010 18.3% 6.1% 8.6% N/A 18.8% 51.8% 8.9% 60.7% 10.6% 5.0% 4.1% 0.7% 20.4% 8.6% 8.1% N/A 2.2% 18.9% N/A 2011 24.8% 11.7% 14.3% N/A N/A 50.7% 10.4% 61.1% 11.1% 3.0% 4.0% 1.3% 19.4% 5.3% 11.1% N/A 3.1% 19.5% N/A 2012 19.7% 15.6% 9.7% 5.0% N/A 51.1% 11.8% 62.9% 12.1% 0.9% 3.5% 0.9% 17.4% 5.0% 13.7% N/A 1.0% 19.7% N/A 2013 19.5% 14.2% 11.0% 5.0% N/A 49.7% 12.3% 62.0% 13.9% 0.4% 3.6% 1.0% 18.9% 5.1% 13.6% N/A 0.4% 19.1% N/A 2014 22.7% 14.9% 11.8% 4.9% N/A 54.3% 11.8% 66.1% 8.8% 1.6% 3.8% 1.3% 15.5% 4.8% 11.6% 1.9% 0.1% 18.4% N/A 2015 20.6% 15.8% 8.9% 4.9% N/A 50.2% 12.5% 62.7% 8.7% 2.3% 4.2% 0.5% 15.7% 4.6% 12.9% 1.8% 0.2% 19.5% 2.1% Total 100.0% 100.0% 100.0% 100.0% 100.0% 100.0% Investment Section 111 . Largest Holdings PENSION TRUST FUND August 31, 2015 Top Ten Domestic Equity Market Holdings Market Value $ 680,990,340 383,158,479 338,626,527 294,805,016 259,193,726 236,690,799 228,232,585 226,114,427 221,230,998 220,568,421 $ 3,089,611,318 Issuer Name Apple Incorporated Microsoft Corporation Google Incorporated Class A Johnson & Johnson Pfizer Incorporated Oracle Corporation Citigroup Incorporated Google Incorporated Class C Amazon.Com Incorporated J.P. Morgan Chase & Company Total Shares 6,039,290 8,804,193 522,717 3,136,891 8,044,498 6,381,526 4,267,625 365,733 431,342 3,441,005 41,434,820 Top Ten International Equity Market Holdings Issuer Name Samsung Electronics Company LTD Novartis AG Tencent Holdings LTD Nestle SA China Construction Bank Roche Holdings AG Toyota Motor Corporation BT Group PLC Vodafone Group PLC China Mobile LTD Market Value $ 301,022,526 260,701,790 260,314,647 228,142,895 192,952,019 185,193,932 176,022,961 175,542,145 174,376,464 174,358,281 $ 2,128,627,660 Investment Section 112 Total Shares 326,937 2,662,214 15,306,916 3,094,328 273,880,548 678,378 2,965,982 26,097,319 50,012,662 14,142,181 389,167,465 . Largest Holdings PENSION TRUST FUND August 31, 2015 Top Ten Fixed Income Market Holdings U.S. Treasury U.S. Treasury U.S. Treasury U.S.
Treasury U.S. Treasury U.S. Treasury U.S.
Treasury U.S. Treasury U.S. Treasury U.S.
Treasury Description 3.625% due 15 Aug 2043 3.750% due 15 Nov 2043 3.375% due 15 May 2044 3.625% due 15 Feb 2044 3.000% due 15 Nov 2044 2.875% due 15 May 2043 3.125% due 15 Aug 2044 4.625% due 15 Feb 2040 3.000% due 15 May 2045 2.750% due 15 Nov 2042 $ $ Market Value 905,477,625 892,232,349 811,576,110 765,630,036 759,777,068 706,578,386 638,016,468 527,614,870 523,827,500 520,532,773 7,051,263,185 $ $ Par Value 796,900,000 767,690,000 748,500,000 674,350,000 753,000,000 717,040,000 616,900,000 402,170,000 518,000,000 541,100,000 6,535,650,000 Note: A complete listing of publically available portfolio holdings is available by contacting the TRS Communications Department. Investment Section 113 . Schedule of Fees and Commissions PENSION TRUST FUND For the Fiscal Year Ended August 31, 2015 Fund Name* Achievement Fund XL, LLC Admiral Capital Real Estate Fund, L.P. Advent International GPE VI-A, L.P. Advent International GPE VII-C, L.P. Aeolus Property Keystone Fund, L.P. Aeolus Property Spire Fund, L.P. AEW Core Property Trust (U.S.), L.P. AEW Senior Housing Investors II, L.P. AEW Senior Housing Investors, L.P. AHL Evolution, LLC Akard Street Partners, L.P. Algert Global Equity Mkt Neutral Almanac Realty Securities Sidecar VI, L.P. Almanac Realty Securities V Co-Invest, L.P. Almanac Realty Securities V, L.P. Almanac Realty Securities VI, L.P. Almanac Realty Securities VII, L.P. Alterna Core Capital Assets Fund II, L.P. Alterna Core Capital Assets Fund, L.P. Alterna/Lavaca Co-Investment Fund, L.P. Amici Fund International LTD Apax Europe VII-A, L.P. Apax VIII, L.P. Apollo Credit Opportunity Fund II, L.P. Apollo Investment Fund VII, L.P. Apollo SPN Investments, L.P. AQR GRP 10 Offshore Fund LTD AQR RT Fund, L.P. AQR Style Premia Offshore Fund LTD ARA Asia Dragon II, L.P. ARA Asia Dragon, L.P. Artemis Real Estate Partners Fund II, L.P. AXA Independence Fund, L.P.** Bain Capital Absolute Return Cayman LTD Bain Capital Fund VIII, L.P. Bain Capital VIII Coinvest Fund, L.P. $ Fees 3,447,174 304,725 1,879,357 2,051,987 324,804 961,759 1,651,871 277,185 785,114 1,426,886 854,570 7,534,862 56,174 148,238 1,091,387 911,311 136,986 1,742,438 1,562,839 35,374 1,295,869 370,494 2,747,127 462,359 752,253 14,082,179 2,002,892 683,037 3,482,438 2,500,000 332,817 750,000 (67,309) 2,089,709 346,031 430,220 (Continued) Investment Section 114 . Schedule of Fees and Commissions PENSION TRUST FUND For the Fiscal Year Ended August 31, 2015 Fund Name* Bay Resource Partners Offshore Fund LTD Black Diamond Relative Value LTD Blackrock Diamond Property Fund, L.P. Blackstone Capital Partners V, L.P. Blackstone Capital Partners VI, L.P. Blackstone Energy Partners II, L.P. Blackstone GSO Capital Solutions Fund II, L.P. Blackstone GSO Capital Solutions Fund, L.P. Blackstone RE Partners Europe III, L.P. Blackstone RE Partners Europe IV, L.P. Blackstone Real Estate VI, L.P. Blackstone Real Estate VI.F (Gresham), L.P. Blackstone Real Estate VII, L.P. Blue Mountain Guadalupe Peak Fund Blue Sage Capital II, L.P. Blue Sea Capital Fund I, LLC BlueTrend Fund LTD Brevan Howard Fund Bridgepoint Europe V, L.P. Bridgewater All Weather LTD Bridgewater Optimal Portfolio, LLC Bridgewater Pure Alpha Major Markets LTD Bridgewater Pure Alpha, LLC Brockton Capital Fund II, L.P. Brockton Capital Fund III, L.P. Brookfield Americas Infrastructure Fund, L.P. Brookfield Infrastructure Fund II-B, L.P. Brookfield Strategic RE Partners B, L.P. Camden Multifamily Co-Investment Fund, L.P. Camden Multifamily Value Add Fund, L.P. Canyon-Johnson Urban Fund III, L.P. Capri Urban Investors, L.P. Cargill Global Agriculture Absolute Return Fund LTD Carlyle Europe Partners III, L.P. Carlyle Europe Real Estate Partners III, L.P. Carlyle Partners III, L.P. $ Fees 7,056,945 3,802,850 660,280 51,088 1,772,504 238,889 36,321 2,163,533 1,984,688 4,013,889 1,990,182 302,484 3,521,948 4,625,862 651,610 29,251 5,598,468 2,754,127 1,395,332 1,982,615 2,060,801 4,234,052 6,921,114 3,138,802 1,150,347 2,288,068 2,573,140 2,151,000 1,143,459 1,277,362 637,618 1,005,750 1,328,659 265,974 963,136 12,127 (Continued) Investment Section 115 . Schedule of Fees and Commissions PENSION TRUST FUND For the Fiscal Year Ended August 31, 2015 Fund Name* Carlyle Partners IV, L.P. Carlyle Partners V, L.P. Carlyle Partners VI, L.P. Carlyle Realty Partners V, L.P. Carlyle Realty Partners VII, L.P. CB Richard Ellis Strat Partners US OPP 5, L.P. CBRE Strategic Partners US Value 6, L.P. CBRE Strategic Partners US Value 7, L.P. CBRE Wood Partners Development Fund 3, L.P. CCMP Capital Investors III Cerberus Institutional (Series Four), L.P. Charterhouse Capital Partners IX, L.P. Charterhouse Capital VIII, L.P. CIM Fund III, L.P. Citadel Presidio Fund, LLC Colony Distressed Credit Fund, L.P. Colony Investors VIII, L.P. Comac Global Macro Fund LTD CPI Capital Partners Europe, L.P. Crestview Partners II, L.P. Crestview Partners III, L.P.** CVC Capital Partners Asia Pacific III, L.P. CVC European Equity Partners III, L.P. CVC European Equity Partners IV, L.P. CVC European Equity Partners Tandem Fund, L.P. CVC European Equity Partners V, L.P. D. E. Shaw BMCAE Special Fund, L.P. D. E.
Shaw VACAE Fund, L.P. DaVinciRe Holdings LTD Divco West Fund III, L.P. Double Black Diamond LTD EI AV Fund (Acosta Verde), L.P. EI Fund V, L.P. EIG Energy Fund XVI, L.P. Element Capital US Feeder $ Fees 261,106 1,090,927 1,895,638 452,794 1,959,979 695,326 1,335,207 1,205,904 284,537 1,828,705 394,914 1,860,099 360,964 3,132,156 3,192,720 2,538,400 2,419,900 594,496 169,099 678,220 (248,507) 1,647,904 72,447 50,149 432,062 862,877 3,264,936 2,359,391 4,432,907 117,604 5,429,296 121,943 1,849,145 1,497,452 1,852,484 (Continued) Investment Section 116 . Schedule of Fees and Commissions PENSION TRUST FUND For the Fiscal Year Ended August 31, 2015 Fund Name* EnCap Energy Capital Fund VII, L.P. EnCap Energy Capital Fund X, L.P. EnCap Energy Fund IX, L.P. EnCap Energy Infrastructure Fund, L.P. Encap Flatrock Midstream Fund II, L.P. Encap Flatrock Midstream Fund III, L.P. Energy Capital Partners Fund III, L.P. Energy Fund XV, L.P. ESCF German (Zentrum), L.P. ESG Cross Border Equity Fund LTD FIR Tree Capital Opportunity Fund First Reserve Energy Infrastructure Fund II, L.P. First Reserve Energy Infrastructure Part, L.P. First Reserve Fund X, L.P. First Reserve Fund XI, L.P. First Reserve Fund XII, L.P. Five Mile Capital Partners II, L.P. Fore Multi Strategy Offshore Fund LTD Forum Asian Realty Income II, L.P. Forum Asian Realty Income III, L.P. Forum Europe Realty Income III, L.P. Frontier Fund III, L.P. Frontier Fund IV, L.P. Fudo Capital Fund II, L.P. Fudo Capital Fund III, L.P. Full Harvest Agricultural Opp Fund II, L.P. GenNx360 Capital Partners II, L.P. GoldenTree Offshore Fund LTD Gores Capital Partners II, L.P. Graham Global Investment Great Hill Equity Partners V, L.P. Green Equity Investors VI, L.P. Grosvenor 2005-1 Series Grosvenor 2007-1 Series Grosvenor 2008-1 Re-Investment Series $ Fees 522,869 681,250 1,236,327 526,268 572,286 3,115,385 1,455,199 1,974,052 573,896 1,815,623 9,243,410 1,015,395 1,673,873 8,840 1,414,602 2,633,477 1,684,838 3,831,991 140,664 1,747,716 786,286 172,977 194,721 1,036,855 2,286,028 225,000 245,815 186,371 170,581 9,420,274 1,082,219 538,076 708,753 981,315 231,831 (Continued) Investment Section 117 . Schedule of Fees and Commissions PENSION TRUST FUND For the Fiscal Year Ended August 31, 2015 Fund Name* Grosvenor 2008-2 MMBO Investments Series Grosvenor 2010-1 PE Investment Series Grosvenor 2010-2 RE Partnership Invest Series Grosvenor 2014-1 PE Investment Series Grosvenor 2014-2 RE Investment Series GSO Energy Partners-D, L.P. GSO Special Situations Fund, L.P. Hadley Harbor Partners, L.P. Halcyon European Structured LTD Halcyon Mount Bonnell Fund, L.P. Harbinger LTD HB Estrela I, L.P. Heitman America Real Estate Trust, L.P. Hellman & Friedman Capital Partners V, L.P.** Hellman & Friedman Capital Partners VI, L.P. HgCapital 5, L.P. HgCapital 6, L.P. Highbridge Mezzanine Partners II, L.P. Highbridge Mezzanine Partners, L.P. Highland Capital Partners VI-B, L.P. Homestead Capital USA Farmland Fund I, L.P. Horizon Portfolio LTD Hunt Commercial Realty Partners II, L.P. Hunt Commercial Realty Partners III, L.P. IC Berkeley Partners III, L.P. IC Hospitality Fund II, L.P. ICV Partners III, L.P. Insight Venture Partners IX, L.P. Insight Venture Partners VIII, L.P. Invesco San Jacinto Core Fund, L.P. Investcorp Interlachen Investcorp Waterloo Macro Fund LTD Iron Point Real Estate Partners II, L.P. Iron Point Real Estate Partners III, L.P. Iron Point Real Estate Partners, L.P. $ Fees 1,302,071 537,028 996,111 214,560 429,121 105,616 4,895,078 332,283 1,397 2,616,241 5,362 1,010,717 1,664,052 (389) 165,550 124,582 2,174,613 1,031,199 455,138 157,535 76,695 13,419,704 561,964 714,756 234,422 38,069 138,910 1,317,928 2,838,978 1,337,679 6,108 6,250,814 1,220,981 656,250 827,832 (Continued) Investment Section 118 . Schedule of Fees and Commissions PENSION TRUST FUND For the Fiscal Year Ended August 31, 2015 Fund Name* J.H. Whitney VI, L.P. JP Morgan Strategic Property Fund, L.P. Kelso Investment Associates VIII, L.P. King Street Capital LTD KKR 2006 Fund, L.P. KKR Natural Resources I, L.P. KKR SPN Investments, L.P. Kohlberg TE Investors VII-B, L.P. L&B Diversified Strategy Partners, L.P. Lansdowne Pecan Street Europe, L.P. LaSalle Capital Group II-A, L.P. LaSalle US Property Fund, L.P. Lee Equity Partners, L.P. Lightspeed Venture Partners, L.P. Lindsay Goldberg III, L.P. Lion Capital Fund I, L.P. Lion Capital Fund II, L.P. Lion Capital Fund III, L.P. Lionstone Cash Flow Partners Fund One, L.P. LiveOak Ventures I, L.P. Lone Star Fund IX, L.P. Lone Star Real Estate Fund II, L.P. Lone Star Real Estate Fund III, L.P. Luxor Capital Partners Offshore LTD MacFarlane Urban Real Estate Fund II, L.P. Magnetar Constellation Fund LTD Marathon Credit Dislocation Fund, L.P. Marathon Structured Products Stategies Fund Meadow Real Estate Fund III, L.P. Mill Road Capital II, L.P. Millennium Partners, L.P. MKP Credit Offshore LTD Morgan Creek Partners Asia, L.P. MW Market Neutral TOPS (US) Fund Nautic Partners V, L.P.** $ Fees 93,374 6,002,601 1,883,407 4,453,739 930,878 7,196,124 11,954,667 2,972,759 254,675 128,776 495,483 2,223,594 191,072 249,317 1,406,437 28,585 1,234,838 4,898,397 2,563,257 374,986 1,200,000 292,176 2,174,523 3,819,563 844,271 8,682,024 2,193,206 111,733 500,000 300,000 4,846,724 7,227,669 1,015,474 5,479,051 (176,218) (Continued) Investment Section 119 . Schedule of Fees and Commissions PENSION TRUST FUND For the Fiscal Year Ended August 31, 2015 Fund Name* New Enterprise Associates 13, L.P. New Enterprise Associates 14, L.P. New Enterprise Associates 15, L.P. New Heritage Capital Fund-B, L.P. NMS Fund II, L.P. Normandy Real Estate Debt Fund, L.P. North Haven Infrastructure Partners II, L.P. North Haven Infrastructure Partners, L.P. Northwest Fund LTD Oak Investment Partners XI, L.P. Oak Investment Partners XII, L.P. Oaktree European Principal Fund III, L.P. Oaktree Opportunities Fund IX, L.P. Oaktree Opportunities Fund VIII, L.P. Oaktree Opportunities Fund VIIIb, L.P. Oaktree Real Estate Opportunities Fund VI, L.P. OCM Opportunities Fund VI, L.P. OCM Opportunities Fund VII, L.P. OCM Opportunities Fund VIIb, L.P. One Rock Capital Partners, L.P. Onex Partners I, L.P. Onex Partners III, L.P. P2 Capital Master Fund VI Palladium Equity Partners IV, L.P. Parkway Properties Office Fund II, L.P. Parvus Armadillo Fund Patria-Brazilian Private Equity Fund IV, L.P. PCCP Mezzanine Recovery Partners II, L.P. PDT Partners Offshore Fund Pennybacker III, L.P.** Permira Europe III, L.P.** Permira IV, L.P. Permira V, L.P. Perry Partners International, Inc. Pershing Square International LTD $ Fees 1,100,214 1,312,261 385,909 471,525 208,182 190,210 1,076,449 194,088 3,921,985 584,522 1,924,876 2,750,214 2,400,000 775,088 1,391,020 2,097,063 79,143 213,458 245,155 245,805 101,746 1,472,713 4,039,354 93,094 2,074,148 18,892,075 1,953,216 408,069 21,663,043 (236,217) (21,217) 960,420 3,382,522 3,229,906 31,515,583 (Continued) Investment Section 120 . Schedule of Fees and Commissions PENSION TRUST FUND For the Fiscal Year Ended August 31, 2015 Fund Name* PFM Diversified Offshore Fund, A.I. LTD PLA Residential Fund III, L.P. PLA Residential Fund IV, L.P. PLA Retail Fund I, L.P. Polaris Venture Partners IV, L.P.** PREI Mezzanine Fund I, L.P. Prime Property Fund, L.P. Principal Green Property Fund I, L.P. Principal RE Strategic Debt Fund I, L.P. Principal Real Estate Strat Eq Fund I, L.P. PRISA PRISA II Prologis U.S. Logistics REIT, L.P. Providence Equity Partners V, L.P. Providence Equity Partners VI, L.P. Raine Partners II, L.P. Ranger Co-Investment Fund II, L.P. Ranger Co-Investment Fund III, L.P. Ranger Co-Investment Fund, L.P. Red River Direct Investment Fund II, L.P. Red River Direct Investment Fund, L.P. Red River Venture Capital Fund, L.P. Reservoir Strategic Partners Fund, L.P. Retail Co-Invest Holdings 3 (Starwood), L.P. Ridgewood Energy Oil & Gas Fund II, L.P. Riverstone Global Energy & Power VI, L.P. Rock Creek Limestone Emerging Markets, L.P. RREEF America REIT III, L.P. Savanna Real Estate Fund III, L.P. Savanna Real Estate IIA, L.P. SCG TMI Co-Invest, L.P. Scout Fund II, L.P. Security Capital Income Opportunity Shepherd Investments International LTD SHI Development Co-Investment I, L.P. $ Fees 9,921,401 2,109,843 432,688 730,242 (1,116) 214,677 2,239,711 1,075,424 1,039,015 1,359,350 2,001,960 1,904,218 885,667 176,140 1,255,988 450,000 324,092 165,610 184,661 2,893,068 1,681,823 727,732 4,442,229 556,842 2,000,000 761,909 8,041,104 497,350 218,533 140,476 197,694 479,476 200,345 62,554 725,715 (Continued) Investment Section 121 . Schedule of Fees and Commissions PENSION TRUST FUND For the Fiscal Year Ended August 31, 2015 Fund Name* Silver Lake Partners IV, L.P. Silverback Arbitrage Fund LTD Soroban Cayman Fund LTD Soroban Opportunities Fund, LLC Southwest Multifamily Partners, L.P. SP5 Wood Partners Co-Invest Venture 2, L.P. SP5 Wood Partners Development, L.P. Spire Capital Partners III, L.P. Squadron Emerging Asia Fund, L.P. Square Mile Credit Partners, L.P. Square Mile Partners III, L.P. Square Mile Partners IV, L.P. Square Mile Partners IV-A-Co-Invest, L.P. Square Mile S2, L.P. Square Mile Tactical Partners, L.P. Starwood Distressed Opportunity Fund IX, L.P. Starwood Opportunity Fund X Global, L.P. Starwood Real Estate Securities, L.P. Starwood UK Hotels Co-Invest, L.P. SteelRiver Infrastructure Fd N. America, L.P. Stockbridge Real Estate Fund II, L.P. Stockbridge Real Estate Fund III, L.P. Stonepeak Infrastructure Fund LP, L.P. Stratford Land Fund III, L.P. Stratford Land Fund IV, L.P. TA X, L.P. TA XI, L.P. Thayer Hotel Investors V, L.P. Theleme Fund LTD Thomas H. Lee Equity Partners V, L.P.** Tilden Park Investment Fund TLF Logistics II, L.P. TLF Logistics, L.P. TPG Growth II, L.P. TPG Growth III, L.P. $ Fees 1,940,515 2,397,748 11,438,312 3,980,314 187,410 257,018 116,414 158,504 903,461 452,151 659,482 56,336 55,406 144,493 59,461 2,239,416 2,123,014 2,206,389 338,235 3,284,352 665,626 1,798,838 1,172,650 2,250,000 3,551,945 385,573 2,796,007 1,049,850 5,525,108 (147,990) 1,587,088 1,489,312 1,309,041 2,615,721 1,587,983 (Continued) Investment Section 122 . Schedule of Fees and Commissions PENSION TRUST FUND For the Fiscal Year Ended August 31, 2015 Fund Name* TPG Opportunities Partners III, L.P. TPG Partners V, L.P. TPG Partners VI, L.P. TPG STAR, L. P. TPH Whipstock Co-Investment Fund, L.P. TriGate Property Partners II, L.P. Tristan EPISO 3, L.P. Triton Fund II, L.P. Triton Fund III, L.P. Triton Fund IV, L.P. Trive Capital Fund I, L.P. Tudor BVI Global Fund LTD Two Sigma Active Extension U.S. Small Cap Equity Fund, L.P. U.S. Government Building Fund, L.P. USAA US Republic Core Fund, L.P. Vistria Fund, L.P. Walton Street Real Estate Fund Sidecar V, L.P. Walton Street Real Estate Fund V, L.P. Walton Street Real Estate Fund VI, L.P. Warburg Pincus Private Equity X, L.P. Wayzata Opportunities Fund II, L.P. Wayzata Opportunities Fund III, L.P. Westbrook Real Estate Fund IX, L.P. Westbrook Real Estate Fund VIII, L.P. Western Asset Macro Opportunities Portfolio LTD Winton Futures Fund LTD Wolverine Flagship Fund LTD Zachry Hastings Infrastructure Partners, L.P. Zaxis Institutional Partners LTD Total $ $ Fees 2,043,780 762,707 335,226 709,117 1,500,000 187,500 1,168,163 239,142 857,933 2,238,333 204,035 11,464,615 19,409,533 3,189,469 3,645,010 302,657 23,252 474,966 1,516,570 1,238,089 1,076,651 2,250,000 1,350,000 1,136,888 1,090,789 32,476,576 4,407,597 541,385 2,630,443 695,661,445 (continued) * Fees are earned by the funds based on each fund's governing documents. TRS calculates returns for thes funds net of all fees. ** Negative balances are equal to the refund in the current year of expenses paid or accrued in a prior year. Investment Section 123 .
Schedule of Fees and Commissions PENSION TRUST FUND For the Fiscal Year Ended August 31, 2015 External Manager*** Adelphi Capital, LLP Affinity Investment Advisors AlphaGen Japan Absolute Return Fund LTD Baring International Investment LTD Blackrock Financial Management, Inc. Brandes Investment Partners, LLC Brookmont Capital Management Cantillon Capital Management, LLC Chilton Capital Management DePrince Race and Zolllo, Inc. Dimensional Fund Advisors, L.P. Glenhill Capital Advisors GMO, LLC Goldman Sachs Asset Management, L.P. Independent Franchise Partners, LLP Indus Capital Partners, LLC Investcorp Waterloo Macro Fund LTD Jennison Associates, LLC JP Morgan Asset Management JP Morgan Knight Vinke Asset Management, LLC Lazard Asset Management, LLC Mar Vista Investment Partners Marathon Active International Matterhorn Morgan Stanley Asset Management Morgan Stanley Investment Management, Inc. Neuberger Berman Greater China Neuberger Berman Nicholas Investment Partners Oaktree Capital Management Omega Advisors, Inc. Fees $ 755,586 196,556 14,955,147 2,212,944 2,764,715 850,188 200,999 7,131,056 190,183 2,735,573 7,951,561 332,065 2,089,930 1,380,221 7,551,414 3,602,501 248,904 748,756 9,571,537 4,610,440 3,688,298 5,931,378 219,162 3,749,605 141,864 9,835,953 7,322,187 2,763,589 3,628,718 122,529 943,917 7,187,553 (continued) Investment Section 124 . Schedule of Fees and Commissions PENSION TRUST FUND For the Fiscal Year Ended August 31, 2015 External Manager*** Parametric Structured Penn Capital Management Co., Inc. Phocas Financial Corp. Platinum Asset Management Co. LTD Rock Creek Austin, L.P. Sasco Capital, Inc. Security Capital Research & Management, Inc. Starboard Value & Opportunity Starwood Real Estate Securities Stephens Investment Management Group Vaughan Nelson Investment Management, L.P. Vulcan Value Partners Wellington Asia Wellington Management Company, L.P. Westwood Management Corp. ZCAPM Total Fees $ $ 10,112,003 487,737 111,987 6,671,939 1,288,365 2,576,635 10,628,552 10,596,888 2,190,725 716,186 1,981,527 965,914 928,469 16,318,380 57,010 692,647 181,939,993 (continued) ***Fees are accrued or paid to external managers based on assets under management and the performance of the investment manager. TRS calculates returns for these managers net of all fees. Investment Section 125 . Schedule of Fees and Commissions PENSION TRUST FUND For the Fiscal Year Ended August 31, 2015 Shares Traded 107,329 1,699,838 200,447 140,329 10 1,434,030 74,300 10,384 73,385 404,326 2,203 1,125 139,220 1,450 308,700 105,700 71,635 40,770 7,968 3,200 12,946,087 2,407,303 3,111,076 59,655 527,518,152 55,027 188,311,987 111,952 190,163 66,463,289 4,152,165 81,470,057 6,938,417 11,950 2,938,127 Brokerage Firm Abel/Noser Corp. ABG Securities ABN AMRO Securities, Inc. Academy Securities, Inc. Access Securities, Inc. Agora Corde Titul E Val Mob AKD Securities Albert Fried & Co., LLC Allen & Co., LLC Ambit Capital Pvt. LTD Antique Stock Broking LTD Aqua Securities, L.P. Atlantic Equities, LLP Autonomous, LLP Aviate Global, LLP Avior Research Pty LTD Avondale Partners, LLC Axis Capital LTD B. Riley & Co., LLC Banchile Corredores De Bolsa S.A. Banco Itau S.A. Banco Pactual S.A. Banco Santander S.A. Bank J. Vontobel Und, Co.
AG Bank of America Banque Paribas Frankfurt Barclays Capital, Inc. Batlivala & Karani Securities India Pvt. LTD BB&T Securities, LLC Bloomberg Tradebook, LLC BMO Capital Markets BNP Paribus Securities Corp. BNY ConvergEx Execution Solutions, LLC BNY Mellon BOCI Securities LTD Investment Section 126 Commissions Paid $ 4,293 463 536 2,807 1 10,918 499 413 2,569 6,681 624 23 2,707 137 4,289 693 2,627 2,151 288 56 134,392 24,643 10,234 8,413 5,127,968 1,209 2,129,168 1,239 7,744 992,041 138,956 651,959 88,302 418 5,545 (continued) . Schedule of Fees and Commissions PENSION TRUST FUND For the Fiscal Year Ended August 31, 2015 Shares Traded 66,139 420,807 35,897,741 262,800 9,974,401 40,512 24,100 251,871 4,506,671 13,846,455 952,148 71,982 1,558,678 31,658,640 24,139 8,439,911 834,722 4,240 123,888 1,010,000 9,781,000 49,550,631 256,790 515 677,345 5,514,589 1,190,000 45,402,770 369,329 517,766,043 4,314,621 700 115,753,894 11,330 Brokerage Firm Bradesco S.A CTVM Brean Capital, LLC Broadcort Capital Corp. BTG Capital Corp. BTIG, LLC Buckingham Research Group, Inc. Burke Andquick Partners, LLC CA Cheuvreux North America Cabrera Capital Markets Calyon Securities Canaccord Genuity, Inc. Canadian Depository For Securities Canadian Imperial Bank Of Commerce Cantor Fitzgerald & Co. Capel Cure Myers Gilts Capital Markets Brokers LTD Carnegie Investment Bank Carnegie Securities Finland Casablanca Finance City Cathay United Bank CCB International Securities LTD Celfin Capital S.A. Corredores De Bolsa Central Securities Depository S.A. Cheevers & Co., Inc. China Fortune Securities LTD China International Capital Corp. CICC US Securities, Inc. CIMB Securities International Pte. LTD Citation Group Citigroup Global Markets, Inc. City Bank LTD CL King & Associates, Inc. CLSA Securities Commerzbank AG Investment Section 127 Commissions Paid $ 536 11,391 340,901 9,318 400,426 1,613 844 8,815 219,656 69,673 32,219 1,605 27,754 330,275 1,207 2,034 42,080 138 8,273 745 16,171 35,481 285 10 2,727 34,855 1,463 44,481 14,082 3,146,515 18,941 28 419,233 479 (continued) . Schedule of Fees and Commissions PENSION TRUST FUND For the Fiscal Year Ended August 31, 2015 Brokerage Firm Compass Point Research & Trading, LLC Concordia S.A. CVMCC ConvergEx Execution Solutions, LLC Cormark Securities, Inc. Cowen & Co., LLC Craig - Hallum Credit Agricole Credit Lyonnais Securities Credit Research & Trading, LLC Credit Suisse Group Crest Depository LTD CSI US Institutional Desk CSL Stockbrokers LTD Cuttone & Co., Inc. Daewoo Securities Co. LTD Daiwa Securities Group, Inc. Danske Bank A.S. Davidson D.A. & Company, Inc. Davy Stockbrokers DBS Vickers Securities (Singapore) Pte.
LTD Dematted Monness, LLC Desjardins Securities, Inc. Deutsche Bank Securities, Inc. Dhanki Securities Pvt. LTD DnB NOR Dolat Capital Markets Pvt. LTD Dougherty Co., Inc. Dowling & Partners Edelweiss Securities Pvt.
LTD Emkay Global Financial Services LTD Equita SIM S.p.A. Erste Group Bank AG Euroclearbank S.A. N.V. Exane S.A. FBN Securities, Inc. Investment Section 128 Shares Traded 113,772 561,978 12,033,239 15,800 35,142,463 722,546 3,394,998 113,731,633 328,802 332,662,869 772,000 1,064,729 12,609,071 317,643 794,344 15,492,015 294,250 20,900 12,161,151 183,000 43,300 167,600 374,378,140 13,915 142,084 173,638 175,370 283,807 324,480 40,032 211,611 28,550 32,521 1,390,557 3,878 Commissions Paid $ 4,163 735 322,448 579 1,066,445 28,052 53,503 417,711 12,475 2,695,739 4,901 35,886 8,687 11,118 63,478 106,600 11,786 732 29,099 100 1,586 4,494 3,220,891 1,175 6,744 2,707 7,109 10,408 4,068 445 4,456 738 1,071 52,620 155 (continued) . Schedule of Fees and Commissions PENSION TRUST FUND For the Fiscal Year Ended August 31, 2015 Shares Traded 14,900 2,400 53,117 43,365 1,910,600 11,252 3,000 598,539 219,000 2,423,329 12,904 1,372,500 6,380 471,990 434,496,442 1,148,460 80,300 82,344 389,985 567,970 228,368 43,035 10,512 336,633,799 58,370 250,250 16,017,848 1,601 70,442 7,800 4,950 2,494,467 15,912 103,770 Brokerage Firm Federal Reserve Bank of Boston Fidelity Capital Markets Fidelity Clearing Canada Fig Partners, LLC Financial Brokerage Group (FBG) First Analysis Securities Corp. First Energy Capital Friedman, Billings & Ramsey Fubon Securities Co. LTD G Trade Services LTD Gabelli & Co. GK GOH Ometraco, PT Global Hunter Securities, LLC GMP Securities, L.P. Goldman Sachs & Co. Goodbody Stockbrokers Gordon, Haskett & Co. Green Street Advisors Guggenheim Capital Markets, LLC Guzman & Co. Hanwha Securities Seoul Height Securities, LLC Hibernia Southcoast Capital, Inc. HSBC Holdings, PLC Hyundai Securities Co. LTD IC Securities (GH) LTD ICAP, PLC ICBC Financial Services, LLC ICICI Securities LTD IM Trust S.A. Corredores De Bolsa Imperial Capital, LLC India Infoline LTD Industrial and Commercial Bank ING Bank N.V. Investment Section 129 Commissions Paid $ 73 108 1,461 1,032 15,490 563 92 18,970 456 122,205 516 983 76 8,384 4,671,402 6,426 2,811 2,882 13,791 26,695 8,410 1,506 420 726,919 6,819 507 827,100 32 885 144 198 26,886 636 8,899 (continued) .
Schedule of Fees and Commissions PENSION TRUST FUND For the Fiscal Year Ended August 31, 2015 Shares Traded 296,917,600 67,200 44,152 1,424,305 23,041,224 458,450 4,558,724 147,600 3,079,515 54,200 128,585,910 1,249 451,622,272 390,614 331,543,733 9,731 214,181 473,716 47,619 1,193,237 17,657,802 939,279 6,002,183 24,974,369 81,971 66,456 1,012,630 4,696,500 906,655 3,872,100 419,645 2,172,204 7,252,672 13,545,437 109,646 Brokerage Firm Instinet, LLC Interacciones Casa de Bolsa, S.A. de C.V. Intermonte Sec SIM SPA Investec Bank, PLC Investment Technology Group LTD IS Yatirim Menkul Degerler AS ISI Group, Inc. Itau BBA USA Securities, Inc. Itau Chile Corredor De Bolsa LTD Itau Europa Securities, Inc. ITG Group, Inc. ITGL J.P. Morgan Secruities, Inc. Janney Montgomery Scott, LLC Jefferies & Company, Inc. JM Financial Institutional Securites LTD JNK Securities, Inc. Joh. Berenberg, Gossler & Co., KG Johnson Rice & Company, LLC Jones & Associates, Inc. Jones Trading Institutional Services, LLC KAS-Associates N.V. KB Investment & Securities Co.
LTD KCG Americas, LLC Keefe Bruyette & Woods, Inc. Kempen & Co. N.V. Kepler Equities Kestrel Capital East Africa LTD Keybanc Capital Markets, Inc. KIM ENG Holdings LTD Korea Investment & Securities Co. LTD Kotak Securities LTD Lanka Securities Pvt.
LTD LarrainVial S.A. Leerink Swann & Co. Investment Section 130 Commissions Paid $ 1,752,245 728 1,544 52,068 454,251 2,022 111,844 2,136 2,512 1,897 294,339 13 4,748,599 13,555 2,070,607 1,092 8,527 3,544 1,905 56,901 582,762 21,810 20,850 568,526 2,972 1,034 31,888 20,077 35,802 9,336 46,894 32,625 37,262 2,203 4,184 (continued) . Schedule of Fees and Commissions PENSION TRUST FUND For the Fiscal Year Ended August 31, 2015 Shares Traded 32,500 28,553 21,828,724 165,242 5,893,079 152,443 36,150 249,635,648 166,963 24,709 101,619 3,584 4,656,900 6,962,747 1,303,259 10,267 790,324,419 2,765,251 3,366 132,515 2,437,836 143,391 92,400 730,247 13,355 2,649,737 18,237 21,594,545 46,129 37,615 40,125 3,893,780 284,776 592,000 152,908 2,435,543 Brokerage Firm Lek Securities Corp. Liberum Capital LTD Liquidnet Holdings, Inc. Longbow Securities, LLC Loop Capital Markets, LLC M.M. Warburg & Co. MA Sidel & Co. Macquarie Bank LTD MainFirstBank AG Maxim Group Miller Tabak + Co., LLC Mirae Asset Securities Co. LTD Mitsubishi UFJ Securities Co. LTD Mizuho Securities MKM Partners, LLC MND Partners, Inc. Morgan Stanley & Co., Inc. Motilal Oswal Securities LTD Murarilal Saraf National Bank of Canada National Financial Services, LLC Natixis Securities, Inc. NavPoint, LLC Needham & Co. Neonet AB Nesbitt Burns Noble International Investments, Inc. Nomura Securities International, Inc. Nordea Bank AB North South Capital, LLC Northland Securities, Inc. Numis Securities LTD Oddo Finance Okasan Internaitional (Asia) LTD Olivetree Securities LTD Oppenheimer & Co., Inc. Investment Section 131 Commissions Paid $ 1,300 2,174 204,068 6,542 268,609 8,811 362 1,333,524 13,398 979 2,689 5,538 72,557 104,861 47,697 205 4,848,481 25,367 82 3,667 86,905 5,699 3,234 27,290 156 28,729 729 60,175 1,821 1,397 1,443 25,345 14,406 3,831 2,368 83,914 (continued) .
Schedule of Fees and Commissions PENSION TRUST FUND For the Fiscal Year Ended August 31, 2015 Shares Traded 422,121 7,332 46,724 12,606,140 433,334 86,559,480 58,598 106,688 140,000 927,216 29,512 953,420 1,245,469 229,991 7,506 2,109,251 27,641,251 3,170,471 27,452 1,064,268 1,445,000 2,050,158 972,418 94,137 461,750 128,000 3,590 4,164,860 792,837 246,398 76,147,490 53,151 128,414,541 74,707 Brokerage Firm Pacific Crest Securities Panmure Gordon & Co. Parel Penserra Securities, LLC Penson Financial Services, Inc. Pershing Securities LTD Petercam S.A. Pickering Energy Parnters, Inc. Pictet Canada, L.P. Piper Jaffray Publikum Borzno Posredovanje D.D. Pulse Trading, LLC Quaker Securities, Inc. Rabobank Group Rafferty Capital Marktes, LLC Raymond James & Associates, Inc. RBC Financial Group Redburn Partners, LLP Religare Capital Markets LTD Renaissance Capital Holdings LTD RHB Investment Bank Berhand Co. Robert W. Baird & Co., Inc. Rosenblatt Securities, LLC Rosy Blue Securities Pvt. LTD ROTH Capital Partners, LLC Roulston Research Corp. S B Lewis & Company Saigon Securities, Inc. Samsung Securities Co. LTD Sandler O'Neil & Partners, L.P. Sanford C.
Bernstein Co. LTD Santander Investment Securities, Inc. Scotia Capital, Inc. Sea Port Group Securities, LLC Investment Section 132 Commissions Paid $ 15,288 31 4,315 621,931 2,686 1,675,041 7,901 4,152 3,500 33,004 2,577 42,427 40,018 2,926 263 76,497 833,773 16,703 1,493 23,179 2,005 76,736 20,620 2,413 15,255 2,240 108 18,125 110,583 9,856 496,221 2,231 741,793 1,657 (continued) . Schedule of Fees and Commissions PENSION TRUST FUND For the Fiscal Year Ended August 31, 2015 Shares Traded 1,402 23,716 444,017 21,396,605 41,487 29,392 116,486,807 4,473,299 8,539,437 9,355,394 1,322,320 1,591,831 9,413,908 810 21,200 70,026 17,369,273 717,502 131,907 2,600 141,376 523,304 4,907,358 215,320 1,209,580 6,091 90 2,181,179 2,209,700 472,210 276,036 723,798,181 11,860 57,771 4,700 256,005 Brokerage Firm Shenyin & Wanguo Securities Co. Shinhan Investment Corp. Sidoti & Company, LLC SJ Levinson & Sons, LLC Skandinaviska Enskilda Bank Simmons & Company International Societe Generale Group SS Kantilal Ishwarlal Securities Standard Chartered Bank State Street Bank & Trust Co. Stephens, Inc. Sterne Agee & Leach, Inc. Stifel Nicolaus & Co., Inc. Strategas Securities, LLC Stuart Frankel & Co., Inc. Sturdivant & Co., Inc. Sumitomo Mitsui Financial Group, Inc. Suntrust Capital Marktes, Inc. Svenska Handelsbanken Swap Broker Tachibana Securities TD Securities TD Waterhouse Cda Telsey Advisory Group, LLC Tera Menkul Degerler A.S. The Alta Group, LLC Tong Yang Securities, Inc. Topeka Capital Markets Topline Securities (Private) LTD Tudor, Pickering, Holt & Co. Tunisie Valeurs UBS AG U.S. Capital Advisors, LLC UniCredit Bank Austria AG United First Partners, LLP Uti Securities Exchange LTD Investment Section 133 Commissions Paid $ 1 1,361 18,127 1,000,165 1,921 1,176 279,195 36,190 48,267 227,225 43,123 61,017 267,460 28 848 2,801 250,779 27,612 3,093 785 3,051 27,078 155,311 6,656 1,168 4,134 5 22,756 10,442 24,555 6,616 2,367,685 415 25,356 141 2,262 (continued) . Schedule of Fees and Commissions PENSION TRUST FUND For the Fiscal Year Ended August 31, 2015 Shares Traded 1,196,706 95,786 14,400 2,948,958 11,791,787 6,327,645 1,126,479 2,079,592 171,904 407,660 3,030 149,151 140,000 8,800 7,235,723,941 Shares Traded 85,423 2,570,874 553,259 3,209,556 Brokerage Firm VTB Bank Warburg Dillon Read, LLC Watkins & Company, Inc. Wedbush Securities, Inc. Weeden & Co. LTD Wells Fargo Securities, LLC William Blair & Company, LLC Wood & Company Woori Investment Securities Wunderlich Securities, Inc. XP Investimentos CCTVM S.A. Yamner & Co., Inc. Yaunta Core Pacific Securities Zacks & Company Total Futures Contracts Brokerage Firm Credit Suisse Group AG Goldman Sachs & Co. JP Morgan Securities, Inc. Total Investment Section 134 Commissions Paid $ 1,583 14 576 33,535 479,252 228,513 47,153 16,496 18,006 13,901 13 1,492 1,249 313 $ 58,281,287 Commissions Paid $ 49,116 7,856,276 1,150,998 $ 9,056,390 . ACTUARIAL SECTION . Actuarial Information Pension Trust Fund . Actuarial Section 136 . Actuarial Information Pension Trust Fund . Actuarial Section 137 . Actuarial Information Pension Trust Fund Actuarial Section 138 . Actuarial Information Pension Trust Fund Actuarial Section 139 . Actuarial Information Pension Trust Fund Actuarial Section 140 . Actuarial Information Pension Trust Fund Actuarial Present Value of Future Benefits From Actuarial Valuation as of August 31, 2015 (With Comparative Data for August 31, 2014) 2015 Present Value of Benefits Presently Being Paid Service Retirement Benefits Disability Retirement Benefits Death Benefits Present Survivor Benefits TOTAL PRESENT VALUE OF BENEFITS PRESENTLY BEING PAID Present Value of Benefits Payable in the Future to Present Active Members Service Retirement Benefits Disability Retirement Benefits Termination Benefits Death and Survivor Benefits TOTAL ACTIVE MEMBER LIABILITIES Present Value of Benefits Payable in the Future to Present Inactive Members Inactive Vested Participants Refunds of Contributions to Inactive Non-vested Members Future Survivor Benefits Payable On Behalf of Present Annuitants TOTAL INACTIVE LIABILITIES TOTAL ACTUARIAL PRESENT VALUE OF FUTURE BENEFITS 2014 $80,335,545,136 1,113,095,219 851,515,997 243,282,654 $76,357,134,130 1,014,408,651 839,061,459 241,128,389 $82,543,439,006 $78,451,732,629 $98,467,131,191 1,203,603,679 7,863,244,733 1,758,578,113 $109,292,557,716 $100,367,139,589 1,492,083,391 8,638,663,636 1,983,416,721 $112,481,303,337 $4,084,868,043 $3,284,986,647 $400,439,304 $371,647,155 1,341,025,218 $5,826,332,565 1,302,923,361 $4,959,557,163 $197,662,329,287 $195,892,593,129 Summary of Cost Items 2015 Actuarial Present Value of Future Benefits Present Value of Future Normal Costs Actuarial Accrued Liability Actuarial Value of Assets UNFUNDED ACTUARIAL ACCRUED LIABILITY $197,662,329,287 (31,209,404,783) $166,452,924,504 (133,485,187,642) $32,967,736,862 Actuarial Section 141 2014 $195,892,593,129 (35,856,992,303) $160,035,600,826 (128,397,777,855) $31,637,822,971 . Actuarial Information Pension Trust Fund Financing objectives and funding policy: The funding policy of the Teacher Retirement System (TRS) is established by the state legislature. Contribution rates may not be reduced or eliminated, or benefits may not be improved, if, as a result of the particular action, the time, as determined by an actuarial valuation, required to amortize the unfunded actuarial liabilities of the retirement system, would be increased to a period that exceeds 30 years by one or more years. For detailed information, see Note 1. Actuarial Methods and Assumptions: The actuarial valuation for TRS was prepared by Gabriel, Roeder, Smith & Company (GRS). The actuary relied on membership data and asset information provided by TRS staff. While not verifying the data at their source, the actuary performed such tests for consistency and reasonableness as was deemed necessary to be satisfied with the appropriateness of using the data supplied. The actuarial cost method used for financial reporting purposes was the Individual Entry Age Normal method as prescribed by GASB 67 and the method used for funding purposes was the Ultimate Entry Age Normal (EAN) method.
The Ultimate EAN cost method is used because it creates the most level funding requirement across the generations of members and stakeholders. The difference between the two methods resides in the calculation of the normal cost for the members in the system. Under Individual EAN, the normal cost for each member is based on the benefit tier for that member while the Ultimate EAN method uses the normal cost for the tier new members are currently being hired into; which reflects the longer term normal cost. The actuarial methods and assumptions have been selected by the Board of Trustees of the Teacher Retirement System of Texas based upon GRS analysis and recommendations.
The Board of Trustees has sole authority to determine the actuarial assumptions used for the plan. The actuarial methods and assumptions are primarily based on a study of actual experience for the four year period ending August 31, 2014 and was adopted on September 24, 2015. The results of the actuarial valuation are dependent on the assumptions used.
Actual results can and will differ as actual experience deviates from these assumptions. Seemingly minor changes in assumptions can materially change the liabilities, calculated contribution rates, and funding periods. With the exception of the post-retirement mortality rates and the decrease in the assumption for general wage inflation, the changes to overall assumptions and methods had a minor impact on results and are presented in a simpler to understand format.
Post-Retirement Mortality rates for current and future retirees are prepared in accordance with the Actuarial Standards of Practice No. 35 which advises actuaries to “adjust mortality rates to reflect mortality improvement prior to the measurement date and to include an assumption as to the expected mortality improvement after the measurement date.” Actuarial Value of Assets: The actuarial value of assets is equal to the market value of assets less a five-year phase in of the excess (shortfall) between expected investment return and actual income. The actual calculation is based on the difference between actual market value and the expected actuarial value of assets each year, and recognizes the cumulative excess return (or shortfall) over at a minimum rate of 20% per year.
Each year a base is set up to reflect this difference. If the current year’s base is of opposite sign to the deferred bases then it is offset dollar for dollar against the deferred bases. Any remaining bases are then recognized over the remaining period for the base (5 less the number of years between the bases year and the valuation year). Actuarial Assumptions: Investment Return Rate: 8.00% per annum, net of investments, compounded annually, composed of an assumed 2.50% inflation rate and a 5.50% real rate of return. Rates and scales developed in the actuarial investigation as of August 31, 2014, with values at specimen ages shown in the tables below: Actuarial Section 142 .
Actuarial Information Pension Trust Fund Post-Retirement Mortality: Service Retirement Annuitants, Beneficiaries and Survivors Post-Retirement Mortality Age Male Members Female Members 40 50 60 70 80 90 100 110 0.001938 0.004247 0.005584 0.015547 0.053691 0.162983 0.407509 0.500000 0.001585 0.002791 0.003882 0.009613 0.035591 0.133727 0.284047 0.467915 Rates of Retirement (for members hired after August 31, 2007): For members hired after August 31, 2007 and who are not vested as of August 31, 2014, or, for members hired after August 31, 2014, the retirement rates for members once they reach unreduced retirement eligibility at age 62 are increased 10% for each year the member is beyond the Rule of 80 (i.e. if the member reached the Rule of 80 at age 58 then the probability of retirement at age 62 is 140% of the rate shown below). Rates of Retirement Normal Retirement Age Male Female 50 0.1300 0.3000 51 0.1300 0.1200 52 0.1300 0.1300 53 0.1300 0.1400 54 0.1400 0.1500 55 0.1500 0.1600 56 0.1600 0.1700 57 0.1700 0.1800 58 0.1800 0.1900 59 0.1800 0.2000 60 0.2200 0.2100 61 0.2000 0.2200 62 0.2400 0.2300 63 0.2000 0.2300 64 0.2000 0.2300 65-74 0.2200 0.2300 75 1.0000 1.0000 Early Retirement Age Male Female 45-46 0.0100 0.0100 47 0.0100 0.0200 48 0.0200 0.0300 49 0.0300 0.0400 50-58 0.0100 0.0100 59 0.0100 0.0200 60-61 0.0200 0.0200 62 0.0500 0.0400 63 0.0500 0.0500 64 0.0600 0.0600 65 0.0500 0.0500 Actuarial Section 143 . Actuarial Information Pension Trust Fund Rates of Termination (net of applying rehire assumption): Probability of Decrement Due to Withdrawal Years of Service 1 2 3 4 5 6 7 8 9 10 Male Members 0.149027 0.119756 0.096637 0.072275 0.062453 0.055556 0.047176 0.041464 0.036978 0.033777 Female Members 0.143098 0.117329 0.097896 0.076765 0.068443 0.060368 0.049631 0.043108 0.038477 0.035264 Rates of Disability Retirement: Probability of Decrement Due to Disability Age 20 30 40 50 60 For Service >= 10 Male Female 0.000184 0.000276 0.000184 0.000276 0.000430 0.000469 0.001993 0.001817 0.003505 0.002754 For Service < 10 Male 0.000037 0.000037 0.000086 0.000399 0.000701 Female 0.000055 0.000055 0.000094 0.000363 0.000551 Active Mortality: Active Mortality Age 20 30 40 50 60 70 80 90 Male Members 0.000365 0.000407 0.000565 0.001517 0.004219 0.012469 0.034930 0.123749 Actuarial Section 144 Female Members 0.000146 0.000196 0.000356 0.000992 0.002198 0.005678 0.016542 0.092945 . Actuarial Information Pension Trust Fund Rates of Salary Increase: The following table reflects an inflation rate of 2.50%, plus productivity component of 1.00%, plus step-rate/promotional component as shown. Rates of Salary Increase Years of Service Merit, Promotion, Longevity 1 2 3 4 5 6 7 8-12 13 14 15 16-17 18 19-20 21-22 23-24 25 or more 6.00% 2.50 1.90 1.70 1.50 1.40 1.20 1.00 0.80 0.70 0.60 0.50 0.40 0.30 0.20 0.10 0.00 General 3.50% 3.50 3.50 3.50 3.50 3.50 3.50 3.50 3.50 3.50 3.50 3.50 3.50 3.50 3.50 3.50 3.50 Total 9.50% 6.00 5.40 5.20 5.00 4.90 4.70 4.50 4.30 4.20 4.10 4.00 3.90 3.80 3.70 3.60 3.50 Actuarial Cost Method: The funding period required to amortize the unfunded actuarial accrued liability is determined using the entry age actuarial cost method. This method assigns the plan’s total unfunded liabilities (the actuarial present value of future benefits less the actuarial value of assets) to various periods. Funding of Unfunded Actuarial Accrued Liability: Funded by the excess of future State/employer contributions required by law over the amount of such contributions required to fund the normal cost of benefits. Under the actuarial funding method and the benefit provisions for new hires, the ultimate normal cost for benefits provided by the System is 9.92% of payroll (7.70% by members plus 2.22% by the State). An additional 0.12% of payroll is used to pay for administrative expenses of the System, leaving 5.36% of payroll less than the ultimate total contribution rate required by law.
It is intended that the excess amount of 5.36% of payroll will be used to amortize any unfunded actuarial accrued liabilities of the System, assuming that total payroll increases by 2.50% per year. As of the valuation as of August 31, 2015, these excess contributions of 5.36% of pay are sufficient to amortize the UAAL, but not under the prescribed 30 year funding period. Actuarial Section 145 . Actuarial Information Pension Trust Fund Schedule of Active Member Valuation Data: Schedule of Active Member Valuation Data Valuation Year Active Members 2006 2007 2008 2009 2010 2011 2012 2013 2014 2015 Annualized Payroll in Thousands 761,658 777,789 801,455 817,537 834,060 828,919 815,155 831,302 857,342 828,851 $28,397,283 31,114,096 33,237,904 35,096,890 36,628,844 36,797,011 36,309,449 37,104,333 39,195,104 37,121,748 Average Annual Salary Annual Percentage Increase in Average Salary $37,284 40,003 41,472 42,930 43,916 44,392 44,543 44,634 45,717 44,787 2.8% 7.3 3.7 3.5 2.3 1.1 0.3 0.2 2.4 (2.0) Schedule of Retirees, Beneficiaries, and Disabled Participants Added to and Removed from Rolls: Retirees, Beneficiaries, and Disabled Participants Added to and Removed from Rolls Added to Rolls Valuation as of August 31 2006 2007 2008 2009 2010 2011 2012 2013 2014 2015 Number Annual Allowances 15,810 15,861 17,727 17,326 20,076 24,688 27,915 25,825 24,429 25,134 $324,292,542 336,348,640 391,920,863 392,452,923 473,512,423 620,038,676 697,134,389 743,998,946 573,876,713 604,436,264 Removed from Rolls Number Annual Allowances 7,175 7,698 7,806 7,940 8,199 8,499 8,848 9,344 9,475 10,578 $120,623,840 131,295,705 135,160,090 136,537,511 142,187,645 147,985,004 155,597,838 165,231,795 174,915,127 191,966,951 Actuarial Section 146 Rolls - End of Year Number Annual Allowances Percentage Annual Increase 257,144 265,307 275,228 284,614 296,491 312,680 331,747 348,228 363,182 377,738 $5,282,107,571 5,487,160,506 5,743,921,279 5,999,836,691 6,331,161,469 6,803,215,141 7,344,751,692 7,923,518,843 8,322,480,429 8,734,949,742 4.0% 3.9 4.7 4.5 5.5 7.5 8.0 7.9 5.0 5.0 Average Annual Allowances $20,541 20,682 20,870 21,081 21,354 21,758 22,140 22,754 22,915 23,124 . Actuarial Information Pension Trust Fund Analysis of Financial Trends: Analysis of Financial Experience Changes in Unfunded Actuarial Accrued Liabilities (UAAL)* Resulting from Differences Between Assumed Experience and Actual Experience Increase/(Decrease) for Year (Billions) As of August 31 2015 2014 2013 2012 2011 2010 2009 2008 2007 2006 Investment (Gains)/ Losses $1.237 (1.095) 2.045 2.208 1.958 1.161 10.321 (1.232) (4.140) (0.264) Legislative Changes/ Benefit Increases 0.360 Contribution Assumption Experience Changes $0.912 1.157 1.911 1.258 0.826 0.797 0.149 0.228 0.496 0.508 $0.682 2.282 0.708 (0.271) 0.676 *Calculated on a 5-year smoothed market basis Actuarial Section 147 Liability Experience ($1.501) 0.358 (1.829) (1.427) (1.350) (0.705) (0.347) (0.694) 2.135 0.254 Net Increase/ (Decrease) $1.330 2.702 2.835 2.039 1.163 1.253 10.123 (1.022) (1.149) 0.498 Beginning UAAL Ending UAAL $31.638 28.936 26.101 24.062 22.899 21.646 11.523 12.545 13.694 13.196 $32.968 31.638 28.936 26.101 24.062 22.899 21.646 11.523 12.545 13.694 . Actuarial Information Pension Trust Fund Solvency Test: A short-term solvency test is one means of checking a retirement system’s progress under its funding program. The schedule below provides a historical illustration of a short-term solvency test for TRS wherein present assets are compared with: (1) active member contributions on deposit; (2) the liabilities for future benefits to present annuitants (Retirees and Beneficiaries); (3) the liabilities for active members under the entry age normal actuarial cost method including a projection of future salary increases and anticipated future service (Active Members (State Financed Portion)). Under the level percent of payroll financing followed by TRS, liabilities for active member contributions on deposit and the liabilities for future benefits to present retirees and beneficiaries will be fully covered by present assets except in rare circumstances. In addition, liabilities for active member benefits earned or to be earned in the future will be partially covered by the remainder of present assets. Generally, if the system has been using level cost financing, the funded portion of active member benefits will increase over time. Solvency Test (AMOUNTS SHOWN IN MILLIONS) Valuation as of August 31 2006 2007 2008 2009 2010 2011 2012 2013 2014 2015 Aggregate Actuarial Accrued Liabilites For Active Members Active Member Retirees and (State Financed Portion) Contributions Beneficiaries (3) (1) * (2) * $20,590 22,236 23,928 23,914 27,559 28,911 30,006 31,365 33,028 33,856 $49,144 51,293 53,243 55,484 58,476 63,470 68,449 73,841 78,431 82,535 $38,177 42,435 44,585 48,632 48,156 46,934 45,972 45,460 48,576 50,062 Valuation Assets $94,128 103,419 110,233 106,384 111,293 115,253 118,326 121,730 128,398 133,485 *Adjusted for pending transfers to retired reserve at August 31 for pending retirements. Actuarial Section 148 Portion of Aggregate Actuarial Accrued Liabilities Covered by Valuation Assets Active Active Members Member Retirees and (State Financed Contributions Beneficiaries Portion) (1) * (3) (2) * 100% 100 100 100 100 100 100 100 100 100 100% 100 100 100 100 100 100 100 100 100 64.1% 70.4 74.2 55.5 52.5 48.7 43.2 36.4 34.9 34.1 .
Actuarial Information Pension Trust Fund Schedule of Funding Progress: Taking into account only the dollar amounts of aggregate actuarial accrued liabilities and unfunded actuarial accrued liabilities (UAAL) can be misleading. The dollar amounts of these two items can be increasing at a time when their actual substance may be decreasing. Dividing valuation asset dollars by aggregate actuarial accrued liability dollars and dividing UAAL dollars by active member payroll dollars provide clarifying indices. The larger the ratio of valuation assets to aggregate actuarial accrued liabilities, the stronger the system.
Observation of these relative indices over a period of years will give an indication of whether the system is becoming stronger or weaker. Schedule of Funding Progress (DOLLAR AMOUNTS SHOWN IN MILLIONS) [1] [2] [3] [4]* [5] Valuation as of August 31 Actuarial Value of Assets Actuarial Accrued Liability (AAL) Unfunded AAL (UAAL) (3)-(2) Funded Ratio Assets as a % of AAL (2)/(3) 2006 2007 2008 2009 2010 2011 2012 2013 2014 2015 $94,218 103,419 110,233 106,384 111,293 115,253 118,326 121,730 128,398 133,485 $107,911 115,964 121,757 128,029 134,191 139,315 144,427 150,666 160,036 166,453 $13,694 12,545 11,523 21,646 22,899 24,062 26,101 28,936 31,638 32,968 87.3% 89.2 90.5 83.1 82.9 82.7 81.9 80.8 80.2 80.2 [6] [7] Projected Payroll UAAL as a % of Covered Payroll (4)/(6) $28,397 31,114 33,238 35,097 36,629 36,797 36,310 37,104 38,522 39,620 48.2% 40.3 34.7 61.7 62.5 65.4 71.9 78.0 82.1 83.2 *Slight variances with the Actuarial Report could result due to rounding. The 10 year schedule of actuarially determined and actual contributions can be found in the Required Supplementary Information section. Actuarial Section 149 . Actuarial Information TRS-Care Actuarial Section 150 . Actuarial Information TRS-Care Actuarial Section 151 . Actuarial Information TRS-Care Actuarial Present Value of Future Benefits From Actua ri a l Va l ua ti on a s of Augus t 31, 2015 (Wi th Compa ra ti ve Da ta for Augus t 31, 2014) Based on a 5.25% discount rate 2015 Present Value of Benefits Being Paid Future Medical Claims Future Rx Claims Retiree Premiums Collected NET PRESENT VALUE OF BENEFITS FOR CURRENT RETIREES Present Value of Benefits Payable in the Future to Present Active Members Future Medical Claims Future Rx Claims Retiree Premiums Collected NET PRESENT VALUE OF BENEFITS FOR FUTURE RETIREES TOTAL ACTUARIAL PRESENT VALUE OF FUTURE BENEFITS 2014 $ 11,456,408,122 14,992,390,269 (5,699,607,494) $ 10,639,267,795 11,335,260,965 (5,667,042,108) $ 20,749,190,897 $ 16,307,486,652 $ 27,343,585,400 30,521,332,625 (11,174,537,629) $ 22,589,627,235 22,183,678,917 (10,422,453,865) $ 46,690,380,396 $ 34,350,852,287 $ 67,439,571,293 $ 50,658,338,939 Summary of Cost Items 2015 Actuarial Present Value of Future Benefits Present Value of Future Normal Costs Actuarial Accrued Liability Actuarial Value of Assets UNFUNDED ACTUARIAL ACCRUED LIABILITY 2014 $ 67,439,571,293 (23,236,242,417) $ 44,203,328,876 (972,919,240) $ 50,658,338,939 (16,939,789,860) $ 33,718,549,079 (457,940,487) $ 43,230,409,636 $ 33,260,608,592 Actuarial Value of Assets: The Actuarial Present Value of benefits allocated to a valuation year is called the Normal Cost. The Actuarial Present Value of benefits allocated to all periods prior to a valuation year is called the Actuarial Accrued Liability. Differences between assumed experience and actual experience (“actuarial gains and/or losses”) become part of actuarial accrued liabilities. Actuarial Methods and Assumptions: The actuarial valuation of TRS-Care is prepared by Gabriel, Roeder, Smith & Company. The actuary relies on membership data and asset information provided by TRS staff. While not verifying the data at their source, the actuary performs such tests for consistency and reasonableness as deemed necessary to be satisfied with the appropriateness of using the data supplied. Actuarial Section 152 .
Actuarial Information TRS-Care Analysis of Financial Trends: Analysis of Financial Experience (AMOUNTS SHOWN IN MILLIONS) 2012 2013 2014 2015 Asset Gain/(Loss) Liability Gain/(Loss) New Assumptions Gain/(Loss) Benefit Changes Gain/(Loss) Contributions Gain/(Loss) Net Gains/(Loss) $ Valuation as of August 31 $ $ $ $ $ (38) (31) (24) (36) 2,148 24 (619) (3,369) (1,302) (1,699) (1,235) (6,232) 3,458 1,266 0 0 (1,485) (1,458) (1,522) (1,004) 2,781 (1,898) (3,400) (10,641) Solvency Test: Solvency Test (AMOUNTS SHOWN IN MILLIONS) Portion of Aggregate Actuarial Accrued Liabilities Covered by Valuation Assets Aggregate Actuarial Accrued Liabilities For (1) Valuation as of August 31 2008 2009 2010 2011 2012 2013 2014 2015 (2) (3) (4) (5) Beneficiaries Active Member and Vested Members (Employer Valuation Contributions* Terminations Financed Portion) Assets NA NA NA NA NA NA NA NA $9,318 9,642 10,918 13,710 12,676 14,367 16,307 20,749 $12,994 14,716 14,889 16,075 14,866 15,468 17,411 23,454 $729 800 815 891 741 551 458 973 (6) (7) (8) Active Beneficiaries and Members Member Vested (Employer Financed Contributions Terminations [(5)- Portion) [(5)-(2)(5)/(2) (2)]/(3) (3)]/(4) NA NA NA NA NA NA NA NA 7.8% 8.3 7.5 6.5 5.8 3.8 2.8 4.7 0.0% 0.0 0.0 0.0 0.0 0.0 0.0 0.0 *Active member contributions are non-refundable. Actuarial Cost Method: The Projected Unit Credit actuarial cost method of valuation was used in determining liabilities and normal cost. A method under which the benefits of each individual included in an Actuarial Valuation are allocated by a consistent formula to valuation years. All benefits are projected according to healthcare trends and aging factors as disclosed above. Funding of Unfunded Actuarial Accrued Liability: Unfunded actuarial accrued liabilities are amortized to produce payments (principal & interest) which are a level percent of payroll. Actuarial Section 153 . Actuarial Information TRS-Care All of the demographic assumptions (rates of retirement, termination and disability) and most of the economic assumptions (general inflation, salary increases, and general payroll growth) used in this OPEB Valuation are identical to those which were adopted by the Board in 2015 after the preparation of an actuarial experience study and used in the respective TRS valuation. The following assumptions which are specific to OPEB were updated from the prior year’s report: 1. The trend rates were reset to better reflect the plan’s anticipated experience. The new trend assumptions assume: a. a faster growth in prescription drug costs than the prior assumptions b.
retiree premiums will not increase in FYE17 c. a lower ultimate trend assumption based on the revised inflation assumption 2. The ultimate trend assumption was increased by 0.20% to reflect the anticipated costs associated with the “Cadillac Tax”. Schedule of Retirees and Beneficiaries Added to and Removed from Rolls: Schedule of Retirees and Beneficiaries Added to and Removed from Rolls Added to Rolls (2) (3) Removed from Rolls (4) (5) Rolls - End of Year (6) (7) (1) Valuation as of August 31 Number Annual Allowances Number Annual Allowances Number 2009 2010 2011 2012 2013 2014 2015 12,158 14,996 20,467 19,407 19,798 18,916 19,171 $ 54,271,769 71,136,696 109,331,023 92,279,848 98,603,255 97,956,524 106,177,651 8,192 7,924 8,019 8,220 10,176 10,656 11,116 $ 19,365,868 21,837,784 24,802,618 28,700,248 25,946,471 27,648,497 31,400,277 202,934 $ 694,017,558 210,006 757,979,912 222,454 898,001,599 233,641 768,682,199 243,263 824,715,257 251,523 933,885,969 259,578 1,050,329,854 Annual Allowances * (8) (9) % Increase Average in Annual Annual Allowances Allowances 14.5% 9.2 18.5 (14.4) 7.3 13.2 12.5 $ 3,420 3,609 4,037 3,290 3,390 3,713 4,046 * Expected employer provided claims and expenses (net of retiree premiums).
Annual allowances in Column (7) include increases due to health care inflation for continuing retirees. Therefore, the annual allowance is not equal to the beginning of year allowance plus the "Added to Rolls" allowance minus the "Removed from Rolls" allowance. Actuarial Section 154 . STATISTICAL SECTION . Statistical Section Overview This page is intentionally left blank. Statistical Section 156 . Statistical Section Overview The Statistical Section presents additional information to provide financial statement users with added historical perspective, context and detail to assist in using the information in the financial statements, notes to financial statements, and required supplementary information to understand and assess the system’s financial condition. Information is presented for the Pension Trust Fund, TRS-Care, TRS-ActiveCare, and the 403(b) Administrative Program. FINANCIAL TRENDS INFORMATION The schedules on the following pages show financial trends information that assists users in understanding and assessing how the system’s financial position has changed over time. The financial trend schedules presented are: • Changes in Fiduciary Net Position • Revenues, Expenses and Changes in Net Position • Benefit and Refund Deductions from Net Position by Type • Benefit Deductions from Net Position by Type OPERATING INFORMATION The schedules presented immediately following the Financial Trends Information contain benefit and reporting operating information to provide contextual data about the system’s operations and resources to assist users in using financial statement information to understand the benefit services provided by the system. The operating information schedules presented are: • Average Benefit Payments – Pension Trust Fund • Average Monthly Benefit – Pension Trust Fund • Average Benefit Payments – Health Benefits • Retired Members by Type of Benefit – Pension Trust Fund • Health Benefit Payments by Range • Principal Participating Employers In addition, a complete listing of participating employers has been included.
The information in this section was derived from internal sources and the CAFR for the relevant year. Statistical Section 157 . FINANCIAL TRENDS INFORMATION Changes in Fiduciary Net Position PENSION TRUST FUND For the Fiscal Years Ended August 31 2015 Additions Member Contributions State's General Fund Non-Employer Contributing Entity Employer Contributions Participating Employers Purchase of Service Credit 415 Excess Benefit Arrangement Service Contributions Transferred in from ERS Investment Income Net of Expenses Interest, Dividends & Securities Lending Net Increase (Decrease) in Fair Value of Investments Other TOTAL ADDITIONS Deductions Benefits Excess Benefits Refunds of Contributions Service Contributions Transferred to ERS Administrative Expenses, Excluding Investing Activity Expenses TOTAL DEDUCTIONS Net Increase (Decrease) Net Position - Beginning of Year Net Position - End of Year 2014 2013 2012 $ 2,576,024,311 $ 2,357,686,000 $ 2,252,094,934 $ 2,188,020,423 1,591,482,988 93,079,033 1,284,893,620 50,089,106 2,216,586 18,989,008 1,530,623,829 120,206,921 864,345,470 143,534,091 2,273,832 17,440,313 1,337,214,693 105,559,580 820,134,412 148,400,880 2,520,830 16,365,042 1,299,077,635 91,532,506 669,305,127 125,971,764 2,483,369 14,940,228 6,694,883,534 2,990,774,278 1,779,069,580 1,875,281,841 (7,107,642,634) 16,443,655,756 3,733,133 4,143,449 $ 5,207,748,685 $ 24,474,683,939 8,055,066,425 2,629,383 $ 14,519,055,759 5,972,016,449 1,867,389 $ 12,240,496,731 $ 8,935,111,459 2,216,586 391,341,181 84,059,353 $ 8,548,642,525 2,273,832 410,600,319 80,163,847 $ 8,075,208,484 2,520,830 391,292,412 75,513,146 $ 7,723,622,166 2,483,369 381,231,352 70,985,963 35,556,979 $ 9,448,285,558 $ (4,240,536,873) $132,779,243,085 $128,538,706,212 41,904,190 $ 9,083,584,713 $ 15,391,099,226 $117,388,143,859 $132,779,243,085 36,264,062 $ 8,580,798,934 $ 5,938,256,825 $111,449,887,034 $117,388,143,859 33,073,740 $ 8,211,396,590 $ 4,029,100,141 $107,420,786,893 $111,449,887,034 Pension Trust Fund Net Position Last Ten Years Billions $140 $130 $120 $110 $100 $90 $80 2006 2007 2008 2009 2010 2011 2012 Statistical Section 158 2013 2014 2015 . FINANCIAL TRENDS INFORMATION 2011 2010 2009 2008 2007 2006 $ 2,243,954,725 $ 2,205,017,425 $ 2,107,057,870 $ 1,998,138,487 $ 1,862,595,865 $ 1,700,415,419 1,484,285,519 111,486,255 744,733,236 105,177,104 1,750,588 12,628,712 1,461,034,870 116,553,826 719,051,333 84,519,762 1,504,510 11,167,772 1,378,304,342 103,539,599 687,910,583 74,542,413 1,553,381 9,558,927 1,352,243,134 98,785,295 604,937,605 87,207,374 1,646,494 8,897,722 1,283,641,587 187,489,771 282,077,713 86,497,411 1,453,605 7,913,660 1,166,690,192 165,411,289 267,399,619 153,556,417 1,041,961 6,908,439 2,020,253,763 1,868,708,873 2,058,925,313 3,387,500,183 3,066,117,408 2,624,813,225 12,616,681,465 1,576,613 $ 19,342,527,980 7,542,738,000 788,787 $ 14,011,085,158 (16,030,794,035) (7,992,472,030) 11,232,429,170 3,899 3,596 5,405 $ (9,609,397,708) $ (453,112,140) $ 18,010,221,595 6,326,056,726 769 $ 12,412,294,056 $ 7,173,504,788 1,750,588 334,268,822 64,772,079 $ 6,617,397,374 1,504,510 265,186,589 61,570,750 $ 6,294,434,115 1,553,381 266,695,076 57,135,135 $ 6,406,644,540 1,646,494 278,002,614 52,773,854 $ 5,762,885,044 1,453,605 280,005,584 48,538,424 $ 5,540,134,272 1,041,961 267,810,017 45,716,307 35,849,819 $ 7,610,146,096 $ 11,732,381,884 $ 95,688,405,009 $107,420,786,893 $ $ $ $ 28,310,448 $ 6,648,128,155 $ (16,257,525,863) $104,910,497,545 $ 88,652,971,682 26,122,662 $ 6,765,190,164 $ (7,218,302,304) $112,128,799,849 $104,910,497,545 27,502,276 $ 6,120,384,933 $ 11,889,836,662 $100,238,963,187 $112,128,799,849 26,444,405 $ 5,881,146,962 $ 6,531,147,094 $ 93,707,816,093 $100,238,963,187 29,992,608 6,975,651,831 7,035,433,327 88,652,971,682 95,688,405,009 Statistical Section 159 . FINANCIAL TRENDS INFORMATION Changes in Fiduciary Net Position TRS-CARE For the Fiscal Years Ended August 31 2015 2013 2012 $ 363,631,292 267,497,910 189,003,903 193,124,772 $ 355,685,504 139,095,786 180,824,523 160,952,396 $ 363,348,030 271,925,242 176,751,407 154,607,926 126,806,652 231,569,472 1,495,680 768,100,754 $2,179,310,118 Deductions Health Care Claims and Insurance Premium Payments Health Care Claims Processing and Other Administrative Expenses TOTAL DEDUCTIONS Net Increase (Decrease) Net Position - Beginning of Year Net Position - End of Year 2014 $ 369,066,459 281,098,358 198,196,273 202,976,470 Additions Health Care Premiums State Contributions Member Contributions Participating Employers Fringe Benefits Paid by State's General Fund on Behalf of TRS Employees Federal Revenue Rebate and Discount Income* Investment Income Supplemental Appropriation TOTAL ADDITIONS 139,422 78,589,415 200,859,859 2,061,745 36,058,148 $1,330,966,466 117,770 74,511,473 82,074,803 3,041,001 102,363,704 $1,098,666,960 103,676 68,633,946 $1,040,560,161 $1,613,181,278 47,380,407 3,769,680 $1,664,331,365 $ 514,978,753 $ 457,940,487 $ 972,919,240 $1,375,039,945 45,387,769 3,646,546 $1,424,074,260 $ (93,107,794) $ 551,048,281 $ 457,940,487 $1,241,656,374 43,577,852 3,398,109 $1,288,632,335 $ (189,965,375) $ 741,013,656 $ 551,048,281 $1,142,131,410 44,571,383 3,714,018 $1,190,416,811 $ (149,856,650) $ 890,870,306 $ 741,013,656 *Prior to fiscal year 2013, rebates were offset within health care claims. Millions $1,000 TRS-Care Net Position Last Ten Years $900 $800 $700 $600 $500 $400 2006 2007 2008 2009 2010 2011 2012 2013 2014 2015 Statistical Section 160 5,189,934 . FINANCIAL TRENDS INFORMATION 2011 2010 2009 2008 2007 2006 $ 345,164,271 282,782,431 183,808,580 158,724,010 $ 332,481,933 279,250,547 181,512,856 155,918,241 $ 329,723,191 267,471,299 173,856,344 149,562,613 $ 328,505,433 254,722,174 165,569,413 141,672,630 $ 323,957,945 238,190,720 154,823,968 136,008,512 $ 326,844,982 215,666,940 140,183,511 118,607,527 108,440 136,887,805 101,511 70,795,686 95,929 61,530,735 91,945 59,486,239 55,932 52,329,617 53,283 34,611,607 8,168,640 11,679,229 17,482,143 29,252,347 32,671,539 21,435,792 $1,115,644,177 $1,031,740,003 $ 999,722,254 $ 979,300,181 $ 938,038,233 $ 857,403,642 $ 992,478,380 44,115,872 3,143,922 $1,039,738,174 $ 75,906,003 $ 814,964,303 $ 890,870,306 $ 971,356,805 42,535,601 3,031,686 $1,016,924,092 $ 14,815,911 $ 800,148,392 $ 814,964,303 $ 885,132,865 40,364,063 2,916,259 $ 928,413,187 $ 71,309,067 $ 728,839,325 $ 800,148,392 $ 833,509,538 36,747,710 3,000,536 $ 873,257,784 $ 106,042,397 $ 622,796,928 $ 728,839,325 $ 742,293,147 33,407,937 2,526,189 $ 778,227,273 $ 159,810,960 $ 462,985,968 $ 622,796,928 $ 687,086,291 31,975,150 2,513,102 $ 721,574,543 $ 135,829,099 $ 327,156,869 $ 462,985,968 Statistical Section 161 . FINANCIAL TRENDS INFORMATION Revenues, Expenses, and Changes in Net Position TRS - ACTIVECARE For the Fiscal Years Ended August 31 Expenses Health Care Claims Health Care Claims Processing and Other Premium Payments to HMOs Administrative Expenses TOTAL EXPENSES Net Increase (Decrease) Net Position - Beginning of Year Net Position - End of Year* 2015 2014 2013 2012 $ 1,943,949,265 236,749 1,537,408 $ 1,928,895,465 139,608 940,022 $ 1,808,521,683 137,630 746,936 $ 1,749,905,117 136,324 1,697,553 29,706 $ 1,945,723,422 79,792 $ 1,930,054,887 75,664 $ 1,809,481,913 72,094 $ 1,751,840,794 $ 1,565,255,957 135,073,416 178,192,468 2,225,417 $ 1,880,747,258 $ 64,976,164 $ 22,839,112 $ 87,815,276 Revenues Health Care Premiums Administrative Fees and Other Investment Income Federal Revenue ARRA-COBRA Reimbursements Fringe Benefits Paid by State's General Fund on Behalf of TRS Employees TOTAL REVENUES $ 1,521,834,989 109,925,954 154,913,859 2,569,850 $ 1,789,244,652 $ 140,810,235 $ (117,971,123) $ 22,839,112 * $ 1,785,069,768 84,903,101 100,905,702 2,351,802 $ 1,973,230,373 $ (163,748,460) $ 45,777,337 $ (117,971,123) $ 1,718,903,645 83,346,223 89,706,406 2,176,610 $ 1,894,132,884 $ (142,292,090) $ 188,069,427 $ 45,777,337 * For FY 2014 and fiscal years prior to FY 2013, Net Position balances were all restricted. In FY 2013 the unrestricted balance is $(117,971,123) and restricted is zero. Millions TRS-ActiveCare Net Position Last Ten Years $600 $500 $400 $300 $200 $100 $0 ($100) ($200) 2006 2007 2008 2009 2010 2011 2012 2013 2014 2015 Statistical Section 162 . FINANCIAL TRENDS INFORMATION 2011 2010 2009 2008 2007 2006 $ 1,549,530,891 135,917 3,387,062 667,746 $ 1,329,171,411 125,321 6,421,269 1,225,158 $ 1,172,011,048 187,813 11,597,992 170,219 $ 1,096,537,022 186,844 21,164,640 $ 939,694,028 184,937 26,016,380 $ 861,464,205 183,470 18,650,516 67,373 $ 1,553,788,989 64,328 $ 1,337,007,487 64,975 $ 1,184,032,047 61,894 $ 1,117,950,400 46,446 $ 965,941,791 40,979 $ 880,339,170 $ 1,510,090,981 76,960,951 76,270,706 2,207,051 $ 1,665,529,689 $ (111,740,700) $ 299,810,127 $ 188,069,427 $ 1,313,114,197 67,906,654 64,532,253 1,883,148 $ 1,447,436,252 $ (110,428,765) $ 410,238,892 $ 299,810,127 $ 1,122,646,958 60,934,432 64,820,440 1,861,949 $ 1,250,263,779 $ (66,231,732) $ 476,470,624 $ 410,238,892 $ 952,156,339 54,583,499 68,204,743 1,830,258 $ 1,076,774,839 $ 41,175,561 $ 435,295,063 $ 476,470,624 $ 801,148,962 48,177,777 58,742,363 1,775,831 $ 909,844,933 $ 56,096,858 $ 379,198,205 $ 435,295,063 $ 708,972,484 53,013,214 49,466,150 1,680,952 $ 813,132,800 $ 67,206,370 $ 311,991,835 $ 379,198,205 Statistical Section 163 . FINANCIAL TRENDS INFORMATION Revenues, Expenses, and Changes in Net Position 403(b) ADMINISTRATIVE PROGRAM For the Fiscal Years Ended August 31 Expenses Administrative Expenses TOTAL EXPENSES Net Increase (Decrease) Net Position - Beginning of Year Net Position - End of Year Thousands $450 2014 2013 2012 $ 27,000 21,000 1,360 $ 15,000 15,000 1,324 $ 60,000 81,000 1,333 $ 114,000 63,000 707 $ 49,360 3,131 $ 34,455 2,890 $ 145,223 2,772 $ 180,479 $ 78,446 $ 78,446 $ (29,086) $ 328,156 $ 299,070 Revenues Certification Fees Product Registration Fees Investment Income Fringe Benefits Paid by State's General Fund on Behalf of TRS Employees TOTAL REVENUES 2015 $ 62,636 $ 62,636 $ (28,181) $ 356,337 $ 328,156 $ 40,194 $ 40,194 $ 105,029 $ 251,308 $ 356,337 $ $ $ $ $ 403(b) Administrative Program Net Position Last Ten Years $400 $350 $300 $250 $200 $150 $100 2006 2007 2008 2009 2010 2011 2012 2013 2014 2015 Statistical Section 164 51,203 51,203 129,276 122,032 251,308 . FINANCIAL TRENDS INFORMATION 2011 $ 12,000 3,000 1,801 $ 7,898 24,699 $ $ $ $ $ 148,444 148,444 (123,745) 245,777 122,032 2010 $ $ 30,000 21,000 4,318 8,034 63,352 $ 172,835 $ 172,835 $ (109,483) $ 355,260 $ 245,777 2009 $ $ 6,000 9,000 8,558 23,558 $ 88,000 $ 88,000 $ (64,442) $ 419,702 $ 355,260 2008 2007 2006 30,000 180,000 19,337 $ 171,000 $ 30,000 12,070 9,532 $ 229,337 $ 183,070 $ 39,532 $ $ $ $ $ $ 24,000 $ 24,000 $ 159,070 $ 223,295 $ 382,365 $ $ $ $ $ $ 192,000 192,000 37,337 382,365 419,702 Statistical Section 165 24,000 24,000 15,532 207,763 223,295 . FINANCIAL TRENDS INFORMATION Benefit and Refund Deductions from Net Position by Type PENSION TRUST FUND Last Ten Fiscal Years 2015 Type of Benefit Service Retirements** Deferred Retirement Option Partial Lump Sum Option Disability Retirements Death and Survivor Benefits: Annual Salary Survivor Annuities Life Annuities 60 Monthly Payments Remainder of Contributions TOTAL BENEFITS Type of Refund Death Separation TOTAL REFUNDS 2014 2013 2012 $ 8,215,765,876 $ 7,795,690,586 $ 7,251,369,740 $ 6,808,592,209 9,643,121 14,974,505 17,223,523 22,361,937 288,923,266 322,033,388 410,323,790 501,152,157 169,318,064 164,299,506 156,308,471 150,238,202 39,574,595 44,846,010 41,219,707 46,859,444 100,150,048 97,822,817 94,563,001 92,126,049 90,563,081 89,547,742 87,044,328 85,816,402 14,443,193 13,415,885 12,659,471 11,816,313 6,730,215 6,012,086 4,496,453 4,659,453 $ 8,935,111,459 $ 8,548,642,525 $ 8,075,208,484 $ 7,723,622,166 $ $ 5,474,475 $ 385,866,706 391,341,181 $ 5,455,829 $ 405,144,490 410,600,319 $ 4,705,228 $ 386,587,184 391,292,412 $ 5,294,006 375,937,346 381,231,352 * A one-time supplemental payment that is capped at $2,400 was distributed to eligible retirees in January 2008. ** For fiscal years 2010 and prior, Service Retirements changed due to the reclassification of Transfers of Service Contributions with Employees Retirement System of Texas. Benefit Deductions from Net Position by Type TRS-CARE Last Ten Fiscal Years 2015 Type of Claim Medical Claims and Insurance Premiums Prescription drugs*** TOTAL 2014 2013 2012 $ 805,668,819 $ 691,283,731 $ 687,469,016 $ 687,987,585 649,457,501 539,842,962 496,229,923 454,143,825 $ 1,455,126,320 $ 1,231,126,693 $ 1,183,698,939 $ 1,142,131,410 *** Note: For TRS-CARE, 2013 and 2014 Prescription claims numbers have been revised to reflect claims net of rebates. These two years were reported gross of rebates in 2013 and 2014. Benefit Deductions from Net Position by Type TRS-ACTIVECARE Last Ten Fiscal Years 2015 Type of Claim Medical Claims and Insurance Premiums Prescription drugs TOTAL 2014 2013 2012 $ 1,479,302,696 $ 1,397,249,236 $ 1,613,167,792 $ 1,450,574,875 264,145,729 279,499,612 272,807,678 268,328,770 $ 1,743,448,425 $ 1,676,748,848 $ 1,885,975,470 $ 1,718,903,645 Statistical Section 166 . FINANCIAL TRENDS INFORMATION 2011 2010 2009 2008 2007 2006 $ 6,241,946,655 $ 5,841,963,927 $ 5,565,925,090 $ 5,649,308,335 * $ 5,064,191,508 $ 4,857,348,525 27,822,115 22,607,290 23,272,668 26,757,772 31,939,855 36,033,028 524,925,790 385,555,126 348,261,100 363,668,944 325,688,244 313,359,714 144,865,109 141,396,837 138,569,650 146,907,654 134,866,736 132,155,505 47,295,194 45,698,147 43,235,232 42,216,290 86,898,720 82,574,358 79,951,723 78,862,569 84,893,007 83,238,898 81,764,240 85,576,098 11,564,275 10,824,948 10,180,012 10,169,530 3,293,923 3,537,843 3,274,400 3,177,348 $ 7,173,504,788 $ 6,617,397,374 $ 6,294,434,115 $ 6,406,644,540 38,928,295 37,880,818 76,116,829 74,115,776 78,322,931 77,537,970 9,386,943 8,581,053 3,443,703 3,121,883 $ 5,762,885,044 $ 5,540,134,272 $ $ $ 3,984,340 $ 330,284,482 334,268,822 $ 2011 $ $ 608,461,321 $ 384,017,059 992,478,380 $ 2011 3,710,941 $ 261,475,648 265,186,589 $ 2010 575,539,788 $ 395,817,017 971,356,805 $ 2010 3,084,718 $ 263,610,358 266,695,076 $ 2009 531,239,020 $ 353,893,845 885,132,865 $ 2009 $ 1,242,673,156 $ 1,092,107,916 $ 934,733,927 $ 267,417,825 221,006,281 187,913,031 $ 1,510,090,981 $ 1,313,114,197 $ 1,122,646,958 $ 2,520,283 275,482,331 278,002,614 $ 2008 498,767,038 334,742,500 833,509,538 2007 $ $ 2008 788,240,087 163,916,252 952,156,339 Statistical Section 167 2,073,365 $ 277,932,219 280,005,584 $ 437,519,746 $ 304,773,401 742,293,147 $ 2007 $ $ 659,478,760 $ 141,670,202 801,148,962 $ 2,322,538 265,487,479 267,810,017 2006 427,553,404 259,532,887 687,086,291 2006 587,513,767 121,458,717 708,972,484 . OPERATING INFORMATION Average Benefit Payments PENSION TRUST FUND Last Ten Fiscal Years Retirement Effective Dates Years Credited Service 16-20 21-25 5-10 11-15 26-30 30+ 9-1-05 to 8-31-06 Average Monthly Benefit * Average Final Average Salary Number of Retirees $ 280 $ 25,456 1,494 $ 582 $ 30,647 1,129 $ 1,097 $ 36,767 1,578 $ 1,635 $ 42,297 2,483 $ 2,342 $ 49,650 3,332 $ 3,315 $ 58,987 2,700 9-1-06 to 8-31-07 Average Monthly Benefit * Average Final Average Salary Number of Retirees $ 310 $ 27,435 1,574 $ 601 $ 31,601 1,183 $ 1,122 $ 37,444 1,554 $ 1,699 $ 44,116 2,625 $ 2,427 $ 51,682 3,289 $ 3,459 $ 61,113 2,834 9-1-07 to 8-31-08 Average Monthly Benefit * Average Final Average Salary Number of Retirees $ 314 $ 27,892 1,532 $ 621 $ 32,391 1,281 $ 1,152 $ 38,421 1,902 $ 1,759 $ 45,582 2,941 $ 2,537 $ 53,616 3,754 $ 3,512 $ 61,848 3,332 9-1-08 to 8-31-09 Average Monthly Benefit * Average Final Average Salary Number of Retirees $ 351 $ 29,747 1,462 $ 658 $ 33,093 1,377 $ 1,219 $ 40,367 1,918 $ 1,773 $ 45,660 2,877 $ 2,613 $ 54,751 3,361 $ 3,633 $ 63,079 3,229 9-1-09 to 8-31-10 Average Monthly Benefit * Average Final Average Salary Number of Retirees $ 363 $ 30,278 1,675 $ 670 $ 34,347 1,604 $ 1,226 $ 40,452 2,236 $ 1,839 $ 47,301 3,517 $ 2,638 $ 55,172 3,825 $ 3,733 $ 64,234 4,187 9-1-10 to 8-31-11 Average Monthly Benefit * Average Final Average Salary Number of Retirees $ 389 $ 32,133 2,092 $ 710 $ 35,566 2,046 $ 1,266 $ 42,127 2,875 $ 1,869 $ 48,185 4,544 $ 2,666 $ 55,189 4,984 $ 3,769 $ 64,945 6,394 9-1-11 to 8-31-12 Average Monthly Benefit * Average Final Average Salary Number of Retirees $ 390 $ 32,190 2,139 $ 726 $ 36,522 2,226 $ 1,305 $ 43,176 2,855 $ 1,922 $ 49,383 4,257 $ 2,781 $ 56,754 4,373 $ 3,857 $ 66,333 5,209 9-1-12 to 8-31-13 Average Monthly Benefit * Average Final Average Salary Number of Retirees $ 389 $ 31,597 2,235 $ 742 $ 37,082 2,383 $ 1,288 $ 43,047 3,068 $ 1,935 $ 49,217 4,388 $ 2,796 $ 56,455 4,676 $ 3,859 $ 65,472 4,952 9-1-13 to 8-31-14 Average Monthly Benefit * Average Final Average Salary Number of Retirees $ 412 $ 32,884 2,293 $ 799 $ 39,265 2,285 $ 1,325 $ 43,889 3,084 $ 1,962 $ 49,224 4,254 $ 2,844 $ 56,835 4,429 $ 3,868 $ 65,447 4,197 9-1-14 to 8-31-15 Average Monthly Benefit * Average Final Average Salary Number of Retirees $ 418 $ 33,259 1,987 $ 821 $ 39,904 1,966 $ 1,340 $ 44,343 2,717 $ 1,991 $ 49,127 3,654 $ 2,827 $ 56,370 3,899 $ 3,930 $ 65,835 3,885 * Average monthly benefits have been reduced for Partial Lump Sum Option payments of $313.4, $325.7, $363.7, $348.3, $385.6, $524.9, $501.2, $410.3, $322.0 and $288.9 million in fiscal years 2006, 2007, 2008, 2009, 2010, 2011, 2012, 2013, 2014 and 2015 respectively. Statistical Section 168 . Average Monthly Benefits Pension Trust Fund The following graph of service retiree accounts as of August 31, 2015 reflects benefit increases and decreases since retirement: Current Average Monthly Benefit by Year of Retirement $2,500 $2,150 $2,168 $2,058 $2,000 $1,868 $1,922 $1,886 $1,845 $1,500 $1,000 $500 $0 1985 Original Benefits Increase(Decrease) Since Retirement Current Benefits Number of Retirees** 1990 1995 2000* 2005* 2010* 2015* $947 $1,234 $1,327 $1,646 $1,839 $2,147 $2,169 975 824 541 240 6 3 $1,922 $2,058 $1,868 $1,886 $1,845 $2,150 $2,168 1,710 3,819 5,718 10,602 10,704 16,512 18,319 (1) * Before adjustment for the Partial Lump Sum Option, average original benefits were $1,781, $2,010, $2,323 and $2,278 for fiscal years 2000, 2005, 2010 and 2015 respectively. ** For each of the retirement years shown, number of service retirees currently receiving benefits. Statistical Section 169 . This page is intentionally left blank. Statistical Section 170 . OPERATING INFORMATION Average Benefit Payments Average Benefit Payments TRS-CARE TRS-ACTIVECARE Last Ten Fiscal Years Last Ten Fiscal Years 2015 2015 Average Benefit Per Participant $ 5,780 Benefit Payments $ 1,455,126,320 Average Participants Average Benefit Per Participant 251,758 $ 3,607 Benefit Payments $ 1,743,448,426 Average Participants 2014 483,299 2014 Average Benefit Per Participant $ 5,059 * Average Benefit Per Participant $ 3,603 Benefit Payments $ 1,231,126,693 * Benefit Payments $ 1,676,748,847 Average Participants 243,336 Average Participants 2013 465,330 2013 Average Benefit Per Participant $ 5,053 * Average Benefit Per Participant $ 3,966 Benefit Payments $ 1,183,698,939 * Benefit Payments $ 1,885,975,470 Average Participants 234,277 2012 475,508 2012 Average Benefit Per Participant $ 5,115 Benefit Payments $ 1,142,131,410 Average Participants 223,287 2011 Average Benefit Per Participant $ 3,868 Benefit Payments $ 1,718,903,645 Average Participants 444,382 2011 Average Benefit Per Participant $ 4,718 Benefit Payments Average Participants $ 992,478,380 210,353 Average Benefit Per Participant $ 4,790 Benefit Payments $ 971,356,805 2010 Average Benefit Per Participant $ 3,662 Benefit Payments Average Participants $ 1,510,090,981 412,385 2010 Average Participants 202,778 2009 Average Benefit Per Participant $ 3,509 Benefit Payments $ 1,313,114,197 Average Participants 374,201 2009 Average Benefit Per Participant $ 4,464 Benefit Payments $ 885,132,865 Average Participants 198,282 2008 Average Benefit Per Participant $ 3,324 Benefit Payments $ 1,122,646,958 Average Participants 337,781 2008 Average Benefit Per Participant $ 4,302 Benefit Payments $ 833,509,538 Average Participants 193,733 2007 Average Benefit Per Participant $ 3,060 Benefit Payments $ 952,156,339 Average Participants 311,200 2007 Average Benefit Per Participant $ 3,891 Benefit Payments $ 742,293,147 Average Participants 190,748 2006 Average Benefit Per Participant $ 2,835 Benefit Payments $ 801,148,962 Average Participants 282,639 2006 Average Benefit Per Participant $ 3,659 Benefit Payments $ 687,086,291 Average Participants Average Participants 187,804 Average Benefit Per Participant $ 2,745 Benefit Payments $ 708,972,484 Average Participants *Note: For TRS-CARE, 2013 and 2014 Average Benefit Per Participant and Benefit Payments numbers have been revised to reflect prescription drug claims net of rebates. These two years were reported as gross numbers in previous years. Statistical Section 171 258,301 . OPERATING INFORMATION Retired Members by Type of Benefit PENSION TRUST FUND Fiscal Year 2015 $ $ $ $ $ $ $ $ $ $ $ $ $ $ Amount of Number of Monthly Retired Benefit Members 1-200 14,378 201-400 38,725 401-600 24,676 601-800 22,303 801-1,000 21,441 1,001-1,200 19,050 1,201-1,400 16,200 1,401-1,600 16,782 1,601-1,800 17,110 1,801-2,000 17,904 2,001-3,000 90,098 3,001-4,000 51,778 4,001-5,000 17,965 over 5,000 9,328 Totals 377,738 Type of Retirement* 1 5,603 10,481 11,817 13,096 14,218 13,632 11,601 12,019 12,655 14,102 77,544 47,942 16,836 8,765 270,311 2 6,913 12,185 8,810 5,455 3,815 2,667 2,107 2,419 2,431 2,069 6,342 1,342 301 111 56,967 *Type of Retirement: 1 Normal Retirement of Age and Service 2 Early Retirement 3 Disability Retirement 4 Survivor Payment, Joint Life or Guarantee 3 289 654 1,327 1,312 1,149 859 728 649 559 495 1,284 181 25 4 9,515 4 1,477 2,302 2,182 1,800 1,671 1,430 1,401 1,341 1,155 968 3,989 1,908 684 376 22,684 6 47 1,000 327 394 402 318 245 277 232 222 859 393 114 71 4,901 35 966 213 246 186 144 118 77 78 48 80 12 5 1 2,209 5 Survivor Payment, Death in Service 6 Survivor Payment, After Disability Retirement 7 Survivor Payment, After Service Retirement Health Benefit Payments by Range TRS-CARE Fiscal Year 2015 Benefit Range $ $ $ $ $ $ $ $ $ 5 0 1 - 5,000 5,001 - 10,000 10,001 - 20,000 20,001 - 30,000 30,001 - 40,000 40,001 - 50,000 50,001 - 100,000 over 100,000 Average Participants 17,601 171,060 34,218 16,192 4,220 2,281 1,461 2,900 1,825 Total 251,758 Statistical Section 172 7 14 11,137 11,151 . OPERATING INFORMATION Option Selected** 1 6,320 11,816 11,399 9,948 9,694 8,041 6,344 6,398 6,518 6,666 32,213 18,993 6,782 3,208 144,340 2 5,013 8,351 7,413 6,709 6,238 5,898 5,424 5,785 5,918 6,272 33,211 18,451 6,081 3,478 124,242 3 1,345 2,619 2,973 3,196 3,238 3,157 2,898 2,953 3,060 3,333 16,769 10,162 3,858 2,087 61,648 4 547 1,200 1,150 1,082 1,057 889 690 734 684 647 3,079 1,658 511 215 14,143 5 1,111 2,039 1,741 1,368 1,214 1,065 844 912 930 986 4,826 2,514 733 340 20,623 **Option Selected: Option 1 - Life Annuity Option 2 - Joint to Survivor Option 3 - Joint to Survivor 50% / Joint to Survivor 75% 6 42 12,700 0 0 0 0 0 0 0 0 0 0 0 0 12,742 Option 4 - 5-year Guarantee Option 5 - 10-year Guarantee Option 6 - Survivor Benefit Health Benefit Payments by Range TRS-ACTIVECARE Fiscal Year 2015 Benefit Range $ $ $ $ $ $ $ $ $ 0 1 - 5,000 5,001 - 10,000 10,001 - 20,000 20,001 - 30,000 30,001 - 40,000 40,001 - 50,000 50,001 - 100,000 over 100,000 Average Participants 58,334 369,196 25,974 15,534 4,899 2,590 1,675 3,140 1,957 Total 483,299 Statistical Section 173 . OPERATING INFORMATION Principal Participating Employers PENSION TRUST FUND Current Fiscal Year and Nine Years Ago 2015 Participating Reporting Entity 2006 Percentage of Total Covered Covered Employees Rank Employment Houston ISD Dallas ISD UT MD Anderson Cancer Center Cypress Fairbanks ISD Northside ISD Austin ISD Fort Worth ISD UT SW Medical Center-Dallas UT At Austin El Paso ISD UT Medical Branch at Galveston All Other 23,811 19,856 18,347 14,272 13,594 12,270 11,354 10,496 9,946 9,689 704,450 Total 848,085 1 2 3 4 5 6 7 8 9 10 2.81 % 2.34 2.16 1.68 1.60 1.45 1.34 1.24 1.17 1.14 Percentage of Total Covered Covered Employees Rank Employment 24,006 19,035 13,811 11,033 10,332 11,125 9,954 1 2 3 5 6 4 8 9 10 7 83.07 9,303 8,776 10,110 602,692 100.00 % 730,177 3.29 % 2.61 1.89 1.51 1.42 1.52 1.36 1.27 1.20 1.39 82.54 100.00 % Source: May report month information submitted to the Teacher Retirement System by participating reporting entities. Statistical Section 174 . OPERATING INFORMATION Principal Participating Employers TRS-CARE Current Fiscal Year and Nine Years Ago 2015 Participating Reporting Entity Houston ISD Dallas ISD Cypress Fairbanks ISD Northside ISD Austin ISD Fort Worth ISD Aldine ISD North East ISD Katy ISD Fort Bend ISD El Paso ISD San Antonio ISD All Other Total 2006 Percentage of Covered Total Covered OPEB OPEB Employees Rank Employment Percentage of Covered Total Covered OPEB OPEB Employees Rank Employment 23,811 19,856 14,272 13,594 12,270 11,354 9,264 9,248 9,166 8,589 1 2 3 4 5 6 7 8 9 10 3.41 % 2.84 2.04 1.95 1.76 1.62 1.33 1.32 1.31 1.23 24,006 19,035 11,033 10,332 11,125 9,954 8,014 7,939 1 2 4 5 3 6 8 10 7 9 567,323 81.19 % 8,776 7,968 492,224 698,747 100.00 % 610,406 3.93 % 3.12 1.81 1.69 1.82 1.63 1.31 1.30 1.44 1.31 80.64 100.00 % Source: May report month information submitted to the Teacher Retirement System by participating reporting entities. Statistical Section 175 . List of Participating Employers PUBLIC SCHOOLS Abbott ISD Abernathy ISD Abilene ISD Academy ISD Adrian ISD Agua Dulce ISD Alamo Heights ISD Alba Golden ISD Albany ISD Aldine ISD Aledo ISD Alice ISD Alief ISD Allen ISD Alpine ISD Alto ISD Alvarado ISD Alvin ISD Alvord ISD Amarillo ISD Amherst ISD Anahuac ISD Anderson-Shiro Cons ISD Andrews ISD Angleton ISD Anna ISD Anson ISD Anthony ISD Anton ISD Apple Springs ISD Aquilla ISD Aransas County ISD Aransas Pass ISD Archer City ISD Argyle ISD Arlington ISD Arp ISD Aspermont ISD Athens ISD Atlanta ISD Aubrey ISD Austin ISD Austwell Tivoli ISD Avalon ISD Avery ISD Avinger ISD Axtell ISD Azle ISD Baird ISD Ballinger ISD Balmorhea ISD Bandera ISD Bangs ISD Banquete ISD Barbers Hill ISD Bartlett ISD Bastrop ISD Bay City ISD Beaumont ISD Beckville ISD Beeville ISD Bellevue ISD Bells ISD Bellville ISD Belton ISD Ben Bolt Palito ISD Benavides ISD Benjamin ISD Big Sandy ISD - Big Sandy Big Sandy ISD - Dallardsville Big Spring ISD Birdville ISD Bishop Cons ISD Blackwell ISD Blanco ISD Bland ISD Blanket ISD Bloomburg ISD Blooming Grove ISD Bloomington ISD Blue Ridge ISD Bluff Dale ISD Blum ISD Boerne ISD Statistical Section 176 Boles ISD Boling ISD Bonham ISD Booker ISD Borden County ISD Borger ISD Bosqueville ISD Bovina ISD Bowie ISD Boyd ISD Boys Ranch ISD Brackett ISD Brady ISD Brazos ISD Brazosport ISD Breckenridge ISD Bremond ISD Brenham ISD Bridge City ISD Bridgeport ISD Broaddus ISD Brock ISD Bronte ISD Brookeland ISD Brookesmith ISD Brooks County ISD Brownfield ISD Brownsboro ISD Brownsville ISD Brownwood ISD Bruceville-Eddy ISD Bryan ISD Bryson ISD Buckholts ISD Buena Vista ISD Buffalo ISD Bullard ISD Buna ISD Burkburnett ISD Burkeville ISD Burleson ISD Burnet Cons ISD Burton ISD . List of Participating Employers (Continued) Bushland ISD Bynum Cons ISD Caddo Mills ISD Calallen ISD Caldwell ISD Calhoun County ISD Callisburg ISD Calvert ISD Cameron ISD Campbell ISD Canadian ISD Canton ISD Canutillo ISD Canyon ISD Carlisle ISD Carrizo Springs Cons ISD Carroll ISD Carrollton-Farmers Branch ISD Carthage ISD Castleberry ISD Cayuga ISD Cedar Hill ISD Celeste ISD Celina ISD Center ISD Center Point ISD Centerville ISD - Centerville Centerville ISD - Groveton Central Heights ISD Central ISD Channelview ISD Channing ISD Chapel Hill ISD - Mt. Pleasant Chapel Hill ISD - Tyler Charlotte ISD Cherokee ISD Chester ISD Chico ISD Childress ISD Chillicothe ISD Chilton ISD China Spring ISD Chireno ISD Chisum ISD Christoval ISD Cisco ISD City View ISD Clarendon Cons ISD Clarksville ISD Claude ISD Clear Creek ISD Cleburne ISD Cleveland ISD Clifton ISD Clint ISD Clyde ISD Coahoma ISD Coldspring Oakhurst ISD Coleman ISD College Station ISD Collinsville ISD Colmesneil ISD Colorado ISD Columbia Brazoria ISD Columbus ISD Comal ISD Comanche ISD Comfort ISD Commerce ISD Community ISD Como-Pickton Cons ISD Comstock ISD Connally Cons ISD Conroe ISD Coolidge ISD Cooper ISD Coppell ISD Copperas Cove ISD Corpus Christi ISD Corrigan-Camden ISD Corsicana ISD Cotton Center ISD Cotulla ISD Coupland ISD Covington ISD Crandall ISD Statistical Section 177 Crane ISD Cranfills Gap ISD Crawford ISD Crockett County Cons CSD Crockett ISD Crosby ISD Crosbyton Cons ISD Cross Plains ISD Cross Roads ISD Crowell Cons ISD Crowley ISD Crystal City ISD Cuero ISD Culberson Cty - Allamoore ISD Cumby ISD Cushing ISD Cypress-Fairbanks ISD D'Hanis ISD Daingerfield-Lone Star ISD Dalhart ISD Dallas ISD Damon ISD Danbury ISD Darrouzett ISD Dawson ISD - Dawson Dawson ISD - Welch Dayton ISD DeKalb ISD DeLeon ISD DeSota ISD Decatur ISD Deer Park ISD Del Valle ISD Dell City ISD Denison ISD Denton ISD Denver City ISD Detroit ISD Devers ISD Devine ISD Dew ISD Deweyville ISD Diboll ISD . List of Participating Employers (Continued) Dickinson ISD Dilley ISD Dime Box ISD Dimmitt ISD Divide ISD Dodd City ISD Donna ISD Doss Cons ISD Douglass ISD Dripping Springs ISD Driscoll ISD Dublin ISD Dumas ISD Duncanville ISD Eagle Mount Saginaw ISD Eagle Pass ISD Eanes ISD Early ISD East Bernard ISD East Central ISD East Chambers ISD Eastland ISD Ector ISD Ector County ISD Edcouch-Elsa ISD Eden Cons ISD Edgewood ISD - Edgewood Edgewood ISD - San Antonio Edinburg Cons ISD Edna ISD El Campo ISD El Paso ISD Electra ISD Elgin ISD Elkhart ISD Elysian Fields ISD Ennis ISD Era ISD Etoile ISD Eula ISD Eustace ISD Evadale ISD Evant ISD Everman ISD Excelsior ISD Ezzell ISD Fabens ISD Fairfield ISD Falls City ISD Fannindel ISD Farmersville ISD Farwell ISD Fayetteville ISD Ferris ISD Flatonia ISD Florence ISD Floresville ISD Flour Bluff ISD Floydada ISD Follett ISD Forestburg ISD Forney ISD Forsan ISD Fort Bend ISD Fort Davis ISD Fort Elliott Cons ISD Fort Hancock ISD Fort Sam Houston ISD Fort Stockton ISD Fort Worth ISD Franklin ISD Frankston ISD Fredericksburg ISD Freer ISD Frenship ISD Friendswood ISD Friona ISD Frisco ISD Frost ISD Fruitvale ISD Gainesville ISD Galena Park ISD Galveston ISD Ganado ISD Garland ISD Garner ISD Statistical Section 178 Garrison ISD Gary ISD Gatesville ISD Gause ISD George West ISD Georgetown ISD Gholson ISD Giddings ISD Gilmer ISD Gladewater County Line ISD Glasscock County ISD Glen Rose ISD Godley ISD Goldburg ISD Goldthwaite Cons ISD Goliad ISD Gonzales ISD Goodrich ISD Goose Creek Cons ISD Gordon ISD Gorman ISD Grady ISD Graford ISD Graham ISD Granbury ISD Grand Prairie ISD Grand Saline ISD Grandfalls Royalty ISD Grandview Hopkins ISD Grandview ISD Granger ISD Grape Creek ISD Grapeland ISD Grapevine-Colleyville ISD Greenville ISD Greenwood ISD Gregory-Portland ISD Groesbeck ISD Groom ISD Groveton ISD Gruver ISD Gunter ISD Gustine ISD . List of Participating Employers (Continued) Guthrie CSD Hale Center ISD Hallettsville ISD Hallsburg ISD Hallsville ISD Hamilton ISD Hamlin ISD Hamshire-Fannett ISD Happy ISD Hardin ISD Hardin-Jefferson ISD Harlandale ISD Harleton ISD Harlingen Cons ISD Harmony ISD Harper ISD Harrold ISD Hart ISD Hartley ISD Harts Bluff ISD Haskell Cons ISD Hawkins ISD Hawley ISD Hays Cons ISD Hearne ISD Hedley ISD Hemphill ISD Hempstead ISD Henderson ISD Henrietta ISD Hereferd ISD Hermleigh ISD Hico ISD Hidalgo ISD Higgins ISD High Island ISD Highland ISD Highland Park ISD - Amarillo Highland Park ISD - Dallas Hillsboro ISD Hitchcock ISD Holland ISD Holliday ISD Hondo ISD Honey Grove ISD Hooks ISD Houston ISD Howe ISD Hubbard ISD - Hubbard Hubbard ISD - DeKalb Huckabay ISD Hudson ISD Huffman ISD Hughes Springs ISD Hull-Daisetta ISD Humble ISD Hunt ISD Huntington ISD Huntsville ISD Hurst-Euless-Bedford ISD Hutto ISD Idalou ISD Industrial ISD Ingleside ISD Ingram ISD Iola ISD Iowa Park Cons ISD Ira ISD Iraan-Sheffield ISD Iredell ISD Irion County ISD Irving ISD Italy ISD Itasca ISD Jacksboro ISD Jacksonville ISD Jarrell ISD Jasper ISD Jayton-Girard ISD Jefferson ISD Jim Hogg County ISD Jim Ned Cons ISD Joaquin ISD Johnson City ISD Jonesboro ISD Joshua ISD Statistical Section 179 Jourdanton ISD Judson ISD Junction ISD Karnack ISD Karnes City ISD Katy ISD Kaufman ISD Keene ISD Keller ISD Kelton ISD Kemp ISD Kenedy County-Wide CSD Kenedy ISD Kennard ISD Kennedale ISD Kerens ISD Kermit ISD Kerrville ISD Kilgore ISD Killeen ISD Kingsville ISD Kirbyville Cons ISD Klein ISD Klondike ISD Knippa ISD Knox City-O'Brien Cons ISD Kopperl ISD Kountze ISD Kress ISD Krum ISD La Feria ISD La Gloria ISD La Grange ISD La Joya ISD La Marque ISD La Porte ISD La Poynor ISD La Pryor ISD La Vega ISD La Vernia ISD La Villa ISD Lackland ISD Lago Vista ISD . List of Participating Employers (Continued) Lake Dallas ISD Lake Travis ISD Lake Worth ISD Lamar Cons ISD Lamesa ISD Lampasas ISD Lancaster ISD Laneville ISD Laredo ISD Lasara ISD Latexo ISD Lazbuddie ISD Leakey ISD Leander ISD Leary ISD Lefors ISD Leggett ISD Leon ISD Leonard ISD Levelland ISD Leverett's Chapel ISD Lewisville ISD Lexington ISD Liberty-Eylau ISD Liberty Hill ISD Liberty ISD Lindale ISD Linden-Kildare Cons ISD Lindsay ISD Lingleville ISD Lipan ISD Little Cypress-Mauriceville Cons ISD Little Elm ISD Littlefield ISD Livingston ISD Llano ISD Lockhart ISD Lockney ISD Lohn ISD Lometa ISD London ISD Lone Oak ISD Longview ISD Loop ISD Loraine ISD Lorena ISD Lorenzo Cons ISD Los Fresnos Cons ISD Louise ISD Lovejoy ISD Lovelady ISD Lubbock-Cooper ISD Lubbock ISD Lueders-Avoca ISD Lufkin ISD Luling ISD Lumberton ISD Lyford Cons ISD Lytle ISD Mabank ISD Madisonville Cons ISD Magnolia ISD Malakoff ISD Malone ISD Malta ISD Manor ISD Mansfield ISD Marathon ISD Marble Falls ISD Marfa ISD Marion ISD Marlin ISD Marshall ISD Mart ISD Martin's Mill ISD Martinsville ISD Mason ISD Matagorda ISD Mathis ISD Maud ISD May ISD Maypearl ISD Mcallen ISD Mccamey ISD Mcdade ISD Mcgregor ISD Statistical Section 180 Mckinney ISD Mclean ISD Mcleod ISD Mcmullen County ISD Meadow ISD Medina ISD Medina Valley ISD Melissa ISD Memphis ISD Menard ISD Mercedes ISD Meridian ISD Merkel ISD Mesquite ISD Mexia ISD Meyersville ISD Miami ISD Midland ISD Midlothian ISD Midway ISD - Henrietta Midway ISD - Waco Milano ISD Mildred ISD Miles ISD Milford ISD Miller Grove ISD Millsap ISD Mineola ISD Mineral Wells ISD Mission Cons ISD Monahans-Wickett-Pyote ISD Montaque ISD Monte Alto ISD Montgomery ISD Moody ISD Moran ISD Morgan ISD Morgan Mill ISD Morton ISD Motley County ISD Moulton ISD Mount Calm ISD Mount Enterprise ISD . List of Participating Employers (Continued) Mount Pleasant ISD Mount Vernon ISD Muenster ISD Muleshoe ISD Mullin ISD Mumford ISD Munday Cons ISD Murchison ISD Nacogdoches ISD Natalia ISD Navarro ISD Navasota ISD Nazareth ISD Neches ISD Nederland ISD Needville ISD New Boston ISD New Braunfels ISD New Caney ISD New Deal ISD New Diana ISD New Home ISD New Summerfield ISD New Waverly ISD Newcastle ISD Newton ISD Nixon-Smiley Cons ISD Nocona ISD Nordheim ISD Normangee ISD North East ISD North Hopkins ISD North Lamar ISD North Zulch ISD Northside ISD - San Antonio Northside ISD - Vernon Northwest ISD Nueces Canyon Cons ISD Nursery ISD O'Donnell ISD Oakwood ISD Odem-Edroy ISD Oglesby ISD Olfen ISD Olney ISD Olton ISD Onalaska ISD Orange Grove ISD Orangefield ISD Ore City ISD Overton ISD Paducah ISD Paint Creek ISD Paint Rock ISD Palacios ISD Palestine ISD Palmer ISD Palo Pinto ISD Pampa ISD Panhandle ISD Panther Creek Cons ISD Paradise ISD Paris ISD Pasadena ISD Patton Springs ISD Pawnee ISD Pearland ISD Pearsall ISD Peaster ISD Pecos-Barstow-Toyah ISD Penelope ISD Perrin-Whitt Cons ISD Perryton ISD Petersburg ISD Petrolia ISD Pettus ISD Pewitt Cons ISD Pflugerville ISD Pharr-San Juan-Alamo ISD Pilot Point ISD Pine Tree ISD Pittsburg ISD Plains ISD Plainview ISD Plano ISD Pleasant Grove ISD Statistical Section 181 Pleasanton ISD Plemons-Stinnett-Phillips Cons ISD Point Isabel ISD Ponder ISD Poolville ISD Port Aransas ISD Port Arthur ISD Port Neches-Groves ISD Post ISD Poteet ISD Poth Cons ISD Pottsboro ISD Prairie Lea ISD Prairie Valley ISD Prairiland ISD Premont ISD Presidio ISD Priddy ISD Princeton ISD Pringle-Morse Cons ISD Progreso ISD Prosper ISD Quanah ISD Queen City ISD Quinlan ISD Quitman ISD Rains ISD Ralls ISD Ramirez Common SD Randolph Field ISD Ranger ISD Rankin ISD Raymondville ISD Reagan County ISD Red Lick ISD Red Oak ISD Redwater ISD Refugio ISD Ricardo ISD Rice Cons ISD Rice ISD Richards ISD Richardson ISD . List of Participating Employers (Continued) Richland Springs ISD Riesel ISD Rio Grand City Cons ISD Rio Hondo ISD Rio Vista ISD Rising Star ISD River Road ISD Rivercrest ISD Riviera ISD Robert Lee ISD Robinson ISD Robstown ISD Roby Cons ISD Rochelle ISD Rockdale ISD Rocksprings ISD Rockwall ISD Rogers ISD Roma ISD Roosevelt ISD Ropes ISD Roscoe ISD Rosebud-Lott ISD Rotan ISD Round Rock ISD Round Top-Carmine ISD Roxton ISD Royal ISD Royse City ISD Rule ISD Runge ISD Rusk ISD S&S Cons ISD Sabinal ISD Sabine ISD Sabine Pass ISD Saint Jo ISD Salado ISD Saltillo ISD Sam Rayburn Cons ISD San Angelo ISD San Antonio ISD San Augustine ISD San Benito Cons ISD San Diego ISD San Elizario ISD San Felipe Del Rio Cons ISD San Isidro ISD San Marcos Cons ISD San Perlita ISD San Saba ISD San Vicente ISD Sands Cons ISD Sanford-Fritch ISD Sanger ISD Santa Anna ISD Santa Fe ISD Santa Gertrudis ISD Santa Maria ISD Santa Rosa ISD Santo ISD Savoy ISD Schertz-Cibolo-Univ City ISD Schleicher County ISD Schulenberg ISD Scurry-Rosser ISD Seagraves ISD Sealy ISD Seguin ISD Seminole Public Schools Seymour ISD Shallowater ISD Shamrock ISD Sharyland ISD Shelbyville ISD Sheldon ISD Shepherd ISD Sherman ISD Shiner ISD Sidney ISD Sierra Blanca ISD Silsbee ISD Silverton ISD Simms ISD Sinton ISD Sivells Bend ISD Statistical Section 182 Skidmore-Tynan ISD Slaton ISD Slidell ISD Slocum ISD Smithville ISD Smyer ISD Snook ISD Snyder ISD Socorro ISD Somerset ISD Somerville ISD Sonora ISD South San Antonio ISD South Texas ISD Southland ISD Southside ISD Southwest ISD Spearman ISD Splendora ISD Spring Branch ISD Spring Creek ISD Spring Hill ISD Spring ISD Springlake-Earth ISD Springtown ISD Spur ISD Spurger ISD Stafford Municipal School Dist Stamford ISD Stanton ISD Stephenville ISD Sterling City ISD Stockdale ISD Stratford ISD Strawn ISD Sudan ISD Sulphur Bluff ISD Sulphur Springs ISD Sundown ISD Sunnyvale ISD Sunray ISD Sweeny ISD Sweet Home ISD . List of Participating Employers (Continued) Sweetwater ISD Taft ISD Tahoka ISD Tarkington ISD Tatum ISD Taylor ISD Teague ISD Temple ISD Tenaha ISD Terlingua CSD Terrell County ISD Terrell ISD Texarkana ISD Texas City ISD Texhoma ISD Texline ISD Thorndale ISD Thrall ISD Three Rivers ISD Three Way ISD Throckmorton ISD Tidehaven ISD Timpson ISD Tioga ISD Tolar ISD Tom Bean ISD Tomball ISD Tornillo ISD Trent ISD Trenton ISD Trinidad ISD Trinity ISD Troup ISD Troy ISD Tulia ISD Tuloso-Midway ISD Turkey-Quitaque ISD Tyler ISD Union Grove ISD Union Hill ISD United ISD Utopia ISD Uvalde Cons ISD Valentine ISD Valley Mills ISD Valley View ISD - Pharr Valley View ISD - Valley View Van Alstyne ISD Van ISD Van Vleck ISD Vega ISD Venus ISD Veribest ISD Vernon Cons ISD Victoria ISD Vidor ISD Vysehrad ISD Waco ISD Waelder ISD Walcott ISD Wall ISD Waller ISD Walnut Bend ISD Walnut Springs ISD Warren ISD Waskom ISD Water Valley ISD Waxahachie ISD Weatherford ISD Webb Cons ISD Weimar ISD Wellington ISD Wellman-Union ISD Wells ISD Weslaco ISD West Hardin County Cons ISD West ISD West Orange-Cove Cons ISD West Oso ISD West Rusk County Cons ISD West Sabine ISD Westbrook ISD Westhoff ISD Westphalia ISD Westwood ISD Wharton ISD Statistical Section 183 Wheeler ISD White Deer ISD White Oak ISD White Settlement ISD Whiteface ISD Whitehouse ISD Whitesboro ISD Whitewright ISD Whitharral ISD Whitney ISD Wichita Falls ISD Wildorado ISD Willis ISD Wills Point ISD Wilson ISD Wimberley ISD Windham School District Windthorst ISD Winfield ISD Wink-Loving Cons ISD Winnsboro ISD Winona ISD Winters ISD Woden ISD Wolfe City ISD Woodsboro ISD Woodson ISD Woodville ISD Wortham ISD Wylie ISD - Abilene Wylie ISD - Wylie Yantis ISD Yoakum ISD Yorktown ISD Ysleta ISD Zapata County ISD Zavalla ISD Zephyr ISD CHARTER SCHOOLS A Plus Academy A W Brown Fellowship Charter School . List of Participating Employers (Continued) Academy of Accelerated Learning Eden Park Academy Academy of Careers & Technologies Education Center Intermediate Acad Academy of Dallas El Paso Academy East Accelerated Intermediate Academy El Paso Leadership Academy Alief Montessori School Eleanor Kolitz Hebrew Academy Alpha Charter School Erath Excels Academy Ambassadors Preparatory Academy Evolution Academy Charter School Amigos Por Vida-Friends For Life Charter Excellence in Leadership Academy S Aristoi Classical Academy Faith Family Academy - Oak Cliff Arlington Classics Academy Faith Family Academy - Waxahachie Arrow Academy Fallbrook College Prep Academy Austin Achieve Public Schools Focus Learning Academy Austin Discovery School Fort Worth Academy of Fine Arts Bay Area Charter School Gateway Academy Beatrice Mayes Institute Gateway Charter Academy Beta Academy George Gervin Academy Bexar County Academy George I Sanchez Charter Big Springs Charter School Girls and Boys Prep Academy Bob Hope School Global Learning Village Brazos River Charter School Golden Rule Charter School Brazos School For Inquiry Great Hearts Academy - San Antonio Bright Ideas Charter School Gulf Coast Trades Center Brooks Acad of Science & Eng Hampton Preparatory Burnham Wood Charter School Harmony School of Excel - Houston Calvin Nelms Charter Harmony School of Science - Houston Carpe Diem Schools Harmony Science Academy - Austin Cedars International Academy Harmony Science Academy El Paso Chaparral Star Academy Harmony Science Academy Houston Chapel Hill Academy Harmony Science Academy San Antonio City Center - Health Careers Harmony Science Academy Waco Cityscape Schools Inc. Henry Ford Academy - San Antonio Compass Academy Higgs Carter King Academy Comquest Academy High Point Academy Core Academy Houston Gateway Charter School Corpus Christi Montessori School Houston Heights High School Crosstimbers Academy Houston Heights Learning Acad Cumberland Academy Idea Public Schools Dallas Community Charter School Ignite Public Schools Dr M L Garza-Gonzalez Charter Inspired Vision Academy Draw Academy International Leadership of Texas Eagle Advantage School Jean Massieu Academy East Fort Worth Montessori School John H Wood Charter School East Texas Charter School Jubilee Academic Center Statistical Section 184 Katherine Anne Porter School Ki Charter Academy KIPP Aspire Academy KIPP Austin College Prep KIPP Inc Charter KIPP Truth Academy La Academia De Estrellas La Amistad Academy La Fe Preparatory School Leadership Prep School Legacy Preparatory Life School Lighthouse Charter School Mainland Prep Academy Manara Academy Meadowland Charter School Medical Center Charter Meridian World School Meyerpark Elementary Charter Midland Academy Charter School Mid-Valley Academy Montessori For All New Frontiers Charter School Newman International Academy North Texas Elem School of Arts Northwest Prep Academy Nova Charter School Nova Charter Southeast Nyos Charter School Odyssey Academy Orenda Charter School Panola Charter School Paso Del Norte Academy Peak Preparatory School Pegasus School of Liberal Arts/Science Phoenix Charter School Pineywoods Academy Por Vida Academy Premier High Schools Premier Learning Academy Prime Prep Academy Promise Community School Radiance Academy of Learning . List of Participating Employers (Continued) Ranch Academy Rapoport Academy Raul Yzaguirre School Richard Milburn - Killeen Rise Academy San Antonio School Inquiry San Antonio Tech Academy School of Excellence in Education School of Science & Tech Discovery School of Science & Technology Seashore Charter Schools Ser-Ninos Charter School Shekinah Radiance Academy South Plains Academy South Texas Educational Tech Inc Southwest High School Southwest Preparatory School St Anthony School St Mary's Charter School Stepping Stones Charter Elementary Summit International Preparatory Tekoa Academy Temple Education Center Texans Can Academies Texas College Preparatory Texas Education Center Texas Empowerment Academy Texas Preparatory School Texas Serenity Academy The Children First Academy - Dallas The East Austin College Prep Acad The Ehrhart School The Excel Center The Excel Center For Adult The North Hills School The Pro-Vision Academy The Rhodes School TLC Academy Transformative Charter Treetops International Trinity Basin Preparatory Trinity Charter School Trinity Environmental Academy Two Dimensions Prep Academy UME Preparatory Academy Universal Academy Vanguard Academy Varnett Charter School Victory Preparatory Academy Village Tech Schools Vista Del Futuro Charter School Waco Charter School Walipp Academy Westlake Academy Williams Preparatory Winfree Academy Charter Schools Yes Prep Public Schools Zoe Learning Academy Lone Star College System McLennan Community College Midland College Navarro College North Central Texas College Northeast Texas Comm College Odessa College Panola College Paris Junior College Ranger Junior College San Jacinto College District South Plains College South Texas College Southwest Texas Junior College Tarrant County College District Temple College COMMUNITY AND JUNIOR COLLEGES Texarkana College Texas Southmost College Alamo Community College District Trinity Valley Junior College Alvin Community College Tyler Junior College Amarillo College Vernon College Angelina College Victoria College Austin Community College Weatherford College Blinn College Western Texas College Brazosport College Wharton County Junior College Central Texas College Cisco Junior College UNIVERSITIES Clarendon College Coastal Bend College Angelo State University College of The Mainland Lamar Institute of Technology Collin County Comm College Lamar State College-Orange Dallas County Comm College Dist Lamar State College-Port Arthur Del Mar College Lamar University-Beaumont El Paso Community College Midwestern State University Frank Phillips College Prairie View A&M University Galveston College Sam Houston State University Grayson County College Stephen F Austin State Univ Hill College Sul Ross State University Houston Comm College System Tarleton State University Howard County Jr College Dist Texas A&M - Agrilife Extension Service Kilgore College Texas A&M - Agrilife Research Laredo Community College Texas A&M - Central Texas Lee College Texas A&M - Commerce Statistical Section 185 . List of Participating Employers (Continued) Texas A&M - Corpus Christi Texas A&M - Eng Exp Station Texas A&M - Eng Ext Service Texas A&M - Galveston Texas A&M - International University Texas A&M - Kingsville Texas A&M - San Antonio Texas A&M - Texarkana Texas A&M - Transportation Inst Texas A&M - University Systems Office Texas A&M - University Texas A&M - Forest Service Texas Southern University Texas State Tech College Texas State University System Texas State University-San Marcos Texas Tech University Texas Woman's University U of N Texas System Admin Univ of TX - Arlington Univ of TX - Austin Univ of TX - Brownsville Univ of TX - Dallas Univ of TX - El Paso Univ of TX - Pan American Univ of TX - Permian Basin Univ of TX - San Antonio Univ of TX - Tyler University of Houston University of North TX UNT at Dallas University of Texas System West Texas A&M University UT Med Br at Galveston UT SW Medical Center MEDICAL SCHOOLS OTHER ENTITIES Texas A&M - University System HSC Texas A&M - Vet Medical Diag Lab U N T HSC at Fort Worth UT Health Ctr at Tyler UT HSC at Houston UT HSC at San Antonio UT Med Anderson Cancer Center Teacher Retirement System REGIONAL SERVICE CENTERS Region 01 Educ Service Center Region 02 Educ Service Center Region 03 Educ Service Center Region 04 Educ Service Center Region 05 Educ Service Center Region 06 Educ Service Center Region 07 Educ Service Center Region 08 Educ Service Center Region 09 Educ Service Center Region 10 Educ Service Center Region 11 Educ Service Center Region 12 Educ Service Center Region 13 Educ Service Center Region 14 Educ Service Center Region 15 Educ Service Center Region 16 Educ Service Center Region 17 Educ Service Center Region 18 Educ Service Center Region 19 Educ Service Center Region 20 Educ Service Center OTHER EDUCATIONAL DISTRICTS Anderson City Spc Ed Co Op Bowie County Sch Dist Dallas County School Dist Harris City Dept Education Parker County Co-Op Statistical Section 186 . BENEFITS SECTION . Changes in the Law STATE: The Legislature met in fiscal year 2015. Several noteworthy state law developments affecting TRS occurred during the fiscal year. FEDERAL: On the federal level, several reportable developments occurred. State Legislation related to participation in DROP - The 84th Legislature in HB 1937 opened a window from Sept. 1, 2015 to Dec. 31, 2015 for members participating in the Deferred Retirement Option Plan (DROP) to revoke participation in the plan.
The member must not have retired on or before Dec. 31, 2015 and must revoke participation on a form prescribed and received by TRS no later than Dec. 31, 2015.
A beneficiary of a member who dies after Sept. 1, 2015 but before retiring may also revoke the member’s participation in DROP provided the beneficiary is eligible to receive both the distributions from DROP and the distributions from the pension plan. Legislation related to Annuity Payment Date - HB 2168 moved the annuity payment date from the first working day of the month following the month for which the annuity accrues to the last working day of the month the annuity accrues. The bill takes effect Sept. 1, 2015 and will result in both the August 2015 and September 2015 annuities being paid in September. Legislation related to TRS Pension Administration - HB 2974 authorized TRS to establish the 12-month period for determining a member’s annual compensation.
It also amended membership eligibility by requiring that eligibility be established through employment with a single employer. For members with fewer than five years of service credit, membership will no longer terminate due to failure to earn service credit for five years if the member remains employed with a TRS-covered employer but is not eligible for membership because the employment is less than one-half time. This change in the law will prevent these members’ accounts from escheating during a time when they are ineligible to withdraw their funds due to plan qualification requirements.
The legislation also clarified that a member could not purchase more than five years of out-of-state service credit if the service credit is considered non-qualified under the Internal Revenue Code. The board of trustees was also given authority to establish a single health benefit surcharge amount that employers of retirees who retired after Sept. 1, 2005 must pay when the retiree exceeds the limits on onehalf time employment in a calendar month. Legislation related to Meetings of the TRS Board of Trustees - HB 2974 clarified that Chapter 551 of the Government Code regarding open meetings of a governmental body does not apply to an assembly of the TRS board or a committee of the board while attending a summit, conference, convention, workshop, or other event held for educational purposes if the assembly or committee does not deliberate, vote, or take action on a specific matter of public business or public policy over which the board or committee has supervision or control.
The law does not apply to regular, special, or emergency meetings of the board scheduled or called under the board’s bylaws. Federal INVESTMENTS Rulemaking under the Dodd – Frank Wall Street Reform and Consumer Protection Act (2010) (Dodd – Frank) During this fiscal year, TRS continued to monitor proposed rules and interpretive guidance issued by the Commodities Futures Trading Commission (CFTC) under Dodd – Frank. Among other things, the CFTC reproposed rules to govern the posting of margin for uncleared swap trades. TRS will assess the final rules—once they are issued—and implement changes to its trading documentation and processes, as necessary, to ensure compliance. Benefits Section 188 .
Changes in the Law BENEFITS Health Care Federal Patient Protection and Affordable Care Act of 2010 (PPACA) - During this fiscal year, TRS continued to monitor the regulations issued with regard to the PPACA and implemented various provisions of the PPACA that impact the health benefit plans administered by TRS. TRS also began to take steps which will allow school districts, charter schools, and other entities participating in TRS-ActiveCare to designate TRS, acting in its capacity as trustee of TRS-ActiveCare, to fulfill the reporting requirements under Internal Revenue Code Section 6055. Section 6055 addresses the reporting of health care coverage selected by active employees and COBRA qualified beneficiaries (and their dependents) who are enrolled in one of the PPO plans offered under TRS-ActiveCare, for the months of enrollment during the 2015 calendar year. Same-Sex Marriages - In June 2015, the U.S. Supreme Court ruled in Obergefell v.
Hodges that under the Due Process and Equal Protection Clauses of the Fourteenth Amendment of the U.S. Constitution, (i) same-sex couples have a fundamental right to marry in all states and (ii) all states must recognize a lawful same-sex marriage performed in another state. Consequently, controlling law now provides that a same-sex person who is married to a “retiree” or an “employee” (as defined, respectively, in Chapters 1575 and 1579, Insurance Code) are entitled to enroll in either TRS-Care or TRSActiveCare as an eligible dependent. TRS will continue to monitor developments and will determine whether any additional administrative changes are necessary with regard to TRS-Care and TRS-ActiveCare in order to comply with this ruling. PENSION Tax Laws, Regulations, and Guidance IRS Determination Letter Program - In July 2015, the IRS issued Announcement 2015-19 indicating that effective Jan.
1, 2017, the IRS is eliminating the existing staggered five-year determination letter application filing cycles for individually designed qualified plans. Effective Jan. 1, 2017, determination letter applications for individually designed plans will be limited to initial plan qualification and upon plan termination.
Qualified plans that are in Cycle E can continue to file their determination letter applications through Jan. 31, 2016 (the end of the current Cycle E period), and qualified plans that are in Cycle A can file during the last Cycle A period that begins Feb. 1, 2016 and ends on Jan.
1, 2017. Off-cycle filings are eliminated effective July 21, 2015 and through Dec. 31, 2016, except for determination letters for new plans and terminating plans.
The IRS also indicated that individually designed plans will be permitted to submit determination letter applications in certain other limited circumstances as determined in the future by the IRS and U.S. Treasury Department. TRS will continue to monitor developments. Advance Notice of Proposed Rulemaking Regarding the Determination of Governmental Plan Status - In November 2011, the IRS issued advance notice of proposed rulemaking indicating that the IRS and the U.S.
Treasury Department intend to issue regulations to define the term “governmental plan” under Section 414(d) of the Internal Revenue Code. The preliminary guidance defines a “governmental plan” as “a plan established and maintained for its employees by the Government of the United States, by the government of any state or political subdivision thereof, or by any agency or instrumentality of the foregoing.” The IRS received over 2,000 comments from the public charter school community regarding the draft proposed regulations contained in the preliminary guidance. In February 2015, the IRS issued Notice 2015-07 indicating that the IRS anticipates issuing proposed regulations that provide that a state or local retirement system that covers public charter school employees will not fail to be a governmental plan under Section 414(d) if certain requirements are satisfied.
The IRS and the U.S. Treasury Department anticipate that the final regulations under Section 414(d) will apply prospectively and will include a delayed effective date. In addition, the IRS and the U.S.
Treasury Department anticipate that the final regulations will contain certain transition relief. The IRS and the U.S. Treasury Department will also continue to review other comments received in response to the 2011 advance notice of proposed rulemaking.
TRS will continue to monitor developments. Benefits Section 189 . Changes in the Law Eligible Rollover Distributions - In September 2014, the IRS issued Notice 2014-54 and proposed regulations providing that eligible rollover distributions of pre-tax and post-tax amounts from a qualified plan that are scheduled to be made to a recipient at the same time will be treated as a single distribution, regardless of whether the payments are made to a single destination or multiple destinations. In addition, the IRS provided rules for the pre-tax and post-tax amounts of the distribution to be allocated on a tax-favored basis. The allocation rules generally apply to distributions made on or after Jan. 1, 2015.
However, the IRS indicated the proposed regulations may be applied to distributions made on or after Sept. 18, 2014 but before Jan. 1, 2015, by applying a reasonable interpretation of the rules under the notice to allocate pre-tax and post-tax amounts among disbursements made to multiple destinations.
The IRS also indicated that it intended to revise the Section 402(f) safe harbor explanations in its 2009 model rollover notice to reflect the new guidance, which it subsequently did in December 2014 with Notice 2014-74. Normal Retirement Age Regulations - In April 2012, the IRS issued Notice 2012-29 indicating that the IRS and the U.S. Treasury Department intend to issue guidance regarding the applicability to governmental plans of final regulations issued in May 2007 concerning pension distributions upon attainment of “normal retirement age” (NRA). The guidance is expected to extend the date by which governmental plans must comply with the final regulations. The IRS and the U.S. Treasury Department intend to clarify that a governmental plan that does not allow “in-service” distributions before age 62 is not required to define NRA in accordance with the final regulations.
The IRS and the U.S. Treasury Department also intend to provide that the rule that deems age 50 or later to be NRA for qualified public safety employees will apply regardless of whether those employees are covered by a separate plan. TRS will continue to monitor developments with respect to these anticipated changes in federal regulations. Other Developments Same-Sex Marriages Obergefell v.
Hodges - As noted above, in June 2015, the U.S. Supreme Court handed down the Obergefell v. Hodges ruling.
Consequently, controlling law now provides that a same-sex person who is married to a TRS member or retiree is eligible under the pension plan for benefits available to a spouse. TRS immediately complied with the law and will continue to monitor developments to determine whether any further plan administration changes are advisable or necessary in order to comply with this ruling. De Leon v. Perry - In February 2014, the U.S.
District Court for the Western District of Texas ruled that the prohibition against same-sex marriage under Article I, Section 32 of the Texas Constitution violated the Equal Protection Clause and the Due Process Clause of the Fourteenth Amendment to the U.S. Constitution. The case was appealed to the U.S. Court of Appeals for the Fifth Circuit.
In response to the U.S. Supreme Court’s decision in Obergefell v. Hodges, the U.S.
Court of Appeals for the Fifth Circuit affirmed the U.S. District Court’s preliminary injunction in De Leon v. Perry prohibiting enforcement of the laws prohibiting same-sex marriage or recognition of same-sex marriages performed outside of the State of Texas, and remanded the case to the U.S.
District Court for entry of judgment in favor of the plaintiffs. On July 7, 2015, the U.S. District Court upheld its previous decision and permanently enjoined the enforcement of the laws of the State of Texas which prohibit same-sex marriage.
TRS implemented the ruling in conjunction with the Obergefell v. Hodges opinion and will continue to monitor developments to determine if any further plan administration changes are advisable or necessary in order to comply with this ruling. Benefits Section 190 . Summary of Benefits The Teacher Retirement System of Texas (TRS) administers a defined benefit retirement plan that is a qualified pension trust under Section 401(a) of the Internal Revenue Code. The pension trust fund provides service retirement; disability retirement; death benefits; and survivor benefits for eligible employees, including their beneficiaries, of public and higher education in Texas. The TRS Benefits Handbook, a general information booklet, is available to TRS members and annuitants. Retirement benefits are financed by member, state, and employer contributions, along with earnings from pension trust fund investments. TRS administers TRS-ActiveCare, the statewide health benefits program for eligible public education employees of participating entities and their eligible dependents.
The program is mainly financed by plan participant premium payments. In addition to TRS-ActiveCare, TRS administers TRS-Care, a separate statewide health benefits program for eligible retired public education employees and their eligible dependents. This program is financed by contributions from the state, active public school employees, reporting entities (employers), premium payments from plan participants, subsidy revenue from the Medicare Part D program. TRS also administers an optional long-term care insurance program for eligible retirees, eligible public school employees, and eligible family members.
The plan is available on an enrollee-pay-all-basis. Retirement Plan Benefits This summary of benefits is based on statutory provisions of the plan effective for FY 2015. The major retirement plan benefits are: SERVICE RETIREMENT Normal Retirement Eligibility For members whose membership began prior to Sept. 1, 2007, who had at least five years of service credit as of Aug. 31, 2014, and who maintained membership until retirement: • • Age 65 with at least five years of credited service, or The sum of member’s age and years of credited service equals or exceeds 80 with at least five years of credited service. For members whose membership began on or after Sept.
1, 2007 but prior to Sept. 1, 2014, who had at least five years of service credit as of Aug. 31, 2014, and who maintained membership until retirement: • • Age 65 with at least five years of credited service, or Age 60 and the sum of member’s age and years of credited service equals or exceeds 80 with at least five years of credited service. For members who did not have at least five years of service credit as of Aug.
31, 2014, who established TRS membership on or after Sept. 1, 2014, or who had at least five years of service credit as of Aug. 31, 2014 but terminated membership in TRS by withdrawal of accumulated contributions and later resumed TRS membership: • • Age 65 with at least five years of credited service, or Age 62 and the sum of member’s age and years of credited service equals or exceeds 80 with at least five years of credited service. Standard Annuity - A monthly benefit payable at retirement throughout the retiree’s lifetime and calculated according to the statutory benefit formula. Benefit Formula - 2.3 percent (multiplier) times the average of the five highest annual creditable salaries times years of credited service equals an annual standard annuity.
For members who are grandfathered, the three highest annual salaries are used. Benefits Section 191 . Summary of Benefits Minimum Benefit - $150 per month less any reduction for early age or optional annuity selection. Early Retirement Eligibility For members whose membership began prior to Sept. 1, 2007, who had at least five years of service credit as of Aug. 31, 2014, and who maintained membership until retirement: • • At least 55 with five or more years of service credit, but the sum of the member’s age and years of service credit total less than 80, or 30 or more years of service credit, but the sum of the member’s age and years of service credit total less than 80. For members whose membership began on or after Sept. 1, 2007 but prior to Sept.
1, 2014, who had at least five years of service credit as of Aug. 31, 2014, and who maintained membership until retirement: • • • At least 55 with five or more years of service credit, but the sum of the member’s age and years of service credit total less than 80, or 30 or more years of service credit, but the sum of the member’s age and years of service credit total less than 80, or The sum of the member’s age and years of service credit total at least 80, but the member is less than age 60.* For members who met the requirements to be grandfathered before Sept. 1, 2005, there is no reduction to their benefit based on actuarial tables if they are at least age 55, the sum of their age and years of service credit total at least 80, and they are below age 60; however, these members are still considered early-age retirees. For members who did not have at least five years of service credit as of Aug.
31, 2014, who established TRS membership on or after Sept. 1, 2014, or who had at least five years of service credit as of Aug. 31, 2014 but terminated membership in TRS by withdrawal of accumulated contributions and later resumed TRS membership: • • • At least 55 with five or more years of service credit, but the sum of the member’s age and years of service credit total less than 80, or 30 or more years of service credit, but the sum of the member’s age and years of service credit total less than 80, and the member is less than age 62, or The sum of the member’s age and years of service credit total at least 80, but the member is less than age 62.** For members who met the requirements to be grandfathered before Sept.
1, 2005, there is no reduction to their benefit based on actuarial tables if they are at least age 55, have at least 20 years of service credit, the sum of their age and years of service credit total at least 80, and they are below age 62; however, these members are still considered early-age retirees. Early Retirement Benefit - The standard annuity calculated under the benefit formula (or the minimum benefit, if applicable) reduced for early retirement. The amount of the reduction varies depending on age, years of service credit, and whether a member is grandfathered. DISABILITY RETIREMENT Eligibility - Physical or mental disability precludes the member’s continued performance of current duties and the disability is probably permanent, as certified by the TRS Medical Board. Benefit - For disabled members with at least 10 years of credited service, the greater of the standard annuity unreduced for early age or $150 per month minimum benefit, less any reduction for the selection of an optional annuity. For disabled members with fewer than 10 years of credited service, $150 per month. Benefits Section 192 .
Summary of Benefits Duration - For retirees with 10 or more years of credited service, payments continue for as long as the disability continues. For those with fewer than 10 years of credited service, payments continue for the life of the retiree, the duration of the disability, or the number of months of credited service, whichever is shorter. Earnings Limit - Disability retirees who applied and retired after Aug. 31, 2007 are subject to an annual limit on earnings from any employment. The current limit is the greater of the highest annual salary before retirement or $40,000. Excess earnings will cause benefits to be forfeited until such time as the excess earnings cease or are reduced to an allowable amount. ANNUITY PAYMENT OPTIONS All service and eligible disability retirees may select an optional form of payment that reduces the standard annuity by application of actuarial reduction factors in order to continue payment to a beneficiary after the retiree’s death.
Actuarial factors for disability retirees are different from those for service retirees because of different assumptions about life expectancy for the two groups. The available options include 100, 75, and 50 percent joint and survivor annuities, and five- and 10-year guaranteed period annuities. Selection of a 100 or 75 percent joint and survivor annuity and a five- or 10-year guaranteed period annuity may not be allowed in certain situations based on the minimum distribution provisions of federal tax law. THE POP-UP PROVISION If a designated beneficiary under any of the joint and survivor options dies while the retiree is still living, the retiree’s future monthly payment increases to the amount of the standard annuity. PARTIAL LUMP SUM OPTION Under the Partial Lump Sum Option (PLSO), at the time of retirement, eligible members may elect to receive an actuarially reduced service retirement annuity plus a cash lump sum distribution. Members may participate in the PLSO if they are eligible for service retirement, meet the Rule of 90 (age and years of service credit equal at least 90), are not participating in the Deferred Retirement Option Plan (DROP), and are not retiring with disability retirement benefits.
Grandfathered members may elect PLSO at retirement if they are eligible for normal age service retirement under the pre-Sept. 1, 2005 law (age 65 with at least five years of credited service, or the sum of the member’s age and years of credited service equals or exceeds 80 with at least five years of credited service), are not participating in DROP, and are not retiring with disability retirement benefits. Members retiring under the proportionate retirement program are not eligible to elect the PLSO. Partial lump sum distributions equal to 12, 24, or 36 months of a standard service retirement annuity may be selected. When a member selects this option, the monthly annuity is actuarially reduced to reflect the lump sum distribution. Flexible distribution options are available, including rollovers to another eligible retirement plan. DEFERRED RETIREMENT OPTION PLAN The Deferred Retirement Option Plan (DROP), which is closed to new participants, was available for active members who were eligible for normal age service retirement and had at least 25 years of credited service. Members who elected to participate in DROP (before enrollment was closed effective Dec.
31, 2005) chose to freeze their salary amounts and service credit used to calculate their retirement benefits and to have a portion of the standard annuity amount deposited into a DROP account while continuing to work for a TRS-covered employer. Interest on DROP accounts prior to Sept. 2014 was credited at a rate of five percent.
The DROP account is currently credited at the rate of two percent per annum. Members are not considered to be retired while participating in DROP. Benefits Section 193 . Summary of Benefits Members who elected DROP chose to participate in 12-month increments for up to five years. During DROP participation, the member does not accrue additional service credit, nor is any compensation earned during DROP participation considered in calculating the standard annuity. Also, during DROP participation, the member’s statutory contributions to TRS continue; however, contributions are not credited to the member’s contribution account and are not subject to refund. Participation in DROP ends at the earliest of the expiration of the election period, retirement, or death. The accumulated DROP account may be distributed as a single lump sum or in monthly or yearly installments covering five or 10 years. Distributions commence at retirement or in the event the member dies before retiring, at the member’s death.
Eligible distributions may be rolled over to another eligible retirement plan. Beginning in September 2015 a member who is currently in the DROP program and has not yet retired will have a window of opportunity to revoke their DROP election. The window for the DROP revocation opens Sept. 1, 2015 and ends Dec.
31, 2015. MINIMUM SERVICE CREDIT REQUIRED FOR SERVICE RETIREMENT BENEFITS Under current law, a member who has completed at least five years of credited service has earned a right to service retirement benefits after reaching eligible retirement age, provided that the member’s accumulated contributions are not withdrawn from the system. Service credited in another retirement system that participates in the Proportionate Retirement Program may be combined with TRS service credit to determine eligibility for TRS service retirement benefits. Any unpurchased, qualifying USERRA military service, up to a maximum of five years, may also be counted in determining eligibility for TRS service retirement benefits. An eligible member must apply for benefits and meet other requirements, such as termination of Texas public education employment, in order to begin receiving benefits. DEATH AND SURVIVOR BENEFITS Active Members - The beneficiary of an active member may elect to receive one of the following benefits in the event of the member’s death before retirement, if the member dies during a school year in which the member performed service or if the member dies while performing qualified military service as defined by applicable federal law.
These benefits also are available due to death when the member is absent from service as described by law, such as when the absence is due to sickness, accident, or other involuntary cause or when the member is within five years of being eligible to retire when leaving employment: 1. A lump sum payment equal to twice the member’s annual rate of compensation or $80,000, whichever is less. 2. Sixty monthly payments equal to the member’s standard annuity without reduction for early age, provided the member had at least five years of service credit at the time of death. 3.
Lifetime payments equal to a 100 percent joint and survivor annuity, provided the member had at least five years of service credit subject to any reduction applicable for early age. This benefit is only available when there is a sole beneficiary. 4. An amount equal to a return of the member’s contributions with accumulated interest. 5.
Survivor benefits of $2,500 lump sum payment plus a monthly benefit. For example, $350 per month to a beneficiary spouse with minor children, continuing until the youngest child reaches age 18. When the spouse turns age 65, or when the youngest child reaches age 18, whichever is later, the spouse would begin receiving $250 per month for life. In addition to these five options, a lump sum death benefit of $160,000 is available if the active member is employed in a TRS-covered position and dies as the result of a physical assault during the performance of the employee’s regular job duties. Benefits Section 194 .
Summary of Benefits Also, the beneficiary of a DROP participant will receive the accumulated DROP account balance, payable as a lump sum or in periodic installments. Retirees - In addition to any joint and survivor or guaranteed period annuity that may be payable under an optional form of payment a retiree elected, the beneficiary of a service or disability retiree is entitled to a $10,000 lump sum payment. In certain circumstances, eligible survivors may select alternate payment options in lieu of the lump sum benefit. The alternate payment options include a lump sum payment of $2,500 plus an applicable monthly survivor benefit. If total payments made before death to a retiree and, when applicable, to a beneficiary for an optional service retirement annuity are less than accumulated contributions at retirement, an amount equal to the remainder is paid to the beneficiary or as otherwise provided by law. Should a retiree die prior to receiving all PLSO payments that are due, TRS will pay any remaining PLSO payments in a single lump sum payment to the beneficiary. If the retiree participated in DROP and died before receiving all DROP distributions, any unpaid DROP payments are paid to the beneficiary designated by the retiree. GRANDFATHERED PROVISIONS A person who, as a member, met any one of the following criteria on or before Aug.
31, 2005, is grandfathered under plan provisions repealed with respect to non-grandfathered members: • • • • • • • the member was at least 50 years old, the member’s age and years of service credit equaled at least 70 (“Rule of 70”), or the member had at least 25 years of service credit. Members who are grandfathered will have their benefits determined in the following manner: Final Average Salary at retirement will be determined by the highest three years (instead of five years) of salary. Preservation of certain retirement reduction factors means that members age 55 or older with 20 to 24 years of credited service who take early retirement will receive a lesser reduction to their annuities than those members who are not grandfathered. Partial Lump Sum Option eligibility will require either age 65 with at least five years of service credit, or a combined age plus years of credited service that equals at least 80 (“Rule of 80”) instead of 90. Health Benefits The major health benefits and long-term care provisions are: HEALTH BENEFITS FOR ACTIVE PUBLIC SCHOOL EMPLOYEES TRS-ActiveCare, the statewide health benefits program for eligible full-time and eligible part-time employees of school districts, open enrollment charter schools, regional education service centers, and other educational districts, went into effect on Sept. 1, 2002. The program initially addressed the most critical areas of the state with regard to availability and affordability of health benefits for public school employees and therefore focused on smaller districts.
The program was subsequently expanded to include larger school districts. In fiscal year 2015, 1,110 entities participated in the program. During this same fiscal year, employees of participating entities were enrolled in three preferred provider organization plans, and employees of certain areas also had the option of choosing coverage under a health maintenance organization. Benefits Section 195 . Summary of Benefits RETIREE HEALTH COVERAGE The program under the Texas Public School Retired Employees Group Benefits Act, known as TRS-Care, makes available a basic level of health coverage without cost to eligible TRS public school retirees. As has been the case for a number of years, eligible retirees and their eligible dependents may pay premiums and participate in one of two standard medical plans and one of two standard prescription plans of more comprehensive benefits and coverage. Participants with Medicare also have two Medicare Advantage medical plan and two Medicare Part D prescription plan options, subject to eligibility criteria. For information on TRS-Care eligibility, please refer to the TRS website. LONG-TERM CARE INSURANCE PROGRAM Eligible active and retired members, their dependents, and certain other family members may participate in the TRS longterm care insurance program.
The plan pays benefits if the participant becomes unable to perform at least two activities of daily living without substantial assistance from another person. The plan also pays benefits as a result of a severe cognitive impairment that requires supervision or verbal direction from another person in order to protect the member or others from serious injury. Benefits Section 196 . . Teacher Retirement System of Texas 1000 Red River Street Austin, Texas 78701-2698 (512) 542-6400 1-800-223-8778 TRS o rher Supe her Teac Art test Con n r le entio Honorable M www.trs.texas.gov .
A 4th grader from Ramirez Elementary in Lubbock, received an Honorable Mention. That artwork is on the back of the CAFR. Top ten artwork from Facebook is featured throughout the CAFR; however, we feel that every participant is a winner. We plan to recognize them and their teachers in other publications and on our website. .
Teacher Retirement System of Texas COMPREHENSIVE ANNUAL FINANCIAL REPORT A Component Unit of the State of Texas Fiscal Year Ended August 31, 2015 Prepared by Teacher Retirement System of Texas 1000 Red River Street Austin, Texas 78701-2698 (512) 542-6400 1-800-223-8778 R WINNE 3rd PLACE TRS Superh ero Teache r Art Contes t Brian K. Guthrie, Executive Director www.trs.texas.gov . INTRODUCTORY SECTION Board of Trustees..........................................................................................................................................3 Professional Awards .....................................................................................................................................4 Le er of Transmi al .....................................................................................................................................6 Organiza on Chart......................................................................................................................................10 Staff and Advisors .......................................................................................................................................11 Membership ...............................................................................................................................................12 Communica ons.........................................................................................................................................14 FINANCIAL SECTION Independent Auditor’s Report....................................................................................................................19 Management’s Discussion and Analysis .....................................................................................................23 Basic Financial Statements Exhibit I - Statement of Fiduciary Net Posi on ...................................................................................36 Exhibit II - Statement of Changes in Fiduciary Net Posi on................................................................40 Exhibit III - Statement of Net Posi on - Proprietary Funds .................................................................44 Exhibit IV - Statement of Revenues, Expenses, and Changes in Net Posi on - Proprietary Funds .....46 Exhibit V - Statement of Cash Flows - Proprietary Funds....................................................................48 Notes to the Financial Statements .............................................................................................................50 Required Supplementary Informa on ........................................................................................................84 Exhibit A - Statement of Changes in Assets and Liabili es - Agency Funds ................................................91 Suppor ng Schedules Schedule 1 - Compara ve Schedule of Changes in Account Balance - Pension Trust Fund Interest Account .........................................................................................................................92 Member Savings Account ...........................................................................................................93 State Contribu on Account ........................................................................................................94 Re red Reserve Account ............................................................................................................95 Deferred Re rement Op on Account.........................................................................................96 Expense Account ........................................................................................................................97 Schedule 2 - Schedule of Administra ve Expenses - All Funds ...........................................................98 Schedule 3 - Compara ve Schedule of Inves ng Ac vity Expenses - Pension Trust Fund................100 Schedule 4 - Schedule of Professional and Consul ng Fees - All Funds ...........................................101 INVESTMENT SECTION Investment Overview ...............................................................................................................................104 Total Time-Weighted Returns ...................................................................................................................106 Asset Alloca on ........................................................................................................................................109 Investment Summary ...............................................................................................................................110 Largest Holdings .......................................................................................................................................112 Schedule of Fees and Commissions..........................................................................................................114 ACTUARIAL SECTION Pension Trust Fund Actuary’s Cer ï¬ca on Le er ............................................................................................................136 Actuarial Present Value of Future Beneï¬ts.......................................................................................141 Actuarial Methods and Assump ons ...............................................................................................142 TRS-Care Actuary’s Cer ï¬ca on Le er ............................................................................................................150 Actuarial Present Value of Future Beneï¬ts.......................................................................................152 Actuarial Methods and Assump ons ...............................................................................................152 STATISTICAL SECTION Sta s cal Sec on Overview .....................................................................................................................157 Financial Trends Informa on Ten-Year Summary Changes in Fiduciary Net Posi on and Revenues, Expenses, and Changes in Net Posi on ..............................................................................................................................158 Beneï¬t and Refund Deduc ons from Net Posi on by Type .............................................................166 Opera ng Informa on Average Beneï¬t Payments ................................................................................................................168 Re red Members by Type of Beneï¬t and Health Beneï¬t Payments by Range .................................172 Principal Par cipa ng Employers .....................................................................................................174 List of Par cipa ng Employers ................................................................................................................. 176 BENEFITS SECTION Changes in the Law...................................................................................................................................188 Summary of Beneï¬ts ................................................................................................................................191 . INTRODUCTORY SECTION . This page is intentionally left blank. Introductory Section 2 . Board of Trustees R. David Kelly, Chair Nanette Sissney Vice Chair Managing Partner Straight Line Realty Partners, Plano Direct appointment of the governor Term expires 2017 School Counselor Whitesboro ISD, Whitesboro Active public education position Term expires 2015 Todd Barth Karen Charleston President Bowers Properties Inc., Houston Direct appointment of the governor Term expires 2015 Space Management Assistant Prairie View A&M University, Houston Higher education position Term expires 2017 Joe Colonnetta David Corpus Private Investor Dallas Direct appointment of the governor Term expires 2019 Senior Vice President CommunityBank of Texas, Humble Position nominated by the State Board of Education Term expires 2019 Christopher Moss Vice President The Advanced Financial Group, Lufkin Position nominated by the State Board of Education Term expires 2015 Anita Palmer Former Texas Public School Teacher, Administrator and University Adjunct Professor Jacksboro Retiree position Term expires 2017 Dolores Ramirez Teacher San Benito CISD, San Benito Active public education position Term expires 2019 For information on the board election process, please refer to Note 1 in the Financial Section. Introductory Section 3 . Professional Awards Government Finance Officers Association Certificate of Achievement for Excellence in Financial Reporting Presented to Teacher Retirement System of Texas For its Comprehensive Annual Financial Report for the Fiscal Year Ended August 31, 2014 Executive Director/CEO Introductory Section 4 . Professional Awards PC PC Public Pension Coordinating Council Recognition Award for Administration 2014 Presented to Teacher Retirement System of Texas In recognition of meeting professional standards for plan administration as set forth in the Public Pension Standards. Presented by the Public Pension Coordinating Council, a confederation of National Association of State Retirement Administrators (NASRA) National Conference on Public Employee Retirement Systems (NCPERS) National Council on Teacher Retirement (NCTR) Alan H. Winkle Program Administrator Introductory Section 5 . Letter of Transmittal November 18, 2015 The Honorable Greg Abbott The Honorable Dan Patrick The Honorable Joe Straus The Board of Trustees and Members   of the Teacher Retirement System Dear Governor Abbott, Lieutenant Governor Patrick, Speaker Straus, TRS Board of Trustees, and Members of the Teacher Retirement System: On behalf of the board of trustees, I am pleased to present the Comprehensive Annual Financial Report (CAFR) of the Teacher Retirement System of Texas (TRS or System) for the fiscal year ended August 31, 2015, the System’s 78th year of operation. During the past fiscal year, the System experienced modest growth as membership grew to approximately 1,459,243 participants. The pension trust fund saw slightly negative returns in the past year, consistent with a downturn in world markets. The fund ended the 2015 fiscal year with a net position of $128.5 billion compared to $132.8 billion at the close of the 2014 fiscal year.
However, contribution increases and benefit changes that were approved by the 83rd Texas Legislature, are continuing to enable TRS to provide secure benefits for current and future retirees. MANAGEMENT RESPONSIBILITY This report consists of management’s representations concerning TRS finances. Management assumes full responsibility for the completeness and reliability of all information presented in this report. To provide a reasonable basis for making these representations, management has established a comprehensive internal control framework that is designed both to protect the assets from loss, theft, or misuse and to compile sufficient, reliable information for the preparation of TRS financial statements in conformity with generally accepted accounting principles.
The cost of controls should not exceed the benefits to be derived as the objective of the internal control framework is to provide reasonable rather than absolute assurance that the financial statements will be free from material misstatement. As management, we assert that, to the best of our knowledge and belief, this financial report is complete and reliable in all material respects. CERTIFICATE OF ACHIEVEMENT FOR EXCELLENCE IN FINANCIAL REPORTING The Government Finance Officers Association of the United States and Canada (GFOA) awarded TRS the Certificate of Achievement for Excellence in Financial Reporting for its Comprehensive Annual Financial Report for the previous fiscal year. To be awarded the certificate, a report must meet or exceed program standards and must satisfy both generally accepted accounting principles and applicable legal requirements.
TRS has received a Certificate of Achievement for the last 25 years. We believe that the current report continues to meet program requirements, and it is being submitted to the GFOA for consideration again this year. Introductory Section 6 . Letter of Transmittal FINANCIAL INFORMATION The basic financial statements have been prepared in accordance with generally accepted accounting principles applied on a consistent basis as promulgated by the Governmental Accounting Standards Board. The Management’s Discussion and Analysis (MD&A) includes a narrative introduction, overview and analysis to accompany the basic financial statements. This transmittal letter is designed to complement the MD&A and should be read in conjunction with it. The MD&A can be found immediately following the report of the independent auditors. During the past year, TRS also embarked on a program of auditing reporting entity reports submitted by reporting entities to TRS in response to GASB accounting and AICPA auditing guidance. TRS Internal Audit staff has been testing employer census data and controls pertaining to census data reporting process for active members.
TRS is reviewing the following elements of the data: gender; dates of birth; dates of hire or years of service; eligible Brian K. Guthrie compensation; and termination or retirement dates. TRS auditors are also testing eligibility and compensation for accuracy, completeness, and compliance with TRS Laws & Rules.
The TRS Financial Reporting department also gave presentations to reporting entities from across the State of Texas during the past year to provide guidance for implementation of GASB 68 through various organizations. ` INVESTMENTS For the 12-month period ending Aug. 31, 2015, the total portfolio had a return of -0.3 percent, which led the fund’s benchmark by 0.5 percent.
The TRS Pension Trust Fund finished the year with an investment net value of $127.9 billion, a decrease of $4.2 billion after contributions and benefit payouts, from fiscal year 2014. For the past 10 years, the timeweighted compound annual return has been 6.2 percent. On a three-year annualized basis, the fund has returned 8.3 percent, which is 1 percent above its benchmark.
Annual rates of return for the five- and 10-year periods ending Aug. 31, 2015 were 9.6 percent and 6.2 percent, respectively. Investment risks are diversified over a very broad range of market sectors and securities. TRS’ investment strategy is designed to address four different potential market scenarios and has an advantage in each of them by allocating 57 percent to global equities, 22 percent to real return, 16 percent to stable value, and 5 percent to risk parity, which has a balanced exposure to all three economic scenarios.
This allocation is designed to minimize downside risk while capturing upside performance in any of the four scenarios. This strategy reduces portfolio risk to adverse developments in sectors and issuers experiencing unusual difficulties and offers opportunity to benefit from future markets. PENSION PLAN BENEFITS For fiscal year 2015, TRS paid pension benefit payments to more than 377,738 retirees and their beneficiaries totaling $8.9 billion. These benefits were funded from a combination of cumulative investment income, member contributions, and state and employer contributions. ACTUARIAL SOUNDNESS OF THE PENSION TRUST FUND As of Aug.
31, 2015, the System had a funded ratio of 80.2 percent with an Unfunded Actuarial Accrued Liability of $33 billion. The System is now deferring net investment losses of $4.9 billion. Introductory Section 7 . Letter of Transmittal The period of time necessary to amortize the unfunded liability has increased from 29.8 years to 33.3 years. Given that current contributions cannot amortize the unfunded liability in less than 31 years, the System does not meet the definition for actuarial soundness. The increase in the period of time necessary to amortize the unfunded liability was anticipated and is partially due to the phasing in of contribution rate increases adopted by the 83rd Texas Legislature. In 2013, the Legislature adopted Senate Bill 1458 that provided a stair-step increase in the member contribution rate from 6.4 percent in FY 2014 to 7.7 percent in FY 2017.
The member contribution rate for FY 2015 was 6.7 percent. While the increased contribution rates are an actuarial gain to the System, the phased-in approach has partially contributed to the funding period and unfunded liability growth. The state contribution rate for FY 2015 was 6.8 percent, and in FY 2015 school districts that do not participate in Social Security began paying a 1.5 percent contribution rate to the System. Also impacting the growth of the unfunded liability are lower than expected investment returns for FY 2015 and the adoption of a new mortality assumption based on the increased life expectancy of System members.
Adoption of the new mortality assumption was part of a larger study of System experience for the last five years. Texas Government Code Section 825.206 requires TRS to conduct an actuarial experience study at least once every five years to examine the mortality, service, and compensation experience of the members and beneficiaries of the retirement system. The TRS Board is then required to review and adopt the System’s actuarial assumptions in light of the relevant experience.
In September 2015, TRS concluded the experience study for the four-year period ending Aug. 31, 2014 and adopted a new assumption set. In addition to updating the mortality assumption, the board kept the assumed investment return rate at 8 percent and lowered the assumptions for inflation, real wage growth, and payroll growth.
The new assumption set more accurately portrays the actuarial condition of the System given that it incorporates System experience for FY 2011 to FY 2014. It is estimated that the unfunded liability and the funding period will both continue to increase over the next few years before beginning to once again decline. However, the funding period is anticipated to remain a finite number until the unfunded liability is amortized and the pension fund is fully funded. Several important legislative changes were enacted by the 84th Texas Legislature during the past year. Some of the bills that most directly impacted TRS members included House Bill 2, a supplemental funding bill, which provided biennial funding for TRS-Care in the amount of roughly $768 million.
House Bill 2168 stipulated that monthly annuity payments be paid on the last working day of the month for which the payment accrues. House Bill 2974 contained a variety of selected omnibus provisions covering several important areas. It also created a joint interim committee to study TRS-Care and TRSActiveCare.
TRS-related legislation is covered in more detail in the “Changes in the Law” section of this report. RETIREE HEALTH BENEFITS PROGRAM TRS administers TRS-Care, a health benefits program for retirees that was established in 1985. TRS-Care is the source of health benefits coverage, which almost all retired public school employees rely upon. Funding is provided by premium payments from retiree participants and contributions from the state, school districts and active employees.
TRS-Care also receives additional revenue from the Medicare Part D prescription drug program. An actuarial valuation for TRS-Care was conducted as of Aug. 31, 2015. The valuation results indicate that TRS-Care has an Unfunded Actuarial Accrued Liability of $44.2 billion.
The plan was 2.2 percent funded as of the end of the Fiscal Year 2015. More detailed information about the valuation results is included in the Notes to the Financial Statements and the Required Supplementary Information. The current funding formula of 1 percent of public school payroll from the State, .55 percent from the district and .65 percent from the member is insufficient to sustain the, TRS-Care Program. The state legislature infused $768 million into the program as a measure intended to ensure solvency of the TRS-Care fund through the FY 16-17 Biennium.
The 84th Legislature also created a joint interim committee to study TRS-Care and also TRS-ActiveCare. TRS will be supporting the work of the committee to address the ongoing solvency and affordability of the TRS-Care and TRS-ActiveCare programs. Introductory Section 8 . Letter of Transmittal ACTIVE MEMBER HEALTH BENEFITS PROGRAM TRS-ActiveCare, initiated in 2002, is a self-funded health benefits program that offers options ranging from catastrophic coverage with reduced premiums to a comprehensive plan at higher premiums. TRS-ActiveCare covers members currently employed by public education employers that participate in the plan. TRS establishes premiums to pay for the cost of the program. The TRS Board of Trustees approved an additional increase in premiums for fiscal year 2014 and froze TRSActiveCare 3 for new enrollment.
As noted above, TRS also updated an earlier study submitted to the 83rd Legislature of options for improving the sustainability of TRS-Care and expanded the study to also include options to improve the affordability of TRS-ActiveCare. ORGANIZATIONAL CHANGE During the past year, TRS named three new chief officers. Chris Cutler became TRS’ new chief information officer, Barbie Pearson was named chief benefit officer, and Katrina Daniel joined TRS as the agency’s new chief health care officer. Over the past year, we have also made a handful of other organizational changes to focus on our key challenges moving forward: health care fund solvency, pension trust fund sustainability, long-term investment returns, and replacing legacy technology systems.
These changes are reflected in the updated organizational chart on the following page. During the past year, TRS increased its focus on the agency’s core values: Customer Satisfaction; Collaboration and Teamwork; Accountability; Respect; Ethics; Excellence; and Employee Fulfillment. These values continue to be incorporated throughout TRS’ work environment, including in performance evaluations, employee recognition programs and communications. They also continuously focus our efforts on how to best serve our members. Thanks to the hard work and dedication of its employees, TRS was named a “Top Workplace” by the Austin AmericanStatesman for the fourth year in a row. ACKNOWLEDGMENTS We wish to express our appreciation for the support of the Governor’s, Lieutenant Governor’s, and Speaker’s Offices, as well as members of the legislature, in maintaining a strong retirement system, which provides valuable benefits for public education employees and retirees. We are grateful for the dedicated service of all of our trustees.
Trustee willingness to accept the substantial responsibilities of directing system administration is a great service to the state and to the members served by TRS. TRS trustees and staff are keenly focused on prudent pension trust fund portfolio management and efficient, serviceoriented delivery of valuable retirement and related benefits for public education employees and retirees. We are pleased to report on operational results for the year and to acknowledge the substantial support of state leadership, trustees, members, interested associations, and TRS staff. Respectfully submitted, Brian K. Guthrie Executive Director Introductory Section 9 .
Organization Chart Chief Audit Executive Amy Barrett TRS Board of Trustees Director of Strategic Initiatives Rebecca K. Merrill Governmental Relations Ray Spivey Chief Investment Officer T. Britton Harris IV Chief Benefit Officer Barbie Pearson Executive Director Brian K. Guthrie Deputy Director Ken Welch General Counsel Carolina de Onís Chief Financial Officer Don Green Chief Information Officer Chris Cutler Communications Howard J. Goldman Introductory Section 10 Human Resources Janet L. Bray Chief Health Care Officer Katrina Daniel . Staff and Advisors EXECUTIVE ADMINISTRATIVE STAFF Brian K. Guthrie, Executive Director INVESTMENT ADVISORS Ken Welch, Deputy Director Keith C. Brown, Ph.D., Austin T. Britton Harris IV, Chief Investment Officer Carolina de Onís, General Counsel AUDIT SERVICES Amy L.
Barrett, Chief Audit Executive Texas State Auditor’s Office, Austin Barbie Pearson, Chief Benefit Officer Don Green, Chief Financial Officer FIDUCIARY COUNSEL Chris Cutler, Chief Information Officer Reinhart Boerner Van Deuren, S.C., Howard J. Goldman, Director, Communications Milwaukee, WI Ray Spivey, Director, Governmental Relations Janet L. Bray, Director, Human Resources MEDICAL BOARD Katrina Daniel, Chief Health Care Officer Dr.
Alice Cox, Fredericksburg Rebecca K. Merrill, Director, Strategic Initiatives Dr. James Reinarz, Austin Dr.
Larry D. Wilson, Austin GENERAL INVESTMENT CONSULTANT Aon Hewitt Investment Consulting, Inc. TEXAS PUBLIC SCHOOL RETIRED EMPLOYEES GROUP INSURANCE PROGRAM ADVISORY COMMITTEE Chicago, IL Bill Barnes, Haslet CONSULTING ACTUARY Donnie Breedlove, Ed.D., Dallas Gabriel, Roeder, Smith & Company, Dallas Sunday McAdams, Seymour Marcia McNeil, Austin INVESTMENT CONSULTANTS Glenna Purcell, Eagle Pass Albourne America, L.L.C., San Francisco, CA Active Teacher Position, Vacant (Absolute Return) Active Administrator Position, Vacant BlackRock Investment Management, L.L.C., New York, NY (Private Equity Co-investments) Active Auxiliary Staff Position, Vacant Retired Auxiliary Staff Position, Vacant Green Street Advisors, Inc., Newport Beach, CA (Real Estate) HEALTH CARE CONSULTANT Hamilton Lane Advisors, L.L.C., San Francisco, CA and Bala Cynwyd, PA Gabriel, Roeder, Smith & Company, Dallas (Private Equity) Leading Edge Investment Advisors, L.L.C., San Francisco, CA (Emerging Managers) The Townsend Group, Inc., Cleveland, OH (Real Estate) Tudor Pickering Holt & Co., L.L.C., Houston, TX (Energy and Natural Resources) MASTER CUSTODIAN AND SECURITIES LENDING AGENT State Street Bank and Trust Company, Boston, MA PERFORMANCE MEASUREMENT State Street Bank and Trust Company, Boston, MA Introductory Section 11 . Membership PENSION TRUST FUND Membership of the Teacher Retirement System of Texas includes employees and retirees of state-supported educational institutions in Texas. At August 31, 2015, participating employers included the following: Public School Districts Charter Schools Community and Junior Colleges Senior Colleges and Universities Regional Service Centers Medical Schools Other Education Districts State Agencies Member Categories Current Members: Active Contributing Active Non-contributing* Deferred Retirement Option Inactive Non-vested Inactive Vested Total Current Members Retirement Recipients: Service Disability Survivor Total Retirement Recipients TOTAL MEMBERSHIP 1,025 189 50 48 20 9 5 1 1,347 2015 2014 828,851 94 161,295 91,265 1,081,505 873,214 118,635 122 19,489 39,965 1,051,425 355,384 9,495 12,859 377,738 1,459,243 341,302 9,413 12,467 363,182 1,414,607 * For 2015, Active Non-contributing will not be presented as a category. These members are allocated to either Inactive Non-vested or Inactive Vested. Population Changes Active Membership: New Members Members Withdrawing Service Retirements Disability Retirements In-Service Deaths Other Changes NET INCREASE Retired Membership: Retirements Deaths After Retirement Option Continuations Other Changes NET INCREASE 2015 2014 96,854 (38,519) (20,247) (777) (1,267) (5,964) 30,080 92,819 (40,829) (20,214) (811) (1,289) 337 30,013 21,024 (8,138) 2,331 (661) 14,556 21,025 (7,535) 2,372 (908) 14,954 Active Member Profile Average Annual Salary Average Age Average Years of Service Annuitant and Beneficiary Profile Average Monthly Annuities Life Annuities Disability Annuities Annuities Certain Average Age of Current Retirees Average Age at Retirement All Retirees Current Year Retirees Average Years of Service All Retirees Current Year Retirees Average Salary at Retirement All Retirees Current Year Retirees Ratio of Current Members to Retirees 2015 $44,787 44.6 10.3 2014 $45,717 44.5 9.9 2015 2014 $2,012 $1,226 $1,075 70.8 $1,995 $1,217 $1,081 70.6 60.0 61.7 60.0 61.5 24.4 23.2 24.4 23.1 $42,962 $50,813 $42,161 $50,073 2.9 to 1 2.9 to 1 TEXAS PUBLIC SCHOOL RETIRED EMPLOYEES GROUP INSURANCE PROGRAM (TRS-CARE) Membership of TRS-Care is eligible to TRS public school retirees. Member Categories Retirees Surviving Spouses Surviving Children Dependent Spouses and Children TOTAL 2015 194,619 6,071 105 52,236 253,031 2014 189,028 5,910 97 49,749 244,784 TEXAS ACTIVE SCHOOL EMPLOYEES UNIFORM GROUP BENEFITS PROGRAM (TRS-ACTIVECARE) Membership of TRS-ActiveCare includes employees of public school districts, open enrollment charter schools, regional service centers and other educational districts. Member Categories Employees Dependents TOTAL 2015 290,354 187,887 478,241 2014 279,014 180,218 459,232 As of August 31, 2015 there were 1,110 participating employers. Introductory Section 12 . Membership Using the data presented on the previous page, the following presents a graphical view of the growth of the System for Current Members, Retirement Recipients, TRS-Care and TRS-ActiveCare as of August 31, 2015. Pension Trust Fund Current Members Thousands TRS-CARE Membership by Year Thousands 1,100 260 1,080 250 240 1,060 230 1,040 220 1,020 210 1,000 200 190 980 2010 Thousands 2011 2012 2013 2014 2010 2015 Pension Trust Fund Retirement Recipients 2012 2013 2014 2015 2014 2015 TRS-ACTIVECARE Membership by Year Thousands 400 2011 500 375 480 350 460 325 440 300 420 275 250 2010 2011 2012 2013 2014 2015 400 Introductory Section 13 2010 2011 2012 2013 . Communications During fiscal year 2015, TRS communicated with members, retirees, participating employers, and the general public over the telephone as well as through group presentations, one-on-one meetings, print publications, webcasts, videos, social media, the agency’s website, and email. TRS staff also spoke at conferences across the state to update members and retirees on their pension and health care benefits as well as TRS investment performance. Major communications from the past year are summarized below: PRINT PUBLICATIONS During fiscal year 2015, TRS published three TRS News issues to provide members and retirees with important information relating to their benefits. The summer 2015 issue described TRS-related legislative changes enacted into law. Employers received TRS-related information through nine Update newsletters.
Annual statements were distributed in October 2014 to all active members of the system. TRS also published a number of publications for members and retirees, including brochures and other materials related to TRS pension and health care benefits. THE INTERNET Over the past year, the TRS website received a total of 3,328,859 visits, representing a 9.7 percent increase from 3,033,862 visits in the previous fiscal year. In addition, 1,732,348 unique visitors used the site during fiscal year 2015 — a 9.6 percent increase from 1,580,841 visitors in fiscal year 2014. MyTRS was promoted during the year through email, newsletter articles, social media, and the agency website. As of Aug. 31, 2015, 490,739 members and retirees had registered to participate in MyTRS, nearly 70,000 more than in the previous year. In 2015, significant online improvements were being developed through the TRS Enterprise Application Modernization (TEAM), a multi-year initiative to update business processes and core technologies used by TRS.
While TEAM will ultimately bring enhanced customer service, members experienced temporary, minimal reductions in MyTRS functionality during the year as work on TEAM progressed. As a result, it was temporarily not possible to access the following information online in 2015: • members’ beneficiary information • service purchase forms (once they have been created for a bill) and • replacement retirement packets (still available by contacting TRS directly) During the past year, TRS also developed a detailed approach to guide a redesign of the TRS website. A contract to develop and implement a redesigned website was awarded to a contractor in the fall of 2015. SOCIAL MEDIA In 2014-15, TRS broadened its engagement through social media with a growing number of members, retirees, and others. In fiscal year 2015, TRS recorded more than 7,860 Facebook likes, 2,200 followers on LinkedIn and 1,800 followers on Twitter.
In addition, TRS videos were viewed 81,334 times on YouTube. During the year, TRS expanded its use of LinkedIn to attract and recruit new employees through a new Career Page managed by Human Resources. At fiscal year-end, TRS heavily promoted a student art contest (kindergarten through fifth grade) to select art work for use in this publication. Submission of art work was slated for September, and voting on Facebook for best art among finalists was scheduled for October. Introductory Section 14 .
Communications WEBCASTING OF BOARD MEETINGS As part of its commitment to open and transparent communication, TRS continued to webcast board meetings during the past year. All board meetings are streamed live so members and others can watch the proceedings as they take place from anywhere in Texas or around the world. Each meeting is also recorded for on-demand playback. All TRS board meetings are archived on the TRS website where individual agenda items can be easily accessed through an online catalog.
In late fiscal year 2015, TRS announced plans to conduct an October webcast town hall meeting to discuss the sustainability and affordability of TRS-Care and TRS-ActiveCare. ASSOCIATION MEETINGS Early in the fiscal year, TRS continued its outreach to members and retirees through a series of Texas Retired Teacher Association meetings. TRS officials spoke to retirees at more than 20 conventions around the state and provided updates on TRS developments. These meetings provide an opportunity for TRS representatives to meet with members and retirees face-to-face and answer any questions they may have.
Legislators or their representatives from the area also frequently attend the meetings. GROUP PRESENTATIONS AND INDIVIDUAL RETIREMENT COUNSELING SESSIONS Over the past year, TRS made a number of group presentations to professional associations, employee and retiree groups and at regional education service centers. Presentations focused on retirement options, health care benefits for active and retired members, long-term care insurance, employment after retirement, and other TRS benefits. A total of 11,405 people attended 173 group presentations, and 20,800 people attended five conventions where TRS was represented.
In addition, 9,300 people visited individually with a TRS counselor – 8,883 in Austin and 417 in field office visit locations. Fiscal year 2015 was the ninth year that one-on-one retirement counseling sessions were offered in limited field locations throughout Texas (450 available appointments in 10 cities). TELECOMMUNICATIONS In fiscal year 2015, the agency’s Benefit Counseling department handled a total of 486,572 calls. In addition, 181,117 calls were completed during the past year within the agency’s automated telephone system. TRS and its contractors also provided telephone assistance to a large number of members seeking health care-related information. TRS-ActiveCare staff and contractors responded to 460,407 calls, and TRS-Care staff and contractors responded to 589,547 calls. COORDINATION WITH REPORTING ENTITIES The TRS Reporting and Query System (TRAQS), the agency’s internet-based reporting system for employers, had 1,362 reporting entities submit monthly reports to TRS by year end.
During the year, eight professional association and software user group presentations were attended by 420 people. One conference exhibit booth was attended by more than 2,000 school business staff, and one webinar was recorded and posted to the TRS website. In addition, a webinar in partnership with TASBO (Texas Association of School Business Officials) was recorded.
One participating employer traveled to TRS for onsite training, and one face-to-face conference training session was conducted with a reporting official. Twenty-six TRS-ActiveCare training seminars were conducted around the state for more than 1,200 benefit administrators of TRS-ActiveCare participating employers. Additionally, 10 webinars were conducted with 185 registered participants. For 2015, YouTube tutorials were also offered with 3,245 total views, as well as, on-demand voiceover webinars were offered to plan participants. There were 2,643 people who viewed the English version and 261 people who viewed the Spanish version.
These seminars/webinars provided information regarding enrollment, changes and ongoing administrative issues for TRS-ActiveCare. Introductory Section 15 . This page is intentionally left blank. Introductory Section 16 . FINANCIAL SECTION . This page is intentionally left blank. Financial Section 18 . Financial Section 19 . Financial Section 20 . Financial Section 21 . Financial Section 22 . Management’s Discussion and Analysis The following is Management’s Discussion and Analysis (MD&A) of the Teacher Retirement System’s (TRS or system) financial performance for the fiscal year ended August 31, 2015. The information presented here should be considered in conjunction with other areas of the Financial Section as well as information presented in the Executive Director’s Letter of Transmittal in the Introductory Section of the TRS Comprehensive Annual Financial Report. FINANCIAL HIGHLIGHTS The net position of the TRS Pension Trust Fund was $128.5 billion as of August 31, 2015, a decrease of 3.2%, in fiscal year 2015. ï‚· As of August 31, 2015, the date of the most recent actuarial valuation, the TRS Pension Trust Fund’s ratio of actuarial assets, as a percentage of actuarial liabilities, was 80.2%, which is the same as the level at August 31, 2014. The unfunded actuarial accrued liability was $33 billion, which is more than the $31.6 billion reported at August 31, 2014. ï‚· The annual rate of return on investments for the pension fund for the year ended August 31, 2015 was (0.27%). The rate of return for fiscal year 2014 was 16.9%. ï‚· The net position of TRS-Care was $972.9 million as of August 31, 2015, an increase of $515 million from fiscal year end 2014. ï‚· As of August 31, 2015, the date of the most recent actuarial valuation, TRS-Care trust fund’s unfunded actuarial accrued liability was $43.2 billion, which is more than the $33.3 billion reported at August 31, 2014. ï‚· TRS-ActiveCare had a net position of $87.8 million as of August 31, 2015, an increase of $65.0 million or 285% in fiscal year 2015. OVERVIEW OF THE FINANCIAL STATEMENTS This discussion and analysis is intended to serve as an introduction to the TRS financial presentation, which consists of the following components: ï‚· Fund financial statements ï‚· Notes to the financial statements ï‚· Required supplementary information ï‚· Other supplementary schedules Collectively, this information presents the net position available for pension and other post-employment benefits, health care benefits, and other purposes as of August 31, 2015, and summarizes any changes in net position for the year then ended. The information available in each of these sections is summarized as follows: Fund Financial Statements Individual fund financial statements are presented for all fiduciary and proprietary funds as of August 31, 2015 and for the year then ended.
Comparative data in total as of August 31, 2014, and for the year then ended has also been presented with the exception of agency funds. These financial statements reflect the resources available to pay benefits to retirees Financial Section 23 . Management’s Discussion and Analysis and other beneficiaries, to pay health care benefits for covered participants, and to administer the 403(b) Administrative Program. Fiduciary funds presented include the Pension Trust Fund, TRS-Care and Agency Funds. Fiduciary funds are used to account for resources held for the benefit of parties outside of TRS. Proprietary funds account for business-type activities and include the TRS-ActiveCare and the non-major 403(b) Administrative Program enterprise funds. Notes to the Financial Statements The financial statement notes provide additional information that is essential to a full understanding of the data provided in the fund financial statements.
Information available in the notes to the financial statements is described below: ï‚· Note 1 provides a summary of significant accounting policies, including the basis of accounting, budgets and appropriations, explanations of major asset and liability classes, and legal reserve account information. Also included is a general description of TRS as well as a description of each of the funds administered by TRS. ï‚· Note 2 provides information on capital assets. ï‚· Note 3 describes deposits and investments, including investing authority, investment risk categorizations, and additional information about cash, derivatives, securities lending, alternative investments and contingent commitments. ï‚· Note 4 provides information on employee compensable leave. ï‚· Note 5 provides information on the operating lease. ï‚· Note 6 provides information on fringe benefits paid by the state and federal government on behalf of employees and participants of the health care plans. ï‚· Note 7 describes deferred compensation plans available to TRS employees. ï‚· Note 8 provides information on contingent liabilities such as TRS employees’ accumulated sick leave, lump sum death benefits, incentive compensation, retiree benefits and any pending litigation. ï‚· Note 9 addresses TRS’ continuance subject to review under the Texas Sunset Act. ï‚· Note 10 describes other post-employment health care benefits provided to TRS’ employees and retired public school employees, contributions to the plan and its funded status. ï‚· Note 11 addresses risk management issues related to the health benefits program for active school district employees. ï‚· Note 12 provides pension disclosure information including detailed data on the plan description, contributions, legal reserve balances and the net pension liability. ï‚· Note 13 provides information on subsequent events. Required Supplementary Information Required supplementary information for the pension plan consists of schedules related to the net pension liability, contributions from employers and the non-employer contributing entity, and the annual money weighted rate of return on pension plan investments. RSI for the other employee benefit plan administered by TRS includes schedules related to the funding progress and the contributions from the participating employers.
Also included in this component is Management’s Discussion and Analysis. Other Supplementary Schedules Other schedules include information on agency funds, changes in statutory reserve account balances, schedule of administrative expenses, investing activity expenses, and payments to consultants. Financial Section 24 . Management’s Discussion and Analysis FINANCIAL ANALYSIS OF TRS FUNDS Pension and Other Employee Benefit Trust Funds Pension Trust Fund Net position held in trust for benefits at August 31, 2015 was $128.5 billion, a decrease of $4.3 billion from the $132.8 billion at August 31, 2014. Billions Pension Trust Fund Net Position Fiscal Years 2014-15 $140 $135 $130 $125 $120 $115 $110 1Q14 2Q14 3Q14 4Q14 1Q15 2Q15 3Q15 4Q15 FY 2014-15 Refer to the following page for a graph of Additions to Net Position. Fiscal year 2015 investment loss was $412.8 million, a decrease of $19.8 billion from the $19.4 billion gain in fiscal year 2014. Current year income from member contributions was $2.6 billion while state contributions and other additions totaled $3 billion. Total contributions and other additions increased $580.3 million, or 11.5%, during fiscal year 2015.
An increase in the member contribution rate from 6.4% in fiscal year 2014 to 6.7% in fiscal year 2015, the new employer surcharge for employees not covered by social security and normal payroll growth resulted in an increase in total contributions. The state contribution rate remained at 6.8% for fiscal year 2015. Financial Section 25 . Management’s Discussion and Analysis Millions $22,500 $20,000 $17,500 $15,000 $12,500 $10,000 $7,500 $5,000 $2,500 $0 -$2,500 Pension Trust Fund Additions to Net Position Fiscal Years 2014-15 19,434 3,045 2,683 2,576 2,358 FY 2015 FY 2014 -413 Investments Member State & Other Deductions from TRS net position held in trust for benefits are predominantly retirement, death, and survivor benefit payments. During fiscal year 2015, retirement benefits and other payments totaled $9 billion, an increase of approximately $390.3 million, or 4.5%, from fiscal year 2014 payments of $8.6 billion. Refunds of Contributions for fiscal year 2015 were $391.3 million, a decrease of $19.3 million from fiscal year 2014. Administrative expenses were $35.6 million, a decrease of $6.3 million from fiscal year 2014.
Administrative expenses, excluding investing activities expense, on a cost per member basis were $24.37 for fiscal year 2015 as compared to $29.62 in fiscal year 2014. Investment cost per member was $177.63 for fiscal year 2015. Investment expense in basis points of net position was 19.75 for fiscal year 2015 and was calculated using average net asset value.
Investment expense in basis points for fiscal year 2014 was 15.94. Millions Pension Trust Fund Deductions from Net Position Fiscal Years 2014-15 $10,500 9,021 8,631 $9,000 $7,500 $6,000 $4,500 $3,000 $1,500 391 411 36 $0 FY 2015 Benefits FY 2014 Refunds Administration Financial Section 26 42 . Management’s Discussion and Analysis Growth of the System - As of August 2015, the monthly annuity payroll had grown to $719 million, and TRS was paying benefits to 377,738 recipients. Refer to the following graph for details on benefit payments by type of recipient. Service recipients include retirees and beneficiaries receiving continuing monthly annuity payments. Disability recipients are disabled members who are receiving continuing monthly disability payments. Survivor recipients are beneficiaries who have elected to receive death benefits in the form of monthly benefits.
The number of retiree accounts increased by 14,556 during fiscal year 2015. Of the current TRS member accounts, 828,945 (active contributing and deferred retirement option participants) were employed during fiscal year 2015 and made contributions to the system. The remaining 252,560 members are no longer employed by TRS covered employers, but have maintained their membership in TRS by leaving their contributions with the system. The number of current member accounts increased by 30,080 during fiscal year 2015. Total Annual Benefit Payments Billions $8.55 $9 $7.73 $8 $7 $6.62 2013 2014 2015 $8.08 2012 $8.94 $7.18 $6 $5 $4 $3 $2 $1 $0 2010 2011 Service, Disability & Survivor Partial Lump Sum Option Deferred Retirement Option TRS Enterprise Application Modernization (TEAM) is the name for the related projects that will modernize TRS technologies, allowing greater flexibility in providing service to TRS membership and reducing the risk of obsolete technology. The TEAM project is currently in progress and will replace TRS' current mainframe-based pension administration systems. The Data Management project is responsible for preparing TRS legacy data for migration to the LOB system.
It includes three sub-projects: Data Assessment, Data Conditioning and Data Migration. The Website Redesign project is expected to kick-off during the first quarter of fiscal year 2016. This project will redesign the TRS external website making it more user-friendly. Increased functionality, up-to-date content, and a more modern look will benefit our site visitors and members.
Easy access to information and self-service features should encourage and increase online business. TRS continues to explore accounting solutions that will replace our “in-house” developed financial legacy systems. Our goal is to select a product that best meets our current and future business and technology needs and provides the best overall value. Financial Section 27 . Management’s Discussion and Analysis Statement of Net Position - Pension Trust Fund (Dollars in Thousands) Fiscal Year 2015 Fiscal Year 2014 Dollar Change Percentage Change $3,311,486 127,042,429 19,372,422 53,725 $149,780,062 $2,751,967 131,595,107 22,876,579 38,054 $157,261,707 $559,519 (4,552,678) (3,504,157) 15,671 ($7,481,645) 20.3 % (3.5) (15.3) 41.2 (4.8) % $760,271 1,053,106 48,495 19,379,484 $21,241,356 $128,538,706 $747,291 799,099 66,198 22,869,876 $24,482,464 $132,779,243 $12,980 254,007 (17,703) (3,490,392) ($3,241,108) ($4,240,537) 1.7 % 31.8 (26.7) (15.3) (13.2) % (3.2) % Fiscal Year 2015 $2,576,024 1,591,483 1,377,973 75,028 (412,759) $5,207,749 Fiscal Year 2014 $2,357,686 1,530,624 984,552 167,392 19,434,430 $24,474,684 Dollar Change $218,338 60,859 393,421 (92,364) (19,847,189) ($19,266,935) Percentage Change 9.3 % 4.0 40.0 (55.2) (102.1) (78.7) % $9,021,388 391,341 35,557 $9,448,286 ($4,240,537) $8,631,080 410,601 41,904 $9,083,585 $15,391,099 $390,308 (19,260) (6,347) $364,701 ($19,631,636) 4.5 % (4.7) (15.1) 4.0 % (127.6) % Assets Cash and Receivables Investments Invested Securities Lending Collateral Capital Assets TOTAL ASSETS Liabilities Benefits Payable Investments Purchased Payable/Securities Sold Short Accounts Payable and Other Collateral Obligations TOTAL LIABILITIES Total Net Position Restricted for Pensions Changes in Net Position - Pension Trust Fund (Dollars in Thousands) Additions Member Contributions State Contributions as Non-Employer Contributing Entity Employer Contributions Other Investment Income/Loss TOTAL ADDITIONS Deductions Retirement Benefits and Other Refunds of Contributions Administrative Expenses TOTAL DEDUCTIONS Change in Net Position On a GAAP basis, the overall financial condition of the fund declined during 2015 due to a net investment loss during the year of $412.8 million – a decrease in investment earnings of 102.1% from fiscal year 2014. This net loss is comprised of a net decrease in fair value of investments of $7.1 billion, $6.9 billion in interest and dividend income, and net income of $81.9 million from securities lending reduced by investing activity expenses of $259.2 million. The net investment income for fiscal year 2014 was $19.4 billion. Financial Section 28 . Management’s Discussion and Analysis Investments - Investment performance is calculated using a time-weighted rate of return. Returns are calculated by State Street Bank and Trust Company, the system’s custodian bank, using industry best practices. When comparing returns, it is important to remember that as a pension fund, the TRS investment performance has a very long horizon. Below are rate of return results for the total fund for the period ending August 31, 2015: • • • • One-Year Three-Years Five-Years Ten-Years -0.3% 8.3% 9.6% 6.2% The following table presents the actual investment allocations as of fiscal year end 2015 and 2014 as compared to the target allocations for 2015 and 2014: U.S. U.S. Large Cap U.S.
Small Cap Non-U.S. Developed Emerging Markets Directional Hedge Funds Fiscal Year 2015 Target Actual 19.8 % 20.6 N/A N/A N/A N/A 14.8 15.8 10.3 8.9 4.6 4.9 Public Equity Private Equity 49.5 11.8 TOTAL GLOBAL EQUITY U.S. Treasuries Absolute Return Stable Value Hedge Funds Cash TOTAL STABLE VALUE 61.3 12.8 0.0 4.0 1.0 17.8 % % 4.8 12.3 % Global Inflation Linked Bonds Real Assets Energy and Natural Resources Commodities TOTAL REAL RETURN TOTAL RISK PARITY TOTAL 1.6 0.0 18.7 % 50.2 12.5 % 50.0 11.0 62.7 8.7 2.3 4.2 0.5 15.7 % % 4.6 12.9 % % 1.8 0.2 19.5 2.2 % 100.0 % Fiscal Year 2014 Target Actual N/A % N/A 18.0 20.5 2.0 2.2 15.0 14.9 10.0 11.8 5.0 4.9 % % % 5.0 13.0 % % 2.1 % 100.0 % Financial Section 29 54.3 11.8 61.0 13.0 0.0 4.0 1.0 18.0 3.0 0.0 21.0 % % 66.1 8.8 1.6 3.8 1.3 15.5 % % 4.8 11.6 % % % 1.9 0.1 18.4 % N/A % N/A % 100.0 % 100.0 % .
Management’s Discussion and Analysis These asset allocation investment categories and targets are determined by and subject to the system’s investment policy guidelines which are reviewed and adjusted by the board as necessary to aid the fund in achieving the long-term portfolio return of 8 percent. TRS had an annual rate of return of -0.27 percent for the fiscal year of 2015 on investments. At the end of fiscal year 2015 the Pension Trust Fund’s investment value was $127.9 billion*, a decrease of approximately $4.3 billion from fiscal year 2014. TRS follows a diversified investment approach that focuses on the three most common economic scenarios. TRS is positioned to take advantage of any of these various market scenarios.
TRS is allocated 61.3% to Global Equity markets, which perform well under favorable Gross Domestic Product (GDP) growth and moderate inflation, 18.7% to Real Return, which should perform well in low GDP growth and high inflation, 17.8% to a Stable Value portfolio, which should perform well and minimize downside risk in stagnant GDP growth and low inflation, and 2.2% to the Risk Parity strategy, which has a balanced exposure to all three economic scenarios. Looking ahead, return expectations remain muted in the years ahead. Concerns about the resilience of global growth remain, with China’s slowdown taking an increasingly prominent role on the world stage.
In addition to China policy actions, much of the market’s focus going forward will be on the monetary policy actions of the world’s major central banks, with the Federal Reserve expected to begin raising short-term interest rates in late 2015 or early 2016, while the European Central Bank and the Bank of Japan are expected to remain accommodative. Pension Trust Fund Investments Value as of August 31, 2015 $127,942,530,426 (chart rounded to millions) * Note: Differences between the Total Investment Value above and Total Investments on Exhibit I are due to differences in reporting methodologies. The Total Investment Value includes Investment Related cash, Net Investment Receivables/Payables and Securities Sold Short. In accordance with GASB, these are not reported on this page with Total Investments.
Additionally, Total Investments on this page includes a short-term asset pool adjustment from Amortized Cost to Fair Value that is not included here. A complete reconciliation of the two values is located on the Investment Summary Market Values page in the Investment Section. Financial Section 30 . Management’s Discussion and Analysis TRS-Care The net position of TRS-Care at August 31, 2015 was $972.9 million, an increase of $515 million from the $457.9 million at August 31, 2014. Additions to net position include premium contributions received from retirees, contributions received from active members, participating employers and the state, federal revenue and investment earnings. Total contributions of $682.3 million increased by $32.5 million from the $649.8 million in fiscal year 2014 due to normal payroll growth. TRS-Care received $768 million in funding by the 2015 legislature under House Bill 2, a supplemental appropriations bill for the 2016-17 biennium. Retiree premiums of $369.1 million in fiscal year 2015 increased $5.4 million from fiscal year 2014 due to growth in the retiree population. Federal revenue received in fiscal year 2015 includes Retiree Drug Subsidy (RDS) payments totaling $14 million and Employer Group Waiver Plan subsidy payments totaling $112.8 million.
Investment income was $1.5 million, a decrease of $566 thousand from the $2.1 million in fiscal year 2014. Cash in the State Treasury increased $464.3 million in fiscal year 2015. Deductions from net position totaled $1.7 billion during fiscal year 2015. This is an increase of $240.3 million or 16.9% over the $1.4 billion in fiscal year 2014.
The change is principally due to a substantial increase in Medicare Advantage (insured plan) premiums. Administrative expenses increased by 3.4% from fiscal year 2014. Deductions for Affordable Care Act mandated Patient-Centered Outcomes Research Institute (PCORI) and Transitional Reinsurance Program fees totaled $4.5 million.
The PCORI fees support research on clinical effectiveness of medical treatments. The Transitional Reinsurance Program provides support to insurers of high risk individuals from 2014 to 2016. Millions TRS-Care Net Position Fiscal Years 2014-15 $1,050 $950 $850 $750 $650 $550 $450 $350 $250 $150 $50 1Q14 2Q14 3Q14 4Q14 1Q15 2Q15 3Q15 4Q15 FY 2014-15 Financial Section 31 . Management’s Discussion and Analysis Statement of Net Position - TRS-Care (Dollars in Thousands) Fiscal Year 2015 Fiscal Year 2014 Dollar Change Percentage Change Assets Cash and Receivables TOTAL ASSETS $1,134,174 $1,134,174 $594,921 $594,921 $539,253 $539,253 90.6 % 90.6 % $2,651 158,604 $161,255 $972,919 $770 136,211 $136,981 $457,940 $1,881 22,393 $24,274 $514,979 244.3 % 16.4 17.7 % 112.5 % Liabilities Accounts Payables and Other Health Care Claims Payables TOTAL LIABILITIES Total Net Position Changes in Net Position - TRS-Care (Dollars in Thousands) Fiscal Year 2015 Fiscal Year 2014 Dollar Change Percentage Change Additions Member Contributions State Contributions Participating Employers and Other Contributions Health Care Premiums Rebates and Discount Income Federal Revenue Investment Income Supplemental Appropriation from State TOTAL ADDITIONS $198,196 281,098 $189,004 267,498 $9,192 13,600 4.9 % 5.1 202,977 369,066 231,569 126,807 1,496 768,101 $2,179,310 193,264 363,631 200,860 78,589 2,062 36,058 $1,330,966 9,713 5,435 30,709 48,218 (566) 732,043 $848,344 5.0 1.5 15.3 61.4 (27.4) 2,030.2 63.7 % $1,613,181 42,873 4,508 3,769 $1,664,331 $514,979 $1,375,040 41,912 3,476 3,646 $1,424,074 ($93,108) $238,141 961 1,032 123 $240,257 $608,087 17.3 % 2.3 29.7 3.4 16.9 % 653.1 % Deductions Health Care / Insurance Premium and Payments Health Care Claims Processing Health Care Fees Administrative Expenses TOTAL DEDUCTIONS Change in Net Position Financial Section 32 . Management’s Discussion and Analysis Enterprise Funds TRS-ActiveCare The TRS-ActiveCare program operates under the authority of the Texas Insurance Code, Title 8, Subtitle H, Chapter 1579 and the Texas Administrative Code, Title 34, Part 3, Chapter 41, and began operations in fiscal year 2003. The Net Position of the plan was $87.8 million at the end of fiscal year 2015, an increase of $65 million or 285% from fiscal year 2014. Revenues for fiscal year 2015 included $1.9 billion from health care premiums, an increase of $15.1 million, or 0.8% over fiscal year 2014. This was due to an increase in plan participation. Investment income for the year was $1.5 million, an increase of $597 thousand, or 63.5% from fiscal year 2014.
Other revenues for 2015 totaled $237 thousand, an increase of $18 thousand from fiscal year 2014. Health care claims for fiscal year 2015 were $1.6 billion, a $43.4 million, or 2.9% increase over the $1.5 billion in fiscal year 2014. Other expenses included claims processing costs of $113 million, $178.2 million for HMO premium payments, and $2.2 million for administrative expenses. Health care fees mandated by the Affordable Care Act totaled $22 million. Millions TRS-ActiveCare Net Position Fiscal Years 2014-15 $225 $175 $125 $75 $25 -$25 -$75 1Q14 2Q14 3Q14 4Q14 1Q15 2Q15 3Q15 4Q15 FY 2014-15 Financial Section 33 .
Management’s Discussion and Analysis Statement of Net Position - TRS-ActiveCare (Dollars in Thousands) Fiscal Year 2015 Fiscal Year 2014 Dollar Change Percentage Change Assets Cash and Receivables TOTAL ASSETS $370,343 $370,343 $230,641 $230,641 $139,702 $139,702 60.6 % 60.6 % $262 715 28,177 253,374 $282,528 $87,815 $386 ($124) 715 15,444 58,691 $74,726 $64,976 -32.4 % Liabilities Accounts Payable and Other Unearned Premium Revenue Premiums and Fees Payable Health Care Claims Payable TOTAL LIABILITIES Total Net Position 12,733 194,683 $207,802 $22,839 121.3 30.1 36.0 % 284.5 % Statement of Revenues, Expenses, and Changes in Net Position - TRS-ActiveCare (Dollars in Thousands) Fiscal Year 2015 Fiscal Year 2014 Dollar Change Percentage Change $1,943,949 1,537 237 $1,945,723 $1,928,895 940 219 $1,930,054 $15,054 597 18 $15,669 0.8 % 63.5 8.2 0.8 % $1,565,256 113,032 22,041 178,192 2,226 $1,880,747 $64,976 $1,521,835 90,680 19,245 154,914 2,570 $1,789,244 $140,810 $43,421 22,352 2,796 23,278 -344 $91,503 ($75,834) 2.9 % 24.6 14.5 15.0 -13.4 5.1 % -53.9 % Revenues (Operating and Non-Operating) Health Care Premiums Investment Income Other Revenue TOTAL REVENUE Operating Expenses Health Care Claims Health Care Claims Processing Health Care Fees Premium Payments to HMO's Administrative Expenses TOTAL EXPENSES Change in Net Position Financial Section 34 . Management’s Discussion and Analysis REQUEST FOR INFORMATION This financial report is designed to provide a general overview of the Teacher Retirement System for those with an interest in the system’s finances. Questions concerning any of the information provided in this report or requests for additional information should be addressed to the Communications Department of the Teacher Retirement System, 1000 Red River Street, Austin, Texas 78701. Please also refer to our website at www.trs.texas.gov. Financial Section 35 . Statement of Fiduciary Net Position AS OF AUGUST 31, 2015 (With Comparative Data for August 31, 2014) Fiduciary Fund Types Pension and Other Employee Benefit Trust Funds Exhibit I Pension Trust Fund ASSETS Cash Cash in State Treasury Cash in Bank (Note 3A) Cash on Hand (Note 3B) TOTAL CASH $ Invested Securities Lending Collateral Capital Assets (Note 2) Intangible Assets Less Accumulated Amortization Depreciable Assets Less Accumulated Depreciation Non-Depreciable Assets TOTAL CAPITAL ASSETS TOTAL ASSETS 967,123,065 398,825,412 3,087,674 1,369,036,151 $ 860,109,505 $ 860,109,505 1,364,937,789 214,892,040 1,117,028 26,393,340 204,844,527 128,204,905 1,711,632 66,819 281,662 1,942,449,742 $ $ $ 3,373,532,192 86,385 47,167,558,671 21,563,259,009 48,186,507,871 65,340,265 6,686,145,072 127,042,429,465 $ 0 $ 19,372,421,460 $ 0 $ 10,569,751 (9,499,614) 55,987,505 (30,368,999) 27,036,363 53,725,006 149,780,061,824 $ $ Receivables (Note 1F) Sale of Investments Interest and Dividends Member and Retiree Service Credit Purchases Participating Employers Due from State's General Fund Due from Employees Retirement System of Texas Prepaid Expenses and Deposits Other TOTAL RECEIVABLES Investments (Note 1F and 3E) Short-Term Short-Term Foreign Currency Contracts Equities Fixed Income Alternative Investments Derivative Investments Pooled Investments TOTAL INVESTMENTS TRS-Care $ $ $ $ $ Financial Section 36 317,174 47,103,564 10,836,320 33,566,874 $ $ $ 182,240,712 274,064,644 0 1,134,174,149 . Fiduciary Fund Types Total Pension and Other Employee Benefit Trust Funds 2015 $ 2014 1,827,232,570 398,825,412 3,087,674 2,229,145,656 $ 1,364,937,789 215,209,214 48,220,592 26,393,340 215,680,847 161,771,779 1,711,632 66,819 182,522,374 2,216,514,386 $ $ $ 3,373,532,192 86,385 47,167,558,671 21,563,259,009 48,186,507,871 65,340,265 6,686,145,072 127,042,429,465 $ $ $ $ $ $ $ $ $ $ Agency Funds Child Support Employee Deductions 1,332,743,714 297,354,404 2,526,510 1,632,624,628 $ 6,599 $ 6,599 949,152,042 217,654,084 45,422,289 42,096,484 204,151,629 129,084,870 1,540,855 $ 125,162,030 1,714,264,283 $ 0 $ $ 3,932,153,291 (37,174) 52,316,260,451 23,475,157,395 44,345,750,419 93,701,725 7,432,120,860 131,595,106,967 $ 0 19,372,421,460 $ 22,876,578,455 $ 0 10,569,751 (9,499,614) 55,987,505 (30,368,999) 27,036,363 53,725,006 150,914,235,973 $ 10,159,743 (8,968,661) 53,814,541 (27,444,410) 10,493,166 38,054,379 157,856,628,712 $ $ $ $ 0 $ 6,599 (to next page) Financial Section 37 . Statement of Fiduciary Net Position AS OF AUGUST 31, 2015 (With Comparative Data for August 31, 2014) Fiduciary Fund Types Pension and Other Employee Benefit Trust Funds Exhibit I (Concluded) Pension Trust Fund LIABILITIES (Note 1F) Accounts Payable Payroll Payable External Manager Fees Payable Benefits Payable Health Care Claims Payable Investments Purchased Payable Securities Sold Short Collateral Obligations Due to Employees Retirement System of Texas Employee Compensable Absences Payable (Note 4) Unrealized Lease Incentives Funds Held for Others TOTAL LIABILITIES NET POSITION Net Investment in Capital Assets Restricted for Pensions/Other Employee Benefits NET POSITION RESTRICTED FOR PENSIONS AND OTHER EMPLOYEE BENEFITS $ 5,185,910 5,005,826 23,235,445 760,271,035 TRS-Care $ 2,087,258 248,231 158,604,093 865,498,021 187,607,731 19,379,483,580 7,065,544 7,729,025 273,495 315,327 $ 21,241,355,612 $ $ 53,725,006 128,484,981,206 $ 128,538,706,212 $ $ 972,919,240 The accompanying Notes to the Financial Statements are an integral part of this financial statement. Financial Section 38 161,254,909 972,919,240 . Fiduciary Fund Types Total Pension and Other Employee Benefit Trust Funds 2015 2014 Agency Funds Child Support Employee Deductions $ 7,273,168 5,254,057 23,235,445 760,271,035 158,604,093 865,498,021 187,607,731 19,379,483,580 7,065,544 8,044,352 273,495 $ 9,741,611 4,610,218 38,222,531 747,290,981 136,210,995 646,945,719 152,153,586 22,869,875,747 6,845,375 7,306,238 242,139 $ $ 21,402,610,521 $ 24,619,445,140 $ $ 53,725,006 129,457,900,446 $ 38,054,379 133,199,129,193 $ $ 129,511,625,452 $ 133,237,183,572 $ 6,599 6,599 0 Financial Section 39 . Statement of Changes in Fiduciary Net Position FOR THE FISCAL YEAR ENDED AUGUST 31, 2015 (With Comparative Data for August 31, 2014) Pension and Other Employee Benefit Trust Funds Pension Trust Fund TRS-Care Exhibit II ADDITIONS Contributions Member State's General Fund - Non-Employer Contributing Entity Employer State's General Fund Participating Employer Contributions Surcharges Employment after Retirement-Employee Employment after Retirement-Employer Non-OASDI Participating Employers Purchase of Service Credit-Refundable Purchase of Service Credit - Non-Refundable State Contributions for 415 Excess Benefit Arrangement Employees Retirement System of Texas: For Service Contributions For 415 Excess Benefit Arrangement Health Care Premiums Federal Revenue (Note 6) Rebate and Discount Income Supplemental Appropriation from State Paid by State's General Fund on Behalf of TRS Employees (Note 6) TOTAL CONTRIBUTIONS AND PREMIUMS Investment Income From Investing Activities: Net Increase/(Decrease) in Fair Value of Investments Interest Dividends Total Investing Activities Income/(Loss) Less: Investing Activity Expenses (Schedule 3) Net Income/(Loss) from Investing Activities From Securities Lending Activities: Securities Lending Income Securities Lending Expenses: Borrower Rebates Management Fees Net Income from Securities Lending Activities TOTAL NET INVESTMENT INCOME/(LOSS) Other Additions Miscellaneous Revenue $ 2,576,024,311 1,591,482,988 $ 93,079,033 924,216,283 198,196,273 281,098,358 191,517,780 7,481,714 8,339,748 344,855,875 23,508,475 26,580,631 2,151,359 11,458,690 18,989,008 65,227 369,066,459 126,806,652 231,569,472 768,100,754 $ 5,616,774,652 $ $ (7,107,642,634) 623,717,202 6,248,497,146 (235,428,286) (259,203,853) (494,632,139) $ $ $ 2,177,814,438 1,495,680 $ 1,495,680 $ 1,495,680 $ 120,970,871 $ $ $ (30,143,454) (8,954,378) 81,873,039 (412,759,100) $ $ 0 1,495,680 Financial Section 40 3,733,133 $ 0 $ TOTAL ADDITIONS $ 5,207,748,685 $ 2,179,310,118 . Pension and Other Employee Benefit Trust Funds 2015 $ 2,774,220,584 1,872,581,346 2014 $ 2,546,689,903 1,798,121,739 93,079,033 1,115,734,063 120,206,921 1,035,151,832 7,481,714 19,798,438 344,855,875 23,508,475 26,580,631 2,151,359 6,247,139 16,071,271 18,989,008 65,227 369,066,459 126,806,652 231,569,472 768,100,754 17,440,313 71,240 363,631,292 78,589,415 200,859,859 36,058,148 $ 7,794,589,090 $ 139,422 6,365,015,177 $ (7,107,642,634) 625,212,882 6,248,497,146 (233,932,606) (259,203,853) (493,136,459) $ $ $ $ 120,970,871 $ $ (30,143,454) (8,954,378) 81,873,039 (411,263,420) 67,386,116 76,147,975 2,202,592 $ $ $ $ $ 16,443,655,756 1,866,157,795 1,254,816,385 19,564,629,936 (200,672,176) 19,363,957,760 122,114,760 (17,464,911) (32,115,830) 72,534,019 19,436,491,779 $ 3,733,133 $ 4,143,449 $ 7,387,058,803 $ 25,805,650,405 (to next page) Financial Section 41 . Statement of Changes in Fiduciary Net Position FOR THE FISCAL YEAR ENDED AUGUST 31, 2015 (With Comparative Data for August 31, 2014) Pension and Other Employee Benefit Trust Funds Exhibit II (Concluded) Pension Trust Fund DEDUCTIONS Benefits Refunds of Contributions - Active Refunds of Contributions - Death 415 Excess Benefit Arrangement Benefits Paid to Employees Retirement System of Texas: For Service Contributions For 415 Excess Benefit Arrangement Health Care Claims and Insurance Premium Payments Health Care Claims Processing Patient-Centered Outcomes Research Institute Fee Transitional Reinsurance Fee Administrative Expenses, Excluding Investing Activity Expenses: Salaries and Wages Payroll Related Costs Professional Fees and Services Travel Materials and Supplies Communications and Utilities Repairs and Maintenance Rentals and Leases Printing and Reproduction Depreciation Expense Amortization Expense Loss on Capital Asset Other Expense $ 8,935,111,459 385,866,706 5,474,475 1,929,315 TRS-Care $ 84,059,353 287,271 1,613,181,278 42,872,769 337,148 4,170,490 20,963,938 6,861,911 369,886 93,414 2,256,166 132,364 1,988,978 187,193 69,353 1,641,856 530,953 2,414,400 486,829 731,307 7,698 41,646 2,212 460,967 18,348 54,490 12,750 TOTAL DEDUCTIONS $ 9,448,285,558 $ 1,664,331,365 Net Increase (Decrease) in Net Position $ (4,240,536,873) $ 514,978,753 NET POSITION: RESTRICTED FOR PENSIONS/OTHER EMPLOYEE BENEFITS - BEGINNING OF YEAR $ 132,779,243,085 $ 457,940,487 NET POSITION: RESTRICTED FOR PENSIONS/OTHER EMPLOYEE BENEFITS - END OF YEAR $ 128,538,706,212 $ 972,919,240 The accompanying Notes to the Financial Statements are an integral part of this financial statement. Financial Section 42 . Pension and Other Employee Benefit Trust Funds 2015 $ 8,935,111,459 385,866,706 5,474,475 1,929,315 2014 $ 8,548,642,525 405,144,490 5,455,829 1,971,677 84,059,353 287,271 1,613,181,278 42,872,769 337,148 4,170,490 80,163,847 302,155 1,375,039,945 41,911,930 475,839 3,000,000 23,378,338 7,348,740 1,101,193 101,112 2,297,812 134,576 1,988,978 241,683 82,103 1,641,856 530,953 21,331,482 8,199,006 5,912,940 193,398 2,672,698 270,011 3,880,469 199,021 149,769 1,868,689 428,434 23,994 420,825 479,315 $ 11,112,616,923 $ 10,507,658,973 $ (3,725,558,120) $ 15,297,991,432 $ 133,237,183,572 $ 117,939,192,140 $ 129,511,625,452 $ 133,237,183,572 Financial Section 43 . Statement of Net Position PROPRIETARY FUNDS AS OF AUGUST 31, 2015 (With Comparative Data for August 31, 2014) Enterprise Funds Major Fund Non-Major Fund TRS-ActiveCare Exhibit III ASSETS Current Assets Cash Cash In State Treasury 403(b) Administrative Program $ 370,204,982 $ 307,266 138,076 $ 107 $ $ LIABILITIES (Note 1F) Current Liabilities Accounts Payable Payroll Payable Unearned Premium Revenue Fees Payable Premiums Payable to HMOs Health Care Claims Payable Employee Compensable Absences Payable (Note 4) TOTAL CURRENT LIABILITIES 307,266 $ Receivables Interest Health Care Premiums TOTAL RECEIVABLES TOTAL ASSETS $ $ TOTAL CASH 370,204,982 138,076 370,343,058 $ $ 107 307,373 $ $ 370 6,168 $ 1,496 120,506 714,480 13,508,000 14,669,296 253,374,387 100,022 282,488,187 $ $ $ $ $ 0 8,303 87,815,276 $ $ NET POSITION Restricted for Health Care Programs Restricted for Administrative Expenses TOTAL NET POSITION 39,595 39,595 282,527,782 $ Non-Current Liabilities Employee Compensable Absences Payable (Note 4) TOTAL NON-CURRENT LIABILITIES TOTAL LIABILITIES $ 1,765 8,303 87,815,276 $ The accompanying Notes to the Financial Statements are an integral part of this financial statement. Financial Section 44 299,070 299,070 . Total Enterprise Funds 2015 2014 $ 370,512,248 $ 230,331,707 $ 370,512,248 $ 230,331,707 $ 138,183 0 138,183 370,650,431 $ 75,182 576,694 651,876 230,983,583 $ $ 1,866 126,674 714,480 13,508,000 14,669,296 253,374,387 101,787 282,496,490 $ 18,800,000 12,733,152 175,883,104 105,757 207,763,970 $ $ $ 39,595 39,595 282,536,085 $ $ $ 52,345 52,345 207,816,315 $ 87,815,276 299,070 88,114,346 $ 22,839,112 328,156 23,167,268 $ $ $ $ $ $ $ 128,338 113,619 Financial Section 45 . Statement of Revenues, Expenses and Changes in Net Position PROPRIETARY FUNDS FOR THE FISCAL YEAR ENDED AUGUST 31, 2015 (With Comparative Data for August 31, 2014) Enterprise Funds Major Fund Non-major Fund Exhibit IV TRS-ActiveCare OPERATING REVENUES Health Care Premiums Administrative Fees Certification Fees Product Registration Fees TOTAL OPERATING REVENUES OPERATING EXPENSES Health Care Claims Health Care Claims Processing Premium Payments to HMOs Patient-Centered Outcomes Research Institute Fees Transitional Reinsurance Fee Administrative Expenses: Salaries and Wages Payroll Related Costs Professional Fees and Services Travel Materials and Supplies Communications and Utilities Repairs and Maintenance Rentals and Leases Other Operating Expense TOTAL EXPENDITURES TOTAL OPERATING EXPENSES $ 1,943,949,265 141,534 403(b) Administrative Program $ $ 1,944,090,799 $ $ 1,565,255,957 113,032,001 178,192,468 939,522 21,101,894 27,000 21,000 48,000 $ 1,161,112 214,416 782,921 6,779 943 1,056 250 56,668 1,271 71,954 6,492 $ 1,880,747,258 $ 78,446 $ 63,343,541 $ (30,446) $ 1,537,408 95,215 $ 1,360 $ 1,632,623 $ 1,360 Change in Net Position $ 64,976,164 $ (29,086) TOTAL NET POSITION - BEGINNING OF YEAR $ 22,839,112 $ 328,156 TOTAL NET POSITION - END OF YEAR $ 87,815,276 $ 299,070 OPERATING INCOME (LOSS) NON-OPERATING REVENUE Investment Income Other Non-operating Revenue Fringe Benefits Paid by State's General Fund on Behalf of TRS Employees (Note 6) TOTAL NON-OPERATING REVENUES The accompanying Notes to the Financial Statements are an integral part of this financial statement. Financial Section 46 . Total Enterprise Funds 2015 $ $ $ 2014 1,943,949,265 141,534 27,000 21,000 1,944,138,799 $ 1,565,255,957 113,032,001 178,192,468 939,522 21,101,894 $ $ 1,233,066 220,908 782,921 6,779 943 1,056 250 56,668 1,271 1,928,895,465 139,608 15,000 15,000 1,929,065,073 1,521,834,989 90,680,328 154,913,859 1,245,626 18,000,000 1,211,715 336,450 1,020,179 8,230 2,913 771 0 46,684 5,544 $ 1,880,825,704 $ 1,789,307,288 $ 63,313,095 $ 139,757,785 $ 1,538,768 95,215 $ 941,346 $ 1,633,983 $ 82,923 1,024,269 $ 64,947,078 $ 140,782,054 $ 23,167,268 $ (117,614,786) $ 88,114,346 $ 23,167,268 Financial Section 47 . Statement of Cash Flows PROPRIETARY FUNDS FOR THE FISCAL YEAR ENDED AUGUST 31, 2015 (With Comparative Data for August 31, 2014) Enterprise Funds Major Fund Exhibit V TRS-ActiveCare CASH FLOWS FROM OPERATING ACTIVITIES Receipts from Health Care Premiums Receipts from Long-Term Care Administrative Fees Receipts from Certification/Product Registration Fees Payments for Administrative Expenses Payments for Health Care Claims Payments for Health Care Claims Processing Payments for HMO Premiums Payments for Affordable Care Act Fees NET CASH PROVIDED (USED) BY OPERATING ACTIVITIES CASH FLOWS FROM NON-CAPITAL FINANCING ACTIVITIES Proceeds from Other Non-Operating Revenue $ 1,945,240,439 141,534 Non-major Fund 403(b) Administrative Program $ 48,000 (84,122) (2,349,876) (1,487,764,675) (113,032,001) (176,256,324) (27,333,416) $ 138,645,681 $ 95,215 $ 95,215 $ 0 $ 1,474,411 $ 1,356 $ 1,474,411 $ 1,356 Net Increase (Decrease) in Cash $ 140,215,307 $ (34,766) CASH AND CASH EQUIVALENTS - SEPTEMBER 1 $ 229,989,675 $ 342,032 CASH AND CASH EQUIVALENTS - AUGUST 31 $ 370,204,982 $ 307,266 $ 63,343,541 $ (30,446) $ 1,291,174 1,936,144 77,491,282 (5,292,000) (126,841) 10,934 (8,553) $ 75,302,140 $ (5,676) NET CASH PROVIDED (USED) BY OPERATING ACTIVITIES $ 138,645,681 $ The accompanying Notes to the Financial Statements are an integral part of this financial statement. * During 2015, $18,800,000 was reclassified from Health Care Claims Payable to Fees Payable for 2014. (36,122) NET CASH PROVIDED BY NON-CAPITAL FINANCING ACTIVITIES CASH FLOWS FROM INVESTING ACTIVITIES Interest Received NET CASH PROVIDED BY INVESTING ACTIVITIES $ (36,122) RECONCILIATION OF OPERATING INCOME (LOSS) TO NET CASH PROVIDED (USED) BY OPERATING ACTIVITIES Operating Income (Loss) Adjustments to Reconcile Operating Income (Loss) to Net Cash Provided (Used) by Operating Activities: Changes in Assets & Liabilities: Decrease in Health Care Premiums Receivable/ Unearned Premium Revenue Increase in Premiums Payable to HMOs Increase (Decrease) in Health Care Claims Payable* (Decrease) in Affordable Care Act Fees Payable* Increase (Decrease) in Accounts Payable Increase (Decrease) in Payroll Payable Increase (Decrease) in Employee Compensable Absences Payable NonCash Transactions: Proceeds from Fringe Benefits Paid by the State's General Fund on Behalf of TRS Employees Total Adjustments $ Financial Section 48 370 2,121 (8,167) . Total Enterprise Funds 2015 $ 2014 1,945,240,439 141,534 48,000 (2,433,998) (1,487,764,675) (113,032,001) (176,256,324) (27,333,416) $ 2,020,390,239 139,608 30,000 (2,587,879) (1,575,470,963) (90,680,328) (150,691,609) (19,245,626) $ 138,609,559 $ 181,883,442 $ 95,215 $ 0 $ 95,215 $ 0 $ 1,475,767 $ 892,291 $ 1,475,767 $ 892,291 $ 140,180,541 $ 182,775,733 $ 230,331,707 $ 47,555,974 $ 370,512,248 $ 230,331,707 $ 63,313,095 $ 139,757,785 $ 1,291,174 1,936,144 77,491,282 (5,292,000) (126,471) 13,055 (16,720) $ 91,494,774 4,222,250 (34,835,974) (18,800,000) (27,426) (12,899) 2,009 0 82,923 $ 75,296,464 $ 42,125,657 $ 138,609,559 $ 181,883,442 Financial Section 49 . Notes to the Financial Statements TABLE OF CONTENTS NOTE 1: SUMMARY OF SIGNIFICANT ACCOUNTING POLICIES............................................................................................. 51 NOTE 2: CAPITAL ASSETS...................................................................................................................................................... 57 NOTE 3: DEPOSITS AND INVESTMENTS ............................................................................................................................... 59 NOTE 4: EMPLOYEE COMPENSABLE LEAVE .........................................................................................................................
72 NOTE 5: OPERATING LEASES ................................................................................................................................................ 73 NOTE 6: FRINGE BENEFITS PAID BY THE STATE OF TEXAS AND THE FEDERAL GOVERNMENT............................................ 73 NOTE 7: DEFERRED COMPENSATION ...................................................................................................................................
73 NOTE 8: CONTINGENT LIABILITIES ....................................................................................................................................... 73 NOTE 9: CONTINUANCE SUBJECT TO REVIEW ..................................................................................................................... 74 NOTE 10: POST-EMPLOYMENT HEALTH CARE BENEFITS .....................................................................................................
74 NOTE 11: RISK MANAGEMENT ............................................................................................................................................. 78 NOTE 12: PENSION DISCLOSURE .......................................................................................................................................... 78 NOTE 13: SUBSEQUENT EVENTS ..........................................................................................................................................
83 Financial Section 50 . Notes to the Financial Statements NOTE 1: SUMMARY OF SIGNIFICANT ACCOUNTING POLICIES A. REPORTING ENTITY The Teacher Retirement System of Texas (TRS or system) is a separate legal entity and considered a discrete component unit of the State of Texas. The system is governed by a nine member board of trustees which has significant independence in the operation and management of the system under the provisions of the state constitution and laws. The trustees serve staggered six-year terms that expire on August 31 of odd numbered years and are all appointed by the governor. The trustees are appointed as follows: ï‚· Three are direct appointments by the Governor. ï‚· Two appointments are from a list nominated by the State Board of Education. ï‚· Two appointments are from three public school district active members nominated by employees of public school districts. ï‚· One appointment is from three higher education active members nominated by employees of institutions of higher education. ï‚· One appointment is from three retired member candidates nominated by TRS retirees. The state legislature confirms trustees appointed by the governor, establishes laws with regard to structure, benefits and contributions, and authorizes Pension Trust Fund administrative expenses. State contributions and appropriations received by TRS are determined by the legislature. This report includes all activities and programs for which TRS exercises fiscal control and responsibility and includes all funds that comprise the system’s legal entity.
TRS administers retirement and related benefits to employees and beneficiaries of employees of the public, state-supported, educational institutions of Texas. It operates primarily under the provisions of the Texas Constitution, Article XVI, Section 67 and Texas Government Code, Title 8, Subtitle C. The pension trust fund is a defined benefit retirement plan that is a qualified pension trust under Section 401(a) of the Internal Revenue Code. The system administers the Texas Public School Retired Employees Group Insurance Program and the Texas Active School Employees Uniform Group Benefits Program.
These programs provide two separate health care plans, TRS-Care and TRSActiveCare, respectively. TRS-Care is considered an employee benefit trust fund and provides health care coverage for certain persons (and their dependents) who retire under TRS. The statutory authority for the program is Texas Insurance Code, Chapter 1575 and Texas Administrative Code, Title 34, Part 3, Chapter 41. The inception of the plan was fiscal year 1986. TRS-ActiveCare provides health care coverage to employees (and their dependents) of participating public education entities.
Optional life and long-term care insurance, which are provided to active members and retirees, are also accounted for in the fund. Authority for the plan can be found in the Texas Insurance Code, Title 8, Subtitle H, Chapter 1579 and in the Texas Administrative Code, Title 34, Part 3, Chapter 41. The plan began operations on September 1, 2002. The system also administers a 403(b) Administrative Program in which companies must be certified by TRS to offer qualified investment products to public education employees through payroll deductions in accordance with Internal Revenue Code section 403(b).
Authority for the program can be found in Vernon’s Civil Statutes, Title 109, Article 6228a5, Sections 4-8A and in the Texas Administrative Code, Title 34, Part 3, Chapter 53. The program began operations on September 1, 2001. An Agency Fund is used to account for garnishments of salaries and wages for child support payments from TRS employees. Financial Section 51 . Notes to the Financial Statements B. MEASUREMENT FOCUS, BASIS OF ACCOUNTING, AND BASIS OF PRESENTATION The system’s accounts are organized on the basis of funds, each of which is considered a separate accounting entity. The operations of each fund are accounted for with a self-balancing set of accounts that comprise its assets, liabilities, additions/revenues and deductions/expenses. The following fund types are used to reflect the system’s transactions: ï‚· ï‚· Fiduciary Funds – include the Pension Trust Fund, TRS-Care (employee benefits trust fund) and the Agency Fund. Proprietary Funds – include TRS-ActiveCare and the 403(b) Administrative Program which are both Enterprise funds.
TRS ActiveCare is considered a major fund. Fiduciary funds are used to report assets held in a trustee or agency capacity on behalf of others. The reporting focus is on net position and changes in net position. The pension and other employee benefit trust funds are used to report resources held in trust for the members and beneficiaries of the defined benefit pension plan and the other employee benefit plan.
Agency funds are used to report resources held in a purely custodial capacity by the reporting government. Proprietary, enterprise funds account for business-type activities or those for which a fee is charged to external users for goods or services. The reporting focus is on the determination of operating income, changes in net position, financial position, and cash flows. Proprietary funds distinguish operating activities from non-operating.
Operating activities generally result from providing services and producing or delivering goods. Operating revenues for the system’s proprietary funds are derived from self-insurance premiums and providing plan and product certification services to qualified 403(b) plans. Operating expenses include the costs of claims, costs of certification/product services and related administrative expenses.
Non-operating revenues and expenses are those items that do not meet any of the above definitions. Separate financial statements are provided for each fund. The fiduciary (excluding agency funds) and proprietary financial statements are reported using the economic resources measurement focus and the accrual basis of accounting. Additions are recognized when earned, and deductions are recognized when the liability is incurred, regardless of the timing of related cash flows.
Contributions are recognized in the period in which amounts are due, pursuant to state law. Benefits and refunds of contributions are recognized when due and payable in accordance with the terms of the plan. All economic resources, including financial and capital assets, and related liabilities, both current and long-term, and the changes therein are reported in each fund’s financial statements.
Capital assets are depreciated or amortized on a straight-line basis, if appropriate. Agency funds are custodial in nature and do not measure the results of operations. Assets and liabilities are recorded using the accrual basis of accounting. Agency funds are used to report assets collected and transferred to the state or other entities. C.
NEW ACCOUNTING PRONOUNCEMENTS The accompanying financial statements were prepared in conformity with generally accepted accounting principles (GAAP) as prescribed by the Governmental Accounting Standards Board (GASB). GASB Statement No. 68 Accounting and Financial Reporting for Pensions, relates to governmental employers that provide pensions through trusts and is effective for fiscal years beginning after June 15, 2014.
TRS issued GASB 68 Allocation Schedules for the first time for use by employers participating in the TRS pension plan. Financial Section 52 . Notes to the Financial Statements D. COMPARATIVE DATA IN TOTAL The basic financial statements include certain prior year summarized comparative data in total but not at the level of detail required for a presentation in conformity with generally accepted accounting principles. Accordingly, such information should be read in conjunction with the system’s financial statements for the fiscal year ended August 31, 2014, from which the summarized information was derived. These reclassifications had no effect on previously reported net positions. Certain items from the prior year’s financial statements have been reclassified to conform to the presentation in the current year’s financial statements.
For the fiscal year 2015, the Statement of Changes in Fiduciary Net Position for the Pension Trust Fund includes a reclassification from Net Increase in Fair Value of Investments to Dividends. For TRS-Care, the $36 million Supplemental Appropriation received from the state in 2014 was presented separately this year due to the size of the amount received in 2015. It was previously presented as State’s General Fund – Non Employer Contributing Entity in 2014.
For TRS ActiveCare on the Statement of Net Position, Fees Payable were presented in Health Care Claims Payable in 2014 and are now shown separately. Pension Surcharges for Employment after Retirement were combined in 2014 and have been separated in 2015 for the employee and employer rates. E. BUDGETS AND APPROPRIATIONS The administrative costs and capital asset outlay for each of the system’s funds and programs are controlled by annual budgets approved by the board of trustees. The Pension Trust Fund receives state contributions for retirement benefits from general revenue appropriations.
In fiscal years 2015 and 2014, contributions were made by the State of Texas to the retirement system at the rate of 6.8% of the aggregate compensation paid to active retirement system members for each year. Although appropriated by the legislature, administrative expenses and capital outlay for the Pension Trust Fund are paid from the fund’s Expense Account, and not from the state’s General Fund. The 83rd Texas Legislature enacted Senate Bill 1458 which reduced the annual interest paid on member account balances from five percent to two percent effective September 1, 2014. TRS-Care received contributions from the state’s General Fund equal to one percent of salaries paid to public education employees in fiscal year 2015. Administrative expenses for this program are paid from the trust fund.
House Bill 2 provided an additional $768 million in funding for TRS-Care. The funding was transferred in fiscal year 2015. The two Enterprise Funds, TRS-ActiveCare and the 403(b) Administrative Program are supported by fees and receive no appropriations from the state for administrative expenses. Effective September 1, 1997, legislation authorized TRS to administer a governmental excess benefit arrangement under section 415(m) of the Internal Revenue Code of 1986 (26 U.S.C.). This legislation created a separate, nonqualified, unfunded excess benefit arrangement outside the trust fund of the retirement system.
Contributions to this arrangement are made from the state’s general revenue appropriations. These contributions are not held in trust and may not be commingled with other funds of the retirement system. They yield no net position; therefore, for reporting purposes only the contributions and benefits are reflected on Exhibit II, Statement of Changes in Fiduciary Net Position. Financial Section 53 .
Notes to the Financial Statements F. ASSETS, LIABILITIES AND LEGAL RESERVES Receivables Receivables represent the amount of money owed to TRS for goods or services delivered or used that have not been received at fiscal year-end. ï‚· ï‚· ï‚· ï‚· ï‚· ï‚· Sale of Investments receivables occur when the trade date is before the fiscal year-end and the settlement date is in the next fiscal year. Interest and Dividend receivables represent distributions of income made on bank accounts and other investments that TRS earned in the current fiscal year but did not receive until after fiscal year-end. Member and Retiree receivables represent contributions that are due from members for the current fiscal year but not received until after fiscal year-end. Reporting Entity receivables represent contributions that are due from reporting entities for the current fiscal year which are not received until after fiscal year-end. Service Credit Purchase receivables represent the outstanding balance due from members on service credit purchase installment contracts at fiscal year-end. Payments can be made on a monthly basis for up to five years for purchasing additional creditable service. Receivables are recognized when an agreement is signed. Other receivables represent amounts owed to TRS such as refund or annuity repayments at fiscal year-end but not received until the next fiscal year. Investments Investments are reported at fair value. The framework for measuring fair value is based on a hierarchy that gives the highest priority to the use of observable inputs in an active market and the lowest priority to the use of unobservable inputs.
Management’s estimated market values for investments without readily ascertainable market values could differ significantly if a ready market for these assets existed. Because of the inherent uncertainties in estimating fair value, it is at least reasonably possible that the estimates will change in the near-term. Global foreign exchange holdings are translated using the London 4 O’clock Closing Spot Rate from a third party vendor. Short-Term Investments are those maturing within one year of purchase date.
Included in short-term investments are foreign currency contracts. These foreign exchange contracts are reported at the spot rate and the net difference between the value of the foreign currency and the U.S. dollar is reported in the net increase (decrease) in fair value of investments. Risks associated with such contracts include movement in the value of the foreign currency related to the U.S.
dollar and the ability of the counterparty to perform. Transactions involving foreign currency are accounted for in accordance with FASB Accounting Standards Codification (ASC) 946-830; the subtopic “Foreign Currency Matters” of the topic “Financial Services – Investment Companies”. The fair value of equity investments is measured based on the primary exchange last sale price or the official close price from the pricing vendor for all exchange listed equities. For delisted securities, the last available close price is utilized.
The fair value of local access products, including equity-linked certificates and participation notes which replicate the performance of an underlying security, index, or market for which investing in the local market or in the American Depository Receipt (ADR) or Global Depository Receipt (GDR), or the total return swap market would be difficult or costly, or both, is estimated using a proprietary pricing service. The fair value of fixed income investments is measured based on exchange quotes or vendor sourced evaluated bid prices. Where constituent data is available, the system will also use a benchmark source. Mortgage backed securities are priced on a pool specific basis or, if not available, using the income method which considers the prepayment speed. Financial Section 54 . Notes to the Financial Statements The system has Alternative Investments in the form of Limited Partnerships (LP) and other non-publicly traded equities. These LPs include interests in private equity, real asset, hedge fund, and other absolute return partnership arrangements. These investments are generally illiquid, and the system’s ability to gain insight into the underlying portfolios of some of the LPs may be limited. The fair value of these LP’s is measured based on the Net Asset Value (NAV) of the entity as provided from the General Partner (GP). The system determines whether the NAV is in accordance with the Investment Companies Guide and is in phase with TRS’ fiscal year end. If these conditions are not met, the system adjusts the NAV accordingly or performs further analysis to estimate fair value of its LP interest.
A NAV that is out of phase may be adjusted for subsequent contributions, distributions, management fees and reserves, material changes in fair value of the underlying investments which make up the NAV, or an updated valuation obtained from the GP. A commingled fund is a pool of assets from multiple investors which are under the direction of an external fund manager. These instruments are typically entered into by executing an Investment Management Agreement or are registered, publicly traded pools that are accessible by many investors. The fair value of commingled funds is generally estimated by the fund administrator retained by the fund manager. Investment derivative instruments are reported at fair value. When the fund holds investment derivatives with offsetting market risks, it nets the offsetting positions.
Derivative instruments associated with investments that are already reported at fair value are classified as investment derivative instruments. Changes in fair value of investment derivative instruments are reported as net increase (decrease) in fair value of investments, a component of investment income. The fair value of option and future contracts traded in active markets is estimated based on the current exchange close price. For option contracts, if a current day close price is not available, a fully vetted valuation model to estimate fair value is discerned through coordination with the portfolio manager and/or the independent clearing broker.
For future contracts, if a current day close price is not available, the last price or settlement price may also be used, depending on availability; or if quoted prices are not available, a fully vetted valuation model to estimate fair value is discerned through coordination with the portfolio manager and/or the independent clearing broker. Futures contracts are marked to market daily. The net offsetting positions are reported as accruals, with a daily variation margin (the gain or loss) recorded between the daily value of the contracts and the value on the previous day. The fair value of fairly generic credit default swap and interest rate swap arrangements are estimated using appropriate pricing models.
At each day’s close, if the variables required to successfully complete the pricing model are not available, the system utilizes a “proxy price” to estimate the fair value at the closing day. Once the variables are available, the system corrects the proxy price. These arrangements are priced “clean” meaning the fair values do not include accrued interest. The fair value of total return and other more complex swap arrangements are estimated using a pricing model or a proprietary pricing agent. The fair value of forward contracts is estimated by adding the forward points to the corresponding spot rate.
These rates are then applied to the outstanding currency exchange to derive a change in valuation. Securities Lending The system reports loaned securities, the invested cash collateral, and the related liabilities resulting from securities lending transactions on Exhibit I, Statement of Fiduciary Net Position. The system also reports the earned income from securities lending on Exhibit II, Statement of Changes in Fiduciary Net Position. Both the loaned securities and the invested cash collateral are reported at quoted market prices. Financial Section 55 .
Notes to the Financial Statements Other Assets Prepaid deposits and rent expense reflects payment for rental costs applicable to a future accounting period. Capital Assets Capital assets associated with the funds’ activities are included in the statement of net position. Purchases of capital assets by the fund are reported at cost on the acquisition date. Depreciation of all exhaustible capital assets is charged as an expense against the fund’s operations. Depreciation is calculated using the straight-line method over the asset’s useful life.
Note 2 includes a table identifying the capitalization threshold and estimated useful life by asset type. Liabilities Accounts Payable represents the liability for assets or services received at fiscal year-end for which payment has not been made. Benefits Payable for the Pension Trust Fund represents the liability for retirement, disability, and death benefits due at fiscal year-end and payable within the next 30 days. Health care claims payable for TRS-Care and TRS-ActiveCare includes an estimate for health care claims incurred but not reported to the system at fiscal year-end. Investments Purchased Payable represents the liability for securities purchased prior to fiscal year-end that has not been made. Foreign investments purchased payable is reported at current exchange rates. Securities Sold Short represent obligations to deliver securities.
The system may sell equity securities short in anticipation of a decline in fair value. In a short sale, the system borrows the securities from another party and delivers the securities to the buyer. The system is required to “cover” its short sale in the future through the purchase of the security in the market at the prevailing market price and deliver it to the counterparty from which it borrowed.
The system is exposed to market risk to the extent that the security price increases during the time from when the security is borrowed to the time when the system purchases it in the market to cover the short sale. Collateral Obligations represent both collateral associated with securities lending, and that associated with payables to brokers for collateral held related to derivative instrument-activity. Employee Compensable Absences Payable represents the liability that becomes due upon the resignation, retirement and use of leave balances by employees. These obligations are normally paid from the same funding source from which each employee’s salary or wage compensation was paid. Liabilities are reported separately as either current or non-current in the statement of net position for enterprise funds, if appropriate. Unrealized Lease Incentives represent a reduction to rental expenses for the rent abatement and incentives received from the non-cancelable operating lease that are being amortized over the lease term. Interfund/Interagency Transactions and Balances The Pension Trust Fund provides various administrative services to other TRS programs and accounts for these services as reciprocal interfund activity.
These transactions are reported using the appropriate classification accounts for additions/revenues or deductions/expenses as if transacted with parties external to the state, i.e., they are not presented as transfers. The interfund receivables and payables related to reciprocal interfund activity are classified as receivables and accounts payable on the financial statements. Interagency transactions have been classified using the above criteria for reciprocal inter-fund activity. Financial Section 56 . Notes to the Financial Statements Legal Reserve Accounts The Pension Trust Fund has five statutorily required reserves. ï‚· ï‚· ï‚· ï‚· ï‚· The Member Savings Account represents the accumulation of active member deposits plus interest. The State Contribution Account represents the reserves available to fund future active member retirement, death, and survivor benefits. The Retired Reserve Account represents the reserves available to fund retirement, death, survivor benefits and post-retirement benefit increases. The Deferred Retirement Option Account represents the accumulation of participating member deposits plus interest less benefits paid out. Net investment gains or losses are accumulated in the Interest Account and transferred to the State Contribution Account together with any other balance remaining in the Interest Account. The Expense Account represents the reserves to pay administrative expenses of the Pension Trust Fund that exceed the state’s appropriations and that are required to perform the fiduciary duties of the board. The statutory accounts are a requirement of the Texas Government Code, Chapter 825, Sections 307-313. NOTE 2: CAPITAL ASSETS Capital assets are presented at historical cost or, if not purchased, at fair value at the date of acquisition. When appropriate straight-line depreciation and amortization have been charged over the shorter of estimated useful lives of the assets or lease period.
All capital assets belong to the pension trust fund. Capitalization thresholds for all capital asset classes and useful lives for exhaustible assets are shown on the following page: Capitalization Threshold Asset Class Land Construction in Progress Buildings Building Improvements Facilities and Other Improvements Leasehold Improvements Furniture and Equipment Vehicles, Boats, and Aircraft Internally Generated Computer Software Other Computer Software Other Capital Assets $ Financial Section 57 0 0 100,000 100,000 100,000 100,000 5,000 5,000 1,000,000 100,000 Various Depreciable Life --50 years 15 years 10 years 6 years 5 years 7 years 5 years 5 years Various . Notes to the Financial Statements Capital asset balances and current year transactions are presented in the following table: Reclasses & Completed CIP Asset Class Balance 09/01/2014 Non-Depreciable Assets: Land and Land Improvements Construction in Progress Other Tangible Capital Assets Total Non-Depreciable Assets $ 1,658,310 8,710,720 124,136 $ 10,493,166 $ Depreciable Assets: Buildings and Building Improvements Furniture and Equipment Vehicle, Boats & Aircraft Leasehold Improvements Facilities and Other Improvements Total Depreciable Assets at Historical Cost $39,175,704 11,122,663 76,363 3,096,189 343,622 $53,814,541 $ Less Accumulated Depreciation for: Buildings and Building Improvements Furniture and Equipment Vehicles, Boats & Aircraft Leasehold Improvements Facilities and Other Improvements Total Accumulated Depreciation Depreciable Assets, Net $(18,145,873) (6,303,401) (40,915) (2,838,171) (116,050) $(27,444,410) $ 26,370,131 $ Intangible Assets: Computer Software Total Amortizable Assets at Historical Cost $ Additions Deletions $ 16,543,197 0 $ $16,543,197 $ 0 $ 1,736,770 (15,332) 451,526 $ $ 1,658,310 25,253,917 124,136 $27,036,363 $39,175,704 12,844,101 76,363 3,547,715 343,622 $55,987,505 0 $ 2,188,296 $ $ $ 0 0 $(1,353,671) (1,286,168) (5,991) (259,729) (34,362) $(2,939,921) $ (751,625) $ $ 15,332 0 $(19,499,544) (7,574,237) (46,906) (3,097,900) (150,412) $(30,368,999) $ 25,618,506 $ 10,159,743 $ 10,159,743 $ $ 0 $ $ 410,008 410,008 $ $ 0 $ 10,569,751 $ 10,569,751 Less Accumulated Amortization for: Computer Software Total Accumulated Amortization Intangible Assets, Net $ (8,968,661) $ (8,968,661) $ 1,191,082 $ $ $ 0 0 $ (530,953) $ (530,953) $ (120,945) $ $ $ 0 0 $ (9,499,614) $ (9,499,614) $ 1,070,137 Fiduciary Capital Assets, Net of Accumulated Depreciation/Amortization $ 38,054,379 $ 0 $15,670,627 $ 0 $ 53,725,006 Financial Section 58 $ (15,332) Balance 08/31/2015 (Exhibit I) 15,332 . Notes to the Financial Statements NOTE 3: DEPOSITS AND INVESTMENTS A. CASH IN BANK AND DEPOSITS Cash and deposits of the system are maintained in bank accounts or in the State Treasury. Foreign bank deposits are reported at current exchange rates. At August 31, 2015, the carrying amount totaled $398,825,412 and the bank balance totaled $398,824,726.
The State Treasury invests funds in time deposits, repurchase and reverse repurchase agreements, obligations of the United States, and obligations of various federal credit organizations. The State Treasury has an arrangement with financial institutions to collateralize state deposits in excess of depository insurance. B. CASH ON HAND AND CASH EQUIVALENTS At August 31, 2015, the system had $3,087,674 in cash on hand.
This total is related to checks for purchases of special service that were being held pending approval of rollover transfer forms. Investments with an original maturity of three months or less and that are used for cash management rather than investing activities are considered cash equivalents. Highly liquid investments invested as part of a short-term investment fund are not considered cash equivalents. C. CUSTODY OF INVESTMENTS The system has contracted with State Street Bank and Trust Company and Goldman Sachs to serve as custodians for the system’s investments. D.
INVESTMENT ALLOCATION, LEGAL PROVISIONS, AND OTHER CONSTRAINTS Under the Texas Property Code, Section 117.003, a trustee of the board owes a duty to the beneficiaries of the trust to comply with the prudent investor rule. In making investments, the board shall exercise the judgment and care under the circumstances then prevailing that persons of ordinary prudence, discretion, and intelligence exercise in the management of their own affairs, not in regard to speculation, but in regard to the permanent disposition of their funds, considering the probable income therefrom as well as the probable safety of their capital. Texas Government Code, Section 825.301(a), Texas Property Code, Section 117.004, and the Texas Constitution, Article XVI, Section 67(a)(3) apply in determining whether a trustee has exercised prudence with respect to an investment decision.
Determination shall be made taking into consideration the investment of all the assets of the trust, or the assets of the collective investment vehicle, over which the trustee had management and control. Trustees establish and may amend the guidelines provided by the TRS Investment Policy Statement in establishing specific asset allocations, benchmarks, eligible investments and quantitative criteria with the assistance of their investment counsel and investment advisors. Trustees utilize asset allocations and portfolio standards they believe are prudent and appropriate for the long-term objectives of the fund. The Investment Division assists the Board in engaging in an assetliability study for the pension plan at least once every five years to review asset classes, return-risk assumptions, and correlation of returns with applicable benchmarks and across asset classes.
The most recent study was completed in fiscal year 2015 and the adopted asset allocation was effective October 1, 2014. A key objective of the asset-liability study shall be the development through statistical modeling techniques of a diversified portfolio that specifies ranges of prudent portfolio exposures and a “long-term normal” position for each asset class. The normal portfolio mix will represent the portfolio that is expected to meet the Board's actuarial return objectives for the pension plan within specific risk tolerances. Financial Section 59 .
Notes to the Financial Statements The following was the asset allocation and Long-Term Expected Real Rate of Return as of August 31, 2015: Asset Allocation and Long-Term Expected Real Rate of Return Asset Class Global Equity U.S. Non-U.S. Developed Emerging Markets Directional Hedge Funds Private Equity Stable Value U.S. Treasuries Absolute Return Stable Value Hedge Funds Cash Real Return Global Inflation Linked Bonds Real Assets Energy and Natural Resources Commodities Risk Parity Risk Parity Inflation Expectation Alpha Total Target Allocation Long-Term Expected Geometric Real Rate of Return Expected Contribution to Long-Term Portfolio Returns1 18% 13 9 4 13 4.6% 5.1 5.9 3.2 7.0 1.0% 0.8 0.7 0.1 1.1 11 0 4 1 0.7 1.8 3.0 -0.2 0.1 0.0 0.1 0.0 3 16 3 0 0.9 5.1 6.6 1.2 0.0 1.1 0.2 0.0 5 6.7 0.3 2.2% 1.0 8.7% 100% 1 The Expected Contribution to Returns incorporates the volatility drag resulting from the conversion between Arithmetic and Geometric mean returns For the year ended August 31, 2015, the annual money-weighted rate of return on pension plan investments, net of pension plan investment expense was -0.32 percent. The money-weighted rate of return expresses investment performance, net of investment expense, adjusted for the changing amounts actually invested. Financial Section 60 .
Notes to the Financial Statements E. INVESTMENTS The fair values of investments at August 31, 2015, are shown in the following table: Pension Trust Fund Investment Type Fair Value Short-Term Investment Fund U.S. Treasury Bill Other Short-Term Short-Term Foreign Currency Contracts Equities: Domestic Equities: Equity Securities Equity Commingled Funds International Equities: Equity Securities Equity Commingled Funds Equity Mutual Funds Debt Securities: Domestic Debt Securities: Asset and Mortgage Backed Corporate U.S. Treasury U.S.
Treasury STRIPS U.S. Treasury TIPS U.S. Government Agency Debt Commingled Funds International Debt Securities: Government Corporate Debt Commingled Funds Alternative Investments: Domestic Alternative Investments: Private Equity Real Assets Hedge Funds Absolute Return Energy and Natural Resources Risk Parity International Alternative Investments: Private Equity Real Assets Hedge Funds $ 2,813,074,520 9,596,171 550,861,501 86,385 20,646,085,075 2,871,308,066 26,521,473,596 3,488,680,255 91,908,027 185,705,826 43,271,751 14,784,523,332 242,603,869 6,004,020,596 36,178,295 173,017,818 263,705,310 3,250,030 31,571,803 12,997,417,625 13,327,277,730 11,158,758,163 173,654,091 2,250,960,367 1,757,759,921 3,413,830,007 2,648,964,608 457,885,359 to next page Financial Section 61 .
Notes to the Financial Statements Pension Trust Fund (concluded) Investment Type Investment Derivatives: Domestic Investment Derivatives: Forward Contracts Options Swap Contracts Warrants International Investment Derivatives: Swap Contracts Fair Value 6,960,269 (2,570,953) (14,081,051) 22,919,926 (785,112) 52,897,186 Warrants Other Investments: Other Commingled Funds - Domestic Total Investments (Exhibit I) 29,659,103 $127,042,429,465 Invested Securities Lending Collateral: Securities Lending Pooled Investments Total Securities Lending Collateral (Exhibit I) $ 19,372,421,460 $ 19,372,421,460 Categories of permissible investments include equities, debt securities, cash equivalents, alternative investments including private equity, real assets, absolute return, hedge funds, other absolute return investments, derivative instruments authorized by law, mutual funds, closed-end funds, exchange-traded funds, and commingled funds. Investment categories are based on the risk profiles exhibited by those investments. The objectives of the Private Equity and Real Asset investments is to provide diversification to the Total Fund, and provide for enhanced returns and diversification within the portfolio by allocating assets among the various strategies. Private equity funds build portfolios of private investments in the equity or equity-rights securities of privately-owned operating companies. Real assets focus on private or public real estate equity, private or public real estate debt, infrastructure, timber, agricultural real estate, oil and gas, real asset mezzanine debt or equity, mortgage-related investments, entitylevel investments, REITS, MLPs, non-fixed assets and other opportunistic investments in real assets.
Funding of committed capital in either the Private Equity or the Real Asset Portfolio will occur over an extended time period and may take several years before the total allocation to each asset class is fully invested. Because an individual investment may begin to return capital to the investor prior to the full funding of the investor’s commitment, the outstanding invested capital of a Private Equity or Real Asset investment might at times be substantially less than the total commitment. Hedge funds are private commingled investment vehicles with the general characteristics as set forth in Texas Government Code, Section 825.3012.
Hedge funds include private investment fund of funds or a commingled vehicle that itself invests in hedge funds. TRS investment policy establishes criteria to analyze and determine whether a private investment fund should be classified as a hedge fund. The permissible hedge fund allocation is a maximum of 10% of the market value of the total fund on the date of each hedge fund investment. Absolute Return investments include credit sensitive investments as well as other limited partnerships that are not hedge funds, private equity, or real assets.
A commingled fund is a fund which is (i) exempt under the provisions of Section 501(a) of the Internal Revenue Code of 1986, (ii) is not required to be registered as an investment company under Section 3(c)(1), 3(c)(7) or other provisions of the Investment Company Act of 1940, or (iii) is an investment company registered under the Investment Company Act of 1940, as amended, provided that investment and reinvestment of assets complies with the investment guidelines in all respects. Energy and Natural Resources investments include private and public energy or natural resource related securities either directly or through funds. Risk Parity portfolios are asset allocation strategies that focus upon equalizing the risk contributions of the asset Financial Section 62 .
Notes to the Financial Statements classes or risk factors comprising the portfolio. Risk Parity then uses leverage to scale the resulting portfolio to target a stated level of portfolio risk/return commensurate with typical pension fund unlevered asset allocation strategies. F. DERIVATIVES Derivatives are financial instruments the value of which are derived, in whole or part, from the value of any one or more underlying securities or assets, or index of securities or assets (such as bonds, stocks, financial commodities, and currencies). Derivatives include futures contracts, options, options on futures contracts, forward contracts, swap contracts, and any instrument or contract intended to manage transaction or currency exchange risk in purchasing, selling or holding investments.
A forward contract is a non-standardized contract for the physical or electronic (through a bookkeeping entry) delivery of a commodity or financial instrument at a specified price at some point in the future. The system’s swap contracts are a financial contract in that the parties agree to exchange cash flows of defined investment assets in amounts and times specified by the contract. An interest rate swap is structured such that one stream of future interest payments is exchanged for another based on the notional amount.
A total return swap is a contract in which one counterparty agrees to either pay to or receive from the other counterparty cash flows based on changes in the value of an underlying asset. A credit default swap is a contract that provides credit protection against a specified credit event such as the default or bankruptcy of the underlying financial instrument (reference asset). The purchaser (buyer) pays a premium to the writer (seller) in return for payment, which is contingent on a credit event affecting the referenced asset. An option contract provides the right, but not the obligation, to buy or sell a specific amount of a specific security within a predetermined time period.
A futures contract is a commitment to buy or sell a specified quantity of a commodity or financial instrument at a specified price with payment and delivery occurring at a specified future date. The fair value balances and notional amounts of investment derivative instruments outstanding at August 31, 2015, classified by type, and the changes in fair value of such investment derivative instruments for the fiscal year ended August 31, 2015 were as follows: Changes in Fair Value Classification Amount Gain/(Loss) Fair Value at August 31, 2015 Classification Amount Notional Fiduciary Funds Investment Derivatives: Forward Contracts Futures Contracts Swap Contracts Warrants Options Investment Revenue Investment Revenue Investment Revenue Investment Revenue Investment Revenue $ $ $ $ $ 478,858,356 (754,028,134) (110,042,846) (18,782,173) (13,113,747) Investment Investment Investment Investment Investment $ $ $ $ $ 6,960,269 0 (14,866,163) 75,817,112 (2,570,953) $ $ $ $ $ 15,804,273,155 3,438,884,458 815,710,774 30,631,554 2,674,236 The methods and significant assumptions used to estimate fair value of the system’s investment derivative instruments are presented in Note 1: Summary of Significant Accounting Policies, Section F. Assets, Liabilities and Legal Reserves. The system’s investment policy states that derivatives may only be used to efficiently manage and reduce the risk of the overall investment portfolio in accordance with applicable law, and must comply with the fiduciary standard of prudence set forth in the Texas Constitution, Article XVI, Section 67(a)(3). Consistent with these objectives, derivative applications may be used to implement investment strategies in a lower cost and efficient manner; efficiently manage the fund’s portfolio by altering the portfolio’s market exposure in lieu of trading the underlying cash market securities through purchases or short sales, or both, of appropriate derivatives; construct portfolios with risk and return characteristics that could not be created with cash market securities consistently with the objectives in the investment policy and in Financial Section 63 .
Notes to the Financial Statements compliance with applicable law; hedge and control risks so that the fund’s risk-return profile is more closely aligned with the fund’s targeted risk-return profile through purchases or short sales, or both, of appropriate derivatives; and facilitate transition trading when holdings must be rebalanced or reallocated among permissible investments as a result of changes to applicable benchmark indexes or investment policy changes. Derivatives may not be used for any activity a primary purpose of which is speculation or to profit while materially increasing risk to the system. Derivative applications may not be used to invest in asset classes that are not consistent with the system’s legally permissible and policy asset categories, implementation strategies, and risk-return characteristics. Investment managers or sponsors of Real Asset Funds investments in commodities are limited to swaps and instruments that constitute a security that is underlain by a financial instrument as opposed to a physical commodity unless such derivatives are cash-settled whether by its contract terms, by rolling the position, or by trading out of the position before a delivery obligation can arise. Any counterparty to an over-the-counter derivative transaction must have a credit rating of at least A- (Standard & Poor’s or Fitch) or A3 (Moody’s) and is subject to established ISDA Master Agreements.
All ISDA Master Agreements provide that netting applies. The system and external managers may also use collateral arrangements to mitigate counterparty credit or performance risk. The net market value of all over-the-counter derivative positions, less collateral posted, for any individual counterparty may not exceed $500 million.
If the over-the-counter derivative transaction is a type of contract that must be centrally cleared as mandated by the Dodd-Frank Wall Street Reform and Consumer Protection Act, it is subject to clearing agreements. G. DEPOSITS AND INVESTMENTS RISK FACTORS Deposits and investments of state and local governments are exposed to risks that have the potential to result in losses. GASB Statement No. 40, Deposit and Investment Risk Disclosures - an amendment to GASB Statement No. 3 updated the custodial credit risk disclosure requirements of Statement 3 and established more comprehensive disclosure requirements addressing other common risks of deposits and investments such as credit risk, concentration of credit risk, interest rate risk and foreign currency risk.
The required disclosures related to these risks are presented on the following pages. Custodial Credit Risk – Deposits The custodial credit risk for deposits is the risk that, in the event of bank failure, the government will not be able to recover deposits or will not be able to recover collateral securities that are in the possession of an outside party. The system does not have a formal deposit policy for custodial credit risk. The State Treasury has specific guidelines for cash and deposits that are maintained in the State Treasury. The deposits in the bank in excess of the insured amount are uninsured and uncollateralized.
As of August 31, 2015, the balance of uncollateralized cash in U.S. and non-U.S. banks for investments pending settlement was $398,530,412. Custodial Credit Risk – Investments The custodial credit risk for investments (including exchange traded investment derivative instruments) is the risk that, in the event of a failure of the counterparty, the government will not be able to recover the value of investment or collateral securities that are in the possession of an outside party.
The system does not have a formal investment policy for custodial credit risk. Short-Term investments totaling $550,861,501 are held by the custodian’s agent in an investment pool not evidenced by a security, and are not exposed to custodial credit risk. All other investments (including exchange traded investment derivative instruments) are registered in the name of Teacher Retirement System or in the name of the system’s custodian Financial Section 64 . Notes to the Financial Statements which is established through a master trust custodial agreement. The securities are held by the custodian in the name of the system. Any cash collateral received associated with investment derivative activity is invested in an agent managed pool that is not evidenced by securities that exist in physical or book entry form, and are not exposed to custodial credit risk. At August 31, 2015, the system held no collateral associated with investment derivative activity. At August 31, 2015, the deposits with broker on exchange-traded investment derivative instruments and investment derivative instruments subject to mandatory clearing through a designated clearing organization in the amount of $578,819,254 were uninsured and uncollateralized. Credit Risk of Investment Derivative Instruments and Debt Securities The credit risk for the system’s investments in debt securities, Short-Term Investment Funds, and over-the-counter investment derivative instruments in asset positions is the risk that an issuer or other counterparty to an investment will not fulfill its obligations. The system’s primary sources of credit risk are derivative counterparty credit risk, the risk from repurchase agreements, and securities lending. The system does not have a formal credit risk policy relating to its investments in Short-Term Investment Funds.
For over-the-counter (OTC) derivatives, any counterparty in a transaction with TRS must have a credit rating of at least A- (Standard & Poor’s or Fitch) or A3 (Moody’s) or better at the inception of the contract. All OTC derivative transactions, including those managed through Agency Agreements, must be subject to established ISDA Master Agreements and have full documentation of all legal obligations of TRS under the transactions. All ISDA Master Agreements provide that netting applies.
To minimize the system’s exposure to loss related to credit risk, the system may use collateral arrangements to mitigate counterparty credit risk. The system has negotiated thresholds for each counterparty above which collateral must be posted. The net market value of all over-the-counter derivative positions, less collateral posted, for any individual counterparty may not exceed $500 million.
The net market value of all over-thecounter derivative positions, without consideration collateral, may not exceed five percent of the total market value of the fund. The system’s investment policy clarifies that termination of the transaction is allowed. Repurchase transactions and tri-party repurchase transactions may not exceed five percent of the market value of the total investment portfolio, including cash and cash equivalents, unless those transactions are covered by a third-party indemnification agreement by an organization that bears a long-term NRSRO credit rating of A- or better and is enhanced by acceptable collateral.
A securities lending agent must be an organization rated A- or better by a NRSRO. The system’s rated counterparties on investment derivative instruments in an asset position, and rated debt investments as of August 31, 2015, using the Standard & Poor’s (S&P) rating scale, are as follows and on the following page. Investment Derivative Instruments: the aggregate fair value of investment derivative instruments in asset positions at August 31, 2015, was $136,406,437. This represents the maximum loss that would be recognized at August 31, 2015, if all counterparties failed to perform as contracted. This maximum exposure is reduced by $119,329,395 of liabilities included in netting arrangements with those counterparties resulting in a net exposure of investment derivative instruments to credit risk of $17,077,042. At August 31, 2015, approximately 98.5% of the net exposure to credit risk of $17,077,042 are held with three counterparties, all with an S&P rating of A.
Approximately 1.5% of the net exposure to credit risk is held with one counterparty with an S&P rating of AA. Financial Section 65 . Notes to the Financial Statements Debt Securities: Investment Type S&P Rating Short-Term Investment Fund Other Short-Term Total Credit Risk of Short-Term U.S. Treasury Bill** Short-Term Foreign Currency Contracts Total Short-Term (Exhibit I) U.S. Government Agency Obligations Total U.S. Government Agency Obligations* Asset and Mortgage Backed Obligations Asset and Mortgage Backed Obligations Asset and Mortgage Backed Obligations Asset and Mortgage Backed Obligations Asset and Mortgage Backed Obligations Asset and Mortgage Backed Obligations Asset and Mortgage Backed Obligations Asset and Mortgage Backed Obligations Asset and Mortgage Backed Obligations Asset and Mortgage Backed Obligations Total Asset and Mortgage Backed Obligations Corporate Obligations Corporate Obligations Corporate Obligations Corporate Obligations Corporate Obligations Corporate Obligations Total Corporate Obligations International Government Obligations International Government Obligations International Government Obligations International Government Obligations International Government Obligations Total International Government Obligations International Corporate Obligations International Corporate Obligations Total International Corporate Obligations Total Credit Risk of Debt Securities (excluding Short-Term) U.S.
Government Obligations and U.S. Government Agency Obligations** $ 2,813,074,520 550,861,501 3,363,936,021 9,596,171 86,385 3,373,618,577 36,178,295 36,178,295 4,223,232 4,806,261 6,626,343 12,417,184 37,061,321 38,060,394 47,700,317 1,350,917 9,555,653 23,904,204 185,705,826 1,303,854 17,676,184 15,001,045 1,321,250 690,031 7,279,387 43,271,751 7,282,329 5,742,309 4,949,034 5,325,646 240,405,992 263,705,310 2,387,910 862,120 3,250,030 $ 532,111,212 $ 21,031,147,797 $ Total Fixed Income (Exhibit I) NR NR Fair Value $ 21,563,259,009 $ $ AA AAA AA A BBB BB B CCC CC D NR BBB BB B CCC D NR AA A BBB CCC NR CCC NR $ $ $ $ $ $ $ $ $ $ *U.S. Government Agency Obligations with a credit rating are investments implicitly guaranteed by the U.S.
Government. **U.S. Treasury Bill, U.S. Government Obligations, and U.S.
Government Agency Obligations without a credit rating are investments explicitly guaranteed by the U.S. Government. Financial Section 66 . Notes to the Financial Statements Interest Rate Risk of Investment Derivative Instruments and Debt Securities Interest rate risk is the risk that changes in interest rates will adversely affect the fair value of an investment. Duration is a measure of a debt investment’s exposure to fair value changes arising from changes in interest rates. It uses the present value of cash flows, weighted for those cash flows as a percentage of the investment’s full price. The system does not have a formal interest rate risk policy. The table below shows the maturities of the system’s Swap contracts at August 31, 2015. Less than 1 Year $ (9,197,502) $ Maturities in Years 1-5 6-10 561,087 $ (159,612) $ Total (8,796,027) The table below shows the long-term fixed income investments by investment type, fair value, and the effective weighted duration rate as of August 31, 2015. Investment Type U.S.
Government Obligations U.S. Government STRIPS and TIPS U.S. Government Agency Obligations Asset and Mortgage Backed Obligations Corporate Obligations International Government Obligations International Corporate Obligations Total Fixed Income (Exhibit I) $ $ Fair Value 14,784,523,332 6,246,624,465 36,178,295 185,705,826 43,271,751 263,705,310 3,250,030 21,563,259,009 Effective Weighted Duration Rate 17.620 5.873 4.453 1.139 4.289 8.184 5.664 13.909 Investments Highly Sensitive to Interest Rate Changes The system’s investments in long-term Asset and Mortgage Backed Obligations are subject to prepayments by the obligees of the underlying assets in periods of decreasing interest rates.
The resultant reduction in expected cash flows will affect the fair value of these securities. Prepayments by the obligee of the underlying assets in periods of declining interest rates could reduce or eliminate the stream of income that would have been received. As of August 31, 2015, these securities totaled $185,705,826. The system invests in Commingled Funds which hold a preponderance of investments with fair values that are highly sensitive to market conditions.
The fair value of the Commingled Fund fluctuates as market conditions fluctuate. Interest rate changes are a part of changes in market conditions. As of August 31, 2015, these funds totaled $204,589,621. The system’s investments in Swap contracts have various reference rates based on various interbank offered rates.
As these reference rates fluctuate, the payments due to/from the system fluctuate. Financial Section 67 . Notes to the Financial Statements At August 31, 2015, the notional amount and fair value of these contracts were as follows: Terms ICE LIBOR GBP 3 month ICE LIBOR USD 3 month ICE LIBOR USD 1 month ICE LIBOR CHF 3 month CAD Interbank 3 month CAD Interbank 1 month MXN Interbank 1 month U.S. Fed Funds Effective Rate $ JPY BOJ Estimated Unsecured Overnight Call Rate Total Notional 805,898 146,603,946 2,040,352 17,208,572 7,399,766 2,072,180 196,565,197 21,855,162 Fair Value $ (6,364) (7,547,130) (1,138,393) (1,165,109) 45,922 (131,022) 201,466 654,916 1,390,799 $ 289,687 395,941,872 $ (8,796,027) Foreign Currency Risk – Deposits and Investments Foreign currency risk is the risk that changes in exchange rates will adversely affect the fair value of a deposit or an investment. The system does not have a formal deposit policy for foreign currency risk. The risk of holding investments in foreign currency is managed by applying currency hedge ratios to foreign exposures and potentially engaging in currency overlay strategies.
When engaging in currency overlay strategies, the maximum notional exposure of the fund to any single non-U.S. dollar developed market currency and any emerging market currency will be limited to 2% and 1% of the market value of the fund respectively. The system’s exposure to foreign currency risk at August 31, 2015, is presented in the tables on the following pages. Financial Section 68 .
Notes to the Financial Statements Deposits: Currency Australian Dollar Bangladeshi Taka Botswana Pula Brazilian Real Canadian Dollar Chilean Peso Colombian Peso Croatian Kuna Czech Koruna Danish Krone Egyptian Pound Euro Ghanaian Cedi Hong Kong Dollar Hungarian Forint Indian Rupee Indonesian Rupiah Israeli Shekel Japanese Yen Jordanian Dinar Kenyan Shilling Kuwaiti Dinar Malaysian Ringgit Mauritius Rupee Mexican Peso Moroccan Dirham New Turkish Lira New Zealand Dollar Nigerian Naira Norwegian Krone Omani Rial Pakistan Rupee Peruvian Nuevo Sol Philippine Peso Polish Zloty Pound Sterling Qatar Riyal Romanian Leu Singapore Dollar South African Rand South Korean Won Sri Lanka Rupee Swedish Krona Swiss Franc Taiwan Dollar Thai Baht Tunisian Dinar United Arab Emirates Dirham Vietnamese Dong Total Deposits Subject Foreign Currency Risk Financial Section 69 Cash in Non-U.S. Banks $ 7,433,552 118,130 85,730 1,720,989 4,357,941 52,132 96,889 28,994 97 65,031 581,285 214,841,227 87,487 12,715,107 110,241 4,219,682 88,422 271,690 71,798,080 47,696 50,653 205,538 1,073,046 115,991 1,043,970 159,549 134,135 31,573 76,985 4,310,639 30,519 90,908 106,759 30,970 1,380,347 12,097,091 37,782 19,674 472,113 1,796,692 617,718 81,818 359,608 10,407,639 8,906,802 124,226 100,495 27,118 892,174 $ 363,502,934 . Notes to the Financial Statements Investments: Currency Australian Dollar Bangladeshi Taka Botswana Pula Brazilian Real Canadian Dollar Chilean Peso Colombian Peso Croatian Kuna Czech Koruna Danish Krone Egyptian Pound Euro Ghanaian Cedi Hong Kong Dollar Hungarian Forint Indian Rupee Indonesian Rupiah Israeli Shekel Japanese Yen Jordanian Dinar Kenyan Shilling Kuwaiti Dinar Malaysian Ringgit Mauritius Rupee Mexican Peso Moroccan Dirham New Turkish Lira New Zealand Dollar Nigerian Naira Norwegian Krone Omani Rial Pakistan Rupee Peruvian Nuevo Sol Philippine Peso Polish Zloty Pound Sterling Qatar Riyal Romanian Leu Russian Ruble Singapore Dollar South African Rand South Korean Won Sri Lankan Rupee Swedish Krona Swiss Franc Taiwan Dollar Thai Baht Tunisian Dinar United Arab Emirates Dirham Vietnamese Dong Total Investments Subject to Foreign Currency Risk $ Debt 46,382,916 $ 77,612,560 862,121 879,430 5,742,309 7,282,329 121,700,315 4,105,451 $ 264,567,431 $ Alternative Commingled Equity Investments Funds Derivatives 335,998,187 $ $ $ $ 10,609,129 5,424,571 546,333,717 6,088 752,643,891 (85,100) 74,555,400 32,240,572 6,822,095 38,318,908 412,662,489 25,707,404 4,530,380,282 2,184,241,298 583,820,985 160,564 2,438,845 2,422,104,732 3,642 40,820,477 927,492,749 290,084,185 20,111,305 3,676,999,933 801,257 6,759,199 8,717,338 15,746,691 192,524,791 103,140 6,436,697 400,317,361 201,466 6,226,569 172,621,654 2,452,370 6,355,634 236,723,408 6,104,366 40,302,217 3,964,217 120,185,919 128,074,837 2,880,961,882 408,808,437 (6,364) 32,154,666 9,828,174 40,144,094 90,947,255 730,833,031 1,343,192,942 (862,433) 5,800,626 348,702,050 1,112,997,407 (1,165,109) 908,458,514 (172,046) 287,784,474 38,550 2,469,803 35,337,982 5,891,058 23,340,766,097 $ 2,593,049,735 $ Financial Section 70 583,820,985 $ (976,345) $ Total Fair Value 382,381,103 10,609,129 5,424,571 546,339,805 752,558,791 74,555,400 32,240,572 6,822,095 38,318,908 412,662,489 25,707,404 7,376,215,689 2,438,845 2,422,108,374 40,820,477 928,354,870 290,084,185 20,111,305 3,678,680,620 6,759,199 8,717,338 15,746,691 192,627,931 6,436,697 406,261,136 6,226,569 172,621,654 9,734,699 6,355,634 236,723,408 6,104,366 40,302,217 3,964,217 120,185,919 128,074,837 3,411,464,270 32,154,666 9,828,174 40,144,094 90,947,255 734,938,482 1,342,330,509 5,800,626 348,702,050 1,111,832,298 908,286,468 287,823,024 2,469,803 35,337,982 5,891,058 26,781,227,903 . Notes to the Financial Statements H. SECURITIES LENDING The system is authorized by Texas Government Code, Section 825.303 to contractually lend securities to borrowers in accordance with policy established by the board of trustees and as required by statute. The system has a contract with State Street Bank and Trust Company to administer its securities lending program for domestic and international equity and fixed income securities. Authorized collateral for the program consists of cash or government securities eligible for book entry in either the Federal Reserve System or Participants Trust Company.
The required collateral is based upon the lent security’s fair value plus accrued income. At a loan’s inception, the value of the collateral must be at least 102% of the value of domestic lent securities and at least 105% for international lent securities. Collateral is marked to market daily, and in the case it falls below 100% for domestic or 105% for international, it is reinstated to the original requirements by the borrower. Cash collateral can be invested in a cash collateral pool, U.S.
government or U.S. government sponsored entity securities, time deposits, bank certificates of deposit, bankers’ acceptances, master notes, repurchase agreements, bank and corporate notes, commercial paper, asset backed securities, and derivative instruments. The system’s policies for securities lending provide investment guidelines for different asset classes to limit its exposure to different types of risks. The par value, dollar-weighted average maturity of the collective cash collateral investment may not exceed 120 days.
The expected final maturity of any individual fixed-rate instrument has a limit of 36 months and any floating-rate instrument has a limit of seven years. Each instrument having a maturity of 13 months or less at the time of purchase must qualify as “first tier securities” within Rule 2a-7 under the Investment Company Act of 1940 and any instrument over 13 months must be rated within the highest major, long-term rating category of an NRSRO, or, if unrated, be determined to be of comparable quality by the trustees. The system does not have a formal custodial credit risk policy relating to its securities lending program. All cash collateral received is invested in an unrated cash collateral pool held by the counterparty, the system’s securities lending agent and is not exposed to custodial credit risk. The following table shows the underlying securities for non-cash collateral loans which are also held by the counterparty, the securities lending agent, but not in the system’s name and are not insured. Investment Type Domestic Obligations Domestic Equities International Equities Total $ $ Fair Value 3,913,935 417,952,146 44,404,802 466,270,883 The system earns income from fees paid by the borrowers and interest earned from investing the cash collateral.
The contract requires the custodian to indemnify the system if the borrower fails to return the securities or income distributions made while the securities are on loan. Non-cash collateral cannot be pledged or sold unless the borrower defaults. Substantially all securities loans can be terminated on demand either by the system or the borrower, although, as of August 31, 2015, the weighted average term of these loans was five days.
As of August 31, 2015, the weighted average maturity of the invested cash collateral was 30 days, and there was no credit risk exposure to borrowers because the amounts owed to borrowers exceeded the amounts owed to the system. During the year there were no significant violations of contractual provisions, no borrower or custodian default losses and no recoveries of prior period losses. The total market value of all loans cannot exceed 30% of the portfolio. Financial Section 71 .
Notes to the Financial Statements The following table represents the fair market values of the securities lending transactions based on type of collateral received as of August 31, 2015: Cash $ 18,870,536,867 $ 19,379,483,580 $ 19,372,421,460 Securities on Loan Collateral Received Reinvested Collateral Non-Cash $ 466,270,883 $ 477,599,005 Total $ 19,336,807,750 $ 19,857,082,585 $ 19,372,421,460 For fiscal year 2015, the system earned income of $81,873,041 from securities lending. I. OTHER INVESTMENTS AND CONTINGENT COMMITMENTS The system’s investment derivative instruments include provisions that require the system to post collateral in the event that the fair value surpasses a specified contractual threshold. If the collateral posting thresholds of all these investments derivative instruments did not exist at August 31, 2015, the system would be required to post the aggregate amount of $43,789,055 in collateral to its counterparties. Where none of the contractual thresholds were surpassed, the system has posted no collateral at August 31, 2015. The system’s investments in certain limited partnerships commit the system to possible future capital contributions.
At August 31, 2015, the remaining commitment was $26,223,477,366. NOTE 4: EMPLOYEE COMPENSABLE LEAVE Salary costs related to employees’ rights to be compensated for leave balances are accrued as expenses in the period in which the services are rendered. Accumulated compensable leave liabilities are reported in the Statement of Fiduciary Net Position for the Pension and Other Employee Benefit Trust Funds and in the Statement of Net Position for the Enterprise Funds. The employees’ compensable leave activity for fiscal year 2015 is shown in the table below. Beginning Balance 09/01/14 Additions Amounts Due Within One Year Ending Balance 08/31/15 Reductions Amounts Due Thereafter Fiduciary Funds: Pension Trust Fund TRS-Care $ $ 7,531,766 $ (6,797,621) $ 7,729,025 $ 4,865,394 $ 2,863,631 311,358 $ (297,901) 315,327 187,267 128,060 149,176 (157,729) 139,617 100,022 39,595 9,932 403(b) Administrative Program 301,870 148,170 Proprietary Funds: TRS-ActiveCare Total 6,994,880 24,402 (32,569) 1,765 1,765 7,464,340 $ 8,007,214 $ (7,285,820) Financial Section 72 $ 8,185,734 $ 5,154,448 $ 3,031,286 .
Notes to the Financial Statements NOTE 5: OPERATING LEASES In fiscal year 2014, TRS entered into a non-cancelable operating lease agreement for building space which expires March 31, 2021. As part of the building lease, TRS received a construction allowance which is being amortized on a straight-line basis over the life of the lease as a reduction of rental expenses. Rental expenses related to the lease for the fiscal year ended August 31, 2015 for the Pension Trust Fund were $1,834,116 and include amortization of unrealized lease incentives of $420,170. Off-site storage fees for data security was $13,890. The future minimum lease payment for the next six years ending August 31 are as follows: Amount Fiscal Year 2016 2017 2018 2019 2020 2021 Total $ $ 1,095,304 1,125,150 1,161,936 1,196,663 1,232,526 731,457 6,543,036 NOTE 6: FRINGE BENEFITS PAID BY THE STATE OF TEXAS AND THE FEDERAL GOVERNMENT The state has a joint contributory retirement plan for substantially all its employees. The employees of TRS participate in the same plan they administer (Note 12). Federal legislation enacted in January 2006 established prescription drug coverage for Medicare beneficiaries known as Medicare Part D.
One of the provisions of Medicare Part D provided retiree drug subsidy reimbursements to TRS-Care on behalf of certain plan participants totaling $14,013,622 for the fiscal year ended August 31, 2015. Under TRS-Care’s Employer Group Waiver Plan (EGWP) reimbursements totaled $43,652,580 for Medicare Part D direct subsidies, $61,663,640 for catastrophic reinsurance subsidies and $7,476,810 for low income subsidies. NOTE 7: DEFERRED COMPENSATION Employees of the system may elect to defer a portion of their earnings for income tax and investment purposes pursuant to authority granted in the Tex. Gov.
Code Ann., Sec. 609.001. Two plans are available for employees.
Both plans are administered by the Employees Retirement System. The system has no additional or unfunded liability for this program. NOTE 8: CONTINGENT LIABILITIES Sick leave, the accumulation of which is unlimited, is earned at the rate of eight hours per month and is taken only in the event of illness or paid to the estate of an employee in the event of death. The maximum sick leave that may be paid to an employee’s estate is one-half of the employee’s accumulated entitlement or 336 hours, whichever is less.
The system’s policy is to recognize the cost of any sick leave when paid. Financial Section 73 . Notes to the Financial Statements The system is contingently liable for benefits payable to retiring members who remain in a pending status longer than 30 days after fiscal year end. In addition, under Texas Insurance Code, Article 3.51-7, the system is contingently liable to pay a lump-sum death benefit not to exceed $5,000 when added to the death benefit authorized under Texas Government Code, Title 8, Chapter 824, to the beneficiaries of deceased, retired employees. A Performance Incentive Compensation Plan was adopted effective October 1, 2007 and modified October 1, 2008 to enable the system to remain competitive in its efforts to attract, retain and motivate high caliber investment division staff. The purpose of the Plan is to provide the opportunity for investment division employees to earn performance incentive pay based on the fund’s investment performance and the employee’s job performance. The performance incentive pay is paid over the subsequent 2 years. For the incentive pay plan year ending September 30, 2015 the liability is estimated not to exceed $ 16 million.
Payments can only be earned following years in which the fund experiences a positive return, and employees must be employed by TRS on the designated dates in the Plan to earn and receive payment. The board of trustees may cancel or modify the Plan at any time. TRS is a defendant in litigation involving issues arising from its normal activities. The outcome of this litigation cannot be determined at this time.
Based upon consultation with legal counsel, management believes there will be no material adverse effect on the basic financial statements as a result of the ultimate outcome of these matters. NOTE 9: CONTINUANCE SUBJECT TO REVIEW As provided by Texas Government Code, Title 8, Section 825.006, “The board of trustees of the Teacher Retirement System of Texas is subject to review under Chapter 325 (Texas Sunset Act), but is not abolished under that chapter. The board shall be reviewed during the period in which state agencies abolished in 2019, and every 12th year after that year, are reviewed.” NOTE 10: POST-EMPLOYMENT HEALTH CARE BENEFITS A. PLAN DESCRIPTION TRS Employees Employees of the system who retire with 10 or more years of eligible service credit and meet the Rule of 80 or are at least 65 years of age continue to receive health care and basic life insurance benefits through the Group Benefits Program of the State Retiree Health Plan (SRHP) in accordance with Texas Insurance Code, Chapter 1551.
The SRHP is maintained and administered through the Employees Retirement System (ERS) of Texas and is considered a cost-sharing, multipleemployer, defined benefit post-employment health care plan. ERS issues a publicly available financial report that includes financial statements and required supplementary information for the SRHP. That report may be obtained by visiting the ERS website at www.ers.state.tx.us, by writing to the Finance Division of the Employees Retirement System of Texas at 200 East 18th Street, Austin, Texas 78701, or by calling 1-877-275-4377. Benefits and contribution provisions of the SRHP are not actuarially determined, but are authorized by state law and may be amended by the Texas Legislature.
For the year ended August 31, 2015, the system contributed up to a maximum monthly amount on a pay-as-you-go basis toward a retiree’s health and basic life insurance premiums as follows: Financial Section 74 . Notes to the Financial Statements Employer Contribution Rates Retiree Health and Basic Life Premium Type of Coverage FY 2015 FY 2014 FY 2013 Member Only Member/Spouse Member/Children Member/Family $ 537.66 $ 503.14 $ 470.38 845.54 791.16 739.58 743.80 696.00 650.62 1,051.68 984.02 919.82 The system covers 100% of a Member Only premium and 50% of their additional premiums for family coverage. The basic plan includes up to $2,500 for life insurance for the retiree. The retiree contributes any premium over and above the system’s contribution for additional coverage. The board has adopted contributions based on rates set by the Texas Legislature on a biennial basis.
At August 31, 2015, there were 255 retirees and their beneficiaries receiving postemployment health care and basic life insurance benefits. Contractually required contributions to the SRHP are currently based on the annual pay-as-you-go expenses of the SRHP. For the year ended August 31, 2015, 2014, and 2013 the system recognized expenditures of $1,822,022, $1,649,877, and $1,426,887, respectively, for these benefits.
The system has annually made 100 percent of its contractually required contributions to the SRHP. Public School Employees TRS, as trustee, administers the Texas Public School Retired Employees Group Insurance Program (TRS-Care) and the related fund in accordance with Texas Insurance Code, Chapter 1575. Sections 1575.202 to 204 establish state, active employee, and public school contribution rates. Section 1575.052 grants the board the authority to establish basic and optional group insurance coverage for participants.
Charter Schools in the TRS system are considered “open enrollment” and receive the same treatment as public school employees. TRS-Care is a cost-sharing, multiple-employer, defined benefit, other post-employment benefit (OPEB) plan that is currently funded on a pay-as-you-go basis and is subject to change based on available funding. The Texas Legislature determines the funding of benefits and has no continuing obligation to provide benefits beyond each fiscal year. At the inception of the plan in fiscal year 1986, funding was projected to last 10 years through fiscal year 1995. The original funding was sufficient to maintain the solvency of the fund through fiscal year 2000.
Since that time, appropriations and contributions have been established to be sufficient to provide benefits for the biennium. To alleviate a funding shortfall for the 2016-17 biennium, the 84th Texas legislature, House Bill 2 appropriated $768 million in supplemental funding that was paid in August 2015. Eligibility generally includes TRS public school retirees with more than 10 years of service and their dependents. Retirees can receive a free basic level of coverage, and optional coverage is also available.
All dependent coverage is optional. Basic coverage is a comprehensive major medical group health insurance plan. During fiscal year 2015, deductibles were $1,800 for those enrolled in Medicare Part A and eligible for Part B, $3,000 for those not enrolled in Medicare Part A, but eligible for Part B, and $4,000 for those not enrolled in Medicare. Financial Section 75 .
Notes to the Financial Statements At August 31, 2015, the number of reporting entities is summarized in the chart below. Other contributing entities include the State of Texas and the Federal Government. Independent School Districts Charter Schools (open enrollment only) Regional Education Service Centers Other Educational Districts Total 1,025* 189 20 5 1,239 *Excludes Windham School District which is not covered by OPEB. At August 31, 2015, OPEB membership consisted of the following: Retirees and beneficiaries receiving Benefits Active Plan Members Total 259,578 684,578 944,156 B. CONTRIBUTIONS Funding for free basic coverage is provided by the program based upon public school district payroll. The State of Texas, active public school employee and reporting entities contribution rates and amounts collected are reflected in the table below for fiscal year 2015.
Per Texas Insurance Code, Chapter 1575.204, the public school contribution may not be less than 0.25% or greater than 0.75% of the salary of each active employee of the public school. Funding for optional coverage is provided by those participants selecting the optional coverage. Actuarial implications of the overall funding are determined by the system’s actuary. The following table shows past and future contribution rates: Financial Section 76 .
Notes to the Financial Statements The contributions shown above and premium contributions of $369,066,459 contribute toward the total plan expenditures of $1,664,331,365. Expenses for TRS-Care are recognized as retirees report claims and include a provision for estimated claims incurred but not yet received. The actuarial valuation of TRS-Care is similar to the actuarial valuations performed for the pension plan, except that the OPEB valuation is more complex. All of the demographic assumptions and most of the economic assumptions are identical to those which were adopted by the Board in 2015 based on the 2015 actuarial experience study of TRS. Additional valuation information follows: Valuation Date ..................................................... August 31, 2015 Actuarial Cost Method .................................
Projected Unit Credit Amortization Method ....................................Level Percent, Open Remaining Amortization Period ...................................... 30 Years Asset Valuation Method .................................................... Market Actuarial Assumptions: Investment Rate of Return * .........................................
5.25% Payroll Growth Rate ...................................................... 2.50% Projected Salary Increases *........................... 3.50% to 9.50% Weighted-Average at Valuation Date .......................
4.79% Healthcare Trend Rates *..............................10.00% to 4.20%** *Includes Inflation at 2.50% **Initial rates are 7.50% for medical and 10.00% for prescriptions. Certain economic and behavioral assumptions are unique to medical benefits. The following assumptions used for members of TRS are identical to the assumptions employed in the August 31, 2015 TRS annual actuarial valuation: Rate of Mortality General Inflation Rates of Retirement Wage Inflation Rates of Termination Expected Payroll Growth Rates of Disability Incidence The following assumptions which are specific to TRS-Care were updated from the prior year’s report: ï‚· The trend rates were reset to better reflect the plan’s anticipated experience. The new trend assumptions assume: o Faster growth in prescription drug costs than the prior assumption o Retiree premiums will not increase in FY 2017 o A lower ultimate trend assumption based on the revised inflation assumption ï‚· The ultimate trend assumption was increased by 0.2% to reflect the anticipated costs associated with the “Cadillac Tax”.
This is an excise tax on high cost health plans offered by employers. Beginning in 2018, health plans that cost more than $10,200 for an individual or $27,500 for a family plan will be subject to the tax, which is 40% of the amount that exceeds those thresholds. Financial Section 77 . Notes to the Financial Statements The results of the actuarial valuation reflect a long-term perspective, are dependent on the actuarial assumptions used, and are subject to continual revision as actual results are compared to past expectations and new estimates are made about the future. Actual results can differ, as actual experience deviates from the assumptions. Even seemingly minor changes in the assumptions can materially change the liabilities, calculated contribution rates and funding periods. The actuarial assumptions used are designed to reduce short-term volatility in the liabilities and assets. The plan provisions used in the actuarial valuation are based on the expectations of cost sharing between the employer and plan members.
The calculations are based on the benefits provided under the terms of the substantive plan in effect at the time of the valuation and on the pattern of sharing of costs between the employer and plan members to that point. The projection of the benefits for financial reporting does not explicitly incorporate the potential effects of legal or contractual funding limitations on the pattern of cost sharing between the employer and plan members in the future. C. FUNDED STATUS AND FUNDING PROGRESS – OPEB PLAN The TRS-Care funded status is shown below: Schedule of Funding Progress (DOLLAR AMOUNTS SHOWN IN MILLIONS) (1) Valuation as of August 31 (2) Actuarial Value of Assets 2015 $973 (3) (4) (5) Actuarial Funded Ratio Accrued Unfunded AAL Assets as a % Liability (AAL) (UAAL) (3)-(2) of AAL (2)/(3) $44,203 $43,230 2.2% (6) Annual Covered Payroll (7) UAAL as a % of Covered Payroll (4)/(6) $31,254 138% The Schedule of Funding Progress located immediately following the Notes to the Financial Statements in the Required Supplementary Information (RSI) presents multi-year trend information about whether the actuarial value of plan assets is increasing or decreasing relative to the actuarial accrued liability for benefits paid. NOTE 11: RISK MANAGEMENT The 77th Texas Legislature enacted the Texas Active School Employees Uniform Group Benefits Act (H.B. 3343), establishing a new statewide health coverage program for public school employees and their dependents.
TRS began administering this program, known as TRS-ActiveCare, September 1, 2002. The plan is available to all public school districts, charter schools with open enrollment, education service centers and certain other employers. The risk associated with this program is retained by the plan’s participants, and no risk is transferred to the plan’s administrators, to employers, or to the state. NOTE 12: PENSION DISCLOSURE A.
PLAN DESCRIPTION The Teacher Retirement System of Texas is a public employee retirement system (PERS) that is a multiple-employer, costsharing, defined benefit pension plan with a special funding situation. The plan is administered through a trust and has the following characteristics: Financial Section 78 . Notes to the Financial Statements ï‚· Contributions from employers and non-employer contributing entities to the pension plan and earnings on the plan are irrevocable, ï‚· Pension plan assets are dedicated to providing pensions to plan members in accordance with benefit terms, and ï‚· Pension plan assets are legally protected from the creditors of employers, non-employer contributing entities, and the pension plan administrator. Plan assets are also legally protected from creditors of the plan members. Benefits are established or amended primarily under the authority of the provisions of the Texas Constitution, Article XVI, Section 67 and by the Legislature in the Texas Government Code, Title 8, Subtitle C. The pension’s board of trustees does not have the authority to establish or amend benefits. The normal service retirement is at age 65 with 5 years of credited service or when the sum of the member’s age and years of credited service equals or exceeds 80 years.
The benefit formula is 2.3 percent (multiplier) times the average of the five highest annual creditable salaries times years of credited service to equal the annual standard annuity. For members who are grandfathered, the three highest annual salaries are used. To be eligible for disability retirement, a member must have a physical or mental disability that precludes the member’s continued performance of current duties, and the disability must be certified by the TRS Medical Board as probably permanent.
Reduced service retirement is at age 55 with 5 years of credited service and any age below 50 with 30 years of credited service. A member is fully vested after 5 years of creditable service and entitled to any benefit for which eligibility requirements have been met. The plan does not provide automatic cost of living adjustments (COLA’s).
Death and Survivor retirement benefits are available to the beneficiary of an active member. For more detail about benefits see the Summary of Benefits section in this report. Contributors to the plan include members, employers and the State of Texas as the only non-employer contributing entity. The State is also the employer for senior colleges, medical schools and state agencies including TRS. In each respective role, the State contributes to the plan in accordance with state statutes and the General Appropriations Act. As of August 31, 2015, the numbers of participating employers were as follows: Independent School Districts Charter Schools (open enrollment only) Community and Junior Colleges Senior Colleges and Universities Regional Service Centers Medical Schools Educational Districts State Agencies Total 1,025 189 50 48 20 9 5 ___ 1 1,347 All employees of public, state-supported educational institutions in Texas who are employed for one-half or more of the standard work load and who are not exempted from membership under Texas Government Code, Title 8, Section 822.002, are covered by the system. As of August 31, 2015, TRS gross membership consisted of the following: Retired plan members or beneficiaries currently receiving benefits Inactive plan members entitled to but not yet receiving benefits Active plan members Total Financial Section 79 377,738 252,560 828,945 1,459,243 .
Notes to the Financial Statements The Average Expected Remaining Service Life (AERSL) of 6.9029 is based on the membership information as of the beginning of the fiscal year. B. CONTRIBUTIONS Contribution requirements are established or amended pursuant to the following state laws: (1) Article 16, section 67 of the Texas Constitution requires the legislature to establish a member contribution rate of not less than 6% of the member’s annual compensation and a state contribution rate of not less than 6% and not more than 10% of the aggregate annual compensation paid to members of the system during the fiscal year. Government Code section 821.006 prohibits benefit improvements, if as a result of the particular action, the time required to amortize TRS’ unfunded actuarial liabilities would be increased to a period that exceeds 31 years, or, if the amortization period already exceeds 31 years, the period would be increased by such action. Actuarial implications of the funding provided in this manner are determined by the system’s actuary. As the non-employer contributing entity, the State of Texas contributes to the retirement system an amount equal to the current employer contribution rate times the aggregate annual compensation of all members of the pension trust fund during that fiscal year reduced by the amounts described below which are paid by the employers. Employers (public school, junior college, other entities or the State of Texas as the employer for senior universities and medical schools) are required to pay the employer contribution rate in the following instances: • On the portion of the member's salary that exceeds the statutory minimum for members entitled to the statutory minimum under Section 21.402 of the Texas Education Code. ï‚· During a new member’s first 90 days of employment. ï‚· When any part or all of an employee’s salary is paid by federal funding sources, a privately sponsored source, from non-educational and general, or local funds. ï‚· When the employing district is a public junior college or junior college district, the employer shall contribute to the retirement system an amount equal to 50% of the state contribution rate for certain instructional or administrative employees; and 100% of the state contribution rate for all other employees. Employers are also required to pay surcharges in the following cases: • When a school district or charter school does not contribute to the Federal Old-Age, Survivors and Disability Insurance (OASDI) Program for certain employees, they must contribute 1.5% of the applicable salary.
Senate Bill 1458 of the 83rd Texas Legislature amended the Government Code section 825.402 to add the 1.5% contribution for those school districts and charter schools. • When employing a retiree of the Teacher Retirement System, the employer shall pay an amount equal to the member contribution and the state contribution as an employment after retirement surcharge. Employee contribution rates are set in state statute, Texas Government Code 825.402. Senate Bill 1458 of the 83rd Texas Legislature amended Texas Government Code 825.402 for member contributions and established employee contribution rates for fiscal years 2015 thru 2017. The 83rd Texas Legislature, General Appropriations Act established the employer contribution rate for fiscal year 2015.
Contribution rates and amounts for fiscal year 2015 are as follows: Financial Section 80 . Notes to the Financial Statements Fiscal Year 2015 Contribution Rate Contributor Member Non-Employer Contributing Entity (State) Employers Total 6.7 % 6.8 6.8 Amount $2,576,024,311 1,591,482,988 1,017,295,316 $5,184,802,615 The following table shows past and future contribution rates: Year Contribution Rates Member 2013 2014 2015 2016 2017 6.4% 6.4 6.7 7.2 7.7 Employer 6.4% 6.8 6.8 6.8 6.8 C. LEGAL RESERVE ACCOUNT BALANCES Section 825.309 of the Government Code requires that money in the Retired Reserve Account be used to pay all retirement annuities and all death or survivor benefits, including post-retirement benefit increases and other adjustments to annuities. The balances in the statutory accounts as of August 31, 2015 were: Member Savings Account State Contribution Account Retired Reserve Account Deferred Retirement Option Account Expense Account Total (Exhibit 1) $ 33,982,141,449 12,400,234,982 82,026,879,743 29,290,153 100,159,885 $ 128,538,706,212 D. DEFERRED RETIREMENT OPTION PROGRAM The Deferred Retirement Option Plan (DROP) was closed to new members on December 31, 2005. It was a plan available for active members who were eligible for normal age service retirement and had at least 25 years of credited service.
They could choose to participate in 12-month increments for up to five years. For detailed information on the plan, see the Summary of Benefits section. The remaining balance in the reserve account is shown in item C.
above. Financial Section 81 . Notes to the Financial Statements E. PENSION LIABILITY Components of the Liability – Components of the Net Pension Liability of the pension plan as of August 31, 2015 are as follows: Components of Liability Total Pension Liability Less: Plan Fiduciary Net Position Net Pension Liability Net Position as a Percentage of Total Pension Liability Amount $163,887,375,172 (128,538,706,212) $ 35,348,668,960 78.43 % Actuarial Assumptions – The total pension liability is determined by an annual actuarial valuation. The actuarial methods and assumptions have been selected by the Board of Trustees based upon analysis and recommendations by the System’s actuary. The Board of Trustees has sole authority to determine the actuarial assumptions used for the plan.
The actuarial methods and assumptions are primarily based on a study of actual experience for the four year period ending August 31, 2014 and were adopted in September 2015. The active mortality rates were based on 90% of the RP 2014 Employee Mortality Tables for males and females. The Postretirement mortality rates were based on the 2015 TRS Healthy Pensioner Mortality Tables. Discount Rate – A single discount rate of 8.0 % was used to measure the total pension liability. There was no change in the discount rate since the previous fiscal year.
This single discount rate was based on the expected rate of return on pension plan investments of 8.0%. The projection of cash flows used to determine this single discount rate assumed that contributions from plan members and those of the contributing employers and the non-employer contributing entity will be made at the rates set by the legislature during the 2013 legislative session and continued in the 2015 session. Based on those assumptions, the pension plan’s fiduciary net position was projected to be available to make all future benefit payments of current plan members. Therefore, the long-term expected rate of return on pension plan investments was applied to all periods of projected benefit payments to determine the total pension liability with no cross-over point to a municipal bond rate. The long-term expected rate of return on pension plan investments is 8.0%.
The long-term expected rate of return on pension plan investments was determined using a building-block method in which best estimate ranges of expected future real rates of return (expected returns, net of pension plan investment expense and inflation) are developed for each major asset class. These ranges are combined to produce the long-term expected rate of return by weighting the expected future real rates of return by the target asset allocation percentage and by adding expected inflation. Best estimates of geometric real rates of return for each major asset class included in the System’s target asset allocation as of August 31, 2015 are summarized in Note 3. Financial Section 82 .
Notes to the Financial Statements The following assumptions were applied to this measurement period: Valuation Date Actuarial Cost Method Asset Valuation Method Actuarial Assumptions: Single Discount Rate Long-term expected Investment Rate of Return Municipal Bond Rate* Last year ending August 31 in the 2015 to 2114 projection period (100 years) Inflation Salary Increases Benefit Changes during the year Ad hoc post-employment benefit changes * August 31, 2015 Individual Entry Age Normal Market Value 8.00 % 8.00 % N/A* 2114 2.50 % 3.50 % to 9.50 % including inflation None None If a municipal bond rate was to be used, the rate would be 3.790% as of August 2015 (i.e. the weekly rate closest to but not later than the Measurement Date). The source for the rate is the Federal Reserve Statistical Release H.15, citing the Bond Buyer Index of general obligation bonds with 20 years to maturity and an average AA credit rating. Sensitivity of the Net Pension Liability – The following presents the net pension liability of the plan using the discount rate of 8 percent, as well as what the net pension liability would be if it were calculated using a discount rate that is onepercentage point lower (7%) or one-percentage point higher (9%) than the current rate: Sensitivity of the Net Pension Liability to the Single Discount Rate Assumptions 1% Decrease Current Single Discount Rate 1% Increase 7% 8% 9% $55,384,701,778 $35,348,668,960 $18,659,898,872 NOTE 13: SUBSEQUENT EVENTS Teacher Retirement System formed a “private limited company” or subsidiary in the United Kingdom. The name of the subsidiary is “Teacher Retirement Investment Company of Texas Ltd.” The subsidiary was created for the purpose of opening a London investment office and is expected to be operational in November 2015.
The primary purpose of the office is to increase the size and number of investment opportunities for the TRS portfolio, especially in private equity funds and co-investments. Financial Section 83 . Required Supplementary Information PENSION TRUST FUND Fiscal Years 2006-2015 SCHEDULE OF CHANGES IN THE EMPLOYERS' NET PENSION LIABILITY AND RELATED RATIOS LAST TEN FISCAL YEARS (DOLLAR AMOUNTS SHOWN IN THOUSANDS) 2015 Total Pension Liability* Service Cost Interest on Net Pension Liability Differences between Expected and Actual Experience Changes of Actuarial Assumptions Benefit Payments Refunds of Member Accounts Net Change in Total Pension Liability Total Pension Liability--Beginning Total Pension Liability--Ending (a) Plan Fiduciary Net Position Contributions--Employer Contributions--Member Non-Employer Contributing Entity Net Investment Income Benefit Payments Refunds of Member Accounts Administrative Expense Other Net Change in Plan Fiduciary Net Position $ 4,225,449 $ 12,555,646 2014 2013 3,965,994 $ 11,813,446 $ (1,588,619) 482,639 (1,474,724) 2,028,541 (8,935,112) (8,548,643) (391,341) (410,600) $ 4,391,299 $ 9,331,377 159,496,076 150,164,699 $ 163,887,375 $ 159,496,076 $ 150,164,699 $ $ 1,377,973 $ 2,576,024 1,591,483 (412,759) (8,935,112) (391,341) (35,557) (11,248) (4,240,537) $ 984,552 $ 2,357,686 1,530,624 19,434,430 (8,548,643) (410,600) (41,904) 84,954 15,391,099 $ 2012 $ 925,694 $ 2,252,095 1,337,215 9,834,136 (8,075,209) (391,292) (36,264) 91,882 5,938,257 $ 0 760,838 2,188,020 1,299,078 7,847,298 (7,723,622) (381,231) (33,074) 71,793 4,029,100 Plan Fiduciary Net Position--Beginning Plan Fiduciary Net Position--Ending (b) $ 132,779,243 $ 117,388,144 $ 111,449,887 $ 107,420,787 $ 128,538,706 $ 132,779,243 $ 117,388,144 $ 111,449,887 Net Pension Liability--Ending (a)-(b) $ 35,348,669 $ 26,716,833 $ 32,776,555 Plan Fiduciary Net Position as a Percentage of the total Pension Liability* Covered-Employee Payroll Net Pension Liability as a percentage of Covered - Employee Payroll $ 78.43% 38,448,124 $ 83.25% 36,654,291 $ 78.17% 35,188,983 91.94% 72.89% 93.14% *Total pension liability is calculated using a new methodology, and will be presented on a prospective basis in accordance with GASB 67, paragraph 50. Financial Section 84 . Required Supplementary Information PENSION TRUST FUND Fiscal Years 2006-2015 2011 2010 $ $ $ $ 2009 $ 0 $ 856,220 $ 2,243,955 1,484,286 14,636,935 (7,173,505) (334,269) (35,850) 54,610 11,732,382 $ $ 95,688,405 $ $ 107,420,787 $ 2008 $ 0 $ 2007 $ 0 $ 835,605 $ 791,450 $ 2,205,017 2,107,058 1,461,035 1,378,304 9,411,447 (13,971,869) (6,617,397) (6,294,434) (265,187) (266,695) (29,993) (28,310) 34,906 26,970 7,035,433 $ (16,257,526) $ 2006 $ 0 $ 703,723 $ 1,998,139 1,352,243 (4,604,972) (6,406,645) (278,003) (26,124) 43,335 (7,218,304) $ $ 0 $ 469,568 $ 1,862,596 1,283,642 14,298,547 (5,762,885) (280,006) (27,503) 45,878 11,889,837 $ 0 432,811 1,700,415 1,166,690 8,950,870 (5,540,134) (267,810) (26,444) 114,749 6,531,147 88,652,972 $ 104,910,498 $ 112,128,780 $ 100,238,963 $ 93,707,816 95,688,405 $ 88,652,972 $ 104,910,498 $ 112,128,780 $ 100,238,963 Financial Section 85 . Required Supplementary Information PENSION TRUST FUND For Fiscal Years Ending August 31 Fiscal Year Ended August 31 2013 2014 2015 SCHEDULE OF THE EMPLOYERS' NET PENSION LIABILITY (HISTORICAL) (DOLLAR AMOUNTS IN THOUSANDS) Plan Net Position as a % of Total Total Pension Plan Net Net Pension Covered Pension Liability Liability Position Liability Payroll $150,164,699 159,496,076 163,887,375 $117,388,144 132,779,243 128,538,706 $32,776,555 26,716,833 35,348,669 78.17% 83.25 78.43 NPL as a % of Covered Payroll $35,188,983 36,654,291 38,448,124 93.14% 72.89 91.94 *Total pension liability is calculated using a new methodology, and will be presented on a prospective basis in accordance with GASB 67, paragraph 50. SCHEDULE OF EMPLOYER AND NON-EMPLOYER CONTRIBUTING ENTITY ACTUARIALLY DETERMINED CONTRIBUTIONS (ADC) Fiscal Year Ending August 31 Actuarially Determined Contribution 2014 2015 $3,177,927,012 3,171,970,234 Actual Contribution $2,515,176,220 2,969,455,641 Contribution Deficiency (Excess) Covered Payroll $662,750,792 202,514,593 Actual Contribution as a % of Covered Payroll $36,654,290,800 38,448,124,045 6.86% 7.72 *This schedule will be presented on a prospective basis in accordance with GASB 67, paragraph 50. NOTE 1 Actuarial Assumptions – The information presented in the preceding table was used in the actuarial valuation for determining the actuarially determined contribution rate. The assumptions are as follows: Valuation Date Actuarial Cost Method Amortization Method Remaining Amortization Period Asset Valuation Method Actuarial Assumptions: Inflation Salary Increases Investment Rate of Return Ad hoc post-employment benefit changes Benefit Changes during the year August 31, 2015 Ultimate Entry Age Normal Level Percentage of Payroll, Open 33 years 5 year Smoothed Market 2.5 % 3.5% to 9.50% including inflation 8.00% None None Financial Section 86 . Required Supplementary Information PENSION TRUST FUND For Fiscal Years Ending August 31 SCHEDULE OF INVESTMENT RETURNS Annual Money-Weighted Rate of Return, Net of Investment Expense 2015 2014 2013 2012 2011 2010 2009 -0.27% 16.90% 9.00% 7.46% 15.57% 10.80% (13.57%) *This schedule will be presented on a prospective basis in accordance with GASB 67, paragraph 50. Financial Section 87 . Required Supplementary Information TRS-CARE For Fiscal Years 2009 – 2015 [1] Valuation as of August 31 [2] Actuarial Value of Assets 2009 2010 2011 2012 2013 2014 2015 $800 815 891 741 551 458 973 SCHEDULE OF FUNDING PROGRESS (DOLLAR AMOUNTS SHOWN IN MILLIONS) [5] [4] Funded [3] Unfunded Ratio Actuarial AAL Assets as a Accrued Liability (UAAL) % of AAL (AAL) (3)-(2) (2)/(3) $24,357 25,808 29,785 27,542 29,835 33,719 44,203 $23,557 24,993 28,894 26,801 29,284 33,261 43,230 3.3% 3.2 3.0 2.7 1.8 1.4 2.2 [6] Annual Covered Payroll [7] UAAL as a % of Covered Payroll (4)/(6) $29,490 30,758 30,515 29,777 30,511 32,247 31,254 80% 81 95 90 96 103 138 SCHEDULE OF CONTRIBUTIONS FROM EMPLOYERS AND OTHER CONTRIBUTING ENTITIES Annual Required Contributions (ARC) (DOLLAR AMOUNTS SHOWN IN THOUSANDS) Actual Contributions [1] Fiscal Year Ended 2009 2010 2011 2012 2013 2014 2015 [2] Annual Required Contributions (ARC) $1,655,647 1,806,751 1,821,817 1,980,371 1,898,160 2,058,689 2,357,011 [3] From State [4] From Employers $267,471 279,251 282,891 272,029 241,577 303,695 1,049,199 [5] On-Behalf From Federal Government $149,563 155,918 158,724 154,608 160,953 193,125 202,976 Financial Section 88 $61,531 70,796 136,888 68,634 74,511 78,589 126,807 [6] Total (3)+(4)+(5) [7] Percentage Contributed (6)/(2) $478,565 505,965 578,503 495,271 477,041 575,409 1,378,982 28.9% 28.0 31.8 25.0 25.1 28.0 58.5 . Notes to Required Supplemental Information TRS-CARE Fiscal Years 2009 - 2015 NOTE 1 The employer ARC was determined by netting the active employee contributions (0.65%) out of the total ARC (8.38%). The ARC for FY2015 was determined by applying the Employer ARC determined in the 2014 valuation as a percentage of payroll (7.73%) to the actual payroll paid in FY2015 ($30.5 billion). Financial Section 89 . This page is intentionally left blank. Financial Section 90 . Statement of Changes in Assets and Liabilities Agency Funds For the Fiscal Year Ended August 31, 2015 Balances September 1, 2014 Additions Deductions Balances August 31, 2015 Child Support Employee Deductions Total Assets: Cash in State Treasury $5,387 $72,715 $71,503 $6,599 TOTAL ASSETS $5,387 $72,715 $71,503 $6,599 5,387 $72,715 $71,503 $6,599 TOTAL LIABILITIES 5,387 $72,715 $71,503 $6,599 The accompanying Notes to the Financial Statements are an integral part of this financial statement. Financial Section 91 Exhibit A Total Liabilities: Funds Held for Others . Comparative Schedule of Changes in Account Balance PENSION TRUST FUND FOR THE FISCAL YEAR ENDED AUGUST 31, 2015 (With Comparative Data for August 31, 2014) Schedule 1 INTEREST ACCOUNT 2015 Additions Interest, Dividends and Other Income: Short-Term Equities Fixed Income Derivatives Securities Lending Program Net Increase/ (Decrease) in Fair Value of Investments Transfer from State Contribution Account for: Investment Income* Net Depreciation in Fair Value of Investments TOTAL ADDITIONS Deductions Bank Fees External Manager Fees External Legal Fees External Custodial Fees Transfers Out: Allocation of Interest to (from): Member Savings Account Retired Reserve Account Deferred Retirement Option Account Expense Account Transfer to State Contribution Account for Net Appreciation in Fair Value of Investments TOTAL DEDUCTIONS $ 2014 3,296,668 6,248,497,146 620,420,534 $ 81,873,039 18,897,780 1,254,816,385 1,851,686,895 (6,488,625) 72,534,019 (7,107,642,634) 16,443,655,756 212,729,627 7,107,642,634 7,166,817,014 4,463,894,756 $ $ 7,150,913 181,939,993 2,655,297 22,000,000 $ 24,098,996,966 $ 930,643 152,954,835 659,595,576 6,189,324,942 667,930 103,482,363 1,568,996,846 5,824,476,921 2,295,263 105,686,702 $ 7,166,817,014 $ 16,443,655,756 24,098,996,966 Net Change in Account Balance Account Balance - Beginning September 1 $ $ 0 0 $ $ 0 0 Account Balance - Ending August 31 $ 0 $ 0 * The prior year transfer of $4,463,894,756 from State Contributions for Investment Income was reported in the Deductions section in 2014. Financial Section 92 . Comparative Schedule of Changes in Account Balance PENSION TRUST FUND FOR THE FISCAL YEAR ENDED AUGUST 31, 2015 (With Comparative Data for August 31, 2014) MEMBER SAVINGS ACCOUNT $ 2,576,024,311 2014 $ 2,357,686,000 23,508,475 6,247,139 67,386,116 $ 659,595,576 3,259,128,362 $ 1,568,996,846 4,000,316,101 $ 385,866,706 $ 405,144,490 $ 24,054,441 2,037,001,787 2,446,922,934 $ 21,531,326 1,926,583,284 2,353,259,100 Net Change in Account Balance Account Balance - Beginning September 1 $ 812,205,428 $ 33,169,936,021 $ $ 1,647,057,001 31,522,879,020 Account Balance - Ending August 31 $ 33,982,141,449 $ 33,169,936,021 Deductions Refund of Contributions-Active Transfers Out: Transfer to Retired Reserve Account: For Dormant Accounts To Fund Benefits TOTAL DEDUCTIONS Financial Section 93 Schedule 1 Additions Contributions: Contributions Paid by Member Employment After Retirement Surcharge Paid by Employers - Employee Purchase of Service Credit-Refundable Transfer In: Allocation from Interest Account TOTAL ADDITIONS 2015 . Comparative Schedule of Changes in Account Balance PENSION TRUST FUND FOR THE FISCAL YEAR ENDED AUGUST 31, 2015 (With Comparative Data for August 31, 2014) Schedule 1 STATE CONTRIBUTION ACCOUNT 2015 Additions Contributions: State's General Fund - Non-Employer Contributing Entity State's General Fund - Employer Participating Employer Surcharges: Employment after Retirement - Employee Employment after Retirement - Employer Non-OASDI Participating Employers Purchase of Service Credit-Non-Refundable Transfers In: Transfers from Interest Account for Net Increase in Fair Value of Investments Transfers from Retired Reserve Account: For Retirement Benefits Forfeited While Member Returned to Teaching For Retirement Benefits Waived by Member TOTAL ADDITIONS $ 2014 1,591,482,988 93,079,033 924,216,283 $ 1,530,623,829 120,206,921 851,936,793 7,481,714 8,339,748 344,855,875 26,580,631 6,161,538 76,147,975 16,443,655,756 Net Change in Account Balance Account Balance - Beginning September 1 654,798 38,940 $ 19,029,426,550 212,729,627 7,107,642,634 $ 4,463,894,756 4,339,063,087 556,680,791.0 $ 12,216,116,139 4,186,949,487 1,320,132,885 $ 9,970,977,128 $ (9,218,949,080) $ 21,619,184,062 Deductions Transfers Out: Transfers to Interest Account: For Investment Income For Net Decrease in Fair Value of Investments Transfers to Retired Reserve Account: To Fund Benefits Based on Actuarial Valuation as of August 31 TOTAL DEDUCTIONS 1,096,898 33,889 2,997,167,059 $ 9,058,449,422 $ 12,560,734,640 $ $ Account Balance - Ending August 31 $ 12,400,234,982 $ 21,619,184,062 * The prior year transfer of $4,463,894,756 to the Interest Account for Investment Income was reported in the Additions section in 2014. Financial Section 94 . Comparative Schedule of Changes in Account Balance PENSION TRUST FUND FOR THE FISCAL YEAR ENDED AUGUST 31, 2015 (With Comparative Data for August 31, 2014) RETIRED RESERVE ACCOUNT Additions Contributions Transferred in from Employees Retirement System of Texas $ 18,989,008 2014 $ 17,440,313 6,189,324,942 5,824,476,921 24,054,441 2,037,001,787 21,531,326 1,926,583,284 4,339,063,087 556,680,791 4,186,949,487 1,320,132,885 40,337 13,165,154,393 7,625 $ 13,297,121,841 8,215,765,876 288,923,266 169,318,064 $ 7,795,690,586 322,033,388 164,299,506 39,574,595 100,150,048 90,563,081 14,443,193 6,730,215 5,474,475 44,846,010 97,822,817 89,547,742 13,415,885 6,012,086 5,455,829 84,059,353 80,163,847 $ 1,096,898 33,889 9,016,132,953 654,798 38,940 $ 8,619,981,434 Net Change in Account Balance Account Balance - Beginning September 1 $ $ 4,149,021,440 77,877,858,303 $ 4,677,140,407 $ 73,200,717,896 Account Balance - Ending August 31 $ 82,026,879,743 $ 77,877,858,303 Deductions Benefits Paid: Service Retirement Annuities Partial Lump Sums Disability Retirement Annuities Death and Survivor Benefits: Annual Salary Survivor Annuities Life Annuities 60 Monthly Payments Remainder of Contributions Refund of Contributions-Death Benefits Transferred to Employees Retirement System of Texas Retirement Benefits Forfeited While Member: Returned to Teaching For Retirement Benefits Waived by Member TOTAL DEDUCTIONS $ $ Financial Section 95 Schedule 1 Transfers In: Allocation from Interest Account Transfer from Member Savings Account: For Dormant Accounts To Fund Benefits Transfer from State Contribution Account: To Fund Benefits Based on Actuarial Valuation as of August 31 Transfer from Deferred Retirement Option Account to Fund Benefits TOTAL ADDITIONS 2015 . Comparative Schedule of Changes in Account Balance PENSION TRUST FUND FOR THE FISCAL YEAR ENDED AUGUST 31, 2015 (With Comparative Data for August 31, 2014) DEFERRED RETIREMENT OPTION ACCOUNT Schedule 1 Additions Transfers In: Allocation from Interest Account TOTAL ADDITIONS Deductions Benefits Paid Transfer Out: Transfer from Retired Reserve Account to Fund Benefits TOTAL DEDUCTIONS Net Change in Account Balance Account Balance - Beginning September 1 Account Balance - Ending August 31 Financial Section 96 2015 2014 $ $ 667,930 667,930 $ $ 2,295,263 2,295,263 $ 9,643,121 $ 14,974,505 $ $ $ $ 40,337 9,683,458 (9,015,528) 38,305,681 29,290,153 $ $ $ $ 7,625 14,982,130 (12,686,867) 50,992,548 38,305,681 . Comparative Schedule of Changes in Account Balance PENSION TRUST FUND FOR THE FISCAL YEAR ENDED AUGUST 31, 2015 (With Comparative Data for August 31, 2014) EXPENSE ACCOUNT 2015 $ $ 4,143,449 $ Deductions: Administrative Expenses: Salaries, Wages and Other Personnel Costs Professional Fees and Services Travel Materials and Supplies Communicatons and Utilities Repairs and Maintenance Rentals and Leases Printing and Reproduction Depreciation Expense Amortization Expense Loss on Capital Assets Other Expense TOTAL DEDUCTIONS 3,733,133 103,482,363 107,215,496 $ 105,686,702 109,830,151 $ 63,381,520 1,634,050 921,395 3,470,876 644,183 3,693,269 1,879,531 235,925 2,939,923 530,953 $ $ 1,683,004 81,014,629 * $ 59,369,410 10,264,842 1,062,078 3,614,537 928,820 6,270,907 1,815,219 294,754 3,116,326 428,434 23,994 1,501,567 88,690,888 Net Change in Account Balance Account Balance - Beginning September 1 $ $ 26,200,867 73,959,018 $ $ 21,139,263 52,819,755 Account Balance - Ending August 31 $ 100,159,885 $ 73,959,018 * This amount includes total internal administrative investing activity expenses of $45,457,650 (Schedule 3) and Administrative expenses net of investing activity expenses are $35,556,979 (Exhibit II). Financial Section 97 Schedule 1 Additions: Miscellaneous Revenues Transfer In: Allocation from Interest Account TOTAL ADDITIONS 2014 . Schedule of Administrative Expenses FOR THE FISCAL YEAR ENDED AUGUST 31, 2015 Schedule 2 Pension Trust Fund Personnel Services: Salaries and Wages: Salaries Longevity Pay Benefit Replacement Pay Employee Compensable Absences Payroll Related Costs: Employer FICA Contributions Employer Health Insurance Contributions Other Employee Benefits TOTAL PERSONNEL SERVICES $ 19,753,092 419,397 57,304 734,145 TRS-Care $ 2,342,313 58,579 9,539 3,969 Other Operating Expenses: Travel Materials and Supplies: Consumable Supplies and Fuels Subscriptions and Reference Information Postage, Mailing and Delivery Services Furniture and Equipment - Expensed Communications and Utilities Repairs and Maintenance Software Purchases and Maintenance Computer Hardware Maintenance Maintenance - Buildings and Equipment Rentals and Leases Printing and Reproduction Depreciation Expense Amortization Expense Other Expense Dues, Fees and Staff Development Insurance Premiums Other Miscellaneous Expenses TOTAL OTHER OPERATING EXPENSES $ 2,901,229 $ Professional Fees and Services $ 2,305,525 4,552,174 4,212 27,825,849 175,867 310,962 369,886 $ 731,307 $ 93,414 $ 7,698 215,408 44,671 1,536,735 459,352 132,364 896 500 39,734 516 2,212 903,709 294,727 790,542 187,193 69,353 1,641,856 530,953 54,490 12,750 $ 193,816 53,448 213,703 7,361,244 $ 17,092 137,144 TOTAL ADMINISTRATIVE EXPENSES $ 35,556,979 $ 3,769,680 Financial Section 98 1,256 . TRS-ActiveCare $ 1,148,008 20,522 1,134 (8,552) 403(b) Administrative Program $ 79,090 Total $ 1,031 (8,167) $ 83,035 129,278 2,103 1,375,528 6,492 $ $ 782,921 $ 6,779 23,322,503 498,498 69,008 721,395 $ 2,570,919 4,992,414 6,315 32,181,052 $ $ 1,884,114 $ $ 107,891 78,446 308 635 216,612 45,806 1,576,469 459,868 135,632 1,056 903,709 294,727 790,792 298,351 82,103 1,641,856 530,953 250 56,668 345 $ 926 66,967 $ 0 $ 195,417 53,448 231,721 7,565,355 $ 2,225,416 $ 78,446 $ 41,630,521 Financial Section 99 . Comparative Schedule of Investing Activity Expenses PENSION TRUST FUND FOR THE FISCAL YEAR ENDED AUGUST 31, 2015 (With Comparative Data for August 31, 2014) Schedule 3 2015 Direct Expenses: Salaries and Other Personnel Costs Professional Fees and Services Consumable Supplies Travel Building Lease Copier Rentals Dues, Fees and Staff Development Subscriptions and Reference Materials Reproduction and Printing Services Software Upgrades Telecommunication and Data Services Furniture and Equipment - Expensed Depreciation - Leasehold Improvements Total Direct Expenses Indirect Expenses: Depreciation Executive Management Support Legal Support Audit Support Human Resources Support Fiscal Management Support Information Technology Support Staff Services Support Other Support Services Total Indirect Expenses Total Internal Administrative Investing Activity Expenses* Bank Fees** External Manager Fees** External Legal Fees** External Custodial Fees** Total Investing Activity Expenses (Exh. II)*** $ 30,504,075 254,558 14,709 720,295 1,430,445 97,441 42,641 63,092 12,565 110,545 300,894 83,661 259,729 33,894,650 $ 350,965 2,860,773 2,257,077 623,865 786,448 1,261,884 2,008,639 1,032,172 381,177 11,563,000 45,457,650 7,150,913 181,939,993 2,655,297 22,000,000 259,203,853 $ $ $ $ $ $ $ 2014 $ $ $ 25,389,603 4,094,014 20,568 780,085 1,347,329 92,937 32,165 49,660 9,361 128,291 400,761 58,677 516,031 32,919,482 326,386 2,829,854 3,086,944 596,652 661,321 1,220,623 3,514,812 1,176,764 453,860 13,867,216 46,786,698 152,954,835 930,643 $ 200,672,176 * Total is not netted against or included in performance calculations. ** Performance calculations are net of Bank Fees, External Legal Fees, External Manager Fees and External Custodial Fees. *** The investing activity expenses do not include the following expenditures: During fiscal year 2015, the system paid commissions to various brokers totaling $67,337,677. A portion of the total commissions was paid through various Commission Sharing Arrangements (CSA) generating $22,409,961 in CSA proceeds. These proceeds were used in accordance with Section 28(e) of the Securities Exchange Act of 1934 to acquire research services from various investment related firms totaling $21,069,278.
Unspent CSA proceeds (totaling $5,221,095) are held by State Street Bank and Trust Company as the system’s CSA Administrator. During fiscal year 2015, the system paid commissions through various external managers totaling $831,289. A portion of the total commissions was paid through various Commission Recapture Arrangements (CRA) generating $453,328 in CRA proceeds. These proceeds were used to acquire services totaling $194,018.
Unspent CRA proceeds (totaling $479,693) are held by State Street Bank and Trust Company as the system's CRA Administrator. Through its contractual agreements with various firms, the system benefited from $5,041,965 in vendor paid expenses and contractual allowances. Vendor paid expenses are legal arrangements that are used to acquire investment related items other than those paid for with soft dollar credits and CSA proceeds. In addition to the commission expenses mentioned above, $695,661,445 was paid to various Alternative and Pooled Investment General Partners for a total of $762,999,122 in fees and commissions, which are not included in Investing Activities Expense on Exhibit II. These amounts are reported in the Schedule of Fees and Commissions and are netted against investment performance on Exhibit II in the Net Increase/(Decrease) in Fair Value of Investments.
Custodial management fees were netted against income from securities lending activities. Financial Section 100 . Schedule of Professional and Consulting Fees ALL FUNDS FOR THE FISCAL YEAR ENDED AUGUST 31, 2015 Nature of Service Consulting Services Consulting Services Actuarial Services Investment Consulting Services Investment Consulting Services Legal Services Consulting Services Investment Consulting Services Financial and Accounting Services Investment Consulting Services Temporary Employment Services Other Professional Services Temporary Employment Services Legal Services Temporary Employment Services Consulting Services Investment Consulting Services Financial and Accounting Services Financial and Accounting Services Temporary Employment Services Consulting Services Consulting Services Board Election Services Consulting Services Investment Consulting Services Investment Consulting Services Investment Consulting Services Consulting Services Consulting Services Consulting Services Consulting Services Legal Services Consulting Services Consulting Services Medical Services Medical Services Medical Services Financial and Accounting Services Consulting Services Consulting Services Consulting Services Temporary Employment Services Consulting Services Consulting Services Other Professional Services Temporary Employment Services Consulting Services Other Professional Services Other Professional Services Prior Year Expenditure Adjustment TOTAL PROFESSIONAL AND CONSULTING FEES Financial Section 101 Amount $ 15,200,000 1,588,216 1,502,211 1,350,000 1,133,333 864,488 645,000 600,000 440,424 400,000 362,061 283,481 266,356 262,342 228,707 175,808 157,500 145,573 134,700 129,600 122,485 115,000 111,486 109,000 95,301 95,000 80,000 75,000 65,394 51,000 47,500 45,000 43,514 41,800 36,630 36,630 36,630 33,225 31,200 29,000 28,756 23,770 22,740 18,092 16,051 15,276 12,310 11,350 55,916 $ 27,374,856 (1,966,840) $ 25,408,016 Schedule 4 Individual or Firm Hewlett Packard Allied Consultants Inc Gabriel, Roeder, Smith, & Company Hamilton Lane Advisors LLC Hewitt Ennis Knupp, Inc Jackson Walker LLP Cognizant Technology Solutions Townsend Group, The Ernst & Young LLP Albourne America Teksystems Austin Ribbon & Computer Supplies Inc Loblolly Consulting LLC Katten Muchin Rosenman LLP Soal Technologies LLC Focus Consulting Group Inc Green Street Advisors Sagebrush Solutions Inc State Auditors Office Rhyan Technology Services Gartner Group CEM Benchmarking Inc Vr Election Services Dba Voice Retrieval Forrester Research, Inc State Street Bank And Trust Company Rosen Consulting Group Brown, Keith C. Momentum Search Partner LLC Mobius Partners Inc Customer Relationship Metrics LC Corporate Executive Board Cohen Milstein Sellers & Toll, PLLC Franklin Covey Co Perryman Group Cox, Alice D. Md Reinarz, James Allen Md Wilson, Larry Md Protiviti Inc Adjacent Technologies Inc Planet Technologies Inc Myers And Stauffer LC TIBH Industries Inc Unify Inc Workers Assistance Program Inc Lyris Technologies Unboundid Corp Texas Facilities Commission API Productions LLC Aggregate Payees less than $10,000 . This page is intentionally left blank. Financial Section 102 . INVESTMENT SECTION . Investment Overview PORTFOLIO STRUCTURE TRS follows a diversified investment approach that focuses on the three most common economic scenarios. Scenario One is characterized by favorable Gross Domestic Product (GDP) growth and moderate inflation as measured by the Consumer Price Index (CPI), which has been the prevailing economic condition 68 percent of the time since 1948. Scenario Two is one of low GDP growth and high inflation, which has occurred 18 percent of the time. Finally, Scenario Three is characterized by stagnant GDP growth and low inflation, which has occurred 14 percent of the time.
TRS is positioned to take advantage of any of these various market scenarios. TRS’s long-term asset allocation target is 57 percent to Global Equity markets, which perform well under Scenario One, 22 percent to Real Return, which should perform well in Scenario Two, 16 percent to a Stable Value portfolio, which should perform well and minimize downside risk in Scenario Three, and 5 percent to the Risk Parity strategy, which has a balanced exposure to all three economic scenarios. INVESTMENT PORTFOLIO PERFORMANCE For the year ending Aug. 31, 2015, the TRS Pension Fund (Trust) delivered investment returns of -0.3 percent, which led the fund’s benchmark by 0.5 percent.
Global Equity returned -3.1 percent, but was largely counterbalanced by returns of 6.2 percent in Stable Value and 6.1 percent in Real Return. On a three-year annualized basis, the fund has returned 8.3 percent, which is 1.0 percent above its benchmark. As a result, the total investment value of the fund as of August 31 was $127.9 billion, or $4.3 billion less than this time last year, after contributions and benefit payouts.
Annual rates of return for the five- and 10-year periods ending Aug. 31, 2015 were 9.6 percent and 6.2 percent, respectively. Additional performance information is included on the Total Time-Weighted Returns and Asset Allocation charts on the following pages. The Total Time-Weighted Returns shown are for the 12-month period ended June 30, 2015 and include comparisons with established benchmarks for the same period. Investment performance is calculated using a time-weighted rate of return.
Returns are calculated by State Street Bank and Trust Company, the fund’s custodian bank, independently and using industry best practices. STRATEGIC INITIATIVES The year 2015 marked the seventh anniversary of the TRS Public Strategic Partnership Network (SPN). At its outset, four managers (JP Morgan, Neuberger Berman, Morgan Stanley, and BlackRock) were funded with $1 billion each to invest globally across the same public asset classes as the Trust. As of Aug.
31, 2015, the total Public SPN is valued at $6.3 billion. In addition, each year, the SPN collaborates to produce several research projects used to benefit the Trust and to provide valuable insights into asset allocation. TRS also replicated the SPN concept in the private markets in 2012, establishing long-term partnerships with Apollo and KKR to manage assets in private equity, real assets, and credit markets. In early 2015, TRS committed another $1 billion each to KKR and Apollo to be directed toward tactical opportunities, including non-traditional credit investments.
As of Aug. 31, 2015, the total Private SPN has a net asset value of $2.6 billion and commitments total $10 billion. These partnerships remain in their early stages, but are already proving beneficial to the Trust. The past year saw continued growth in the successful Principal Investments Program, which seeks to take advantage of TRS’s competitive advantages as a large, long-term investor by initiating high-transparency, low-fee, alpha-producing investment arrangements with select investment partners.
Since the beginning of the program in 2009, the fund has committed $6 billion in more than 50 principal investments across Private Equity, Real Assets, Energy and Natural Resources, Special Opportunities, and Internal Public Markets. In addition, the Investment Management Division (IMD) Investment Section 104 . Investment Overview has committed another $1.2 billion across nearly 70 smaller principal investments in separate dedicated vehicles managed by select general partners, as well as an even greater volume of principal investments in side-car vehicles. In late 2014, the IMD executed an initiative called “Preferred Destination” to further increase general partner awareness of IMD’s desire to make TRS one of the world’s primary destinations for large, attractive principal investment opportunities. This effort was highly successful and has resulted in an even greater level of high quality deal flow for TRS, which will continue to make principal investments a greater portion of IMD’s private market investments. To date, this effort has been highly accretive to the Trust’s returns and it should continue to be in the future. To further support the “Preferred Destination” effort, the IMD also announced the opening of an office in London.
The office, which is expected to open in November of 2015, is TRS’s first international office. With a presence in London, the IMD hopes to be a better investment partner, have greater access to attractive deal flow, and be more knowledgeable about markets in the United Kingdom and Europe. TRS will continue to build upon its reputation as a leading institutional investor and strengthen investment relationships with key players overseas. The IMD has a dedicated risk management function.
The Risk group monitors the risk of the fund versus its risk objectives, performs an independent risk certification for every new manager commitment, and monitors the performance of each manager and portfolio monthly with a risk signals review. During the last 12 months, the Risk group continued to refine its suite of tools and reports, including expanding existing risk signals to incorporate additional performance data, Trust holdings data, macro indicators, and risk indicators. They also performed an in-depth review of best practices for stress testing various Trust exposures.
In addition to risk management, the Risk group is also increasingly active in managing certain quantitative investment strategies, with a goal of generating alpha that is uncorrelated to the alpha generated by the rest of the Trust. Looking ahead, return expectations remain muted in the years ahead. Concerns about the resilience of global growth remain, with China’s slowdown taking an increasingly prominent role on the world stage. In addition to China’s policy actions, much of the market’s focus going forward will be on the monetary policy actions of the world’s major central banks, with the Federal Reserve expected to begin raising short-term interest rates in late 2015 or early 2016, while the European Central Bank and the Bank of Japan are expected to remain accommodative. Prepared by: Investment staff of the system Investment Section 105 .
Total Time-Weighted Returns PENSION TRUST FUND For Periods Ended June 30 2010 2011 2012 2013 2014 2015 3 Years 5 Years 10 Years TRS Custom Benchmark2 15.6% 12.8% 22.2% 21.2% 2.7% 4.1% 10.2% 8.7% 16.3% 15.5% 4.2% 3.8% 10.1% 9.2% 10.9% 10.5% 6.8% 6.5% TRS U.S.A. U.S.A. Composite Benchmark3 16.7% 15.6% 31.9% 32.8% 2.2% 3.4% 20.9% 21.2% 24.5% 25.1% 5.8% 7.7% 16.8% 17.8% 16.5% 17.5% N/A N/A TRS Non-U.S. Developed Non-U.S. Developed Composite Benchmark4 8.1% 7.0% 30.1% 30.3% -13.1% -14.1% 18.7% 17.1% 22.8% 23.8% -0.6% -5.3% 13.1% 11.1% 10.4% 9.0% N/A N/A TRS Emerging Markets Emerging Markets Composite Benchmark5 24.3% 23.2% 27.2% 27.8% -15.9% -16.0% 5.6% 2.9% 14.5% 14.3% -4.6% -5.1% 4.9% 3.7% 4.3% 3.7% N/A N/A N/A N/A N/A N/A N/A N/A 10.0% 7.2% 12.6% 7.7% 1.4% 3.8% 7.9% 6.2% N/A N/A N/A N/A TRS Public Equity Public Equity Composite Benchmark7 14.4% 14.3% 30.3% 31.2% -8.1% -7.7% 15.7% 14.8% 20.9% 20.8% 1.3% 0.8% 12.3% 11.8% 11.2% 11.1% 5.8% 5.7% TRS Private Equity Private Equity Composite Benchmark8 24.6% 34.9% 24.6% 21.9% 7.1% 7.3% 16.7% 8.9% 21.7% 17.6% 12.6% 8.4% 16.9% 11.5% 16.4% 12.7% 15.4% 9.3% 16.1% 17.0% 29.5% 30.3% -5.5% -5.2% 15.8% 13.7% 21.0% 20.2% 3.2% 2.3% 13.1% 11.8% 12.1% 11.6% 6.6% 6.2% TRS U.S.
Treasuries U.S. Treasuries Composite Benchmark10 12.7% 12.0% -0.4% -1.1% 33.1% 32.3% -7.9% -8.4% 6.6% 6.3% 8.2% 6.3% 2.0% 1.2% 7.1% 6.2% N/A N/A TRS Absolute Return Absolute Return Composite Benchmark11 34.3% 2.4% 14.0% 2.3% 2.4% 2.5% 28.8% 2.3% 12.3% 2.2% 13.6% 2.3% 18.0% 2.3% 13.9% 2.3% N/A N/A TRS Stable Value Hedge Funds Stable Value Hedge Fund Composite Benchmark12 7.7% 2.4% 5.9% 2.3% -2.6% 1.7% 5.5% 6.9% 5.1% 6.6% 5.2% 2.6% 5.2% 5.5% 3.8% 4.0% 3.8% 4.8% Total TRS Stable Value Stable Value Composite Benchmark13 19.1% 9.3% 5.0% -0.3% 18.9% 23.9% -2.7% -4.6% 6.2% 6.0% 7.6% 5.4% 3.6% 2.2% 6.8% 5.7% 6.0% 5.9% TRS Global Inflation Linked Bonds Global Inflation Linked Bonds Composite Benchmark14 10.3% 10.6% 8.3% 7.7% 11.7% 11.7% -4.5% -4.8% 4.5% 4.4% -1.6% -1.7% -0.6% -0.8% 3.5% 3.3% N/A N/A TRS Real Assets Real Assets Composite Benchmark15 -8.9% -15.7% 19.4% 19.0% 11.5% 13.6% 10.6% 9.7% 13.4% 12.7% 13.2% 12.4% 12.3% 11.6% 14.4% 13.4% N/A N/A N/A N/A N/A N/A N/A N/A N/A N/A N/A N/A -6.3% -9.0% N/A N/A N/A N/A N/A N/A -0.2% -5.4% 28.4% 26.1% -18.2% -10.7% -29.9% 2.0% 32.2% 10.4% -57.0% -36.8% -26.4% -10.7% -16.0% -4.3% N/A N/A 7.7% 2.6% 17.4% 16.8% 10.2% 11.6% 4.6% 5.7% 10.6% 9.8% 6.4% 6.7% 7.2% 7.5% 9.8% 10.1% 7.1% N/A N/A N/A N/A N/A N/A N/A N/A N/A N/A N/A N/A N/A N/A N/A N/A N/A N/A N/A Total Portfolio 1 TRS Directional Hedge Funds Directional Hedge Fund Composite Benchmark6 Total TRS Global Equity Global Equity Composite Benchmark9 TRS Energy and Natural Resources Energy and Natural Resources Composite Benchmark16 TRS Commodities Commodities Composite Benchmark17 Total TRS Real Return Real Return Composite Benchmark18 TRS Risk Parity Risk Parity Benchmark19 1 Time-weighted rates of return adjusted for cash flows. Returns are calculated net of all fees. Investment Section 106 .
Total Time-Weighted Returns PENSION TRUST FUND For Periods Ended June 30 2 42% S&P 500/ 7.5% S&P 400/ 3% S&P 600/ 13% MS ACWI Free Ex-US/ 28.5% LB Aggregate/ 1% SB High Yield Market Index/ 3% Private Equity Composite (3 years at 0, then Russell 2000 + 500 bps)/ 1.5% Absolute Return Composite (70% 3-month LIBOR/ 30% S&P 500)/ 0.5% 91-day T-Bill through 01/05, 50% Total Domestic Equity Composite/ 13.4% MS ACWI Ex-US/ 28.35% LB Aggregate/ 2.06% Citigroup High Yield Index/ 4.12% Private Equity Composite (3 years at 0, then Russell 2000 + 500 bps)/ 1.55% Absolute Return Composite (70% 3-month LIBOR/ 30% S&P 500)/ 0.52% 91-day T-Bill through 9/07, 15% Russell 1000 Growth/ 15% Russell 1000 Value/ 5% Russell 2000/ 15% MSCI EAFE + Canada/ 5% MSCI EM/5 % Russell 3000 + 5%/ 10% Lehman Long Treasuries/ 4% 3 month LIBOR + 2%/ 5% Lehman Intermediate Gov-Credit/ 1% Citigroup 90 day US Treasury/ 10% Lehman Global Inflation Linked Bonds/ 4% Real Estate Composite/ 1% US Core CPI + 5%/ 3% Goldman Sachs Commodity Index/ 2% NAREIT through 9/08, 10% Russell 1000 Growth/ 10% Russell 1000 Value/ 5% Russell 2000/ 8% MSCI EAFE + Canada/ 5% MSCI EM/ 15% MSCI World/ 7% Russell 3000 + 5%/ 12% BC Long Treasuries/ 4% 3 month LIBOR + 2%/ 3% BC Intermediate Gov-Credit/ 1% Citigroup 90 day US Treasury/ 5% BC Global Inflation Linked Bonds/ 5% BC US TIPS/ 5% Real Estate Composite/ 1% US Core CPI + 5%/ 2% Goldman Sachs Commodity Index/ 2% NAREIT through 9/09, 5% MSCI USA Small Cap/ 8% MSCI USA Large Cap/ 33% MSCI World Net/ 6% MSCI EM Net/ 4% 3 month LIBOR + 2%/ 15% BC Long Treasury/ 2% Goldman Sachs Commodity/ 8% BC US TIPS/ 8% SSPEI 1 QTR lagged/ 8% NCREIF ODCE Net lagged/ 2% MSCI US REIT/ 1% 90 day US Treasury through 9/10, 5% MSCI Small Cap/ 20% MSCI USA/ 15% MSCI EAFE + Canada/ 10% MSCI EM/ 15% BC Long Treasuries/ 4% 3 month LIBOR + 2%/ 1% Citigroup 90 day US Treasury/ 8% BC US TIPS/ 2% MSCI US REIT/ 10% SSPEI 1 QTR lagged/ 2% Goldman Sachs Commodity Index/ 8% NCREIF Open Ended fund lagged through 9/11, 2% MSCI Small Cap/ 18% MSCI USA/ 15% MSCI EAFE + Canada/ 10% MSCI EM/ 13% BC Long Treasuries/ 4% HFRI FOF: Conservative Index/ 5% HFRI Fund of Funds Composite/ 1% Citigroup 90 day US Treasury/ 5% BC US TIPS/ 2% MSCI US REIT/ 12% SSPEI 1 QTR lagged/ 13% NCREIF Open Ended fund lagged through 9/12, 2% MSCI Small Cap/ 18% MSCI USA/ 15% MSCI EAFE + Canada/ 10% MSCI EM/ 13% BC Long Treasuries/ 4% HFRI FOF: Conservative Index/ 5% HFRI Fund of Funds Composite/ 1% Citigroup 90 day US Treasury/ 5% BC US TIPS/ 12% SSPEI 1 QTR lagged/ 15% NCREIF Open Ended fund lagged through 9/13, 2% MSCI Small Cap/ 18% MSCI USA/ 15% MSCI EAFE + Canada/ 10% MSCI EM/ 13% BC Long Treasuries/ 4% HFRI FOF: Conservative Index/ 5% HFRI Fund of Funds Composite/ 1% Citigroup 90 day US Treasury/ 5% BC US TIPS/ 11% SSPEI Adj 1 QTR lagged/ 13% NCREIF Open Ended fund lagged/ 3% (75% Cambridge Associates Natural Resources (reweighted)/ 25% quarterly Consumer Price Index lagged 1 quarter) through 9/14, 20.13% MSCI USA Investible Market/ 15.13% MSCI EAFE + Canada/ 10.24% MSCI EM/ 13.13% BC Long Treasuries/ 4% HFRI FOF: Conservative Index/ 4.89% HFRI Fund of Funds Composite/ 1% Citigroup 90 day US Treasury/ 5.13% BC US TIPS/ 11.97% SSPEI Adj 1 QTR lagged/ 11.84% NCREIF Open Ended fund lagged/ 1.99% (75% Cambridge Associates Natural Resources (reweighted)/ 25% quarterly Consumer Price Index lagged 1 quarter)/ 0.55% Risk Parity Benchmark through 12/14, 20.03% MSCI USA Investible Market/ 15.03% MSCI EAFE + Canada/ 10.25% MSCI EM/ 13.03% BC Long Treasuries/ 4% HFRI FOF: Conservative Index/ 4.78% HFRI Fund of Funds Composite/ 1% Citigroup 90 day US Treasury/ 5.03% BC US TIPS/ 11.77% SSPEI Adj 1 QTR lagged/ 12.01% NCREIF Open Ended fund lagged/ 1.96% (75% Cambridge Associates Natural Resources (reweighted)/25% quarterly Consumer Price Index lagged 1 quarter)/ 1.11% Risk Parity Benchmark through 3/15, currently 19.97% MSCI USA Investible Market/ 14.97% MSCI EAFE + Canada/ 10.31% MSCI EM/ 12.97% BC Long Treasuries/ 4% HFRI FOF: Conservative Index/ 4.66% HFRI Fund of Funds Composite/ 1% Citigroup 90 day US Treasury/ 4.97% BC US TIPS/ 11.43% SSPEI Adj 1 QTR lagged/ 12.17% NCREIF Open Ended fund lagged/ 1.85% (75% Cambridge Associates Natural Resources (reweighted)/ 25% quarterly Consumer Price Index lagged 1 quarter)/ 1.7% Risk Parity Benchmark. 43% Russell 1000 Growth/ 43% Russell 1000 Value/ 14% Russell 2000 through 9/08, 40% Russell 1000 Growth/ 40% Russell 1000 Value/ 20% Russell 2000 through 9/09, 81% MSCI Large Cap/ 19% MSCI Small Cap through 9/10, 80% MSCI USA/ 20% MSCI Small Cap through 9/11, 90% MSCI USA/ 10% MSCI Small Cap through 9/14, Currently MSCI USA Investible Market. 3 4 100% MSCI EAFE + Canada Index. 5 100% MSCI EM Index. 6 100% HFRI Fund of Funds Composite. 7 61% S&P 500/ 12% S&P 400/ 6% S&P 600, 21% MSCI ACWI free ex-US through 6/05, 60.16% S&P 500/ 12.22% S&P 400/ 6.5% S&P 600, 21.12% MSCI ACWI free ex-US through 3/06, 59.82% S&P 500/ 11.97% S&P 400/ 5.99% S&P 600/ 22.22% MSCI ACWI free ex-US through 9/07, 27.28% Russell 1000 Growth/ 27.27% Russell 1000 Value/ 9.09% Russell 2000/ 27.27% MSCI EAFE + Canada/ 9.09% MSCI EM through 9/08, 18.9% Russell 1000 Growth/ 18.9% Russell 1000 Value/ 9.4% Russell 2000/ 15.1% MSCI EAFE + Canada/ 9.4% MSCI EM/ 28.3% MSCI World through 9/09, 11.5% MSCI EM/ 63.5% MSCI All-Country World Net/ 9.6% MSCI USA Small Cap/ 15.4% MSCI USA Large Cap through 9/10, 20% MSCI EM/ 30% MSCI EAFE + Canada/ 40% MSCI USA Gross/ 10% MSCI USA Small Cap through 9/11, 20% MSCI EM/ 30% MSCI EAFE + Canada/ 36% MSCI USA Gross/ 4% MSCI USA Small Cap/ 10% HFRI Fund of Funds Composite through 9/14, 20.32% MSCI EM/ 30.03% MSCI EAFE + Canada/ 39.95% MSCI USA Investible Market/ 9.7% HFRI Fund of Funds Composite through 12/14, 20.45% MSCI EM/ 30.01% MSCI EAFE + Canada/ 39.99% MSCI USA Investible Market/ 9.55% HFRI Fund of Funds Composite through 3/15, currently 20.66% MSCI EM/ 29.99% MSCI EAFE + Canada/ 40.01% MSCI USA Investible Market/ 9.34% HFRI Fund of Funds Composite 83 years at 0, then Russell 2000 + 500 bps through 9/07, Russell 3000 + 5% through 9/09, SSPEI 1 QTR lagged through 9/13, currently SSPEI Adj 1 QTR lagged. Investment Section 107 . Total Time-Weighted Returns PENSION TRUST FUND For Periods Ended June 30 9 57% S&P 500/ 11% S&P 400/ 6% S&P 600, 20% MSCI ACWI free ex-US/ 6% Russell 2000+5% through 6/05, 56.49% S&P 500/ 11.44% S&P 400/ 6.11% S&P 600, 19.85% MSCI ACWI free ex-US/ 6.11% Russell 2000 + 5% through 3/06, 56% S&P 500/ 11.21% S&P 400/ 5.6% S&P 600, 20.8% MSCI ACWI free ex-US/ 6.39% Russell 2000 + 5% through 9/07, 25% Russell 1000 Growth/ 25% Russell 1000 Value/ 8.33% Russell 2000/ 25% MSCI EAFE + Canada/ 8.33% MSCI EM/ 8.34% Russell 3000 + 5% through 9/08, 16.67% Russell 1000 Growth/ 16.67% Russell 1000 Value/ 8.33% Russell 2000/ 13.33% MSCI EAFE + Canada/ 8.33% MSCI EM/ 25% MSCI World/ 11.67% Russell 3000 + 5% through 9/09, 10% MSCI EM Net/ 55% AC World Net/ 13.33% SSPEI 1 QTR lagged/ 8.33% MSCI USA Small Cap/ 13.34% MSCI USA Large Cap through 9/10, 16.7% MSCI EM/ 25% MSCI EAFE + Canada/ 8.3% MSCI USA Small Cap/ 33.3% MSCI USA Gross/ 16.7% SSPEI 1 QTR lagged through 9/11, 16.1% MSCI EM/ 24.2% MSCI EAFE + Canada/ 3.2% MSCI USA Small Cap/ 29% MSCI USA Gross/ 8.1% HFRI Fund of Funds Composite/ 19.4% SSPEI 1 QTR lagged through 9/13, 16.4% MSCI EM/ 24.6% MSCI EAFE + Canada/ 3.3% MSCI USA Small Cap/ 29.5% MSCI USA Gross/ 8.2% HFRI Fund of Funds Composite/ 18% SSPEI Adj 1 QTR lagged through 9/14, 16.42% MSCI EM/ 24.26% MSCI EAFE + Canada/ 32.28% MSCI USA Investible Market/ 7.84% HFRI Fund of Funds Composite/ 19.2% SSPEI Adj 1 QTR lagged through 12/14, 16.57% MSCI EM/ 24.30% MSCI EAFE + Canada/ 32.38% MSCI USA Investible Market/ 7.72% HFRI Fund of Funds Composite/ 19.03% SSPEI Adj 1 QTR lagged through 3/15, currently 16.81% MSCI EM/ 24.4% MSCI EAFE + Canada/ 32.56% MSCI USA Investible Market/ 7.6% HFRI Fund of Funds Composite/ 18.63% SSPEI Adj 1 QTR lagged. 10 100% BC Long Treasuries Index. 11 100% 3 month LIBOR + 2%. 12 70% 3-month LIBOR/ 30% S&P 500 through 9/07, 3 Month LIBOR + 2% through 9/11, currently 100% HFRI FOF: Conservative Index. 13 87.3% LB Aggregate/ 6.35% Citigroup High Yield Index / 4.76% Hedge Fund Composite/ 1.59% 91 day T-Bill through 03/05, 87.3% LB Aggregate/ 6.35% Lehman High Yield/ 4.76% Hedge Fund Composite/ 1.59% 91 day T-Bill through 03/06, 93.63% LB Aggregate/ 4.77% Hedge Fund Composite/ 1.6% 91 day T-Bill through 9/07, 50% Lehman Long Treasury/ 25% Lehman Intermediate Gov-Credit/ 20% Hedge Fund Composite/ 5% 91 day T-Bill through 9/08, 60% BC Long Treasury/ 15% BC Intermediate Gov-Credit/ 20% Hedge Fund Composite/ 5% 91 day T-Bill through 9/09, 75% BC Long Treasury/ 20% Hedge Fund Composite/ 5% 91 day T-Bill through 9/11, 72.2% BC Long Treasury/ 22.2% HFRI FOF: Conservative Index/ 5.6% Citigroup 91 day T-Bill through 9/14, 72.42% BC Long Treasury/ 22.06% HFRI FOF: Conservative Index/ 5.52% Citigroup 91 day T-Bill through 12/14, 72.27% BC Long Treasury/ 22.18% HFRI FOF: Conservative Index/ 5.55% Citigroup 91 day T-Bill through 3/15, currently 72.17% BC Long Treasury/ 22.26% HFRI FOF: Conservative Index/ 5.57% Citigroup 91 day T-Bill. 14 BC Global Inflation Linked Bonds through 9/08, 50% BC Global Inflation Linked Bonds/ 50% BC US TIPS through 9/09, currently BC US TIPS. Index established 4/2006, NCREIF Property Index (1 quarter lag) + 200 bps through 9/07, 80% Real Estate Composite Index/ 20% US Core CPI + 5% through 9/08, 83% Real Estate Composite Index/ 17% US Core CPI + 5% through 9/09, currently NCREIF Open Ended Net 1 QTR lagged. 15 16 75% Cambridge Associates Natural Resources (reweighted)/ 25% quarterly Consumer Price Index lagged 1 quarter. 17 100% Goldman Sachs Commodity Index. Index established 4/2006, NCREIF Property Index (1 quarter lag) + 200 bps through 9/07, 50% LB Global Inflation Linked Bond Index/ 20% Real Estate Composite Index/ 5% US Core CPI + 5%/ 15% Goldman Sachs Commodity Index/ 10% NAREIT Index through 9/08, 25% BC Global Inflation Linked Bond Index/ 25% BC US TIPS Index/ 25% Real Estate Composite Index/ 5% US Core CPI + 5%/ 10% Goldman Sachs Commodity Index/ 10% NAREIT Index through 9/09, 40% BC Global Inflation Linked Bond Index/ 40% NCREIF Open Ended Net 1 QTR lagged/ 10% Goldman Sachs Commodity Index/ 10% MSCI US REIT through 9/11, 25% BC US TIPS/ 65% NCREIF Open Ended Net 1 QTR lagged/ 10% MSCI US REIT through 9/12, 25% BC US TIPS/ 75% NCREIF Open Ended Net 1 QTR lagged through 9/13, 23.8% BC US TIPS/ 61.9% NCREIF Open Ended Net 1 QTR lagged/ 14.3% (75% Cambridge Associates Natural Resources (reweighted)/ 25% quarterly Consumer Price Index lagged 1 quarter) through 9/14, 27.06% BC US TIPS/ 62.45% NCREIF Open Ended Net 1 QTR lagged/ 10.49% (75% Cambridge Associates Natural Resources (reweighted)/ 25% quarterly Consumer Price Index lagged 1 quarter) through 12/14, 26.47% BC US TIPS/ 63.21% NCREIF Open Ended Net 1 QTR lagged/ 10.32% (75% Cambridge Associates Natural Resources (reweighted)/ 25% quarterly Consumer Price Index lagged 1 quarter) through 3/15, currently 26.17% BC US TIPS/ 64.11% NCREIF Open Ended Net 1 QTR lagged/ 9.72% (75% Cambridge Associates Natural Resources (reweighted)/ 25% quarterly Consumer Price Index lagged 1 quarter). 18 19 No performance data is available because this asset classes is new and was not established for the entire 1 year period. Investment Section 108 . Asset Allocation PENSION TRUST FUND August 31, 2015 Stable Value 15.7% U.S. Non-U.S. Developed Emerging Markets Directional Hedge Funds Public Equity Private Equity Total Global Equity U.S. Treasuries Absolute Return Stable Value Hedge Funds Cash Total Stable Value TRS Global Inflation Linked Bonds TRS Real Assets TRS Energy and Natural Resources TRS Commodities Total Real Return Total Risk Parity Total Global Equity 62.7% Low 13% 8% 4% 0% 39% 8% 50.0% 0.0% 0.0% 0.0% 0.0% 11.0% 0.0% 11.0% 0.0% 0.0% 17.0% 0.0% Real Return 19.5% POLICY RANGES High Transition Normal 23% 19.8% 18% 14.8% 14% 10.3% 10% 4.6% 49% 49.5% 18% 11.8% 64.0% 61.3% 20% 12.8% 20% 0.0% 10.0% 4.0% 5.0% 1.0% 21.0% 17.8% 8.0% 4.8% 21.0% 12.3% 8.0% 1.6% 5.0% 0.0% 27.0% 18.7% 10.0% 2.2% Investment Section 109 Actual 20.6% 15.8% 8.9% 4.9% 50.2% 12.5% 62.7% 8.7% 2.3% 4.2% 0.5% 15.7% 4.6% 12.9% 1.8% 0.2% 19.5% 2.1% 100.0% . Investment Summary PENSION TRUST FUND August 31, 2015 $140 Value in Billions $120 $100 $80 Risk Parity $60 Real Return Stable Value $40 Global Equity $20 $0 2010 2011 2012 2013 2014 2015 MARKET VALUES (in billions)1 U.S. Non-U.S. Developed Emerging Markets Directional Hedge Funds World Equity Public Equity Private Equity Total Global Equity U.S. Treasuries Absolute Return Stable Value Hedge Funds Cash Total Stable Value Global Inflation Linked Bonds Real Assets Energy and Natural Resources Commodities Total Real Return Total Risk Parity Total $ $ $ $ $ $ $ 2010 17.437 $ 5.810 8.180 N/A 17.936 49.363 8.501 57.864 $ 10.047 $ 4.786 3.947 0.700 19.480 $ 8.167 $ 7.664 N/A 2.068 17.899 $ N/A 95.243 $ 2011 26.528 $ 12.488 15.296 N/A N/A 54.312 11.099 65.411 $ 11.907 $ 3.214 4.324 1.376 20.821 $ 5.635 $ 11.880 N/A 3.323 20.838 $ N/A 107.070 $ 2012 23.085 $ 17.301 10.754 5.584 N/A 56.724 13.101 69.825 $ 13.476 $ 0.999 3.936 0.957 19.368 $ 5.499 $ 15.219 N/A 1.155 21.873 $ N/A 111.066 $ 1 2013 22.842 16.641 12.829 5.918 N/A 58.230 14.365 72.595 16.312 0.465 4.207 1.129 22.113 5.924 15.920 N/A 0.498 22.342 N/A 117.050 $ $ $ $ $ $ $ 2014 29.981 19.718 15.594 6.496 N/A 71.789 15.594 87.383 11.650 2.068 5.055 1.698 20.471 6.318 15.335 2.540 0.169 24.362 N/A 132.216 $ $ $ $ $ $ $ $ 2015 26.355 20.175 11.437 6.222 N/A 64.189 16.032 80.221 11.141 2.961 5.395 0.673 20.170 5.839 16.495 2.259 0.244 24.837 2.715 127.943 Investment values are based on industry standard investment performance methodology. Investment values in Exhibit I are in compliance with GASB Reporting Standards.
A reconcilication is provided. $ 127.943 Total Market Value 8/31/15 (0.399) Less Investment Related Cash Less Investment Related Receivables (1.580) Plus Investment Related Payables 0.888 Plus Securities Sold Short 0.188 Plus Short-Term Asset Pool Adjustment from Amortized Cost to Fair Value 0.002 Total Investments Exhibit 1 $ 127.042 Investment Section 110 . Investment Summary PENSION TRUST FUND August 31, 2015 100% 80% 60% Risk Parity Real Return Stable Value 40% Global Equity 20% 0% 2010 2011 2012 2013 2014 2015 PERCENTAGE OF MARKET VALUES U.S. Non-U.S. Developed Emerging Markets Directional Hedge Funds World Equity Public Equity Private Equity Total Global Equity U.S. Treasuries Absolute Return Stable Value Hedge Funds Cash Total Stable Value Global Inflation Linked Bonds Real Assets Energy and Natural Resources Commodities Total Real Return Total Risk Parity 2010 18.3% 6.1% 8.6% N/A 18.8% 51.8% 8.9% 60.7% 10.6% 5.0% 4.1% 0.7% 20.4% 8.6% 8.1% N/A 2.2% 18.9% N/A 2011 24.8% 11.7% 14.3% N/A N/A 50.7% 10.4% 61.1% 11.1% 3.0% 4.0% 1.3% 19.4% 5.3% 11.1% N/A 3.1% 19.5% N/A 2012 19.7% 15.6% 9.7% 5.0% N/A 51.1% 11.8% 62.9% 12.1% 0.9% 3.5% 0.9% 17.4% 5.0% 13.7% N/A 1.0% 19.7% N/A 2013 19.5% 14.2% 11.0% 5.0% N/A 49.7% 12.3% 62.0% 13.9% 0.4% 3.6% 1.0% 18.9% 5.1% 13.6% N/A 0.4% 19.1% N/A 2014 22.7% 14.9% 11.8% 4.9% N/A 54.3% 11.8% 66.1% 8.8% 1.6% 3.8% 1.3% 15.5% 4.8% 11.6% 1.9% 0.1% 18.4% N/A 2015 20.6% 15.8% 8.9% 4.9% N/A 50.2% 12.5% 62.7% 8.7% 2.3% 4.2% 0.5% 15.7% 4.6% 12.9% 1.8% 0.2% 19.5% 2.1% Total 100.0% 100.0% 100.0% 100.0% 100.0% 100.0% Investment Section 111 . Largest Holdings PENSION TRUST FUND August 31, 2015 Top Ten Domestic Equity Market Holdings Market Value $ 680,990,340 383,158,479 338,626,527 294,805,016 259,193,726 236,690,799 228,232,585 226,114,427 221,230,998 220,568,421 $ 3,089,611,318 Issuer Name Apple Incorporated Microsoft Corporation Google Incorporated Class A Johnson & Johnson Pfizer Incorporated Oracle Corporation Citigroup Incorporated Google Incorporated Class C Amazon.Com Incorporated J.P. Morgan Chase & Company Total Shares 6,039,290 8,804,193 522,717 3,136,891 8,044,498 6,381,526 4,267,625 365,733 431,342 3,441,005 41,434,820 Top Ten International Equity Market Holdings Issuer Name Samsung Electronics Company LTD Novartis AG Tencent Holdings LTD Nestle SA China Construction Bank Roche Holdings AG Toyota Motor Corporation BT Group PLC Vodafone Group PLC China Mobile LTD Market Value $ 301,022,526 260,701,790 260,314,647 228,142,895 192,952,019 185,193,932 176,022,961 175,542,145 174,376,464 174,358,281 $ 2,128,627,660 Investment Section 112 Total Shares 326,937 2,662,214 15,306,916 3,094,328 273,880,548 678,378 2,965,982 26,097,319 50,012,662 14,142,181 389,167,465 . Largest Holdings PENSION TRUST FUND August 31, 2015 Top Ten Fixed Income Market Holdings U.S. Treasury U.S. Treasury U.S. Treasury U.S.
Treasury U.S. Treasury U.S. Treasury U.S.
Treasury U.S. Treasury U.S. Treasury U.S.
Treasury Description 3.625% due 15 Aug 2043 3.750% due 15 Nov 2043 3.375% due 15 May 2044 3.625% due 15 Feb 2044 3.000% due 15 Nov 2044 2.875% due 15 May 2043 3.125% due 15 Aug 2044 4.625% due 15 Feb 2040 3.000% due 15 May 2045 2.750% due 15 Nov 2042 $ $ Market Value 905,477,625 892,232,349 811,576,110 765,630,036 759,777,068 706,578,386 638,016,468 527,614,870 523,827,500 520,532,773 7,051,263,185 $ $ Par Value 796,900,000 767,690,000 748,500,000 674,350,000 753,000,000 717,040,000 616,900,000 402,170,000 518,000,000 541,100,000 6,535,650,000 Note: A complete listing of publically available portfolio holdings is available by contacting the TRS Communications Department. Investment Section 113 . Schedule of Fees and Commissions PENSION TRUST FUND For the Fiscal Year Ended August 31, 2015 Fund Name* Achievement Fund XL, LLC Admiral Capital Real Estate Fund, L.P. Advent International GPE VI-A, L.P. Advent International GPE VII-C, L.P. Aeolus Property Keystone Fund, L.P. Aeolus Property Spire Fund, L.P. AEW Core Property Trust (U.S.), L.P. AEW Senior Housing Investors II, L.P. AEW Senior Housing Investors, L.P. AHL Evolution, LLC Akard Street Partners, L.P. Algert Global Equity Mkt Neutral Almanac Realty Securities Sidecar VI, L.P. Almanac Realty Securities V Co-Invest, L.P. Almanac Realty Securities V, L.P. Almanac Realty Securities VI, L.P. Almanac Realty Securities VII, L.P. Alterna Core Capital Assets Fund II, L.P. Alterna Core Capital Assets Fund, L.P. Alterna/Lavaca Co-Investment Fund, L.P. Amici Fund International LTD Apax Europe VII-A, L.P. Apax VIII, L.P. Apollo Credit Opportunity Fund II, L.P. Apollo Investment Fund VII, L.P. Apollo SPN Investments, L.P. AQR GRP 10 Offshore Fund LTD AQR RT Fund, L.P. AQR Style Premia Offshore Fund LTD ARA Asia Dragon II, L.P. ARA Asia Dragon, L.P. Artemis Real Estate Partners Fund II, L.P. AXA Independence Fund, L.P.** Bain Capital Absolute Return Cayman LTD Bain Capital Fund VIII, L.P. Bain Capital VIII Coinvest Fund, L.P. $ Fees 3,447,174 304,725 1,879,357 2,051,987 324,804 961,759 1,651,871 277,185 785,114 1,426,886 854,570 7,534,862 56,174 148,238 1,091,387 911,311 136,986 1,742,438 1,562,839 35,374 1,295,869 370,494 2,747,127 462,359 752,253 14,082,179 2,002,892 683,037 3,482,438 2,500,000 332,817 750,000 (67,309) 2,089,709 346,031 430,220 (Continued) Investment Section 114 . Schedule of Fees and Commissions PENSION TRUST FUND For the Fiscal Year Ended August 31, 2015 Fund Name* Bay Resource Partners Offshore Fund LTD Black Diamond Relative Value LTD Blackrock Diamond Property Fund, L.P. Blackstone Capital Partners V, L.P. Blackstone Capital Partners VI, L.P. Blackstone Energy Partners II, L.P. Blackstone GSO Capital Solutions Fund II, L.P. Blackstone GSO Capital Solutions Fund, L.P. Blackstone RE Partners Europe III, L.P. Blackstone RE Partners Europe IV, L.P. Blackstone Real Estate VI, L.P. Blackstone Real Estate VI.F (Gresham), L.P. Blackstone Real Estate VII, L.P. Blue Mountain Guadalupe Peak Fund Blue Sage Capital II, L.P. Blue Sea Capital Fund I, LLC BlueTrend Fund LTD Brevan Howard Fund Bridgepoint Europe V, L.P. Bridgewater All Weather LTD Bridgewater Optimal Portfolio, LLC Bridgewater Pure Alpha Major Markets LTD Bridgewater Pure Alpha, LLC Brockton Capital Fund II, L.P. Brockton Capital Fund III, L.P. Brookfield Americas Infrastructure Fund, L.P. Brookfield Infrastructure Fund II-B, L.P. Brookfield Strategic RE Partners B, L.P. Camden Multifamily Co-Investment Fund, L.P. Camden Multifamily Value Add Fund, L.P. Canyon-Johnson Urban Fund III, L.P. Capri Urban Investors, L.P. Cargill Global Agriculture Absolute Return Fund LTD Carlyle Europe Partners III, L.P. Carlyle Europe Real Estate Partners III, L.P. Carlyle Partners III, L.P. $ Fees 7,056,945 3,802,850 660,280 51,088 1,772,504 238,889 36,321 2,163,533 1,984,688 4,013,889 1,990,182 302,484 3,521,948 4,625,862 651,610 29,251 5,598,468 2,754,127 1,395,332 1,982,615 2,060,801 4,234,052 6,921,114 3,138,802 1,150,347 2,288,068 2,573,140 2,151,000 1,143,459 1,277,362 637,618 1,005,750 1,328,659 265,974 963,136 12,127 (Continued) Investment Section 115 . Schedule of Fees and Commissions PENSION TRUST FUND For the Fiscal Year Ended August 31, 2015 Fund Name* Carlyle Partners IV, L.P. Carlyle Partners V, L.P. Carlyle Partners VI, L.P. Carlyle Realty Partners V, L.P. Carlyle Realty Partners VII, L.P. CB Richard Ellis Strat Partners US OPP 5, L.P. CBRE Strategic Partners US Value 6, L.P. CBRE Strategic Partners US Value 7, L.P. CBRE Wood Partners Development Fund 3, L.P. CCMP Capital Investors III Cerberus Institutional (Series Four), L.P. Charterhouse Capital Partners IX, L.P. Charterhouse Capital VIII, L.P. CIM Fund III, L.P. Citadel Presidio Fund, LLC Colony Distressed Credit Fund, L.P. Colony Investors VIII, L.P. Comac Global Macro Fund LTD CPI Capital Partners Europe, L.P. Crestview Partners II, L.P. Crestview Partners III, L.P.** CVC Capital Partners Asia Pacific III, L.P. CVC European Equity Partners III, L.P. CVC European Equity Partners IV, L.P. CVC European Equity Partners Tandem Fund, L.P. CVC European Equity Partners V, L.P. D. E. Shaw BMCAE Special Fund, L.P. D. E.
Shaw VACAE Fund, L.P. DaVinciRe Holdings LTD Divco West Fund III, L.P. Double Black Diamond LTD EI AV Fund (Acosta Verde), L.P. EI Fund V, L.P. EIG Energy Fund XVI, L.P. Element Capital US Feeder $ Fees 261,106 1,090,927 1,895,638 452,794 1,959,979 695,326 1,335,207 1,205,904 284,537 1,828,705 394,914 1,860,099 360,964 3,132,156 3,192,720 2,538,400 2,419,900 594,496 169,099 678,220 (248,507) 1,647,904 72,447 50,149 432,062 862,877 3,264,936 2,359,391 4,432,907 117,604 5,429,296 121,943 1,849,145 1,497,452 1,852,484 (Continued) Investment Section 116 . Schedule of Fees and Commissions PENSION TRUST FUND For the Fiscal Year Ended August 31, 2015 Fund Name* EnCap Energy Capital Fund VII, L.P. EnCap Energy Capital Fund X, L.P. EnCap Energy Fund IX, L.P. EnCap Energy Infrastructure Fund, L.P. Encap Flatrock Midstream Fund II, L.P. Encap Flatrock Midstream Fund III, L.P. Energy Capital Partners Fund III, L.P. Energy Fund XV, L.P. ESCF German (Zentrum), L.P. ESG Cross Border Equity Fund LTD FIR Tree Capital Opportunity Fund First Reserve Energy Infrastructure Fund II, L.P. First Reserve Energy Infrastructure Part, L.P. First Reserve Fund X, L.P. First Reserve Fund XI, L.P. First Reserve Fund XII, L.P. Five Mile Capital Partners II, L.P. Fore Multi Strategy Offshore Fund LTD Forum Asian Realty Income II, L.P. Forum Asian Realty Income III, L.P. Forum Europe Realty Income III, L.P. Frontier Fund III, L.P. Frontier Fund IV, L.P. Fudo Capital Fund II, L.P. Fudo Capital Fund III, L.P. Full Harvest Agricultural Opp Fund II, L.P. GenNx360 Capital Partners II, L.P. GoldenTree Offshore Fund LTD Gores Capital Partners II, L.P. Graham Global Investment Great Hill Equity Partners V, L.P. Green Equity Investors VI, L.P. Grosvenor 2005-1 Series Grosvenor 2007-1 Series Grosvenor 2008-1 Re-Investment Series $ Fees 522,869 681,250 1,236,327 526,268 572,286 3,115,385 1,455,199 1,974,052 573,896 1,815,623 9,243,410 1,015,395 1,673,873 8,840 1,414,602 2,633,477 1,684,838 3,831,991 140,664 1,747,716 786,286 172,977 194,721 1,036,855 2,286,028 225,000 245,815 186,371 170,581 9,420,274 1,082,219 538,076 708,753 981,315 231,831 (Continued) Investment Section 117 . Schedule of Fees and Commissions PENSION TRUST FUND For the Fiscal Year Ended August 31, 2015 Fund Name* Grosvenor 2008-2 MMBO Investments Series Grosvenor 2010-1 PE Investment Series Grosvenor 2010-2 RE Partnership Invest Series Grosvenor 2014-1 PE Investment Series Grosvenor 2014-2 RE Investment Series GSO Energy Partners-D, L.P. GSO Special Situations Fund, L.P. Hadley Harbor Partners, L.P. Halcyon European Structured LTD Halcyon Mount Bonnell Fund, L.P. Harbinger LTD HB Estrela I, L.P. Heitman America Real Estate Trust, L.P. Hellman & Friedman Capital Partners V, L.P.** Hellman & Friedman Capital Partners VI, L.P. HgCapital 5, L.P. HgCapital 6, L.P. Highbridge Mezzanine Partners II, L.P. Highbridge Mezzanine Partners, L.P. Highland Capital Partners VI-B, L.P. Homestead Capital USA Farmland Fund I, L.P. Horizon Portfolio LTD Hunt Commercial Realty Partners II, L.P. Hunt Commercial Realty Partners III, L.P. IC Berkeley Partners III, L.P. IC Hospitality Fund II, L.P. ICV Partners III, L.P. Insight Venture Partners IX, L.P. Insight Venture Partners VIII, L.P. Invesco San Jacinto Core Fund, L.P. Investcorp Interlachen Investcorp Waterloo Macro Fund LTD Iron Point Real Estate Partners II, L.P. Iron Point Real Estate Partners III, L.P. Iron Point Real Estate Partners, L.P. $ Fees 1,302,071 537,028 996,111 214,560 429,121 105,616 4,895,078 332,283 1,397 2,616,241 5,362 1,010,717 1,664,052 (389) 165,550 124,582 2,174,613 1,031,199 455,138 157,535 76,695 13,419,704 561,964 714,756 234,422 38,069 138,910 1,317,928 2,838,978 1,337,679 6,108 6,250,814 1,220,981 656,250 827,832 (Continued) Investment Section 118 . Schedule of Fees and Commissions PENSION TRUST FUND For the Fiscal Year Ended August 31, 2015 Fund Name* J.H. Whitney VI, L.P. JP Morgan Strategic Property Fund, L.P. Kelso Investment Associates VIII, L.P. King Street Capital LTD KKR 2006 Fund, L.P. KKR Natural Resources I, L.P. KKR SPN Investments, L.P. Kohlberg TE Investors VII-B, L.P. L&B Diversified Strategy Partners, L.P. Lansdowne Pecan Street Europe, L.P. LaSalle Capital Group II-A, L.P. LaSalle US Property Fund, L.P. Lee Equity Partners, L.P. Lightspeed Venture Partners, L.P. Lindsay Goldberg III, L.P. Lion Capital Fund I, L.P. Lion Capital Fund II, L.P. Lion Capital Fund III, L.P. Lionstone Cash Flow Partners Fund One, L.P. LiveOak Ventures I, L.P. Lone Star Fund IX, L.P. Lone Star Real Estate Fund II, L.P. Lone Star Real Estate Fund III, L.P. Luxor Capital Partners Offshore LTD MacFarlane Urban Real Estate Fund II, L.P. Magnetar Constellation Fund LTD Marathon Credit Dislocation Fund, L.P. Marathon Structured Products Stategies Fund Meadow Real Estate Fund III, L.P. Mill Road Capital II, L.P. Millennium Partners, L.P. MKP Credit Offshore LTD Morgan Creek Partners Asia, L.P. MW Market Neutral TOPS (US) Fund Nautic Partners V, L.P.** $ Fees 93,374 6,002,601 1,883,407 4,453,739 930,878 7,196,124 11,954,667 2,972,759 254,675 128,776 495,483 2,223,594 191,072 249,317 1,406,437 28,585 1,234,838 4,898,397 2,563,257 374,986 1,200,000 292,176 2,174,523 3,819,563 844,271 8,682,024 2,193,206 111,733 500,000 300,000 4,846,724 7,227,669 1,015,474 5,479,051 (176,218) (Continued) Investment Section 119 . Schedule of Fees and Commissions PENSION TRUST FUND For the Fiscal Year Ended August 31, 2015 Fund Name* New Enterprise Associates 13, L.P. New Enterprise Associates 14, L.P. New Enterprise Associates 15, L.P. New Heritage Capital Fund-B, L.P. NMS Fund II, L.P. Normandy Real Estate Debt Fund, L.P. North Haven Infrastructure Partners II, L.P. North Haven Infrastructure Partners, L.P. Northwest Fund LTD Oak Investment Partners XI, L.P. Oak Investment Partners XII, L.P. Oaktree European Principal Fund III, L.P. Oaktree Opportunities Fund IX, L.P. Oaktree Opportunities Fund VIII, L.P. Oaktree Opportunities Fund VIIIb, L.P. Oaktree Real Estate Opportunities Fund VI, L.P. OCM Opportunities Fund VI, L.P. OCM Opportunities Fund VII, L.P. OCM Opportunities Fund VIIb, L.P. One Rock Capital Partners, L.P. Onex Partners I, L.P. Onex Partners III, L.P. P2 Capital Master Fund VI Palladium Equity Partners IV, L.P. Parkway Properties Office Fund II, L.P. Parvus Armadillo Fund Patria-Brazilian Private Equity Fund IV, L.P. PCCP Mezzanine Recovery Partners II, L.P. PDT Partners Offshore Fund Pennybacker III, L.P.** Permira Europe III, L.P.** Permira IV, L.P. Permira V, L.P. Perry Partners International, Inc. Pershing Square International LTD $ Fees 1,100,214 1,312,261 385,909 471,525 208,182 190,210 1,076,449 194,088 3,921,985 584,522 1,924,876 2,750,214 2,400,000 775,088 1,391,020 2,097,063 79,143 213,458 245,155 245,805 101,746 1,472,713 4,039,354 93,094 2,074,148 18,892,075 1,953,216 408,069 21,663,043 (236,217) (21,217) 960,420 3,382,522 3,229,906 31,515,583 (Continued) Investment Section 120 . Schedule of Fees and Commissions PENSION TRUST FUND For the Fiscal Year Ended August 31, 2015 Fund Name* PFM Diversified Offshore Fund, A.I. LTD PLA Residential Fund III, L.P. PLA Residential Fund IV, L.P. PLA Retail Fund I, L.P. Polaris Venture Partners IV, L.P.** PREI Mezzanine Fund I, L.P. Prime Property Fund, L.P. Principal Green Property Fund I, L.P. Principal RE Strategic Debt Fund I, L.P. Principal Real Estate Strat Eq Fund I, L.P. PRISA PRISA II Prologis U.S. Logistics REIT, L.P. Providence Equity Partners V, L.P. Providence Equity Partners VI, L.P. Raine Partners II, L.P. Ranger Co-Investment Fund II, L.P. Ranger Co-Investment Fund III, L.P. Ranger Co-Investment Fund, L.P. Red River Direct Investment Fund II, L.P. Red River Direct Investment Fund, L.P. Red River Venture Capital Fund, L.P. Reservoir Strategic Partners Fund, L.P. Retail Co-Invest Holdings 3 (Starwood), L.P. Ridgewood Energy Oil & Gas Fund II, L.P. Riverstone Global Energy & Power VI, L.P. Rock Creek Limestone Emerging Markets, L.P. RREEF America REIT III, L.P. Savanna Real Estate Fund III, L.P. Savanna Real Estate IIA, L.P. SCG TMI Co-Invest, L.P. Scout Fund II, L.P. Security Capital Income Opportunity Shepherd Investments International LTD SHI Development Co-Investment I, L.P. $ Fees 9,921,401 2,109,843 432,688 730,242 (1,116) 214,677 2,239,711 1,075,424 1,039,015 1,359,350 2,001,960 1,904,218 885,667 176,140 1,255,988 450,000 324,092 165,610 184,661 2,893,068 1,681,823 727,732 4,442,229 556,842 2,000,000 761,909 8,041,104 497,350 218,533 140,476 197,694 479,476 200,345 62,554 725,715 (Continued) Investment Section 121 . Schedule of Fees and Commissions PENSION TRUST FUND For the Fiscal Year Ended August 31, 2015 Fund Name* Silver Lake Partners IV, L.P. Silverback Arbitrage Fund LTD Soroban Cayman Fund LTD Soroban Opportunities Fund, LLC Southwest Multifamily Partners, L.P. SP5 Wood Partners Co-Invest Venture 2, L.P. SP5 Wood Partners Development, L.P. Spire Capital Partners III, L.P. Squadron Emerging Asia Fund, L.P. Square Mile Credit Partners, L.P. Square Mile Partners III, L.P. Square Mile Partners IV, L.P. Square Mile Partners IV-A-Co-Invest, L.P. Square Mile S2, L.P. Square Mile Tactical Partners, L.P. Starwood Distressed Opportunity Fund IX, L.P. Starwood Opportunity Fund X Global, L.P. Starwood Real Estate Securities, L.P. Starwood UK Hotels Co-Invest, L.P. SteelRiver Infrastructure Fd N. America, L.P. Stockbridge Real Estate Fund II, L.P. Stockbridge Real Estate Fund III, L.P. Stonepeak Infrastructure Fund LP, L.P. Stratford Land Fund III, L.P. Stratford Land Fund IV, L.P. TA X, L.P. TA XI, L.P. Thayer Hotel Investors V, L.P. Theleme Fund LTD Thomas H. Lee Equity Partners V, L.P.** Tilden Park Investment Fund TLF Logistics II, L.P. TLF Logistics, L.P. TPG Growth II, L.P. TPG Growth III, L.P. $ Fees 1,940,515 2,397,748 11,438,312 3,980,314 187,410 257,018 116,414 158,504 903,461 452,151 659,482 56,336 55,406 144,493 59,461 2,239,416 2,123,014 2,206,389 338,235 3,284,352 665,626 1,798,838 1,172,650 2,250,000 3,551,945 385,573 2,796,007 1,049,850 5,525,108 (147,990) 1,587,088 1,489,312 1,309,041 2,615,721 1,587,983 (Continued) Investment Section 122 . Schedule of Fees and Commissions PENSION TRUST FUND For the Fiscal Year Ended August 31, 2015 Fund Name* TPG Opportunities Partners III, L.P. TPG Partners V, L.P. TPG Partners VI, L.P. TPG STAR, L. P. TPH Whipstock Co-Investment Fund, L.P. TriGate Property Partners II, L.P. Tristan EPISO 3, L.P. Triton Fund II, L.P. Triton Fund III, L.P. Triton Fund IV, L.P. Trive Capital Fund I, L.P. Tudor BVI Global Fund LTD Two Sigma Active Extension U.S. Small Cap Equity Fund, L.P. U.S. Government Building Fund, L.P. USAA US Republic Core Fund, L.P. Vistria Fund, L.P. Walton Street Real Estate Fund Sidecar V, L.P. Walton Street Real Estate Fund V, L.P. Walton Street Real Estate Fund VI, L.P. Warburg Pincus Private Equity X, L.P. Wayzata Opportunities Fund II, L.P. Wayzata Opportunities Fund III, L.P. Westbrook Real Estate Fund IX, L.P. Westbrook Real Estate Fund VIII, L.P. Western Asset Macro Opportunities Portfolio LTD Winton Futures Fund LTD Wolverine Flagship Fund LTD Zachry Hastings Infrastructure Partners, L.P. Zaxis Institutional Partners LTD Total $ $ Fees 2,043,780 762,707 335,226 709,117 1,500,000 187,500 1,168,163 239,142 857,933 2,238,333 204,035 11,464,615 19,409,533 3,189,469 3,645,010 302,657 23,252 474,966 1,516,570 1,238,089 1,076,651 2,250,000 1,350,000 1,136,888 1,090,789 32,476,576 4,407,597 541,385 2,630,443 695,661,445 (continued) * Fees are earned by the funds based on each fund's governing documents. TRS calculates returns for thes funds net of all fees. ** Negative balances are equal to the refund in the current year of expenses paid or accrued in a prior year. Investment Section 123 .
Schedule of Fees and Commissions PENSION TRUST FUND For the Fiscal Year Ended August 31, 2015 External Manager*** Adelphi Capital, LLP Affinity Investment Advisors AlphaGen Japan Absolute Return Fund LTD Baring International Investment LTD Blackrock Financial Management, Inc. Brandes Investment Partners, LLC Brookmont Capital Management Cantillon Capital Management, LLC Chilton Capital Management DePrince Race and Zolllo, Inc. Dimensional Fund Advisors, L.P. Glenhill Capital Advisors GMO, LLC Goldman Sachs Asset Management, L.P. Independent Franchise Partners, LLP Indus Capital Partners, LLC Investcorp Waterloo Macro Fund LTD Jennison Associates, LLC JP Morgan Asset Management JP Morgan Knight Vinke Asset Management, LLC Lazard Asset Management, LLC Mar Vista Investment Partners Marathon Active International Matterhorn Morgan Stanley Asset Management Morgan Stanley Investment Management, Inc. Neuberger Berman Greater China Neuberger Berman Nicholas Investment Partners Oaktree Capital Management Omega Advisors, Inc. Fees $ 755,586 196,556 14,955,147 2,212,944 2,764,715 850,188 200,999 7,131,056 190,183 2,735,573 7,951,561 332,065 2,089,930 1,380,221 7,551,414 3,602,501 248,904 748,756 9,571,537 4,610,440 3,688,298 5,931,378 219,162 3,749,605 141,864 9,835,953 7,322,187 2,763,589 3,628,718 122,529 943,917 7,187,553 (continued) Investment Section 124 . Schedule of Fees and Commissions PENSION TRUST FUND For the Fiscal Year Ended August 31, 2015 External Manager*** Parametric Structured Penn Capital Management Co., Inc. Phocas Financial Corp. Platinum Asset Management Co. LTD Rock Creek Austin, L.P. Sasco Capital, Inc. Security Capital Research & Management, Inc. Starboard Value & Opportunity Starwood Real Estate Securities Stephens Investment Management Group Vaughan Nelson Investment Management, L.P. Vulcan Value Partners Wellington Asia Wellington Management Company, L.P. Westwood Management Corp. ZCAPM Total Fees $ $ 10,112,003 487,737 111,987 6,671,939 1,288,365 2,576,635 10,628,552 10,596,888 2,190,725 716,186 1,981,527 965,914 928,469 16,318,380 57,010 692,647 181,939,993 (continued) ***Fees are accrued or paid to external managers based on assets under management and the performance of the investment manager. TRS calculates returns for these managers net of all fees. Investment Section 125 . Schedule of Fees and Commissions PENSION TRUST FUND For the Fiscal Year Ended August 31, 2015 Shares Traded 107,329 1,699,838 200,447 140,329 10 1,434,030 74,300 10,384 73,385 404,326 2,203 1,125 139,220 1,450 308,700 105,700 71,635 40,770 7,968 3,200 12,946,087 2,407,303 3,111,076 59,655 527,518,152 55,027 188,311,987 111,952 190,163 66,463,289 4,152,165 81,470,057 6,938,417 11,950 2,938,127 Brokerage Firm Abel/Noser Corp. ABG Securities ABN AMRO Securities, Inc. Academy Securities, Inc. Access Securities, Inc. Agora Corde Titul E Val Mob AKD Securities Albert Fried & Co., LLC Allen & Co., LLC Ambit Capital Pvt. LTD Antique Stock Broking LTD Aqua Securities, L.P. Atlantic Equities, LLP Autonomous, LLP Aviate Global, LLP Avior Research Pty LTD Avondale Partners, LLC Axis Capital LTD B. Riley & Co., LLC Banchile Corredores De Bolsa S.A. Banco Itau S.A. Banco Pactual S.A. Banco Santander S.A. Bank J. Vontobel Und, Co.
AG Bank of America Banque Paribas Frankfurt Barclays Capital, Inc. Batlivala & Karani Securities India Pvt. LTD BB&T Securities, LLC Bloomberg Tradebook, LLC BMO Capital Markets BNP Paribus Securities Corp. BNY ConvergEx Execution Solutions, LLC BNY Mellon BOCI Securities LTD Investment Section 126 Commissions Paid $ 4,293 463 536 2,807 1 10,918 499 413 2,569 6,681 624 23 2,707 137 4,289 693 2,627 2,151 288 56 134,392 24,643 10,234 8,413 5,127,968 1,209 2,129,168 1,239 7,744 992,041 138,956 651,959 88,302 418 5,545 (continued) . Schedule of Fees and Commissions PENSION TRUST FUND For the Fiscal Year Ended August 31, 2015 Shares Traded 66,139 420,807 35,897,741 262,800 9,974,401 40,512 24,100 251,871 4,506,671 13,846,455 952,148 71,982 1,558,678 31,658,640 24,139 8,439,911 834,722 4,240 123,888 1,010,000 9,781,000 49,550,631 256,790 515 677,345 5,514,589 1,190,000 45,402,770 369,329 517,766,043 4,314,621 700 115,753,894 11,330 Brokerage Firm Bradesco S.A CTVM Brean Capital, LLC Broadcort Capital Corp. BTG Capital Corp. BTIG, LLC Buckingham Research Group, Inc. Burke Andquick Partners, LLC CA Cheuvreux North America Cabrera Capital Markets Calyon Securities Canaccord Genuity, Inc. Canadian Depository For Securities Canadian Imperial Bank Of Commerce Cantor Fitzgerald & Co. Capel Cure Myers Gilts Capital Markets Brokers LTD Carnegie Investment Bank Carnegie Securities Finland Casablanca Finance City Cathay United Bank CCB International Securities LTD Celfin Capital S.A. Corredores De Bolsa Central Securities Depository S.A. Cheevers & Co., Inc. China Fortune Securities LTD China International Capital Corp. CICC US Securities, Inc. CIMB Securities International Pte. LTD Citation Group Citigroup Global Markets, Inc. City Bank LTD CL King & Associates, Inc. CLSA Securities Commerzbank AG Investment Section 127 Commissions Paid $ 536 11,391 340,901 9,318 400,426 1,613 844 8,815 219,656 69,673 32,219 1,605 27,754 330,275 1,207 2,034 42,080 138 8,273 745 16,171 35,481 285 10 2,727 34,855 1,463 44,481 14,082 3,146,515 18,941 28 419,233 479 (continued) . Schedule of Fees and Commissions PENSION TRUST FUND For the Fiscal Year Ended August 31, 2015 Brokerage Firm Compass Point Research & Trading, LLC Concordia S.A. CVMCC ConvergEx Execution Solutions, LLC Cormark Securities, Inc. Cowen & Co., LLC Craig - Hallum Credit Agricole Credit Lyonnais Securities Credit Research & Trading, LLC Credit Suisse Group Crest Depository LTD CSI US Institutional Desk CSL Stockbrokers LTD Cuttone & Co., Inc. Daewoo Securities Co. LTD Daiwa Securities Group, Inc. Danske Bank A.S. Davidson D.A. & Company, Inc. Davy Stockbrokers DBS Vickers Securities (Singapore) Pte.
LTD Dematted Monness, LLC Desjardins Securities, Inc. Deutsche Bank Securities, Inc. Dhanki Securities Pvt. LTD DnB NOR Dolat Capital Markets Pvt. LTD Dougherty Co., Inc. Dowling & Partners Edelweiss Securities Pvt.
LTD Emkay Global Financial Services LTD Equita SIM S.p.A. Erste Group Bank AG Euroclearbank S.A. N.V. Exane S.A. FBN Securities, Inc. Investment Section 128 Shares Traded 113,772 561,978 12,033,239 15,800 35,142,463 722,546 3,394,998 113,731,633 328,802 332,662,869 772,000 1,064,729 12,609,071 317,643 794,344 15,492,015 294,250 20,900 12,161,151 183,000 43,300 167,600 374,378,140 13,915 142,084 173,638 175,370 283,807 324,480 40,032 211,611 28,550 32,521 1,390,557 3,878 Commissions Paid $ 4,163 735 322,448 579 1,066,445 28,052 53,503 417,711 12,475 2,695,739 4,901 35,886 8,687 11,118 63,478 106,600 11,786 732 29,099 100 1,586 4,494 3,220,891 1,175 6,744 2,707 7,109 10,408 4,068 445 4,456 738 1,071 52,620 155 (continued) . Schedule of Fees and Commissions PENSION TRUST FUND For the Fiscal Year Ended August 31, 2015 Shares Traded 14,900 2,400 53,117 43,365 1,910,600 11,252 3,000 598,539 219,000 2,423,329 12,904 1,372,500 6,380 471,990 434,496,442 1,148,460 80,300 82,344 389,985 567,970 228,368 43,035 10,512 336,633,799 58,370 250,250 16,017,848 1,601 70,442 7,800 4,950 2,494,467 15,912 103,770 Brokerage Firm Federal Reserve Bank of Boston Fidelity Capital Markets Fidelity Clearing Canada Fig Partners, LLC Financial Brokerage Group (FBG) First Analysis Securities Corp. First Energy Capital Friedman, Billings & Ramsey Fubon Securities Co. LTD G Trade Services LTD Gabelli & Co. GK GOH Ometraco, PT Global Hunter Securities, LLC GMP Securities, L.P. Goldman Sachs & Co. Goodbody Stockbrokers Gordon, Haskett & Co. Green Street Advisors Guggenheim Capital Markets, LLC Guzman & Co. Hanwha Securities Seoul Height Securities, LLC Hibernia Southcoast Capital, Inc. HSBC Holdings, PLC Hyundai Securities Co. LTD IC Securities (GH) LTD ICAP, PLC ICBC Financial Services, LLC ICICI Securities LTD IM Trust S.A. Corredores De Bolsa Imperial Capital, LLC India Infoline LTD Industrial and Commercial Bank ING Bank N.V. Investment Section 129 Commissions Paid $ 73 108 1,461 1,032 15,490 563 92 18,970 456 122,205 516 983 76 8,384 4,671,402 6,426 2,811 2,882 13,791 26,695 8,410 1,506 420 726,919 6,819 507 827,100 32 885 144 198 26,886 636 8,899 (continued) .
Schedule of Fees and Commissions PENSION TRUST FUND For the Fiscal Year Ended August 31, 2015 Shares Traded 296,917,600 67,200 44,152 1,424,305 23,041,224 458,450 4,558,724 147,600 3,079,515 54,200 128,585,910 1,249 451,622,272 390,614 331,543,733 9,731 214,181 473,716 47,619 1,193,237 17,657,802 939,279 6,002,183 24,974,369 81,971 66,456 1,012,630 4,696,500 906,655 3,872,100 419,645 2,172,204 7,252,672 13,545,437 109,646 Brokerage Firm Instinet, LLC Interacciones Casa de Bolsa, S.A. de C.V. Intermonte Sec SIM SPA Investec Bank, PLC Investment Technology Group LTD IS Yatirim Menkul Degerler AS ISI Group, Inc. Itau BBA USA Securities, Inc. Itau Chile Corredor De Bolsa LTD Itau Europa Securities, Inc. ITG Group, Inc. ITGL J.P. Morgan Secruities, Inc. Janney Montgomery Scott, LLC Jefferies & Company, Inc. JM Financial Institutional Securites LTD JNK Securities, Inc. Joh. Berenberg, Gossler & Co., KG Johnson Rice & Company, LLC Jones & Associates, Inc. Jones Trading Institutional Services, LLC KAS-Associates N.V. KB Investment & Securities Co.
LTD KCG Americas, LLC Keefe Bruyette & Woods, Inc. Kempen & Co. N.V. Kepler Equities Kestrel Capital East Africa LTD Keybanc Capital Markets, Inc. KIM ENG Holdings LTD Korea Investment & Securities Co. LTD Kotak Securities LTD Lanka Securities Pvt.
LTD LarrainVial S.A. Leerink Swann & Co. Investment Section 130 Commissions Paid $ 1,752,245 728 1,544 52,068 454,251 2,022 111,844 2,136 2,512 1,897 294,339 13 4,748,599 13,555 2,070,607 1,092 8,527 3,544 1,905 56,901 582,762 21,810 20,850 568,526 2,972 1,034 31,888 20,077 35,802 9,336 46,894 32,625 37,262 2,203 4,184 (continued) . Schedule of Fees and Commissions PENSION TRUST FUND For the Fiscal Year Ended August 31, 2015 Shares Traded 32,500 28,553 21,828,724 165,242 5,893,079 152,443 36,150 249,635,648 166,963 24,709 101,619 3,584 4,656,900 6,962,747 1,303,259 10,267 790,324,419 2,765,251 3,366 132,515 2,437,836 143,391 92,400 730,247 13,355 2,649,737 18,237 21,594,545 46,129 37,615 40,125 3,893,780 284,776 592,000 152,908 2,435,543 Brokerage Firm Lek Securities Corp. Liberum Capital LTD Liquidnet Holdings, Inc. Longbow Securities, LLC Loop Capital Markets, LLC M.M. Warburg & Co. MA Sidel & Co. Macquarie Bank LTD MainFirstBank AG Maxim Group Miller Tabak + Co., LLC Mirae Asset Securities Co. LTD Mitsubishi UFJ Securities Co. LTD Mizuho Securities MKM Partners, LLC MND Partners, Inc. Morgan Stanley & Co., Inc. Motilal Oswal Securities LTD Murarilal Saraf National Bank of Canada National Financial Services, LLC Natixis Securities, Inc. NavPoint, LLC Needham & Co. Neonet AB Nesbitt Burns Noble International Investments, Inc. Nomura Securities International, Inc. Nordea Bank AB North South Capital, LLC Northland Securities, Inc. Numis Securities LTD Oddo Finance Okasan Internaitional (Asia) LTD Olivetree Securities LTD Oppenheimer & Co., Inc. Investment Section 131 Commissions Paid $ 1,300 2,174 204,068 6,542 268,609 8,811 362 1,333,524 13,398 979 2,689 5,538 72,557 104,861 47,697 205 4,848,481 25,367 82 3,667 86,905 5,699 3,234 27,290 156 28,729 729 60,175 1,821 1,397 1,443 25,345 14,406 3,831 2,368 83,914 (continued) .
Schedule of Fees and Commissions PENSION TRUST FUND For the Fiscal Year Ended August 31, 2015 Shares Traded 422,121 7,332 46,724 12,606,140 433,334 86,559,480 58,598 106,688 140,000 927,216 29,512 953,420 1,245,469 229,991 7,506 2,109,251 27,641,251 3,170,471 27,452 1,064,268 1,445,000 2,050,158 972,418 94,137 461,750 128,000 3,590 4,164,860 792,837 246,398 76,147,490 53,151 128,414,541 74,707 Brokerage Firm Pacific Crest Securities Panmure Gordon & Co. Parel Penserra Securities, LLC Penson Financial Services, Inc. Pershing Securities LTD Petercam S.A. Pickering Energy Parnters, Inc. Pictet Canada, L.P. Piper Jaffray Publikum Borzno Posredovanje D.D. Pulse Trading, LLC Quaker Securities, Inc. Rabobank Group Rafferty Capital Marktes, LLC Raymond James & Associates, Inc. RBC Financial Group Redburn Partners, LLP Religare Capital Markets LTD Renaissance Capital Holdings LTD RHB Investment Bank Berhand Co. Robert W. Baird & Co., Inc. Rosenblatt Securities, LLC Rosy Blue Securities Pvt. LTD ROTH Capital Partners, LLC Roulston Research Corp. S B Lewis & Company Saigon Securities, Inc. Samsung Securities Co. LTD Sandler O'Neil & Partners, L.P. Sanford C.
Bernstein Co. LTD Santander Investment Securities, Inc. Scotia Capital, Inc. Sea Port Group Securities, LLC Investment Section 132 Commissions Paid $ 15,288 31 4,315 621,931 2,686 1,675,041 7,901 4,152 3,500 33,004 2,577 42,427 40,018 2,926 263 76,497 833,773 16,703 1,493 23,179 2,005 76,736 20,620 2,413 15,255 2,240 108 18,125 110,583 9,856 496,221 2,231 741,793 1,657 (continued) . Schedule of Fees and Commissions PENSION TRUST FUND For the Fiscal Year Ended August 31, 2015 Shares Traded 1,402 23,716 444,017 21,396,605 41,487 29,392 116,486,807 4,473,299 8,539,437 9,355,394 1,322,320 1,591,831 9,413,908 810 21,200 70,026 17,369,273 717,502 131,907 2,600 141,376 523,304 4,907,358 215,320 1,209,580 6,091 90 2,181,179 2,209,700 472,210 276,036 723,798,181 11,860 57,771 4,700 256,005 Brokerage Firm Shenyin & Wanguo Securities Co. Shinhan Investment Corp. Sidoti & Company, LLC SJ Levinson & Sons, LLC Skandinaviska Enskilda Bank Simmons & Company International Societe Generale Group SS Kantilal Ishwarlal Securities Standard Chartered Bank State Street Bank & Trust Co. Stephens, Inc. Sterne Agee & Leach, Inc. Stifel Nicolaus & Co., Inc. Strategas Securities, LLC Stuart Frankel & Co., Inc. Sturdivant & Co., Inc. Sumitomo Mitsui Financial Group, Inc. Suntrust Capital Marktes, Inc. Svenska Handelsbanken Swap Broker Tachibana Securities TD Securities TD Waterhouse Cda Telsey Advisory Group, LLC Tera Menkul Degerler A.S. The Alta Group, LLC Tong Yang Securities, Inc. Topeka Capital Markets Topline Securities (Private) LTD Tudor, Pickering, Holt & Co. Tunisie Valeurs UBS AG U.S. Capital Advisors, LLC UniCredit Bank Austria AG United First Partners, LLP Uti Securities Exchange LTD Investment Section 133 Commissions Paid $ 1 1,361 18,127 1,000,165 1,921 1,176 279,195 36,190 48,267 227,225 43,123 61,017 267,460 28 848 2,801 250,779 27,612 3,093 785 3,051 27,078 155,311 6,656 1,168 4,134 5 22,756 10,442 24,555 6,616 2,367,685 415 25,356 141 2,262 (continued) . Schedule of Fees and Commissions PENSION TRUST FUND For the Fiscal Year Ended August 31, 2015 Shares Traded 1,196,706 95,786 14,400 2,948,958 11,791,787 6,327,645 1,126,479 2,079,592 171,904 407,660 3,030 149,151 140,000 8,800 7,235,723,941 Shares Traded 85,423 2,570,874 553,259 3,209,556 Brokerage Firm VTB Bank Warburg Dillon Read, LLC Watkins & Company, Inc. Wedbush Securities, Inc. Weeden & Co. LTD Wells Fargo Securities, LLC William Blair & Company, LLC Wood & Company Woori Investment Securities Wunderlich Securities, Inc. XP Investimentos CCTVM S.A. Yamner & Co., Inc. Yaunta Core Pacific Securities Zacks & Company Total Futures Contracts Brokerage Firm Credit Suisse Group AG Goldman Sachs & Co. JP Morgan Securities, Inc. Total Investment Section 134 Commissions Paid $ 1,583 14 576 33,535 479,252 228,513 47,153 16,496 18,006 13,901 13 1,492 1,249 313 $ 58,281,287 Commissions Paid $ 49,116 7,856,276 1,150,998 $ 9,056,390 . ACTUARIAL SECTION . Actuarial Information Pension Trust Fund . Actuarial Section 136 . Actuarial Information Pension Trust Fund . Actuarial Section 137 . Actuarial Information Pension Trust Fund Actuarial Section 138 . Actuarial Information Pension Trust Fund Actuarial Section 139 . Actuarial Information Pension Trust Fund Actuarial Section 140 . Actuarial Information Pension Trust Fund Actuarial Present Value of Future Benefits From Actuarial Valuation as of August 31, 2015 (With Comparative Data for August 31, 2014) 2015 Present Value of Benefits Presently Being Paid Service Retirement Benefits Disability Retirement Benefits Death Benefits Present Survivor Benefits TOTAL PRESENT VALUE OF BENEFITS PRESENTLY BEING PAID Present Value of Benefits Payable in the Future to Present Active Members Service Retirement Benefits Disability Retirement Benefits Termination Benefits Death and Survivor Benefits TOTAL ACTIVE MEMBER LIABILITIES Present Value of Benefits Payable in the Future to Present Inactive Members Inactive Vested Participants Refunds of Contributions to Inactive Non-vested Members Future Survivor Benefits Payable On Behalf of Present Annuitants TOTAL INACTIVE LIABILITIES TOTAL ACTUARIAL PRESENT VALUE OF FUTURE BENEFITS 2014 $80,335,545,136 1,113,095,219 851,515,997 243,282,654 $76,357,134,130 1,014,408,651 839,061,459 241,128,389 $82,543,439,006 $78,451,732,629 $98,467,131,191 1,203,603,679 7,863,244,733 1,758,578,113 $109,292,557,716 $100,367,139,589 1,492,083,391 8,638,663,636 1,983,416,721 $112,481,303,337 $4,084,868,043 $3,284,986,647 $400,439,304 $371,647,155 1,341,025,218 $5,826,332,565 1,302,923,361 $4,959,557,163 $197,662,329,287 $195,892,593,129 Summary of Cost Items 2015 Actuarial Present Value of Future Benefits Present Value of Future Normal Costs Actuarial Accrued Liability Actuarial Value of Assets UNFUNDED ACTUARIAL ACCRUED LIABILITY $197,662,329,287 (31,209,404,783) $166,452,924,504 (133,485,187,642) $32,967,736,862 Actuarial Section 141 2014 $195,892,593,129 (35,856,992,303) $160,035,600,826 (128,397,777,855) $31,637,822,971 . Actuarial Information Pension Trust Fund Financing objectives and funding policy: The funding policy of the Teacher Retirement System (TRS) is established by the state legislature. Contribution rates may not be reduced or eliminated, or benefits may not be improved, if, as a result of the particular action, the time, as determined by an actuarial valuation, required to amortize the unfunded actuarial liabilities of the retirement system, would be increased to a period that exceeds 30 years by one or more years. For detailed information, see Note 1. Actuarial Methods and Assumptions: The actuarial valuation for TRS was prepared by Gabriel, Roeder, Smith & Company (GRS). The actuary relied on membership data and asset information provided by TRS staff. While not verifying the data at their source, the actuary performed such tests for consistency and reasonableness as was deemed necessary to be satisfied with the appropriateness of using the data supplied. The actuarial cost method used for financial reporting purposes was the Individual Entry Age Normal method as prescribed by GASB 67 and the method used for funding purposes was the Ultimate Entry Age Normal (EAN) method.
The Ultimate EAN cost method is used because it creates the most level funding requirement across the generations of members and stakeholders. The difference between the two methods resides in the calculation of the normal cost for the members in the system. Under Individual EAN, the normal cost for each member is based on the benefit tier for that member while the Ultimate EAN method uses the normal cost for the tier new members are currently being hired into; which reflects the longer term normal cost. The actuarial methods and assumptions have been selected by the Board of Trustees of the Teacher Retirement System of Texas based upon GRS analysis and recommendations.
The Board of Trustees has sole authority to determine the actuarial assumptions used for the plan. The actuarial methods and assumptions are primarily based on a study of actual experience for the four year period ending August 31, 2014 and was adopted on September 24, 2015. The results of the actuarial valuation are dependent on the assumptions used.
Actual results can and will differ as actual experience deviates from these assumptions. Seemingly minor changes in assumptions can materially change the liabilities, calculated contribution rates, and funding periods. With the exception of the post-retirement mortality rates and the decrease in the assumption for general wage inflation, the changes to overall assumptions and methods had a minor impact on results and are presented in a simpler to understand format.
Post-Retirement Mortality rates for current and future retirees are prepared in accordance with the Actuarial Standards of Practice No. 35 which advises actuaries to “adjust mortality rates to reflect mortality improvement prior to the measurement date and to include an assumption as to the expected mortality improvement after the measurement date.” Actuarial Value of Assets: The actuarial value of assets is equal to the market value of assets less a five-year phase in of the excess (shortfall) between expected investment return and actual income. The actual calculation is based on the difference between actual market value and the expected actuarial value of assets each year, and recognizes the cumulative excess return (or shortfall) over at a minimum rate of 20% per year.
Each year a base is set up to reflect this difference. If the current year’s base is of opposite sign to the deferred bases then it is offset dollar for dollar against the deferred bases. Any remaining bases are then recognized over the remaining period for the base (5 less the number of years between the bases year and the valuation year). Actuarial Assumptions: Investment Return Rate: 8.00% per annum, net of investments, compounded annually, composed of an assumed 2.50% inflation rate and a 5.50% real rate of return. Rates and scales developed in the actuarial investigation as of August 31, 2014, with values at specimen ages shown in the tables below: Actuarial Section 142 .
Actuarial Information Pension Trust Fund Post-Retirement Mortality: Service Retirement Annuitants, Beneficiaries and Survivors Post-Retirement Mortality Age Male Members Female Members 40 50 60 70 80 90 100 110 0.001938 0.004247 0.005584 0.015547 0.053691 0.162983 0.407509 0.500000 0.001585 0.002791 0.003882 0.009613 0.035591 0.133727 0.284047 0.467915 Rates of Retirement (for members hired after August 31, 2007): For members hired after August 31, 2007 and who are not vested as of August 31, 2014, or, for members hired after August 31, 2014, the retirement rates for members once they reach unreduced retirement eligibility at age 62 are increased 10% for each year the member is beyond the Rule of 80 (i.e. if the member reached the Rule of 80 at age 58 then the probability of retirement at age 62 is 140% of the rate shown below). Rates of Retirement Normal Retirement Age Male Female 50 0.1300 0.3000 51 0.1300 0.1200 52 0.1300 0.1300 53 0.1300 0.1400 54 0.1400 0.1500 55 0.1500 0.1600 56 0.1600 0.1700 57 0.1700 0.1800 58 0.1800 0.1900 59 0.1800 0.2000 60 0.2200 0.2100 61 0.2000 0.2200 62 0.2400 0.2300 63 0.2000 0.2300 64 0.2000 0.2300 65-74 0.2200 0.2300 75 1.0000 1.0000 Early Retirement Age Male Female 45-46 0.0100 0.0100 47 0.0100 0.0200 48 0.0200 0.0300 49 0.0300 0.0400 50-58 0.0100 0.0100 59 0.0100 0.0200 60-61 0.0200 0.0200 62 0.0500 0.0400 63 0.0500 0.0500 64 0.0600 0.0600 65 0.0500 0.0500 Actuarial Section 143 . Actuarial Information Pension Trust Fund Rates of Termination (net of applying rehire assumption): Probability of Decrement Due to Withdrawal Years of Service 1 2 3 4 5 6 7 8 9 10 Male Members 0.149027 0.119756 0.096637 0.072275 0.062453 0.055556 0.047176 0.041464 0.036978 0.033777 Female Members 0.143098 0.117329 0.097896 0.076765 0.068443 0.060368 0.049631 0.043108 0.038477 0.035264 Rates of Disability Retirement: Probability of Decrement Due to Disability Age 20 30 40 50 60 For Service >= 10 Male Female 0.000184 0.000276 0.000184 0.000276 0.000430 0.000469 0.001993 0.001817 0.003505 0.002754 For Service < 10 Male 0.000037 0.000037 0.000086 0.000399 0.000701 Female 0.000055 0.000055 0.000094 0.000363 0.000551 Active Mortality: Active Mortality Age 20 30 40 50 60 70 80 90 Male Members 0.000365 0.000407 0.000565 0.001517 0.004219 0.012469 0.034930 0.123749 Actuarial Section 144 Female Members 0.000146 0.000196 0.000356 0.000992 0.002198 0.005678 0.016542 0.092945 . Actuarial Information Pension Trust Fund Rates of Salary Increase: The following table reflects an inflation rate of 2.50%, plus productivity component of 1.00%, plus step-rate/promotional component as shown. Rates of Salary Increase Years of Service Merit, Promotion, Longevity 1 2 3 4 5 6 7 8-12 13 14 15 16-17 18 19-20 21-22 23-24 25 or more 6.00% 2.50 1.90 1.70 1.50 1.40 1.20 1.00 0.80 0.70 0.60 0.50 0.40 0.30 0.20 0.10 0.00 General 3.50% 3.50 3.50 3.50 3.50 3.50 3.50 3.50 3.50 3.50 3.50 3.50 3.50 3.50 3.50 3.50 3.50 Total 9.50% 6.00 5.40 5.20 5.00 4.90 4.70 4.50 4.30 4.20 4.10 4.00 3.90 3.80 3.70 3.60 3.50 Actuarial Cost Method: The funding period required to amortize the unfunded actuarial accrued liability is determined using the entry age actuarial cost method. This method assigns the plan’s total unfunded liabilities (the actuarial present value of future benefits less the actuarial value of assets) to various periods. Funding of Unfunded Actuarial Accrued Liability: Funded by the excess of future State/employer contributions required by law over the amount of such contributions required to fund the normal cost of benefits. Under the actuarial funding method and the benefit provisions for new hires, the ultimate normal cost for benefits provided by the System is 9.92% of payroll (7.70% by members plus 2.22% by the State). An additional 0.12% of payroll is used to pay for administrative expenses of the System, leaving 5.36% of payroll less than the ultimate total contribution rate required by law.
It is intended that the excess amount of 5.36% of payroll will be used to amortize any unfunded actuarial accrued liabilities of the System, assuming that total payroll increases by 2.50% per year. As of the valuation as of August 31, 2015, these excess contributions of 5.36% of pay are sufficient to amortize the UAAL, but not under the prescribed 30 year funding period. Actuarial Section 145 . Actuarial Information Pension Trust Fund Schedule of Active Member Valuation Data: Schedule of Active Member Valuation Data Valuation Year Active Members 2006 2007 2008 2009 2010 2011 2012 2013 2014 2015 Annualized Payroll in Thousands 761,658 777,789 801,455 817,537 834,060 828,919 815,155 831,302 857,342 828,851 $28,397,283 31,114,096 33,237,904 35,096,890 36,628,844 36,797,011 36,309,449 37,104,333 39,195,104 37,121,748 Average Annual Salary Annual Percentage Increase in Average Salary $37,284 40,003 41,472 42,930 43,916 44,392 44,543 44,634 45,717 44,787 2.8% 7.3 3.7 3.5 2.3 1.1 0.3 0.2 2.4 (2.0) Schedule of Retirees, Beneficiaries, and Disabled Participants Added to and Removed from Rolls: Retirees, Beneficiaries, and Disabled Participants Added to and Removed from Rolls Added to Rolls Valuation as of August 31 2006 2007 2008 2009 2010 2011 2012 2013 2014 2015 Number Annual Allowances 15,810 15,861 17,727 17,326 20,076 24,688 27,915 25,825 24,429 25,134 $324,292,542 336,348,640 391,920,863 392,452,923 473,512,423 620,038,676 697,134,389 743,998,946 573,876,713 604,436,264 Removed from Rolls Number Annual Allowances 7,175 7,698 7,806 7,940 8,199 8,499 8,848 9,344 9,475 10,578 $120,623,840 131,295,705 135,160,090 136,537,511 142,187,645 147,985,004 155,597,838 165,231,795 174,915,127 191,966,951 Actuarial Section 146 Rolls - End of Year Number Annual Allowances Percentage Annual Increase 257,144 265,307 275,228 284,614 296,491 312,680 331,747 348,228 363,182 377,738 $5,282,107,571 5,487,160,506 5,743,921,279 5,999,836,691 6,331,161,469 6,803,215,141 7,344,751,692 7,923,518,843 8,322,480,429 8,734,949,742 4.0% 3.9 4.7 4.5 5.5 7.5 8.0 7.9 5.0 5.0 Average Annual Allowances $20,541 20,682 20,870 21,081 21,354 21,758 22,140 22,754 22,915 23,124 . Actuarial Information Pension Trust Fund Analysis of Financial Trends: Analysis of Financial Experience Changes in Unfunded Actuarial Accrued Liabilities (UAAL)* Resulting from Differences Between Assumed Experience and Actual Experience Increase/(Decrease) for Year (Billions) As of August 31 2015 2014 2013 2012 2011 2010 2009 2008 2007 2006 Investment (Gains)/ Losses $1.237 (1.095) 2.045 2.208 1.958 1.161 10.321 (1.232) (4.140) (0.264) Legislative Changes/ Benefit Increases 0.360 Contribution Assumption Experience Changes $0.912 1.157 1.911 1.258 0.826 0.797 0.149 0.228 0.496 0.508 $0.682 2.282 0.708 (0.271) 0.676 *Calculated on a 5-year smoothed market basis Actuarial Section 147 Liability Experience ($1.501) 0.358 (1.829) (1.427) (1.350) (0.705) (0.347) (0.694) 2.135 0.254 Net Increase/ (Decrease) $1.330 2.702 2.835 2.039 1.163 1.253 10.123 (1.022) (1.149) 0.498 Beginning UAAL Ending UAAL $31.638 28.936 26.101 24.062 22.899 21.646 11.523 12.545 13.694 13.196 $32.968 31.638 28.936 26.101 24.062 22.899 21.646 11.523 12.545 13.694 . Actuarial Information Pension Trust Fund Solvency Test: A short-term solvency test is one means of checking a retirement system’s progress under its funding program. The schedule below provides a historical illustration of a short-term solvency test for TRS wherein present assets are compared with: (1) active member contributions on deposit; (2) the liabilities for future benefits to present annuitants (Retirees and Beneficiaries); (3) the liabilities for active members under the entry age normal actuarial cost method including a projection of future salary increases and anticipated future service (Active Members (State Financed Portion)). Under the level percent of payroll financing followed by TRS, liabilities for active member contributions on deposit and the liabilities for future benefits to present retirees and beneficiaries will be fully covered by present assets except in rare circumstances. In addition, liabilities for active member benefits earned or to be earned in the future will be partially covered by the remainder of present assets. Generally, if the system has been using level cost financing, the funded portion of active member benefits will increase over time. Solvency Test (AMOUNTS SHOWN IN MILLIONS) Valuation as of August 31 2006 2007 2008 2009 2010 2011 2012 2013 2014 2015 Aggregate Actuarial Accrued Liabilites For Active Members Active Member Retirees and (State Financed Portion) Contributions Beneficiaries (3) (1) * (2) * $20,590 22,236 23,928 23,914 27,559 28,911 30,006 31,365 33,028 33,856 $49,144 51,293 53,243 55,484 58,476 63,470 68,449 73,841 78,431 82,535 $38,177 42,435 44,585 48,632 48,156 46,934 45,972 45,460 48,576 50,062 Valuation Assets $94,128 103,419 110,233 106,384 111,293 115,253 118,326 121,730 128,398 133,485 *Adjusted for pending transfers to retired reserve at August 31 for pending retirements. Actuarial Section 148 Portion of Aggregate Actuarial Accrued Liabilities Covered by Valuation Assets Active Active Members Member Retirees and (State Financed Contributions Beneficiaries Portion) (1) * (3) (2) * 100% 100 100 100 100 100 100 100 100 100 100% 100 100 100 100 100 100 100 100 100 64.1% 70.4 74.2 55.5 52.5 48.7 43.2 36.4 34.9 34.1 .
Actuarial Information Pension Trust Fund Schedule of Funding Progress: Taking into account only the dollar amounts of aggregate actuarial accrued liabilities and unfunded actuarial accrued liabilities (UAAL) can be misleading. The dollar amounts of these two items can be increasing at a time when their actual substance may be decreasing. Dividing valuation asset dollars by aggregate actuarial accrued liability dollars and dividing UAAL dollars by active member payroll dollars provide clarifying indices. The larger the ratio of valuation assets to aggregate actuarial accrued liabilities, the stronger the system.
Observation of these relative indices over a period of years will give an indication of whether the system is becoming stronger or weaker. Schedule of Funding Progress (DOLLAR AMOUNTS SHOWN IN MILLIONS) [1] [2] [3] [4]* [5] Valuation as of August 31 Actuarial Value of Assets Actuarial Accrued Liability (AAL) Unfunded AAL (UAAL) (3)-(2) Funded Ratio Assets as a % of AAL (2)/(3) 2006 2007 2008 2009 2010 2011 2012 2013 2014 2015 $94,218 103,419 110,233 106,384 111,293 115,253 118,326 121,730 128,398 133,485 $107,911 115,964 121,757 128,029 134,191 139,315 144,427 150,666 160,036 166,453 $13,694 12,545 11,523 21,646 22,899 24,062 26,101 28,936 31,638 32,968 87.3% 89.2 90.5 83.1 82.9 82.7 81.9 80.8 80.2 80.2 [6] [7] Projected Payroll UAAL as a % of Covered Payroll (4)/(6) $28,397 31,114 33,238 35,097 36,629 36,797 36,310 37,104 38,522 39,620 48.2% 40.3 34.7 61.7 62.5 65.4 71.9 78.0 82.1 83.2 *Slight variances with the Actuarial Report could result due to rounding. The 10 year schedule of actuarially determined and actual contributions can be found in the Required Supplementary Information section. Actuarial Section 149 . Actuarial Information TRS-Care Actuarial Section 150 . Actuarial Information TRS-Care Actuarial Section 151 . Actuarial Information TRS-Care Actuarial Present Value of Future Benefits From Actua ri a l Va l ua ti on a s of Augus t 31, 2015 (Wi th Compa ra ti ve Da ta for Augus t 31, 2014) Based on a 5.25% discount rate 2015 Present Value of Benefits Being Paid Future Medical Claims Future Rx Claims Retiree Premiums Collected NET PRESENT VALUE OF BENEFITS FOR CURRENT RETIREES Present Value of Benefits Payable in the Future to Present Active Members Future Medical Claims Future Rx Claims Retiree Premiums Collected NET PRESENT VALUE OF BENEFITS FOR FUTURE RETIREES TOTAL ACTUARIAL PRESENT VALUE OF FUTURE BENEFITS 2014 $ 11,456,408,122 14,992,390,269 (5,699,607,494) $ 10,639,267,795 11,335,260,965 (5,667,042,108) $ 20,749,190,897 $ 16,307,486,652 $ 27,343,585,400 30,521,332,625 (11,174,537,629) $ 22,589,627,235 22,183,678,917 (10,422,453,865) $ 46,690,380,396 $ 34,350,852,287 $ 67,439,571,293 $ 50,658,338,939 Summary of Cost Items 2015 Actuarial Present Value of Future Benefits Present Value of Future Normal Costs Actuarial Accrued Liability Actuarial Value of Assets UNFUNDED ACTUARIAL ACCRUED LIABILITY 2014 $ 67,439,571,293 (23,236,242,417) $ 44,203,328,876 (972,919,240) $ 50,658,338,939 (16,939,789,860) $ 33,718,549,079 (457,940,487) $ 43,230,409,636 $ 33,260,608,592 Actuarial Value of Assets: The Actuarial Present Value of benefits allocated to a valuation year is called the Normal Cost. The Actuarial Present Value of benefits allocated to all periods prior to a valuation year is called the Actuarial Accrued Liability. Differences between assumed experience and actual experience (“actuarial gains and/or losses”) become part of actuarial accrued liabilities. Actuarial Methods and Assumptions: The actuarial valuation of TRS-Care is prepared by Gabriel, Roeder, Smith & Company. The actuary relies on membership data and asset information provided by TRS staff. While not verifying the data at their source, the actuary performs such tests for consistency and reasonableness as deemed necessary to be satisfied with the appropriateness of using the data supplied. Actuarial Section 152 .
Actuarial Information TRS-Care Analysis of Financial Trends: Analysis of Financial Experience (AMOUNTS SHOWN IN MILLIONS) 2012 2013 2014 2015 Asset Gain/(Loss) Liability Gain/(Loss) New Assumptions Gain/(Loss) Benefit Changes Gain/(Loss) Contributions Gain/(Loss) Net Gains/(Loss) $ Valuation as of August 31 $ $ $ $ $ (38) (31) (24) (36) 2,148 24 (619) (3,369) (1,302) (1,699) (1,235) (6,232) 3,458 1,266 0 0 (1,485) (1,458) (1,522) (1,004) 2,781 (1,898) (3,400) (10,641) Solvency Test: Solvency Test (AMOUNTS SHOWN IN MILLIONS) Portion of Aggregate Actuarial Accrued Liabilities Covered by Valuation Assets Aggregate Actuarial Accrued Liabilities For (1) Valuation as of August 31 2008 2009 2010 2011 2012 2013 2014 2015 (2) (3) (4) (5) Beneficiaries Active Member and Vested Members (Employer Valuation Contributions* Terminations Financed Portion) Assets NA NA NA NA NA NA NA NA $9,318 9,642 10,918 13,710 12,676 14,367 16,307 20,749 $12,994 14,716 14,889 16,075 14,866 15,468 17,411 23,454 $729 800 815 891 741 551 458 973 (6) (7) (8) Active Beneficiaries and Members Member Vested (Employer Financed Contributions Terminations [(5)- Portion) [(5)-(2)(5)/(2) (2)]/(3) (3)]/(4) NA NA NA NA NA NA NA NA 7.8% 8.3 7.5 6.5 5.8 3.8 2.8 4.7 0.0% 0.0 0.0 0.0 0.0 0.0 0.0 0.0 *Active member contributions are non-refundable. Actuarial Cost Method: The Projected Unit Credit actuarial cost method of valuation was used in determining liabilities and normal cost. A method under which the benefits of each individual included in an Actuarial Valuation are allocated by a consistent formula to valuation years. All benefits are projected according to healthcare trends and aging factors as disclosed above. Funding of Unfunded Actuarial Accrued Liability: Unfunded actuarial accrued liabilities are amortized to produce payments (principal & interest) which are a level percent of payroll. Actuarial Section 153 . Actuarial Information TRS-Care All of the demographic assumptions (rates of retirement, termination and disability) and most of the economic assumptions (general inflation, salary increases, and general payroll growth) used in this OPEB Valuation are identical to those which were adopted by the Board in 2015 after the preparation of an actuarial experience study and used in the respective TRS valuation. The following assumptions which are specific to OPEB were updated from the prior year’s report: 1. The trend rates were reset to better reflect the plan’s anticipated experience. The new trend assumptions assume: a. a faster growth in prescription drug costs than the prior assumptions b.
retiree premiums will not increase in FYE17 c. a lower ultimate trend assumption based on the revised inflation assumption 2. The ultimate trend assumption was increased by 0.20% to reflect the anticipated costs associated with the “Cadillac Tax”. Schedule of Retirees and Beneficiaries Added to and Removed from Rolls: Schedule of Retirees and Beneficiaries Added to and Removed from Rolls Added to Rolls (2) (3) Removed from Rolls (4) (5) Rolls - End of Year (6) (7) (1) Valuation as of August 31 Number Annual Allowances Number Annual Allowances Number 2009 2010 2011 2012 2013 2014 2015 12,158 14,996 20,467 19,407 19,798 18,916 19,171 $ 54,271,769 71,136,696 109,331,023 92,279,848 98,603,255 97,956,524 106,177,651 8,192 7,924 8,019 8,220 10,176 10,656 11,116 $ 19,365,868 21,837,784 24,802,618 28,700,248 25,946,471 27,648,497 31,400,277 202,934 $ 694,017,558 210,006 757,979,912 222,454 898,001,599 233,641 768,682,199 243,263 824,715,257 251,523 933,885,969 259,578 1,050,329,854 Annual Allowances * (8) (9) % Increase Average in Annual Annual Allowances Allowances 14.5% 9.2 18.5 (14.4) 7.3 13.2 12.5 $ 3,420 3,609 4,037 3,290 3,390 3,713 4,046 * Expected employer provided claims and expenses (net of retiree premiums).
Annual allowances in Column (7) include increases due to health care inflation for continuing retirees. Therefore, the annual allowance is not equal to the beginning of year allowance plus the "Added to Rolls" allowance minus the "Removed from Rolls" allowance. Actuarial Section 154 . STATISTICAL SECTION . Statistical Section Overview This page is intentionally left blank. Statistical Section 156 . Statistical Section Overview The Statistical Section presents additional information to provide financial statement users with added historical perspective, context and detail to assist in using the information in the financial statements, notes to financial statements, and required supplementary information to understand and assess the system’s financial condition. Information is presented for the Pension Trust Fund, TRS-Care, TRS-ActiveCare, and the 403(b) Administrative Program. FINANCIAL TRENDS INFORMATION The schedules on the following pages show financial trends information that assists users in understanding and assessing how the system’s financial position has changed over time. The financial trend schedules presented are: • Changes in Fiduciary Net Position • Revenues, Expenses and Changes in Net Position • Benefit and Refund Deductions from Net Position by Type • Benefit Deductions from Net Position by Type OPERATING INFORMATION The schedules presented immediately following the Financial Trends Information contain benefit and reporting operating information to provide contextual data about the system’s operations and resources to assist users in using financial statement information to understand the benefit services provided by the system. The operating information schedules presented are: • Average Benefit Payments – Pension Trust Fund • Average Monthly Benefit – Pension Trust Fund • Average Benefit Payments – Health Benefits • Retired Members by Type of Benefit – Pension Trust Fund • Health Benefit Payments by Range • Principal Participating Employers In addition, a complete listing of participating employers has been included.
The information in this section was derived from internal sources and the CAFR for the relevant year. Statistical Section 157 . FINANCIAL TRENDS INFORMATION Changes in Fiduciary Net Position PENSION TRUST FUND For the Fiscal Years Ended August 31 2015 Additions Member Contributions State's General Fund Non-Employer Contributing Entity Employer Contributions Participating Employers Purchase of Service Credit 415 Excess Benefit Arrangement Service Contributions Transferred in from ERS Investment Income Net of Expenses Interest, Dividends & Securities Lending Net Increase (Decrease) in Fair Value of Investments Other TOTAL ADDITIONS Deductions Benefits Excess Benefits Refunds of Contributions Service Contributions Transferred to ERS Administrative Expenses, Excluding Investing Activity Expenses TOTAL DEDUCTIONS Net Increase (Decrease) Net Position - Beginning of Year Net Position - End of Year 2014 2013 2012 $ 2,576,024,311 $ 2,357,686,000 $ 2,252,094,934 $ 2,188,020,423 1,591,482,988 93,079,033 1,284,893,620 50,089,106 2,216,586 18,989,008 1,530,623,829 120,206,921 864,345,470 143,534,091 2,273,832 17,440,313 1,337,214,693 105,559,580 820,134,412 148,400,880 2,520,830 16,365,042 1,299,077,635 91,532,506 669,305,127 125,971,764 2,483,369 14,940,228 6,694,883,534 2,990,774,278 1,779,069,580 1,875,281,841 (7,107,642,634) 16,443,655,756 3,733,133 4,143,449 $ 5,207,748,685 $ 24,474,683,939 8,055,066,425 2,629,383 $ 14,519,055,759 5,972,016,449 1,867,389 $ 12,240,496,731 $ 8,935,111,459 2,216,586 391,341,181 84,059,353 $ 8,548,642,525 2,273,832 410,600,319 80,163,847 $ 8,075,208,484 2,520,830 391,292,412 75,513,146 $ 7,723,622,166 2,483,369 381,231,352 70,985,963 35,556,979 $ 9,448,285,558 $ (4,240,536,873) $132,779,243,085 $128,538,706,212 41,904,190 $ 9,083,584,713 $ 15,391,099,226 $117,388,143,859 $132,779,243,085 36,264,062 $ 8,580,798,934 $ 5,938,256,825 $111,449,887,034 $117,388,143,859 33,073,740 $ 8,211,396,590 $ 4,029,100,141 $107,420,786,893 $111,449,887,034 Pension Trust Fund Net Position Last Ten Years Billions $140 $130 $120 $110 $100 $90 $80 2006 2007 2008 2009 2010 2011 2012 Statistical Section 158 2013 2014 2015 . FINANCIAL TRENDS INFORMATION 2011 2010 2009 2008 2007 2006 $ 2,243,954,725 $ 2,205,017,425 $ 2,107,057,870 $ 1,998,138,487 $ 1,862,595,865 $ 1,700,415,419 1,484,285,519 111,486,255 744,733,236 105,177,104 1,750,588 12,628,712 1,461,034,870 116,553,826 719,051,333 84,519,762 1,504,510 11,167,772 1,378,304,342 103,539,599 687,910,583 74,542,413 1,553,381 9,558,927 1,352,243,134 98,785,295 604,937,605 87,207,374 1,646,494 8,897,722 1,283,641,587 187,489,771 282,077,713 86,497,411 1,453,605 7,913,660 1,166,690,192 165,411,289 267,399,619 153,556,417 1,041,961 6,908,439 2,020,253,763 1,868,708,873 2,058,925,313 3,387,500,183 3,066,117,408 2,624,813,225 12,616,681,465 1,576,613 $ 19,342,527,980 7,542,738,000 788,787 $ 14,011,085,158 (16,030,794,035) (7,992,472,030) 11,232,429,170 3,899 3,596 5,405 $ (9,609,397,708) $ (453,112,140) $ 18,010,221,595 6,326,056,726 769 $ 12,412,294,056 $ 7,173,504,788 1,750,588 334,268,822 64,772,079 $ 6,617,397,374 1,504,510 265,186,589 61,570,750 $ 6,294,434,115 1,553,381 266,695,076 57,135,135 $ 6,406,644,540 1,646,494 278,002,614 52,773,854 $ 5,762,885,044 1,453,605 280,005,584 48,538,424 $ 5,540,134,272 1,041,961 267,810,017 45,716,307 35,849,819 $ 7,610,146,096 $ 11,732,381,884 $ 95,688,405,009 $107,420,786,893 $ $ $ $ 28,310,448 $ 6,648,128,155 $ (16,257,525,863) $104,910,497,545 $ 88,652,971,682 26,122,662 $ 6,765,190,164 $ (7,218,302,304) $112,128,799,849 $104,910,497,545 27,502,276 $ 6,120,384,933 $ 11,889,836,662 $100,238,963,187 $112,128,799,849 26,444,405 $ 5,881,146,962 $ 6,531,147,094 $ 93,707,816,093 $100,238,963,187 29,992,608 6,975,651,831 7,035,433,327 88,652,971,682 95,688,405,009 Statistical Section 159 . FINANCIAL TRENDS INFORMATION Changes in Fiduciary Net Position TRS-CARE For the Fiscal Years Ended August 31 2015 2013 2012 $ 363,631,292 267,497,910 189,003,903 193,124,772 $ 355,685,504 139,095,786 180,824,523 160,952,396 $ 363,348,030 271,925,242 176,751,407 154,607,926 126,806,652 231,569,472 1,495,680 768,100,754 $2,179,310,118 Deductions Health Care Claims and Insurance Premium Payments Health Care Claims Processing and Other Administrative Expenses TOTAL DEDUCTIONS Net Increase (Decrease) Net Position - Beginning of Year Net Position - End of Year 2014 $ 369,066,459 281,098,358 198,196,273 202,976,470 Additions Health Care Premiums State Contributions Member Contributions Participating Employers Fringe Benefits Paid by State's General Fund on Behalf of TRS Employees Federal Revenue Rebate and Discount Income* Investment Income Supplemental Appropriation TOTAL ADDITIONS 139,422 78,589,415 200,859,859 2,061,745 36,058,148 $1,330,966,466 117,770 74,511,473 82,074,803 3,041,001 102,363,704 $1,098,666,960 103,676 68,633,946 $1,040,560,161 $1,613,181,278 47,380,407 3,769,680 $1,664,331,365 $ 514,978,753 $ 457,940,487 $ 972,919,240 $1,375,039,945 45,387,769 3,646,546 $1,424,074,260 $ (93,107,794) $ 551,048,281 $ 457,940,487 $1,241,656,374 43,577,852 3,398,109 $1,288,632,335 $ (189,965,375) $ 741,013,656 $ 551,048,281 $1,142,131,410 44,571,383 3,714,018 $1,190,416,811 $ (149,856,650) $ 890,870,306 $ 741,013,656 *Prior to fiscal year 2013, rebates were offset within health care claims. Millions $1,000 TRS-Care Net Position Last Ten Years $900 $800 $700 $600 $500 $400 2006 2007 2008 2009 2010 2011 2012 2013 2014 2015 Statistical Section 160 5,189,934 . FINANCIAL TRENDS INFORMATION 2011 2010 2009 2008 2007 2006 $ 345,164,271 282,782,431 183,808,580 158,724,010 $ 332,481,933 279,250,547 181,512,856 155,918,241 $ 329,723,191 267,471,299 173,856,344 149,562,613 $ 328,505,433 254,722,174 165,569,413 141,672,630 $ 323,957,945 238,190,720 154,823,968 136,008,512 $ 326,844,982 215,666,940 140,183,511 118,607,527 108,440 136,887,805 101,511 70,795,686 95,929 61,530,735 91,945 59,486,239 55,932 52,329,617 53,283 34,611,607 8,168,640 11,679,229 17,482,143 29,252,347 32,671,539 21,435,792 $1,115,644,177 $1,031,740,003 $ 999,722,254 $ 979,300,181 $ 938,038,233 $ 857,403,642 $ 992,478,380 44,115,872 3,143,922 $1,039,738,174 $ 75,906,003 $ 814,964,303 $ 890,870,306 $ 971,356,805 42,535,601 3,031,686 $1,016,924,092 $ 14,815,911 $ 800,148,392 $ 814,964,303 $ 885,132,865 40,364,063 2,916,259 $ 928,413,187 $ 71,309,067 $ 728,839,325 $ 800,148,392 $ 833,509,538 36,747,710 3,000,536 $ 873,257,784 $ 106,042,397 $ 622,796,928 $ 728,839,325 $ 742,293,147 33,407,937 2,526,189 $ 778,227,273 $ 159,810,960 $ 462,985,968 $ 622,796,928 $ 687,086,291 31,975,150 2,513,102 $ 721,574,543 $ 135,829,099 $ 327,156,869 $ 462,985,968 Statistical Section 161 . FINANCIAL TRENDS INFORMATION Revenues, Expenses, and Changes in Net Position TRS - ACTIVECARE For the Fiscal Years Ended August 31 Expenses Health Care Claims Health Care Claims Processing and Other Premium Payments to HMOs Administrative Expenses TOTAL EXPENSES Net Increase (Decrease) Net Position - Beginning of Year Net Position - End of Year* 2015 2014 2013 2012 $ 1,943,949,265 236,749 1,537,408 $ 1,928,895,465 139,608 940,022 $ 1,808,521,683 137,630 746,936 $ 1,749,905,117 136,324 1,697,553 29,706 $ 1,945,723,422 79,792 $ 1,930,054,887 75,664 $ 1,809,481,913 72,094 $ 1,751,840,794 $ 1,565,255,957 135,073,416 178,192,468 2,225,417 $ 1,880,747,258 $ 64,976,164 $ 22,839,112 $ 87,815,276 Revenues Health Care Premiums Administrative Fees and Other Investment Income Federal Revenue ARRA-COBRA Reimbursements Fringe Benefits Paid by State's General Fund on Behalf of TRS Employees TOTAL REVENUES $ 1,521,834,989 109,925,954 154,913,859 2,569,850 $ 1,789,244,652 $ 140,810,235 $ (117,971,123) $ 22,839,112 * $ 1,785,069,768 84,903,101 100,905,702 2,351,802 $ 1,973,230,373 $ (163,748,460) $ 45,777,337 $ (117,971,123) $ 1,718,903,645 83,346,223 89,706,406 2,176,610 $ 1,894,132,884 $ (142,292,090) $ 188,069,427 $ 45,777,337 * For FY 2014 and fiscal years prior to FY 2013, Net Position balances were all restricted. In FY 2013 the unrestricted balance is $(117,971,123) and restricted is zero. Millions TRS-ActiveCare Net Position Last Ten Years $600 $500 $400 $300 $200 $100 $0 ($100) ($200) 2006 2007 2008 2009 2010 2011 2012 2013 2014 2015 Statistical Section 162 . FINANCIAL TRENDS INFORMATION 2011 2010 2009 2008 2007 2006 $ 1,549,530,891 135,917 3,387,062 667,746 $ 1,329,171,411 125,321 6,421,269 1,225,158 $ 1,172,011,048 187,813 11,597,992 170,219 $ 1,096,537,022 186,844 21,164,640 $ 939,694,028 184,937 26,016,380 $ 861,464,205 183,470 18,650,516 67,373 $ 1,553,788,989 64,328 $ 1,337,007,487 64,975 $ 1,184,032,047 61,894 $ 1,117,950,400 46,446 $ 965,941,791 40,979 $ 880,339,170 $ 1,510,090,981 76,960,951 76,270,706 2,207,051 $ 1,665,529,689 $ (111,740,700) $ 299,810,127 $ 188,069,427 $ 1,313,114,197 67,906,654 64,532,253 1,883,148 $ 1,447,436,252 $ (110,428,765) $ 410,238,892 $ 299,810,127 $ 1,122,646,958 60,934,432 64,820,440 1,861,949 $ 1,250,263,779 $ (66,231,732) $ 476,470,624 $ 410,238,892 $ 952,156,339 54,583,499 68,204,743 1,830,258 $ 1,076,774,839 $ 41,175,561 $ 435,295,063 $ 476,470,624 $ 801,148,962 48,177,777 58,742,363 1,775,831 $ 909,844,933 $ 56,096,858 $ 379,198,205 $ 435,295,063 $ 708,972,484 53,013,214 49,466,150 1,680,952 $ 813,132,800 $ 67,206,370 $ 311,991,835 $ 379,198,205 Statistical Section 163 . FINANCIAL TRENDS INFORMATION Revenues, Expenses, and Changes in Net Position 403(b) ADMINISTRATIVE PROGRAM For the Fiscal Years Ended August 31 Expenses Administrative Expenses TOTAL EXPENSES Net Increase (Decrease) Net Position - Beginning of Year Net Position - End of Year Thousands $450 2014 2013 2012 $ 27,000 21,000 1,360 $ 15,000 15,000 1,324 $ 60,000 81,000 1,333 $ 114,000 63,000 707 $ 49,360 3,131 $ 34,455 2,890 $ 145,223 2,772 $ 180,479 $ 78,446 $ 78,446 $ (29,086) $ 328,156 $ 299,070 Revenues Certification Fees Product Registration Fees Investment Income Fringe Benefits Paid by State's General Fund on Behalf of TRS Employees TOTAL REVENUES 2015 $ 62,636 $ 62,636 $ (28,181) $ 356,337 $ 328,156 $ 40,194 $ 40,194 $ 105,029 $ 251,308 $ 356,337 $ $ $ $ $ 403(b) Administrative Program Net Position Last Ten Years $400 $350 $300 $250 $200 $150 $100 2006 2007 2008 2009 2010 2011 2012 2013 2014 2015 Statistical Section 164 51,203 51,203 129,276 122,032 251,308 . FINANCIAL TRENDS INFORMATION 2011 $ 12,000 3,000 1,801 $ 7,898 24,699 $ $ $ $ $ 148,444 148,444 (123,745) 245,777 122,032 2010 $ $ 30,000 21,000 4,318 8,034 63,352 $ 172,835 $ 172,835 $ (109,483) $ 355,260 $ 245,777 2009 $ $ 6,000 9,000 8,558 23,558 $ 88,000 $ 88,000 $ (64,442) $ 419,702 $ 355,260 2008 2007 2006 30,000 180,000 19,337 $ 171,000 $ 30,000 12,070 9,532 $ 229,337 $ 183,070 $ 39,532 $ $ $ $ $ $ 24,000 $ 24,000 $ 159,070 $ 223,295 $ 382,365 $ $ $ $ $ $ 192,000 192,000 37,337 382,365 419,702 Statistical Section 165 24,000 24,000 15,532 207,763 223,295 . FINANCIAL TRENDS INFORMATION Benefit and Refund Deductions from Net Position by Type PENSION TRUST FUND Last Ten Fiscal Years 2015 Type of Benefit Service Retirements** Deferred Retirement Option Partial Lump Sum Option Disability Retirements Death and Survivor Benefits: Annual Salary Survivor Annuities Life Annuities 60 Monthly Payments Remainder of Contributions TOTAL BENEFITS Type of Refund Death Separation TOTAL REFUNDS 2014 2013 2012 $ 8,215,765,876 $ 7,795,690,586 $ 7,251,369,740 $ 6,808,592,209 9,643,121 14,974,505 17,223,523 22,361,937 288,923,266 322,033,388 410,323,790 501,152,157 169,318,064 164,299,506 156,308,471 150,238,202 39,574,595 44,846,010 41,219,707 46,859,444 100,150,048 97,822,817 94,563,001 92,126,049 90,563,081 89,547,742 87,044,328 85,816,402 14,443,193 13,415,885 12,659,471 11,816,313 6,730,215 6,012,086 4,496,453 4,659,453 $ 8,935,111,459 $ 8,548,642,525 $ 8,075,208,484 $ 7,723,622,166 $ $ 5,474,475 $ 385,866,706 391,341,181 $ 5,455,829 $ 405,144,490 410,600,319 $ 4,705,228 $ 386,587,184 391,292,412 $ 5,294,006 375,937,346 381,231,352 * A one-time supplemental payment that is capped at $2,400 was distributed to eligible retirees in January 2008. ** For fiscal years 2010 and prior, Service Retirements changed due to the reclassification of Transfers of Service Contributions with Employees Retirement System of Texas. Benefit Deductions from Net Position by Type TRS-CARE Last Ten Fiscal Years 2015 Type of Claim Medical Claims and Insurance Premiums Prescription drugs*** TOTAL 2014 2013 2012 $ 805,668,819 $ 691,283,731 $ 687,469,016 $ 687,987,585 649,457,501 539,842,962 496,229,923 454,143,825 $ 1,455,126,320 $ 1,231,126,693 $ 1,183,698,939 $ 1,142,131,410 *** Note: For TRS-CARE, 2013 and 2014 Prescription claims numbers have been revised to reflect claims net of rebates. These two years were reported gross of rebates in 2013 and 2014. Benefit Deductions from Net Position by Type TRS-ACTIVECARE Last Ten Fiscal Years 2015 Type of Claim Medical Claims and Insurance Premiums Prescription drugs TOTAL 2014 2013 2012 $ 1,479,302,696 $ 1,397,249,236 $ 1,613,167,792 $ 1,450,574,875 264,145,729 279,499,612 272,807,678 268,328,770 $ 1,743,448,425 $ 1,676,748,848 $ 1,885,975,470 $ 1,718,903,645 Statistical Section 166 . FINANCIAL TRENDS INFORMATION 2011 2010 2009 2008 2007 2006 $ 6,241,946,655 $ 5,841,963,927 $ 5,565,925,090 $ 5,649,308,335 * $ 5,064,191,508 $ 4,857,348,525 27,822,115 22,607,290 23,272,668 26,757,772 31,939,855 36,033,028 524,925,790 385,555,126 348,261,100 363,668,944 325,688,244 313,359,714 144,865,109 141,396,837 138,569,650 146,907,654 134,866,736 132,155,505 47,295,194 45,698,147 43,235,232 42,216,290 86,898,720 82,574,358 79,951,723 78,862,569 84,893,007 83,238,898 81,764,240 85,576,098 11,564,275 10,824,948 10,180,012 10,169,530 3,293,923 3,537,843 3,274,400 3,177,348 $ 7,173,504,788 $ 6,617,397,374 $ 6,294,434,115 $ 6,406,644,540 38,928,295 37,880,818 76,116,829 74,115,776 78,322,931 77,537,970 9,386,943 8,581,053 3,443,703 3,121,883 $ 5,762,885,044 $ 5,540,134,272 $ $ $ 3,984,340 $ 330,284,482 334,268,822 $ 2011 $ $ 608,461,321 $ 384,017,059 992,478,380 $ 2011 3,710,941 $ 261,475,648 265,186,589 $ 2010 575,539,788 $ 395,817,017 971,356,805 $ 2010 3,084,718 $ 263,610,358 266,695,076 $ 2009 531,239,020 $ 353,893,845 885,132,865 $ 2009 $ 1,242,673,156 $ 1,092,107,916 $ 934,733,927 $ 267,417,825 221,006,281 187,913,031 $ 1,510,090,981 $ 1,313,114,197 $ 1,122,646,958 $ 2,520,283 275,482,331 278,002,614 $ 2008 498,767,038 334,742,500 833,509,538 2007 $ $ 2008 788,240,087 163,916,252 952,156,339 Statistical Section 167 2,073,365 $ 277,932,219 280,005,584 $ 437,519,746 $ 304,773,401 742,293,147 $ 2007 $ $ 659,478,760 $ 141,670,202 801,148,962 $ 2,322,538 265,487,479 267,810,017 2006 427,553,404 259,532,887 687,086,291 2006 587,513,767 121,458,717 708,972,484 . OPERATING INFORMATION Average Benefit Payments PENSION TRUST FUND Last Ten Fiscal Years Retirement Effective Dates Years Credited Service 16-20 21-25 5-10 11-15 26-30 30+ 9-1-05 to 8-31-06 Average Monthly Benefit * Average Final Average Salary Number of Retirees $ 280 $ 25,456 1,494 $ 582 $ 30,647 1,129 $ 1,097 $ 36,767 1,578 $ 1,635 $ 42,297 2,483 $ 2,342 $ 49,650 3,332 $ 3,315 $ 58,987 2,700 9-1-06 to 8-31-07 Average Monthly Benefit * Average Final Average Salary Number of Retirees $ 310 $ 27,435 1,574 $ 601 $ 31,601 1,183 $ 1,122 $ 37,444 1,554 $ 1,699 $ 44,116 2,625 $ 2,427 $ 51,682 3,289 $ 3,459 $ 61,113 2,834 9-1-07 to 8-31-08 Average Monthly Benefit * Average Final Average Salary Number of Retirees $ 314 $ 27,892 1,532 $ 621 $ 32,391 1,281 $ 1,152 $ 38,421 1,902 $ 1,759 $ 45,582 2,941 $ 2,537 $ 53,616 3,754 $ 3,512 $ 61,848 3,332 9-1-08 to 8-31-09 Average Monthly Benefit * Average Final Average Salary Number of Retirees $ 351 $ 29,747 1,462 $ 658 $ 33,093 1,377 $ 1,219 $ 40,367 1,918 $ 1,773 $ 45,660 2,877 $ 2,613 $ 54,751 3,361 $ 3,633 $ 63,079 3,229 9-1-09 to 8-31-10 Average Monthly Benefit * Average Final Average Salary Number of Retirees $ 363 $ 30,278 1,675 $ 670 $ 34,347 1,604 $ 1,226 $ 40,452 2,236 $ 1,839 $ 47,301 3,517 $ 2,638 $ 55,172 3,825 $ 3,733 $ 64,234 4,187 9-1-10 to 8-31-11 Average Monthly Benefit * Average Final Average Salary Number of Retirees $ 389 $ 32,133 2,092 $ 710 $ 35,566 2,046 $ 1,266 $ 42,127 2,875 $ 1,869 $ 48,185 4,544 $ 2,666 $ 55,189 4,984 $ 3,769 $ 64,945 6,394 9-1-11 to 8-31-12 Average Monthly Benefit * Average Final Average Salary Number of Retirees $ 390 $ 32,190 2,139 $ 726 $ 36,522 2,226 $ 1,305 $ 43,176 2,855 $ 1,922 $ 49,383 4,257 $ 2,781 $ 56,754 4,373 $ 3,857 $ 66,333 5,209 9-1-12 to 8-31-13 Average Monthly Benefit * Average Final Average Salary Number of Retirees $ 389 $ 31,597 2,235 $ 742 $ 37,082 2,383 $ 1,288 $ 43,047 3,068 $ 1,935 $ 49,217 4,388 $ 2,796 $ 56,455 4,676 $ 3,859 $ 65,472 4,952 9-1-13 to 8-31-14 Average Monthly Benefit * Average Final Average Salary Number of Retirees $ 412 $ 32,884 2,293 $ 799 $ 39,265 2,285 $ 1,325 $ 43,889 3,084 $ 1,962 $ 49,224 4,254 $ 2,844 $ 56,835 4,429 $ 3,868 $ 65,447 4,197 9-1-14 to 8-31-15 Average Monthly Benefit * Average Final Average Salary Number of Retirees $ 418 $ 33,259 1,987 $ 821 $ 39,904 1,966 $ 1,340 $ 44,343 2,717 $ 1,991 $ 49,127 3,654 $ 2,827 $ 56,370 3,899 $ 3,930 $ 65,835 3,885 * Average monthly benefits have been reduced for Partial Lump Sum Option payments of $313.4, $325.7, $363.7, $348.3, $385.6, $524.9, $501.2, $410.3, $322.0 and $288.9 million in fiscal years 2006, 2007, 2008, 2009, 2010, 2011, 2012, 2013, 2014 and 2015 respectively. Statistical Section 168 . Average Monthly Benefits Pension Trust Fund The following graph of service retiree accounts as of August 31, 2015 reflects benefit increases and decreases since retirement: Current Average Monthly Benefit by Year of Retirement $2,500 $2,150 $2,168 $2,058 $2,000 $1,868 $1,922 $1,886 $1,845 $1,500 $1,000 $500 $0 1985 Original Benefits Increase(Decrease) Since Retirement Current Benefits Number of Retirees** 1990 1995 2000* 2005* 2010* 2015* $947 $1,234 $1,327 $1,646 $1,839 $2,147 $2,169 975 824 541 240 6 3 $1,922 $2,058 $1,868 $1,886 $1,845 $2,150 $2,168 1,710 3,819 5,718 10,602 10,704 16,512 18,319 (1) * Before adjustment for the Partial Lump Sum Option, average original benefits were $1,781, $2,010, $2,323 and $2,278 for fiscal years 2000, 2005, 2010 and 2015 respectively. ** For each of the retirement years shown, number of service retirees currently receiving benefits. Statistical Section 169 . This page is intentionally left blank. Statistical Section 170 . OPERATING INFORMATION Average Benefit Payments Average Benefit Payments TRS-CARE TRS-ACTIVECARE Last Ten Fiscal Years Last Ten Fiscal Years 2015 2015 Average Benefit Per Participant $ 5,780 Benefit Payments $ 1,455,126,320 Average Participants Average Benefit Per Participant 251,758 $ 3,607 Benefit Payments $ 1,743,448,426 Average Participants 2014 483,299 2014 Average Benefit Per Participant $ 5,059 * Average Benefit Per Participant $ 3,603 Benefit Payments $ 1,231,126,693 * Benefit Payments $ 1,676,748,847 Average Participants 243,336 Average Participants 2013 465,330 2013 Average Benefit Per Participant $ 5,053 * Average Benefit Per Participant $ 3,966 Benefit Payments $ 1,183,698,939 * Benefit Payments $ 1,885,975,470 Average Participants 234,277 2012 475,508 2012 Average Benefit Per Participant $ 5,115 Benefit Payments $ 1,142,131,410 Average Participants 223,287 2011 Average Benefit Per Participant $ 3,868 Benefit Payments $ 1,718,903,645 Average Participants 444,382 2011 Average Benefit Per Participant $ 4,718 Benefit Payments Average Participants $ 992,478,380 210,353 Average Benefit Per Participant $ 4,790 Benefit Payments $ 971,356,805 2010 Average Benefit Per Participant $ 3,662 Benefit Payments Average Participants $ 1,510,090,981 412,385 2010 Average Participants 202,778 2009 Average Benefit Per Participant $ 3,509 Benefit Payments $ 1,313,114,197 Average Participants 374,201 2009 Average Benefit Per Participant $ 4,464 Benefit Payments $ 885,132,865 Average Participants 198,282 2008 Average Benefit Per Participant $ 3,324 Benefit Payments $ 1,122,646,958 Average Participants 337,781 2008 Average Benefit Per Participant $ 4,302 Benefit Payments $ 833,509,538 Average Participants 193,733 2007 Average Benefit Per Participant $ 3,060 Benefit Payments $ 952,156,339 Average Participants 311,200 2007 Average Benefit Per Participant $ 3,891 Benefit Payments $ 742,293,147 Average Participants 190,748 2006 Average Benefit Per Participant $ 2,835 Benefit Payments $ 801,148,962 Average Participants 282,639 2006 Average Benefit Per Participant $ 3,659 Benefit Payments $ 687,086,291 Average Participants Average Participants 187,804 Average Benefit Per Participant $ 2,745 Benefit Payments $ 708,972,484 Average Participants *Note: For TRS-CARE, 2013 and 2014 Average Benefit Per Participant and Benefit Payments numbers have been revised to reflect prescription drug claims net of rebates. These two years were reported as gross numbers in previous years. Statistical Section 171 258,301 . OPERATING INFORMATION Retired Members by Type of Benefit PENSION TRUST FUND Fiscal Year 2015 $ $ $ $ $ $ $ $ $ $ $ $ $ $ Amount of Number of Monthly Retired Benefit Members 1-200 14,378 201-400 38,725 401-600 24,676 601-800 22,303 801-1,000 21,441 1,001-1,200 19,050 1,201-1,400 16,200 1,401-1,600 16,782 1,601-1,800 17,110 1,801-2,000 17,904 2,001-3,000 90,098 3,001-4,000 51,778 4,001-5,000 17,965 over 5,000 9,328 Totals 377,738 Type of Retirement* 1 5,603 10,481 11,817 13,096 14,218 13,632 11,601 12,019 12,655 14,102 77,544 47,942 16,836 8,765 270,311 2 6,913 12,185 8,810 5,455 3,815 2,667 2,107 2,419 2,431 2,069 6,342 1,342 301 111 56,967 *Type of Retirement: 1 Normal Retirement of Age and Service 2 Early Retirement 3 Disability Retirement 4 Survivor Payment, Joint Life or Guarantee 3 289 654 1,327 1,312 1,149 859 728 649 559 495 1,284 181 25 4 9,515 4 1,477 2,302 2,182 1,800 1,671 1,430 1,401 1,341 1,155 968 3,989 1,908 684 376 22,684 6 47 1,000 327 394 402 318 245 277 232 222 859 393 114 71 4,901 35 966 213 246 186 144 118 77 78 48 80 12 5 1 2,209 5 Survivor Payment, Death in Service 6 Survivor Payment, After Disability Retirement 7 Survivor Payment, After Service Retirement Health Benefit Payments by Range TRS-CARE Fiscal Year 2015 Benefit Range $ $ $ $ $ $ $ $ $ 5 0 1 - 5,000 5,001 - 10,000 10,001 - 20,000 20,001 - 30,000 30,001 - 40,000 40,001 - 50,000 50,001 - 100,000 over 100,000 Average Participants 17,601 171,060 34,218 16,192 4,220 2,281 1,461 2,900 1,825 Total 251,758 Statistical Section 172 7 14 11,137 11,151 . OPERATING INFORMATION Option Selected** 1 6,320 11,816 11,399 9,948 9,694 8,041 6,344 6,398 6,518 6,666 32,213 18,993 6,782 3,208 144,340 2 5,013 8,351 7,413 6,709 6,238 5,898 5,424 5,785 5,918 6,272 33,211 18,451 6,081 3,478 124,242 3 1,345 2,619 2,973 3,196 3,238 3,157 2,898 2,953 3,060 3,333 16,769 10,162 3,858 2,087 61,648 4 547 1,200 1,150 1,082 1,057 889 690 734 684 647 3,079 1,658 511 215 14,143 5 1,111 2,039 1,741 1,368 1,214 1,065 844 912 930 986 4,826 2,514 733 340 20,623 **Option Selected: Option 1 - Life Annuity Option 2 - Joint to Survivor Option 3 - Joint to Survivor 50% / Joint to Survivor 75% 6 42 12,700 0 0 0 0 0 0 0 0 0 0 0 0 12,742 Option 4 - 5-year Guarantee Option 5 - 10-year Guarantee Option 6 - Survivor Benefit Health Benefit Payments by Range TRS-ACTIVECARE Fiscal Year 2015 Benefit Range $ $ $ $ $ $ $ $ $ 0 1 - 5,000 5,001 - 10,000 10,001 - 20,000 20,001 - 30,000 30,001 - 40,000 40,001 - 50,000 50,001 - 100,000 over 100,000 Average Participants 58,334 369,196 25,974 15,534 4,899 2,590 1,675 3,140 1,957 Total 483,299 Statistical Section 173 . OPERATING INFORMATION Principal Participating Employers PENSION TRUST FUND Current Fiscal Year and Nine Years Ago 2015 Participating Reporting Entity 2006 Percentage of Total Covered Covered Employees Rank Employment Houston ISD Dallas ISD UT MD Anderson Cancer Center Cypress Fairbanks ISD Northside ISD Austin ISD Fort Worth ISD UT SW Medical Center-Dallas UT At Austin El Paso ISD UT Medical Branch at Galveston All Other 23,811 19,856 18,347 14,272 13,594 12,270 11,354 10,496 9,946 9,689 704,450 Total 848,085 1 2 3 4 5 6 7 8 9 10 2.81 % 2.34 2.16 1.68 1.60 1.45 1.34 1.24 1.17 1.14 Percentage of Total Covered Covered Employees Rank Employment 24,006 19,035 13,811 11,033 10,332 11,125 9,954 1 2 3 5 6 4 8 9 10 7 83.07 9,303 8,776 10,110 602,692 100.00 % 730,177 3.29 % 2.61 1.89 1.51 1.42 1.52 1.36 1.27 1.20 1.39 82.54 100.00 % Source: May report month information submitted to the Teacher Retirement System by participating reporting entities. Statistical Section 174 . OPERATING INFORMATION Principal Participating Employers TRS-CARE Current Fiscal Year and Nine Years Ago 2015 Participating Reporting Entity Houston ISD Dallas ISD Cypress Fairbanks ISD Northside ISD Austin ISD Fort Worth ISD Aldine ISD North East ISD Katy ISD Fort Bend ISD El Paso ISD San Antonio ISD All Other Total 2006 Percentage of Covered Total Covered OPEB OPEB Employees Rank Employment Percentage of Covered Total Covered OPEB OPEB Employees Rank Employment 23,811 19,856 14,272 13,594 12,270 11,354 9,264 9,248 9,166 8,589 1 2 3 4 5 6 7 8 9 10 3.41 % 2.84 2.04 1.95 1.76 1.62 1.33 1.32 1.31 1.23 24,006 19,035 11,033 10,332 11,125 9,954 8,014 7,939 1 2 4 5 3 6 8 10 7 9 567,323 81.19 % 8,776 7,968 492,224 698,747 100.00 % 610,406 3.93 % 3.12 1.81 1.69 1.82 1.63 1.31 1.30 1.44 1.31 80.64 100.00 % Source: May report month information submitted to the Teacher Retirement System by participating reporting entities. Statistical Section 175 . List of Participating Employers PUBLIC SCHOOLS Abbott ISD Abernathy ISD Abilene ISD Academy ISD Adrian ISD Agua Dulce ISD Alamo Heights ISD Alba Golden ISD Albany ISD Aldine ISD Aledo ISD Alice ISD Alief ISD Allen ISD Alpine ISD Alto ISD Alvarado ISD Alvin ISD Alvord ISD Amarillo ISD Amherst ISD Anahuac ISD Anderson-Shiro Cons ISD Andrews ISD Angleton ISD Anna ISD Anson ISD Anthony ISD Anton ISD Apple Springs ISD Aquilla ISD Aransas County ISD Aransas Pass ISD Archer City ISD Argyle ISD Arlington ISD Arp ISD Aspermont ISD Athens ISD Atlanta ISD Aubrey ISD Austin ISD Austwell Tivoli ISD Avalon ISD Avery ISD Avinger ISD Axtell ISD Azle ISD Baird ISD Ballinger ISD Balmorhea ISD Bandera ISD Bangs ISD Banquete ISD Barbers Hill ISD Bartlett ISD Bastrop ISD Bay City ISD Beaumont ISD Beckville ISD Beeville ISD Bellevue ISD Bells ISD Bellville ISD Belton ISD Ben Bolt Palito ISD Benavides ISD Benjamin ISD Big Sandy ISD - Big Sandy Big Sandy ISD - Dallardsville Big Spring ISD Birdville ISD Bishop Cons ISD Blackwell ISD Blanco ISD Bland ISD Blanket ISD Bloomburg ISD Blooming Grove ISD Bloomington ISD Blue Ridge ISD Bluff Dale ISD Blum ISD Boerne ISD Statistical Section 176 Boles ISD Boling ISD Bonham ISD Booker ISD Borden County ISD Borger ISD Bosqueville ISD Bovina ISD Bowie ISD Boyd ISD Boys Ranch ISD Brackett ISD Brady ISD Brazos ISD Brazosport ISD Breckenridge ISD Bremond ISD Brenham ISD Bridge City ISD Bridgeport ISD Broaddus ISD Brock ISD Bronte ISD Brookeland ISD Brookesmith ISD Brooks County ISD Brownfield ISD Brownsboro ISD Brownsville ISD Brownwood ISD Bruceville-Eddy ISD Bryan ISD Bryson ISD Buckholts ISD Buena Vista ISD Buffalo ISD Bullard ISD Buna ISD Burkburnett ISD Burkeville ISD Burleson ISD Burnet Cons ISD Burton ISD . List of Participating Employers (Continued) Bushland ISD Bynum Cons ISD Caddo Mills ISD Calallen ISD Caldwell ISD Calhoun County ISD Callisburg ISD Calvert ISD Cameron ISD Campbell ISD Canadian ISD Canton ISD Canutillo ISD Canyon ISD Carlisle ISD Carrizo Springs Cons ISD Carroll ISD Carrollton-Farmers Branch ISD Carthage ISD Castleberry ISD Cayuga ISD Cedar Hill ISD Celeste ISD Celina ISD Center ISD Center Point ISD Centerville ISD - Centerville Centerville ISD - Groveton Central Heights ISD Central ISD Channelview ISD Channing ISD Chapel Hill ISD - Mt. Pleasant Chapel Hill ISD - Tyler Charlotte ISD Cherokee ISD Chester ISD Chico ISD Childress ISD Chillicothe ISD Chilton ISD China Spring ISD Chireno ISD Chisum ISD Christoval ISD Cisco ISD City View ISD Clarendon Cons ISD Clarksville ISD Claude ISD Clear Creek ISD Cleburne ISD Cleveland ISD Clifton ISD Clint ISD Clyde ISD Coahoma ISD Coldspring Oakhurst ISD Coleman ISD College Station ISD Collinsville ISD Colmesneil ISD Colorado ISD Columbia Brazoria ISD Columbus ISD Comal ISD Comanche ISD Comfort ISD Commerce ISD Community ISD Como-Pickton Cons ISD Comstock ISD Connally Cons ISD Conroe ISD Coolidge ISD Cooper ISD Coppell ISD Copperas Cove ISD Corpus Christi ISD Corrigan-Camden ISD Corsicana ISD Cotton Center ISD Cotulla ISD Coupland ISD Covington ISD Crandall ISD Statistical Section 177 Crane ISD Cranfills Gap ISD Crawford ISD Crockett County Cons CSD Crockett ISD Crosby ISD Crosbyton Cons ISD Cross Plains ISD Cross Roads ISD Crowell Cons ISD Crowley ISD Crystal City ISD Cuero ISD Culberson Cty - Allamoore ISD Cumby ISD Cushing ISD Cypress-Fairbanks ISD D'Hanis ISD Daingerfield-Lone Star ISD Dalhart ISD Dallas ISD Damon ISD Danbury ISD Darrouzett ISD Dawson ISD - Dawson Dawson ISD - Welch Dayton ISD DeKalb ISD DeLeon ISD DeSota ISD Decatur ISD Deer Park ISD Del Valle ISD Dell City ISD Denison ISD Denton ISD Denver City ISD Detroit ISD Devers ISD Devine ISD Dew ISD Deweyville ISD Diboll ISD . List of Participating Employers (Continued) Dickinson ISD Dilley ISD Dime Box ISD Dimmitt ISD Divide ISD Dodd City ISD Donna ISD Doss Cons ISD Douglass ISD Dripping Springs ISD Driscoll ISD Dublin ISD Dumas ISD Duncanville ISD Eagle Mount Saginaw ISD Eagle Pass ISD Eanes ISD Early ISD East Bernard ISD East Central ISD East Chambers ISD Eastland ISD Ector ISD Ector County ISD Edcouch-Elsa ISD Eden Cons ISD Edgewood ISD - Edgewood Edgewood ISD - San Antonio Edinburg Cons ISD Edna ISD El Campo ISD El Paso ISD Electra ISD Elgin ISD Elkhart ISD Elysian Fields ISD Ennis ISD Era ISD Etoile ISD Eula ISD Eustace ISD Evadale ISD Evant ISD Everman ISD Excelsior ISD Ezzell ISD Fabens ISD Fairfield ISD Falls City ISD Fannindel ISD Farmersville ISD Farwell ISD Fayetteville ISD Ferris ISD Flatonia ISD Florence ISD Floresville ISD Flour Bluff ISD Floydada ISD Follett ISD Forestburg ISD Forney ISD Forsan ISD Fort Bend ISD Fort Davis ISD Fort Elliott Cons ISD Fort Hancock ISD Fort Sam Houston ISD Fort Stockton ISD Fort Worth ISD Franklin ISD Frankston ISD Fredericksburg ISD Freer ISD Frenship ISD Friendswood ISD Friona ISD Frisco ISD Frost ISD Fruitvale ISD Gainesville ISD Galena Park ISD Galveston ISD Ganado ISD Garland ISD Garner ISD Statistical Section 178 Garrison ISD Gary ISD Gatesville ISD Gause ISD George West ISD Georgetown ISD Gholson ISD Giddings ISD Gilmer ISD Gladewater County Line ISD Glasscock County ISD Glen Rose ISD Godley ISD Goldburg ISD Goldthwaite Cons ISD Goliad ISD Gonzales ISD Goodrich ISD Goose Creek Cons ISD Gordon ISD Gorman ISD Grady ISD Graford ISD Graham ISD Granbury ISD Grand Prairie ISD Grand Saline ISD Grandfalls Royalty ISD Grandview Hopkins ISD Grandview ISD Granger ISD Grape Creek ISD Grapeland ISD Grapevine-Colleyville ISD Greenville ISD Greenwood ISD Gregory-Portland ISD Groesbeck ISD Groom ISD Groveton ISD Gruver ISD Gunter ISD Gustine ISD . List of Participating Employers (Continued) Guthrie CSD Hale Center ISD Hallettsville ISD Hallsburg ISD Hallsville ISD Hamilton ISD Hamlin ISD Hamshire-Fannett ISD Happy ISD Hardin ISD Hardin-Jefferson ISD Harlandale ISD Harleton ISD Harlingen Cons ISD Harmony ISD Harper ISD Harrold ISD Hart ISD Hartley ISD Harts Bluff ISD Haskell Cons ISD Hawkins ISD Hawley ISD Hays Cons ISD Hearne ISD Hedley ISD Hemphill ISD Hempstead ISD Henderson ISD Henrietta ISD Hereferd ISD Hermleigh ISD Hico ISD Hidalgo ISD Higgins ISD High Island ISD Highland ISD Highland Park ISD - Amarillo Highland Park ISD - Dallas Hillsboro ISD Hitchcock ISD Holland ISD Holliday ISD Hondo ISD Honey Grove ISD Hooks ISD Houston ISD Howe ISD Hubbard ISD - Hubbard Hubbard ISD - DeKalb Huckabay ISD Hudson ISD Huffman ISD Hughes Springs ISD Hull-Daisetta ISD Humble ISD Hunt ISD Huntington ISD Huntsville ISD Hurst-Euless-Bedford ISD Hutto ISD Idalou ISD Industrial ISD Ingleside ISD Ingram ISD Iola ISD Iowa Park Cons ISD Ira ISD Iraan-Sheffield ISD Iredell ISD Irion County ISD Irving ISD Italy ISD Itasca ISD Jacksboro ISD Jacksonville ISD Jarrell ISD Jasper ISD Jayton-Girard ISD Jefferson ISD Jim Hogg County ISD Jim Ned Cons ISD Joaquin ISD Johnson City ISD Jonesboro ISD Joshua ISD Statistical Section 179 Jourdanton ISD Judson ISD Junction ISD Karnack ISD Karnes City ISD Katy ISD Kaufman ISD Keene ISD Keller ISD Kelton ISD Kemp ISD Kenedy County-Wide CSD Kenedy ISD Kennard ISD Kennedale ISD Kerens ISD Kermit ISD Kerrville ISD Kilgore ISD Killeen ISD Kingsville ISD Kirbyville Cons ISD Klein ISD Klondike ISD Knippa ISD Knox City-O'Brien Cons ISD Kopperl ISD Kountze ISD Kress ISD Krum ISD La Feria ISD La Gloria ISD La Grange ISD La Joya ISD La Marque ISD La Porte ISD La Poynor ISD La Pryor ISD La Vega ISD La Vernia ISD La Villa ISD Lackland ISD Lago Vista ISD . List of Participating Employers (Continued) Lake Dallas ISD Lake Travis ISD Lake Worth ISD Lamar Cons ISD Lamesa ISD Lampasas ISD Lancaster ISD Laneville ISD Laredo ISD Lasara ISD Latexo ISD Lazbuddie ISD Leakey ISD Leander ISD Leary ISD Lefors ISD Leggett ISD Leon ISD Leonard ISD Levelland ISD Leverett's Chapel ISD Lewisville ISD Lexington ISD Liberty-Eylau ISD Liberty Hill ISD Liberty ISD Lindale ISD Linden-Kildare Cons ISD Lindsay ISD Lingleville ISD Lipan ISD Little Cypress-Mauriceville Cons ISD Little Elm ISD Littlefield ISD Livingston ISD Llano ISD Lockhart ISD Lockney ISD Lohn ISD Lometa ISD London ISD Lone Oak ISD Longview ISD Loop ISD Loraine ISD Lorena ISD Lorenzo Cons ISD Los Fresnos Cons ISD Louise ISD Lovejoy ISD Lovelady ISD Lubbock-Cooper ISD Lubbock ISD Lueders-Avoca ISD Lufkin ISD Luling ISD Lumberton ISD Lyford Cons ISD Lytle ISD Mabank ISD Madisonville Cons ISD Magnolia ISD Malakoff ISD Malone ISD Malta ISD Manor ISD Mansfield ISD Marathon ISD Marble Falls ISD Marfa ISD Marion ISD Marlin ISD Marshall ISD Mart ISD Martin's Mill ISD Martinsville ISD Mason ISD Matagorda ISD Mathis ISD Maud ISD May ISD Maypearl ISD Mcallen ISD Mccamey ISD Mcdade ISD Mcgregor ISD Statistical Section 180 Mckinney ISD Mclean ISD Mcleod ISD Mcmullen County ISD Meadow ISD Medina ISD Medina Valley ISD Melissa ISD Memphis ISD Menard ISD Mercedes ISD Meridian ISD Merkel ISD Mesquite ISD Mexia ISD Meyersville ISD Miami ISD Midland ISD Midlothian ISD Midway ISD - Henrietta Midway ISD - Waco Milano ISD Mildred ISD Miles ISD Milford ISD Miller Grove ISD Millsap ISD Mineola ISD Mineral Wells ISD Mission Cons ISD Monahans-Wickett-Pyote ISD Montaque ISD Monte Alto ISD Montgomery ISD Moody ISD Moran ISD Morgan ISD Morgan Mill ISD Morton ISD Motley County ISD Moulton ISD Mount Calm ISD Mount Enterprise ISD . List of Participating Employers (Continued) Mount Pleasant ISD Mount Vernon ISD Muenster ISD Muleshoe ISD Mullin ISD Mumford ISD Munday Cons ISD Murchison ISD Nacogdoches ISD Natalia ISD Navarro ISD Navasota ISD Nazareth ISD Neches ISD Nederland ISD Needville ISD New Boston ISD New Braunfels ISD New Caney ISD New Deal ISD New Diana ISD New Home ISD New Summerfield ISD New Waverly ISD Newcastle ISD Newton ISD Nixon-Smiley Cons ISD Nocona ISD Nordheim ISD Normangee ISD North East ISD North Hopkins ISD North Lamar ISD North Zulch ISD Northside ISD - San Antonio Northside ISD - Vernon Northwest ISD Nueces Canyon Cons ISD Nursery ISD O'Donnell ISD Oakwood ISD Odem-Edroy ISD Oglesby ISD Olfen ISD Olney ISD Olton ISD Onalaska ISD Orange Grove ISD Orangefield ISD Ore City ISD Overton ISD Paducah ISD Paint Creek ISD Paint Rock ISD Palacios ISD Palestine ISD Palmer ISD Palo Pinto ISD Pampa ISD Panhandle ISD Panther Creek Cons ISD Paradise ISD Paris ISD Pasadena ISD Patton Springs ISD Pawnee ISD Pearland ISD Pearsall ISD Peaster ISD Pecos-Barstow-Toyah ISD Penelope ISD Perrin-Whitt Cons ISD Perryton ISD Petersburg ISD Petrolia ISD Pettus ISD Pewitt Cons ISD Pflugerville ISD Pharr-San Juan-Alamo ISD Pilot Point ISD Pine Tree ISD Pittsburg ISD Plains ISD Plainview ISD Plano ISD Pleasant Grove ISD Statistical Section 181 Pleasanton ISD Plemons-Stinnett-Phillips Cons ISD Point Isabel ISD Ponder ISD Poolville ISD Port Aransas ISD Port Arthur ISD Port Neches-Groves ISD Post ISD Poteet ISD Poth Cons ISD Pottsboro ISD Prairie Lea ISD Prairie Valley ISD Prairiland ISD Premont ISD Presidio ISD Priddy ISD Princeton ISD Pringle-Morse Cons ISD Progreso ISD Prosper ISD Quanah ISD Queen City ISD Quinlan ISD Quitman ISD Rains ISD Ralls ISD Ramirez Common SD Randolph Field ISD Ranger ISD Rankin ISD Raymondville ISD Reagan County ISD Red Lick ISD Red Oak ISD Redwater ISD Refugio ISD Ricardo ISD Rice Cons ISD Rice ISD Richards ISD Richardson ISD . List of Participating Employers (Continued) Richland Springs ISD Riesel ISD Rio Grand City Cons ISD Rio Hondo ISD Rio Vista ISD Rising Star ISD River Road ISD Rivercrest ISD Riviera ISD Robert Lee ISD Robinson ISD Robstown ISD Roby Cons ISD Rochelle ISD Rockdale ISD Rocksprings ISD Rockwall ISD Rogers ISD Roma ISD Roosevelt ISD Ropes ISD Roscoe ISD Rosebud-Lott ISD Rotan ISD Round Rock ISD Round Top-Carmine ISD Roxton ISD Royal ISD Royse City ISD Rule ISD Runge ISD Rusk ISD S&S Cons ISD Sabinal ISD Sabine ISD Sabine Pass ISD Saint Jo ISD Salado ISD Saltillo ISD Sam Rayburn Cons ISD San Angelo ISD San Antonio ISD San Augustine ISD San Benito Cons ISD San Diego ISD San Elizario ISD San Felipe Del Rio Cons ISD San Isidro ISD San Marcos Cons ISD San Perlita ISD San Saba ISD San Vicente ISD Sands Cons ISD Sanford-Fritch ISD Sanger ISD Santa Anna ISD Santa Fe ISD Santa Gertrudis ISD Santa Maria ISD Santa Rosa ISD Santo ISD Savoy ISD Schertz-Cibolo-Univ City ISD Schleicher County ISD Schulenberg ISD Scurry-Rosser ISD Seagraves ISD Sealy ISD Seguin ISD Seminole Public Schools Seymour ISD Shallowater ISD Shamrock ISD Sharyland ISD Shelbyville ISD Sheldon ISD Shepherd ISD Sherman ISD Shiner ISD Sidney ISD Sierra Blanca ISD Silsbee ISD Silverton ISD Simms ISD Sinton ISD Sivells Bend ISD Statistical Section 182 Skidmore-Tynan ISD Slaton ISD Slidell ISD Slocum ISD Smithville ISD Smyer ISD Snook ISD Snyder ISD Socorro ISD Somerset ISD Somerville ISD Sonora ISD South San Antonio ISD South Texas ISD Southland ISD Southside ISD Southwest ISD Spearman ISD Splendora ISD Spring Branch ISD Spring Creek ISD Spring Hill ISD Spring ISD Springlake-Earth ISD Springtown ISD Spur ISD Spurger ISD Stafford Municipal School Dist Stamford ISD Stanton ISD Stephenville ISD Sterling City ISD Stockdale ISD Stratford ISD Strawn ISD Sudan ISD Sulphur Bluff ISD Sulphur Springs ISD Sundown ISD Sunnyvale ISD Sunray ISD Sweeny ISD Sweet Home ISD . List of Participating Employers (Continued) Sweetwater ISD Taft ISD Tahoka ISD Tarkington ISD Tatum ISD Taylor ISD Teague ISD Temple ISD Tenaha ISD Terlingua CSD Terrell County ISD Terrell ISD Texarkana ISD Texas City ISD Texhoma ISD Texline ISD Thorndale ISD Thrall ISD Three Rivers ISD Three Way ISD Throckmorton ISD Tidehaven ISD Timpson ISD Tioga ISD Tolar ISD Tom Bean ISD Tomball ISD Tornillo ISD Trent ISD Trenton ISD Trinidad ISD Trinity ISD Troup ISD Troy ISD Tulia ISD Tuloso-Midway ISD Turkey-Quitaque ISD Tyler ISD Union Grove ISD Union Hill ISD United ISD Utopia ISD Uvalde Cons ISD Valentine ISD Valley Mills ISD Valley View ISD - Pharr Valley View ISD - Valley View Van Alstyne ISD Van ISD Van Vleck ISD Vega ISD Venus ISD Veribest ISD Vernon Cons ISD Victoria ISD Vidor ISD Vysehrad ISD Waco ISD Waelder ISD Walcott ISD Wall ISD Waller ISD Walnut Bend ISD Walnut Springs ISD Warren ISD Waskom ISD Water Valley ISD Waxahachie ISD Weatherford ISD Webb Cons ISD Weimar ISD Wellington ISD Wellman-Union ISD Wells ISD Weslaco ISD West Hardin County Cons ISD West ISD West Orange-Cove Cons ISD West Oso ISD West Rusk County Cons ISD West Sabine ISD Westbrook ISD Westhoff ISD Westphalia ISD Westwood ISD Wharton ISD Statistical Section 183 Wheeler ISD White Deer ISD White Oak ISD White Settlement ISD Whiteface ISD Whitehouse ISD Whitesboro ISD Whitewright ISD Whitharral ISD Whitney ISD Wichita Falls ISD Wildorado ISD Willis ISD Wills Point ISD Wilson ISD Wimberley ISD Windham School District Windthorst ISD Winfield ISD Wink-Loving Cons ISD Winnsboro ISD Winona ISD Winters ISD Woden ISD Wolfe City ISD Woodsboro ISD Woodson ISD Woodville ISD Wortham ISD Wylie ISD - Abilene Wylie ISD - Wylie Yantis ISD Yoakum ISD Yorktown ISD Ysleta ISD Zapata County ISD Zavalla ISD Zephyr ISD CHARTER SCHOOLS A Plus Academy A W Brown Fellowship Charter School . List of Participating Employers (Continued) Academy of Accelerated Learning Eden Park Academy Academy of Careers & Technologies Education Center Intermediate Acad Academy of Dallas El Paso Academy East Accelerated Intermediate Academy El Paso Leadership Academy Alief Montessori School Eleanor Kolitz Hebrew Academy Alpha Charter School Erath Excels Academy Ambassadors Preparatory Academy Evolution Academy Charter School Amigos Por Vida-Friends For Life Charter Excellence in Leadership Academy S Aristoi Classical Academy Faith Family Academy - Oak Cliff Arlington Classics Academy Faith Family Academy - Waxahachie Arrow Academy Fallbrook College Prep Academy Austin Achieve Public Schools Focus Learning Academy Austin Discovery School Fort Worth Academy of Fine Arts Bay Area Charter School Gateway Academy Beatrice Mayes Institute Gateway Charter Academy Beta Academy George Gervin Academy Bexar County Academy George I Sanchez Charter Big Springs Charter School Girls and Boys Prep Academy Bob Hope School Global Learning Village Brazos River Charter School Golden Rule Charter School Brazos School For Inquiry Great Hearts Academy - San Antonio Bright Ideas Charter School Gulf Coast Trades Center Brooks Acad of Science & Eng Hampton Preparatory Burnham Wood Charter School Harmony School of Excel - Houston Calvin Nelms Charter Harmony School of Science - Houston Carpe Diem Schools Harmony Science Academy - Austin Cedars International Academy Harmony Science Academy El Paso Chaparral Star Academy Harmony Science Academy Houston Chapel Hill Academy Harmony Science Academy San Antonio City Center - Health Careers Harmony Science Academy Waco Cityscape Schools Inc. Henry Ford Academy - San Antonio Compass Academy Higgs Carter King Academy Comquest Academy High Point Academy Core Academy Houston Gateway Charter School Corpus Christi Montessori School Houston Heights High School Crosstimbers Academy Houston Heights Learning Acad Cumberland Academy Idea Public Schools Dallas Community Charter School Ignite Public Schools Dr M L Garza-Gonzalez Charter Inspired Vision Academy Draw Academy International Leadership of Texas Eagle Advantage School Jean Massieu Academy East Fort Worth Montessori School John H Wood Charter School East Texas Charter School Jubilee Academic Center Statistical Section 184 Katherine Anne Porter School Ki Charter Academy KIPP Aspire Academy KIPP Austin College Prep KIPP Inc Charter KIPP Truth Academy La Academia De Estrellas La Amistad Academy La Fe Preparatory School Leadership Prep School Legacy Preparatory Life School Lighthouse Charter School Mainland Prep Academy Manara Academy Meadowland Charter School Medical Center Charter Meridian World School Meyerpark Elementary Charter Midland Academy Charter School Mid-Valley Academy Montessori For All New Frontiers Charter School Newman International Academy North Texas Elem School of Arts Northwest Prep Academy Nova Charter School Nova Charter Southeast Nyos Charter School Odyssey Academy Orenda Charter School Panola Charter School Paso Del Norte Academy Peak Preparatory School Pegasus School of Liberal Arts/Science Phoenix Charter School Pineywoods Academy Por Vida Academy Premier High Schools Premier Learning Academy Prime Prep Academy Promise Community School Radiance Academy of Learning . List of Participating Employers (Continued) Ranch Academy Rapoport Academy Raul Yzaguirre School Richard Milburn - Killeen Rise Academy San Antonio School Inquiry San Antonio Tech Academy School of Excellence in Education School of Science & Tech Discovery School of Science & Technology Seashore Charter Schools Ser-Ninos Charter School Shekinah Radiance Academy South Plains Academy South Texas Educational Tech Inc Southwest High School Southwest Preparatory School St Anthony School St Mary's Charter School Stepping Stones Charter Elementary Summit International Preparatory Tekoa Academy Temple Education Center Texans Can Academies Texas College Preparatory Texas Education Center Texas Empowerment Academy Texas Preparatory School Texas Serenity Academy The Children First Academy - Dallas The East Austin College Prep Acad The Ehrhart School The Excel Center The Excel Center For Adult The North Hills School The Pro-Vision Academy The Rhodes School TLC Academy Transformative Charter Treetops International Trinity Basin Preparatory Trinity Charter School Trinity Environmental Academy Two Dimensions Prep Academy UME Preparatory Academy Universal Academy Vanguard Academy Varnett Charter School Victory Preparatory Academy Village Tech Schools Vista Del Futuro Charter School Waco Charter School Walipp Academy Westlake Academy Williams Preparatory Winfree Academy Charter Schools Yes Prep Public Schools Zoe Learning Academy Lone Star College System McLennan Community College Midland College Navarro College North Central Texas College Northeast Texas Comm College Odessa College Panola College Paris Junior College Ranger Junior College San Jacinto College District South Plains College South Texas College Southwest Texas Junior College Tarrant County College District Temple College COMMUNITY AND JUNIOR COLLEGES Texarkana College Texas Southmost College Alamo Community College District Trinity Valley Junior College Alvin Community College Tyler Junior College Amarillo College Vernon College Angelina College Victoria College Austin Community College Weatherford College Blinn College Western Texas College Brazosport College Wharton County Junior College Central Texas College Cisco Junior College UNIVERSITIES Clarendon College Coastal Bend College Angelo State University College of The Mainland Lamar Institute of Technology Collin County Comm College Lamar State College-Orange Dallas County Comm College Dist Lamar State College-Port Arthur Del Mar College Lamar University-Beaumont El Paso Community College Midwestern State University Frank Phillips College Prairie View A&M University Galveston College Sam Houston State University Grayson County College Stephen F Austin State Univ Hill College Sul Ross State University Houston Comm College System Tarleton State University Howard County Jr College Dist Texas A&M - Agrilife Extension Service Kilgore College Texas A&M - Agrilife Research Laredo Community College Texas A&M - Central Texas Lee College Texas A&M - Commerce Statistical Section 185 . List of Participating Employers (Continued) Texas A&M - Corpus Christi Texas A&M - Eng Exp Station Texas A&M - Eng Ext Service Texas A&M - Galveston Texas A&M - International University Texas A&M - Kingsville Texas A&M - San Antonio Texas A&M - Texarkana Texas A&M - Transportation Inst Texas A&M - University Systems Office Texas A&M - University Texas A&M - Forest Service Texas Southern University Texas State Tech College Texas State University System Texas State University-San Marcos Texas Tech University Texas Woman's University U of N Texas System Admin Univ of TX - Arlington Univ of TX - Austin Univ of TX - Brownsville Univ of TX - Dallas Univ of TX - El Paso Univ of TX - Pan American Univ of TX - Permian Basin Univ of TX - San Antonio Univ of TX - Tyler University of Houston University of North TX UNT at Dallas University of Texas System West Texas A&M University UT Med Br at Galveston UT SW Medical Center MEDICAL SCHOOLS OTHER ENTITIES Texas A&M - University System HSC Texas A&M - Vet Medical Diag Lab U N T HSC at Fort Worth UT Health Ctr at Tyler UT HSC at Houston UT HSC at San Antonio UT Med Anderson Cancer Center Teacher Retirement System REGIONAL SERVICE CENTERS Region 01 Educ Service Center Region 02 Educ Service Center Region 03 Educ Service Center Region 04 Educ Service Center Region 05 Educ Service Center Region 06 Educ Service Center Region 07 Educ Service Center Region 08 Educ Service Center Region 09 Educ Service Center Region 10 Educ Service Center Region 11 Educ Service Center Region 12 Educ Service Center Region 13 Educ Service Center Region 14 Educ Service Center Region 15 Educ Service Center Region 16 Educ Service Center Region 17 Educ Service Center Region 18 Educ Service Center Region 19 Educ Service Center Region 20 Educ Service Center OTHER EDUCATIONAL DISTRICTS Anderson City Spc Ed Co Op Bowie County Sch Dist Dallas County School Dist Harris City Dept Education Parker County Co-Op Statistical Section 186 . BENEFITS SECTION . Changes in the Law STATE: The Legislature met in fiscal year 2015. Several noteworthy state law developments affecting TRS occurred during the fiscal year. FEDERAL: On the federal level, several reportable developments occurred. State Legislation related to participation in DROP - The 84th Legislature in HB 1937 opened a window from Sept. 1, 2015 to Dec. 31, 2015 for members participating in the Deferred Retirement Option Plan (DROP) to revoke participation in the plan.
The member must not have retired on or before Dec. 31, 2015 and must revoke participation on a form prescribed and received by TRS no later than Dec. 31, 2015.
A beneficiary of a member who dies after Sept. 1, 2015 but before retiring may also revoke the member’s participation in DROP provided the beneficiary is eligible to receive both the distributions from DROP and the distributions from the pension plan. Legislation related to Annuity Payment Date - HB 2168 moved the annuity payment date from the first working day of the month following the month for which the annuity accrues to the last working day of the month the annuity accrues. The bill takes effect Sept. 1, 2015 and will result in both the August 2015 and September 2015 annuities being paid in September. Legislation related to TRS Pension Administration - HB 2974 authorized TRS to establish the 12-month period for determining a member’s annual compensation.
It also amended membership eligibility by requiring that eligibility be established through employment with a single employer. For members with fewer than five years of service credit, membership will no longer terminate due to failure to earn service credit for five years if the member remains employed with a TRS-covered employer but is not eligible for membership because the employment is less than one-half time. This change in the law will prevent these members’ accounts from escheating during a time when they are ineligible to withdraw their funds due to plan qualification requirements.
The legislation also clarified that a member could not purchase more than five years of out-of-state service credit if the service credit is considered non-qualified under the Internal Revenue Code. The board of trustees was also given authority to establish a single health benefit surcharge amount that employers of retirees who retired after Sept. 1, 2005 must pay when the retiree exceeds the limits on onehalf time employment in a calendar month. Legislation related to Meetings of the TRS Board of Trustees - HB 2974 clarified that Chapter 551 of the Government Code regarding open meetings of a governmental body does not apply to an assembly of the TRS board or a committee of the board while attending a summit, conference, convention, workshop, or other event held for educational purposes if the assembly or committee does not deliberate, vote, or take action on a specific matter of public business or public policy over which the board or committee has supervision or control.
The law does not apply to regular, special, or emergency meetings of the board scheduled or called under the board’s bylaws. Federal INVESTMENTS Rulemaking under the Dodd – Frank Wall Street Reform and Consumer Protection Act (2010) (Dodd – Frank) During this fiscal year, TRS continued to monitor proposed rules and interpretive guidance issued by the Commodities Futures Trading Commission (CFTC) under Dodd – Frank. Among other things, the CFTC reproposed rules to govern the posting of margin for uncleared swap trades. TRS will assess the final rules—once they are issued—and implement changes to its trading documentation and processes, as necessary, to ensure compliance. Benefits Section 188 .
Changes in the Law BENEFITS Health Care Federal Patient Protection and Affordable Care Act of 2010 (PPACA) - During this fiscal year, TRS continued to monitor the regulations issued with regard to the PPACA and implemented various provisions of the PPACA that impact the health benefit plans administered by TRS. TRS also began to take steps which will allow school districts, charter schools, and other entities participating in TRS-ActiveCare to designate TRS, acting in its capacity as trustee of TRS-ActiveCare, to fulfill the reporting requirements under Internal Revenue Code Section 6055. Section 6055 addresses the reporting of health care coverage selected by active employees and COBRA qualified beneficiaries (and their dependents) who are enrolled in one of the PPO plans offered under TRS-ActiveCare, for the months of enrollment during the 2015 calendar year. Same-Sex Marriages - In June 2015, the U.S. Supreme Court ruled in Obergefell v.
Hodges that under the Due Process and Equal Protection Clauses of the Fourteenth Amendment of the U.S. Constitution, (i) same-sex couples have a fundamental right to marry in all states and (ii) all states must recognize a lawful same-sex marriage performed in another state. Consequently, controlling law now provides that a same-sex person who is married to a “retiree” or an “employee” (as defined, respectively, in Chapters 1575 and 1579, Insurance Code) are entitled to enroll in either TRS-Care or TRSActiveCare as an eligible dependent. TRS will continue to monitor developments and will determine whether any additional administrative changes are necessary with regard to TRS-Care and TRS-ActiveCare in order to comply with this ruling. PENSION Tax Laws, Regulations, and Guidance IRS Determination Letter Program - In July 2015, the IRS issued Announcement 2015-19 indicating that effective Jan.
1, 2017, the IRS is eliminating the existing staggered five-year determination letter application filing cycles for individually designed qualified plans. Effective Jan. 1, 2017, determination letter applications for individually designed plans will be limited to initial plan qualification and upon plan termination.
Qualified plans that are in Cycle E can continue to file their determination letter applications through Jan. 31, 2016 (the end of the current Cycle E period), and qualified plans that are in Cycle A can file during the last Cycle A period that begins Feb. 1, 2016 and ends on Jan.
1, 2017. Off-cycle filings are eliminated effective July 21, 2015 and through Dec. 31, 2016, except for determination letters for new plans and terminating plans.
The IRS also indicated that individually designed plans will be permitted to submit determination letter applications in certain other limited circumstances as determined in the future by the IRS and U.S. Treasury Department. TRS will continue to monitor developments. Advance Notice of Proposed Rulemaking Regarding the Determination of Governmental Plan Status - In November 2011, the IRS issued advance notice of proposed rulemaking indicating that the IRS and the U.S.
Treasury Department intend to issue regulations to define the term “governmental plan” under Section 414(d) of the Internal Revenue Code. The preliminary guidance defines a “governmental plan” as “a plan established and maintained for its employees by the Government of the United States, by the government of any state or political subdivision thereof, or by any agency or instrumentality of the foregoing.” The IRS received over 2,000 comments from the public charter school community regarding the draft proposed regulations contained in the preliminary guidance. In February 2015, the IRS issued Notice 2015-07 indicating that the IRS anticipates issuing proposed regulations that provide that a state or local retirement system that covers public charter school employees will not fail to be a governmental plan under Section 414(d) if certain requirements are satisfied.
The IRS and the U.S. Treasury Department anticipate that the final regulations under Section 414(d) will apply prospectively and will include a delayed effective date. In addition, the IRS and the U.S.
Treasury Department anticipate that the final regulations will contain certain transition relief. The IRS and the U.S. Treasury Department will also continue to review other comments received in response to the 2011 advance notice of proposed rulemaking.
TRS will continue to monitor developments. Benefits Section 189 . Changes in the Law Eligible Rollover Distributions - In September 2014, the IRS issued Notice 2014-54 and proposed regulations providing that eligible rollover distributions of pre-tax and post-tax amounts from a qualified plan that are scheduled to be made to a recipient at the same time will be treated as a single distribution, regardless of whether the payments are made to a single destination or multiple destinations. In addition, the IRS provided rules for the pre-tax and post-tax amounts of the distribution to be allocated on a tax-favored basis. The allocation rules generally apply to distributions made on or after Jan. 1, 2015.
However, the IRS indicated the proposed regulations may be applied to distributions made on or after Sept. 18, 2014 but before Jan. 1, 2015, by applying a reasonable interpretation of the rules under the notice to allocate pre-tax and post-tax amounts among disbursements made to multiple destinations.
The IRS also indicated that it intended to revise the Section 402(f) safe harbor explanations in its 2009 model rollover notice to reflect the new guidance, which it subsequently did in December 2014 with Notice 2014-74. Normal Retirement Age Regulations - In April 2012, the IRS issued Notice 2012-29 indicating that the IRS and the U.S. Treasury Department intend to issue guidance regarding the applicability to governmental plans of final regulations issued in May 2007 concerning pension distributions upon attainment of “normal retirement age” (NRA). The guidance is expected to extend the date by which governmental plans must comply with the final regulations. The IRS and the U.S. Treasury Department intend to clarify that a governmental plan that does not allow “in-service” distributions before age 62 is not required to define NRA in accordance with the final regulations.
The IRS and the U.S. Treasury Department also intend to provide that the rule that deems age 50 or later to be NRA for qualified public safety employees will apply regardless of whether those employees are covered by a separate plan. TRS will continue to monitor developments with respect to these anticipated changes in federal regulations. Other Developments Same-Sex Marriages Obergefell v.
Hodges - As noted above, in June 2015, the U.S. Supreme Court handed down the Obergefell v. Hodges ruling.
Consequently, controlling law now provides that a same-sex person who is married to a TRS member or retiree is eligible under the pension plan for benefits available to a spouse. TRS immediately complied with the law and will continue to monitor developments to determine whether any further plan administration changes are advisable or necessary in order to comply with this ruling. De Leon v. Perry - In February 2014, the U.S.
District Court for the Western District of Texas ruled that the prohibition against same-sex marriage under Article I, Section 32 of the Texas Constitution violated the Equal Protection Clause and the Due Process Clause of the Fourteenth Amendment to the U.S. Constitution. The case was appealed to the U.S. Court of Appeals for the Fifth Circuit.
In response to the U.S. Supreme Court’s decision in Obergefell v. Hodges, the U.S.
Court of Appeals for the Fifth Circuit affirmed the U.S. District Court’s preliminary injunction in De Leon v. Perry prohibiting enforcement of the laws prohibiting same-sex marriage or recognition of same-sex marriages performed outside of the State of Texas, and remanded the case to the U.S.
District Court for entry of judgment in favor of the plaintiffs. On July 7, 2015, the U.S. District Court upheld its previous decision and permanently enjoined the enforcement of the laws of the State of Texas which prohibit same-sex marriage.
TRS implemented the ruling in conjunction with the Obergefell v. Hodges opinion and will continue to monitor developments to determine if any further plan administration changes are advisable or necessary in order to comply with this ruling. Benefits Section 190 . Summary of Benefits The Teacher Retirement System of Texas (TRS) administers a defined benefit retirement plan that is a qualified pension trust under Section 401(a) of the Internal Revenue Code. The pension trust fund provides service retirement; disability retirement; death benefits; and survivor benefits for eligible employees, including their beneficiaries, of public and higher education in Texas. The TRS Benefits Handbook, a general information booklet, is available to TRS members and annuitants. Retirement benefits are financed by member, state, and employer contributions, along with earnings from pension trust fund investments. TRS administers TRS-ActiveCare, the statewide health benefits program for eligible public education employees of participating entities and their eligible dependents.
The program is mainly financed by plan participant premium payments. In addition to TRS-ActiveCare, TRS administers TRS-Care, a separate statewide health benefits program for eligible retired public education employees and their eligible dependents. This program is financed by contributions from the state, active public school employees, reporting entities (employers), premium payments from plan participants, subsidy revenue from the Medicare Part D program. TRS also administers an optional long-term care insurance program for eligible retirees, eligible public school employees, and eligible family members.
The plan is available on an enrollee-pay-all-basis. Retirement Plan Benefits This summary of benefits is based on statutory provisions of the plan effective for FY 2015. The major retirement plan benefits are: SERVICE RETIREMENT Normal Retirement Eligibility For members whose membership began prior to Sept. 1, 2007, who had at least five years of service credit as of Aug. 31, 2014, and who maintained membership until retirement: • • Age 65 with at least five years of credited service, or The sum of member’s age and years of credited service equals or exceeds 80 with at least five years of credited service. For members whose membership began on or after Sept.
1, 2007 but prior to Sept. 1, 2014, who had at least five years of service credit as of Aug. 31, 2014, and who maintained membership until retirement: • • Age 65 with at least five years of credited service, or Age 60 and the sum of member’s age and years of credited service equals or exceeds 80 with at least five years of credited service. For members who did not have at least five years of service credit as of Aug.
31, 2014, who established TRS membership on or after Sept. 1, 2014, or who had at least five years of service credit as of Aug. 31, 2014 but terminated membership in TRS by withdrawal of accumulated contributions and later resumed TRS membership: • • Age 65 with at least five years of credited service, or Age 62 and the sum of member’s age and years of credited service equals or exceeds 80 with at least five years of credited service. Standard Annuity - A monthly benefit payable at retirement throughout the retiree’s lifetime and calculated according to the statutory benefit formula. Benefit Formula - 2.3 percent (multiplier) times the average of the five highest annual creditable salaries times years of credited service equals an annual standard annuity.
For members who are grandfathered, the three highest annual salaries are used. Benefits Section 191 . Summary of Benefits Minimum Benefit - $150 per month less any reduction for early age or optional annuity selection. Early Retirement Eligibility For members whose membership began prior to Sept. 1, 2007, who had at least five years of service credit as of Aug. 31, 2014, and who maintained membership until retirement: • • At least 55 with five or more years of service credit, but the sum of the member’s age and years of service credit total less than 80, or 30 or more years of service credit, but the sum of the member’s age and years of service credit total less than 80. For members whose membership began on or after Sept. 1, 2007 but prior to Sept.
1, 2014, who had at least five years of service credit as of Aug. 31, 2014, and who maintained membership until retirement: • • • At least 55 with five or more years of service credit, but the sum of the member’s age and years of service credit total less than 80, or 30 or more years of service credit, but the sum of the member’s age and years of service credit total less than 80, or The sum of the member’s age and years of service credit total at least 80, but the member is less than age 60.* For members who met the requirements to be grandfathered before Sept. 1, 2005, there is no reduction to their benefit based on actuarial tables if they are at least age 55, the sum of their age and years of service credit total at least 80, and they are below age 60; however, these members are still considered early-age retirees. For members who did not have at least five years of service credit as of Aug.
31, 2014, who established TRS membership on or after Sept. 1, 2014, or who had at least five years of service credit as of Aug. 31, 2014 but terminated membership in TRS by withdrawal of accumulated contributions and later resumed TRS membership: • • • At least 55 with five or more years of service credit, but the sum of the member’s age and years of service credit total less than 80, or 30 or more years of service credit, but the sum of the member’s age and years of service credit total less than 80, and the member is less than age 62, or The sum of the member’s age and years of service credit total at least 80, but the member is less than age 62.** For members who met the requirements to be grandfathered before Sept.
1, 2005, there is no reduction to their benefit based on actuarial tables if they are at least age 55, have at least 20 years of service credit, the sum of their age and years of service credit total at least 80, and they are below age 62; however, these members are still considered early-age retirees. Early Retirement Benefit - The standard annuity calculated under the benefit formula (or the minimum benefit, if applicable) reduced for early retirement. The amount of the reduction varies depending on age, years of service credit, and whether a member is grandfathered. DISABILITY RETIREMENT Eligibility - Physical or mental disability precludes the member’s continued performance of current duties and the disability is probably permanent, as certified by the TRS Medical Board. Benefit - For disabled members with at least 10 years of credited service, the greater of the standard annuity unreduced for early age or $150 per month minimum benefit, less any reduction for the selection of an optional annuity. For disabled members with fewer than 10 years of credited service, $150 per month. Benefits Section 192 .
Summary of Benefits Duration - For retirees with 10 or more years of credited service, payments continue for as long as the disability continues. For those with fewer than 10 years of credited service, payments continue for the life of the retiree, the duration of the disability, or the number of months of credited service, whichever is shorter. Earnings Limit - Disability retirees who applied and retired after Aug. 31, 2007 are subject to an annual limit on earnings from any employment. The current limit is the greater of the highest annual salary before retirement or $40,000. Excess earnings will cause benefits to be forfeited until such time as the excess earnings cease or are reduced to an allowable amount. ANNUITY PAYMENT OPTIONS All service and eligible disability retirees may select an optional form of payment that reduces the standard annuity by application of actuarial reduction factors in order to continue payment to a beneficiary after the retiree’s death.
Actuarial factors for disability retirees are different from those for service retirees because of different assumptions about life expectancy for the two groups. The available options include 100, 75, and 50 percent joint and survivor annuities, and five- and 10-year guaranteed period annuities. Selection of a 100 or 75 percent joint and survivor annuity and a five- or 10-year guaranteed period annuity may not be allowed in certain situations based on the minimum distribution provisions of federal tax law. THE POP-UP PROVISION If a designated beneficiary under any of the joint and survivor options dies while the retiree is still living, the retiree’s future monthly payment increases to the amount of the standard annuity. PARTIAL LUMP SUM OPTION Under the Partial Lump Sum Option (PLSO), at the time of retirement, eligible members may elect to receive an actuarially reduced service retirement annuity plus a cash lump sum distribution. Members may participate in the PLSO if they are eligible for service retirement, meet the Rule of 90 (age and years of service credit equal at least 90), are not participating in the Deferred Retirement Option Plan (DROP), and are not retiring with disability retirement benefits.
Grandfathered members may elect PLSO at retirement if they are eligible for normal age service retirement under the pre-Sept. 1, 2005 law (age 65 with at least five years of credited service, or the sum of the member’s age and years of credited service equals or exceeds 80 with at least five years of credited service), are not participating in DROP, and are not retiring with disability retirement benefits. Members retiring under the proportionate retirement program are not eligible to elect the PLSO. Partial lump sum distributions equal to 12, 24, or 36 months of a standard service retirement annuity may be selected. When a member selects this option, the monthly annuity is actuarially reduced to reflect the lump sum distribution. Flexible distribution options are available, including rollovers to another eligible retirement plan. DEFERRED RETIREMENT OPTION PLAN The Deferred Retirement Option Plan (DROP), which is closed to new participants, was available for active members who were eligible for normal age service retirement and had at least 25 years of credited service. Members who elected to participate in DROP (before enrollment was closed effective Dec.
31, 2005) chose to freeze their salary amounts and service credit used to calculate their retirement benefits and to have a portion of the standard annuity amount deposited into a DROP account while continuing to work for a TRS-covered employer. Interest on DROP accounts prior to Sept. 2014 was credited at a rate of five percent.
The DROP account is currently credited at the rate of two percent per annum. Members are not considered to be retired while participating in DROP. Benefits Section 193 . Summary of Benefits Members who elected DROP chose to participate in 12-month increments for up to five years. During DROP participation, the member does not accrue additional service credit, nor is any compensation earned during DROP participation considered in calculating the standard annuity. Also, during DROP participation, the member’s statutory contributions to TRS continue; however, contributions are not credited to the member’s contribution account and are not subject to refund. Participation in DROP ends at the earliest of the expiration of the election period, retirement, or death. The accumulated DROP account may be distributed as a single lump sum or in monthly or yearly installments covering five or 10 years. Distributions commence at retirement or in the event the member dies before retiring, at the member’s death.
Eligible distributions may be rolled over to another eligible retirement plan. Beginning in September 2015 a member who is currently in the DROP program and has not yet retired will have a window of opportunity to revoke their DROP election. The window for the DROP revocation opens Sept. 1, 2015 and ends Dec.
31, 2015. MINIMUM SERVICE CREDIT REQUIRED FOR SERVICE RETIREMENT BENEFITS Under current law, a member who has completed at least five years of credited service has earned a right to service retirement benefits after reaching eligible retirement age, provided that the member’s accumulated contributions are not withdrawn from the system. Service credited in another retirement system that participates in the Proportionate Retirement Program may be combined with TRS service credit to determine eligibility for TRS service retirement benefits. Any unpurchased, qualifying USERRA military service, up to a maximum of five years, may also be counted in determining eligibility for TRS service retirement benefits. An eligible member must apply for benefits and meet other requirements, such as termination of Texas public education employment, in order to begin receiving benefits. DEATH AND SURVIVOR BENEFITS Active Members - The beneficiary of an active member may elect to receive one of the following benefits in the event of the member’s death before retirement, if the member dies during a school year in which the member performed service or if the member dies while performing qualified military service as defined by applicable federal law.
These benefits also are available due to death when the member is absent from service as described by law, such as when the absence is due to sickness, accident, or other involuntary cause or when the member is within five years of being eligible to retire when leaving employment: 1. A lump sum payment equal to twice the member’s annual rate of compensation or $80,000, whichever is less. 2. Sixty monthly payments equal to the member’s standard annuity without reduction for early age, provided the member had at least five years of service credit at the time of death. 3.
Lifetime payments equal to a 100 percent joint and survivor annuity, provided the member had at least five years of service credit subject to any reduction applicable for early age. This benefit is only available when there is a sole beneficiary. 4. An amount equal to a return of the member’s contributions with accumulated interest. 5.
Survivor benefits of $2,500 lump sum payment plus a monthly benefit. For example, $350 per month to a beneficiary spouse with minor children, continuing until the youngest child reaches age 18. When the spouse turns age 65, or when the youngest child reaches age 18, whichever is later, the spouse would begin receiving $250 per month for life. In addition to these five options, a lump sum death benefit of $160,000 is available if the active member is employed in a TRS-covered position and dies as the result of a physical assault during the performance of the employee’s regular job duties. Benefits Section 194 .
Summary of Benefits Also, the beneficiary of a DROP participant will receive the accumulated DROP account balance, payable as a lump sum or in periodic installments. Retirees - In addition to any joint and survivor or guaranteed period annuity that may be payable under an optional form of payment a retiree elected, the beneficiary of a service or disability retiree is entitled to a $10,000 lump sum payment. In certain circumstances, eligible survivors may select alternate payment options in lieu of the lump sum benefit. The alternate payment options include a lump sum payment of $2,500 plus an applicable monthly survivor benefit. If total payments made before death to a retiree and, when applicable, to a beneficiary for an optional service retirement annuity are less than accumulated contributions at retirement, an amount equal to the remainder is paid to the beneficiary or as otherwise provided by law. Should a retiree die prior to receiving all PLSO payments that are due, TRS will pay any remaining PLSO payments in a single lump sum payment to the beneficiary. If the retiree participated in DROP and died before receiving all DROP distributions, any unpaid DROP payments are paid to the beneficiary designated by the retiree. GRANDFATHERED PROVISIONS A person who, as a member, met any one of the following criteria on or before Aug.
31, 2005, is grandfathered under plan provisions repealed with respect to non-grandfathered members: • • • • • • • the member was at least 50 years old, the member’s age and years of service credit equaled at least 70 (“Rule of 70”), or the member had at least 25 years of service credit. Members who are grandfathered will have their benefits determined in the following manner: Final Average Salary at retirement will be determined by the highest three years (instead of five years) of salary. Preservation of certain retirement reduction factors means that members age 55 or older with 20 to 24 years of credited service who take early retirement will receive a lesser reduction to their annuities than those members who are not grandfathered. Partial Lump Sum Option eligibility will require either age 65 with at least five years of service credit, or a combined age plus years of credited service that equals at least 80 (“Rule of 80”) instead of 90. Health Benefits The major health benefits and long-term care provisions are: HEALTH BENEFITS FOR ACTIVE PUBLIC SCHOOL EMPLOYEES TRS-ActiveCare, the statewide health benefits program for eligible full-time and eligible part-time employees of school districts, open enrollment charter schools, regional education service centers, and other educational districts, went into effect on Sept. 1, 2002. The program initially addressed the most critical areas of the state with regard to availability and affordability of health benefits for public school employees and therefore focused on smaller districts.
The program was subsequently expanded to include larger school districts. In fiscal year 2015, 1,110 entities participated in the program. During this same fiscal year, employees of participating entities were enrolled in three preferred provider organization plans, and employees of certain areas also had the option of choosing coverage under a health maintenance organization. Benefits Section 195 . Summary of Benefits RETIREE HEALTH COVERAGE The program under the Texas Public School Retired Employees Group Benefits Act, known as TRS-Care, makes available a basic level of health coverage without cost to eligible TRS public school retirees. As has been the case for a number of years, eligible retirees and their eligible dependents may pay premiums and participate in one of two standard medical plans and one of two standard prescription plans of more comprehensive benefits and coverage. Participants with Medicare also have two Medicare Advantage medical plan and two Medicare Part D prescription plan options, subject to eligibility criteria. For information on TRS-Care eligibility, please refer to the TRS website. LONG-TERM CARE INSURANCE PROGRAM Eligible active and retired members, their dependents, and certain other family members may participate in the TRS longterm care insurance program.
The plan pays benefits if the participant becomes unable to perform at least two activities of daily living without substantial assistance from another person. The plan also pays benefits as a result of a severe cognitive impairment that requires supervision or verbal direction from another person in order to protect the member or others from serious injury. Benefits Section 196 . . Teacher Retirement System of Texas 1000 Red River Street Austin, Texas 78701-2698 (512) 542-6400 1-800-223-8778 TRS o rher Supe her Teac Art test Con n r le entio Honorable M www.trs.texas.gov .