


Description
Fall 2015
TIAA-CREF Asset Management
Impact of rising interest rates
on equity markets
Executive summary
Saira Malik, CFA
Managing Director,
Head of Global Active Equity
Portfolio Management,
TIAA-CREF Asset Management
WW
The shift to a credit tightening cycle raises concern about the potential impact of rising
interest rates on equities.
WW
Past cycle performance shows the overall effect of rising rates on stocks is slightly
negative when inflation is high (above 4%), but positive returns are possible when
inflation is under control, as it is today.
WW
The Fed’s objective in the tightening cycle will be to normalize rates following an
unusually long period of stimulation, rather than to fight inflation—suggesting a
moderate pace of rate increases that could be supportive of stocks.
WW
Amid expected greater market volatility, investors should consider diversifying their sources
of investment income and increasing exposure to non-U.S. developed-market stocks.
WW
As rate hikes unwind distortions caused by the Fed’s aggressive monetary stimulus,
high-dividend stocks, REITs, and Utilities will likely suffer.
Impact on stocks is likely to be modest overall,
except for rate-sensitive sectors
With the Federal Reserve poised to begin a new credit tightening cycle, investors should
consider the potential impact on equities and broader allocation decisions. However,
predicting the potential impact is difficult because outcomes depend on the unique
environment of each rate-hike cycle, and individual outcomes have varied greatly depending
on a range of capital market and economic conditions.
Past tightening cycles have been a toss-up—stock market performance has been split
about evenly between positive and negative returns in the year following the first rate hike.
Inflation is often the key differentiating variable.
The start of this new cycle follows a period of unusually long monetary stimulus and near-zero
interest rates, which have distorted the market for a variety of income-producing investments,
such as high-dividend-paying stocks and high-yield bonds. The process of unwinding this
stimulus creates particular risks for those sectors as investors return to more traditional
bond investments.
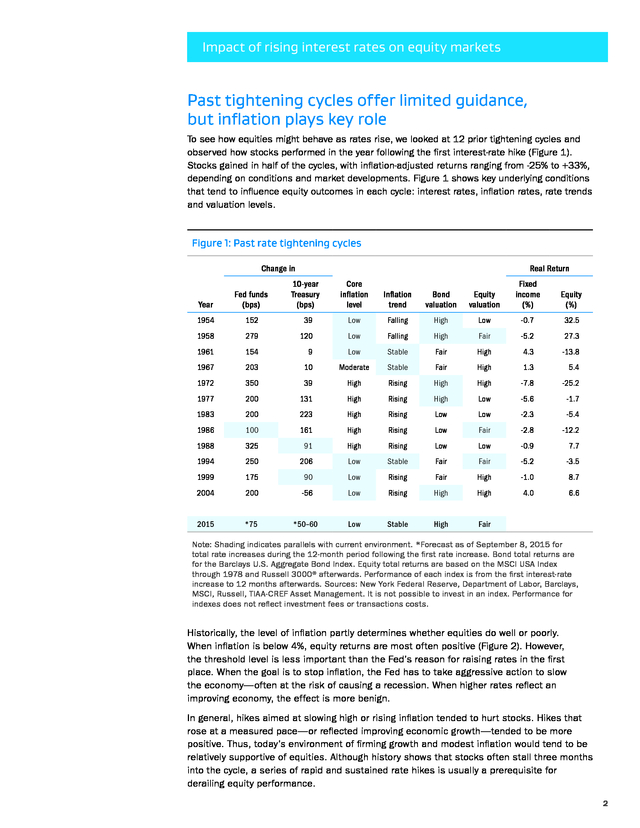
Overall, we think the impact on stocks will be relatively modest, as hikes are expected to unfold in a long, slow climb that may be supportive of equities. Given uncertainty about the new cycle’s path, stock valuations and expected higher volatility, investors should consider reducing their return expectations and increasing exposure to non-U.S. developed-market stocks, while tempering exposure to income-related stocks vulnerable to the rate normalization process. . Impact of rising interest rates on equity markets Past tightening cycles offer limited guidance, but inflation plays key role To see how equities might behave as rates rise, we looked at 12 prior tightening cycles and observed how stocks performed in the year following the first interest-rate hike (Figure 1). Stocks gained in half of the cycles, with inflation-adjusted returns ranging from -25% to +33%, depending on conditions and market developments. Figure 1 shows key underlying conditions that tend to influence equity outcomes in each cycle: interest rates, inflation rates, rate trends and valuation levels. Figure 1: Past rate tightening cycles Change in Real Return 10-year Treasury (bps) Core inflation level Inflation trend Bond valuation Equity valuation Fixed income (%) Equity (%) Falling High Low -0.7 32.5 Year Fed funds (bps) 1954 152 39 Low 1958 279 120 Low Falling High Fair -5.2 27.3 1961 154 9 Low Stable Fair High 4.3 -13.8 1967 203 10 Moderate Stable Fair High 1.3 5.4 1972 350 39 High Rising High High -7.8 -25.2 1977 200 131 High Rising High Low -5.6 -1.7 1983 200 223 High Rising Low Low -2.3 -5.4 1986 100 161 High Rising Low Fair -2.8 -12.2 1988 325 91 High Rising Low Low -0.9 7.7 1994 250 206 Low Stable Fair Fair -5.2 -3.5 1999 175 90 Low Rising Fair High -1.0 8.7 2004 200 -56 Low Rising High High 4.0 6.6 2015 *75 *50–60 Low Stable High Fair Note: Shading indicates parallels with current environment. *Forecast as of September 8, 2015 for total rate increases during the 12-month period following the first rate increase. Bond total returns are for the Barclays U.S.
Aggregate Bond Index. Equity total returns are based on the MSCI USA Index through 1978 and Russell 3000® afterwards. Performance of each index is from the first interest-rate increase to 12 months afterwards.
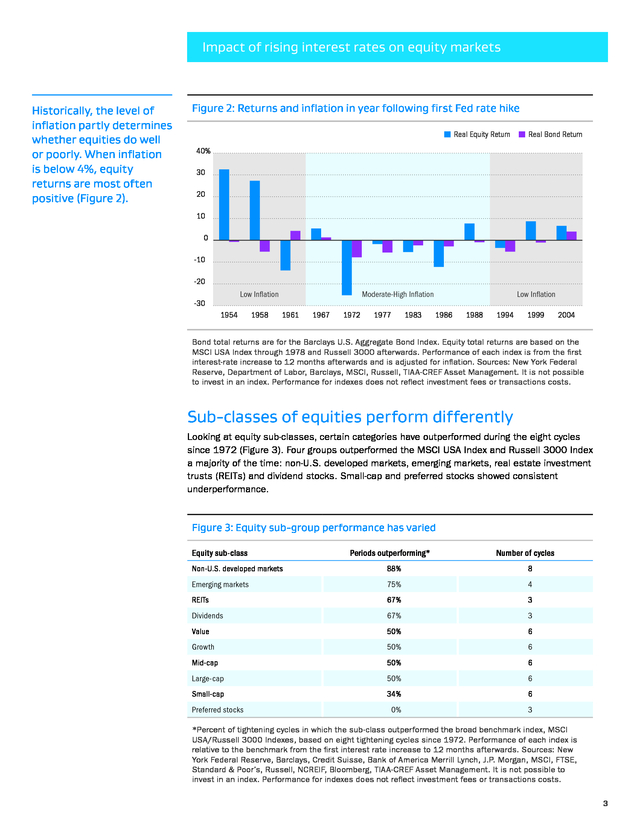
Sources: New York Federal Reserve, Department of Labor, Barclays, MSCI, Russell, TIAA-CREF Asset Management. It is not possible to invest in an index. Performance for indexes does not reflect investment fees or transactions costs. Historically, the level of inflation partly determines whether equities do well or poorly. When inflation is below 4%, equity returns are most often positive (Figure 2).
However, the threshold level is less important than the Fed’s reason for raising rates in the first place. When the goal is to stop inflation, the Fed has to take aggressive action to slow the economy—often at the risk of causing a recession. When higher rates reflect an improving economy, the effect is more benign. In general, hikes aimed at slowing high or rising inflation tended to hurt stocks.
Hikes that rose at a measured pace—or reflected improving economic growth—tended to be more positive. Thus, today’s environment of firming growth and modest inflation would tend to be relatively supportive of equities. Although history shows that stocks often stall three months into the cycle, a series of rapid and sustained rate hikes is usually a prerequisite for derailing equity performance. 2 .
Impact of rising interest rates on equity markets Historically, the level of inflation partly determines whether equities do well or poorly. When inflation is below 4%, equity returns are most often positive (Figure 2). Figure 2: Returns and inflation in year following first Fed rate hike W Real Equity Return W Real Bond Return 40% 30 20 10 0 -10 -20 Low Inflation -30 1954 1958 Moderate-High Inflation 1961 1967 1972 1977 1983 Low Inflation 1986 1988 1994 1999 2004 Bond total returns are for the Barclays U.S. Aggregate Bond Index. Equity total returns are based on the MSCI USA Index through 1978 and Russell 3000 afterwards.
Performance of each index is from the first interest-rate increase to 12 months afterwards and is adjusted for inflation. Sources: New York Federal Reserve, Department of Labor, Barclays, MSCI, Russell, TIAA-CREF Asset Management. It is not possible to invest in an index.
Performance for indexes does not reflect investment fees or transactions costs. Sub-classes of equities perform differently Looking at equity sub-classes, certain categories have outperformed during the eight cycles since 1972 (Figure 3). Four groups outperformed the MSCI USA Index and Russell 3000 Index a majority of the time: non-U.S. developed markets, emerging markets, real estate investment trusts (REITs) and dividend stocks.
Small-cap and preferred stocks showed consistent underperformance. Figure 3: Equity sub-group performance has varied Equity sub-class Periods outperforming* Number of cycles Non-U.S. developed markets 88% 8 Emerging markets 75% 4 REITs 67% 3 Dividends 67% 3 Value 50% 6 Growth 50% 6 Mid-cap 50% 6 Large-cap 50% 6 Small-cap 34% 6 0% 3 Preferred stocks *Percent of tightening cycles in which the sub-class outperformed the broad benchmark index, MSCI USA/Russell 3000 Indexes, based on eight tightening cycles since 1972. Performance of each index is relative to the benchmark from the first interest rate increase to 12 months afterwards.
Sources: New York Federal Reserve, Barclays, Credit Suisse, Bank of America Merrill Lynch, J.P. Morgan, MSCI, FTSE, Standard & Poor’s, Russell, NCREIF, Bloomberg, TIAA-CREF Asset Management. It is not possible to invest in an index.
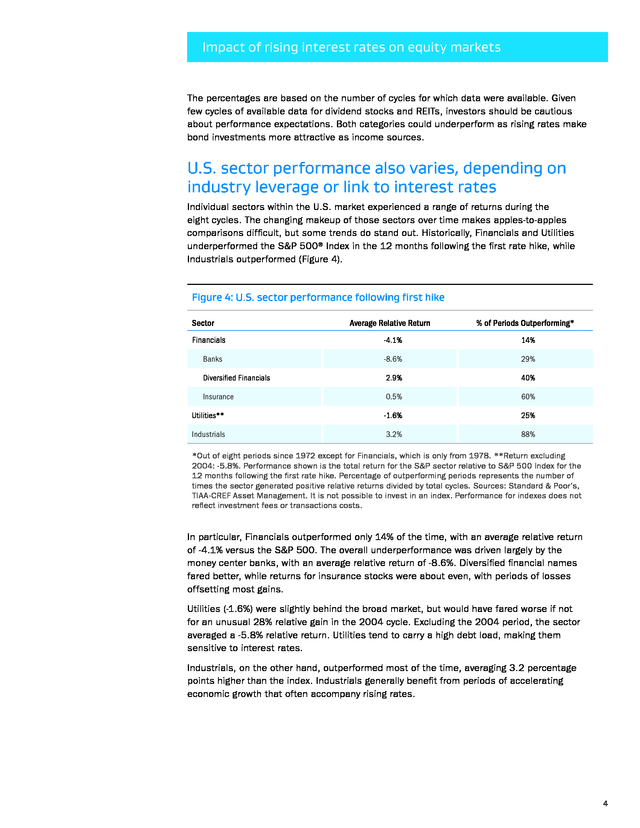
Performance for indexes does not reflect investment fees or transactions costs. 3 . Impact of rising interest rates on equity markets The percentages are based on the number of cycles for which data were available. Given few cycles of available data for dividend stocks and REITs, investors should be cautious about performance expectations. Both categories could underperform as rising rates make bond investments more attractive as income sources. U.S. sector performance also varies, depending on industry leverage or link to interest rates Individual sectors within the U.S.
market experienced a range of returns during the eight cycles. The changing makeup of those sectors over time makes apples-to-apples comparisons difficult, but some trends do stand out. Historically, Financials and Utilities underperformed the S&P 500® Index in the 12 months following the first rate hike, while Industrials outperformed (Figure 4). Figure 4: U.S.
sector performance following first hike Sector Financials Average Relative Return % of Periods Outperforming* -4.1% 14% Banks -8.6% 29% Diversified Financials 2.9% 40% Insurance 0.5% 60% Utilities** -1.6% 25% Industrials 3.2% 88% *Out of eight periods since 1972 except for Financials, which is only from 1978. **Return excluding 2004: -5.8%. Performance shown is the total return for the S&P sector relative to S&P 500 Index for the 12 months following the first rate hike.
Percentage of outperforming periods represents the number of times the sector generated positive relative returns divided by total cycles. Sources: Standard & Poor’s, TIAA-CREF Asset Management. It is not possible to invest in an index.
Performance for indexes does not reflect investment fees or transactions costs. In particular, Financials outperformed only 14% of the time, with an average relative return of -4.1% versus the S&P 500. The overall underperformance was driven largely by the money center banks, with an average relative return of -8.6%. Diversified financial names fared better, while returns for insurance stocks were about even, with periods of losses offsetting most gains. Utilities (-1.6%) were slightly behind the broad market, but would have fared worse if not for an unusual 28% relative gain in the 2004 cycle.
Excluding the 2004 period, the sector averaged a -5.8% relative return. Utilities tend to carry a high debt load, making them sensitive to interest rates. Industrials, on the other hand, outperformed most of the time, averaging 3.2 percentage points higher than the index. Industrials generally benefit from periods of accelerating economic growth that often accompany rising rates. 4 .
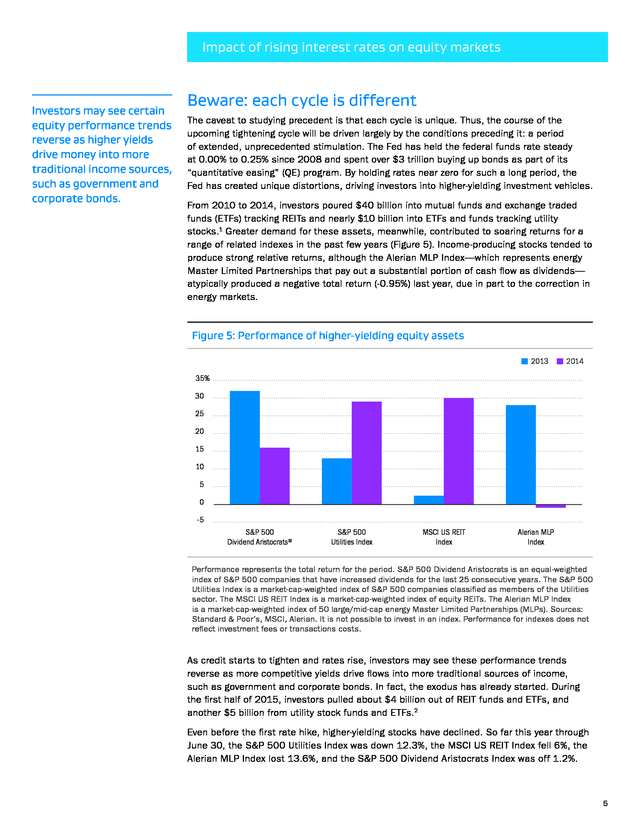
Impact of rising interest rates on equity markets Investors may see certain equity performance trends reverse as higher yields drive money into more traditional income sources, such as government and corporate bonds. Beware: each cycle is different The caveat to studying precedent is that each cycle is unique. Thus, the course of the upcoming tightening cycle will be driven largely by the conditions preceding it: a period of extended, unprecedented stimulation. The Fed has held the federal funds rate steady at 0.00% to 0.25% since 2008 and spent over $3 trillion buying up bonds as part of its “quantitative easing” (QE) program. By holding rates near zero for such a long period, the Fed has created unique distortions, driving investors into higher-yielding investment vehicles. From 2010 to 2014, investors poured $40 billion into mutual funds and exchange traded funds (ETFs) tracking REITs and nearly $10 billion into ETFs and funds tracking utility stocks.1 Greater demand for these assets, meanwhile, contributed to soaring returns for a range of related indexes in the past few years (Figure 5).
Income-producing stocks tended to produce strong relative returns, although the Alerian MLP Index—which represents energy Master Limited Partnerships that pay out a substantial portion of cash flow as dividends— atypically produced a negative total return (-0.95%) last year, due in part to the correction in energy markets. Figure 5: Performance of higher-yielding equity assets W 2013 W 2014 35% 30 25 20 15 10 5 0 -5 S&P 500 Dividend Aristocrats® S&P 500 Utilities Index MSCI US REIT Index Alerian MLP Index Performance represents the total return for the period. S&P 500 Dividend Aristocrats is an equal-weighted index of S&P 500 companies that have increased dividends for the last 25 consecutive years. The S&P 500 Utilities Index is a market-cap-weighted index of S&P 500 companies classified as members of the Utilities sector.
The MSCI US REIT Index is a market-cap-weighted index of equity REITs. The Alerian MLP Index is a market-cap-weighted index of 50 large/mid-cap energy Master Limited Partnerships (MLPs). Sources: Standard & Poor’s, MSCI, Alerian.
It is not possible to invest in an index. Performance for indexes does not reflect investment fees or transactions costs. As credit starts to tighten and rates rise, investors may see these performance trends reverse as more competitive yields drive flows into more traditional sources of income, such as government and corporate bonds. In fact, the exodus has already started.
During the first half of 2015, investors pulled about $4 billion out of REIT funds and ETFs, and another $5 billion from utility stock funds and ETFs.2 Even before the first rate hike, higher-yielding stocks have declined. So far this year through June 30, the S&P 500 Utilities Index was down 12.3%, the MSCI US REIT Index fell 6%, the Alerian MLP Index lost 13.6%, and the S&P 500 Dividend Aristocrats Index was off 1.2%. 5 . Impact of rising interest rates on equity markets Current macroeconomic environment differs from the last cycle Economic and market conditions at the beginning of a tightening cycle matter. Similar to the start of the last cycle, core inflation is low and bond valuations are high. However, the inflation outlook is stable—not rising—and equity valuations are fair, given the recent market decline. Moreover, there has been no rate hike since June 2006. In 1994 and 2004, the first rate hike came two and a half years after the end of the previous recession. The Fed’s primary goal for the upcoming tightening cycle will be to normalize interest rates, rather than its more typical purpose of fighting inflation.
How equity markets respond to this cycle will likely depend on the following variables: WW The pace and scope of Fed tightening. We expect rate hikes to be more gradual and modest than in the past few cycles. In the 2004–2006 cycle, the Fed raised the federal funds rate 17 consecutive times—nine times and 200 basis points in the first 12 months alone.
Today, we have a lower starting rate of inflation and less robust economic growth, suggesting a slower and calmer rate cycle that should support stocks. WW Clarity of communication from the Fed. The process of working through the aftermath of the technology and housing market bubbles has in some respects encouraged the Fed to become more transparent about its intentions. Assuming improved Fed communication in future, the market is less likely to be caught off guard, resulting in less danger for stocks.
In 2004, when the Fed was starting to become more open, the stock market traded down into the hike and during the first month afterward, but then moved upward. WW Globalization’s downward pressure on U.S. rates. The health of emerging-market economies has become a bigger, more complicating factor in global capital markets as these developing nations have grown in size and influence.
More importantly, economies are connected as never before, and U.S., European Union and global financial authorities have sought to prevent contagion from individual country debt crises and market bubbles. European efforts to revive economic growth through their version of QE have limited the rise in long-term U.S. rates. Zero or negative rates in Europe have made U.S.
Treasuries attractive to global investors—despite the prospect of higher U.S. rates—and kept their yields from rising closer to levels that might be warranted by U.S. economic conditions. Indeed, China’s recent slowdown and market plunge, Germany’s historically low yields, and the Greek financial drama have influenced the 10-year U.S.
Treasury yield as much as domestic economic conditions within the U.S. To spur economic growth, many governments are depreciating their currencies or choosing not to defend them, the opposite of U.S. monetary policy. As a result, demand for the relatively higher yields available on dollar-based assets remains strong, boosting their prices and limiting the scope of rate increases.
As long as these rates are below “normal,” they will continue to artificially inflate demand for dividend-paying stocks and domestic fixed-income securities, delaying expected outflows. WW U.S. inflation prospects are benign, but wage pressure is rising. A key factor in stock markets’ reaction to higher rates is the pace of inflation.
Despite improving economic growth, inflation has remained benign. The personal consumption expenditures (PCE) index of prices has continually lagged the Fed’s annualized target rate of 2%, contributing to the Fed’s decision to delay the start of rate hikes. 6 . Impact of rising interest rates on equity markets Although inflation prospects are benign, wage growth and rising prices could trigger faster rate hikes and a potential market downturn. However, two important variables could influence the pace of Fed action: wage growth and worker productivity. Despite stubbornly slow wage growth, further tightening of labor markets could bring wage pressure and rising inflation. As long as worker productivity keeps up with rising wages, tighter labor markets should not cause trouble. If productivity lags, wage pressure could squeeze profit margins, as companies find they can’t raise prices—and so far most have been unable to do so. Wage pressure or higher prices could force rates up faster than expected, triggering a market downturn. Four considerations for investors in a rising-rate environment 1. Expect volatility during the transition to higher rates and adjust return expectations downward. Investors are likely to see higher volatility due to heightened uncertainty at this key inflection point in the cycle and should lower their return expectations from the recent bull market’s outsized gains. Despite potential volatility, we believe the stock market could post a positive real return over the 12-month period following the first rate hike. Stock valuations are about average, low inflation justifies a higher multiple and stocks remain relatively attractive versus bonds. Corporate earnings, meanwhile, may continue to grow due to the strengthening economy, but more slowly than in recent years.
The relative attractiveness of U.S. assets—based on economic growth, higher yields, and pressure on foreign currencies from governments looking to boost their own economies—suggests continued strength in the dollar. This may be a continuing drag on sales for multinational companies dependent on exports. 2. Consider increasing exposure to non-U.S.
developed markets. Overseas valuations are moderate or even below U.S. levels, and earnings growth is expected to increase in developed markets. This suggests the potential for stocks in developed markets such as Europe to outperform over the first 12 months of the cycle, as they have in the past.
The outlook for emerging markets is clouded by China’s economic slowdown and the drop in commodity prices. 3. Diversify investment income sources to avoid potential impact on high-dividend stocks. Demand for high-dividend stocks, funds and ETFs that was driven by low bond yields is likely to reverse—and asset outflows have already begun. Once rates start to climb, dividend stocks and REITs will likely be under even more pressure as investors shift back to bonds for steady income. 7 . Impact of rising interest rates on equity markets 4. Consider tactical reallocations where appropriate, but do so with care. Given few lasting patterns in stock returns and the widely variable nature of each cycle, investors should consider any tactical changes carefully. However, the following selected areas warrant further discussion: Figure 6: Selected sector expectations Sector Outlook Comment Financials Mixed Excess deposits may help bank profitability, but financial firms face stricter regulation and typically underperform Technology Likely to outperform Low debt and dollar exposure, high operating leverage; the sector benefits if companies spend high cash balances on tech to boost productivity Health Care Likely to outperform Low debt, limited dollar exposure, good secular growth prospects due in part to Obamacare and aging America Utilities Likely to underperform Typically underperforms; would do well only as extreme, defensive reaction to hikes, but scale and pace of tightening are not expected to derail equities Source: TIAA-CREF Asset Management. WW Financials are likely to be mixed. Banks have high excess deposits but may compete the advantage away in pursuit of new retail deposits. Diversified financials are benefiting from trading and mergers & acquisitions activity, but the group is likely to be less profitable.
The sector overall faces a more costly and stringent regulatory environment. WW Technology could benefit as companies begin to spend cash to improve worker productivity and offset wage pressure or lack of pricing power. WW Health Care is supported by the Affordable Care Act, and an aging U.S. population assures sustained demand. WW Most Utilities are likely to underperform. 8 . Impact of rising interest rates on equity markets Conclusions While rising interest rates typically are perceived as a negative for stock performance, outcomes are difficult to predict with precision, as historical patterns are not definitive and each cycle is different. Investors should expect results to depend on economic and market factors specific to each cycle. The environment for this next cycle suggests that real returns in the short term could be positive. Investor strategy should consider the following factors: WW The impact of higher rates often begins before the first tightening occurs, as performance and flows so far this year have already shown. WW Economic growth and a return to normalized conditions, rather than rising inflation, are triggering the upcoming tightening cycle. This suggests a slow and steady pace of rate hikes, which would be supportive of stocks, rather than more aggressive action that is typical when the Fed is seeking to combat sharply rising inflation.
Against this backdrop, equity performance is less likely to be rate-driven and more likely to reflect market valuations, earnings growth, and the rate of productivity increases. WW Even with this supportive cycle, greater uncertainty at the inflection point and the historical drag of higher rates on performance suggest investors should lower their return expectations and remain diversified. As rates normalize and distortions are unwound, high-dividend stocks, REITs and the Utilities sector will likely suffer. Technology and Health Care sectors may benefit. WW Better relative valuations and central bank support in overseas markets suggest that investors should consider non-U.S. opportunities.
Despite recent turbulence, global developed-market stocks are well positioned to continue their history of rate cycle outperformance. Emerging markets are less attractive due to the economic slowdown in China and low commodity prices. Visit us at www.tiaa-cref.org/assetmanagement for additional information about TIAA-CREF’s equity capabilities. Source: Morningstar Source: Morningstar This material should not be regarded as financial advice, or as a recommendation or an offer to buy or sell any product or service to which this information may relate. Economic and market forecasts are subject to uncertainty and may change based on varying market conditions, political and economic developments. This report is prepared by TIAA-CREF Asset Management and represents the views of Saira Malik. These views may change in response to changing economic and market conditions.
Any projections included in this material are for asset classes only, and do not reflect the experience of any product or service offered by TIAA-CREF. Past performance is not indicative of future results. The material is for informational purposes only and should not be regarded as a recommendation or an offer to buy or sell any product or service to which this information may relate.
Certain products and services may not be available to all entities or persons. Please note equity and fixedincome investing involves risk. Foreign investments are also subject to political, currency and regulatory risks. TIAA-CREF Asset Management provides investment advice and portfolio management services to the TIAA-CREF group of companies through the following entities: Teachers Advisors, Inc., TIAA-CREF Investment Management, LLC, TIAA-CREF Alternatives Advisors, LLC and Teachers Insurance and Annuity Association of America® (TIAA®). TIAA-CREF Alternatives Advisors, LLC is a registered investment adviser and wholly owned subsidiary of Teachers Insurance and Annuity Association of America (TIAA). ©2015 Teachers Insurance and Annuity Association of America-College Retirement Equities Fund (TIAA-CREF), 730 Third Avenue, New York, NY 10017. 1 2 C25594 448720_566303 (09/15) .
Overall, we think the impact on stocks will be relatively modest, as hikes are expected to unfold in a long, slow climb that may be supportive of equities. Given uncertainty about the new cycle’s path, stock valuations and expected higher volatility, investors should consider reducing their return expectations and increasing exposure to non-U.S. developed-market stocks, while tempering exposure to income-related stocks vulnerable to the rate normalization process. . Impact of rising interest rates on equity markets Past tightening cycles offer limited guidance, but inflation plays key role To see how equities might behave as rates rise, we looked at 12 prior tightening cycles and observed how stocks performed in the year following the first interest-rate hike (Figure 1). Stocks gained in half of the cycles, with inflation-adjusted returns ranging from -25% to +33%, depending on conditions and market developments. Figure 1 shows key underlying conditions that tend to influence equity outcomes in each cycle: interest rates, inflation rates, rate trends and valuation levels. Figure 1: Past rate tightening cycles Change in Real Return 10-year Treasury (bps) Core inflation level Inflation trend Bond valuation Equity valuation Fixed income (%) Equity (%) Falling High Low -0.7 32.5 Year Fed funds (bps) 1954 152 39 Low 1958 279 120 Low Falling High Fair -5.2 27.3 1961 154 9 Low Stable Fair High 4.3 -13.8 1967 203 10 Moderate Stable Fair High 1.3 5.4 1972 350 39 High Rising High High -7.8 -25.2 1977 200 131 High Rising High Low -5.6 -1.7 1983 200 223 High Rising Low Low -2.3 -5.4 1986 100 161 High Rising Low Fair -2.8 -12.2 1988 325 91 High Rising Low Low -0.9 7.7 1994 250 206 Low Stable Fair Fair -5.2 -3.5 1999 175 90 Low Rising Fair High -1.0 8.7 2004 200 -56 Low Rising High High 4.0 6.6 2015 *75 *50–60 Low Stable High Fair Note: Shading indicates parallels with current environment. *Forecast as of September 8, 2015 for total rate increases during the 12-month period following the first rate increase. Bond total returns are for the Barclays U.S.
Aggregate Bond Index. Equity total returns are based on the MSCI USA Index through 1978 and Russell 3000® afterwards. Performance of each index is from the first interest-rate increase to 12 months afterwards.
Sources: New York Federal Reserve, Department of Labor, Barclays, MSCI, Russell, TIAA-CREF Asset Management. It is not possible to invest in an index. Performance for indexes does not reflect investment fees or transactions costs. Historically, the level of inflation partly determines whether equities do well or poorly. When inflation is below 4%, equity returns are most often positive (Figure 2).
However, the threshold level is less important than the Fed’s reason for raising rates in the first place. When the goal is to stop inflation, the Fed has to take aggressive action to slow the economy—often at the risk of causing a recession. When higher rates reflect an improving economy, the effect is more benign. In general, hikes aimed at slowing high or rising inflation tended to hurt stocks.
Hikes that rose at a measured pace—or reflected improving economic growth—tended to be more positive. Thus, today’s environment of firming growth and modest inflation would tend to be relatively supportive of equities. Although history shows that stocks often stall three months into the cycle, a series of rapid and sustained rate hikes is usually a prerequisite for derailing equity performance. 2 .
Impact of rising interest rates on equity markets Historically, the level of inflation partly determines whether equities do well or poorly. When inflation is below 4%, equity returns are most often positive (Figure 2). Figure 2: Returns and inflation in year following first Fed rate hike W Real Equity Return W Real Bond Return 40% 30 20 10 0 -10 -20 Low Inflation -30 1954 1958 Moderate-High Inflation 1961 1967 1972 1977 1983 Low Inflation 1986 1988 1994 1999 2004 Bond total returns are for the Barclays U.S. Aggregate Bond Index. Equity total returns are based on the MSCI USA Index through 1978 and Russell 3000 afterwards.
Performance of each index is from the first interest-rate increase to 12 months afterwards and is adjusted for inflation. Sources: New York Federal Reserve, Department of Labor, Barclays, MSCI, Russell, TIAA-CREF Asset Management. It is not possible to invest in an index.
Performance for indexes does not reflect investment fees or transactions costs. Sub-classes of equities perform differently Looking at equity sub-classes, certain categories have outperformed during the eight cycles since 1972 (Figure 3). Four groups outperformed the MSCI USA Index and Russell 3000 Index a majority of the time: non-U.S. developed markets, emerging markets, real estate investment trusts (REITs) and dividend stocks.
Small-cap and preferred stocks showed consistent underperformance. Figure 3: Equity sub-group performance has varied Equity sub-class Periods outperforming* Number of cycles Non-U.S. developed markets 88% 8 Emerging markets 75% 4 REITs 67% 3 Dividends 67% 3 Value 50% 6 Growth 50% 6 Mid-cap 50% 6 Large-cap 50% 6 Small-cap 34% 6 0% 3 Preferred stocks *Percent of tightening cycles in which the sub-class outperformed the broad benchmark index, MSCI USA/Russell 3000 Indexes, based on eight tightening cycles since 1972. Performance of each index is relative to the benchmark from the first interest rate increase to 12 months afterwards.
Sources: New York Federal Reserve, Barclays, Credit Suisse, Bank of America Merrill Lynch, J.P. Morgan, MSCI, FTSE, Standard & Poor’s, Russell, NCREIF, Bloomberg, TIAA-CREF Asset Management. It is not possible to invest in an index.
Performance for indexes does not reflect investment fees or transactions costs. 3 . Impact of rising interest rates on equity markets The percentages are based on the number of cycles for which data were available. Given few cycles of available data for dividend stocks and REITs, investors should be cautious about performance expectations. Both categories could underperform as rising rates make bond investments more attractive as income sources. U.S. sector performance also varies, depending on industry leverage or link to interest rates Individual sectors within the U.S.
market experienced a range of returns during the eight cycles. The changing makeup of those sectors over time makes apples-to-apples comparisons difficult, but some trends do stand out. Historically, Financials and Utilities underperformed the S&P 500® Index in the 12 months following the first rate hike, while Industrials outperformed (Figure 4). Figure 4: U.S.
sector performance following first hike Sector Financials Average Relative Return % of Periods Outperforming* -4.1% 14% Banks -8.6% 29% Diversified Financials 2.9% 40% Insurance 0.5% 60% Utilities** -1.6% 25% Industrials 3.2% 88% *Out of eight periods since 1972 except for Financials, which is only from 1978. **Return excluding 2004: -5.8%. Performance shown is the total return for the S&P sector relative to S&P 500 Index for the 12 months following the first rate hike.
Percentage of outperforming periods represents the number of times the sector generated positive relative returns divided by total cycles. Sources: Standard & Poor’s, TIAA-CREF Asset Management. It is not possible to invest in an index.
Performance for indexes does not reflect investment fees or transactions costs. In particular, Financials outperformed only 14% of the time, with an average relative return of -4.1% versus the S&P 500. The overall underperformance was driven largely by the money center banks, with an average relative return of -8.6%. Diversified financial names fared better, while returns for insurance stocks were about even, with periods of losses offsetting most gains. Utilities (-1.6%) were slightly behind the broad market, but would have fared worse if not for an unusual 28% relative gain in the 2004 cycle.
Excluding the 2004 period, the sector averaged a -5.8% relative return. Utilities tend to carry a high debt load, making them sensitive to interest rates. Industrials, on the other hand, outperformed most of the time, averaging 3.2 percentage points higher than the index. Industrials generally benefit from periods of accelerating economic growth that often accompany rising rates. 4 .
Impact of rising interest rates on equity markets Investors may see certain equity performance trends reverse as higher yields drive money into more traditional income sources, such as government and corporate bonds. Beware: each cycle is different The caveat to studying precedent is that each cycle is unique. Thus, the course of the upcoming tightening cycle will be driven largely by the conditions preceding it: a period of extended, unprecedented stimulation. The Fed has held the federal funds rate steady at 0.00% to 0.25% since 2008 and spent over $3 trillion buying up bonds as part of its “quantitative easing” (QE) program. By holding rates near zero for such a long period, the Fed has created unique distortions, driving investors into higher-yielding investment vehicles. From 2010 to 2014, investors poured $40 billion into mutual funds and exchange traded funds (ETFs) tracking REITs and nearly $10 billion into ETFs and funds tracking utility stocks.1 Greater demand for these assets, meanwhile, contributed to soaring returns for a range of related indexes in the past few years (Figure 5).
Income-producing stocks tended to produce strong relative returns, although the Alerian MLP Index—which represents energy Master Limited Partnerships that pay out a substantial portion of cash flow as dividends— atypically produced a negative total return (-0.95%) last year, due in part to the correction in energy markets. Figure 5: Performance of higher-yielding equity assets W 2013 W 2014 35% 30 25 20 15 10 5 0 -5 S&P 500 Dividend Aristocrats® S&P 500 Utilities Index MSCI US REIT Index Alerian MLP Index Performance represents the total return for the period. S&P 500 Dividend Aristocrats is an equal-weighted index of S&P 500 companies that have increased dividends for the last 25 consecutive years. The S&P 500 Utilities Index is a market-cap-weighted index of S&P 500 companies classified as members of the Utilities sector.
The MSCI US REIT Index is a market-cap-weighted index of equity REITs. The Alerian MLP Index is a market-cap-weighted index of 50 large/mid-cap energy Master Limited Partnerships (MLPs). Sources: Standard & Poor’s, MSCI, Alerian.
It is not possible to invest in an index. Performance for indexes does not reflect investment fees or transactions costs. As credit starts to tighten and rates rise, investors may see these performance trends reverse as more competitive yields drive flows into more traditional sources of income, such as government and corporate bonds. In fact, the exodus has already started.
During the first half of 2015, investors pulled about $4 billion out of REIT funds and ETFs, and another $5 billion from utility stock funds and ETFs.2 Even before the first rate hike, higher-yielding stocks have declined. So far this year through June 30, the S&P 500 Utilities Index was down 12.3%, the MSCI US REIT Index fell 6%, the Alerian MLP Index lost 13.6%, and the S&P 500 Dividend Aristocrats Index was off 1.2%. 5 . Impact of rising interest rates on equity markets Current macroeconomic environment differs from the last cycle Economic and market conditions at the beginning of a tightening cycle matter. Similar to the start of the last cycle, core inflation is low and bond valuations are high. However, the inflation outlook is stable—not rising—and equity valuations are fair, given the recent market decline. Moreover, there has been no rate hike since June 2006. In 1994 and 2004, the first rate hike came two and a half years after the end of the previous recession. The Fed’s primary goal for the upcoming tightening cycle will be to normalize interest rates, rather than its more typical purpose of fighting inflation.
How equity markets respond to this cycle will likely depend on the following variables: WW The pace and scope of Fed tightening. We expect rate hikes to be more gradual and modest than in the past few cycles. In the 2004–2006 cycle, the Fed raised the federal funds rate 17 consecutive times—nine times and 200 basis points in the first 12 months alone.
Today, we have a lower starting rate of inflation and less robust economic growth, suggesting a slower and calmer rate cycle that should support stocks. WW Clarity of communication from the Fed. The process of working through the aftermath of the technology and housing market bubbles has in some respects encouraged the Fed to become more transparent about its intentions. Assuming improved Fed communication in future, the market is less likely to be caught off guard, resulting in less danger for stocks.
In 2004, when the Fed was starting to become more open, the stock market traded down into the hike and during the first month afterward, but then moved upward. WW Globalization’s downward pressure on U.S. rates. The health of emerging-market economies has become a bigger, more complicating factor in global capital markets as these developing nations have grown in size and influence.
More importantly, economies are connected as never before, and U.S., European Union and global financial authorities have sought to prevent contagion from individual country debt crises and market bubbles. European efforts to revive economic growth through their version of QE have limited the rise in long-term U.S. rates. Zero or negative rates in Europe have made U.S.
Treasuries attractive to global investors—despite the prospect of higher U.S. rates—and kept their yields from rising closer to levels that might be warranted by U.S. economic conditions. Indeed, China’s recent slowdown and market plunge, Germany’s historically low yields, and the Greek financial drama have influenced the 10-year U.S.
Treasury yield as much as domestic economic conditions within the U.S. To spur economic growth, many governments are depreciating their currencies or choosing not to defend them, the opposite of U.S. monetary policy. As a result, demand for the relatively higher yields available on dollar-based assets remains strong, boosting their prices and limiting the scope of rate increases.
As long as these rates are below “normal,” they will continue to artificially inflate demand for dividend-paying stocks and domestic fixed-income securities, delaying expected outflows. WW U.S. inflation prospects are benign, but wage pressure is rising. A key factor in stock markets’ reaction to higher rates is the pace of inflation.
Despite improving economic growth, inflation has remained benign. The personal consumption expenditures (PCE) index of prices has continually lagged the Fed’s annualized target rate of 2%, contributing to the Fed’s decision to delay the start of rate hikes. 6 . Impact of rising interest rates on equity markets Although inflation prospects are benign, wage growth and rising prices could trigger faster rate hikes and a potential market downturn. However, two important variables could influence the pace of Fed action: wage growth and worker productivity. Despite stubbornly slow wage growth, further tightening of labor markets could bring wage pressure and rising inflation. As long as worker productivity keeps up with rising wages, tighter labor markets should not cause trouble. If productivity lags, wage pressure could squeeze profit margins, as companies find they can’t raise prices—and so far most have been unable to do so. Wage pressure or higher prices could force rates up faster than expected, triggering a market downturn. Four considerations for investors in a rising-rate environment 1. Expect volatility during the transition to higher rates and adjust return expectations downward. Investors are likely to see higher volatility due to heightened uncertainty at this key inflection point in the cycle and should lower their return expectations from the recent bull market’s outsized gains. Despite potential volatility, we believe the stock market could post a positive real return over the 12-month period following the first rate hike. Stock valuations are about average, low inflation justifies a higher multiple and stocks remain relatively attractive versus bonds. Corporate earnings, meanwhile, may continue to grow due to the strengthening economy, but more slowly than in recent years.
The relative attractiveness of U.S. assets—based on economic growth, higher yields, and pressure on foreign currencies from governments looking to boost their own economies—suggests continued strength in the dollar. This may be a continuing drag on sales for multinational companies dependent on exports. 2. Consider increasing exposure to non-U.S.
developed markets. Overseas valuations are moderate or even below U.S. levels, and earnings growth is expected to increase in developed markets. This suggests the potential for stocks in developed markets such as Europe to outperform over the first 12 months of the cycle, as they have in the past.
The outlook for emerging markets is clouded by China’s economic slowdown and the drop in commodity prices. 3. Diversify investment income sources to avoid potential impact on high-dividend stocks. Demand for high-dividend stocks, funds and ETFs that was driven by low bond yields is likely to reverse—and asset outflows have already begun. Once rates start to climb, dividend stocks and REITs will likely be under even more pressure as investors shift back to bonds for steady income. 7 . Impact of rising interest rates on equity markets 4. Consider tactical reallocations where appropriate, but do so with care. Given few lasting patterns in stock returns and the widely variable nature of each cycle, investors should consider any tactical changes carefully. However, the following selected areas warrant further discussion: Figure 6: Selected sector expectations Sector Outlook Comment Financials Mixed Excess deposits may help bank profitability, but financial firms face stricter regulation and typically underperform Technology Likely to outperform Low debt and dollar exposure, high operating leverage; the sector benefits if companies spend high cash balances on tech to boost productivity Health Care Likely to outperform Low debt, limited dollar exposure, good secular growth prospects due in part to Obamacare and aging America Utilities Likely to underperform Typically underperforms; would do well only as extreme, defensive reaction to hikes, but scale and pace of tightening are not expected to derail equities Source: TIAA-CREF Asset Management. WW Financials are likely to be mixed. Banks have high excess deposits but may compete the advantage away in pursuit of new retail deposits. Diversified financials are benefiting from trading and mergers & acquisitions activity, but the group is likely to be less profitable.
The sector overall faces a more costly and stringent regulatory environment. WW Technology could benefit as companies begin to spend cash to improve worker productivity and offset wage pressure or lack of pricing power. WW Health Care is supported by the Affordable Care Act, and an aging U.S. population assures sustained demand. WW Most Utilities are likely to underperform. 8 . Impact of rising interest rates on equity markets Conclusions While rising interest rates typically are perceived as a negative for stock performance, outcomes are difficult to predict with precision, as historical patterns are not definitive and each cycle is different. Investors should expect results to depend on economic and market factors specific to each cycle. The environment for this next cycle suggests that real returns in the short term could be positive. Investor strategy should consider the following factors: WW The impact of higher rates often begins before the first tightening occurs, as performance and flows so far this year have already shown. WW Economic growth and a return to normalized conditions, rather than rising inflation, are triggering the upcoming tightening cycle. This suggests a slow and steady pace of rate hikes, which would be supportive of stocks, rather than more aggressive action that is typical when the Fed is seeking to combat sharply rising inflation.
Against this backdrop, equity performance is less likely to be rate-driven and more likely to reflect market valuations, earnings growth, and the rate of productivity increases. WW Even with this supportive cycle, greater uncertainty at the inflection point and the historical drag of higher rates on performance suggest investors should lower their return expectations and remain diversified. As rates normalize and distortions are unwound, high-dividend stocks, REITs and the Utilities sector will likely suffer. Technology and Health Care sectors may benefit. WW Better relative valuations and central bank support in overseas markets suggest that investors should consider non-U.S. opportunities.
Despite recent turbulence, global developed-market stocks are well positioned to continue their history of rate cycle outperformance. Emerging markets are less attractive due to the economic slowdown in China and low commodity prices. Visit us at www.tiaa-cref.org/assetmanagement for additional information about TIAA-CREF’s equity capabilities. Source: Morningstar Source: Morningstar This material should not be regarded as financial advice, or as a recommendation or an offer to buy or sell any product or service to which this information may relate. Economic and market forecasts are subject to uncertainty and may change based on varying market conditions, political and economic developments. This report is prepared by TIAA-CREF Asset Management and represents the views of Saira Malik. These views may change in response to changing economic and market conditions.
Any projections included in this material are for asset classes only, and do not reflect the experience of any product or service offered by TIAA-CREF. Past performance is not indicative of future results. The material is for informational purposes only and should not be regarded as a recommendation or an offer to buy or sell any product or service to which this information may relate.
Certain products and services may not be available to all entities or persons. Please note equity and fixedincome investing involves risk. Foreign investments are also subject to political, currency and regulatory risks. TIAA-CREF Asset Management provides investment advice and portfolio management services to the TIAA-CREF group of companies through the following entities: Teachers Advisors, Inc., TIAA-CREF Investment Management, LLC, TIAA-CREF Alternatives Advisors, LLC and Teachers Insurance and Annuity Association of America® (TIAA®). TIAA-CREF Alternatives Advisors, LLC is a registered investment adviser and wholly owned subsidiary of Teachers Insurance and Annuity Association of America (TIAA). ©2015 Teachers Insurance and Annuity Association of America-College Retirement Equities Fund (TIAA-CREF), 730 Third Avenue, New York, NY 10017. 1 2 C25594 448720_566303 (09/15) .


