


Description
This document contains forward-looking statements within the meaning of the federal securities laws. We intend these forwardlooking statements to be covered by the safe harbor provisions of the federal securities laws. In particular, any projections
regarding our future revenues, expenses, earnings, capital expenditures, effective tax rates, client trading activity, accounts or
stock price, as well as the assumptions on which such expectations are based, are forward-looking statements. These statements
reflect only our current expectations and are not guarantees of future performance or results.
These statements involve risks, uncertainties and assumptions that could cause actual results or performance to differ materially from those contained in the forward-looking statements. These risks, uncertainties and assumptions include, but are not limited to: general economic and political conditions and other securities industry risks, fluctuations in interest rates, stock market fluctuations and changes in client trading activity, credit risk with clients and counterparties, increased competition, systems failures, delays and capacity constraints, network security risks, liquidity risks, new laws and regulations affecting our business, regulatory and legal matters and uncertainties and other risk factors described in our latest Annual Report on Form 10-K, filed with the SEC on Nov. 21, 2014 and our latest Quarterly Report on Form 10-Q filed thereafter.
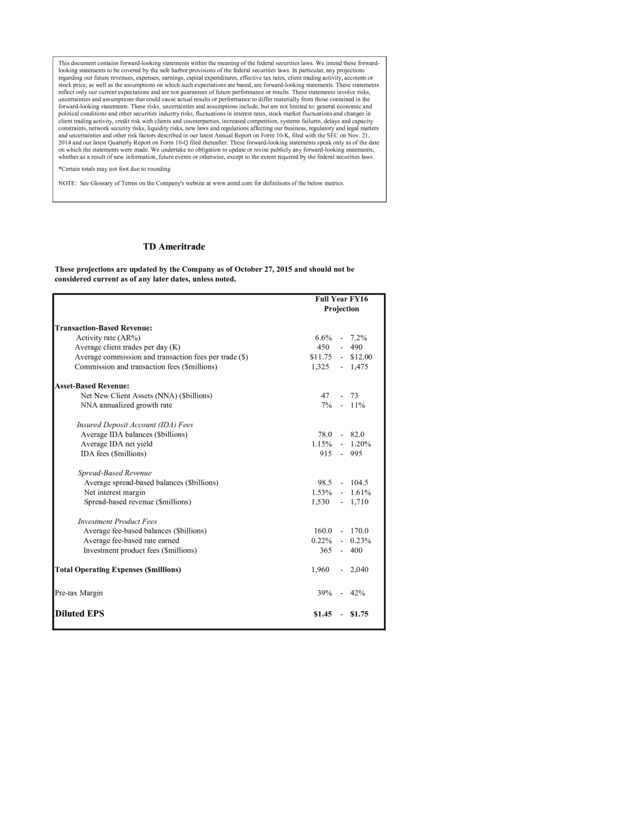
These forward-looking statements speak only as of the date on which the statements were made. We undertake no obligation to update or revise publicly any forward-looking statements, whether as a result of new information, future events or otherwise, except to the extent required by the federal securities laws. *Certain totals may not foot due to rounding NOTE: See Glossary of Terms on the Company's website at www.amtd.com for definitions of the below metrics. TD Ameritrade These projections are updated by the Company as of October 27, 2015 and should not be considered current as of any later dates, unless noted. Full Year FY16 Projection Transaction-Based Revenue: Activity rate (AR%) Average client trades per day (K) Average commission and transaction fees per trade ($) Commission and transaction fees ($millions) Asset-Based Revenue: Net New Client Assets (NNA) ($billions) NNA annualized growth rate 6.6% 450 $11.75 1,325 47 7% - 7.2% 490 $12.00 1,475 - 73 - 11% Insured Deposit Account (IDA) Fees Average IDA balances ($billions) Average IDA net yield IDA fees ($millions) 78.0 1.15% 915 - 82.0 - 1.20% - 995 Spread-Based Revenue Average spread-based balances ($billions) Net interest margin Spread-based revenue ($millions) 98.5 1.53% 1,530 - 104.5 - 1.61% - 1,710 Investment Product Fees Average fee-based balances ($billions) Average fee-based rate earned Investment product fees ($millions) 160.0 0.22% 365 - 170.0 - 0.23% - 400 1,960 - 2,040 Total Operating Expenses ($millions) Pre-tax Margin 39% - 42% Diluted EPS $1.45 - $1.75 .
These statements involve risks, uncertainties and assumptions that could cause actual results or performance to differ materially from those contained in the forward-looking statements. These risks, uncertainties and assumptions include, but are not limited to: general economic and political conditions and other securities industry risks, fluctuations in interest rates, stock market fluctuations and changes in client trading activity, credit risk with clients and counterparties, increased competition, systems failures, delays and capacity constraints, network security risks, liquidity risks, new laws and regulations affecting our business, regulatory and legal matters and uncertainties and other risk factors described in our latest Annual Report on Form 10-K, filed with the SEC on Nov. 21, 2014 and our latest Quarterly Report on Form 10-Q filed thereafter.
These forward-looking statements speak only as of the date on which the statements were made. We undertake no obligation to update or revise publicly any forward-looking statements, whether as a result of new information, future events or otherwise, except to the extent required by the federal securities laws. *Certain totals may not foot due to rounding NOTE: See Glossary of Terms on the Company's website at www.amtd.com for definitions of the below metrics. TD Ameritrade These projections are updated by the Company as of October 27, 2015 and should not be considered current as of any later dates, unless noted. Full Year FY16 Projection Transaction-Based Revenue: Activity rate (AR%) Average client trades per day (K) Average commission and transaction fees per trade ($) Commission and transaction fees ($millions) Asset-Based Revenue: Net New Client Assets (NNA) ($billions) NNA annualized growth rate 6.6% 450 $11.75 1,325 47 7% - 7.2% 490 $12.00 1,475 - 73 - 11% Insured Deposit Account (IDA) Fees Average IDA balances ($billions) Average IDA net yield IDA fees ($millions) 78.0 1.15% 915 - 82.0 - 1.20% - 995 Spread-Based Revenue Average spread-based balances ($billions) Net interest margin Spread-based revenue ($millions) 98.5 1.53% 1,530 - 104.5 - 1.61% - 1,710 Investment Product Fees Average fee-based balances ($billions) Average fee-based rate earned Investment product fees ($millions) 160.0 0.22% 365 - 170.0 - 0.23% - 400 1,960 - 2,040 Total Operating Expenses ($millions) Pre-tax Margin 39% - 42% Diluted EPS $1.45 - $1.75 .


