


Description
MORTGAGE-BACKED SECURITIES
Mortgage Market Monitor
February 2016 Remittances
. Table of Contents
Foreword ............................................................................................ 3
III. Loss Severity by City............................................................... 47
Overview ............................................................................................
7 IV. Loss Severity by Unpaid Principal Balance .......................... 49 Section A: Serious Delinquencies .....................................................
9 Section E: Servicing ......................................................................... 51 I. Serious Delinquencies as % of Unpaid Principal Balance....
10 I. Modifications.......................................................................... 52 II.
Foreclosure and REO as % of Unpaid Principal Balance ..... 12 II. Recidivism ..............................................................................
57 III. 12 months of Clean Delinquency History ............................. 17 III.
Liquidation Timeline .............................................................. 60 IV. Updated Consumer Credit Data ...........................................
21 IV. Cash Flow Velocity ................................................................. 63 Section B: Defaults ..........................................................................
24 V. Short Sales ............................................................................. 66 I.
CDR by Sector......................................................................... 25 VI. California Severity by Servicer...............................................
69 II. CDR and Serious Delinquencies by Sector ........................... 27 VII.
Advancing.............................................................................. 71 III. CDR by Delinquency Status ...................................................
32 Section F: Origination Trends ......................................................... 74 Section C: Prepayments .................................................................. 34 I.
Freddie Mac New Origination by FICO Band ....................... 75 I. Voluntary Prepayments by Sector ..........................................
35 II. Freddie Mac New Origination by DTI ................................... 77 II.
CPR Breakout by Sector ......................................................... 37 III. Freddie Mac New Origination in Limited Doc Loans...........
79 III. Voluntary Prepayments by Delinquency Status .................... 39 IV.
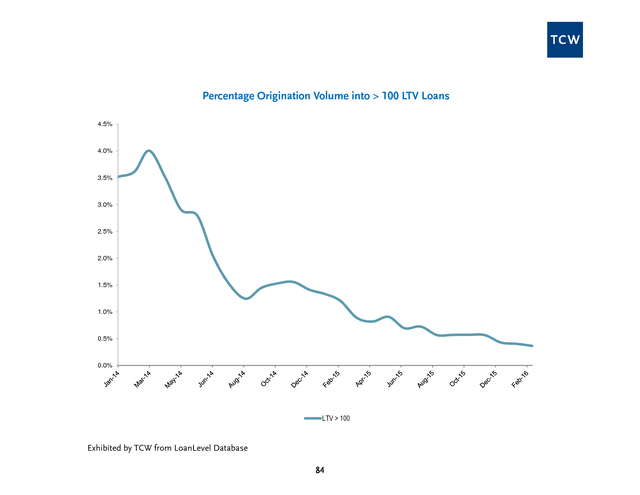
Freddie Mac New Origination in Jumbo Conforming Loans 81 Section D: Loss Severity .................................................................. 41 V. Freddie Mac New Origination in Loans with LTV > 100% ...
83 I. Loss Severity by Sector ........................................................... 42 Section G: Home Prices ..................................................................
85 II. Loss Severity by State............................................................. 44 I.
Home Price Indices ................................................................ 86 II. Case Shiller Summary ............................................................
88 1 . This publication is for general information purposes only and does not constitute an offer to sell, or a solicitation of an offer to buy, any security. Any holdings of a particular company or security discussed herein are under periodic review by the portfolio management group and are subject to change without notice. In addition, TCW manages a number of separate strategies, and portfolio managers in those strategies may have differing views or analysis with respect to a particular company, security or the economy than the views expressed herein. An investment in the strategy described herein has risks, including the risk of losing some or all of the invested capital.
Before embarking on the described investment program, an investor should carefully consider the risks and suitability of the described strategy based on their own investment objectives and financial position. Past performance is no guarantee of future results. The information contained herein may include estimates, projections and other “forward-looking statements.” Due to numerous factors, actual events may differ substantially from those presented herein. TCW assumes no duty to update any such forward-looking statements or any other information or opinions in this document.
Any information and statistical date contained herein derived from third party sources are believed to be reliable, but TCW does not represent that they are accurate, and they should not be relied on as such or be the basis for an investment decision. Copyright 2015 TCW. 2 . Foreword The Mortgage Market Monitor draws from a variety of data sources to identify market moving trends in the first lien residential mortgage market. The two main data sources are the First American CoreLogic LoanPerformance securitized loans database and the TCW Loan Level Database. The following definitions will facilitate use of this report: SECTOR The sector definition is based upon the following distinctions: • Prime: FICO > 725 and Loan to Value (LTV) < 75% and No Negative Amortization • Alt-A: FICO between 675 and 725 or FICO > 725 and LTV >= 75% and No Negative Amortization • Option Arm: Any loan that allows Negative Amortization • Subprime: FICO < 675 and No Negative Amortization SERIOUS DELINQUENCY We define a serious delinquency as a loan that is: more than 60 days delinquent; in foreclosure; in bankruptcy; or classified as real estate owned (REO). There are two different standards used in the mortgage industry to characterize a loan’s delinquency status.
The Office of Thrift Supervision (OTS) defines a loan as “past due” when the borrower fails to make a second consecutive scheduled payment. The Mortgage Bankers Association (MBA) defines a loan as “past due” when a scheduled payment is unpaid for 30 days or more. In certain situations (such as the loan due date on the first of the month and the servicer reporting date on the last day of the month) a newly delinquent borrower can be flagged as “under 30” by the OTS methodology and 30-59 days delinquent by the MBA methodology.
The MBA methodology is typically used for Prime loans and the OTS methodology is typically used for Subprime loans. In this report we use the MBA methodology for all loans, making apples to apples comparison across sectors possible. ROLL RATES Roll rates are displayed as what they imply for Serious Delinquencies, Voluntary Prepayments and Defaults. For example, if the one month roll rate (aka transition rate) for Subprime loans from Current to Current is 92% then we hold that rate static and apply it to the Subprime delinquency pipeline.
Likewise, we take the average roll rate from Current to 30 days delinquent, 30 to 30 days delinquent, 30 to Current, and all the remaining roll pairs (63 in all) to project implied Serious Delinquencies, Voluntary Prepayments and Defaults for 12 months into the future. The accuracy of these projections depends upon the assumption that the roll rates stay static over the next 12 months. We know they will not and, consequently, we take the 1 month average roll rate projection and compare it to the 3 month roll rate projection to see which way the most recent roll rates are trending. 3 .
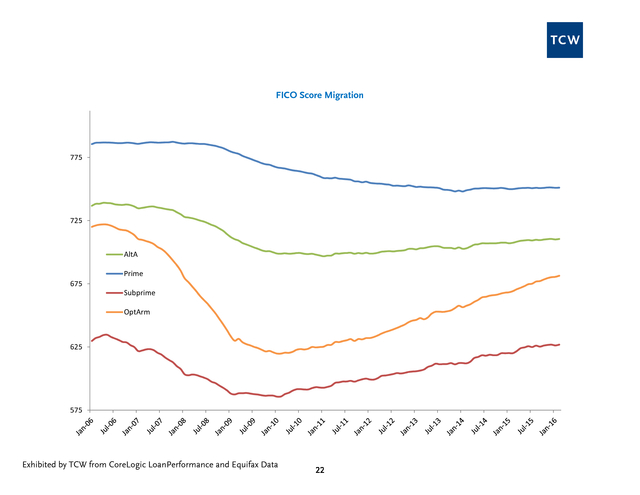
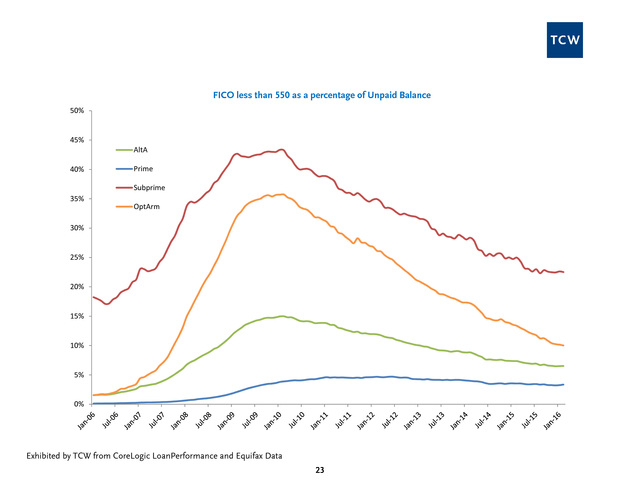
CONSUMER CREDIT INFORMATION Equifax, one of the three consumer credit companies, furnishes TCW with updated consumer credit information on all loans in our database on a monthly basis. This detailed credit information gives us a current view of the borrower’s credit profile. The Vantage score is a score that summarizes the consumer’s credit behavior, not unlike the FICO score. While FICO score distributions tend to be normal, Vantage score distributions on the same consumers have much fatter tails.
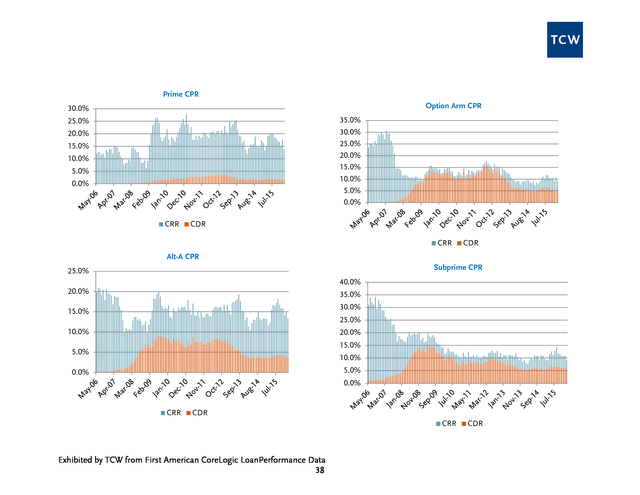
In this report we show a weighted average Vantage score by sector, and we also take advantage of the Vantage score’s strength in identifying consumer credit distress by looking at the tails. CPR Constant Prepayment Rate (CPR) is an annualization of the unscheduled monthly mortality rate of loan balance. To calculate this metric one compares the balance of loans that left the pool of loans through default or voluntary payoff to the outstanding balance of the pool of loans in the previous month. Distinguishing between loans that leave the pool with a loss and loans that leave the pool without a loss yields the Conditional Default Rate (CDR) and the Constant Rate of Reduction (CRR), respectively.
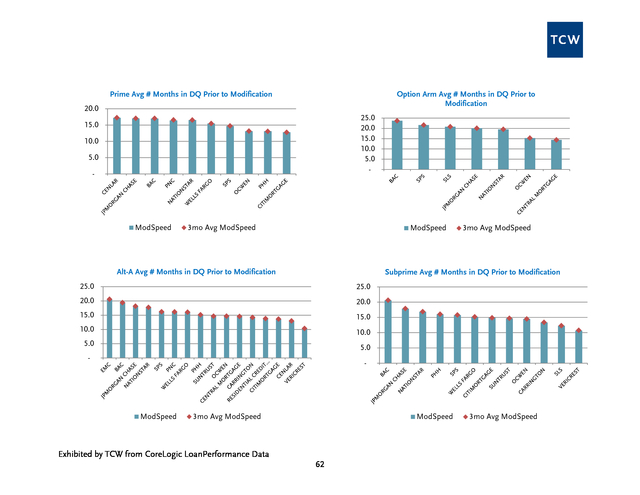
These can be viewed as the two components of CPR. LOSS SEVERITY If a loan leaves a pool of loans and experiences a loss, then it will have a loss severity. The loss severity is calculated by dividing the total loss amount by the unpaid principal balance of the loan at the time it becomes inactive. MODIFICATION A loan whose terms are changed by the servicer becomes a modified loan. Typical modifications include: rate reduction; capitalization of delinquent interest, taxes and insurance; term extension; principal forbearance; and principal forgiveness.
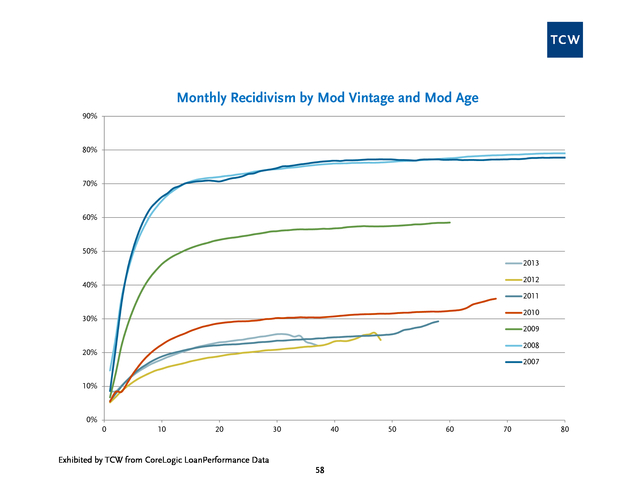
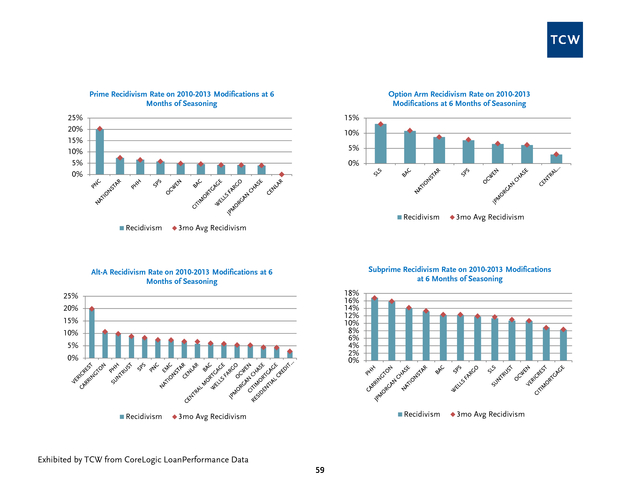
We use a proprietary algorithm to determine which loans receive capitalization modifications, principal forgiveness modifications and fixed rate loan interest rate modifications. We look to the Loanperformance modification data for information on adjustable rate mortgage interest rate modifications as well as P&I modifications. RECIDIVISM A borrower whose loan was modified and subsequently falls back into delinquency and/or liquidates is a recidivist. To eliminate noise when we track recidivism we let the modification season for six months.
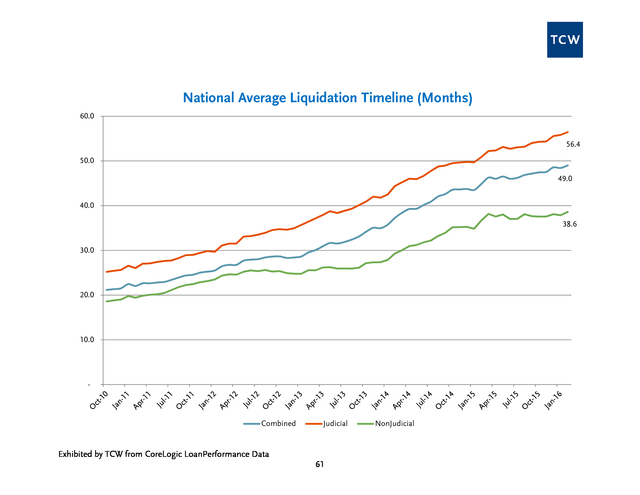
Of those seasoned modified loans we determine what percentage is now seriously delinquent. LIQUIDATION TIMELINE When a loan becomes delinquent and ultimately liquidates it can progress through three main stages: Pre-foreclosure delinquency; Foreclosure; and REO. Each of these stages lasts a number of months. The length varies substantially by geographic region and servicer.
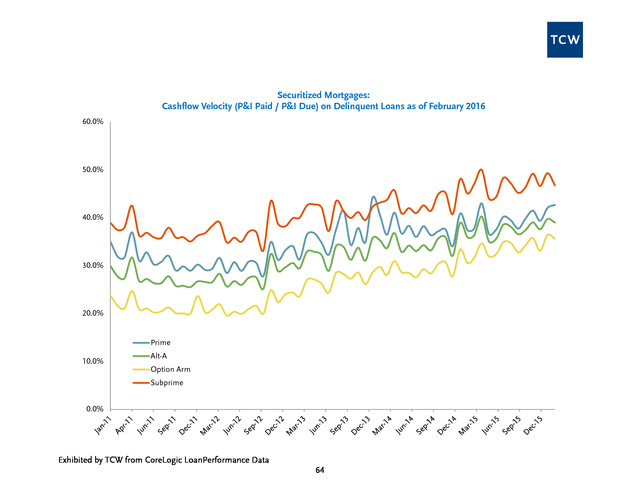
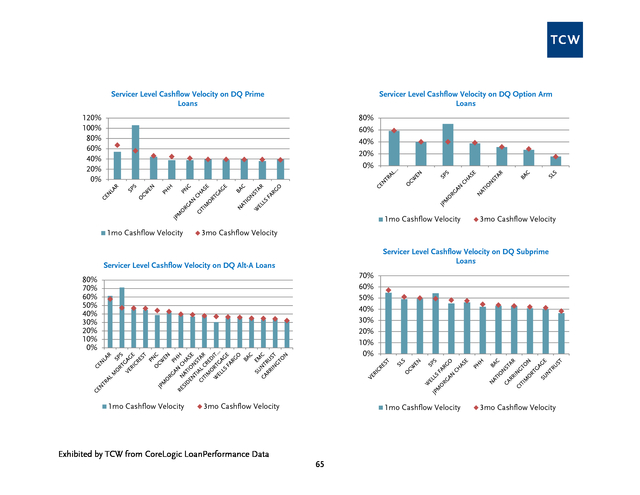
A geographic area with a longer than average timeline might require a more formal court proceeding before title can be transferred to the servicer (Judicial states); it may be an area that is experiencing capacity constraints in recording offices, or attorney networks; there may be an abundant supply of homes on the market making it difficult to sell an REO; or the servicer may be understaffed and unable to attend to the various liquidation requirements of a loan in a timely 4 . manner. This report shows how servicers perform relative to one another in timeline management in California. We focus on one state to eliminate the noise produced by these dynamics across states. CASH FLOW VELOCITY This metric is used to track a servicer’s ability to get payments from borrowers that are currently delinquent. It is defined as Total Principal and Interest (P&I) paid by delinquent borrowers divided by Total Principal and Interest due from delinquent borrowers.
For example, assume there are two borrowers being serviced by a servicer who are 60-89 days delinquent and both borrowers have P&I payments of $1,500. A servicer with the right calling campaign and incentive structure for its loss mitigators may be able to get one of the two borrowers to pay $1,500 despite having already missed two payments. This borrower would remain 60-89 days delinquent while the remaining borrower would roll into 90-119 days delinquent.
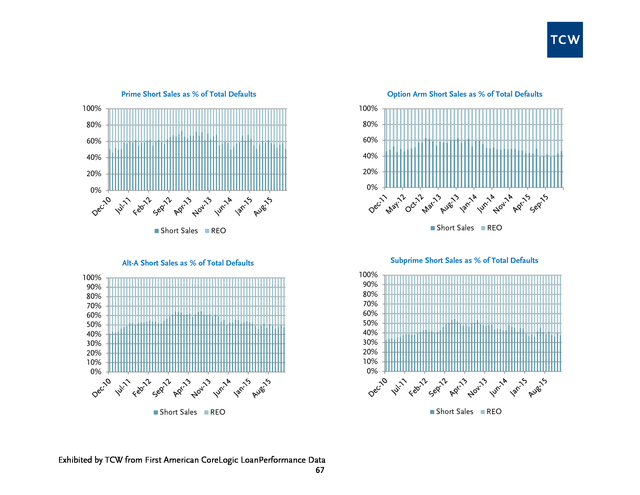
The cash flow velocity for the month in this situation would be $1,500 / ($1,500 + $1,500) = 50%. The higher the cash flow velocity the more adept the servicer is when dealing with delinquent borrowers. SHORT SALE In this report we define “Short Sale” as any loan that liquidates with a loss but never reaches the REO status. Short sales typically have lower severities compared to REO sales.
Those servicers that successfully implement a short sale focused liquidation strategy relative to other servicers will likely have lower severities. ADVANCING When a borrower misses a mortgage payment on a first lien mortgage the servicing contract obligates the servicer to make the interest and principal payment for the borrower. This is called “advancing.” The servicer advances the mortgage payment to the certificate holders, expecting to be repaid at some point in the future. The reimbursement requirement is fulfilled through collection of liquidation proceeds, late collections, and/or insurance proceeds from the loan that has been advanced upon.
If the servicer believes that the advance is not recoverable, it is freed from the contractual obligation to advance on the loan. Assuming the decision to stop advancing is legitimate; investors can gain insight into a servicer’s opinion on future severities of loans on which it has stopped advancing. However, since the determination that advances will not be recoverable is largely subjective, opportunity exists for servicers to save money (funding costs on advances). SERVICING The impact of servicing on a bond’s IRR is difficult to measure.
The two main contributors to this difficulty are: approximately one third of securitized non-agency mortgages are serviced by more than one servicer; and recent industry consolidation in the servicing industry makes it difficult to identify the current servicing platform/management team responsible for a bond. These two difficulties are avoided at TCW by calculating bond level servicing performance. That is, the servicing level metrics displayed in this report are calculated at the bond level for all RMBS securities, thereby removing the uncertainties described above.
This bond level analysis is supplemented by a broad, quantitative based opinion formed on servicers in the industry. Factors influencing the rankings from highest weighted to lowest weighted include: Modifications as of 2010, Recidivism, Cash Flow Velocity, Liquidation Timelines, and Modification Timeline, with weights of 40%, 20%, 15%, 15%, and 10%, respectively. While we arrived at these weightings through scenario analysis, they are more last cash flow friendly and front pay unfriendly. 5 . HOME PRICES Various home price indices have been constructed to gauge the change in home prices over time. In this report we focus on the Case Shiller 10 city aggregate, and the FHFA Purchase only indices. Additionally, we include the Case Shiller futures contracts that trade on the CME to get the market’s perspective on where home prices are heading in the next few years. The index values are all normalized to facilitate an apples-to-apples comparison across indices. DTI Debt-to-income Ratio.
We track the debt-to-income ratio at origination for Freddie Mac loans at the loan level. The debt-to-income ratio “indicates the sum of the borrower’s monthly debt payments, including monthly housing expenses, divided by the total monthly income used to qualify the borrower, expressed as a percentage… This disclosure is subject to the widely varying standards originators use to verify borrowers assets and liabilities.” 6 . Market Update Similar to other risk assets, Non-Agency RMBS began the month in a difficult landscape as the same concerns that weighed on the market in January, mainly those over oil and China, carried over to February. However, that did not stop one of the GSEs from putting out a bid list early in the month, which consisted of eight bonds totaling 365mm and traded in line with expectations. Altogether, the first week saw a decent amount of supply that reached almost 2bn, though precise color was limited and the number of line items not trading was high. Over the course of the second week, heightened macro volatility and weakness dampened the motivation of accounts to sell, leading to the cancellation of several bid lists and a drop in total volume to under 1.6bn.
Bonds that were kept by sellers continued to disproportionately outnumber those that traded due to a combination of wider bid-ask spreads and lower levels of participation on lists. While subdued volumes persisted the following week, partly the result of a holiday, sentiment began to shift as broader markets rebounded. Stocks and oil bounced from two year and twelve year lows, respectively.
Even though nonagency spreads didn’t necessarily tighten in sympathy, the overall tone felt better. As February month-end and the annual ABS conference (Feb 28 Mar 2) approached, it seemed like accounts were trying to take advantage of the improved environment and fit in as much selling as they could over the last full week. The 2.3bn in supply, which included a 496mm GSE list consisting of seasoned subprime and Alt-A collateral, was the largest weekly amount tallied so far this year and capped off February with a total of 7.2bn. February was supposed to be the month in which the long awaited 8.5bn Countrywide settlement would finally be paid.
However, instead of receiving a payout, investors were left with disappointment as Bank of New York Mellon (trustee of the 530 deals included in the settlement) filed a petition on February 5 to the NY state court for judicial instruction regarding the distribution waterfall. There are varying opinions on the interpretation of the pooling and servicing agreement (PSA) that would affect investors differently depending on their placement in the capital structure. As a result, the trustee is seeking clarification on the proper distribution procedure for paying bondholders.
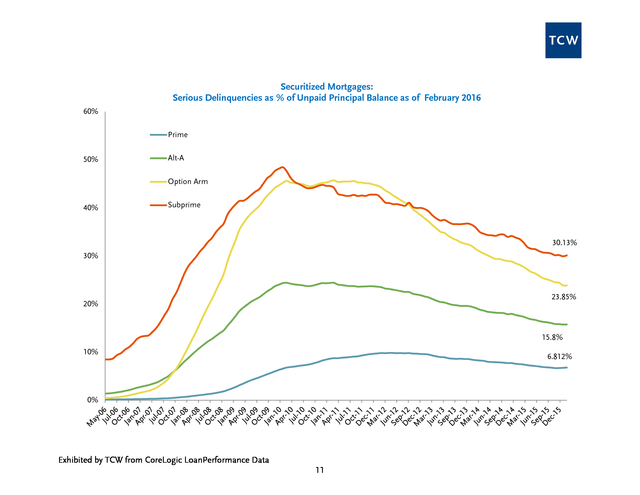
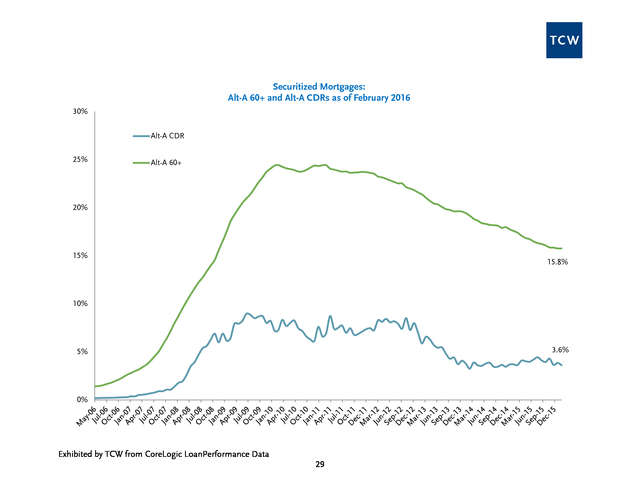
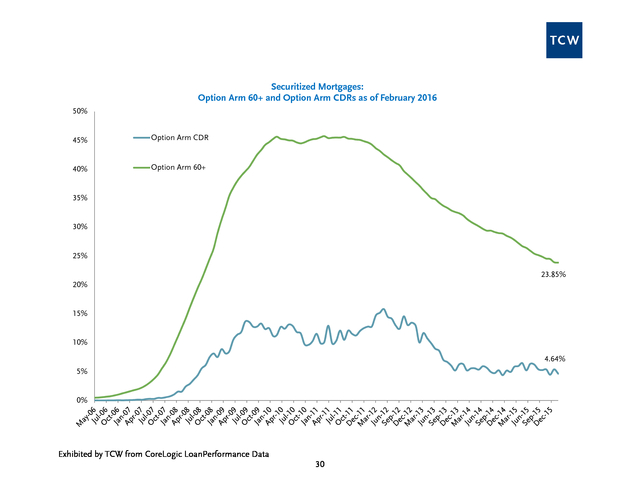
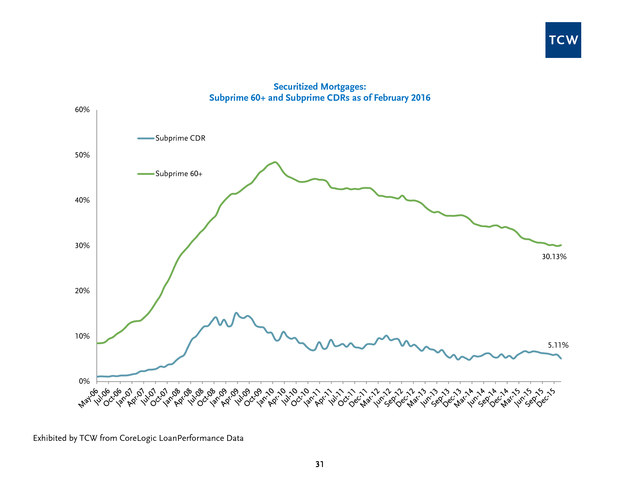
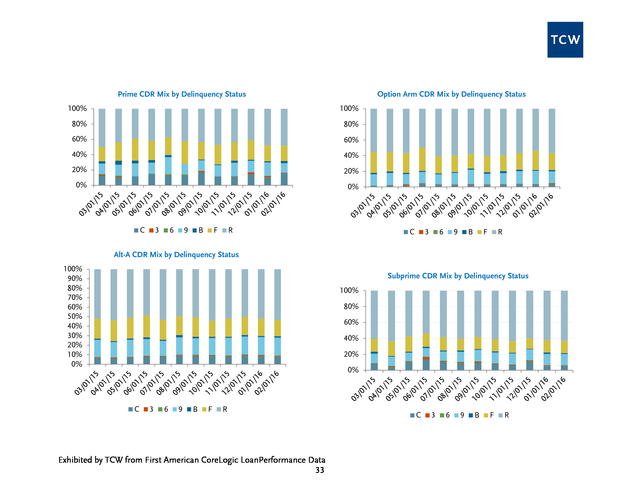
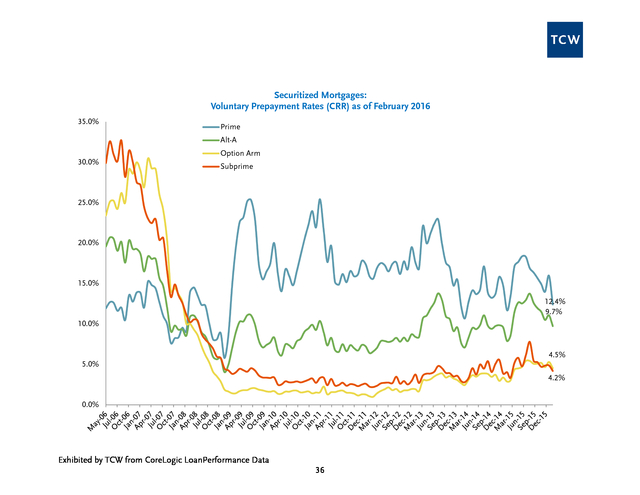
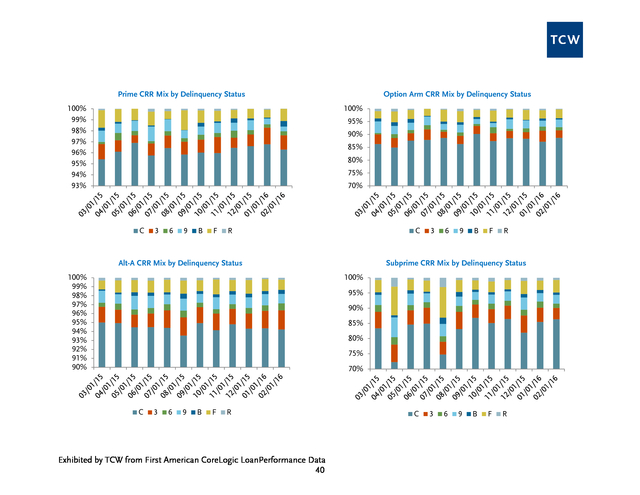
Meanwhile, with the final payment date delayed and uncertain, the 8.5bn settlement has been deposited into an escrow account where investment proceeds will also be allocated to bondholders. In risk sharing, Fannie Mae priced its first deal of the year on February 10, 945mm CAS 2016-C01, which also debuted first loss B tranches. The transaction was downsized from an initial size of 949.5mm and priced wider than guidance - 195dm, 675dm and 1175dm for 1M1, 1M2, and 1B, respectively, and 210dm and 695dm for higher LTV 2M1 and 2M2, respectively (2B was rescinded due to lack of support and interest). Collateral Performance 7 . Changes in serious delinquencies were mixed in February. Prime delinquencies increased by 6 basis points to 6.81%; Alt-A delinquencies increased by 1 basis point to 15.77%; Option Arm delinquencies decreased by 6 basis points to 23.85% and Subprime delinquencies increased by 19 basis points to 30.13%. Roll rates from current status to delinquency are holding stable near sector- level long-term averages. Voluntary prepayments decreased across all sectors this month. Prime CRRs came in at 12.4%, down 356 basis points month-over-month; Alt-A CRRs were 9.7%, down 134 basis points month-over-month; Option Arm CRRs were 4.5%, down 77 basis points month-over-month and Subprime CRRs were 4.2%, down 68 basis points month-over-month.
CDRs also decreased across all sectors. Prime CDRs decreased by 37 basis points to 1.39%; Alt-A CDRs decreased by 25 basis points to 3.61%; Option Arm CDRs decreased by 75 basis points to 4.64% and Subprime CDRs decreased by 86 basis points to 5.11%. Case-Shiller futures continue to reflect a broad recovery in home prices, predicting home prices will rise three percent annually during the next four to five years. Year-over-year, home prices are up 5.4% across Case-Shiller’s 20 major city index.
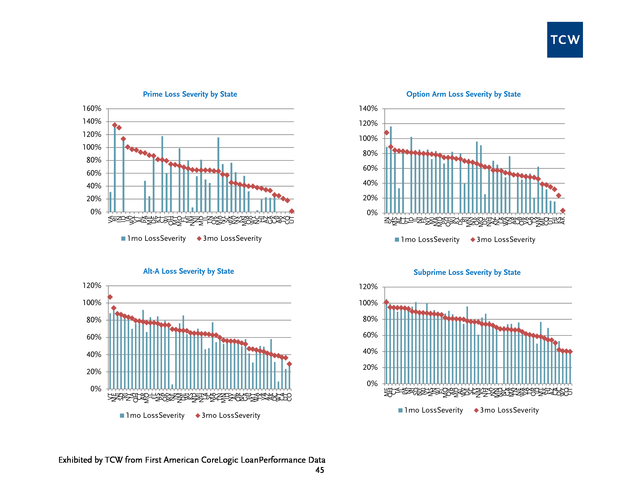
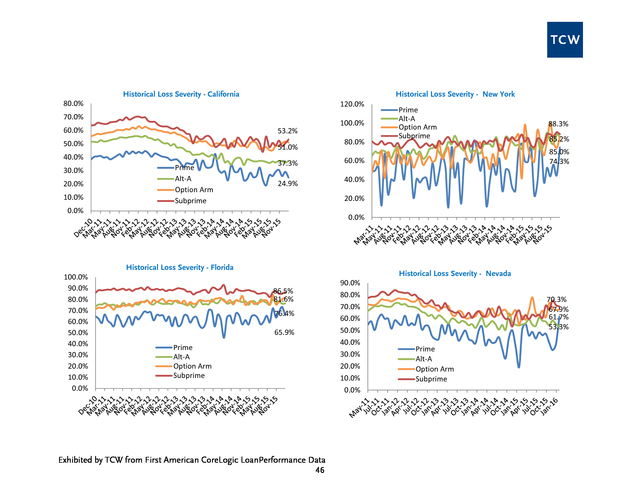
At the national level, changes in severities were mixed again. At the state level, California Subprime severities increased to 53% this month. Florida Subprime severities increased to 87%.
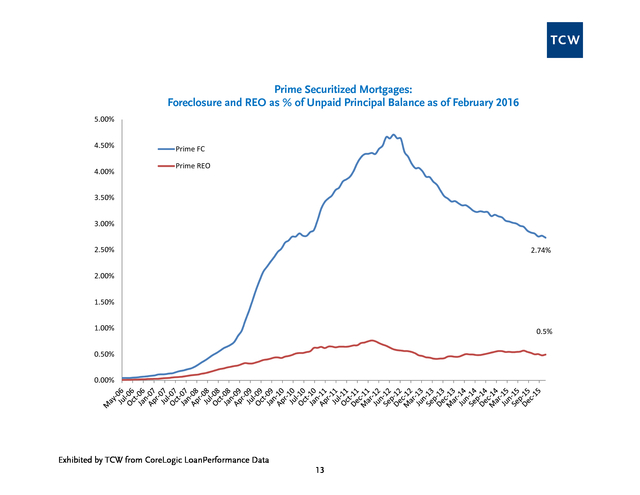
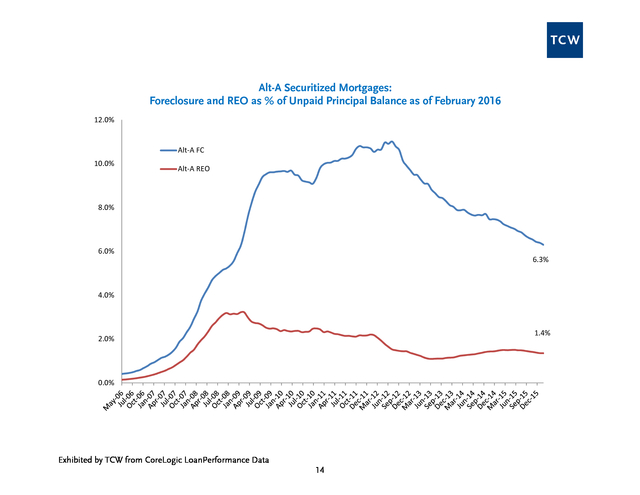
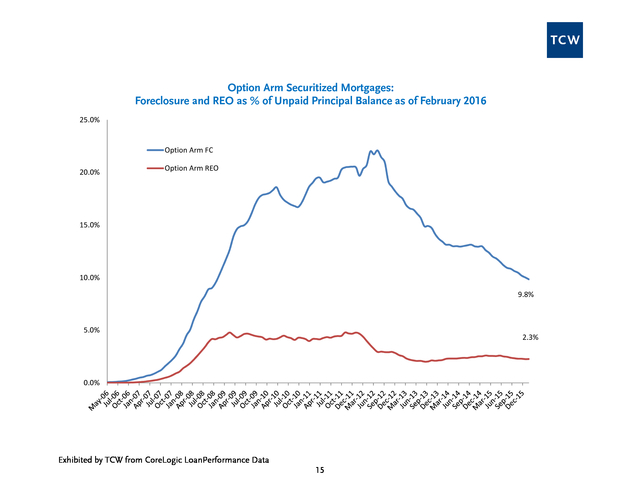
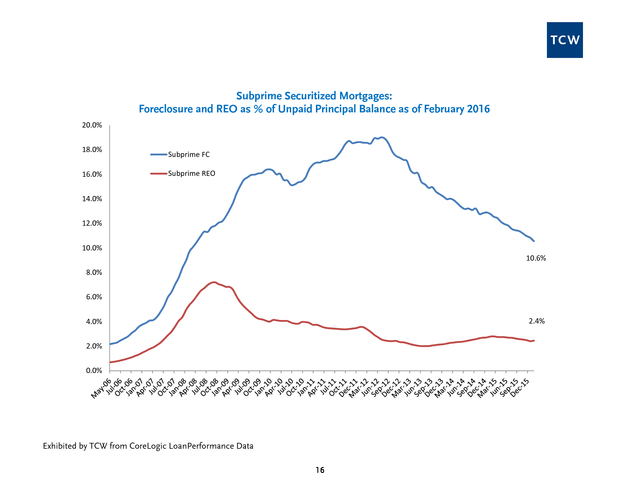
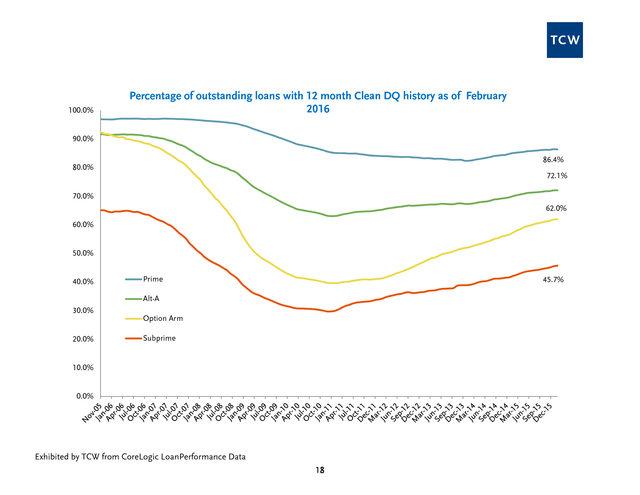
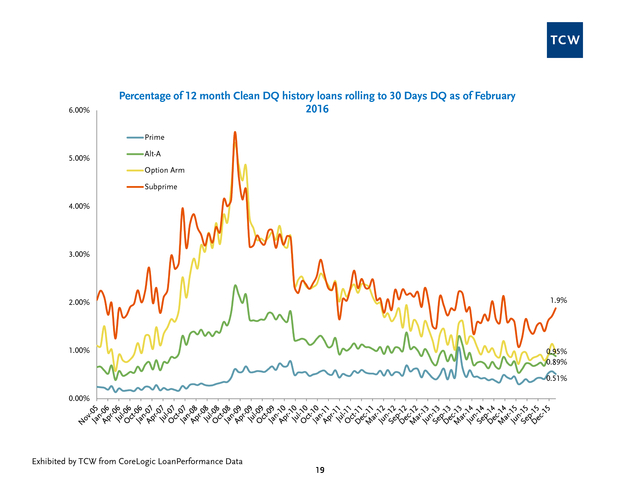
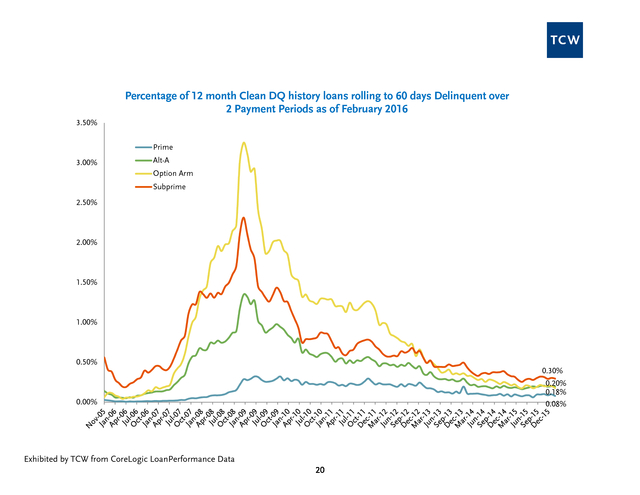
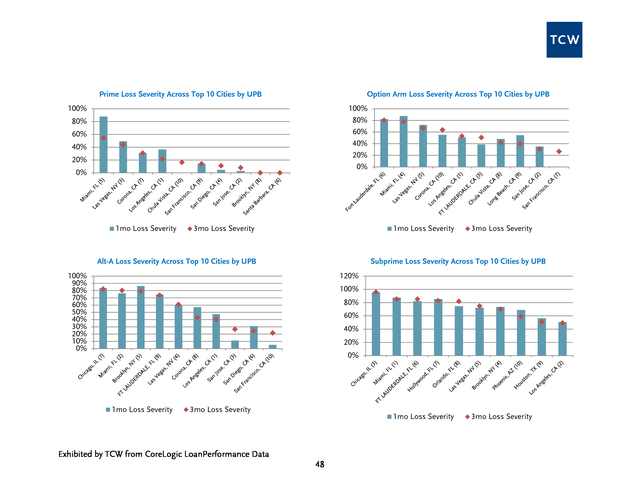
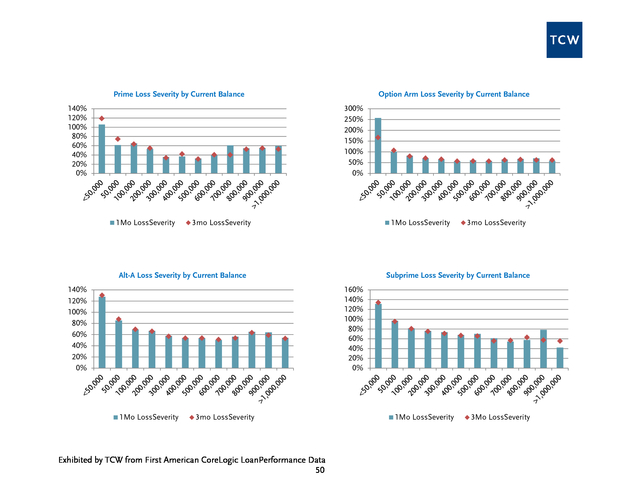
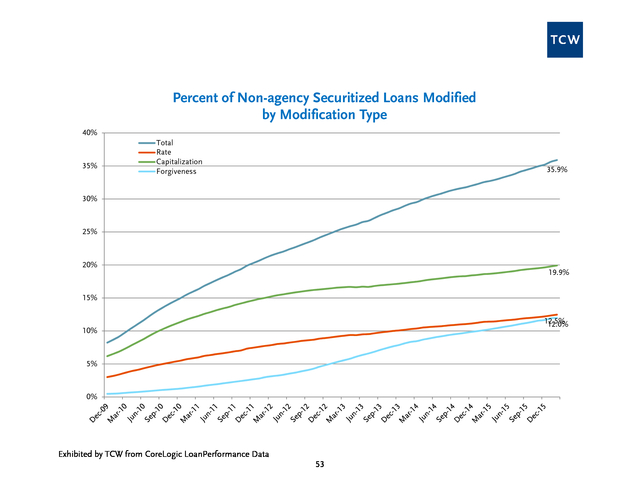
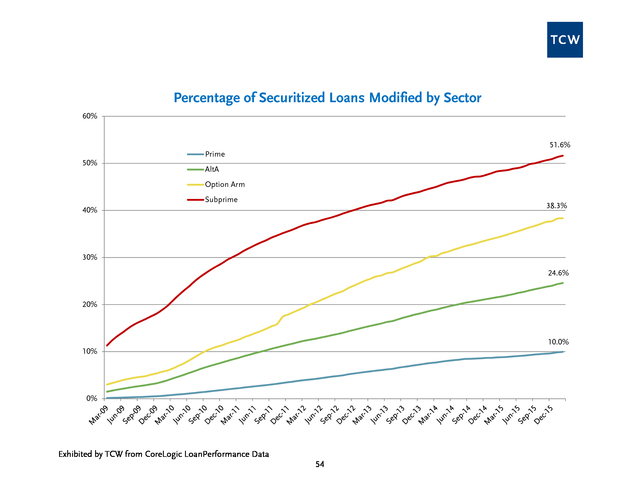
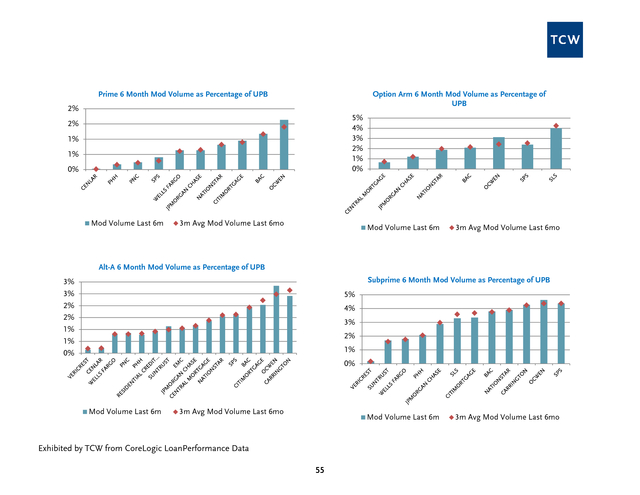
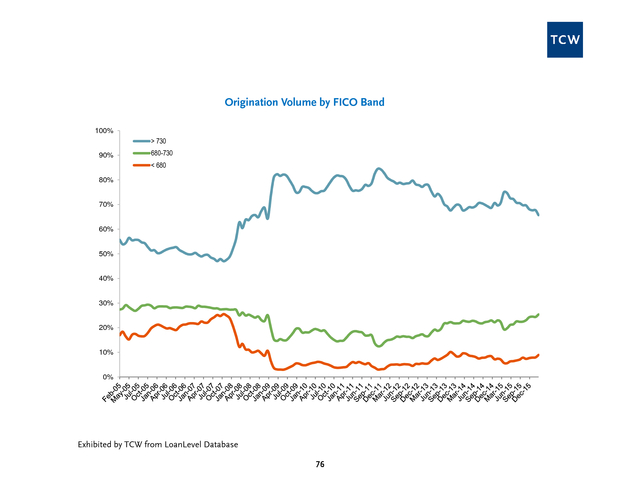
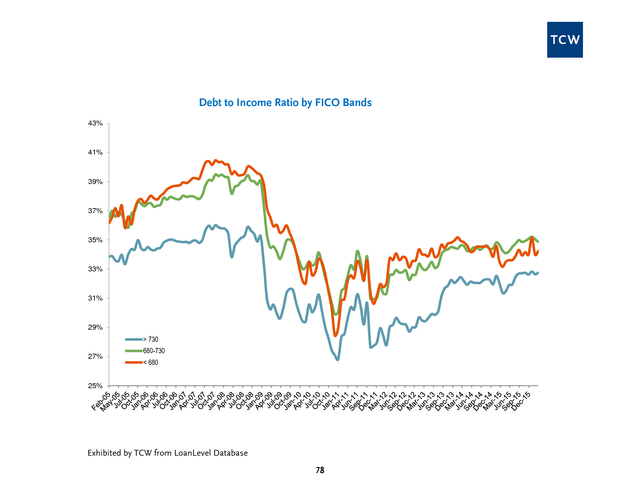
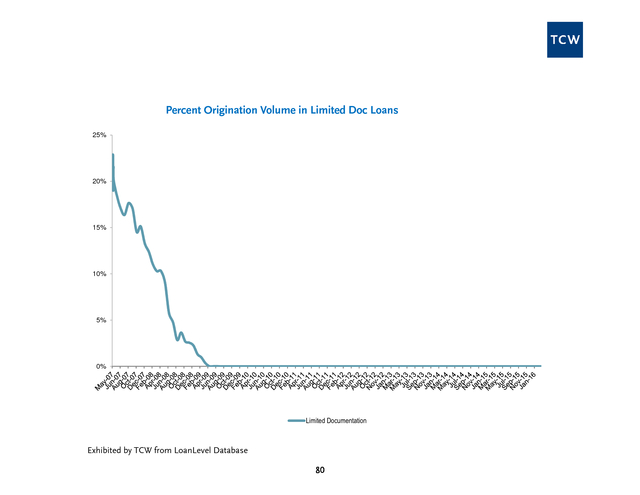
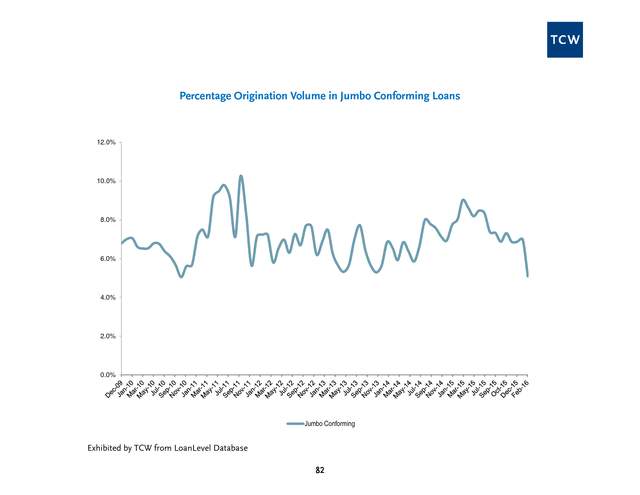
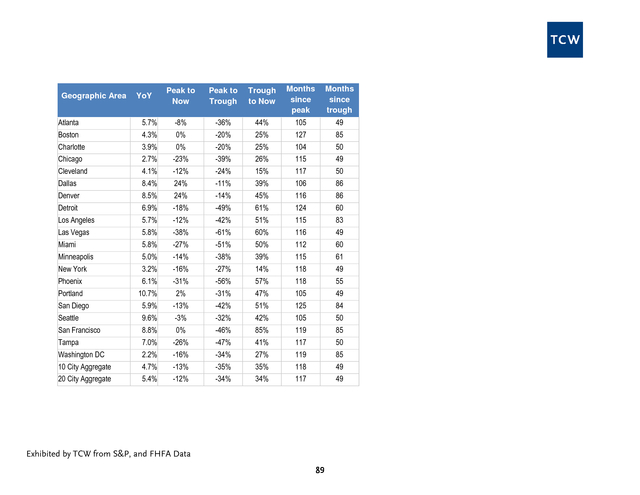
New York Subprime severities decreased to 88%; and Nevada Subprime severities decreased to 70%. 8 . Section A: Serious Delinquencies 9 . I. Serious Delinquencies as % of Unpaid Principal Balance 10 . Securitized Mortgages: Serious Delinquencies as % of Unpaid Principal Balance as of February 2016 60% Prime 50% Alt-A Option Arm 40% Subprime 30.13% 30% 23.85% 20% 15.8% 10% 6.812% 0% Exhibited by TCW from CoreLogic LoanPerformance Data 11 . II. Foreclosure and REO as % of Unpaid Principal Balance Exhibited by TCW from CoreLogic LoanPerformance Data 12 . Prime Securitized Mortgages: Foreclosure and REO as % of Unpaid Principal Balance as of February 2016 5.00% 4.50% 4.00% Prime FC Prime REO 3.50% 3.00% 2.50% 2.74% 2.00% 1.50% 1.00% 0.5% 0.50% 0.00% Exhibited by TCW from CoreLogic LoanPerformance Data 13 . Alt-A Securitized Mortgages: Foreclosure and REO as % of Unpaid Principal Balance as of February 2016 12.0% Alt-A FC 10.0% Alt-A REO 8.0% 6.0% 6.3% 4.0% 1.4% 2.0% 0.0% Exhibited by TCW from CoreLogic LoanPerformance Data 14 . Option Arm Securitized Mortgages: Foreclosure and REO as % of Unpaid Principal Balance as of February 2016 25.0% Option Arm FC 20.0% Option Arm REO 15.0% 10.0% 9.8% 5.0% 2.3% 0.0% Exhibited by TCW from CoreLogic LoanPerformance Data 15 . Subprime Securitized Mortgages: Foreclosure and REO as % of Unpaid Principal Balance as of February 2016 20.0% 18.0% 16.0% Subprime FC Subprime REO 14.0% 12.0% 10.0% 10.6% 8.0% 6.0% 2.4% 4.0% 2.0% 0.0% Exhibited by TCW from CoreLogic LoanPerformance Data 16 . III. 12 months of Clean Delinquency History 17 . 100.0% Percentage of outstanding loans with 12 month Clean DQ history as of February 2016 90.0% 86.4% 80.0% 72.1% 70.0% 62.0% 60.0% 50.0% 40.0% Prime 45.7% Alt-A 30.0% 20.0% Option Arm Subprime 10.0% 0.0% Exhibited by TCW from CoreLogic LoanPerformance Data 18 . 6.00% Percentage of 12 month Clean DQ history loans rolling to 30 Days DQ as of February 2016 Prime 5.00% Alt-A Option Arm Subprime 4.00% 3.00% 2.00% 1.9% 1.00% 0.95% 0.89% 0.51% 0.00% Exhibited by TCW from CoreLogic LoanPerformance Data 19 . Percentage of 12 month Clean DQ history loans rolling to 60 days Delinquent over 2 Payment Periods as of February 2016 3.50% Prime 3.00% Alt-A Option Arm Subprime 2.50% 2.00% 1.50% 1.00% 0.50% 0.30% 0.20% 0.18% 0.08% 0.00% Exhibited by TCW from CoreLogic LoanPerformance Data 20 . IV. Updated Consumer Credit Data 21 . FICO Score Migration 775 725 AltA Prime 675 Subprime OptArm 625 575 Exhibited by TCW from CoreLogic LoanPerformance and Equifax Data 22 . FICO less than 550 as a percentage of Unpaid Balance 50% 45% AltA 40% Prime Subprime 35% OptArm 30% 25% 20% 15% 10% 5% 0% Exhibited by TCW from CoreLogic LoanPerformance and Equifax Data 23 . Section B: Defaults 24 . I. CDR by Sector 25 . Securitized Mortgages: Default Rates (CDR) as of February 2016 18% 16% Prime AltA 14% OptArm 12% Subprime 10% 8% 6% 5.11% 4.64% 4% 3.6% 1.39% 2% 0% Exhibited by TCW from First American CoreLogic LoanPerformance Data 26 . II. CDR and Serious Delinquencies by Sector 27 . Securitized Mortgages: Prime 60+ and Prime CDRs as of February 2016 12% Prime CDR 10% Prime 60+ 8% 6.812% 6% 4% 1.39% 2% 0% Exhibited by TCW from CoreLogic LoanPerformance Data 28 . Securitized Mortgages: Alt-A 60+ and Alt-A CDRs as of February 2016 30% Alt-A CDR 25% Alt-A 60+ 20% 15% 15.8% 10% 3.6% 5% 0% Exhibited by TCW from CoreLogic LoanPerformance Data 29 . Securitized Mortgages: Option Arm 60+ and Option Arm CDRs as of February 2016 50% 45% Option Arm CDR 40% Option Arm 60+ 35% 30% 25% 23.85% 20% 15% 10% 4.64% 5% 0% Exhibited by TCW from CoreLogic LoanPerformance Data 30 . Securitized Mortgages: Subprime 60+ and Subprime CDRs as of February 2016 60% Subprime CDR 50% Subprime 60+ 40% 30% 30.13% 20% 10% 5.11% 0% Exhibited by TCW from CoreLogic LoanPerformance Data 31 . III. CDR by Delinquency Status 32 . Prime CDR Mix by Delinquency Status Option Arm CDR Mix by Delinquency Status 100% 100% 80% 80% 60% 60% 40% 40% 20% 20% 0% 0% C 3 6 9 B F R C 3 6 9 B F R Alt-A CDR Mix by Delinquency Status 100% 90% 80% 70% 60% 50% 40% 30% 20% 10% 0% Subprime CDR Mix by Delinquency Status 100% 80% 60% 40% 20% 0% C 3 6 9 B F R Exhibited by TCW from First American CoreLogic LoanPerformance Data 33 C 3 6 9 B F R . Section C: Prepayments 34 . I. Voluntary Prepayments by Sector 35 . Securitized Mortgages: Voluntary Prepayment Rates (CRR) as of February 2016 35.0% Prime Alt-A Option Arm 30.0% Subprime 25.0% 20.0% 15.0% 12.4% 9.7% 10.0% 4.5% 5.0% 4.2% 0.0% Exhibited by TCW from CoreLogic LoanPerformance Data 36 . II. CPR Breakout by Sector 37 . Prime CPR Option Arm CPR 30.0% 35.0% 30.0% 25.0% 20.0% 15.0% 10.0% 5.0% 0.0% 25.0% 20.0% 15.0% 10.0% 5.0% 0.0% CRR CDR CRR CDR Alt-A CPR Subprime CPR 25.0% 40.0% 20.0% 35.0% 30.0% 15.0% 25.0% 10.0% 20.0% 15.0% 5.0% 10.0% 5.0% 0.0% 0.0% CRR CDR CRR Exhibited by TCW from First American CoreLogic LoanPerformance Data 38 CDR . III. Voluntary Prepayments by Delinquency Status 39 . Prime CRR Mix by Delinquency Status 100% 99% 98% 97% 96% 95% 94% 93% Option Arm CRR Mix by Delinquency Status 100% 95% 90% 85% 80% 75% 70% C 3 6 9 B F R C Alt-A CRR Mix by Delinquency Status 3 6 9 B F R Subprime CRR Mix by Delinquency Status 100% 100% 99% 98% 97% 96% 95% 94% 93% 92% 91% 90% 95% 90% 85% 80% 75% 70% C 3 6 9 B F R Exhibited by TCW from First American CoreLogic LoanPerformance Data 40 C 3 6 9 B F R . Section D: Loss Severity 41 . I. Loss Severity by Sector 42 . Historical Loss Severity By Sector 90.0% 80.0% 70.0% 78.6% Prime Alt-A Option Arm Subprime 66.3% 61.5% 60.0% 50.0% 48.6% 40.0% 30.0% 20.0% 10.0% 0.0% Exhibited by TCW from CoreLogic LoanPerformance Data 43 . II. Loss Severity by State 44 . Prime Loss Severity by State Option Arm Loss Severity by State 160% 140% 140% 120% 120% 100% 100% 80% 80% 60% 60% 20% 20% 0% 0% 1mo LossSeverity 3mo LossSeverity IN SC MS AL CT VT ID IL NJ FL NY MI MA MD PA OH WI KY DC RI MN NV OK MO DE NH AZ NC LA WA TN AR CA OR VA GA TX NM ME CO UT HI KS AK 40% VA RI IN ID IA WV VT AL PA ME DE KY CT WI OH MT MO FL MI NM NJ MD IL TN OK MA NY SC WA NV KS MN OR WY NC HI AZ GA CA AR TX CO UT 40% 1mo LossSeverity Alt-A Loss Severity by State 3mo LossSeverity Subprime Loss Severity by State 120% 120% 100% 100% 80% 80% 60% 60% 40% 40% 0% VT ME NJ SD RI NY IA OH CT AR MO IL FL MS PA OK WV NE IN NM DE WI KS MD MI NH LA SC MA KY TN MN ID NV AL OR NC GA HI MT WA TX VA AZ AK DC WY CA UT CO 0% 1mo LossSeverity 3mo LossSeverity Exhibited by TCW from First American CoreLogic LoanPerformance Data 45 ME OH CT IA IL PA NJ RI SD NY MI VT MS IN WI FL MO OK AR MD AL WV DE SC KY NM KS NH LA NV MN ND NC GA MA TN NE WA VA TX OR ID MT AK HI AZ CA DC WY CO UT 20% 20% 1mo LossSeverity 3mo LossSeverity . Historical Loss Severity - California Historical Loss Severity - New York 80.0% 120.0% 70.0% 100.0% 60.0% 53.2% 50.0% 51.0% 40.0% 30.0% 20.0% 10.0% Prime Alt-A Option Arm Subprime 80.0% 37.3% 85.2% 40.0% 20.0% 0.0% 0.0% Historical Loss Severity - Florida 100.0% 90.0% 80.0% 70.0% 60.0% 50.0% 40.0% 30.0% 20.0% 10.0% 0.0% 88.3% 85.0% 74.3% 60.0% 24.9% Prime Alt-A Option Arm Subprime Historical Loss Severity - Nevada 86.5% 81.6% 76.4% 65.9% Prime Alt-A Option Arm Subprime Exhibited by TCW from First American CoreLogic LoanPerformance Data 46 90.0% 80.0% 70.0% 60.0% 50.0% 40.0% 30.0% 20.0% 10.0% 0.0% 70.3% 67.9% 61.7% 53.3% Prime Alt-A Option Arm Subprime . III. Loss Severity by City 47 . Prime Loss Severity Across Top 10 Cities by UPB Option Arm Loss Severity Across Top 10 Cities by UPB 100% 80% 60% 40% 20% 0% 100% 80% 60% 40% 20% 0% 1mo Loss Severity 3mo Loss Severity 1mo Loss Severity Alt-A Loss Severity Across Top 10 Cities by UPB 3mo Loss Severity Subprime Loss Severity Across Top 10 Cities by UPB 120% 100% 90% 80% 70% 60% 50% 40% 30% 20% 10% 0% 100% 80% 60% 40% 20% 0% 1mo Loss Severity 3mo Loss Severity 1mo Loss Severity Exhibited by TCW from CoreLogic LoanPerformance Data 48 3mo Loss Severity . IV. Loss Severity by Unpaid Principal Balance 49 . Prime Loss Severity by Current Balance 140% 120% 100% 80% 60% 40% 20% 0% Option Arm Loss Severity by Current Balance 300% 250% 200% 150% 100% 50% 0% 1Mo LossSeverity 3mo LossSeverity 1Mo LossSeverity Alt-A Loss Severity by Current Balance 3mo LossSeverity Subprime Loss Severity by Current Balance 160% 140% 120% 100% 80% 60% 40% 20% 0% 140% 120% 100% 80% 60% 40% 20% 0% 1Mo LossSeverity 3mo LossSeverity Exhibited by TCW from First American CoreLogic LoanPerformance Data 50 1Mo LossSeverity 3Mo LossSeverity . Section E: Servicing 51 . I. Modifications 52 . Percent of Non-agency Securitized Loans Modified by Modification Type 40% 35% Total Rate Capitalization Forgiveness 35.9% 30% 25% 20% 19.9% 15% 12.5% 12.0% 10% 5% 0% Exhibited by TCW from CoreLogic LoanPerformance Data 53 . Percentage of Securitized Loans Modified by Sector 60% 51.6% Prime 50% AltA Option Arm Subprime 38.3% 40% 30% 24.6% 20% 10.0% 10% 0% Exhibited by TCW from CoreLogic LoanPerformance Data 54 . Prime 6 Month Mod Volume as Percentage of UPB Option Arm 6 Month Mod Volume as Percentage of UPB 2% 5% 4% 3% 2% 1% 0% 2% 1% 1% 0% Mod Volume Last 6m 3m Avg Mod Volume Last 6mo Mod Volume Last 6m 3m Avg Mod Volume Last 6mo Alt-A 6 Month Mod Volume as Percentage of UPB Subprime 6 Month Mod Volume as Percentage of UPB 3% 3% 2% 2% 1% 1% 0% 5% 4% 3% 2% 1% 0% Mod Volume Last 6m 3m Avg Mod Volume Last 6mo Mod Volume Last 6m Exhibited by TCW from CoreLogic LoanPerformance Data 55 3m Avg Mod Volume Last 6mo . Prime 2010-2013 Cumulative Modifications as a Percentage of UPB Option Arm 2010-2013 Cumulative Modificaations as a Percentage of UPB 12% 10% 8% 6% 4% 2% 0% 30.0% 25.0% 20.0% 15.0% 10.0% 5.0% 0.0% 2010+ Mod pct 2010+ Mod pct 3mo Avg 2010+ Mod Pct 3mo Avg 2010+ Mod Pct Alt-A 2010-2013 Cumumulative Modifications as a Percentage of UPB Subprime 2010-2013 Cumulative Modifications as a Percentage of UPB 30.0% 25.0% 20.0% 15.0% 10.0% 5.0% 0.0% 40.0% 30.0% 20.0% 10.0% 0.0% 2010+ Mod pct 2010+ Mod pct 3mo Avg 2010+ Mod Pct Exhibited by TCW from CoreLogic LoanPerformance Data 56 3mo Avg 2010+ Mod Pct . II. Recidivism 57 . Monthly Recidivism by Mod Vintage and Mod Age 90% 80% 70% 60% 50% 2013 2012 40% 2011 2010 30% 2009 2008 20% 2007 10% 0% 0 10 20 30 40 Exhibited by TCW from CoreLogic LoanPerformance Data 58 50 60 70 80 . Prime Recidivism Rate on 2010-2013 Modifications at 6 Months of Seasoning Option Arm Recidivism Rate on 2010-2013 Modifications at 6 Months of Seasoning 25% 20% 15% 10% 5% 0% 15% 10% 5% 0% Recidivism Recidivism 3mo Avg Recidivism 3mo Avg Recidivism Subprime Recidivism Rate on 2010-2013 Modifications at 6 Months of Seasoning Alt-A Recidivism Rate on 2010-2013 Modifications at 6 Months of Seasoning 18% 16% 14% 12% 10% 8% 6% 4% 2% 0% 25% 20% 15% 10% 5% 0% Recidivism Recidivism 3mo Avg Recidivism Exhibited by TCW from CoreLogic LoanPerformance Data 59 3mo Avg Recidivism . III. Liquidation Timeline Exhibited by TCW from CoreLogic LoanPerformance Data 60 . National Average Liquidation Timeline (Months) 60.0 56.4 50.0 49.0 40.0 38.6 30.0 20.0 10.0 - Combined Judicial Exhibited by TCW from CoreLogic LoanPerformance Data 61 NonJudicial . Prime Avg # Months in DQ Prior to Modification Option Arm Avg # Months in DQ Prior to Modification 20.0 25.0 20.0 15.0 10.0 5.0 - 15.0 10.0 5.0 - ModSpeed 3mo Avg ModSpeed ModSpeed Alt-A Avg # Months in DQ Prior to Modification 3mo Avg ModSpeed Subprime Avg # Months in DQ Prior to Modification 25.0 25.0 20.0 20.0 15.0 15.0 10.0 10.0 5.0 5.0 - - ModSpeed 3mo Avg ModSpeed ModSpeed Exhibited by TCW from CoreLogic LoanPerformance Data 62 3mo Avg ModSpeed . IV. Cash Flow Velocity 63 . Securitized Mortgages: Cashflow Velocity (P&I Paid / P&I Due) on Delinquent Loans as of February 2016 60.0% 50.0% 40.0% 30.0% 20.0% Prime 10.0% Alt-A Option Arm Subprime 0.0% Exhibited by TCW from CoreLogic LoanPerformance Data 64 . Servicer Level Cashflow Velocity on DQ Prime Loans Servicer Level Cashflow Velocity on DQ Option Arm Loans 120% 100% 80% 60% 40% 20% 0% 80% 60% 40% 20% 0% 1mo Cashflow Velocity 1mo Cashflow Velocity 3mo Cashflow Velocity 3mo Cashflow Velocity Servicer Level Cashflow Velocity on DQ Subprime Loans Servicer Level Cashflow Velocity on DQ Alt-A Loans 70% 60% 50% 40% 30% 20% 10% 0% 80% 70% 60% 50% 40% 30% 20% 10% 0% 1mo Cashflow Velocity 3mo Cashflow Velocity 1mo Cashflow Velocity Exhibited by TCW from CoreLogic LoanPerformance Data 65 3mo Cashflow Velocity . V. Short Sales 66 . Prime Short Sales as % of Total Defaults Option Arm Short Sales as % of Total Defaults 100% 100% 80% 80% 60% 60% 40% 40% 20% 20% 0% 0% Short Sales Short Sales REO REO Subprime Short Sales as % of Total Defaults Alt-A Short Sales as % of Total Defaults 100% 90% 80% 70% 60% 50% 40% 30% 20% 10% 0% 100% 90% 80% 70% 60% 50% 40% 30% 20% 10% 0% Short Sales REO Exhibited by TCW from First American CoreLogic LoanPerformance Data 67 Short Sales REO . Percentage Prime Defaults Liquidated via Short Sale by Servicer 70% 60% 50% 40% 30% 20% 10% 0% Percentage Option Arm Defaults Liquidated via Short Sale by Servicer 60% 50% 40% 30% 20% 10% 0% 1mo Short Sales 1mo Short Sales 3mo Short Sales Percentage Alt-A Defaults Liquidated via Short Sale by Servicer 80% 70% 60% 50% 40% 30% 20% 10% 0% Percentage Subprime Defaults Liquidated via Short Sale by Servicer 60% 50% 40% 30% 20% 10% 0% 1mo Short Sales 1mo Short Sales 3mo Short Sales Exhibited by TCW from First American CoreLogic LoanPerformance Data 68 3mo Short Sales 3mo Short Sales . VI. California Severity by Servicer 69 . Prime Average CA Severity by Servicer Option Arm Average CA Severity by Servicer 45% 40% 35% 30% 25% 20% 15% 10% 5% 0% 80% 70% 60% 50% 40% 30% 20% 10% 0% 1mo Avg Severity 1mo Avg Severity 3mo Avg Severity 3mo Avg Severity Subprime Average CA Severity by Servicer Alt-A Average CA Severity by Servicer 70% 60% 50% 40% 30% 20% 10% 0% 60% 50% 40% 30% 20% 10% 0% 1mo Avg Severity 1mo Avg Severity 3mo Avg Severity Exhibited by TCW from CoreLogic LoanPerformance Data 70 3mo Avg Severity . VII. Advancing 71 . Securitized Mortgages: % 60+ Loans No Longer Advanced Upon as of February 2016 50.0% 45.0% Subprime OptArm 40.0% AltA Prime 35.0% 30.0% 25.0% 20.0% 15.0% 10.0% 5.0% 0.0% -5.0% Exhibited by TCW from CoreLogic LoanPerformance Data 72 . Prime Percentage 60+ Not Advanced Upon by Servicer Option Arm Percentage 60+ Not Advanced Upon by Servicer 70% 60% 50% 40% 30% 20% 10% 0% 100% 80% 60% 40% 20% 0% 1mo % 60+ No Advance 3mo % 60+ No Advance 3mo % 60+ No Advance 1mo % 60+ No Advance Subprime Percentage 60+ Not Advanced Upon by Servicer Alt-A Percentage 60+ Not Advanced Upon by Servicer 80% 70% 60% 50% 40% 30% 20% 10% 0% 70% 60% 50% 40% 30% 20% 10% 0% 3mo % 60+ No Advance 1mo % 60+ No Advance 1mo % 60+ No Advance Exhibited by TCW from CoreLogic LoanPerformance Data 73 3mo % 60+ No Advance . Section F: Origination Trends 74 . I. Freddie Mac New Origination by FICO Band 75 . Origination Volume by FICO Band 100% > 730 90% 680-730 < 680 80% 70% 60% 50% 40% 30% 20% 10% 0% Exhibited by TCW from LoanLevel Database 76 . II. Freddie Mac New Origination by DTI 77 . Debt to Income Ratio by FICO Bands 43% 41% 39% 37% 35% 33% 31% 29% > 730 27% 680-730 < 680 25% Exhibited by TCW from LoanLevel Database 78 . III. Freddie Mac New Origination in Limited Doc Loans 79 . Percent Origination Volume in Limited Doc Loans 25% 20% 15% 10% 5% 0% Limited Documentation Exhibited by TCW from LoanLevel Database 80 . IV. Freddie Mac New Origination in Jumbo Conforming Loans 81 . Percentage Origination Volume in Jumbo Conforming Loans 12.0% 10.0% 8.0% 6.0% 4.0% 2.0% 0.0% Jumbo Conforming Exhibited by TCW from LoanLevel Database 82 . V. Freddie Mac New Origination in Loans with LTV > 100% 83 . Percentage Origination Volume into > 100 LTV Loans 4.5% 4.0% 3.5% 3.0% 2.5% 2.0% 1.5% 1.0% 0.5% 0.0% LTV > 100 Exhibited by TCW from LoanLevel Database 84 . Section G: Home Prices 85 . I. Home Price Indices 86 . National Home Price Indices 250 FHFA Purchase 230 Case Shiller 10 City 210 Case Shiller 10 City 190 170 150 130 110 90 70 50 Exhibited by TCW from S&P, and FHFA Data 87 . II. Case Shiller Summary 88 . Geographic Area YoY Peak to Now Peak to Trough Trough to Now Months since peak Months since trough Atlanta 5.7% -8% -36% 44% 105 49 Boston 4.3% 0% -20% 25% 127 85 Charlotte 3.9% 0% -20% 25% 104 50 Chicago 2.7% -23% -39% 26% 115 49 Cleveland 4.1% -12% -24% 15% 117 50 Dallas 8.4% 24% -11% 39% 106 86 Denver 8.5% 24% -14% 45% 116 86 Detroit 6.9% -18% -49% 61% 124 60 Los Angeles 5.7% -12% -42% 51% 115 83 Las Vegas 5.8% -38% -61% 60% 116 49 Miami 5.8% -27% -51% 50% 112 60 Minneapolis 5.0% -14% -38% 39% 115 61 New York 3.2% -16% -27% 14% 118 49 Phoenix 6.1% -31% -56% 57% 118 55 Portland 10.7% 2% -31% 47% 105 49 San Diego 5.9% -13% -42% 51% 125 84 Seattle 9.6% -3% -32% 42% 105 50 San Francisco 8.8% 0% -46% 85% 119 85 Tampa 7.0% -26% -47% 41% 117 50 Washington DC 2.2% -16% -34% 27% 119 85 10 City Aggregate 4.7% -13% -35% 35% 118 49 20 City Aggregate 5.4% -12% -34% 34% 117 49 Exhibited by TCW from S&P, and FHFA Data 89 .
7 IV. Loss Severity by Unpaid Principal Balance .......................... 49 Section A: Serious Delinquencies .....................................................
9 Section E: Servicing ......................................................................... 51 I. Serious Delinquencies as % of Unpaid Principal Balance....
10 I. Modifications.......................................................................... 52 II.
Foreclosure and REO as % of Unpaid Principal Balance ..... 12 II. Recidivism ..............................................................................
57 III. 12 months of Clean Delinquency History ............................. 17 III.
Liquidation Timeline .............................................................. 60 IV. Updated Consumer Credit Data ...........................................
21 IV. Cash Flow Velocity ................................................................. 63 Section B: Defaults ..........................................................................
24 V. Short Sales ............................................................................. 66 I.
CDR by Sector......................................................................... 25 VI. California Severity by Servicer...............................................
69 II. CDR and Serious Delinquencies by Sector ........................... 27 VII.
Advancing.............................................................................. 71 III. CDR by Delinquency Status ...................................................
32 Section F: Origination Trends ......................................................... 74 Section C: Prepayments .................................................................. 34 I.
Freddie Mac New Origination by FICO Band ....................... 75 I. Voluntary Prepayments by Sector ..........................................
35 II. Freddie Mac New Origination by DTI ................................... 77 II.
CPR Breakout by Sector ......................................................... 37 III. Freddie Mac New Origination in Limited Doc Loans...........
79 III. Voluntary Prepayments by Delinquency Status .................... 39 IV.
Freddie Mac New Origination in Jumbo Conforming Loans 81 Section D: Loss Severity .................................................................. 41 V. Freddie Mac New Origination in Loans with LTV > 100% ...
83 I. Loss Severity by Sector ........................................................... 42 Section G: Home Prices ..................................................................
85 II. Loss Severity by State............................................................. 44 I.
Home Price Indices ................................................................ 86 II. Case Shiller Summary ............................................................
88 1 . This publication is for general information purposes only and does not constitute an offer to sell, or a solicitation of an offer to buy, any security. Any holdings of a particular company or security discussed herein are under periodic review by the portfolio management group and are subject to change without notice. In addition, TCW manages a number of separate strategies, and portfolio managers in those strategies may have differing views or analysis with respect to a particular company, security or the economy than the views expressed herein. An investment in the strategy described herein has risks, including the risk of losing some or all of the invested capital.
Before embarking on the described investment program, an investor should carefully consider the risks and suitability of the described strategy based on their own investment objectives and financial position. Past performance is no guarantee of future results. The information contained herein may include estimates, projections and other “forward-looking statements.” Due to numerous factors, actual events may differ substantially from those presented herein. TCW assumes no duty to update any such forward-looking statements or any other information or opinions in this document.
Any information and statistical date contained herein derived from third party sources are believed to be reliable, but TCW does not represent that they are accurate, and they should not be relied on as such or be the basis for an investment decision. Copyright 2015 TCW. 2 . Foreword The Mortgage Market Monitor draws from a variety of data sources to identify market moving trends in the first lien residential mortgage market. The two main data sources are the First American CoreLogic LoanPerformance securitized loans database and the TCW Loan Level Database. The following definitions will facilitate use of this report: SECTOR The sector definition is based upon the following distinctions: • Prime: FICO > 725 and Loan to Value (LTV) < 75% and No Negative Amortization • Alt-A: FICO between 675 and 725 or FICO > 725 and LTV >= 75% and No Negative Amortization • Option Arm: Any loan that allows Negative Amortization • Subprime: FICO < 675 and No Negative Amortization SERIOUS DELINQUENCY We define a serious delinquency as a loan that is: more than 60 days delinquent; in foreclosure; in bankruptcy; or classified as real estate owned (REO). There are two different standards used in the mortgage industry to characterize a loan’s delinquency status.
The Office of Thrift Supervision (OTS) defines a loan as “past due” when the borrower fails to make a second consecutive scheduled payment. The Mortgage Bankers Association (MBA) defines a loan as “past due” when a scheduled payment is unpaid for 30 days or more. In certain situations (such as the loan due date on the first of the month and the servicer reporting date on the last day of the month) a newly delinquent borrower can be flagged as “under 30” by the OTS methodology and 30-59 days delinquent by the MBA methodology.
The MBA methodology is typically used for Prime loans and the OTS methodology is typically used for Subprime loans. In this report we use the MBA methodology for all loans, making apples to apples comparison across sectors possible. ROLL RATES Roll rates are displayed as what they imply for Serious Delinquencies, Voluntary Prepayments and Defaults. For example, if the one month roll rate (aka transition rate) for Subprime loans from Current to Current is 92% then we hold that rate static and apply it to the Subprime delinquency pipeline.
Likewise, we take the average roll rate from Current to 30 days delinquent, 30 to 30 days delinquent, 30 to Current, and all the remaining roll pairs (63 in all) to project implied Serious Delinquencies, Voluntary Prepayments and Defaults for 12 months into the future. The accuracy of these projections depends upon the assumption that the roll rates stay static over the next 12 months. We know they will not and, consequently, we take the 1 month average roll rate projection and compare it to the 3 month roll rate projection to see which way the most recent roll rates are trending. 3 .
CONSUMER CREDIT INFORMATION Equifax, one of the three consumer credit companies, furnishes TCW with updated consumer credit information on all loans in our database on a monthly basis. This detailed credit information gives us a current view of the borrower’s credit profile. The Vantage score is a score that summarizes the consumer’s credit behavior, not unlike the FICO score. While FICO score distributions tend to be normal, Vantage score distributions on the same consumers have much fatter tails.
In this report we show a weighted average Vantage score by sector, and we also take advantage of the Vantage score’s strength in identifying consumer credit distress by looking at the tails. CPR Constant Prepayment Rate (CPR) is an annualization of the unscheduled monthly mortality rate of loan balance. To calculate this metric one compares the balance of loans that left the pool of loans through default or voluntary payoff to the outstanding balance of the pool of loans in the previous month. Distinguishing between loans that leave the pool with a loss and loans that leave the pool without a loss yields the Conditional Default Rate (CDR) and the Constant Rate of Reduction (CRR), respectively.
These can be viewed as the two components of CPR. LOSS SEVERITY If a loan leaves a pool of loans and experiences a loss, then it will have a loss severity. The loss severity is calculated by dividing the total loss amount by the unpaid principal balance of the loan at the time it becomes inactive. MODIFICATION A loan whose terms are changed by the servicer becomes a modified loan. Typical modifications include: rate reduction; capitalization of delinquent interest, taxes and insurance; term extension; principal forbearance; and principal forgiveness.
We use a proprietary algorithm to determine which loans receive capitalization modifications, principal forgiveness modifications and fixed rate loan interest rate modifications. We look to the Loanperformance modification data for information on adjustable rate mortgage interest rate modifications as well as P&I modifications. RECIDIVISM A borrower whose loan was modified and subsequently falls back into delinquency and/or liquidates is a recidivist. To eliminate noise when we track recidivism we let the modification season for six months.
Of those seasoned modified loans we determine what percentage is now seriously delinquent. LIQUIDATION TIMELINE When a loan becomes delinquent and ultimately liquidates it can progress through three main stages: Pre-foreclosure delinquency; Foreclosure; and REO. Each of these stages lasts a number of months. The length varies substantially by geographic region and servicer.
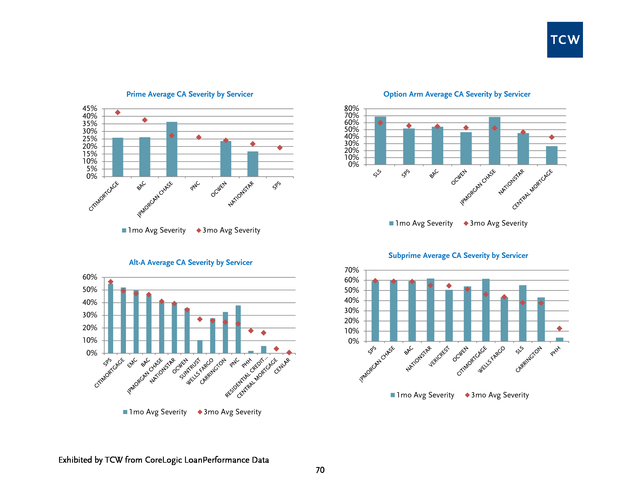
A geographic area with a longer than average timeline might require a more formal court proceeding before title can be transferred to the servicer (Judicial states); it may be an area that is experiencing capacity constraints in recording offices, or attorney networks; there may be an abundant supply of homes on the market making it difficult to sell an REO; or the servicer may be understaffed and unable to attend to the various liquidation requirements of a loan in a timely 4 . manner. This report shows how servicers perform relative to one another in timeline management in California. We focus on one state to eliminate the noise produced by these dynamics across states. CASH FLOW VELOCITY This metric is used to track a servicer’s ability to get payments from borrowers that are currently delinquent. It is defined as Total Principal and Interest (P&I) paid by delinquent borrowers divided by Total Principal and Interest due from delinquent borrowers.
For example, assume there are two borrowers being serviced by a servicer who are 60-89 days delinquent and both borrowers have P&I payments of $1,500. A servicer with the right calling campaign and incentive structure for its loss mitigators may be able to get one of the two borrowers to pay $1,500 despite having already missed two payments. This borrower would remain 60-89 days delinquent while the remaining borrower would roll into 90-119 days delinquent.
The cash flow velocity for the month in this situation would be $1,500 / ($1,500 + $1,500) = 50%. The higher the cash flow velocity the more adept the servicer is when dealing with delinquent borrowers. SHORT SALE In this report we define “Short Sale” as any loan that liquidates with a loss but never reaches the REO status. Short sales typically have lower severities compared to REO sales.
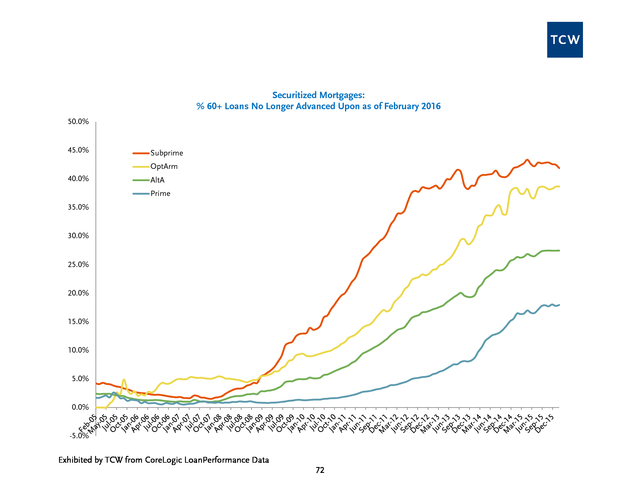
Those servicers that successfully implement a short sale focused liquidation strategy relative to other servicers will likely have lower severities. ADVANCING When a borrower misses a mortgage payment on a first lien mortgage the servicing contract obligates the servicer to make the interest and principal payment for the borrower. This is called “advancing.” The servicer advances the mortgage payment to the certificate holders, expecting to be repaid at some point in the future. The reimbursement requirement is fulfilled through collection of liquidation proceeds, late collections, and/or insurance proceeds from the loan that has been advanced upon.
If the servicer believes that the advance is not recoverable, it is freed from the contractual obligation to advance on the loan. Assuming the decision to stop advancing is legitimate; investors can gain insight into a servicer’s opinion on future severities of loans on which it has stopped advancing. However, since the determination that advances will not be recoverable is largely subjective, opportunity exists for servicers to save money (funding costs on advances). SERVICING The impact of servicing on a bond’s IRR is difficult to measure.
The two main contributors to this difficulty are: approximately one third of securitized non-agency mortgages are serviced by more than one servicer; and recent industry consolidation in the servicing industry makes it difficult to identify the current servicing platform/management team responsible for a bond. These two difficulties are avoided at TCW by calculating bond level servicing performance. That is, the servicing level metrics displayed in this report are calculated at the bond level for all RMBS securities, thereby removing the uncertainties described above.
This bond level analysis is supplemented by a broad, quantitative based opinion formed on servicers in the industry. Factors influencing the rankings from highest weighted to lowest weighted include: Modifications as of 2010, Recidivism, Cash Flow Velocity, Liquidation Timelines, and Modification Timeline, with weights of 40%, 20%, 15%, 15%, and 10%, respectively. While we arrived at these weightings through scenario analysis, they are more last cash flow friendly and front pay unfriendly. 5 . HOME PRICES Various home price indices have been constructed to gauge the change in home prices over time. In this report we focus on the Case Shiller 10 city aggregate, and the FHFA Purchase only indices. Additionally, we include the Case Shiller futures contracts that trade on the CME to get the market’s perspective on where home prices are heading in the next few years. The index values are all normalized to facilitate an apples-to-apples comparison across indices. DTI Debt-to-income Ratio.
We track the debt-to-income ratio at origination for Freddie Mac loans at the loan level. The debt-to-income ratio “indicates the sum of the borrower’s monthly debt payments, including monthly housing expenses, divided by the total monthly income used to qualify the borrower, expressed as a percentage… This disclosure is subject to the widely varying standards originators use to verify borrowers assets and liabilities.” 6 . Market Update Similar to other risk assets, Non-Agency RMBS began the month in a difficult landscape as the same concerns that weighed on the market in January, mainly those over oil and China, carried over to February. However, that did not stop one of the GSEs from putting out a bid list early in the month, which consisted of eight bonds totaling 365mm and traded in line with expectations. Altogether, the first week saw a decent amount of supply that reached almost 2bn, though precise color was limited and the number of line items not trading was high. Over the course of the second week, heightened macro volatility and weakness dampened the motivation of accounts to sell, leading to the cancellation of several bid lists and a drop in total volume to under 1.6bn.
Bonds that were kept by sellers continued to disproportionately outnumber those that traded due to a combination of wider bid-ask spreads and lower levels of participation on lists. While subdued volumes persisted the following week, partly the result of a holiday, sentiment began to shift as broader markets rebounded. Stocks and oil bounced from two year and twelve year lows, respectively.
Even though nonagency spreads didn’t necessarily tighten in sympathy, the overall tone felt better. As February month-end and the annual ABS conference (Feb 28 Mar 2) approached, it seemed like accounts were trying to take advantage of the improved environment and fit in as much selling as they could over the last full week. The 2.3bn in supply, which included a 496mm GSE list consisting of seasoned subprime and Alt-A collateral, was the largest weekly amount tallied so far this year and capped off February with a total of 7.2bn. February was supposed to be the month in which the long awaited 8.5bn Countrywide settlement would finally be paid.
However, instead of receiving a payout, investors were left with disappointment as Bank of New York Mellon (trustee of the 530 deals included in the settlement) filed a petition on February 5 to the NY state court for judicial instruction regarding the distribution waterfall. There are varying opinions on the interpretation of the pooling and servicing agreement (PSA) that would affect investors differently depending on their placement in the capital structure. As a result, the trustee is seeking clarification on the proper distribution procedure for paying bondholders.
Meanwhile, with the final payment date delayed and uncertain, the 8.5bn settlement has been deposited into an escrow account where investment proceeds will also be allocated to bondholders. In risk sharing, Fannie Mae priced its first deal of the year on February 10, 945mm CAS 2016-C01, which also debuted first loss B tranches. The transaction was downsized from an initial size of 949.5mm and priced wider than guidance - 195dm, 675dm and 1175dm for 1M1, 1M2, and 1B, respectively, and 210dm and 695dm for higher LTV 2M1 and 2M2, respectively (2B was rescinded due to lack of support and interest). Collateral Performance 7 . Changes in serious delinquencies were mixed in February. Prime delinquencies increased by 6 basis points to 6.81%; Alt-A delinquencies increased by 1 basis point to 15.77%; Option Arm delinquencies decreased by 6 basis points to 23.85% and Subprime delinquencies increased by 19 basis points to 30.13%. Roll rates from current status to delinquency are holding stable near sector- level long-term averages. Voluntary prepayments decreased across all sectors this month. Prime CRRs came in at 12.4%, down 356 basis points month-over-month; Alt-A CRRs were 9.7%, down 134 basis points month-over-month; Option Arm CRRs were 4.5%, down 77 basis points month-over-month and Subprime CRRs were 4.2%, down 68 basis points month-over-month.
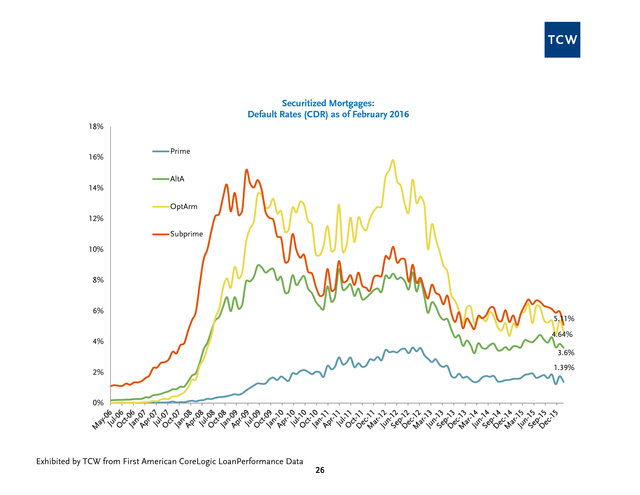
CDRs also decreased across all sectors. Prime CDRs decreased by 37 basis points to 1.39%; Alt-A CDRs decreased by 25 basis points to 3.61%; Option Arm CDRs decreased by 75 basis points to 4.64% and Subprime CDRs decreased by 86 basis points to 5.11%. Case-Shiller futures continue to reflect a broad recovery in home prices, predicting home prices will rise three percent annually during the next four to five years. Year-over-year, home prices are up 5.4% across Case-Shiller’s 20 major city index.
At the national level, changes in severities were mixed again. At the state level, California Subprime severities increased to 53% this month. Florida Subprime severities increased to 87%.
New York Subprime severities decreased to 88%; and Nevada Subprime severities decreased to 70%. 8 . Section A: Serious Delinquencies 9 . I. Serious Delinquencies as % of Unpaid Principal Balance 10 . Securitized Mortgages: Serious Delinquencies as % of Unpaid Principal Balance as of February 2016 60% Prime 50% Alt-A Option Arm 40% Subprime 30.13% 30% 23.85% 20% 15.8% 10% 6.812% 0% Exhibited by TCW from CoreLogic LoanPerformance Data 11 . II. Foreclosure and REO as % of Unpaid Principal Balance Exhibited by TCW from CoreLogic LoanPerformance Data 12 . Prime Securitized Mortgages: Foreclosure and REO as % of Unpaid Principal Balance as of February 2016 5.00% 4.50% 4.00% Prime FC Prime REO 3.50% 3.00% 2.50% 2.74% 2.00% 1.50% 1.00% 0.5% 0.50% 0.00% Exhibited by TCW from CoreLogic LoanPerformance Data 13 . Alt-A Securitized Mortgages: Foreclosure and REO as % of Unpaid Principal Balance as of February 2016 12.0% Alt-A FC 10.0% Alt-A REO 8.0% 6.0% 6.3% 4.0% 1.4% 2.0% 0.0% Exhibited by TCW from CoreLogic LoanPerformance Data 14 . Option Arm Securitized Mortgages: Foreclosure and REO as % of Unpaid Principal Balance as of February 2016 25.0% Option Arm FC 20.0% Option Arm REO 15.0% 10.0% 9.8% 5.0% 2.3% 0.0% Exhibited by TCW from CoreLogic LoanPerformance Data 15 . Subprime Securitized Mortgages: Foreclosure and REO as % of Unpaid Principal Balance as of February 2016 20.0% 18.0% 16.0% Subprime FC Subprime REO 14.0% 12.0% 10.0% 10.6% 8.0% 6.0% 2.4% 4.0% 2.0% 0.0% Exhibited by TCW from CoreLogic LoanPerformance Data 16 . III. 12 months of Clean Delinquency History 17 . 100.0% Percentage of outstanding loans with 12 month Clean DQ history as of February 2016 90.0% 86.4% 80.0% 72.1% 70.0% 62.0% 60.0% 50.0% 40.0% Prime 45.7% Alt-A 30.0% 20.0% Option Arm Subprime 10.0% 0.0% Exhibited by TCW from CoreLogic LoanPerformance Data 18 . 6.00% Percentage of 12 month Clean DQ history loans rolling to 30 Days DQ as of February 2016 Prime 5.00% Alt-A Option Arm Subprime 4.00% 3.00% 2.00% 1.9% 1.00% 0.95% 0.89% 0.51% 0.00% Exhibited by TCW from CoreLogic LoanPerformance Data 19 . Percentage of 12 month Clean DQ history loans rolling to 60 days Delinquent over 2 Payment Periods as of February 2016 3.50% Prime 3.00% Alt-A Option Arm Subprime 2.50% 2.00% 1.50% 1.00% 0.50% 0.30% 0.20% 0.18% 0.08% 0.00% Exhibited by TCW from CoreLogic LoanPerformance Data 20 . IV. Updated Consumer Credit Data 21 . FICO Score Migration 775 725 AltA Prime 675 Subprime OptArm 625 575 Exhibited by TCW from CoreLogic LoanPerformance and Equifax Data 22 . FICO less than 550 as a percentage of Unpaid Balance 50% 45% AltA 40% Prime Subprime 35% OptArm 30% 25% 20% 15% 10% 5% 0% Exhibited by TCW from CoreLogic LoanPerformance and Equifax Data 23 . Section B: Defaults 24 . I. CDR by Sector 25 . Securitized Mortgages: Default Rates (CDR) as of February 2016 18% 16% Prime AltA 14% OptArm 12% Subprime 10% 8% 6% 5.11% 4.64% 4% 3.6% 1.39% 2% 0% Exhibited by TCW from First American CoreLogic LoanPerformance Data 26 . II. CDR and Serious Delinquencies by Sector 27 . Securitized Mortgages: Prime 60+ and Prime CDRs as of February 2016 12% Prime CDR 10% Prime 60+ 8% 6.812% 6% 4% 1.39% 2% 0% Exhibited by TCW from CoreLogic LoanPerformance Data 28 . Securitized Mortgages: Alt-A 60+ and Alt-A CDRs as of February 2016 30% Alt-A CDR 25% Alt-A 60+ 20% 15% 15.8% 10% 3.6% 5% 0% Exhibited by TCW from CoreLogic LoanPerformance Data 29 . Securitized Mortgages: Option Arm 60+ and Option Arm CDRs as of February 2016 50% 45% Option Arm CDR 40% Option Arm 60+ 35% 30% 25% 23.85% 20% 15% 10% 4.64% 5% 0% Exhibited by TCW from CoreLogic LoanPerformance Data 30 . Securitized Mortgages: Subprime 60+ and Subprime CDRs as of February 2016 60% Subprime CDR 50% Subprime 60+ 40% 30% 30.13% 20% 10% 5.11% 0% Exhibited by TCW from CoreLogic LoanPerformance Data 31 . III. CDR by Delinquency Status 32 . Prime CDR Mix by Delinquency Status Option Arm CDR Mix by Delinquency Status 100% 100% 80% 80% 60% 60% 40% 40% 20% 20% 0% 0% C 3 6 9 B F R C 3 6 9 B F R Alt-A CDR Mix by Delinquency Status 100% 90% 80% 70% 60% 50% 40% 30% 20% 10% 0% Subprime CDR Mix by Delinquency Status 100% 80% 60% 40% 20% 0% C 3 6 9 B F R Exhibited by TCW from First American CoreLogic LoanPerformance Data 33 C 3 6 9 B F R . Section C: Prepayments 34 . I. Voluntary Prepayments by Sector 35 . Securitized Mortgages: Voluntary Prepayment Rates (CRR) as of February 2016 35.0% Prime Alt-A Option Arm 30.0% Subprime 25.0% 20.0% 15.0% 12.4% 9.7% 10.0% 4.5% 5.0% 4.2% 0.0% Exhibited by TCW from CoreLogic LoanPerformance Data 36 . II. CPR Breakout by Sector 37 . Prime CPR Option Arm CPR 30.0% 35.0% 30.0% 25.0% 20.0% 15.0% 10.0% 5.0% 0.0% 25.0% 20.0% 15.0% 10.0% 5.0% 0.0% CRR CDR CRR CDR Alt-A CPR Subprime CPR 25.0% 40.0% 20.0% 35.0% 30.0% 15.0% 25.0% 10.0% 20.0% 15.0% 5.0% 10.0% 5.0% 0.0% 0.0% CRR CDR CRR Exhibited by TCW from First American CoreLogic LoanPerformance Data 38 CDR . III. Voluntary Prepayments by Delinquency Status 39 . Prime CRR Mix by Delinquency Status 100% 99% 98% 97% 96% 95% 94% 93% Option Arm CRR Mix by Delinquency Status 100% 95% 90% 85% 80% 75% 70% C 3 6 9 B F R C Alt-A CRR Mix by Delinquency Status 3 6 9 B F R Subprime CRR Mix by Delinquency Status 100% 100% 99% 98% 97% 96% 95% 94% 93% 92% 91% 90% 95% 90% 85% 80% 75% 70% C 3 6 9 B F R Exhibited by TCW from First American CoreLogic LoanPerformance Data 40 C 3 6 9 B F R . Section D: Loss Severity 41 . I. Loss Severity by Sector 42 . Historical Loss Severity By Sector 90.0% 80.0% 70.0% 78.6% Prime Alt-A Option Arm Subprime 66.3% 61.5% 60.0% 50.0% 48.6% 40.0% 30.0% 20.0% 10.0% 0.0% Exhibited by TCW from CoreLogic LoanPerformance Data 43 . II. Loss Severity by State 44 . Prime Loss Severity by State Option Arm Loss Severity by State 160% 140% 140% 120% 120% 100% 100% 80% 80% 60% 60% 20% 20% 0% 0% 1mo LossSeverity 3mo LossSeverity IN SC MS AL CT VT ID IL NJ FL NY MI MA MD PA OH WI KY DC RI MN NV OK MO DE NH AZ NC LA WA TN AR CA OR VA GA TX NM ME CO UT HI KS AK 40% VA RI IN ID IA WV VT AL PA ME DE KY CT WI OH MT MO FL MI NM NJ MD IL TN OK MA NY SC WA NV KS MN OR WY NC HI AZ GA CA AR TX CO UT 40% 1mo LossSeverity Alt-A Loss Severity by State 3mo LossSeverity Subprime Loss Severity by State 120% 120% 100% 100% 80% 80% 60% 60% 40% 40% 0% VT ME NJ SD RI NY IA OH CT AR MO IL FL MS PA OK WV NE IN NM DE WI KS MD MI NH LA SC MA KY TN MN ID NV AL OR NC GA HI MT WA TX VA AZ AK DC WY CA UT CO 0% 1mo LossSeverity 3mo LossSeverity Exhibited by TCW from First American CoreLogic LoanPerformance Data 45 ME OH CT IA IL PA NJ RI SD NY MI VT MS IN WI FL MO OK AR MD AL WV DE SC KY NM KS NH LA NV MN ND NC GA MA TN NE WA VA TX OR ID MT AK HI AZ CA DC WY CO UT 20% 20% 1mo LossSeverity 3mo LossSeverity . Historical Loss Severity - California Historical Loss Severity - New York 80.0% 120.0% 70.0% 100.0% 60.0% 53.2% 50.0% 51.0% 40.0% 30.0% 20.0% 10.0% Prime Alt-A Option Arm Subprime 80.0% 37.3% 85.2% 40.0% 20.0% 0.0% 0.0% Historical Loss Severity - Florida 100.0% 90.0% 80.0% 70.0% 60.0% 50.0% 40.0% 30.0% 20.0% 10.0% 0.0% 88.3% 85.0% 74.3% 60.0% 24.9% Prime Alt-A Option Arm Subprime Historical Loss Severity - Nevada 86.5% 81.6% 76.4% 65.9% Prime Alt-A Option Arm Subprime Exhibited by TCW from First American CoreLogic LoanPerformance Data 46 90.0% 80.0% 70.0% 60.0% 50.0% 40.0% 30.0% 20.0% 10.0% 0.0% 70.3% 67.9% 61.7% 53.3% Prime Alt-A Option Arm Subprime . III. Loss Severity by City 47 . Prime Loss Severity Across Top 10 Cities by UPB Option Arm Loss Severity Across Top 10 Cities by UPB 100% 80% 60% 40% 20% 0% 100% 80% 60% 40% 20% 0% 1mo Loss Severity 3mo Loss Severity 1mo Loss Severity Alt-A Loss Severity Across Top 10 Cities by UPB 3mo Loss Severity Subprime Loss Severity Across Top 10 Cities by UPB 120% 100% 90% 80% 70% 60% 50% 40% 30% 20% 10% 0% 100% 80% 60% 40% 20% 0% 1mo Loss Severity 3mo Loss Severity 1mo Loss Severity Exhibited by TCW from CoreLogic LoanPerformance Data 48 3mo Loss Severity . IV. Loss Severity by Unpaid Principal Balance 49 . Prime Loss Severity by Current Balance 140% 120% 100% 80% 60% 40% 20% 0% Option Arm Loss Severity by Current Balance 300% 250% 200% 150% 100% 50% 0% 1Mo LossSeverity 3mo LossSeverity 1Mo LossSeverity Alt-A Loss Severity by Current Balance 3mo LossSeverity Subprime Loss Severity by Current Balance 160% 140% 120% 100% 80% 60% 40% 20% 0% 140% 120% 100% 80% 60% 40% 20% 0% 1Mo LossSeverity 3mo LossSeverity Exhibited by TCW from First American CoreLogic LoanPerformance Data 50 1Mo LossSeverity 3Mo LossSeverity . Section E: Servicing 51 . I. Modifications 52 . Percent of Non-agency Securitized Loans Modified by Modification Type 40% 35% Total Rate Capitalization Forgiveness 35.9% 30% 25% 20% 19.9% 15% 12.5% 12.0% 10% 5% 0% Exhibited by TCW from CoreLogic LoanPerformance Data 53 . Percentage of Securitized Loans Modified by Sector 60% 51.6% Prime 50% AltA Option Arm Subprime 38.3% 40% 30% 24.6% 20% 10.0% 10% 0% Exhibited by TCW from CoreLogic LoanPerformance Data 54 . Prime 6 Month Mod Volume as Percentage of UPB Option Arm 6 Month Mod Volume as Percentage of UPB 2% 5% 4% 3% 2% 1% 0% 2% 1% 1% 0% Mod Volume Last 6m 3m Avg Mod Volume Last 6mo Mod Volume Last 6m 3m Avg Mod Volume Last 6mo Alt-A 6 Month Mod Volume as Percentage of UPB Subprime 6 Month Mod Volume as Percentage of UPB 3% 3% 2% 2% 1% 1% 0% 5% 4% 3% 2% 1% 0% Mod Volume Last 6m 3m Avg Mod Volume Last 6mo Mod Volume Last 6m Exhibited by TCW from CoreLogic LoanPerformance Data 55 3m Avg Mod Volume Last 6mo . Prime 2010-2013 Cumulative Modifications as a Percentage of UPB Option Arm 2010-2013 Cumulative Modificaations as a Percentage of UPB 12% 10% 8% 6% 4% 2% 0% 30.0% 25.0% 20.0% 15.0% 10.0% 5.0% 0.0% 2010+ Mod pct 2010+ Mod pct 3mo Avg 2010+ Mod Pct 3mo Avg 2010+ Mod Pct Alt-A 2010-2013 Cumumulative Modifications as a Percentage of UPB Subprime 2010-2013 Cumulative Modifications as a Percentage of UPB 30.0% 25.0% 20.0% 15.0% 10.0% 5.0% 0.0% 40.0% 30.0% 20.0% 10.0% 0.0% 2010+ Mod pct 2010+ Mod pct 3mo Avg 2010+ Mod Pct Exhibited by TCW from CoreLogic LoanPerformance Data 56 3mo Avg 2010+ Mod Pct . II. Recidivism 57 . Monthly Recidivism by Mod Vintage and Mod Age 90% 80% 70% 60% 50% 2013 2012 40% 2011 2010 30% 2009 2008 20% 2007 10% 0% 0 10 20 30 40 Exhibited by TCW from CoreLogic LoanPerformance Data 58 50 60 70 80 . Prime Recidivism Rate on 2010-2013 Modifications at 6 Months of Seasoning Option Arm Recidivism Rate on 2010-2013 Modifications at 6 Months of Seasoning 25% 20% 15% 10% 5% 0% 15% 10% 5% 0% Recidivism Recidivism 3mo Avg Recidivism 3mo Avg Recidivism Subprime Recidivism Rate on 2010-2013 Modifications at 6 Months of Seasoning Alt-A Recidivism Rate on 2010-2013 Modifications at 6 Months of Seasoning 18% 16% 14% 12% 10% 8% 6% 4% 2% 0% 25% 20% 15% 10% 5% 0% Recidivism Recidivism 3mo Avg Recidivism Exhibited by TCW from CoreLogic LoanPerformance Data 59 3mo Avg Recidivism . III. Liquidation Timeline Exhibited by TCW from CoreLogic LoanPerformance Data 60 . National Average Liquidation Timeline (Months) 60.0 56.4 50.0 49.0 40.0 38.6 30.0 20.0 10.0 - Combined Judicial Exhibited by TCW from CoreLogic LoanPerformance Data 61 NonJudicial . Prime Avg # Months in DQ Prior to Modification Option Arm Avg # Months in DQ Prior to Modification 20.0 25.0 20.0 15.0 10.0 5.0 - 15.0 10.0 5.0 - ModSpeed 3mo Avg ModSpeed ModSpeed Alt-A Avg # Months in DQ Prior to Modification 3mo Avg ModSpeed Subprime Avg # Months in DQ Prior to Modification 25.0 25.0 20.0 20.0 15.0 15.0 10.0 10.0 5.0 5.0 - - ModSpeed 3mo Avg ModSpeed ModSpeed Exhibited by TCW from CoreLogic LoanPerformance Data 62 3mo Avg ModSpeed . IV. Cash Flow Velocity 63 . Securitized Mortgages: Cashflow Velocity (P&I Paid / P&I Due) on Delinquent Loans as of February 2016 60.0% 50.0% 40.0% 30.0% 20.0% Prime 10.0% Alt-A Option Arm Subprime 0.0% Exhibited by TCW from CoreLogic LoanPerformance Data 64 . Servicer Level Cashflow Velocity on DQ Prime Loans Servicer Level Cashflow Velocity on DQ Option Arm Loans 120% 100% 80% 60% 40% 20% 0% 80% 60% 40% 20% 0% 1mo Cashflow Velocity 1mo Cashflow Velocity 3mo Cashflow Velocity 3mo Cashflow Velocity Servicer Level Cashflow Velocity on DQ Subprime Loans Servicer Level Cashflow Velocity on DQ Alt-A Loans 70% 60% 50% 40% 30% 20% 10% 0% 80% 70% 60% 50% 40% 30% 20% 10% 0% 1mo Cashflow Velocity 3mo Cashflow Velocity 1mo Cashflow Velocity Exhibited by TCW from CoreLogic LoanPerformance Data 65 3mo Cashflow Velocity . V. Short Sales 66 . Prime Short Sales as % of Total Defaults Option Arm Short Sales as % of Total Defaults 100% 100% 80% 80% 60% 60% 40% 40% 20% 20% 0% 0% Short Sales Short Sales REO REO Subprime Short Sales as % of Total Defaults Alt-A Short Sales as % of Total Defaults 100% 90% 80% 70% 60% 50% 40% 30% 20% 10% 0% 100% 90% 80% 70% 60% 50% 40% 30% 20% 10% 0% Short Sales REO Exhibited by TCW from First American CoreLogic LoanPerformance Data 67 Short Sales REO . Percentage Prime Defaults Liquidated via Short Sale by Servicer 70% 60% 50% 40% 30% 20% 10% 0% Percentage Option Arm Defaults Liquidated via Short Sale by Servicer 60% 50% 40% 30% 20% 10% 0% 1mo Short Sales 1mo Short Sales 3mo Short Sales Percentage Alt-A Defaults Liquidated via Short Sale by Servicer 80% 70% 60% 50% 40% 30% 20% 10% 0% Percentage Subprime Defaults Liquidated via Short Sale by Servicer 60% 50% 40% 30% 20% 10% 0% 1mo Short Sales 1mo Short Sales 3mo Short Sales Exhibited by TCW from First American CoreLogic LoanPerformance Data 68 3mo Short Sales 3mo Short Sales . VI. California Severity by Servicer 69 . Prime Average CA Severity by Servicer Option Arm Average CA Severity by Servicer 45% 40% 35% 30% 25% 20% 15% 10% 5% 0% 80% 70% 60% 50% 40% 30% 20% 10% 0% 1mo Avg Severity 1mo Avg Severity 3mo Avg Severity 3mo Avg Severity Subprime Average CA Severity by Servicer Alt-A Average CA Severity by Servicer 70% 60% 50% 40% 30% 20% 10% 0% 60% 50% 40% 30% 20% 10% 0% 1mo Avg Severity 1mo Avg Severity 3mo Avg Severity Exhibited by TCW from CoreLogic LoanPerformance Data 70 3mo Avg Severity . VII. Advancing 71 . Securitized Mortgages: % 60+ Loans No Longer Advanced Upon as of February 2016 50.0% 45.0% Subprime OptArm 40.0% AltA Prime 35.0% 30.0% 25.0% 20.0% 15.0% 10.0% 5.0% 0.0% -5.0% Exhibited by TCW from CoreLogic LoanPerformance Data 72 . Prime Percentage 60+ Not Advanced Upon by Servicer Option Arm Percentage 60+ Not Advanced Upon by Servicer 70% 60% 50% 40% 30% 20% 10% 0% 100% 80% 60% 40% 20% 0% 1mo % 60+ No Advance 3mo % 60+ No Advance 3mo % 60+ No Advance 1mo % 60+ No Advance Subprime Percentage 60+ Not Advanced Upon by Servicer Alt-A Percentage 60+ Not Advanced Upon by Servicer 80% 70% 60% 50% 40% 30% 20% 10% 0% 70% 60% 50% 40% 30% 20% 10% 0% 3mo % 60+ No Advance 1mo % 60+ No Advance 1mo % 60+ No Advance Exhibited by TCW from CoreLogic LoanPerformance Data 73 3mo % 60+ No Advance . Section F: Origination Trends 74 . I. Freddie Mac New Origination by FICO Band 75 . Origination Volume by FICO Band 100% > 730 90% 680-730 < 680 80% 70% 60% 50% 40% 30% 20% 10% 0% Exhibited by TCW from LoanLevel Database 76 . II. Freddie Mac New Origination by DTI 77 . Debt to Income Ratio by FICO Bands 43% 41% 39% 37% 35% 33% 31% 29% > 730 27% 680-730 < 680 25% Exhibited by TCW from LoanLevel Database 78 . III. Freddie Mac New Origination in Limited Doc Loans 79 . Percent Origination Volume in Limited Doc Loans 25% 20% 15% 10% 5% 0% Limited Documentation Exhibited by TCW from LoanLevel Database 80 . IV. Freddie Mac New Origination in Jumbo Conforming Loans 81 . Percentage Origination Volume in Jumbo Conforming Loans 12.0% 10.0% 8.0% 6.0% 4.0% 2.0% 0.0% Jumbo Conforming Exhibited by TCW from LoanLevel Database 82 . V. Freddie Mac New Origination in Loans with LTV > 100% 83 . Percentage Origination Volume into > 100 LTV Loans 4.5% 4.0% 3.5% 3.0% 2.5% 2.0% 1.5% 1.0% 0.5% 0.0% LTV > 100 Exhibited by TCW from LoanLevel Database 84 . Section G: Home Prices 85 . I. Home Price Indices 86 . National Home Price Indices 250 FHFA Purchase 230 Case Shiller 10 City 210 Case Shiller 10 City 190 170 150 130 110 90 70 50 Exhibited by TCW from S&P, and FHFA Data 87 . II. Case Shiller Summary 88 . Geographic Area YoY Peak to Now Peak to Trough Trough to Now Months since peak Months since trough Atlanta 5.7% -8% -36% 44% 105 49 Boston 4.3% 0% -20% 25% 127 85 Charlotte 3.9% 0% -20% 25% 104 50 Chicago 2.7% -23% -39% 26% 115 49 Cleveland 4.1% -12% -24% 15% 117 50 Dallas 8.4% 24% -11% 39% 106 86 Denver 8.5% 24% -14% 45% 116 86 Detroit 6.9% -18% -49% 61% 124 60 Los Angeles 5.7% -12% -42% 51% 115 83 Las Vegas 5.8% -38% -61% 60% 116 49 Miami 5.8% -27% -51% 50% 112 60 Minneapolis 5.0% -14% -38% 39% 115 61 New York 3.2% -16% -27% 14% 118 49 Phoenix 6.1% -31% -56% 57% 118 55 Portland 10.7% 2% -31% 47% 105 49 San Diego 5.9% -13% -42% 51% 125 84 Seattle 9.6% -3% -32% 42% 105 50 San Francisco 8.8% 0% -46% 85% 119 85 Tampa 7.0% -26% -47% 41% 117 50 Washington DC 2.2% -16% -34% 27% 119 85 10 City Aggregate 4.7% -13% -35% 35% 118 49 20 City Aggregate 5.4% -12% -34% 34% 117 49 Exhibited by TCW from S&P, and FHFA Data 89 .


