


Description
SKYBRIDGE DIVIDEND VALUE FUND
Annual Investment Adviser’s Report
April 30, 2015
(Unaudited)
Dear Fellow Shareholder,
We are excited to have completed our first year of fund operations. After starting with $65,000 on April 7, of 2014,
we had $100.5 million under management as of April 30, 2015. We appreciate your trust as stewards of your hard-earned
assets.
The S&P 500® Index was up 12.98% for the year ended April 30, 2015. During the same time period, our SkyBridge
Dividend Value Fund’s Class I Shares were up 12.54%.
Class A Shares were up 9.74% since inception on June 13, 2014 and Class C Shares were up 14.26% since inception on October 17, 2014. Underweighting the financial and healthcare sectors hurt relative performance, while overweighting the consumer discretionary sector helped relative performance. The top three performing companies over the time period were Kraft Foods Group, Inc., Dr. Pepper Snapple Group, Inc.
and Six Flags Entertainment Corp. The bottom three performing companies were Mattel, Inc., Tupperware Brands Corporation and Coach, Inc. The Fund invests primarily in dividend yielding equity securities for which there is no guarantee that a company will increase or continue to pay dividends over time. The fund is subject to overall market risks which will cause its value to fluctuate over time as well as the Adviser’s ability to select securities to meet its objective. Our rules-based process allows us to take a long view, and the goal of our strategy is to outperform the S&P 500® Index over three year rolling time periods (net of fees and expenses).
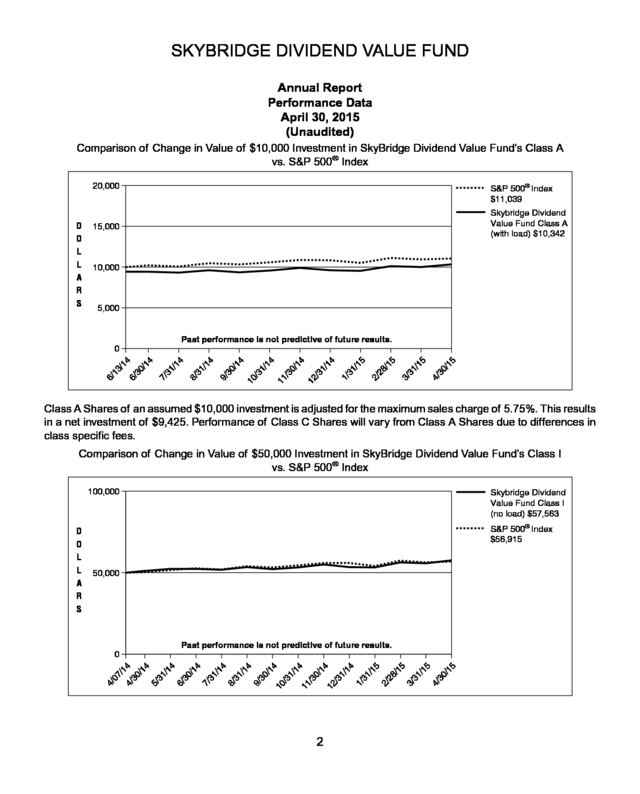
The repeatable investment process seeks to identify profitable, attractively valued securities with appealing dividends and favors long term gains. We believe the current low interest rate environment generally favors equities over bonds, especially considering the tax advantages of equity dividends over bond income. As always, we thank you for your support. Sincerely, Brendan Voege Portfolio Manager Current and future portfolio holdings are subject to change and risk. 1 . SKYBRIDGE DIVIDEND VALUE FUND Annual Report Performance Data April 30, 2015 (Unaudited) Comparison of Change in Value of $10,000 Investment in SkyBridge Dividend Value Fund’s Class A vs. S&P 500® Index 20,000 D O L L A R S S&P 500® Index $11,039 Skybridge Dividend Value Fund Class A (with load) $10,342 15,000 10,000 5,000 Past performance is not predictive of future results. 5 /1 5 4/ 30 /1 5 3/ 31 /1 2/ 31 1/ /3 28 /1 5 14 1/ 14 12 11 10 /3 1/ /3 30 0/ 14 4 /1 4 9/ 31 /1 4 8/ 7/ 31 /1 4 /1 30 6/ 6/ 13 /1 4 0 Class A Shares of an assumed $10,000 investment is adjusted for the maximum sales charge of 5.75%. This results in a net investment of $9,425. Performance of Class C Shares will vary from Class A Shares due to differences in class specific fees. Comparison of Change in Value of $50,000 Investment in SkyBridge Dividend Value Fund’s Class I vs.
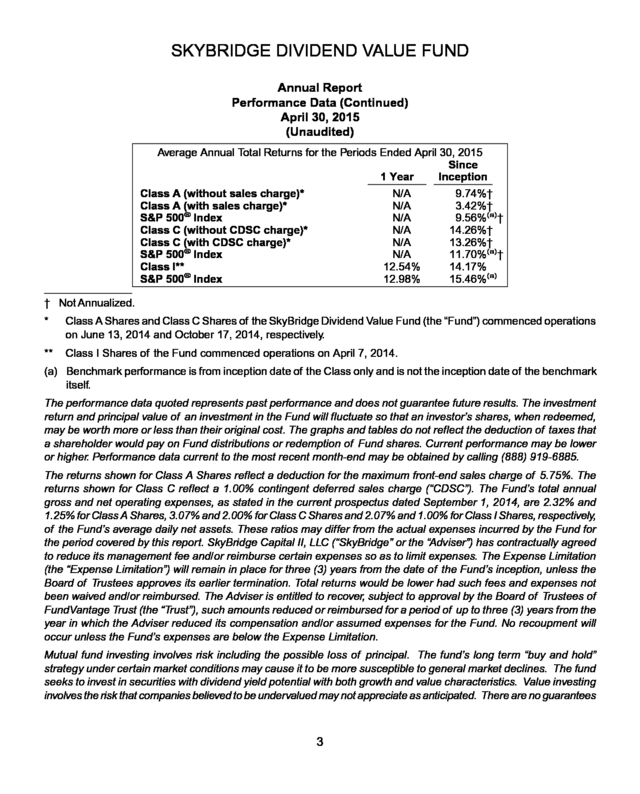
S&P 500® Index 100,000 S&P 500® Index $56,915 50,000 Past performance is not predictive of future results. 2 /1 5 /1 5 30 4/ 31 3/ /1 5 28 2/ /1 5 31 1/ 1/ 14 /3 0/ 14 12 /3 11 1/ 14 /3 30 /1 4 10 9/ /1 4 31 8/ /1 4 31 7/ /1 4 /1 4 30 6/ 31 5/ /1 4 30 4/ 07 /1 4 0 4/ D O L L A R S Skybridge Dividend Value Fund Class I (no load) $57,563 . SKYBRIDGE DIVIDEND VALUE FUND Annual Report Performance Data (Continued) April 30, 2015 (Unaudited) Average Annual Total Returns for the Periods Ended April 30, 2015 Since 1 Year Inception Class A (without sales charge)* N/A 9.74%† Class A (with sales charge)* N/A 3.42%† S&P 500® Index N/A 9.56%(a)† Class C (without CDSC charge)* N/A 14.26%† Class C (with CDSC charge)* N/A 13.26%† S&P 500® Index N/A 11.70%(a)† Class I** 12.54% 14.17% S&P 500® Index 12.98% 15.46%(a) † Not Annualized. * Class A Shares and Class C Shares of the SkyBridge Dividend Value Fund (the “Fund”) commenced operations on June 13, 2014 and October 17, 2014, respectively. ** Class I Shares of the Fund commenced operations on April 7, 2014. (a) Benchmark performance is from inception date of the Class only and is not the inception date of the benchmark itself. The performance data quoted represents past performance and does not guarantee future results. The investment return and principal value of an investment in the Fund will fluctuate so that an investor’s shares, when redeemed, may be worth more or less than their original cost. The graphs and tables do not reflect the deduction of taxes that a shareholder would pay on Fund distributions or redemption of Fund shares. Current performance may be lower or higher.
Performance data current to the most recent month-end may be obtained by calling (888) 919-6885. The returns shown for Class A Shares reflect a deduction for the maximum front-end sales charge of 5.75%. The returns shown for Class C reflect a 1.00% contingent deferred sales charge (“CDSC”). The Fund’s total annual gross and net operating expenses, as stated in the current prospectus dated September 1, 2014, are 2.32% and 1.25% for Class A Shares, 3.07% and 2.00% for Class C Shares and 2.07% and 1.00% for Class I Shares, respectively, of the Fund’s average daily net assets.
These ratios may differ from the actual expenses incurred by the Fund for the period covered by this report. SkyBridge Capital II, LLC (“SkyBridge” or the “Adviser”) has contractually agreed to reduce its management fee and/or reimburse certain expenses so as to limit expenses. The Expense Limitation (the “Expense Limitation”) will remain in place for three (3) years from the date of the Fund’s inception, unless the Board of Trustees approves its earlier termination.
Total returns would be lower had such fees and expenses not been waived and/or reimbursed. The Adviser is entitled to recover, subject to approval by the Board of Trustees of FundVantage Trust (the “Trust”), such amounts reduced or reimbursed for a period of up to three (3) years from the year in which the Adviser reduced its compensation and/or assumed expenses for the Fund. No recoupment will occur unless the Fund’s expenses are below the Expense Limitation. Mutual fund investing involves risk including the possible loss of principal.
The fund’s long term “buy and hold” strategy under certain market conditions may cause it to be more susceptible to general market declines. The fund seeks to invest in securities with dividend yield potential with both growth and value characteristics. Value investing involves the risk that companies believed to be undervalued may not appreciate as anticipated.
There are no guarantees 3 . SKYBRIDGE DIVIDEND VALUE FUND Annual Report Performance Data (Concluded) April 30, 2015 (Unaudited) a company will continue to pay or increase its dividend. The fund may invest in small to mid-capitalization companies which may be more volatile and less liquid than stocks of larger companies. The Fund intends to evaluate performance as compared to that of the S&P 500® Index. The S&P 500® Index is a widely recognized, unmanaged index of 500 common stocks which are generally representative of the U.S. stock market as a whole.
It is not possible to invest in an index. 4 . SKYBRIDGE DIVIDEND VALUE FUND Fund Expense Disclosure April 30, 2015 (Unaudited) As a shareholder of the Fund, you incur two types of costs: (1) transaction costs including sales charges (loads) on purchase payments (if any) or redemption fees; and (2) ongoing costs, including management fees, distribution and/or service (Rule 12b-1) fees (if any) and other Fund expenses. These examples are intended to help you understand your ongoing costs (in dollars) of investing in the Fund and to compare these costs with the ongoing costs of investing in other mutual funds. These examples are based on an investment of $1,000 invested at the beginning of the period from November 1, 2014 through April 30, 2015 and held for the entire period. Actual Expenses The first line of the accompanying table provides information about actual account values and actual expenses. You may use the information in this line, together with the amount you invested, to estimate the expenses that you paid over the period. Simply divide your account value by $1,000 (for example, an $8,600 account value divided by $1,000 = 8.6), then multiply the result by the number in the first line under the heading entitled “Expenses Paid During Period” to estimate the expenses you paid on your account during this period. Hypothetical Examples for Comparison Purposes The second line of the accompanying table provides information about hypothetical account values and hypothetical expenses based on the Fund’s actual expense ratio and an assumed rate of return of 5% per year before expenses, which is not your Fund’s actual return.
The hypothetical account values and expenses may not be used to estimate the actual ending account balance or expenses you paid for the period. You may use this information to compare the ongoing costs of investing in the Fund and other funds. To do so, compare these 5% hypothetical examples with the 5% hypothetical examples that appear in the shareholder reports of other funds. Please note that the expenses shown in the accompanying table are meant to highlight your ongoing costs only and do not reflect any transactional costs, such as sales charges (loads) on purchase payments (if any) or redemption fees.
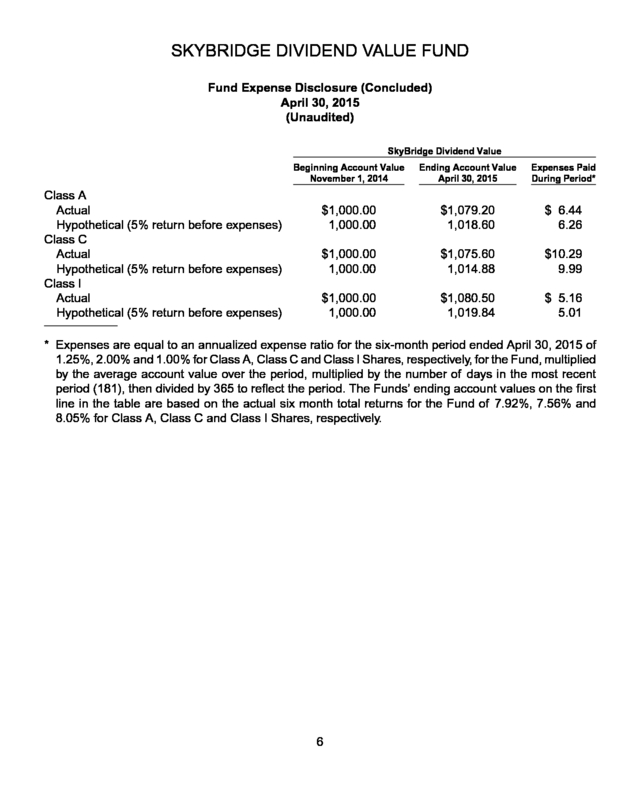
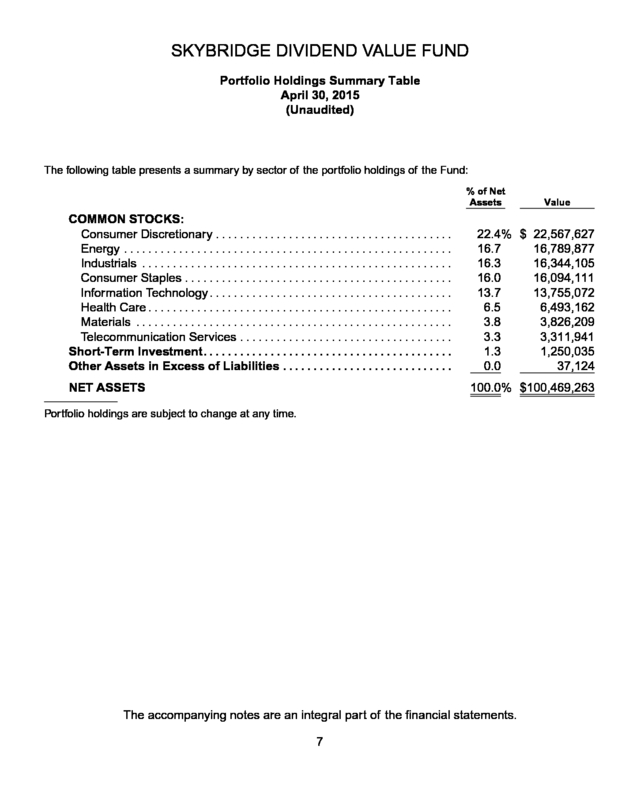
Therefore, the second line of the accompanying table is useful in comparing ongoing costs only, and will not help you determine the relative total costs of owning different funds. In addition, if these transactional costs were included, your costs would have been higher. 5 . SKYBRIDGE DIVIDEND VALUE FUND Fund Expense Disclosure (Concluded) April 30, 2015 (Unaudited) SkyBridge Dividend Value Beginning Account Value November 1, 2014 Class A Actual Hypothetical (5% return before expenses) Class C Actual Hypothetical (5% return before expenses) Class I Actual Hypothetical (5% return before expenses) Ending Account Value April 30, 2015 Expenses Paid During Period* $1,000.00 1,000.00 $1,079.20 1,018.60 $ 6.44 6.26 $1,000.00 1,000.00 $1,075.60 1,014.88 $10.29 9.99 $1,000.00 1,000.00 $1,080.50 1,019.84 $ 5.16 5.01 * Expenses are equal to an annualized expense ratio for the six-month period ended April 30, 2015 of 1.25%, 2.00% and 1.00% for Class A, Class C and Class I Shares, respectively, for the Fund, multiplied by the average account value over the period, multiplied by the number of days in the most recent period (181), then divided by 365 to reflect the period. The Funds’ ending account values on the first line in the table are based on the actual six month total returns for the Fund of 7.92%, 7.56% and 8.05% for Class A, Class C and Class I Shares, respectively. 6 . SKYBRIDGE DIVIDEND VALUE FUND Portfolio Holdings Summary Table April 30, 2015 (Unaudited) The following table presents a summary by sector of the portfolio holdings of the Fund: % of Net Assets COMMON STOCKS: Consumer Discretionary . . . .
. . .
. . .
. . .
. . .
. . .
. . .
. . .
. . .
. . .
. . .
. . .
. . Energy . .
. . .
. . .
. . .
. . .
. . .
. . .
. . .
. . .
. . .
. . .
. . .
. . .
. . .
. . .
. . .
. . .
. . .
. Industrials . . .
. . .
. . .
. . .
. . .
. . .
. . .
. . .
. . .
. . .
. . .
. . .
. . .
. . .
. . .
. . .
. . . Consumer Staples .
. . .
. . .
. . .
. . .
. . .
. . .
. . .
. . .
. . .
. . .
. . .
. . .
. . .
. . .
. Information Technology . . .
. . .
. . .
. . .
. . .
. . .
. . .
. . .
. . .
. . .
. . .
. . .
. . .
. Health Care . . .
. . .
. . .
. . .
. . .
. . .
. . .
. . .
. . .
. . .
. . .
. . .
. . .
. . .
. . .
. . .
. . Materials . .
. . .
. . .
. . .
. . .
. . .
. . .
. . .
. . .
. . .
. . .
. . .
. . .
. . .
. . .
. . .
. . .
. . Telecommunication Services . .
. . .
. . .
. . .
. . .
. . .
. . .
. . .
. . .
. . .
. . .
. . . Short-Term Investment.
. . .
. . .
. . .
. . .
. . .
. . .
. . .
. . .
. . .
. . .
. . .
. . .
. . .
. Other Assets in Excess of Liabilities . . .
. . .
. . .
. . .
. . .
. . .
. . .
. . .
. . .
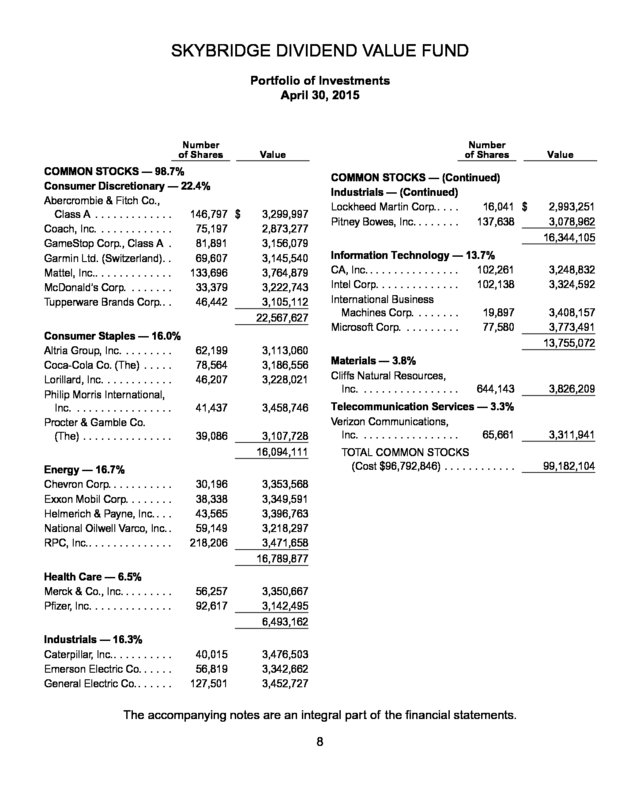
. NET ASSETS Value 22.4% $ 22,567,627 16.7 16,789,877 16.3 16,344,105 16.0 16,094,111 13.7 13,755,072 6.5 6,493,162 3.8 3,826,209 3.3 3,311,941 1.3 1,250,035 0.0 37,124 100.0% $100,469,263 Portfolio holdings are subject to change at any time. The accompanying notes are an integral part of the financial statements. 7 . SKYBRIDGE DIVIDEND VALUE FUND Portfolio of Investments April 30, 2015 Number of Shares COMMON STOCKS — 98.7% Consumer Discretionary — 22.4% Abercrombie & Fitch Co., Class A . . . .
. . .
. . .
. . . 146,797 $ Coach, Inc.
. . .
. . .
. . .
. . . 75,197 GameStop Corp., Class A . 81,891 Garmin Ltd.
(Switzerland). . 69,607 Mattel, Inc.. .
. . .
. . .
. . .
. . 133,696 McDonald’s Corp. .
. . .
. . . 33,379 Tupperware Brands Corp..
. 46,442 Consumer Staples — 16.0% Altria Group, Inc. . .
. . .
. . . Coca-Cola Co.
(The) . . .
. . Lorillard, Inc. .
. . .
. . .
. . .
. Philip Morris International, Inc. . .
. . .
. . .
. . .
. . .
. . Procter & Gamble Co. (The) . .
. . .
. . .
. . .
. . .
. Number of Shares Value COMMON STOCKS — (Continued) Industrials — (Continued) Lockheed Martin Corp.. . .
. 16,041 $ Pitney Bowes, Inc. . .
. . .
. . 137,638 3,299,997 2,873,277 3,156,079 3,145,540 3,764,879 3,222,743 3,105,112 22,567,627 62,199 78,564 46,207 3,113,060 3,186,556 3,228,021 41,437 3,458,746 39,086 Information Technology — 13.7% CA, Inc. .
. . .
. . .
. . .
. . .
. . 102,261 Intel Corp. .
. . .
. . .
. . .
. . . 102,138 International Business Machines Corp.
. . .
. . .
. 19,897 Microsoft Corp. . .
. . .
. . .
. 77,580 3,107,728 16,094,111 Energy — 16.7% Chevron Corp. . .
. . .
. . .
. . Exxon Mobil Corp. .
. . .
. . . Helmerich & Payne, Inc.
. . . National Oilwell Varco, Inc.
. RPC, Inc.. . .
. . .
. . .
. . .
. . 30,196 38,338 43,565 59,149 218,206 56,257 92,617 40,015 56,819 127,501 3,248,832 3,324,592 3,408,157 3,773,491 13,755,072 644,143 3,826,209 3,311,941 TOTAL COMMON STOCKS (Cost $96,792,846) . .
. . .
. . .
. . .
. 99,182,104 3,350,667 3,142,495 6,493,162 Industrials — 16.3% Caterpillar, Inc.. . .
. . .
. . .
. Emerson Electric Co. . .
. . . General Electric Co.
. . .
. . . 2,993,251 3,078,962 16,344,105 Telecommunication Services — 3.3% Verizon Communications, Inc.
. . .
. . .
. . .
. . .
. . .
. 65,661 3,353,568 3,349,591 3,396,763 3,218,297 3,471,658 16,789,877 Health Care — 6.5% Merck & Co., Inc. . .
. . .
. . . Pfizer, Inc.
. . .
. . .
. . .
. . .
. Materials — 3.8% Cliffs Natural Resources, Inc. . .
. . .
. . .
. . .
. . .
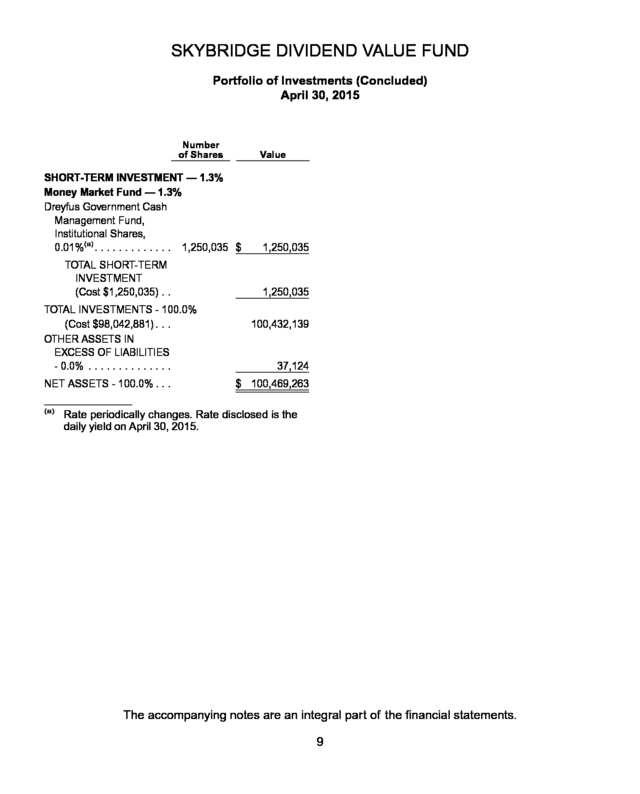
. . Value 3,476,503 3,342,662 3,452,727 The accompanying notes are an integral part of the financial statements. 8 . SKYBRIDGE DIVIDEND VALUE FUND Portfolio of Investments (Concluded) April 30, 2015 Number of Shares Value SHORT-TERM INVESTMENT — 1.3% Money Market Fund — 1.3% Dreyfus Government Cash Management Fund, Institutional Shares, 0.01%(a) . . . .
. . .
. . .
. . .
1,250,035 $ TOTAL SHORT-TERM INVESTMENT (Cost $1,250,035) . . TOTAL INVESTMENTS - 100.0% (Cost $98,042,881) . .
. OTHER ASSETS IN EXCESS OF LIABILITIES - 0.0% . . .
. . .
. . .
. . .
. . NET ASSETS - 100.0% . .
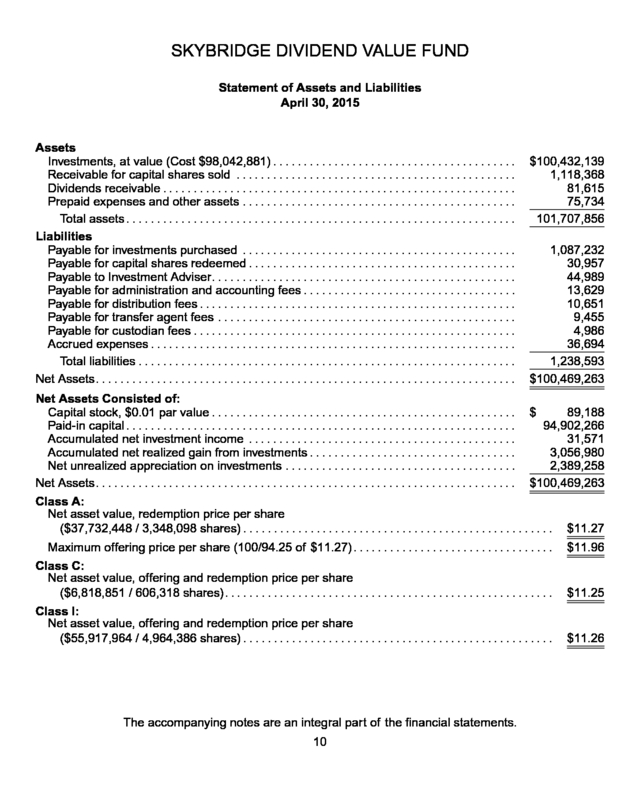
. (a) 1,250,035 1,250,035 100,432,139 37,124 $ 100,469,263 Rate periodically changes. Rate disclosed is the daily yield on April 30, 2015. The accompanying notes are an integral part of the financial statements. 9 . SKYBRIDGE DIVIDEND VALUE FUND Statement of Assets and Liabilities April 30, 2015 Assets Investments, at value (Cost $98,042,881) . . . .
. . .
. . .
. . .
. . .
. . .
. . .
. . .
. . .
. . .
. . .
. . .
. . . Receivable for capital shares sold .
. . .
. . .
. . .
. . .
. . .
. . .
. . .
. . .
. . .
. . .
. . .
. . .
. . .
. . .
. . . Dividends receivable .
. . .
. . .
. . .
. . .
. . .
. . .
. . .
. . .
. . .
. . .
. . .
. . .
. . .
. . .
. . .
. . .
. . .
. . .
. . . Prepaid expenses and other assets .
. . .
. . .
. . .
. . .
. . .
. . .
. . .
. . .
. . .
. . .
. . .
. . .
. . .
. . .
. . Total assets . .
. . .
. . .
. . .
. . .
. . .
. . .
. . .
. . .
. . .
. . .
. . .
. . .
. . .
. . .
. . .
. . .
. . .
. . .
. . .
. . .
. . Liabilities Payable for investments purchased . .
. . .
. . .
. . .
. . .
. . .
. . .
. . .
. . .
. . .
. . .
. . .
. . .
. . .
. . .
. Payable for capital shares redeemed . . .
. . .
. . .
. . .
. . .
. . .
. . .
. . .
. . .
. . .
. . .
. . .
. . .
. . .
. . Payable to Investment Adviser. .
. . .
. . .
. . .
. . .
. . .
. . .
. . .
. . .
. . .
. . .
. . .
. . .
. . .
. . .
. . .
. . . Payable for administration and accounting fees .
. . .
. . .
. . .
. . .
. . .
. . .
. . .
. . .
. . .
. . .
. . .
. Payable for distribution fees . . .
. . .
. . .
. . .
. . .
. . .
. . .
. . .
. . .
. . .
. . .
. . .
. . .
. . .
. . .
. . .
. . .
. Payable for transfer agent fees . . .
. . .
. . .
. . .
. . .
. . .
. . .
. . .
. . .
. . .
. . .
. . .
. . .
. . .
. . .
. . .
. Payable for custodian fees . . .
. . .
. . .
. . .
. . .
. . .
. . .
. . .
. . .
. . .
. . .
. . .
. . .
. . .
. . .
. . .
. . .
. . Accrued expenses . .
. . .
. . .
. . .
. . .
. . .
. . .
. . .
. . .
. . .
. . .
. . .
. . .
. . .
. . .
. . .
. . .
. . .
. . .
. . .
. Total liabilities . . .
. . .
. . .
. . .
. . .
. . .
. . .
. . .
. . .
. . .
. . .
. . .
. . .
. . .
. . .
. . .
. . .
. . .
. . .
. . .
. . Net Assets. .
. . .
. . .
. . .
. . .
. . .
. . .
. . .
. . .
. . .
. . .
. . .
. . .
. . .
. . .
. . .
. . .
. . .
. . .
. . .
. . .
. . .
. . .
. Net Assets Consisted of: Capital stock, $0.01 par value . . .
. . .
. . .
. . .
. . .
. . .
. . .
. . .
. . .
. . .
. . .
. . .
. . .
. . .
. . .
. . .
. . Paid-in capital . .
. . .
. . .
. . .
. . .
. . .
. . .
. . .
. . .
. . .
. . .
. . .
. . .
. . .
. . .
. . .
. . .
. . .
. . .
. . .
. . .
. . Accumulated net investment income . .
. . .
. . .
. . .
. . .
. . .
. . .
. . .
. . .
. . .
. . .
. . .
. . .
. . .
. . . Accumulated net realized gain from investments .
. . .
. . .
. . .
. . .
. . .
. . .
. . .
. . .
. . .
. . .
. . . Net unrealized appreciation on investments .
. . .
. . .
. . .
. . .
. . .
. . .
. . .
. . .
. . .
. . .
. . .
. . .
. Net Assets. . .
. . .
. . .
. . .
. . .
. . .
. . .
. . .
. . .
. . .
. . .
. . .
. . .
. . .
. . .
. . .
. . .
. . .
. . .
. . .
. . .
. . .
. . . $100,432,139 1,118,368 81,615 75,734 101,707,856 1,087,232 30,957 44,989 13,629 10,651 9,455 4,986 36,694 1,238,593 $100,469,263 $ 89,188 94,902,266 31,571 3,056,980 2,389,258 $100,469,263 Class A: Net asset value, redemption price per share ($37,732,448 / 3,348,098 shares) .
. . .
. . .
. . .
. . .
. . .
. . .
. . .
. . .
. . .
. . .
. . .
. . .
. . .
. . .
. . .
. . .
. . $11.27 Maximum offering price per share (100/94.25 of $11.27) . .
. . .
. . .
. . .
. . .
. . .
. . .
. . .
. . .
. . .
. . .
. $11.96 Class C: Net asset value, offering and redemption price per share ($6,818,851 / 606,318 shares). . .
. . .
. . .
. . .
. . .
. . .
. . .
. . .
. . .
. . .
. . .
. . .
. . .
. . .
. . .
. . .
. . .
. . . $11.25 Class I: Net asset value, offering and redemption price per share ($55,917,964 / 4,964,386 shares) .
. . .
. . .
. . .
. . .
. . .
. . .
. . .
. . .
. . .
. . .
. . .
. . .
. . .
. . .
. . .
. . .
. . $11.26 The accompanying notes are an integral part of the financial statements. 10 . SKYBRIDGE DIVIDEND VALUE FUND Statement of Operations For the Year Ended April 30, 2015 Investment Income Dividends . . . .
. . .
. . .
. . .
. . .
. . .
. . .
. . .
. . .
. . .
. . .
. . .
. . .
. . .
. . .
. . .
. . .
. . .
. . .
. . .
. . .
. . .
. . . Interest .
. . .
. . .
. . .
. . .
. . .
. . .
. . .
. . .
. . .
. . .
. . .
. . .
. . .
. . .
. . .
. . .
. . .
. . .
. . .
. . .
. . .
. . .
. . .
. . Total investment income . .
. . .
. . .
. . .
. . .
. . .
. . .
. . .
. . .
. . .
. . .
. . .
. . .
. . .
. . .
. . .
. . .
. . .
. . Expenses Advisory fees (Note 2) . .
. . .
. . .
. . .
. . .
. . .
. . .
. . .
. . .
. . .
. . .
. . .
. . .
. . .
. . .
. . .
. . .
. . .
. . .
. . . Printing and shareholder reporting fees .
. . .
. . .
. . .
. . .
. . .
. . .
. . .
. . .
. . .
. . .
. . .
. . .
. . .
. . .
. Administration and accounting fees (Note 2). . .
. . .
. . .
. . .
. . .
. . .
. . .
. . .
. . .
. . .
. . .
. . .
. . .
. Transfer agent fees (Note 2). . .
. . .
. . .
. . .
. . .
. . .
. . .
. . .
. . .
. . .
. . .
. . .
. . .
. . .
. . .
. . .
. . .
. . . Distribution fees (Class A) (Note 2).
. . .
. . .
. . .
. . .
. . .
. . .
. . .
. . .
. . .
. . .
. . .
. . .
. . .
. . .
. . .
. . Legal fees . .
. . .
. . .
. . .
. . .
. . .
. . .
. . .
. . .
. . .
. . .
. . .
. . .
. . .
. . .
. . .
. . .
. . .
. . .
. . .
. . .
. . .
. . .
. Custodian fees (Note 2) . . .
. . .
. . .
. . .
. . .
. . .
. . .
. . .
. . .
. . .
. . .
. . .
. . .
. . .
. . .
. . .
. . .
. . .
. . . Audit fees .
. . .
. . .
. . .
. . .
. . .
. . .
. . .
. . .
. . .
. . .
. . .
. . .
. . .
. . .
. . .
. . .
. . .
. . .
. . .
. . .
. . .
. . .
. . . Registration and filing fees .
. . .
. . .
. . .
. . .
. . .
. . .
. . .
. . .
. . .
. . .
. . .
. . .
. . .
. . .
. . .
. . .
. . .
. . . Trustees’ and officers’ fees (Note 2) .
. . .
. . .
. . .
. . .
. . .
. . .
. . .
. . .
. . .
. . .
. . .
. . .
. . .
. . .
. . .
. Distribution and shareholder servicing fees (Class C) (Note 2) . . .
. . .
. . .
. . .
. . .
. . .
. . .
. . . Other expenses .
. . .
. . .
. . .
. . .
. . .
. . .
. . .
. . .
. . .
. . .
. . .
. . .
. . .
. . .
. . .
. . .
. . .
. . .
. . .
. . .
. . . Total expenses before waivers and reimbursements .
. . .
. . .
. . .
. . .
. . .
. . .
. . .
. . .
. . .
. . . Less: waivers and reimbursements (Note 2) .
. . .
. . .
. . .
. . .
. . .
. . .
. . .
. . .
. . .
. . .
. . .
. . .
. Net expenses after waivers and reimbursements . . .
. . .
. . .
. . .
. . .
. . .
. . .
. . .
. . .
. . .
. . .
. . . Net investment income .
. . .
. . .
. . .
. . .
. . .
. . .
. . .
. . .
. . .
. . .
. . .
. . .
. . .
. . .
. . .
. . .
. . .
. . .
. . . Net realized and unrealized gain from investments: Net realized gain from investments .
. . .
. . .
. . .
. . .
. . .
. . .
. . .
. . .
. . .
. . .
. . .
. . .
. . .
. . .
. . .
. . Net change in unrealized appreciation/(depreciation) on investments . .
. . .
. . .
. . .
. . .
. . .
. Net realized and unrealized gain on investments . . .
. . .
. . .
. . .
. . .
. . .
. . .
. . .
. . .
. . .
. . .
. . . Net increase in net assets resulting from operations .
. . .
. . .
. . .
. . .
. . .
. . .
. . .
. . .
. . .
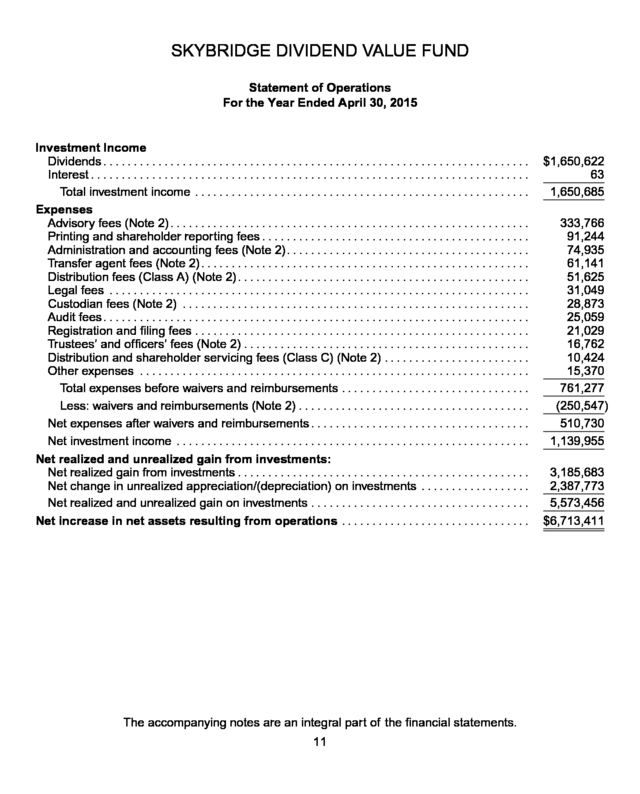
. . . The accompanying notes are an integral part of the financial statements. 11 $1,650,622 63 1,650,685 333,766 91,244 74,935 61,141 51,625 31,049 28,873 25,059 21,029 16,762 10,424 15,370 761,277 (250,547) 510,730 1,139,955 3,185,683 2,387,773 5,573,456 $6,713,411 .
SKYBRIDGE DIVIDEND VALUE FUND Statements of Changes in Net Assets For the Year Ended April 30, 2015 Increase in net assets from operations: Net investment income . . . .
. . .
. . .
. . .
. . .
. . .
. . .
. . .
. . .
. . .
. . .
. . .
. . Net realized gain from investments . .
. . .
. . .
. . .
. . .
. . .
. . .
. . .
. . .
. . . Net change in unrealized appreciation/(depreciation) on investments .
. . .
. . .
. . .
. . .
. . .
. . .
. . .
. . .
. . .
. . .
. . .
. . .
. . .
. . .
. . .
. Net increase in net assets resulting from operations . . .
. . .
. . .
. . .
. . .
. Less Dividends and Distributions to Shareholders from: Net investment income: Class A. . .
. . .
. . .
. . .
. . .
. . .
. . .
. . .
. . .
. . .
. . .
. . .
. . .
. . .
. . .
. . .
. . . Class C.
. . .
. . .
. . .
. . .
. . .
. . .
. . .
. . .
. . .
. . .
. . .
. . .
. . .
. . .
. . .
. . .
. . Class I . .
. . .
. . .
. . .
. . .
. . .
. . .
. . .
. . .
. . .
. . .
. . .
. . .
. . .
. . .
. . .
. . .
. Total net investment income . . .
. . .
. . .
. . .
. . .
. . .
. . .
. . .
. . .
. . .
. . .
. . Net realized capital gains: Class A. .
. . .
. . .
. . .
. . .
. . .
. . .
. . .
. . .
. . .
. . .
. . .
. . .
. . .
. . .
. . .
. . .
. Class C. . .
. . .
. . .
. . .
. . .
. . .
. . .
. . .
. . .
. . .
. . .
. . .
. . .
. . .
. . .
. . .
. . . Class I .
. . .
. . .
. . .
. . .
. . .
. . .
. . .
. . .
. . .
. . .
. . .
. . .
. . .
. . .
. . .
. . .
. . Total net realized capital gains . .
. . .
. . .
. . .
. . .
. . .
. . .
. . .
. . .
. . .
. . .
. Increase in Net Assets Derived from Capital Share Transactions (Note 4) . . .
. . .
. . .
. . .
. . .
. . .
. . .
. . .
. . .
. . .
. . .
. . .
. . .
. . .
. . .
. . .
. . .
. Total increase in net assets . . .
. . .
. . .
. . .
. . .
. . .
. . .
. . .
. . .
. . .
. . .
. . .
. Net assets Beginning of period . . .
. . .
. . .
. . .
. . .
. . .
. . .
. . .
. . .
. . .
. . .
. . .
. . .
. . . End of period .
. . .
. . .
. . .
. . .
. . .
. . .
. . .
. . .
. . .
. . .
. . .
. . .
. . .
. . .
. . .
. Accumulated net investment income, end of period. . .
. . .
. . .
. . .
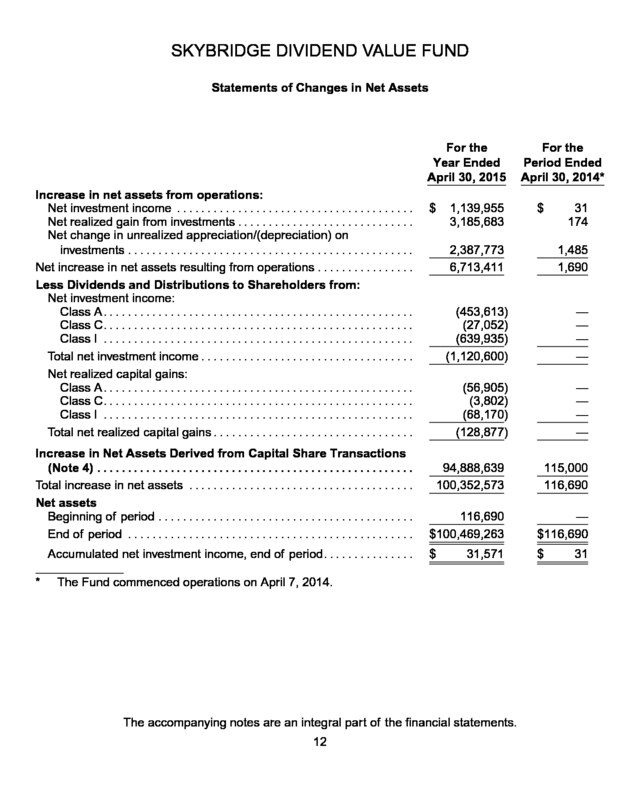
. . . * $ 1,139,955 3,185,683 $ 31 174 2,387,773 6,713,411 1,485 1,690 (453,613) (27,052) (639,935) (1,120,600) — — — — (56,905) (3,802) (68,170) (128,877) — — — — 94,888,639 100,352,573 115,000 116,690 116,690 $100,469,263 — $116,690 $ $ 31,571 The Fund commenced operations on April 7, 2014. The accompanying notes are an integral part of the financial statements. 12 For the Period Ended April 30, 2014* 31 .
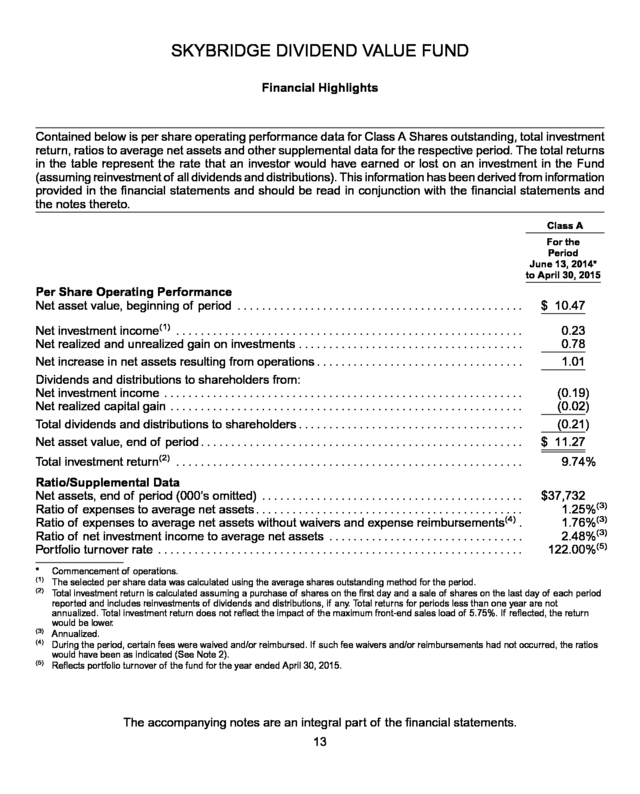
SKYBRIDGE DIVIDEND VALUE FUND Financial Highlights Contained below is per share operating performance data for Class A Shares outstanding, total investment return, ratios to average net assets and other supplemental data for the respective period. The total returns in the table represent the rate that an investor would have earned or lost on an investment in the Fund (assuming reinvestment of all dividends and distributions). This information has been derived from information provided in the financial statements and should be read in conjunction with the financial statements and the notes thereto. Class A For the Period June 13, 2014* to April 30, 2015 Per Share Operating Performance Net asset value, beginning of period . .
. . .
. . .
. . .
. . .
. . .
. . .
. . .
. . .
. . .
. . .
. . .
. . .
. . .
. . .
. . . Net investment income(1) .
. . .
. . .
. . .
. . .
. . .
. . .
. . .
. . .
. . .
. . .
. . .
. . .
. . .
. . .
. . .
. . .
. . .
. . .
. . Net realized and unrealized gain on investments . .
. . .
. . .
. . .
. . .
. . .
. . .
. . .
. . .
. . .
. . .
. . .
. . Net increase in net assets resulting from operations . .
. . .
. . .
. . .
. . .
. . .
. . .
. . .
. . .
. . .
. . .
. . Dividends and distributions to shareholders from: Net investment income . .
. . .
. . .
. . .
. . .
. . .
. . .
. . .
. . .
. . .
. . .
. . .
. . .
. . .
. . .
. . .
. . .
. . .
. . .
. . . Net realized capital gain .
. . .
. . .
. . .
. . .
. . .
. . .
. . .
. . .
. . .
. . .
. . .
. . .
. . .
. . .
. . .
. . .
. . .
. . .
. . . Total dividends and distributions to shareholders .
. . .
. . .
. . .
. . .
. . .
. . .
. . .
. . .
. . .
. . .
. . .
. . . Net asset value, end of period .
. . .
. . .
. . .
. . .
. . .
. . .
. . .
. . .
. . .
. . .
. . .
. . .
. . .
. . .
. . .
. . .
. . .
. Total investment return(2) . . .
. . .
. . .
. . .
. . .
. . .
. . .
. . .
. . .
. . .
. . .
. . .
. . .
. . .
. . .
. . .
. . .
. . .
. . . Ratio/Supplemental Data Net assets, end of period (000’s omitted) .
. . .
. . .
. . .
. . .
. . .
. . .
. . .
. . .
. . .
. . .
. . .
. . .
. . .
. . . Ratio of expenses to average net assets .
. . .
. . .
. . .
. . .
. . .
. . .
. . .
. . .
. . .
. . .
. . .
. . .
. . .
. . .
. Ratio of expenses to average net assets without waivers and expense reimbursements(4) . Ratio of net investment income to average net assets . . .
. . .
. . .
. . .
. . .
. . .
. . .
. . .
. . .
. . .
. . Portfolio turnover rate . .
. . .
. . .
. . .
. . .
. . .
. . .
. . .
. . .
. . .
. . .
. . .
. . .
. . .
. . .
. . .
. . .
. . .
. . .
. . .
. * (1) (2) (3) (4) (5) $ 10.47 0.23 0.78 1.01 (0.19) (0.02) (0.21) $ 11.27 9.74% $37,732 1.25%(3) 1.76%(3) 2.48%(3) 122.00%(5) Commencement of operations. The selected per share data was calculated using the average shares outstanding method for the period. Total investment return is calculated assuming a purchase of shares on the first day and a sale of shares on the last day of each period reported and includes reinvestments of dividends and distributions, if any. Total returns for periods less than one year are not annualized. Total investment return does not reflect the impact of the maximum front-end sales load of 5.75%.
If reflected, the return would be lower. Annualized. During the period, certain fees were waived and/or reimbursed. If such fee waivers and/or reimbursements had not occurred, the ratios would have been as indicated (See Note 2). Reflects portfolio turnover of the fund for the year ended April 30, 2015. The accompanying notes are an integral part of the financial statements. 13 . SKYBRIDGE DIVIDEND VALUE FUND Financial Highlights Contained below is per share operating performance data for Class C Shares outstanding, total investment return, ratios to average net assets and other supplemental data for the respective period. The total returns in the table represent the rate that an investor would have earned or lost on an investment in the Fund (assuming reinvestment of all dividends and distributions). This information has been derived from information provided in the financial statements and should be read in conjunction with the financial statements and the notes thereto. Class C For the Period October 17, 2014* to April 30, 2015 Per Share Operating Performance Net asset value, beginning of period . .
. . .
. . .
. . .
. . .
. . .
. . .
. . .
. . .
. . .
. . .
. . .
. . .
. . .
. . .
. . Net investment income(1) . .
. . .
. . .
. . .
. . .
. . .
. . .
. . .
. . .
. . .
. . .
. . .
. . .
. . .
. . .
. . .
. . .
. . .
. . . Net realized and unrealized gain on investments .
. . .
. . .
. . .
. . .
. . .
. . .
. . .
. . .
. . .
. . .
. . .
. . Net increase in net assets resulting from operations . .
. . .
. . .
. . .
. . .
. . .
. . .
. . .
. . .
. . .
. . .
. Dividends and distributions to shareholders from: Net investment income . . .
. . .
. . .
. . .
. . .
. . .
. . .
. . .
. . .
. . .
. . .
. . .
. . .
. . .
. . .
. . .
. . .
. . .
. . .
. Net realized capital gain . . .
. . .
. . .
. . .
. . .
. . .
. . .
. . .
. . .
. . .
. . .
. . .
. . .
. . .
. . .
. . .
. . .
. . .
. . . Total dividends and distributions to shareholders .
. . .
. . .
. . .
. . .
. . .
. . .
. . .
. . .
. . .
. . .
. . .
. . Net asset value, end of period. .
. . .
. . .
. . .
. . .
. . .
. . .
. . .
. . .
. . .
. . .
. . .
. . .
. . .
. . .
. . .
. . .
. . Total investment return(2) . .
. . .
. . .
. . .
. . .
. . .
. . .
. . .
. . .
. . .
. . .
. . .
. . .
. . .
. . .
. . .
. . .
. . .
. . . Ratio/Supplemental Data Net assets, end of period (000’s omitted) .
. . .
. . .
. . .
. . .
. . .
. . .
. . .
. . .
. . .
. . .
. . .
. . .
. . .
. . Ratio of expenses to average net assets. .
. . .
. . .
. . .
. . .
. . .
. . .
. . .
. . .
. . .
. . .
. . .
. . .
. . .
. . Ratio of expenses to average net assets without waivers and expense reimbursements(4) . .
. . .
. . .
. . .
. . .
. . .
. . .
. . .
. . .
. . .
. . .
. . .
. . .
. . .
. . .
. . .
. . .
. . .
. . .
. . .
. Ratio of net investment income to average net assets . . .
. . .
. . .
. . .
. . .
. . .
. . .
. . .
. . .
. . .
. Portfolio turnover rate . . .
. . .
. . .
. . .
. . .
. . .
. . .
. . .
. . .
. . .
. . .
. . .
. . .
. . .
. . .
. . .
. . .
. . .
. . .
. . * (1) (2) (3) (4) (5) $ 9.95 0.08 1.33 1.41 (0.09) (0.02) (0.11) $ 11.25 14.26% $ 6,819 2.00%(3) 2.32%(3) 1.46%(3) 122.00%(5) Commencement of operations. The selected per share data was calculated using the average shares outstanding method for the period. Total investment return is calculated assuming a purchase of shares on the first day and a sale of shares on the last day of each period reported and includes reinvestment of dividends and distributions, if any. Total returns for periods less than one year are not annualized. Annualized. During the period, certain fees were waived and/or reimbursed.
If such fee waivers and/or reimbursements had not occurred, the ratios would have been as indicated (See Note 2). Reflects portfolio turnover of the fund for the year ended April 30, 2015. The accompanying notes are an integral part of the financial statements. 14 . SKYBRIDGE DIVIDEND VALUE FUND Financial Highlights Contained below is per share operating performance data for Class I Shares outstanding, total investment return, ratios to average net assets and other supplemental data for the respective period. The total returns in the table represent the rate that an investor would have earned or lost on an investment in the Fund (assuming reinvestment of all dividends and distributions). This information has been derived from information provided in the financial statements and should be read in conjunction with the financial statements and the notes thereto. Class I For the For the Period Year Ended April 7, 2014* April 30, 2015 to April 30, 2014 Per Share Operating Performance Net asset value, beginning of period . .
. . .
. . .
. . .
. . .
. . .
. . .
. . .
. . .
. . .
. . .
. . .
. . Net investment income(1) . .
. . .
. . .
. . .
. . .
. . .
. . .
. . .
. . .
. . .
. . .
. . .
. . .
. . .
. . .
. . . Net realized and unrealized gain on investments .
. . .
. . .
. . .
. . .
. . .
. . .
. . .
. . .
. . Net increase in net assets resulting from operations. .
. . .
. . .
. . .
. . .
. . .
. . .
. . .
. Dividends and distributions to shareholders from: Net investment income . . .
. . .
. . .
. . .
. . .
. . .
. . .
. . .
. . .
. . .
. . .
. . .
. . .
. . .
. . .
. . .
. Net realized capital gain . . .
. . .
. . .
. . .
. . .
. . .
. . .
. . .
. . .
. . .
. . .
. . .
. . .
. . .
. . .
. . . Total dividends and distributions to shareholders.
. . .
. . .
. . .
. . .
. . .
. . .
. . .
. . .
. . Net asset value, end of period . .
. . .
. . .
. . .
. . .
. . .
. . .
. . .
. . .
. . .
. . .
. . .
. . .
. . .
. Total investment return(3) . . .
. . .
. . .
. . .
. . .
. . .
. . .
. . .
. . .
. . .
. . .
. . .
. . .
. . .
. . .
. . Ratio/Supplemental Data Net assets, end of period (000’s omitted) . .
. . .
. . .
. . .
. . .
. . .
. . .
. . .
. . .
. . .
. . .
. Ratio of expenses to average net assets . . .
. . .
. . .
. . .
. . .
. . .
. . .
. . .
. . .
. . .
. . . Ratio of expenses to average net assets without waivers and expense reimbursements(5) .
. . .
. . .
. . .
. . .
. . .
. . .
. . .
. . .
. . .
. . .
. . .
. . .
. . .
. . .
. . .
. . .
. . Ratio of net investment income to average net assets . .
. . .
. . .
. . .
. . .
. . .
. . .
. . Portfolio turnover rate . .
. . .
. . .
. . .
. . .
. . .
. . .
. . .
. . .
. . .
. . .
. . .
. . .
. . .
. . .
. . .
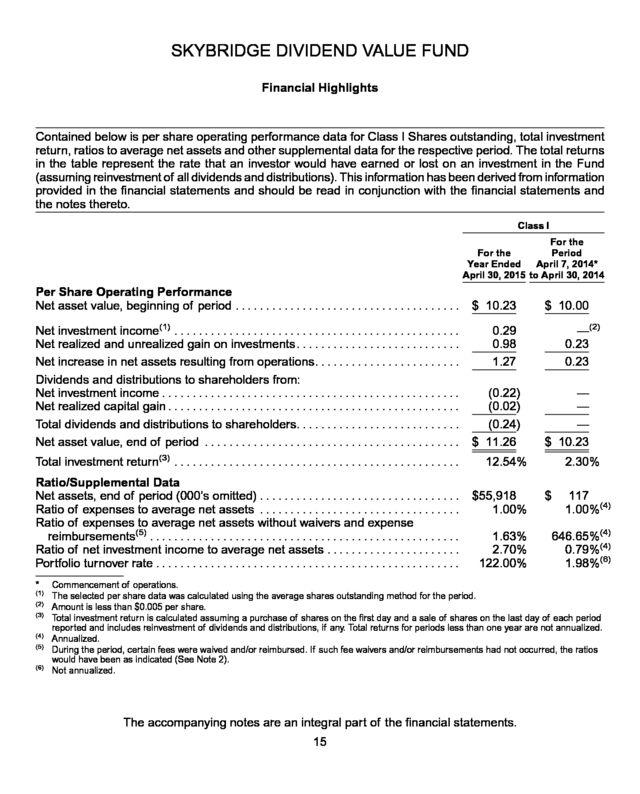
. . . * (1) (2) (3) (4) (5) (6) $ 10.23 $ 10.00 —(2) 0.23 0.23 0.29 0.98 1.27 (0.22) (0.02) (0.24) $ 11.26 — — — $ 10.23 12.54% $55,918 1.00% 1.63% 2.70% 122.00% 2.30% $ 117 1.00%(4) 646.65%(4) 0.79%(4) 1.98%(6) Commencement of operations. The selected per share data was calculated using the average shares outstanding method for the period. Amount is less than $0.005 per share. Total investment return is calculated assuming a purchase of shares on the first day and a sale of shares on the last day of each period reported and includes reinvestment of dividends and distributions, if any.
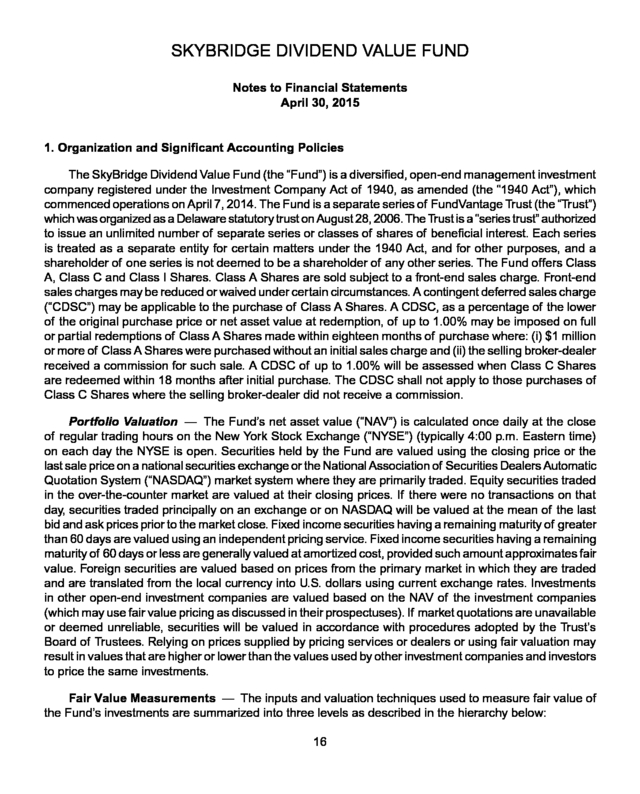
Total returns for periods less than one year are not annualized. Annualized. During the period, certain fees were waived and/or reimbursed. If such fee waivers and/or reimbursements had not occurred, the ratios would have been as indicated (See Note 2). Not annualized. The accompanying notes are an integral part of the financial statements. 15 . SKYBRIDGE DIVIDEND VALUE FUND Notes to Financial Statements April 30, 2015 1. Organization and Significant Accounting Policies The SkyBridge Dividend Value Fund (the “Fund”) is a diversified, open-end management investment company registered under the Investment Company Act of 1940, as amended (the “1940 Act”), which commenced operations on April 7, 2014. The Fund is a separate series of FundVantage Trust (the “Trust”) which was organized as a Delaware statutory trust on August 28, 2006. The Trust is a “series trust” authorized to issue an unlimited number of separate series or classes of shares of beneficial interest.
Each series is treated as a separate entity for certain matters under the 1940 Act, and for other purposes, and a shareholder of one series is not deemed to be a shareholder of any other series. The Fund offers Class A, Class C and Class I Shares. Class A Shares are sold subject to a front-end sales charge.
Front-end sales charges may be reduced or waived under certain circumstances. A contingent deferred sales charge (“CDSC”) may be applicable to the purchase of Class A Shares. A CDSC, as a percentage of the lower of the original purchase price or net asset value at redemption, of up to 1.00% may be imposed on full or partial redemptions of Class A Shares made within eighteen months of purchase where: (i) $1 million or more of Class A Shares were purchased without an initial sales charge and (ii) the selling broker-dealer received a commission for such sale.
A CDSC of up to 1.00% will be assessed when Class C Shares are redeemed within 18 months after initial purchase. The CDSC shall not apply to those purchases of Class C Shares where the selling broker-dealer did not receive a commission. Portfolio Valuation — The Fund’s net asset value (“NAV”) is calculated once daily at the close of regular trading hours on the New York Stock Exchange (“NYSE”) (typically 4:00 p.m. Eastern time) on each day the NYSE is open.
Securities held by the Fund are valued using the closing price or the last sale price on a national securities exchange or the National Association of Securities Dealers Automatic Quotation System (“NASDAQ”) market system where they are primarily traded. Equity securities traded in the over-the-counter market are valued at their closing prices. If there were no transactions on that day, securities traded principally on an exchange or on NASDAQ will be valued at the mean of the last bid and ask prices prior to the market close.
Fixed income securities having a remaining maturity of greater than 60 days are valued using an independent pricing service. Fixed income securities having a remaining maturity of 60 days or less are generally valued at amortized cost, provided such amount approximates fair value. Foreign securities are valued based on prices from the primary market in which they are traded and are translated from the local currency into U.S.
dollars using current exchange rates. Investments in other open-end investment companies are valued based on the NAV of the investment companies (which may use fair value pricing as discussed in their prospectuses). If market quotations are unavailable or deemed unreliable, securities will be valued in accordance with procedures adopted by the Trust’s Board of Trustees.
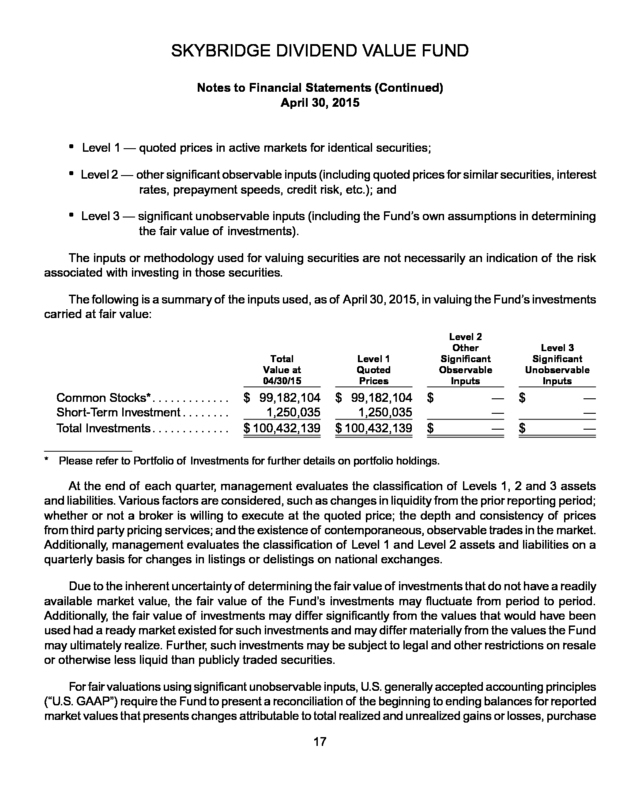
Relying on prices supplied by pricing services or dealers or using fair valuation may result in values that are higher or lower than the values used by other investment companies and investors to price the same investments. Fair Value Measurements — The inputs and valuation techniques used to measure fair value of the Fund’s investments are summarized into three levels as described in the hierarchy below: 16 . SKYBRIDGE DIVIDEND VALUE FUND Notes to Financial Statements (Continued) April 30, 2015 • Level 1 — quoted prices in active markets for identical securities; • Level 2 — other significant observable inputs (including quoted prices for similar securities, interest rates, prepayment speeds, credit risk, etc.); and • Level 3 — significant unobservable inputs (including the Fund’s own assumptions in determining the fair value of investments). The inputs or methodology used for valuing securities are not necessarily an indication of the risk associated with investing in those securities. The following is a summary of the inputs used, as of April 30, 2015, in valuing the Fund’s investments carried at fair value: Total Value at 04/30/15 Common Stocks*. . . .
. . .
. . .
. . . Short-Term Investment .
. . .
. . .
. Total Investments . . .
. . .
. . .
. . .
. Level 1 Quoted Prices $ 99,182,104 1,250,035 $ 100,432,139 $ 99,182,104 1,250,035 $ 100,432,139 Level 2 Other Significant Observable Inputs $ $ — — — Level 3 Significant Unobservable Inputs $ $ — — — * Please refer to Portfolio of Investments for further details on portfolio holdings. At the end of each quarter, management evaluates the classification of Levels 1, 2 and 3 assets and liabilities. Various factors are considered, such as changes in liquidity from the prior reporting period; whether or not a broker is willing to execute at the quoted price; the depth and consistency of prices from third party pricing services; and the existence of contemporaneous, observable trades in the market. Additionally, management evaluates the classification of Level 1 and Level 2 assets and liabilities on a quarterly basis for changes in listings or delistings on national exchanges. Due to the inherent uncertainty of determining the fair value of investments that do not have a readily available market value, the fair value of the Fund’s investments may fluctuate from period to period. Additionally, the fair value of investments may differ significantly from the values that would have been used had a ready market existed for such investments and may differ materially from the values the Fund may ultimately realize. Further, such investments may be subject to legal and other restrictions on resale or otherwise less liquid than publicly traded securities. For fair valuations using significant unobservable inputs, U.S.
generally accepted accounting principles (“U.S. GAAP”) require the Fund to present a reconciliation of the beginning to ending balances for reported market values that presents changes attributable to total realized and unrealized gains or losses, purchase 17 . SKYBRIDGE DIVIDEND VALUE FUND Notes to Financial Statements (Continued) April 30, 2015 and sales, and transfers in and out of Level 3 during the period. Transfers in and out between Levels are based on values at the end of the period. U.S. GAAP also requires the Fund to disclose amounts and reasons for all transfers in and out of Level 1 and Level 2 fair value measurements.
A reconciliation of Level 3 investments is presented only when the Fund had an amount of Level 3 investments at the end of the reporting period that was meaningful in relation to its net assets. The amounts and reasons for all transfers in and out of each Level within the three-tier hierarchy are disclosed when the Fund had an amount of total transfers during the reporting period that was meaningful in relation to its net assets as of the end of the reporting period. For the year ended April 30, 2015, there were no transfers between Levels 1, 2 and 3 for the Fund. Use of Estimates — The Fund is an investment company and follows accounting and reporting guidance in the Financial Accounting Standards Board Accounting Standards Codification Topic 946. The preparation of financial statements in conformity with U.S. GAAP requires management to make estimates and assumptions that affect the amounts reported in the financial statements and accompanying notes at the date of the financial statements and the reported amounts of revenues and expenses during the period.
Actual results could differ from those estimates and those differences could be material. Investment Transactions, Investment Income and Expenses — Investment transactions are recorded on trade date for financial statement preparation purposes. Realized gains and losses on investments sold are recorded on the identified cost basis. Interest income is recorded on the accrual basis.
Dividends are recorded on the ex-dividend date. Distribution (12b-1) fees and shareholder services fees relating to a specific class are charged directly to that class. General expenses of the Trust are generally allocated to each fund in proportion to its relative daily net assets.
Expenses directly attributable to a particular fund in the Trust are charged directly to that fund. The Fund’s investment income, expenses (other than class specific expenses) and unrealized and realized gains and losses are allocated daily to each class of shares based upon the relative proportion of net assets of each class at the beginning of the day. Dividends and Distributions to Shareholders — Dividends from net investment income are declared and paid quarterly to shareholders. Distributions, if any, of net short-term capital gain and net capital gain (the excess of net long-term capital gain over the short-term capital loss) realized by the Fund, after deducting any available capital loss carryovers, are declared and paid to its shareholders annually.
Income dividends and capital gain distributions are determined in accordance with U.S. federal income tax regulations, which may differ from U.S. GAAP These differences include the treatment of non-taxable dividends, . expiring capital loss carryforwards and losses deferred due to wash sales and excise tax regulations. Permanent book and tax basis differences relating to shareholder distributions will result in reclassifications within the components of net assets. U.S.
Tax Status — No provision is made for U.S. income taxes as it is the Fund’s intention to continue to qualify for and elect the tax treatment applicable to regulated investment companies under Subchapter 18 . SKYBRIDGE DIVIDEND VALUE FUND Notes to Financial Statements (Continued) April 30, 2015 M of the Internal Revenue Code of 1986, as amended, and make the requisite distributions to its shareholders which will be sufficient to relieve it from U.S. income and excise taxes. Other — In the normal course of business, the Fund may enter into contracts that provide general indemnifications. The Fund’s maximum exposure under these arrangements is dependent on claims that may be made against the Fund in the future, and therefore, cannot be estimated; however, based on experience, the risk of material loss for such claims is considered remote. 2. Transactions with Affiliates and Related Parties SkyBridge Capital II, LLC (“SkyBridge” or the “Adviser”) serves as investment adviser to the Fund pursuant to an investment advisory agreement with the Trust (the “Advisory Agreement”).
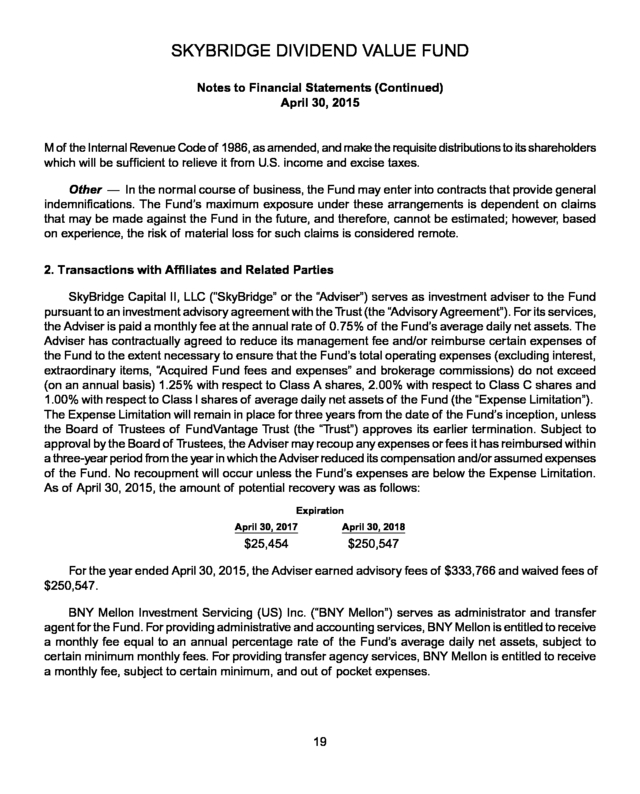
For its services, the Adviser is paid a monthly fee at the annual rate of 0.75% of the Fund’s average daily net assets. The Adviser has contractually agreed to reduce its management fee and/or reimburse certain expenses of the Fund to the extent necessary to ensure that the Fund’s total operating expenses (excluding interest, extraordinary items, “Acquired Fund fees and expenses” and brokerage commissions) do not exceed (on an annual basis) 1.25% with respect to Class A shares, 2.00% with respect to Class C shares and 1.00% with respect to Class I shares of average daily net assets of the Fund (the “Expense Limitation”). The Expense Limitation will remain in place for three years from the date of the Fund’s inception, unless the Board of Trustees of FundVantage Trust (the “Trust”) approves its earlier termination. Subject to approval by the Board of Trustees, the Adviser may recoup any expenses or fees it has reimbursed within a three-year period from the year in which the Adviser reduced its compensation and/or assumed expenses of the Fund.
No recoupment will occur unless the Fund’s expenses are below the Expense Limitation. As of April 30, 2015, the amount of potential recovery was as follows: Expiration April 30, 2017 April 30, 2018 $25,454 $250,547 For the year ended April 30, 2015, the Adviser earned advisory fees of $333,766 and waived fees of $250,547. BNY Mellon Investment Servicing (US) Inc. (“BNY Mellon”) serves as administrator and transfer agent for the Fund. For providing administrative and accounting services, BNY Mellon is entitled to receive a monthly fee equal to an annual percentage rate of the Fund’s average daily net assets, subject to certain minimum monthly fees.
For providing transfer agency services, BNY Mellon is entitled to receive a monthly fee, subject to certain minimum, and out of pocket expenses. 19 . SKYBRIDGE DIVIDEND VALUE FUND Notes to Financial Statements (Continued) April 30, 2015 The Bank of New York Mellon (the “Custodian”) provides certain custodial services to the Fund. The Custodian is entitled to receive a monthly fee, subject to certain minimum, and out of pocket expenses. Foreside Funds Distributors LLC (the “Underwriter”) provides principal underwriting services to the Fund. The Trust and the Underwriter are parties to an underwriting agreement. The Trust has adopted a distribution plan for Class A and Class C Shares in accordance with Rule 12b-1 under the 1940 Act. Pursuant to the Class A and Class C Shares plan, the Fund compensates the Underwriter for direct and indirect costs and expenses incurred in connection with advertising, marketing and other distribution services in an amount not to exceed 0.25% and 1.00% (0.75% distribution fee and 0.25% shareholder service fee), respectively, on an annualized basis of the average daily net assets of the Fund’s Class A and Class C Shares. The Trustees of the Trust who are not officers or employees of an investment adviser, sub-adviser or other service provider to the Trust receive compensation in the form of an annual retainer and per meeting fees for their services as a Trustee. The remuneration paid to the Trustees by the Fund during the year ended April 30, 2015 was $4,131. Certain employees of BNY Mellon serve as Officers of the Trust.
They are not compensated by the Fund or the Trust. 3. Investment in Securities For the year ended April 30, 2015, aggregate purchases and sales of investment securities (excluding short-term investments) of the Fund were as follows: Purchases Investment Securities . .
. . .
. . .
. . .
. . .
. . .
. . .
. . .
. . .
. . .
. . .
. . .
. . .
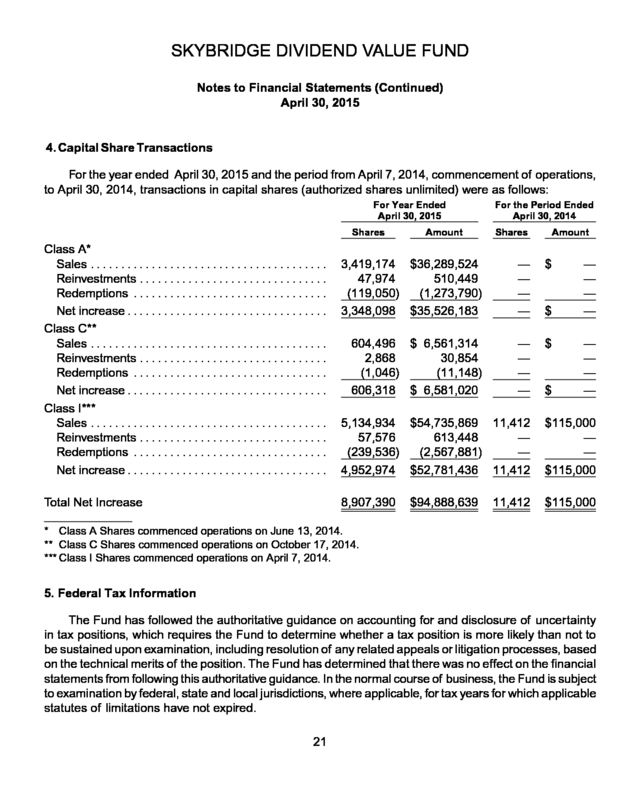
. 20 Sales $148,349,967 $54,807,814 . SKYBRIDGE DIVIDEND VALUE FUND Notes to Financial Statements (Continued) April 30, 2015 4. Capital Share Transactions For the year ended April 30, 2015 and the period from April 7, 2014, commencement of operations, to April 30, 2014, transactions in capital shares (authorized shares unlimited) were as follows: For Year Ended April 30, 2015 Shares Class A* Sales . . .
. . .
. . .
. . .
. . .
. . .
. . .
. . .
. . .
. . .
. . .
. . .
. . . Reinvestments .
. . .
. . .
. . .
. . .
. . .
. . .
. . .
. . .
. . .
. . . Redemptions .
. . .
. . .
. . .
. . .
. . .
. . .
. . .
. . .
. . .
. . .
. Net increase . . .
. . .
. . .
. . .
. . .
. . .
. . .
. . .
. . .
. . .
. . . Class C** Sales .
. . .
. . .
. . .
. . .
. . .
. . .
. . .
. . .
. . .
. . .
. . .
. . .
. . Reinvestments . .
. . .
. . .
. . .
. . .
. . .
. . .
. . .
. . .
. . .
. . Redemptions . .
. . .
. . .
. . .
. . .
. . .
. . .
. . .
. . .
. . .
. . . Net increase .
. . .
. . .
. . .
. . .
. . .
. . .
. . .
. . .
. . .
. . .
. . Class I*** Sales . .
. . .
. . .
. . .
. . .
. . .
. . .
. . .
. . .
. . .
. . .
. . .
. . .
. Reinvestments . . .
. . .
. . .
. . .
. . .
. . .
. . .
. . .
. . .
. . .
. Redemptions . . .
. . .
. . .
. . .
. . .
. . .
. . .
. . .
. . .
. . .
. . Net increase . .
. . .
. . .
. . .
. . .
. . .
. . .
. . .
. . .
. . .
. . .
. Amount For the Period Ended April 30, 2014 Shares 3,419,174 $36,289,524 47,974 510,449 (119,050) (1,273,790) 3,348,098 $35,526,183 — — — — 604,496 $ 6,561,314 2,868 30,854 (1,046) (11,148) 606,318 $ 6,581,020 — — — — Amount $ $ $ $ — — — — — — — — $115,000 — — $115,000 8,907,390 Total Net Increase 5,134,934 $54,735,869 11,412 57,576 613,448 — (239,536) (2,567,881) — 4,952,974 $52,781,436 11,412 $115,000 $94,888,639 11,412 * Class A Shares commenced operations on June 13, 2014. ** Class C Shares commenced operations on October 17, 2014. *** Class I Shares commenced operations on April 7, 2014. 5. Federal Tax Information The Fund has followed the authoritative guidance on accounting for and disclosure of uncertainty in tax positions, which requires the Fund to determine whether a tax position is more likely than not to be sustained upon examination, including resolution of any related appeals or litigation processes, based on the technical merits of the position. The Fund has determined that there was no effect on the financial statements from following this authoritative guidance.
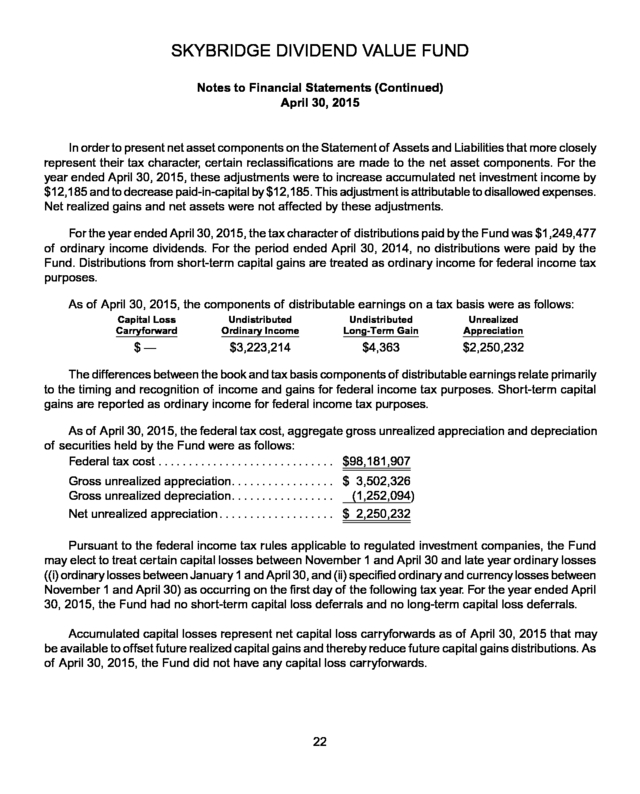
In the normal course of business, the Fund is subject to examination by federal, state and local jurisdictions, where applicable, for tax years for which applicable statutes of limitations have not expired. 21 . SKYBRIDGE DIVIDEND VALUE FUND Notes to Financial Statements (Continued) April 30, 2015 In order to present net asset components on the Statement of Assets and Liabilities that more closely represent their tax character, certain reclassifications are made to the net asset components. For the year ended April 30, 2015, these adjustments were to increase accumulated net investment income by $12,185 and to decrease paid-in-capital by $12,185. This adjustment is attributable to disallowed expenses. Net realized gains and net assets were not affected by these adjustments. For the year ended April 30, 2015, the tax character of distributions paid by the Fund was $1,249,477 of ordinary income dividends. For the period ended April 30, 2014, no distributions were paid by the Fund.
Distributions from short-term capital gains are treated as ordinary income for federal income tax purposes. As of April 30, 2015, the components of distributable earnings on a tax basis were as follows: Capital Loss Carryforward Undistributed Ordinary Income Undistributed Long-Term Gain Unrealized Appreciation $— $3,223,214 $4,363 $2,250,232 The differences between the book and tax basis components of distributable earnings relate primarily to the timing and recognition of income and gains for federal income tax purposes. Short-term capital gains are reported as ordinary income for federal income tax purposes. As of April 30, 2015, the federal tax cost, aggregate gross unrealized appreciation and depreciation of securities held by the Fund were as follows: Federal tax cost . .
. . .
. . .
. . .
. . .
. . .
. . .
. . .
. . .
. . .
$98,181,907 Gross unrealized appreciation. . .
. . .
. . .
. . .
. . .
. . $ 3,502,326 Gross unrealized depreciation.
. . .
. . .
. . .
. . .
. . .
. (1,252,094) Net unrealized appreciation . . .
. . .
. . .
. . .
. . .
. . .
. $ 2,250,232 Pursuant to the federal income tax rules applicable to regulated investment companies, the Fund may elect to treat certain capital losses between November 1 and April 30 and late year ordinary losses ((i) ordinary losses between January 1 and April 30, and (ii) specified ordinary and currency losses between November 1 and April 30) as occurring on the first day of the following tax year. For the year ended April 30, 2015, the Fund had no short-term capital loss deferrals and no long-term capital loss deferrals. Accumulated capital losses represent net capital loss carryforwards as of April 30, 2015 that may be available to offset future realized capital gains and thereby reduce future capital gains distributions.
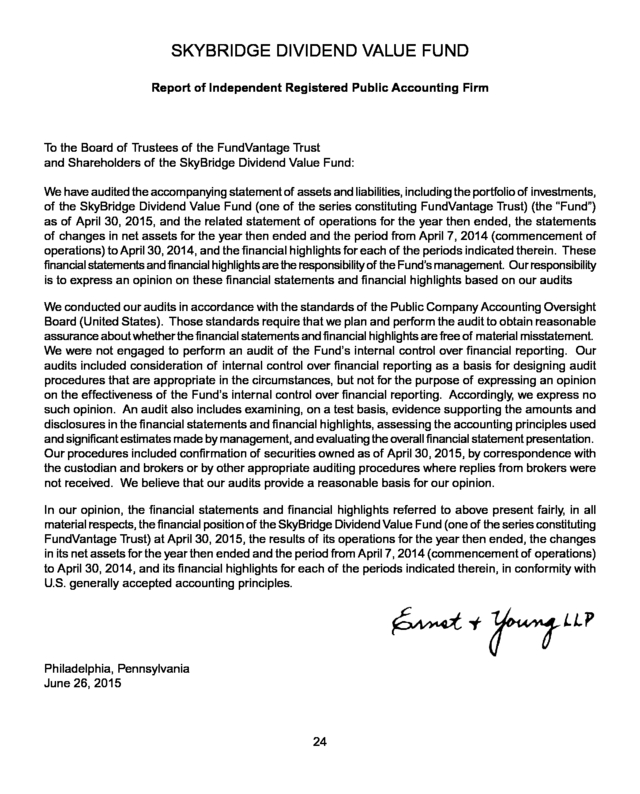
As of April 30, 2015, the Fund did not have any capital loss carryforwards. 22 . SKYBRIDGE DIVIDEND VALUE FUND Notes to Financial Statements (Concluded) April 30, 2015 6. Subsequent Events Management has evaluated the impact of all subsequent events on the Fund through the date the financial statements were issued, and has determined that there were no subsequent events requiring recognition or disclosure in the financial statements. 23 . SKYBRIDGE DIVIDEND VALUE FUND Report of Independent Registered Public Accounting Firm To the Board of Trustees of the FundVantage Trust and Shareholders of the SkyBridge Dividend Value Fund: We have audited the accompanying statement of assets and liabilities, including the portfolio of investments, of the SkyBridge Dividend Value Fund (one of the series constituting FundVantage Trust) (the “Fund”) as of April 30, 2015, and the related statement of operations for the year then ended, the statements of changes in net assets for the year then ended and the period from April 7, 2014 (commencement of operations) to April 30, 2014, and the financial highlights for each of the periods indicated therein. These financial statements and financial highlights are the responsibility of the Fund’s management. Our responsibility is to express an opinion on these financial statements and financial highlights based on our audits We conducted our audits in accordance with the standards of the Public Company Accounting Oversight Board (United States). Those standards require that we plan and perform the audit to obtain reasonable assurance about whether the financial statements and financial highlights are free of material misstatement. We were not engaged to perform an audit of the Fund’s internal control over financial reporting.
Our audits included consideration of internal control over financial reporting as a basis for designing audit procedures that are appropriate in the circumstances, but not for the purpose of expressing an opinion on the effectiveness of the Fund’s internal control over financial reporting. Accordingly, we express no such opinion. An audit also includes examining, on a test basis, evidence supporting the amounts and disclosures in the financial statements and financial highlights, assessing the accounting principles used and significant estimates made by management, and evaluating the overall financial statement presentation. Our procedures included confirmation of securities owned as of April 30, 2015, by correspondence with the custodian and brokers or by other appropriate auditing procedures where replies from brokers were not received.
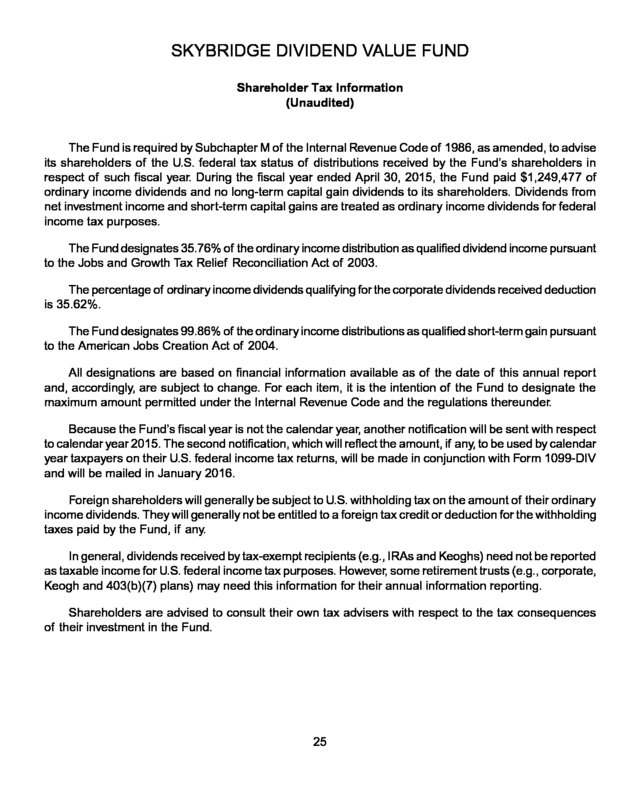
We believe that our audits provide a reasonable basis for our opinion. In our opinion, the financial statements and financial highlights referred to above present fairly, in all material respects, the financial position of the SkyBridge Dividend Value Fund (one of the series constituting FundVantage Trust) at April 30, 2015, the results of its operations for the year then ended, the changes in its net assets for the year then ended and the period from April 7, 2014 (commencement of operations) to April 30, 2014, and its financial highlights for each of the periods indicated therein, in conformity with U.S. generally accepted accounting principles. Philadelphia, Pennsylvania June 26, 2015 24 . SKYBRIDGE DIVIDEND VALUE FUND Shareholder Tax Information (Unaudited) The Fund is required by Subchapter M of the Internal Revenue Code of 1986, as amended, to advise its shareholders of the U.S. federal tax status of distributions received by the Fund’s shareholders in respect of such fiscal year. During the fiscal year ended April 30, 2015, the Fund paid $1,249,477 of ordinary income dividends and no long-term capital gain dividends to its shareholders. Dividends from net investment income and short-term capital gains are treated as ordinary income dividends for federal income tax purposes. The Fund designates 35.76% of the ordinary income distribution as qualified dividend income pursuant to the Jobs and Growth Tax Relief Reconciliation Act of 2003. The percentage of ordinary income dividends qualifying for the corporate dividends received deduction is 35.62%. The Fund designates 99.86% of the ordinary income distributions as qualified short-term gain pursuant to the American Jobs Creation Act of 2004. All designations are based on financial information available as of the date of this annual report and, accordingly, are subject to change.
For each item, it is the intention of the Fund to designate the maximum amount permitted under the Internal Revenue Code and the regulations thereunder. Because the Fund’s fiscal year is not the calendar year, another notification will be sent with respect to calendar year 2015. The second notification, which will reflect the amount, if any, to be used by calendar year taxpayers on their U.S. federal income tax returns, will be made in conjunction with Form 1099-DIV and will be mailed in January 2016. Foreign shareholders will generally be subject to U.S.
withholding tax on the amount of their ordinary income dividends. They will generally not be entitled to a foreign tax credit or deduction for the withholding taxes paid by the Fund, if any. In general, dividends received by tax-exempt recipients (e.g., IRAs and Keoghs) need not be reported as taxable income for U.S. federal income tax purposes.
However, some retirement trusts (e.g., corporate, Keogh and 403(b)(7) plans) may need this information for their annual information reporting. Shareholders are advised to consult their own tax advisers with respect to the tax consequences of their investment in the Fund. 25 . SKYBRIDGE DIVIDEND VALUE FUND Other Information (Unaudited) Proxy Voting Policies and procedures that the Fund uses to determine how to vote proxies relating to portfolio securities as well as information regarding how the Fund voted proxies relating to portfolio securities for the most recent 12-month period ended June 30 are available without charge, upon request, by calling (888) 919-6885 and on the Securities and Exchange Commission’s (“SEC”) website at http:// www.sec.gov. Quarterly Portfolio Schedules The Trust files its complete schedule of portfolio holdings with the SEC for the first and third fiscal quarters of each fiscal year (quarters ended July 31 and January 31) on Form N-Q. The Trust’s Forms N-Q are available on the SEC’s website at http://www.sec.gov and may be reviewed and copied at the SEC’s Public Reference Room in Washington, D.C. Information on the operation of the SEC’s Public Reference Room may be obtained by calling 1-800-SEC-0330. [ 26 To Come ] . SKYBRIDGE DIVIDEND VALUE FUND Privacy Notice (Unaudited) The privacy of your personal financial information is extremely important to us. When you open an account with us, we collect a significant amount of information from you in order to properly invest and administer your account. We take very seriously the obligation to keep that information private and confidential, and we want you to know how we protect that important information. We collect nonpublic personal information about you from applications or other forms you complete and from your transactions with us or our affiliates. We do not disclose information about you, or our former clients, to our affiliates or to service providers or other third parties, except as permitted by law. We share only the information required to properly administer your accounts, which enables us to send transaction confirmations, monthly or quarterly statements, financials and tax forms.
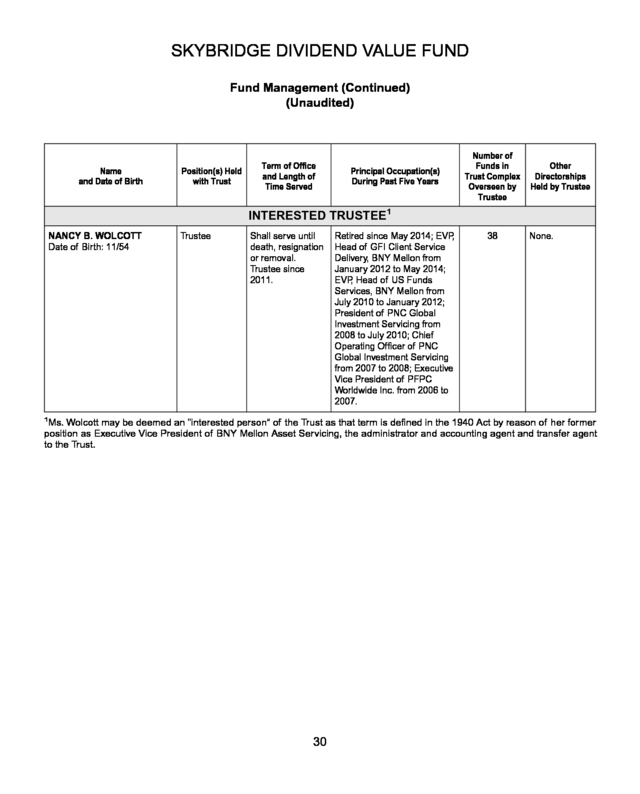
Even within FundVantage Trust and its affiliated entities, a limited number of people who actually service accounts will have access to your personal financial information. Further, we do not share information about our current or former clients with any outside marketing groups or sales entities. To ensure the highest degree of security and confidentiality, FundVantage Trust and its affiliates maintain various physical, electronic and procedural safeguards to protect your personal information. We also apply special measures for authentication of information you request or submit to us on our web site. If you have questions or comments about our privacy practices, please call us at (888) 919-6885. 27 . SKYBRIDGE DIVIDEND VALUE FUND Fund Management (Unaudited) FundVantage Trust (the “Trust”) is governed by a Board of Trustees (the “Trustees”). The primary responsibility of the Trustees is to represent the interest of the Trust’s shareholders and to provide oversight management of the Trust. The following tables present certain information regarding the Board of Trustees and officers of the Trust. Each person listed under “Interested Trustee” below is an “interested person” of the Trust, the Adviser, another investment adviser of a series of the Trust, or Foreside Funds Distributors LLC, the principal underwriter of the Trust (“Underwriter”), within the meaning of the 1940 Act. Each person who is not an “interested person” of the Trust, the Adviser or the Underwriter within the meaning of the 1940 Act is referred to as an “Independent Trustee” and is listed under such heading below.
The address of each Trustee and Officer as it relates to the Trust’s business is 301 Bellevue Parkway, 2nd Floor, Wilmington, DE 19809. The Statement of Additional Information for the Fund contains additional information about the Trustees and is available, without charge, upon request, by calling (888) 919-6885. Name and Date of Birth Position(s) Held with Trust Term of Office and Length of Time Served Principal Occupation(s) During Past Five Years Number of Funds in Trust Complex Overseen by Trustee Other Directorships Held by Trustee INDEPENDENT TRUSTEES ROBERT J. CHRISTIAN Date of Birth: 2/49 Trustee and Chairman of the Board Shall serve until death, resignation or removal. Trustee and Chairman since 2007. Retired since February 2006; Executive Vice President of Wilmington Trust Company from February 1996 to February 2006; President of Rodney Square Management Corporation (“RSMC”) (investment advisory firm) from 1996 to 2005; Vice President of RSMC from 2005 to 2006. 38 Optimum Fund Trust (registered investment company) (6 portfolios). IQBAL MANSUR Date of Birth: 6/55 Trustee Shall serve until death, resignation or removal. Trustee since 2007. University Professor, Widener University. 38 None. 28 . SKYBRIDGE DIVIDEND VALUE FUND Fund Management (Continued) (Unaudited) Name and Date of Birth Position(s) Held with Trust Term of Office and Length of Time Served Principal Occupation(s) During Past Five Years Number of Funds in Trust Complex Overseen by Trustee Other Directorships Held by Trustee DONALD J. PUGLISI Date of Birth: 8/45 Trustee Shall serve until death, resignation or removal. Trustee since 2008. Managing Director of Puglisi & Associates (financial, administrative and consulting services) from 1973 to present; MBNA America Professor of Business Emeritus at the University of Delaware from 2001 to present; Commissioner, The State of Delaware Public Service Commission from 1997 to 2004. 38 None. STEPHEN M. WYNNE Date of Birth: 1/55 Trustee Shall serve until death, resignation or removal. Trustee since 2009. Retired since December 2010; Chief Executive Officer of US Funds Services, BNY Mellon Asset Servicing from July 2010 to December 2010; Chief Executive Officer of PNC Global Investment Servicing from March 2008 to July 2010; President, PNC Global Investment Servicing 2003 to 2008. 38 Copeland Trust (registered investment company) (2 portfolios). Context Capital Funds (registered investment company) (1 portfolio). 29 . SKYBRIDGE DIVIDEND VALUE FUND Fund Management (Continued) (Unaudited) Name and Date of Birth Position(s) Held with Trust Term of Office and Length of Time Served Principal Occupation(s) During Past Five Years Number of Funds in Trust Complex Overseen by Trustee Other Directorships Held by Trustee INTERESTED TRUSTEE1 NANCY B. WOLCOTT Date of Birth: 11/54 Trustee Shall serve until death, resignation or removal. Trustee since 2011. 1 Retired since May 2014; EVP , Head of GFI Client Service Delivery, BNY Mellon from January 2012 to May 2014; EVP Head of US Funds , Services, BNY Mellon from July 2010 to January 2012; President of PNC Global Investment Servicing from 2008 to July 2010; Chief Operating Officer of PNC Global Investment Servicing from 2007 to 2008; Executive Vice President of PFPC Worldwide Inc. from 2006 to 2007. 38 None. Ms. Wolcott may be deemed an “interested person” of the Trust as that term is defined in the 1940 Act by reason of her former position as Executive Vice President of BNY Mellon Asset Servicing, the administrator and accounting agent and transfer agent to the Trust. 30 .
SKYBRIDGE DIVIDEND VALUE FUND Fund Management (Concluded) (Unaudited) Name and Date of Birth Position(s) Held with Trust Term of Office and Length of Time Served Principal Occupation(s) During Past Five Years EXECUTIVE OFFICERS JOEL L. WEISS Date of Birth: 1/63 President and Chief Executive Officer Shall serve until death, resignation or removal. Officer since 2007. Vice President and Managing Director of BNY Mellon Investment Servicing (US) Inc. and predecessor firms since 1993. JAMES G.
SHAW Date of Birth: 10/60 Treasurer and Chief Financial Officer Shall serve until death, resignation or removal. Officer since 2007. Vice President and Senior Director of BNY Mellon Investment Servicing (US) Inc. and predecessor firms since 1995. VINCENZO A.
SCARDUZIO Secretary Date of Birth: 4/72 Shall serve until death, resignation or removal. Officer since 2012. Vice President and Counsel Regulatory Administration of BNY Mellon Investment Servicing (US) Inc. and predecessor firms since 2001; DAVID C.
LEBISKY Date of Birth: 5/72 Shall serve until death, resignation or removal. Officer since 2015. Senior Consultant, Freeh Group International Solutions, LLC (a global risk management firm) since 2015; Scotia Institutional Investments US, LP Director , of Regulatory Administration from 2010 to 2014. Chief Compliance Officer 31 . Investment Adviser SkyBridge Capital II, LLC 527 Madison Avenue, 16th Floor New York, New York 10022 Administrator BNY Mellon Investment Servicing (US) Inc. 301 Bellevue Parkway Wilmington, DE 19809 Transfer Agent BNY Mellon Investment Servicing (US) Inc. 4400 Computer Drive Westborough, MA 01581 Principal Underwriter Foreside Funds Distributors LLC 400 Berwyn Park 899 Cassatt Road Berwyn, PA 19312 Custodian The Bank of New York Mellon One Wall Street New York, NY 10286 Independent Registered Public Accounting Firm Ernst & Young LLP One Commerce Square 2005 Market Street, Suite 700 Philadelphia, PA 19103-7096 Legal Counsel Pepper Hamilton LLP 3000 Two Logan Square 18th and Arch Streets Philadelphia, PA 19103 SkyBridge Dividend Value Fund of FundVantage Trust Class A Class C Class I ANNUAL REPORT April 30, 2015 This report is submitted for the general information of the shareholders of the SkyBridge Dividend Value Fund. It is not authorized for distribution unless preceded or accompanied by a current prospectus for the SkyBridge Dividend Value Fund. Sky001 .
Class A Shares were up 9.74% since inception on June 13, 2014 and Class C Shares were up 14.26% since inception on October 17, 2014. Underweighting the financial and healthcare sectors hurt relative performance, while overweighting the consumer discretionary sector helped relative performance. The top three performing companies over the time period were Kraft Foods Group, Inc., Dr. Pepper Snapple Group, Inc.
and Six Flags Entertainment Corp. The bottom three performing companies were Mattel, Inc., Tupperware Brands Corporation and Coach, Inc. The Fund invests primarily in dividend yielding equity securities for which there is no guarantee that a company will increase or continue to pay dividends over time. The fund is subject to overall market risks which will cause its value to fluctuate over time as well as the Adviser’s ability to select securities to meet its objective. Our rules-based process allows us to take a long view, and the goal of our strategy is to outperform the S&P 500® Index over three year rolling time periods (net of fees and expenses).
The repeatable investment process seeks to identify profitable, attractively valued securities with appealing dividends and favors long term gains. We believe the current low interest rate environment generally favors equities over bonds, especially considering the tax advantages of equity dividends over bond income. As always, we thank you for your support. Sincerely, Brendan Voege Portfolio Manager Current and future portfolio holdings are subject to change and risk. 1 . SKYBRIDGE DIVIDEND VALUE FUND Annual Report Performance Data April 30, 2015 (Unaudited) Comparison of Change in Value of $10,000 Investment in SkyBridge Dividend Value Fund’s Class A vs. S&P 500® Index 20,000 D O L L A R S S&P 500® Index $11,039 Skybridge Dividend Value Fund Class A (with load) $10,342 15,000 10,000 5,000 Past performance is not predictive of future results. 5 /1 5 4/ 30 /1 5 3/ 31 /1 2/ 31 1/ /3 28 /1 5 14 1/ 14 12 11 10 /3 1/ /3 30 0/ 14 4 /1 4 9/ 31 /1 4 8/ 7/ 31 /1 4 /1 30 6/ 6/ 13 /1 4 0 Class A Shares of an assumed $10,000 investment is adjusted for the maximum sales charge of 5.75%. This results in a net investment of $9,425. Performance of Class C Shares will vary from Class A Shares due to differences in class specific fees. Comparison of Change in Value of $50,000 Investment in SkyBridge Dividend Value Fund’s Class I vs.
S&P 500® Index 100,000 S&P 500® Index $56,915 50,000 Past performance is not predictive of future results. 2 /1 5 /1 5 30 4/ 31 3/ /1 5 28 2/ /1 5 31 1/ 1/ 14 /3 0/ 14 12 /3 11 1/ 14 /3 30 /1 4 10 9/ /1 4 31 8/ /1 4 31 7/ /1 4 /1 4 30 6/ 31 5/ /1 4 30 4/ 07 /1 4 0 4/ D O L L A R S Skybridge Dividend Value Fund Class I (no load) $57,563 . SKYBRIDGE DIVIDEND VALUE FUND Annual Report Performance Data (Continued) April 30, 2015 (Unaudited) Average Annual Total Returns for the Periods Ended April 30, 2015 Since 1 Year Inception Class A (without sales charge)* N/A 9.74%† Class A (with sales charge)* N/A 3.42%† S&P 500® Index N/A 9.56%(a)† Class C (without CDSC charge)* N/A 14.26%† Class C (with CDSC charge)* N/A 13.26%† S&P 500® Index N/A 11.70%(a)† Class I** 12.54% 14.17% S&P 500® Index 12.98% 15.46%(a) † Not Annualized. * Class A Shares and Class C Shares of the SkyBridge Dividend Value Fund (the “Fund”) commenced operations on June 13, 2014 and October 17, 2014, respectively. ** Class I Shares of the Fund commenced operations on April 7, 2014. (a) Benchmark performance is from inception date of the Class only and is not the inception date of the benchmark itself. The performance data quoted represents past performance and does not guarantee future results. The investment return and principal value of an investment in the Fund will fluctuate so that an investor’s shares, when redeemed, may be worth more or less than their original cost. The graphs and tables do not reflect the deduction of taxes that a shareholder would pay on Fund distributions or redemption of Fund shares. Current performance may be lower or higher.
Performance data current to the most recent month-end may be obtained by calling (888) 919-6885. The returns shown for Class A Shares reflect a deduction for the maximum front-end sales charge of 5.75%. The returns shown for Class C reflect a 1.00% contingent deferred sales charge (“CDSC”). The Fund’s total annual gross and net operating expenses, as stated in the current prospectus dated September 1, 2014, are 2.32% and 1.25% for Class A Shares, 3.07% and 2.00% for Class C Shares and 2.07% and 1.00% for Class I Shares, respectively, of the Fund’s average daily net assets.
These ratios may differ from the actual expenses incurred by the Fund for the period covered by this report. SkyBridge Capital II, LLC (“SkyBridge” or the “Adviser”) has contractually agreed to reduce its management fee and/or reimburse certain expenses so as to limit expenses. The Expense Limitation (the “Expense Limitation”) will remain in place for three (3) years from the date of the Fund’s inception, unless the Board of Trustees approves its earlier termination.
Total returns would be lower had such fees and expenses not been waived and/or reimbursed. The Adviser is entitled to recover, subject to approval by the Board of Trustees of FundVantage Trust (the “Trust”), such amounts reduced or reimbursed for a period of up to three (3) years from the year in which the Adviser reduced its compensation and/or assumed expenses for the Fund. No recoupment will occur unless the Fund’s expenses are below the Expense Limitation. Mutual fund investing involves risk including the possible loss of principal.
The fund’s long term “buy and hold” strategy under certain market conditions may cause it to be more susceptible to general market declines. The fund seeks to invest in securities with dividend yield potential with both growth and value characteristics. Value investing involves the risk that companies believed to be undervalued may not appreciate as anticipated.
There are no guarantees 3 . SKYBRIDGE DIVIDEND VALUE FUND Annual Report Performance Data (Concluded) April 30, 2015 (Unaudited) a company will continue to pay or increase its dividend. The fund may invest in small to mid-capitalization companies which may be more volatile and less liquid than stocks of larger companies. The Fund intends to evaluate performance as compared to that of the S&P 500® Index. The S&P 500® Index is a widely recognized, unmanaged index of 500 common stocks which are generally representative of the U.S. stock market as a whole.
It is not possible to invest in an index. 4 . SKYBRIDGE DIVIDEND VALUE FUND Fund Expense Disclosure April 30, 2015 (Unaudited) As a shareholder of the Fund, you incur two types of costs: (1) transaction costs including sales charges (loads) on purchase payments (if any) or redemption fees; and (2) ongoing costs, including management fees, distribution and/or service (Rule 12b-1) fees (if any) and other Fund expenses. These examples are intended to help you understand your ongoing costs (in dollars) of investing in the Fund and to compare these costs with the ongoing costs of investing in other mutual funds. These examples are based on an investment of $1,000 invested at the beginning of the period from November 1, 2014 through April 30, 2015 and held for the entire period. Actual Expenses The first line of the accompanying table provides information about actual account values and actual expenses. You may use the information in this line, together with the amount you invested, to estimate the expenses that you paid over the period. Simply divide your account value by $1,000 (for example, an $8,600 account value divided by $1,000 = 8.6), then multiply the result by the number in the first line under the heading entitled “Expenses Paid During Period” to estimate the expenses you paid on your account during this period. Hypothetical Examples for Comparison Purposes The second line of the accompanying table provides information about hypothetical account values and hypothetical expenses based on the Fund’s actual expense ratio and an assumed rate of return of 5% per year before expenses, which is not your Fund’s actual return.
The hypothetical account values and expenses may not be used to estimate the actual ending account balance or expenses you paid for the period. You may use this information to compare the ongoing costs of investing in the Fund and other funds. To do so, compare these 5% hypothetical examples with the 5% hypothetical examples that appear in the shareholder reports of other funds. Please note that the expenses shown in the accompanying table are meant to highlight your ongoing costs only and do not reflect any transactional costs, such as sales charges (loads) on purchase payments (if any) or redemption fees.
Therefore, the second line of the accompanying table is useful in comparing ongoing costs only, and will not help you determine the relative total costs of owning different funds. In addition, if these transactional costs were included, your costs would have been higher. 5 . SKYBRIDGE DIVIDEND VALUE FUND Fund Expense Disclosure (Concluded) April 30, 2015 (Unaudited) SkyBridge Dividend Value Beginning Account Value November 1, 2014 Class A Actual Hypothetical (5% return before expenses) Class C Actual Hypothetical (5% return before expenses) Class I Actual Hypothetical (5% return before expenses) Ending Account Value April 30, 2015 Expenses Paid During Period* $1,000.00 1,000.00 $1,079.20 1,018.60 $ 6.44 6.26 $1,000.00 1,000.00 $1,075.60 1,014.88 $10.29 9.99 $1,000.00 1,000.00 $1,080.50 1,019.84 $ 5.16 5.01 * Expenses are equal to an annualized expense ratio for the six-month period ended April 30, 2015 of 1.25%, 2.00% and 1.00% for Class A, Class C and Class I Shares, respectively, for the Fund, multiplied by the average account value over the period, multiplied by the number of days in the most recent period (181), then divided by 365 to reflect the period. The Funds’ ending account values on the first line in the table are based on the actual six month total returns for the Fund of 7.92%, 7.56% and 8.05% for Class A, Class C and Class I Shares, respectively. 6 . SKYBRIDGE DIVIDEND VALUE FUND Portfolio Holdings Summary Table April 30, 2015 (Unaudited) The following table presents a summary by sector of the portfolio holdings of the Fund: % of Net Assets COMMON STOCKS: Consumer Discretionary . . . .
. . .
. . .
. . .
. . .
. . .
. . .
. . .
. . .
. . .
. . .
. . .
. . Energy . .
. . .
. . .
. . .
. . .
. . .
. . .
. . .
. . .
. . .
. . .
. . .
. . .
. . .
. . .
. . .
. . .
. . .
. Industrials . . .
. . .
. . .
. . .
. . .
. . .
. . .
. . .
. . .
. . .
. . .
. . .
. . .
. . .
. . .
. . .
. . . Consumer Staples .
. . .
. . .
. . .
. . .
. . .
. . .
. . .
. . .
. . .
. . .
. . .
. . .
. . .
. . .
. Information Technology . . .
. . .
. . .
. . .
. . .
. . .
. . .
. . .
. . .
. . .
. . .
. . .
. . .
. Health Care . . .
. . .
. . .
. . .
. . .
. . .
. . .
. . .
. . .
. . .
. . .
. . .
. . .
. . .
. . .
. . .
. . Materials . .
. . .
. . .
. . .
. . .
. . .
. . .
. . .
. . .
. . .
. . .
. . .
. . .
. . .
. . .
. . .
. . .
. . Telecommunication Services . .
. . .
. . .
. . .
. . .
. . .
. . .
. . .
. . .
. . .
. . .
. . . Short-Term Investment.
. . .
. . .
. . .
. . .
. . .
. . .
. . .
. . .
. . .
. . .
. . .
. . .
. . .
. Other Assets in Excess of Liabilities . . .
. . .
. . .
. . .
. . .
. . .
. . .
. . .
. . .
. NET ASSETS Value 22.4% $ 22,567,627 16.7 16,789,877 16.3 16,344,105 16.0 16,094,111 13.7 13,755,072 6.5 6,493,162 3.8 3,826,209 3.3 3,311,941 1.3 1,250,035 0.0 37,124 100.0% $100,469,263 Portfolio holdings are subject to change at any time. The accompanying notes are an integral part of the financial statements. 7 . SKYBRIDGE DIVIDEND VALUE FUND Portfolio of Investments April 30, 2015 Number of Shares COMMON STOCKS — 98.7% Consumer Discretionary — 22.4% Abercrombie & Fitch Co., Class A . . . .
. . .
. . .
. . . 146,797 $ Coach, Inc.
. . .
. . .
. . .
. . . 75,197 GameStop Corp., Class A . 81,891 Garmin Ltd.
(Switzerland). . 69,607 Mattel, Inc.. .
. . .
. . .
. . .
. . 133,696 McDonald’s Corp. .
. . .
. . . 33,379 Tupperware Brands Corp..
. 46,442 Consumer Staples — 16.0% Altria Group, Inc. . .
. . .
. . . Coca-Cola Co.
(The) . . .
. . Lorillard, Inc. .
. . .
. . .
. . .
. Philip Morris International, Inc. . .
. . .
. . .
. . .
. . .
. . Procter & Gamble Co. (The) . .
. . .
. . .
. . .
. . .
. Number of Shares Value COMMON STOCKS — (Continued) Industrials — (Continued) Lockheed Martin Corp.. . .
. 16,041 $ Pitney Bowes, Inc. . .
. . .
. . 137,638 3,299,997 2,873,277 3,156,079 3,145,540 3,764,879 3,222,743 3,105,112 22,567,627 62,199 78,564 46,207 3,113,060 3,186,556 3,228,021 41,437 3,458,746 39,086 Information Technology — 13.7% CA, Inc. .
. . .
. . .
. . .
. . .
. . 102,261 Intel Corp. .
. . .
. . .
. . .
. . . 102,138 International Business Machines Corp.
. . .
. . .
. 19,897 Microsoft Corp. . .
. . .
. . .
. 77,580 3,107,728 16,094,111 Energy — 16.7% Chevron Corp. . .
. . .
. . .
. . Exxon Mobil Corp. .
. . .
. . . Helmerich & Payne, Inc.
. . . National Oilwell Varco, Inc.
. RPC, Inc.. . .
. . .
. . .
. . .
. . 30,196 38,338 43,565 59,149 218,206 56,257 92,617 40,015 56,819 127,501 3,248,832 3,324,592 3,408,157 3,773,491 13,755,072 644,143 3,826,209 3,311,941 TOTAL COMMON STOCKS (Cost $96,792,846) . .
. . .
. . .
. . .
. 99,182,104 3,350,667 3,142,495 6,493,162 Industrials — 16.3% Caterpillar, Inc.. . .
. . .
. . .
. Emerson Electric Co. . .
. . . General Electric Co.
. . .
. . . 2,993,251 3,078,962 16,344,105 Telecommunication Services — 3.3% Verizon Communications, Inc.
. . .
. . .
. . .
. . .
. . .
. 65,661 3,353,568 3,349,591 3,396,763 3,218,297 3,471,658 16,789,877 Health Care — 6.5% Merck & Co., Inc. . .
. . .
. . . Pfizer, Inc.
. . .
. . .
. . .
. . .
. Materials — 3.8% Cliffs Natural Resources, Inc. . .
. . .
. . .
. . .
. . .
. . Value 3,476,503 3,342,662 3,452,727 The accompanying notes are an integral part of the financial statements. 8 . SKYBRIDGE DIVIDEND VALUE FUND Portfolio of Investments (Concluded) April 30, 2015 Number of Shares Value SHORT-TERM INVESTMENT — 1.3% Money Market Fund — 1.3% Dreyfus Government Cash Management Fund, Institutional Shares, 0.01%(a) . . . .
. . .
. . .
. . .
1,250,035 $ TOTAL SHORT-TERM INVESTMENT (Cost $1,250,035) . . TOTAL INVESTMENTS - 100.0% (Cost $98,042,881) . .
. OTHER ASSETS IN EXCESS OF LIABILITIES - 0.0% . . .
. . .
. . .
. . .
. . NET ASSETS - 100.0% . .
. (a) 1,250,035 1,250,035 100,432,139 37,124 $ 100,469,263 Rate periodically changes. Rate disclosed is the daily yield on April 30, 2015. The accompanying notes are an integral part of the financial statements. 9 . SKYBRIDGE DIVIDEND VALUE FUND Statement of Assets and Liabilities April 30, 2015 Assets Investments, at value (Cost $98,042,881) . . . .
. . .
. . .
. . .
. . .
. . .
. . .
. . .
. . .
. . .
. . .
. . .
. . . Receivable for capital shares sold .
. . .
. . .
. . .
. . .
. . .
. . .
. . .
. . .
. . .
. . .
. . .
. . .
. . .
. . .
. . . Dividends receivable .
. . .
. . .
. . .
. . .
. . .
. . .
. . .
. . .
. . .
. . .
. . .
. . .
. . .
. . .
. . .
. . .
. . .
. . .
. . . Prepaid expenses and other assets .
. . .
. . .
. . .
. . .
. . .
. . .
. . .
. . .
. . .
. . .
. . .
. . .
. . .
. . .
. . Total assets . .
. . .
. . .
. . .
. . .
. . .
. . .
. . .
. . .
. . .
. . .
. . .
. . .
. . .
. . .
. . .
. . .
. . .
. . .
. . .
. . .
. . Liabilities Payable for investments purchased . .
. . .
. . .
. . .
. . .
. . .
. . .
. . .
. . .
. . .
. . .
. . .
. . .
. . .
. . .
. Payable for capital shares redeemed . . .
. . .
. . .
. . .
. . .
. . .
. . .
. . .
. . .
. . .
. . .
. . .
. . .
. . .
. . Payable to Investment Adviser. .
. . .
. . .
. . .
. . .
. . .
. . .
. . .
. . .
. . .
. . .
. . .
. . .
. . .
. . .
. . .
. . . Payable for administration and accounting fees .
. . .
. . .
. . .
. . .
. . .
. . .
. . .
. . .
. . .
. . .
. . .
. Payable for distribution fees . . .
. . .
. . .
. . .
. . .
. . .
. . .
. . .
. . .
. . .
. . .
. . .
. . .
. . .
. . .
. . .
. . .
. Payable for transfer agent fees . . .
. . .
. . .
. . .
. . .
. . .
. . .
. . .
. . .
. . .
. . .
. . .
. . .
. . .
. . .
. . .
. Payable for custodian fees . . .
. . .
. . .
. . .
. . .
. . .
. . .
. . .
. . .
. . .
. . .
. . .
. . .
. . .
. . .
. . .
. . .
. . Accrued expenses . .
. . .
. . .
. . .
. . .
. . .
. . .
. . .
. . .
. . .
. . .
. . .
. . .
. . .
. . .
. . .
. . .
. . .
. . .
. . .
. Total liabilities . . .
. . .
. . .
. . .
. . .
. . .
. . .
. . .
. . .
. . .
. . .
. . .
. . .
. . .
. . .
. . .
. . .
. . .
. . .
. . .
. . Net Assets. .
. . .
. . .
. . .
. . .
. . .
. . .
. . .
. . .
. . .
. . .
. . .
. . .
. . .
. . .
. . .
. . .
. . .
. . .
. . .
. . .
. . .
. . .
. Net Assets Consisted of: Capital stock, $0.01 par value . . .
. . .
. . .
. . .
. . .
. . .
. . .
. . .
. . .
. . .
. . .
. . .
. . .
. . .
. . .
. . .
. . Paid-in capital . .
. . .
. . .
. . .
. . .
. . .
. . .
. . .
. . .
. . .
. . .
. . .
. . .
. . .
. . .
. . .
. . .
. . .
. . .
. . .
. . .
. . Accumulated net investment income . .
. . .
. . .
. . .
. . .
. . .
. . .
. . .
. . .
. . .
. . .
. . .
. . .
. . .
. . . Accumulated net realized gain from investments .
. . .
. . .
. . .
. . .
. . .
. . .
. . .
. . .
. . .
. . .
. . . Net unrealized appreciation on investments .
. . .
. . .
. . .
. . .
. . .
. . .
. . .
. . .
. . .
. . .
. . .
. . .
. Net Assets. . .
. . .
. . .
. . .
. . .
. . .
. . .
. . .
. . .
. . .
. . .
. . .
. . .
. . .
. . .
. . .
. . .
. . .
. . .
. . .
. . .
. . .
. . . $100,432,139 1,118,368 81,615 75,734 101,707,856 1,087,232 30,957 44,989 13,629 10,651 9,455 4,986 36,694 1,238,593 $100,469,263 $ 89,188 94,902,266 31,571 3,056,980 2,389,258 $100,469,263 Class A: Net asset value, redemption price per share ($37,732,448 / 3,348,098 shares) .
. . .
. . .
. . .
. . .
. . .
. . .
. . .
. . .
. . .
. . .
. . .
. . .
. . .
. . .
. . .
. . .
. . $11.27 Maximum offering price per share (100/94.25 of $11.27) . .
. . .
. . .
. . .
. . .
. . .
. . .
. . .
. . .
. . .
. . .
. $11.96 Class C: Net asset value, offering and redemption price per share ($6,818,851 / 606,318 shares). . .
. . .
. . .
. . .
. . .
. . .
. . .
. . .
. . .
. . .
. . .
. . .
. . .
. . .
. . .
. . .
. . .
. . . $11.25 Class I: Net asset value, offering and redemption price per share ($55,917,964 / 4,964,386 shares) .
. . .
. . .
. . .
. . .
. . .
. . .
. . .
. . .
. . .
. . .
. . .
. . .
. . .
. . .
. . .
. . .
. . $11.26 The accompanying notes are an integral part of the financial statements. 10 . SKYBRIDGE DIVIDEND VALUE FUND Statement of Operations For the Year Ended April 30, 2015 Investment Income Dividends . . . .
. . .
. . .
. . .
. . .
. . .
. . .
. . .
. . .
. . .
. . .
. . .
. . .
. . .
. . .
. . .
. . .
. . .
. . .
. . .
. . .
. . .
. . . Interest .
. . .
. . .
. . .
. . .
. . .
. . .
. . .
. . .
. . .
. . .
. . .
. . .
. . .
. . .
. . .
. . .
. . .
. . .
. . .
. . .
. . .
. . .
. . .
. . Total investment income . .
. . .
. . .
. . .
. . .
. . .
. . .
. . .
. . .
. . .
. . .
. . .
. . .
. . .
. . .
. . .
. . .
. . .
. . Expenses Advisory fees (Note 2) . .
. . .
. . .
. . .
. . .
. . .
. . .
. . .
. . .
. . .
. . .
. . .
. . .
. . .
. . .
. . .
. . .
. . .
. . .
. . . Printing and shareholder reporting fees .
. . .
. . .
. . .
. . .
. . .
. . .
. . .
. . .
. . .
. . .
. . .
. . .
. . .
. . .
. Administration and accounting fees (Note 2). . .
. . .
. . .
. . .
. . .
. . .
. . .
. . .
. . .
. . .
. . .
. . .
. . .
. Transfer agent fees (Note 2). . .
. . .
. . .
. . .
. . .
. . .
. . .
. . .
. . .
. . .
. . .
. . .
. . .
. . .
. . .
. . .
. . .
. . . Distribution fees (Class A) (Note 2).
. . .
. . .
. . .
. . .
. . .
. . .
. . .
. . .
. . .
. . .
. . .
. . .
. . .
. . .
. . .
. . Legal fees . .
. . .
. . .
. . .
. . .
. . .
. . .
. . .
. . .
. . .
. . .
. . .
. . .
. . .
. . .
. . .
. . .
. . .
. . .
. . .
. . .
. . .
. . .
. Custodian fees (Note 2) . . .
. . .
. . .
. . .
. . .
. . .
. . .
. . .
. . .
. . .
. . .
. . .
. . .
. . .
. . .
. . .
. . .
. . .
. . . Audit fees .
. . .
. . .
. . .
. . .
. . .
. . .
. . .
. . .
. . .
. . .
. . .
. . .
. . .
. . .
. . .
. . .
. . .
. . .
. . .
. . .
. . .
. . .
. . . Registration and filing fees .
. . .
. . .
. . .
. . .
. . .
. . .
. . .
. . .
. . .
. . .
. . .
. . .
. . .
. . .
. . .
. . .
. . .
. . . Trustees’ and officers’ fees (Note 2) .
. . .
. . .
. . .
. . .
. . .
. . .
. . .
. . .
. . .
. . .
. . .
. . .
. . .
. . .
. . .
. Distribution and shareholder servicing fees (Class C) (Note 2) . . .
. . .
. . .
. . .
. . .
. . .
. . .
. . . Other expenses .
. . .
. . .
. . .
. . .
. . .
. . .
. . .
. . .
. . .
. . .
. . .
. . .
. . .
. . .
. . .
. . .
. . .
. . .
. . .
. . .
. . . Total expenses before waivers and reimbursements .
. . .
. . .
. . .
. . .
. . .
. . .
. . .
. . .
. . .
. . . Less: waivers and reimbursements (Note 2) .
. . .
. . .
. . .
. . .
. . .
. . .
. . .
. . .
. . .
. . .
. . .
. . .
. Net expenses after waivers and reimbursements . . .
. . .
. . .
. . .
. . .
. . .
. . .
. . .
. . .
. . .
. . .
. . . Net investment income .
. . .
. . .
. . .
. . .
. . .
. . .
. . .
. . .
. . .
. . .
. . .
. . .
. . .
. . .
. . .
. . .
. . .
. . .
. . . Net realized and unrealized gain from investments: Net realized gain from investments .
. . .
. . .
. . .
. . .
. . .
. . .
. . .
. . .
. . .
. . .
. . .
. . .
. . .
. . .
. . .
. . Net change in unrealized appreciation/(depreciation) on investments . .
. . .
. . .
. . .
. . .
. . .
. Net realized and unrealized gain on investments . . .
. . .
. . .
. . .
. . .
. . .
. . .
. . .
. . .
. . .
. . .
. . . Net increase in net assets resulting from operations .
. . .
. . .
. . .
. . .
. . .
. . .
. . .
. . .
. . .
. . . The accompanying notes are an integral part of the financial statements. 11 $1,650,622 63 1,650,685 333,766 91,244 74,935 61,141 51,625 31,049 28,873 25,059 21,029 16,762 10,424 15,370 761,277 (250,547) 510,730 1,139,955 3,185,683 2,387,773 5,573,456 $6,713,411 .
SKYBRIDGE DIVIDEND VALUE FUND Statements of Changes in Net Assets For the Year Ended April 30, 2015 Increase in net assets from operations: Net investment income . . . .
. . .
. . .
. . .
. . .
. . .
. . .
. . .
. . .
. . .
. . .
. . .
. . Net realized gain from investments . .
. . .
. . .
. . .
. . .
. . .
. . .
. . .
. . .
. . . Net change in unrealized appreciation/(depreciation) on investments .
. . .
. . .
. . .
. . .
. . .
. . .
. . .
. . .
. . .
. . .
. . .
. . .
. . .
. . .
. . .
. Net increase in net assets resulting from operations . . .
. . .
. . .
. . .
. . .
. Less Dividends and Distributions to Shareholders from: Net investment income: Class A. . .
. . .
. . .
. . .
. . .
. . .
. . .
. . .
. . .
. . .
. . .
. . .
. . .
. . .
. . .
. . .
. . . Class C.
. . .
. . .
. . .
. . .
. . .
. . .
. . .
. . .
. . .
. . .
. . .
. . .
. . .
. . .
. . .
. . .
. . Class I . .
. . .
. . .
. . .
. . .
. . .
. . .
. . .
. . .
. . .
. . .
. . .
. . .
. . .
. . .
. . .
. . .
. Total net investment income . . .
. . .
. . .
. . .
. . .
. . .
. . .
. . .
. . .
. . .
. . .
. . Net realized capital gains: Class A. .
. . .
. . .
. . .
. . .
. . .
. . .
. . .
. . .
. . .
. . .
. . .
. . .
. . .
. . .
. . .
. . .
. Class C. . .
. . .
. . .
. . .
. . .
. . .
. . .
. . .
. . .
. . .
. . .
. . .
. . .
. . .
. . .
. . .
. . . Class I .
. . .
. . .
. . .
. . .
. . .
. . .
. . .
. . .
. . .
. . .
. . .
. . .
. . .
. . .
. . .
. . .
. . Total net realized capital gains . .
. . .
. . .
. . .
. . .
. . .
. . .
. . .
. . .
. . .
. . .
. Increase in Net Assets Derived from Capital Share Transactions (Note 4) . . .
. . .
. . .
. . .
. . .
. . .
. . .
. . .
. . .
. . .
. . .
. . .
. . .
. . .
. . .
. . .
. . .
. Total increase in net assets . . .
. . .
. . .
. . .
. . .
. . .
. . .
. . .
. . .
. . .
. . .
. . .
. Net assets Beginning of period . . .
. . .
. . .
. . .
. . .
. . .
. . .
. . .
. . .
. . .
. . .
. . .
. . .
. . . End of period .
. . .
. . .
. . .
. . .
. . .
. . .
. . .
. . .
. . .
. . .
. . .
. . .
. . .
. . .
. . .
. Accumulated net investment income, end of period. . .
. . .
. . .
. . .
. . . * $ 1,139,955 3,185,683 $ 31 174 2,387,773 6,713,411 1,485 1,690 (453,613) (27,052) (639,935) (1,120,600) — — — — (56,905) (3,802) (68,170) (128,877) — — — — 94,888,639 100,352,573 115,000 116,690 116,690 $100,469,263 — $116,690 $ $ 31,571 The Fund commenced operations on April 7, 2014. The accompanying notes are an integral part of the financial statements. 12 For the Period Ended April 30, 2014* 31 .
SKYBRIDGE DIVIDEND VALUE FUND Financial Highlights Contained below is per share operating performance data for Class A Shares outstanding, total investment return, ratios to average net assets and other supplemental data for the respective period. The total returns in the table represent the rate that an investor would have earned or lost on an investment in the Fund (assuming reinvestment of all dividends and distributions). This information has been derived from information provided in the financial statements and should be read in conjunction with the financial statements and the notes thereto. Class A For the Period June 13, 2014* to April 30, 2015 Per Share Operating Performance Net asset value, beginning of period . .
. . .
. . .
. . .
. . .
. . .
. . .
. . .
. . .
. . .
. . .
. . .
. . .
. . .
. . .
. . . Net investment income(1) .
. . .
. . .
. . .
. . .
. . .
. . .
. . .
. . .
. . .
. . .
. . .
. . .
. . .
. . .
. . .
. . .
. . .
. . .
. . Net realized and unrealized gain on investments . .
. . .
. . .
. . .
. . .
. . .
. . .
. . .
. . .
. . .
. . .
. . .
. . Net increase in net assets resulting from operations . .
. . .
. . .
. . .
. . .
. . .
. . .
. . .
. . .
. . .
. . .
. . Dividends and distributions to shareholders from: Net investment income . .
. . .
. . .
. . .
. . .
. . .
. . .
. . .
. . .
. . .
. . .
. . .
. . .
. . .
. . .
. . .
. . .
. . .
. . .
. . . Net realized capital gain .
. . .
. . .
. . .
. . .
. . .
. . .
. . .
. . .
. . .
. . .
. . .
. . .
. . .
. . .
. . .
. . .
. . .
. . .
. . . Total dividends and distributions to shareholders .
. . .
. . .
. . .
. . .
. . .
. . .
. . .
. . .
. . .
. . .
. . .
. . . Net asset value, end of period .
. . .
. . .
. . .
. . .
. . .
. . .
. . .
. . .
. . .
. . .
. . .
. . .
. . .
. . .
. . .
. . .
. . .
. Total investment return(2) . . .
. . .
. . .
. . .
. . .
. . .
. . .
. . .
. . .
. . .
. . .
. . .
. . .
. . .
. . .
. . .
. . .
. . .
. . . Ratio/Supplemental Data Net assets, end of period (000’s omitted) .
. . .
. . .
. . .
. . .
. . .
. . .
. . .
. . .
. . .
. . .
. . .
. . .
. . .
. . . Ratio of expenses to average net assets .
. . .
. . .
. . .
. . .
. . .
. . .
. . .
. . .
. . .
. . .
. . .
. . .
. . .
. . .
. Ratio of expenses to average net assets without waivers and expense reimbursements(4) . Ratio of net investment income to average net assets . . .
. . .
. . .
. . .
. . .
. . .
. . .
. . .
. . .
. . .
. . Portfolio turnover rate . .
. . .
. . .
. . .
. . .
. . .
. . .
. . .
. . .
. . .
. . .
. . .
. . .
. . .
. . .
. . .
. . .
. . .
. . .
. . .
. * (1) (2) (3) (4) (5) $ 10.47 0.23 0.78 1.01 (0.19) (0.02) (0.21) $ 11.27 9.74% $37,732 1.25%(3) 1.76%(3) 2.48%(3) 122.00%(5) Commencement of operations. The selected per share data was calculated using the average shares outstanding method for the period. Total investment return is calculated assuming a purchase of shares on the first day and a sale of shares on the last day of each period reported and includes reinvestments of dividends and distributions, if any. Total returns for periods less than one year are not annualized. Total investment return does not reflect the impact of the maximum front-end sales load of 5.75%.
If reflected, the return would be lower. Annualized. During the period, certain fees were waived and/or reimbursed. If such fee waivers and/or reimbursements had not occurred, the ratios would have been as indicated (See Note 2). Reflects portfolio turnover of the fund for the year ended April 30, 2015. The accompanying notes are an integral part of the financial statements. 13 . SKYBRIDGE DIVIDEND VALUE FUND Financial Highlights Contained below is per share operating performance data for Class C Shares outstanding, total investment return, ratios to average net assets and other supplemental data for the respective period. The total returns in the table represent the rate that an investor would have earned or lost on an investment in the Fund (assuming reinvestment of all dividends and distributions). This information has been derived from information provided in the financial statements and should be read in conjunction with the financial statements and the notes thereto. Class C For the Period October 17, 2014* to April 30, 2015 Per Share Operating Performance Net asset value, beginning of period . .
. . .
. . .
. . .
. . .
. . .
. . .
. . .
. . .
. . .
. . .
. . .
. . .
. . .
. . .
. . Net investment income(1) . .
. . .
. . .
. . .
. . .
. . .
. . .
. . .
. . .
. . .
. . .
. . .
. . .
. . .
. . .
. . .
. . .
. . .
. . . Net realized and unrealized gain on investments .
. . .
. . .
. . .
. . .
. . .
. . .
. . .
. . .
. . .
. . .
. . .
. . Net increase in net assets resulting from operations . .
. . .
. . .
. . .
. . .
. . .
. . .
. . .
. . .
. . .
. . .
. Dividends and distributions to shareholders from: Net investment income . . .
. . .
. . .
. . .
. . .
. . .
. . .
. . .
. . .
. . .
. . .
. . .
. . .
. . .
. . .
. . .
. . .
. . .
. . .
. Net realized capital gain . . .
. . .
. . .
. . .
. . .
. . .
. . .
. . .
. . .
. . .
. . .
. . .
. . .
. . .
. . .
. . .
. . .
. . .
. . . Total dividends and distributions to shareholders .
. . .
. . .
. . .
. . .
. . .
. . .
. . .
. . .
. . .
. . .
. . .
. . Net asset value, end of period. .
. . .
. . .
. . .
. . .
. . .
. . .
. . .
. . .
. . .
. . .
. . .
. . .
. . .
. . .
. . .
. . .
. . Total investment return(2) . .
. . .
. . .
. . .
. . .
. . .
. . .
. . .
. . .
. . .
. . .
. . .
. . .
. . .
. . .
. . .
. . .
. . .
. . . Ratio/Supplemental Data Net assets, end of period (000’s omitted) .
. . .
. . .
. . .
. . .
. . .
. . .
. . .
. . .
. . .
. . .
. . .
. . .
. . .
. . Ratio of expenses to average net assets. .
. . .
. . .
. . .
. . .
. . .
. . .
. . .
. . .
. . .
. . .
. . .
. . .
. . .
. . Ratio of expenses to average net assets without waivers and expense reimbursements(4) . .
. . .
. . .
. . .
. . .
. . .
. . .
. . .
. . .
. . .
. . .
. . .
. . .
. . .
. . .
. . .
. . .
. . .
. . .
. . .
. Ratio of net investment income to average net assets . . .
. . .
. . .
. . .
. . .
. . .
. . .
. . .
. . .
. . .
. Portfolio turnover rate . . .
. . .
. . .
. . .
. . .
. . .
. . .
. . .
. . .
. . .
. . .
. . .
. . .
. . .
. . .
. . .
. . .
. . .
. . .
. . * (1) (2) (3) (4) (5) $ 9.95 0.08 1.33 1.41 (0.09) (0.02) (0.11) $ 11.25 14.26% $ 6,819 2.00%(3) 2.32%(3) 1.46%(3) 122.00%(5) Commencement of operations. The selected per share data was calculated using the average shares outstanding method for the period. Total investment return is calculated assuming a purchase of shares on the first day and a sale of shares on the last day of each period reported and includes reinvestment of dividends and distributions, if any. Total returns for periods less than one year are not annualized. Annualized. During the period, certain fees were waived and/or reimbursed.
If such fee waivers and/or reimbursements had not occurred, the ratios would have been as indicated (See Note 2). Reflects portfolio turnover of the fund for the year ended April 30, 2015. The accompanying notes are an integral part of the financial statements. 14 . SKYBRIDGE DIVIDEND VALUE FUND Financial Highlights Contained below is per share operating performance data for Class I Shares outstanding, total investment return, ratios to average net assets and other supplemental data for the respective period. The total returns in the table represent the rate that an investor would have earned or lost on an investment in the Fund (assuming reinvestment of all dividends and distributions). This information has been derived from information provided in the financial statements and should be read in conjunction with the financial statements and the notes thereto. Class I For the For the Period Year Ended April 7, 2014* April 30, 2015 to April 30, 2014 Per Share Operating Performance Net asset value, beginning of period . .
. . .
. . .
. . .
. . .
. . .
. . .
. . .
. . .
. . .
. . .
. . .
. . Net investment income(1) . .
. . .
. . .
. . .
. . .
. . .
. . .
. . .
. . .
. . .
. . .
. . .
. . .
. . .
. . .
. . . Net realized and unrealized gain on investments .
. . .
. . .
. . .
. . .
. . .
. . .
. . .
. . .
. . Net increase in net assets resulting from operations. .
. . .
. . .
. . .
. . .
. . .
. . .
. . .
. Dividends and distributions to shareholders from: Net investment income . . .
. . .
. . .
. . .
. . .
. . .
. . .
. . .
. . .
. . .
. . .
. . .
. . .
. . .
. . .
. . .
. Net realized capital gain . . .
. . .
. . .
. . .
. . .
. . .
. . .
. . .
. . .
. . .
. . .
. . .
. . .
. . .
. . .
. . . Total dividends and distributions to shareholders.
. . .
. . .
. . .
. . .
. . .
. . .
. . .
. . .
. . Net asset value, end of period . .
. . .
. . .
. . .
. . .
. . .
. . .
. . .
. . .
. . .
. . .
. . .
. . .
. . .
. Total investment return(3) . . .
. . .
. . .
. . .
. . .
. . .
. . .
. . .
. . .
. . .
. . .
. . .
. . .
. . .
. . .
. . Ratio/Supplemental Data Net assets, end of period (000’s omitted) . .
. . .
. . .
. . .
. . .
. . .
. . .
. . .
. . .
. . .
. . .
. Ratio of expenses to average net assets . . .
. . .
. . .
. . .
. . .
. . .
. . .
. . .
. . .
. . .
. . . Ratio of expenses to average net assets without waivers and expense reimbursements(5) .
. . .
. . .
. . .
. . .
. . .
. . .
. . .
. . .
. . .
. . .
. . .
. . .
. . .
. . .
. . .
. . .
. . Ratio of net investment income to average net assets . .
. . .
. . .
. . .
. . .
. . .
. . .
. . Portfolio turnover rate . .
. . .
. . .
. . .
. . .
. . .
. . .
. . .
. . .
. . .
. . .
. . .
. . .
. . .
. . .
. . .
. . . * (1) (2) (3) (4) (5) (6) $ 10.23 $ 10.00 —(2) 0.23 0.23 0.29 0.98 1.27 (0.22) (0.02) (0.24) $ 11.26 — — — $ 10.23 12.54% $55,918 1.00% 1.63% 2.70% 122.00% 2.30% $ 117 1.00%(4) 646.65%(4) 0.79%(4) 1.98%(6) Commencement of operations. The selected per share data was calculated using the average shares outstanding method for the period. Amount is less than $0.005 per share. Total investment return is calculated assuming a purchase of shares on the first day and a sale of shares on the last day of each period reported and includes reinvestment of dividends and distributions, if any.
Total returns for periods less than one year are not annualized. Annualized. During the period, certain fees were waived and/or reimbursed. If such fee waivers and/or reimbursements had not occurred, the ratios would have been as indicated (See Note 2). Not annualized. The accompanying notes are an integral part of the financial statements. 15 . SKYBRIDGE DIVIDEND VALUE FUND Notes to Financial Statements April 30, 2015 1. Organization and Significant Accounting Policies The SkyBridge Dividend Value Fund (the “Fund”) is a diversified, open-end management investment company registered under the Investment Company Act of 1940, as amended (the “1940 Act”), which commenced operations on April 7, 2014. The Fund is a separate series of FundVantage Trust (the “Trust”) which was organized as a Delaware statutory trust on August 28, 2006. The Trust is a “series trust” authorized to issue an unlimited number of separate series or classes of shares of beneficial interest.
Each series is treated as a separate entity for certain matters under the 1940 Act, and for other purposes, and a shareholder of one series is not deemed to be a shareholder of any other series. The Fund offers Class A, Class C and Class I Shares. Class A Shares are sold subject to a front-end sales charge.
Front-end sales charges may be reduced or waived under certain circumstances. A contingent deferred sales charge (“CDSC”) may be applicable to the purchase of Class A Shares. A CDSC, as a percentage of the lower of the original purchase price or net asset value at redemption, of up to 1.00% may be imposed on full or partial redemptions of Class A Shares made within eighteen months of purchase where: (i) $1 million or more of Class A Shares were purchased without an initial sales charge and (ii) the selling broker-dealer received a commission for such sale.
A CDSC of up to 1.00% will be assessed when Class C Shares are redeemed within 18 months after initial purchase. The CDSC shall not apply to those purchases of Class C Shares where the selling broker-dealer did not receive a commission. Portfolio Valuation — The Fund’s net asset value (“NAV”) is calculated once daily at the close of regular trading hours on the New York Stock Exchange (“NYSE”) (typically 4:00 p.m. Eastern time) on each day the NYSE is open.
Securities held by the Fund are valued using the closing price or the last sale price on a national securities exchange or the National Association of Securities Dealers Automatic Quotation System (“NASDAQ”) market system where they are primarily traded. Equity securities traded in the over-the-counter market are valued at their closing prices. If there were no transactions on that day, securities traded principally on an exchange or on NASDAQ will be valued at the mean of the last bid and ask prices prior to the market close.
Fixed income securities having a remaining maturity of greater than 60 days are valued using an independent pricing service. Fixed income securities having a remaining maturity of 60 days or less are generally valued at amortized cost, provided such amount approximates fair value. Foreign securities are valued based on prices from the primary market in which they are traded and are translated from the local currency into U.S.
dollars using current exchange rates. Investments in other open-end investment companies are valued based on the NAV of the investment companies (which may use fair value pricing as discussed in their prospectuses). If market quotations are unavailable or deemed unreliable, securities will be valued in accordance with procedures adopted by the Trust’s Board of Trustees.
Relying on prices supplied by pricing services or dealers or using fair valuation may result in values that are higher or lower than the values used by other investment companies and investors to price the same investments. Fair Value Measurements — The inputs and valuation techniques used to measure fair value of the Fund’s investments are summarized into three levels as described in the hierarchy below: 16 . SKYBRIDGE DIVIDEND VALUE FUND Notes to Financial Statements (Continued) April 30, 2015 • Level 1 — quoted prices in active markets for identical securities; • Level 2 — other significant observable inputs (including quoted prices for similar securities, interest rates, prepayment speeds, credit risk, etc.); and • Level 3 — significant unobservable inputs (including the Fund’s own assumptions in determining the fair value of investments). The inputs or methodology used for valuing securities are not necessarily an indication of the risk associated with investing in those securities. The following is a summary of the inputs used, as of April 30, 2015, in valuing the Fund’s investments carried at fair value: Total Value at 04/30/15 Common Stocks*. . . .
. . .
. . .
. . . Short-Term Investment .
. . .
. . .
. Total Investments . . .
. . .
. . .
. . .
. Level 1 Quoted Prices $ 99,182,104 1,250,035 $ 100,432,139 $ 99,182,104 1,250,035 $ 100,432,139 Level 2 Other Significant Observable Inputs $ $ — — — Level 3 Significant Unobservable Inputs $ $ — — — * Please refer to Portfolio of Investments for further details on portfolio holdings. At the end of each quarter, management evaluates the classification of Levels 1, 2 and 3 assets and liabilities. Various factors are considered, such as changes in liquidity from the prior reporting period; whether or not a broker is willing to execute at the quoted price; the depth and consistency of prices from third party pricing services; and the existence of contemporaneous, observable trades in the market. Additionally, management evaluates the classification of Level 1 and Level 2 assets and liabilities on a quarterly basis for changes in listings or delistings on national exchanges. Due to the inherent uncertainty of determining the fair value of investments that do not have a readily available market value, the fair value of the Fund’s investments may fluctuate from period to period. Additionally, the fair value of investments may differ significantly from the values that would have been used had a ready market existed for such investments and may differ materially from the values the Fund may ultimately realize. Further, such investments may be subject to legal and other restrictions on resale or otherwise less liquid than publicly traded securities. For fair valuations using significant unobservable inputs, U.S.
generally accepted accounting principles (“U.S. GAAP”) require the Fund to present a reconciliation of the beginning to ending balances for reported market values that presents changes attributable to total realized and unrealized gains or losses, purchase 17 . SKYBRIDGE DIVIDEND VALUE FUND Notes to Financial Statements (Continued) April 30, 2015 and sales, and transfers in and out of Level 3 during the period. Transfers in and out between Levels are based on values at the end of the period. U.S. GAAP also requires the Fund to disclose amounts and reasons for all transfers in and out of Level 1 and Level 2 fair value measurements.
A reconciliation of Level 3 investments is presented only when the Fund had an amount of Level 3 investments at the end of the reporting period that was meaningful in relation to its net assets. The amounts and reasons for all transfers in and out of each Level within the three-tier hierarchy are disclosed when the Fund had an amount of total transfers during the reporting period that was meaningful in relation to its net assets as of the end of the reporting period. For the year ended April 30, 2015, there were no transfers between Levels 1, 2 and 3 for the Fund. Use of Estimates — The Fund is an investment company and follows accounting and reporting guidance in the Financial Accounting Standards Board Accounting Standards Codification Topic 946. The preparation of financial statements in conformity with U.S. GAAP requires management to make estimates and assumptions that affect the amounts reported in the financial statements and accompanying notes at the date of the financial statements and the reported amounts of revenues and expenses during the period.
Actual results could differ from those estimates and those differences could be material. Investment Transactions, Investment Income and Expenses — Investment transactions are recorded on trade date for financial statement preparation purposes. Realized gains and losses on investments sold are recorded on the identified cost basis. Interest income is recorded on the accrual basis.
Dividends are recorded on the ex-dividend date. Distribution (12b-1) fees and shareholder services fees relating to a specific class are charged directly to that class. General expenses of the Trust are generally allocated to each fund in proportion to its relative daily net assets.
Expenses directly attributable to a particular fund in the Trust are charged directly to that fund. The Fund’s investment income, expenses (other than class specific expenses) and unrealized and realized gains and losses are allocated daily to each class of shares based upon the relative proportion of net assets of each class at the beginning of the day. Dividends and Distributions to Shareholders — Dividends from net investment income are declared and paid quarterly to shareholders. Distributions, if any, of net short-term capital gain and net capital gain (the excess of net long-term capital gain over the short-term capital loss) realized by the Fund, after deducting any available capital loss carryovers, are declared and paid to its shareholders annually.
Income dividends and capital gain distributions are determined in accordance with U.S. federal income tax regulations, which may differ from U.S. GAAP These differences include the treatment of non-taxable dividends, . expiring capital loss carryforwards and losses deferred due to wash sales and excise tax regulations. Permanent book and tax basis differences relating to shareholder distributions will result in reclassifications within the components of net assets. U.S.
Tax Status — No provision is made for U.S. income taxes as it is the Fund’s intention to continue to qualify for and elect the tax treatment applicable to regulated investment companies under Subchapter 18 . SKYBRIDGE DIVIDEND VALUE FUND Notes to Financial Statements (Continued) April 30, 2015 M of the Internal Revenue Code of 1986, as amended, and make the requisite distributions to its shareholders which will be sufficient to relieve it from U.S. income and excise taxes. Other — In the normal course of business, the Fund may enter into contracts that provide general indemnifications. The Fund’s maximum exposure under these arrangements is dependent on claims that may be made against the Fund in the future, and therefore, cannot be estimated; however, based on experience, the risk of material loss for such claims is considered remote. 2. Transactions with Affiliates and Related Parties SkyBridge Capital II, LLC (“SkyBridge” or the “Adviser”) serves as investment adviser to the Fund pursuant to an investment advisory agreement with the Trust (the “Advisory Agreement”).
For its services, the Adviser is paid a monthly fee at the annual rate of 0.75% of the Fund’s average daily net assets. The Adviser has contractually agreed to reduce its management fee and/or reimburse certain expenses of the Fund to the extent necessary to ensure that the Fund’s total operating expenses (excluding interest, extraordinary items, “Acquired Fund fees and expenses” and brokerage commissions) do not exceed (on an annual basis) 1.25% with respect to Class A shares, 2.00% with respect to Class C shares and 1.00% with respect to Class I shares of average daily net assets of the Fund (the “Expense Limitation”). The Expense Limitation will remain in place for three years from the date of the Fund’s inception, unless the Board of Trustees of FundVantage Trust (the “Trust”) approves its earlier termination. Subject to approval by the Board of Trustees, the Adviser may recoup any expenses or fees it has reimbursed within a three-year period from the year in which the Adviser reduced its compensation and/or assumed expenses of the Fund.
No recoupment will occur unless the Fund’s expenses are below the Expense Limitation. As of April 30, 2015, the amount of potential recovery was as follows: Expiration April 30, 2017 April 30, 2018 $25,454 $250,547 For the year ended April 30, 2015, the Adviser earned advisory fees of $333,766 and waived fees of $250,547. BNY Mellon Investment Servicing (US) Inc. (“BNY Mellon”) serves as administrator and transfer agent for the Fund. For providing administrative and accounting services, BNY Mellon is entitled to receive a monthly fee equal to an annual percentage rate of the Fund’s average daily net assets, subject to certain minimum monthly fees.
For providing transfer agency services, BNY Mellon is entitled to receive a monthly fee, subject to certain minimum, and out of pocket expenses. 19 . SKYBRIDGE DIVIDEND VALUE FUND Notes to Financial Statements (Continued) April 30, 2015 The Bank of New York Mellon (the “Custodian”) provides certain custodial services to the Fund. The Custodian is entitled to receive a monthly fee, subject to certain minimum, and out of pocket expenses. Foreside Funds Distributors LLC (the “Underwriter”) provides principal underwriting services to the Fund. The Trust and the Underwriter are parties to an underwriting agreement. The Trust has adopted a distribution plan for Class A and Class C Shares in accordance with Rule 12b-1 under the 1940 Act. Pursuant to the Class A and Class C Shares plan, the Fund compensates the Underwriter for direct and indirect costs and expenses incurred in connection with advertising, marketing and other distribution services in an amount not to exceed 0.25% and 1.00% (0.75% distribution fee and 0.25% shareholder service fee), respectively, on an annualized basis of the average daily net assets of the Fund’s Class A and Class C Shares. The Trustees of the Trust who are not officers or employees of an investment adviser, sub-adviser or other service provider to the Trust receive compensation in the form of an annual retainer and per meeting fees for their services as a Trustee. The remuneration paid to the Trustees by the Fund during the year ended April 30, 2015 was $4,131. Certain employees of BNY Mellon serve as Officers of the Trust.
They are not compensated by the Fund or the Trust. 3. Investment in Securities For the year ended April 30, 2015, aggregate purchases and sales of investment securities (excluding short-term investments) of the Fund were as follows: Purchases Investment Securities . .
. . .
. . .
. . .
. . .
. . .
. . .
. . .
. . .
. . .
. . .
. . .
. . .
. 20 Sales $148,349,967 $54,807,814 . SKYBRIDGE DIVIDEND VALUE FUND Notes to Financial Statements (Continued) April 30, 2015 4. Capital Share Transactions For the year ended April 30, 2015 and the period from April 7, 2014, commencement of operations, to April 30, 2014, transactions in capital shares (authorized shares unlimited) were as follows: For Year Ended April 30, 2015 Shares Class A* Sales . . .
. . .
. . .
. . .
. . .
. . .
. . .
. . .
. . .
. . .
. . .
. . .
. . . Reinvestments .
. . .
. . .
. . .
. . .
. . .
. . .
. . .
. . .
. . .
. . . Redemptions .
. . .
. . .
. . .
. . .
. . .
. . .
. . .
. . .
. . .
. . .
. Net increase . . .
. . .
. . .
. . .
. . .
. . .
. . .
. . .
. . .
. . .
. . . Class C** Sales .
. . .
. . .
. . .
. . .
. . .
. . .
. . .
. . .
. . .
. . .
. . .
. . .
. . Reinvestments . .
. . .
. . .
. . .
. . .
. . .
. . .
. . .
. . .
. . .
. . Redemptions . .
. . .
. . .
. . .
. . .
. . .
. . .
. . .
. . .
. . .
. . . Net increase .
. . .
. . .
. . .
. . .
. . .
. . .
. . .
. . .
. . .
. . .
. . Class I*** Sales . .
. . .
. . .
. . .
. . .
. . .
. . .
. . .
. . .
. . .
. . .
. . .
. . .
. Reinvestments . . .
. . .
. . .
. . .
. . .
. . .
. . .
. . .
. . .
. . .
. Redemptions . . .
. . .
. . .
. . .
. . .
. . .
. . .
. . .
. . .
. . .
. . Net increase . .
. . .
. . .
. . .
. . .
. . .
. . .
. . .
. . .
. . .
. . .
. Amount For the Period Ended April 30, 2014 Shares 3,419,174 $36,289,524 47,974 510,449 (119,050) (1,273,790) 3,348,098 $35,526,183 — — — — 604,496 $ 6,561,314 2,868 30,854 (1,046) (11,148) 606,318 $ 6,581,020 — — — — Amount $ $ $ $ — — — — — — — — $115,000 — — $115,000 8,907,390 Total Net Increase 5,134,934 $54,735,869 11,412 57,576 613,448 — (239,536) (2,567,881) — 4,952,974 $52,781,436 11,412 $115,000 $94,888,639 11,412 * Class A Shares commenced operations on June 13, 2014. ** Class C Shares commenced operations on October 17, 2014. *** Class I Shares commenced operations on April 7, 2014. 5. Federal Tax Information The Fund has followed the authoritative guidance on accounting for and disclosure of uncertainty in tax positions, which requires the Fund to determine whether a tax position is more likely than not to be sustained upon examination, including resolution of any related appeals or litigation processes, based on the technical merits of the position. The Fund has determined that there was no effect on the financial statements from following this authoritative guidance.
In the normal course of business, the Fund is subject to examination by federal, state and local jurisdictions, where applicable, for tax years for which applicable statutes of limitations have not expired. 21 . SKYBRIDGE DIVIDEND VALUE FUND Notes to Financial Statements (Continued) April 30, 2015 In order to present net asset components on the Statement of Assets and Liabilities that more closely represent their tax character, certain reclassifications are made to the net asset components. For the year ended April 30, 2015, these adjustments were to increase accumulated net investment income by $12,185 and to decrease paid-in-capital by $12,185. This adjustment is attributable to disallowed expenses. Net realized gains and net assets were not affected by these adjustments. For the year ended April 30, 2015, the tax character of distributions paid by the Fund was $1,249,477 of ordinary income dividends. For the period ended April 30, 2014, no distributions were paid by the Fund.
Distributions from short-term capital gains are treated as ordinary income for federal income tax purposes. As of April 30, 2015, the components of distributable earnings on a tax basis were as follows: Capital Loss Carryforward Undistributed Ordinary Income Undistributed Long-Term Gain Unrealized Appreciation $— $3,223,214 $4,363 $2,250,232 The differences between the book and tax basis components of distributable earnings relate primarily to the timing and recognition of income and gains for federal income tax purposes. Short-term capital gains are reported as ordinary income for federal income tax purposes. As of April 30, 2015, the federal tax cost, aggregate gross unrealized appreciation and depreciation of securities held by the Fund were as follows: Federal tax cost . .
. . .
. . .
. . .
. . .
. . .
. . .
. . .
. . .
. . .
$98,181,907 Gross unrealized appreciation. . .
. . .
. . .
. . .
. . .
. . $ 3,502,326 Gross unrealized depreciation.
. . .
. . .
. . .
. . .
. . .
. (1,252,094) Net unrealized appreciation . . .
. . .
. . .
. . .
. . .
. . .
. $ 2,250,232 Pursuant to the federal income tax rules applicable to regulated investment companies, the Fund may elect to treat certain capital losses between November 1 and April 30 and late year ordinary losses ((i) ordinary losses between January 1 and April 30, and (ii) specified ordinary and currency losses between November 1 and April 30) as occurring on the first day of the following tax year. For the year ended April 30, 2015, the Fund had no short-term capital loss deferrals and no long-term capital loss deferrals. Accumulated capital losses represent net capital loss carryforwards as of April 30, 2015 that may be available to offset future realized capital gains and thereby reduce future capital gains distributions.
As of April 30, 2015, the Fund did not have any capital loss carryforwards. 22 . SKYBRIDGE DIVIDEND VALUE FUND Notes to Financial Statements (Concluded) April 30, 2015 6. Subsequent Events Management has evaluated the impact of all subsequent events on the Fund through the date the financial statements were issued, and has determined that there were no subsequent events requiring recognition or disclosure in the financial statements. 23 . SKYBRIDGE DIVIDEND VALUE FUND Report of Independent Registered Public Accounting Firm To the Board of Trustees of the FundVantage Trust and Shareholders of the SkyBridge Dividend Value Fund: We have audited the accompanying statement of assets and liabilities, including the portfolio of investments, of the SkyBridge Dividend Value Fund (one of the series constituting FundVantage Trust) (the “Fund”) as of April 30, 2015, and the related statement of operations for the year then ended, the statements of changes in net assets for the year then ended and the period from April 7, 2014 (commencement of operations) to April 30, 2014, and the financial highlights for each of the periods indicated therein. These financial statements and financial highlights are the responsibility of the Fund’s management. Our responsibility is to express an opinion on these financial statements and financial highlights based on our audits We conducted our audits in accordance with the standards of the Public Company Accounting Oversight Board (United States). Those standards require that we plan and perform the audit to obtain reasonable assurance about whether the financial statements and financial highlights are free of material misstatement. We were not engaged to perform an audit of the Fund’s internal control over financial reporting.
Our audits included consideration of internal control over financial reporting as a basis for designing audit procedures that are appropriate in the circumstances, but not for the purpose of expressing an opinion on the effectiveness of the Fund’s internal control over financial reporting. Accordingly, we express no such opinion. An audit also includes examining, on a test basis, evidence supporting the amounts and disclosures in the financial statements and financial highlights, assessing the accounting principles used and significant estimates made by management, and evaluating the overall financial statement presentation. Our procedures included confirmation of securities owned as of April 30, 2015, by correspondence with the custodian and brokers or by other appropriate auditing procedures where replies from brokers were not received.
We believe that our audits provide a reasonable basis for our opinion. In our opinion, the financial statements and financial highlights referred to above present fairly, in all material respects, the financial position of the SkyBridge Dividend Value Fund (one of the series constituting FundVantage Trust) at April 30, 2015, the results of its operations for the year then ended, the changes in its net assets for the year then ended and the period from April 7, 2014 (commencement of operations) to April 30, 2014, and its financial highlights for each of the periods indicated therein, in conformity with U.S. generally accepted accounting principles. Philadelphia, Pennsylvania June 26, 2015 24 . SKYBRIDGE DIVIDEND VALUE FUND Shareholder Tax Information (Unaudited) The Fund is required by Subchapter M of the Internal Revenue Code of 1986, as amended, to advise its shareholders of the U.S. federal tax status of distributions received by the Fund’s shareholders in respect of such fiscal year. During the fiscal year ended April 30, 2015, the Fund paid $1,249,477 of ordinary income dividends and no long-term capital gain dividends to its shareholders. Dividends from net investment income and short-term capital gains are treated as ordinary income dividends for federal income tax purposes. The Fund designates 35.76% of the ordinary income distribution as qualified dividend income pursuant to the Jobs and Growth Tax Relief Reconciliation Act of 2003. The percentage of ordinary income dividends qualifying for the corporate dividends received deduction is 35.62%. The Fund designates 99.86% of the ordinary income distributions as qualified short-term gain pursuant to the American Jobs Creation Act of 2004. All designations are based on financial information available as of the date of this annual report and, accordingly, are subject to change.
For each item, it is the intention of the Fund to designate the maximum amount permitted under the Internal Revenue Code and the regulations thereunder. Because the Fund’s fiscal year is not the calendar year, another notification will be sent with respect to calendar year 2015. The second notification, which will reflect the amount, if any, to be used by calendar year taxpayers on their U.S. federal income tax returns, will be made in conjunction with Form 1099-DIV and will be mailed in January 2016. Foreign shareholders will generally be subject to U.S.
withholding tax on the amount of their ordinary income dividends. They will generally not be entitled to a foreign tax credit or deduction for the withholding taxes paid by the Fund, if any. In general, dividends received by tax-exempt recipients (e.g., IRAs and Keoghs) need not be reported as taxable income for U.S. federal income tax purposes.
However, some retirement trusts (e.g., corporate, Keogh and 403(b)(7) plans) may need this information for their annual information reporting. Shareholders are advised to consult their own tax advisers with respect to the tax consequences of their investment in the Fund. 25 . SKYBRIDGE DIVIDEND VALUE FUND Other Information (Unaudited) Proxy Voting Policies and procedures that the Fund uses to determine how to vote proxies relating to portfolio securities as well as information regarding how the Fund voted proxies relating to portfolio securities for the most recent 12-month period ended June 30 are available without charge, upon request, by calling (888) 919-6885 and on the Securities and Exchange Commission’s (“SEC”) website at http:// www.sec.gov. Quarterly Portfolio Schedules The Trust files its complete schedule of portfolio holdings with the SEC for the first and third fiscal quarters of each fiscal year (quarters ended July 31 and January 31) on Form N-Q. The Trust’s Forms N-Q are available on the SEC’s website at http://www.sec.gov and may be reviewed and copied at the SEC’s Public Reference Room in Washington, D.C. Information on the operation of the SEC’s Public Reference Room may be obtained by calling 1-800-SEC-0330. [ 26 To Come ] . SKYBRIDGE DIVIDEND VALUE FUND Privacy Notice (Unaudited) The privacy of your personal financial information is extremely important to us. When you open an account with us, we collect a significant amount of information from you in order to properly invest and administer your account. We take very seriously the obligation to keep that information private and confidential, and we want you to know how we protect that important information. We collect nonpublic personal information about you from applications or other forms you complete and from your transactions with us or our affiliates. We do not disclose information about you, or our former clients, to our affiliates or to service providers or other third parties, except as permitted by law. We share only the information required to properly administer your accounts, which enables us to send transaction confirmations, monthly or quarterly statements, financials and tax forms.
Even within FundVantage Trust and its affiliated entities, a limited number of people who actually service accounts will have access to your personal financial information. Further, we do not share information about our current or former clients with any outside marketing groups or sales entities. To ensure the highest degree of security and confidentiality, FundVantage Trust and its affiliates maintain various physical, electronic and procedural safeguards to protect your personal information. We also apply special measures for authentication of information you request or submit to us on our web site. If you have questions or comments about our privacy practices, please call us at (888) 919-6885. 27 . SKYBRIDGE DIVIDEND VALUE FUND Fund Management (Unaudited) FundVantage Trust (the “Trust”) is governed by a Board of Trustees (the “Trustees”). The primary responsibility of the Trustees is to represent the interest of the Trust’s shareholders and to provide oversight management of the Trust. The following tables present certain information regarding the Board of Trustees and officers of the Trust. Each person listed under “Interested Trustee” below is an “interested person” of the Trust, the Adviser, another investment adviser of a series of the Trust, or Foreside Funds Distributors LLC, the principal underwriter of the Trust (“Underwriter”), within the meaning of the 1940 Act. Each person who is not an “interested person” of the Trust, the Adviser or the Underwriter within the meaning of the 1940 Act is referred to as an “Independent Trustee” and is listed under such heading below.
The address of each Trustee and Officer as it relates to the Trust’s business is 301 Bellevue Parkway, 2nd Floor, Wilmington, DE 19809. The Statement of Additional Information for the Fund contains additional information about the Trustees and is available, without charge, upon request, by calling (888) 919-6885. Name and Date of Birth Position(s) Held with Trust Term of Office and Length of Time Served Principal Occupation(s) During Past Five Years Number of Funds in Trust Complex Overseen by Trustee Other Directorships Held by Trustee INDEPENDENT TRUSTEES ROBERT J. CHRISTIAN Date of Birth: 2/49 Trustee and Chairman of the Board Shall serve until death, resignation or removal. Trustee and Chairman since 2007. Retired since February 2006; Executive Vice President of Wilmington Trust Company from February 1996 to February 2006; President of Rodney Square Management Corporation (“RSMC”) (investment advisory firm) from 1996 to 2005; Vice President of RSMC from 2005 to 2006. 38 Optimum Fund Trust (registered investment company) (6 portfolios). IQBAL MANSUR Date of Birth: 6/55 Trustee Shall serve until death, resignation or removal. Trustee since 2007. University Professor, Widener University. 38 None. 28 . SKYBRIDGE DIVIDEND VALUE FUND Fund Management (Continued) (Unaudited) Name and Date of Birth Position(s) Held with Trust Term of Office and Length of Time Served Principal Occupation(s) During Past Five Years Number of Funds in Trust Complex Overseen by Trustee Other Directorships Held by Trustee DONALD J. PUGLISI Date of Birth: 8/45 Trustee Shall serve until death, resignation or removal. Trustee since 2008. Managing Director of Puglisi & Associates (financial, administrative and consulting services) from 1973 to present; MBNA America Professor of Business Emeritus at the University of Delaware from 2001 to present; Commissioner, The State of Delaware Public Service Commission from 1997 to 2004. 38 None. STEPHEN M. WYNNE Date of Birth: 1/55 Trustee Shall serve until death, resignation or removal. Trustee since 2009. Retired since December 2010; Chief Executive Officer of US Funds Services, BNY Mellon Asset Servicing from July 2010 to December 2010; Chief Executive Officer of PNC Global Investment Servicing from March 2008 to July 2010; President, PNC Global Investment Servicing 2003 to 2008. 38 Copeland Trust (registered investment company) (2 portfolios). Context Capital Funds (registered investment company) (1 portfolio). 29 . SKYBRIDGE DIVIDEND VALUE FUND Fund Management (Continued) (Unaudited) Name and Date of Birth Position(s) Held with Trust Term of Office and Length of Time Served Principal Occupation(s) During Past Five Years Number of Funds in Trust Complex Overseen by Trustee Other Directorships Held by Trustee INTERESTED TRUSTEE1 NANCY B. WOLCOTT Date of Birth: 11/54 Trustee Shall serve until death, resignation or removal. Trustee since 2011. 1 Retired since May 2014; EVP , Head of GFI Client Service Delivery, BNY Mellon from January 2012 to May 2014; EVP Head of US Funds , Services, BNY Mellon from July 2010 to January 2012; President of PNC Global Investment Servicing from 2008 to July 2010; Chief Operating Officer of PNC Global Investment Servicing from 2007 to 2008; Executive Vice President of PFPC Worldwide Inc. from 2006 to 2007. 38 None. Ms. Wolcott may be deemed an “interested person” of the Trust as that term is defined in the 1940 Act by reason of her former position as Executive Vice President of BNY Mellon Asset Servicing, the administrator and accounting agent and transfer agent to the Trust. 30 .
SKYBRIDGE DIVIDEND VALUE FUND Fund Management (Concluded) (Unaudited) Name and Date of Birth Position(s) Held with Trust Term of Office and Length of Time Served Principal Occupation(s) During Past Five Years EXECUTIVE OFFICERS JOEL L. WEISS Date of Birth: 1/63 President and Chief Executive Officer Shall serve until death, resignation or removal. Officer since 2007. Vice President and Managing Director of BNY Mellon Investment Servicing (US) Inc. and predecessor firms since 1993. JAMES G.
SHAW Date of Birth: 10/60 Treasurer and Chief Financial Officer Shall serve until death, resignation or removal. Officer since 2007. Vice President and Senior Director of BNY Mellon Investment Servicing (US) Inc. and predecessor firms since 1995. VINCENZO A.
SCARDUZIO Secretary Date of Birth: 4/72 Shall serve until death, resignation or removal. Officer since 2012. Vice President and Counsel Regulatory Administration of BNY Mellon Investment Servicing (US) Inc. and predecessor firms since 2001; DAVID C.
LEBISKY Date of Birth: 5/72 Shall serve until death, resignation or removal. Officer since 2015. Senior Consultant, Freeh Group International Solutions, LLC (a global risk management firm) since 2015; Scotia Institutional Investments US, LP Director , of Regulatory Administration from 2010 to 2014. Chief Compliance Officer 31 . Investment Adviser SkyBridge Capital II, LLC 527 Madison Avenue, 16th Floor New York, New York 10022 Administrator BNY Mellon Investment Servicing (US) Inc. 301 Bellevue Parkway Wilmington, DE 19809 Transfer Agent BNY Mellon Investment Servicing (US) Inc. 4400 Computer Drive Westborough, MA 01581 Principal Underwriter Foreside Funds Distributors LLC 400 Berwyn Park 899 Cassatt Road Berwyn, PA 19312 Custodian The Bank of New York Mellon One Wall Street New York, NY 10286 Independent Registered Public Accounting Firm Ernst & Young LLP One Commerce Square 2005 Market Street, Suite 700 Philadelphia, PA 19103-7096 Legal Counsel Pepper Hamilton LLP 3000 Two Logan Square 18th and Arch Streets Philadelphia, PA 19103 SkyBridge Dividend Value Fund of FundVantage Trust Class A Class C Class I ANNUAL REPORT April 30, 2015 This report is submitted for the general information of the shareholders of the SkyBridge Dividend Value Fund. It is not authorized for distribution unless preceded or accompanied by a current prospectus for the SkyBridge Dividend Value Fund. Sky001 .


