


Description
The House View:
What’s Good for China
by Lee Partridge,
Chief Investment Officer
September 1, 2015
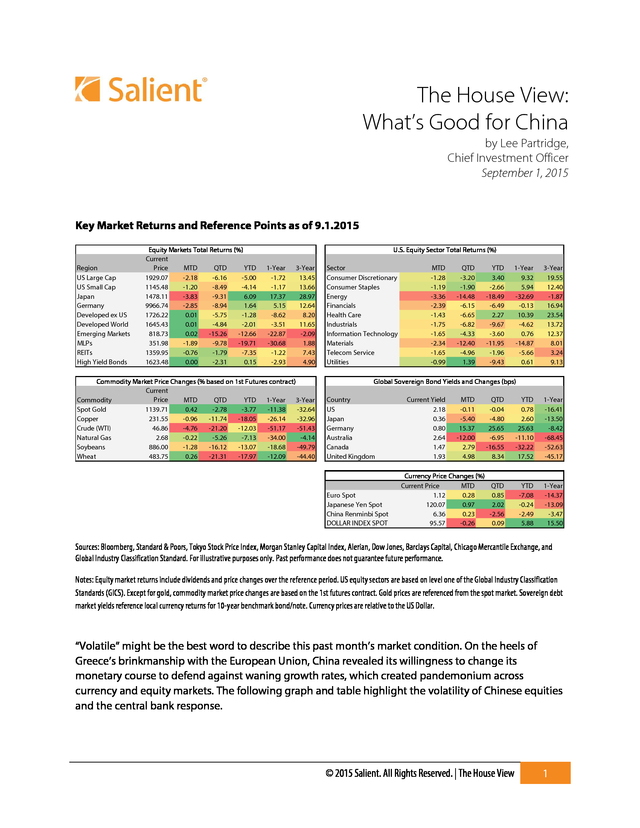
Key Market Returns and Reference Points as of 9.1.2015
Region
US Large Cap
US Small Cap
Japan
Germany
Developed ex US
Developed World
Emerging Markets
MLPs
REITs
High Yield Bonds
Equity Markets Total Returns (%)
Current
MTD
QTD
YTD
Price
1929.07
-2.18
-6.16
-5.00
1145.48
-1.20
-8.49
-4.14
1478.11
-3.83
-9.31
6.09
9966.74
-2.85
-8.94
1.64
1726.22
0.01
-5.75
-1.28
1645.43
0.01
-4.84
-2.01
818.73
0.02
-15.26
-12.66
351.98
-1.89
-9.78
-19.71
1359.95
-0.76
-1.79
-7.35
1623.48
0.00
-2.31
0.15
U.S. Equity Sector Total Returns (%)
1-Year
-1.72
-1.17
17.37
5.15
-8.62
-3.51
-22.87
-30.68
-1.22
-2.93
3-Year
13.45
13.66
28.97
12.64
8.20
11.65
-2.09
1.88
7.43
4.90
Commodity Market Price Changes (% based on 1st Futures contract)
Current
Price
Commodity
MTD
QTD
YTD 1-Year 3-Year
Spot Gold
1139.71
0.42
-2.78
-3.77
-11.38
-32.64
Copper
231.55
-0.96
-11.74
-18.05
-26.14
-32.96
Crude (WTI)
46.86
-4.76
-21.20
-12.03
-51.17
-51.43
Natural Gas
2.68
-0.22
-5.26
-7.13
-34.00
-4.14
Soybeans
886.00
-1.28
-16.12
-13.07
-18.68
-49.79
Wheat
483.75
0.26
-21.31
-17.97
-12.09
-44.40
Sector
Consumer Discretionary
Consumer Staples
Energy
Financials
Health Care
Industrials
Information Technology
Materials
Telecom Service
Utilities
MTD
-1.28
-1.19
-3.36
-2.39
-1.43
-1.75
-1.65
-2.34
-1.65
-0.99
QTD
-3.20
-1.90
-14.48
-6.15
-6.65
-6.82
-4.33
-12.40
-4.96
1.39
YTD
3.40
-2.66
-18.49
-6.49
2.27
-9.67
-3.60
-11.95
-1.96
-9.43
1-Year
9.32
5.94
-32.69
-0.13
10.39
-4.62
0.76
-14.87
-5.66
0.61
3-Year
19.55
12.40
-1.87
16.94
23.54
13.72
12.37
8.01
3.24
9.13
Global Sovereign Bond Yields and Changes (bps)
Country
US
Japan
Germany
Australia
Canada
United Kingdom
Euro Spot
Japanese Yen Spot
China Renminbi Spot
DOLLAR INDEX SPOT
Current Yield
2.18
0.36
0.80
2.64
1.47
1.93
MTD
-0.11
-5.40
15.37
-12.00
2.79
4.98
QTD
-0.04
-4.80
25.65
-6.95
-16.55
8.34
YTD
0.78
2.60
25.63
-11.10
-32.22
17.52
1-Year
-16.41
-13.50
-8.42
-68.45
-52.63
-45.17
Currency Price Changes (%)
Current Price
MTD
QTD
1.12
0.28
0.85
120.07
0.97
2.02
6.36
0.23
-2.56
95.57
-0.26
0.09
YTD
-7.08
-0.24
-2.49
5.88
1-Year
-14.37
-13.09
-3.47
15.50
Sources: Bloomberg, Standard & Poors, Tokyo Stock Price Index, Morgan Stanley Capital Index, Alerian, Dow Jones, Barclays Capital, Chicago Mercantile Exchange, and
Global Industry Classification Standard. For illustrative purposes only. Past performance does not guarantee future performance.
Notes: Equity market returns include dividends and price changes over the reference period.
US equity sectors are based on level one of the Global Industry Classification Standards (GICS). Except for gold, commodity market price changes are based on the 1st futures contract. Gold prices are referenced from the spot market.
Sovereign debt market yields reference local currency returns for 10-year benchmark bond/note. Currency prices are relative to the US Dollar. “Volatile” might be the best word to describe this past month’s market condition. On the heels of Greece’s brinkmanship with the European Union, China revealed its willingness to change its monetary course to defend against waning growth rates, which created pandemonium across currency and equity markets.
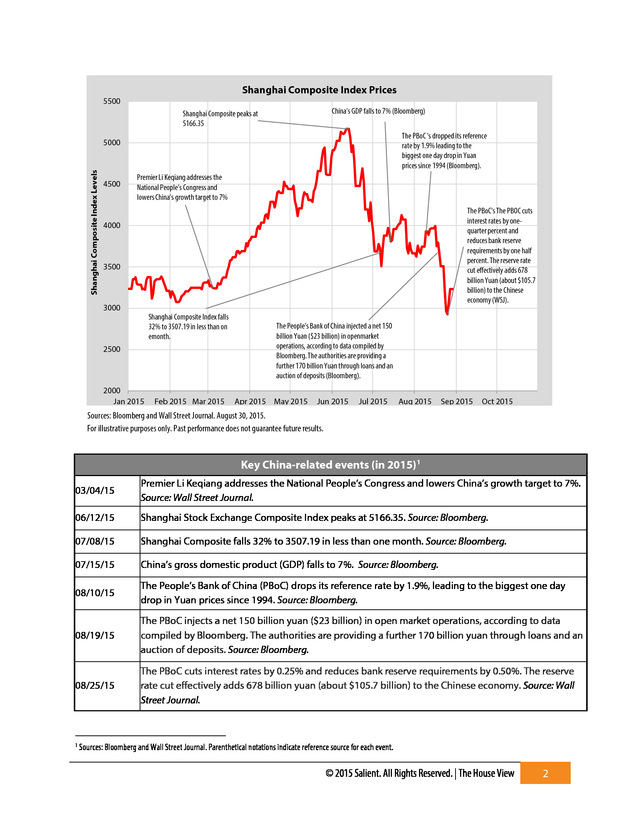
The following graph and table highlight the volatility of Chinese equities and the central bank response. © 2015 Salient. All Rights Reserved. | The House View 1 .
Shanghai Composite Index Prices 5500 China's GDP falls to 7% (Bloomberg) Shanghai Composite peaks at 5166.35 The PBoC 's dropped its reference rate by 1.9% leading to the biggest one day drop in Yuan prices since 1994 (Bloomberg). Shanghai Composite Index Levels 5000 4500 Premier Li Keqiang addresses the National People’s Congress and lowers China’s growth target to 7% The PBoC's The PBOC cuts interest rates by onequarter percent and reduces bank reserve requirements by one half percent. The reserve rate cut effectively adds 678 billion Yuan (about $105.7 billion) to the Chinese economy (WSJ). 4000 3500 3000 Shanghai Composite Index falls 32% to 3507.19 in less than on emonth. 2500 2000 Jan 2015 Feb 2015 Mar 2015 The People’s Bank of China injected a net 150 billion Yuan ($23 billion) in openmarket operations, according to data compiled by Bloomberg. The authorities are providing a further 170 billion Yuan through loans and an auction of deposits (Bloomberg). Apr 2015 May 2015 Jun 2015 Jul 2015 Aug 2015 Sep 2015 Oct 2015 Sources: Bloomberg and Wall Street Journal. August 30, 2015. For illustrative purposes only.
Past performance does not guarantee future results. Key China-related events (in 2015) 1 03/04/15 Premier Li Keqiang addresses the National People’s Congress and lowers China’s growth target to 7%. Source: Wall Street Journal. 06/12/15 Shanghai Stock Exchange Composite Index peaks at 5166.35. Source: Bloomberg. 07/08/15 Shanghai Composite falls 32% to 3507.19 in less than one month. Source: Bloomberg. 07/15/15 China’s gross domestic product (GDP) falls to 7%.
Source: Bloomberg. 08/10/15 The People’s Bank of China (PBoC) drops its reference rate by 1.9%, leading to the biggest one day drop in Yuan prices since 1994. Source: Bloomberg. 08/19/15 The PBoC injects a net 150 billion yuan ($23 billion) in open market operations, according to data compiled by Bloomberg. The authorities are providing a further 170 billion yuan through loans and an auction of deposits.
Source: Bloomberg. 08/25/15 The PBoC cuts interest rates by 0.25% and reduces bank reserve requirements by 0.50%. The reserve rate cut effectively adds 678 billion yuan (about $105.7 billion) to the Chinese economy. Source: Wall Street Journal. 1 Sources: Bloomberg and Wall Street Journal.
Parenthetical notations indicate reference source for each event. © 2015 Salient. All Rights Reserved. | The House View 2 .
Our Takeaways Our takeaways for the month are as follows: 1. We believe that the People’s Bank of China (PBoC) was entirely justified in its August actions. The peg to the U.S. dollar since 2013 has represented a difficult arrangement for China during a period when the dollar has been strengthening vis-à-vis other major currencies while China’s economic growth has been faltering.
Since 2009, China has contributed 65% more to the growth of the global economy than the United States. We believe, at least to some extent, that what’s good for China is good for America and the world (evidence to follow). 2. We live in a world of credit fueled consumption.
While the risks of morale hazard run high, a move toward more hawkish monetary policy and/or any new regulatory initiatives relating to banks, could further dampen growth. Furthermore, it’s important to note that both the absolute level of global debt and global debt to GDP have increased since the financial crisis of 2008, which may explain at least some of the global economy’s growth to date. 3. In our view, it has become less likely that the Federal Reserve (Fed) will increase short-term interest rates this year, which means the Fed may remain on the sidelines through next year’s presidential election cycle.
Based on recent market volatility and dissipating growth, the Fed’s intent to normalize short-term interest rates seems ill-timed. William Dudley, president of the Federal Reserve Bank of New York stated at a press conference on August 26 that the case for raising interest rates is “less compelling” (Dudley Comments). Stanley Fischer, vice chairman of the Fed, offered an alternative view at the annual economic policy symposium in Jackson Hole, Wyoming, by suggesting that the Fed should not wait to raise short-term interest rates citing the transitory nature of certain disinflationary forces (Fischer-Jackson Hole).
At the very least, we think the Fed is grasping for policy flexibility as these two key leaders offer conflicting views while Fed Chair Janet Yellen remains on the sidelines. Faltering growth in China leads to monetary capitulation According to the International Monetary Fund’s (IMF) 2015 projections, since 2009 the global economy grew at a 3.77% annualized pace from $59.7 trillion to $74.5 trillion. The largest contributors to growth during this period were China (41% of total increase) and the United States (25% of total increase). We highlight these statistics to offer investors some perspective on the relative importance of China as a growth engine for the global economy.
Without China, the world would have only grown by an annualized rate of 2.50% during this period (from $54.5 trillion to $63.3 trillion). © 2015 Salient. All Rights Reserved. | The House View 3 .
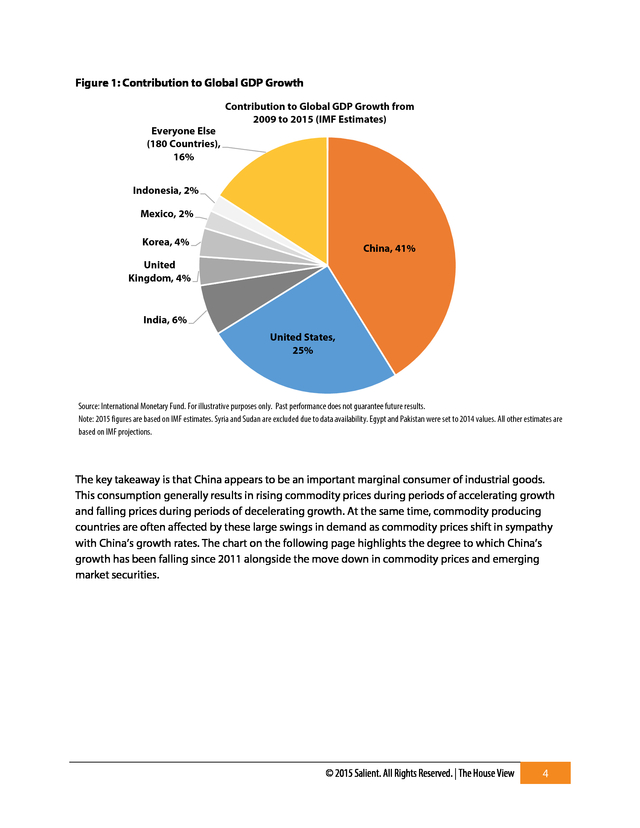
Figure 1: Contribution to Global GDP Growth Everyone Else (180 Countries), 16% Contribution to Global GDP Growth from 2009 to 2015 (IMF Estimates) Indonesia, 2% Mexico, 2% Korea, 4% China, 41% United Kingdom, 4% India, 6% United States, 25% Source: International Monetary Fund. For illustrative purposes only. Past performance does not guarantee future results. Note: 2015 figures are based on IMF estimates. Syria and Sudan are excluded due to data availability.
Egypt and Pakistan were set to 2014 values. All other estimates are based on IMF projections. The key takeaway is that China appears to be an important marginal consumer of industrial goods. This consumption generally results in rising commodity prices during periods of accelerating growth and falling prices during periods of decelerating growth. At the same time, commodity producing countries are often affected by these large swings in demand as commodity prices shift in sympathy with China’s growth rates.
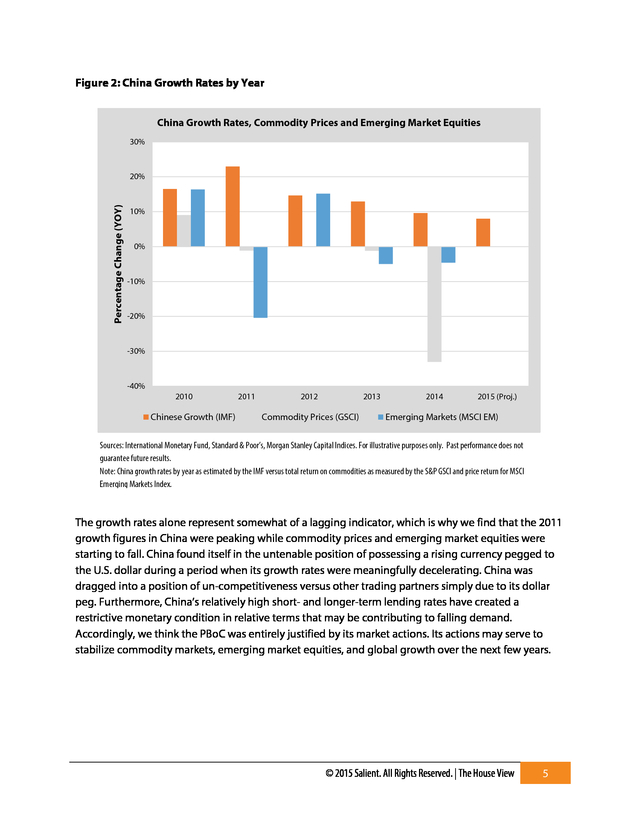
The chart on the following page highlights the degree to which China’s growth has been falling since 2011 alongside the move down in commodity prices and emerging market securities. © 2015 Salient. All Rights Reserved. | The House View 4 .
Figure 2: China Growth Rates by Year China Growth Rates, Commodity Prices and Emerging Market Equities 30% Percentage Change (YOY) 20% 10% 0% -10% -20% -30% -40% 2010 Chinese Growth (IMF) 2011 2012 2013 Commodity Prices (GSCI) 2014 2015 (Proj.) Emerging Markets (MSCI EM) Sources: International Monetary Fund, Standard & Poor’s, Morgan Stanley Capital Indices. For illustrative purposes only. Past performance does not guarantee future results. Note: China growth rates by year as estimated by the IMF versus total return on commodities as measured by the S&P GSCI and price return for MSCI Emerging Markets Index. The growth rates alone represent somewhat of a lagging indicator, which is why we find that the 2011 growth figures in China were peaking while commodity prices and emerging market equities were starting to fall. China found itself in the untenable position of possessing a rising currency pegged to the U.S.
dollar during a period when its growth rates were meaningfully decelerating. China was dragged into a position of un-competitiveness versus other trading partners simply due to its dollar peg. Furthermore, China’s relatively high short- and longer-term lending rates have created a restrictive monetary condition in relative terms that may be contributing to falling demand. Accordingly, we think the PBoC was entirely justified by its market actions.
Its actions may serve to stabilize commodity markets, emerging market equities, and global growth over the next few years. © 2015 Salient. All Rights Reserved. | The House View 5 .
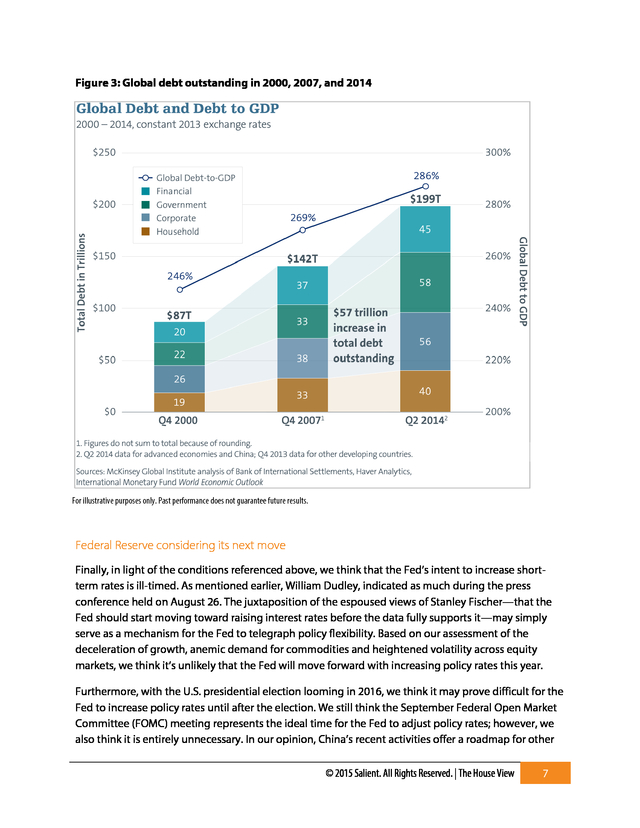
Credit growth expanding globally While China’s growth has decelerated since 2011, the volume of its credit outstanding in both absolute and GDP-relative terms has been growing significantly. In particular, China’s debt load increased by over 80% of the country’s GDP from 2007 through 2014 while its GDP grew from $3.5 trillion to $10.4 trillion from 2007 to 2014. Similarly, the levels of debt in many peripheral European and Asian countries have increased significantly during this period. In aggregate, the total level of debt increased from 269% of GDP in 2007 to 286% of GDP in 2014. 2 In U.S.
dollar terms, the level of global debt increased by $57 trillion during that period. As debt levels rise faster than output, we are concerned that consumption has been fueled by increased borrowings as opposed to more natural economic growth. This arrangement is certainly viable in the short run and can persist over longer periods of time particularly if there are only a few principal offenders. We have three specific concerns associated with this proliferation of debt: 1.
The magnitude of debt coupled with structural fiscal deficits makes it very unlikely that a significant number of countries will achieve a primary surplus over any foreseeable horizon let alone a total budget surplus when interest burden is considered. 2. We think that one of the key explanatory variables associated with consumption trends is consumer borrowings. 3. Lastly, we recognize that this proliferation of credit is occurring during a unique period of history when the global economy is characterized by a fiat currency system underpinned by floating exchange rates. We believe that the combination of these three phenomena likely frames the argument for lower global growth moving forward, while simultaneously broadening the potential range of policy and macroeconomic consequences considerably. As illustrated in the following graph, the sources of debt increases between 2007 and 2014 were broadly distributed.
While the government sector represents the greatest portion of debt increases, we think it’s important to note that the total amount of debt held by households, corporations, and financial intermediaries similarly increased during this time period. 2 Source: McKinsey Global Institute, February 2015. © 2015 Salient. All Rights Reserved. | The House View 6 .
Figure 3: Global debt outstanding in 2000, 2007, and 2014 Figures have been rounded for illustrative purposes only. Past performance does not guarantee future results. For illustrative purposes only. Past performance does not guarantee future results. Federal Reserve considering its next move Finally, in light of the conditions referenced above, we think that the Fed’s intent to increase shortterm rates is ill-timed. As mentioned earlier, William Dudley, indicated as much during the press conference held on August 26.
The juxtaposition of the espoused views of Stanley Fischer—that the Fed should start moving toward raising interest rates before the data fully supports it—may simply serve as a mechanism for the Fed to telegraph policy flexibility. Based on our assessment of the deceleration of growth, anemic demand for commodities and heightened volatility across equity markets, we think it’s unlikely that the Fed will move forward with increasing policy rates this year. Furthermore, with the U.S. presidential election looming in 2016, we think it may prove difficult for the Fed to increase policy rates until after the election.
We still think the September Federal Open Market Committee (FOMC) meeting represents the ideal time for the Fed to adjust policy rates; however, we also think it is entirely unnecessary. In our opinion, China’s recent activities offer a roadmap for other © 2015 Salient. All Rights Reserved.
| The House View 7 . tools the Fed has at its disposal. Adjusting bank reserve requirements is certainly an impactful move that could free up capital, and injecting more liquidity into the system via reverse repurchase operations could bring short and intermediate-term policy rates down further, possibly resulting in negative nominal rates as observed in several European countries. Additionally, the Fed could easily revert back to quantitative easing measures if market conditions warrant. We think the Fed would lose credibility if it increases interest rates then capitulate to diminished growth trends or heightened market volatility. Conclusion To reiterate our three key takeaways: 1.
We agree with the recent monetary initiatives engaged by the PBoC. 2. Stricter regulation of financial institutions in any form may decelerate the creation of credit, which appears to have fueled consumption and at least some growth in the global economy. The PBoC’s downward adjustment to bank reserve requirements seems appropriate considering the reduction in demand. 3.
We think it’s less likely that Fed members will adjust short-term interest rates in September and that they may wait until after the presidential election to do anything at all. We believe that the combination of accommodative monetary conditions and increased borrowings have fueled developed market returns since 2009. The removal of this stimulus may result in a further undesirable pullback in both equity and commodity prices. Accordingly, we think policymakers will err on the side of restraint with the hopes that growth conditions and market sentiment stabilize. © 2015 Salient.
All Rights Reserved. | The House View 8 . DISCLOSURES Investing involves risk, including possible loss of principal. The value of any financial instruments or markets mentioned herein can fall as well as rise. Past performance does not guarantee future results. This material is distributed for informational purposes only and should not be considered as investment advice, a recommendation of any particular security, strategy or investment product, or as an offer or solicitation with respect to the purchase or sale of any investment. Statistics, prices, estimates, forward-looking statements, and other information contained herein have been obtained from sources believed to be reliable, but no guarantee is given as to their accuracy or completeness. All expressions of opinion are subject to change without notice. Diversification does not assure profit or protect against risk. One cannot invest directly in an index. Lee Partridge has earned the right to use the Chartered Financial Analyst designation.
CFA Institute marks are trademarks owned by the CFA Institute. DEFINITIONS Alerian MLP Index (AMZ) is a composite of the 50 most prominent energy MLPs that provides investors with a comprehensive benchmark for this emerging asset class. Barclays Intermediate Government/Credit Bond Index tracks the performance of intermediate term U.S. government and corporate bonds. Chicago Mercantile Exchange is the world's second-largest exchange for futures and options on futures and the largest in the U.S. Dow Jones-UBS Commodity Index (DJ-UBSCI) is a broadly diversified index that allows investors to track commodity futures through a single, simple measure. The index is composed of futures contracts on physical commodities. The Global Industry Classification Standard (GICS) is a standardized classification system for equities developed jointly by Morgan Stanley Capital International (MSCI) and Standard & Poor's.
The GICS methodology is used by the MSCI indexes, which include domestic and international stocks, as well as by a large portion of the professional investment management community. Goldman Sachs Commodity Index is a composite index of commodity sector returns representing an unleveraged, long-only investment in commodity futures that is broadly diversified across the spectrum of commodities. The returns are calculated on a fully collateralized basis with full reinvestment. MSCI Emerging Markets (EM) Index is an index created by Morgan Stanley Capital International (MSCI) that is designed to measure equity market performance in global emerging markets. S&P 500 Index is an unmanaged, capitalization weighted index comprising publicly traded common stocks issued by companies in various industries. The S&P 500 Index is widely recognized as the leading broad-based measurement of changes in conditions of the U.S. equities market. Shanghai Stock Exchange Composite Index (Shangai Composite) is a capitalization-weighted index.
The index tracks the daily price performance of all A shares and B-shares listed on the Shanghai Stock Exchange. The index was developed on December 19, 1990 with a base value of 100. Index trade volume on Q is scaled down by a factor of 1000. Tokyo Stock Price Index is an index that measures stock prices on the Tokyo Stock Exchange (TSE). © 2015 Salient.
All Rights Reserved. | The House View 9 .
US equity sectors are based on level one of the Global Industry Classification Standards (GICS). Except for gold, commodity market price changes are based on the 1st futures contract. Gold prices are referenced from the spot market.
Sovereign debt market yields reference local currency returns for 10-year benchmark bond/note. Currency prices are relative to the US Dollar. “Volatile” might be the best word to describe this past month’s market condition. On the heels of Greece’s brinkmanship with the European Union, China revealed its willingness to change its monetary course to defend against waning growth rates, which created pandemonium across currency and equity markets.
The following graph and table highlight the volatility of Chinese equities and the central bank response. © 2015 Salient. All Rights Reserved. | The House View 1 .
Shanghai Composite Index Prices 5500 China's GDP falls to 7% (Bloomberg) Shanghai Composite peaks at 5166.35 The PBoC 's dropped its reference rate by 1.9% leading to the biggest one day drop in Yuan prices since 1994 (Bloomberg). Shanghai Composite Index Levels 5000 4500 Premier Li Keqiang addresses the National People’s Congress and lowers China’s growth target to 7% The PBoC's The PBOC cuts interest rates by onequarter percent and reduces bank reserve requirements by one half percent. The reserve rate cut effectively adds 678 billion Yuan (about $105.7 billion) to the Chinese economy (WSJ). 4000 3500 3000 Shanghai Composite Index falls 32% to 3507.19 in less than on emonth. 2500 2000 Jan 2015 Feb 2015 Mar 2015 The People’s Bank of China injected a net 150 billion Yuan ($23 billion) in openmarket operations, according to data compiled by Bloomberg. The authorities are providing a further 170 billion Yuan through loans and an auction of deposits (Bloomberg). Apr 2015 May 2015 Jun 2015 Jul 2015 Aug 2015 Sep 2015 Oct 2015 Sources: Bloomberg and Wall Street Journal. August 30, 2015. For illustrative purposes only.
Past performance does not guarantee future results. Key China-related events (in 2015) 1 03/04/15 Premier Li Keqiang addresses the National People’s Congress and lowers China’s growth target to 7%. Source: Wall Street Journal. 06/12/15 Shanghai Stock Exchange Composite Index peaks at 5166.35. Source: Bloomberg. 07/08/15 Shanghai Composite falls 32% to 3507.19 in less than one month. Source: Bloomberg. 07/15/15 China’s gross domestic product (GDP) falls to 7%.
Source: Bloomberg. 08/10/15 The People’s Bank of China (PBoC) drops its reference rate by 1.9%, leading to the biggest one day drop in Yuan prices since 1994. Source: Bloomberg. 08/19/15 The PBoC injects a net 150 billion yuan ($23 billion) in open market operations, according to data compiled by Bloomberg. The authorities are providing a further 170 billion yuan through loans and an auction of deposits.
Source: Bloomberg. 08/25/15 The PBoC cuts interest rates by 0.25% and reduces bank reserve requirements by 0.50%. The reserve rate cut effectively adds 678 billion yuan (about $105.7 billion) to the Chinese economy. Source: Wall Street Journal. 1 Sources: Bloomberg and Wall Street Journal.
Parenthetical notations indicate reference source for each event. © 2015 Salient. All Rights Reserved. | The House View 2 .
Our Takeaways Our takeaways for the month are as follows: 1. We believe that the People’s Bank of China (PBoC) was entirely justified in its August actions. The peg to the U.S. dollar since 2013 has represented a difficult arrangement for China during a period when the dollar has been strengthening vis-à-vis other major currencies while China’s economic growth has been faltering.
Since 2009, China has contributed 65% more to the growth of the global economy than the United States. We believe, at least to some extent, that what’s good for China is good for America and the world (evidence to follow). 2. We live in a world of credit fueled consumption.
While the risks of morale hazard run high, a move toward more hawkish monetary policy and/or any new regulatory initiatives relating to banks, could further dampen growth. Furthermore, it’s important to note that both the absolute level of global debt and global debt to GDP have increased since the financial crisis of 2008, which may explain at least some of the global economy’s growth to date. 3. In our view, it has become less likely that the Federal Reserve (Fed) will increase short-term interest rates this year, which means the Fed may remain on the sidelines through next year’s presidential election cycle.
Based on recent market volatility and dissipating growth, the Fed’s intent to normalize short-term interest rates seems ill-timed. William Dudley, president of the Federal Reserve Bank of New York stated at a press conference on August 26 that the case for raising interest rates is “less compelling” (Dudley Comments). Stanley Fischer, vice chairman of the Fed, offered an alternative view at the annual economic policy symposium in Jackson Hole, Wyoming, by suggesting that the Fed should not wait to raise short-term interest rates citing the transitory nature of certain disinflationary forces (Fischer-Jackson Hole).
At the very least, we think the Fed is grasping for policy flexibility as these two key leaders offer conflicting views while Fed Chair Janet Yellen remains on the sidelines. Faltering growth in China leads to monetary capitulation According to the International Monetary Fund’s (IMF) 2015 projections, since 2009 the global economy grew at a 3.77% annualized pace from $59.7 trillion to $74.5 trillion. The largest contributors to growth during this period were China (41% of total increase) and the United States (25% of total increase). We highlight these statistics to offer investors some perspective on the relative importance of China as a growth engine for the global economy.
Without China, the world would have only grown by an annualized rate of 2.50% during this period (from $54.5 trillion to $63.3 trillion). © 2015 Salient. All Rights Reserved. | The House View 3 .
Figure 1: Contribution to Global GDP Growth Everyone Else (180 Countries), 16% Contribution to Global GDP Growth from 2009 to 2015 (IMF Estimates) Indonesia, 2% Mexico, 2% Korea, 4% China, 41% United Kingdom, 4% India, 6% United States, 25% Source: International Monetary Fund. For illustrative purposes only. Past performance does not guarantee future results. Note: 2015 figures are based on IMF estimates. Syria and Sudan are excluded due to data availability.
Egypt and Pakistan were set to 2014 values. All other estimates are based on IMF projections. The key takeaway is that China appears to be an important marginal consumer of industrial goods. This consumption generally results in rising commodity prices during periods of accelerating growth and falling prices during periods of decelerating growth. At the same time, commodity producing countries are often affected by these large swings in demand as commodity prices shift in sympathy with China’s growth rates.
The chart on the following page highlights the degree to which China’s growth has been falling since 2011 alongside the move down in commodity prices and emerging market securities. © 2015 Salient. All Rights Reserved. | The House View 4 .
Figure 2: China Growth Rates by Year China Growth Rates, Commodity Prices and Emerging Market Equities 30% Percentage Change (YOY) 20% 10% 0% -10% -20% -30% -40% 2010 Chinese Growth (IMF) 2011 2012 2013 Commodity Prices (GSCI) 2014 2015 (Proj.) Emerging Markets (MSCI EM) Sources: International Monetary Fund, Standard & Poor’s, Morgan Stanley Capital Indices. For illustrative purposes only. Past performance does not guarantee future results. Note: China growth rates by year as estimated by the IMF versus total return on commodities as measured by the S&P GSCI and price return for MSCI Emerging Markets Index. The growth rates alone represent somewhat of a lagging indicator, which is why we find that the 2011 growth figures in China were peaking while commodity prices and emerging market equities were starting to fall. China found itself in the untenable position of possessing a rising currency pegged to the U.S.
dollar during a period when its growth rates were meaningfully decelerating. China was dragged into a position of un-competitiveness versus other trading partners simply due to its dollar peg. Furthermore, China’s relatively high short- and longer-term lending rates have created a restrictive monetary condition in relative terms that may be contributing to falling demand. Accordingly, we think the PBoC was entirely justified by its market actions.
Its actions may serve to stabilize commodity markets, emerging market equities, and global growth over the next few years. © 2015 Salient. All Rights Reserved. | The House View 5 .
Credit growth expanding globally While China’s growth has decelerated since 2011, the volume of its credit outstanding in both absolute and GDP-relative terms has been growing significantly. In particular, China’s debt load increased by over 80% of the country’s GDP from 2007 through 2014 while its GDP grew from $3.5 trillion to $10.4 trillion from 2007 to 2014. Similarly, the levels of debt in many peripheral European and Asian countries have increased significantly during this period. In aggregate, the total level of debt increased from 269% of GDP in 2007 to 286% of GDP in 2014. 2 In U.S.
dollar terms, the level of global debt increased by $57 trillion during that period. As debt levels rise faster than output, we are concerned that consumption has been fueled by increased borrowings as opposed to more natural economic growth. This arrangement is certainly viable in the short run and can persist over longer periods of time particularly if there are only a few principal offenders. We have three specific concerns associated with this proliferation of debt: 1.
The magnitude of debt coupled with structural fiscal deficits makes it very unlikely that a significant number of countries will achieve a primary surplus over any foreseeable horizon let alone a total budget surplus when interest burden is considered. 2. We think that one of the key explanatory variables associated with consumption trends is consumer borrowings. 3. Lastly, we recognize that this proliferation of credit is occurring during a unique period of history when the global economy is characterized by a fiat currency system underpinned by floating exchange rates. We believe that the combination of these three phenomena likely frames the argument for lower global growth moving forward, while simultaneously broadening the potential range of policy and macroeconomic consequences considerably. As illustrated in the following graph, the sources of debt increases between 2007 and 2014 were broadly distributed.
While the government sector represents the greatest portion of debt increases, we think it’s important to note that the total amount of debt held by households, corporations, and financial intermediaries similarly increased during this time period. 2 Source: McKinsey Global Institute, February 2015. © 2015 Salient. All Rights Reserved. | The House View 6 .
Figure 3: Global debt outstanding in 2000, 2007, and 2014 Figures have been rounded for illustrative purposes only. Past performance does not guarantee future results. For illustrative purposes only. Past performance does not guarantee future results. Federal Reserve considering its next move Finally, in light of the conditions referenced above, we think that the Fed’s intent to increase shortterm rates is ill-timed. As mentioned earlier, William Dudley, indicated as much during the press conference held on August 26.
The juxtaposition of the espoused views of Stanley Fischer—that the Fed should start moving toward raising interest rates before the data fully supports it—may simply serve as a mechanism for the Fed to telegraph policy flexibility. Based on our assessment of the deceleration of growth, anemic demand for commodities and heightened volatility across equity markets, we think it’s unlikely that the Fed will move forward with increasing policy rates this year. Furthermore, with the U.S. presidential election looming in 2016, we think it may prove difficult for the Fed to increase policy rates until after the election.
We still think the September Federal Open Market Committee (FOMC) meeting represents the ideal time for the Fed to adjust policy rates; however, we also think it is entirely unnecessary. In our opinion, China’s recent activities offer a roadmap for other © 2015 Salient. All Rights Reserved.
| The House View 7 . tools the Fed has at its disposal. Adjusting bank reserve requirements is certainly an impactful move that could free up capital, and injecting more liquidity into the system via reverse repurchase operations could bring short and intermediate-term policy rates down further, possibly resulting in negative nominal rates as observed in several European countries. Additionally, the Fed could easily revert back to quantitative easing measures if market conditions warrant. We think the Fed would lose credibility if it increases interest rates then capitulate to diminished growth trends or heightened market volatility. Conclusion To reiterate our three key takeaways: 1.
We agree with the recent monetary initiatives engaged by the PBoC. 2. Stricter regulation of financial institutions in any form may decelerate the creation of credit, which appears to have fueled consumption and at least some growth in the global economy. The PBoC’s downward adjustment to bank reserve requirements seems appropriate considering the reduction in demand. 3.
We think it’s less likely that Fed members will adjust short-term interest rates in September and that they may wait until after the presidential election to do anything at all. We believe that the combination of accommodative monetary conditions and increased borrowings have fueled developed market returns since 2009. The removal of this stimulus may result in a further undesirable pullback in both equity and commodity prices. Accordingly, we think policymakers will err on the side of restraint with the hopes that growth conditions and market sentiment stabilize. © 2015 Salient.
All Rights Reserved. | The House View 8 . DISCLOSURES Investing involves risk, including possible loss of principal. The value of any financial instruments or markets mentioned herein can fall as well as rise. Past performance does not guarantee future results. This material is distributed for informational purposes only and should not be considered as investment advice, a recommendation of any particular security, strategy or investment product, or as an offer or solicitation with respect to the purchase or sale of any investment. Statistics, prices, estimates, forward-looking statements, and other information contained herein have been obtained from sources believed to be reliable, but no guarantee is given as to their accuracy or completeness. All expressions of opinion are subject to change without notice. Diversification does not assure profit or protect against risk. One cannot invest directly in an index. Lee Partridge has earned the right to use the Chartered Financial Analyst designation.
CFA Institute marks are trademarks owned by the CFA Institute. DEFINITIONS Alerian MLP Index (AMZ) is a composite of the 50 most prominent energy MLPs that provides investors with a comprehensive benchmark for this emerging asset class. Barclays Intermediate Government/Credit Bond Index tracks the performance of intermediate term U.S. government and corporate bonds. Chicago Mercantile Exchange is the world's second-largest exchange for futures and options on futures and the largest in the U.S. Dow Jones-UBS Commodity Index (DJ-UBSCI) is a broadly diversified index that allows investors to track commodity futures through a single, simple measure. The index is composed of futures contracts on physical commodities. The Global Industry Classification Standard (GICS) is a standardized classification system for equities developed jointly by Morgan Stanley Capital International (MSCI) and Standard & Poor's.
The GICS methodology is used by the MSCI indexes, which include domestic and international stocks, as well as by a large portion of the professional investment management community. Goldman Sachs Commodity Index is a composite index of commodity sector returns representing an unleveraged, long-only investment in commodity futures that is broadly diversified across the spectrum of commodities. The returns are calculated on a fully collateralized basis with full reinvestment. MSCI Emerging Markets (EM) Index is an index created by Morgan Stanley Capital International (MSCI) that is designed to measure equity market performance in global emerging markets. S&P 500 Index is an unmanaged, capitalization weighted index comprising publicly traded common stocks issued by companies in various industries. The S&P 500 Index is widely recognized as the leading broad-based measurement of changes in conditions of the U.S. equities market. Shanghai Stock Exchange Composite Index (Shangai Composite) is a capitalization-weighted index.
The index tracks the daily price performance of all A shares and B-shares listed on the Shanghai Stock Exchange. The index was developed on December 19, 1990 with a base value of 100. Index trade volume on Q is scaled down by a factor of 1000. Tokyo Stock Price Index is an index that measures stock prices on the Tokyo Stock Exchange (TSE). © 2015 Salient.
All Rights Reserved. | The House View 9 .


