The House View - Risk still exists in the capital markets - August 7. 2015
Salient Partners


Description
The House View
by Lee Partridge,
Chief Investment Officer
August 7, 2015
In our view, the month of July served as somewhat of a warning sign to investors that risk still exists in
the capital markets. We point to several factors that should encourage investors to consider the
absolute level of risk embedded in their portfolios juxtaposed to the level of diversification within
those portfolios. The month of July reminded us of several of the central themes we’ve been
discussing for the past two years, which are summarized as follows:
•
•
•
The Federal Reserve’s (Fed) inclination to increase short-term interest rates is out of sync with
dissipating output growth patterns in the U.S. and abroad.
China’s economy is slowing dramatically, as witnessed not only by the government’s official
growth statistics but also by declining commodity prices in both energy and industrial metal
prices.
Volatility is increasing.
The withdrawal of monetary stimulus by the Federal Reserve is equivalent to the removal of a backstop—the “Yellen/Bernanke/Yellen put”—that’s leaving investors out on the ledge. The Fed wants to move in September We’ve discussed the Federal Reserve’s conundrum on numerous occasions. Fed members are confronted with the prospect of a questionable employment picture butted up against a presidential election cycle that begins in earnest in the fall of 2015. We think the Fed has one shot at initiating the process of increasing short-term interest rates in the month of September.
A later move may be criticized as being politically motivated and may also interfere with the late-stage growth phase of the domestic economy. The Fed has a difficult job to be sure. It manages a multi-trillion dollar balance sheet that reflects a six to nine month delayed reaction to every policy initiative undertaken. Fed members have relegated themselves to managing the perception of liquidity through a combination of repurchase agreements and open market purchases of fixed income securities.
It is important to note that the Fed also controls reserve requirements for banks and other market participants with which it has not tinkered. Last November, the Fed declared the cessation of open market purchases of U.S. Treasury and mortgage-backed securities. At virtually the same time, the European Central Bank declared a quantitative easing initiative, which included the purchases of over €1 trillion of sovereign debt, covered bonds and other eligible securities.
On the one hand, the handing over of the baton from the Federal Reserve to the rest of the central banking community makes intuitive sense; however, from a market standpoint, it’s important to note that the S&P 500 Index more than tripled from March 2009 through the end of July while the DAX Index and Nikkei 225 Index posted returns of 177% and 183%, © 2015 Salient. All Rights Reserved. | The House View 1 .
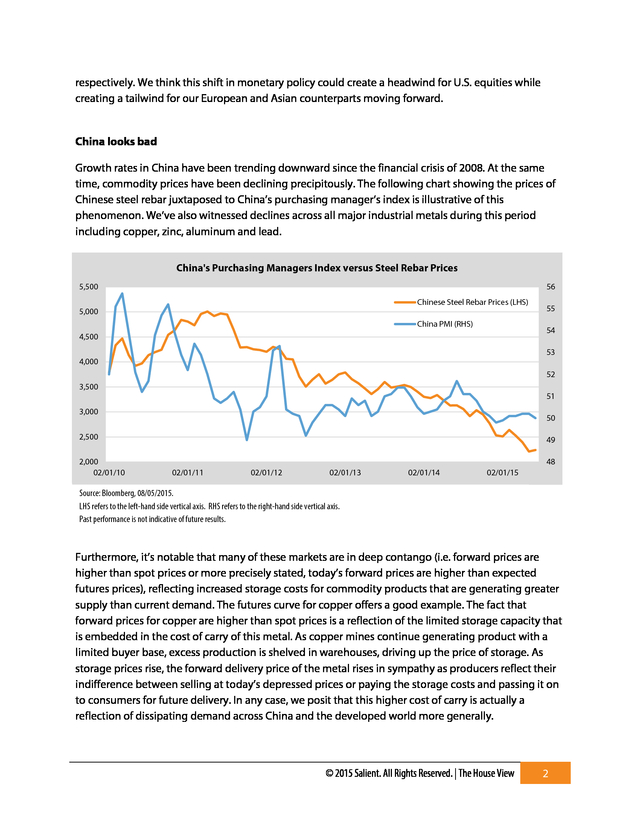
respectively. We think this shift in monetary policy could create a headwind for U.S. equities while creating a tailwind for our European and Asian counterparts moving forward. China looks bad Growth rates in China have been trending downward since the financial crisis of 2008. At the same time, commodity prices have been declining precipitously.
The following chart showing the prices of Chinese steel rebar juxtaposed to China’s purchasing manager’s index is illustrative of this phenomenon. We’ve also witnessed declines across all major industrial metals during this period including copper, zinc, aluminum and lead. China's Purchasing Managers Index versus Steel Rebar Prices 5,500 56 Chinese Steel Rebar Prices (LHS) 5,000 China PMI (RHS) 55 54 4,500 53 4,000 52 3,500 51 3,000 50 2,500 2,000 02/01/10 49 48 02/01/11 02/01/12 02/01/13 02/01/14 02/01/15 Source: Bloomberg, 08/05/2015. LHS refers to the left-hand side vertical axis. RHS refers to the right-hand side vertical axis. Past performance is not indicative of future results. Furthermore, it’s notable that many of these markets are in deep contango (i.e.
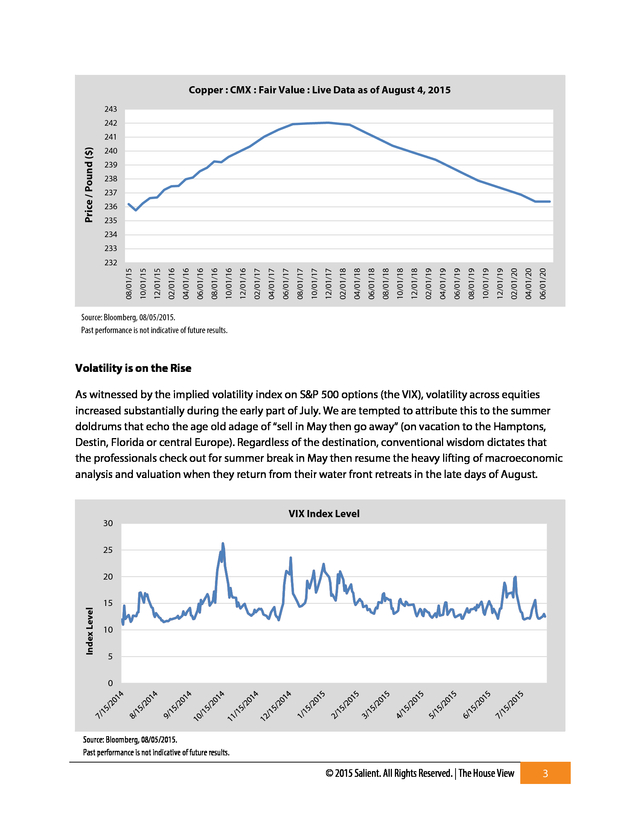
forward prices are higher than spot prices or more precisely stated, today’s forward prices are higher than expected futures prices), reflecting increased storage costs for commodity products that are generating greater supply than current demand. The futures curve for copper offers a good example. The fact that forward prices for copper are higher than spot prices is a reflection of the limited storage capacity that is embedded in the cost of carry of this metal.
As copper mines continue generating product with a limited buyer base, excess production is shelved in warehouses, driving up the price of storage. As storage prices rise, the forward delivery price of the metal rises in sympathy as producers reflect their indifference between selling at today’s depressed prices or paying the storage costs and passing it on to consumers for future delivery. In any case, we posit that this higher cost of carry is actually a reflection of dissipating demand across China and the developed world more generally. © 2015 Salient.
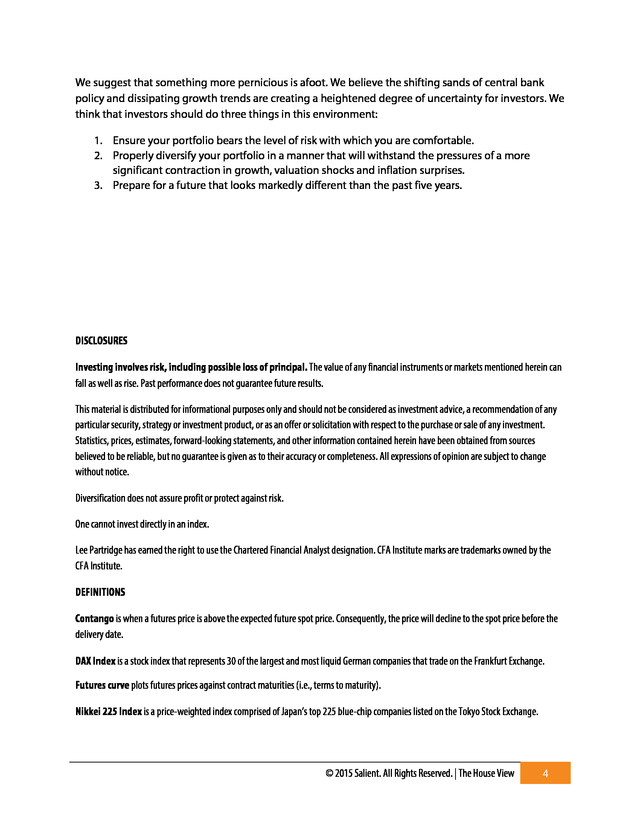
All Rights Reserved. | The House View 2 . Copper : CMX : Fair Value : Live Data as of August 4, 2015 243 242 Price / Pound ($) 241 240 239 238 237 236 235 234 233 06/01/20 04/01/20 02/01/20 12/01/19 10/01/19 08/01/19 06/01/19 04/01/19 02/01/19 12/01/18 10/01/18 08/01/18 06/01/18 04/01/18 02/01/18 12/01/17 10/01/17 08/01/17 06/01/17 04/01/17 02/01/17 12/01/16 10/01/16 08/01/16 06/01/16 04/01/16 02/01/16 12/01/15 10/01/15 08/01/15 232 Source: Bloomberg, 08/05/2015. Past performance is not indicative of future results. Volatility is on the Rise As witnessed by the implied volatility index on S&P 500 options (the VIX), volatility across equities increased substantially during the early part of July. We are tempted to attribute this to the summer doldrums that echo the age old adage of “sell in May then go away” (on vacation to the Hamptons, Destin, Florida or central Europe). Regardless of the destination, conventional wisdom dictates that the professionals check out for summer break in May then resume the heavy lifting of macroeconomic analysis and valuation when they return from their water front retreats in the late days of August. 30 VIX Index Level 25 Index Level 20 15 10 5 0 Source: Bloomberg, 08/05/2015. Past performance is not indicative of future results. © 2015 Salient. All Rights Reserved.
| The House View 3 . We suggest that something more pernicious is afoot. We believe the shifting sands of central bank policy and dissipating growth trends are creating a heightened degree of uncertainty for investors. We think that investors should do three things in this environment: 1. Ensure your portfolio bears the level of risk with which you are comfortable. 2.
Properly diversify your portfolio in a manner that will withstand the pressures of a more significant contraction in growth, valuation shocks and inflation surprises. 3. Prepare for a future that looks markedly different than the past five years. DISCLOSURES Investing involves risk, including possible loss of principal. The value of any financial instruments or markets mentioned herein can fall as well as rise.
Past performance does not guarantee future results. This material is distributed for informational purposes only and should not be considered as investment advice, a recommendation of any particular security, strategy or investment product, or as an offer or solicitation with respect to the purchase or sale of any investment. Statistics, prices, estimates, forward-looking statements, and other information contained herein have been obtained from sources believed to be reliable, but no guarantee is given as to their accuracy or completeness. All expressions of opinion are subject to change without notice. Diversification does not assure profit or protect against risk. One cannot invest directly in an index. Lee Partridge has earned the right to use the Chartered Financial Analyst designation. CFA Institute marks are trademarks owned by the CFA Institute. DEFINITIONS Contango is when a futures price is above the expected future spot price.
Consequently, the price will decline to the spot price before the delivery date. DAX Index is a stock index that represents 30 of the largest and most liquid German companies that trade on the Frankfurt Exchange. Futures curve plots futures prices against contract maturities (i.e., terms to maturity). Nikkei 225 Index is a price-weighted index comprised of Japan’s top 225 blue-chip companies listed on the Tokyo Stock Exchange. © 2015 Salient. All Rights Reserved. | The House View 4 .
The withdrawal of monetary stimulus by the Federal Reserve is equivalent to the removal of a backstop—the “Yellen/Bernanke/Yellen put”—that’s leaving investors out on the ledge. The Fed wants to move in September We’ve discussed the Federal Reserve’s conundrum on numerous occasions. Fed members are confronted with the prospect of a questionable employment picture butted up against a presidential election cycle that begins in earnest in the fall of 2015. We think the Fed has one shot at initiating the process of increasing short-term interest rates in the month of September.
A later move may be criticized as being politically motivated and may also interfere with the late-stage growth phase of the domestic economy. The Fed has a difficult job to be sure. It manages a multi-trillion dollar balance sheet that reflects a six to nine month delayed reaction to every policy initiative undertaken. Fed members have relegated themselves to managing the perception of liquidity through a combination of repurchase agreements and open market purchases of fixed income securities.
It is important to note that the Fed also controls reserve requirements for banks and other market participants with which it has not tinkered. Last November, the Fed declared the cessation of open market purchases of U.S. Treasury and mortgage-backed securities. At virtually the same time, the European Central Bank declared a quantitative easing initiative, which included the purchases of over €1 trillion of sovereign debt, covered bonds and other eligible securities.
On the one hand, the handing over of the baton from the Federal Reserve to the rest of the central banking community makes intuitive sense; however, from a market standpoint, it’s important to note that the S&P 500 Index more than tripled from March 2009 through the end of July while the DAX Index and Nikkei 225 Index posted returns of 177% and 183%, © 2015 Salient. All Rights Reserved. | The House View 1 .
respectively. We think this shift in monetary policy could create a headwind for U.S. equities while creating a tailwind for our European and Asian counterparts moving forward. China looks bad Growth rates in China have been trending downward since the financial crisis of 2008. At the same time, commodity prices have been declining precipitously.
The following chart showing the prices of Chinese steel rebar juxtaposed to China’s purchasing manager’s index is illustrative of this phenomenon. We’ve also witnessed declines across all major industrial metals during this period including copper, zinc, aluminum and lead. China's Purchasing Managers Index versus Steel Rebar Prices 5,500 56 Chinese Steel Rebar Prices (LHS) 5,000 China PMI (RHS) 55 54 4,500 53 4,000 52 3,500 51 3,000 50 2,500 2,000 02/01/10 49 48 02/01/11 02/01/12 02/01/13 02/01/14 02/01/15 Source: Bloomberg, 08/05/2015. LHS refers to the left-hand side vertical axis. RHS refers to the right-hand side vertical axis. Past performance is not indicative of future results. Furthermore, it’s notable that many of these markets are in deep contango (i.e.
forward prices are higher than spot prices or more precisely stated, today’s forward prices are higher than expected futures prices), reflecting increased storage costs for commodity products that are generating greater supply than current demand. The futures curve for copper offers a good example. The fact that forward prices for copper are higher than spot prices is a reflection of the limited storage capacity that is embedded in the cost of carry of this metal.
As copper mines continue generating product with a limited buyer base, excess production is shelved in warehouses, driving up the price of storage. As storage prices rise, the forward delivery price of the metal rises in sympathy as producers reflect their indifference between selling at today’s depressed prices or paying the storage costs and passing it on to consumers for future delivery. In any case, we posit that this higher cost of carry is actually a reflection of dissipating demand across China and the developed world more generally. © 2015 Salient.
All Rights Reserved. | The House View 2 . Copper : CMX : Fair Value : Live Data as of August 4, 2015 243 242 Price / Pound ($) 241 240 239 238 237 236 235 234 233 06/01/20 04/01/20 02/01/20 12/01/19 10/01/19 08/01/19 06/01/19 04/01/19 02/01/19 12/01/18 10/01/18 08/01/18 06/01/18 04/01/18 02/01/18 12/01/17 10/01/17 08/01/17 06/01/17 04/01/17 02/01/17 12/01/16 10/01/16 08/01/16 06/01/16 04/01/16 02/01/16 12/01/15 10/01/15 08/01/15 232 Source: Bloomberg, 08/05/2015. Past performance is not indicative of future results. Volatility is on the Rise As witnessed by the implied volatility index on S&P 500 options (the VIX), volatility across equities increased substantially during the early part of July. We are tempted to attribute this to the summer doldrums that echo the age old adage of “sell in May then go away” (on vacation to the Hamptons, Destin, Florida or central Europe). Regardless of the destination, conventional wisdom dictates that the professionals check out for summer break in May then resume the heavy lifting of macroeconomic analysis and valuation when they return from their water front retreats in the late days of August. 30 VIX Index Level 25 Index Level 20 15 10 5 0 Source: Bloomberg, 08/05/2015. Past performance is not indicative of future results. © 2015 Salient. All Rights Reserved.
| The House View 3 . We suggest that something more pernicious is afoot. We believe the shifting sands of central bank policy and dissipating growth trends are creating a heightened degree of uncertainty for investors. We think that investors should do three things in this environment: 1. Ensure your portfolio bears the level of risk with which you are comfortable. 2.
Properly diversify your portfolio in a manner that will withstand the pressures of a more significant contraction in growth, valuation shocks and inflation surprises. 3. Prepare for a future that looks markedly different than the past five years. DISCLOSURES Investing involves risk, including possible loss of principal. The value of any financial instruments or markets mentioned herein can fall as well as rise.
Past performance does not guarantee future results. This material is distributed for informational purposes only and should not be considered as investment advice, a recommendation of any particular security, strategy or investment product, or as an offer or solicitation with respect to the purchase or sale of any investment. Statistics, prices, estimates, forward-looking statements, and other information contained herein have been obtained from sources believed to be reliable, but no guarantee is given as to their accuracy or completeness. All expressions of opinion are subject to change without notice. Diversification does not assure profit or protect against risk. One cannot invest directly in an index. Lee Partridge has earned the right to use the Chartered Financial Analyst designation. CFA Institute marks are trademarks owned by the CFA Institute. DEFINITIONS Contango is when a futures price is above the expected future spot price.
Consequently, the price will decline to the spot price before the delivery date. DAX Index is a stock index that represents 30 of the largest and most liquid German companies that trade on the Frankfurt Exchange. Futures curve plots futures prices against contract maturities (i.e., terms to maturity). Nikkei 225 Index is a price-weighted index comprised of Japan’s top 225 blue-chip companies listed on the Tokyo Stock Exchange. © 2015 Salient. All Rights Reserved. | The House View 4 .


