


Description
The House View
by Lee Partridge,
Chief Investment Officer
December 1, 2015
“The Building Blocks of Diversification”
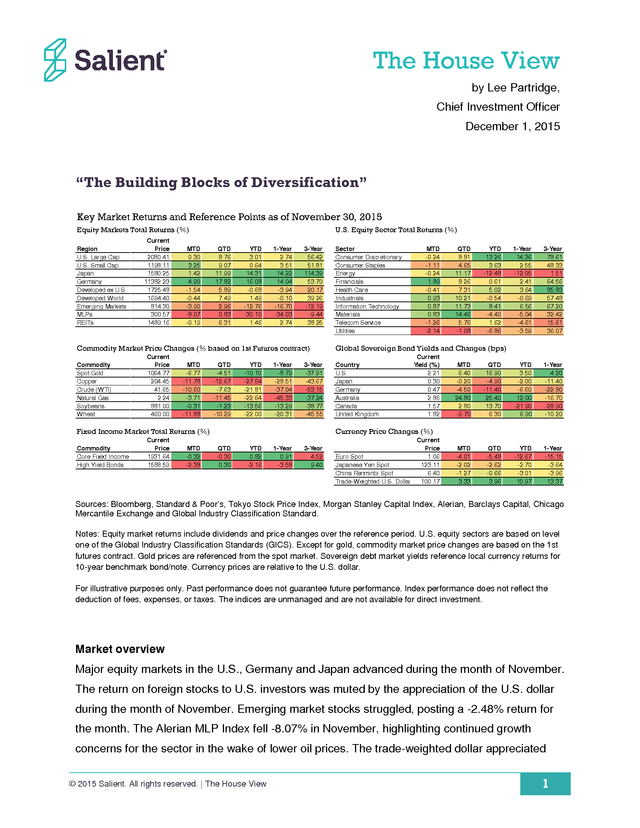
Key Market Returns and Reference Points as of November 30, 2015
Equity Markets Total Returns (%)
Region
U.S. Large Cap
U.S. Small Cap
Japan
Germany
Developed ex U.S.
Developed World
Emerging Markets
MLPs
REITs
Current
Price
2080.41
1198.11
1580.25
11382.23
1725.48
1694.40
814.30
300.57
1489.16
MTD
0.30
3.25
1.42
4.90
-1.54
-0.44
-3.90
-8.07
-0.19
U.S. Equity Sector Total Returns (%)
QTD
8.76
9.07
11.99
17.82
5.89
7.49
2.96
0.83
6.31
YTD
3.01
0.64
14.31
16.08
-0.68
1.49
-12.76
-30.10
1.46
1-Year
2.74
3.51
14.22
14.04
-3.94
-0.10
-16.70
-34.03
2.74
3-Year
56.42
51.81
114.39
53.70
20.17
39.26
-12.19
-9.44
38.25
Commodity Market Price Changes (% based on 1st Futures contract)
Commodity
Spot Gold
Copper
Crude (WTI)
Natural Gas
Soybeans
Wheat
Current
Price
1064.77
204.45
41.65
2.24
881.00
460.00
MTD
-6.77
-11.78
-10.60
-3.71
-0.31
-11.88
QTD
-4.51
-12.67
-7.63
-11.45
-1.23
-10.29
YTD
-10.10
-27.64
-21.81
-22.64
-13.56
-22.00
1-Year
-8.79
-28.51
-37.04
-45.33
-13.29
-20.31
3-Year
-37.91
-43.67
-53.15
-37.24
-38.77
-45.55
Fixed Income Market Total Returns (%)
Commodity
Core Fixed Income
High Yield Bonds
Current
Price
1931.64
1588.59
MTD
-0.32
-2.38
Sector
Consumer Discretionary
Consumer Staples
Energy
Financials
Health Care
Industrials
Information Technology
Materials
Telecom Service
Utilities
MTD
-0.24
-1.11
-0.24
1.89
-0.41
0.93
0.87
0.83
-1.26
-2.14
QTD
8.81
4.65
11.17
8.26
7.31
10.21
11.73
14.46
5.76
-1.08
YTD
13.26
3.63
-12.48
0.61
5.02
-0.54
8.41
-4.40
1.62
-6.86
1-Year
14.36
2.55
-12.05
2.41
3.64
-0.69
6.56
-5.04
-4.61
-3.59
3-Year
78.61
48.33
1.51
64.56
85.83
57.48
67.20
32.42
15.61
36.07
Global Sovereign Bond Yields and Changes (bps)
Country
U.S.
Japan
Germany
Australia
Canada
United Kingdom
Current
Yield (%)
2.21
0.30
0.47
2.86
1.57
1.82
MTD
6.40
-0.20
-4.50
24.80
2.80
-9.70
QTD
16.90
-4.90
-11.40
25.40
13.70
6.30
YTD
3.50
-2.00
-6.60
12.00
-21.90
6.90
1-Year
4.20
-11.40
-22.80
-16.70
-28.90
-10.20
MTD
-4.01
-2.02
-1.27
3.33
QTD
-5.48
-2.62
-0.66
3.96
YTD
-12.67
-2.70
-3.01
10.97
1-Year
-15.15
-3.64
-3.96
13.37
Currency Price Changes (%)
QTD
-0.30
0.30
YTD
0.82
-2.16
1-Year
0.91
-3.58
3-Year
4.52
9.40
Current
Price
Euro Spot
1.06
Japanese Yen Spot
123.11
China Renminbi Spot
6.40
Trade-Weighted U.S.
Dollar 100.17 Sources: Bloomberg, Standard & Poor’s, Tokyo Stock Price Index, Morgan Stanley Capital Index, Alerian, Barclays Capital, Chicago Mercantile Exchange and Global Industry Classification Standard. Notes: Equity market returns include dividends and price changes over the reference period. U.S. equity sectors are based on level one of the Global Industry Classification Standards (GICS).
Except for gold, commodity market price changes are based on the 1st futures contract. Gold prices are referenced from the spot market. Sovereign debt market yields reference local currency returns for 10-year benchmark bond/note.
Currency prices are relative to the U.S. dollar. For illustrative purposes only. Past performance does not guarantee future performance.
Index performance does not reflect the deduction of fees, expenses, or taxes. The indices are unmanaged and are not available for direct investment. Market overview Major equity markets in the U.S., Germany and Japan advanced during the month of November. The return on foreign stocks to U.S. investors was muted by the appreciation of the U.S.
dollar during the month of November. Emerging market stocks struggled, posting a -2.48% return for the month. The Alerian MLP Index fell -8.07% in November, highlighting continued growth concerns for the sector in the wake of lower oil prices.
The trade-weighted dollar appreciated © 2015 Salient. All rights reserved. | The House View 1 .
3.36% and U.S. interest rates, as measured by the ten-year U.S. Treasury, rose 0.07% over the course of the month. The rising dollar and rising interest rates likely reflect broad expectations for an interest rate hike by the Federal Reserve following the Federal Open Market Committee (FOMC) meeting scheduled for December 16, 2015. Thought for the month Sound investment management practices often require investors to override “gut instincts” as they respond to short-term market volatility and adhere to longer-term portfolio management disciplines that chart a course toward stated risk and return objectives.
For many of us, the allure of outperformance—whether it come from an individual stock, fund, strategy or asset class—as well as the aversion to underperformance, often motivates investors to make shortterm investment decisions as a means of achieving investment goals. We seek the manager or stock that can outperform the broader market. We actively trade our portfolios to ensure that we don’t miss out on a hot investment or to avoid further losses on one of the “dogs” in our portfolio. Sadly, many of the short-term decisions made by investors are counterproductive and symptomatic of the lack of an overarching investment strategy.
All too often investors neglect the more fundamental aspects of portfolio management, which include specifying the risk and return objectives for their portfolios, adequately diversifying their portfolios to reduce uncompensated risks, reducing investment costs and ensuring that portfolios are appropriately rebalanced to maintain intended levels of risk and diversification during periods of market turbulence. In his classic text, Winning the Loser’s Game, Charles D. Ellis highlights the challenge of developing sound investment practices and sticking to those practices during turbulent market conditions. “For most investors, the hardest part is not figuring out the optimal investment policy; it is staying committed to sound investment through bull and bear markets and maintaining what Disraeli called “constancy to purpose.” Sustaining a long-term focus at market highs or market lows is notoriously difficult. At either kind of market extreme, emotions are strongest when current market action appears most demanding of change and apparent “facts” seem most compelling. Being rational in an emotional environment is never easy.
Holding onto a sound policy through thick and thin is both extraordinarily difficult and extraordinarily important work. © 2015 Salient. All rights reserved. | The House View 2 .
This is why investors can benefit from developing and sticking with sound investment policies and practices. The cost of infidelity to your own commitments can be very high. 1” One of the key tenets of a sound investment strategy is determining the appropriate mix of asset classes and strategies that will comprise the strategic asset allocation of a portfolio. Determining the long-term composition of the portfolio during periods of relative calm may help investors accomplish two primary objectives.
The first objective is articulating and targeting long-term risk and return preferences. The second objective is ensuring that the portfolio is designed to achieve those risk and return objectives as efficiently as possible (i.e., maximizing return relative to the degree of risk taken). This month’s blog post begins a three-part series on diversification that will cover: • The importance of carefully selecting the right building blocks when designing a portfolio, • Determining appropriate weights amongst the building blocks within the portfolio, and • The importance of selecting the right rebalancing strategy to maintain targeted portfolio risk and diversification levels. We begin this series with the topic of selecting the right building blocks for the portfolio. Selecting the building blocks Determining the right mix of asset classes and strategies to be included in a portfolio can be a daunting task.
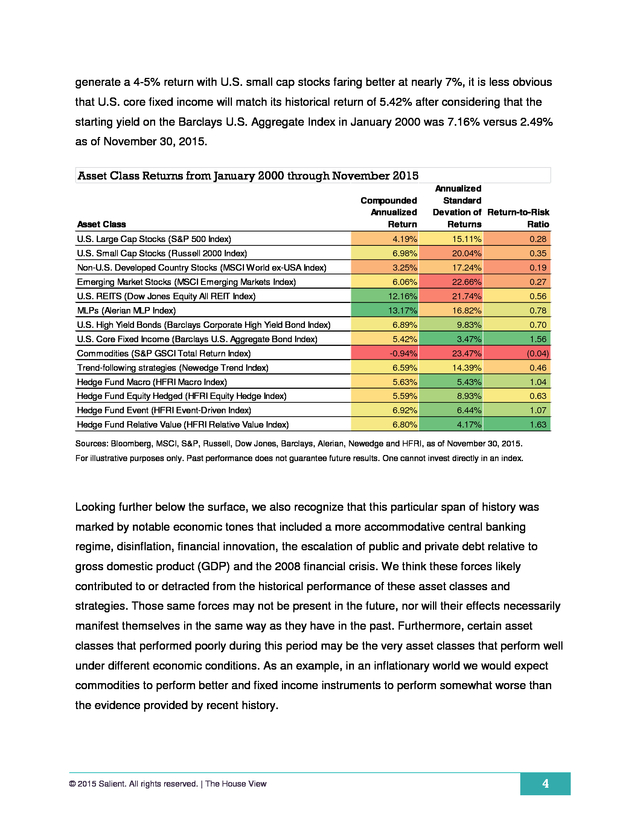
The following table summarizes the annualized risk and return for 14 asset classes or strategies from January 2000 to October 2015. In addition to the asset classes listed, there are a myriad of private investment opportunities, sub-asset classes and related asset classes that have not been included. In most cases, we believe that those asset classes could be categorized into one of the 14 asset classes already identified within this report. Many investors use historic risk and return information to frame future expectations.
In certain instances, we think this is reasonable if one assumes that market participants efficiently price risk to generate a more or less consistent rate of return over longer periods of time. In other instances, we think it is important to give more weight to the starting price of the particular asset class relative to its historic levels. While it may be reasonable to expect U.S.
large cap stocks to 1 Ellis, Charles D. (2013). Winning the Loser’s Game: Timeless Strategies for Successful Investing (6th ed.).
McGraw Hill. © 2015 Salient. All rights reserved. | The House View 3 .
generate a 4-5% return with U.S. small cap stocks faring better at nearly 7%, it is less obvious that U.S. core fixed income will match its historical return of 5.42% after considering that the starting yield on the Barclays U.S. Aggregate Index in January 2000 was 7.16% versus 2.49% as of November 30, 2015. Asset Class Returns from January 2000 through November 2015 Asset Class Compounded Annualized Return Annualized Standard Devation of Return-to-Risk Returns Ratio U.S.
Large Cap Stocks (S&P 500 Index) 4.19% 15.11% 0.28 U.S. Small Cap Stocks (Russell 2000 Index) 6.98% 20.04% 0.35 Non-U.S. Developed Country Stocks (MSCI World ex-USA Index) 3.25% 17.24% 0.19 Emerging Market Stocks (MSCI Emerging Markets Index) 6.06% 22.66% 0.27 U.S.
REITS (Dow Jones Equity All REIT Index) 12.16% 21.74% 0.56 MLPs (Alerian MLP Index) 13.17% 16.82% 0.78 U.S. High Yield Bonds (Barclays Corporate High Yield Bond Index) 6.89% 9.83% 0.70 U.S. Core Fixed Income (Barclays U.S.
Aggregate Bond Index) 5.42% 3.47% 1.56 Commodities (S&P GSCI Total Return Index) -0.94% 23.47% (0.04) Trend-following strategies (Newedge Trend Index) 6.59% 14.39% 0.46 Hedge Fund Macro (HFRI Macro Index) 5.63% 5.43% 1.04 Hedge Fund Equity Hedged (HFRI Equity Hedge Index) 5.59% 8.93% 0.63 Hedge Fund Event (HFRI Event-Driven Index) 6.92% 6.44% 1.07 Hedge Fund Relative Value (HFRI Relative Value Index) 6.80% 4.17% 1.63 Sources: Bloomberg, MSCI, S&P, Russell, Dow Jones, Barclays, Alerian, Newedge and HFRI, as of November 30, 2015. For illustrative purposes only. Past performance does not guarantee future results. One cannot invest directly in an index. Looking further below the surface, we also recognize that this particular span of history was marked by notable economic tones that included a more accommodative central banking regime, disinflation, financial innovation, the escalation of public and private debt relative to gross domestic product (GDP) and the 2008 financial crisis.
We think these forces likely contributed to or detracted from the historical performance of these asset classes and strategies. Those same forces may not be present in the future, nor will their effects necessarily manifest themselves in the same way as they have in the past. Furthermore, certain asset classes that performed poorly during this period may be the very asset classes that perform well under different economic conditions.
As an example, in an inflationary world we would expect commodities to perform better and fixed income instruments to perform somewhat worse than the evidence provided by recent history. © 2015 Salient. All rights reserved. | The House View 4 .
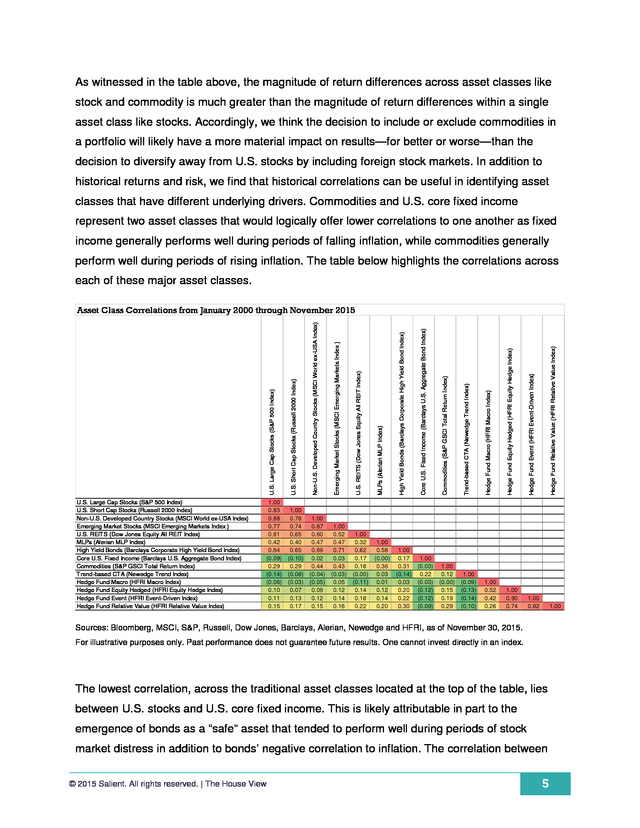
As witnessed in the table above, the magnitude of return differences across asset classes like stock and commodity is much greater than the magnitude of return differences within a single asset class like stocks. Accordingly, we think the decision to include or exclude commodities in a portfolio will likely have a more material impact on results—for better or worse—than the decision to diversify away from U.S. stocks by including foreign stock markets. In addition to historical returns and risk, we find that historical correlations can be useful in identifying asset classes that have different underlying drivers.
Commodities and U.S. core fixed income represent two asset classes that would logically offer lower correlations to one another as fixed income generally performs well during periods of falling inflation, while commodities generally perform well during periods of rising inflation. The table below highlights the correlations across each of these major asset classes. U.S.
Large Cap Stocks (S&P 500 Index) Non-U.S. Developed Country Stocks (MSCI World ex-USA Index) Emerging Market Stocks (MSCI Emerging Markets Index ) U.S. REITS (Dow Jones Equity All REIT Index) MLPs (Alerian MLP Index) High Yield Bonds (Barclays Corporate High Yield Bond Index) Core U.S.
Fixed Income (Barclays U.S. Aggregate Bond Index) Commodities (S&P GSCI Total Return Index) Trend-based CTA (Newedge Trend Index) Hedge Fund Macro (HFRI Macro Index) Hedge Fund Equity Hedged (HFRI Equity Hedge Index) Hedge Fund Event (HFRI Event-Driven Index) Hedge Fund Relative Value (HFRI Relative Value Index) U.S. Large Cap Stocks (S&P 500 Index) U.S.
Short Cap Stocks (Russell 2000 Index) Non-U.S. Developed Country Stocks (MSCI World ex-USA Index) Emerging Market Stocks (MSCI Emerging Markets Index ) U.S. REITS (Dow Jones Equity All REIT Index) MLPs (Alerian MLP Index) High Yield Bonds (Barclays Corporate High Yield Bond Index) Core U.S.
Fixed Income (Barclays U.S. Aggregate Bond Index) Commodities (S&P GSCI Total Return Index) Trend-based CTA (Newedge Trend Index) Hedge Fund Macro (HFRI Macro Index) Hedge Fund Equity Hedged (HFRI Equity Hedge Index) Hedge Fund Event (HFRI Event-Driven Index) Hedge Fund Relative Value (HFRI Relative Value Index) U.S. Short Cap Stocks (Russell 2000 Index) Asset Class Correlations from January 2000 through November 2015 1.00 0.83 0.88 0.77 0.61 0.42 0.64 (0.09) 0.29 (0.14) (0.06) 0.10 0.11 0.15 1.00 0.78 0.74 0.65 0.40 0.65 (0.10) 0.29 (0.08) (0.03) 0.07 0.13 0.17 1.00 0.87 0.60 0.47 0.69 0.02 0.44 (0.04) (0.05) 0.09 0.12 0.15 1.00 0.52 0.47 0.71 0.03 0.43 (0.03) 0.05 0.12 0.14 0.16 1.00 0.32 0.62 0.17 0.16 (0.00) (0.11) 0.14 0.16 0.22 1.00 0.58 (0.00) 0.36 0.03 0.01 0.12 0.14 0.20 1.00 0.17 0.31 (0.14) 0.03 0.20 0.22 0.30 1.00 (0.03) 0.22 (0.03) (0.12) (0.12) (0.09) 1.00 0.12 (0.00) 0.15 0.19 0.29 1.00 (0.09) (0.13) (0.14) (0.10) 1.00 0.52 0.42 0.26 1.00 0.90 0.74 1.00 0.82 1.00 Sources: Bloomberg, MSCI, S&P, Russell, Dow Jones, Barclays, Alerian, Newedge and HFRI, as of November 30, 2015. For illustrative purposes only.
Past performance does not guarantee future results. One cannot invest directly in an index. The lowest correlation, across the traditional asset classes located at the top of the table, lies between U.S. stocks and U.S.
core fixed income. This is likely attributable in part to the emergence of bonds as a “safe” asset that tended to perform well during periods of stock market distress in addition to bonds’ negative correlation to inflation. The correlation between © 2015 Salient.
All rights reserved. | The House View 5 . U.S. core fixed income and commodities is also quite low. Lastly, the correlations between master limited partnerships (MLPs) and virtually all major equity markets are also relatively low. If we expand the opportunity set to include commodity trading advisors and hedge funds we note that further diversification benefits are achievable; however, those further reaches of diversification come at additional costs. Hedge fund managers typically charge between 1.5% and 2% in management fees and share 20% of the profits generated by their strategy. One school of thought holds that it doesn’t really matter how much managers charge if the net performance is sufficiently strong.
While we are sympathetic to this argument, we recognize that hedge funds are generally confined to holding some combination of stocks, bonds, commodities or currencies. For a hedge fund to generate meaningfully different returns than the underlying markets in which they transact, they have to outperform those markets by a magnitude that is sufficient to overcome the fees they charge investors. Furthermore, outperformance is a zero sum game.
For every dollar won, relative to the market, another dollar is lost. For this reason, we do not think that hedge funds should be included in the strategic asset allocation policies of investors; however, we do think investors may benefit from using hedge funds to implement certain elements of their investment portfolios if agreeable terms on fees and other governance matters can be achieved. In contrast to hedge funds, we note that trend-based commodity trading advisors (CTA) managers are lowly correlated to virtually all traditional asset classes. Many trend-based CTA managers also offer lower fee options that are accessible through funds that offer daily liquidity. The fact that trend-based CTA managers systematically “buy into strength” and “sell into weakness” creates a dynamic tool for making tactical tilts within a portfolio that can serve to increase exposure to asset classes that are trending upward and reduce exposure to asset classes that are out of favor. Based on these factors, we think most liquid U.S.-based investment portfolios should be constructed from the following basic building blocks: • Global Equities (inclusive of emerging market stocks) • U.S.
Core Fixed Income • Commodities • Liquid Real Assets (e.g., MLPs, real estate investment trusts (REITs)) • Trend-based CTA strategies with appropriate fee structures © 2015 Salient. All rights reserved. | The House View 6 .
The level of diversification across global equity markets is likely to be less important than the overall level of equity that an investor has in their portfolio. Accordingly, investors may be better served by considering their allocation across equity markets after first considering their allocations to equity markets, if at all. Furthermore, based on today’s low levels of interest rates, we believe that trend-based CTA strategies may serve investors better than U.S. core fixed income as a portfolio diversifier. Conclusion Investors are often preoccupied with current market events and sometimes feel they need to act in order to be doing their jobs.
More often than not, we believe investors’ time is better spent thinking about more strategic portfolio construction matters. In this report we highlight the fact that investors should give more consideration to their mix of equities, master limited partnerships, U.S. core fixed income, commodities and trend-based CTA strategies than attempting to select the proper sub-asset class investments within those categories or tactically allocating across those categories. © 2015 Salient.
All rights reserved. | The House View 7 . DISCLOSURES Investing involves risk, including possible loss of principal. The value of any financial instruments or markets mentioned herein can fall as well as rise. Past performance does not guarantee future results. This material is distributed for informational purposes only and should not be considered as investment advice, a recommendation of any particular security, strategy or investment product, or as an offer or solicitation with respect to the purchase or sale of any investment. Statistics, prices, estimates, forward-looking statements, and other information contained herein have been obtained from sources believed to be reliable, but no guarantee is given as to their accuracy or completeness.
All expressions of opinion are subject to change without notice. Hypothetical backtested returns have many inherent limitations. Unlike actual performance, it does not represent actual trading. Since trades have not been actually been executed, results may have under- or over-compensated for the impact, if any, of certain market factors, such as lack of liquidity, and may not reflect the impact that certain economic or market factors may have had on the decision-making process.
Hypothetical backtested performance also is developed with the benefit of hindsight. Other periods selected may have different results, including losses. There can be no assurance that the Adviser will achieve profits or avoid incurring substantial losses. Neither diversification nor asset allocation assures profit or protects against risk. One cannot invest directly in an index. “Alerian MLP Index”, “Alerian MLP Total Return Index”, “AMZ” and “AMZX” are trademarks of Alerian and their use is granted under a license from Alerian. Lee Partridge has earned the right to use the Chartered Financial Analyst designation. CFA Institute marks are trademarks owned by the CFA Institute. Research services are provided by Salient Capital Advisors, LLC, a wholly owned subsidiary of Salient Partners, L.P. and a Securities and Exchange Commission Registered Investment Adviser.
Registration as an investment advisor does not imply any level of skill or training. Salient research has been prepared without regard to the individual financial circumstances and objectives of persons who receive it. Salient recommends that investors independently evaluate particular investments and strategies, and encourage investors to seek the advice of a financial advisor.
The appropriateness of a particular investment or strategy will depend on an investor’s individual circumstances and objectives. Salient is the trade name for Salient Partners, L.P., which together with its subsidiaries provides asset management and advisory services. Insurance products offered through Salient Insurance Agency, LLC (Texas license #1736192). Trust services provided by Salient Trust Co., LTA. Securities offered through Salient Capital, L.P., a registered broker-dealer and Member FINRA, SIPC.
Each of Salient Insurance Agency, LLC, Salient Trust Co., LTA, and Salient Capital, L.P., is a subsidiary of Salient Partners, L.P. © 2015 Salient. All rights reserved. | The House View 8 .
DEFINITIONS Alerian MLP Index (AMZ) is a composite of the 50 most prominent energy MLPs that provides investors with a comprehensive benchmark for this emerging asset class. Barclays Global High Yield Index is a multi-currency flagship measure of the global high yield debt market. Barclays Intermediate Government/Credit Bond Index tracks the performance of intermediate term U.S. government and corporate bonds. Barclays U.S. Aggregate Bond Index represents securities that are SEC-registered, taxable and dollar denominated. The index covers the U.S. investment grade fixed-rate-bond market, with index components for government and corporate securities, mortgage pass-through securities and asset-backed securities. Barclays U.S.
Corporate High-Yield Bond Index covers the USD-denominated, non-investment grade, fixed-rate, taxable corporate bond market. Securities are classified as high-yield if the middle rating of Moody’s, Fitch and S&P is Ba1/BB+/BB+ or below. Bloomberg Commodity Index is a broadly diversified index composed of exchange-traded futures contracts on physical commodities. Commodity trading advisor (CTA) is US financial regulatory term for an individual or organization who is retained by a fund or individual client to provide advice and services related to trading in futures contracts, commodity options and/or certain swaps. They are responsible for the trading within managed futures accounts.
The definition of CTA may also apply to investment advisors for hedge funds and private funds including mutual funds and exchangetraded funds in certain cases.[3] CTAs are generally regulated by the United States federal government through registration with the Commodity Futures Trading Commission (CFTC) and membership of the National Futures Association (NFA). Chicago Mercantile Exchange is the world's second-largest exchange for futures and options on futures and the largest exchange in the U.S. The Chicago Board Options Exchange Volatility Index reflects a market estimate of future volatility, based on the weighted average of the implied volatilities for a wide range of strikes. 1st & 2nd month expirations are used until 8 days from expiration, then the 2nd and 3rd are used. Dow Jones Equity All REIT Index represents all publicly traded real estate investment trusts in the Dow Jones U.S. stock universe classified as Equity REITs according to the S&P Dow Jones Indices REIT Industry Classification Hierarchy. These companies are REITs that primarily own and operate income-producing real estate. The Global Industry Classification Standard (GICS) is a standardized classification system for equities developed jointly by Morgan Stanley Capital International (MSCI) and Standard & Poor's.
The GICS methodology is used by the MSCI indexes, which include domestic and international stocks, as well as by a large portion of the professional investment management community. HFRI Equity Hedge Index maintains positions both long and short in primarily equity and equity derivative securities. HFRI Event-Driven Index maintains positions in companies currently or prospectively involved in corporate transactions of a wide variety including but not limited to mergers, restructurings, financial distress, tender offers, shareholder buybacks, debt exchanges, security issuance or other capital structure adjustments. HFRI Macro Index maintains positions in a broad range of strategies in which the investment process is predicated on movements in underlying economic variables and the impact these have on equity, fixed income, hard currency and commodity markets. HFRI Relative Value Index maintains positions in strategies in which the investment thesis is predicated on realization of a valuation discrepancy in the relationship between multiple securities. Newedge CTA Trend Sub-Index is a subset of the Newedge CTA Index, and follows traders of trend following methodologies. The Newedge CTA Index is equal weighted, calculates the daily rate of return for a pool of CTAs selected from the larger managers that are open to new investment. © 2015 Salient. All rights reserved.
| The House View 9 . S&P GSCI Commodity Index is a composite index of commodity sector returns representing an unleveraged, longonly investment in commodity futures that is broadly diversified across the spectrum of commodities and serves as a measure of commodity performance over time. MSCI Emerging Markets (EM) Index is an index created by Morgan Stanley Capital International (MSCI) that is designed to measure equity market performance in global emerging markets. MSCI ACWI (All Country World Index) ex-USA is a free float-adjusted market capitalization index that is designed to measure equity market performance in the global developed and emerging markets, excluding the United States. One cannot invest directly in an index. The Russell 2000 Index measures the performance of the small-cap segment of the U.S. equity universe. It includes approximately 2000 of the smallest securities based on a combination of their market cap and current index membership. The Russell 2000 is constructed to provide a comprehensive and unbiased small-cap barometer and is completely reconstituted annually to ensure larger stocks do not distort the performance and characteristics of the true small-cap opportunity set. S&P 500 Index is an unmanaged, capitalization weighted index comprising publicly traded common stocks issued by companies in various industries.
The S&P 500 Index is widely recognized as the leading broad-based measurement of changes in conditions of the U.S. equities market. Tokyo Stock Price Index is an index that measures stock prices on the Tokyo Stock Exchange (TSE). © 2015 Salient. All rights reserved.
| The House View 10 .
Dollar 100.17 Sources: Bloomberg, Standard & Poor’s, Tokyo Stock Price Index, Morgan Stanley Capital Index, Alerian, Barclays Capital, Chicago Mercantile Exchange and Global Industry Classification Standard. Notes: Equity market returns include dividends and price changes over the reference period. U.S. equity sectors are based on level one of the Global Industry Classification Standards (GICS).
Except for gold, commodity market price changes are based on the 1st futures contract. Gold prices are referenced from the spot market. Sovereign debt market yields reference local currency returns for 10-year benchmark bond/note.
Currency prices are relative to the U.S. dollar. For illustrative purposes only. Past performance does not guarantee future performance.
Index performance does not reflect the deduction of fees, expenses, or taxes. The indices are unmanaged and are not available for direct investment. Market overview Major equity markets in the U.S., Germany and Japan advanced during the month of November. The return on foreign stocks to U.S. investors was muted by the appreciation of the U.S.
dollar during the month of November. Emerging market stocks struggled, posting a -2.48% return for the month. The Alerian MLP Index fell -8.07% in November, highlighting continued growth concerns for the sector in the wake of lower oil prices.
The trade-weighted dollar appreciated © 2015 Salient. All rights reserved. | The House View 1 .
3.36% and U.S. interest rates, as measured by the ten-year U.S. Treasury, rose 0.07% over the course of the month. The rising dollar and rising interest rates likely reflect broad expectations for an interest rate hike by the Federal Reserve following the Federal Open Market Committee (FOMC) meeting scheduled for December 16, 2015. Thought for the month Sound investment management practices often require investors to override “gut instincts” as they respond to short-term market volatility and adhere to longer-term portfolio management disciplines that chart a course toward stated risk and return objectives.
For many of us, the allure of outperformance—whether it come from an individual stock, fund, strategy or asset class—as well as the aversion to underperformance, often motivates investors to make shortterm investment decisions as a means of achieving investment goals. We seek the manager or stock that can outperform the broader market. We actively trade our portfolios to ensure that we don’t miss out on a hot investment or to avoid further losses on one of the “dogs” in our portfolio. Sadly, many of the short-term decisions made by investors are counterproductive and symptomatic of the lack of an overarching investment strategy.
All too often investors neglect the more fundamental aspects of portfolio management, which include specifying the risk and return objectives for their portfolios, adequately diversifying their portfolios to reduce uncompensated risks, reducing investment costs and ensuring that portfolios are appropriately rebalanced to maintain intended levels of risk and diversification during periods of market turbulence. In his classic text, Winning the Loser’s Game, Charles D. Ellis highlights the challenge of developing sound investment practices and sticking to those practices during turbulent market conditions. “For most investors, the hardest part is not figuring out the optimal investment policy; it is staying committed to sound investment through bull and bear markets and maintaining what Disraeli called “constancy to purpose.” Sustaining a long-term focus at market highs or market lows is notoriously difficult. At either kind of market extreme, emotions are strongest when current market action appears most demanding of change and apparent “facts” seem most compelling. Being rational in an emotional environment is never easy.
Holding onto a sound policy through thick and thin is both extraordinarily difficult and extraordinarily important work. © 2015 Salient. All rights reserved. | The House View 2 .
This is why investors can benefit from developing and sticking with sound investment policies and practices. The cost of infidelity to your own commitments can be very high. 1” One of the key tenets of a sound investment strategy is determining the appropriate mix of asset classes and strategies that will comprise the strategic asset allocation of a portfolio. Determining the long-term composition of the portfolio during periods of relative calm may help investors accomplish two primary objectives.
The first objective is articulating and targeting long-term risk and return preferences. The second objective is ensuring that the portfolio is designed to achieve those risk and return objectives as efficiently as possible (i.e., maximizing return relative to the degree of risk taken). This month’s blog post begins a three-part series on diversification that will cover: • The importance of carefully selecting the right building blocks when designing a portfolio, • Determining appropriate weights amongst the building blocks within the portfolio, and • The importance of selecting the right rebalancing strategy to maintain targeted portfolio risk and diversification levels. We begin this series with the topic of selecting the right building blocks for the portfolio. Selecting the building blocks Determining the right mix of asset classes and strategies to be included in a portfolio can be a daunting task.
The following table summarizes the annualized risk and return for 14 asset classes or strategies from January 2000 to October 2015. In addition to the asset classes listed, there are a myriad of private investment opportunities, sub-asset classes and related asset classes that have not been included. In most cases, we believe that those asset classes could be categorized into one of the 14 asset classes already identified within this report. Many investors use historic risk and return information to frame future expectations.
In certain instances, we think this is reasonable if one assumes that market participants efficiently price risk to generate a more or less consistent rate of return over longer periods of time. In other instances, we think it is important to give more weight to the starting price of the particular asset class relative to its historic levels. While it may be reasonable to expect U.S.
large cap stocks to 1 Ellis, Charles D. (2013). Winning the Loser’s Game: Timeless Strategies for Successful Investing (6th ed.).
McGraw Hill. © 2015 Salient. All rights reserved. | The House View 3 .
generate a 4-5% return with U.S. small cap stocks faring better at nearly 7%, it is less obvious that U.S. core fixed income will match its historical return of 5.42% after considering that the starting yield on the Barclays U.S. Aggregate Index in January 2000 was 7.16% versus 2.49% as of November 30, 2015. Asset Class Returns from January 2000 through November 2015 Asset Class Compounded Annualized Return Annualized Standard Devation of Return-to-Risk Returns Ratio U.S.
Large Cap Stocks (S&P 500 Index) 4.19% 15.11% 0.28 U.S. Small Cap Stocks (Russell 2000 Index) 6.98% 20.04% 0.35 Non-U.S. Developed Country Stocks (MSCI World ex-USA Index) 3.25% 17.24% 0.19 Emerging Market Stocks (MSCI Emerging Markets Index) 6.06% 22.66% 0.27 U.S.
REITS (Dow Jones Equity All REIT Index) 12.16% 21.74% 0.56 MLPs (Alerian MLP Index) 13.17% 16.82% 0.78 U.S. High Yield Bonds (Barclays Corporate High Yield Bond Index) 6.89% 9.83% 0.70 U.S. Core Fixed Income (Barclays U.S.
Aggregate Bond Index) 5.42% 3.47% 1.56 Commodities (S&P GSCI Total Return Index) -0.94% 23.47% (0.04) Trend-following strategies (Newedge Trend Index) 6.59% 14.39% 0.46 Hedge Fund Macro (HFRI Macro Index) 5.63% 5.43% 1.04 Hedge Fund Equity Hedged (HFRI Equity Hedge Index) 5.59% 8.93% 0.63 Hedge Fund Event (HFRI Event-Driven Index) 6.92% 6.44% 1.07 Hedge Fund Relative Value (HFRI Relative Value Index) 6.80% 4.17% 1.63 Sources: Bloomberg, MSCI, S&P, Russell, Dow Jones, Barclays, Alerian, Newedge and HFRI, as of November 30, 2015. For illustrative purposes only. Past performance does not guarantee future results. One cannot invest directly in an index. Looking further below the surface, we also recognize that this particular span of history was marked by notable economic tones that included a more accommodative central banking regime, disinflation, financial innovation, the escalation of public and private debt relative to gross domestic product (GDP) and the 2008 financial crisis.
We think these forces likely contributed to or detracted from the historical performance of these asset classes and strategies. Those same forces may not be present in the future, nor will their effects necessarily manifest themselves in the same way as they have in the past. Furthermore, certain asset classes that performed poorly during this period may be the very asset classes that perform well under different economic conditions.
As an example, in an inflationary world we would expect commodities to perform better and fixed income instruments to perform somewhat worse than the evidence provided by recent history. © 2015 Salient. All rights reserved. | The House View 4 .
As witnessed in the table above, the magnitude of return differences across asset classes like stock and commodity is much greater than the magnitude of return differences within a single asset class like stocks. Accordingly, we think the decision to include or exclude commodities in a portfolio will likely have a more material impact on results—for better or worse—than the decision to diversify away from U.S. stocks by including foreign stock markets. In addition to historical returns and risk, we find that historical correlations can be useful in identifying asset classes that have different underlying drivers.
Commodities and U.S. core fixed income represent two asset classes that would logically offer lower correlations to one another as fixed income generally performs well during periods of falling inflation, while commodities generally perform well during periods of rising inflation. The table below highlights the correlations across each of these major asset classes. U.S.
Large Cap Stocks (S&P 500 Index) Non-U.S. Developed Country Stocks (MSCI World ex-USA Index) Emerging Market Stocks (MSCI Emerging Markets Index ) U.S. REITS (Dow Jones Equity All REIT Index) MLPs (Alerian MLP Index) High Yield Bonds (Barclays Corporate High Yield Bond Index) Core U.S.
Fixed Income (Barclays U.S. Aggregate Bond Index) Commodities (S&P GSCI Total Return Index) Trend-based CTA (Newedge Trend Index) Hedge Fund Macro (HFRI Macro Index) Hedge Fund Equity Hedged (HFRI Equity Hedge Index) Hedge Fund Event (HFRI Event-Driven Index) Hedge Fund Relative Value (HFRI Relative Value Index) U.S. Large Cap Stocks (S&P 500 Index) U.S.
Short Cap Stocks (Russell 2000 Index) Non-U.S. Developed Country Stocks (MSCI World ex-USA Index) Emerging Market Stocks (MSCI Emerging Markets Index ) U.S. REITS (Dow Jones Equity All REIT Index) MLPs (Alerian MLP Index) High Yield Bonds (Barclays Corporate High Yield Bond Index) Core U.S.
Fixed Income (Barclays U.S. Aggregate Bond Index) Commodities (S&P GSCI Total Return Index) Trend-based CTA (Newedge Trend Index) Hedge Fund Macro (HFRI Macro Index) Hedge Fund Equity Hedged (HFRI Equity Hedge Index) Hedge Fund Event (HFRI Event-Driven Index) Hedge Fund Relative Value (HFRI Relative Value Index) U.S. Short Cap Stocks (Russell 2000 Index) Asset Class Correlations from January 2000 through November 2015 1.00 0.83 0.88 0.77 0.61 0.42 0.64 (0.09) 0.29 (0.14) (0.06) 0.10 0.11 0.15 1.00 0.78 0.74 0.65 0.40 0.65 (0.10) 0.29 (0.08) (0.03) 0.07 0.13 0.17 1.00 0.87 0.60 0.47 0.69 0.02 0.44 (0.04) (0.05) 0.09 0.12 0.15 1.00 0.52 0.47 0.71 0.03 0.43 (0.03) 0.05 0.12 0.14 0.16 1.00 0.32 0.62 0.17 0.16 (0.00) (0.11) 0.14 0.16 0.22 1.00 0.58 (0.00) 0.36 0.03 0.01 0.12 0.14 0.20 1.00 0.17 0.31 (0.14) 0.03 0.20 0.22 0.30 1.00 (0.03) 0.22 (0.03) (0.12) (0.12) (0.09) 1.00 0.12 (0.00) 0.15 0.19 0.29 1.00 (0.09) (0.13) (0.14) (0.10) 1.00 0.52 0.42 0.26 1.00 0.90 0.74 1.00 0.82 1.00 Sources: Bloomberg, MSCI, S&P, Russell, Dow Jones, Barclays, Alerian, Newedge and HFRI, as of November 30, 2015. For illustrative purposes only.
Past performance does not guarantee future results. One cannot invest directly in an index. The lowest correlation, across the traditional asset classes located at the top of the table, lies between U.S. stocks and U.S.
core fixed income. This is likely attributable in part to the emergence of bonds as a “safe” asset that tended to perform well during periods of stock market distress in addition to bonds’ negative correlation to inflation. The correlation between © 2015 Salient.
All rights reserved. | The House View 5 . U.S. core fixed income and commodities is also quite low. Lastly, the correlations between master limited partnerships (MLPs) and virtually all major equity markets are also relatively low. If we expand the opportunity set to include commodity trading advisors and hedge funds we note that further diversification benefits are achievable; however, those further reaches of diversification come at additional costs. Hedge fund managers typically charge between 1.5% and 2% in management fees and share 20% of the profits generated by their strategy. One school of thought holds that it doesn’t really matter how much managers charge if the net performance is sufficiently strong.
While we are sympathetic to this argument, we recognize that hedge funds are generally confined to holding some combination of stocks, bonds, commodities or currencies. For a hedge fund to generate meaningfully different returns than the underlying markets in which they transact, they have to outperform those markets by a magnitude that is sufficient to overcome the fees they charge investors. Furthermore, outperformance is a zero sum game.
For every dollar won, relative to the market, another dollar is lost. For this reason, we do not think that hedge funds should be included in the strategic asset allocation policies of investors; however, we do think investors may benefit from using hedge funds to implement certain elements of their investment portfolios if agreeable terms on fees and other governance matters can be achieved. In contrast to hedge funds, we note that trend-based commodity trading advisors (CTA) managers are lowly correlated to virtually all traditional asset classes. Many trend-based CTA managers also offer lower fee options that are accessible through funds that offer daily liquidity. The fact that trend-based CTA managers systematically “buy into strength” and “sell into weakness” creates a dynamic tool for making tactical tilts within a portfolio that can serve to increase exposure to asset classes that are trending upward and reduce exposure to asset classes that are out of favor. Based on these factors, we think most liquid U.S.-based investment portfolios should be constructed from the following basic building blocks: • Global Equities (inclusive of emerging market stocks) • U.S.
Core Fixed Income • Commodities • Liquid Real Assets (e.g., MLPs, real estate investment trusts (REITs)) • Trend-based CTA strategies with appropriate fee structures © 2015 Salient. All rights reserved. | The House View 6 .
The level of diversification across global equity markets is likely to be less important than the overall level of equity that an investor has in their portfolio. Accordingly, investors may be better served by considering their allocation across equity markets after first considering their allocations to equity markets, if at all. Furthermore, based on today’s low levels of interest rates, we believe that trend-based CTA strategies may serve investors better than U.S. core fixed income as a portfolio diversifier. Conclusion Investors are often preoccupied with current market events and sometimes feel they need to act in order to be doing their jobs.
More often than not, we believe investors’ time is better spent thinking about more strategic portfolio construction matters. In this report we highlight the fact that investors should give more consideration to their mix of equities, master limited partnerships, U.S. core fixed income, commodities and trend-based CTA strategies than attempting to select the proper sub-asset class investments within those categories or tactically allocating across those categories. © 2015 Salient.
All rights reserved. | The House View 7 . DISCLOSURES Investing involves risk, including possible loss of principal. The value of any financial instruments or markets mentioned herein can fall as well as rise. Past performance does not guarantee future results. This material is distributed for informational purposes only and should not be considered as investment advice, a recommendation of any particular security, strategy or investment product, or as an offer or solicitation with respect to the purchase or sale of any investment. Statistics, prices, estimates, forward-looking statements, and other information contained herein have been obtained from sources believed to be reliable, but no guarantee is given as to their accuracy or completeness.
All expressions of opinion are subject to change without notice. Hypothetical backtested returns have many inherent limitations. Unlike actual performance, it does not represent actual trading. Since trades have not been actually been executed, results may have under- or over-compensated for the impact, if any, of certain market factors, such as lack of liquidity, and may not reflect the impact that certain economic or market factors may have had on the decision-making process.
Hypothetical backtested performance also is developed with the benefit of hindsight. Other periods selected may have different results, including losses. There can be no assurance that the Adviser will achieve profits or avoid incurring substantial losses. Neither diversification nor asset allocation assures profit or protects against risk. One cannot invest directly in an index. “Alerian MLP Index”, “Alerian MLP Total Return Index”, “AMZ” and “AMZX” are trademarks of Alerian and their use is granted under a license from Alerian. Lee Partridge has earned the right to use the Chartered Financial Analyst designation. CFA Institute marks are trademarks owned by the CFA Institute. Research services are provided by Salient Capital Advisors, LLC, a wholly owned subsidiary of Salient Partners, L.P. and a Securities and Exchange Commission Registered Investment Adviser.
Registration as an investment advisor does not imply any level of skill or training. Salient research has been prepared without regard to the individual financial circumstances and objectives of persons who receive it. Salient recommends that investors independently evaluate particular investments and strategies, and encourage investors to seek the advice of a financial advisor.
The appropriateness of a particular investment or strategy will depend on an investor’s individual circumstances and objectives. Salient is the trade name for Salient Partners, L.P., which together with its subsidiaries provides asset management and advisory services. Insurance products offered through Salient Insurance Agency, LLC (Texas license #1736192). Trust services provided by Salient Trust Co., LTA. Securities offered through Salient Capital, L.P., a registered broker-dealer and Member FINRA, SIPC.
Each of Salient Insurance Agency, LLC, Salient Trust Co., LTA, and Salient Capital, L.P., is a subsidiary of Salient Partners, L.P. © 2015 Salient. All rights reserved. | The House View 8 .
DEFINITIONS Alerian MLP Index (AMZ) is a composite of the 50 most prominent energy MLPs that provides investors with a comprehensive benchmark for this emerging asset class. Barclays Global High Yield Index is a multi-currency flagship measure of the global high yield debt market. Barclays Intermediate Government/Credit Bond Index tracks the performance of intermediate term U.S. government and corporate bonds. Barclays U.S. Aggregate Bond Index represents securities that are SEC-registered, taxable and dollar denominated. The index covers the U.S. investment grade fixed-rate-bond market, with index components for government and corporate securities, mortgage pass-through securities and asset-backed securities. Barclays U.S.
Corporate High-Yield Bond Index covers the USD-denominated, non-investment grade, fixed-rate, taxable corporate bond market. Securities are classified as high-yield if the middle rating of Moody’s, Fitch and S&P is Ba1/BB+/BB+ or below. Bloomberg Commodity Index is a broadly diversified index composed of exchange-traded futures contracts on physical commodities. Commodity trading advisor (CTA) is US financial regulatory term for an individual or organization who is retained by a fund or individual client to provide advice and services related to trading in futures contracts, commodity options and/or certain swaps. They are responsible for the trading within managed futures accounts.
The definition of CTA may also apply to investment advisors for hedge funds and private funds including mutual funds and exchangetraded funds in certain cases.[3] CTAs are generally regulated by the United States federal government through registration with the Commodity Futures Trading Commission (CFTC) and membership of the National Futures Association (NFA). Chicago Mercantile Exchange is the world's second-largest exchange for futures and options on futures and the largest exchange in the U.S. The Chicago Board Options Exchange Volatility Index reflects a market estimate of future volatility, based on the weighted average of the implied volatilities for a wide range of strikes. 1st & 2nd month expirations are used until 8 days from expiration, then the 2nd and 3rd are used. Dow Jones Equity All REIT Index represents all publicly traded real estate investment trusts in the Dow Jones U.S. stock universe classified as Equity REITs according to the S&P Dow Jones Indices REIT Industry Classification Hierarchy. These companies are REITs that primarily own and operate income-producing real estate. The Global Industry Classification Standard (GICS) is a standardized classification system for equities developed jointly by Morgan Stanley Capital International (MSCI) and Standard & Poor's.
The GICS methodology is used by the MSCI indexes, which include domestic and international stocks, as well as by a large portion of the professional investment management community. HFRI Equity Hedge Index maintains positions both long and short in primarily equity and equity derivative securities. HFRI Event-Driven Index maintains positions in companies currently or prospectively involved in corporate transactions of a wide variety including but not limited to mergers, restructurings, financial distress, tender offers, shareholder buybacks, debt exchanges, security issuance or other capital structure adjustments. HFRI Macro Index maintains positions in a broad range of strategies in which the investment process is predicated on movements in underlying economic variables and the impact these have on equity, fixed income, hard currency and commodity markets. HFRI Relative Value Index maintains positions in strategies in which the investment thesis is predicated on realization of a valuation discrepancy in the relationship between multiple securities. Newedge CTA Trend Sub-Index is a subset of the Newedge CTA Index, and follows traders of trend following methodologies. The Newedge CTA Index is equal weighted, calculates the daily rate of return for a pool of CTAs selected from the larger managers that are open to new investment. © 2015 Salient. All rights reserved.
| The House View 9 . S&P GSCI Commodity Index is a composite index of commodity sector returns representing an unleveraged, longonly investment in commodity futures that is broadly diversified across the spectrum of commodities and serves as a measure of commodity performance over time. MSCI Emerging Markets (EM) Index is an index created by Morgan Stanley Capital International (MSCI) that is designed to measure equity market performance in global emerging markets. MSCI ACWI (All Country World Index) ex-USA is a free float-adjusted market capitalization index that is designed to measure equity market performance in the global developed and emerging markets, excluding the United States. One cannot invest directly in an index. The Russell 2000 Index measures the performance of the small-cap segment of the U.S. equity universe. It includes approximately 2000 of the smallest securities based on a combination of their market cap and current index membership. The Russell 2000 is constructed to provide a comprehensive and unbiased small-cap barometer and is completely reconstituted annually to ensure larger stocks do not distort the performance and characteristics of the true small-cap opportunity set. S&P 500 Index is an unmanaged, capitalization weighted index comprising publicly traded common stocks issued by companies in various industries.
The S&P 500 Index is widely recognized as the leading broad-based measurement of changes in conditions of the U.S. equities market. Tokyo Stock Price Index is an index that measures stock prices on the Tokyo Stock Exchange (TSE). © 2015 Salient. All rights reserved.
| The House View 10 .


