


Description
Salient 2015 Market Outlook
Lee Partridge, Chief Investment Officer
February 2015
. Disclosures
This information is being provided to you by Salient Capital Advisors, LLC, and is intended solely for educational
purposes. No other distribution or use of these materials has been authorized.
The opinions expressed in these materials represent the personal views of the investment professionals of
Salient Capital Advisors, LLC and is based on their broad based investment knowledge, experience, research and
analysis. It must be noted, however, that no one can accurately predict the future of the market with certainty or
guarantee future investment performance. Past performance is not a guarantee of future results.
Certain statements in this communication are forward-looking statements of Salient Capital Advisors,
LLC.
The forward-looking statements and other views expressed herein are as of the date of this material.
Actual future results or occurrences may differ significantly from those anticipated in any forward-looking statements, and there is no guarantee that any predictions will come to pass. The views expressed herein are subject to change at any time, due to numerous market and other factors. The Adviser disclaims any obligation to update publicly or revise any forward-looking statements or views expressed herein.
There can be no assurance that the strategy will achieve its investment objectives. The value of any strategy will fluctuate with the value of the underlying securities. This information is neither an offer to sell nor a solicitation of any offer to buy any securities. Any offering or solicitation will be made only to eligible investors and pursuant to any applicable Private Placement Memorandum and/or other governing documents, all of which must be read in their entirety.
There are special risks associated with an investment in commodities and futures, including market price fluctuations, regulatory changes, interest rate changes, credit risk, economic changes and the impact of adverse political or financial factors. Transactions in futures are speculative and carry a high degree of risk. Research and advisory services are provided by Salient Capital Advisors, LLC, a wholly owned subsidiary of Salient Partners, L.P. and a Securities and Exchange Commission registered investment adviser.
Salient research has been prepared without regard to the individual financial circumstances and objectives of persons who receive it. Salient recommends that investors independently evaluate particular investments and strategies, and encourage investors to seek the advice of a financial advisor. The appropriateness of a particular investment or strategy will depend on an investor’s individual circumstances and objectives. Salient Capital Advisors, LLC does not provide tax advice.
Please contact your tax professional to determine how the information contained in this document may apply to your situation. Salient Wealth is the trade name for various subsidiaries of Salient Partners, L.P., which together provide asset management and advisory services. Asset management and financial planning services provided by Salient Capital Advisors, LLC, a registered investment advisor. Registration as an investment advisor does not imply any level of skill or training.
Insurance products offered through Salient Insurance Agency, LLC (Texas license #1736192). Trust services provided by Salient Trust Co., LTA. Family office services offered through Salient Select, LLC.
Securities offered through Salient Capital, L.P., a registered broker-dealer and Member FINRA, SIPC. Each of Salient Insurance Agency, LLC, Salient Trust Co., LTA, and Salient Capital, L.P., is a subsidiary of Salient Partners, L.P. Diversification does not ensure a profit or guarantee against loss. © 2015 Salient. All Rights Reserved. Salient Partners, L.P. 2 .
Dr. Joseph Dolan: You know, it's a shame about Ed. Fletch: Oh, it was. Yeah, it was really a shame. To go so suddenly like that. Dr.
Joseph Dolan: Ahh, he was dying for years. Fletch: Sure, but... the end was really... very sudden. Dr.
Joseph Dolan: He was in intensive care for eight weeks! Fletch: Yeah, but I mean the very end, when he actually died. That was extremely sudden. -Fletch, 1985. Film. A lot of market participants can relate to the interchange between Fletch and Dr.
Dolan from the 1985 film, Fletch. Feigning knowledge of Dr. Dolan’s deceased patient Ed, Fletch comments on the tragedy of his “untimely death.” In the back and forth that ensues, it becomes clear that Ed’s death was actually a drawn out affair that did—in the end—ultimately result in death.
Dr. Dolan is akin to the value-oriented investors who see the current deficit spending/money printing craze as the decline phase of an unsustainable economy’s inevitable life cycle, despite the market’s seemingly inexplicable rise. The first possibility is that this ends with a market crash.
Many will no doubt be taken off guard by the inevitable consequences of easy money and over-indebtedness and claim that the crash was sudden. The frustrated cadre of value-oriented investors, however, will no doubt stipulate that it had been dying for years. This is the way the world ends Not with a bang but with a whimper. -T.S. Eliot (The Hollow Men) The other possibility is that the ultimate consequences of debt financed consumption, bad demographics, geopolitical uncertainty and lax monetary policy will be a slow growth economy that will persist for many years. The initial rebound from the edge of the abyss in 2008 seems to have lulled investors into a state of deep complacency, whereby the current world of low volatility and steady returns is now considered the norm.
We think it’s more likely that these challenges will create a headwind to growth for years to come versus a market crash. Salient Partners, L.P. 3 . Overview 2014 marked the end of the Federal Reserve’s (Fed) third round of quantitative easing. Just as the Federal Reserve wound down its purchases of U.S. Treasury Bonds and mortgages, heightened geopolitical and economic risks emerged. Growth rates in China and the rest of the emerging world continue to dissipate, which we believe resulted in part of the falling asset values across commodities generally.
Tensions in Eastern Europe persist with Russia redoubling its commitment to occupy Crimea, combating Ukrainian nationalists. On the Western Front, the Euro zone was troubled by mounting imbalances that have most recently set the stage for Greece’s shrugging off of austerity measures after Alexis Tsipras was elected as Prime Minister. Greece’s testing of European resolve will likely inform Italy’s actions as it struggles with similar fiscal budget challenges.
The Islamic State in Iraq & Syria group (ISIS) and other terrorist groups who associate themselves with the causes of Islam continue to escalate their acts of terror, furthering the chasm between the world of Islam and the rest of the developed world. While the Swiss National Bank’s removal of the Franc/Euro peg caught a number of hedge funds off guard, we’ve been contemplating the implications of negative nominal term interest rates. As of February 5, 2015, the Swiss 10-year government bond yielded -0.10%. Slowing global growth, an aging populous, high debt loads and stretched fiscal budgets have resulted in lower growth expectations and a greater threat of deflationary pressure.
For the first time in modern economic history, at 0.37% yields, the 10-year German bond yield is on top of 10-year Japanese Government Bond yields at 0.36%. The European Central Bank (ECB) has entered into the world of quantitative easing with its first announced action which will involve the purchase of at least 1.14 trillion euros between March 2015 and September 2016. Finally, the strength of the U.S. Dollar will likely challenge the rate of profit growth in the United States as domestic exports become less competitive overseas and profits from foreign operations are muted as they are translated back to U.S.
Dollars. In sum, we find this to be a challenging environment with less margin of safety than what we observed during the first stages of the peripheral debt crisis in 2011 when the price-to-earnings ratio (P/E) of the MSCI World index ebbed at 12X (TTM earnings*) and high yield credit spreads spiked to nearly 9% over comparable U.S. Treasuries (Barclays High Yield Credit Index).
The MSCI World Index currently has a Price-Earnings ratio of 17.7X (TTM earnings*) and high yield credit spreads have fallen to less than 5%. In our opinion, it’s likely that U.S. equities and bonds more generally will generate returns over the next five years that are notably lower than the returns generated over the past five years.
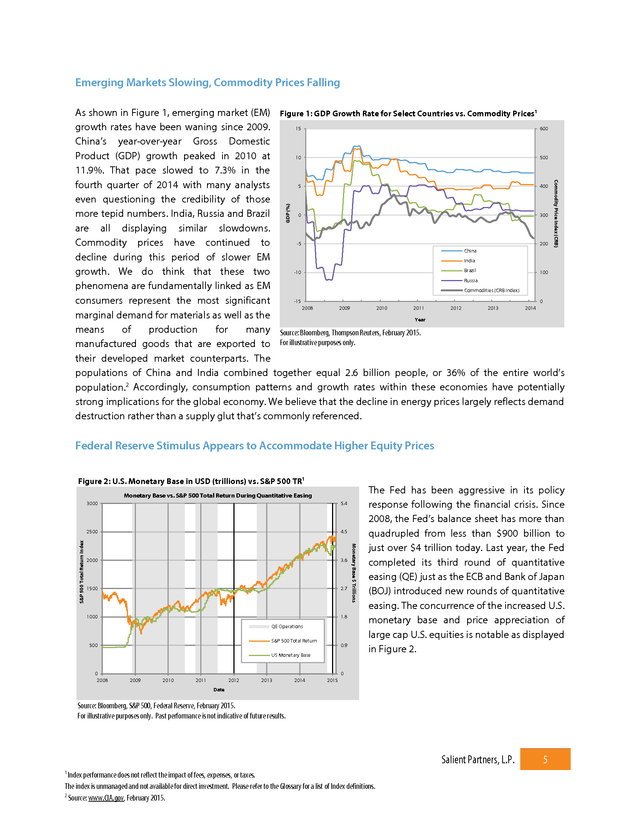
We believe there may be greater volatility of returns as economic imbalances work their way through the system. Salient Partners, L.P. * Trailing Twelve Months (TTM) is the timeframe of the past 12 months used for reporting financial figures. TTM figures can be calculated by subtracting the previous year’s results from the same quarter as the most recent quarter reported and adding the difference to the latest fiscal year end results. 4 . Emerging Markets Slowing, Commodity Prices Falling GDP (%) Commodity Price Index (CRB) As shown in Figure 1, emerging market (EM) Figure 1: GDP Growth Rate for Select Countries vs. Commodity Prices1 growth rates have been waning since 2009. 600 15 China’s year-over-year Gross Domestic 500 10 Product (GDP) growth peaked in 2010 at 11.9%. That pace slowed to 7.3% in the 400 5 fourth quarter of 2014 with many analysts even questioning the credibility of those 300 0 more tepid numbers. India, Russia and Brazil are all displaying similar slowdowns. 200 -5 Commodity prices have continued to China decline during this period of slower EM India Brazil 100 -10 growth.
We do think that these two Russia phenomena are fundamentally linked as EM Commodities (CRB Index) 0 -15 consumers represent the most significant 2008 2009 2010 2011 2012 2013 2014 marginal demand for materials as well as the Year means of production for many Source: Bloomberg, Thompson Reuters, February 2015. manufactured goods that are exported to For illustrative purposes only. their developed market counterparts. The populations of China and India combined together equal 2.6 billion people, or 36% of the entire world’s population.2 Accordingly, consumption patterns and growth rates within these economies have potentially strong implications for the global economy. We believe that the decline in energy prices largely reflects demand destruction rather than a supply glut that’s commonly referenced. Federal Reserve Stimulus Appears to Accommodate Higher Equity Prices Figure 2: U.S.
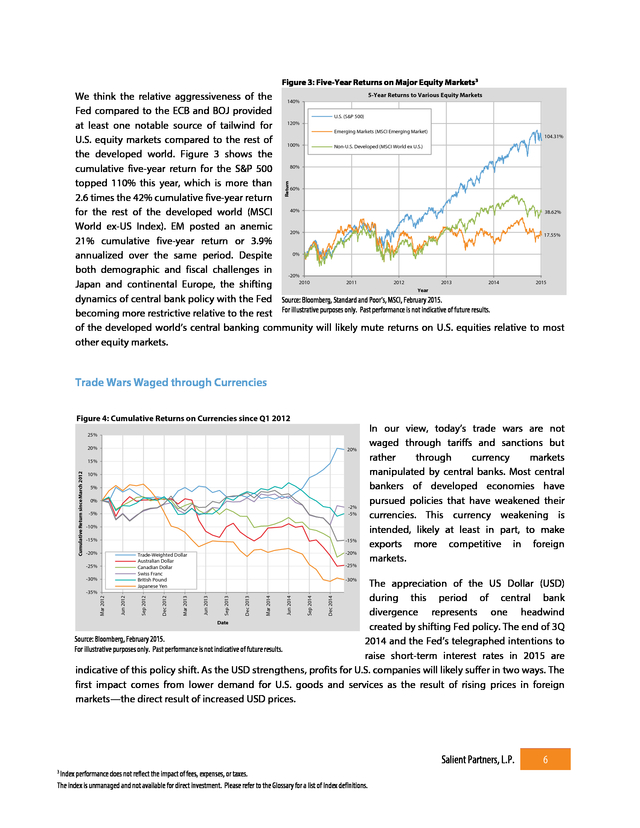
Monetary Base in USD (trillions) vs. S&P 500 TR1 Monetary Base vs. S&P 500 Total Return During Quantitative Easing 2500 S&P 500 Total Return Index 5.4 4.5 2000 3.6 1500 2.7 1.8 1000 QE Operations S&P 500 Total Return 500 0.9 US Monetary Base 0 2008 Monetary Base $ Trillions 3000 The Fed has been aggressive in its policy response following the financial crisis.
Since 2008, the Fed’s balance sheet has more than quadrupled from less than $900 billion to just over $4 trillion today. Last year, the Fed completed its third round of quantitative easing (QE) just as the ECB and Bank of Japan (BOJ) introduced new rounds of quantitative easing. The concurrence of the increased U.S. monetary base and price appreciation of large cap U.S.
equities is notable as displayed in Figure 2. 0 2009 2010 2011 2012 2013 2014 2015 Date Source: Bloomberg, S&P 500, Federal Reserve, February 2015. For illustrative purposes only. Past performance is not indicative of future results. Salient Partners, L.P. 1 Index performance does not reflect the impact of fees, expenses, or taxes. The index is unmanaged and not available for direct investment. Please refer to the Glossary for a list of Index definitions. 2 Source: www.CIA.gov, February 2015. 5 .
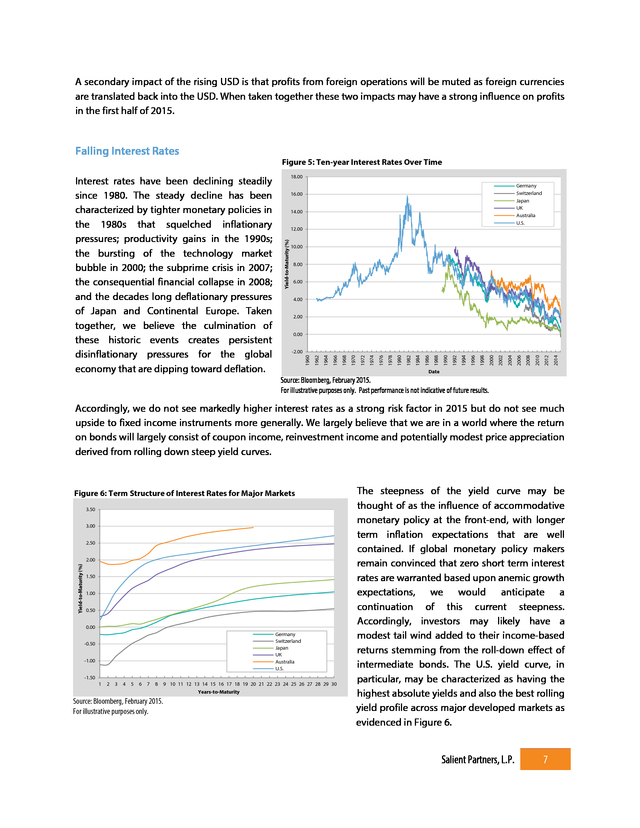
Figure 3: Five-Year Returns on Major Equity Markets3 Return 5-Year Returns to Various Equity Markets We think the relative aggressiveness of the 140% Fed compared to the ECB and BOJ provided U.S. (S&P 500) at least one notable source of tailwind for 120% Emerging Markets (MSCI Emerging Market) 104.31% U.S. equity markets compared to the rest of 100% Non-U.S. Developed (MSCI World ex U.S.) the developed world.
Figure 3 shows the 80% cumulative five-year return for the S&P 500 topped 110% this year, which is more than 60% 2.6 times the 42% cumulative five-year return 40% 38.62% for the rest of the developed world (MSCI World ex-US Index). EM posted an anemic 20% 17.55% 21% cumulative five-year return or 3.9% 0% annualized over the same period. Despite both demographic and fiscal challenges in -20% 2010 2011 2012 2013 2014 2015 Japan and continental Europe, the shifting Year dynamics of central bank policy with the Fed Source: Bloomberg, Standard and Poor’s, MSCI, February 2015. becoming more restrictive relative to the rest For illustrative purposes only.
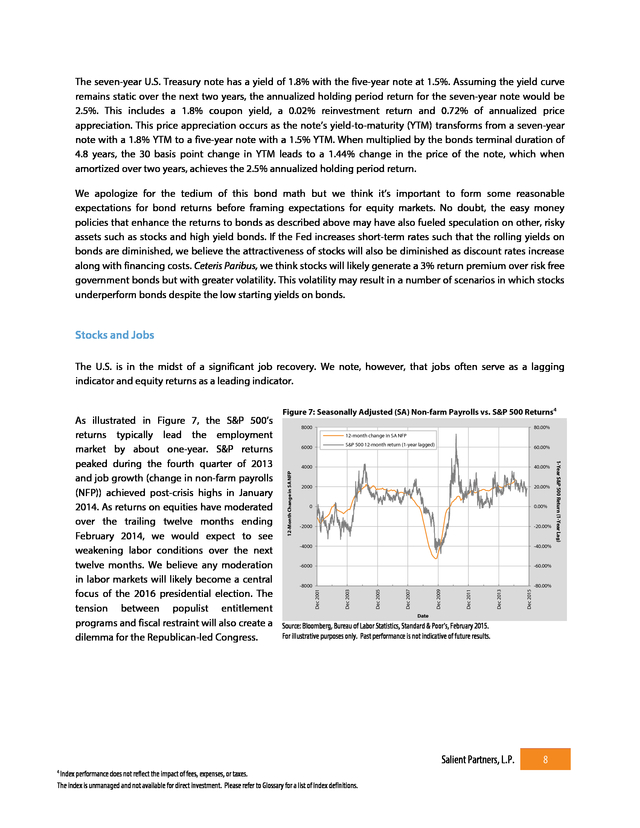
Past performance is not indicative of future results. of the developed world’s central banking community will likely mute returns on U.S. equities relative to most other equity markets. Trade Wars Waged through Currencies Figure 4: Cumulative Returns on Currencies since Q1 2012 25% 20% 20% Cumulative Return since March 2012 15% 10% 5% 0% -2% -5% -5% -10% -15% -15% -20% -20% Trade-Weighted Dollar Australian Dollar Canadian Dollar Swiss Franc British Pound Japanese Yen -25% -30% -25% In our view, today’s trade wars are not waged through tariffs and sanctions but rather through currency markets manipulated by central banks. Most central bankers of developed economies have pursued policies that have weakened their currencies.
This currency weakening is intended, likely at least in part, to make exports more competitive in foreign markets. -30% Dec 2014 Sep 2014 Jun 2014 Mar 2014 Dec 2013 Sep 2013 Jun 2013 Mar 2013 Dec 2012 Jun 2012 Mar 2012 Sep 2012 The appreciation of the US Dollar (USD) during this period of central bank divergence represents one headwind Date created by shifting Fed policy. The end of 3Q Source: Bloomberg, February 2015. 2014 and the Fed’s telegraphed intentions to For illustrative purposes only. Past performance is not indicative of future results. raise short-term interest rates in 2015 are indicative of this policy shift.
As the USD strengthens, profits for U.S. companies will likely suffer in two ways. The first impact comes from lower demand for U.S.
goods and services as the result of rising prices in foreign markets—the direct result of increased USD prices. -35% Salient Partners, L.P. 3 Index performance does not reflect the impact of fees, expenses, or taxes. The index is unmanaged and not available for direct investment. Please refer to the Glossary for a list of Index definitions. 6 . A secondary impact of the rising USD is that profits from foreign operations will be muted as foreign currencies are translated back into the USD. When taken together these two impacts may have a strong influence on profits in the first half of 2015. 18.00 Germany Switzerland Japan UK Australia U.S. 16.00 14.00 12.00 10.00 8.00 6.00 4.00 2.00 0.00 2014 2012 2010 2008 2006 2004 2002 2000 1998 1996 1994 1992 1990 1988 1986 1984 1982 1980 1978 1976 1974 1972 1970 1968 1966 1964 1962 -2.00 1960 Interest rates have been declining steadily since 1980. The steady decline has been characterized by tighter monetary policies in the 1980s that squelched inflationary pressures; productivity gains in the 1990s; the bursting of the technology market bubble in 2000; the subprime crisis in 2007; the consequential financial collapse in 2008; and the decades long deflationary pressures of Japan and Continental Europe. Taken together, we believe the culmination of these historic events creates persistent disinflationary pressures for the global economy that are dipping toward deflation. Figure 5: Ten-year Interest Rates Over Time Yield-to-Maturity (%) Falling Interest Rates Date Source: Bloomberg, February 2015. For illustrative purposes only.
Past performance is not indicative of future results. Accordingly, we do not see markedly higher interest rates as a strong risk factor in 2015 but do not see much upside to fixed income instruments more generally. We largely believe that we are in a world where the return on bonds will largely consist of coupon income, reinvestment income and potentially modest price appreciation derived from rolling down steep yield curves. Figure 6: Term Structure of Interest Rates for Major Markets 3.50 3.00 2.50 Yield-to-Maturity (%) 2.00 1.50 1.00 0.50 0.00 Germany Switzerland Japan UK Australia U.S. -0.50 -1.00 -1.50 1 2 3 4 5 6 7 8 9 10 11 12 13 14 15 16 17 18 19 20 21 22 23 24 25 26 27 28 29 30 Years-to-Maturity Source: Bloomberg, February 2015. For illustrative purposes only. The steepness of the yield curve may be thought of as the influence of accommodative monetary policy at the front-end, with longer term inflation expectations that are well contained. If global monetary policy makers remain convinced that zero short term interest rates are warranted based upon anemic growth expectations, we would anticipate a continuation of this current steepness. Accordingly, investors may likely have a modest tail wind added to their income-based returns stemming from the roll-down effect of intermediate bonds.
The U.S. yield curve, in particular, may be characterized as having the highest absolute yields and also the best rolling yield profile across major developed markets as evidenced in Figure 6. Salient Partners, L.P. 7 . The seven-year U.S. Treasury note has a yield of 1.8% with the five-year note at 1.5%. Assuming the yield curve remains static over the next two years, the annualized holding period return for the seven-year note would be 2.5%. This includes a 1.8% coupon yield, a 0.02% reinvestment return and 0.72% of annualized price appreciation.
This price appreciation occurs as the note’s yield-to-maturity (YTM) transforms from a seven-year note with a 1.8% YTM to a five-year note with a 1.5% YTM. When multiplied by the bonds terminal duration of 4.8 years, the 30 basis point change in YTM leads to a 1.44% change in the price of the note, which when amortized over two years, achieves the 2.5% annualized holding period return. We apologize for the tedium of this bond math but we think it’s important to form some reasonable expectations for bond returns before framing expectations for equity markets. No doubt, the easy money policies that enhance the returns to bonds as described above may have also fueled speculation on other, risky assets such as stocks and high yield bonds.
If the Fed increases short-term rates such that the rolling yields on bonds are diminished, we believe the attractiveness of stocks will also be diminished as discount rates increase along with financing costs. Ceteris Paribus, we think stocks will likely generate a 3% return premium over risk free government bonds but with greater volatility. This volatility may result in a number of scenarios in which stocks underperform bonds despite the low starting yields on bonds. Stocks and Jobs The U.S.
is in the midst of a significant job recovery. We note, however, that jobs often serve as a lagging indicator and equity returns as a leading indicator. Figure 7: Seasonally Adjusted (SA) Non-farm Payrolls vs. S&P 500 Returns4 80.00% 60.00% 20.00% 0.00% -20.00% -40.00% -60.00% Salient Partners, L.P. 4 Index performance does not reflect the impact of fees, expenses, or taxes. The index is unmanaged and not available for direct investment.
Please refer to Glossary for a list of Index definitions. Dec 2015 -80.00% Dec 2013 Dec 2011 Dec 2009 Dec 2007 Dec 2005 Dec 2003 Dec 2001 12-Month Change in SA NFP 40.00% 8 1-Year S&P 500 Return (1-Year Lag) As illustrated in Figure 7, the S&P 500’s 8000 12-month change in SA NFP returns typically lead the employment S&P 500 12-month return (1-year lagged) 6000 market by about one-year. S&P returns peaked during the fourth quarter of 2013 4000 and job growth (change in non-farm payrolls 2000 (NFP)) achieved post-crisis highs in January 0 2014. As returns on equities have moderated over the trailing twelve months ending -2000 February 2014, we would expect to see -4000 weakening labor conditions over the next -6000 twelve months.
We believe any moderation in labor markets will likely become a central -8000 focus of the 2016 presidential election. The tension between populist entitlement Date programs and fiscal restraint will also create a Source: Bloomberg, Bureau of Labor Statistics, Standard & Poor’s, February 2015. For illustrative purposes only. Past performance is not indicative of future results. dilemma for the Republican-led Congress. .
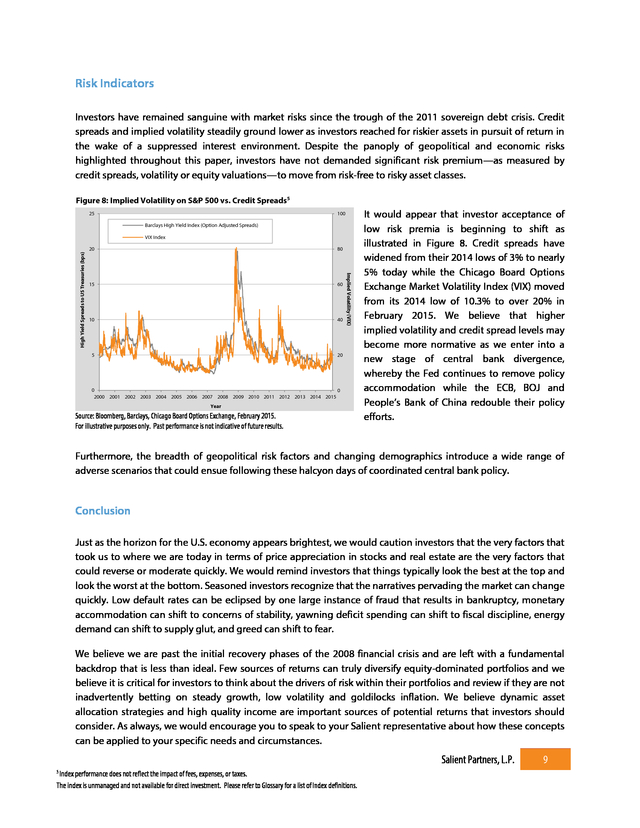
Risk Indicators Investors have remained sanguine with market risks since the trough of the 2011 sovereign debt crisis. Credit spreads and implied volatility steadily ground lower as investors reached for riskier assets in pursuit of return in the wake of a suppressed interest environment. Despite the panoply of geopolitical and economic risks highlighted throughout this paper, investors have not demanded significant risk premium—as measured by credit spreads, volatility or equity valuations—to move from risk-free to risky asset classes. Figure 8: Implied Volatility on S&P 500 vs. Credit Spreads5 25 100 Barclays High Yield Index (Option Adjusted Spreads) VIX Index 15 60 10 40 5 High Yield Spreads to US Treasuries (bps) 80 20 Implied Volatility (VIX) 20 0 0 2000 2001 2002 2003 2004 2005 2006 2007 2008 2009 2010 2011 2012 2013 2014 2015 Year Source: Bloomberg, Barclays, Chicago Board Options Exchange, February 2015. For illustrative purposes only.
Past performance is not indicative of future results. It would appear that investor acceptance of low risk premia is beginning to shift as illustrated in Figure 8. Credit spreads have widened from their 2014 lows of 3% to nearly 5% today while the Chicago Board Options Exchange Market Volatility Index (VIX) moved from its 2014 low of 10.3% to over 20% in February 2015. We believe that higher implied volatility and credit spread levels may become more normative as we enter into a new stage of central bank divergence, whereby the Fed continues to remove policy accommodation while the ECB, BOJ and People’s Bank of China redouble their policy efforts. Furthermore, the breadth of geopolitical risk factors and changing demographics introduce a wide range of adverse scenarios that could ensue following these halcyon days of coordinated central bank policy. Conclusion Just as the horizon for the U.S.
economy appears brightest, we would caution investors that the very factors that took us to where we are today in terms of price appreciation in stocks and real estate are the very factors that could reverse or moderate quickly. We would remind investors that things typically look the best at the top and look the worst at the bottom. Seasoned investors recognize that the narratives pervading the market can change quickly.
Low default rates can be eclipsed by one large instance of fraud that results in bankruptcy, monetary accommodation can shift to concerns of stability, yawning deficit spending can shift to fiscal discipline, energy demand can shift to supply glut, and greed can shift to fear. We believe we are past the initial recovery phases of the 2008 financial crisis and are left with a fundamental backdrop that is less than ideal. Few sources of returns can truly diversify equity-dominated portfolios and we believe it is critical for investors to think about the drivers of risk within their portfolios and review if they are not inadvertently betting on steady growth, low volatility and goldilocks inflation. We believe dynamic asset allocation strategies and high quality income are important sources of potential returns that investors should consider.
As always, we would encourage you to speak to your Salient representative about how these concepts can be applied to your specific needs and circumstances. Salient Partners, L.P. 5 Index performance does not reflect the impact of fees, expenses, or taxes. The index is unmanaged and not available for direct investment. Please refer to Glossary for a list of Index definitions. 9 . Glossary Barclays High Yield Credit Index - An Index that measures the market of USD-denominated, non-investment grade, fixed-rate, taxable corporate bonds. CRB Commodities Index - A broad-based commodity index consisting of 17 different commodities. Each of the commodities is continuously rebalanced and a Treasury bill return is added to the return from the commodities to reflect interest earned on margin. MSCI Emerging Market Index - An Index that covers over 2,700 securities in 21 markets that are currently classified as EM countries. The EM equity universe spans large, mid and small cap securities and can be segmented across styles and sectors. MSCI World Index - A free float-adjusted market capitalization weighted index that is designed to measure the equity market performance of developed markets. The MSCI World Index consists of the following 24 developed market country indices. MSCI World Index ex U.S.
Index - An Index that is a free float-adjusted market capitalization weighted index that is designed to measure the equity market performance of developed markets excluding the U.S. Quantitative Easing (QE) Operations - A monetary policy used by a central bank to stimulate an economy when standard monetary policy has become ineffective. S&P 500 Index - The S&P 500 Index is an unmanaged, capitalization weighted index comprising publicly traded common stocks issued by companies in various industries. S&P 500 Total Return Index - An unmanaged, capitalization weighted index calculating the performance of publicly traded common stocks issued by companies in various industries that have all dividends and distributions reinvested. U.S. Monetary Base - The sum of currency in circulation and reserve balances (deposits held by banks and other depository institutions in their accounts at the Federal Reserve). CBOE Volatility Index (VIX) - A key measure of market expectations of near-term volatility conveyed by S&P 500 stock index option prices. It is the premier benchmark for U.S.
stock market volatility. Salient Partners, L.P. 10 .
Actual future results or occurrences may differ significantly from those anticipated in any forward-looking statements, and there is no guarantee that any predictions will come to pass. The views expressed herein are subject to change at any time, due to numerous market and other factors. The Adviser disclaims any obligation to update publicly or revise any forward-looking statements or views expressed herein.
There can be no assurance that the strategy will achieve its investment objectives. The value of any strategy will fluctuate with the value of the underlying securities. This information is neither an offer to sell nor a solicitation of any offer to buy any securities. Any offering or solicitation will be made only to eligible investors and pursuant to any applicable Private Placement Memorandum and/or other governing documents, all of which must be read in their entirety.
There are special risks associated with an investment in commodities and futures, including market price fluctuations, regulatory changes, interest rate changes, credit risk, economic changes and the impact of adverse political or financial factors. Transactions in futures are speculative and carry a high degree of risk. Research and advisory services are provided by Salient Capital Advisors, LLC, a wholly owned subsidiary of Salient Partners, L.P. and a Securities and Exchange Commission registered investment adviser.
Salient research has been prepared without regard to the individual financial circumstances and objectives of persons who receive it. Salient recommends that investors independently evaluate particular investments and strategies, and encourage investors to seek the advice of a financial advisor. The appropriateness of a particular investment or strategy will depend on an investor’s individual circumstances and objectives. Salient Capital Advisors, LLC does not provide tax advice.
Please contact your tax professional to determine how the information contained in this document may apply to your situation. Salient Wealth is the trade name for various subsidiaries of Salient Partners, L.P., which together provide asset management and advisory services. Asset management and financial planning services provided by Salient Capital Advisors, LLC, a registered investment advisor. Registration as an investment advisor does not imply any level of skill or training.
Insurance products offered through Salient Insurance Agency, LLC (Texas license #1736192). Trust services provided by Salient Trust Co., LTA. Family office services offered through Salient Select, LLC.
Securities offered through Salient Capital, L.P., a registered broker-dealer and Member FINRA, SIPC. Each of Salient Insurance Agency, LLC, Salient Trust Co., LTA, and Salient Capital, L.P., is a subsidiary of Salient Partners, L.P. Diversification does not ensure a profit or guarantee against loss. © 2015 Salient. All Rights Reserved. Salient Partners, L.P. 2 .
Dr. Joseph Dolan: You know, it's a shame about Ed. Fletch: Oh, it was. Yeah, it was really a shame. To go so suddenly like that. Dr.
Joseph Dolan: Ahh, he was dying for years. Fletch: Sure, but... the end was really... very sudden. Dr.
Joseph Dolan: He was in intensive care for eight weeks! Fletch: Yeah, but I mean the very end, when he actually died. That was extremely sudden. -Fletch, 1985. Film. A lot of market participants can relate to the interchange between Fletch and Dr.
Dolan from the 1985 film, Fletch. Feigning knowledge of Dr. Dolan’s deceased patient Ed, Fletch comments on the tragedy of his “untimely death.” In the back and forth that ensues, it becomes clear that Ed’s death was actually a drawn out affair that did—in the end—ultimately result in death.
Dr. Dolan is akin to the value-oriented investors who see the current deficit spending/money printing craze as the decline phase of an unsustainable economy’s inevitable life cycle, despite the market’s seemingly inexplicable rise. The first possibility is that this ends with a market crash.
Many will no doubt be taken off guard by the inevitable consequences of easy money and over-indebtedness and claim that the crash was sudden. The frustrated cadre of value-oriented investors, however, will no doubt stipulate that it had been dying for years. This is the way the world ends Not with a bang but with a whimper. -T.S. Eliot (The Hollow Men) The other possibility is that the ultimate consequences of debt financed consumption, bad demographics, geopolitical uncertainty and lax monetary policy will be a slow growth economy that will persist for many years. The initial rebound from the edge of the abyss in 2008 seems to have lulled investors into a state of deep complacency, whereby the current world of low volatility and steady returns is now considered the norm.
We think it’s more likely that these challenges will create a headwind to growth for years to come versus a market crash. Salient Partners, L.P. 3 . Overview 2014 marked the end of the Federal Reserve’s (Fed) third round of quantitative easing. Just as the Federal Reserve wound down its purchases of U.S. Treasury Bonds and mortgages, heightened geopolitical and economic risks emerged. Growth rates in China and the rest of the emerging world continue to dissipate, which we believe resulted in part of the falling asset values across commodities generally.
Tensions in Eastern Europe persist with Russia redoubling its commitment to occupy Crimea, combating Ukrainian nationalists. On the Western Front, the Euro zone was troubled by mounting imbalances that have most recently set the stage for Greece’s shrugging off of austerity measures after Alexis Tsipras was elected as Prime Minister. Greece’s testing of European resolve will likely inform Italy’s actions as it struggles with similar fiscal budget challenges.
The Islamic State in Iraq & Syria group (ISIS) and other terrorist groups who associate themselves with the causes of Islam continue to escalate their acts of terror, furthering the chasm between the world of Islam and the rest of the developed world. While the Swiss National Bank’s removal of the Franc/Euro peg caught a number of hedge funds off guard, we’ve been contemplating the implications of negative nominal term interest rates. As of February 5, 2015, the Swiss 10-year government bond yielded -0.10%. Slowing global growth, an aging populous, high debt loads and stretched fiscal budgets have resulted in lower growth expectations and a greater threat of deflationary pressure.
For the first time in modern economic history, at 0.37% yields, the 10-year German bond yield is on top of 10-year Japanese Government Bond yields at 0.36%. The European Central Bank (ECB) has entered into the world of quantitative easing with its first announced action which will involve the purchase of at least 1.14 trillion euros between March 2015 and September 2016. Finally, the strength of the U.S. Dollar will likely challenge the rate of profit growth in the United States as domestic exports become less competitive overseas and profits from foreign operations are muted as they are translated back to U.S.
Dollars. In sum, we find this to be a challenging environment with less margin of safety than what we observed during the first stages of the peripheral debt crisis in 2011 when the price-to-earnings ratio (P/E) of the MSCI World index ebbed at 12X (TTM earnings*) and high yield credit spreads spiked to nearly 9% over comparable U.S. Treasuries (Barclays High Yield Credit Index).
The MSCI World Index currently has a Price-Earnings ratio of 17.7X (TTM earnings*) and high yield credit spreads have fallen to less than 5%. In our opinion, it’s likely that U.S. equities and bonds more generally will generate returns over the next five years that are notably lower than the returns generated over the past five years.
We believe there may be greater volatility of returns as economic imbalances work their way through the system. Salient Partners, L.P. * Trailing Twelve Months (TTM) is the timeframe of the past 12 months used for reporting financial figures. TTM figures can be calculated by subtracting the previous year’s results from the same quarter as the most recent quarter reported and adding the difference to the latest fiscal year end results. 4 . Emerging Markets Slowing, Commodity Prices Falling GDP (%) Commodity Price Index (CRB) As shown in Figure 1, emerging market (EM) Figure 1: GDP Growth Rate for Select Countries vs. Commodity Prices1 growth rates have been waning since 2009. 600 15 China’s year-over-year Gross Domestic 500 10 Product (GDP) growth peaked in 2010 at 11.9%. That pace slowed to 7.3% in the 400 5 fourth quarter of 2014 with many analysts even questioning the credibility of those 300 0 more tepid numbers. India, Russia and Brazil are all displaying similar slowdowns. 200 -5 Commodity prices have continued to China decline during this period of slower EM India Brazil 100 -10 growth.
We do think that these two Russia phenomena are fundamentally linked as EM Commodities (CRB Index) 0 -15 consumers represent the most significant 2008 2009 2010 2011 2012 2013 2014 marginal demand for materials as well as the Year means of production for many Source: Bloomberg, Thompson Reuters, February 2015. manufactured goods that are exported to For illustrative purposes only. their developed market counterparts. The populations of China and India combined together equal 2.6 billion people, or 36% of the entire world’s population.2 Accordingly, consumption patterns and growth rates within these economies have potentially strong implications for the global economy. We believe that the decline in energy prices largely reflects demand destruction rather than a supply glut that’s commonly referenced. Federal Reserve Stimulus Appears to Accommodate Higher Equity Prices Figure 2: U.S.
Monetary Base in USD (trillions) vs. S&P 500 TR1 Monetary Base vs. S&P 500 Total Return During Quantitative Easing 2500 S&P 500 Total Return Index 5.4 4.5 2000 3.6 1500 2.7 1.8 1000 QE Operations S&P 500 Total Return 500 0.9 US Monetary Base 0 2008 Monetary Base $ Trillions 3000 The Fed has been aggressive in its policy response following the financial crisis.
Since 2008, the Fed’s balance sheet has more than quadrupled from less than $900 billion to just over $4 trillion today. Last year, the Fed completed its third round of quantitative easing (QE) just as the ECB and Bank of Japan (BOJ) introduced new rounds of quantitative easing. The concurrence of the increased U.S. monetary base and price appreciation of large cap U.S.
equities is notable as displayed in Figure 2. 0 2009 2010 2011 2012 2013 2014 2015 Date Source: Bloomberg, S&P 500, Federal Reserve, February 2015. For illustrative purposes only. Past performance is not indicative of future results. Salient Partners, L.P. 1 Index performance does not reflect the impact of fees, expenses, or taxes. The index is unmanaged and not available for direct investment. Please refer to the Glossary for a list of Index definitions. 2 Source: www.CIA.gov, February 2015. 5 .
Figure 3: Five-Year Returns on Major Equity Markets3 Return 5-Year Returns to Various Equity Markets We think the relative aggressiveness of the 140% Fed compared to the ECB and BOJ provided U.S. (S&P 500) at least one notable source of tailwind for 120% Emerging Markets (MSCI Emerging Market) 104.31% U.S. equity markets compared to the rest of 100% Non-U.S. Developed (MSCI World ex U.S.) the developed world.
Figure 3 shows the 80% cumulative five-year return for the S&P 500 topped 110% this year, which is more than 60% 2.6 times the 42% cumulative five-year return 40% 38.62% for the rest of the developed world (MSCI World ex-US Index). EM posted an anemic 20% 17.55% 21% cumulative five-year return or 3.9% 0% annualized over the same period. Despite both demographic and fiscal challenges in -20% 2010 2011 2012 2013 2014 2015 Japan and continental Europe, the shifting Year dynamics of central bank policy with the Fed Source: Bloomberg, Standard and Poor’s, MSCI, February 2015. becoming more restrictive relative to the rest For illustrative purposes only.
Past performance is not indicative of future results. of the developed world’s central banking community will likely mute returns on U.S. equities relative to most other equity markets. Trade Wars Waged through Currencies Figure 4: Cumulative Returns on Currencies since Q1 2012 25% 20% 20% Cumulative Return since March 2012 15% 10% 5% 0% -2% -5% -5% -10% -15% -15% -20% -20% Trade-Weighted Dollar Australian Dollar Canadian Dollar Swiss Franc British Pound Japanese Yen -25% -30% -25% In our view, today’s trade wars are not waged through tariffs and sanctions but rather through currency markets manipulated by central banks. Most central bankers of developed economies have pursued policies that have weakened their currencies.
This currency weakening is intended, likely at least in part, to make exports more competitive in foreign markets. -30% Dec 2014 Sep 2014 Jun 2014 Mar 2014 Dec 2013 Sep 2013 Jun 2013 Mar 2013 Dec 2012 Jun 2012 Mar 2012 Sep 2012 The appreciation of the US Dollar (USD) during this period of central bank divergence represents one headwind Date created by shifting Fed policy. The end of 3Q Source: Bloomberg, February 2015. 2014 and the Fed’s telegraphed intentions to For illustrative purposes only. Past performance is not indicative of future results. raise short-term interest rates in 2015 are indicative of this policy shift.
As the USD strengthens, profits for U.S. companies will likely suffer in two ways. The first impact comes from lower demand for U.S.
goods and services as the result of rising prices in foreign markets—the direct result of increased USD prices. -35% Salient Partners, L.P. 3 Index performance does not reflect the impact of fees, expenses, or taxes. The index is unmanaged and not available for direct investment. Please refer to the Glossary for a list of Index definitions. 6 . A secondary impact of the rising USD is that profits from foreign operations will be muted as foreign currencies are translated back into the USD. When taken together these two impacts may have a strong influence on profits in the first half of 2015. 18.00 Germany Switzerland Japan UK Australia U.S. 16.00 14.00 12.00 10.00 8.00 6.00 4.00 2.00 0.00 2014 2012 2010 2008 2006 2004 2002 2000 1998 1996 1994 1992 1990 1988 1986 1984 1982 1980 1978 1976 1974 1972 1970 1968 1966 1964 1962 -2.00 1960 Interest rates have been declining steadily since 1980. The steady decline has been characterized by tighter monetary policies in the 1980s that squelched inflationary pressures; productivity gains in the 1990s; the bursting of the technology market bubble in 2000; the subprime crisis in 2007; the consequential financial collapse in 2008; and the decades long deflationary pressures of Japan and Continental Europe. Taken together, we believe the culmination of these historic events creates persistent disinflationary pressures for the global economy that are dipping toward deflation. Figure 5: Ten-year Interest Rates Over Time Yield-to-Maturity (%) Falling Interest Rates Date Source: Bloomberg, February 2015. For illustrative purposes only.
Past performance is not indicative of future results. Accordingly, we do not see markedly higher interest rates as a strong risk factor in 2015 but do not see much upside to fixed income instruments more generally. We largely believe that we are in a world where the return on bonds will largely consist of coupon income, reinvestment income and potentially modest price appreciation derived from rolling down steep yield curves. Figure 6: Term Structure of Interest Rates for Major Markets 3.50 3.00 2.50 Yield-to-Maturity (%) 2.00 1.50 1.00 0.50 0.00 Germany Switzerland Japan UK Australia U.S. -0.50 -1.00 -1.50 1 2 3 4 5 6 7 8 9 10 11 12 13 14 15 16 17 18 19 20 21 22 23 24 25 26 27 28 29 30 Years-to-Maturity Source: Bloomberg, February 2015. For illustrative purposes only. The steepness of the yield curve may be thought of as the influence of accommodative monetary policy at the front-end, with longer term inflation expectations that are well contained. If global monetary policy makers remain convinced that zero short term interest rates are warranted based upon anemic growth expectations, we would anticipate a continuation of this current steepness. Accordingly, investors may likely have a modest tail wind added to their income-based returns stemming from the roll-down effect of intermediate bonds.
The U.S. yield curve, in particular, may be characterized as having the highest absolute yields and also the best rolling yield profile across major developed markets as evidenced in Figure 6. Salient Partners, L.P. 7 . The seven-year U.S. Treasury note has a yield of 1.8% with the five-year note at 1.5%. Assuming the yield curve remains static over the next two years, the annualized holding period return for the seven-year note would be 2.5%. This includes a 1.8% coupon yield, a 0.02% reinvestment return and 0.72% of annualized price appreciation.
This price appreciation occurs as the note’s yield-to-maturity (YTM) transforms from a seven-year note with a 1.8% YTM to a five-year note with a 1.5% YTM. When multiplied by the bonds terminal duration of 4.8 years, the 30 basis point change in YTM leads to a 1.44% change in the price of the note, which when amortized over two years, achieves the 2.5% annualized holding period return. We apologize for the tedium of this bond math but we think it’s important to form some reasonable expectations for bond returns before framing expectations for equity markets. No doubt, the easy money policies that enhance the returns to bonds as described above may have also fueled speculation on other, risky assets such as stocks and high yield bonds.
If the Fed increases short-term rates such that the rolling yields on bonds are diminished, we believe the attractiveness of stocks will also be diminished as discount rates increase along with financing costs. Ceteris Paribus, we think stocks will likely generate a 3% return premium over risk free government bonds but with greater volatility. This volatility may result in a number of scenarios in which stocks underperform bonds despite the low starting yields on bonds. Stocks and Jobs The U.S.
is in the midst of a significant job recovery. We note, however, that jobs often serve as a lagging indicator and equity returns as a leading indicator. Figure 7: Seasonally Adjusted (SA) Non-farm Payrolls vs. S&P 500 Returns4 80.00% 60.00% 20.00% 0.00% -20.00% -40.00% -60.00% Salient Partners, L.P. 4 Index performance does not reflect the impact of fees, expenses, or taxes. The index is unmanaged and not available for direct investment.
Please refer to Glossary for a list of Index definitions. Dec 2015 -80.00% Dec 2013 Dec 2011 Dec 2009 Dec 2007 Dec 2005 Dec 2003 Dec 2001 12-Month Change in SA NFP 40.00% 8 1-Year S&P 500 Return (1-Year Lag) As illustrated in Figure 7, the S&P 500’s 8000 12-month change in SA NFP returns typically lead the employment S&P 500 12-month return (1-year lagged) 6000 market by about one-year. S&P returns peaked during the fourth quarter of 2013 4000 and job growth (change in non-farm payrolls 2000 (NFP)) achieved post-crisis highs in January 0 2014. As returns on equities have moderated over the trailing twelve months ending -2000 February 2014, we would expect to see -4000 weakening labor conditions over the next -6000 twelve months.
We believe any moderation in labor markets will likely become a central -8000 focus of the 2016 presidential election. The tension between populist entitlement Date programs and fiscal restraint will also create a Source: Bloomberg, Bureau of Labor Statistics, Standard & Poor’s, February 2015. For illustrative purposes only. Past performance is not indicative of future results. dilemma for the Republican-led Congress. .
Risk Indicators Investors have remained sanguine with market risks since the trough of the 2011 sovereign debt crisis. Credit spreads and implied volatility steadily ground lower as investors reached for riskier assets in pursuit of return in the wake of a suppressed interest environment. Despite the panoply of geopolitical and economic risks highlighted throughout this paper, investors have not demanded significant risk premium—as measured by credit spreads, volatility or equity valuations—to move from risk-free to risky asset classes. Figure 8: Implied Volatility on S&P 500 vs. Credit Spreads5 25 100 Barclays High Yield Index (Option Adjusted Spreads) VIX Index 15 60 10 40 5 High Yield Spreads to US Treasuries (bps) 80 20 Implied Volatility (VIX) 20 0 0 2000 2001 2002 2003 2004 2005 2006 2007 2008 2009 2010 2011 2012 2013 2014 2015 Year Source: Bloomberg, Barclays, Chicago Board Options Exchange, February 2015. For illustrative purposes only.
Past performance is not indicative of future results. It would appear that investor acceptance of low risk premia is beginning to shift as illustrated in Figure 8. Credit spreads have widened from their 2014 lows of 3% to nearly 5% today while the Chicago Board Options Exchange Market Volatility Index (VIX) moved from its 2014 low of 10.3% to over 20% in February 2015. We believe that higher implied volatility and credit spread levels may become more normative as we enter into a new stage of central bank divergence, whereby the Fed continues to remove policy accommodation while the ECB, BOJ and People’s Bank of China redouble their policy efforts. Furthermore, the breadth of geopolitical risk factors and changing demographics introduce a wide range of adverse scenarios that could ensue following these halcyon days of coordinated central bank policy. Conclusion Just as the horizon for the U.S.
economy appears brightest, we would caution investors that the very factors that took us to where we are today in terms of price appreciation in stocks and real estate are the very factors that could reverse or moderate quickly. We would remind investors that things typically look the best at the top and look the worst at the bottom. Seasoned investors recognize that the narratives pervading the market can change quickly.
Low default rates can be eclipsed by one large instance of fraud that results in bankruptcy, monetary accommodation can shift to concerns of stability, yawning deficit spending can shift to fiscal discipline, energy demand can shift to supply glut, and greed can shift to fear. We believe we are past the initial recovery phases of the 2008 financial crisis and are left with a fundamental backdrop that is less than ideal. Few sources of returns can truly diversify equity-dominated portfolios and we believe it is critical for investors to think about the drivers of risk within their portfolios and review if they are not inadvertently betting on steady growth, low volatility and goldilocks inflation. We believe dynamic asset allocation strategies and high quality income are important sources of potential returns that investors should consider.
As always, we would encourage you to speak to your Salient representative about how these concepts can be applied to your specific needs and circumstances. Salient Partners, L.P. 5 Index performance does not reflect the impact of fees, expenses, or taxes. The index is unmanaged and not available for direct investment. Please refer to Glossary for a list of Index definitions. 9 . Glossary Barclays High Yield Credit Index - An Index that measures the market of USD-denominated, non-investment grade, fixed-rate, taxable corporate bonds. CRB Commodities Index - A broad-based commodity index consisting of 17 different commodities. Each of the commodities is continuously rebalanced and a Treasury bill return is added to the return from the commodities to reflect interest earned on margin. MSCI Emerging Market Index - An Index that covers over 2,700 securities in 21 markets that are currently classified as EM countries. The EM equity universe spans large, mid and small cap securities and can be segmented across styles and sectors. MSCI World Index - A free float-adjusted market capitalization weighted index that is designed to measure the equity market performance of developed markets. The MSCI World Index consists of the following 24 developed market country indices. MSCI World Index ex U.S.
Index - An Index that is a free float-adjusted market capitalization weighted index that is designed to measure the equity market performance of developed markets excluding the U.S. Quantitative Easing (QE) Operations - A monetary policy used by a central bank to stimulate an economy when standard monetary policy has become ineffective. S&P 500 Index - The S&P 500 Index is an unmanaged, capitalization weighted index comprising publicly traded common stocks issued by companies in various industries. S&P 500 Total Return Index - An unmanaged, capitalization weighted index calculating the performance of publicly traded common stocks issued by companies in various industries that have all dividends and distributions reinvested. U.S. Monetary Base - The sum of currency in circulation and reserve balances (deposits held by banks and other depository institutions in their accounts at the Federal Reserve). CBOE Volatility Index (VIX) - A key measure of market expectations of near-term volatility conveyed by S&P 500 stock index option prices. It is the premier benchmark for U.S.
stock market volatility. Salient Partners, L.P. 10 .


