


Description
Risk Parity in a Rising Rates Regime
July 18, 2013
Roberto Croce, Ph.D.
Rusty Guinn
Lee Partridge
. Salient Whitepaper #2013-03
This information is being provided to you by Salient Capital Advisors, LLC, and is intended solely for educational purposes.
No other distribution or use of these materials has been authorized. The opinions expressed in these materials represent the
personal views of the investment professionals of Salient Capital Advisors, LLC and is based on their broad based investment
knowledge, experience, research and analysis. It must be noted, however, that no one can accurately predict the future of the
market with certainty or guarantee future investment performance. Past performance is not a guarantee of future results.
Information is for U.S.
residents only. Certain statements in this communication are forward-looking statements of Salient Capital Advisors, LLC. The forward-looking statements and other views expressed herein are as of the date of this letter. Actual future results or occurrences may differ significantly from those anticipated in any forward-looking statements, and there is no guarantee that any predictions will come to pass. The views expressed herein are subject to change at any time, due to numerous market and other factors.
The Adviser disclaims any obligation to update publicly or revise any forward-looking statements or views expressed herein. There can be no assurance that the Strategy will achieve its investment objectives. The value of any strategy will fluctuate with the value of the underlying securities. This information is neither an offer to sell nor a solicitation of any offer to buy any securities.
Any offering or solicitation will be made only to eligible investors and pursuant to any applicable Private Placement Memorandum and other governing documents, all of which must be read in their entirety. Please note that the returns presented in this paper are the result of a hypothetical investment framework. Backtested performance is NOT an indicator of future actual results and do the results above do NOT represent returns that any investor actually attained. Backtested results are calculated by the retroactive application of a model constructed on the basis of historical data and based on assumptions integral to the model which may or may not be testable and are subject to losses. Certain assumptions have been made for modeling purposes and are unlikely to be realized.
No representations and warranties are made as to the reasonableness of the assumptions. Changes in these assumptions may have a material impact on the backtested returns presented. This information is provided for illustrative purposes only.
Backtested performance is developed with the benefit of hindsight and has inherent limitations. Specifically, backtested results do not reflect actual trading or the effect of material economic and market factors on the decision-making process. Since trades have not actually been executed, results may have under- or over-compensated for the impact, if any, of certain market factors, such as lack of liquidity, and may not reflect the impact that certain economic or market factors may have had on the decision-making process.
Further, backtesting allows the security selection methodology to be adjusted until past returns are maximized. Actual performance may differ significantly from backtested performance. Backtested results are adjusted to reflect the reinvestment of dividends and other income. The above backtested results are do not include the effect of backtested transaction costs, management fees, performance fees or expenses, if applicable.
No cash balance or cash flow is included in the calculation. There are special risks associated with an investment in commodities and futures, including market price fluctuations, regulatory changes, interest rate changes, credit risk, economic changes and the impact of adverse political or financial factors. Transactions in futures are speculative and carry a high degree of risk. Research and advisory services are provided by Salient Capital Advisors, LLC, a wholly owned subsidiary of Salient Partners, L.P. and a U.S.
Securities and Exchange Commission Registered Investment Adviser. Registration as an Investment Adviser does not imply any level of skill or training. Salient research has been prepared without regard to the individual financial circumstances and objectives of persons who receive it.
Salient recommends that investors independently evaluate particular investments and strategies, and encourage investors to seek the advice of a financial advisor. The appropriateness of a particular investment or strategy will depend on an investor’s individual circumstances and objectives. All references to historic returns are based on the hypothetical performance of the strategy as backtested for research purposes. “Expected returns” refer to the general expectations of risk premia arising from various asset classes in the context if a risk-return relationship and are in now way intended to be forward looking projections. Salient is the trade name for Salient Partners, L.P., which together with its subsidiaries provides asset management and advisory services.
Insurance products offered through Salient Insurance Agency, LLC (Texas license #1736192). Trust services provided by Salient Trust Co., LTA. Securities offered through Salient Capital, L.P., a registered broker-dealer and Member FINRA, SIPC.
Each of Salient Insurance Agency, LLC, Salient Trust Co., LTA, and Salient Capital, L.P., is a subsidiary of Salient Partners, L.P. © Salient Capital Advisors, LLC, 2013 Authors: Roberto Croce, Ph.D., Rusty Guinn, Lee Partridge 2 . Salient Whitepaper #2013-03 Summary In this white paper, we endeavor to answer an increasingly common question among investors: “What happens to risk parity strategies when interest rates rise sharply from a low level?” The question is relevant for largely the same reasons that it is challenging to answer, namely, that most investors today have not encountered a regime of significant and sharp increases in interest rates during their investment lives. Furthermore, while the idea to extend Professor Markowitz’s pivotal portfolio construction research (Markowitz, 1952) to implementations that dispensed with constraints on leverage may have existed in the minds of academics, the maturity of the futures markets over the course of the 1980s was important to the creation of feasible risk parity (“RP”) products. In order to examine this question, we structure two distinct analyses of a relatively straightforward RP implementation during the period between 1971 and 1982, the last stretch of consistent, sustained rises in yields in the United States. The first analysis plots the performance of RP strategies over that period exactly as it was experienced. The second, and we believe more conservative analysis, presents a hypothetical variant of the 1970s in which the starting point for the yield on the US 10-Year Treasury Bond in 1971 was 1.6%, approximating the 2013 low.
The purpose of this second analysis is to account for the impact of current income when bond yields are higher. Since returns on bonds are a function of both income and duration (interest rate sensitivity), we wish to examine whether reducing the income component to current levels might have an appreciable impact on the performance of RP during rising rate environments. Based on our analysis, we conclude that RP would have fared well on an absolute basis under both scenarios, generating positive returns over the period. We also conclude that RP strategies would have outperformed the traditional 60/40 portfolio in a precise reliving of the 1970s rise in interest rates, and that RP strategies would have kept pace with the 60/40 portfolio even after removing the mitigating influence of a higher starting yield. We furthermore observe that the incorporation of momentum as a fourth asset within the risk parity implementation may have provided meaningful additional insulation against rising rates. Context: Why the Concern About Rising Rates? There are fundamental justifications for investors’ concerns and views on interest rates.
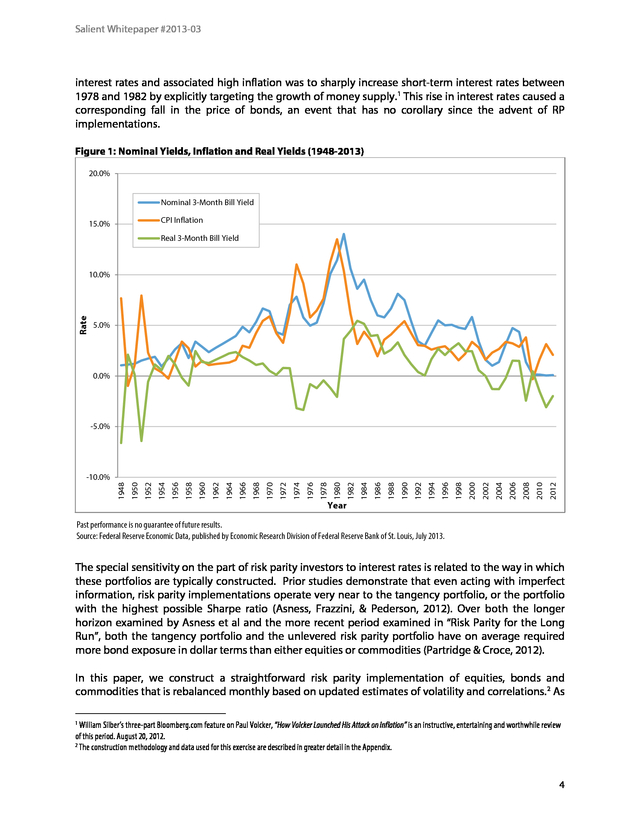
Investors may, for example, simply listen to policymakers who caution that highly accommodative monetary policy will not be permanent and draw sensible conclusions about the likely impact of the removal of those policies on interest rates. They may likewise propose that continued expansion of the monetary base creates the potential for inflationary pressures that might induce a more rapid rise in interest rates. While we might take some issue with the prevailing assumptions on how these forces would filter through to interest rates, it is not our intent to address these views in detail in this paper, but rather to answer the question, “What if they are right?” We believe there are historical justifications for investors’ concerns. As shown in Figure 1 on the following page, real interest rates have been almost continuously negative since 2008, and excluding a brief rise in rates in 2004, have been almost monotonically negative since 2002.
We believe this is an unusual state, but not unprecedented. The last episode of sustained, negative real interest rates occurred during the six year period from 1974 through 1980, a period which largely coincided with the period being examined in our analysis. It is notable because the policy response to low real 3 .
Salient Whitepaper #2013-03 interest rates and associated high inflation was to sharply increase short-term interest rates between 1978 and 1982 by explicitly targeting the growth of money supply. 1 This rise in interest rates caused a corresponding fall in the price of bonds, an event that has no corollary since the advent of RP implementations. Figure 1: Nominal Yields, Inflation and Real Yields (1948-2013) 20.0% Nominal 3-Month Bill Yield CPI Inflation 15.0% Real 3-Month Bill Yield Rate 10.0% 5.0% 0.0% -5.0% 2012 2010 2008 2006 2004 2002 2000 1998 1996 1994 1992 1990 1988 1986 Year 1984 1982 1980 1978 1976 1974 1972 1970 1968 1966 1964 1962 1960 1958 1956 1954 1952 1950 1948 -10.0% Past performance is no guarantee of future results. Source: Federal Reserve Economic Data, published by Economic Research Division of Federal Reserve Bank of St. Louis, July 2013. The special sensitivity on the part of risk parity investors to interest rates is related to the way in which these portfolios are typically constructed. Prior studies demonstrate that even acting with imperfect information, risk parity implementations operate very near to the tangency portfolio, or the portfolio with the highest possible Sharpe ratio (Asness, Frazzini, & Pederson, 2012).
Over both the longer horizon examined by Asness et al and the more recent period examined in “Risk Parity for the Long Run”, both the tangency portfolio and the unlevered risk parity portfolio have on average required more bond exposure in dollar terms than either equities or commodities (Partridge & Croce, 2012). In this paper, we construct a straightforward risk parity implementation of equities, bonds and commodities that is rebalanced monthly based on updated estimates of volatility and correlations.2 As 1 William Silber’s three-part Bloomberg.com feature on Paul Volcker, “How Volcker Launched His Attack on Inflation” is an instructive, entertaining and worthwhile review of this period. August 20, 2012. 2 The construction methodology and data used for this exercise are described in greater detail in the Appendix. 4 . Salient Whitepaper #2013-03 Figure 2 below shows, we too find that bonds are typically the largest allocation. On average, we find that bonds represent a 47.5% allocation in the unlevered risk parity portfolio, compared with 19.4% to equities and 33.1% to commodities. This is intuitive even without considering correlations: bonds represent a fundamentally less risky asset than equities and would nearly always require a larger weight to achieve the same risk in a portfolio. The proportion of weights over this period is variable, and there are certain periods of time over which bonds are not the largest allocation. We will consider the reasons for this and implications in more detail later in this piece. Figure 2: Exposures of Historical Unlevered Risk Parity Portfolio 100% 90% 80% Notional Exposure 70% 60% 50% 40% 30% 20% 10% 6/1/1963 11/1/1964 4/1/1966 9/1/1967 2/1/1969 7/1/1970 12/1/1971 5/1/1973 10/1/1974 3/1/1976 8/1/1977 1/1/1979 6/1/1980 11/1/1981 4/1/1983 9/1/1984 2/1/1986 7/1/1987 12/1/1988 5/1/1990 10/1/1991 3/1/1993 8/1/1994 1/1/1996 6/1/1997 11/1/1998 4/1/2000 9/1/2001 2/1/2003 7/1/2004 12/1/2005 5/1/2007 10/1/2008 3/1/2010 8/1/2011 0% Month Equities Bonds Commodities Source: Salient Capital Advisors, LLC, July 2013. “Unlevered Risk Parity Portfolio” reflects risk parity portfolio constructed consistent with methodology described in Appendix with constraint of 100% notional exposure. Data universe and source for Equities, Bonds and Commodities assets defined in Appendix. The second critical feature of many risk parity implementations is the willingness to use notional exposures beyond 100%.
In other words, while increasing the Sharpe Ratio of the portfolio may be valuable, the novelty of RP is that most implementations target a higher level of volatility than the unlevered portfolio is capable of delivering. An increase in desired volatility requires a corresponding increase in the notional exposure allocated to each asset. The example RP implementation we have constructed for this exercise targets a volatility of 10%. The resultant exposures to equities, bonds and commodities are shown in Figure 3 on the following page. 5 .
Salient Whitepaper #2013-03 The exposure to each asset must approximately double, on average, in order for the strategy to reach the targeted 10% volatility level. This means that a typical RP investor might reasonably expect to have 100% of his portfolio allocated to bonds in an average period, and as much as 300% during periods where estimated bond volatility or correlations with other assets were particularly low. Equities Bonds Commodities Unlevered RP Average Exposure 19.4% 47.5% 33.1% Minimum Exposure 7.6% 21.0% 10.8% Maximum Exposure 34.1% 74.4% 65.5% RP @ 10% Vol Figure 3: Historical Three-Asset RP Exposure Ranges Average Exposure 39.7% 103.4% 67.3% Minimum Exposure 17.5% 31.1% 17.1% Maximum Exposure 103.2% 300.0% 185.9% Source: Salient Capital Advisors, LLC, July 2013. “Unlevered RP” reflects risk parity portfolio with constraint of 100% notional exposure. “RP @ 10%” reflects risk parity portfolio with exposures as described in the methodology section of the Appendix. The perceived risk of risk parity bond exposure in a rising rates environment is amplified in part by this last point. Historically, the periods in which estimates of bond impact on portfolio volatility would have been lowest and thus in which bond exposures in RP implementations would have been largest correspond to the periods immediately preceding poor environments for bond markets. Based on our analysis, rates exposure of the risk parity strategy would have been, for example, consistently high for much of the 1970s prior to the significant rate increases.
Thus, the perception among many investors is that history may be repeating itself – that a low rate environment coupled with significant exposures to bonds in risk parity strategies will be followed by sharply rising rates and poor returns to those strategies. Risk Parity Performance Between 1971 and 1982 To evaluate this perception, we believe it is worthwhile to examine risk parity implementation in the historical context of the period between January 1971 and December 1981. This is essentially the period over which interest rates rose from trough levels to their peak. To wit, the US 10-Year Treasury Bond yielded 6.24% in January 1971 and by September 1981 reached a peak yield (based on monthend values) of 15.32%.
3 The high level summary is that a simple implementation of risk parity would have (i) generated positive nominal returns and (ii) outperformed an allocation strategy with comparable volatility, namely a benchmark of 60% equities and 40% bonds. Based on our analysis, risk parity would have experienced a cumulative return of 235%, while the 60/40 portfolio would have experienced a cumulative return of 118%. 3 Bloomberg, July 2013. 6 . Salient Whitepaper #2013-03 Figure 4: Cumulative Return, Risk Parity vs. 60/40 Portfolio 300% Risk Parity 60/40 250% Cumulative Return 200% 150% 100% 50% 0% 8/31/1981 12/31/1981 4/30/1981 8/29/1980 12/31/1980 4/30/1980 8/31/1979 12/31/1979 4/30/1979 8/31/1978 12/29/1978 4/28/1978 8/31/1977 12/30/1977 4/29/1977 8/31/1976 12/31/1976 4/30/1976 8/29/1975 12/31/1975 4/30/1975 8/30/1974 12/31/1974 4/30/1974 8/31/1973 12/31/1973 4/30/1973 8/31/1972 12/29/1972 4/28/1972 8/31/1971 12/31/1971 4/30/1971 12/31/1970 -50% Month Past performance is no guarantee of future results. Source: Salient Capital Advisors, LLC, July 2013. “Unlevered Risk Parity Portfolio” reflects risk parity portfolio constructed consistent with methodology described in Appendix with constraint of 100% notional exposure. Data universe and source for Equities, Bonds and Commodities assets defined in Appendix. It may not be immediately intuitive how risk parity weathered this particular environment. We believe there are three principal explanations: Volatility is Dynamic: While the principal difference between traditional static allocation schemes and risk parity implementations is often ascribed to the use of leverage or the bias toward lower volatility assets, the fact that exposures are dynamic is one of the most important differences.
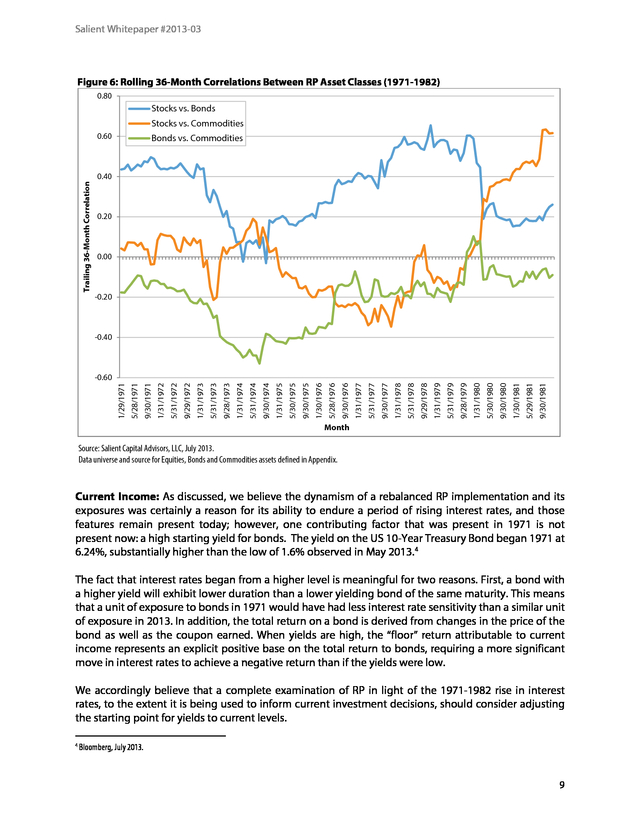
When poor asset returns are associated with increased volatility of those returns, risk parity implementations are typically designed to be capable of responding quickly to change exposures to reflect changing risk. As shown in Figure 5 on the following page, increases in bond volatility in 1974 and 1980 led to meaningful and relatively rapid reductions in the size of those exposures. 7 . Salient Whitepaper #2013-03 Figure 5: Notional Exposures of Risk Parity at 10% Volatility Target (1971-1982) 4.5 4.0 3.5 Notional Exposure 3.0 2.5 2.0 1.5 1.0 0.5 9/1/1981 5/1/1981 1/1/1981 9/1/1980 5/1/1980 1/1/1980 9/1/1979 5/1/1979 1/1/1979 9/1/1978 5/1/1978 1/1/1978 9/1/1977 5/1/1977 1/1/1977 9/1/1976 5/1/1976 1/1/1976 9/1/1975 5/1/1975 1/1/1975 9/1/1974 5/1/1974 1/1/1974 9/1/1973 5/1/1973 1/1/1973 9/1/1972 5/1/1972 1/1/1972 9/1/1971 5/1/1971 1/1/1971 0.0 Month Equities Bonds Commodities Source: Salient Capital Advisors, LLC, July 2013. Data universe and source for Equities, Bonds and Commodities assets defined in Appendix. Diversification is Dynamic: In addition to (and often in conjunction with) changes in volatility, correlations between assets change frequently as well. And while this may not often lead to changes in most traditional allocation models, it can potentially contribute to meaningful changes in the positioning of risk parity implementations that rebalance with any frequency. Consider, for example, that stocks and bonds were positively correlated over nearly every rolling 36-month period in this analysis. Relative to the more recent past, this means that bonds, all else being equal, would have typically been a less prominent asset within most risk parity implementations. In contrast, commodities were the diversifying asset in the 1970s.
Commodities were negatively correlated with either stocks or bonds over the rolling 36-month period 97% of the time between 1971 and 1982. Perhaps more impressively, commodities were negatively correlated with both stocks and bonds over 50% of the observed periods. We believe that many observers fail to consider in discussions of risk parity that many of the poorest environments historically for bonds represent desirable environments for inflation-sensitive assets similar to commodities.
The 1970s were such a period. 8 . Salient Whitepaper #2013-03 Figure 6: Rolling 36-Month Correlations Between RP Asset Classes (1971-1982) 0.80 Stocks vs. Bonds Stocks vs. Commodities 0.60 Bonds vs. Commodities Trailing 36-Month Correlation 0.40 0.20 0.00 -0.20 -0.40 9/30/1981 5/29/1981 1/30/1981 9/30/1980 5/30/1980 1/31/1980 9/28/1979 5/31/1979 1/31/1979 9/29/1978 5/31/1978 1/31/1978 9/30/1977 5/31/1977 1/31/1977 9/30/1976 5/28/1976 1/30/1976 9/30/1975 5/30/1975 1/31/1975 9/30/1974 5/31/1974 1/31/1974 9/28/1973 5/31/1973 1/31/1973 9/29/1972 5/31/1972 1/31/1972 9/30/1971 5/28/1971 1/29/1971 -0.60 Month Source: Salient Capital Advisors, LLC, July 2013. Data universe and source for Equities, Bonds and Commodities assets defined in Appendix. Current Income: As discussed, we believe the dynamism of a rebalanced RP implementation and its exposures was certainly a reason for its ability to endure a period of rising interest rates, and those features remain present today; however, one contributing factor that was present in 1971 is not present now: a high starting yield for bonds.
The yield on the US 10-Year Treasury Bond began 1971 at 6.24%, substantially higher than the low of 1.6% observed in May 2013. 4 The fact that interest rates began from a higher level is meaningful for two reasons. First, a bond with a higher yield will exhibit lower duration than a lower yielding bond of the same maturity.
This means that a unit of exposure to bonds in 1971 would have had less interest rate sensitivity than a similar unit of exposure in 2013. In addition, the total return on a bond is derived from changes in the price of the bond as well as the coupon earned. When yields are high, the “floor” return attributable to current income represents an explicit positive base on the total return to bonds, requiring a more significant move in interest rates to achieve a negative return than if the yields were low. We accordingly believe that a complete examination of RP in light of the 1971-1982 rise in interest rates, to the extent it is being used to inform current investment decisions, should consider adjusting the starting point for yields to current levels. 4 Bloomberg, July 2013. 9 .
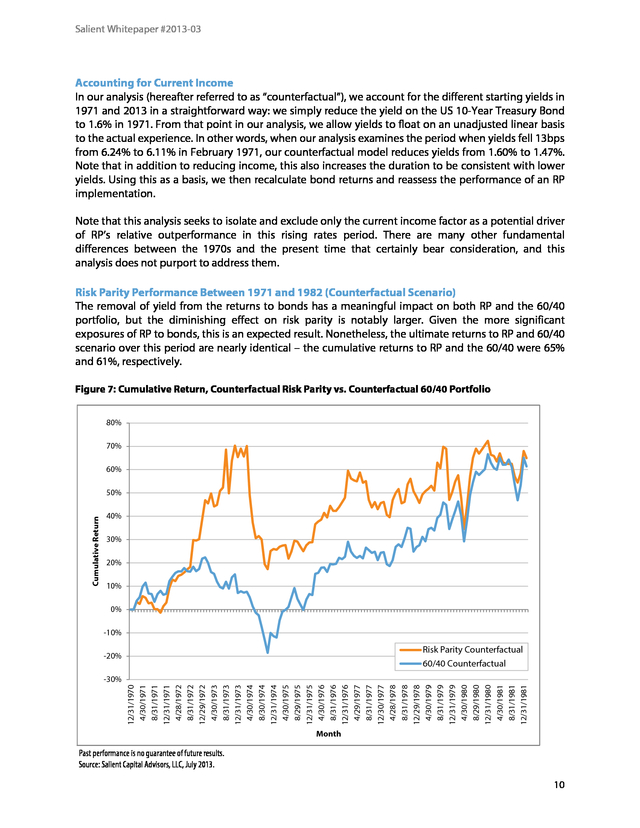
Salient Whitepaper #2013-03 Accounting for Current Income In our analysis (hereafter referred to as “counterfactual”), we account for the different starting yields in 1971 and 2013 in a straightforward way: we simply reduce the yield on the US 10-Year Treasury Bond to 1.6% in 1971. From that point in our analysis, we allow yields to float on an unadjusted linear basis to the actual experience. In other words, when our analysis examines the period when yields fell 13bps from 6.24% to 6.11% in February 1971, our counterfactual model reduces yields from 1.60% to 1.47%. Note that in addition to reducing income, this also increases the duration to be consistent with lower yields. Using this as a basis, we then recalculate bond returns and reassess the performance of an RP implementation. Note that this analysis seeks to isolate and exclude only the current income factor as a potential driver of RP’s relative outperformance in this rising rates period.
There are many other fundamental differences between the 1970s and the present time that certainly bear consideration, and this analysis does not purport to address them. Risk Parity Performance Between 1971 and 1982 (Counterfactual Scenario) The removal of yield from the returns to bonds has a meaningful impact on both RP and the 60/40 portfolio, but the diminishing effect on risk parity is notably larger. Given the more significant exposures of RP to bonds, this is an expected result. Nonetheless, the ultimate returns to RP and 60/40 scenario over this period are nearly identical – the cumulative returns to RP and the 60/40 were 65% and 61%, respectively. Figure 7: Cumulative Return, Counterfactual Risk Parity vs.
Counterfactual 60/40 Portfolio 80% 70% 60% Cumulative Return 50% 40% 30% 20% 10% 0% -10% Risk Parity Counterfactual 60/40 Counterfactual -20% 12/31/1970 4/30/1971 8/31/1971 12/31/1971 4/28/1972 8/31/1972 12/29/1972 4/30/1973 8/31/1973 12/31/1973 4/30/1974 8/30/1974 12/31/1974 4/30/1975 8/29/1975 12/31/1975 4/30/1976 8/31/1976 12/31/1976 4/29/1977 8/31/1977 12/30/1977 4/28/1978 8/31/1978 12/29/1978 4/30/1979 8/31/1979 12/31/1979 4/30/1980 8/29/1980 12/31/1980 4/30/1981 8/31/1981 12/31/1981 -30% Month Past performance is no guarantee of future results. Source: Salient Capital Advisors, LLC, July 2013. 10 . Salient Whitepaper #2013-03 There are complicating factors to this type of analysis. First, the starting and ending point of any such analysis can meaningfully impact its interpretation. Had the analysis terminated in 1979, the RP strategy would have demonstrated more meaningful outperformance vs. 60/40.
Likewise, had the analysis begun in 1974, the 60/40 portfolio would have outperformed this risk parity implementation. We submit, however, that if applied to any forward-looking purposes, this analysis presents a conservative case for the trajectory of bond yields, and not one that we consider likely. Even in this scenario, however, we believe this analysis demonstrates that the reports of the demise of risk parity in a rising rate regime have been exaggerated. Alternative Defenses of RP Against Rising Rates We have previously discussed the role of diversifying return streams in defraying the impact of a rising rate environment, especially in an RP implementation that rebalances to reflect changing volatilities and relationships between asset classes. In a persistent environment of rising rates, it is intuitive that a successful strategy would respond by accounting for the associated increase in volatility of bonds and the potentially diversifying influence of commodities should the rise in nominal rates be accompanied by inflation. While responsiveness to these changing correlations and volatilities is helpful, we believe that the incorporation of momentum strategies as a component of risk parity investing is both generally and specifically compelling vis-à-vis the rising rates environments under consideration in this paper.
As noted in our piece, “A Primer on Momentum”, momentum strategies offer both a low correlation to long-only sleeves of the portfolio and positive expected returns during prolonged drawdowns in any particular asset (Croce, 2012). Since we are principally concerned with Figure 8: Actual Annual Bond Returns vs. establishing historical proxies for a scenario that Counterfactual Scenario exchanges a 30+ year decline in interest rates for Actual 10-Year Counterfactual a corresponding rise over a period of years, the Bond Returns 10-Year Bond Return Year appeal to adding a diversifying asset with 1971 14.44% 5.79% highest expected returns when a single asset experiences prolonged drawdowns is intuitive. 3.92% -2.45% 1972 Consider the annual return profile of bonds as a 1973 4.10% -1.33% standalone asset class in our counterfactual 1974 5.94% -3.24% scenario shown in Figure 8 to the right. 1975 3.92% -1.66% A cursory examination of the returns that would have been experienced by bonds had rates risen as they did in the 1970s from a base of 1.6% demonstrates consistent and sustained underperformance. Consider that in this scenario bonds would have produced a positive return in only three of these years, with sustained underperformance in each of 1977 through 1980. 1976 1977 1978 1979 1980 1981 18.01% -1.24% -0.57% 4.16% 3.97% 5.31% 13.61% -4.39% -7.05% -5.98% -10.91% 3.05% Source: Salient Capital Advisors, LLC, July 2013. Incorporating momentum into our existing risk parity framework for this paper is straightforward. Instead of allocating 1/3 of risk to each of commodities, bonds and equities, we allocate 1/4 of risk to each of those assets as well as a strategy that sells short assets that have had negative performance 11 . Salient Whitepaper #2013-03 and buys long assets that have had positive performance over the last 12 months. 5 When combined with the other 3/4 of the portfolio that is dedicated to long-only positions in each of the three asset classes, the momentum allocation results in overweighting those asset classes that are appreciating and underweighting those asset classes that are declining. In Figure 9 below we show the performance of this strategy over the 1971-1982 period against (i) the 60/40 portfolio and (ii) the risk parity portfolio excluding momentum. Over the entire period, the incorporation of momentum introduces a meaningful improvement to returns, producing cumulative returns of 285% vs. 65% and 61% for RP without momentum and the 60/40 portfolio, respectively. Figure 9: Cumulative Return, Counterfactual RP w/ Momentum vs.
Counterfactual 60/40 350% Risk Parity Counterfactual 300% 60/40 Counterfactual RP Plus Momentum Counterfactual Cumulative Return 250% 200% 150% 100% 50% 0% 8/31/1981 12/31/1981 4/30/1981 8/29/1980 12/31/1980 4/30/1980 8/31/1979 12/31/1979 4/30/1979 8/31/1978 12/29/1978 4/28/1978 8/31/1977 12/30/1977 4/29/1977 8/31/1976 12/31/1976 4/30/1976 8/29/1975 12/31/1975 4/30/1975 8/30/1974 12/31/1974 4/30/1974 8/31/1973 12/31/1973 4/30/1973 8/31/1972 12/29/1972 4/28/1972 8/31/1971 12/31/1971 4/30/1971 12/31/1970 -50% Month Past performance is no guarantee of future results. Source: Salient Capital Advisors, LLC, July 2013. We also believe it is noteworthy that the incorporation of momentum in the RP implementation serves to reduce the importance of the starting period, shorten the depths of period drawdowns vs. the 60/40 portfolio and benefit, rather than suffer, from the sustained poor performance of bonds in the period from 1977-1982. 5 Note that the calculation is technically an 11-month momentum calculation lagged by one month. 12 . Salient Whitepaper #2013-03 Conclusions There are entirely sensible reasons to have long-term concerns about bonds in light of current interest rate levels, and given the historical tendency of risk parity strategies to have large positions in bonds, the concern for RP in a rising rates regime is understandable. Evidence from the last rising rate environment indicates, however, that critics of RP potentially understate (i) the potentially diversifying influence of commodities in these periods, (ii) the responsiveness of risk parity strategies to changes in asset volatility and (iii) the dynamic incorporation of changing correlations in many RP implementations. We furthermore believe the evidence indicates that incorporating momentum strategies into risk parity produces results that are particularly valuable to a rising rates regime. 13 . Salient Whitepaper #2013-03 Appendix: Data and Methodologies All allocations are made a priori, without the benefit of asset returns that had not yet occurred. Data and Index Definitions “Equities” in this white paper refers to capitalization-weighted returns from the NYSE, Amex, and NASDAQ accessed from CRSP. “Bonds” in this analysis refers to 10-year U.S. Treasury Bond returns, as accessed from CRSP. “Commodities” in this analysis refers to returns of the Continuous Commodity Index as accessed via Bloomberg. The risk-free rate refers to the return on 3-month T-bills, as accessed via Bloomberg. Historical bond yields used in calculation of the counterfactual scenario were accessed from the Federal Reserve Bank of St. Louis F.R.E.D. database. Methodology for Creation of Risk Parity Portfolio Starting in January 1971 (using data from January 1969-December 1970), we calculate the covariance of the assets based on rolling 24-month observations and solve for portfolio weights that would lead to equal estimates of risk for each asset and estimated total portfolio volatility of 10%.
Risk contributions are re-calculated monthly, after which the portfolio is rebalanced. Methodology for Creation of Counterfactual Risk Parity Portfolio All data and portfolio construction methodologies are consistent with the creation of the standard risk parity portfolios. Counterfactual bond yields are generated by subtracting 4.64% from the historical yields from January 1971-December 1981. Counterfactual bond returns are then generated for on-therun bonds issued at par with coupons equal to the counterfactual yield.
Counterfactual price returns are calculated using changes in the counterfactual yield, while coupon returns accrue based on the level of counterfactual yield. Methodology for Incorporation of Momentum Momentum is calculated based on 11-month returns lagged by one month. Momentum is incorporated into Risk Parity portfolio as a new “asset class”, which receives ¼ of the portfolio’s risk budget. This portfolio is constructed in such a way that assets with positive momentum are long and assets with negative momentum are sold short. All data accumulated July 2013. 14 .
Salient Whitepaper #2013-03 Bibliography Asness, C. S., Moskowitz, T. J., & Pederson, L. H.
(2010). Value and Momentum Everywhere. AFA 2010 Meetings Papers. Asness, C., Frazzini, A., & Pederson, L.
(2012). Leverage Aversion and Risk Parity. Financial Analysts Journal, 47-59. Croce, R.
(2012). A Primer on Momentum. Houston: Salient Partners, L.P. Fama, E.
F., & French, K. R. (1992).
The Cross-Section of Expected Stock Returns. Journal of Finance, 427465. Gorton, G. B., Hayashi, F., & Rouwenhorst, K.
G. (2008). The Fundamentals of Commodity Futures Returns.
Yale School of Management Working Papers. Jegadeesh, N., & Titman, S. (1993). Returns to Buying Winners and Selling Losers: Implications for Stock Market Efficiency.
Journal of Finance, 65-91. Markowitz, H. (1952). Portfolio Selection.
Journal of Finance, 77-91. Partridge, L., & Croce, R. (2012). Risk Parity for the Long Run.
Houston: Salient Partners, L.P. Rouwenhorst, K. G. (1998).
International Momentum Strategies. Journal of Finance, 267-284. 15 .
residents only. Certain statements in this communication are forward-looking statements of Salient Capital Advisors, LLC. The forward-looking statements and other views expressed herein are as of the date of this letter. Actual future results or occurrences may differ significantly from those anticipated in any forward-looking statements, and there is no guarantee that any predictions will come to pass. The views expressed herein are subject to change at any time, due to numerous market and other factors.
The Adviser disclaims any obligation to update publicly or revise any forward-looking statements or views expressed herein. There can be no assurance that the Strategy will achieve its investment objectives. The value of any strategy will fluctuate with the value of the underlying securities. This information is neither an offer to sell nor a solicitation of any offer to buy any securities.
Any offering or solicitation will be made only to eligible investors and pursuant to any applicable Private Placement Memorandum and other governing documents, all of which must be read in their entirety. Please note that the returns presented in this paper are the result of a hypothetical investment framework. Backtested performance is NOT an indicator of future actual results and do the results above do NOT represent returns that any investor actually attained. Backtested results are calculated by the retroactive application of a model constructed on the basis of historical data and based on assumptions integral to the model which may or may not be testable and are subject to losses. Certain assumptions have been made for modeling purposes and are unlikely to be realized.
No representations and warranties are made as to the reasonableness of the assumptions. Changes in these assumptions may have a material impact on the backtested returns presented. This information is provided for illustrative purposes only.
Backtested performance is developed with the benefit of hindsight and has inherent limitations. Specifically, backtested results do not reflect actual trading or the effect of material economic and market factors on the decision-making process. Since trades have not actually been executed, results may have under- or over-compensated for the impact, if any, of certain market factors, such as lack of liquidity, and may not reflect the impact that certain economic or market factors may have had on the decision-making process.
Further, backtesting allows the security selection methodology to be adjusted until past returns are maximized. Actual performance may differ significantly from backtested performance. Backtested results are adjusted to reflect the reinvestment of dividends and other income. The above backtested results are do not include the effect of backtested transaction costs, management fees, performance fees or expenses, if applicable.
No cash balance or cash flow is included in the calculation. There are special risks associated with an investment in commodities and futures, including market price fluctuations, regulatory changes, interest rate changes, credit risk, economic changes and the impact of adverse political or financial factors. Transactions in futures are speculative and carry a high degree of risk. Research and advisory services are provided by Salient Capital Advisors, LLC, a wholly owned subsidiary of Salient Partners, L.P. and a U.S.
Securities and Exchange Commission Registered Investment Adviser. Registration as an Investment Adviser does not imply any level of skill or training. Salient research has been prepared without regard to the individual financial circumstances and objectives of persons who receive it.
Salient recommends that investors independently evaluate particular investments and strategies, and encourage investors to seek the advice of a financial advisor. The appropriateness of a particular investment or strategy will depend on an investor’s individual circumstances and objectives. All references to historic returns are based on the hypothetical performance of the strategy as backtested for research purposes. “Expected returns” refer to the general expectations of risk premia arising from various asset classes in the context if a risk-return relationship and are in now way intended to be forward looking projections. Salient is the trade name for Salient Partners, L.P., which together with its subsidiaries provides asset management and advisory services.
Insurance products offered through Salient Insurance Agency, LLC (Texas license #1736192). Trust services provided by Salient Trust Co., LTA. Securities offered through Salient Capital, L.P., a registered broker-dealer and Member FINRA, SIPC.
Each of Salient Insurance Agency, LLC, Salient Trust Co., LTA, and Salient Capital, L.P., is a subsidiary of Salient Partners, L.P. © Salient Capital Advisors, LLC, 2013 Authors: Roberto Croce, Ph.D., Rusty Guinn, Lee Partridge 2 . Salient Whitepaper #2013-03 Summary In this white paper, we endeavor to answer an increasingly common question among investors: “What happens to risk parity strategies when interest rates rise sharply from a low level?” The question is relevant for largely the same reasons that it is challenging to answer, namely, that most investors today have not encountered a regime of significant and sharp increases in interest rates during their investment lives. Furthermore, while the idea to extend Professor Markowitz’s pivotal portfolio construction research (Markowitz, 1952) to implementations that dispensed with constraints on leverage may have existed in the minds of academics, the maturity of the futures markets over the course of the 1980s was important to the creation of feasible risk parity (“RP”) products. In order to examine this question, we structure two distinct analyses of a relatively straightforward RP implementation during the period between 1971 and 1982, the last stretch of consistent, sustained rises in yields in the United States. The first analysis plots the performance of RP strategies over that period exactly as it was experienced. The second, and we believe more conservative analysis, presents a hypothetical variant of the 1970s in which the starting point for the yield on the US 10-Year Treasury Bond in 1971 was 1.6%, approximating the 2013 low.
The purpose of this second analysis is to account for the impact of current income when bond yields are higher. Since returns on bonds are a function of both income and duration (interest rate sensitivity), we wish to examine whether reducing the income component to current levels might have an appreciable impact on the performance of RP during rising rate environments. Based on our analysis, we conclude that RP would have fared well on an absolute basis under both scenarios, generating positive returns over the period. We also conclude that RP strategies would have outperformed the traditional 60/40 portfolio in a precise reliving of the 1970s rise in interest rates, and that RP strategies would have kept pace with the 60/40 portfolio even after removing the mitigating influence of a higher starting yield. We furthermore observe that the incorporation of momentum as a fourth asset within the risk parity implementation may have provided meaningful additional insulation against rising rates. Context: Why the Concern About Rising Rates? There are fundamental justifications for investors’ concerns and views on interest rates.
Investors may, for example, simply listen to policymakers who caution that highly accommodative monetary policy will not be permanent and draw sensible conclusions about the likely impact of the removal of those policies on interest rates. They may likewise propose that continued expansion of the monetary base creates the potential for inflationary pressures that might induce a more rapid rise in interest rates. While we might take some issue with the prevailing assumptions on how these forces would filter through to interest rates, it is not our intent to address these views in detail in this paper, but rather to answer the question, “What if they are right?” We believe there are historical justifications for investors’ concerns. As shown in Figure 1 on the following page, real interest rates have been almost continuously negative since 2008, and excluding a brief rise in rates in 2004, have been almost monotonically negative since 2002.
We believe this is an unusual state, but not unprecedented. The last episode of sustained, negative real interest rates occurred during the six year period from 1974 through 1980, a period which largely coincided with the period being examined in our analysis. It is notable because the policy response to low real 3 .
Salient Whitepaper #2013-03 interest rates and associated high inflation was to sharply increase short-term interest rates between 1978 and 1982 by explicitly targeting the growth of money supply. 1 This rise in interest rates caused a corresponding fall in the price of bonds, an event that has no corollary since the advent of RP implementations. Figure 1: Nominal Yields, Inflation and Real Yields (1948-2013) 20.0% Nominal 3-Month Bill Yield CPI Inflation 15.0% Real 3-Month Bill Yield Rate 10.0% 5.0% 0.0% -5.0% 2012 2010 2008 2006 2004 2002 2000 1998 1996 1994 1992 1990 1988 1986 Year 1984 1982 1980 1978 1976 1974 1972 1970 1968 1966 1964 1962 1960 1958 1956 1954 1952 1950 1948 -10.0% Past performance is no guarantee of future results. Source: Federal Reserve Economic Data, published by Economic Research Division of Federal Reserve Bank of St. Louis, July 2013. The special sensitivity on the part of risk parity investors to interest rates is related to the way in which these portfolios are typically constructed. Prior studies demonstrate that even acting with imperfect information, risk parity implementations operate very near to the tangency portfolio, or the portfolio with the highest possible Sharpe ratio (Asness, Frazzini, & Pederson, 2012).
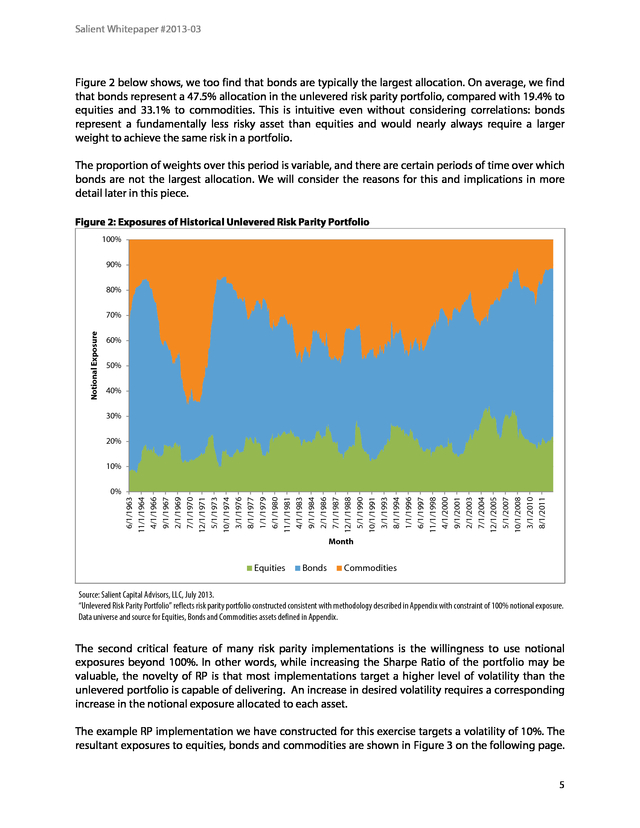
Over both the longer horizon examined by Asness et al and the more recent period examined in “Risk Parity for the Long Run”, both the tangency portfolio and the unlevered risk parity portfolio have on average required more bond exposure in dollar terms than either equities or commodities (Partridge & Croce, 2012). In this paper, we construct a straightforward risk parity implementation of equities, bonds and commodities that is rebalanced monthly based on updated estimates of volatility and correlations.2 As 1 William Silber’s three-part Bloomberg.com feature on Paul Volcker, “How Volcker Launched His Attack on Inflation” is an instructive, entertaining and worthwhile review of this period. August 20, 2012. 2 The construction methodology and data used for this exercise are described in greater detail in the Appendix. 4 . Salient Whitepaper #2013-03 Figure 2 below shows, we too find that bonds are typically the largest allocation. On average, we find that bonds represent a 47.5% allocation in the unlevered risk parity portfolio, compared with 19.4% to equities and 33.1% to commodities. This is intuitive even without considering correlations: bonds represent a fundamentally less risky asset than equities and would nearly always require a larger weight to achieve the same risk in a portfolio. The proportion of weights over this period is variable, and there are certain periods of time over which bonds are not the largest allocation. We will consider the reasons for this and implications in more detail later in this piece. Figure 2: Exposures of Historical Unlevered Risk Parity Portfolio 100% 90% 80% Notional Exposure 70% 60% 50% 40% 30% 20% 10% 6/1/1963 11/1/1964 4/1/1966 9/1/1967 2/1/1969 7/1/1970 12/1/1971 5/1/1973 10/1/1974 3/1/1976 8/1/1977 1/1/1979 6/1/1980 11/1/1981 4/1/1983 9/1/1984 2/1/1986 7/1/1987 12/1/1988 5/1/1990 10/1/1991 3/1/1993 8/1/1994 1/1/1996 6/1/1997 11/1/1998 4/1/2000 9/1/2001 2/1/2003 7/1/2004 12/1/2005 5/1/2007 10/1/2008 3/1/2010 8/1/2011 0% Month Equities Bonds Commodities Source: Salient Capital Advisors, LLC, July 2013. “Unlevered Risk Parity Portfolio” reflects risk parity portfolio constructed consistent with methodology described in Appendix with constraint of 100% notional exposure. Data universe and source for Equities, Bonds and Commodities assets defined in Appendix. The second critical feature of many risk parity implementations is the willingness to use notional exposures beyond 100%.
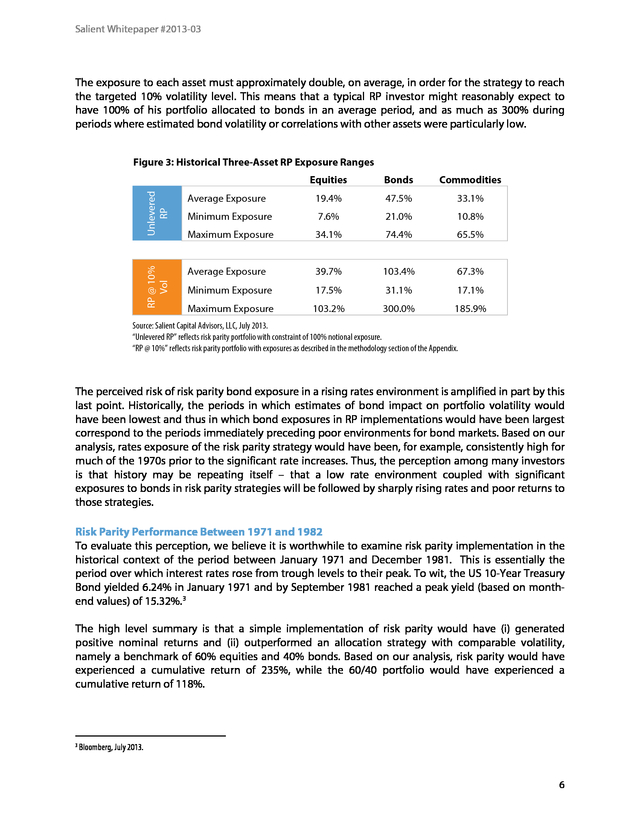
In other words, while increasing the Sharpe Ratio of the portfolio may be valuable, the novelty of RP is that most implementations target a higher level of volatility than the unlevered portfolio is capable of delivering. An increase in desired volatility requires a corresponding increase in the notional exposure allocated to each asset. The example RP implementation we have constructed for this exercise targets a volatility of 10%. The resultant exposures to equities, bonds and commodities are shown in Figure 3 on the following page. 5 .
Salient Whitepaper #2013-03 The exposure to each asset must approximately double, on average, in order for the strategy to reach the targeted 10% volatility level. This means that a typical RP investor might reasonably expect to have 100% of his portfolio allocated to bonds in an average period, and as much as 300% during periods where estimated bond volatility or correlations with other assets were particularly low. Equities Bonds Commodities Unlevered RP Average Exposure 19.4% 47.5% 33.1% Minimum Exposure 7.6% 21.0% 10.8% Maximum Exposure 34.1% 74.4% 65.5% RP @ 10% Vol Figure 3: Historical Three-Asset RP Exposure Ranges Average Exposure 39.7% 103.4% 67.3% Minimum Exposure 17.5% 31.1% 17.1% Maximum Exposure 103.2% 300.0% 185.9% Source: Salient Capital Advisors, LLC, July 2013. “Unlevered RP” reflects risk parity portfolio with constraint of 100% notional exposure. “RP @ 10%” reflects risk parity portfolio with exposures as described in the methodology section of the Appendix. The perceived risk of risk parity bond exposure in a rising rates environment is amplified in part by this last point. Historically, the periods in which estimates of bond impact on portfolio volatility would have been lowest and thus in which bond exposures in RP implementations would have been largest correspond to the periods immediately preceding poor environments for bond markets. Based on our analysis, rates exposure of the risk parity strategy would have been, for example, consistently high for much of the 1970s prior to the significant rate increases.
Thus, the perception among many investors is that history may be repeating itself – that a low rate environment coupled with significant exposures to bonds in risk parity strategies will be followed by sharply rising rates and poor returns to those strategies. Risk Parity Performance Between 1971 and 1982 To evaluate this perception, we believe it is worthwhile to examine risk parity implementation in the historical context of the period between January 1971 and December 1981. This is essentially the period over which interest rates rose from trough levels to their peak. To wit, the US 10-Year Treasury Bond yielded 6.24% in January 1971 and by September 1981 reached a peak yield (based on monthend values) of 15.32%.
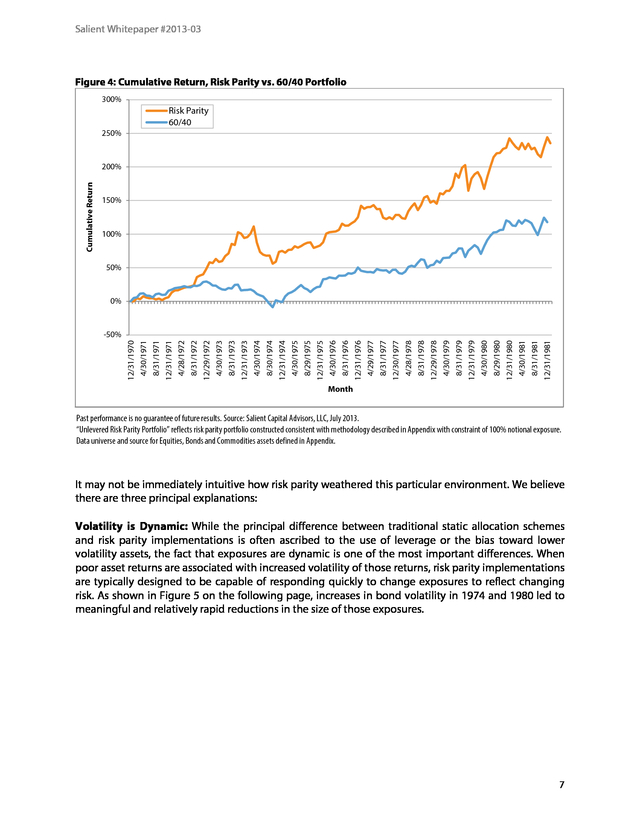
3 The high level summary is that a simple implementation of risk parity would have (i) generated positive nominal returns and (ii) outperformed an allocation strategy with comparable volatility, namely a benchmark of 60% equities and 40% bonds. Based on our analysis, risk parity would have experienced a cumulative return of 235%, while the 60/40 portfolio would have experienced a cumulative return of 118%. 3 Bloomberg, July 2013. 6 . Salient Whitepaper #2013-03 Figure 4: Cumulative Return, Risk Parity vs. 60/40 Portfolio 300% Risk Parity 60/40 250% Cumulative Return 200% 150% 100% 50% 0% 8/31/1981 12/31/1981 4/30/1981 8/29/1980 12/31/1980 4/30/1980 8/31/1979 12/31/1979 4/30/1979 8/31/1978 12/29/1978 4/28/1978 8/31/1977 12/30/1977 4/29/1977 8/31/1976 12/31/1976 4/30/1976 8/29/1975 12/31/1975 4/30/1975 8/30/1974 12/31/1974 4/30/1974 8/31/1973 12/31/1973 4/30/1973 8/31/1972 12/29/1972 4/28/1972 8/31/1971 12/31/1971 4/30/1971 12/31/1970 -50% Month Past performance is no guarantee of future results. Source: Salient Capital Advisors, LLC, July 2013. “Unlevered Risk Parity Portfolio” reflects risk parity portfolio constructed consistent with methodology described in Appendix with constraint of 100% notional exposure. Data universe and source for Equities, Bonds and Commodities assets defined in Appendix. It may not be immediately intuitive how risk parity weathered this particular environment. We believe there are three principal explanations: Volatility is Dynamic: While the principal difference between traditional static allocation schemes and risk parity implementations is often ascribed to the use of leverage or the bias toward lower volatility assets, the fact that exposures are dynamic is one of the most important differences.
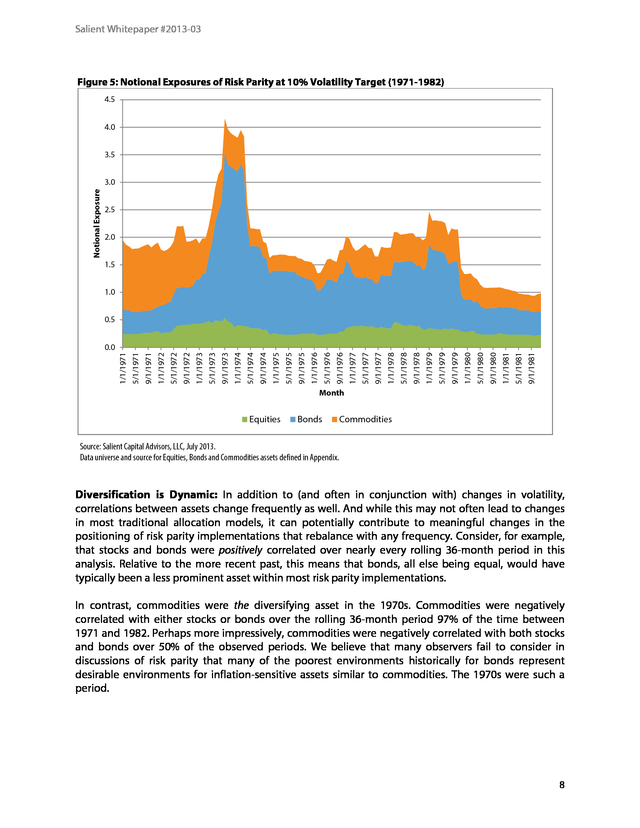
When poor asset returns are associated with increased volatility of those returns, risk parity implementations are typically designed to be capable of responding quickly to change exposures to reflect changing risk. As shown in Figure 5 on the following page, increases in bond volatility in 1974 and 1980 led to meaningful and relatively rapid reductions in the size of those exposures. 7 . Salient Whitepaper #2013-03 Figure 5: Notional Exposures of Risk Parity at 10% Volatility Target (1971-1982) 4.5 4.0 3.5 Notional Exposure 3.0 2.5 2.0 1.5 1.0 0.5 9/1/1981 5/1/1981 1/1/1981 9/1/1980 5/1/1980 1/1/1980 9/1/1979 5/1/1979 1/1/1979 9/1/1978 5/1/1978 1/1/1978 9/1/1977 5/1/1977 1/1/1977 9/1/1976 5/1/1976 1/1/1976 9/1/1975 5/1/1975 1/1/1975 9/1/1974 5/1/1974 1/1/1974 9/1/1973 5/1/1973 1/1/1973 9/1/1972 5/1/1972 1/1/1972 9/1/1971 5/1/1971 1/1/1971 0.0 Month Equities Bonds Commodities Source: Salient Capital Advisors, LLC, July 2013. Data universe and source for Equities, Bonds and Commodities assets defined in Appendix. Diversification is Dynamic: In addition to (and often in conjunction with) changes in volatility, correlations between assets change frequently as well. And while this may not often lead to changes in most traditional allocation models, it can potentially contribute to meaningful changes in the positioning of risk parity implementations that rebalance with any frequency. Consider, for example, that stocks and bonds were positively correlated over nearly every rolling 36-month period in this analysis. Relative to the more recent past, this means that bonds, all else being equal, would have typically been a less prominent asset within most risk parity implementations. In contrast, commodities were the diversifying asset in the 1970s.
Commodities were negatively correlated with either stocks or bonds over the rolling 36-month period 97% of the time between 1971 and 1982. Perhaps more impressively, commodities were negatively correlated with both stocks and bonds over 50% of the observed periods. We believe that many observers fail to consider in discussions of risk parity that many of the poorest environments historically for bonds represent desirable environments for inflation-sensitive assets similar to commodities.
The 1970s were such a period. 8 . Salient Whitepaper #2013-03 Figure 6: Rolling 36-Month Correlations Between RP Asset Classes (1971-1982) 0.80 Stocks vs. Bonds Stocks vs. Commodities 0.60 Bonds vs. Commodities Trailing 36-Month Correlation 0.40 0.20 0.00 -0.20 -0.40 9/30/1981 5/29/1981 1/30/1981 9/30/1980 5/30/1980 1/31/1980 9/28/1979 5/31/1979 1/31/1979 9/29/1978 5/31/1978 1/31/1978 9/30/1977 5/31/1977 1/31/1977 9/30/1976 5/28/1976 1/30/1976 9/30/1975 5/30/1975 1/31/1975 9/30/1974 5/31/1974 1/31/1974 9/28/1973 5/31/1973 1/31/1973 9/29/1972 5/31/1972 1/31/1972 9/30/1971 5/28/1971 1/29/1971 -0.60 Month Source: Salient Capital Advisors, LLC, July 2013. Data universe and source for Equities, Bonds and Commodities assets defined in Appendix. Current Income: As discussed, we believe the dynamism of a rebalanced RP implementation and its exposures was certainly a reason for its ability to endure a period of rising interest rates, and those features remain present today; however, one contributing factor that was present in 1971 is not present now: a high starting yield for bonds.
The yield on the US 10-Year Treasury Bond began 1971 at 6.24%, substantially higher than the low of 1.6% observed in May 2013. 4 The fact that interest rates began from a higher level is meaningful for two reasons. First, a bond with a higher yield will exhibit lower duration than a lower yielding bond of the same maturity.
This means that a unit of exposure to bonds in 1971 would have had less interest rate sensitivity than a similar unit of exposure in 2013. In addition, the total return on a bond is derived from changes in the price of the bond as well as the coupon earned. When yields are high, the “floor” return attributable to current income represents an explicit positive base on the total return to bonds, requiring a more significant move in interest rates to achieve a negative return than if the yields were low. We accordingly believe that a complete examination of RP in light of the 1971-1982 rise in interest rates, to the extent it is being used to inform current investment decisions, should consider adjusting the starting point for yields to current levels. 4 Bloomberg, July 2013. 9 .
Salient Whitepaper #2013-03 Accounting for Current Income In our analysis (hereafter referred to as “counterfactual”), we account for the different starting yields in 1971 and 2013 in a straightforward way: we simply reduce the yield on the US 10-Year Treasury Bond to 1.6% in 1971. From that point in our analysis, we allow yields to float on an unadjusted linear basis to the actual experience. In other words, when our analysis examines the period when yields fell 13bps from 6.24% to 6.11% in February 1971, our counterfactual model reduces yields from 1.60% to 1.47%. Note that in addition to reducing income, this also increases the duration to be consistent with lower yields. Using this as a basis, we then recalculate bond returns and reassess the performance of an RP implementation. Note that this analysis seeks to isolate and exclude only the current income factor as a potential driver of RP’s relative outperformance in this rising rates period.
There are many other fundamental differences between the 1970s and the present time that certainly bear consideration, and this analysis does not purport to address them. Risk Parity Performance Between 1971 and 1982 (Counterfactual Scenario) The removal of yield from the returns to bonds has a meaningful impact on both RP and the 60/40 portfolio, but the diminishing effect on risk parity is notably larger. Given the more significant exposures of RP to bonds, this is an expected result. Nonetheless, the ultimate returns to RP and 60/40 scenario over this period are nearly identical – the cumulative returns to RP and the 60/40 were 65% and 61%, respectively. Figure 7: Cumulative Return, Counterfactual Risk Parity vs.
Counterfactual 60/40 Portfolio 80% 70% 60% Cumulative Return 50% 40% 30% 20% 10% 0% -10% Risk Parity Counterfactual 60/40 Counterfactual -20% 12/31/1970 4/30/1971 8/31/1971 12/31/1971 4/28/1972 8/31/1972 12/29/1972 4/30/1973 8/31/1973 12/31/1973 4/30/1974 8/30/1974 12/31/1974 4/30/1975 8/29/1975 12/31/1975 4/30/1976 8/31/1976 12/31/1976 4/29/1977 8/31/1977 12/30/1977 4/28/1978 8/31/1978 12/29/1978 4/30/1979 8/31/1979 12/31/1979 4/30/1980 8/29/1980 12/31/1980 4/30/1981 8/31/1981 12/31/1981 -30% Month Past performance is no guarantee of future results. Source: Salient Capital Advisors, LLC, July 2013. 10 . Salient Whitepaper #2013-03 There are complicating factors to this type of analysis. First, the starting and ending point of any such analysis can meaningfully impact its interpretation. Had the analysis terminated in 1979, the RP strategy would have demonstrated more meaningful outperformance vs. 60/40.
Likewise, had the analysis begun in 1974, the 60/40 portfolio would have outperformed this risk parity implementation. We submit, however, that if applied to any forward-looking purposes, this analysis presents a conservative case for the trajectory of bond yields, and not one that we consider likely. Even in this scenario, however, we believe this analysis demonstrates that the reports of the demise of risk parity in a rising rate regime have been exaggerated. Alternative Defenses of RP Against Rising Rates We have previously discussed the role of diversifying return streams in defraying the impact of a rising rate environment, especially in an RP implementation that rebalances to reflect changing volatilities and relationships between asset classes. In a persistent environment of rising rates, it is intuitive that a successful strategy would respond by accounting for the associated increase in volatility of bonds and the potentially diversifying influence of commodities should the rise in nominal rates be accompanied by inflation. While responsiveness to these changing correlations and volatilities is helpful, we believe that the incorporation of momentum strategies as a component of risk parity investing is both generally and specifically compelling vis-à-vis the rising rates environments under consideration in this paper.
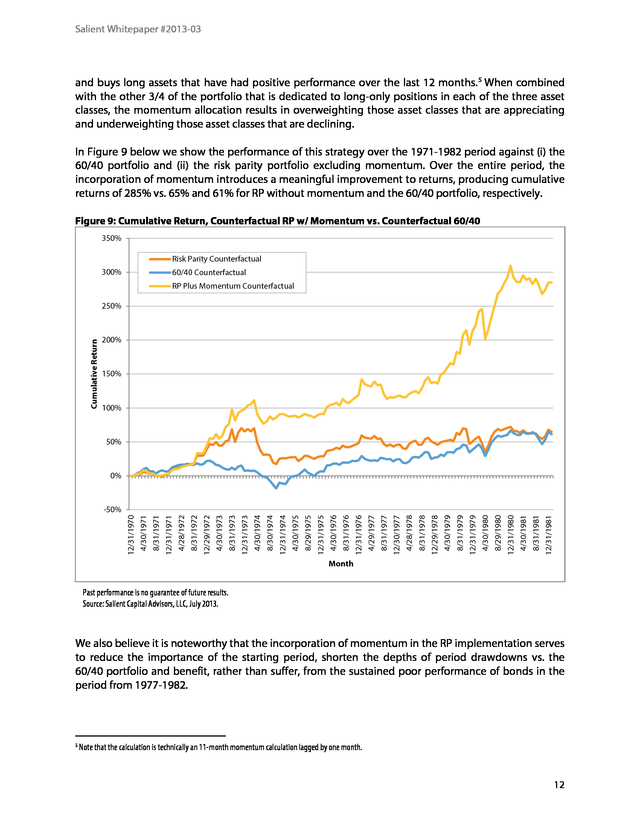
As noted in our piece, “A Primer on Momentum”, momentum strategies offer both a low correlation to long-only sleeves of the portfolio and positive expected returns during prolonged drawdowns in any particular asset (Croce, 2012). Since we are principally concerned with Figure 8: Actual Annual Bond Returns vs. establishing historical proxies for a scenario that Counterfactual Scenario exchanges a 30+ year decline in interest rates for Actual 10-Year Counterfactual a corresponding rise over a period of years, the Bond Returns 10-Year Bond Return Year appeal to adding a diversifying asset with 1971 14.44% 5.79% highest expected returns when a single asset experiences prolonged drawdowns is intuitive. 3.92% -2.45% 1972 Consider the annual return profile of bonds as a 1973 4.10% -1.33% standalone asset class in our counterfactual 1974 5.94% -3.24% scenario shown in Figure 8 to the right. 1975 3.92% -1.66% A cursory examination of the returns that would have been experienced by bonds had rates risen as they did in the 1970s from a base of 1.6% demonstrates consistent and sustained underperformance. Consider that in this scenario bonds would have produced a positive return in only three of these years, with sustained underperformance in each of 1977 through 1980. 1976 1977 1978 1979 1980 1981 18.01% -1.24% -0.57% 4.16% 3.97% 5.31% 13.61% -4.39% -7.05% -5.98% -10.91% 3.05% Source: Salient Capital Advisors, LLC, July 2013. Incorporating momentum into our existing risk parity framework for this paper is straightforward. Instead of allocating 1/3 of risk to each of commodities, bonds and equities, we allocate 1/4 of risk to each of those assets as well as a strategy that sells short assets that have had negative performance 11 . Salient Whitepaper #2013-03 and buys long assets that have had positive performance over the last 12 months. 5 When combined with the other 3/4 of the portfolio that is dedicated to long-only positions in each of the three asset classes, the momentum allocation results in overweighting those asset classes that are appreciating and underweighting those asset classes that are declining. In Figure 9 below we show the performance of this strategy over the 1971-1982 period against (i) the 60/40 portfolio and (ii) the risk parity portfolio excluding momentum. Over the entire period, the incorporation of momentum introduces a meaningful improvement to returns, producing cumulative returns of 285% vs. 65% and 61% for RP without momentum and the 60/40 portfolio, respectively. Figure 9: Cumulative Return, Counterfactual RP w/ Momentum vs.
Counterfactual 60/40 350% Risk Parity Counterfactual 300% 60/40 Counterfactual RP Plus Momentum Counterfactual Cumulative Return 250% 200% 150% 100% 50% 0% 8/31/1981 12/31/1981 4/30/1981 8/29/1980 12/31/1980 4/30/1980 8/31/1979 12/31/1979 4/30/1979 8/31/1978 12/29/1978 4/28/1978 8/31/1977 12/30/1977 4/29/1977 8/31/1976 12/31/1976 4/30/1976 8/29/1975 12/31/1975 4/30/1975 8/30/1974 12/31/1974 4/30/1974 8/31/1973 12/31/1973 4/30/1973 8/31/1972 12/29/1972 4/28/1972 8/31/1971 12/31/1971 4/30/1971 12/31/1970 -50% Month Past performance is no guarantee of future results. Source: Salient Capital Advisors, LLC, July 2013. We also believe it is noteworthy that the incorporation of momentum in the RP implementation serves to reduce the importance of the starting period, shorten the depths of period drawdowns vs. the 60/40 portfolio and benefit, rather than suffer, from the sustained poor performance of bonds in the period from 1977-1982. 5 Note that the calculation is technically an 11-month momentum calculation lagged by one month. 12 . Salient Whitepaper #2013-03 Conclusions There are entirely sensible reasons to have long-term concerns about bonds in light of current interest rate levels, and given the historical tendency of risk parity strategies to have large positions in bonds, the concern for RP in a rising rates regime is understandable. Evidence from the last rising rate environment indicates, however, that critics of RP potentially understate (i) the potentially diversifying influence of commodities in these periods, (ii) the responsiveness of risk parity strategies to changes in asset volatility and (iii) the dynamic incorporation of changing correlations in many RP implementations. We furthermore believe the evidence indicates that incorporating momentum strategies into risk parity produces results that are particularly valuable to a rising rates regime. 13 . Salient Whitepaper #2013-03 Appendix: Data and Methodologies All allocations are made a priori, without the benefit of asset returns that had not yet occurred. Data and Index Definitions “Equities” in this white paper refers to capitalization-weighted returns from the NYSE, Amex, and NASDAQ accessed from CRSP. “Bonds” in this analysis refers to 10-year U.S. Treasury Bond returns, as accessed from CRSP. “Commodities” in this analysis refers to returns of the Continuous Commodity Index as accessed via Bloomberg. The risk-free rate refers to the return on 3-month T-bills, as accessed via Bloomberg. Historical bond yields used in calculation of the counterfactual scenario were accessed from the Federal Reserve Bank of St. Louis F.R.E.D. database. Methodology for Creation of Risk Parity Portfolio Starting in January 1971 (using data from January 1969-December 1970), we calculate the covariance of the assets based on rolling 24-month observations and solve for portfolio weights that would lead to equal estimates of risk for each asset and estimated total portfolio volatility of 10%.
Risk contributions are re-calculated monthly, after which the portfolio is rebalanced. Methodology for Creation of Counterfactual Risk Parity Portfolio All data and portfolio construction methodologies are consistent with the creation of the standard risk parity portfolios. Counterfactual bond yields are generated by subtracting 4.64% from the historical yields from January 1971-December 1981. Counterfactual bond returns are then generated for on-therun bonds issued at par with coupons equal to the counterfactual yield.
Counterfactual price returns are calculated using changes in the counterfactual yield, while coupon returns accrue based on the level of counterfactual yield. Methodology for Incorporation of Momentum Momentum is calculated based on 11-month returns lagged by one month. Momentum is incorporated into Risk Parity portfolio as a new “asset class”, which receives ¼ of the portfolio’s risk budget. This portfolio is constructed in such a way that assets with positive momentum are long and assets with negative momentum are sold short. All data accumulated July 2013. 14 .
Salient Whitepaper #2013-03 Bibliography Asness, C. S., Moskowitz, T. J., & Pederson, L. H.
(2010). Value and Momentum Everywhere. AFA 2010 Meetings Papers. Asness, C., Frazzini, A., & Pederson, L.
(2012). Leverage Aversion and Risk Parity. Financial Analysts Journal, 47-59. Croce, R.
(2012). A Primer on Momentum. Houston: Salient Partners, L.P. Fama, E.
F., & French, K. R. (1992).
The Cross-Section of Expected Stock Returns. Journal of Finance, 427465. Gorton, G. B., Hayashi, F., & Rouwenhorst, K.
G. (2008). The Fundamentals of Commodity Futures Returns.
Yale School of Management Working Papers. Jegadeesh, N., & Titman, S. (1993). Returns to Buying Winners and Selling Losers: Implications for Stock Market Efficiency.
Journal of Finance, 65-91. Markowitz, H. (1952). Portfolio Selection.
Journal of Finance, 77-91. Partridge, L., & Croce, R. (2012). Risk Parity for the Long Run.
Houston: Salient Partners, L.P. Rouwenhorst, K. G. (1998).
International Momentum Strategies. Journal of Finance, 267-284. 15 .


