


Description
The House View
by Lee Partridge, CFA
Chief Investment Officer
February 8, 2016
Rebalancing to a New Normal
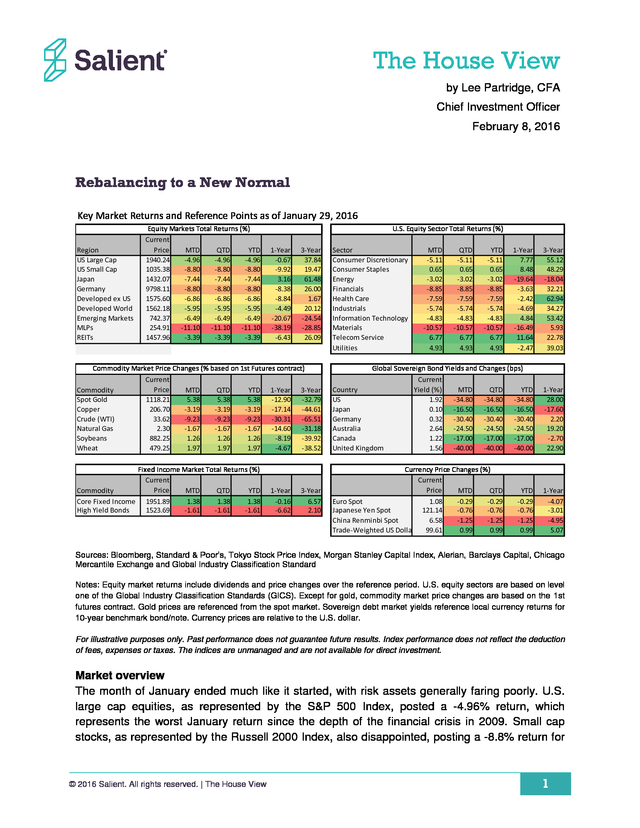
Key Market Returns and Reference Points as of January 29, 2016
Region
US Large Cap
US Small Cap
Japan
Germany
Developed ex US
Developed World
Emerging Markets
MLPs
REITs
Equity Markets Total Returns (%)
Current
Price
MTD
QTD
YTD
1940.24
-4.96
-4.96
-4.96
1035.38
-8.80
-8.80
-8.80
1432.07
-7.44
-7.44
-7.44
9798.11
-8.80
-8.80
-8.80
1575.60
-6.86
-6.86
-6.86
1562.18
-5.95
-5.95
-5.95
742.37
-6.49
-6.49
-6.49
254.91 -11.10 -11.10 -11.10
1457.96
-3.39
-3.39
-3.39
U.S. Equity Sector Total Returns (%)
1-Year
-0.67
-9.92
3.16
-8.38
-8.84
-4.49
-20.67
-38.19
-6.43
1-Year
7.77
8.48
-19.64
-3.63
-2.42
-4.69
4.84
-16.49
11.64
-2.47
3-Year
55.12
48.29
-18.04
32.21
62.94
34.27
53.42
5.93
22.78
39.03
Commodity Market Price Changes (% based on 1st Futures contract)
Current
Price
Commodity
MTD
QTD
YTD 1-Year 3-Year
Spot Gold
1118.21
5.38
5.38
5.38 -12.90 -32.79
Copper
206.70
-3.19
-3.19
-3.19 -17.14 -44.61
Crude (WTI)
33.62
-9.23
-9.23
-9.23 -30.31 -65.51
Natural Gas
2.30
-1.67
-1.67
-1.67 -14.60 -31.18
Soybeans
882.25
1.26
1.26
1.26
-8.19 -39.92
Wheat
479.25
1.97
1.97
1.97
-4.67 -38.52
Global Sovereign Bond Yields and Changes (bps)
Current
Country
Yield (%)
MTD
QTD
YTD
US
1.92 -34.80 -34.80 -34.80
Japan
0.10 -16.50 -16.50 -16.50
Germany
0.32 -30.40 -30.40 -30.40
Australia
2.64 -24.50 -24.50 -24.50
Canada
1.22 -17.00 -17.00 -17.00
United Kingdom
1.56 -40.00 -40.00 -40.00
1-Year
28.00
-17.60
2.20
19.20
-2.70
22.90
Fixed Income Market Total Returns (%)
Current
Price
Commodity
MTD
QTD
YTD
Core Fixed Income 1951.89
1.38
1.38
1.38
High Yield Bonds
1523.69
-1.61
-1.61
-1.61
Currency Price Changes (%)
Current
Price
MTD
QTD
Euro Spot
1.08
-0.29
-0.29
Japanese Yen Spot
121.14
-0.76
-0.76
China Renminbi Spot
6.58
-1.25
-1.25
Trade-Weighted US Dollar 99.61
0.99
0.99
1-Year
-4.07
-3.01
-4.95
5.07
1-Year
-0.16
-6.62
3-Year
37.84
19.47
61.48
26.00
1.67
20.12
-24.54
-28.85
26.09
3-Year
6.57
2.10
Sector
Consumer Discretionary
Consumer Staples
Energy
Financials
Health Care
Industrials
Information Technology
Materials
Telecom Service
Utilities
MTD
-5.11
0.65
-3.02
-8.85
-7.59
-5.74
-4.83
-10.57
6.77
4.93
QTD
-5.11
0.65
-3.02
-8.85
-7.59
-5.74
-4.83
-10.57
6.77
4.93
YTD
-5.11
0.65
-3.02
-8.85
-7.59
-5.74
-4.83
-10.57
6.77
4.93
YTD
-0.29
-0.76
-1.25
0.99
Sources: Bloomberg, Standard & Poor’s, Tokyo Stock Price Index, Morgan Stanley Capital Index, Alerian, Barclays Capital, Chicago
Mercantile Exchange and Global Industry Classification Standard
Notes: Equity market returns include dividends and price changes over the reference period. U.S. equity sectors are based on level
one of the Global Industry Classification Standards (GICS).
Except for gold, commodity market price changes are based on the 1st futures contract. Gold prices are referenced from the spot market. Sovereign debt market yields reference local currency returns for 10-year benchmark bond/note.
Currency prices are relative to the U.S. dollar. For illustrative purposes only. Past performance does not guarantee future results.
Index performance does not reflect the deduction of fees, expenses or taxes. The indices are unmanaged and are not available for direct investment. Market overview The month of January ended much like it started, with risk assets generally faring poorly. U.S. large cap equities, as represented by the S&P 500 Index, posted a -4.96% return, which represents the worst January return since the depth of the financial crisis in 2009.
Small cap stocks, as represented by the Russell 2000 Index, also disappointed, posting a -8.8% return for © 2016 Salient. All rights reserved. | The House View 1 .
the month of January. Master limited partnerships (MLPs) as well as materials and energy stocks all posted negative returns of -11.1%, -10.57% and -3.02%, respectively. Fixed income markets were bolstered by the Bank of Japan’s (BOJ) decision to accelerate its monetary stimulus measures on January 27, 2016 which resulted in negative interest rates on Japanese government bonds out to seven-year maturities. The yield on the 10-year U.S. Treasury fell 35 basis points from 2.27% at the beginning of the month to 1.92% at month-end. Despite this decline in U.S. Treasury yields, the widening spreads on high yield bonds, as measured by the Barclays U.S.
Corporate High-Yield Bond Index, resulted in a -4.61% loss for the month of January, which extended the index’s losses from the prior year. Commodity markets also experienced a general decline with crude oil down -9.23% in January. Most other energies and industrial metals were similarly down for the month. Precious metal and agricultural commodity prices were mixed, with gold up 5.38% for the month, which represented the largest one-month gain for gold since January 2015. Taken together, we think the weaknesses across equity, credit and commodity markets paint a troubling picture of lower growth expectations and deflationary forces. The measures taken by the BOJ to move toward negative interest rates open a new chapter in the current economic experiment of expansive monetary policy and unprecedented levels of global debt.
As a result, we expect to see heightened volatility with muted returns across markets. Thought for the month As we contemplate the volatility of the current market and how investors can respond, we believe the basic tenets of diversification represent a key component of successful portfolio management. In our last two monthly notes, we discussed key elements of diversification: the breadth of the opportunity set and proper allocations to each component of the portfolio. Now, we will focus on the last element of diversification: rebalancing.
This technique allows investors to maintain their intended level of diversification after large market moves. Most rebalancing strategies are designed to reduce drawdowns and enhance portfolio returns. Rebalancing strategies target mean-reverting volatile markets by systematically selling assets at their recent peaks and buying assets at local troughs.
Most institutional investors have formalized rebalancing policies that force them to adhere to their stated risk and return objectives. Many individual investors lack the same level of formality with respect to rebalancing that their institutional counterparts maintain. While systematic rebalancing programs represent an important tool that allows investors to maintain the diversification of their portfolios, the question of which rebalancing approach to use can present a vexing problem. As a general rule, rebalancing strategies fall into two broad categories: calendar-based strategies and threshold-based strategies.
Calendar-based strategies move a target portfolio toward its strategic asset allocation weights at regular calendar intervals (i.e., monthly, quarterly or annually). Threshold-based strategies continually evaluate how far the portfolio has deviated from its strategic asset allocation in percentage terms. If any asset class strays from its strategic target by more than the stated threshold amount (e.g., 5%, 10%, 15%, etc.) a rebalancing event is triggered and the portfolio is rebalanced to its strategic allocation weights (note that more sophisticated rebalancing © 2016 Salient.
All rights reserved. | The House View 2 . strategies may only move a portion of the portfolio toward its strategic weights or may only move incrementally toward the strategic weights). Consider an investor who has $1 million with a 50% strategic allocation to stocks and a 50% strategic allocation to bonds. Following a month in which stocks are up 10% and bonds are down 5%, the portfolio would have increased 2.5% in value to $1,025,000. In addition, the portfolio’s asset allocation is no longer 50% stocks and 50% bonds. The stock component of the portfolio appreciated from $500,000 to $550,000 while the bond allocation of the portfolio decreased from $500,000 to $475,000, making the new allocation to stocks 53.7% and the new allocation to bonds 46.3% (of the new $1,025,000 portfolio value).
Over time, these differences versus the intended 50/50 mix become more pronounced. In order to maintain the intended portfolio weights during the next performance period, the investor would have to sell $37,500 of stock and purchase $37,500 of bonds so that exactly $512,500 is invested in stocks and $512,500 is invested in bonds. The question facing the investor in our example is when to make those adjustments. For institutional investors, a monthly rebalancing cycle typically becomes the default option as benchmark returns are often calculated on a monthly basis using the weights of the strategic asset allocation.
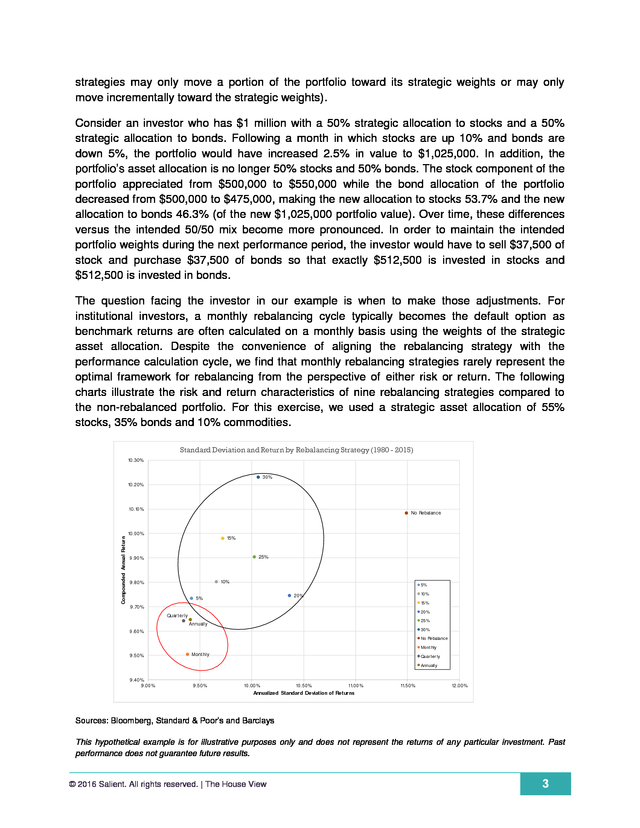
Despite the convenience of aligning the rebalancing strategy with the performance calculation cycle, we find that monthly rebalancing strategies rarely represent the optimal framework for rebalancing from the perspective of either risk or return. The following charts illustrate the risk and return characteristics of nine rebalancing strategies compared to the non-rebalanced portfolio. For this exercise, we used a strategic asset allocation of 55% stocks, 35% bonds and 10% commodities. Standard Deviation and Return by Rebalancing Strategy (1980 - 2015) 10.30% 30% 10.20% Compounded Annual Return 10.1 % 0 No Rebalance 10.00 % 15% 25% 9 .90 % 10% 9 .80 % 5% 10% 20% 5% 15% 9 .70 % 20% Quart erly 25% Annually 30% 9 .60 % No Rebalance Mont hly 9 .50 % Mont hly Quar ter ly Annually 9 .40 % 9 .00 % 9 .50 % 10.00 % 10.50% 11 % .00 11 % .50 12.0 0% Annualized Standard Deviation of Returns Sources: Bloomberg, Standard & Poor’s and Barclays This hypothetical example is for illustrative purposes only and does not represent the returns of any particular investment.
Past performance does not guarantee future results. © 2016 Salient. All rights reserved. | The House View 3 .
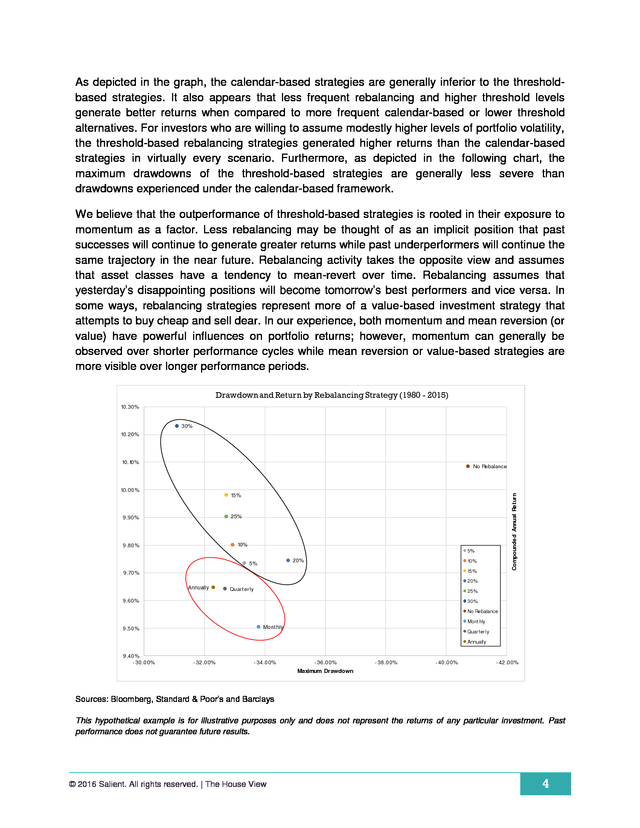
As depicted in the graph, the calendar-based strategies are generally inferior to the thresholdbased strategies. It also appears that less frequent rebalancing and higher threshold levels generate better returns when compared to more frequent calendar-based or lower threshold alternatives. For investors who are willing to assume modestly higher levels of portfolio volatility, the threshold-based rebalancing strategies generated higher returns than the calendar-based strategies in virtually every scenario. Furthermore, as depicted in the following chart, the maximum drawdowns of the threshold-based strategies are generally less severe than drawdowns experienced under the calendar-based framework. We believe that the outperformance of threshold-based strategies is rooted in their exposure to momentum as a factor.
Less rebalancing may be thought of as an implicit position that past successes will continue to generate greater returns while past underperformers will continue the same trajectory in the near future. Rebalancing activity takes the opposite view and assumes that asset classes have a tendency to mean-revert over time. Rebalancing assumes that yesterday’s disappointing positions will become tomorrow’s best performers and vice versa.
In some ways, rebalancing strategies represent more of a value-based investment strategy that attempts to buy cheap and sell dear. In our experience, both momentum and mean reversion (or value) have powerful influences on portfolio returns; however, momentum can generally be observed over shorter performance cycles while mean reversion or value-based strategies are more visible over longer performance periods. Drawdown and Return by Rebalancing Strategy (1980 - 2015) 10.30% 30% 10.20% 10.1 % 0 No Rebalance Compounded Annual Return 10.00 % 15% 25% 9 .90 % 10% 9 .80 % 5% 20% 5% 10% 15% 9 .70 % 20% Annually Quart erly 25% 9 .60 % 30% No Rebalance Mont hly Mont hly 9 .50 % Quar ter ly Annually 9 .40 % - 30 .0 0% - 32 .0 0% - 34 .0 0% - 36 .0 0% - 38 .0 0% - 40 .0 0% - 42 .0 0% Maximum Drawdown Sources: Bloomberg, Standard & Poor’s and Barclays This hypothetical example is for illustrative purposes only and does not represent the returns of any particular investment. Past performance does not guarantee future results. © 2016 Salient.
All rights reserved. | The House View 4 . As we put these pieces together, we find that a higher threshold-based rebalancing program takes advantage of both momentum and mean reversion by allowing asset classes to run unconstrained in the short run until the relative weights of the portfolio approach extreme levels of imbalance and are forced back to strategic weights. One might think of this as an “antibubble” strategy that attempts to avoid large drawdowns that might follow better-performing asset classes. In our opinion, and based on the simulations applied to the portfolio described above, a rebalance trigger that is enacted when any single asset class strays from its strategic allocation weight by more than 15% of the total portfolio value generates optimal performance. Conclusion Many investors often fail to rebalance their portfolios with the sense of rigor that they place on their primary asset allocation decisions. Rebalancing aims to help investors diversify across asset classes following periods of significant outperformance or underperformance.
We find that rebalancing strategies are generally threshold rather than calendar-based. Furthermore, higher threshold-based strategies tend to better balance the tension between shorter-term momentum and longer-term mean reversion than lower threshold-based strategies or calendar-based strategies. Following the past six years of above-average equity returns, we believe investors would do well to examine the level of diversification of their portfolios and their rebalancing strategies. © 2016 Salient.
All rights reserved. | The House View 5 . DISCLOSURES Investing involves risk, including possible loss of principal. The value of any financial instruments or markets mentioned herein can fall as well as rise. Past performance does not guarantee future results. This material is distributed for informational purposes only and should not be considered as investment advice, a recommendation of any particular security, strategy or investment product, or as an offer or solicitation with respect to the purchase or sale of any investment. Statistics, prices, estimates, forward-looking statements, and other information contained herein have been obtained from sources believed to be reliable, but no guarantee is given as to their accuracy or completeness.
All expressions of opinion are subject to change without notice. Neither diversification nor asset allocation assures profit or protects against risk. “Alerian MLP Index”, “Alerian MLP Total Return Index”, “AMZ” and “AMZX” are trademarks of Alerian and their use is granted under a license from Alerian. Lee Partridge has earned the right to use the Chartered Financial Analyst designation (CFA). CFA Institute marks are trademarks owned by CFA Institute. One cannot invest directly in an index. DEFINITIONS Alerian MLP Index (AMZ) is a composite of the 50 most prominent energy MLPs that provides investors with a comprehensive benchmark for this emerging asset class. Barclays Global High Yield Index is a multi-currency flagship measure of the global high yield debt market. Barclays Intermediate Government/Credit Bond Index tracks the performance of intermediate term U.S. government and corporate bonds. Barclays U.S. Corporate High Yield Index represents the universe of fixed-rate, non-investment grade debt. Bloomberg Commodity Index is a broadly diversified index composed of exchange-traded futures contracts on physical commodities. Chicago Mercantile Exchange is the world's second-largest exchange for futures and options on futures and the largest exchange in the U.S. Chicago Board Options Exchange Volatility Index reflects a market estimate of future volatility, based on the weighted average of the implied volatilities for a wide range of strikes.
1st & 2nd month expirations are used until 8 days from expiration, then the 2nd and 3rd are used. Global Industry Classification Standard (GICS) is a standardized classification system for equities developed jointly by Morgan Stanley Capital International (MSCI) and Standard & Poor's. The GICS methodology is used by the MSCI indexes, which include domestic and international stocks, as well as by a large portion of the professional investment management community. Mean reversion is a theory that suggests that prices and returns eventually move back towards the mean or average. This mean or average can be the historical average of the price or return or another relevant average such as the growth in the economy or the average return of an industry. MSCI Emerging Markets (EM) Index is an index created by Morgan Stanley Capital International (MSCI) that is designed to measure equity market performance in global emerging markets. Russell 2000 Index measures the performance of the small-cap segment of the U.S.
equity universe. It includes approximately 2000 of the smallest securities based on a combination of their market cap and current index membership. The Russell 2000 is constructed to provide a comprehensive and unbiased small-cap barometer and is completely reconstituted annually to ensure larger stocks do not distort the performance and characteristics of the true small-cap opportunity set. © 2016 Salient.
All rights reserved. | The House View 6 . S&P 500 Index is an unmanaged, capitalization weighted index comprising publicly traded common stocks issued by companies in various industries. The S&P 500 Index is widely recognized as the leading broad-based measurement of changes in conditions of the U.S. equities market. S&P GSCI Commodity Index is a composite index of commodity sector returns representing an unleveraged, longonly investment in commodity futures that is broadly diversified across the spectrum of commodities and serves as a measure of commodity performance over time. Standard Deviation is a measure of the dispersion of a set of data from its mean. The more spread apart the data, the higher the deviation.
Standard deviation is calculated as the square root of variance. Standard deviation is also known as historical volatility and is used by investors as a gauge for the amount of expected volatility. Tokyo Stock Price Index is an index that measures stock prices on the Tokyo Stock Exchange (TSE). Trough is the stage of the economy's business cycle that marks the end of a period of declining business activity and the transition to expansion. © 2016 Salient. All rights reserved.
| The House View 7 .
Except for gold, commodity market price changes are based on the 1st futures contract. Gold prices are referenced from the spot market. Sovereign debt market yields reference local currency returns for 10-year benchmark bond/note.
Currency prices are relative to the U.S. dollar. For illustrative purposes only. Past performance does not guarantee future results.
Index performance does not reflect the deduction of fees, expenses or taxes. The indices are unmanaged and are not available for direct investment. Market overview The month of January ended much like it started, with risk assets generally faring poorly. U.S. large cap equities, as represented by the S&P 500 Index, posted a -4.96% return, which represents the worst January return since the depth of the financial crisis in 2009.
Small cap stocks, as represented by the Russell 2000 Index, also disappointed, posting a -8.8% return for © 2016 Salient. All rights reserved. | The House View 1 .
the month of January. Master limited partnerships (MLPs) as well as materials and energy stocks all posted negative returns of -11.1%, -10.57% and -3.02%, respectively. Fixed income markets were bolstered by the Bank of Japan’s (BOJ) decision to accelerate its monetary stimulus measures on January 27, 2016 which resulted in negative interest rates on Japanese government bonds out to seven-year maturities. The yield on the 10-year U.S. Treasury fell 35 basis points from 2.27% at the beginning of the month to 1.92% at month-end. Despite this decline in U.S. Treasury yields, the widening spreads on high yield bonds, as measured by the Barclays U.S.
Corporate High-Yield Bond Index, resulted in a -4.61% loss for the month of January, which extended the index’s losses from the prior year. Commodity markets also experienced a general decline with crude oil down -9.23% in January. Most other energies and industrial metals were similarly down for the month. Precious metal and agricultural commodity prices were mixed, with gold up 5.38% for the month, which represented the largest one-month gain for gold since January 2015. Taken together, we think the weaknesses across equity, credit and commodity markets paint a troubling picture of lower growth expectations and deflationary forces. The measures taken by the BOJ to move toward negative interest rates open a new chapter in the current economic experiment of expansive monetary policy and unprecedented levels of global debt.
As a result, we expect to see heightened volatility with muted returns across markets. Thought for the month As we contemplate the volatility of the current market and how investors can respond, we believe the basic tenets of diversification represent a key component of successful portfolio management. In our last two monthly notes, we discussed key elements of diversification: the breadth of the opportunity set and proper allocations to each component of the portfolio. Now, we will focus on the last element of diversification: rebalancing.
This technique allows investors to maintain their intended level of diversification after large market moves. Most rebalancing strategies are designed to reduce drawdowns and enhance portfolio returns. Rebalancing strategies target mean-reverting volatile markets by systematically selling assets at their recent peaks and buying assets at local troughs.
Most institutional investors have formalized rebalancing policies that force them to adhere to their stated risk and return objectives. Many individual investors lack the same level of formality with respect to rebalancing that their institutional counterparts maintain. While systematic rebalancing programs represent an important tool that allows investors to maintain the diversification of their portfolios, the question of which rebalancing approach to use can present a vexing problem. As a general rule, rebalancing strategies fall into two broad categories: calendar-based strategies and threshold-based strategies.
Calendar-based strategies move a target portfolio toward its strategic asset allocation weights at regular calendar intervals (i.e., monthly, quarterly or annually). Threshold-based strategies continually evaluate how far the portfolio has deviated from its strategic asset allocation in percentage terms. If any asset class strays from its strategic target by more than the stated threshold amount (e.g., 5%, 10%, 15%, etc.) a rebalancing event is triggered and the portfolio is rebalanced to its strategic allocation weights (note that more sophisticated rebalancing © 2016 Salient.
All rights reserved. | The House View 2 . strategies may only move a portion of the portfolio toward its strategic weights or may only move incrementally toward the strategic weights). Consider an investor who has $1 million with a 50% strategic allocation to stocks and a 50% strategic allocation to bonds. Following a month in which stocks are up 10% and bonds are down 5%, the portfolio would have increased 2.5% in value to $1,025,000. In addition, the portfolio’s asset allocation is no longer 50% stocks and 50% bonds. The stock component of the portfolio appreciated from $500,000 to $550,000 while the bond allocation of the portfolio decreased from $500,000 to $475,000, making the new allocation to stocks 53.7% and the new allocation to bonds 46.3% (of the new $1,025,000 portfolio value).
Over time, these differences versus the intended 50/50 mix become more pronounced. In order to maintain the intended portfolio weights during the next performance period, the investor would have to sell $37,500 of stock and purchase $37,500 of bonds so that exactly $512,500 is invested in stocks and $512,500 is invested in bonds. The question facing the investor in our example is when to make those adjustments. For institutional investors, a monthly rebalancing cycle typically becomes the default option as benchmark returns are often calculated on a monthly basis using the weights of the strategic asset allocation.
Despite the convenience of aligning the rebalancing strategy with the performance calculation cycle, we find that monthly rebalancing strategies rarely represent the optimal framework for rebalancing from the perspective of either risk or return. The following charts illustrate the risk and return characteristics of nine rebalancing strategies compared to the non-rebalanced portfolio. For this exercise, we used a strategic asset allocation of 55% stocks, 35% bonds and 10% commodities. Standard Deviation and Return by Rebalancing Strategy (1980 - 2015) 10.30% 30% 10.20% Compounded Annual Return 10.1 % 0 No Rebalance 10.00 % 15% 25% 9 .90 % 10% 9 .80 % 5% 10% 20% 5% 15% 9 .70 % 20% Quart erly 25% Annually 30% 9 .60 % No Rebalance Mont hly 9 .50 % Mont hly Quar ter ly Annually 9 .40 % 9 .00 % 9 .50 % 10.00 % 10.50% 11 % .00 11 % .50 12.0 0% Annualized Standard Deviation of Returns Sources: Bloomberg, Standard & Poor’s and Barclays This hypothetical example is for illustrative purposes only and does not represent the returns of any particular investment.
Past performance does not guarantee future results. © 2016 Salient. All rights reserved. | The House View 3 .
As depicted in the graph, the calendar-based strategies are generally inferior to the thresholdbased strategies. It also appears that less frequent rebalancing and higher threshold levels generate better returns when compared to more frequent calendar-based or lower threshold alternatives. For investors who are willing to assume modestly higher levels of portfolio volatility, the threshold-based rebalancing strategies generated higher returns than the calendar-based strategies in virtually every scenario. Furthermore, as depicted in the following chart, the maximum drawdowns of the threshold-based strategies are generally less severe than drawdowns experienced under the calendar-based framework. We believe that the outperformance of threshold-based strategies is rooted in their exposure to momentum as a factor.
Less rebalancing may be thought of as an implicit position that past successes will continue to generate greater returns while past underperformers will continue the same trajectory in the near future. Rebalancing activity takes the opposite view and assumes that asset classes have a tendency to mean-revert over time. Rebalancing assumes that yesterday’s disappointing positions will become tomorrow’s best performers and vice versa.
In some ways, rebalancing strategies represent more of a value-based investment strategy that attempts to buy cheap and sell dear. In our experience, both momentum and mean reversion (or value) have powerful influences on portfolio returns; however, momentum can generally be observed over shorter performance cycles while mean reversion or value-based strategies are more visible over longer performance periods. Drawdown and Return by Rebalancing Strategy (1980 - 2015) 10.30% 30% 10.20% 10.1 % 0 No Rebalance Compounded Annual Return 10.00 % 15% 25% 9 .90 % 10% 9 .80 % 5% 20% 5% 10% 15% 9 .70 % 20% Annually Quart erly 25% 9 .60 % 30% No Rebalance Mont hly Mont hly 9 .50 % Quar ter ly Annually 9 .40 % - 30 .0 0% - 32 .0 0% - 34 .0 0% - 36 .0 0% - 38 .0 0% - 40 .0 0% - 42 .0 0% Maximum Drawdown Sources: Bloomberg, Standard & Poor’s and Barclays This hypothetical example is for illustrative purposes only and does not represent the returns of any particular investment. Past performance does not guarantee future results. © 2016 Salient.
All rights reserved. | The House View 4 . As we put these pieces together, we find that a higher threshold-based rebalancing program takes advantage of both momentum and mean reversion by allowing asset classes to run unconstrained in the short run until the relative weights of the portfolio approach extreme levels of imbalance and are forced back to strategic weights. One might think of this as an “antibubble” strategy that attempts to avoid large drawdowns that might follow better-performing asset classes. In our opinion, and based on the simulations applied to the portfolio described above, a rebalance trigger that is enacted when any single asset class strays from its strategic allocation weight by more than 15% of the total portfolio value generates optimal performance. Conclusion Many investors often fail to rebalance their portfolios with the sense of rigor that they place on their primary asset allocation decisions. Rebalancing aims to help investors diversify across asset classes following periods of significant outperformance or underperformance.
We find that rebalancing strategies are generally threshold rather than calendar-based. Furthermore, higher threshold-based strategies tend to better balance the tension between shorter-term momentum and longer-term mean reversion than lower threshold-based strategies or calendar-based strategies. Following the past six years of above-average equity returns, we believe investors would do well to examine the level of diversification of their portfolios and their rebalancing strategies. © 2016 Salient.
All rights reserved. | The House View 5 . DISCLOSURES Investing involves risk, including possible loss of principal. The value of any financial instruments or markets mentioned herein can fall as well as rise. Past performance does not guarantee future results. This material is distributed for informational purposes only and should not be considered as investment advice, a recommendation of any particular security, strategy or investment product, or as an offer or solicitation with respect to the purchase or sale of any investment. Statistics, prices, estimates, forward-looking statements, and other information contained herein have been obtained from sources believed to be reliable, but no guarantee is given as to their accuracy or completeness.
All expressions of opinion are subject to change without notice. Neither diversification nor asset allocation assures profit or protects against risk. “Alerian MLP Index”, “Alerian MLP Total Return Index”, “AMZ” and “AMZX” are trademarks of Alerian and their use is granted under a license from Alerian. Lee Partridge has earned the right to use the Chartered Financial Analyst designation (CFA). CFA Institute marks are trademarks owned by CFA Institute. One cannot invest directly in an index. DEFINITIONS Alerian MLP Index (AMZ) is a composite of the 50 most prominent energy MLPs that provides investors with a comprehensive benchmark for this emerging asset class. Barclays Global High Yield Index is a multi-currency flagship measure of the global high yield debt market. Barclays Intermediate Government/Credit Bond Index tracks the performance of intermediate term U.S. government and corporate bonds. Barclays U.S. Corporate High Yield Index represents the universe of fixed-rate, non-investment grade debt. Bloomberg Commodity Index is a broadly diversified index composed of exchange-traded futures contracts on physical commodities. Chicago Mercantile Exchange is the world's second-largest exchange for futures and options on futures and the largest exchange in the U.S. Chicago Board Options Exchange Volatility Index reflects a market estimate of future volatility, based on the weighted average of the implied volatilities for a wide range of strikes.
1st & 2nd month expirations are used until 8 days from expiration, then the 2nd and 3rd are used. Global Industry Classification Standard (GICS) is a standardized classification system for equities developed jointly by Morgan Stanley Capital International (MSCI) and Standard & Poor's. The GICS methodology is used by the MSCI indexes, which include domestic and international stocks, as well as by a large portion of the professional investment management community. Mean reversion is a theory that suggests that prices and returns eventually move back towards the mean or average. This mean or average can be the historical average of the price or return or another relevant average such as the growth in the economy or the average return of an industry. MSCI Emerging Markets (EM) Index is an index created by Morgan Stanley Capital International (MSCI) that is designed to measure equity market performance in global emerging markets. Russell 2000 Index measures the performance of the small-cap segment of the U.S.
equity universe. It includes approximately 2000 of the smallest securities based on a combination of their market cap and current index membership. The Russell 2000 is constructed to provide a comprehensive and unbiased small-cap barometer and is completely reconstituted annually to ensure larger stocks do not distort the performance and characteristics of the true small-cap opportunity set. © 2016 Salient.
All rights reserved. | The House View 6 . S&P 500 Index is an unmanaged, capitalization weighted index comprising publicly traded common stocks issued by companies in various industries. The S&P 500 Index is widely recognized as the leading broad-based measurement of changes in conditions of the U.S. equities market. S&P GSCI Commodity Index is a composite index of commodity sector returns representing an unleveraged, longonly investment in commodity futures that is broadly diversified across the spectrum of commodities and serves as a measure of commodity performance over time. Standard Deviation is a measure of the dispersion of a set of data from its mean. The more spread apart the data, the higher the deviation.
Standard deviation is calculated as the square root of variance. Standard deviation is also known as historical volatility and is used by investors as a gauge for the amount of expected volatility. Tokyo Stock Price Index is an index that measures stock prices on the Tokyo Stock Exchange (TSE). Trough is the stage of the economy's business cycle that marks the end of a period of declining business activity and the transition to expansion. © 2016 Salient. All rights reserved.
| The House View 7 .


