


Description
The House View
by Lee Partridge,
Chief Investment Officer
January 5, 2016
“Preparing for the Road Ahead”
Key Market Returns and Reference Points as of December 31, 2015
Region
U.S. Large Cap
U.S. Small Cap
Japan
Germany
Developed ex-U.S.
Developed World
Emerging Markets
MLPs
REITs
Equity Markets Total
Current
Price
MTD
2043.94
-1.59
1135.89
-5.02
1543.39
-1.97
10860.14
-5.62
1693.06
-1.77
1662.79
-1.72
794.14
-2.37
289.76
-3.57
1509.17
1.34
U.S. Equity Sector Total Returns (%)
Returns (%)
QTD
7.03
3.59
9.78
11.21
4.01
5.64
0.52
-2.77
7.74
YTD
1.37
-4.41
12.06
9.56
-2.44
-0.25
-14.83
-32.59
2.82
1-Year
1.37
-4.41
12.06
9.56
-2.44
-0.25
-14.83
-32.59
2.82
1-Year
10.11
6.60
-21.12
-1.56
6.89
-2.56
5.92
-8.38
3.40
-4.84
3-Year
72.79
55.94
-9.05
53.72
89.52
50.48
63.39
23.03
18.70
38.95
Commodity Market Price Changes (% based on 1st Futures contract)
Current
Price
MTD
QTD
YTD 1-Year 3-Year
Commodity
Spot Gold
1061.10
-0.34
-4.84
-10.41
-10.41
-36.66
Copper
213.50
4.43
-8.80
-24.44
-24.44
-41.55
Crude (WTI)
37.04
-11.07
-17.85
-30.47
-30.47
-59.66
Natural Gas
2.34
4.56
-7.41
-19.11
-19.11
-30.26
Soybeans
871.25
-1.11
-2.33
-14.52
-14.52
-38.59
Wheat
470.00
2.17
-8.34
-20.31
-20.31
-39.59
Global Sovereign Bond Yields and Changes (bps)
Current
Yield (%)
Country
MTD
QTD
YTD
U.S.
2.27
6.30
23.20
9.80
Japan
0.26
-4.20
-9.10
-6.20
Germany
0.63
15.60
4.20
9.00
Australia
2.88
2.10
27.50
14.10
Canada
1.39
-17.50
-3.80
-39.40
United Kingdom
1.96
13.50
19.80
20.40
1-Year
9.80
-6.20
9.00
14.10
-39.40
20.40
Fixed Income Market Total Returns (%)
Current
Price
MTD
QTD
YTD
Commodity
Core Fixed Income
1925.40
-0.32
-0.57
0.55
High Yield Bonds
1548.58
-2.52
-2.06
-4.47
Currency Price Changes (%)
Current
Price
MTD
Euro Spot
1.09
2.81
Japan Yen Spot
120.22
2.40
China Renminbi Spot
6.49
-1.47
Trade-Weighted U.S.
Dollar 98.63 -1.54 1-Year -10.22 -0.37 -4.44 9.26 1-Year 0.55 -4.47 3-Year 52.55 39.19 90.79 41.13 14.56 34.27 -18.39 -9.86 35.20 3-Year 4.39 5.16 Sector Consumer Discretionary Consumer Staples Energy Financials Healthcare Industrials Information Technology Materials Telecom Service Utilities MTD -2.78 2.86 -9.87 -2.16 1.78 -2.03 -2.29 -4.16 1.75 2.17 QTD 5.79 7.64 0.20 5.92 9.22 7.97 9.17 9.69 7.61 1.07 YTD 10.11 6.60 -21.12 -1.56 6.89 -2.56 5.92 -8.38 3.40 -4.84 QTD -2.82 -0.28 -2.12 2.37 YTD -10.22 -0.37 -4.44 9.26 Sources: Bloomberg, Standard & Poor’s, Tokyo Stock Price Index, Morgan Stanley Capital Index, Alerian, Barclays Capital, Chicago Mercantile Exchange and Global Industry Classification Standard Notes: Equity market returns include dividends and price changes over the reference period. U.S. equity sectors are based on level one of the Global Industry Classification Standards (GICS).
Except for gold, commodity market price changes are based on the 1st futures contract. Gold prices are referenced from the spot market. Sovereign debt market yields reference local currency returns for 10-year benchmark bond/note.
Currency prices are relative to the U.S. dollar. For illustrative purposes only. Past performance does not guarantee future results.
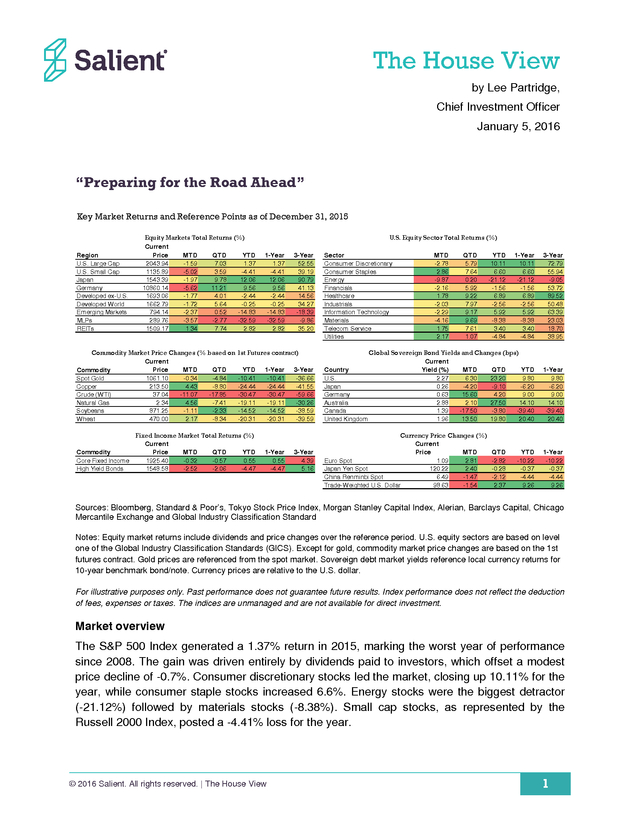
Index performance does not reflect the deduction of fees, expenses or taxes. The indices are unmanaged and are not available for direct investment. Market overview The S&P 500 Index generated a 1.37% return in 2015, marking the worst year of performance since 2008. The gain was driven entirely by dividends paid to investors, which offset a modest price decline of -0.7%.
Consumer discretionary stocks led the market, closing up 10.11% for the year, while consumer staple stocks increased 6.6%. Energy stocks were the biggest detractor (-21.12%) followed by materials stocks (-8.38%). Small cap stocks, as represented by the Russell 2000 Index, posted a -4.41% loss for the year. © 2016 Salient.
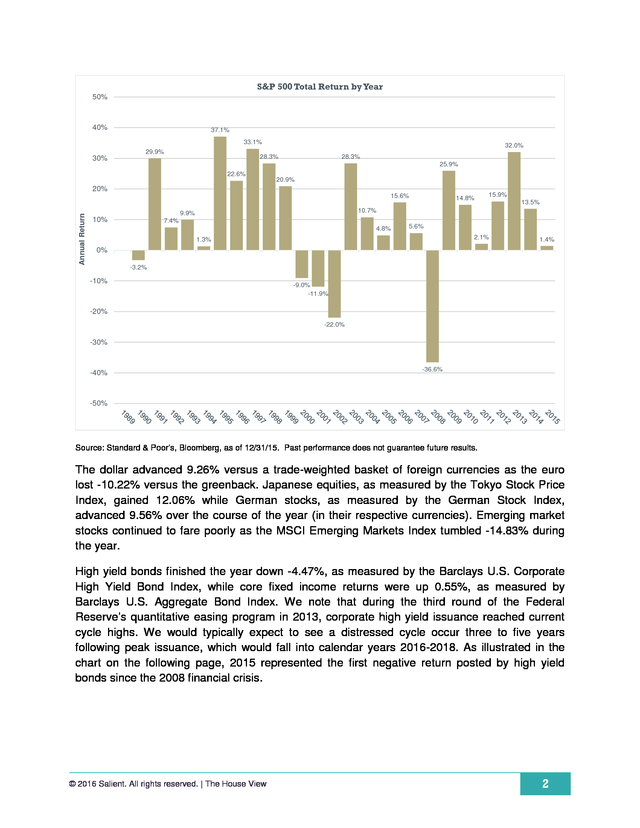
All rights reserved. | The House View 1 . S&P 500 Total Return by Year 50% 40% 37.1% 33.1% 29.9% 32.0% 28.3% 28.3% 30% 25.9% 22.6% 20.9% 20% Annual Return 15.6% 9.9% 10% 14.8% 15.9% 13.5% 10.7% 7.4% 4.8% 5.6% 2.1% 1.3% 1.4% 0% -3.2% -10% -9.0% -11.9% -20% -22.0% -30% -40% -36.6% -50% Source: Standard & Poor’s, Bloomberg, as of 12/31/15. Past performance does not guarantee future results. The dollar advanced 9.26% versus a trade-weighted basket of foreign currencies as the euro lost -10.22% versus the greenback. Japanese equities, as measured by the Tokyo Stock Price Index, gained 12.06% while German stocks, as measured by the German Stock Index, advanced 9.56% over the course of the year (in their respective currencies). Emerging market stocks continued to fare poorly as the MSCI Emerging Markets Index tumbled -14.83% during the year. High yield bonds finished the year down -4.47%, as measured by the Barclays U.S.
Corporate High Yield Bond Index, while core fixed income returns were up 0.55%, as measured by Barclays U.S. Aggregate Bond Index. We note that during the third round of the Federal Reserve’s quantitative easing program in 2013, corporate high yield issuance reached current cycle highs.
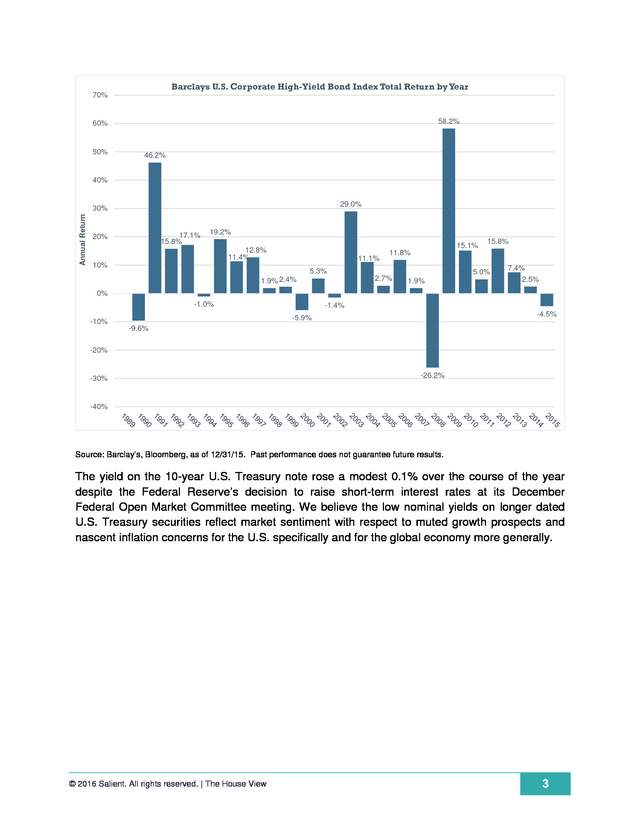
We would typically expect to see a distressed cycle occur three to five years following peak issuance, which would fall into calendar years 2016-2018. As illustrated in the chart on the following page, 2015 represented the first negative return posted by high yield bonds since the 2008 financial crisis. © 2016 Salient. All rights reserved.
| The House View 2 . Barclays U.S. Corporate High-Yield Bond Index Total Return by Year 70% 58.2% 60% 50% 46.2% 40% 29.0% Annual Return 30% 17.1% 15.8% 20% 19.2% 12.8% 11.4% 11.1% 10% 15.1% 11.8% 5.3% 2.7% 1.9% 2.4% 15.8% 5.0% 1.9% 7.4% 2.5% 0% -1.0% -10% -1.4% -4.5% -5.9% -9.6% -20% -30% -26.2% -40% Source: Barclay’s, Bloomberg, as of 12/31/15. Past performance does not guarantee future results. The yield on the 10-year U.S. Treasury note rose a modest 0.1% over the course of the year despite the Federal Reserve’s decision to raise short-term interest rates at its December Federal Open Market Committee meeting.
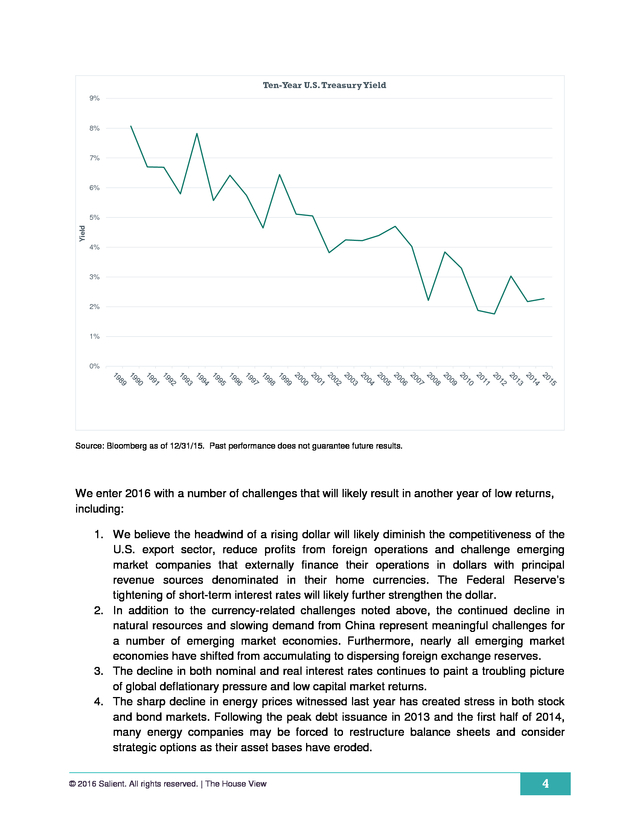
We believe the low nominal yields on longer dated U.S. Treasury securities reflect market sentiment with respect to muted growth prospects and nascent inflation concerns for the U.S. specifically and for the global economy more generally. © 2016 Salient.
All rights reserved. | The House View 3 . Ten-Year U.S. Treasury Yield 9% 8% 7% 6% Yield 5% 4% 3% 2% 1% 0% Source: Bloomberg as of 12/31/15. Past performance does not guarantee future results. We enter 2016 with a number of challenges that will likely result in another year of low returns, including: 1. We believe the headwind of a rising dollar will likely diminish the competitiveness of the U.S.
export sector, reduce profits from foreign operations and challenge emerging market companies that externally finance their operations in dollars with principal revenue sources denominated in their home currencies. The Federal Reserve’s tightening of short-term interest rates will likely further strengthen the dollar. 2. In addition to the currency-related challenges noted above, the continued decline in natural resources and slowing demand from China represent meaningful challenges for a number of emerging market economies.
Furthermore, nearly all emerging market economies have shifted from accumulating to dispersing foreign exchange reserves. 3. The decline in both nominal and real interest rates continues to paint a troubling picture of global deflationary pressure and low capital market returns. 4. The sharp decline in energy prices witnessed last year has created stress in both stock and bond markets.
Following the peak debt issuance in 2013 and the first half of 2014, many energy companies may be forced to restructure balance sheets and consider strategic options as their asset bases have eroded. © 2016 Salient. All rights reserved. | The House View 4 .
5. Global debt remains at record highs and exceeds the 2007 levels that resulted in the financial crisis of 2008. The methods for dealing with overindebtedness—increasing taxes, decreasing expenditures, growing out of it, inflating out of it or restructuring it— seem either unpalatable or undoable. Despite this laundry list of woes, we enter 2016 with the S&P 500 trading at 18.26 times its trailing 12 month’s earnings while the federal funds target rate hovers between 0.25% and 0.50%, high yield bond yields have crept up to 8.74%, 10-year U.S. Treasurys yield a modest 2.27% and the price of West Texas Intermediate crude oil closed the year out at $37.04 per barrel. With such little margin of safety from a valuation perspective, we encourage investors to consider the level of risk embedded in their portfolios and the sources of that risk.
With that in mind, we turn our attention to the second installment in our series on diversification. Thought for the month Last month we visited the topic of diversification with a focus on identifying the most suitable building blocks to use in constructing liquid portfolios. In that exercise, we asserted that there are five distinct asset classes that investors should think about when allocating to portfolios: • • • • • Global Equities U.S. Core Fixed Income Commodities Liquid Real Assets [e.g., master limited partnerships (MLPs) and real estate investment trusts (REITs)] Trend-Based Commodity Trading Advisors (CTA) Strategies (with appropriate fee structures) Many investors might argue that the list is incomplete due to the absence of security types like high yield bonds, municipal bonds, convertible stocks or style-driven equity exposures like value, growth or smaller companies.
While we recognize that these are distinct investment options, they do not offer enough distinction with respect to stocks and bonds to be treated as truly separate asset classes or building blocks for portfolio construction purposes. We think investors should first consider how much global equity exposure they can tolerate—alongside their other asset class decisions—then consider how much of that global equity exposure should come from particular geographic regions, value stocks or even high yield bonds as a substitute for equities. The reason we believe it is important to approach the asset allocation problem in this manner is that it helps ensure that each of the primary exposures within the portfolio have a low resemblance to one another.
This approach allows investors to achieve greater diversification as their portfolios are designed to withstand encounters with a wide range of economic scenarios. Selecting the right primary asset classes to allocate capital is the first step in establishing a strategic asset allocation policy. The second step is determining the weights of each component of the portfolio. Once an investor’s risk tolerance has been identified, the weights of each of the asset classes should be targeted to achieve the desired level of expected risk and return with © 2016 Salient.
All rights reserved. | The House View 5 . adherence to proper diversification and subject to any binding constraints. The amount of risk contributed by each component of the portfolio is a function of that component’s volatility and correlation with the other components of the portfolio. Accordingly, the level of diversification that can be achieved through two highly correlated asset classes (such as stocks and high yield bonds) is much lower than what could be achieved when combining two lowly correlated asset classes (such as U.S. Treasury securities and commodities). The other significant input to the portfolio construction problem is the expected return for each asset class.
In our work we note that many investors are more optimistic about the return prospects for equity securities than for other asset classes. This sentiment is understandable due to the element of profit growth that equity securities enjoy that is not found with bonds or commodities. The historic evidence, however, does not fully support this enthusiasm for equities.
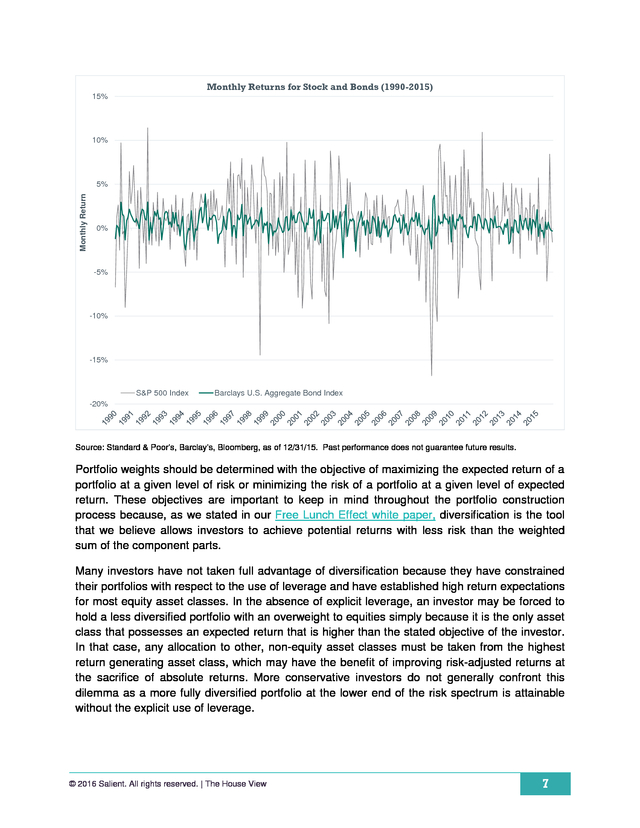
Since 1990 the S&P 500 has generated a 9.26% annualized return compared with a 6.25% annualized return for the Barclays U.S. Aggregate Bond Index but the stock index returns were generated at four times the price volatility of the bond index. If investors were willing to leverage their bond position 2 to 1, they could have achieved a return that surpassed the return on stocks with half the price volatility. The chart on the following page illustrates the difference between stock and bond volatility. Between 1990 and 2015, stocks generated a 4.2% monthly standard deviation of returns, which was four times the 1.05% monthly standard deviation of returns generated by bonds.
As investors allocate more capital to stocks in their portfolio, the riskiness of those portfolios will generally increase as well. © 2016 Salient. All rights reserved. | The House View 6 .
Monthly Returns for Stock and Bonds (1990-2015) 15% 10% Monthly Return 5% 0% -5% -10% -15% S&P 500 Index Barclays U.S. Aggregate Bond Index -20% Source: Standard & Poor’s, Barclay’s, Bloomberg, as of 12/31/15. Past performance does not guarantee future results. Portfolio weights should be determined with the objective of maximizing the expected return of a portfolio at a given level of risk or minimizing the risk of a portfolio at a given level of expected return. These objectives are important to keep in mind throughout the portfolio construction process because, as we stated in our Free Lunch Effect white paper, diversification is the tool that we believe allows investors to achieve potential returns with less risk than the weighted sum of the component parts. Many investors have not taken full advantage of diversification because they have constrained their portfolios with respect to the use of leverage and have established high return expectations for most equity asset classes.
In the absence of explicit leverage, an investor may be forced to hold a less diversified portfolio with an overweight to equities simply because it is the only asset class that possesses an expected return that is higher than the stated objective of the investor. In that case, any allocation to other, non-equity asset classes must be taken from the highest return generating asset class, which may have the benefit of improving risk-adjusted returns at the sacrifice of absolute returns. More conservative investors do not generally confront this dilemma as a more fully diversified portfolio at the lower end of the risk spectrum is attainable without the explicit use of leverage. © 2016 Salient. All rights reserved.
| The House View 7 . We think investors should establish their asset allocation policies with a broad range of economic outcomes in mind. History shows that fear, greed, growth, contraction, inflation and even deflation can catch many investors off guard. Rather than attempting to predict when these might occur we think it’s far more important to prepare in advance through a sound asset allocation policy that takes full advantage of diversification. © 2016 Salient. All rights reserved.
| The House View 8 . DISCLOSURES Investing involves risk, including possible loss of principal. The value of any financial instruments or markets mentioned herein can fall as well as rise. Past performance does not guarantee future results. This material is distributed for informational purposes only and should not be considered as investment advice, a recommendation of any particular security, strategy or investment product, or as an offer or solicitation with respect to the purchase or sale of any investment. Statistics, prices, estimates, forward-looking statements, and other information contained herein have been obtained from sources believed to be reliable, but no guarantee is given as to their accuracy or completeness.
All expressions of opinion are subject to change without notice. Neither diversification nor asset allocation assures profit or protects against risk. Limitations of Hypothetical Performance. The hypothetical backtested performance presented is supplemental to the GIPS-compliant presentation included as part of this presentation. The returns presented reflect hypothetical performance an investor would have obtained had it invested in the manner shown and does not represents returns that any investor actually attained.
The information presented is based upon the following hypothetical assumptions: [1)The historical transactions costs are reflected by our estimates based on the modern costs of trading the instruments in the strategy. 2) No market events not accounted for in the model would have disrupted the rebalancing of assets throughout the backtest. 3) The computational resources required to conduct the strategy would have been available throughout the history.
Certain of the assumptions have been made for modeling purposes and are unlikely to be realized. No representation or warranty is made as to the reasonableness of the assumptions made or that all assumptions used in achieving the returns have been stated or fully considered. Changes in the assumptions may have a material impact on the hypothetical returns presented. Hypothetical backtested returns have many inherent limitations.
Unlike actual performance, it does not represent actual trading. Since trades have not been actually been executed, results may have under- or over-compensated for the impact, if any, of certain market factors, such as lack of liquidity, and may not reflect the impact that certain economic or market factors may have had on the decision-making process. Hypothetical backtested performance also is developed with the benefit of hindsight.
Other periods selected may have different results, including losses. There can be no assurance that the Adviser will achieve profits or avoid incurring substantial losses. Lee Partridge has earned the right to use the Chartered Financial Analyst designation. CFA Institute marks are trademarks owned by the CFA Institute. DEFINITIONS Alerian MLP Index (AMZ) is a composite of the 50 most prominent energy MLPs that provides investors with a comprehensive benchmark for this emerging asset class. Barclays Global High Yield Index is a multi-currency flagship measure of the global high yield debt market. Barclays Intermediate Government/Credit Bond Index tracks the performance of intermediate term U.S. government and corporate bonds. Bloomberg Commodity Index is a broadly diversified index composed of exchange-traded futures contracts on physical commodities. Chicago Mercantile Exchange is the world's second-largest exchange for futures and options on futures and the largest exchange in the U.S. Chicago Board Options Exchange Volatility Index reflects a market estimate of future volatility, based on the weighted average of the implied volatilities for a wide range of strikes. 1st & 2nd month expirations are used until 8 days from expiration, then the 2nd and 3rd are used. Commodity trading advisor (CTA) is US financial regulatory term for an individual or organization who is retained by a fund or individual client to provide advice and services related to trading in futures contracts, commodity options and/or certain swaps.
They are responsible for the trading within managed futures accounts. The definition of CTA may also apply to investment advisors for hedge funds and private funds including mutual funds and exchangetraded funds in certain cases.[3] CTAs are generally regulated by the United States federal government through registration with the Commodity Futures Trading Commission (CFTC) and membership of the National Futures Association (NFA). © 2016 Salient. All rights reserved.
| The House View 9 . Global Industry Classification Standard (GICS) is a standardized classification system for equities developed jointly by Morgan Stanley Capital International (MSCI) and Standard & Poor's. The GICS methodology is used by the MSCI indexes, which include domestic and international stocks, as well as by a large portion of the professional investment management community. MSCI Emerging Markets (EM) Index is an index created by Morgan Stanley Capital International (MSCI) that is designed to measure equity market performance in global emerging markets. Russell 2000 Index measures the performance of the small-cap segment of the U.S. equity universe. It includes approximately 2000 of the smallest securities based on a combination of their market cap and current index membership.
The Russell 2000 is constructed to provide a comprehensive and unbiased small-cap barometer and is completely reconstituted annually to ensure larger stocks do not distort the performance and characteristics of the true small-cap opportunity set. S&P 500 Index is an unmanaged, capitalization weighted index comprising publicly traded common stocks issued by companies in various industries. The S&P 500 Index is widely recognized as the leading broad-based measurement of changes in conditions of the U.S. equities market. S&P GSCI Commodity Index is a composite index of commodity sector returns representing an unleveraged, longonly investment in commodity futures that is broadly diversified across the spectrum of commodities and serves as a measure of commodity performance over time. Tokyo Stock Price Index is an index that measures stock prices on the Tokyo Stock Exchange (TSE). One cannot invest directly in an index. © 2016 Salient.
All rights reserved. | The House View 10 .
Dollar 98.63 -1.54 1-Year -10.22 -0.37 -4.44 9.26 1-Year 0.55 -4.47 3-Year 52.55 39.19 90.79 41.13 14.56 34.27 -18.39 -9.86 35.20 3-Year 4.39 5.16 Sector Consumer Discretionary Consumer Staples Energy Financials Healthcare Industrials Information Technology Materials Telecom Service Utilities MTD -2.78 2.86 -9.87 -2.16 1.78 -2.03 -2.29 -4.16 1.75 2.17 QTD 5.79 7.64 0.20 5.92 9.22 7.97 9.17 9.69 7.61 1.07 YTD 10.11 6.60 -21.12 -1.56 6.89 -2.56 5.92 -8.38 3.40 -4.84 QTD -2.82 -0.28 -2.12 2.37 YTD -10.22 -0.37 -4.44 9.26 Sources: Bloomberg, Standard & Poor’s, Tokyo Stock Price Index, Morgan Stanley Capital Index, Alerian, Barclays Capital, Chicago Mercantile Exchange and Global Industry Classification Standard Notes: Equity market returns include dividends and price changes over the reference period. U.S. equity sectors are based on level one of the Global Industry Classification Standards (GICS).
Except for gold, commodity market price changes are based on the 1st futures contract. Gold prices are referenced from the spot market. Sovereign debt market yields reference local currency returns for 10-year benchmark bond/note.
Currency prices are relative to the U.S. dollar. For illustrative purposes only. Past performance does not guarantee future results.
Index performance does not reflect the deduction of fees, expenses or taxes. The indices are unmanaged and are not available for direct investment. Market overview The S&P 500 Index generated a 1.37% return in 2015, marking the worst year of performance since 2008. The gain was driven entirely by dividends paid to investors, which offset a modest price decline of -0.7%.
Consumer discretionary stocks led the market, closing up 10.11% for the year, while consumer staple stocks increased 6.6%. Energy stocks were the biggest detractor (-21.12%) followed by materials stocks (-8.38%). Small cap stocks, as represented by the Russell 2000 Index, posted a -4.41% loss for the year. © 2016 Salient.
All rights reserved. | The House View 1 . S&P 500 Total Return by Year 50% 40% 37.1% 33.1% 29.9% 32.0% 28.3% 28.3% 30% 25.9% 22.6% 20.9% 20% Annual Return 15.6% 9.9% 10% 14.8% 15.9% 13.5% 10.7% 7.4% 4.8% 5.6% 2.1% 1.3% 1.4% 0% -3.2% -10% -9.0% -11.9% -20% -22.0% -30% -40% -36.6% -50% Source: Standard & Poor’s, Bloomberg, as of 12/31/15. Past performance does not guarantee future results. The dollar advanced 9.26% versus a trade-weighted basket of foreign currencies as the euro lost -10.22% versus the greenback. Japanese equities, as measured by the Tokyo Stock Price Index, gained 12.06% while German stocks, as measured by the German Stock Index, advanced 9.56% over the course of the year (in their respective currencies). Emerging market stocks continued to fare poorly as the MSCI Emerging Markets Index tumbled -14.83% during the year. High yield bonds finished the year down -4.47%, as measured by the Barclays U.S.
Corporate High Yield Bond Index, while core fixed income returns were up 0.55%, as measured by Barclays U.S. Aggregate Bond Index. We note that during the third round of the Federal Reserve’s quantitative easing program in 2013, corporate high yield issuance reached current cycle highs.
We would typically expect to see a distressed cycle occur three to five years following peak issuance, which would fall into calendar years 2016-2018. As illustrated in the chart on the following page, 2015 represented the first negative return posted by high yield bonds since the 2008 financial crisis. © 2016 Salient. All rights reserved.
| The House View 2 . Barclays U.S. Corporate High-Yield Bond Index Total Return by Year 70% 58.2% 60% 50% 46.2% 40% 29.0% Annual Return 30% 17.1% 15.8% 20% 19.2% 12.8% 11.4% 11.1% 10% 15.1% 11.8% 5.3% 2.7% 1.9% 2.4% 15.8% 5.0% 1.9% 7.4% 2.5% 0% -1.0% -10% -1.4% -4.5% -5.9% -9.6% -20% -30% -26.2% -40% Source: Barclay’s, Bloomberg, as of 12/31/15. Past performance does not guarantee future results. The yield on the 10-year U.S. Treasury note rose a modest 0.1% over the course of the year despite the Federal Reserve’s decision to raise short-term interest rates at its December Federal Open Market Committee meeting.
We believe the low nominal yields on longer dated U.S. Treasury securities reflect market sentiment with respect to muted growth prospects and nascent inflation concerns for the U.S. specifically and for the global economy more generally. © 2016 Salient.
All rights reserved. | The House View 3 . Ten-Year U.S. Treasury Yield 9% 8% 7% 6% Yield 5% 4% 3% 2% 1% 0% Source: Bloomberg as of 12/31/15. Past performance does not guarantee future results. We enter 2016 with a number of challenges that will likely result in another year of low returns, including: 1. We believe the headwind of a rising dollar will likely diminish the competitiveness of the U.S.
export sector, reduce profits from foreign operations and challenge emerging market companies that externally finance their operations in dollars with principal revenue sources denominated in their home currencies. The Federal Reserve’s tightening of short-term interest rates will likely further strengthen the dollar. 2. In addition to the currency-related challenges noted above, the continued decline in natural resources and slowing demand from China represent meaningful challenges for a number of emerging market economies.
Furthermore, nearly all emerging market economies have shifted from accumulating to dispersing foreign exchange reserves. 3. The decline in both nominal and real interest rates continues to paint a troubling picture of global deflationary pressure and low capital market returns. 4. The sharp decline in energy prices witnessed last year has created stress in both stock and bond markets.
Following the peak debt issuance in 2013 and the first half of 2014, many energy companies may be forced to restructure balance sheets and consider strategic options as their asset bases have eroded. © 2016 Salient. All rights reserved. | The House View 4 .
5. Global debt remains at record highs and exceeds the 2007 levels that resulted in the financial crisis of 2008. The methods for dealing with overindebtedness—increasing taxes, decreasing expenditures, growing out of it, inflating out of it or restructuring it— seem either unpalatable or undoable. Despite this laundry list of woes, we enter 2016 with the S&P 500 trading at 18.26 times its trailing 12 month’s earnings while the federal funds target rate hovers between 0.25% and 0.50%, high yield bond yields have crept up to 8.74%, 10-year U.S. Treasurys yield a modest 2.27% and the price of West Texas Intermediate crude oil closed the year out at $37.04 per barrel. With such little margin of safety from a valuation perspective, we encourage investors to consider the level of risk embedded in their portfolios and the sources of that risk.
With that in mind, we turn our attention to the second installment in our series on diversification. Thought for the month Last month we visited the topic of diversification with a focus on identifying the most suitable building blocks to use in constructing liquid portfolios. In that exercise, we asserted that there are five distinct asset classes that investors should think about when allocating to portfolios: • • • • • Global Equities U.S. Core Fixed Income Commodities Liquid Real Assets [e.g., master limited partnerships (MLPs) and real estate investment trusts (REITs)] Trend-Based Commodity Trading Advisors (CTA) Strategies (with appropriate fee structures) Many investors might argue that the list is incomplete due to the absence of security types like high yield bonds, municipal bonds, convertible stocks or style-driven equity exposures like value, growth or smaller companies.
While we recognize that these are distinct investment options, they do not offer enough distinction with respect to stocks and bonds to be treated as truly separate asset classes or building blocks for portfolio construction purposes. We think investors should first consider how much global equity exposure they can tolerate—alongside their other asset class decisions—then consider how much of that global equity exposure should come from particular geographic regions, value stocks or even high yield bonds as a substitute for equities. The reason we believe it is important to approach the asset allocation problem in this manner is that it helps ensure that each of the primary exposures within the portfolio have a low resemblance to one another.
This approach allows investors to achieve greater diversification as their portfolios are designed to withstand encounters with a wide range of economic scenarios. Selecting the right primary asset classes to allocate capital is the first step in establishing a strategic asset allocation policy. The second step is determining the weights of each component of the portfolio. Once an investor’s risk tolerance has been identified, the weights of each of the asset classes should be targeted to achieve the desired level of expected risk and return with © 2016 Salient.
All rights reserved. | The House View 5 . adherence to proper diversification and subject to any binding constraints. The amount of risk contributed by each component of the portfolio is a function of that component’s volatility and correlation with the other components of the portfolio. Accordingly, the level of diversification that can be achieved through two highly correlated asset classes (such as stocks and high yield bonds) is much lower than what could be achieved when combining two lowly correlated asset classes (such as U.S. Treasury securities and commodities). The other significant input to the portfolio construction problem is the expected return for each asset class.
In our work we note that many investors are more optimistic about the return prospects for equity securities than for other asset classes. This sentiment is understandable due to the element of profit growth that equity securities enjoy that is not found with bonds or commodities. The historic evidence, however, does not fully support this enthusiasm for equities.
Since 1990 the S&P 500 has generated a 9.26% annualized return compared with a 6.25% annualized return for the Barclays U.S. Aggregate Bond Index but the stock index returns were generated at four times the price volatility of the bond index. If investors were willing to leverage their bond position 2 to 1, they could have achieved a return that surpassed the return on stocks with half the price volatility. The chart on the following page illustrates the difference between stock and bond volatility. Between 1990 and 2015, stocks generated a 4.2% monthly standard deviation of returns, which was four times the 1.05% monthly standard deviation of returns generated by bonds.
As investors allocate more capital to stocks in their portfolio, the riskiness of those portfolios will generally increase as well. © 2016 Salient. All rights reserved. | The House View 6 .
Monthly Returns for Stock and Bonds (1990-2015) 15% 10% Monthly Return 5% 0% -5% -10% -15% S&P 500 Index Barclays U.S. Aggregate Bond Index -20% Source: Standard & Poor’s, Barclay’s, Bloomberg, as of 12/31/15. Past performance does not guarantee future results. Portfolio weights should be determined with the objective of maximizing the expected return of a portfolio at a given level of risk or minimizing the risk of a portfolio at a given level of expected return. These objectives are important to keep in mind throughout the portfolio construction process because, as we stated in our Free Lunch Effect white paper, diversification is the tool that we believe allows investors to achieve potential returns with less risk than the weighted sum of the component parts. Many investors have not taken full advantage of diversification because they have constrained their portfolios with respect to the use of leverage and have established high return expectations for most equity asset classes.
In the absence of explicit leverage, an investor may be forced to hold a less diversified portfolio with an overweight to equities simply because it is the only asset class that possesses an expected return that is higher than the stated objective of the investor. In that case, any allocation to other, non-equity asset classes must be taken from the highest return generating asset class, which may have the benefit of improving risk-adjusted returns at the sacrifice of absolute returns. More conservative investors do not generally confront this dilemma as a more fully diversified portfolio at the lower end of the risk spectrum is attainable without the explicit use of leverage. © 2016 Salient. All rights reserved.
| The House View 7 . We think investors should establish their asset allocation policies with a broad range of economic outcomes in mind. History shows that fear, greed, growth, contraction, inflation and even deflation can catch many investors off guard. Rather than attempting to predict when these might occur we think it’s far more important to prepare in advance through a sound asset allocation policy that takes full advantage of diversification. © 2016 Salient. All rights reserved.
| The House View 8 . DISCLOSURES Investing involves risk, including possible loss of principal. The value of any financial instruments or markets mentioned herein can fall as well as rise. Past performance does not guarantee future results. This material is distributed for informational purposes only and should not be considered as investment advice, a recommendation of any particular security, strategy or investment product, or as an offer or solicitation with respect to the purchase or sale of any investment. Statistics, prices, estimates, forward-looking statements, and other information contained herein have been obtained from sources believed to be reliable, but no guarantee is given as to their accuracy or completeness.
All expressions of opinion are subject to change without notice. Neither diversification nor asset allocation assures profit or protects against risk. Limitations of Hypothetical Performance. The hypothetical backtested performance presented is supplemental to the GIPS-compliant presentation included as part of this presentation. The returns presented reflect hypothetical performance an investor would have obtained had it invested in the manner shown and does not represents returns that any investor actually attained.
The information presented is based upon the following hypothetical assumptions: [1)The historical transactions costs are reflected by our estimates based on the modern costs of trading the instruments in the strategy. 2) No market events not accounted for in the model would have disrupted the rebalancing of assets throughout the backtest. 3) The computational resources required to conduct the strategy would have been available throughout the history.
Certain of the assumptions have been made for modeling purposes and are unlikely to be realized. No representation or warranty is made as to the reasonableness of the assumptions made or that all assumptions used in achieving the returns have been stated or fully considered. Changes in the assumptions may have a material impact on the hypothetical returns presented. Hypothetical backtested returns have many inherent limitations.
Unlike actual performance, it does not represent actual trading. Since trades have not been actually been executed, results may have under- or over-compensated for the impact, if any, of certain market factors, such as lack of liquidity, and may not reflect the impact that certain economic or market factors may have had on the decision-making process. Hypothetical backtested performance also is developed with the benefit of hindsight.
Other periods selected may have different results, including losses. There can be no assurance that the Adviser will achieve profits or avoid incurring substantial losses. Lee Partridge has earned the right to use the Chartered Financial Analyst designation. CFA Institute marks are trademarks owned by the CFA Institute. DEFINITIONS Alerian MLP Index (AMZ) is a composite of the 50 most prominent energy MLPs that provides investors with a comprehensive benchmark for this emerging asset class. Barclays Global High Yield Index is a multi-currency flagship measure of the global high yield debt market. Barclays Intermediate Government/Credit Bond Index tracks the performance of intermediate term U.S. government and corporate bonds. Bloomberg Commodity Index is a broadly diversified index composed of exchange-traded futures contracts on physical commodities. Chicago Mercantile Exchange is the world's second-largest exchange for futures and options on futures and the largest exchange in the U.S. Chicago Board Options Exchange Volatility Index reflects a market estimate of future volatility, based on the weighted average of the implied volatilities for a wide range of strikes. 1st & 2nd month expirations are used until 8 days from expiration, then the 2nd and 3rd are used. Commodity trading advisor (CTA) is US financial regulatory term for an individual or organization who is retained by a fund or individual client to provide advice and services related to trading in futures contracts, commodity options and/or certain swaps.
They are responsible for the trading within managed futures accounts. The definition of CTA may also apply to investment advisors for hedge funds and private funds including mutual funds and exchangetraded funds in certain cases.[3] CTAs are generally regulated by the United States federal government through registration with the Commodity Futures Trading Commission (CFTC) and membership of the National Futures Association (NFA). © 2016 Salient. All rights reserved.
| The House View 9 . Global Industry Classification Standard (GICS) is a standardized classification system for equities developed jointly by Morgan Stanley Capital International (MSCI) and Standard & Poor's. The GICS methodology is used by the MSCI indexes, which include domestic and international stocks, as well as by a large portion of the professional investment management community. MSCI Emerging Markets (EM) Index is an index created by Morgan Stanley Capital International (MSCI) that is designed to measure equity market performance in global emerging markets. Russell 2000 Index measures the performance of the small-cap segment of the U.S. equity universe. It includes approximately 2000 of the smallest securities based on a combination of their market cap and current index membership.
The Russell 2000 is constructed to provide a comprehensive and unbiased small-cap barometer and is completely reconstituted annually to ensure larger stocks do not distort the performance and characteristics of the true small-cap opportunity set. S&P 500 Index is an unmanaged, capitalization weighted index comprising publicly traded common stocks issued by companies in various industries. The S&P 500 Index is widely recognized as the leading broad-based measurement of changes in conditions of the U.S. equities market. S&P GSCI Commodity Index is a composite index of commodity sector returns representing an unleveraged, longonly investment in commodity futures that is broadly diversified across the spectrum of commodities and serves as a measure of commodity performance over time. Tokyo Stock Price Index is an index that measures stock prices on the Tokyo Stock Exchange (TSE). One cannot invest directly in an index. © 2016 Salient.
All rights reserved. | The House View 10 .


