North American Crude Oil Independence: Not Just a Pipe Dream - April 2014
Salient Partners


Description
North American Crude Oil Independence:
Not Just a Pipe Dream
Scott Fogleman
Ted Gardner, CFA
April 2014
Advisory services are offered through Salient Capital Advisors, LLC, a SEC registered investment advisor. Salient is the trade name for Salient Partners,
L.P., which together with its subsidiaries provides asset management and advisory services. Salient Partners, L.P. is the parent company to Salient
Capital Advisors, LLC.
Salient Partners, L.P. and affiliates do not provide tax or legal advice. Please consult your tax and or legal professional to determine how the information contained in the publication may apply to your situation. .
North American Crude Oil Independence: Not Just a Pipe Dream #2014-04 Fund ID: MLPs This information is being provided to you by Salient Capital Advisors, LLC. It is intended solely for educational purposes. No other distribution or use of these materials has been authorized. The opinions expressed in these materials represent the personal views of the investment professionals of Salient Capital Advisors, LLC and is based on their broad based investment knowledge, experience, research and analysis.
It must be noted, however, that no one can accurately predict the future of the market with certainty or guarantee future investment performance. Past performance is not a guarantee of future results. Certain statements in this communication are forward-looking statements of Salient Capital Advisors, LLC. The forward-looking statements and other views expressed herein are as of the date of this letter. Actual future results or occurrences may differ significantly from those anticipated in any forward-looking statements, and there is no guarantee that any predictions will come to pass.
The views expressed herein are subject to change at any time, due to numerous market and other factors. The Adviser disclaims any obligation to update publicly or revise any forward-looking statements or views expressed herein. This information is neither an offer to sell nor a solicitation of any offer to buy any securities. Any offering or solicitation will be made only to eligible investors and pursuant to any applicable Private Placement Memorandum and other governing documents, all of which must be read in their entirety. MLPs are subject to regulatory and tax risks, including but not limited to changes in current tax law which could result in MLPs being treated as corporations for U.S.
federal income tax purposes or the elimination or reduction of MLPs tax deductions. MLP returns have the potential to be highly volatile, an MLP is also subject to liquidity risk, potential conflicts of interest as a result of the MLP ownership structure and the risks of the specific sector in which the MLP is concentrated. Research services are provided by Salient Capital Advisors, LLC, a wholly owned subsidiary of Salient Partners, L.P. and a Securities and Exchange Commission Registered Investment Adviser. Registration as an investment adviser does not imply any level of skill or training.
Salient research has been prepared without regard to the individual financial circumstances and objectives of persons who receive it. Salient recommends that investors independently evaluate particular investments and strategies, and encourage investors to seek the advice of a financial advisor. The appropriateness of a particular investment or strategy will depend on an investor’s individual circumstances and objectives. Salient Capital Advisors, LLC does not provide tax advice.
Please contact your tax professional to determine how the information contained in this document may apply to your situation. Salient is the trade name for Salient Partners, L.P., which together with its subsidiaries provides asset management and advisory services. Insurance products offered through Salient Insurance Agency, LLC (Texas license #1736192). Trust services provided by Salient Trust Co., LTA.
Securities offered through Salient Capital, L.P., a registered broker-dealer and Member FINRA, SIPC. Each of Salient Insurance Agency, LLC, Salient Trust Co., LTA, and Salient Capital, L.P., is a subsidiary of Salient Partners, L.P. 1 © Salient Capital Advisors, LLC, 2014 . North American Crude Oil Independence: Not Just a Pipe Dream #2014-04 Fund ID: MLPs Table of Contents I. Executive Summary II. Introduction III. But First, A Little Background a. b. Taking on the Crude Revolution Boldly Going Where No Production Was Before IV. The Bakken Shale V. The Eagle Ford Shale a. Pipelines Exist…But to the Wrong Places b. First to Corpus Christi and then…? VI. The Permian Basin: The Re-Awakening of a Giant a. Existing Permian Takeaway Pipelines (Worked Like a Charm for Decades) VII. Conclusion: Energy Independence? VIII. Risks IX. Glossary 2 © Salient Capital Advisors, LLC, 2014 . North American Crude Oil Independence: Not Just a Pipe Dream #2014-04 I. Fund ID: MLPs Executive Summary Much has been written about the ongoing “energy renaissance” and how domestic crude oil and natural gas production has reversed years of decline to reach levels not seen in decades. However, we have not seen much discussion of the role that Master Limited Partnerships (MLPs) have played in helping to facilitate this energy boom. We believe that MLPs could be beneficiaries of increased domestic production levels for an extended period of time to come as additional energy infrastructure is needed to get the incremental production to market. This paper is the first in what we plan to be a series of periodic reports to help educate investors about how MLPs are at the forefront of the energy rush and why we believe it may make sense for investors to consider MLPs as a portion of their comprehensive asset allocation strategy. For this first installment, we will focus on domestic crude oil production since we believe that the renewed focus on crude is what is driving the current round of energy infrastructure expansion. Specifically, we will concentrate on three areas that have collectively contributed the lion’s share of the recent surge in crude oil production: the Bakken Shale in North Dakota, the Eagle Ford Shale in South Texas, and the Permian Basin in West Texas. We detail how each of the plays presented their own unique logistical challenges and how MLPs have worked with local producers to help provide solutions. In summary, we believe that the aforementioned “energy renaissance” is real and that MLPs may be well positioned to benefit from what could be hundreds of billions of dollars spent over the next decade to make the dream of North American energy independence a reality. We hope you enjoy it. 3 © Salient Capital Advisors, LLC, 2014 .
North American Crude Oil Independence: Not Just a Pipe Dream #2014-04 Fund ID: MLPs II. Introduction Question: Which U.S. state had the fastest growing population in percentage terms over the last three years, enjoys real estate prices 33% lower than the U.S. median, and sports the lowest unemployment rate of all 50 states? Gotta be Texas, right? Wrong.
It’s North Dakota. 1 Why North Dakota? Because North Dakota sits on top of the Bakken Shale, a massive formation calculated to contain between 7 and 11 billion barrels of recoverable crude oil. 2 While geologists have known for years that the oil was there, only recently has technology advanced enough to make it economically feasible for Exploration and Production (E&P) companies to drill for it.
In just the last seven years, North Dakota crude oil production has climbed from roughly 100 thousand barrels per day (mbpd) to over 970 mbpd. At approximately $100/barrel, you can see how that kind of money could start to attract a crowd. North Dakota’s population has recently climbed to more than 723,000 setting a new record for the state.
3 When was the old record set? The 1930 census. So in just over seven years of extensive drilling in and around the Bakken formation, North Dakota has been able to reverse over seven decades of population decline. And the best part of North Dakota’s economic resurgence is that the boom has not been limited to North Dakota. The last seven years have seen an explosion in North American energy production which has created “North Dakota-esque” economic booms in a multitude of locations where hydrocarbons (crude oil, natural gas, and natural gas liquids (NGLs)) had never before been produced in commercial quantities.
Areas such as the Marcellus and Utica Shales in Pennsylvania and Ohio and the Eagle Ford Shale in South Texas have seen a surge of activity in recent years. Even the venerable Permian Basin of West Texas, which has been producing crude oil since the 1920s, is enjoying its highest production in 40 years. 4 Domestic crude oil production has increased by more than 2 million bpd (mmbpd) since 2008, and the rapid increase has created some logistical issues.
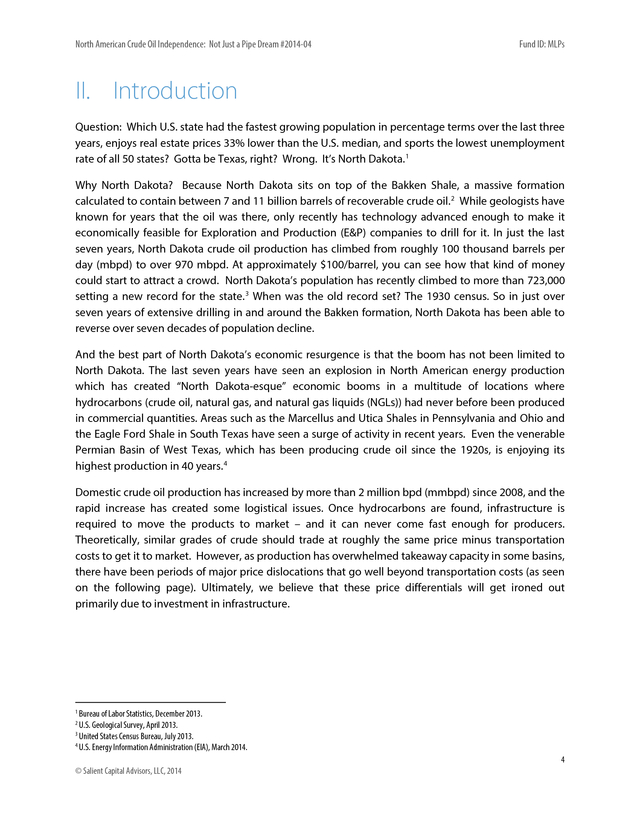
Once hydrocarbons are found, infrastructure is required to move the products to market – and it can never come fast enough for producers. Theoretically, similar grades of crude should trade at roughly the same price minus transportation costs to get it to market. However, as production has overwhelmed takeaway capacity in some basins, there have been periods of major price dislocations that go well beyond transportation costs (as seen on the following page). Ultimately, we believe that these price differentials will get ironed out primarily due to investment in infrastructure. Bureau of Labor Statistics, December 2013. U.S.
Geological Survey, April 2013. 3 United States Census Bureau, July 2013. 4 U.S. Energy Information Administration (EIA), March 2014. 1 2 4 © Salient Capital Advisors, LLC, 2014 . North American Crude Oil Independence: Not Just a Pipe Dream #2014-04 Fund ID: MLPs Source: Enbridge Energy Partners – December Investors Presentation, prices as of December 5, 2013. WTI: West Texas Intermediate, WCS: Western Canadian Select For illustrative purposes only. Please refer to the glossary for a list of definitions. We believe that the production boom is going to continue in the coming years, which may provide a myriad of potential growth opportunities for MLPs to help alleviate the bottlenecks. In fact, there is currently a $45 billion backlog of crude oil projects expected to be completed over the next five years – the overwhelming majority of which will be constructed by MLPs. 5 In the pages that follow, we discuss three of the major oil producing basins and some of the dynamics in each. III.
But first, a little background… Although the MLP structure was created in 1986, for years the space remained somewhat of an investment backwater highlighted by largely illiquid stocks with high yields and little organic growth. At the end of 2004, there were only 36 publicly-traded MLPs with a combined market cap of $54 billion. 6 All that began to change with the natural gas production boom. The North American energy revolution began in earnest back in 2005 when natural gas producers applied hydraulic fracturing (“fracking”) to shale formations across the country. Though the technique had been around since the 1940s, it had not been widely applied until the middle of the last decade as natural gas prices had remained steadily above $10/thousand cubic feet (mcf) following the supply disruption from Hurricanes Katrina and Rita in August and September 2005.
Fracking involves injecting large amounts of water, sand, and a chemical mixture under high pressure into a shale formation which creates fissures in the shale and allows natural gas and crude oil to flow back up the well. In just a few years, a perceived natural gas shortage turned into a natural gas glut. 5 6 Bentek, En*Vantage, Credit Suisse, September 2013. Alerian Capital Management, November 2013. 5 © Salient Capital Advisors, LLC, 2014 . North American Crude Oil Independence: Not Just a Pipe Dream #2014-04 Fund ID: MLPs Obviously, all of this production needed to get from the wellhead to the user markets which resulted in an increased demand for both natural gas processing and transportation capacity. The transportation, processing, and storage of commodities are three core links in the midstream portion of the energy value chain. Midstream services are by nature capital-intensive efforts that historically have produced relatively low-margin, though largely predictable, cash flows. As natural gas production ramped, the need for additional midstream infrastructure increased as well.
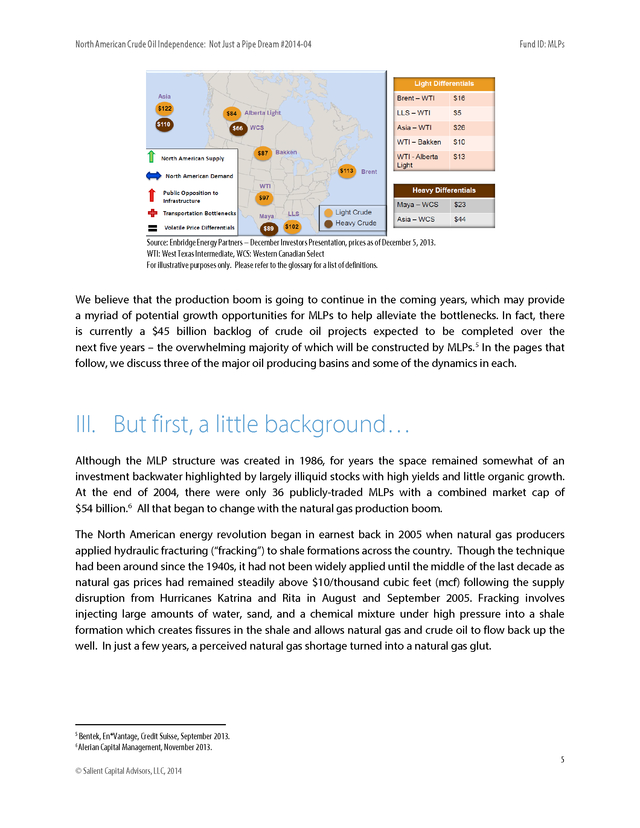
However, many of the “majors” and other E&P companies were hesitant to invest heavily in midstream assets as the expected returns on these activities are generally lower than other parts of their businesses like E&P and refining. This is where MLPs came in. In order to meet the increasing demand for midstream services and to “unlock shareholder value,” a proliferation of companies such as The Williams Companies, Inc., Loews Corporation, and Spectra Energy Corporation began to move some or all of their midstream assets into MLPs. Several other companies came public as MLPs during those years as well, and by the end of 2010, there were 72 MLPs with a combined market capitalization of $229B.
7 MLP Sector Growth Coincided With Natural Gas Production Boom 62 250 60 200 58 $B Bcf/d 150 56 100 54 50 52 50 1999 2000 2001 2002 2003 2004 2005 2006 US Natural Gas Production (Bcf/d) 2007 2008 2009 0 2010 MLP Market Cap ($B) Source: United States Energy Information Administration (EIA), FactSet, September 2013. For illustrative purposes only. 7 Alerian Capital Management, November 2013. 6 © Salient Capital Advisors, LLC, 2014 . North American Crude Oil Independence: Not Just a Pipe Dream #2014-04 Fund ID: MLPs The rapid growth of the MLP segment from 2005-2010 was significant for several reasons. One, the sector proved to be an efficient investor of capital. MLP organic growth capex grew from $9 billion in 2006 to over $20 billion in 2008 while MLP distributions grew over three times the rate of inflation – nearly an 11% compound annual growth rate. It didn’t hurt that MLPs provided positive returns for investors over this time frame, either.
8 We would also argue that the MLP structure held up quite well during the financial crisis of 2008. Note the use of the word “structure” in the previous sentence. The stock prices, especially for noninvestment grade MLPs, were devastated with many losing upwards of 65% for the year (the Alerian MLP Index (AMZ) was down 37%).
However, the overwhelming majority of MLPs (about 83%) held or raised their distributions throughout the crisis while a handful of names actually raised their distributions each quarter. Based on our research, only 17% of MLPs either cut or suspended distributions during or following the crisis. Those were mostly small-cap MLPs concentrated in the E&P and Gathering and Processing (G&P) sub-sectors, which were hit with the double whammy of frozen capital markets and plummeting commodity prices.
When the capital markets began functioning, many of the hardest hit MLPs saw gains well above 100% in 2009. 9 Taking on the Crude Revolution We believe that the rapid growth of the MLP segment during the natural gas production boom (20062010) helped prove that the sector was a prudent operator, developer, and acquirer of assets and, perhaps more importantly, a viable income-oriented investment alternative. So when low natural gas prices and new oil discoveries led producers to shift from natural gas to crude oil and/or “rich” or “wet” gas fields, MLPs were there. U.S.
crude oil production peaked in 1970 at 9.6 mmbpd and subsequently bottomed in late 2008 at roughly 5 mmbpd.10 As drillers have applied fracking techniques to crude oil, domestic crude production has soared, reversing 38 years of decline in just the last five years. Many producers were also able to recover considerable amounts of rich gas (i.e., high NGL content) while drilling for oil. This not only increased profits for the producers, but created additional demand for natural gas processing and transportation which benefitted MLPs due to the lessons learned during the previous natural gas boom.
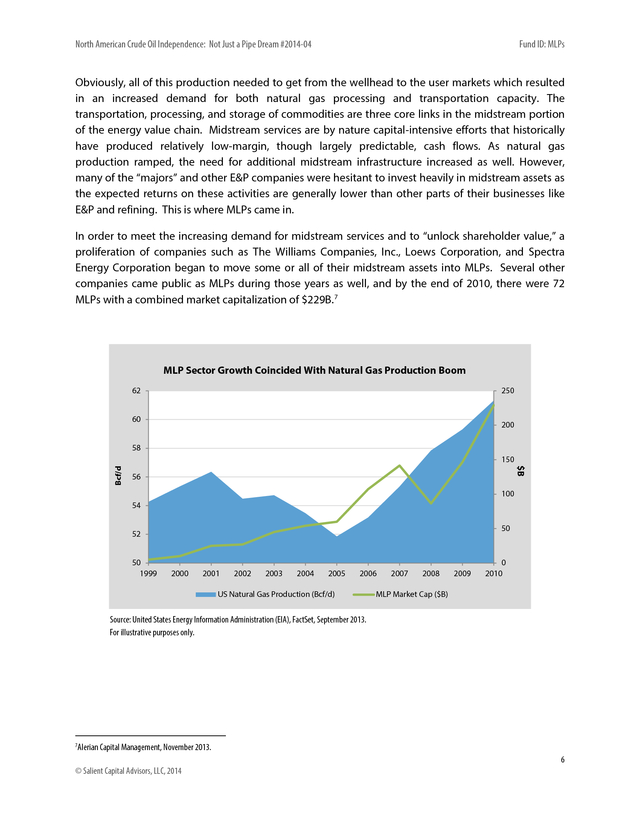
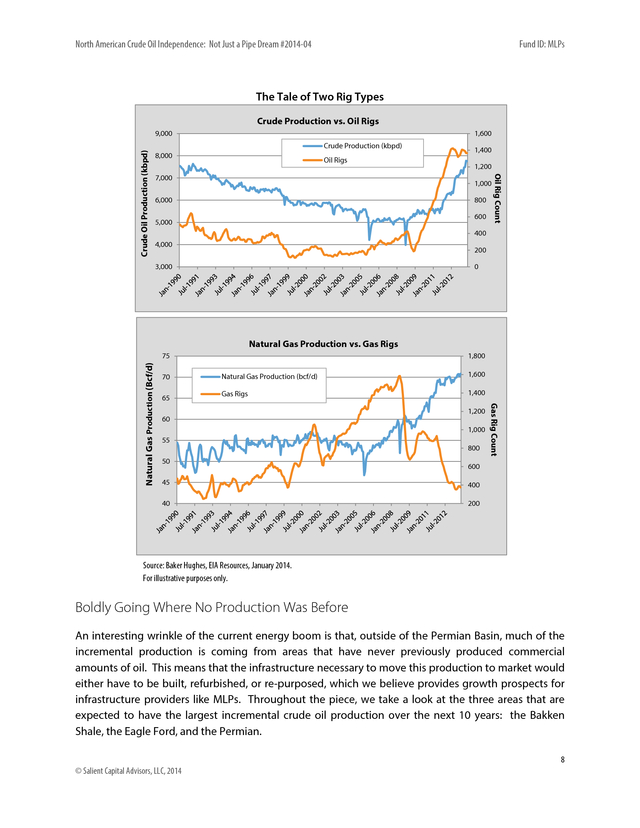
This phenomenon also explains why natural gas production continues to increase despite sustained low prices and a lower rig count, but let’s leave that discussion for another day. 11 FactSet, CreditSuisse September, 2013. FactSet, February 2014. 10 EIA, January 2014. 11 Baker Hughes, EIA, January, 31 2014. 8 9 7 © Salient Capital Advisors, LLC, 2014 . North American Crude Oil Independence: Not Just a Pipe Dream #2014-04 Fund ID: MLPs The Tale of Two Rig Types Crude Production vs. Oil Rigs 1,600 Crude Production (kbpd) 8,000 Oil Rigs 7,000 1,400 1,200 1,000 6,000 800 600 5,000 Oil Rig Count Crude Oil Production (kbpd) 9,000 400 4,000 200 3,000 0 Natural Gas Production vs. Gas Rigs 70 65 1,800 Natural Gas Production (bcf/d) 1,600 Gas Rigs 1,400 60 1,200 1,000 55 50 800 Gas Rig Count Natural Gas Production (Bcf/d) 75 600 45 400 40 200 Source: Baker Hughes, EIA Resources, January 2014. For illustrative purposes only. Boldly Going Where No Production Was Before An interesting wrinkle of the current energy boom is that, outside of the Permian Basin, much of the incremental production is coming from areas that have never previously produced commercial amounts of oil. This means that the infrastructure necessary to move this production to market would either have to be built, refurbished, or re-purposed, which we believe provides growth prospects for infrastructure providers like MLPs.
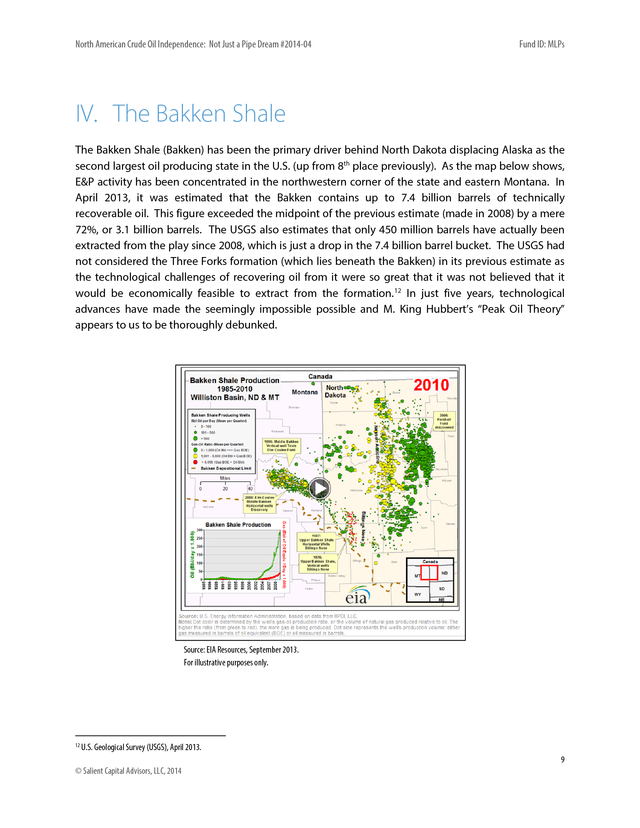
Throughout the piece, we take a look at the three areas that are expected to have the largest incremental crude oil production over the next 10 years: the Bakken Shale, the Eagle Ford, and the Permian. 8 © Salient Capital Advisors, LLC, 2014 . North American Crude Oil Independence: Not Just a Pipe Dream #2014-04 Fund ID: MLPs IV. The Bakken Shale The Bakken Shale (Bakken) has been the primary driver behind North Dakota displacing Alaska as the second largest oil producing state in the U.S. (up from 8th place previously). As the map below shows, E&P activity has been concentrated in the northwestern corner of the state and eastern Montana.
In April 2013, it was estimated that the Bakken contains up to 7.4 billion barrels of technically recoverable oil. This figure exceeded the midpoint of the previous estimate (made in 2008) by a mere 72%, or 3.1 billion barrels. The USGS also estimates that only 450 million barrels have actually been extracted from the play since 2008, which is just a drop in the 7.4 billion barrel bucket.
The USGS had not considered the Three Forks formation (which lies beneath the Bakken) in its previous estimate as the technological challenges of recovering oil from it were so great that it was not believed that it would be economically feasible to extract from the formation. 12 In just five years, technological advances have made the seemingly impossible possible and M. King Hubbert’s “Peak Oil Theory” appears to us to be thoroughly debunked. Source: EIA Resources, September 2013. For illustrative purposes only. 12 U.S.
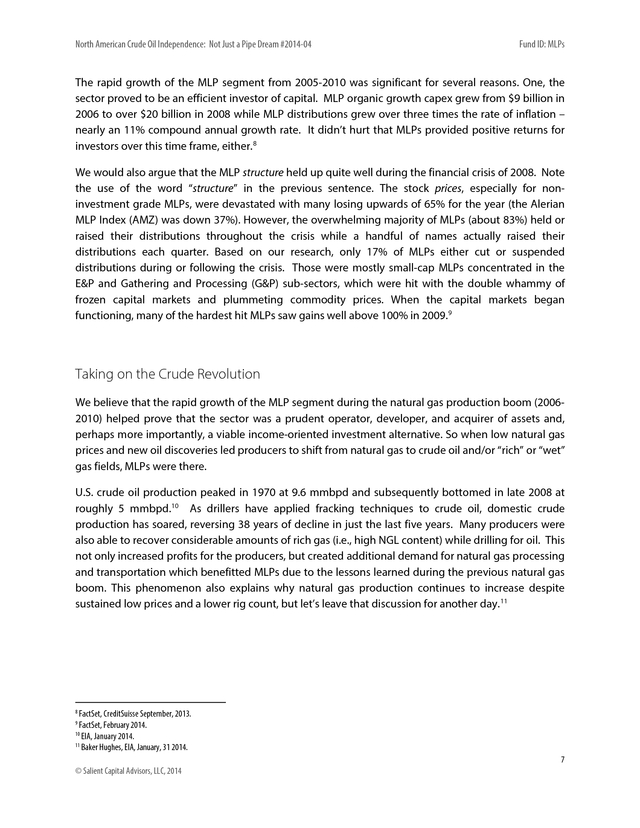
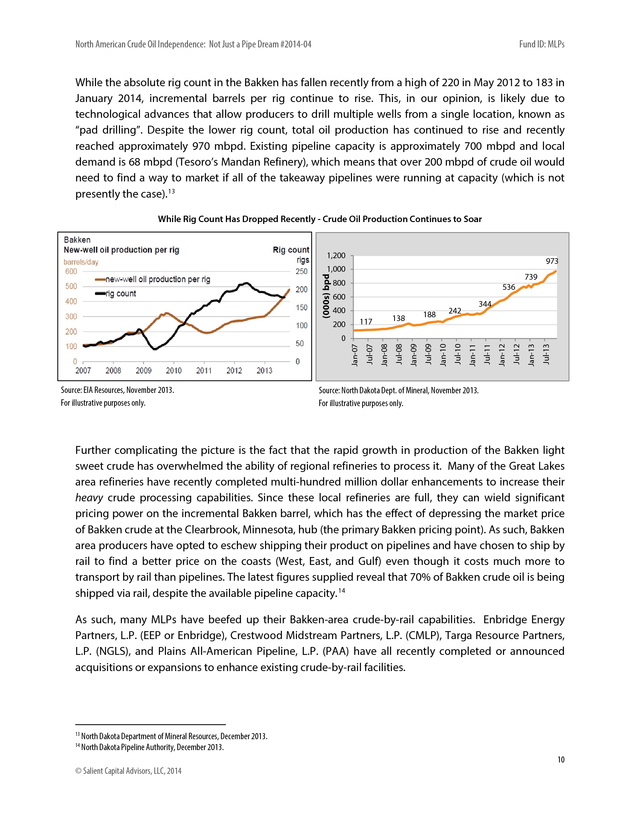
Geological Survey (USGS), April 2013. 9 © Salient Capital Advisors, LLC, 2014 . North American Crude Oil Independence: Not Just a Pipe Dream #2014-04 Fund ID: MLPs While the absolute rig count in the Bakken has fallen recently from a high of 220 in May 2012 to 183 in January 2014, incremental barrels per rig continue to rise. This, in our opinion, is likely due to technological advances that allow producers to drill multiple wells from a single location, known as “pad drilling”. Despite the lower rig count, total oil production has continued to rise and recently reached approximately 970 mbpd. Existing pipeline capacity is approximately 700 mbpd and local demand is 68 mbpd (Tesoro’s Mandan Refinery), which means that over 200 mbpd of crude oil would need to find a way to market if all of the takeaway pipelines were running at capacity (which is not presently the case).
13 While Rig Count Has Dropped Recently - Crude Oil Production Continues to Soar 1,200 973 (000s) bpd 1,000 739 800 536 600 400 117 200 344 242 188 138 Source: EIA Resources, November 2013. For illustrative purposes only. Jul-13 Jul-12 Jan-13 Jul-11 Jan-12 Jul-10 Jan-11 Jul-09 Jan-10 Jul-08 Jan-09 Jan-08 Jul-07 Jan-07 0 Source: North Dakota Dept. of Mineral, November 2013. For illustrative purposes only. Further complicating the picture is the fact that the rapid growth in production of the Bakken light sweet crude has overwhelmed the ability of regional refineries to process it. Many of the Great Lakes area refineries have recently completed multi-hundred million dollar enhancements to increase their heavy crude processing capabilities.
Since these local refineries are full, they can wield significant pricing power on the incremental Bakken barrel, which has the effect of depressing the market price of Bakken crude at the Clearbrook, Minnesota, hub (the primary Bakken pricing point). As such, Bakken area producers have opted to eschew shipping their product on pipelines and have chosen to ship by rail to find a better price on the coasts (West, East, and Gulf) even though it costs much more to transport by rail than pipelines. The latest figures supplied reveal that 70% of Bakken crude oil is being shipped via rail, despite the available pipeline capacity.
14 As such, many MLPs have beefed up their Bakken-area crude-by-rail capabilities. Enbridge Energy Partners, L.P. (EEP or Enbridge), Crestwood Midstream Partners, L.P.
(CMLP), Targa Resource Partners, L.P. (NGLS), and Plains All-American Pipeline, L.P. (PAA) have all recently completed or announced acquisitions or expansions to enhance existing crude-by-rail facilities. 13 14 North Dakota Department of Mineral Resources, December 2013. North Dakota Pipeline Authority, December 2013. 10 © Salient Capital Advisors, LLC, 2014 .
North American Crude Oil Independence: Not Just a Pipe Dream #2014-04 Fund ID: MLPs A Note on Recent Rail Incidents On December 12, 2013, Mr. Lynn Helms, the director of the North Dakota Department of Mineral Resources stated that he expected up to 90% of Bakken crude could move by rail in 2014. Just over two weeks later, a Bakken crude train collided with another train near Casselton, North Dakota, sending a massive fireball into the sky. The Casselton accident was the second high profile crude-byrail accident in just five months following July’s horrific Lac-Megantic, Quebec, derailment which killed 47 people.
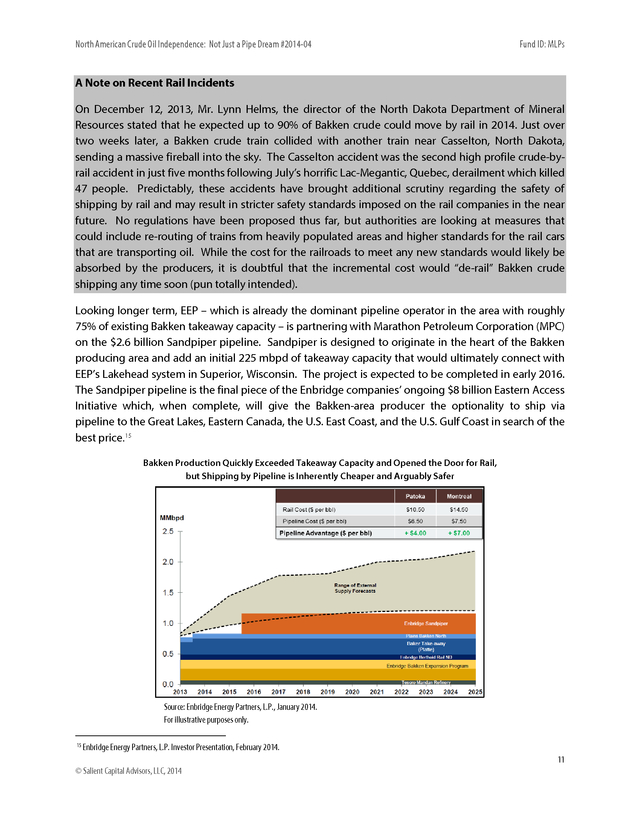
Predictably, these accidents have brought additional scrutiny regarding the safety of shipping by rail and may result in stricter safety standards imposed on the rail companies in the near future. No regulations have been proposed thus far, but authorities are looking at measures that could include re-routing of trains from heavily populated areas and higher standards for the rail cars that are transporting oil. While the cost for the railroads to meet any new standards would likely be absorbed by the producers, it is doubtful that the incremental cost would “de-rail” Bakken crude shipping any time soon (pun totally intended). Looking longer term, EEP – which is already the dominant pipeline operator in the area with roughly 75% of existing Bakken takeaway capacity – is partnering with Marathon Petroleum Corporation (MPC) on the $2.6 billion Sandpiper pipeline.
Sandpiper is designed to originate in the heart of the Bakken producing area and add an initial 225 mbpd of takeaway capacity that would ultimately connect with EEP’s Lakehead system in Superior, Wisconsin. The project is expected to be completed in early 2016. The Sandpiper pipeline is the final piece of the Enbridge companies’ ongoing $8 billion Eastern Access Initiative which, when complete, will give the Bakken-area producer the optionality to ship via pipeline to the Great Lakes, Eastern Canada, the U.S. East Coast, and the U.S.
Gulf Coast in search of the best price. 15 Bakken Production Quickly Exceeded Takeaway Capacity and Opened the Door for Rail, but Shipping by Pipeline is Inherently Cheaper and Arguably Safer Source: Enbridge Energy Partners, L.P., January 2014. For illustrative purposes only. 15 Enbridge Energy Partners, L.P. Investor Presentation, February 2014. 11 © Salient Capital Advisors, LLC, 2014 .
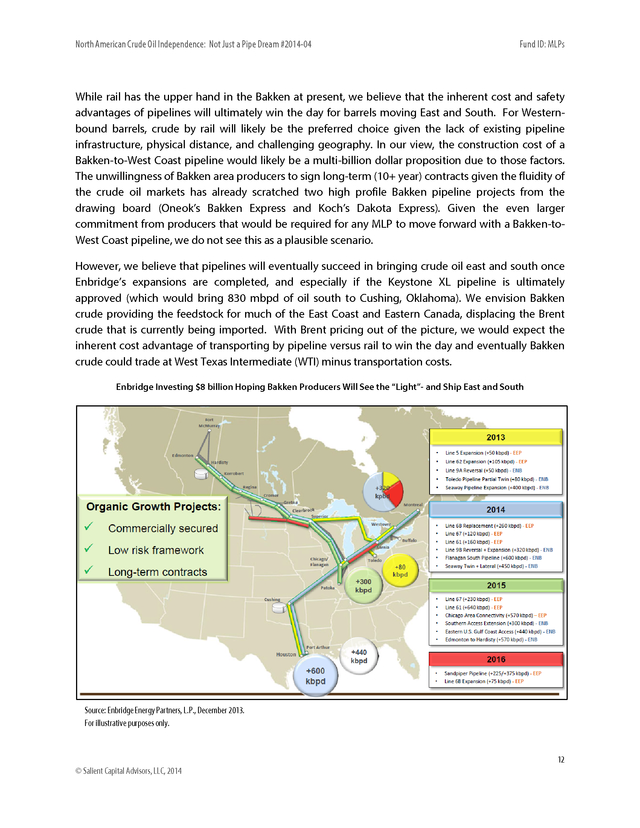
North American Crude Oil Independence: Not Just a Pipe Dream #2014-04 Fund ID: MLPs While rail has the upper hand in the Bakken at present, we believe that the inherent cost and safety advantages of pipelines will ultimately win the day for barrels moving East and South. For Westernbound barrels, crude by rail will likely be the preferred choice given the lack of existing pipeline infrastructure, physical distance, and challenging geography. In our view, the construction cost of a Bakken-to-West Coast pipeline would likely be a multi-billion dollar proposition due to those factors. The unwillingness of Bakken area producers to sign long-term (10+ year) contracts given the fluidity of the crude oil markets has already scratched two high profile Bakken pipeline projects from the drawing board (Oneok’s Bakken Express and Koch’s Dakota Express). Given the even larger commitment from producers that would be required for any MLP to move forward with a Bakken-toWest Coast pipeline, we do not see this as a plausible scenario. However, we believe that pipelines will eventually succeed in bringing crude oil east and south once Enbridge’s expansions are completed, and especially if the Keystone XL pipeline is ultimately approved (which would bring 830 mbpd of oil south to Cushing, Oklahoma).
We envision Bakken crude providing the feedstock for much of the East Coast and Eastern Canada, displacing the Brent crude that is currently being imported. With Brent pricing out of the picture, we would expect the inherent cost advantage of transporting by pipeline versus rail to win the day and eventually Bakken crude could trade at West Texas Intermediate (WTI) minus transportation costs. Enbridge Investing $8 billion Hoping Bakken Producers Will See the “Light”- and Ship East and South Source: Enbridge Energy Partners, L.P., December 2013. For illustrative purposes only. 12 © Salient Capital Advisors, LLC, 2014 . North American Crude Oil Independence: Not Just a Pipe Dream #2014-04 Fund ID: MLPs V. The Eagle Ford Shale The Eagle Ford Shale in South Texas has come out of nowhere to recently surpass the Bakken in terms of crude oil production. Originally thought to be a wet gas play, the Eagle Ford produced less than 1,000 bpd of crude oil as recently as 2009. By the end of 2013, crude production had topped 1.2 million bpd with ultimate production expected to reach 1.7-2.0 mmbpd by the end of the decade.
16 The dramatic increase in production has brought an economic windfall to the area but has created some thorny logistical issues as well. Source: EIA, February 2014. For illustrative purposes only. 16 EIA, February 2014. 13 © Salient Capital Advisors, LLC, 2014 . North American Crude Oil Independence: Not Just a Pipe Dream #2014-04 Fund ID: MLPs Pipelines Exist…But to the Wrong Places First and foremost, how do producers get all that oil to market? Surprisingly, given the lack of historical crude production, a lot of legacy infrastructure was in place. After all, it’s Texas – folks have been drilling for oil and gas for a long time. Most of the legacy South Texas infrastructure was related to conventional natural gas drilling in the area from years past. Those fields largely depleted themselves over the years, leaving miles of underutilized pipe in the ground.
In some cases, MLPs repurposed those existing pipelines to help alleviate the growing crude oil and NGL production glut. For example, Kinder Morgan’s Crude and Condensate Pipeline (KMCC), which can deliver up to 300 mbpd of Eagle Ford production to the Houston Ship Channel, came about by converting 113 miles of existing natural gas pipeline to crude service and then building a 65 mile extension of that pipe.17 Many of the existing pipelines delivered their barrels to Valero’s Three Rivers refinery (100 mbpd capacity) and then on to Corpus Christi (total refining capacity of 790 mbpd) instead of the greater Houston refining complex which can process over 2 mmbpd. With the rapid production growth, Three Rivers and the Corpus Christi refining complex have quickly been inundated with oil, leaving producers clamoring for alternative market outlets. Two of the largest MLPs, Enterprise Products Partners, L.P. (EPD) and Plains All-American Pipeline, L.P.
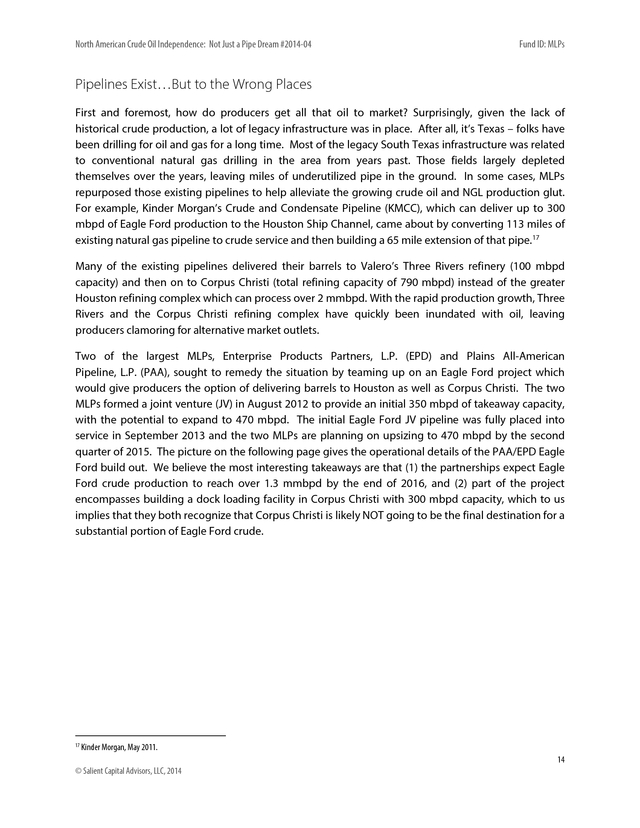
(PAA), sought to remedy the situation by teaming up on an Eagle Ford project which would give producers the option of delivering barrels to Houston as well as Corpus Christi. The two MLPs formed a joint venture (JV) in August 2012 to provide an initial 350 mbpd of takeaway capacity, with the potential to expand to 470 mbpd. The initial Eagle Ford JV pipeline was fully placed into service in September 2013 and the two MLPs are planning on upsizing to 470 mbpd by the second quarter of 2015.
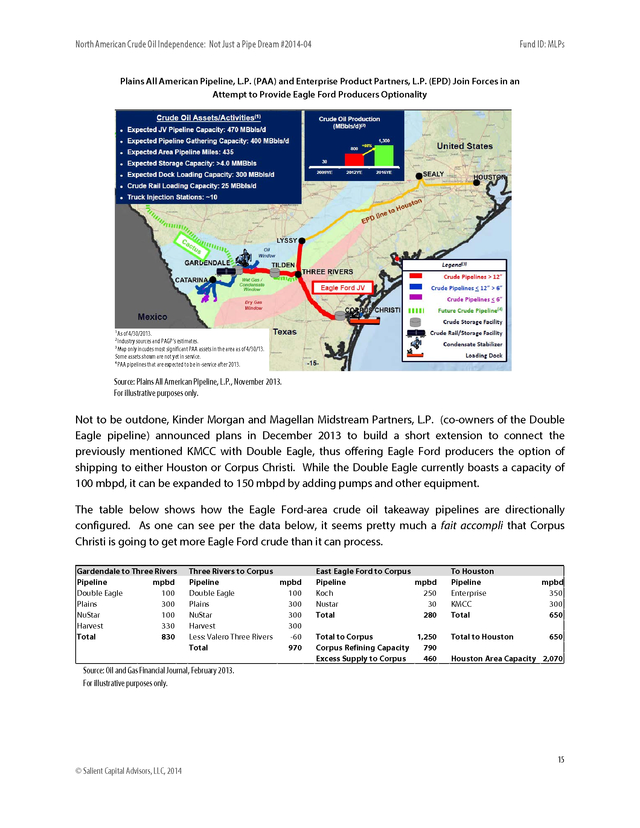
The picture on the following page gives the operational details of the PAA/EPD Eagle Ford build out. We believe the most interesting takeaways are that (1) the partnerships expect Eagle Ford crude production to reach over 1.3 mmbpd by the end of 2016, and (2) part of the project encompasses building a dock loading facility in Corpus Christi with 300 mbpd capacity, which to us implies that they both recognize that Corpus Christi is likely NOT going to be the final destination for a substantial portion of Eagle Ford crude. 17 Kinder Morgan, May 2011. 14 © Salient Capital Advisors, LLC, 2014 . North American Crude Oil Independence: Not Just a Pipe Dream #2014-04 Fund ID: MLPs Plains All American Pipeline, L.P. (PAA) and Enterprise Product Partners, L.P. (EPD) Join Forces in an Attempt to Provide Eagle Ford Producers Optionality 1 As of 4/30/2013. Industry sources and PAGP’s estimates. Map only incudes most significant PAA assets in the area as of 4/30/13. Some assets shown are not yet in service. 4 PAA pipelines that are expected to be in-service after 2013. 2 3 Source: Plains All American Pipeline, L.P., November 2013. For illustrative purposes only. Not to be outdone, Kinder Morgan and Magellan Midstream Partners, L.P. (co-owners of the Double Eagle pipeline) announced plans in December 2013 to build a short extension to connect the previously mentioned KMCC with Double Eagle, thus offering Eagle Ford producers the option of shipping to either Houston or Corpus Christi.
While the Double Eagle currently boasts a capacity of 100 mbpd, it can be expanded to 150 mbpd by adding pumps and other equipment. The table below shows how the Eagle Ford-area crude oil takeaway pipelines are directionally configured. As one can see per the data below, it seems pretty much a fait accompli that Corpus Christi is going to get more Eagle Ford crude than it can process. Gardendale to Three Rivers Pipeline mpbd Double Eagle 100 Plains 300 NuStar 100 Harvest 330 Total 830 Three Rivers to Corpus Pipeline mpbd Double Eagle 100 Plains 300 NuStar 300 Harvest 300 Less: Valero Three Rivers -60 Total 970 East Eagle Ford to Corpus Pipeline mpbd Koch 250 Nustar 30 Total 280 To Houston Pipeline Enterprise KMCC Total Total to Corpus 1,250 Corpus Refining Capacity 790 Excess Supply to Corpus 460 Total to Houston mpbd 350 300 650 650 Houston Area Capacity 2,070 Source: Oil and Gas Financial Journal, February 2013. For illustrative purposes only. 15 © Salient Capital Advisors, LLC, 2014 . North American Crude Oil Independence: Not Just a Pipe Dream #2014-04 Fund ID: MLPs First to Corpus Christi and then…? The Eagle Ford Shale has also taught us that simply having the pipelines in place to deliver product may not prove to be an adequate solution because the product being delivered is not what the end user needs. The Eagle Ford produces light sweet crude, which is not the preferred feedstock for the U.S. Gulf Coast refiners. Believing that the world was running out of light sweet crude, many U.S. refiners spent the last decade recalibrating their facilities to handle heavier sour barrels (i.e.
higher sulfur content), like those produced in Canada, Mexico, Venezuela, and throughout the Middle East. The Gulf Coast refiners are no exception. By the middle of 2013, light sweet crude imports to the Gulf Coast had dropped to 60 mbpd, down from a 650 mbpd average for the years 2008-10. 18 We expect the continued increase in domestic production to displace the remaining imports to the Gulf in short order. However, domestic light sweet production continues to ramp and there is the potential for a glut to form on the Gulf Coast.
Looking at the three Corpus Christi refiners, while the aggregate nameplate capacity of the facilities is 790 mbpd, only 172 mbpd is currently calibrated to handle light sweet crude, which means that over 1 mmbpd could eventually be delivered to Corpus Christi that cannot be processed locally. To take advantage of this potential scenario, MLPs have announced no fewer than five marine projects to barge the crude oil and condensate to other Gulf Coast and East Coast locations. This raises another issue – the U.S.
currently bans the export of crude oil. Further, all ships delivering between two U.S. ports must be American-flagged, American-made, and American-crewed according to the Jones Act of 1920, which severely restricts the ability and raises the cost for companies to move barrels to more accommodating markets.
19 The potentially massive light sweet supply/demand imbalance may create a need for innovative solutions to allow producers to get the best price for their barrels. Whether the solution proves to be additional pipelines to Houston and beyond (side-stepping Corpus Christi), further marine terminal development in Corpus Christi, a relaxing of the export and/or Jones Act laws, or a combination of any of the above, we believe that the tax-advantaged structure of MLPs and first-mover advantage given the substantial existing asset footprint in place should give MLPs a leg up on the competition. VI. The Permian Basin: The Re-Awakening of a Giant What can be said about the Permian Basin (Permian) that has not already been said? Basically, the Permian IS what most people imagine when they think of oil production – wide, dusty vistas with a solitary oil derrick pumping out black gold.
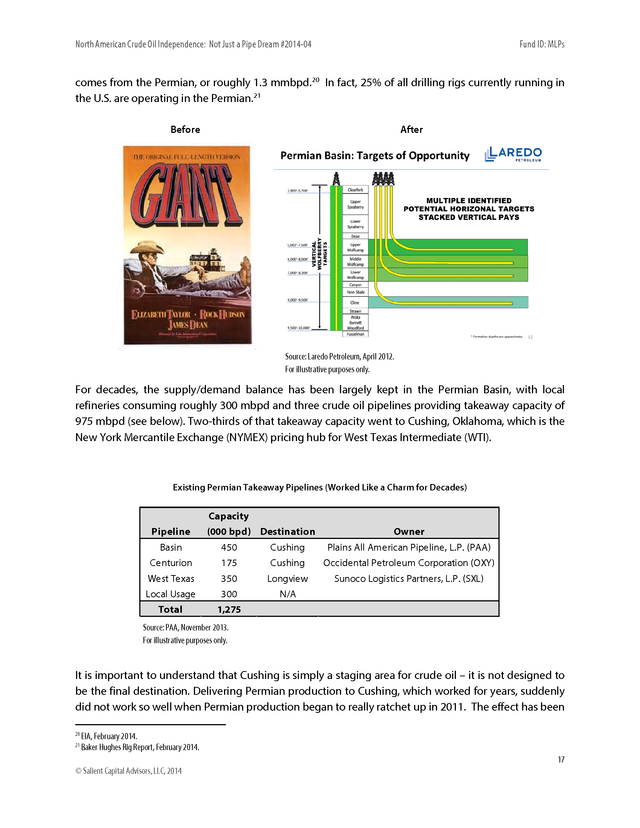
While the drilling activity that takes place in the Permian today is light years more sophisticated than what Edna Ferber portrayed in the 1956 movie Giant, the end result is the same. The Permian Basin produces oil, and lots of it – 15% of current U.S. production 18 19 EIA, October 31, 2013. Oil & Gas Financial Journal, February 2013. 16 © Salient Capital Advisors, LLC, 2014 .
North American Crude Oil Independence: Not Just a Pipe Dream #2014-04 Fund ID: MLPs comes from the Permian, or roughly 1.3 mmbpd. 20 In fact, 25% of all drilling rigs currently running in the U.S. are operating in the Permian. 21 Before After Source: Laredo Petroleum, April 2012. For illustrative purposes only. For decades, the supply/demand balance has been largely kept in the Permian Basin, with local refineries consuming roughly 300 mbpd and three crude oil pipelines providing takeaway capacity of 975 mbpd (see below).
Two-thirds of that takeaway capacity went to Cushing, Oklahoma, which is the New York Mercantile Exchange (NYMEX) pricing hub for West Texas Intermediate (WTI). Existing Permian Takeaway Pipelines (Worked Like a Charm for Decades) Capacity Pipeline (000 bpd) Destination Owner Basin 450 Cushing Plains All American Pipeline, L.P. (PAA) Centurion 175 Cushing Occidental Petroleum Corporation (OXY) Sunoco Logistics Partners, L.P. (SXL) West Texas 350 Longview Local Usage 300 N/A Total 1,275 Source: PAA, November 2013. For illustrative purposes only. It is important to understand that Cushing is simply a staging area for crude oil – it is not designed to be the final destination.
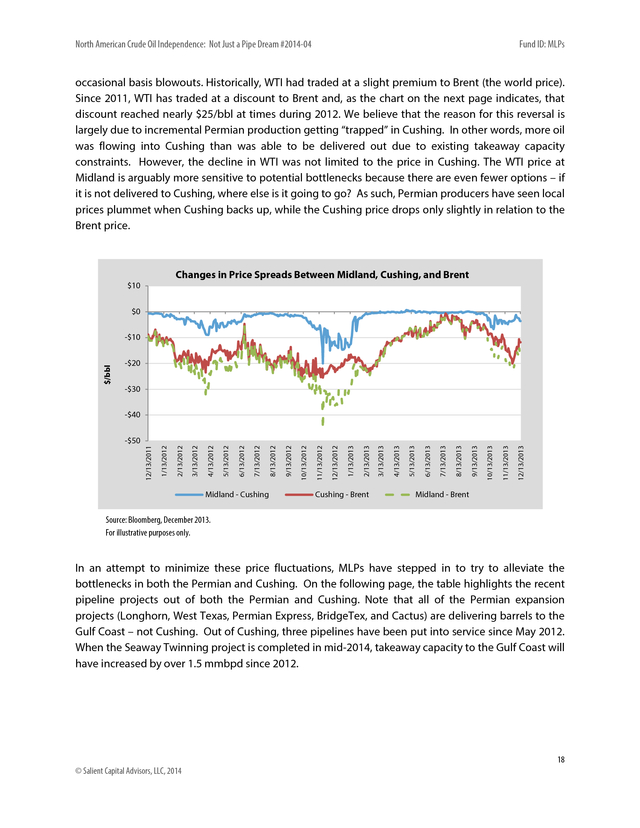
Delivering Permian production to Cushing, which worked for years, suddenly did not work so well when Permian production began to really ratchet up in 2011. The effect has been 20 21 EIA, February 2014. Baker Hughes Rig Report, February 2014. 17 © Salient Capital Advisors, LLC, 2014 . North American Crude Oil Independence: Not Just a Pipe Dream #2014-04 Fund ID: MLPs occasional basis blowouts. Historically, WTI had traded at a slight premium to Brent (the world price). Since 2011, WTI has traded at a discount to Brent and, as the chart on the next page indicates, that discount reached nearly $25/bbl at times during 2012. We believe that the reason for this reversal is largely due to incremental Permian production getting “trapped” in Cushing. In other words, more oil was flowing into Cushing than was able to be delivered out due to existing takeaway capacity constraints.
However, the decline in WTI was not limited to the price in Cushing. The WTI price at Midland is arguably more sensitive to potential bottlenecks because there are even fewer options – if it is not delivered to Cushing, where else is it going to go? As such, Permian producers have seen local prices plummet when Cushing backs up, while the Cushing price drops only slightly in relation to the Brent price. Changes in Price Spreads Between Midland, Cushing, and Brent $10 $0 $/bbl -$10 -$20 -$30 -$40 Midland - Cushing Cushing - Brent 12/13/2013 11/13/2013 9/13/2013 10/13/2013 8/13/2013 7/13/2013 6/13/2013 5/13/2013 4/13/2013 3/13/2013 2/13/2013 1/13/2013 12/13/2012 11/13/2012 10/13/2012 9/13/2012 8/13/2012 7/13/2012 6/13/2012 5/13/2012 4/13/2012 3/13/2012 2/13/2012 1/13/2012 12/13/2011 -$50 Midland - Brent Source: Bloomberg, December 2013. For illustrative purposes only. In an attempt to minimize these price fluctuations, MLPs have stepped in to try to alleviate the bottlenecks in both the Permian and Cushing. On the following page, the table highlights the recent pipeline projects out of both the Permian and Cushing.
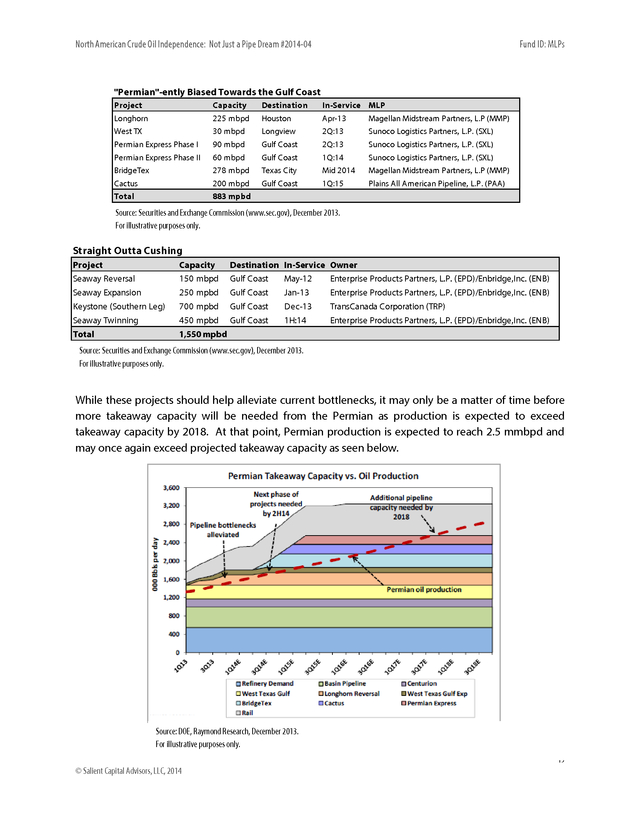
Note that all of the Permian expansion projects (Longhorn, West Texas, Permian Express, BridgeTex, and Cactus) are delivering barrels to the Gulf Coast – not Cushing. Out of Cushing, three pipelines have been put into service since May 2012. When the Seaway Twinning project is completed in mid-2014, takeaway capacity to the Gulf Coast will have increased by over 1.5 mmbpd since 2012. 18 © Salient Capital Advisors, LLC, 2014 . North American Crude Oil Independence: Not Just a Pipe Dream #2014-04 Fund ID: MLPs "Permian"-ently Biased Towards the Gulf Coast Project Capacity Destination In-Service MLP Longhorn 225 mbpd Houston Apr-13 Magellan Midstream Partners, L.P (MMP) West TX 30 mbpd Longview 2Q:13 Sunoco Logistics Partners, L.P. (SXL) Permian Express Phase I 90 mbpd Gulf Coast 2Q:13 Sunoco Logistics Partners, L.P. (SXL) Permian Express Phase II 60 mbpd Gulf Coast 1Q:14 Sunoco Logistics Partners, L.P. (SXL) BridgeTex 278 mbpd Texas City Mid 2014 Magellan Midstream Partners, L.P (MMP) Cactus 200 mbpd Gulf Coast 1Q:15 Plains All American Pipeline, L.P.
(PAA) Total 883 mpbd Source: Securities and Exchange Commission (www.sec.gov), December 2013. For illustrative purposes only. Straight Outta Cushing Project Capacity Destination In-Service Owner Seaway Reversal 150 mbpd Gulf Coast May-12 Enterprise Products Partners, L.P. (EPD)/Enbridge,Inc. (ENB) Seaway Expansion 250 mpbd Gulf Coast Jan-13 Enterprise Products Partners, L.P.
(EPD)/Enbridge,Inc. (ENB) Keystone (Southern Leg) 700 mpbd Gulf Coast Dec-13 TransCanada Corporation (TRP) Seaway Twinning 450 mpbd Gulf Coast 1H:14 Enterprise Products Partners, L.P. (EPD)/Enbridge,Inc.
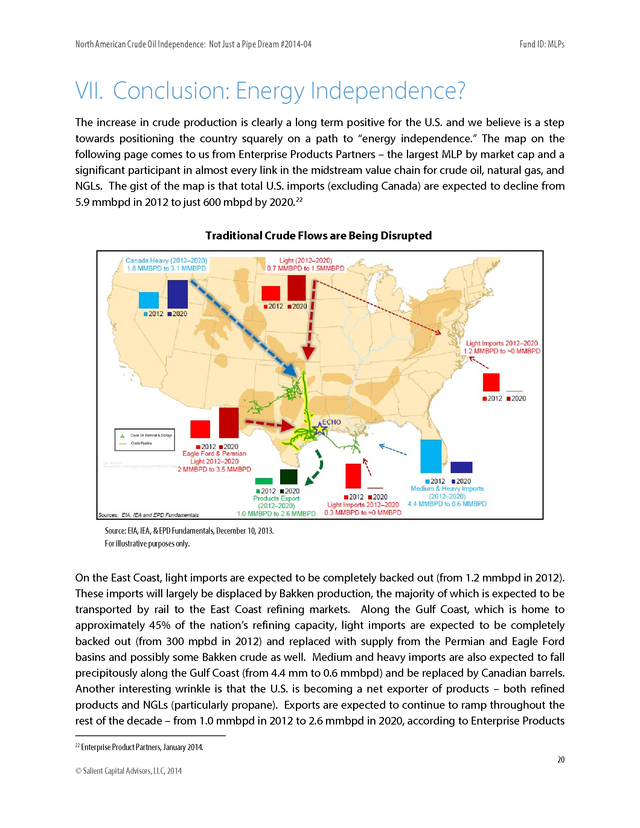
(ENB) Total 1,550 mpbd Source: Securities and Exchange Commission (www.sec.gov), December 2013. For illustrative purposes only. While these projects should help alleviate current bottlenecks, it may only be a matter of time before more takeaway capacity will be needed from the Permian as production is expected to exceed takeaway capacity by 2018. At that point, Permian production is expected to reach 2.5 mmbpd and may once again exceed projected takeaway capacity as seen below. Source: DOE, Raymond Research, December 2013. For illustrative purposes only. 19 © Salient Capital Advisors, LLC, 2014 . North American Crude Oil Independence: Not Just a Pipe Dream #2014-04 Fund ID: MLPs VII. Conclusion: Energy Independence? The increase in crude production is clearly a long term positive for the U.S. and we believe is a step towards positioning the country squarely on a path to “energy independence.” The map on the following page comes to us from Enterprise Products Partners – the largest MLP by market cap and a significant participant in almost every link in the midstream value chain for crude oil, natural gas, and NGLs. The gist of the map is that total U.S.
imports (excluding Canada) are expected to decline from 5.9 mmbpd in 2012 to just 600 mbpd by 2020. 22 Traditional Crude Flows are Being Disrupted Source: EIA, IEA, & EPD Fundamentals, December 10, 2013. For illustrative purposes only. On the East Coast, light imports are expected to be completely backed out (from 1.2 mmbpd in 2012). These imports will largely be displaced by Bakken production, the majority of which is expected to be transported by rail to the East Coast refining markets. Along the Gulf Coast, which is home to approximately 45% of the nation’s refining capacity, light imports are expected to be completely backed out (from 300 mpbd in 2012) and replaced with supply from the Permian and Eagle Ford basins and possibly some Bakken crude as well.
Medium and heavy imports are also expected to fall precipitously along the Gulf Coast (from 4.4 mm to 0.6 mmbpd) and be replaced by Canadian barrels. Another interesting wrinkle is that the U.S. is becoming a net exporter of products – both refined products and NGLs (particularly propane). Exports are expected to continue to ramp throughout the rest of the decade – from 1.0 mmbpd in 2012 to 2.6 mmbpd in 2020, according to Enterprise Products 22 Enterprise Product Partners, January 2014. 20 © Salient Capital Advisors, LLC, 2014 .
North American Crude Oil Independence: Not Just a Pipe Dream #2014-04 Fund ID: MLPs and that does not even include potential crude oil exports, which are not permitted at this juncture (and is another topic entirely). 23 Taken as a whole, non-North American U.S. crude oil imports are expected to decline by 90% within seven years.23 This is what is meant by “energy independence.” True, the U.S. will likely never be able to produce the approximately 18.5 million bpd of crude oil that it currently consumes daily, but if we include Canada and Mexico – especially now that the Mexican government has recently voted to allow foreign investment in developing its energy reserves – we believe we can get pretty close.
Having a cheap, abundant, and reliable source of energy would likely encourage increased investment in this country, which is something we are already seeing in the petrochemical space due to the abundance of cheap NGLs. A scenario that looked impossible only a few years ago now seems possible. 23 Enterprise Product Partners, L.P., January 2014. 21 © Salient Capital Advisors, LLC, 2014 . North American Crude Oil Independence: Not Just a Pipe Dream #2014-04 Fund ID: MLPs VIII. Risks Each individual partnership has its own set of risks, which generally include (but are not limited to) commodity price movements, declines in throughput volumes, integration and execution risks associated with acquisitions, damages from natural disasters or terrorism, and interest rate risks. Some of the risks to the MLP space as a whole are discussed below. Economic Weakness. While equity markets have performed relatively well following the 2008 financial crisis, the U.S.
and global economies have not recovered as quickly as they have following previous recessions. Many economists expect the economy to continue to limp along at approximately a 2% growth rate, but there are some that argue for higher growth and yet others that see a looming recession. If the economy experiences another round of weakness, MLP returns may be impacted. Treasury Rates.
24 As of December 31, 2013, the yield on the 10-Year Treasury was 3.03% vs. the December 2012 close of 1.76%. On average, economists at the major investment banks expect the yield on the 10-Year Treasury to be 3.40% at the end of 2014 (with a range of 2.5 to 4.0%).
While MLPs have historically had a low correlation to Treasury rates, a rapid, dramatic move upward in Treasury yields may create some near-term pressure on MLPs. Credit Spreads. MLPs have historically exhibited a relatively high correlation to major credit spread widening (and tightening) events. It has been relatively quiet recently, but if debt issues in either the U.S.
or globally begin to escalate once again, both investment grade and high yield credit spreads could be negatively impacted. Such a situation would most likely negatively impact MLP valuations. Commodities. Prices for both natural gas and NGLs have been weak for a while now (natural gas since 2009, NGLs since May 2012).
However, the recent boom in U.S. crude oil production has created significant growth opportunities for midstream infrastructure providers. Should oil prices experience a significant and prolonged decline that leads to lower future production (and thus fewer growth opportunities for MLPs), valuations may be negatively impacted. Fund Flows.
Positive fund flows have been a major contributor to the performance of MLPs over the past few years. Investors remain concerned about the low rates on bonds and CDs not meeting their income needs, as well as the potential drop in bond prices if yields increase rapidly. MLPs have often been seen as an alternative to bonds due to higher yields and the ability to grow the distribution to offset any potential increase in interest rates.
While we believe near term fund flows will continue to be strong, we could see investors ultimately return to traditional fixed income instruments if rates rise quickly. Tax Law Changes. We believe this is unlikely in the absence of overall tax reform, but any negative change in the tax code would likely have a detrimental impact on MLPs. 24 Source: Bloomberg, Salient Capital Advisors, LLC. December 31, 2013. 22 © Salient Capital Advisors, LLC, 2014 .
North American Crude Oil Independence: Not Just a Pipe Dream #2014-04 Fund ID: MLPs IX. Glossary AMZ (Alerian MLP Index) is a composite of the 50 most prominent energy MLPs that provides investors with a comprehensive benchmark for this emerging asset class. RISKS: Include tax related risks due to their partnership status, unlike the other asset classes discussed, as well as possible higher volatility than the majority of the other asset classes. Brent Crude is a major trading classification of light sweet crude oil that serves as a major benchmark price for purchases of oil worldwide. Capex (capital expenditure) Funds used by a company to acquire or upgrade physical assets such as property, buildings or equipment. Compound Growth is the year-over-year growth rate of an investment over a specified period of time. Exploration & Production Subsector is a group of companies that explore for, and produce oil and gas. Gathering & Processing involves moving natural gas from the wellhead to a natural gas processing plant, where NGLs and other impurities are removed from the natural gas stream. Heavy crude is oil that is highly viscous, and cannot easily flow to production wells under normal reservoir conditions. Light crude is liquid petroleum that has a low density and flows freely at room temperature. Light crude oil receives a higher price than heavy crude oil on the commodity markets because it produces a higher percentage of gasoline and diesel fuel when converted into products by an oil refinery. Majors refer to large, multi-national oil gas companies with fully integrated assets covering the entire upstream, midstream, and downstream portions of the energy value chain. Examples include ExxonMobil, Chevron, and BP. Market Cap is the total value of the issued shares of a publicly traded company; it is equal to the share price times the number of shares outstanding. Mbpd is thousand barrels per day. Mmbpd is million barrels per day. Mcf is 1,000 cubic feet. Midstream services are the transportation (by pipeline, rail, barge, or truck), storage and wholesale marketing of crude or refined petroleum products. Natural Gas Condensates is a low-density mixture of hydrocarbon liquids that are present as gaseous components in the raw natural gas produced from many natural gas fields. Natural Gas Liquids (NGL) are hydrocarbons that are contained in natural gas and include ethane, propane, butane, isobutane, and natural gasoline. 23 © Salient Capital Advisors, LLC, 2014 .
North American Crude Oil Independence: Not Just a Pipe Dream #2014-04 Fund ID: MLPs NYMEX is the world’s largest physical commodity futures exchange. Peak Oil Theory states that there is a point in time when the maximum rate of petroleum extraction is reached, after which the rate of production is expected to enter terminal decline. Rich/Wet Gas is natural gas that is high in natural gas liquids (NGL) content. The level is measured in gallons per mcf (GPM). The U.S. Geological Survey is a scientific agency of the United States government. WCS (Western Canadian Select) is one of North America’s largest heavy crude oil streams. WTI (West Texas Intermediate) is also known as Texas light sweet, a grade of crude oil used as a benchmark in oil pricing. 24 © Salient Capital Advisors, LLC, 2014 . 4265 San Felipe, 8th Floor Houston, Texas 77027 (800) 994-0755 Salientpartners.com .
Salient Partners, L.P. and affiliates do not provide tax or legal advice. Please consult your tax and or legal professional to determine how the information contained in the publication may apply to your situation. .
North American Crude Oil Independence: Not Just a Pipe Dream #2014-04 Fund ID: MLPs This information is being provided to you by Salient Capital Advisors, LLC. It is intended solely for educational purposes. No other distribution or use of these materials has been authorized. The opinions expressed in these materials represent the personal views of the investment professionals of Salient Capital Advisors, LLC and is based on their broad based investment knowledge, experience, research and analysis.
It must be noted, however, that no one can accurately predict the future of the market with certainty or guarantee future investment performance. Past performance is not a guarantee of future results. Certain statements in this communication are forward-looking statements of Salient Capital Advisors, LLC. The forward-looking statements and other views expressed herein are as of the date of this letter. Actual future results or occurrences may differ significantly from those anticipated in any forward-looking statements, and there is no guarantee that any predictions will come to pass.
The views expressed herein are subject to change at any time, due to numerous market and other factors. The Adviser disclaims any obligation to update publicly or revise any forward-looking statements or views expressed herein. This information is neither an offer to sell nor a solicitation of any offer to buy any securities. Any offering or solicitation will be made only to eligible investors and pursuant to any applicable Private Placement Memorandum and other governing documents, all of which must be read in their entirety. MLPs are subject to regulatory and tax risks, including but not limited to changes in current tax law which could result in MLPs being treated as corporations for U.S.
federal income tax purposes or the elimination or reduction of MLPs tax deductions. MLP returns have the potential to be highly volatile, an MLP is also subject to liquidity risk, potential conflicts of interest as a result of the MLP ownership structure and the risks of the specific sector in which the MLP is concentrated. Research services are provided by Salient Capital Advisors, LLC, a wholly owned subsidiary of Salient Partners, L.P. and a Securities and Exchange Commission Registered Investment Adviser. Registration as an investment adviser does not imply any level of skill or training.
Salient research has been prepared without regard to the individual financial circumstances and objectives of persons who receive it. Salient recommends that investors independently evaluate particular investments and strategies, and encourage investors to seek the advice of a financial advisor. The appropriateness of a particular investment or strategy will depend on an investor’s individual circumstances and objectives. Salient Capital Advisors, LLC does not provide tax advice.
Please contact your tax professional to determine how the information contained in this document may apply to your situation. Salient is the trade name for Salient Partners, L.P., which together with its subsidiaries provides asset management and advisory services. Insurance products offered through Salient Insurance Agency, LLC (Texas license #1736192). Trust services provided by Salient Trust Co., LTA.
Securities offered through Salient Capital, L.P., a registered broker-dealer and Member FINRA, SIPC. Each of Salient Insurance Agency, LLC, Salient Trust Co., LTA, and Salient Capital, L.P., is a subsidiary of Salient Partners, L.P. 1 © Salient Capital Advisors, LLC, 2014 . North American Crude Oil Independence: Not Just a Pipe Dream #2014-04 Fund ID: MLPs Table of Contents I. Executive Summary II. Introduction III. But First, A Little Background a. b. Taking on the Crude Revolution Boldly Going Where No Production Was Before IV. The Bakken Shale V. The Eagle Ford Shale a. Pipelines Exist…But to the Wrong Places b. First to Corpus Christi and then…? VI. The Permian Basin: The Re-Awakening of a Giant a. Existing Permian Takeaway Pipelines (Worked Like a Charm for Decades) VII. Conclusion: Energy Independence? VIII. Risks IX. Glossary 2 © Salient Capital Advisors, LLC, 2014 . North American Crude Oil Independence: Not Just a Pipe Dream #2014-04 I. Fund ID: MLPs Executive Summary Much has been written about the ongoing “energy renaissance” and how domestic crude oil and natural gas production has reversed years of decline to reach levels not seen in decades. However, we have not seen much discussion of the role that Master Limited Partnerships (MLPs) have played in helping to facilitate this energy boom. We believe that MLPs could be beneficiaries of increased domestic production levels for an extended period of time to come as additional energy infrastructure is needed to get the incremental production to market. This paper is the first in what we plan to be a series of periodic reports to help educate investors about how MLPs are at the forefront of the energy rush and why we believe it may make sense for investors to consider MLPs as a portion of their comprehensive asset allocation strategy. For this first installment, we will focus on domestic crude oil production since we believe that the renewed focus on crude is what is driving the current round of energy infrastructure expansion. Specifically, we will concentrate on three areas that have collectively contributed the lion’s share of the recent surge in crude oil production: the Bakken Shale in North Dakota, the Eagle Ford Shale in South Texas, and the Permian Basin in West Texas. We detail how each of the plays presented their own unique logistical challenges and how MLPs have worked with local producers to help provide solutions. In summary, we believe that the aforementioned “energy renaissance” is real and that MLPs may be well positioned to benefit from what could be hundreds of billions of dollars spent over the next decade to make the dream of North American energy independence a reality. We hope you enjoy it. 3 © Salient Capital Advisors, LLC, 2014 .
North American Crude Oil Independence: Not Just a Pipe Dream #2014-04 Fund ID: MLPs II. Introduction Question: Which U.S. state had the fastest growing population in percentage terms over the last three years, enjoys real estate prices 33% lower than the U.S. median, and sports the lowest unemployment rate of all 50 states? Gotta be Texas, right? Wrong.
It’s North Dakota. 1 Why North Dakota? Because North Dakota sits on top of the Bakken Shale, a massive formation calculated to contain between 7 and 11 billion barrels of recoverable crude oil. 2 While geologists have known for years that the oil was there, only recently has technology advanced enough to make it economically feasible for Exploration and Production (E&P) companies to drill for it.
In just the last seven years, North Dakota crude oil production has climbed from roughly 100 thousand barrels per day (mbpd) to over 970 mbpd. At approximately $100/barrel, you can see how that kind of money could start to attract a crowd. North Dakota’s population has recently climbed to more than 723,000 setting a new record for the state.
3 When was the old record set? The 1930 census. So in just over seven years of extensive drilling in and around the Bakken formation, North Dakota has been able to reverse over seven decades of population decline. And the best part of North Dakota’s economic resurgence is that the boom has not been limited to North Dakota. The last seven years have seen an explosion in North American energy production which has created “North Dakota-esque” economic booms in a multitude of locations where hydrocarbons (crude oil, natural gas, and natural gas liquids (NGLs)) had never before been produced in commercial quantities.
Areas such as the Marcellus and Utica Shales in Pennsylvania and Ohio and the Eagle Ford Shale in South Texas have seen a surge of activity in recent years. Even the venerable Permian Basin of West Texas, which has been producing crude oil since the 1920s, is enjoying its highest production in 40 years. 4 Domestic crude oil production has increased by more than 2 million bpd (mmbpd) since 2008, and the rapid increase has created some logistical issues.
Once hydrocarbons are found, infrastructure is required to move the products to market – and it can never come fast enough for producers. Theoretically, similar grades of crude should trade at roughly the same price minus transportation costs to get it to market. However, as production has overwhelmed takeaway capacity in some basins, there have been periods of major price dislocations that go well beyond transportation costs (as seen on the following page). Ultimately, we believe that these price differentials will get ironed out primarily due to investment in infrastructure. Bureau of Labor Statistics, December 2013. U.S.
Geological Survey, April 2013. 3 United States Census Bureau, July 2013. 4 U.S. Energy Information Administration (EIA), March 2014. 1 2 4 © Salient Capital Advisors, LLC, 2014 . North American Crude Oil Independence: Not Just a Pipe Dream #2014-04 Fund ID: MLPs Source: Enbridge Energy Partners – December Investors Presentation, prices as of December 5, 2013. WTI: West Texas Intermediate, WCS: Western Canadian Select For illustrative purposes only. Please refer to the glossary for a list of definitions. We believe that the production boom is going to continue in the coming years, which may provide a myriad of potential growth opportunities for MLPs to help alleviate the bottlenecks. In fact, there is currently a $45 billion backlog of crude oil projects expected to be completed over the next five years – the overwhelming majority of which will be constructed by MLPs. 5 In the pages that follow, we discuss three of the major oil producing basins and some of the dynamics in each. III.
But first, a little background… Although the MLP structure was created in 1986, for years the space remained somewhat of an investment backwater highlighted by largely illiquid stocks with high yields and little organic growth. At the end of 2004, there were only 36 publicly-traded MLPs with a combined market cap of $54 billion. 6 All that began to change with the natural gas production boom. The North American energy revolution began in earnest back in 2005 when natural gas producers applied hydraulic fracturing (“fracking”) to shale formations across the country. Though the technique had been around since the 1940s, it had not been widely applied until the middle of the last decade as natural gas prices had remained steadily above $10/thousand cubic feet (mcf) following the supply disruption from Hurricanes Katrina and Rita in August and September 2005.
Fracking involves injecting large amounts of water, sand, and a chemical mixture under high pressure into a shale formation which creates fissures in the shale and allows natural gas and crude oil to flow back up the well. In just a few years, a perceived natural gas shortage turned into a natural gas glut. 5 6 Bentek, En*Vantage, Credit Suisse, September 2013. Alerian Capital Management, November 2013. 5 © Salient Capital Advisors, LLC, 2014 . North American Crude Oil Independence: Not Just a Pipe Dream #2014-04 Fund ID: MLPs Obviously, all of this production needed to get from the wellhead to the user markets which resulted in an increased demand for both natural gas processing and transportation capacity. The transportation, processing, and storage of commodities are three core links in the midstream portion of the energy value chain. Midstream services are by nature capital-intensive efforts that historically have produced relatively low-margin, though largely predictable, cash flows. As natural gas production ramped, the need for additional midstream infrastructure increased as well.
However, many of the “majors” and other E&P companies were hesitant to invest heavily in midstream assets as the expected returns on these activities are generally lower than other parts of their businesses like E&P and refining. This is where MLPs came in. In order to meet the increasing demand for midstream services and to “unlock shareholder value,” a proliferation of companies such as The Williams Companies, Inc., Loews Corporation, and Spectra Energy Corporation began to move some or all of their midstream assets into MLPs. Several other companies came public as MLPs during those years as well, and by the end of 2010, there were 72 MLPs with a combined market capitalization of $229B.
7 MLP Sector Growth Coincided With Natural Gas Production Boom 62 250 60 200 58 $B Bcf/d 150 56 100 54 50 52 50 1999 2000 2001 2002 2003 2004 2005 2006 US Natural Gas Production (Bcf/d) 2007 2008 2009 0 2010 MLP Market Cap ($B) Source: United States Energy Information Administration (EIA), FactSet, September 2013. For illustrative purposes only. 7 Alerian Capital Management, November 2013. 6 © Salient Capital Advisors, LLC, 2014 . North American Crude Oil Independence: Not Just a Pipe Dream #2014-04 Fund ID: MLPs The rapid growth of the MLP segment from 2005-2010 was significant for several reasons. One, the sector proved to be an efficient investor of capital. MLP organic growth capex grew from $9 billion in 2006 to over $20 billion in 2008 while MLP distributions grew over three times the rate of inflation – nearly an 11% compound annual growth rate. It didn’t hurt that MLPs provided positive returns for investors over this time frame, either.
8 We would also argue that the MLP structure held up quite well during the financial crisis of 2008. Note the use of the word “structure” in the previous sentence. The stock prices, especially for noninvestment grade MLPs, were devastated with many losing upwards of 65% for the year (the Alerian MLP Index (AMZ) was down 37%).
However, the overwhelming majority of MLPs (about 83%) held or raised their distributions throughout the crisis while a handful of names actually raised their distributions each quarter. Based on our research, only 17% of MLPs either cut or suspended distributions during or following the crisis. Those were mostly small-cap MLPs concentrated in the E&P and Gathering and Processing (G&P) sub-sectors, which were hit with the double whammy of frozen capital markets and plummeting commodity prices.
When the capital markets began functioning, many of the hardest hit MLPs saw gains well above 100% in 2009. 9 Taking on the Crude Revolution We believe that the rapid growth of the MLP segment during the natural gas production boom (20062010) helped prove that the sector was a prudent operator, developer, and acquirer of assets and, perhaps more importantly, a viable income-oriented investment alternative. So when low natural gas prices and new oil discoveries led producers to shift from natural gas to crude oil and/or “rich” or “wet” gas fields, MLPs were there. U.S.
crude oil production peaked in 1970 at 9.6 mmbpd and subsequently bottomed in late 2008 at roughly 5 mmbpd.10 As drillers have applied fracking techniques to crude oil, domestic crude production has soared, reversing 38 years of decline in just the last five years. Many producers were also able to recover considerable amounts of rich gas (i.e., high NGL content) while drilling for oil. This not only increased profits for the producers, but created additional demand for natural gas processing and transportation which benefitted MLPs due to the lessons learned during the previous natural gas boom.
This phenomenon also explains why natural gas production continues to increase despite sustained low prices and a lower rig count, but let’s leave that discussion for another day. 11 FactSet, CreditSuisse September, 2013. FactSet, February 2014. 10 EIA, January 2014. 11 Baker Hughes, EIA, January, 31 2014. 8 9 7 © Salient Capital Advisors, LLC, 2014 . North American Crude Oil Independence: Not Just a Pipe Dream #2014-04 Fund ID: MLPs The Tale of Two Rig Types Crude Production vs. Oil Rigs 1,600 Crude Production (kbpd) 8,000 Oil Rigs 7,000 1,400 1,200 1,000 6,000 800 600 5,000 Oil Rig Count Crude Oil Production (kbpd) 9,000 400 4,000 200 3,000 0 Natural Gas Production vs. Gas Rigs 70 65 1,800 Natural Gas Production (bcf/d) 1,600 Gas Rigs 1,400 60 1,200 1,000 55 50 800 Gas Rig Count Natural Gas Production (Bcf/d) 75 600 45 400 40 200 Source: Baker Hughes, EIA Resources, January 2014. For illustrative purposes only. Boldly Going Where No Production Was Before An interesting wrinkle of the current energy boom is that, outside of the Permian Basin, much of the incremental production is coming from areas that have never previously produced commercial amounts of oil. This means that the infrastructure necessary to move this production to market would either have to be built, refurbished, or re-purposed, which we believe provides growth prospects for infrastructure providers like MLPs.
Throughout the piece, we take a look at the three areas that are expected to have the largest incremental crude oil production over the next 10 years: the Bakken Shale, the Eagle Ford, and the Permian. 8 © Salient Capital Advisors, LLC, 2014 . North American Crude Oil Independence: Not Just a Pipe Dream #2014-04 Fund ID: MLPs IV. The Bakken Shale The Bakken Shale (Bakken) has been the primary driver behind North Dakota displacing Alaska as the second largest oil producing state in the U.S. (up from 8th place previously). As the map below shows, E&P activity has been concentrated in the northwestern corner of the state and eastern Montana.
In April 2013, it was estimated that the Bakken contains up to 7.4 billion barrels of technically recoverable oil. This figure exceeded the midpoint of the previous estimate (made in 2008) by a mere 72%, or 3.1 billion barrels. The USGS also estimates that only 450 million barrels have actually been extracted from the play since 2008, which is just a drop in the 7.4 billion barrel bucket.
The USGS had not considered the Three Forks formation (which lies beneath the Bakken) in its previous estimate as the technological challenges of recovering oil from it were so great that it was not believed that it would be economically feasible to extract from the formation. 12 In just five years, technological advances have made the seemingly impossible possible and M. King Hubbert’s “Peak Oil Theory” appears to us to be thoroughly debunked. Source: EIA Resources, September 2013. For illustrative purposes only. 12 U.S.
Geological Survey (USGS), April 2013. 9 © Salient Capital Advisors, LLC, 2014 . North American Crude Oil Independence: Not Just a Pipe Dream #2014-04 Fund ID: MLPs While the absolute rig count in the Bakken has fallen recently from a high of 220 in May 2012 to 183 in January 2014, incremental barrels per rig continue to rise. This, in our opinion, is likely due to technological advances that allow producers to drill multiple wells from a single location, known as “pad drilling”. Despite the lower rig count, total oil production has continued to rise and recently reached approximately 970 mbpd. Existing pipeline capacity is approximately 700 mbpd and local demand is 68 mbpd (Tesoro’s Mandan Refinery), which means that over 200 mbpd of crude oil would need to find a way to market if all of the takeaway pipelines were running at capacity (which is not presently the case).
13 While Rig Count Has Dropped Recently - Crude Oil Production Continues to Soar 1,200 973 (000s) bpd 1,000 739 800 536 600 400 117 200 344 242 188 138 Source: EIA Resources, November 2013. For illustrative purposes only. Jul-13 Jul-12 Jan-13 Jul-11 Jan-12 Jul-10 Jan-11 Jul-09 Jan-10 Jul-08 Jan-09 Jan-08 Jul-07 Jan-07 0 Source: North Dakota Dept. of Mineral, November 2013. For illustrative purposes only. Further complicating the picture is the fact that the rapid growth in production of the Bakken light sweet crude has overwhelmed the ability of regional refineries to process it. Many of the Great Lakes area refineries have recently completed multi-hundred million dollar enhancements to increase their heavy crude processing capabilities.
Since these local refineries are full, they can wield significant pricing power on the incremental Bakken barrel, which has the effect of depressing the market price of Bakken crude at the Clearbrook, Minnesota, hub (the primary Bakken pricing point). As such, Bakken area producers have opted to eschew shipping their product on pipelines and have chosen to ship by rail to find a better price on the coasts (West, East, and Gulf) even though it costs much more to transport by rail than pipelines. The latest figures supplied reveal that 70% of Bakken crude oil is being shipped via rail, despite the available pipeline capacity.
14 As such, many MLPs have beefed up their Bakken-area crude-by-rail capabilities. Enbridge Energy Partners, L.P. (EEP or Enbridge), Crestwood Midstream Partners, L.P.
(CMLP), Targa Resource Partners, L.P. (NGLS), and Plains All-American Pipeline, L.P. (PAA) have all recently completed or announced acquisitions or expansions to enhance existing crude-by-rail facilities. 13 14 North Dakota Department of Mineral Resources, December 2013. North Dakota Pipeline Authority, December 2013. 10 © Salient Capital Advisors, LLC, 2014 .
North American Crude Oil Independence: Not Just a Pipe Dream #2014-04 Fund ID: MLPs A Note on Recent Rail Incidents On December 12, 2013, Mr. Lynn Helms, the director of the North Dakota Department of Mineral Resources stated that he expected up to 90% of Bakken crude could move by rail in 2014. Just over two weeks later, a Bakken crude train collided with another train near Casselton, North Dakota, sending a massive fireball into the sky. The Casselton accident was the second high profile crude-byrail accident in just five months following July’s horrific Lac-Megantic, Quebec, derailment which killed 47 people.
Predictably, these accidents have brought additional scrutiny regarding the safety of shipping by rail and may result in stricter safety standards imposed on the rail companies in the near future. No regulations have been proposed thus far, but authorities are looking at measures that could include re-routing of trains from heavily populated areas and higher standards for the rail cars that are transporting oil. While the cost for the railroads to meet any new standards would likely be absorbed by the producers, it is doubtful that the incremental cost would “de-rail” Bakken crude shipping any time soon (pun totally intended). Looking longer term, EEP – which is already the dominant pipeline operator in the area with roughly 75% of existing Bakken takeaway capacity – is partnering with Marathon Petroleum Corporation (MPC) on the $2.6 billion Sandpiper pipeline.
Sandpiper is designed to originate in the heart of the Bakken producing area and add an initial 225 mbpd of takeaway capacity that would ultimately connect with EEP’s Lakehead system in Superior, Wisconsin. The project is expected to be completed in early 2016. The Sandpiper pipeline is the final piece of the Enbridge companies’ ongoing $8 billion Eastern Access Initiative which, when complete, will give the Bakken-area producer the optionality to ship via pipeline to the Great Lakes, Eastern Canada, the U.S. East Coast, and the U.S.
Gulf Coast in search of the best price. 15 Bakken Production Quickly Exceeded Takeaway Capacity and Opened the Door for Rail, but Shipping by Pipeline is Inherently Cheaper and Arguably Safer Source: Enbridge Energy Partners, L.P., January 2014. For illustrative purposes only. 15 Enbridge Energy Partners, L.P. Investor Presentation, February 2014. 11 © Salient Capital Advisors, LLC, 2014 .
North American Crude Oil Independence: Not Just a Pipe Dream #2014-04 Fund ID: MLPs While rail has the upper hand in the Bakken at present, we believe that the inherent cost and safety advantages of pipelines will ultimately win the day for barrels moving East and South. For Westernbound barrels, crude by rail will likely be the preferred choice given the lack of existing pipeline infrastructure, physical distance, and challenging geography. In our view, the construction cost of a Bakken-to-West Coast pipeline would likely be a multi-billion dollar proposition due to those factors. The unwillingness of Bakken area producers to sign long-term (10+ year) contracts given the fluidity of the crude oil markets has already scratched two high profile Bakken pipeline projects from the drawing board (Oneok’s Bakken Express and Koch’s Dakota Express). Given the even larger commitment from producers that would be required for any MLP to move forward with a Bakken-toWest Coast pipeline, we do not see this as a plausible scenario. However, we believe that pipelines will eventually succeed in bringing crude oil east and south once Enbridge’s expansions are completed, and especially if the Keystone XL pipeline is ultimately approved (which would bring 830 mbpd of oil south to Cushing, Oklahoma).
We envision Bakken crude providing the feedstock for much of the East Coast and Eastern Canada, displacing the Brent crude that is currently being imported. With Brent pricing out of the picture, we would expect the inherent cost advantage of transporting by pipeline versus rail to win the day and eventually Bakken crude could trade at West Texas Intermediate (WTI) minus transportation costs. Enbridge Investing $8 billion Hoping Bakken Producers Will See the “Light”- and Ship East and South Source: Enbridge Energy Partners, L.P., December 2013. For illustrative purposes only. 12 © Salient Capital Advisors, LLC, 2014 . North American Crude Oil Independence: Not Just a Pipe Dream #2014-04 Fund ID: MLPs V. The Eagle Ford Shale The Eagle Ford Shale in South Texas has come out of nowhere to recently surpass the Bakken in terms of crude oil production. Originally thought to be a wet gas play, the Eagle Ford produced less than 1,000 bpd of crude oil as recently as 2009. By the end of 2013, crude production had topped 1.2 million bpd with ultimate production expected to reach 1.7-2.0 mmbpd by the end of the decade.
16 The dramatic increase in production has brought an economic windfall to the area but has created some thorny logistical issues as well. Source: EIA, February 2014. For illustrative purposes only. 16 EIA, February 2014. 13 © Salient Capital Advisors, LLC, 2014 . North American Crude Oil Independence: Not Just a Pipe Dream #2014-04 Fund ID: MLPs Pipelines Exist…But to the Wrong Places First and foremost, how do producers get all that oil to market? Surprisingly, given the lack of historical crude production, a lot of legacy infrastructure was in place. After all, it’s Texas – folks have been drilling for oil and gas for a long time. Most of the legacy South Texas infrastructure was related to conventional natural gas drilling in the area from years past. Those fields largely depleted themselves over the years, leaving miles of underutilized pipe in the ground.
In some cases, MLPs repurposed those existing pipelines to help alleviate the growing crude oil and NGL production glut. For example, Kinder Morgan’s Crude and Condensate Pipeline (KMCC), which can deliver up to 300 mbpd of Eagle Ford production to the Houston Ship Channel, came about by converting 113 miles of existing natural gas pipeline to crude service and then building a 65 mile extension of that pipe.17 Many of the existing pipelines delivered their barrels to Valero’s Three Rivers refinery (100 mbpd capacity) and then on to Corpus Christi (total refining capacity of 790 mbpd) instead of the greater Houston refining complex which can process over 2 mmbpd. With the rapid production growth, Three Rivers and the Corpus Christi refining complex have quickly been inundated with oil, leaving producers clamoring for alternative market outlets. Two of the largest MLPs, Enterprise Products Partners, L.P. (EPD) and Plains All-American Pipeline, L.P.
(PAA), sought to remedy the situation by teaming up on an Eagle Ford project which would give producers the option of delivering barrels to Houston as well as Corpus Christi. The two MLPs formed a joint venture (JV) in August 2012 to provide an initial 350 mbpd of takeaway capacity, with the potential to expand to 470 mbpd. The initial Eagle Ford JV pipeline was fully placed into service in September 2013 and the two MLPs are planning on upsizing to 470 mbpd by the second quarter of 2015.
The picture on the following page gives the operational details of the PAA/EPD Eagle Ford build out. We believe the most interesting takeaways are that (1) the partnerships expect Eagle Ford crude production to reach over 1.3 mmbpd by the end of 2016, and (2) part of the project encompasses building a dock loading facility in Corpus Christi with 300 mbpd capacity, which to us implies that they both recognize that Corpus Christi is likely NOT going to be the final destination for a substantial portion of Eagle Ford crude. 17 Kinder Morgan, May 2011. 14 © Salient Capital Advisors, LLC, 2014 . North American Crude Oil Independence: Not Just a Pipe Dream #2014-04 Fund ID: MLPs Plains All American Pipeline, L.P. (PAA) and Enterprise Product Partners, L.P. (EPD) Join Forces in an Attempt to Provide Eagle Ford Producers Optionality 1 As of 4/30/2013. Industry sources and PAGP’s estimates. Map only incudes most significant PAA assets in the area as of 4/30/13. Some assets shown are not yet in service. 4 PAA pipelines that are expected to be in-service after 2013. 2 3 Source: Plains All American Pipeline, L.P., November 2013. For illustrative purposes only. Not to be outdone, Kinder Morgan and Magellan Midstream Partners, L.P. (co-owners of the Double Eagle pipeline) announced plans in December 2013 to build a short extension to connect the previously mentioned KMCC with Double Eagle, thus offering Eagle Ford producers the option of shipping to either Houston or Corpus Christi.
While the Double Eagle currently boasts a capacity of 100 mbpd, it can be expanded to 150 mbpd by adding pumps and other equipment. The table below shows how the Eagle Ford-area crude oil takeaway pipelines are directionally configured. As one can see per the data below, it seems pretty much a fait accompli that Corpus Christi is going to get more Eagle Ford crude than it can process. Gardendale to Three Rivers Pipeline mpbd Double Eagle 100 Plains 300 NuStar 100 Harvest 330 Total 830 Three Rivers to Corpus Pipeline mpbd Double Eagle 100 Plains 300 NuStar 300 Harvest 300 Less: Valero Three Rivers -60 Total 970 East Eagle Ford to Corpus Pipeline mpbd Koch 250 Nustar 30 Total 280 To Houston Pipeline Enterprise KMCC Total Total to Corpus 1,250 Corpus Refining Capacity 790 Excess Supply to Corpus 460 Total to Houston mpbd 350 300 650 650 Houston Area Capacity 2,070 Source: Oil and Gas Financial Journal, February 2013. For illustrative purposes only. 15 © Salient Capital Advisors, LLC, 2014 . North American Crude Oil Independence: Not Just a Pipe Dream #2014-04 Fund ID: MLPs First to Corpus Christi and then…? The Eagle Ford Shale has also taught us that simply having the pipelines in place to deliver product may not prove to be an adequate solution because the product being delivered is not what the end user needs. The Eagle Ford produces light sweet crude, which is not the preferred feedstock for the U.S. Gulf Coast refiners. Believing that the world was running out of light sweet crude, many U.S. refiners spent the last decade recalibrating their facilities to handle heavier sour barrels (i.e.
higher sulfur content), like those produced in Canada, Mexico, Venezuela, and throughout the Middle East. The Gulf Coast refiners are no exception. By the middle of 2013, light sweet crude imports to the Gulf Coast had dropped to 60 mbpd, down from a 650 mbpd average for the years 2008-10. 18 We expect the continued increase in domestic production to displace the remaining imports to the Gulf in short order. However, domestic light sweet production continues to ramp and there is the potential for a glut to form on the Gulf Coast.
Looking at the three Corpus Christi refiners, while the aggregate nameplate capacity of the facilities is 790 mbpd, only 172 mbpd is currently calibrated to handle light sweet crude, which means that over 1 mmbpd could eventually be delivered to Corpus Christi that cannot be processed locally. To take advantage of this potential scenario, MLPs have announced no fewer than five marine projects to barge the crude oil and condensate to other Gulf Coast and East Coast locations. This raises another issue – the U.S.
currently bans the export of crude oil. Further, all ships delivering between two U.S. ports must be American-flagged, American-made, and American-crewed according to the Jones Act of 1920, which severely restricts the ability and raises the cost for companies to move barrels to more accommodating markets.
19 The potentially massive light sweet supply/demand imbalance may create a need for innovative solutions to allow producers to get the best price for their barrels. Whether the solution proves to be additional pipelines to Houston and beyond (side-stepping Corpus Christi), further marine terminal development in Corpus Christi, a relaxing of the export and/or Jones Act laws, or a combination of any of the above, we believe that the tax-advantaged structure of MLPs and first-mover advantage given the substantial existing asset footprint in place should give MLPs a leg up on the competition. VI. The Permian Basin: The Re-Awakening of a Giant What can be said about the Permian Basin (Permian) that has not already been said? Basically, the Permian IS what most people imagine when they think of oil production – wide, dusty vistas with a solitary oil derrick pumping out black gold.
While the drilling activity that takes place in the Permian today is light years more sophisticated than what Edna Ferber portrayed in the 1956 movie Giant, the end result is the same. The Permian Basin produces oil, and lots of it – 15% of current U.S. production 18 19 EIA, October 31, 2013. Oil & Gas Financial Journal, February 2013. 16 © Salient Capital Advisors, LLC, 2014 .
North American Crude Oil Independence: Not Just a Pipe Dream #2014-04 Fund ID: MLPs comes from the Permian, or roughly 1.3 mmbpd. 20 In fact, 25% of all drilling rigs currently running in the U.S. are operating in the Permian. 21 Before After Source: Laredo Petroleum, April 2012. For illustrative purposes only. For decades, the supply/demand balance has been largely kept in the Permian Basin, with local refineries consuming roughly 300 mbpd and three crude oil pipelines providing takeaway capacity of 975 mbpd (see below).
Two-thirds of that takeaway capacity went to Cushing, Oklahoma, which is the New York Mercantile Exchange (NYMEX) pricing hub for West Texas Intermediate (WTI). Existing Permian Takeaway Pipelines (Worked Like a Charm for Decades) Capacity Pipeline (000 bpd) Destination Owner Basin 450 Cushing Plains All American Pipeline, L.P. (PAA) Centurion 175 Cushing Occidental Petroleum Corporation (OXY) Sunoco Logistics Partners, L.P. (SXL) West Texas 350 Longview Local Usage 300 N/A Total 1,275 Source: PAA, November 2013. For illustrative purposes only. It is important to understand that Cushing is simply a staging area for crude oil – it is not designed to be the final destination.
Delivering Permian production to Cushing, which worked for years, suddenly did not work so well when Permian production began to really ratchet up in 2011. The effect has been 20 21 EIA, February 2014. Baker Hughes Rig Report, February 2014. 17 © Salient Capital Advisors, LLC, 2014 . North American Crude Oil Independence: Not Just a Pipe Dream #2014-04 Fund ID: MLPs occasional basis blowouts. Historically, WTI had traded at a slight premium to Brent (the world price). Since 2011, WTI has traded at a discount to Brent and, as the chart on the next page indicates, that discount reached nearly $25/bbl at times during 2012. We believe that the reason for this reversal is largely due to incremental Permian production getting “trapped” in Cushing. In other words, more oil was flowing into Cushing than was able to be delivered out due to existing takeaway capacity constraints.
However, the decline in WTI was not limited to the price in Cushing. The WTI price at Midland is arguably more sensitive to potential bottlenecks because there are even fewer options – if it is not delivered to Cushing, where else is it going to go? As such, Permian producers have seen local prices plummet when Cushing backs up, while the Cushing price drops only slightly in relation to the Brent price. Changes in Price Spreads Between Midland, Cushing, and Brent $10 $0 $/bbl -$10 -$20 -$30 -$40 Midland - Cushing Cushing - Brent 12/13/2013 11/13/2013 9/13/2013 10/13/2013 8/13/2013 7/13/2013 6/13/2013 5/13/2013 4/13/2013 3/13/2013 2/13/2013 1/13/2013 12/13/2012 11/13/2012 10/13/2012 9/13/2012 8/13/2012 7/13/2012 6/13/2012 5/13/2012 4/13/2012 3/13/2012 2/13/2012 1/13/2012 12/13/2011 -$50 Midland - Brent Source: Bloomberg, December 2013. For illustrative purposes only. In an attempt to minimize these price fluctuations, MLPs have stepped in to try to alleviate the bottlenecks in both the Permian and Cushing. On the following page, the table highlights the recent pipeline projects out of both the Permian and Cushing.
Note that all of the Permian expansion projects (Longhorn, West Texas, Permian Express, BridgeTex, and Cactus) are delivering barrels to the Gulf Coast – not Cushing. Out of Cushing, three pipelines have been put into service since May 2012. When the Seaway Twinning project is completed in mid-2014, takeaway capacity to the Gulf Coast will have increased by over 1.5 mmbpd since 2012. 18 © Salient Capital Advisors, LLC, 2014 . North American Crude Oil Independence: Not Just a Pipe Dream #2014-04 Fund ID: MLPs "Permian"-ently Biased Towards the Gulf Coast Project Capacity Destination In-Service MLP Longhorn 225 mbpd Houston Apr-13 Magellan Midstream Partners, L.P (MMP) West TX 30 mbpd Longview 2Q:13 Sunoco Logistics Partners, L.P. (SXL) Permian Express Phase I 90 mbpd Gulf Coast 2Q:13 Sunoco Logistics Partners, L.P. (SXL) Permian Express Phase II 60 mbpd Gulf Coast 1Q:14 Sunoco Logistics Partners, L.P. (SXL) BridgeTex 278 mbpd Texas City Mid 2014 Magellan Midstream Partners, L.P (MMP) Cactus 200 mbpd Gulf Coast 1Q:15 Plains All American Pipeline, L.P.
(PAA) Total 883 mpbd Source: Securities and Exchange Commission (www.sec.gov), December 2013. For illustrative purposes only. Straight Outta Cushing Project Capacity Destination In-Service Owner Seaway Reversal 150 mbpd Gulf Coast May-12 Enterprise Products Partners, L.P. (EPD)/Enbridge,Inc. (ENB) Seaway Expansion 250 mpbd Gulf Coast Jan-13 Enterprise Products Partners, L.P.
(EPD)/Enbridge,Inc. (ENB) Keystone (Southern Leg) 700 mpbd Gulf Coast Dec-13 TransCanada Corporation (TRP) Seaway Twinning 450 mpbd Gulf Coast 1H:14 Enterprise Products Partners, L.P. (EPD)/Enbridge,Inc.
(ENB) Total 1,550 mpbd Source: Securities and Exchange Commission (www.sec.gov), December 2013. For illustrative purposes only. While these projects should help alleviate current bottlenecks, it may only be a matter of time before more takeaway capacity will be needed from the Permian as production is expected to exceed takeaway capacity by 2018. At that point, Permian production is expected to reach 2.5 mmbpd and may once again exceed projected takeaway capacity as seen below. Source: DOE, Raymond Research, December 2013. For illustrative purposes only. 19 © Salient Capital Advisors, LLC, 2014 . North American Crude Oil Independence: Not Just a Pipe Dream #2014-04 Fund ID: MLPs VII. Conclusion: Energy Independence? The increase in crude production is clearly a long term positive for the U.S. and we believe is a step towards positioning the country squarely on a path to “energy independence.” The map on the following page comes to us from Enterprise Products Partners – the largest MLP by market cap and a significant participant in almost every link in the midstream value chain for crude oil, natural gas, and NGLs. The gist of the map is that total U.S.
imports (excluding Canada) are expected to decline from 5.9 mmbpd in 2012 to just 600 mbpd by 2020. 22 Traditional Crude Flows are Being Disrupted Source: EIA, IEA, & EPD Fundamentals, December 10, 2013. For illustrative purposes only. On the East Coast, light imports are expected to be completely backed out (from 1.2 mmbpd in 2012). These imports will largely be displaced by Bakken production, the majority of which is expected to be transported by rail to the East Coast refining markets. Along the Gulf Coast, which is home to approximately 45% of the nation’s refining capacity, light imports are expected to be completely backed out (from 300 mpbd in 2012) and replaced with supply from the Permian and Eagle Ford basins and possibly some Bakken crude as well.
Medium and heavy imports are also expected to fall precipitously along the Gulf Coast (from 4.4 mm to 0.6 mmbpd) and be replaced by Canadian barrels. Another interesting wrinkle is that the U.S. is becoming a net exporter of products – both refined products and NGLs (particularly propane). Exports are expected to continue to ramp throughout the rest of the decade – from 1.0 mmbpd in 2012 to 2.6 mmbpd in 2020, according to Enterprise Products 22 Enterprise Product Partners, January 2014. 20 © Salient Capital Advisors, LLC, 2014 .
North American Crude Oil Independence: Not Just a Pipe Dream #2014-04 Fund ID: MLPs and that does not even include potential crude oil exports, which are not permitted at this juncture (and is another topic entirely). 23 Taken as a whole, non-North American U.S. crude oil imports are expected to decline by 90% within seven years.23 This is what is meant by “energy independence.” True, the U.S. will likely never be able to produce the approximately 18.5 million bpd of crude oil that it currently consumes daily, but if we include Canada and Mexico – especially now that the Mexican government has recently voted to allow foreign investment in developing its energy reserves – we believe we can get pretty close.
Having a cheap, abundant, and reliable source of energy would likely encourage increased investment in this country, which is something we are already seeing in the petrochemical space due to the abundance of cheap NGLs. A scenario that looked impossible only a few years ago now seems possible. 23 Enterprise Product Partners, L.P., January 2014. 21 © Salient Capital Advisors, LLC, 2014 . North American Crude Oil Independence: Not Just a Pipe Dream #2014-04 Fund ID: MLPs VIII. Risks Each individual partnership has its own set of risks, which generally include (but are not limited to) commodity price movements, declines in throughput volumes, integration and execution risks associated with acquisitions, damages from natural disasters or terrorism, and interest rate risks. Some of the risks to the MLP space as a whole are discussed below. Economic Weakness. While equity markets have performed relatively well following the 2008 financial crisis, the U.S.
and global economies have not recovered as quickly as they have following previous recessions. Many economists expect the economy to continue to limp along at approximately a 2% growth rate, but there are some that argue for higher growth and yet others that see a looming recession. If the economy experiences another round of weakness, MLP returns may be impacted. Treasury Rates.
24 As of December 31, 2013, the yield on the 10-Year Treasury was 3.03% vs. the December 2012 close of 1.76%. On average, economists at the major investment banks expect the yield on the 10-Year Treasury to be 3.40% at the end of 2014 (with a range of 2.5 to 4.0%).
While MLPs have historically had a low correlation to Treasury rates, a rapid, dramatic move upward in Treasury yields may create some near-term pressure on MLPs. Credit Spreads. MLPs have historically exhibited a relatively high correlation to major credit spread widening (and tightening) events. It has been relatively quiet recently, but if debt issues in either the U.S.
or globally begin to escalate once again, both investment grade and high yield credit spreads could be negatively impacted. Such a situation would most likely negatively impact MLP valuations. Commodities. Prices for both natural gas and NGLs have been weak for a while now (natural gas since 2009, NGLs since May 2012).
However, the recent boom in U.S. crude oil production has created significant growth opportunities for midstream infrastructure providers. Should oil prices experience a significant and prolonged decline that leads to lower future production (and thus fewer growth opportunities for MLPs), valuations may be negatively impacted. Fund Flows.
Positive fund flows have been a major contributor to the performance of MLPs over the past few years. Investors remain concerned about the low rates on bonds and CDs not meeting their income needs, as well as the potential drop in bond prices if yields increase rapidly. MLPs have often been seen as an alternative to bonds due to higher yields and the ability to grow the distribution to offset any potential increase in interest rates.
While we believe near term fund flows will continue to be strong, we could see investors ultimately return to traditional fixed income instruments if rates rise quickly. Tax Law Changes. We believe this is unlikely in the absence of overall tax reform, but any negative change in the tax code would likely have a detrimental impact on MLPs. 24 Source: Bloomberg, Salient Capital Advisors, LLC. December 31, 2013. 22 © Salient Capital Advisors, LLC, 2014 .
North American Crude Oil Independence: Not Just a Pipe Dream #2014-04 Fund ID: MLPs IX. Glossary AMZ (Alerian MLP Index) is a composite of the 50 most prominent energy MLPs that provides investors with a comprehensive benchmark for this emerging asset class. RISKS: Include tax related risks due to their partnership status, unlike the other asset classes discussed, as well as possible higher volatility than the majority of the other asset classes. Brent Crude is a major trading classification of light sweet crude oil that serves as a major benchmark price for purchases of oil worldwide. Capex (capital expenditure) Funds used by a company to acquire or upgrade physical assets such as property, buildings or equipment. Compound Growth is the year-over-year growth rate of an investment over a specified period of time. Exploration & Production Subsector is a group of companies that explore for, and produce oil and gas. Gathering & Processing involves moving natural gas from the wellhead to a natural gas processing plant, where NGLs and other impurities are removed from the natural gas stream. Heavy crude is oil that is highly viscous, and cannot easily flow to production wells under normal reservoir conditions. Light crude is liquid petroleum that has a low density and flows freely at room temperature. Light crude oil receives a higher price than heavy crude oil on the commodity markets because it produces a higher percentage of gasoline and diesel fuel when converted into products by an oil refinery. Majors refer to large, multi-national oil gas companies with fully integrated assets covering the entire upstream, midstream, and downstream portions of the energy value chain. Examples include ExxonMobil, Chevron, and BP. Market Cap is the total value of the issued shares of a publicly traded company; it is equal to the share price times the number of shares outstanding. Mbpd is thousand barrels per day. Mmbpd is million barrels per day. Mcf is 1,000 cubic feet. Midstream services are the transportation (by pipeline, rail, barge, or truck), storage and wholesale marketing of crude or refined petroleum products. Natural Gas Condensates is a low-density mixture of hydrocarbon liquids that are present as gaseous components in the raw natural gas produced from many natural gas fields. Natural Gas Liquids (NGL) are hydrocarbons that are contained in natural gas and include ethane, propane, butane, isobutane, and natural gasoline. 23 © Salient Capital Advisors, LLC, 2014 .
North American Crude Oil Independence: Not Just a Pipe Dream #2014-04 Fund ID: MLPs NYMEX is the world’s largest physical commodity futures exchange. Peak Oil Theory states that there is a point in time when the maximum rate of petroleum extraction is reached, after which the rate of production is expected to enter terminal decline. Rich/Wet Gas is natural gas that is high in natural gas liquids (NGL) content. The level is measured in gallons per mcf (GPM). The U.S. Geological Survey is a scientific agency of the United States government. WCS (Western Canadian Select) is one of North America’s largest heavy crude oil streams. WTI (West Texas Intermediate) is also known as Texas light sweet, a grade of crude oil used as a benchmark in oil pricing. 24 © Salient Capital Advisors, LLC, 2014 . 4265 San Felipe, 8th Floor Houston, Texas 77027 (800) 994-0755 Salientpartners.com .


