


Description
Institutional Investing Trends
for a Deleveraging Economy
Lee Partridge
Jeremy Radcliffe
Worth Wray
. This information is being provided to you by Salient Capital Advisors, LLC, and is intended solely for educational purposes.
No other distribution or use of these materials has been authorized.
The opinions expressed in these materials represent the personal views of the investment professionals of Salient Capital
Advisors, LLC and is based on their broad based investment knowledge, experience, research and analysis. It must be noted,
however, that no one can accurately predict the future of the market with certainty or guarantee future investment
performance. Past performance is not a guarantee of future results.
Certain statements in this communication are forward-looking statements of Salient Capital Advisors, LLC.
The forward-looking statements and other views expressed herein are as of the date of this document. Actual future results
or occurrences may differ significantly from those anticipated in any forward-looking statements, and there is no guarantee
that any predictions will come to pass.
The views expressed herein are subject to change at any time, due to numerous market and other factors. The Adviser disclaims any obligation to update publicly or revise any forward-looking statements or views expressed herein. There can be no assurance that any investment program will achieve its investment objectives. The value of any investment program will fluctuate with the value of the underlying securities. This information is neither an offer to sell nor a solicitation of any offer to buy any securities.
Any offering or solicitation will be made only to eligible investors and pursuant to any applicable Private Placement Memorandum, prospectus and other governing documents, all of which must be read in their entirety. Research services are provided by Salient Capital Advisors, LLC, a wholly owned subsidiary of Salient Partners, L.P., a U.S. Securities and Exchange Commission Registered Investment Adviser. Salient research has been prepared without regard to the individual financial circumstances and objectives of persons who receive it. Salient recommends that investors independently evaluate particular investments and strategies, and encourage investors to seek the advice of a financial advisor.
The appropriateness of a particular investment or strategy will depend on an investor’s individual circumstances and objectives. ©2013. Salient. Material not to be duplicated.
Intended for U.S. investors only. Salient is the trade name for Salient Partners, L.P., which together with its subsidiaries provides asset management and advisory services. Insurance products offered through Salient Insurance Agency, LLC (Texas license #1736192).
Trust services provided by Salient Trust Co., LTA. Securities offered through Salient Capital, L.P., a registered broker-dealer and Member FINRA, SIPC. Each of Salient Insurance Agency, LLC, Salient Trust Co., LTA, and Salient Capital, L.P., is a subsidiary of Salient Partners, L.P. 2 .
Executive Summary Credit typically acts like fuel for economic growth. As we saw in the United States from 1944 to 2009, credit expansion can drive unnaturally strong economic growth as cash flows and additional borrowing boost consumption and investment; while contraction in credit (“deleveraging”), which last occurred in the United States from 1929 to 1943, can impose unnaturally weak economic growth as cash flows are diverted to retire debts incurred in previous years. After the largest credit expansion in history and a truly global financial crisis, the United States economy – along with the rest of the developed world – has just begun a long process of deleveraging, which is already dragging on growth, suppressing interest rates, and distorting the market cycle. At Salient, we believe understanding this deleveraging environment and its implications for investing is an important task for anyone who chooses to put capital at risk today. In this paper, we are going to briefly explain deleveraging, how it typically happens, and why we believe it requires a different approach to the investing process. Then, we are going to describe five actionable examples of strategies being employed by institutional investors in this environment: (1) balancing core portfolio risks at a specific volatility level, (2) gathering diversifying “alternative betas” with rules-based tools, (3) identifying yield opportunities supported by durable cash flows, (4) migrating active equity exposure from style boxes to a global, unconstrained framework, and (5) focusing private investments in opportunities to garner the potential illiquidity premium. 3 .
Beyond the Business Cycle: How Credit Shapes the Investing Environment Conventional wisdom suggests that investors should manage their portfolios around changes in the business cycle, or the tendency for economic activity to swing from expansion to recession every five to ten years. The cycle typically begins with positive economic growth and low levels of inflation. As an expansion builds, momentum and credit growth accelerate, aggregate demand starts to exceed aggregate supply, production is stretched as the actual output (or GDP) of the economy exceeds its long-run potential output (a “positive output gap”), inflation increases, and the economy begins to feel the strain of this disparity. The business cycle usually peaks after the central bank raises interest rates to slow credit growth and prevent excessive inflation.
When the actual output of the economy falls below potential output (“negative output gap”), inflation moderates, economic growth slows, and the economy eventually contracts. Recession typically ends with central bank stimulus that is intended to encourage economic growth, and a new expansion typically begins… but not this time. 1 Nearly four years after the financial crisis ended in March 2009, the US economy continues to muddle through its weakest recovery in more than sixty years.
Unlike “normal” business cycles, the Fed has not been able to restore the economy to trend growth even after dropping its policy interest rate to zero and expanding its balance sheet by trillions of dollars through direct asset purchases (often called “quantitative easing” or “QE” for short). In response to unprecedented Fed policy action, economic growth is still running well below its long term average, the money supply has only increased at a sluggish pace, and policymakers are more concerned about Japanese-style deflation than inflation. 2 So what is going on today that is so different from every other business cycle in recent memory? Why is real GDP growth only running around 2% per year? 3 We believe the answer lies in the graph on the next page, and, as the graph suggests, we believe these challenges could potentially last for the next decade—if not longer. 1 Dalio, Ray, (2012).
How the Economic Machine Works: A Template for Understanding What is Happening Now. Bridgewater Associates White Paper. Koo, Richard, (2012). The World in Balance Sheet Recession: Causes, Cures, and Politics.
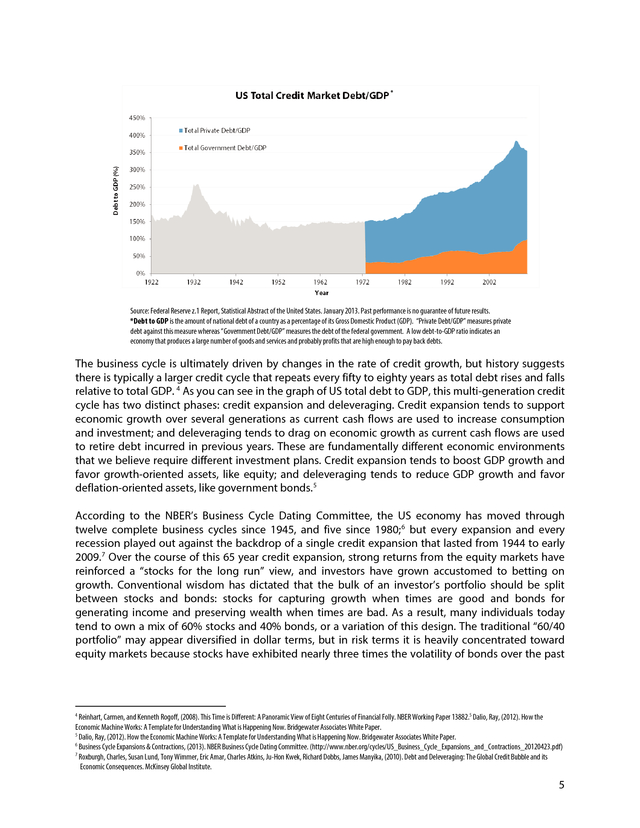
Real World Economics Review, Issue 58, 19-37. 3 Federal Reserve z.1 Report, Statistical Abstract of the United States. January 2013 2 4 . * Source: Federal Reserve z.1 Report, Statistical Abstract of the United States. January 2013. Past performance is no guarantee of future results. *Debt to GDP is the amount of national debt of a country as a percentage of its Gross Domestic Product (GDP). “Private Debt/GDP” measures private debt against this measure whereas “Government Debt/GDP” measures the debt of the federal government.
A low debt-to-GDP ratio indicates an economy that produces a large number of goods and services and probably profits that are high enough to pay back debts. The business cycle is ultimately driven by changes in the rate of credit growth, but history suggests there is typically a larger credit cycle that repeats every fifty to eighty years as total debt rises and falls relative to total GDP. 4 As you can see in the graph of US total debt to GDP, this multi-generation credit cycle has two distinct phases: credit expansion and deleveraging. Credit expansion tends to support economic growth over several generations as current cash flows are used to increase consumption and investment; and deleveraging tends to drag on economic growth as current cash flows are used to retire debt incurred in previous years.
These are fundamentally different economic environments that we believe require different investment plans. Credit expansion tends to boost GDP growth and favor growth-oriented assets, like equity; and deleveraging tends to reduce GDP growth and favor deflation-oriented assets, like government bonds. 5 According to the NBER’s Business Cycle Dating Committee, the US economy has moved through twelve complete business cycles since 1945, and five since 1980; 6 but every expansion and every recession played out against the backdrop of a single credit expansion that lasted from 1944 to early 2009.
7 Over the course of this 65 year credit expansion, strong returns from the equity markets have reinforced a “stocks for the long run” view, and investors have grown accustomed to betting on growth. Conventional wisdom has dictated that the bulk of an investor’s portfolio should be split between stocks and bonds: stocks for capturing growth when times are good and bonds for generating income and preserving wealth when times are bad. As a result, many individuals today tend to own a mix of 60% stocks and 40% bonds, or a variation of this design.
The traditional “60/40 portfolio” may appear diversified in dollar terms, but in risk terms it is heavily concentrated toward equity markets because stocks have exhibited nearly three times the volatility of bonds over the past 4 Reinhart, Carmen, and Kenneth Rogoff, (2008). This Time is Different: A Panoramic View of Eight Centuries of Financial Folly. NBER Working Paper 13882.5 Dalio, Ray, (2012).
How the Economic Machine Works: A Template for Understanding What is Happening Now. Bridgewater Associates White Paper. 5 Dalio, Ray, (2012). How the Economic Machine Works: A Template for Understanding What is Happening Now.
Bridgewater Associates White Paper. 6 Business Cycle Expansions & Contractions, (2013). NBER Business Cycle Dating Committee. (http://www.nber.org/cycles/US_Business_Cycle_Expansions_and_Contractions_20120423.pdf) 7 Roxburgh, Charles, Susan Lund, Tony Wimmer, Eric Amar, Charles Atkins, Ju-Hon Kwek, Richard Dobbs, James Manyika, (2010).
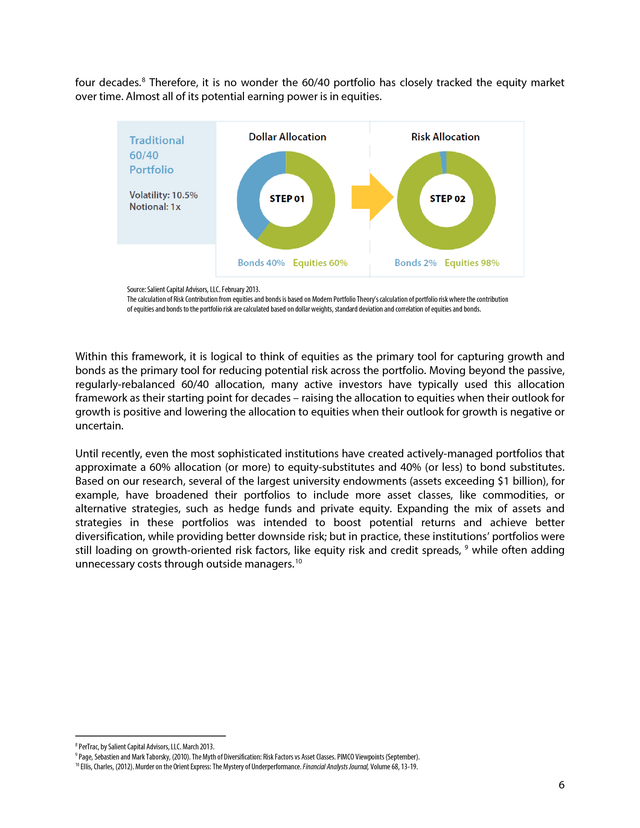
Debt and Deleveraging: The Global Credit Bubble and its Economic Consequences. McKinsey Global Institute. 5 . four decades. 8 Therefore, it is no wonder the 60/40 portfolio has closely tracked the equity market over time. Almost all of its potential earning power is in equities. Source: Salient Capital Advisors, LLC. February 2013. The calculation of Risk Contribution from equities and bonds is based on Modern Portfolio Theory’s calculation of portfolio risk where the contribution of equities and bonds to the portfolio risk are calculated based on dollar weights, standard deviation and correlation of equities and bonds. Within this framework, it is logical to think of equities as the primary tool for capturing growth and bonds as the primary tool for reducing potential risk across the portfolio.
Moving beyond the passive, regularly-rebalanced 60/40 allocation, many active investors have typically used this allocation framework as their starting point for decades – raising the allocation to equities when their outlook for growth is positive and lowering the allocation to equities when their outlook for growth is negative or uncertain. Until recently, even the most sophisticated institutions have created actively-managed portfolios that approximate a 60% allocation (or more) to equity-substitutes and 40% (or less) to bond substitutes. Based on our research, several of the largest university endowments (assets exceeding $1 billion), for example, have broadened their portfolios to include more asset classes, like commodities, or alternative strategies, such as hedge funds and private equity. Expanding the mix of assets and strategies in these portfolios was intended to boost potential returns and achieve better diversification, while providing better downside risk; but in practice, these institutions’ portfolios were still loading on growth-oriented risk factors, like equity risk and credit spreads, 9 while often adding unnecessary costs through outside managers. 10 8 PerTrac, by Salient Capital Advisors, LLC.
March 2013. Page, Sebastien and Mark Taborsky, (2010). The Myth of Diversification: Risk Factors vs Asset Classes. PIMCO Viewpoints (September). 10 Ellis, Charles, (2012).
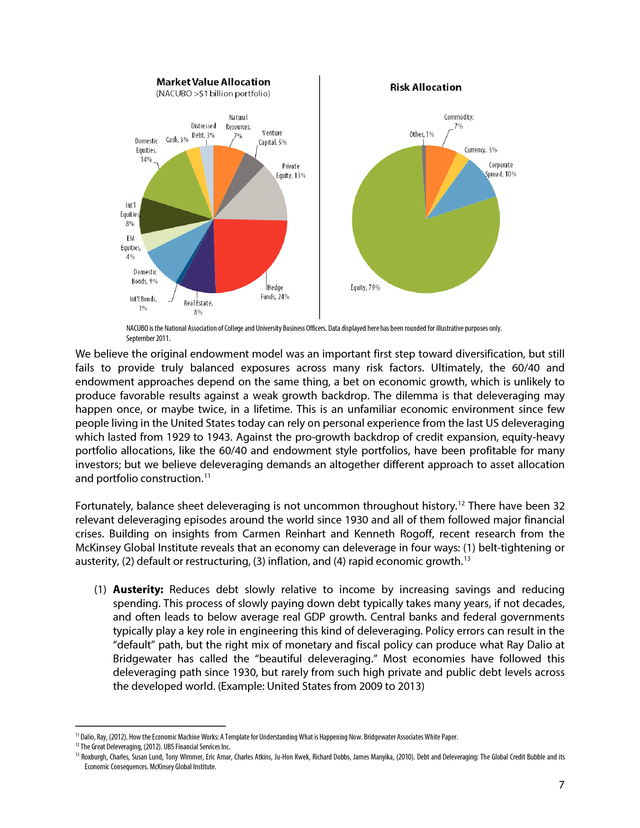
Murder on the Orient Express: The Mystery of Underperformance. Financial Analysts Journal, Volume 68, 13-19. 9 6 . NACUBO is the National Association of College and University Business Officers. Data displayed here has been rounded for illustrative purposes only. September 2011. We believe the original endowment model was an important first step toward diversification, but still fails to provide truly balanced exposures across many risk factors. Ultimately, the 60/40 and endowment approaches depend on the same thing, a bet on economic growth, which is unlikely to produce favorable results against a weak growth backdrop. The dilemma is that deleveraging may happen once, or maybe twice, in a lifetime.
This is an unfamiliar economic environment since few people living in the United States today can rely on personal experience from the last US deleveraging which lasted from 1929 to 1943. Against the pro-growth backdrop of credit expansion, equity-heavy portfolio allocations, like the 60/40 and endowment style portfolios, have been profitable for many investors; but we believe deleveraging demands an altogether different approach to asset allocation and portfolio construction. 11 Fortunately, balance sheet deleveraging is not uncommon throughout history.
12 There have been 32 relevant deleveraging episodes around the world since 1930 and all of them followed major financial crises. Building on insights from Carmen Reinhart and Kenneth Rogoff, recent research from the McKinsey Global Institute reveals that an economy can deleverage in four ways: (1) belt-tightening or austerity, (2) default or restructuring, (3) inflation, and (4) rapid economic growth. 13 (1) Austerity: Reduces debt slowly relative to income by increasing savings and reducing spending.
This process of slowly paying down debt typically takes many years, if not decades, and often leads to below average real GDP growth. Central banks and federal governments typically play a key role in engineering this kind of deleveraging. Policy errors can result in the “default” path, but the right mix of monetary and fiscal policy can produce what Ray Dalio at Bridgewater has called the “beautiful deleveraging.” Most economies have followed this deleveraging path since 1930, but rarely from such high private and public debt levels across the developed world.
(Example: United States from 2009 to 2013) 11 Dalio, Ray, (2012). How the Economic Machine Works: A Template for Understanding What is Happening Now. Bridgewater Associates White Paper. The Great Deleveraging, (2012).
UBS Financial Services Inc. 13 Roxburgh, Charles, Susan Lund, Tony Wimmer, Eric Amar, Charles Atkins, Ju-Hon Kwek, Richard Dobbs, James Manyika, (2010). Debt and Deleveraging: The Global Credit Bubble and its Economic Consequences. McKinsey Global Institute. 12 7 .
(2) Default: Reduces outstanding debts through refusing or rescheduling debt payments. This process can be swift and painful since it often results in collapsing income and money supply. Defaults can lead to disorderly deleveraging and often bring on full-scale depression. The resulting fall in income typically leads to a rise in debt relative to income, meaning that another form of deleveraging must follow. Although the United States avoided this painful path in early 2009, we believe it could still happen in the event of a major policy error. (Example: United States from 1929 to 1932) (3) Inflation: Reduces debt-to-income ratios as high inflation causes nominal incomes to rise faster than nominal debt.
High inflation may boost nominal growth, but it typically slows real GDP growth over the same period. Although many investors are worried about inflation today, deleveraging basically “breaks” the credit creation process and most often prevents the selfreinforcing cycle of rising wages, spending, and prices. Throughout history, deleveraging through inflation has typically happened when central banks lose their credibility and a currency collapses.
Despite widespread fears about the US Dollar, it is still the “cleanest dirty shirt” of the major reserve currencies. Thus, we believe high inflation or hyperinflation is a very low-probability outcome until the private sector deleverages enough for the credit creation process to resume. (Example: Spain from 1976 to 1980) (4) Growth: Reduce debt to income through rapid real income growth.
Deleveraging through growth has only happened once after a major financial crisis since 1930, and it happened as the United States was massively mobilizing for World War II. We believe this path is the least likely outcome for today’s deleveraging, although a “game-changing” technological innovation could induce rapid growth, in theory. (Example: United States from 1933 to 1939) Now that credit expansion has given way to deleveraging in the United States – and across most of developed world – traditionally allocated portfolios may not be prepared for an economic environment with potential sluggish real GDP growth, zero interest rates, and little room for policy mistakes.
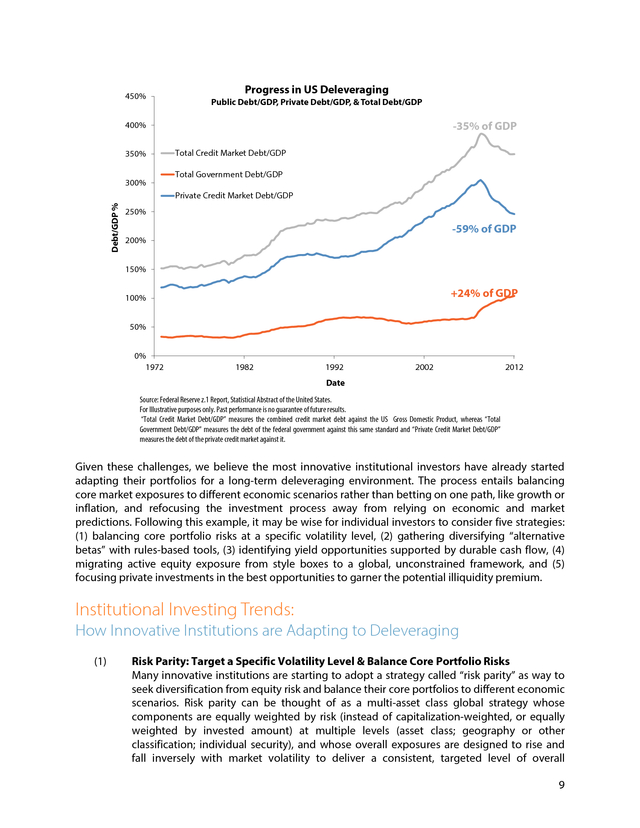
As you can see from the chart on the next page, debt to GDP has been falling in the United States since 2009 and we believe the process may take years to run. As debt falls relative to income, the deleveraging process will likely drag on today’s growth as current cash flows are used to retire debts incurred in the past, many of which were put toward nonproductive uses like Spanish beach condos, vacation homes in Ireland, or “McMansions” in the United States. So far, the mix of debt reduction and policy intervention has been one of the most “beautiful” on record 14; but we believe this will continue to be a daunting task for policymakers with significant potential downside risk to markets. 14 "Beautiful deleveraging" describes the rare instance where fiscal and monetary policy offsets the negative effects of debt reduction on economic activity.
Source: Dalio, Ray, (2012). An In Depth Look at Deleveragings. Bridgewater Associates White Paper. 8 .
450% Progress in US Deleveraging Public Debt/GDP, Private Debt/GDP, & Total Debt/GDP -35% of GDP 400% 350% 300% Total Credit Market Debt/GDP Total Government Debt/GDP Debt/GDP % Private Credit Market Debt/GDP 250% -59% of GDP 200% 150% +24% of GDP 100% 50% 0% 1972 1982 1992 2002 2012 Date Source: Federal Reserve z.1 Report, Statistical Abstract of the United States. For Illustrative purposes only. Past performance is no guarantee of future results. “Total Credit Market Debt/GDP” measures the combined credit market debt against the US Gross Domestic Product, whereas “Total Government Debt/GDP” measures the debt of the federal government against this same standard and “Private Credit Market Debt/GDP” measures the debt of the private credit market against it. Given these challenges, we believe the most innovative institutional investors have already started adapting their portfolios for a long-term deleveraging environment. The process entails balancing core market exposures to different economic scenarios rather than betting on one path, like growth or inflation, and refocusing the investment process away from relying on economic and market predictions. Following this example, it may be wise for individual investors to consider five strategies: (1) balancing core portfolio risks at a specific volatility level, (2) gathering diversifying “alternative betas” with rules-based tools, (3) identifying yield opportunities supported by durable cash flow, (4) migrating active equity exposure from style boxes to a global, unconstrained framework, and (5) focusing private investments in the best opportunities to garner the potential illiquidity premium. Institutional Investing Trends: How Innovative Institutions are Adapting to Deleveraging (1) Risk Parity: Target a Specific Volatility Level & Balance Core Portfolio Risks Many innovative institutions are starting to adopt a strategy called “risk parity” as way to seek diversification from equity risk and balance their core portfolios to different economic scenarios.
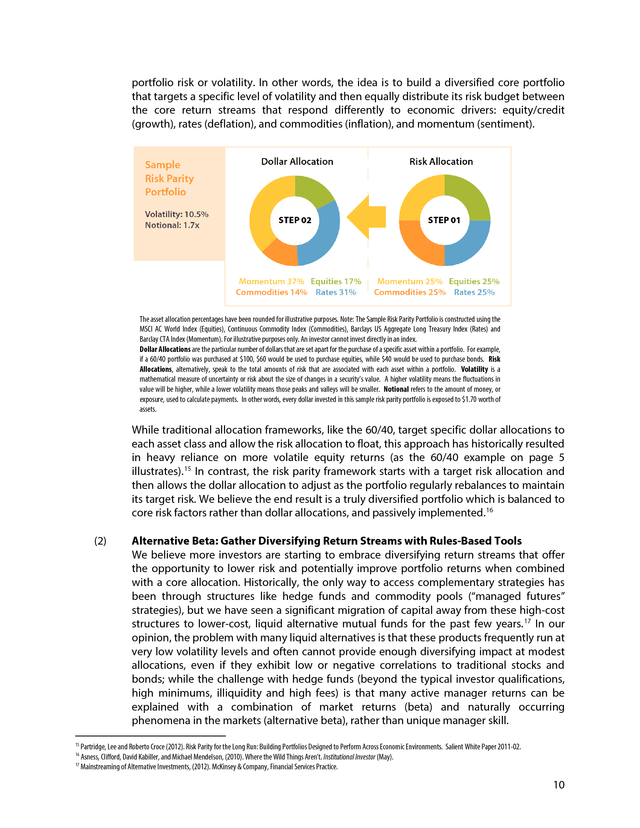
Risk parity can be thought of as a multi-asset class global strategy whose components are equally weighted by risk (instead of capitalization-weighted, or equally weighted by invested amount) at multiple levels (asset class; geography or other classification; individual security), and whose overall exposures are designed to rise and fall inversely with market volatility to deliver a consistent, targeted level of overall 9 . portfolio risk or volatility. In other words, the idea is to build a diversified core portfolio that targets a specific level of volatility and then equally distribute its risk budget between the core return streams that respond differently to economic drivers: equity/credit (growth), rates (deflation), and commodities (inflation), and momentum (sentiment). The asset allocation percentages have been rounded for illustrative purposes. Note: The Sample Risk Parity Portfolio is constructed using the MSCI AC World Index (Equities), Continuous Commodity Index (Commodities), Barclays US Aggregate Long Treasury Index (Rates) and Barclay CTA Index (Momentum). For illustrative purposes only.
An investor cannot invest directly in an index. Dollar Allocations are the particular number of dollars that are set apart for the purchase of a specific asset within a portfolio. For example, if a 60/40 portfolio was purchased at $100, $60 would be used to purchase equities, while $40 would be used to purchase bonds. Risk Allocations, alternatively, speak to the total amounts of risk that are associated with each asset within a portfolio.
Volatility is a mathematical measure of uncertainty or risk about the size of changes in a security’s value. A higher volatility means the fluctuations in value will be higher, while a lower volatility means those peaks and valleys will be smaller. Notional refers to the amount of money, or exposure, used to calculate payments.
In other words, every dollar invested in this sample risk parity portfolio is exposed to $1.70 worth of assets. While traditional allocation frameworks, like the 60/40, target specific dollar allocations to each asset class and allow the risk allocation to float, this approach has historically resulted in heavy reliance on more volatile equity returns (as the 60/40 example on page 5 illustrates). 15 In contrast, the risk parity framework starts with a target risk allocation and then allows the dollar allocation to adjust as the portfolio regularly rebalances to maintain its target risk. We believe the end result is a truly diversified portfolio which is balanced to core risk factors rather than dollar allocations, and passively implemented.
16 (2) Alternative Beta: Gather Diversifying Return Streams with Rules-Based Tools We believe more investors are starting to embrace diversifying return streams that offer the opportunity to lower risk and potentially improve portfolio returns when combined with a core allocation. Historically, the only way to access complementary strategies has been through structures like hedge funds and commodity pools (“managed futures” strategies), but we have seen a significant migration of capital away from these high-cost structures to lower-cost, liquid alternative mutual funds for the past few years. 17 In our opinion, the problem with many liquid alternatives is that these products frequently run at very low volatility levels and often cannot provide enough diversifying impact at modest allocations, even if they exhibit low or negative correlations to traditional stocks and bonds; while the challenge with hedge funds (beyond the typical investor qualifications, high minimums, illiquidity and high fees) is that many active manager returns can be explained with a combination of market returns (beta) and naturally occurring phenomena in the markets (alternative beta), rather than unique manager skill. 15 Partridge, Lee and Roberto Croce (2012).
Risk Parity for the Long Run: Building Portfolios Designed to Perform Across Economic Environments. Salient White Paper 2011-02. Asness, Clifford, David Kabiller, and Michael Mendelson, (2010). Where the Wild Things Aren’t.
Institutional Investor (May). 17 Mainstreaming of Alternative Investments, (2012). McKinsey & Company, Financial Services Practice. 16 10 . Building on the improvements that these institutions are making to their core portfolios, many innovative investors are starting to ask more questions about the value of differentiated return streams. Market exposures in equity, credit, rates, and commodities can often be harvested inexpensively in very liquid formats; so many institutions are implementing these exposures directly. Alternative betas, like size, value, momentum, 18 and carry, can often be gathered easily with rules-based tools. Institutions are often willing to pay a modest fee for implementation, but not the same high-cost combination of management and incentive fees that most hedge funds demand.
Rather than paying for a combination of these factors, many forward-thinking institutions are demanding “pure” access to these non-market betas, frequently at 15% to 20% target volatility levels. Finally, many institutions are raising the hurdle for hedge fund managers in their portfolios and only choosing to pay management and incentive fees when a fund’s returns cannot be easily explained by a combination of market beta and alternative beta. 19 We believe hedge funds may provide another complementary return stream and bring more potential balance to a portfolio, but only when the returns from skill are discernible, diversifying, and robust. We feel these innovative investors are embracing these alternative betas as a potentially dependable and efficient way to diversify portfolios before starting down the path of hunting for managers truly capable of generating “alpha” or skill-based returns. (3) Yield: Seek to Improve & Diversify Cash Flows Low rates are typically a natural consequence of the breakdown in credit creation that happens when households and banks reduce debt relative to income.
Moreover, we believe central banks must hold rates low until government debt falls to a more manageable level. 20 This kind of policy intervention may eventually lead to inflation, but history suggests that short-term rates can remain near 0% for decades as economies deleverage. 21,22 Rather than blindly stretching for yield, many leading institutions are working to improve and diversify their potential cash flows while also prioritizing total return opportunities.
At current valuations, we believe three kinds of assets appear to be attractive: (1) Master Limited Partnerships, (2) high yield credit, and (3) emerging market sovereign debt. Master Limited Partnerships (MLPs) are publicly traded partnerships, typically backed by steady income streams from energy infrastructure assets, which offer investors the opportunity to invest for high total return while capturing yield. MLPs have historically generated competitive total returns through a combination of high current yield and growth in distributions, while also providing portfolio diversification and a hedge against unexpected inflation. 23 High net worth and retail investors have historically dominated the MLP market due in part to the tax complexities, but MLPs are now gaining traction among institutional 18 Croce, Roberto, (2013).
A Primer on Momentum. Salient White Paper 2012-03. Ellis, Charles, (2012). Murder on the Orient Express: The Mystery of Underperformance.
Financial Analysts Journal, Volume 68, 13-19. 20 Reinhart, Carmen, Vincent Reinhart, and Kenneth Rogoff, (2012). Debt Overhangs: Past and Present. NBER Working Paper 18015. 21 Koo, Richard, (2012).
The World in Balance Sheet Recession: Causes, Cures, and Politics. Real World Economics Review, Issue 58, 19-37. 22 Dalio, Ray, (2012). An In Depth Look at Deleveragings.
Bridgewater Associates White Paper. 23 Past performance is no guarantee of future results. 19 11 . investors as a potentially more durable source of yield. As modern technology allows for increases in energy production from North American shale basins, the supply of existing infrastructure needed for gathering, processing, and transporting oil and gas is still growing more slowly than the demand for new midstream infrastructure. 24 Thus, we currently believe there is little potential downside to cash flows for midstream MLPs despite changes in economic activity. High Yield Credit offers a yield component above short term Treasury rates that is directly related to a company’s credit quality, or default risk. Although high yield bond prices are elevated today with yields near all-time lows, credit spreads to Treasuries are still priced fairly and typically offer relatively attractive yields in the 5% to 6% range.
25 We believe high yield may be a better way to take growth-oriented risk than equity in a deleveraging period, since corporate balance sheets (excluding financials) are generally strong and monetary policy continues to limit defaults by keeping capital markets open. It may not offer the same total return opportunity as MLPs, but many institutions are using this as a tool for diversifying their cash flows. Emerging Market Sovereign Debt, denominated in local currency, offers longâ€term investors an opportunity for attractive yield with potential upside from currency appreciation. In both relative and absolute terms, we believe emerging markets sovereign debt offers a potentially more compelling risk/return profile when compared to developed market sovereign debt based upon higher economic growth rates, lower deficits, falling inflation, better demographics, rich natural resources (particularly in Latin America), more conservative monetary policies, and a reduction in dependence on external debt.
Despite these potential advantages, many local emerging market issuers are trading at yield concessions to their developed market counterparts. We anticipate a convergence of emerging and developed market inflation rates coupled with continued improvements to the fiscal picture of across emerging countries that we believe will lead to a convergence of nominal interest rates, which has already been demonstrated by many dollardenominated issues that are actually trading through U.S. Treasuries.
26 This strategy seeks to capitalize on currency devaluation in the developed world, a direct result of the policy tools being employed to combat the slow and often painful effects of deleveraging. (4) Global Equity: Unconstrained with Risk Management > Style Boxes Many institutional investors are exploring better ways to actively access the equity markets with an emphasis on global, unconstrained stock picking. Rather than forcing managers into traditional style boxes; there is evidence that unconstrained managers can outperform by shifting between styles, regions, and market capitalizations at will. 27 In our opinion, this kind of unconstrained and global orientation allows managers to actively seek out value and growth opportunities while minimizing the home market bias that may plague many portfolios allocated with a style box approach. We are also seeing demand for better risk management across actively managed equity portfolios.
Our own research suggests that risk-adjusted returns tend to fall during periods of high and rising volatility, while risk-adjusted returns tend to rise during periods of low 24 Gardner, Ted, Greg Reid, Parag Sanghani, and Hollis Ghobrial (2012). Master Limited Partnerships. Salient White Paper 2012-04. Marks, Howard and Sheldon Stone, (2013).
High Yield Bonds Today. Memo to Oaktree Clients. 26 Salient Capital Advisors, LLC. February 2013. 27 Pyne, Andrew, (2012).
Equity Investing: From Style Box to Global Unconstrained. PIMCO Featured Solution Series. 25 12 . and falling volatility. An approach that targets a specific risk band, raising volatility when it gets too low and reducing volatility when it gets too high, may provide a better beta to the equity market while seeking to capture the potential benefits of security selection. (5) Private Energy & Credit: Focus Illiquidity Risk Around Best Opportunities The illiquidity premium is back and potentially available to an investors who is willing to commit a portion of his or her portfolio to private investments. While the illiquidity premium would normally shrink after several years of an economic recovery, sluggish growth and an almost dogmatic preference for liquidity continues to create potential buying opportunities for patient investors willing to deploy capital at typically lower entry multiples (compared to private markets) and eventually exit at potentially higher multiples (through initial public offerings or sales to strategic investors) after some sort of valuecreation or turnaround process. We believe the key ingredients are time, manager/management skill, and the prevailing market conditions at entry and exit. By parting with liquidity and taking a multi-year outlook on valuation trends, investment themes, and strategies, we believe private investments offer the opportunity to be useful for investors looking to boost their potential returns in a deleveraging environment. Although current supply and demand dynamics are less than promising today in secondary markets and traditional buyout and growth capital strategies, we believe conditions are favorable in private credit and energy strategies where the supply of capital is limited and demand for capital is growing. Private credit typically offers cash flows and total return competitive with high yield, but many strong managers have been able to deliver these results with more downside protection than high yield by owning distressed credits backed by senior claims in the capital structure.
Furthermore, deleveraging in the financial sector is creating opportunities for private credit as banks around the developed world are being forced to sell quality assets and raise liquidity to meet the new capital requirements set out under Basel III. 28 Private energy and energy infrastructure typically offer strong prospects for high total return, attractive cash flows, and growing demand from strategic investors. We believe investors can potentially achieve attractive current yields and total returns by purchasing interests in existing oil and gas companies, seeking to capture the revenue from production over several years, and potentially exiting through strategic sales, in many cases to become public MLPs. 28 KPMG, Basel 3 - Pressure is Building.
December 2010. 13 . References Economics Business Cycle Expansions & Contractions, (2013). NBER Business Cycle Dating Committee. (http://www.nber.org/cycles/US_Business_Cycle_Expansions_and_Contractions_20120423.pdf) Cecchetti, Stephen, MS Mohanty, and Fabrizio Zampolli, (2010). The Future of Public Debt. BIS Working Paper 300. Dalio, Ray, (2012).
An In Depth Look at Deleveragings. Bridgewater Associates White Paper. Dalio, Ray, (2012). How the Economic Machine Works: A Template for Understanding What is Happening Now.
Bridgewater Associates White Paper. Koo, Richard, (2012). The World in Balance Sheet Recession: Causes, Cures, and Politics. Real World Economics Review, Issue 58, 19-37. Reinhart, Carmen, Vincent Reinhart, and Kenneth Rogoff, (2012).
Debt Overhangs: Past and Present. NBER Working Paper 18015. Reinhart, Carmen, and Kenneth Rogoff, (2008). This Time is Different: A Panoramic View of Eight Centuries of Financial Folly. NBER Working Paper 13882. Roxburgh, Charles, Susan Lund, Tony Wimmer, Eric Amar, Charles Atkins, Ju-Hon Kwek, Richard Dobbs, James Manyika, (2010).
Debt and Deleveraging: The Global Credit Bubble and its Economic Consequences. The Great Deleveraging, (2012). UBS Financial Services Inc. Investments Asness, Clifford, David Kabiller, and Michael Mendelson, (2010). Where the Wild Things Aren’t. Institutional Investor (May). Bender, Jennifer, Remy Briand, Frank Nielson, and Dan Stefek, (2010).
Portfolio of Risk Premia: A New Approach to Diversification. Journal of Portfolio Management, 17-25 (Winter). Croce, Roberto, (2013). A Primer on Momentum.
Salient White Paper 2012-03. Ellis, Charles, (2012). Murder on the Orient Express: The Mystery of Underperformance. Financial Analysts Journal, Volume 68, 13-19. 14 .
Gardner, Ted, Greg Reid, Parag Sanghani, and Hollis Ghobrial, (2012). Master Limited Partnerships. Salient White Paper 2012-04. Mainstreaming of Alternative Investments, (2012). McKinsey & Company, Financial Services Practice. Marks, Howard and Sheldon Stone, (2013). High Yield Bonds Today.
Memo to Oaktree Clients. Page, Sebastien and Mark Taborsky, (2010). The Myth of Diversification: Risk Factors vs Asset Classes. PIMCO Viewpoints (September). Partridge, Lee, and Roberto Croce, (2012). Risk Parity for the Long Run: Building Portfolios Designed to Perform Across Economic Environments.
Salient White Paper 2012-02. Pyne, Andrew, (2012). Equity Investing: From Style Box to Global Unconstrained. PIMCO Featured Solution Series. The All Weather Story, (2012).
Bridgewater Associates. 15 .
The views expressed herein are subject to change at any time, due to numerous market and other factors. The Adviser disclaims any obligation to update publicly or revise any forward-looking statements or views expressed herein. There can be no assurance that any investment program will achieve its investment objectives. The value of any investment program will fluctuate with the value of the underlying securities. This information is neither an offer to sell nor a solicitation of any offer to buy any securities.
Any offering or solicitation will be made only to eligible investors and pursuant to any applicable Private Placement Memorandum, prospectus and other governing documents, all of which must be read in their entirety. Research services are provided by Salient Capital Advisors, LLC, a wholly owned subsidiary of Salient Partners, L.P., a U.S. Securities and Exchange Commission Registered Investment Adviser. Salient research has been prepared without regard to the individual financial circumstances and objectives of persons who receive it. Salient recommends that investors independently evaluate particular investments and strategies, and encourage investors to seek the advice of a financial advisor.
The appropriateness of a particular investment or strategy will depend on an investor’s individual circumstances and objectives. ©2013. Salient. Material not to be duplicated.
Intended for U.S. investors only. Salient is the trade name for Salient Partners, L.P., which together with its subsidiaries provides asset management and advisory services. Insurance products offered through Salient Insurance Agency, LLC (Texas license #1736192).
Trust services provided by Salient Trust Co., LTA. Securities offered through Salient Capital, L.P., a registered broker-dealer and Member FINRA, SIPC. Each of Salient Insurance Agency, LLC, Salient Trust Co., LTA, and Salient Capital, L.P., is a subsidiary of Salient Partners, L.P. 2 .
Executive Summary Credit typically acts like fuel for economic growth. As we saw in the United States from 1944 to 2009, credit expansion can drive unnaturally strong economic growth as cash flows and additional borrowing boost consumption and investment; while contraction in credit (“deleveraging”), which last occurred in the United States from 1929 to 1943, can impose unnaturally weak economic growth as cash flows are diverted to retire debts incurred in previous years. After the largest credit expansion in history and a truly global financial crisis, the United States economy – along with the rest of the developed world – has just begun a long process of deleveraging, which is already dragging on growth, suppressing interest rates, and distorting the market cycle. At Salient, we believe understanding this deleveraging environment and its implications for investing is an important task for anyone who chooses to put capital at risk today. In this paper, we are going to briefly explain deleveraging, how it typically happens, and why we believe it requires a different approach to the investing process. Then, we are going to describe five actionable examples of strategies being employed by institutional investors in this environment: (1) balancing core portfolio risks at a specific volatility level, (2) gathering diversifying “alternative betas” with rules-based tools, (3) identifying yield opportunities supported by durable cash flows, (4) migrating active equity exposure from style boxes to a global, unconstrained framework, and (5) focusing private investments in opportunities to garner the potential illiquidity premium. 3 .
Beyond the Business Cycle: How Credit Shapes the Investing Environment Conventional wisdom suggests that investors should manage their portfolios around changes in the business cycle, or the tendency for economic activity to swing from expansion to recession every five to ten years. The cycle typically begins with positive economic growth and low levels of inflation. As an expansion builds, momentum and credit growth accelerate, aggregate demand starts to exceed aggregate supply, production is stretched as the actual output (or GDP) of the economy exceeds its long-run potential output (a “positive output gap”), inflation increases, and the economy begins to feel the strain of this disparity. The business cycle usually peaks after the central bank raises interest rates to slow credit growth and prevent excessive inflation.
When the actual output of the economy falls below potential output (“negative output gap”), inflation moderates, economic growth slows, and the economy eventually contracts. Recession typically ends with central bank stimulus that is intended to encourage economic growth, and a new expansion typically begins… but not this time. 1 Nearly four years after the financial crisis ended in March 2009, the US economy continues to muddle through its weakest recovery in more than sixty years.
Unlike “normal” business cycles, the Fed has not been able to restore the economy to trend growth even after dropping its policy interest rate to zero and expanding its balance sheet by trillions of dollars through direct asset purchases (often called “quantitative easing” or “QE” for short). In response to unprecedented Fed policy action, economic growth is still running well below its long term average, the money supply has only increased at a sluggish pace, and policymakers are more concerned about Japanese-style deflation than inflation. 2 So what is going on today that is so different from every other business cycle in recent memory? Why is real GDP growth only running around 2% per year? 3 We believe the answer lies in the graph on the next page, and, as the graph suggests, we believe these challenges could potentially last for the next decade—if not longer. 1 Dalio, Ray, (2012).
How the Economic Machine Works: A Template for Understanding What is Happening Now. Bridgewater Associates White Paper. Koo, Richard, (2012). The World in Balance Sheet Recession: Causes, Cures, and Politics.
Real World Economics Review, Issue 58, 19-37. 3 Federal Reserve z.1 Report, Statistical Abstract of the United States. January 2013 2 4 . * Source: Federal Reserve z.1 Report, Statistical Abstract of the United States. January 2013. Past performance is no guarantee of future results. *Debt to GDP is the amount of national debt of a country as a percentage of its Gross Domestic Product (GDP). “Private Debt/GDP” measures private debt against this measure whereas “Government Debt/GDP” measures the debt of the federal government.
A low debt-to-GDP ratio indicates an economy that produces a large number of goods and services and probably profits that are high enough to pay back debts. The business cycle is ultimately driven by changes in the rate of credit growth, but history suggests there is typically a larger credit cycle that repeats every fifty to eighty years as total debt rises and falls relative to total GDP. 4 As you can see in the graph of US total debt to GDP, this multi-generation credit cycle has two distinct phases: credit expansion and deleveraging. Credit expansion tends to support economic growth over several generations as current cash flows are used to increase consumption and investment; and deleveraging tends to drag on economic growth as current cash flows are used to retire debt incurred in previous years.
These are fundamentally different economic environments that we believe require different investment plans. Credit expansion tends to boost GDP growth and favor growth-oriented assets, like equity; and deleveraging tends to reduce GDP growth and favor deflation-oriented assets, like government bonds. 5 According to the NBER’s Business Cycle Dating Committee, the US economy has moved through twelve complete business cycles since 1945, and five since 1980; 6 but every expansion and every recession played out against the backdrop of a single credit expansion that lasted from 1944 to early 2009.
7 Over the course of this 65 year credit expansion, strong returns from the equity markets have reinforced a “stocks for the long run” view, and investors have grown accustomed to betting on growth. Conventional wisdom has dictated that the bulk of an investor’s portfolio should be split between stocks and bonds: stocks for capturing growth when times are good and bonds for generating income and preserving wealth when times are bad. As a result, many individuals today tend to own a mix of 60% stocks and 40% bonds, or a variation of this design.
The traditional “60/40 portfolio” may appear diversified in dollar terms, but in risk terms it is heavily concentrated toward equity markets because stocks have exhibited nearly three times the volatility of bonds over the past 4 Reinhart, Carmen, and Kenneth Rogoff, (2008). This Time is Different: A Panoramic View of Eight Centuries of Financial Folly. NBER Working Paper 13882.5 Dalio, Ray, (2012).
How the Economic Machine Works: A Template for Understanding What is Happening Now. Bridgewater Associates White Paper. 5 Dalio, Ray, (2012). How the Economic Machine Works: A Template for Understanding What is Happening Now.
Bridgewater Associates White Paper. 6 Business Cycle Expansions & Contractions, (2013). NBER Business Cycle Dating Committee. (http://www.nber.org/cycles/US_Business_Cycle_Expansions_and_Contractions_20120423.pdf) 7 Roxburgh, Charles, Susan Lund, Tony Wimmer, Eric Amar, Charles Atkins, Ju-Hon Kwek, Richard Dobbs, James Manyika, (2010).
Debt and Deleveraging: The Global Credit Bubble and its Economic Consequences. McKinsey Global Institute. 5 . four decades. 8 Therefore, it is no wonder the 60/40 portfolio has closely tracked the equity market over time. Almost all of its potential earning power is in equities. Source: Salient Capital Advisors, LLC. February 2013. The calculation of Risk Contribution from equities and bonds is based on Modern Portfolio Theory’s calculation of portfolio risk where the contribution of equities and bonds to the portfolio risk are calculated based on dollar weights, standard deviation and correlation of equities and bonds. Within this framework, it is logical to think of equities as the primary tool for capturing growth and bonds as the primary tool for reducing potential risk across the portfolio.
Moving beyond the passive, regularly-rebalanced 60/40 allocation, many active investors have typically used this allocation framework as their starting point for decades – raising the allocation to equities when their outlook for growth is positive and lowering the allocation to equities when their outlook for growth is negative or uncertain. Until recently, even the most sophisticated institutions have created actively-managed portfolios that approximate a 60% allocation (or more) to equity-substitutes and 40% (or less) to bond substitutes. Based on our research, several of the largest university endowments (assets exceeding $1 billion), for example, have broadened their portfolios to include more asset classes, like commodities, or alternative strategies, such as hedge funds and private equity. Expanding the mix of assets and strategies in these portfolios was intended to boost potential returns and achieve better diversification, while providing better downside risk; but in practice, these institutions’ portfolios were still loading on growth-oriented risk factors, like equity risk and credit spreads, 9 while often adding unnecessary costs through outside managers. 10 8 PerTrac, by Salient Capital Advisors, LLC.
March 2013. Page, Sebastien and Mark Taborsky, (2010). The Myth of Diversification: Risk Factors vs Asset Classes. PIMCO Viewpoints (September). 10 Ellis, Charles, (2012).
Murder on the Orient Express: The Mystery of Underperformance. Financial Analysts Journal, Volume 68, 13-19. 9 6 . NACUBO is the National Association of College and University Business Officers. Data displayed here has been rounded for illustrative purposes only. September 2011. We believe the original endowment model was an important first step toward diversification, but still fails to provide truly balanced exposures across many risk factors. Ultimately, the 60/40 and endowment approaches depend on the same thing, a bet on economic growth, which is unlikely to produce favorable results against a weak growth backdrop. The dilemma is that deleveraging may happen once, or maybe twice, in a lifetime.
This is an unfamiliar economic environment since few people living in the United States today can rely on personal experience from the last US deleveraging which lasted from 1929 to 1943. Against the pro-growth backdrop of credit expansion, equity-heavy portfolio allocations, like the 60/40 and endowment style portfolios, have been profitable for many investors; but we believe deleveraging demands an altogether different approach to asset allocation and portfolio construction. 11 Fortunately, balance sheet deleveraging is not uncommon throughout history.
12 There have been 32 relevant deleveraging episodes around the world since 1930 and all of them followed major financial crises. Building on insights from Carmen Reinhart and Kenneth Rogoff, recent research from the McKinsey Global Institute reveals that an economy can deleverage in four ways: (1) belt-tightening or austerity, (2) default or restructuring, (3) inflation, and (4) rapid economic growth. 13 (1) Austerity: Reduces debt slowly relative to income by increasing savings and reducing spending.
This process of slowly paying down debt typically takes many years, if not decades, and often leads to below average real GDP growth. Central banks and federal governments typically play a key role in engineering this kind of deleveraging. Policy errors can result in the “default” path, but the right mix of monetary and fiscal policy can produce what Ray Dalio at Bridgewater has called the “beautiful deleveraging.” Most economies have followed this deleveraging path since 1930, but rarely from such high private and public debt levels across the developed world.
(Example: United States from 2009 to 2013) 11 Dalio, Ray, (2012). How the Economic Machine Works: A Template for Understanding What is Happening Now. Bridgewater Associates White Paper. The Great Deleveraging, (2012).
UBS Financial Services Inc. 13 Roxburgh, Charles, Susan Lund, Tony Wimmer, Eric Amar, Charles Atkins, Ju-Hon Kwek, Richard Dobbs, James Manyika, (2010). Debt and Deleveraging: The Global Credit Bubble and its Economic Consequences. McKinsey Global Institute. 12 7 .
(2) Default: Reduces outstanding debts through refusing or rescheduling debt payments. This process can be swift and painful since it often results in collapsing income and money supply. Defaults can lead to disorderly deleveraging and often bring on full-scale depression. The resulting fall in income typically leads to a rise in debt relative to income, meaning that another form of deleveraging must follow. Although the United States avoided this painful path in early 2009, we believe it could still happen in the event of a major policy error. (Example: United States from 1929 to 1932) (3) Inflation: Reduces debt-to-income ratios as high inflation causes nominal incomes to rise faster than nominal debt.
High inflation may boost nominal growth, but it typically slows real GDP growth over the same period. Although many investors are worried about inflation today, deleveraging basically “breaks” the credit creation process and most often prevents the selfreinforcing cycle of rising wages, spending, and prices. Throughout history, deleveraging through inflation has typically happened when central banks lose their credibility and a currency collapses.
Despite widespread fears about the US Dollar, it is still the “cleanest dirty shirt” of the major reserve currencies. Thus, we believe high inflation or hyperinflation is a very low-probability outcome until the private sector deleverages enough for the credit creation process to resume. (Example: Spain from 1976 to 1980) (4) Growth: Reduce debt to income through rapid real income growth.
Deleveraging through growth has only happened once after a major financial crisis since 1930, and it happened as the United States was massively mobilizing for World War II. We believe this path is the least likely outcome for today’s deleveraging, although a “game-changing” technological innovation could induce rapid growth, in theory. (Example: United States from 1933 to 1939) Now that credit expansion has given way to deleveraging in the United States – and across most of developed world – traditionally allocated portfolios may not be prepared for an economic environment with potential sluggish real GDP growth, zero interest rates, and little room for policy mistakes.
As you can see from the chart on the next page, debt to GDP has been falling in the United States since 2009 and we believe the process may take years to run. As debt falls relative to income, the deleveraging process will likely drag on today’s growth as current cash flows are used to retire debts incurred in the past, many of which were put toward nonproductive uses like Spanish beach condos, vacation homes in Ireland, or “McMansions” in the United States. So far, the mix of debt reduction and policy intervention has been one of the most “beautiful” on record 14; but we believe this will continue to be a daunting task for policymakers with significant potential downside risk to markets. 14 "Beautiful deleveraging" describes the rare instance where fiscal and monetary policy offsets the negative effects of debt reduction on economic activity.
Source: Dalio, Ray, (2012). An In Depth Look at Deleveragings. Bridgewater Associates White Paper. 8 .
450% Progress in US Deleveraging Public Debt/GDP, Private Debt/GDP, & Total Debt/GDP -35% of GDP 400% 350% 300% Total Credit Market Debt/GDP Total Government Debt/GDP Debt/GDP % Private Credit Market Debt/GDP 250% -59% of GDP 200% 150% +24% of GDP 100% 50% 0% 1972 1982 1992 2002 2012 Date Source: Federal Reserve z.1 Report, Statistical Abstract of the United States. For Illustrative purposes only. Past performance is no guarantee of future results. “Total Credit Market Debt/GDP” measures the combined credit market debt against the US Gross Domestic Product, whereas “Total Government Debt/GDP” measures the debt of the federal government against this same standard and “Private Credit Market Debt/GDP” measures the debt of the private credit market against it. Given these challenges, we believe the most innovative institutional investors have already started adapting their portfolios for a long-term deleveraging environment. The process entails balancing core market exposures to different economic scenarios rather than betting on one path, like growth or inflation, and refocusing the investment process away from relying on economic and market predictions. Following this example, it may be wise for individual investors to consider five strategies: (1) balancing core portfolio risks at a specific volatility level, (2) gathering diversifying “alternative betas” with rules-based tools, (3) identifying yield opportunities supported by durable cash flow, (4) migrating active equity exposure from style boxes to a global, unconstrained framework, and (5) focusing private investments in the best opportunities to garner the potential illiquidity premium. Institutional Investing Trends: How Innovative Institutions are Adapting to Deleveraging (1) Risk Parity: Target a Specific Volatility Level & Balance Core Portfolio Risks Many innovative institutions are starting to adopt a strategy called “risk parity” as way to seek diversification from equity risk and balance their core portfolios to different economic scenarios.
Risk parity can be thought of as a multi-asset class global strategy whose components are equally weighted by risk (instead of capitalization-weighted, or equally weighted by invested amount) at multiple levels (asset class; geography or other classification; individual security), and whose overall exposures are designed to rise and fall inversely with market volatility to deliver a consistent, targeted level of overall 9 . portfolio risk or volatility. In other words, the idea is to build a diversified core portfolio that targets a specific level of volatility and then equally distribute its risk budget between the core return streams that respond differently to economic drivers: equity/credit (growth), rates (deflation), and commodities (inflation), and momentum (sentiment). The asset allocation percentages have been rounded for illustrative purposes. Note: The Sample Risk Parity Portfolio is constructed using the MSCI AC World Index (Equities), Continuous Commodity Index (Commodities), Barclays US Aggregate Long Treasury Index (Rates) and Barclay CTA Index (Momentum). For illustrative purposes only.
An investor cannot invest directly in an index. Dollar Allocations are the particular number of dollars that are set apart for the purchase of a specific asset within a portfolio. For example, if a 60/40 portfolio was purchased at $100, $60 would be used to purchase equities, while $40 would be used to purchase bonds. Risk Allocations, alternatively, speak to the total amounts of risk that are associated with each asset within a portfolio.
Volatility is a mathematical measure of uncertainty or risk about the size of changes in a security’s value. A higher volatility means the fluctuations in value will be higher, while a lower volatility means those peaks and valleys will be smaller. Notional refers to the amount of money, or exposure, used to calculate payments.
In other words, every dollar invested in this sample risk parity portfolio is exposed to $1.70 worth of assets. While traditional allocation frameworks, like the 60/40, target specific dollar allocations to each asset class and allow the risk allocation to float, this approach has historically resulted in heavy reliance on more volatile equity returns (as the 60/40 example on page 5 illustrates). 15 In contrast, the risk parity framework starts with a target risk allocation and then allows the dollar allocation to adjust as the portfolio regularly rebalances to maintain its target risk. We believe the end result is a truly diversified portfolio which is balanced to core risk factors rather than dollar allocations, and passively implemented.
16 (2) Alternative Beta: Gather Diversifying Return Streams with Rules-Based Tools We believe more investors are starting to embrace diversifying return streams that offer the opportunity to lower risk and potentially improve portfolio returns when combined with a core allocation. Historically, the only way to access complementary strategies has been through structures like hedge funds and commodity pools (“managed futures” strategies), but we have seen a significant migration of capital away from these high-cost structures to lower-cost, liquid alternative mutual funds for the past few years. 17 In our opinion, the problem with many liquid alternatives is that these products frequently run at very low volatility levels and often cannot provide enough diversifying impact at modest allocations, even if they exhibit low or negative correlations to traditional stocks and bonds; while the challenge with hedge funds (beyond the typical investor qualifications, high minimums, illiquidity and high fees) is that many active manager returns can be explained with a combination of market returns (beta) and naturally occurring phenomena in the markets (alternative beta), rather than unique manager skill. 15 Partridge, Lee and Roberto Croce (2012).
Risk Parity for the Long Run: Building Portfolios Designed to Perform Across Economic Environments. Salient White Paper 2011-02. Asness, Clifford, David Kabiller, and Michael Mendelson, (2010). Where the Wild Things Aren’t.
Institutional Investor (May). 17 Mainstreaming of Alternative Investments, (2012). McKinsey & Company, Financial Services Practice. 16 10 . Building on the improvements that these institutions are making to their core portfolios, many innovative investors are starting to ask more questions about the value of differentiated return streams. Market exposures in equity, credit, rates, and commodities can often be harvested inexpensively in very liquid formats; so many institutions are implementing these exposures directly. Alternative betas, like size, value, momentum, 18 and carry, can often be gathered easily with rules-based tools. Institutions are often willing to pay a modest fee for implementation, but not the same high-cost combination of management and incentive fees that most hedge funds demand.
Rather than paying for a combination of these factors, many forward-thinking institutions are demanding “pure” access to these non-market betas, frequently at 15% to 20% target volatility levels. Finally, many institutions are raising the hurdle for hedge fund managers in their portfolios and only choosing to pay management and incentive fees when a fund’s returns cannot be easily explained by a combination of market beta and alternative beta. 19 We believe hedge funds may provide another complementary return stream and bring more potential balance to a portfolio, but only when the returns from skill are discernible, diversifying, and robust. We feel these innovative investors are embracing these alternative betas as a potentially dependable and efficient way to diversify portfolios before starting down the path of hunting for managers truly capable of generating “alpha” or skill-based returns. (3) Yield: Seek to Improve & Diversify Cash Flows Low rates are typically a natural consequence of the breakdown in credit creation that happens when households and banks reduce debt relative to income.
Moreover, we believe central banks must hold rates low until government debt falls to a more manageable level. 20 This kind of policy intervention may eventually lead to inflation, but history suggests that short-term rates can remain near 0% for decades as economies deleverage. 21,22 Rather than blindly stretching for yield, many leading institutions are working to improve and diversify their potential cash flows while also prioritizing total return opportunities.
At current valuations, we believe three kinds of assets appear to be attractive: (1) Master Limited Partnerships, (2) high yield credit, and (3) emerging market sovereign debt. Master Limited Partnerships (MLPs) are publicly traded partnerships, typically backed by steady income streams from energy infrastructure assets, which offer investors the opportunity to invest for high total return while capturing yield. MLPs have historically generated competitive total returns through a combination of high current yield and growth in distributions, while also providing portfolio diversification and a hedge against unexpected inflation. 23 High net worth and retail investors have historically dominated the MLP market due in part to the tax complexities, but MLPs are now gaining traction among institutional 18 Croce, Roberto, (2013).
A Primer on Momentum. Salient White Paper 2012-03. Ellis, Charles, (2012). Murder on the Orient Express: The Mystery of Underperformance.
Financial Analysts Journal, Volume 68, 13-19. 20 Reinhart, Carmen, Vincent Reinhart, and Kenneth Rogoff, (2012). Debt Overhangs: Past and Present. NBER Working Paper 18015. 21 Koo, Richard, (2012).
The World in Balance Sheet Recession: Causes, Cures, and Politics. Real World Economics Review, Issue 58, 19-37. 22 Dalio, Ray, (2012). An In Depth Look at Deleveragings.
Bridgewater Associates White Paper. 23 Past performance is no guarantee of future results. 19 11 . investors as a potentially more durable source of yield. As modern technology allows for increases in energy production from North American shale basins, the supply of existing infrastructure needed for gathering, processing, and transporting oil and gas is still growing more slowly than the demand for new midstream infrastructure. 24 Thus, we currently believe there is little potential downside to cash flows for midstream MLPs despite changes in economic activity. High Yield Credit offers a yield component above short term Treasury rates that is directly related to a company’s credit quality, or default risk. Although high yield bond prices are elevated today with yields near all-time lows, credit spreads to Treasuries are still priced fairly and typically offer relatively attractive yields in the 5% to 6% range.
25 We believe high yield may be a better way to take growth-oriented risk than equity in a deleveraging period, since corporate balance sheets (excluding financials) are generally strong and monetary policy continues to limit defaults by keeping capital markets open. It may not offer the same total return opportunity as MLPs, but many institutions are using this as a tool for diversifying their cash flows. Emerging Market Sovereign Debt, denominated in local currency, offers longâ€term investors an opportunity for attractive yield with potential upside from currency appreciation. In both relative and absolute terms, we believe emerging markets sovereign debt offers a potentially more compelling risk/return profile when compared to developed market sovereign debt based upon higher economic growth rates, lower deficits, falling inflation, better demographics, rich natural resources (particularly in Latin America), more conservative monetary policies, and a reduction in dependence on external debt.
Despite these potential advantages, many local emerging market issuers are trading at yield concessions to their developed market counterparts. We anticipate a convergence of emerging and developed market inflation rates coupled with continued improvements to the fiscal picture of across emerging countries that we believe will lead to a convergence of nominal interest rates, which has already been demonstrated by many dollardenominated issues that are actually trading through U.S. Treasuries.
26 This strategy seeks to capitalize on currency devaluation in the developed world, a direct result of the policy tools being employed to combat the slow and often painful effects of deleveraging. (4) Global Equity: Unconstrained with Risk Management > Style Boxes Many institutional investors are exploring better ways to actively access the equity markets with an emphasis on global, unconstrained stock picking. Rather than forcing managers into traditional style boxes; there is evidence that unconstrained managers can outperform by shifting between styles, regions, and market capitalizations at will. 27 In our opinion, this kind of unconstrained and global orientation allows managers to actively seek out value and growth opportunities while minimizing the home market bias that may plague many portfolios allocated with a style box approach. We are also seeing demand for better risk management across actively managed equity portfolios.
Our own research suggests that risk-adjusted returns tend to fall during periods of high and rising volatility, while risk-adjusted returns tend to rise during periods of low 24 Gardner, Ted, Greg Reid, Parag Sanghani, and Hollis Ghobrial (2012). Master Limited Partnerships. Salient White Paper 2012-04. Marks, Howard and Sheldon Stone, (2013).
High Yield Bonds Today. Memo to Oaktree Clients. 26 Salient Capital Advisors, LLC. February 2013. 27 Pyne, Andrew, (2012).
Equity Investing: From Style Box to Global Unconstrained. PIMCO Featured Solution Series. 25 12 . and falling volatility. An approach that targets a specific risk band, raising volatility when it gets too low and reducing volatility when it gets too high, may provide a better beta to the equity market while seeking to capture the potential benefits of security selection. (5) Private Energy & Credit: Focus Illiquidity Risk Around Best Opportunities The illiquidity premium is back and potentially available to an investors who is willing to commit a portion of his or her portfolio to private investments. While the illiquidity premium would normally shrink after several years of an economic recovery, sluggish growth and an almost dogmatic preference for liquidity continues to create potential buying opportunities for patient investors willing to deploy capital at typically lower entry multiples (compared to private markets) and eventually exit at potentially higher multiples (through initial public offerings or sales to strategic investors) after some sort of valuecreation or turnaround process. We believe the key ingredients are time, manager/management skill, and the prevailing market conditions at entry and exit. By parting with liquidity and taking a multi-year outlook on valuation trends, investment themes, and strategies, we believe private investments offer the opportunity to be useful for investors looking to boost their potential returns in a deleveraging environment. Although current supply and demand dynamics are less than promising today in secondary markets and traditional buyout and growth capital strategies, we believe conditions are favorable in private credit and energy strategies where the supply of capital is limited and demand for capital is growing. Private credit typically offers cash flows and total return competitive with high yield, but many strong managers have been able to deliver these results with more downside protection than high yield by owning distressed credits backed by senior claims in the capital structure.
Furthermore, deleveraging in the financial sector is creating opportunities for private credit as banks around the developed world are being forced to sell quality assets and raise liquidity to meet the new capital requirements set out under Basel III. 28 Private energy and energy infrastructure typically offer strong prospects for high total return, attractive cash flows, and growing demand from strategic investors. We believe investors can potentially achieve attractive current yields and total returns by purchasing interests in existing oil and gas companies, seeking to capture the revenue from production over several years, and potentially exiting through strategic sales, in many cases to become public MLPs. 28 KPMG, Basel 3 - Pressure is Building.
December 2010. 13 . References Economics Business Cycle Expansions & Contractions, (2013). NBER Business Cycle Dating Committee. (http://www.nber.org/cycles/US_Business_Cycle_Expansions_and_Contractions_20120423.pdf) Cecchetti, Stephen, MS Mohanty, and Fabrizio Zampolli, (2010). The Future of Public Debt. BIS Working Paper 300. Dalio, Ray, (2012).
An In Depth Look at Deleveragings. Bridgewater Associates White Paper. Dalio, Ray, (2012). How the Economic Machine Works: A Template for Understanding What is Happening Now.
Bridgewater Associates White Paper. Koo, Richard, (2012). The World in Balance Sheet Recession: Causes, Cures, and Politics. Real World Economics Review, Issue 58, 19-37. Reinhart, Carmen, Vincent Reinhart, and Kenneth Rogoff, (2012).
Debt Overhangs: Past and Present. NBER Working Paper 18015. Reinhart, Carmen, and Kenneth Rogoff, (2008). This Time is Different: A Panoramic View of Eight Centuries of Financial Folly. NBER Working Paper 13882. Roxburgh, Charles, Susan Lund, Tony Wimmer, Eric Amar, Charles Atkins, Ju-Hon Kwek, Richard Dobbs, James Manyika, (2010).
Debt and Deleveraging: The Global Credit Bubble and its Economic Consequences. The Great Deleveraging, (2012). UBS Financial Services Inc. Investments Asness, Clifford, David Kabiller, and Michael Mendelson, (2010). Where the Wild Things Aren’t. Institutional Investor (May). Bender, Jennifer, Remy Briand, Frank Nielson, and Dan Stefek, (2010).
Portfolio of Risk Premia: A New Approach to Diversification. Journal of Portfolio Management, 17-25 (Winter). Croce, Roberto, (2013). A Primer on Momentum.
Salient White Paper 2012-03. Ellis, Charles, (2012). Murder on the Orient Express: The Mystery of Underperformance. Financial Analysts Journal, Volume 68, 13-19. 14 .
Gardner, Ted, Greg Reid, Parag Sanghani, and Hollis Ghobrial, (2012). Master Limited Partnerships. Salient White Paper 2012-04. Mainstreaming of Alternative Investments, (2012). McKinsey & Company, Financial Services Practice. Marks, Howard and Sheldon Stone, (2013). High Yield Bonds Today.
Memo to Oaktree Clients. Page, Sebastien and Mark Taborsky, (2010). The Myth of Diversification: Risk Factors vs Asset Classes. PIMCO Viewpoints (September). Partridge, Lee, and Roberto Croce, (2012). Risk Parity for the Long Run: Building Portfolios Designed to Perform Across Economic Environments.
Salient White Paper 2012-02. Pyne, Andrew, (2012). Equity Investing: From Style Box to Global Unconstrained. PIMCO Featured Solution Series. The All Weather Story, (2012).
Bridgewater Associates. 15 .


