An Early January Effect and Other Calendar Anomalies - October 1, 2015
Salient Partners


Description
The House View:
An Early January Effect and
Other Calendar Anomalies
by Lee Partridge,
Chief Investment Officer
October 1, 2015
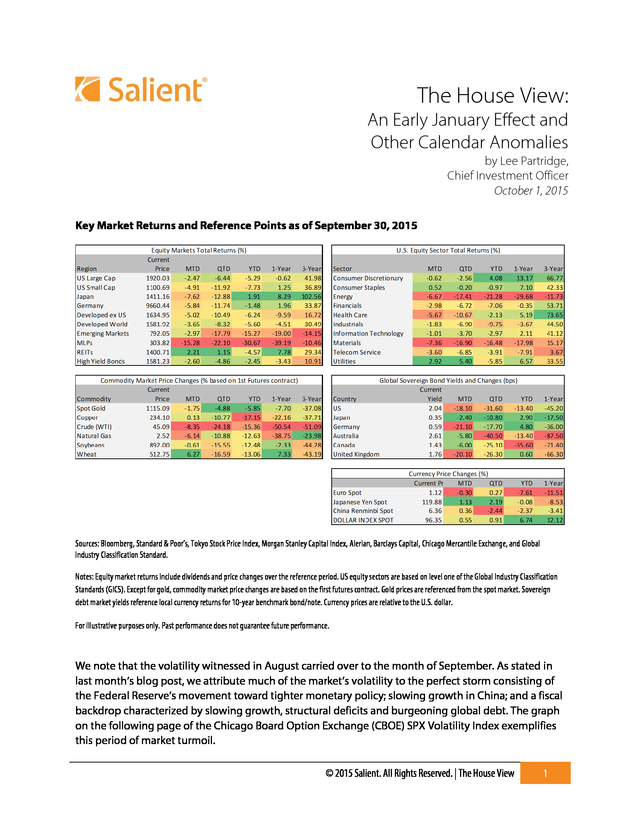
Key Market Returns and Reference Points as of September 30, 2015
Sources: Bloomberg, Standard & Poor’s, Tokyo Stock Price Index, Morgan Stanley Capital Index, Alerian, Barclays Capital, Chicago Mercantile Exchange, and Global
Industry Classification Standard.
Notes: Equity market returns include dividends and price changes over the reference period. US equity sectors are based on level one of the Global Industry Classification
Standards (GICS). Except for gold, commodity market price changes are based on the first futures contract. Gold prices are referenced from the spot market.
Sovereign debt market yields reference local currency returns for 10-year benchmark bond/note. Currency prices are relative to the U.S. dollar. For illustrative purposes only.
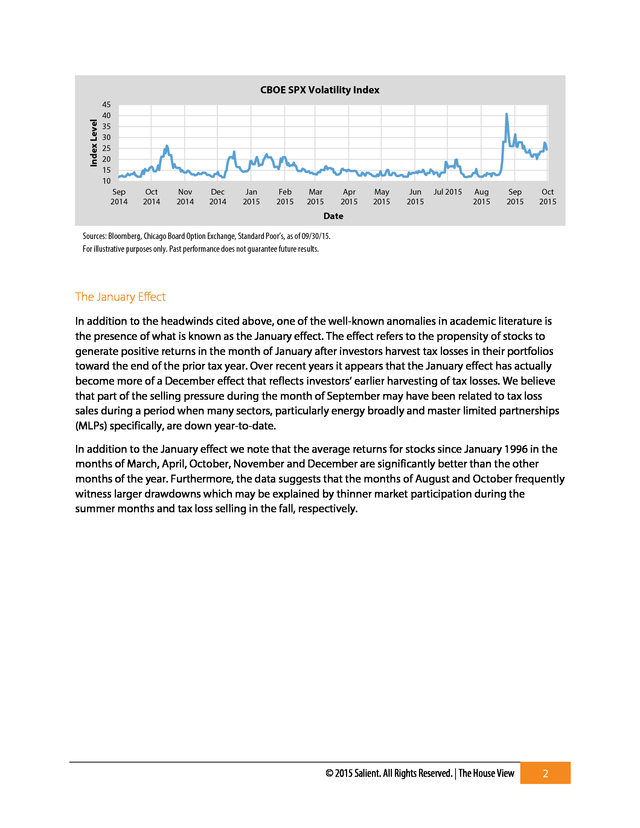
Past performance does not guarantee future performance. We note that the volatility witnessed in August carried over to the month of September. As stated in last month’s blog post, we attribute much of the market’s volatility to the perfect storm consisting of the Federal Reserve’s movement toward tighter monetary policy; slowing growth in China; and a fiscal backdrop characterized by slowing growth, structural deficits and burgeoning global debt. The graph on the following page of the Chicago Board Option Exchange (CBOE) SPX Volatility Index exemplifies this period of market turmoil. © 2015 Salient.
All Rights Reserved. | The House View 1 . Index Level CBOE SPX Volatility Index 45 40 35 30 25 20 15 10 Sep 2014 Oct 2014 Nov 2014 Dec 2014 Jan 2015 Feb 2015 Mar 2015 Apr 2015 May 2015 Jun 2015 Jul 2015 Aug 2015 Sep 2015 Oct 2015 Date Sources: Bloomberg, Chicago Board Option Exchange, Standard Poor’s, as of 09/30/15. For illustrative purposes only. Past performance does not guarantee future results. The January Effect In addition to the headwinds cited above, one of the well-known anomalies in academic literature is the presence of what is known as the January effect. The effect refers to the propensity of stocks to generate positive returns in the month of January after investors harvest tax losses in their portfolios toward the end of the prior tax year. Over recent years it appears that the January effect has actually become more of a December effect that reflects investors’ earlier harvesting of tax losses.
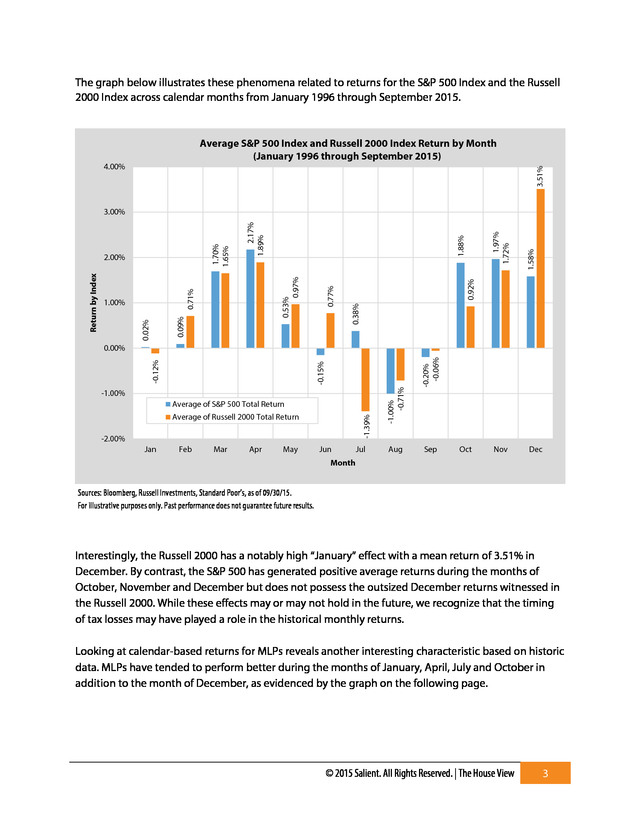
We believe that part of the selling pressure during the month of September may have been related to tax loss sales during a period when many sectors, particularly energy broadly and master limited partnerships (MLPs) specifically, are down year-to-date. In addition to the January effect we note that the average returns for stocks since January 1996 in the months of March, April, October, November and December are significantly better than the other months of the year. Furthermore, the data suggests that the months of August and October frequently witness larger drawdowns which may be explained by thinner market participation during the summer months and tax loss selling in the fall, respectively. © 2015 Salient. All Rights Reserved.
| The House View 2 . The graph below illustrates these phenomena related to returns for the S&P 500 Index and the Russell 2000 Index across calendar months from January 1996 through September 2015. Average S&P 500 Index and Russell 2000 Index Return by Month (January 1996 through September 2015) 3.51% 4.00% 1.58% 1.97% 1.72% 1.88% 0.92% 0.38% 0.77% 0.53% 0.97% 0.71% 0.09% 1.00% 0.02% Return by Index 2.00% 2.17% 1.89% 1.70% 1.65% 3.00% -1.00% Average of S&P 500 Total Return -1.39% Average of Russell 2000 Total Return -2.00% Jan Feb Mar Apr May Jun Jul Aug -0.20% -0.06% -1.00% -0.71% -0.15% -0.12% 0.00% Sep Oct Nov Dec Month Sources: Bloomberg, Russell Investments, Standard Poor’s, as of 09/30/15. For illustrative purposes only. Past performance does not guarantee future results. Interestingly, the Russell 2000 has a notably high “January” effect with a mean return of 3.51% in December. By contrast, the S&P 500 has generated positive average returns during the months of October, November and December but does not possess the outsized December returns witnessed in the Russell 2000. While these effects may or may not hold in the future, we recognize that the timing of tax losses may have played a role in the historical monthly returns. Looking at calendar-based returns for MLPs reveals another interesting characteristic based on historic data.
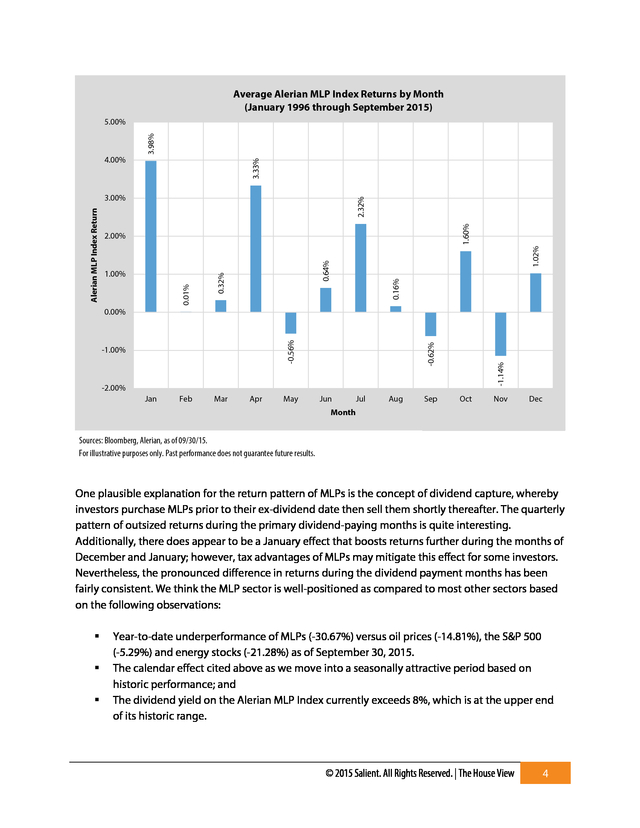
MLPs have tended to perform better during the months of January, April, July and October in addition to the month of December, as evidenced by the graph on the following page. © 2015 Salient. All Rights Reserved. | The House View 3 .
Average Alerian MLP Index Returns by Month (January 1996 through September 2015) 3.33% 4.00% 3.98% 5.00% 1.60% 2.32% 0.16% 0.64% 0.32% 1.00% 1.02% 2.00% 0.01% Alerian MLP Index Return 3.00% -1.14% -1.00% -0.62% -0.56% 0.00% -2.00% Jan Feb Mar Apr May Jun Jul Aug Sep Oct Nov Dec Month Sources: Bloomberg, Alerian, as of 09/30/15. For illustrative purposes only. Past performance does not guarantee future results. One plausible explanation for the return pattern of MLPs is the concept of dividend capture, whereby investors purchase MLPs prior to their ex-dividend date then sell them shortly thereafter. The quarterly pattern of outsized returns during the primary dividend-paying months is quite interesting. Additionally, there does appear to be a January effect that boosts returns further during the months of December and January; however, tax advantages of MLPs may mitigate this effect for some investors. Nevertheless, the pronounced difference in returns during the dividend payment months has been fairly consistent. We think the MLP sector is well-positioned as compared to most other sectors based on the following observations:    Year-to-date underperformance of MLPs (-30.67%) versus oil prices (-14.81%), the S&P 500 (-5.29%) and energy stocks (-21.28%) as of September 30, 2015. The calendar effect cited above as we move into a seasonally attractive period based on historic performance; and The dividend yield on the Alerian MLP Index currently exceeds 8%, which is at the upper end of its historic range. © 2015 Salient.
All Rights Reserved. | The House View 4 . Market Outlook We think the key determinants of market performance through the end of the year will rest on the Federal Reserve rhetoric and/or next policy move, budgetary discussions surrounding next year’s presidential election, market volatility and energy prices. Before entering into a discussion of each of these points, I would like to highlight some key takeaways from Ben Hunt’s most recent newsletter in which he highlights the temptation to take action despite the absence of a clear path forward that warrants such actions, which is where we believe we are today. In most instances it’s more difficult to simply stand in place than it is to do something. We believe many investors would be better off focusing on their long-run asset allocation structure and its potential ability to withstand a wide range of economic scenarios.
I highly recommend Ben’s piece, “Rounders” to anyone interested in overcoming self-defeating investor behavior. All that said, the negative connotation of doing something just to do something does not include more perfunctory actions that may be considered a part of the portfolio construction process such as rebalancing or adaptive investing. As mentioned above, the key issues we see affecting markets between now and year end are: 1. The Federal Reserve On September 28, 2015, William Dudley, chairman of the Federal Reserve Bank of New York, suggested that the Federal Reserve will likely raise short-term interest rates before the end of the year.
Federal Reserve Chair, Janet Yellen, did not address the topic in her prepared remarks at a banking conference in St. Louis on September 30. Our take is that the Federal Reserve recognizes the fragility of the global economy.
Fed officials are aware of the disinflationary pressures seen across commodity markets, heightened market volatility, limited wage pressure, slowing global growth and fiscal imbalances. With that knowledge we believe the Federal Reserve may increase interest rates before the end of the year but would likely tether any action to an accommodative statement that suggests it may not take any subsequent action until clearer evidence prevails. Furthermore, we still have not ruled out the possibility that the Fed passes on raising interest rates this year and, as we’ve stated in previous pieces, that will make it very difficult for it to increase interest rate in 2016 due to the U.S.
presidential election. 2. Budgetary Discussions As John Boehner, speaker of the House of Representatives, transitions out of office in the coming months, the debate over various social programs will likely increase. More conservative members of Congress will be emboldened to pass bills to the Senate with the working knowledge that those bills will either die on the Senate floor or be vetoed by the president.
Furthermore, the election cycle itself will place a spotlight on a wide range of expenditures ranging from military spending to social welfare programs. The fundamental challenge in our view is that the world has been growing from the expansion of credit since the financial crisis, which has permeated the government, financial, corporate and household sectors. We think that even modest moves toward lower spending or higher taxes—while © 2015 Salient.
All Rights Reserved. | The House View 5 . clearly necessary in the long run to achieve a stable economy—will likely reduce growth rates and weigh on domestic equity markets. 3. Market Volatility As referenced above, the pronounced rise in market volatility likely reflects a fundamental shift in investors’ minds from greed to fear. The recognition of these headwinds has led to a volatile summer. Our expectation is that volatility levels will likely remain elevated through most of 2016 while returns are dampened.
We think policymakers will be confronted with an ever more challenging balancing act of moving toward long-term fiscal stability, while providing confidence to market participants that growth rates are stable and profitability remains strong. We believe that market volatility will be higher and returns lower over the next five to six years than they have been since the financial crisis. 4. Energy Prices Energy prices are a function of both supply and demand factors.
On the demand side, the slowing of the Chinese economy has become the dominant factor. China served as the marginal buyer of oil during its period of rapid growth over the last decade. As output growth in China began slowing toward the end of 2013, commodity prices have generally fallen in sympathy, which has a spillover effect on commodity-producing regions like Latin America, which is also plagued by leftist political regimes, internal inflation and decreasing foreign exchange reserves.
We think it is going to be difficult for commodity prices to find a bottom until China’s growth rate stabilizes. Despite those concerns, we believe that China’s monetary policy initiatives and economic reforms represent steps in the right direction with respect to stabilizing growth. The supply side challenges are largely characterized by Saudi Arabia’s shift away from its historic role of price stabilizer toward a new era of being a steady state producer that is less willing to adjust output levels to stabilize prices. We believe that in many ways this will create a more fundamentally stable energy market as consumers and producers set prices based on a more fundamental equilibrium.
We also recognize that most oil producing countries would like to see oil prices move back to the $60-70 per barrel range. Summary As we look toward the fourth quarter of 2015, we believe that market volatility will remain heightened. We would not be surprised to see some of the more depressed sectors, including energy, stage a rebound over the course of the quarter. As we look toward 2016 we think the market returns will revert back to more modest return levels as rhetoric surrounding congressional budget debates, the presidential elections and shifting Federal Reserve policy may create additional headwinds. © 2015 Salient. All Rights Reserved.
| The House View 6 . DISCLOSURES Investing involves risk, including possible loss of principal. The value of any financial instruments or markets mentioned herein can fall as well as rise. Past performance does not guarantee future results. This material is distributed for informational purposes only and should not be considered as investment advice, a recommendation of any particular security, strategy or investment product, or as an offer or solicitation with respect to the purchase or sale of any investment. Statistics, prices, estimates, forward-looking statements, and other information contained herein have been obtained from sources believed to be reliable, but no guarantee is given as to their accuracy or completeness. All expressions of opinion are subject to change without notice. Neither diversification nor asset allocation assures profit or protects against risk. One cannot invest directly in an index. “Alerian MLP Index”, “Alerian MLP Total Return Index”, “AMZ” and “AMZX” are trademarks of Alerian and their use is granted under a license from Alerian. Lee Partridge has earned the right to use the Chartered Financial Analyst designation.
CFA Institute marks are trademarks owned by the CFA Institute. DEFINITIONS Alerian MLP Index (AMZ) is a composite of the 50 most prominent energy MLPs that provides investors with a comprehensive benchmark for this emerging asset class. Barclays Intermediate Government/Credit Bond Index tracks the performance of intermediate term U.S. government and corporate bonds. Bloomberg Commodity Index is a broadly diversified index composed of exchange-traded futures contracts on physical commodities. Chicago Mercantile Exchange is the world's second-largest exchange for futures and options on futures and the largest exchange in the U.S. The Chicago Board Options Exchange Volatility Index reflects a market estimate of future volatility, based on the weighted average of the implied volatilities for a wide range of strikes. 1st & 2nd month expirations are used until 8 days from expiration, then the 2nd and 3rd are used. The Global Industry Classification Standard (GICS) is a standardized classification system for equities developed jointly by Morgan Stanley Capital International (MSCI) and Standard & Poor's.
The GICS methodology is used by the MSCI indexes, which include domestic and international stocks, as well as by a large portion of the professional investment management community. S&P GSCI is a widely recognized, investable broad-based and production-weighted index that represents the global commodity market and measures commodity performance over time. MSCI Emerging Markets (EM) Index is an index created by Morgan Stanley Capital International (MSCI) that is designed to measure equity market performance in global emerging markets. The Russell 2000 Index measures the performance of the small-cap segment of the U.S. equity universe. It includes approximately 2000 of the smallest securities based on a combination of their market cap and current index membership.
The Russell 2000 is constructed to © 2015 Salient. All Rights Reserved. | The House View 7 .
provide a comprehensive and unbiased small-cap barometer and is completely reconstituted annually to ensure larger stocks do not distort the performance and characteristics of the true small-cap opportunity set. S&P 500 Index is an unmanaged, capitalization weighted index comprising publicly traded common stocks issued by companies in various industries. The S&P 500 Index is widely recognized as the leading broad-based measurement of changes in conditions of the U.S. equities market. Tokyo Stock Price Index is an index that measures stock prices on the Tokyo Stock Exchange (TSE). © 2015 Salient. All Rights Reserved. | The House View 8 .
Sovereign debt market yields reference local currency returns for 10-year benchmark bond/note. Currency prices are relative to the U.S. dollar. For illustrative purposes only.
Past performance does not guarantee future performance. We note that the volatility witnessed in August carried over to the month of September. As stated in last month’s blog post, we attribute much of the market’s volatility to the perfect storm consisting of the Federal Reserve’s movement toward tighter monetary policy; slowing growth in China; and a fiscal backdrop characterized by slowing growth, structural deficits and burgeoning global debt. The graph on the following page of the Chicago Board Option Exchange (CBOE) SPX Volatility Index exemplifies this period of market turmoil. © 2015 Salient.
All Rights Reserved. | The House View 1 . Index Level CBOE SPX Volatility Index 45 40 35 30 25 20 15 10 Sep 2014 Oct 2014 Nov 2014 Dec 2014 Jan 2015 Feb 2015 Mar 2015 Apr 2015 May 2015 Jun 2015 Jul 2015 Aug 2015 Sep 2015 Oct 2015 Date Sources: Bloomberg, Chicago Board Option Exchange, Standard Poor’s, as of 09/30/15. For illustrative purposes only. Past performance does not guarantee future results. The January Effect In addition to the headwinds cited above, one of the well-known anomalies in academic literature is the presence of what is known as the January effect. The effect refers to the propensity of stocks to generate positive returns in the month of January after investors harvest tax losses in their portfolios toward the end of the prior tax year. Over recent years it appears that the January effect has actually become more of a December effect that reflects investors’ earlier harvesting of tax losses.
We believe that part of the selling pressure during the month of September may have been related to tax loss sales during a period when many sectors, particularly energy broadly and master limited partnerships (MLPs) specifically, are down year-to-date. In addition to the January effect we note that the average returns for stocks since January 1996 in the months of March, April, October, November and December are significantly better than the other months of the year. Furthermore, the data suggests that the months of August and October frequently witness larger drawdowns which may be explained by thinner market participation during the summer months and tax loss selling in the fall, respectively. © 2015 Salient. All Rights Reserved.
| The House View 2 . The graph below illustrates these phenomena related to returns for the S&P 500 Index and the Russell 2000 Index across calendar months from January 1996 through September 2015. Average S&P 500 Index and Russell 2000 Index Return by Month (January 1996 through September 2015) 3.51% 4.00% 1.58% 1.97% 1.72% 1.88% 0.92% 0.38% 0.77% 0.53% 0.97% 0.71% 0.09% 1.00% 0.02% Return by Index 2.00% 2.17% 1.89% 1.70% 1.65% 3.00% -1.00% Average of S&P 500 Total Return -1.39% Average of Russell 2000 Total Return -2.00% Jan Feb Mar Apr May Jun Jul Aug -0.20% -0.06% -1.00% -0.71% -0.15% -0.12% 0.00% Sep Oct Nov Dec Month Sources: Bloomberg, Russell Investments, Standard Poor’s, as of 09/30/15. For illustrative purposes only. Past performance does not guarantee future results. Interestingly, the Russell 2000 has a notably high “January” effect with a mean return of 3.51% in December. By contrast, the S&P 500 has generated positive average returns during the months of October, November and December but does not possess the outsized December returns witnessed in the Russell 2000. While these effects may or may not hold in the future, we recognize that the timing of tax losses may have played a role in the historical monthly returns. Looking at calendar-based returns for MLPs reveals another interesting characteristic based on historic data.
MLPs have tended to perform better during the months of January, April, July and October in addition to the month of December, as evidenced by the graph on the following page. © 2015 Salient. All Rights Reserved. | The House View 3 .
Average Alerian MLP Index Returns by Month (January 1996 through September 2015) 3.33% 4.00% 3.98% 5.00% 1.60% 2.32% 0.16% 0.64% 0.32% 1.00% 1.02% 2.00% 0.01% Alerian MLP Index Return 3.00% -1.14% -1.00% -0.62% -0.56% 0.00% -2.00% Jan Feb Mar Apr May Jun Jul Aug Sep Oct Nov Dec Month Sources: Bloomberg, Alerian, as of 09/30/15. For illustrative purposes only. Past performance does not guarantee future results. One plausible explanation for the return pattern of MLPs is the concept of dividend capture, whereby investors purchase MLPs prior to their ex-dividend date then sell them shortly thereafter. The quarterly pattern of outsized returns during the primary dividend-paying months is quite interesting. Additionally, there does appear to be a January effect that boosts returns further during the months of December and January; however, tax advantages of MLPs may mitigate this effect for some investors. Nevertheless, the pronounced difference in returns during the dividend payment months has been fairly consistent. We think the MLP sector is well-positioned as compared to most other sectors based on the following observations:    Year-to-date underperformance of MLPs (-30.67%) versus oil prices (-14.81%), the S&P 500 (-5.29%) and energy stocks (-21.28%) as of September 30, 2015. The calendar effect cited above as we move into a seasonally attractive period based on historic performance; and The dividend yield on the Alerian MLP Index currently exceeds 8%, which is at the upper end of its historic range. © 2015 Salient.
All Rights Reserved. | The House View 4 . Market Outlook We think the key determinants of market performance through the end of the year will rest on the Federal Reserve rhetoric and/or next policy move, budgetary discussions surrounding next year’s presidential election, market volatility and energy prices. Before entering into a discussion of each of these points, I would like to highlight some key takeaways from Ben Hunt’s most recent newsletter in which he highlights the temptation to take action despite the absence of a clear path forward that warrants such actions, which is where we believe we are today. In most instances it’s more difficult to simply stand in place than it is to do something. We believe many investors would be better off focusing on their long-run asset allocation structure and its potential ability to withstand a wide range of economic scenarios.
I highly recommend Ben’s piece, “Rounders” to anyone interested in overcoming self-defeating investor behavior. All that said, the negative connotation of doing something just to do something does not include more perfunctory actions that may be considered a part of the portfolio construction process such as rebalancing or adaptive investing. As mentioned above, the key issues we see affecting markets between now and year end are: 1. The Federal Reserve On September 28, 2015, William Dudley, chairman of the Federal Reserve Bank of New York, suggested that the Federal Reserve will likely raise short-term interest rates before the end of the year.
Federal Reserve Chair, Janet Yellen, did not address the topic in her prepared remarks at a banking conference in St. Louis on September 30. Our take is that the Federal Reserve recognizes the fragility of the global economy.
Fed officials are aware of the disinflationary pressures seen across commodity markets, heightened market volatility, limited wage pressure, slowing global growth and fiscal imbalances. With that knowledge we believe the Federal Reserve may increase interest rates before the end of the year but would likely tether any action to an accommodative statement that suggests it may not take any subsequent action until clearer evidence prevails. Furthermore, we still have not ruled out the possibility that the Fed passes on raising interest rates this year and, as we’ve stated in previous pieces, that will make it very difficult for it to increase interest rate in 2016 due to the U.S.
presidential election. 2. Budgetary Discussions As John Boehner, speaker of the House of Representatives, transitions out of office in the coming months, the debate over various social programs will likely increase. More conservative members of Congress will be emboldened to pass bills to the Senate with the working knowledge that those bills will either die on the Senate floor or be vetoed by the president.
Furthermore, the election cycle itself will place a spotlight on a wide range of expenditures ranging from military spending to social welfare programs. The fundamental challenge in our view is that the world has been growing from the expansion of credit since the financial crisis, which has permeated the government, financial, corporate and household sectors. We think that even modest moves toward lower spending or higher taxes—while © 2015 Salient.
All Rights Reserved. | The House View 5 . clearly necessary in the long run to achieve a stable economy—will likely reduce growth rates and weigh on domestic equity markets. 3. Market Volatility As referenced above, the pronounced rise in market volatility likely reflects a fundamental shift in investors’ minds from greed to fear. The recognition of these headwinds has led to a volatile summer. Our expectation is that volatility levels will likely remain elevated through most of 2016 while returns are dampened.
We think policymakers will be confronted with an ever more challenging balancing act of moving toward long-term fiscal stability, while providing confidence to market participants that growth rates are stable and profitability remains strong. We believe that market volatility will be higher and returns lower over the next five to six years than they have been since the financial crisis. 4. Energy Prices Energy prices are a function of both supply and demand factors.
On the demand side, the slowing of the Chinese economy has become the dominant factor. China served as the marginal buyer of oil during its period of rapid growth over the last decade. As output growth in China began slowing toward the end of 2013, commodity prices have generally fallen in sympathy, which has a spillover effect on commodity-producing regions like Latin America, which is also plagued by leftist political regimes, internal inflation and decreasing foreign exchange reserves.
We think it is going to be difficult for commodity prices to find a bottom until China’s growth rate stabilizes. Despite those concerns, we believe that China’s monetary policy initiatives and economic reforms represent steps in the right direction with respect to stabilizing growth. The supply side challenges are largely characterized by Saudi Arabia’s shift away from its historic role of price stabilizer toward a new era of being a steady state producer that is less willing to adjust output levels to stabilize prices. We believe that in many ways this will create a more fundamentally stable energy market as consumers and producers set prices based on a more fundamental equilibrium.
We also recognize that most oil producing countries would like to see oil prices move back to the $60-70 per barrel range. Summary As we look toward the fourth quarter of 2015, we believe that market volatility will remain heightened. We would not be surprised to see some of the more depressed sectors, including energy, stage a rebound over the course of the quarter. As we look toward 2016 we think the market returns will revert back to more modest return levels as rhetoric surrounding congressional budget debates, the presidential elections and shifting Federal Reserve policy may create additional headwinds. © 2015 Salient. All Rights Reserved.
| The House View 6 . DISCLOSURES Investing involves risk, including possible loss of principal. The value of any financial instruments or markets mentioned herein can fall as well as rise. Past performance does not guarantee future results. This material is distributed for informational purposes only and should not be considered as investment advice, a recommendation of any particular security, strategy or investment product, or as an offer or solicitation with respect to the purchase or sale of any investment. Statistics, prices, estimates, forward-looking statements, and other information contained herein have been obtained from sources believed to be reliable, but no guarantee is given as to their accuracy or completeness. All expressions of opinion are subject to change without notice. Neither diversification nor asset allocation assures profit or protects against risk. One cannot invest directly in an index. “Alerian MLP Index”, “Alerian MLP Total Return Index”, “AMZ” and “AMZX” are trademarks of Alerian and their use is granted under a license from Alerian. Lee Partridge has earned the right to use the Chartered Financial Analyst designation.
CFA Institute marks are trademarks owned by the CFA Institute. DEFINITIONS Alerian MLP Index (AMZ) is a composite of the 50 most prominent energy MLPs that provides investors with a comprehensive benchmark for this emerging asset class. Barclays Intermediate Government/Credit Bond Index tracks the performance of intermediate term U.S. government and corporate bonds. Bloomberg Commodity Index is a broadly diversified index composed of exchange-traded futures contracts on physical commodities. Chicago Mercantile Exchange is the world's second-largest exchange for futures and options on futures and the largest exchange in the U.S. The Chicago Board Options Exchange Volatility Index reflects a market estimate of future volatility, based on the weighted average of the implied volatilities for a wide range of strikes. 1st & 2nd month expirations are used until 8 days from expiration, then the 2nd and 3rd are used. The Global Industry Classification Standard (GICS) is a standardized classification system for equities developed jointly by Morgan Stanley Capital International (MSCI) and Standard & Poor's.
The GICS methodology is used by the MSCI indexes, which include domestic and international stocks, as well as by a large portion of the professional investment management community. S&P GSCI is a widely recognized, investable broad-based and production-weighted index that represents the global commodity market and measures commodity performance over time. MSCI Emerging Markets (EM) Index is an index created by Morgan Stanley Capital International (MSCI) that is designed to measure equity market performance in global emerging markets. The Russell 2000 Index measures the performance of the small-cap segment of the U.S. equity universe. It includes approximately 2000 of the smallest securities based on a combination of their market cap and current index membership.
The Russell 2000 is constructed to © 2015 Salient. All Rights Reserved. | The House View 7 .
provide a comprehensive and unbiased small-cap barometer and is completely reconstituted annually to ensure larger stocks do not distort the performance and characteristics of the true small-cap opportunity set. S&P 500 Index is an unmanaged, capitalization weighted index comprising publicly traded common stocks issued by companies in various industries. The S&P 500 Index is widely recognized as the leading broad-based measurement of changes in conditions of the U.S. equities market. Tokyo Stock Price Index is an index that measures stock prices on the Tokyo Stock Exchange (TSE). © 2015 Salient. All Rights Reserved. | The House View 8 .


