


Description
2016 Market Outlook
by Lee Partridge, CFA
Chief Investment Officer
January 5, 2016
Key Highlights
 As we approach the eighth year of this current market expansion, we would like to
provide you with our thoughts on market positioning, which include an underweight to
risk assets, including stocks and credit-sensitive bonds, in favor of safe haven assets
like developed sovereign debt as well as more market neutral strategies.
 Geographic:

Overweight United States, Germany, South Korea and China.

Underweight India, Russia and Brazil (as well as most South American
countries).
 Sector:

Overweight information technology and healthcare sectors.

Underweight energy and utility sectors.

Favor midstream master limited partnerships (MLPs) versus upstream energy
and utility companies.
 Style:

Remain neutral on growth versus value stocks. We continue to monitor value
stocks for an attractive entry point that will be characterized by positive return
momentum relative to their growth counterparts.

Remain neutral on small cap stocks.
 Remain neutral with respect to duration on U.S. Treasurys. We think that a rising dollar
and more hawkish Federal Reserve will keep a ceiling on longer-term interest rates while
preserving the safe-haven elements of these instruments.
 Underweight high yield bonds.
At an 8.7% yield, we do not believe many investors are adequately compensated for the risk of rising defaults and associated losses. 1 We believe investors will be well served to hold out for 10% or greater yields.  Overweight emerging market corporate debt. We believe that many of these issues are attractively priced versus both emerging sovereign issuers and U.S.
high yield issuers. 1 Source: Barclays U.S. Corporate High-Yield Bond Index, December 2015. © 2016 Salient. All rights reserved.
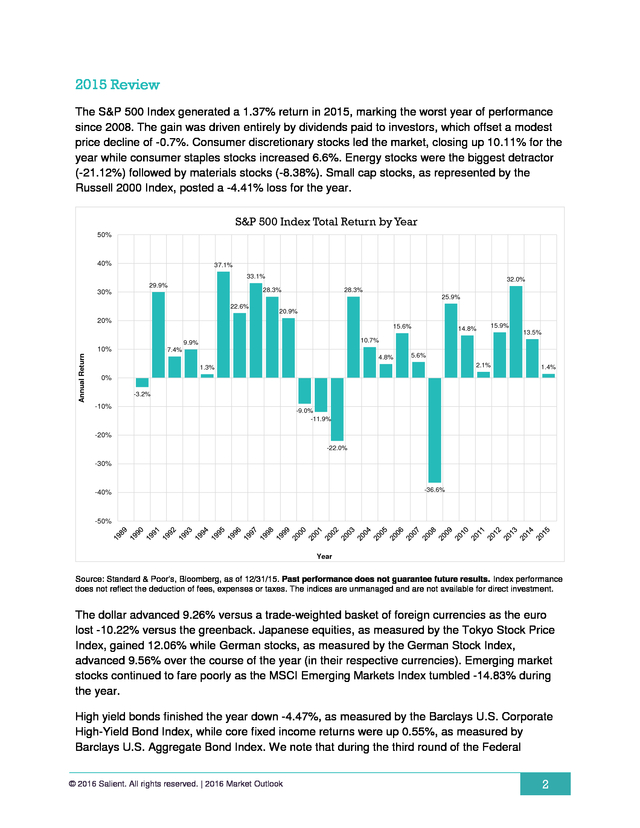
| 2016 Market Outlook 1 . 2015 Review The S&P 500 Index generated a 1.37% return in 2015, marking the worst year of performance since 2008. The gain was driven entirely by dividends paid to investors, which offset a modest price decline of -0.7%. Consumer discretionary stocks led the market, closing up 10.11% for the year while consumer staples stocks increased 6.6%. Energy stocks were the biggest detractor (-21.12%) followed by materials stocks (-8.38%).
Small cap stocks, as represented by the Russell 2000 Index, posted a -4.41% loss for the year. S&P 500 Index Total Return by Year 50% 40% 37.1% 33.1% 29.9% 32.0% 28.3% 28.3% 30% 25.9% 22.6% 20.9% 20% 15.6% 9.9% Annual Return 10% 14.8% 15.9% 13.5% 10.7% 7.4% 4.8% 5.6% 2.1% 1.3% 1.4% 0% -3.2% -10% -9.0% -11.9% -20% -22.0% -30% -36.6% -40% -50% Year Source: Standard & Poor’s, Bloomberg, as of 12/31/15. Past performance does not guarantee future results. Index performance does not reflect the deduction of fees, expenses or taxes.
The indices are unmanaged and are not available for direct investment. The dollar advanced 9.26% versus a trade-weighted basket of foreign currencies as the euro lost -10.22% versus the greenback. Japanese equities, as measured by the Tokyo Stock Price Index, gained 12.06% while German stocks, as measured by the German Stock Index, advanced 9.56% over the course of the year (in their respective currencies). Emerging market stocks continued to fare poorly as the MSCI Emerging Markets Index tumbled -14.83% during the year. High yield bonds finished the year down -4.47%, as measured by the Barclays U.S.
Corporate High-Yield Bond Index, while core fixed income returns were up 0.55%, as measured by Barclays U.S. Aggregate Bond Index. We note that during the third round of the Federal © 2016 Salient.
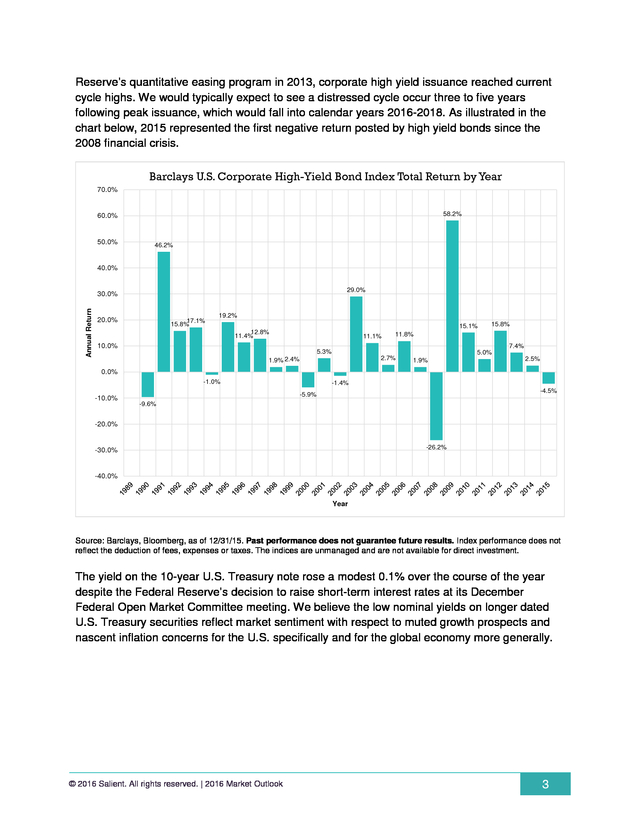
All rights reserved. | 2016 Market Outlook 2 . Reserve’s quantitative easing program in 2013, corporate high yield issuance reached current cycle highs. We would typically expect to see a distressed cycle occur three to five years following peak issuance, which would fall into calendar years 2016-2018. As illustrated in the chart below, 2015 represented the first negative return posted by high yield bonds since the 2008 financial crisis. Barclays U.S. Corporate High-Yield Bond Index Total Return by Year 70.0% 58.2% 60.0% 50.0% 46.2% 40.0% 29.0% Annual Return 30.0% 20.0% 17.1% 15.8% 19.2% 15.1% 12.8% 11.4% 11.1% 10.0% 15.8% 11.8% 7.4% 5.3% 2.7% 1.9% 2.4% 5.0% 1.9% 2.5% 0.0% -1.0% -10.0% -1.4% -4.5% -5.9% -9.6% -20.0% -26.2% -30.0% -40.0% Year Source: Barclays, Bloomberg, as of 12/31/15.
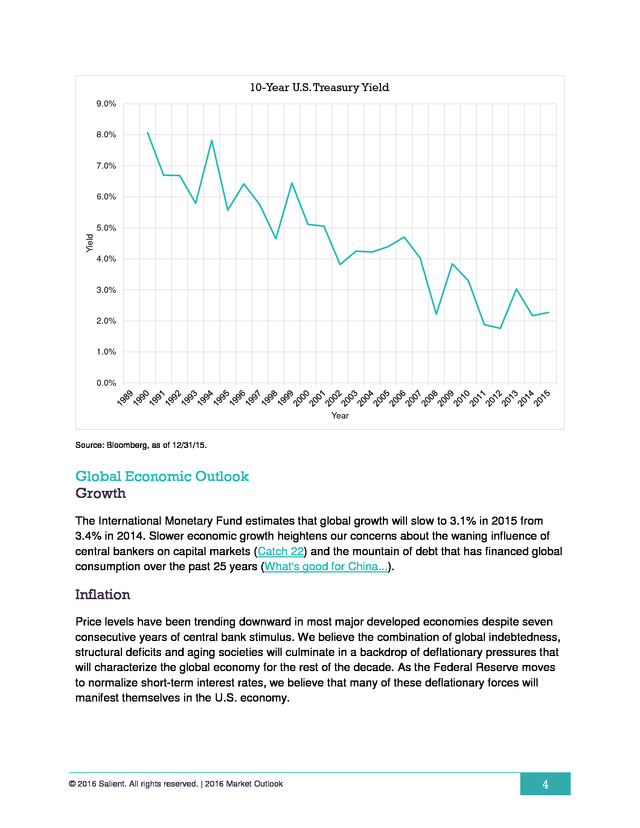
Past performance does not guarantee future results. Index performance does not reflect the deduction of fees, expenses or taxes. The indices are unmanaged and are not available for direct investment. The yield on the 10-year U.S.
Treasury note rose a modest 0.1% over the course of the year despite the Federal Reserve’s decision to raise short-term interest rates at its December Federal Open Market Committee meeting. We believe the low nominal yields on longer dated U.S. Treasury securities reflect market sentiment with respect to muted growth prospects and nascent inflation concerns for the U.S.
specifically and for the global economy more generally. © 2016 Salient. All rights reserved. | 2016 Market Outlook 3 .
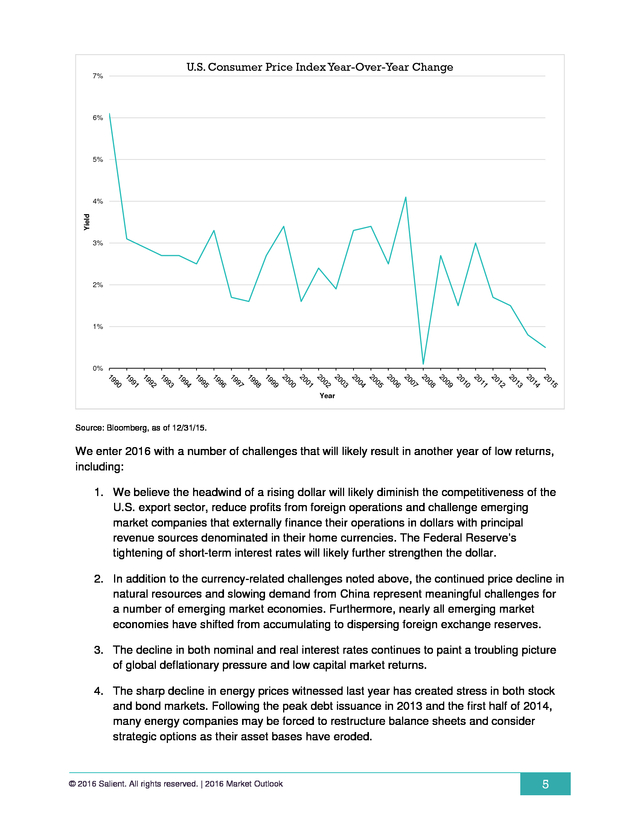
10-Year U.S. Treasury Yield 9.0% 8.0% 7.0% 6.0% Yield 5.0% 4.0% 3.0% 2.0% 1.0% 0.0% Year Source: Bloomberg, as of 12/31/15. Global Economic Outlook Growth The International Monetary Fund estimates that global growth will slow to 3.1% in 2015 from 3.4% in 2014. Slower economic growth heightens our concerns about the waning influence of central bankers on capital markets (Catch 22) and the mountain of debt that has financed global consumption over the past 25 years (What's good for China...). Inflation Price levels have been trending downward in most major developed economies despite seven consecutive years of central bank stimulus. We believe the combination of global indebtedness, structural deficits and aging societies will culminate in a backdrop of deflationary pressures that will characterize the global economy for the rest of the decade.
As the Federal Reserve moves to normalize short-term interest rates, we believe that many of these deflationary forces will manifest themselves in the U.S. economy. © 2016 Salient. All rights reserved.
| 2016 Market Outlook 4 . 7% U.S. Consumer Price Index Year-Over-Year Change 6% 5% Yield 4% 3% 2% 1% 0% Year Source: Bloomberg, as of 12/31/15. We enter 2016 with a number of challenges that will likely result in another year of low returns, including: 1. We believe the headwind of a rising dollar will likely diminish the competitiveness of the U.S. export sector, reduce profits from foreign operations and challenge emerging market companies that externally finance their operations in dollars with principal revenue sources denominated in their home currencies.
The Federal Reserve’s tightening of short-term interest rates will likely further strengthen the dollar. 2. In addition to the currency-related challenges noted above, the continued price decline in natural resources and slowing demand from China represent meaningful challenges for a number of emerging market economies. Furthermore, nearly all emerging market economies have shifted from accumulating to dispersing foreign exchange reserves. 3.
The decline in both nominal and real interest rates continues to paint a troubling picture of global deflationary pressure and low capital market returns. 4. The sharp decline in energy prices witnessed last year has created stress in both stock and bond markets. Following the peak debt issuance in 2013 and the first half of 2014, many energy companies may be forced to restructure balance sheets and consider strategic options as their asset bases have eroded. © 2016 Salient.
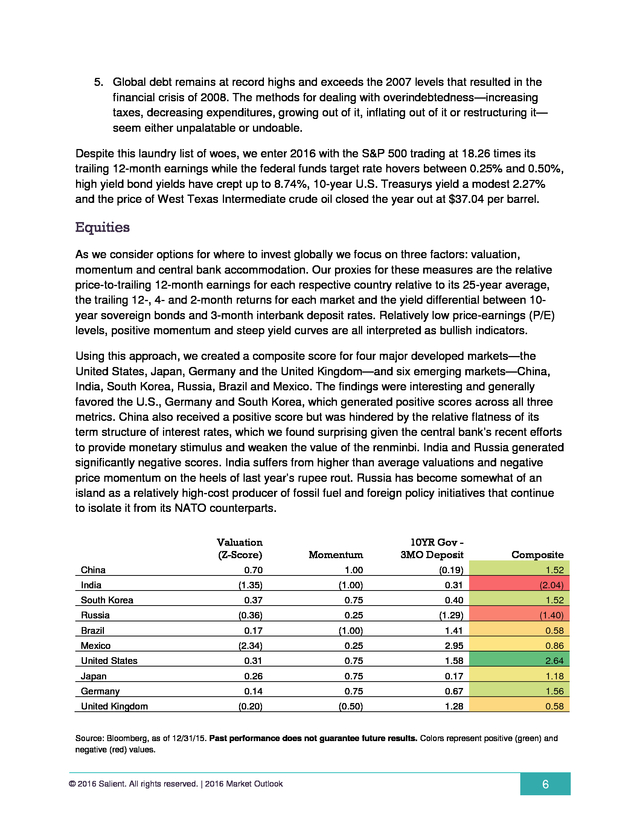
All rights reserved. | 2016 Market Outlook 5 . 5. Global debt remains at record highs and exceeds the 2007 levels that resulted in the financial crisis of 2008. The methods for dealing with overindebtedness—increasing taxes, decreasing expenditures, growing out of it, inflating out of it or restructuring it— seem either unpalatable or undoable. Despite this laundry list of woes, we enter 2016 with the S&P 500 trading at 18.26 times its trailing 12-month earnings while the federal funds target rate hovers between 0.25% and 0.50%, high yield bond yields have crept up to 8.74%, 10-year U.S. Treasurys yield a modest 2.27% and the price of West Texas Intermediate crude oil closed the year out at $37.04 per barrel. Equities As we consider options for where to invest globally we focus on three factors: valuation, momentum and central bank accommodation.
Our proxies for these measures are the relative price-to-trailing 12-month earnings for each respective country relative to its 25-year average, the trailing 12-, 4- and 2-month returns for each market and the yield differential between 10year sovereign bonds and 3-month interbank deposit rates. Relatively low price-earnings (P/E) levels, positive momentum and steep yield curves are all interpreted as bullish indicators. Using this approach, we created a composite score for four major developed markets—the United States, Japan, Germany and the United Kingdom—and six emerging markets—China, India, South Korea, Russia, Brazil and Mexico. The findings were interesting and generally favored the U.S., Germany and South Korea, which generated positive scores across all three metrics.
China also received a positive score but was hindered by the relative flatness of its term structure of interest rates, which we found surprising given the central bank’s recent efforts to provide monetary stimulus and weaken the value of the renminbi. India and Russia generated significantly negative scores. India suffers from higher than average valuations and negative price momentum on the heels of last year’s rupee rout.
Russia has become somewhat of an island as a relatively high-cost producer of fossil fuel and foreign policy initiatives that continue to isolate it from its NATO counterparts. Valuation (Z-Score) China India South Korea Russia Brazil Mexico Momentum 10YR Gov 3MO Deposit Composite 0.70 1.00 (0.19) 1.52 (1.35) (1.00) 0.31 (2.04) 0.37 0.75 0.40 1.52 (0.36) 0.25 (1.29) (1.40) 0.17 (1.00) 1.41 0.58 (2.34) 0.25 2.95 0.86 United States 0.31 0.75 1.58 2.64 Japan 0.26 0.75 0.17 1.18 0.14 0.75 0.67 1.56 (0.20) (0.50) 1.28 0.58 Germany United Kingdom Source: Bloomberg, as of 12/31/15. Past performance does not guarantee future results. Colors represent positive (green) and negative (red) values. © 2016 Salient.
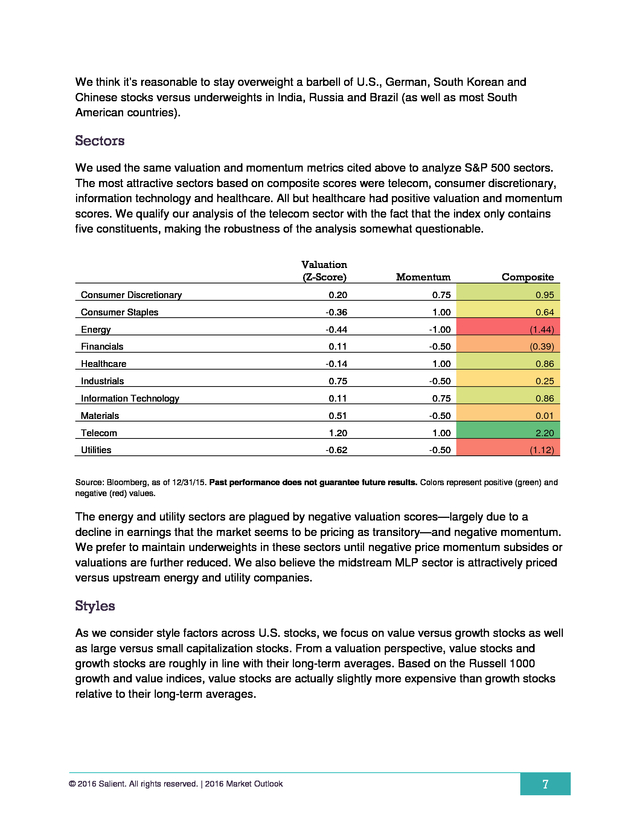
All rights reserved. | 2016 Market Outlook 6 . We think it’s reasonable to stay overweight a barbell of U.S., German, South Korean and Chinese stocks versus underweights in India, Russia and Brazil (as well as most South American countries). Sectors We used the same valuation and momentum metrics cited above to analyze S&P 500 sectors. The most attractive sectors based on composite scores were telecom, consumer discretionary, information technology and healthcare. All but healthcare had positive valuation and momentum scores. We qualify our analysis of the telecom sector with the fact that the index only contains five constituents, making the robustness of the analysis somewhat questionable. Valuation (Z-Score) Momentum Composite 0.20 0.75 0.95 Consumer Staples -0.36 1.00 0.64 Energy -0.44 -1.00 (1.44) Financials 0.11 -0.50 (0.39) Healthcare -0.14 1.00 0.86 Industrials 0.75 -0.50 0.25 Information Technology 0.11 0.75 0.86 Materials 0.51 -0.50 0.01 Telecom 1.20 1.00 2.20 -0.62 -0.50 (1.12) Consumer Discretionary Utilities Source: Bloomberg, as of 12/31/15. Past performance does not guarantee future results.
Colors represent positive (green) and negative (red) values. The energy and utility sectors are plagued by negative valuation scores—largely due to a decline in earnings that the market seems to be pricing as transitory—and negative momentum. We prefer to maintain underweights in these sectors until negative price momentum subsides or valuations are further reduced. We also believe the midstream MLP sector is attractively priced versus upstream energy and utility companies. Styles As we consider style factors across U.S. stocks, we focus on value versus growth stocks as well as large versus small capitalization stocks.
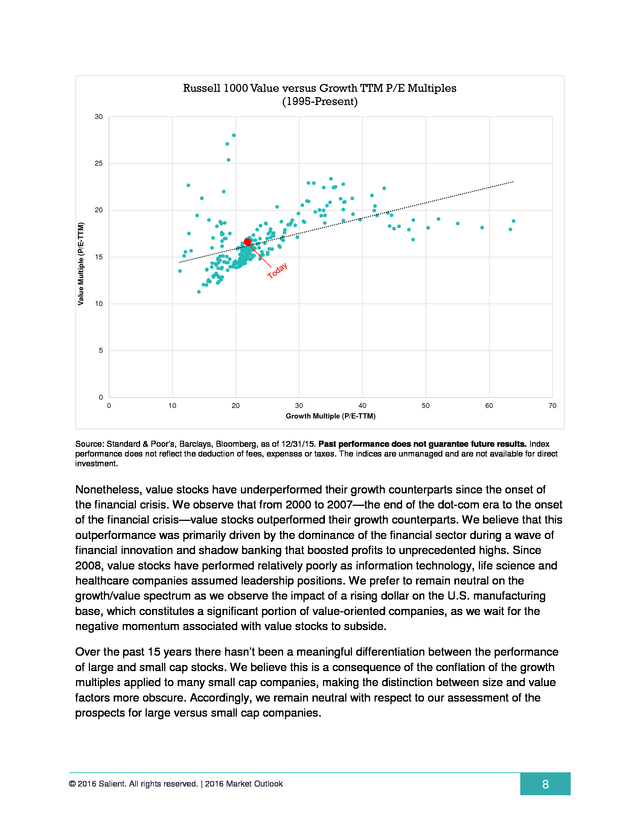
From a valuation perspective, value stocks and growth stocks are roughly in line with their long-term averages. Based on the Russell 1000 growth and value indices, value stocks are actually slightly more expensive than growth stocks relative to their long-term averages. © 2016 Salient. All rights reserved.
| 2016 Market Outlook 7 . Russell 1000 Value versus Growth TTM P/E Multiples (1995-Present) 30 25 Value Multiple (P/E-TTM) 20 15 10 5 0 0 10 20 30 40 Growth Multiple (P/E-TTM) 50 60 70 Source: Standard & Poor’s, Barclays, Bloomberg, as of 12/31/15. Past performance does not guarantee future results. Index performance does not reflect the deduction of fees, expenses or taxes. The indices are unmanaged and are not available for direct investment. Nonetheless, value stocks have underperformed their growth counterparts since the onset of the financial crisis.
We observe that from 2000 to 2007—the end of the dot-com era to the onset of the financial crisis—value stocks outperformed their growth counterparts. We believe that this outperformance was primarily driven by the dominance of the financial sector during a wave of financial innovation and shadow banking that boosted profits to unprecedented highs. Since 2008, value stocks have performed relatively poorly as information technology, life science and healthcare companies assumed leadership positions.
We prefer to remain neutral on the growth/value spectrum as we observe the impact of a rising dollar on the U.S. manufacturing base, which constitutes a significant portion of value-oriented companies, as we wait for the negative momentum associated with value stocks to subside. Over the past 15 years there hasn’t been a meaningful differentiation between the performance of large and small cap stocks. We believe this is a consequence of the conflation of the growth multiples applied to many small cap companies, making the distinction between size and value factors more obscure.
Accordingly, we remain neutral with respect to our assessment of the prospects for large versus small cap companies. © 2016 Salient. All rights reserved. | 2016 Market Outlook 8 .
Cumulative Returns for U.S. Large and Small Capitalization Stocks (1995-Present) 600% 500% Cumulative Return 400% 300% 200% 100% Small Cap Large Cap 2015 2014 2013 2012 2011 2010 2009 2008 2007 2006 2005 2004 2003 2002 2001 2000 1999 1998 1997 1996 1995 0% Year Source: Standard & Poor’s, Barclays, Bloomberg, as of 12/31/15. Past performance does not guarantee future results. Index performance does not reflect the deduction of fees, expenses or taxes.
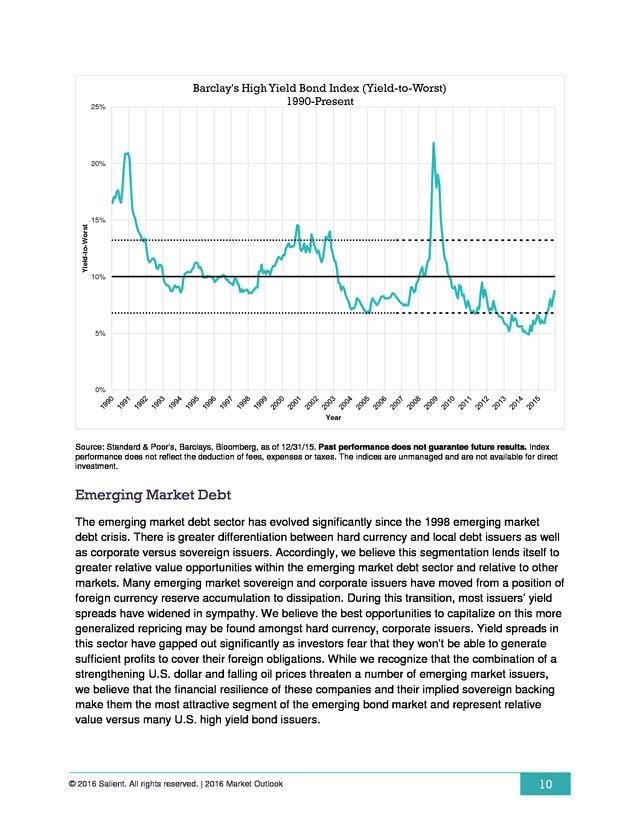
The indices are unmanaged and are not available for direct investment. High Yield As we turn our analysis to high yield markets we recognize that the spreads to treasuries may look attractive to yield-starved investors; however, we believe that the nominal yields do not compensate investors for the likely rise in default rates and loss severities that will be incurred over the next cycle. High yield spreads and accompanying yields have widened in sympathy with the poor stock performance of the energy sector, in particular. We believe that a return to more normative default rates and accompanying loss levels across sectors would demand higher yield levels and wider spreads.
We advise investors to wait for a more attractive entry point at which the yield-to-worst on the Barclays U.S. Corporate High-Yield Bond Index is above 10%. © 2016 Salient. All rights reserved.
| 2016 Market Outlook 9 . 25% Barclay's High Yield Bond Index (Yield-to-Worst) 1990-Present 20% Yield-to-Worst 15% 10% 5% 0% Year Source: Standard & Poor’s, Barclays, Bloomberg, as of 12/31/15. Past performance does not guarantee future results. Index performance does not reflect the deduction of fees, expenses or taxes. The indices are unmanaged and are not available for direct investment. Emerging Market Debt The emerging market debt sector has evolved significantly since the 1998 emerging market debt crisis.
There is greater differentiation between hard currency and local debt issuers as well as corporate versus sovereign issuers. Accordingly, we believe this segmentation lends itself to greater relative value opportunities within the emerging market debt sector and relative to other markets. Many emerging market sovereign and corporate issuers have moved from a position of foreign currency reserve accumulation to dissipation.
During this transition, most issuers’ yield spreads have widened in sympathy. We believe the best opportunities to capitalize on this more generalized repricing may be found amongst hard currency, corporate issuers. Yield spreads in this sector have gapped out significantly as investors fear that they won’t be able to generate sufficient profits to cover their foreign obligations.
While we recognize that the combination of a strengthening U.S. dollar and falling oil prices threaten a number of emerging market issuers, we believe that the financial resilience of these companies and their implied sovereign backing make them the most attractive segment of the emerging bond market and represent relative value versus many U.S. high yield bond issuers. © 2016 Salient.
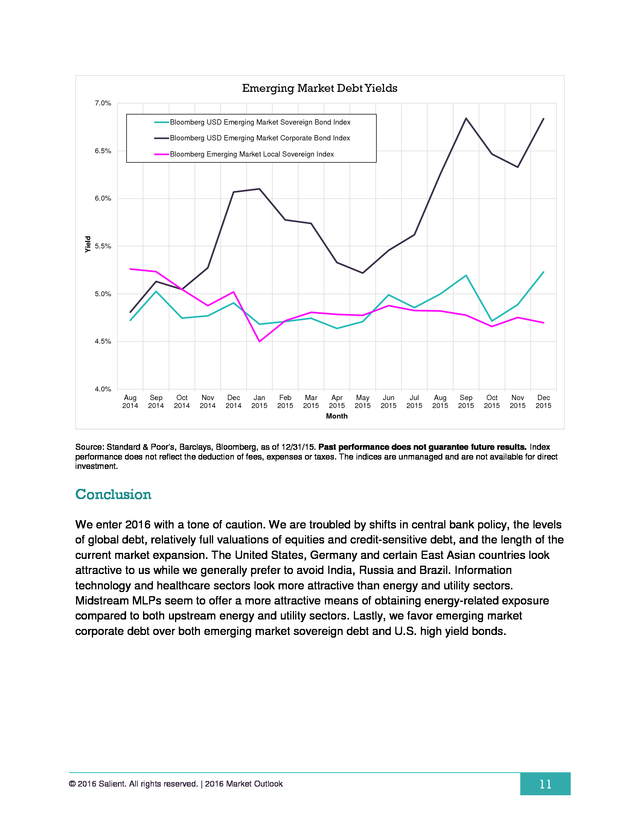
All rights reserved. | 2016 Market Outlook 10 . Emerging Market Debt Yields 7.0% Bloomberg USD Emerging Market Sovereign Bond Index Bloomberg USD Emerging Market Corporate Bond Index 6.5% Bloomberg Emerging Market Local Sovereign Index Yield 6.0% 5.5% 5.0% 4.5% 4.0% Aug 2014 Sep 2014 Oct 2014 Nov 2014 Dec 2014 Jan 2015 Feb 2015 Mar 2015 Apr May 2015 2015 Month Jun 2015 Jul 2015 Aug 2015 Sep 2015 Oct 2015 Nov 2015 Dec 2015 Source: Standard & Poor’s, Barclays, Bloomberg, as of 12/31/15. Past performance does not guarantee future results. Index performance does not reflect the deduction of fees, expenses or taxes. The indices are unmanaged and are not available for direct investment. Conclusion We enter 2016 with a tone of caution.
We are troubled by shifts in central bank policy, the levels of global debt, relatively full valuations of equities and credit-sensitive debt, and the length of the current market expansion. The United States, Germany and certain East Asian countries look attractive to us while we generally prefer to avoid India, Russia and Brazil. Information technology and healthcare sectors look more attractive than energy and utility sectors. Midstream MLPs seem to offer a more attractive means of obtaining energy-related exposure compared to both upstream energy and utility sectors.
Lastly, we favor emerging market corporate debt over both emerging market sovereign debt and U.S. high yield bonds. © 2016 Salient. All rights reserved.
| 2016 Market Outlook 11 . DISCLOSURES Investing involves risk, including possible loss of principal. The value of any financial instruments or markets mentioned herein can fall as well as rise. Past performance does not guarantee future results. This material is distributed for informational purposes only and should not be considered as investment advice, a recommendation of any particular security, strategy or investment product, or as an offer or solicitation with respect to the purchase or sale of any investment. Statistics, prices, estimates, forward-looking statements, and other information contained herein have been obtained from sources believed to be reliable, but no guarantee is given as to their accuracy or completeness.
All expressions of opinion are subject to change without notice. Neither diversification nor asset allocation assures profit or protects against risk. Lee Partridge has earned the right to use the Chartered Financial Analyst designation. CFA Institute marks are trademarks owned by the CFA Institute. DEFINITIONS Alerian MLP Index (AMZ) is a composite of the 50 most prominent energy MLPs that provides investors with a comprehensive benchmark for this emerging asset class. Barclays Global High Yield Index is a multi-currency flagship measure of the global high yield debt market. Barclays High Yield Municipal Bond Index tracks the performance of noninvestment-grade U.S. municipal bonds with a remaining maturity of one year or more. Barclays Intermediate Government/Credit Bond Index tracks the performance of intermediate term U.S. government and corporate bonds. Barclays U.S.
Aggregate Bond Index represents securities that are U.S. domestic, taxable and dollar denominated. The index covers the U.S. investment-grade, fixed-rate bond market, with index components for government and corporate securities, mortgage pass-through securities and asset-backed securities. Barclays U.S.
Corporate High-Yield Bond Index covers the USD-denominated, noninvestment-grade, fixed-rate, taxable corporate bond market. Securities are classified as high yield if the middle rating of Moody’s, Fitch and S&P is Ba1/BB+/BB+ or below. Bloomberg Commodity Index is a broadly diversified index composed of exchange-traded futures contracts on physical commodities. Bloomberg USD Emerging Market Sovereign Bond Index is a rules-based, market-value weighted index engineered to measure USD fixed-rate securities of sovereign issuers in emerging markets as identified by Bloomberg. Bloomberg USD Emerging Market Corporate Bond Index is a rules-based, market-value weighted index engineered to measure corporate bond performance of USD fixed-rate corporate bonds of issuers in emerging markets as defined by Bloomberg. Bloomberg Emerging Market Local Sovereign Index is a rules-based market-value weighted index engineered to measure the fixed-rate local currency sovereign bonds issued in emerging markets as identified by Bloomberg. Commodity trading advisor (CTA) is U.S. financial regulatory term for an individual or organization who is retained by a fund or individual client to provide advice and services related to trading in futures contracts, commodity options and/or certain swaps.
They are responsible for the trading within managed futures accounts. The definition of CTA may also apply to investment advisors for hedge funds and private funds including mutual funds and exchangetraded funds in certain cases.[3] CTAs are generally regulated by the United States federal government through registration with the Commodity Futures Trading Commission (CFTC) and membership of the National Futures Association (NFA). German Stock Index (DAX) is a blue chip stock market index consisting of the 30 major German companies trading on the Frankfurt Stock Exchange. © 2016 Salient. All rights reserved.
| 2016 Market Outlook 12 . Global Industry Classification Standard (GICS) is a standardized classification system for equities developed jointly by Morgan Stanley Capital International (MSCI) and Standard & Poor's. The GICS methodology is used by the MSCI indexes, which include domestic and international stocks, as well as by a large portion of the professional investment management community. MSCI Emerging Markets (EM) Index is an index created by Morgan Stanley Capital International (MSCI) that is designed to measure equity market performance in global emerging markets. Russell 2000 Index measures the performance of the small-cap segment of the U.S. equity universe. It includes approximately 2000 of the smallest securities based on a combination of their market cap and current index membership.
The Russell 2000 is constructed to provide a comprehensive and unbiased small-cap barometer and is completely reconstituted annually to ensure larger stocks do not distort the performance and characteristics of the true small-cap opportunity set. S&P 500 Index is an unmanaged, capitalization weighted index comprising publicly traded common stocks issued by companies in various industries. The S&P 500 Index is widely recognized as the leading broad-based measurement of changes in conditions of the U.S. equities market. S&P GSCI Commodity Index is a composite index of commodity sector returns representing an unleveraged, longonly investment in commodity futures that is broadly diversified across the spectrum of commodities and serves as a measure of commodity performance over time. Tokyo Stock Price Index is an index that measures stock prices on the Tokyo Stock Exchange (TSE). One cannot invest directly in an index. salientpartners.com © 2016 Salient.
All rights reserved. | 2016 Market Outlook 13 .
At an 8.7% yield, we do not believe many investors are adequately compensated for the risk of rising defaults and associated losses. 1 We believe investors will be well served to hold out for 10% or greater yields.  Overweight emerging market corporate debt. We believe that many of these issues are attractively priced versus both emerging sovereign issuers and U.S.
high yield issuers. 1 Source: Barclays U.S. Corporate High-Yield Bond Index, December 2015. © 2016 Salient. All rights reserved.
| 2016 Market Outlook 1 . 2015 Review The S&P 500 Index generated a 1.37% return in 2015, marking the worst year of performance since 2008. The gain was driven entirely by dividends paid to investors, which offset a modest price decline of -0.7%. Consumer discretionary stocks led the market, closing up 10.11% for the year while consumer staples stocks increased 6.6%. Energy stocks were the biggest detractor (-21.12%) followed by materials stocks (-8.38%).
Small cap stocks, as represented by the Russell 2000 Index, posted a -4.41% loss for the year. S&P 500 Index Total Return by Year 50% 40% 37.1% 33.1% 29.9% 32.0% 28.3% 28.3% 30% 25.9% 22.6% 20.9% 20% 15.6% 9.9% Annual Return 10% 14.8% 15.9% 13.5% 10.7% 7.4% 4.8% 5.6% 2.1% 1.3% 1.4% 0% -3.2% -10% -9.0% -11.9% -20% -22.0% -30% -36.6% -40% -50% Year Source: Standard & Poor’s, Bloomberg, as of 12/31/15. Past performance does not guarantee future results. Index performance does not reflect the deduction of fees, expenses or taxes.
The indices are unmanaged and are not available for direct investment. The dollar advanced 9.26% versus a trade-weighted basket of foreign currencies as the euro lost -10.22% versus the greenback. Japanese equities, as measured by the Tokyo Stock Price Index, gained 12.06% while German stocks, as measured by the German Stock Index, advanced 9.56% over the course of the year (in their respective currencies). Emerging market stocks continued to fare poorly as the MSCI Emerging Markets Index tumbled -14.83% during the year. High yield bonds finished the year down -4.47%, as measured by the Barclays U.S.
Corporate High-Yield Bond Index, while core fixed income returns were up 0.55%, as measured by Barclays U.S. Aggregate Bond Index. We note that during the third round of the Federal © 2016 Salient.
All rights reserved. | 2016 Market Outlook 2 . Reserve’s quantitative easing program in 2013, corporate high yield issuance reached current cycle highs. We would typically expect to see a distressed cycle occur three to five years following peak issuance, which would fall into calendar years 2016-2018. As illustrated in the chart below, 2015 represented the first negative return posted by high yield bonds since the 2008 financial crisis. Barclays U.S. Corporate High-Yield Bond Index Total Return by Year 70.0% 58.2% 60.0% 50.0% 46.2% 40.0% 29.0% Annual Return 30.0% 20.0% 17.1% 15.8% 19.2% 15.1% 12.8% 11.4% 11.1% 10.0% 15.8% 11.8% 7.4% 5.3% 2.7% 1.9% 2.4% 5.0% 1.9% 2.5% 0.0% -1.0% -10.0% -1.4% -4.5% -5.9% -9.6% -20.0% -26.2% -30.0% -40.0% Year Source: Barclays, Bloomberg, as of 12/31/15.
Past performance does not guarantee future results. Index performance does not reflect the deduction of fees, expenses or taxes. The indices are unmanaged and are not available for direct investment. The yield on the 10-year U.S.
Treasury note rose a modest 0.1% over the course of the year despite the Federal Reserve’s decision to raise short-term interest rates at its December Federal Open Market Committee meeting. We believe the low nominal yields on longer dated U.S. Treasury securities reflect market sentiment with respect to muted growth prospects and nascent inflation concerns for the U.S.
specifically and for the global economy more generally. © 2016 Salient. All rights reserved. | 2016 Market Outlook 3 .
10-Year U.S. Treasury Yield 9.0% 8.0% 7.0% 6.0% Yield 5.0% 4.0% 3.0% 2.0% 1.0% 0.0% Year Source: Bloomberg, as of 12/31/15. Global Economic Outlook Growth The International Monetary Fund estimates that global growth will slow to 3.1% in 2015 from 3.4% in 2014. Slower economic growth heightens our concerns about the waning influence of central bankers on capital markets (Catch 22) and the mountain of debt that has financed global consumption over the past 25 years (What's good for China...). Inflation Price levels have been trending downward in most major developed economies despite seven consecutive years of central bank stimulus. We believe the combination of global indebtedness, structural deficits and aging societies will culminate in a backdrop of deflationary pressures that will characterize the global economy for the rest of the decade.
As the Federal Reserve moves to normalize short-term interest rates, we believe that many of these deflationary forces will manifest themselves in the U.S. economy. © 2016 Salient. All rights reserved.
| 2016 Market Outlook 4 . 7% U.S. Consumer Price Index Year-Over-Year Change 6% 5% Yield 4% 3% 2% 1% 0% Year Source: Bloomberg, as of 12/31/15. We enter 2016 with a number of challenges that will likely result in another year of low returns, including: 1. We believe the headwind of a rising dollar will likely diminish the competitiveness of the U.S. export sector, reduce profits from foreign operations and challenge emerging market companies that externally finance their operations in dollars with principal revenue sources denominated in their home currencies.
The Federal Reserve’s tightening of short-term interest rates will likely further strengthen the dollar. 2. In addition to the currency-related challenges noted above, the continued price decline in natural resources and slowing demand from China represent meaningful challenges for a number of emerging market economies. Furthermore, nearly all emerging market economies have shifted from accumulating to dispersing foreign exchange reserves. 3.
The decline in both nominal and real interest rates continues to paint a troubling picture of global deflationary pressure and low capital market returns. 4. The sharp decline in energy prices witnessed last year has created stress in both stock and bond markets. Following the peak debt issuance in 2013 and the first half of 2014, many energy companies may be forced to restructure balance sheets and consider strategic options as their asset bases have eroded. © 2016 Salient.
All rights reserved. | 2016 Market Outlook 5 . 5. Global debt remains at record highs and exceeds the 2007 levels that resulted in the financial crisis of 2008. The methods for dealing with overindebtedness—increasing taxes, decreasing expenditures, growing out of it, inflating out of it or restructuring it— seem either unpalatable or undoable. Despite this laundry list of woes, we enter 2016 with the S&P 500 trading at 18.26 times its trailing 12-month earnings while the federal funds target rate hovers between 0.25% and 0.50%, high yield bond yields have crept up to 8.74%, 10-year U.S. Treasurys yield a modest 2.27% and the price of West Texas Intermediate crude oil closed the year out at $37.04 per barrel. Equities As we consider options for where to invest globally we focus on three factors: valuation, momentum and central bank accommodation.
Our proxies for these measures are the relative price-to-trailing 12-month earnings for each respective country relative to its 25-year average, the trailing 12-, 4- and 2-month returns for each market and the yield differential between 10year sovereign bonds and 3-month interbank deposit rates. Relatively low price-earnings (P/E) levels, positive momentum and steep yield curves are all interpreted as bullish indicators. Using this approach, we created a composite score for four major developed markets—the United States, Japan, Germany and the United Kingdom—and six emerging markets—China, India, South Korea, Russia, Brazil and Mexico. The findings were interesting and generally favored the U.S., Germany and South Korea, which generated positive scores across all three metrics.
China also received a positive score but was hindered by the relative flatness of its term structure of interest rates, which we found surprising given the central bank’s recent efforts to provide monetary stimulus and weaken the value of the renminbi. India and Russia generated significantly negative scores. India suffers from higher than average valuations and negative price momentum on the heels of last year’s rupee rout.
Russia has become somewhat of an island as a relatively high-cost producer of fossil fuel and foreign policy initiatives that continue to isolate it from its NATO counterparts. Valuation (Z-Score) China India South Korea Russia Brazil Mexico Momentum 10YR Gov 3MO Deposit Composite 0.70 1.00 (0.19) 1.52 (1.35) (1.00) 0.31 (2.04) 0.37 0.75 0.40 1.52 (0.36) 0.25 (1.29) (1.40) 0.17 (1.00) 1.41 0.58 (2.34) 0.25 2.95 0.86 United States 0.31 0.75 1.58 2.64 Japan 0.26 0.75 0.17 1.18 0.14 0.75 0.67 1.56 (0.20) (0.50) 1.28 0.58 Germany United Kingdom Source: Bloomberg, as of 12/31/15. Past performance does not guarantee future results. Colors represent positive (green) and negative (red) values. © 2016 Salient.
All rights reserved. | 2016 Market Outlook 6 . We think it’s reasonable to stay overweight a barbell of U.S., German, South Korean and Chinese stocks versus underweights in India, Russia and Brazil (as well as most South American countries). Sectors We used the same valuation and momentum metrics cited above to analyze S&P 500 sectors. The most attractive sectors based on composite scores were telecom, consumer discretionary, information technology and healthcare. All but healthcare had positive valuation and momentum scores. We qualify our analysis of the telecom sector with the fact that the index only contains five constituents, making the robustness of the analysis somewhat questionable. Valuation (Z-Score) Momentum Composite 0.20 0.75 0.95 Consumer Staples -0.36 1.00 0.64 Energy -0.44 -1.00 (1.44) Financials 0.11 -0.50 (0.39) Healthcare -0.14 1.00 0.86 Industrials 0.75 -0.50 0.25 Information Technology 0.11 0.75 0.86 Materials 0.51 -0.50 0.01 Telecom 1.20 1.00 2.20 -0.62 -0.50 (1.12) Consumer Discretionary Utilities Source: Bloomberg, as of 12/31/15. Past performance does not guarantee future results.
Colors represent positive (green) and negative (red) values. The energy and utility sectors are plagued by negative valuation scores—largely due to a decline in earnings that the market seems to be pricing as transitory—and negative momentum. We prefer to maintain underweights in these sectors until negative price momentum subsides or valuations are further reduced. We also believe the midstream MLP sector is attractively priced versus upstream energy and utility companies. Styles As we consider style factors across U.S. stocks, we focus on value versus growth stocks as well as large versus small capitalization stocks.
From a valuation perspective, value stocks and growth stocks are roughly in line with their long-term averages. Based on the Russell 1000 growth and value indices, value stocks are actually slightly more expensive than growth stocks relative to their long-term averages. © 2016 Salient. All rights reserved.
| 2016 Market Outlook 7 . Russell 1000 Value versus Growth TTM P/E Multiples (1995-Present) 30 25 Value Multiple (P/E-TTM) 20 15 10 5 0 0 10 20 30 40 Growth Multiple (P/E-TTM) 50 60 70 Source: Standard & Poor’s, Barclays, Bloomberg, as of 12/31/15. Past performance does not guarantee future results. Index performance does not reflect the deduction of fees, expenses or taxes. The indices are unmanaged and are not available for direct investment. Nonetheless, value stocks have underperformed their growth counterparts since the onset of the financial crisis.
We observe that from 2000 to 2007—the end of the dot-com era to the onset of the financial crisis—value stocks outperformed their growth counterparts. We believe that this outperformance was primarily driven by the dominance of the financial sector during a wave of financial innovation and shadow banking that boosted profits to unprecedented highs. Since 2008, value stocks have performed relatively poorly as information technology, life science and healthcare companies assumed leadership positions.
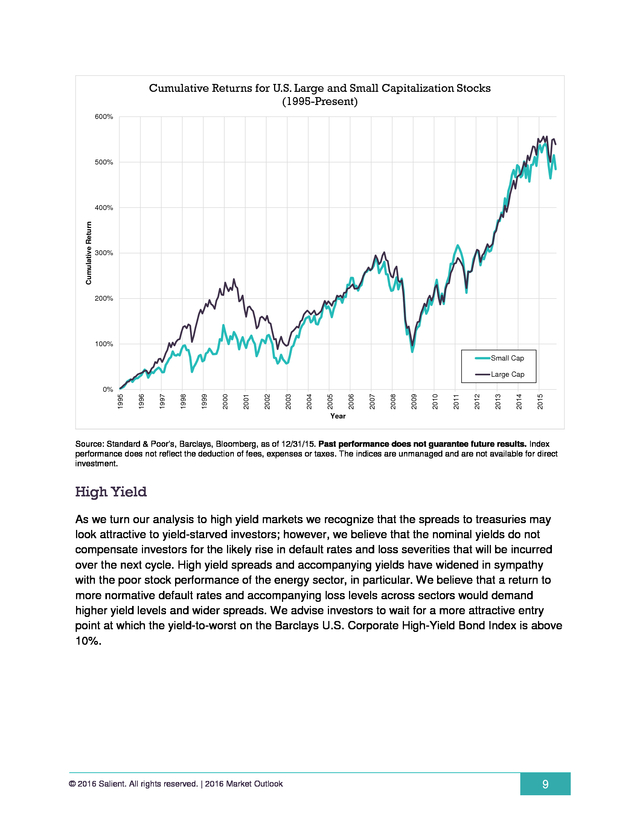
We prefer to remain neutral on the growth/value spectrum as we observe the impact of a rising dollar on the U.S. manufacturing base, which constitutes a significant portion of value-oriented companies, as we wait for the negative momentum associated with value stocks to subside. Over the past 15 years there hasn’t been a meaningful differentiation between the performance of large and small cap stocks. We believe this is a consequence of the conflation of the growth multiples applied to many small cap companies, making the distinction between size and value factors more obscure.
Accordingly, we remain neutral with respect to our assessment of the prospects for large versus small cap companies. © 2016 Salient. All rights reserved. | 2016 Market Outlook 8 .
Cumulative Returns for U.S. Large and Small Capitalization Stocks (1995-Present) 600% 500% Cumulative Return 400% 300% 200% 100% Small Cap Large Cap 2015 2014 2013 2012 2011 2010 2009 2008 2007 2006 2005 2004 2003 2002 2001 2000 1999 1998 1997 1996 1995 0% Year Source: Standard & Poor’s, Barclays, Bloomberg, as of 12/31/15. Past performance does not guarantee future results. Index performance does not reflect the deduction of fees, expenses or taxes.
The indices are unmanaged and are not available for direct investment. High Yield As we turn our analysis to high yield markets we recognize that the spreads to treasuries may look attractive to yield-starved investors; however, we believe that the nominal yields do not compensate investors for the likely rise in default rates and loss severities that will be incurred over the next cycle. High yield spreads and accompanying yields have widened in sympathy with the poor stock performance of the energy sector, in particular. We believe that a return to more normative default rates and accompanying loss levels across sectors would demand higher yield levels and wider spreads.
We advise investors to wait for a more attractive entry point at which the yield-to-worst on the Barclays U.S. Corporate High-Yield Bond Index is above 10%. © 2016 Salient. All rights reserved.
| 2016 Market Outlook 9 . 25% Barclay's High Yield Bond Index (Yield-to-Worst) 1990-Present 20% Yield-to-Worst 15% 10% 5% 0% Year Source: Standard & Poor’s, Barclays, Bloomberg, as of 12/31/15. Past performance does not guarantee future results. Index performance does not reflect the deduction of fees, expenses or taxes. The indices are unmanaged and are not available for direct investment. Emerging Market Debt The emerging market debt sector has evolved significantly since the 1998 emerging market debt crisis.
There is greater differentiation between hard currency and local debt issuers as well as corporate versus sovereign issuers. Accordingly, we believe this segmentation lends itself to greater relative value opportunities within the emerging market debt sector and relative to other markets. Many emerging market sovereign and corporate issuers have moved from a position of foreign currency reserve accumulation to dissipation.
During this transition, most issuers’ yield spreads have widened in sympathy. We believe the best opportunities to capitalize on this more generalized repricing may be found amongst hard currency, corporate issuers. Yield spreads in this sector have gapped out significantly as investors fear that they won’t be able to generate sufficient profits to cover their foreign obligations.
While we recognize that the combination of a strengthening U.S. dollar and falling oil prices threaten a number of emerging market issuers, we believe that the financial resilience of these companies and their implied sovereign backing make them the most attractive segment of the emerging bond market and represent relative value versus many U.S. high yield bond issuers. © 2016 Salient.
All rights reserved. | 2016 Market Outlook 10 . Emerging Market Debt Yields 7.0% Bloomberg USD Emerging Market Sovereign Bond Index Bloomberg USD Emerging Market Corporate Bond Index 6.5% Bloomberg Emerging Market Local Sovereign Index Yield 6.0% 5.5% 5.0% 4.5% 4.0% Aug 2014 Sep 2014 Oct 2014 Nov 2014 Dec 2014 Jan 2015 Feb 2015 Mar 2015 Apr May 2015 2015 Month Jun 2015 Jul 2015 Aug 2015 Sep 2015 Oct 2015 Nov 2015 Dec 2015 Source: Standard & Poor’s, Barclays, Bloomberg, as of 12/31/15. Past performance does not guarantee future results. Index performance does not reflect the deduction of fees, expenses or taxes. The indices are unmanaged and are not available for direct investment. Conclusion We enter 2016 with a tone of caution.
We are troubled by shifts in central bank policy, the levels of global debt, relatively full valuations of equities and credit-sensitive debt, and the length of the current market expansion. The United States, Germany and certain East Asian countries look attractive to us while we generally prefer to avoid India, Russia and Brazil. Information technology and healthcare sectors look more attractive than energy and utility sectors. Midstream MLPs seem to offer a more attractive means of obtaining energy-related exposure compared to both upstream energy and utility sectors.
Lastly, we favor emerging market corporate debt over both emerging market sovereign debt and U.S. high yield bonds. © 2016 Salient. All rights reserved.
| 2016 Market Outlook 11 . DISCLOSURES Investing involves risk, including possible loss of principal. The value of any financial instruments or markets mentioned herein can fall as well as rise. Past performance does not guarantee future results. This material is distributed for informational purposes only and should not be considered as investment advice, a recommendation of any particular security, strategy or investment product, or as an offer or solicitation with respect to the purchase or sale of any investment. Statistics, prices, estimates, forward-looking statements, and other information contained herein have been obtained from sources believed to be reliable, but no guarantee is given as to their accuracy or completeness.
All expressions of opinion are subject to change without notice. Neither diversification nor asset allocation assures profit or protects against risk. Lee Partridge has earned the right to use the Chartered Financial Analyst designation. CFA Institute marks are trademarks owned by the CFA Institute. DEFINITIONS Alerian MLP Index (AMZ) is a composite of the 50 most prominent energy MLPs that provides investors with a comprehensive benchmark for this emerging asset class. Barclays Global High Yield Index is a multi-currency flagship measure of the global high yield debt market. Barclays High Yield Municipal Bond Index tracks the performance of noninvestment-grade U.S. municipal bonds with a remaining maturity of one year or more. Barclays Intermediate Government/Credit Bond Index tracks the performance of intermediate term U.S. government and corporate bonds. Barclays U.S.
Aggregate Bond Index represents securities that are U.S. domestic, taxable and dollar denominated. The index covers the U.S. investment-grade, fixed-rate bond market, with index components for government and corporate securities, mortgage pass-through securities and asset-backed securities. Barclays U.S.
Corporate High-Yield Bond Index covers the USD-denominated, noninvestment-grade, fixed-rate, taxable corporate bond market. Securities are classified as high yield if the middle rating of Moody’s, Fitch and S&P is Ba1/BB+/BB+ or below. Bloomberg Commodity Index is a broadly diversified index composed of exchange-traded futures contracts on physical commodities. Bloomberg USD Emerging Market Sovereign Bond Index is a rules-based, market-value weighted index engineered to measure USD fixed-rate securities of sovereign issuers in emerging markets as identified by Bloomberg. Bloomberg USD Emerging Market Corporate Bond Index is a rules-based, market-value weighted index engineered to measure corporate bond performance of USD fixed-rate corporate bonds of issuers in emerging markets as defined by Bloomberg. Bloomberg Emerging Market Local Sovereign Index is a rules-based market-value weighted index engineered to measure the fixed-rate local currency sovereign bonds issued in emerging markets as identified by Bloomberg. Commodity trading advisor (CTA) is U.S. financial regulatory term for an individual or organization who is retained by a fund or individual client to provide advice and services related to trading in futures contracts, commodity options and/or certain swaps.
They are responsible for the trading within managed futures accounts. The definition of CTA may also apply to investment advisors for hedge funds and private funds including mutual funds and exchangetraded funds in certain cases.[3] CTAs are generally regulated by the United States federal government through registration with the Commodity Futures Trading Commission (CFTC) and membership of the National Futures Association (NFA). German Stock Index (DAX) is a blue chip stock market index consisting of the 30 major German companies trading on the Frankfurt Stock Exchange. © 2016 Salient. All rights reserved.
| 2016 Market Outlook 12 . Global Industry Classification Standard (GICS) is a standardized classification system for equities developed jointly by Morgan Stanley Capital International (MSCI) and Standard & Poor's. The GICS methodology is used by the MSCI indexes, which include domestic and international stocks, as well as by a large portion of the professional investment management community. MSCI Emerging Markets (EM) Index is an index created by Morgan Stanley Capital International (MSCI) that is designed to measure equity market performance in global emerging markets. Russell 2000 Index measures the performance of the small-cap segment of the U.S. equity universe. It includes approximately 2000 of the smallest securities based on a combination of their market cap and current index membership.
The Russell 2000 is constructed to provide a comprehensive and unbiased small-cap barometer and is completely reconstituted annually to ensure larger stocks do not distort the performance and characteristics of the true small-cap opportunity set. S&P 500 Index is an unmanaged, capitalization weighted index comprising publicly traded common stocks issued by companies in various industries. The S&P 500 Index is widely recognized as the leading broad-based measurement of changes in conditions of the U.S. equities market. S&P GSCI Commodity Index is a composite index of commodity sector returns representing an unleveraged, longonly investment in commodity futures that is broadly diversified across the spectrum of commodities and serves as a measure of commodity performance over time. Tokyo Stock Price Index is an index that measures stock prices on the Tokyo Stock Exchange (TSE). One cannot invest directly in an index. salientpartners.com © 2016 Salient.
All rights reserved. | 2016 Market Outlook 13 .


