


Description
1
THEME INDICES
STOXX® GLOBAL 3D PRINTING PURE PLAY
INDEX
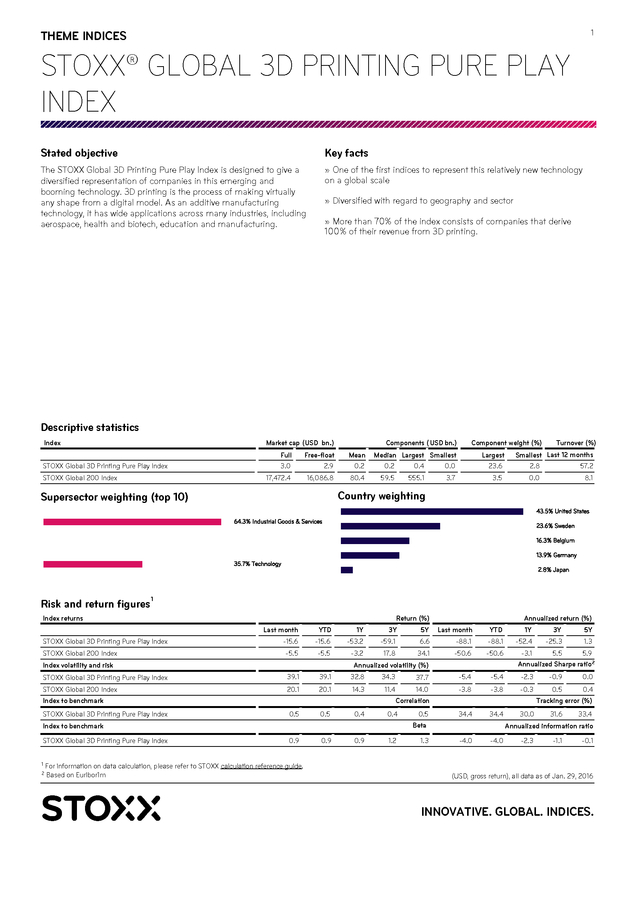
Stated objective
Key facts
The STOXX Global 3D Printing Pure Play Index is designed to give a
diversified representation of companies in this emerging and
booming technology. 3D printing is the process of making virtually
any shape from a digital model. As an additive manufacturing
technology, it has wide applications across many industries, including
aerospace, health and biotech, education and manufacturing.
» One of the first indices to represent this relatively new technology
on a global scale
» Diversified with regard to geography and sector
» More than 70% of the index consists of companies that derive
100% of their revenue from 3D printing.
Descriptive statistics
Index
Market cap (USD bn.)
STOXX Global 200 Index
Free-float
2.9
Mean
0.2
17,472.4
STOXX Global 3D Printing Pure Play Index
16,086.8
80.4
Component weight (%)
Median Largest Smallest
0.2
0.4
0.0
59.5
555.1
Largest
23.6
3.7
3.5
Turnover (%)
Smallest Last 12 months
2.8
57.2
0.0
8.1
Country weighting
Supersector weighting (top 10)
Risk and return figures
Components ( USD bn.)
Full
3.0
1
Index returns
Return (%)
Annualized return (%)
Last month
STOXX Global 3D Printing Pure Play Index
STOXX Global 200 Index
YTD
1Y
3Y
5Y
Last month
YTD
1Y
3Y
5Y
-15.6
-15.6
-53.2
-59.1
6.6
-88.1
-88.1
-52.4
-25.3
1.3
-5.5
-5.5
-3.2
17.8
34.1
-50.6
-50.6
Index volatility and risk
Annualized volatility (%)
-3.1
5.5
5.9
Annualized Sharpe ratio2
STOXX Global 3D Printing Pure Play Index
39.1
39.1
32.8
34.3
37.7
-5.4
-5.4
-2.3
STOXX Global 200 Index
Index to benchmark
20.1
20.1
14.3
11.4
14.0
Correlation
-3.8
-3.8
-0.3
0.5
0.5
0.4
0.4
0.5
Beta
34.4
34.4
1.3
-4.0
STOXX Global 3D Printing Pure Play Index
Index to benchmark
STOXX Global 3D Printing Pure Play Index
1
2
0.9
For information on data calculation, please refer to STOXX calculation reference guide.
Based on Euribor1m
0.9
0.9
1.2
30.0
-0.9
0.0
0.5
0.4
Tracking error (%)
31.6
33.4
Annualized information ratio
-4.0
-2.3
-1.1
-0.1
(USD, gross return), all data as of Jan. 29, 2016
INNOVATIVE.
GLOBAL. INDICES. . 2 THEME INDICES STOXX® GLOBAL 3D PRINTING PURE PLAY INDEX Fundamentals (for last 12 months) Price/earnings incl. negative Index Price/earnings excl. negative Price/ book Price/ sales Price/ cash flow Trailing Projected Trailing Projected Trailing Dividend yield (%) 4 Trailing Trailing Trailing STOXX Global 3D Printing Pure Play Index 4.6 517.8 59.8 79.8 1.0 0.1 1.5 70.0 STOXX Global 200 Index 17.9 15.0 16.8 15.0 0.2 2.6 1.7 17.2 3 Performance and annual returns Methodology For the Pure Play Index, a company must generate more than 10% of its revenue from the 3D Printing sector, have a minimum threemonth average daily trading volume (3-month ADTV) of 25,000 euros and a minimum free-float market cap of 10 million euros. All companies that meet these requirements are ranked by free-float market cap.
The top 30 companies will be selected for inclusion in the index. The detailed methodology including the calculation formula can be found in our rulebook: www.stoxx.com/indices/rulebooks.html Quick facts Versions and symbols Reuters SXG3DPGT EUR CH0212849951 SXG3DPT SXG3DPT INDEX .SXG3DPT Price EUR CH0212849092 SXG3DPP CH0212850082 SXG3DPGU SXG3DPGU Net Return USD CH0212850066 SXG3DPU SXG3DPU INDEX .SXG3DPU Price USD CH0212850033 SXG3DPK SXG3DPK INDEX .SXG3DPK 30 or fewer Review frequency Annually (September) Calculation/distribution Price (EUR/USD), net return, gross return (EUR/USD): end-of-day End-of-day: 10:15 pm CET 100 as of Sep. 17, 2010 Available daily back to Sep.
17, 2010 Jul. 24, 2013 SXG3DPP INDEX .SXG3DPP Gross Return USD No. of components .SXG3DPGT Net Return 20% Inception date Bloomberg SXG3DPGT Cap factor History Symbol CH0212850017 Free-float market cap Base value/base date ISIN Gross Return EUR Weighting Calculation hours Index .SXG3DPGU Complete list available here: www.stoxx.com/data/vendor_codes.html 3 4 STOXX data from Jan.
31, 2011 to Jan. 28, 2016 gr. div.
yield is calculated as gr. return index return minus price index return CONTACT DETAILS STOXX customer support P +41 58 399 5900 customersupport@stoxx.com www.stoxx.com Zurich/headquarters: P +41 58 399 5300 (USD, gross return), all data as of Jan. 29, 2016 Frankfurt: P +49 69 211 13243 London: P +44 207 862 7680 New York: P +1 212 669 6426 Hong Kong: P +852 6307 9316 Sydney: P +61 2 9089 8844 Tokyo: P +81 3 5847 8248 STOXX is part of Deutsche Boerse Group CUSTOMIZATION The index can be used as a basis for the definition of STOXX® Customized Indices, which can be tailored to specific client or mandate needs.
STOXX offers a wide range of customization, in terms of component selection, weighting schemes and personalized calculation methodologies. DISCLAIMER STOXX, Deutsche Börse Group and their licensors, research partners or data providers do not make any warranties or representations, express or implied, with respect to the timeliness, sequence, accuracy, completeness, currentness, merchantability, quality or fitness for any particular purpose of its index data and exclude any liability in connection therewith. STOXX, Deutsche Börse Group and their licensors, research partners or data providers are not providing investment advice through the publication of indices or in connection therewith. In particular, the inclusion of a company in an index, its weighting, or the exclusion of a company from an index, does not in any way reflect an opinion of STOXX, Deutsche Börse Group or their licensors, research partners or data providers on the merits of that company.
Financial instruments based on the STOXX® indices, DAX® indices or on any other indices supported by STOXX are in no way sponsored, endorsed, sold or promoted by STOXX, Deutsche Börse Group or their licensors, research partners or data providers. BACKTESTED PERFORMANCE This document contains index performance data based on backtesting, i.e. calculations of how the index might have performed prior to launch if it had existed using the same index methodology and based on historical constituents. Backtested performance information is purely hypothetical and is provided in this document solely for information purposes. Backtested performance does not represent actual performance and should not be interpreted as an indication of actual performance. .
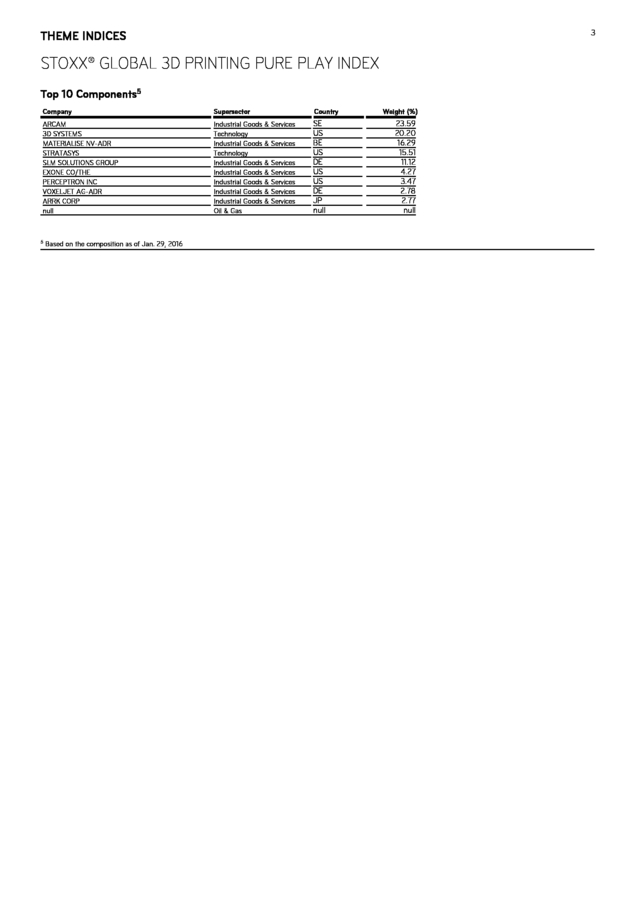
3 THEME INDICES STOXX® GLOBAL 3D PRINTING PURE PLAY INDEX Top 10 Components5 Company Supersector Country ARCAM 3D SYSTEMS MATERIALISE NV-ADR STRATASYS SLM SOLUTIONS GROUP EXONE CO/THE PERCEPTRON INC VOXELJET AG-ADR ARRK CORP null Industrial Goods & Services Technology Industrial Goods & Services Technology Industrial Goods & Services Industrial Goods & Services Industrial Goods & Services Industrial Goods & Services Industrial Goods & Services Oil & Gas SE US BE US DE US US DE JP null 5 Based on the composition as of Jan. 29, 2016 Weight (%) 23.59 20.20 16.29 15.51 11.12 4.27 3.47 2.78 2.77 null .
GLOBAL. INDICES. . 2 THEME INDICES STOXX® GLOBAL 3D PRINTING PURE PLAY INDEX Fundamentals (for last 12 months) Price/earnings incl. negative Index Price/earnings excl. negative Price/ book Price/ sales Price/ cash flow Trailing Projected Trailing Projected Trailing Dividend yield (%) 4 Trailing Trailing Trailing STOXX Global 3D Printing Pure Play Index 4.6 517.8 59.8 79.8 1.0 0.1 1.5 70.0 STOXX Global 200 Index 17.9 15.0 16.8 15.0 0.2 2.6 1.7 17.2 3 Performance and annual returns Methodology For the Pure Play Index, a company must generate more than 10% of its revenue from the 3D Printing sector, have a minimum threemonth average daily trading volume (3-month ADTV) of 25,000 euros and a minimum free-float market cap of 10 million euros. All companies that meet these requirements are ranked by free-float market cap.
The top 30 companies will be selected for inclusion in the index. The detailed methodology including the calculation formula can be found in our rulebook: www.stoxx.com/indices/rulebooks.html Quick facts Versions and symbols Reuters SXG3DPGT EUR CH0212849951 SXG3DPT SXG3DPT INDEX .SXG3DPT Price EUR CH0212849092 SXG3DPP CH0212850082 SXG3DPGU SXG3DPGU Net Return USD CH0212850066 SXG3DPU SXG3DPU INDEX .SXG3DPU Price USD CH0212850033 SXG3DPK SXG3DPK INDEX .SXG3DPK 30 or fewer Review frequency Annually (September) Calculation/distribution Price (EUR/USD), net return, gross return (EUR/USD): end-of-day End-of-day: 10:15 pm CET 100 as of Sep. 17, 2010 Available daily back to Sep.
17, 2010 Jul. 24, 2013 SXG3DPP INDEX .SXG3DPP Gross Return USD No. of components .SXG3DPGT Net Return 20% Inception date Bloomberg SXG3DPGT Cap factor History Symbol CH0212850017 Free-float market cap Base value/base date ISIN Gross Return EUR Weighting Calculation hours Index .SXG3DPGU Complete list available here: www.stoxx.com/data/vendor_codes.html 3 4 STOXX data from Jan.
31, 2011 to Jan. 28, 2016 gr. div.
yield is calculated as gr. return index return minus price index return CONTACT DETAILS STOXX customer support P +41 58 399 5900 customersupport@stoxx.com www.stoxx.com Zurich/headquarters: P +41 58 399 5300 (USD, gross return), all data as of Jan. 29, 2016 Frankfurt: P +49 69 211 13243 London: P +44 207 862 7680 New York: P +1 212 669 6426 Hong Kong: P +852 6307 9316 Sydney: P +61 2 9089 8844 Tokyo: P +81 3 5847 8248 STOXX is part of Deutsche Boerse Group CUSTOMIZATION The index can be used as a basis for the definition of STOXX® Customized Indices, which can be tailored to specific client or mandate needs.
STOXX offers a wide range of customization, in terms of component selection, weighting schemes and personalized calculation methodologies. DISCLAIMER STOXX, Deutsche Börse Group and their licensors, research partners or data providers do not make any warranties or representations, express or implied, with respect to the timeliness, sequence, accuracy, completeness, currentness, merchantability, quality or fitness for any particular purpose of its index data and exclude any liability in connection therewith. STOXX, Deutsche Börse Group and their licensors, research partners or data providers are not providing investment advice through the publication of indices or in connection therewith. In particular, the inclusion of a company in an index, its weighting, or the exclusion of a company from an index, does not in any way reflect an opinion of STOXX, Deutsche Börse Group or their licensors, research partners or data providers on the merits of that company.
Financial instruments based on the STOXX® indices, DAX® indices or on any other indices supported by STOXX are in no way sponsored, endorsed, sold or promoted by STOXX, Deutsche Börse Group or their licensors, research partners or data providers. BACKTESTED PERFORMANCE This document contains index performance data based on backtesting, i.e. calculations of how the index might have performed prior to launch if it had existed using the same index methodology and based on historical constituents. Backtested performance information is purely hypothetical and is provided in this document solely for information purposes. Backtested performance does not represent actual performance and should not be interpreted as an indication of actual performance. .
3 THEME INDICES STOXX® GLOBAL 3D PRINTING PURE PLAY INDEX Top 10 Components5 Company Supersector Country ARCAM 3D SYSTEMS MATERIALISE NV-ADR STRATASYS SLM SOLUTIONS GROUP EXONE CO/THE PERCEPTRON INC VOXELJET AG-ADR ARRK CORP null Industrial Goods & Services Technology Industrial Goods & Services Technology Industrial Goods & Services Industrial Goods & Services Industrial Goods & Services Industrial Goods & Services Industrial Goods & Services Oil & Gas SE US BE US DE US US DE JP null 5 Based on the composition as of Jan. 29, 2016 Weight (%) 23.59 20.20 16.29 15.51 11.12 4.27 3.47 2.78 2.77 null .