


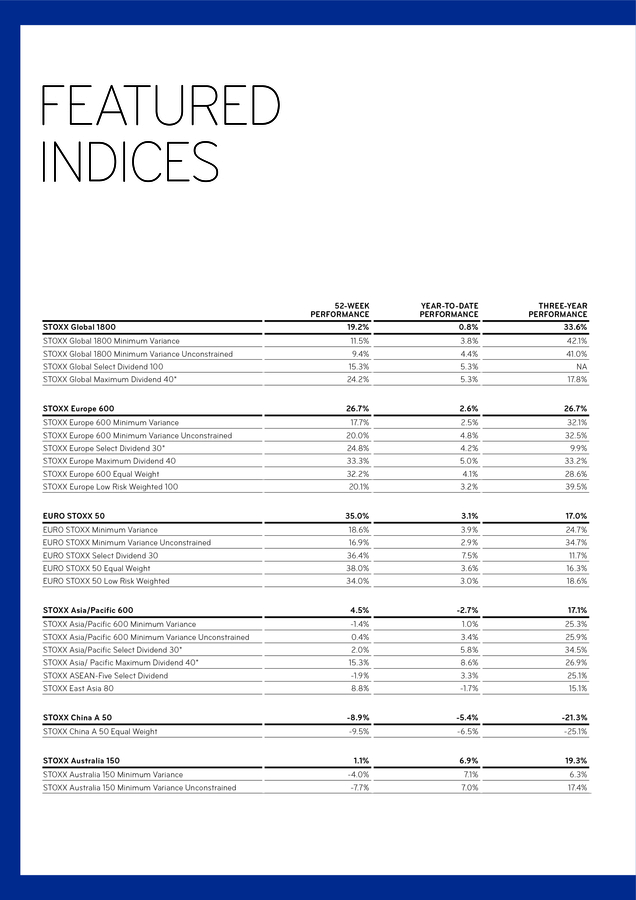


Description
VOL 3/iSSue 1 – SpRInG 2014
sToXX “shi Tuo”
The indian invesTor
sTrong balance sheeTs
low risk sTraTegy
. welcome
TO THe neW eDiTiOn
OF STOXX PuLSe
meeT sToXX
aT a conference
» May 8, 2014, Shanghai, china
STOXX launches the chinese version of
its name at an official ceremony.
» May 15, Sydney, australia
rahul Saito, regional director of north
asia, speaks at the investing in
responsibility conference hosted by
GTQ. he will be part of a panel titled:
“The case for eSG integration.”
» Jun. 4-5, amsterdam, netherlands
hartmut Graf, ceO, will be a panelist at
the inside eTfs europe conference. The
panel, held on Jun.
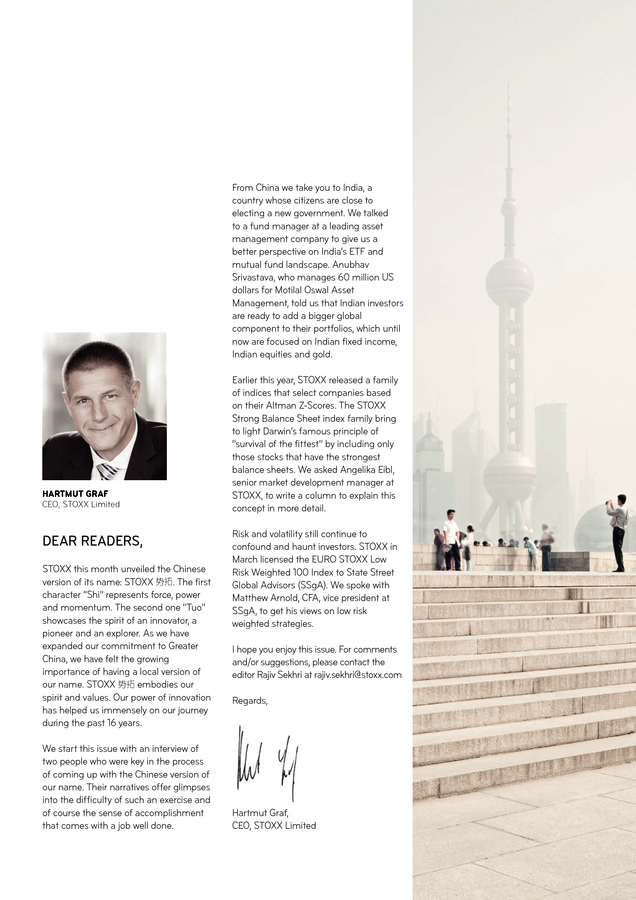
4, is titled: “The rise of ‘Smart Beta’: does it Work, and how do You use it in Portfolios?” » Jun. 19, Hong kong Konrad Sippel, global head of Business development and executive director, speaks at the fT asset management Summit. . from china we take you to india, a country whose citizens are close to electing a new government. We talked to a fund manager at a leading asset management company to give us a better perspective on india’s eTf and mutual fund landscape. anubhav Srivastava, who manages 60 million uS dollars for motilal Oswal asset management, told us that indian investors are ready to add a bigger global component to their portfolios, which until now are focused on indian fixed income, indian equities and gold. HaRTMuT GRaf CeO, STOXX Limited dear readers, STOXX this month unveiled the chinese version of its name: STOXX 势拓. The first character “Shi” represents force, power and momentum.
The second one “Tuo” showcases the spirit of an innovator, a pioneer and an explorer. as we have expanded our commitment to Greater china, we have felt the growing importance of having a local version of our name. STOXX 势拓 embodies our spirit and values.
Our power of innovation has helped us immensely on our journey during the past 16 years. We start this issue with an interview of two people who were key in the process of coming up with the chinese version of our name. Their narratives offer glimpses into the difficulty of such an exercise and of course the sense of accomplishment that comes with a job well done. earlier this year, STOXX released a family of indices that select companies based on their altman Z-Scores. The STOXX Strong Balance Sheet index family bring to light darwin’s famous principle of “survival of the fittest” by including only those stocks that have the strongest balance sheets.
We asked angelika eibl, senior market development manager at STOXX, to write a column to explain this concept in more detail. risk and volatility still continue to confound and haunt investors. STOXX in march licensed the eurO STOXX low risk Weighted 100 index to State Street Global advisors (SSga). We spoke with matthew arnold, cfa, vice president at SSga, to get his views on low risk weighted strategies. i hope you enjoy this issue.
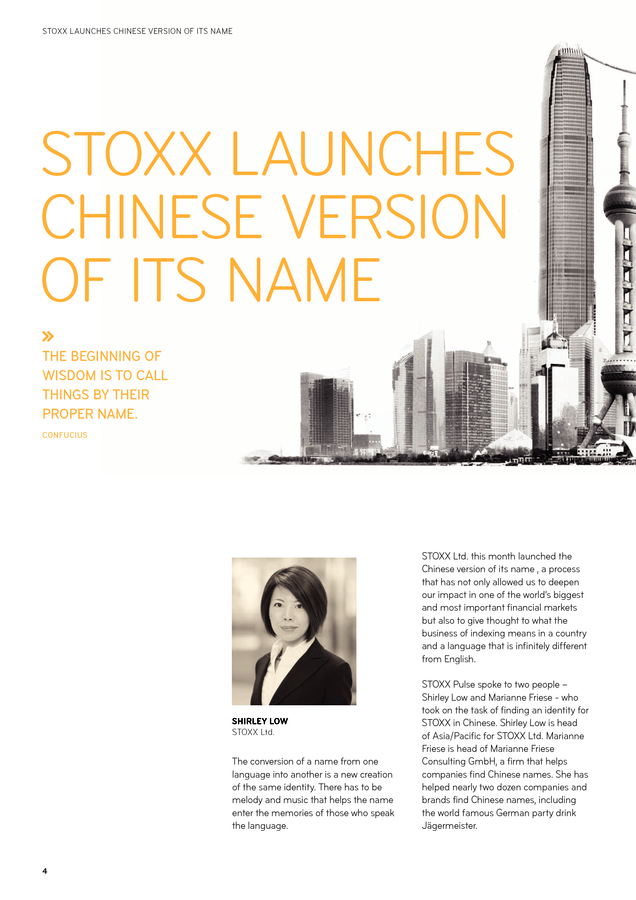
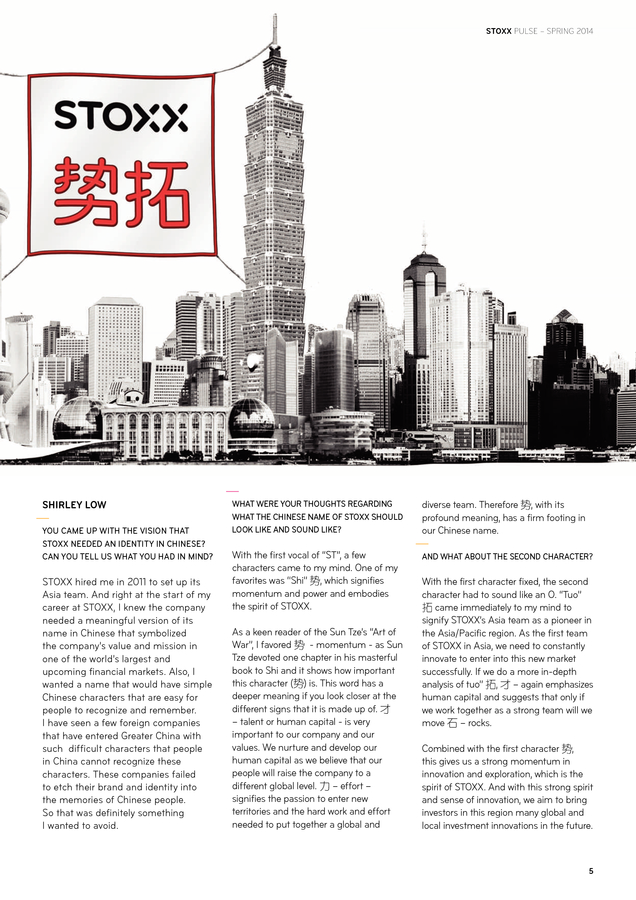
for comments and/or suggestions, please contact the editor rajiv Sekhri at rajiv.sekhri@stoxx.com regards, hartmut Graf, ceO, STOXX limited . STOXX launcheS chineSe verSiOn Of iTS name STOXX launcheS chineSe verSiOn Of iTS name The beginning of wisdom is To call Things by Their proper name. confucius STOXX ltd. this month launched the chinese version of its name , a process that has not only allowed us to deepen our impact in one of the world’s biggest and most important financial markets but also to give thought to what the business of indexing means in a country and a language that is infinitely different from english. SHIRLEY LOW STOXX Ltd. The conversion of a name from one language into another is a new creation of the same identity. There has to be melody and music that helps the name enter the memories of those who speak the language. 4 STOXX Pulse spoke to two people – Shirley low and marianne friese - who took on the task of finding an identity for STOXX in chinese. Shirley low is head of asia/Pacific for STOXX ltd.
marianne friese is head of marianne friese consulting Gmbh, a firm that helps companies find chinese names. She has helped nearly two dozen companies and brands find chinese names, including the world famous German party drink Jägermeister. . STOXX PuLSe – SPring 2014 SHIRLEY LOW you came up wiTh The vision ThaT sToXX needed an idenTiTy in chinese? can you Tell us whaT you had in mind? STOXX hired me in 2011 to set up its asia team. and right at the start of my career at STOXX, i knew the company needed a meaningful version of its name in chinese that symbolized the company’s value and mission in one of the world’s largest and upcoming financial markets. also, i wanted a name that would have simple chinese characters that are easy for people to recognize and remember. i have seen a few foreign companies that have entered Greater china with such difficult characters that people in china cannot recognize these characters. These companies failed to etch their brand and identity into the memories of chinese people. So that was definitely something i wanted to avoid. whaT were your ThoughTs regarding whaT The chinese name of sToXX should look like and sound like? diverse team.
Therefore 势, with its profound meaning, has a firm footing in our chinese name. With the first vocal of “ST”, a few characters came to my mind. One of my favorites was “Shi” 势, which signifies momentum and power and embodies the spirit of STOXX. and whaT abouT The second characTer? as a keen reader of the Sun Tze’s “art of War”, i favored 势 - momentum - as Sun Tze devoted one chapter in his masterful book to Shi and it shows how important this character (势) is. This word has a deeper meaning if you look closer at the different signs that it is made up of.
æ‰ – talent or human capital - is very important to our company and our values. We nurture and develop our human capital as we believe that our people will raise the company to a different global level. 力 – effort – signifies the passion to enter new territories and the hard work and effort needed to put together a global and With the first character fixed, the second character had to sound like an O.
“Tuo” æ‹“ came immediately to my mind to signify STOXX’s asia team as a pioneer in the asia/Pacific region. as the first team of STOXX in asia, we need to constantly innovate to enter into this new market successfully. if we do a more in-depth analysis of tuo” æ‹“, æ‰ – again emphasizes human capital and suggests that only if we work together as a strong team will we move 石 – rocks. combined with the first character 势, this gives us a strong momentum in innovation and exploration, which is the spirit of STOXX.
and with this strong spirit and sense of innovation, we aim to bring investors in this region many global and local investment innovations in the future. 5 . STOXX launcheS chineSe verSiOn Of iTS name 6 . 专 ä¸ æ•° STOXX Pulse – sPring 2014 å°† hence, The mosT imporTanT aspecT in creaTing a chinese name for sToXX was To find a name ThaT reflecTs The spiriT and mission of The company 欧 带 marianne friese how did you find ThaT balance? 势 æ‹“ MaRIannE fRIESE Marianne Friese Consulting so going from The names of people To naming companies? is iT a similar eXercise? MaRIannE fRIESE whaT is so differenT abouT a name in chinese raTher Than a name in say english or german? it is like earth and sky, the difference. in english you have names like Peter, Janet. But in chinese there are no names like that. You have to choose characters, which convey the meaning of a word – such as heaven, beauty or water – to create a name. most given names in chinese have one or two characters and family names generally have one character. So, for example, it is hard for a chinese person to comprehend that there are thousands of Janets in this world. let me explain with the name of STOXX. in a chinese context, STOXX is an artificial name.
The sound of the word stock or stocks does not apply or have meaning in chinese. hence, the most important aspect in creating a chinese name for STOXX was to find a name that reflects the spirit and mission of the company and at the same time this spirit and mission can be conveyed by chinese characters that are meaningful, resonant and melodious. and each character is pronounced differently in different parts of china.
hence the written name becomes critical because Simplified chinese, the written form, is the uniform written language of the country. So to find a name for STOXX, which was done by our team in china, we had to find in those 20,000 or so characters a name that was not too obvious, that was unique but also simple enough to be memorable. To find a good balance between these parameters is the hardest part of the task. What we did at first was to look at the competitive environment, who the players were in this sector in china, whether they use dual names etc. Such a check gives you an idea of what characters to avoid and also gives you an understanding of what kind of business environment exists for the company identity-wise in china. after this exercise we came up with a list of about 100 names. Then we clustered the names into groups of names that showed similarities.
and from these clusters we came up with a final list of about four names. from the 20,000 characters to the list of 100 to the final two, the process involved talking to men, women, bankers, writers, chinese literature experts, chinese people living in china, hong Kong and abroad, and many others to get their input and opinion on names. finally, it was mission critical that the name can still be registered in the respective categories.
hence, we did quite extensive pre-checks on this matter before submitting any suggestions. in the end, STOXX was pleased with the final list of four we suggested. STOXX was very actively involved in the process by checking with key contacts in china on their preferences regarding the names we suggested. Of course, STOXX was with us all the way, offering its input and ideas to the search for the name.
creating a chinese name is a great project to deliver – it takes experience and smarts from our end and good cooperation and trust from the client’s side.« 7 . The POrTfOliO Of an indian inveSTOr The POrTfOliO Of an indian inveSTOr anuBHaV SRIVaSTaVa Motilal Oswal 8 . STOXX PuLSe – SPring 2014 corpus needs to diversify and get into a much higher return than what we have right now. Therefore, there continues to be a lot of interest in middle- and low-level residential real estate and gold bullion – perceived inflation hedges. “Green ShOOTS” Seen in TermS Of indian inveSTOrS diverSifYinG GlOBallY as the world's largest democracy elects a new government, STOXX Pulse asked a fund manager with a leading asset management company in india to offer his perspective on indian investors and talk about the eTf and mutual fund landscape in india. anubhav Srivastava is senior vice president and fund manager, head of institutions and Product development, at motilal Oswal asset management, where he manages 60 million uS dollars in equities, fixed income and commodities. Srivastava has worked at motilal Oswal since October, 2010. Before that he was head of Quantitative finance at Syntel inc. he has a postgraduate diploma in management from the indian institute of management, ahemdabad and a master’s of Science in Quantitative finance from the university of Westminster. motilal Oswal is one of india’s leading asset management companies.
it is a subsidiary of motilal Oswal Securities ltd. whaT do indian invesTors lack in Their porTfolios? if you look at a classic indian investor portfolio, there is a massive concentration of indian fixed income, indian equities and then gold. now a pure concentration in indian equity and fixed income is actually a bit of a problem because given the volatile times we are in, especially during the last five years, what happened was that fixed income and equity tended to get highly correlated. and therefore, fixed income gets subjected to the kind of drawdown that equities are subjected to. That means the entire portfolio sinks. now let us put that in the perspective of retirement planning or other financial objectives. What we see is that coupled with 10% ongoing inflation there is a huge problem both in terms of risk and in terms of return. now the rule of thumb is that if 100 uS dollars goes down 20% to $80, it requires a 25% return to bring it back up.
But those returns are not what we have seen in the markets which have, by and large, been flat point-topoint in the past five to six years. and therefore investors have not been able to plan for retirement. fixed income yields have been running 8.5% to 9%, still below inflation. When you add to that the cost of investing, we’re talking about a required return rate close to 14%. investors are not getting a return of 14% a year.
instead, money is depreciating in real value. in the long run, what we are going to see is that people will not be able to plan their retirements. and this is more so the case with some of the pension funds that run in the country because they have just domestic equity and debt investment. now on the pension and insurance side, while there is not such a big asset liability mismatch, but there are still a couple of issues that come up.
first, is that many of these products which are heavily loaded with commission payout right up front, but you are starting out with a smaller corpus. ultimately, the returns are going to come from that corpus. Secondly, another five years down the line, this population dynamic of a very young workforce is going to flip.
it has already been happening over the past 10 years and it is going to be a big problem. and therefore that you Talk abouT a 14% reTurn so ThaT people can jusT abouT break even on Their invesTmenTs? is ThaT even possible? it requires equity. if you look at a pure domestic investment, probably it is not. long-term equity growth rates in india are 12% to 13%. depending on one’s selected timescale, if you buy and hold the equity for 10 years you might get something like that.
The only way to do this is to diversify internationally. and, of course, you have to select your investments appropriately. and what we see is that internationally, one of the benefits that result is that if the rupee depreciates then we get a better return.
So it defrays the cost of all these imported parts of the cPi, or the wholesale price index. So it provides a little bit of a hedge along with the returns in companies that are global leaders, which still have cash on their balance sheets and have a fair amount of growth going on. and it need not just be the tech sector, which is the first thing that comes to mind.
it is not just about Google, apple etc. but also about daimler, BmW, some of the other european companies which are quite a good investment right now. are invesTors, muTual funds and oTher pension funds in india willing To diversify aT This sTage ? as with all emerging markets, what tends to happen is that there is resistance among resident fund managers to go into the unknown. So you will see that the largest funds in india are broad equity funds, actively managed.
having said that there is a european fund being filed, but that is from the active side. also, a whole bunch of uS funds are available. my point is that any diversification strategy will need to look at international markets. investors are willing to, while insurance and pension managers have regulatory challenges. 9 .
any diversificaTion sTraTegy will need To look aT inTernaTional markeTs. anubhav srivasTava Whilst there is resistance, i see some green shoots in terms of people looking at diversifying globally. i think one of the challenges is that there are not enough products available in the indian market. You have hang Seng with a correlation of maybe 0.5 to the indian markets. The correlations to the nasdaq tend to be even lower.
But there is a whole other section, say europe or emerging markets, that is missing. and of the things we do need to take cognizance of is that a lot of these things will provide returns at different points unless there is a global economic meltdown of the 2008 variety. So choices that will help indian investors diversify are not available. can you give some color on The regulaTory environmenT for eTfs and muTual funds in india? also, is iT True ThaT you can only offer an eTf in india ThaT is based on an indeX ThaT is parT of an eXchange, such as The daX, Hang Seng or naSdaq? regulations in india are still evolving.
Our regulator SeBi is working very hard to globalize indian regulations as well as get some best practices from around the world. With respect to the issue that you cannot make an eTf in india based on non-exchange indices – to an extent that is true but it is not entirely true because our first eTf was a smart-beta product loosely based on the nifty. We also have approval for a cnX equal-weight index. The other issue may be that the government is a little hesitant to allow for large limits in terms of foreign investment via the mutual fund and eTf route in india as it might have an adverse impact on account deficits. But that is speculation because there is no formal policy to substantiate that statement. in terms of what the regulators will approve, because they have so few applications, regulatory appetite for these kinds of international products remains to be seen. But they will concretize regulations going forward.
indian equity eTfs are still very small compared to gold eTf products that are out there in the indian market. and the breadth GDP GROWTH EXPECTATIONS 4.7% of products that are available in the indian market is still limited. from a regulatory perspective, typically we are not allowed to do say leveraged products/ inverse products. and the commodities side of the spectrum is regulated by the fmc which has not approved anything other than gold as of yet for eTf investment. There are regulations right now that prevent large institutional investors from coming into the eTf market.
Just recently regulators issued a draft guideline that says that given certain terms and conditions insurance companies can invest into eTfs. This is a first step. Globally a large chunk of eTf investments are either 401K plans or they are largely institutional affairs, unlike india. is There also a hesiTaTion from The side of muTual fund companies in india To creaTe an eTf because There is no demand and noT much of a passive invesTing scenario in The counTry? i think that is more to do with the nature of mutual fund companies.
if you look at the BIGGEST CONCERN FOR ECONOMIC GROWTH 1.7% 1.9% 2.6% 12% 6.2% 23.1% National election results 32.4% 14.9% Lack of business and consumer conï¬dence Below 4% Domestic inflation and Reserve Bank of India (RBI) policy action Between 4% and 5% Between 5% and 6% 58.5% Between 6% and 7% Greater than 7% Domestic politics and corruption Global liquidity constraints 20.4% 21.6% FX currency risk and credit rating downgrade Global oil prices Source: Indian Association of Investment Professionals’ Annual Forecast Survey for ï¬scal year 2015. The survey had 431 participants from the country’s investment and ï¬nancial sector. 10 . STOXX PuLSe – SPring 2014 products that will allow them to get into the low volatility space and get a reasonable return by mixing asset classes. global scenario, a lot of asset management and mutual fund companies have clearly decided which side they want to be on. i think india is a bit behind on the curve, but we still see a lot of mutual fund companies that have one or two eTfs. and going forward, as the regulations become clearer and as demand picks up because of how the economy and the financial markets have been, i expect there to be a larger uptake/ issuance of eTfs. and not just basic eTfs, but you will see sectoral eTfs in a big way. We will also get into smart-beta type products though there could be some initiative coming straight from the exchanges and the index providers for developing these. What we have seen is that there is a big demand coming in from the retail and the middle segment of the market for asset allocation products. So independent financial advisors, private wealth management outfits as well as pure retail customers are looking at where do you see gdp growTh in india in 2014 and whaT impacT will The may general elecTion have on The counTry? in addiTion, can you also Talk abouT The huge amounT of household savings in india? in my view we are looking at 4.5% to 4.8% GdP growth in 2014, and, on the higher side maybe 5% to 5.3%. regarding household savings, there is about 400 billion uS dollars on the lower side in the country, which is purely put into bank deposits and is depreciating given that interest rates lag inflation.
Superimpose this with the fact that we have moved from a defined benefit pension scheme to a defined contribution pension scheme, this money has to move into more productive investments rather than simple and non-transparent bond investments. Those people who are actually at the forefront of helping manage this will be the asset management companies. right now there is a regulation that says that insurance companies and pension funds have to manage their own assets.
The view that is out there, is that insurance and pension funds should be doing what they do i.e. manage risk, whereas the asset management should be outsource to asset management companies and also to multiple managers which tends to diversify fund manager risk, house risk as well as get a whole new fresh set of ideas. With regard to the political scenario, yes it tends to be a worry but the kind of volatility we see now is normal given the elections and the budget. having said that, the country has identified what the problem areas are, such as infrastructure, governance.
The new government might take a little while, but the priorities for the new government are all set. furthermore, in terms of a mandate, whether somebody is going to get a clear mandate or not, i would go with the latter. if the mandates are not clear that may prove to be a slight hindrance but, on the other hand, if everybody gets on board and does their job well, we could get 80% of the problems sorted and our growth rates would see a fair amount of acceleration in the coming years. valuations today are reasonable and we are looking at a market that has been under bought. Therefore, the next two to three years might just be good ones for indian markets. « 11 .
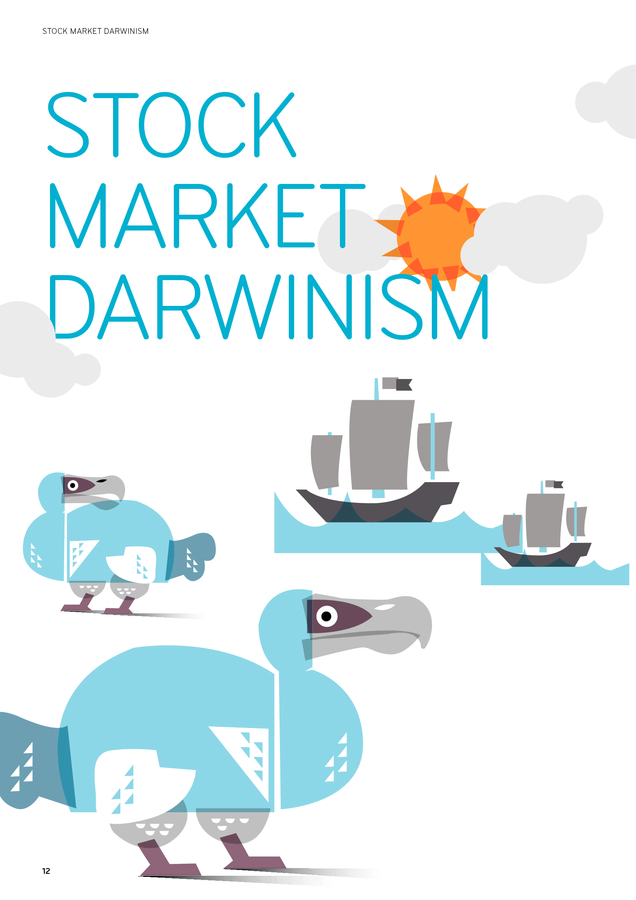
STOcK marKeT darWiniSm STOcK marKeT darWiniSm 12 . STOXX PuLSe – SPring 2014 STOXX STrOnG Balance SheeT indiceS: a familY ThaT SelecTS The financiallY fiTTeST cOmPanieS STOXX ltd. launched an index family earlier in 2014 that selects companies based on their altman Z-Score. STOXX Pulse asked angelika eibl, senior market development manager at STOXX, to write a commentary about this index family and what it offers investors. history holds plenty of examples of successful species that became extinct after failing to adapt to significant changes in their environment. The dodo, for instance, was a friendly flightless bird about three feet tall that was native to mauritius.
after thousands of years of successfully populating a place where he had no natural enemies, the dodo was extinct a mere 60 years after the first dutch ship reached the island. Being fearless and wingless, the bird wasn’t exactly well-equipped to survive the arrival of hungry sailors. anGELIka EIBL STOXX Ltd. iT is noT The sTrongesT or The mosT inTelligenT who will survive buT Those who can besT manage change. charles darwin Similarly, some companies are clearly better positioned than others to successfully adapt to an ever-changing market environment. high debt levels don’t bode well in the mid and long term, for instance. let’s look at the example of arcandor, which prior to its bankruptcy owned Germany’s iconic department store chain Karstadt.
in 2006, arcandor raised a reported 4.5 billion euros through the sale and leaseback of the majority of its properties. commonly, the idea behind a sales and leaseback is to free up cash from low yielding real estate and invest it at a positive spread into the higher yielding operating business. Yet arcandor did the opposite, fully financing the majority of its department stores at rapidly increasing rates that soon steeply exceeded the firm’s operating margin.
By 2008, rents amounted to 15% to 20% of revenue in several major cities1, or a multiple of the single-digit margins that are common in Germany’s fiercely competitive retail market. By december 2008, its total liabilities exceeded its market cap by over 12 billion euros, or 2,300%. in June 2009, arcandor filed for bankruptcy protection after its request for loan guarantees was rejected by the German government.
arcandor’s management made the case that the firm had become a hapless casualty of the credit crunch and the economic contraction, both of which doubtlessly accelerated the firm’s downfall. Yet in hindsight, the firm’s inapt, possibly reckless financial engineering had been bound to sooner or later cause serious trouble. Starting from the premise that there should be features that allow investors to systematically and quantitatively discern among companies that are well-placed to survive ever-changing markets versus companies in danger of perishing, Professor edward i. altman from new York university’s Stern School of Business performed extensive research in the late 1960s2.
in his pioneering work, he used the technique of linear discriminant analysis to develop a simple yet powerful metric which would gauge a stock’s near- and mid-term default risk using readily available data from corporate balance sheets and income statements. 1 Source: "club der millionäre", der Spiegel, 25/2009 2 "financial ratios, discriminant analysis and the Prediction of corporate Bankruptcy”, altman (1968) 13 . STOcK marKeT darWiniSm This metric is called the altman Z-Score. Popular and widely used among practitioners, the score measures the financial health of a company using the weighted sum of five financial ratios relating to liquidity, profitability, market return, debt and revenues Z-Score=1.2X1+1.4X2+3.3X3+0.6X4+1.0X5 where X1 = working capital/total assets X2 = retained earnings/total assets X3 = earnings before interest and tax/ total assets X4 = market value of equity/book value of debt X5 = sales/total assets 3 4 5 6 altman determined that companies with Z-Scores of 3.0 and higher are very likely to stay in business over a two-year time horizon, whereas companies with Z-Scores of 1.8 and smaller have significant default risk over the same period.3 in between these two values, the lines are blurred and a reliable classification cannot be made. The model of the Z-Score was originally designed only for manufacturing companies and was later extended to all industries ex financials. That’s because altman determined through quantitative research in the 1960s what the world learned from the media post-2007: financial firms’ reporting is prone to hiding meaningful information, such as off-balance sheet activities and refinancing risks. as a result, accounting- based metrics such as the Z-Score are less reliable, even meaningless when applied to financials. altman’s research found the Z-Score to correctly predict bankruptcies of nonfinancials two years before the event in 72% of cases, with an “all-clear” falsely being given in 6% of cases (type ii error). later tests have found the model to even be 80% to 94%4 correct in predicting bankruptcy ahead of time. Over time, researchers have further found that the Z-Score not only predicts distress with a high degree of accuracy but is also a useful tool in gauging the likelihood of outperformance of a given stock5.
carter and hofer for instance investigated a variety of common performance metrics and found the Z-Score to provide the greatest relative information about the market-adjusted return to shareholders6. for reference: as of June 2008, the ill-fated German retailer arcandor had an altman Z Score of -0.1 (Source: Bloomberg) “Prediction of corporate Bankruptcy from 2008 Through 2011”, li (2012) “a Study of the efficacy of altman’s Z To Predict Bankruptcy of Specialty retail firms doing Business in contemporary Times”, hayes et al. (2010) “measuring organizational performance: metrics for entrepreneurship and strategic management research”, carton, hofer (2006) 14 . STOXX PuLSe – SPring 2014 Broad, liquid representation of a given market as evidenced by high correlation and low tracking error to the underlying base index Outperformance through higher return as well as reduced volatility Downside protection through reduced maximum drawdown Going back to our analogy from evolutionary theory, one can say: a species that due to its high degree of adaptability is particularly likely to persist is likely to do better than other species even in the absence of major environmental changes. This is evolutionary theory at its best. We have found that what holds true in nature applies equally well to the stock market. Through the STOXX Strong Balance Sheet index family, we offer our clients an index methodology that filters out any stocks that are not suited for survival. The concept is as straightforward as it is powerful: for a given universe, the pertinent STOXX Strong Balance Sheet index contains only stocks with a threeyear track record of Z-Scores of 3.5 and higher.
financial firms are excluded from the universe. further, stocks must pass an adaptive liquidity screen (95% of the most liquid stocks in a universe qualify) that has a fixed, region-specific floor of typically around the local currency equivalent of 5 million uS dollars in average daily trading volume. There are two index versions: one is weighted by free-float market cap subject to a 10% cap at the component level.
The second version is equally weighted. The index is reviewed annually in September and rebalanced quarterly. The chart and table shows the key figures and return of the STOXX Global Strong Balance Sheet index versus its benchmark, the STOXX Global 1800. furthermore, a factor analysis reveals excess returns are most strongly driven by the overweighting of companies with little leverage. This finding quantitatively confirms the intuition that if there is one thing that limits a company’s flexibility to adapt to changes in the market and makes it prone to distress, that is high levels of debt. True to its premise, the STOXX Strong Balance Sheet index family succeeds in achieving the following: in conclusion, we offer to our clients an index family that successfully adopts darwin’s famous principle of the “survival of the fittest” by excluding all but those stocks with the strongest balance sheets as measured by their respective Z-Scores. empirically, such stocks are more adaptive to ever-changing markets, create excess return and mitigate downside risk.
Since the STOXX Strong Balance Sheet index family is broadly diversified and thus representative of the underlying market, it is ideally suited to replace traditional ex financial indices and strategies. in addition, the index family can be used to derive long only, “130-30” or market neutral satellite strategies to produce excess return.« STOXX GLOBaL STROnG BaLancE SHEET InDEX OuTpERfORMS BEncHMaRk 180 160 140 120 100 80 60 40 Sep. 2007 Sep.
2008 Sep. 2009 Sep. 2010 Sep.
2011 STOXX Global Strong Balance Sheet Sep. 2012 Sep. 2013 STOXX Global 1800 STOXX Global Strong Balance Sheet # positions ff market cap in uSd tn Total no.
of defaults return, annualized volatility, annualized maximum drawdown STOXX Global 1800 376 1800 9.9 0 7.0% 17.8% -47.7% 32.9 11 1 2.8% 20.1% -58.2% numbers computed using STOXX gross returns in uSd over period from Sep. 24, 2007 to feb. 28, 2014 unless labelled otherwise 1 General motors corp., arcandor aG, landsbanki islands hf., Glitnir banki hf., Kaupthing Bunadarbanki hf., Washington mutual inc., General Growth Properties inc., lehman Brothers holdings inc., Japan airlines corp., SinO-fOreST, elpida memory inc. 15 .
dOWnSide PrOTecTiOn dOWnSide Pr TecTiOn STOXX Pulse spoke with matthew arnold, cfa, vice president at SSga and a senior eTf strategist within SPdr eTf Strategy & consulting Group. We asked him about low risk weighted strategies in particular and the broader realm of low volatility investing. MaTTHEW aRnOLD SSgA Prior to joining SSga in 2009, arnold worked at fortis investments (previously aBn amrO asset management). he has worked in the financial services industry since 1997 and holds a Bachelor’s of commerce and post-graduate diploma in commerce in finance from the university of Otago in new Zealand. why do invesTors use risk-weighTed sTraTegies? inveSTOrS Of all STriPeS SeeK lOW riSK, lOW vOlaTiliTY inveSTmenT STraTeGieS STOXX ltd. in march licensed the eurO STOXX low risk weighted 100 index to State Street Global advisors (SSga) for an eTf.
The index selects those 100 stocks in the eurO STOXX index which showed the lowest volatility over the past year, thus offering eurozone exposure with the least possible portfolio volatility. 16 We think there are a number of reasons why an increasing number of investors use risk-weighted or low volatility equity strategies within their portfolios. firstly, with two very painful equity bear markets since 2000, investors of all types – from retail ‘mom and pops’ through to the most sophisticated pension funds – have been looking for fully invested strategies that offer the prospect of some downside protection. most low volatility strategies have, historically at least, experienced lower drawdowns than the broad, capweighted indices that are commonplace in the industry today. and, as the name suggests, they have also experienced lower price volatility than broad market indices.
Secondly, there is an increasing body of evidence that lower volatility stocks have in fact outperformed higher volatility stocks over the long term. So some investors have increased their allocations to low volatility stocks with the aim of outperforming the broad market over time. While it remains to be seen whether this “anomaly” continues, we think demand will grow given the favorable drawdown and risk characteristics of low volatility or riskweighted strategies. why do you Think using an alTernaTive weighTing sTraTegy – such as weighTing componenTs on Their level of risk – makes sense? We think alternatively weighted equity strategies are appropriate for a range of investors.
income-oriented investors, for example, might benefit from strategies which weight stocks based on dividend yield rather than market cap, while private investors and pension funds might find the reduced absolute risk of low volatility approaches attractive in today’s environment. ultimately, developments within the beta management world are allowing investors to build portfolios that more closely align with their investment goals. This can only be a good thing. whaT are The mosT imporTanT ingredienTs a risk-weighTed indeX should have? and, in your opinion, do indeX providers offers riskweighTed indices ThaT offer invesTors whaT They are looking for? .
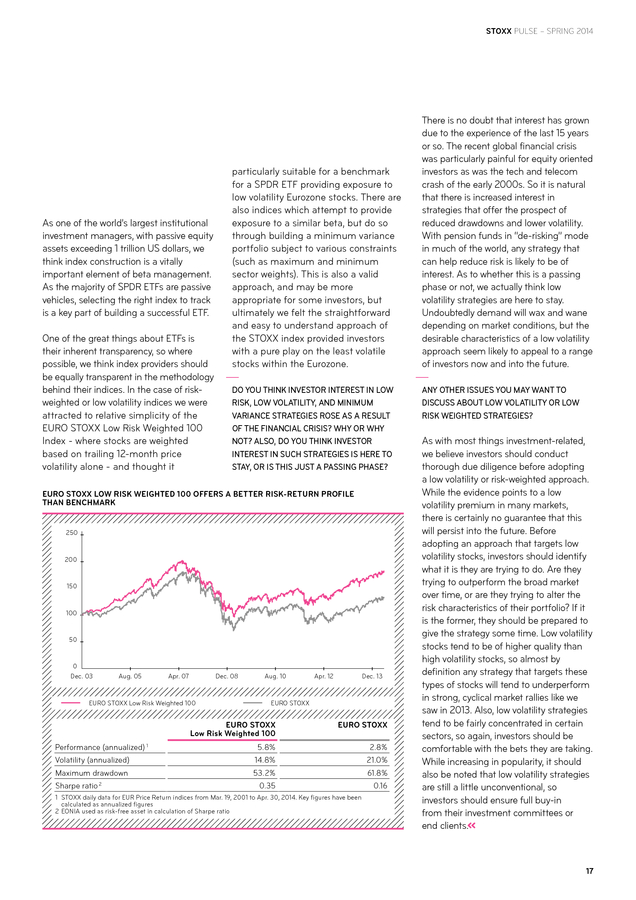
STOXX PuLSe – SPring 2014 as one of the world’s largest institutional investment managers, with passive equity assets exceeding 1 trillion uS dollars, we think index construction is a vitally important element of beta management. as the majority of SPdr eTfs are passive vehicles, selecting the right index to track is a key part of building a successful eTf. One of the great things about eTfs is their inherent transparency, so where possible, we think index providers should be equally transparent in the methodology behind their indices. in the case of riskweighted or low volatility indices we were attracted to relative simplicity of the eurO STOXX low risk Weighted 100 index - where stocks are weighted based on trailing 12-month price volatility alone - and thought it particularly suitable for a benchmark for a SPdr eTf providing exposure to low volatility eurozone stocks. There are also indices which attempt to provide exposure to a similar beta, but do so through building a minimum variance portfolio subject to various constraints (such as maximum and minimum sector weights). This is also a valid approach, and may be more appropriate for some investors, but ultimately we felt the straightforward and easy to understand approach of the STOXX index provided investors with a pure play on the least volatile stocks within the eurozone. do you Think invesTor inTeresT in low risk, low volaTiliTy, and minimum variance sTraTegies rose as a resulT of The financial crisis? why or why noT? also, do you Think invesTor inTeresT in such sTraTegies is here To sTay, or is This jusT a passing phase? EuRO STOXX LOW RISk WEIGHTED 100 OffERS a BETTER RISk-RETuRn pROfILE THan BEncHMaRk 250 200 150 100 50 0 dec.
03 aug. 05 apr. 07 dec.
08 eurO STOXX low risk Weighted 100 aug. 10 apr. 12 dec.
13 eurO STOXX EuRO STOXX Low Risk Weighted 100 Performance (annualized) 1 volatility (annualized) maximum drawdown Sharpe ratio 2 EuRO STOXX 5.8% 14.8% 53.2% 0.35 2.8% 21.0% 61.8% 0.16 1 STOXX daily data for eur Price return indices from mar. 19, 2001 to apr. 30, 2014.
Key figures have been calculated as annualized figures 2 eOnia used as risk-free asset in calculation of Sharpe ratio There is no doubt that interest has grown due to the experience of the last 15 years or so. The recent global financial crisis was particularly painful for equity oriented investors as was the tech and telecom crash of the early 2000s. So it is natural that there is increased interest in strategies that offer the prospect of reduced drawdowns and lower volatility. With pension funds in “de-risking” mode in much of the world, any strategy that can help reduce risk is likely to be of interest.
as to whether this is a passing phase or not, we actually think low volatility strategies are here to stay. undoubtedly demand will wax and wane depending on market conditions, but the desirable characteristics of a low volatility approach seem likely to appeal to a range of investors now and into the future. any oTher issues you may wanT To discuss abouT low volaTiliTy or low risk weighTed sTraTegies? as with most things investment-related, we believe investors should conduct thorough due diligence before adopting a low volatility or risk-weighted approach. While the evidence points to a low volatility premium in many markets, there is certainly no guarantee that this will persist into the future. Before adopting an approach that targets low volatility stocks, investors should identify what it is they are trying to do. are they trying to outperform the broad market over time, or are they trying to alter the risk characteristics of their portfolio? if it is the former, they should be prepared to give the strategy some time.
low volatility stocks tend to be of higher quality than high volatility stocks, so almost by definition any strategy that targets these types of stocks will tend to underperform in strong, cyclical market rallies like we saw in 2013. also, low volatility strategies tend to be fairly concentrated in certain sectors, so again, investors should be comfortable with the bets they are taking. While increasing in popularity, it should also be noted that low volatility strategies are still a little unconventional, so investors should ensure full buy-in from their investment committees or end clients.« 17 . feaTured indiceS FeATureD inDiCeS 52-WEEk pERfORMancE 19.2% YEaR-TO-DaTE pERfORMancE 0.8% THREE-YEaR pERfORMancE 33.6% STOXX Global 1800 minimum variance STOXX Global 1800 minimum variance unconstrained STOXX Global Select dividend 100 STOXX Global maximum dividend 40* 11.5% 9.4% 15.3% 24.2% 3.8% 4.4% 5.3% 5.3% 42.1% 41.0% na 17.8% STOXX Europe 600 26.7% 2.6% 26.7% STOXX europe 600 minimum variance STOXX europe 600 minimum variance unconstrained STOXX europe Select dividend 30* STOXX europe maximum dividend 40 STOXX europe 600 equal Weight STOXX europe low risk Weighted 100 17.7% 20.0% 24.8% 33.3% 32.2% 20.1% 2.5% 4.8% 4.2% 5.0% 4.1% 3.2% 32.1% 32.5% 9.9% 33.2% 28.6% 39.5% EuRO STOXX 50 35.0% 3.1% 17.0% eurO STOXX minimum variance eurO STOXX minimum variance unconstrained eurO STOXX Select dividend 30 eurO STOXX 50 equal Weight eurO STOXX 50 low risk Weighted 18.6% 16.9% 36.4% 38.0% 34.0% 3.9% 2.9% 7.5% 3.6% 3.0% 24.7% 34.7% 11.7% 16.3% 18.6% STOXX Global 1800 STOXX asia/pacific 600 4.5% -2.7% 17.1% STOXX asia/Pacific 600 minimum variance STOXX asia/Pacific 600 minimum variance unconstrained STOXX asia/Pacific Select dividend 30* STOXX asia/ Pacific maximum dividend 40* STOXX aSean-five Select dividend STOXX east asia 80 -1.4% 0.4% 2.0% 15.3% -1.9% 8.8% 1.0% 3.4% 5.8% 8.6% 3.3% -1.7% 25.3% 25.9% 34.5% 26.9% 25.1% 15.1% STOXX china a 50 -8.9% -5.4% -21.3% STOXX china a 50 equal Weight -9.5% -6.5% -25.1% 1.1% 6.9% 19.3% -4.0% -7.7% 7.1% 7.0% 6.3% 17.4% STOXX australia 150 STOXX australia 150 minimum variance STOXX australia 150 minimum variance unconstrained 18 . STOXX PuLSe – SPring 2014 52-WEEk pERfORMancE STOXX north america 600 YEaR-TO-DaTE pERfORMancE THREE-YEaR pERfORMancE 20.0% 1.0% 43.0% STOXX north america 600 minimum variance STOXX north america 600 minimum variance unconstrained STOXX north america maximum dividend 40* STOXX north america Select dividend 40* 15.1% 12.2% 12.3% 12.8% 4.0% 3.9% 5.2% 5.2% 49.2% 53.0% 48.8% 36.3% STOXX uSa 900 21.0% 0.8% 46.5% STOXX uSa 900 minimum variance STOXX uSa 900 minimum variance unconstrained 14.0% 10.3% 2.3% 4.4% 44.7% 56.1% STOXX canada 240 10.4% 3.4% -1.6% 8.5% 7.7% 1.5% 1.9% 16.1% 24.9% STOXX canada 240 minimum variance STOXX canada 240 minimum variance unconstrained all indices are in uSd Gross return versions, except the ones marked with *, which are in uSd net return versions Source: STOXX data as of apr. 9, 2014 19 . cOnTacTS VOL 3/iSSue 1 – SpRInG 2014 Printed in may 2014 Selnaustrasse 30 ch-8021 Zurich P +41 (0)58 399 5300 stoxx@stoxx.com www.stoxx.com frankfurt: +49 (0)69 211 13243 hong Kong: +852 6307 9316 london: +44 (0)20 7862 7680 madrid: +34 (0)91 369 1229 new York: +1 212 669 6426 Stockholm: +46 (0)8 4600 6090 STOXX is part of Deutsche Börse and SIX This newsletter contains opinions and statements from various information providers. STOXX limited does not represent or endorse any of these views or opinions and does not vouch for their accuracy or reliability. The views expressed by the information providers in this newsletter are their own views and do not reflect the views and opinions of STOXX limited. STOXX® indices are protected through various intellectual property rights. ‘STOXX’, ‘eurO STOXX 50’ and ‘iSTOXX’ are registered trademarks.
The use of the STOXX® indices for financial products or for other purposes requires a license from STOXX. STOXX does not make any warranties or representations, expressed or implied with respect to the timeliness, sequence, accuracy, completeness, currentness, merchantability, quality or fitness for any particular purpose of its index data. STOXX is not providing investment advice through the publication of the STOXX® indices or in connection therewith.
in particular, the inclusion of a company in an index, its weighting, or the exclusion of a company from an index, does not in any way reflect an opinion of STOXX on the merits of that company. financial instruments based on the STOXX® indices are in no way sponsored, endorsed, sold or promoted by STOXX. © STOXX limited. all rights reserved. .
4, is titled: “The rise of ‘Smart Beta’: does it Work, and how do You use it in Portfolios?” » Jun. 19, Hong kong Konrad Sippel, global head of Business development and executive director, speaks at the fT asset management Summit. . from china we take you to india, a country whose citizens are close to electing a new government. We talked to a fund manager at a leading asset management company to give us a better perspective on india’s eTf and mutual fund landscape. anubhav Srivastava, who manages 60 million uS dollars for motilal Oswal asset management, told us that indian investors are ready to add a bigger global component to their portfolios, which until now are focused on indian fixed income, indian equities and gold. HaRTMuT GRaf CeO, STOXX Limited dear readers, STOXX this month unveiled the chinese version of its name: STOXX 势拓. The first character “Shi” represents force, power and momentum.
The second one “Tuo” showcases the spirit of an innovator, a pioneer and an explorer. as we have expanded our commitment to Greater china, we have felt the growing importance of having a local version of our name. STOXX 势拓 embodies our spirit and values.
Our power of innovation has helped us immensely on our journey during the past 16 years. We start this issue with an interview of two people who were key in the process of coming up with the chinese version of our name. Their narratives offer glimpses into the difficulty of such an exercise and of course the sense of accomplishment that comes with a job well done. earlier this year, STOXX released a family of indices that select companies based on their altman Z-Scores. The STOXX Strong Balance Sheet index family bring to light darwin’s famous principle of “survival of the fittest” by including only those stocks that have the strongest balance sheets.
We asked angelika eibl, senior market development manager at STOXX, to write a column to explain this concept in more detail. risk and volatility still continue to confound and haunt investors. STOXX in march licensed the eurO STOXX low risk Weighted 100 index to State Street Global advisors (SSga). We spoke with matthew arnold, cfa, vice president at SSga, to get his views on low risk weighted strategies. i hope you enjoy this issue.
for comments and/or suggestions, please contact the editor rajiv Sekhri at rajiv.sekhri@stoxx.com regards, hartmut Graf, ceO, STOXX limited . STOXX launcheS chineSe verSiOn Of iTS name STOXX launcheS chineSe verSiOn Of iTS name The beginning of wisdom is To call Things by Their proper name. confucius STOXX ltd. this month launched the chinese version of its name , a process that has not only allowed us to deepen our impact in one of the world’s biggest and most important financial markets but also to give thought to what the business of indexing means in a country and a language that is infinitely different from english. SHIRLEY LOW STOXX Ltd. The conversion of a name from one language into another is a new creation of the same identity. There has to be melody and music that helps the name enter the memories of those who speak the language. 4 STOXX Pulse spoke to two people – Shirley low and marianne friese - who took on the task of finding an identity for STOXX in chinese. Shirley low is head of asia/Pacific for STOXX ltd.
marianne friese is head of marianne friese consulting Gmbh, a firm that helps companies find chinese names. She has helped nearly two dozen companies and brands find chinese names, including the world famous German party drink Jägermeister. . STOXX PuLSe – SPring 2014 SHIRLEY LOW you came up wiTh The vision ThaT sToXX needed an idenTiTy in chinese? can you Tell us whaT you had in mind? STOXX hired me in 2011 to set up its asia team. and right at the start of my career at STOXX, i knew the company needed a meaningful version of its name in chinese that symbolized the company’s value and mission in one of the world’s largest and upcoming financial markets. also, i wanted a name that would have simple chinese characters that are easy for people to recognize and remember. i have seen a few foreign companies that have entered Greater china with such difficult characters that people in china cannot recognize these characters. These companies failed to etch their brand and identity into the memories of chinese people. So that was definitely something i wanted to avoid. whaT were your ThoughTs regarding whaT The chinese name of sToXX should look like and sound like? diverse team.
Therefore 势, with its profound meaning, has a firm footing in our chinese name. With the first vocal of “ST”, a few characters came to my mind. One of my favorites was “Shi” 势, which signifies momentum and power and embodies the spirit of STOXX. and whaT abouT The second characTer? as a keen reader of the Sun Tze’s “art of War”, i favored 势 - momentum - as Sun Tze devoted one chapter in his masterful book to Shi and it shows how important this character (势) is. This word has a deeper meaning if you look closer at the different signs that it is made up of.
æ‰ – talent or human capital - is very important to our company and our values. We nurture and develop our human capital as we believe that our people will raise the company to a different global level. 力 – effort – signifies the passion to enter new territories and the hard work and effort needed to put together a global and With the first character fixed, the second character had to sound like an O.
“Tuo” æ‹“ came immediately to my mind to signify STOXX’s asia team as a pioneer in the asia/Pacific region. as the first team of STOXX in asia, we need to constantly innovate to enter into this new market successfully. if we do a more in-depth analysis of tuo” æ‹“, æ‰ – again emphasizes human capital and suggests that only if we work together as a strong team will we move 石 – rocks. combined with the first character 势, this gives us a strong momentum in innovation and exploration, which is the spirit of STOXX.
and with this strong spirit and sense of innovation, we aim to bring investors in this region many global and local investment innovations in the future. 5 . STOXX launcheS chineSe verSiOn Of iTS name 6 . 专 ä¸ æ•° STOXX Pulse – sPring 2014 å°† hence, The mosT imporTanT aspecT in creaTing a chinese name for sToXX was To find a name ThaT reflecTs The spiriT and mission of The company 欧 带 marianne friese how did you find ThaT balance? 势 æ‹“ MaRIannE fRIESE Marianne Friese Consulting so going from The names of people To naming companies? is iT a similar eXercise? MaRIannE fRIESE whaT is so differenT abouT a name in chinese raTher Than a name in say english or german? it is like earth and sky, the difference. in english you have names like Peter, Janet. But in chinese there are no names like that. You have to choose characters, which convey the meaning of a word – such as heaven, beauty or water – to create a name. most given names in chinese have one or two characters and family names generally have one character. So, for example, it is hard for a chinese person to comprehend that there are thousands of Janets in this world. let me explain with the name of STOXX. in a chinese context, STOXX is an artificial name.
The sound of the word stock or stocks does not apply or have meaning in chinese. hence, the most important aspect in creating a chinese name for STOXX was to find a name that reflects the spirit and mission of the company and at the same time this spirit and mission can be conveyed by chinese characters that are meaningful, resonant and melodious. and each character is pronounced differently in different parts of china.
hence the written name becomes critical because Simplified chinese, the written form, is the uniform written language of the country. So to find a name for STOXX, which was done by our team in china, we had to find in those 20,000 or so characters a name that was not too obvious, that was unique but also simple enough to be memorable. To find a good balance between these parameters is the hardest part of the task. What we did at first was to look at the competitive environment, who the players were in this sector in china, whether they use dual names etc. Such a check gives you an idea of what characters to avoid and also gives you an understanding of what kind of business environment exists for the company identity-wise in china. after this exercise we came up with a list of about 100 names. Then we clustered the names into groups of names that showed similarities.
and from these clusters we came up with a final list of about four names. from the 20,000 characters to the list of 100 to the final two, the process involved talking to men, women, bankers, writers, chinese literature experts, chinese people living in china, hong Kong and abroad, and many others to get their input and opinion on names. finally, it was mission critical that the name can still be registered in the respective categories.
hence, we did quite extensive pre-checks on this matter before submitting any suggestions. in the end, STOXX was pleased with the final list of four we suggested. STOXX was very actively involved in the process by checking with key contacts in china on their preferences regarding the names we suggested. Of course, STOXX was with us all the way, offering its input and ideas to the search for the name.
creating a chinese name is a great project to deliver – it takes experience and smarts from our end and good cooperation and trust from the client’s side.« 7 . The POrTfOliO Of an indian inveSTOr The POrTfOliO Of an indian inveSTOr anuBHaV SRIVaSTaVa Motilal Oswal 8 . STOXX PuLSe – SPring 2014 corpus needs to diversify and get into a much higher return than what we have right now. Therefore, there continues to be a lot of interest in middle- and low-level residential real estate and gold bullion – perceived inflation hedges. “Green ShOOTS” Seen in TermS Of indian inveSTOrS diverSifYinG GlOBallY as the world's largest democracy elects a new government, STOXX Pulse asked a fund manager with a leading asset management company in india to offer his perspective on indian investors and talk about the eTf and mutual fund landscape in india. anubhav Srivastava is senior vice president and fund manager, head of institutions and Product development, at motilal Oswal asset management, where he manages 60 million uS dollars in equities, fixed income and commodities. Srivastava has worked at motilal Oswal since October, 2010. Before that he was head of Quantitative finance at Syntel inc. he has a postgraduate diploma in management from the indian institute of management, ahemdabad and a master’s of Science in Quantitative finance from the university of Westminster. motilal Oswal is one of india’s leading asset management companies.
it is a subsidiary of motilal Oswal Securities ltd. whaT do indian invesTors lack in Their porTfolios? if you look at a classic indian investor portfolio, there is a massive concentration of indian fixed income, indian equities and then gold. now a pure concentration in indian equity and fixed income is actually a bit of a problem because given the volatile times we are in, especially during the last five years, what happened was that fixed income and equity tended to get highly correlated. and therefore, fixed income gets subjected to the kind of drawdown that equities are subjected to. That means the entire portfolio sinks. now let us put that in the perspective of retirement planning or other financial objectives. What we see is that coupled with 10% ongoing inflation there is a huge problem both in terms of risk and in terms of return. now the rule of thumb is that if 100 uS dollars goes down 20% to $80, it requires a 25% return to bring it back up.
But those returns are not what we have seen in the markets which have, by and large, been flat point-topoint in the past five to six years. and therefore investors have not been able to plan for retirement. fixed income yields have been running 8.5% to 9%, still below inflation. When you add to that the cost of investing, we’re talking about a required return rate close to 14%. investors are not getting a return of 14% a year.
instead, money is depreciating in real value. in the long run, what we are going to see is that people will not be able to plan their retirements. and this is more so the case with some of the pension funds that run in the country because they have just domestic equity and debt investment. now on the pension and insurance side, while there is not such a big asset liability mismatch, but there are still a couple of issues that come up.
first, is that many of these products which are heavily loaded with commission payout right up front, but you are starting out with a smaller corpus. ultimately, the returns are going to come from that corpus. Secondly, another five years down the line, this population dynamic of a very young workforce is going to flip.
it has already been happening over the past 10 years and it is going to be a big problem. and therefore that you Talk abouT a 14% reTurn so ThaT people can jusT abouT break even on Their invesTmenTs? is ThaT even possible? it requires equity. if you look at a pure domestic investment, probably it is not. long-term equity growth rates in india are 12% to 13%. depending on one’s selected timescale, if you buy and hold the equity for 10 years you might get something like that.
The only way to do this is to diversify internationally. and, of course, you have to select your investments appropriately. and what we see is that internationally, one of the benefits that result is that if the rupee depreciates then we get a better return.
So it defrays the cost of all these imported parts of the cPi, or the wholesale price index. So it provides a little bit of a hedge along with the returns in companies that are global leaders, which still have cash on their balance sheets and have a fair amount of growth going on. and it need not just be the tech sector, which is the first thing that comes to mind.
it is not just about Google, apple etc. but also about daimler, BmW, some of the other european companies which are quite a good investment right now. are invesTors, muTual funds and oTher pension funds in india willing To diversify aT This sTage ? as with all emerging markets, what tends to happen is that there is resistance among resident fund managers to go into the unknown. So you will see that the largest funds in india are broad equity funds, actively managed.
having said that there is a european fund being filed, but that is from the active side. also, a whole bunch of uS funds are available. my point is that any diversification strategy will need to look at international markets. investors are willing to, while insurance and pension managers have regulatory challenges. 9 .
any diversificaTion sTraTegy will need To look aT inTernaTional markeTs. anubhav srivasTava Whilst there is resistance, i see some green shoots in terms of people looking at diversifying globally. i think one of the challenges is that there are not enough products available in the indian market. You have hang Seng with a correlation of maybe 0.5 to the indian markets. The correlations to the nasdaq tend to be even lower.
But there is a whole other section, say europe or emerging markets, that is missing. and of the things we do need to take cognizance of is that a lot of these things will provide returns at different points unless there is a global economic meltdown of the 2008 variety. So choices that will help indian investors diversify are not available. can you give some color on The regulaTory environmenT for eTfs and muTual funds in india? also, is iT True ThaT you can only offer an eTf in india ThaT is based on an indeX ThaT is parT of an eXchange, such as The daX, Hang Seng or naSdaq? regulations in india are still evolving.
Our regulator SeBi is working very hard to globalize indian regulations as well as get some best practices from around the world. With respect to the issue that you cannot make an eTf in india based on non-exchange indices – to an extent that is true but it is not entirely true because our first eTf was a smart-beta product loosely based on the nifty. We also have approval for a cnX equal-weight index. The other issue may be that the government is a little hesitant to allow for large limits in terms of foreign investment via the mutual fund and eTf route in india as it might have an adverse impact on account deficits. But that is speculation because there is no formal policy to substantiate that statement. in terms of what the regulators will approve, because they have so few applications, regulatory appetite for these kinds of international products remains to be seen. But they will concretize regulations going forward.
indian equity eTfs are still very small compared to gold eTf products that are out there in the indian market. and the breadth GDP GROWTH EXPECTATIONS 4.7% of products that are available in the indian market is still limited. from a regulatory perspective, typically we are not allowed to do say leveraged products/ inverse products. and the commodities side of the spectrum is regulated by the fmc which has not approved anything other than gold as of yet for eTf investment. There are regulations right now that prevent large institutional investors from coming into the eTf market.
Just recently regulators issued a draft guideline that says that given certain terms and conditions insurance companies can invest into eTfs. This is a first step. Globally a large chunk of eTf investments are either 401K plans or they are largely institutional affairs, unlike india. is There also a hesiTaTion from The side of muTual fund companies in india To creaTe an eTf because There is no demand and noT much of a passive invesTing scenario in The counTry? i think that is more to do with the nature of mutual fund companies.
if you look at the BIGGEST CONCERN FOR ECONOMIC GROWTH 1.7% 1.9% 2.6% 12% 6.2% 23.1% National election results 32.4% 14.9% Lack of business and consumer conï¬dence Below 4% Domestic inflation and Reserve Bank of India (RBI) policy action Between 4% and 5% Between 5% and 6% 58.5% Between 6% and 7% Greater than 7% Domestic politics and corruption Global liquidity constraints 20.4% 21.6% FX currency risk and credit rating downgrade Global oil prices Source: Indian Association of Investment Professionals’ Annual Forecast Survey for ï¬scal year 2015. The survey had 431 participants from the country’s investment and ï¬nancial sector. 10 . STOXX PuLSe – SPring 2014 products that will allow them to get into the low volatility space and get a reasonable return by mixing asset classes. global scenario, a lot of asset management and mutual fund companies have clearly decided which side they want to be on. i think india is a bit behind on the curve, but we still see a lot of mutual fund companies that have one or two eTfs. and going forward, as the regulations become clearer and as demand picks up because of how the economy and the financial markets have been, i expect there to be a larger uptake/ issuance of eTfs. and not just basic eTfs, but you will see sectoral eTfs in a big way. We will also get into smart-beta type products though there could be some initiative coming straight from the exchanges and the index providers for developing these. What we have seen is that there is a big demand coming in from the retail and the middle segment of the market for asset allocation products. So independent financial advisors, private wealth management outfits as well as pure retail customers are looking at where do you see gdp growTh in india in 2014 and whaT impacT will The may general elecTion have on The counTry? in addiTion, can you also Talk abouT The huge amounT of household savings in india? in my view we are looking at 4.5% to 4.8% GdP growth in 2014, and, on the higher side maybe 5% to 5.3%. regarding household savings, there is about 400 billion uS dollars on the lower side in the country, which is purely put into bank deposits and is depreciating given that interest rates lag inflation.
Superimpose this with the fact that we have moved from a defined benefit pension scheme to a defined contribution pension scheme, this money has to move into more productive investments rather than simple and non-transparent bond investments. Those people who are actually at the forefront of helping manage this will be the asset management companies. right now there is a regulation that says that insurance companies and pension funds have to manage their own assets.
The view that is out there, is that insurance and pension funds should be doing what they do i.e. manage risk, whereas the asset management should be outsource to asset management companies and also to multiple managers which tends to diversify fund manager risk, house risk as well as get a whole new fresh set of ideas. With regard to the political scenario, yes it tends to be a worry but the kind of volatility we see now is normal given the elections and the budget. having said that, the country has identified what the problem areas are, such as infrastructure, governance.
The new government might take a little while, but the priorities for the new government are all set. furthermore, in terms of a mandate, whether somebody is going to get a clear mandate or not, i would go with the latter. if the mandates are not clear that may prove to be a slight hindrance but, on the other hand, if everybody gets on board and does their job well, we could get 80% of the problems sorted and our growth rates would see a fair amount of acceleration in the coming years. valuations today are reasonable and we are looking at a market that has been under bought. Therefore, the next two to three years might just be good ones for indian markets. « 11 .
STOcK marKeT darWiniSm STOcK marKeT darWiniSm 12 . STOXX PuLSe – SPring 2014 STOXX STrOnG Balance SheeT indiceS: a familY ThaT SelecTS The financiallY fiTTeST cOmPanieS STOXX ltd. launched an index family earlier in 2014 that selects companies based on their altman Z-Score. STOXX Pulse asked angelika eibl, senior market development manager at STOXX, to write a commentary about this index family and what it offers investors. history holds plenty of examples of successful species that became extinct after failing to adapt to significant changes in their environment. The dodo, for instance, was a friendly flightless bird about three feet tall that was native to mauritius.
after thousands of years of successfully populating a place where he had no natural enemies, the dodo was extinct a mere 60 years after the first dutch ship reached the island. Being fearless and wingless, the bird wasn’t exactly well-equipped to survive the arrival of hungry sailors. anGELIka EIBL STOXX Ltd. iT is noT The sTrongesT or The mosT inTelligenT who will survive buT Those who can besT manage change. charles darwin Similarly, some companies are clearly better positioned than others to successfully adapt to an ever-changing market environment. high debt levels don’t bode well in the mid and long term, for instance. let’s look at the example of arcandor, which prior to its bankruptcy owned Germany’s iconic department store chain Karstadt.
in 2006, arcandor raised a reported 4.5 billion euros through the sale and leaseback of the majority of its properties. commonly, the idea behind a sales and leaseback is to free up cash from low yielding real estate and invest it at a positive spread into the higher yielding operating business. Yet arcandor did the opposite, fully financing the majority of its department stores at rapidly increasing rates that soon steeply exceeded the firm’s operating margin.
By 2008, rents amounted to 15% to 20% of revenue in several major cities1, or a multiple of the single-digit margins that are common in Germany’s fiercely competitive retail market. By december 2008, its total liabilities exceeded its market cap by over 12 billion euros, or 2,300%. in June 2009, arcandor filed for bankruptcy protection after its request for loan guarantees was rejected by the German government.
arcandor’s management made the case that the firm had become a hapless casualty of the credit crunch and the economic contraction, both of which doubtlessly accelerated the firm’s downfall. Yet in hindsight, the firm’s inapt, possibly reckless financial engineering had been bound to sooner or later cause serious trouble. Starting from the premise that there should be features that allow investors to systematically and quantitatively discern among companies that are well-placed to survive ever-changing markets versus companies in danger of perishing, Professor edward i. altman from new York university’s Stern School of Business performed extensive research in the late 1960s2.
in his pioneering work, he used the technique of linear discriminant analysis to develop a simple yet powerful metric which would gauge a stock’s near- and mid-term default risk using readily available data from corporate balance sheets and income statements. 1 Source: "club der millionäre", der Spiegel, 25/2009 2 "financial ratios, discriminant analysis and the Prediction of corporate Bankruptcy”, altman (1968) 13 . STOcK marKeT darWiniSm This metric is called the altman Z-Score. Popular and widely used among practitioners, the score measures the financial health of a company using the weighted sum of five financial ratios relating to liquidity, profitability, market return, debt and revenues Z-Score=1.2X1+1.4X2+3.3X3+0.6X4+1.0X5 where X1 = working capital/total assets X2 = retained earnings/total assets X3 = earnings before interest and tax/ total assets X4 = market value of equity/book value of debt X5 = sales/total assets 3 4 5 6 altman determined that companies with Z-Scores of 3.0 and higher are very likely to stay in business over a two-year time horizon, whereas companies with Z-Scores of 1.8 and smaller have significant default risk over the same period.3 in between these two values, the lines are blurred and a reliable classification cannot be made. The model of the Z-Score was originally designed only for manufacturing companies and was later extended to all industries ex financials. That’s because altman determined through quantitative research in the 1960s what the world learned from the media post-2007: financial firms’ reporting is prone to hiding meaningful information, such as off-balance sheet activities and refinancing risks. as a result, accounting- based metrics such as the Z-Score are less reliable, even meaningless when applied to financials. altman’s research found the Z-Score to correctly predict bankruptcies of nonfinancials two years before the event in 72% of cases, with an “all-clear” falsely being given in 6% of cases (type ii error). later tests have found the model to even be 80% to 94%4 correct in predicting bankruptcy ahead of time. Over time, researchers have further found that the Z-Score not only predicts distress with a high degree of accuracy but is also a useful tool in gauging the likelihood of outperformance of a given stock5.
carter and hofer for instance investigated a variety of common performance metrics and found the Z-Score to provide the greatest relative information about the market-adjusted return to shareholders6. for reference: as of June 2008, the ill-fated German retailer arcandor had an altman Z Score of -0.1 (Source: Bloomberg) “Prediction of corporate Bankruptcy from 2008 Through 2011”, li (2012) “a Study of the efficacy of altman’s Z To Predict Bankruptcy of Specialty retail firms doing Business in contemporary Times”, hayes et al. (2010) “measuring organizational performance: metrics for entrepreneurship and strategic management research”, carton, hofer (2006) 14 . STOXX PuLSe – SPring 2014 Broad, liquid representation of a given market as evidenced by high correlation and low tracking error to the underlying base index Outperformance through higher return as well as reduced volatility Downside protection through reduced maximum drawdown Going back to our analogy from evolutionary theory, one can say: a species that due to its high degree of adaptability is particularly likely to persist is likely to do better than other species even in the absence of major environmental changes. This is evolutionary theory at its best. We have found that what holds true in nature applies equally well to the stock market. Through the STOXX Strong Balance Sheet index family, we offer our clients an index methodology that filters out any stocks that are not suited for survival. The concept is as straightforward as it is powerful: for a given universe, the pertinent STOXX Strong Balance Sheet index contains only stocks with a threeyear track record of Z-Scores of 3.5 and higher.
financial firms are excluded from the universe. further, stocks must pass an adaptive liquidity screen (95% of the most liquid stocks in a universe qualify) that has a fixed, region-specific floor of typically around the local currency equivalent of 5 million uS dollars in average daily trading volume. There are two index versions: one is weighted by free-float market cap subject to a 10% cap at the component level.
The second version is equally weighted. The index is reviewed annually in September and rebalanced quarterly. The chart and table shows the key figures and return of the STOXX Global Strong Balance Sheet index versus its benchmark, the STOXX Global 1800. furthermore, a factor analysis reveals excess returns are most strongly driven by the overweighting of companies with little leverage. This finding quantitatively confirms the intuition that if there is one thing that limits a company’s flexibility to adapt to changes in the market and makes it prone to distress, that is high levels of debt. True to its premise, the STOXX Strong Balance Sheet index family succeeds in achieving the following: in conclusion, we offer to our clients an index family that successfully adopts darwin’s famous principle of the “survival of the fittest” by excluding all but those stocks with the strongest balance sheets as measured by their respective Z-Scores. empirically, such stocks are more adaptive to ever-changing markets, create excess return and mitigate downside risk.
Since the STOXX Strong Balance Sheet index family is broadly diversified and thus representative of the underlying market, it is ideally suited to replace traditional ex financial indices and strategies. in addition, the index family can be used to derive long only, “130-30” or market neutral satellite strategies to produce excess return.« STOXX GLOBaL STROnG BaLancE SHEET InDEX OuTpERfORMS BEncHMaRk 180 160 140 120 100 80 60 40 Sep. 2007 Sep.
2008 Sep. 2009 Sep. 2010 Sep.
2011 STOXX Global Strong Balance Sheet Sep. 2012 Sep. 2013 STOXX Global 1800 STOXX Global Strong Balance Sheet # positions ff market cap in uSd tn Total no.
of defaults return, annualized volatility, annualized maximum drawdown STOXX Global 1800 376 1800 9.9 0 7.0% 17.8% -47.7% 32.9 11 1 2.8% 20.1% -58.2% numbers computed using STOXX gross returns in uSd over period from Sep. 24, 2007 to feb. 28, 2014 unless labelled otherwise 1 General motors corp., arcandor aG, landsbanki islands hf., Glitnir banki hf., Kaupthing Bunadarbanki hf., Washington mutual inc., General Growth Properties inc., lehman Brothers holdings inc., Japan airlines corp., SinO-fOreST, elpida memory inc. 15 .
dOWnSide PrOTecTiOn dOWnSide Pr TecTiOn STOXX Pulse spoke with matthew arnold, cfa, vice president at SSga and a senior eTf strategist within SPdr eTf Strategy & consulting Group. We asked him about low risk weighted strategies in particular and the broader realm of low volatility investing. MaTTHEW aRnOLD SSgA Prior to joining SSga in 2009, arnold worked at fortis investments (previously aBn amrO asset management). he has worked in the financial services industry since 1997 and holds a Bachelor’s of commerce and post-graduate diploma in commerce in finance from the university of Otago in new Zealand. why do invesTors use risk-weighTed sTraTegies? inveSTOrS Of all STriPeS SeeK lOW riSK, lOW vOlaTiliTY inveSTmenT STraTeGieS STOXX ltd. in march licensed the eurO STOXX low risk weighted 100 index to State Street Global advisors (SSga) for an eTf.
The index selects those 100 stocks in the eurO STOXX index which showed the lowest volatility over the past year, thus offering eurozone exposure with the least possible portfolio volatility. 16 We think there are a number of reasons why an increasing number of investors use risk-weighted or low volatility equity strategies within their portfolios. firstly, with two very painful equity bear markets since 2000, investors of all types – from retail ‘mom and pops’ through to the most sophisticated pension funds – have been looking for fully invested strategies that offer the prospect of some downside protection. most low volatility strategies have, historically at least, experienced lower drawdowns than the broad, capweighted indices that are commonplace in the industry today. and, as the name suggests, they have also experienced lower price volatility than broad market indices.
Secondly, there is an increasing body of evidence that lower volatility stocks have in fact outperformed higher volatility stocks over the long term. So some investors have increased their allocations to low volatility stocks with the aim of outperforming the broad market over time. While it remains to be seen whether this “anomaly” continues, we think demand will grow given the favorable drawdown and risk characteristics of low volatility or riskweighted strategies. why do you Think using an alTernaTive weighTing sTraTegy – such as weighTing componenTs on Their level of risk – makes sense? We think alternatively weighted equity strategies are appropriate for a range of investors.
income-oriented investors, for example, might benefit from strategies which weight stocks based on dividend yield rather than market cap, while private investors and pension funds might find the reduced absolute risk of low volatility approaches attractive in today’s environment. ultimately, developments within the beta management world are allowing investors to build portfolios that more closely align with their investment goals. This can only be a good thing. whaT are The mosT imporTanT ingredienTs a risk-weighTed indeX should have? and, in your opinion, do indeX providers offers riskweighTed indices ThaT offer invesTors whaT They are looking for? .
STOXX PuLSe – SPring 2014 as one of the world’s largest institutional investment managers, with passive equity assets exceeding 1 trillion uS dollars, we think index construction is a vitally important element of beta management. as the majority of SPdr eTfs are passive vehicles, selecting the right index to track is a key part of building a successful eTf. One of the great things about eTfs is their inherent transparency, so where possible, we think index providers should be equally transparent in the methodology behind their indices. in the case of riskweighted or low volatility indices we were attracted to relative simplicity of the eurO STOXX low risk Weighted 100 index - where stocks are weighted based on trailing 12-month price volatility alone - and thought it particularly suitable for a benchmark for a SPdr eTf providing exposure to low volatility eurozone stocks. There are also indices which attempt to provide exposure to a similar beta, but do so through building a minimum variance portfolio subject to various constraints (such as maximum and minimum sector weights). This is also a valid approach, and may be more appropriate for some investors, but ultimately we felt the straightforward and easy to understand approach of the STOXX index provided investors with a pure play on the least volatile stocks within the eurozone. do you Think invesTor inTeresT in low risk, low volaTiliTy, and minimum variance sTraTegies rose as a resulT of The financial crisis? why or why noT? also, do you Think invesTor inTeresT in such sTraTegies is here To sTay, or is This jusT a passing phase? EuRO STOXX LOW RISk WEIGHTED 100 OffERS a BETTER RISk-RETuRn pROfILE THan BEncHMaRk 250 200 150 100 50 0 dec.
03 aug. 05 apr. 07 dec.
08 eurO STOXX low risk Weighted 100 aug. 10 apr. 12 dec.
13 eurO STOXX EuRO STOXX Low Risk Weighted 100 Performance (annualized) 1 volatility (annualized) maximum drawdown Sharpe ratio 2 EuRO STOXX 5.8% 14.8% 53.2% 0.35 2.8% 21.0% 61.8% 0.16 1 STOXX daily data for eur Price return indices from mar. 19, 2001 to apr. 30, 2014.
Key figures have been calculated as annualized figures 2 eOnia used as risk-free asset in calculation of Sharpe ratio There is no doubt that interest has grown due to the experience of the last 15 years or so. The recent global financial crisis was particularly painful for equity oriented investors as was the tech and telecom crash of the early 2000s. So it is natural that there is increased interest in strategies that offer the prospect of reduced drawdowns and lower volatility. With pension funds in “de-risking” mode in much of the world, any strategy that can help reduce risk is likely to be of interest.
as to whether this is a passing phase or not, we actually think low volatility strategies are here to stay. undoubtedly demand will wax and wane depending on market conditions, but the desirable characteristics of a low volatility approach seem likely to appeal to a range of investors now and into the future. any oTher issues you may wanT To discuss abouT low volaTiliTy or low risk weighTed sTraTegies? as with most things investment-related, we believe investors should conduct thorough due diligence before adopting a low volatility or risk-weighted approach. While the evidence points to a low volatility premium in many markets, there is certainly no guarantee that this will persist into the future. Before adopting an approach that targets low volatility stocks, investors should identify what it is they are trying to do. are they trying to outperform the broad market over time, or are they trying to alter the risk characteristics of their portfolio? if it is the former, they should be prepared to give the strategy some time.
low volatility stocks tend to be of higher quality than high volatility stocks, so almost by definition any strategy that targets these types of stocks will tend to underperform in strong, cyclical market rallies like we saw in 2013. also, low volatility strategies tend to be fairly concentrated in certain sectors, so again, investors should be comfortable with the bets they are taking. While increasing in popularity, it should also be noted that low volatility strategies are still a little unconventional, so investors should ensure full buy-in from their investment committees or end clients.« 17 . feaTured indiceS FeATureD inDiCeS 52-WEEk pERfORMancE 19.2% YEaR-TO-DaTE pERfORMancE 0.8% THREE-YEaR pERfORMancE 33.6% STOXX Global 1800 minimum variance STOXX Global 1800 minimum variance unconstrained STOXX Global Select dividend 100 STOXX Global maximum dividend 40* 11.5% 9.4% 15.3% 24.2% 3.8% 4.4% 5.3% 5.3% 42.1% 41.0% na 17.8% STOXX Europe 600 26.7% 2.6% 26.7% STOXX europe 600 minimum variance STOXX europe 600 minimum variance unconstrained STOXX europe Select dividend 30* STOXX europe maximum dividend 40 STOXX europe 600 equal Weight STOXX europe low risk Weighted 100 17.7% 20.0% 24.8% 33.3% 32.2% 20.1% 2.5% 4.8% 4.2% 5.0% 4.1% 3.2% 32.1% 32.5% 9.9% 33.2% 28.6% 39.5% EuRO STOXX 50 35.0% 3.1% 17.0% eurO STOXX minimum variance eurO STOXX minimum variance unconstrained eurO STOXX Select dividend 30 eurO STOXX 50 equal Weight eurO STOXX 50 low risk Weighted 18.6% 16.9% 36.4% 38.0% 34.0% 3.9% 2.9% 7.5% 3.6% 3.0% 24.7% 34.7% 11.7% 16.3% 18.6% STOXX Global 1800 STOXX asia/pacific 600 4.5% -2.7% 17.1% STOXX asia/Pacific 600 minimum variance STOXX asia/Pacific 600 minimum variance unconstrained STOXX asia/Pacific Select dividend 30* STOXX asia/ Pacific maximum dividend 40* STOXX aSean-five Select dividend STOXX east asia 80 -1.4% 0.4% 2.0% 15.3% -1.9% 8.8% 1.0% 3.4% 5.8% 8.6% 3.3% -1.7% 25.3% 25.9% 34.5% 26.9% 25.1% 15.1% STOXX china a 50 -8.9% -5.4% -21.3% STOXX china a 50 equal Weight -9.5% -6.5% -25.1% 1.1% 6.9% 19.3% -4.0% -7.7% 7.1% 7.0% 6.3% 17.4% STOXX australia 150 STOXX australia 150 minimum variance STOXX australia 150 minimum variance unconstrained 18 . STOXX PuLSe – SPring 2014 52-WEEk pERfORMancE STOXX north america 600 YEaR-TO-DaTE pERfORMancE THREE-YEaR pERfORMancE 20.0% 1.0% 43.0% STOXX north america 600 minimum variance STOXX north america 600 minimum variance unconstrained STOXX north america maximum dividend 40* STOXX north america Select dividend 40* 15.1% 12.2% 12.3% 12.8% 4.0% 3.9% 5.2% 5.2% 49.2% 53.0% 48.8% 36.3% STOXX uSa 900 21.0% 0.8% 46.5% STOXX uSa 900 minimum variance STOXX uSa 900 minimum variance unconstrained 14.0% 10.3% 2.3% 4.4% 44.7% 56.1% STOXX canada 240 10.4% 3.4% -1.6% 8.5% 7.7% 1.5% 1.9% 16.1% 24.9% STOXX canada 240 minimum variance STOXX canada 240 minimum variance unconstrained all indices are in uSd Gross return versions, except the ones marked with *, which are in uSd net return versions Source: STOXX data as of apr. 9, 2014 19 . cOnTacTS VOL 3/iSSue 1 – SpRInG 2014 Printed in may 2014 Selnaustrasse 30 ch-8021 Zurich P +41 (0)58 399 5300 stoxx@stoxx.com www.stoxx.com frankfurt: +49 (0)69 211 13243 hong Kong: +852 6307 9316 london: +44 (0)20 7862 7680 madrid: +34 (0)91 369 1229 new York: +1 212 669 6426 Stockholm: +46 (0)8 4600 6090 STOXX is part of Deutsche Börse and SIX This newsletter contains opinions and statements from various information providers. STOXX limited does not represent or endorse any of these views or opinions and does not vouch for their accuracy or reliability. The views expressed by the information providers in this newsletter are their own views and do not reflect the views and opinions of STOXX limited. STOXX® indices are protected through various intellectual property rights. ‘STOXX’, ‘eurO STOXX 50’ and ‘iSTOXX’ are registered trademarks.
The use of the STOXX® indices for financial products or for other purposes requires a license from STOXX. STOXX does not make any warranties or representations, expressed or implied with respect to the timeliness, sequence, accuracy, completeness, currentness, merchantability, quality or fitness for any particular purpose of its index data. STOXX is not providing investment advice through the publication of the STOXX® indices or in connection therewith.
in particular, the inclusion of a company in an index, its weighting, or the exclusion of a company from an index, does not in any way reflect an opinion of STOXX on the merits of that company. financial instruments based on the STOXX® indices are in no way sponsored, endorsed, sold or promoted by STOXX. © STOXX limited. all rights reserved. .