


Description
FUNDAMENTALS
January 2015
There’s Diversity in Value
Brent Leadbetter, CFA, and John West, CFA
John West, CFA
“
Market inefficiencies
have existed as long
as there have been
markets.
“
KEY POINTS
1.
The excess returns captured by a
value style index and a fundamentally weighted strategy have low
cross correlations across 11 of the
world’s largest economies and 16
major asset classes.
2.
A simulated market-neutral portfolio with long positions in fundamentally weighted indices and short
positions in cap-weighted indices
generates a high Sharpe ratio.
3.
A global long-short strategy that
employs fundamental weighting
can be seen as a diversifying asset
with the potential to improve longterm risk-adjusted returns.
In team sports like basketball, the whole
can be greater than the sum of the parts if
individual players—even those who are not
of All Star caliber on their own—complement
one another. This was clearly demonstrated in
last year’s NBA finals when the San Antonio
Spurs beat the Miami Heat with their “big
three” superstars. Commentators seemed to
spend as much time describing the way the
Spurs organization had been built as they did
praising their players. Tim Duncan has played
well ever since he was the first pick in the
1997 draft.
Tony Parker breaks down defenses with his quick dribble. Boris Diaw excels as a passer. Manu Ginobili provides a spark off of the bench.
Tiago Splitter rebounds. Kawhi Leonard defends against the other team’s best player. Danny Green hits corner threes, and so on. The Spurs have perfected a winning formula, signing quality players to fill complementary roles. The San Antonio Spurs’ proven strategy of utilizing complementary capabilities can also be employed in constructing investment portfolios.
Asset classes that perform well in isolation can be promising as stand-alone options, but they become far more attractive when combined with others whose strengths are dissimilar. In investing, as in team sports, diversification makes it possible to excel regardless of the competition and the playing conditions. That’s a platitude.
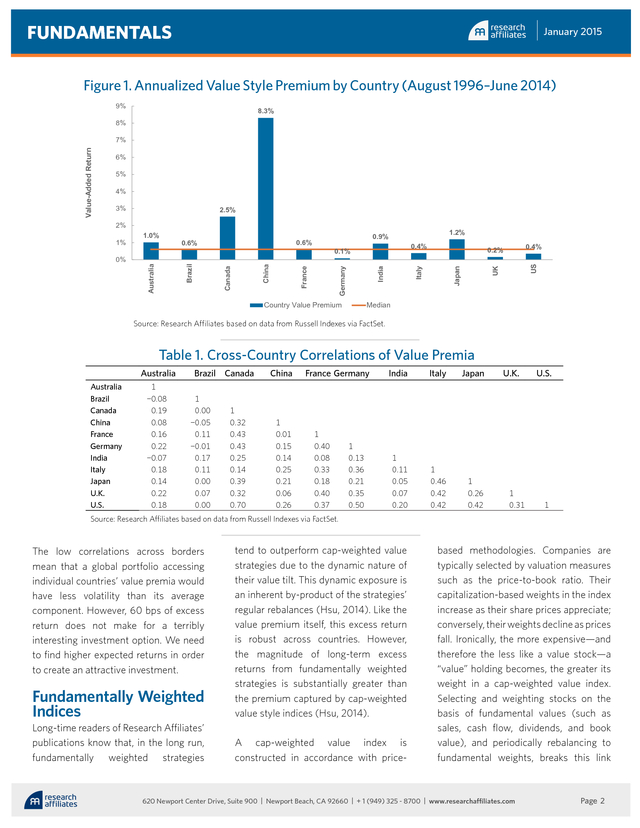
But we take another step and propose that the wellestablished value premium can be considered a diversifying asset class. Global Value Premia The existence of a value premium, most notably documented by Fama and French (1992), is widely accepted. Further, the value premium is robust across countries. Figure 1 shows the annualized value premium, as measured by the excess returns of longonly capitalization-weighted value equity indices over long-only cap-weighted core equity indices, for 11 of the world’s 12 largest economies (Arnott, 2007; West, 2011).
The median value premium is 60 bps, and none of the markets exhibits a negative value premium over the period from August 1996 to June 2014. A correlation matrix (Table 1) using the same monthly return time series shows that the excess returns attributable to these country-specific value premia are far less than perfectly correlated. The average cross correlation is only 0.21. Interestingly, the highest correlations belong to some of the largest developed countries. It should not be a surprise, given the size of its equity market, that the United States has the largest average correlation (0.34) with other countries’ value premia. Canada is not far behind at 0.32. The other countries with correlations above 0.2 are also developed markets.
In contrast, Australia and the emerging markets (Brazil, India, and China) exhibit the lowest average correlations. Media Contact Hewes Communications + 1 (212) 207-9450 hewesteam@hewescomm.com . FUNDAMENTALS January 2015 Figure 1. Annualized Value Style Premium by Country (August 1996–June 2014) 9% 8.3% 8% 6% 5% 4% 3% 2.5% 2% Japan Italy India Germany Country Value Premium 0.2% 0.4% US 0.4% 0.1% France China Canada 1.2% 0.9% 0.6% 0.6% Brazil 0% 1.0% Australia 1% UK Value-Added Return 7% Median Source: Research Affiliates based on data from Russell Indexes via FactSet. Table 1. Cross-Country Correlations of Value Premia Australia Australia Brazil Canada China France Germany India Italy Japan U.K. U.S. 1 -0.08 0.19 0.08 0.16 0.22 -0.07 0.18 0.14 0.22 0.18 Brazil Canada 1 0.00 -0.05 0.11 -0.01 0.17 0.11 0.00 0.07 0.00 1 0.32 0.43 0.43 0.25 0.14 0.39 0.32 0.70 China 1 0.01 0.15 0.14 0.25 0.21 0.06 0.26 France Germany 1 0.40 0.08 0.33 0.18 0.40 0.37 1 0.13 0.36 0.21 0.35 0.50 India Italy Japan 1 0.11 0.05 0.07 0.20 1 0.46 0.42 0.42 1 0.26 0.42 U.K. 1 0.31 U.S. 1 Source: Research Affiliates based on data from Russell Indexes via FactSet. The low correlations across borders mean that a global portfolio accessing individual countries’ value premia would have less volatility than its average component. However, 60 bps of excess return does not make for a terribly interesting investment option.
We need to find higher expected returns in order to create an attractive investment. Fundamentally Weighted Indices Long-time readers of Research Affiliates’ publications know that, in the long run, fundamentally weighted strategies tend to outperform cap-weighted value strategies due to the dynamic nature of their value tilt. This dynamic exposure is an inherent by-product of the strategies’ regular rebalances (Hsu, 2014). Like the value premium itself, this excess return is robust across countries.
However, the magnitude of long-term excess returns from fundamentally weighted strategies is substantially greater than the premium captured by cap-weighted value style indices (Hsu, 2014). A cap-weighted value index is constructed in accordance with price- based methodologies. Companies are typically selected by valuation measures such as the price-to-book ratio. Their capitalization-based weights in the index increase as their share prices appreciate; conversely, their weights decline as prices fall.
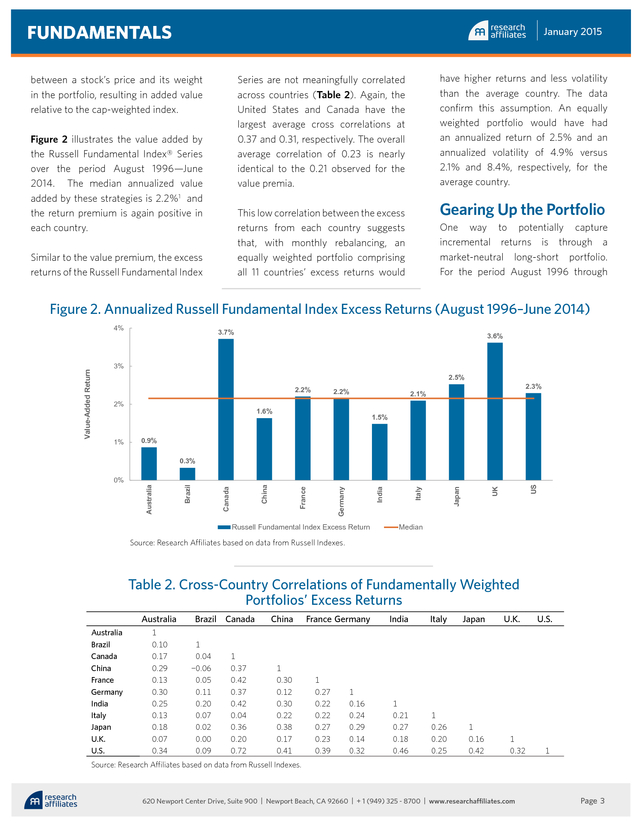
Ironically, the more expensive—and therefore the less like a value stock—a “value” holding becomes, the greater its weight in a cap-weighted value index. Selecting and weighting stocks on the basis of fundamental values (such as sales, cash flow, dividends, and book value), and periodically rebalancing to fundamental weights, breaks this link 620 Newport Center Drive, Suite 900 | Newport Beach, CA 92660 | + 1 (949) 325 - 8700 | www.researchaffiliates.com Page 2 . FUNDAMENTALS January 2015 between a stock’s price and its weight in the portfolio, resulting in added value relative to the cap-weighted index. have higher returns and less volatility than the average country. The data confirm this assumption. An equally weighted portfolio would have had an annualized return of 2.5% and an annualized volatility of 4.9% versus 2.1% and 8.4%, respectively, for the average country. Series are not meaningfully correlated across countries (Table 2). Again, the United States and Canada have the largest average cross correlations at 0.37 and 0.31, respectively.
The overall average correlation of 0.23 is nearly identical to the 0.21 observed for the value premia. Figure 2 illustrates the value added by the Russell Fundamental Index® Series over the period August 1996—June 2014. The median annualized value added by these strategies is 2.2%1 and the return premium is again positive in each country. Gearing Up the Portfolio This low correlation between the excess returns from each country suggests that, with monthly rebalancing, an equally weighted portfolio comprising all 11 countries’ excess returns would Similar to the value premium, the excess returns of the Russell Fundamental Index One way to potentially capture incremental returns is through a market-neutral long-short portfolio. For the period August 1996 through Figure 2. Annualized Russell Fundamental Index Excess Returns (August 1996–June 2014) Value-Added Return 4% 3.7% 3.6% 3% 2.5% 2.2% 2% 1% 2.2% 1.6% 2.3% 2.1% 1.5% 0.9% Russell Fundamental Index Excess Return US UK Japan Italy India Germany France China Canada Brazil 0% Australia 0.3% Median Source: Research Affiliates based on data from Russell Indexes. Table 2.
Cross-Country Correlations of Fundamentally Weighted Portfolios’ Excess Returns Australia Australia Brazil Canada China France Germany India Italy Japan U.K. U.S. 1 0.10 0.17 0.29 0.13 0.30 0.25 0.13 0.18 0.07 0.34 Brazil Canada 1 0.04 -0.06 0.05 0.11 0.20 0.07 0.02 0.00 0.09 1 0.37 0.42 0.37 0.42 0.04 0.36 0.20 0.72 China 1 0.30 0.12 0.30 0.22 0.38 0.17 0.41 France Germany 1 0.27 0.22 0.22 0.27 0.23 0.39 1 0.16 0.24 0.29 0.14 0.32 India Italy Japan 1 0.21 0.27 0.18 0.46 1 0.26 0.20 0.25 1 0.16 0.42 U.K. 1 0.32 U.S. 1 Source: Research Affiliates based on data from Russell Indexes. 620 Newport Center Drive, Suite 900 | Newport Beach, CA 92660 | + 1 (949) 325 - 8700 | www.researchaffiliates.com Page 3 . FUNDAMENTALS weighted strategies and short capweighted indices will not necessarily experience a similar decline in riskadjusted returns due to low rates and high valuations. “ In investing, as in basketball, diversification makes it possible to excel. Table 3 shows how the market-neutral long–short strategy would have performed in comparison with asset class returns over the same period. For reference, “first pillar” asset classes include developed market equities; “second pillar,” mainstream fixedincome strategies; and “third pillar,” diversified inflation hedges such as emerging market stocks, emerging market bonds, and high yield bonds. As a stand-alone option, this global market-neutral long–short portfolio would have generated a Sharpe ratio superior to that of first pillar equities but below those of second and third pillar assets. Present-day yields and valuation levels will make it challenging for both stocks and bonds to replicate the returns realized in the declining rate environment reflected in Table 3’s historical timeframe. However, a portfolio that is long fundamentally “ June 2014, a simulated portfolio with equal exposures to long positions in fundamentally weighted indices in each of the 11 countries, and short positions in the corresponding cap-weighted indices, would have generated an annualized return of 5% and an annualized volatility of 5%.
This outcome would have generated an attractive Sharpe ratio of 0.52.2 January 2015 The value added by rebalancing strategies is based on the presence of mispricing in the market, not the level of yields and valuations. Investors can reasonably expect rebalancing strategies to remain advantageous over the long term unless markets become perfectly efficient—an improbable development, given that market inefficiencies have existed as long as there have been markets! And if the added value persists, so will the magnitude of the Sharpe ratio. Observe, too, that this portfolio’s hypothetical returns reflect a simple approach utilizing broadly diversified indices backed by collateral earning only the risk-free rate of return. Several other ways to enhance returns come to mind.
In the long portfolio, including only the largest active positions in fundamentally weighted indices (relative to cap-weighted indices) might result in more concentrated exposure to the companies most responsible for the excess returns. Actively managing the fixed-income collateral would offer the possibility of outperforming the return on cash. Either of these changes would likely increase the already attractive Sharpe ratio of 0.52.
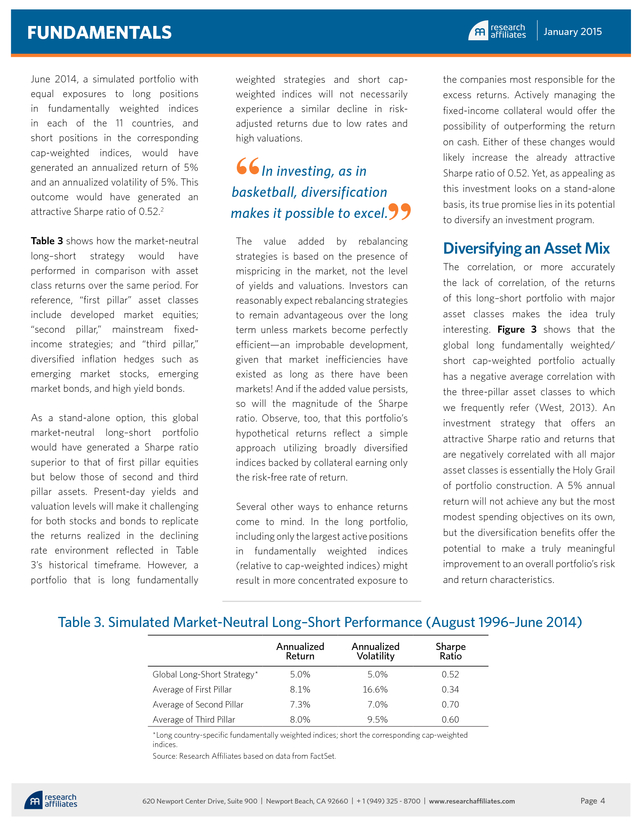
Yet, as appealing as this investment looks on a stand-alone basis, its true promise lies in its potential to diversify an investment program. Diversifying an Asset Mix The correlation, or more accurately the lack of correlation, of the returns of this long–short portfolio with major asset classes makes the idea truly interesting. Figure 3 shows that the global long fundamentally weighted/ short cap-weighted portfolio actually has a negative average correlation with the three-pillar asset classes to which we frequently refer (West, 2013). An investment strategy that offers an attractive Sharpe ratio and returns that are negatively correlated with all major asset classes is essentially the Holy Grail of portfolio construction.
A 5% annual return will not achieve any but the most modest spending objectives on its own, but the diversification benefits offer the potential to make a truly meaningful improvement to an overall portfolio’s risk and return characteristics. Table 3. Simulated Market-Neutral Long–Short Performance (August 1996–June 2014) Annualized Return Annualized Volatility Sharpe Ratio Global Long-Short Strategy* 5.0% 5.0% 0.52 Average of First Pillar 8.1% 16.6% 0.34 Average of Second Pillar 7.3% 7.0% 0.70 Average of Third Pillar 8.0% 9.5% 0.60 *Long country-specific fundamentally weighted indices; short the corresponding cap-weighted indices. Source: Research Affiliates based on data from FactSet. 620 Newport Center Drive, Suite 900 | Newport Beach, CA 92660 | + 1 (949) 325 - 8700 | www.researchaffiliates.com Page 4 . FUNDAMENTALS January 2015 Figure 3. Sharpe Ratios and Average Cross Correlations 1.75 Core Fixed Income 1.50 1.25 Sharpe Ratio TIPS 1.00 Bank Loans Long Treasury Local Curr EM Bonds Long Credit High Yield EM Bonds 0.75 Convertibles Long Fund'l/Short Cap REITs 0.50 Large Cap US Equities Small Cap US Equities Developed ex US Equities 0.25 EM Equities Commodities 0.00 -0.20 -0.10 0.00 0.10 0.20 0.30 0.40 0.50 Average Correlation to the Three-Pillar Asset Classes Source: Research Affiliates based on data from from FactSet. None of the asset classes has a negative average cross correlation, even after we include the global long–short portfolio. A portfolio comprised 50% of first-pillar developed equities, 30% second-pillar mainstream bonds, and 20% third-pillar inflation hedges already contains considerably more global diversification, more inflation protection, and less reliance on equity market beta than the average simulated three-pillar investment portfolio. As a result, it hypothetically generates attractive performance over the same measurement period we have been considering.
However, as shown in Table 4, introducing a 10% allocation to the global market-neutral portfolio would have improved the risk-adjusted performance even of the 50/30/20 portfolio. Thus, adding this global market-neutral strategy has the potential to increase the Sharpe ratio of even the most diversified portfolios. With today’s low yields and correspondingly modest expected returns for mainstream stocks and bonds, such further diversification may never have been more reasonable. range. A team composed solely of Boris Diaws would probably be unsuccessful, but the San Antonio Spurs leaned heavily on Diaw on their way to last year’s NBA championship.
He had a specific role in which he fittingly complemented his teammates’ skills. In Closing A portfolio comprising long positions in individual fundamentally weighted country indices and short positions in capweighted country indices might prove to be the Boris Diaw of a diversified portfolio. Investors would be unlikely to meet their return targets by concentrating all their assets in such a strategy. However, given its high Sharpe ratio and low correlation with widely used asset classes, it seems a suitable addition to a robust asset mix. In isolation, Boris Diaw is an aboveaverage basketball player. As a power forward, he has the ability to rebound and score around the basket.
However, because of his unique skill set, he truly shines as part of a team. He is large enough to guard post players, yet he has the situational awareness necessary to be a great passer and the sure touch necessary to be a threat from three-point Table 4. Diversifying a Three-Pillar Portfolio (August 1996−June 2014) Annualized Return 50/30/20 45/27/18/10* Annualized Volatility Sharpe Ratio 8.2% 10.2% 0.57 7.9% 9.0% 0.61 *45% first pillar, 27% second pillar, 18% third pillar, and 10% global market-neutral long fundamentally weighted/short cap-weighted. Source: Research Affiliates based on data from FactSet. 620 Newport Center Drive, Suite 900 | Newport Beach, CA 92660 | + 1 (949) 325 - 8700 | www.researchaffiliates.com Page 5 .
FUNDAMENTALS Endnotes 1. 2. In this case, the mean, 2.1%, is quite close to the median due to the absence of outliers. We used the risk-free rate, proxied by one-month U.S. Treasury bills, to represent a conservative return from the collateral that would back such a strategy. January 2015 Fama, Eugene F., and Kenneth R. French. 1992.
“The Cross-Section of Expected Stock Returns.” Journal of Finance, vol. 47, no. 2 (June):427–465. Hsu, Jason.
2014. “Value Investing: Smart Beta vs. Style Indices.” Journal of Index Investing, vol.
5, no. 1 (Summer):121–126. References West, John. 2011.
“Sector Weights: On Average Wrong, but Dynamically Right.” Research Affiliates (May). Arnott, Rob. 2007. “Dynamic Style and Size Exposures.” Research Affiliates (August). ———.
2013. “Attention 3-D Shoppers.” Research Affiliates (July). Disclosures The material contained in this document is for general information purposes only. It is not intended as an offer or a solicitation for the purchase and/or sale of any security, derivative, commodity, or financial instrument, nor is it advice or a recommendation to enter into any transaction.
Research results relate only to a hypothetical model of past performance (i.e., a simulation) and not to an asset management product. No allowance has been made for trading costs or management fees, which would reduce investment performance. Actual results may differ.
Index returns represent back-tested performance based on rules used in the creation of the index, are not a guarantee of future performance, and are not indicative of any specific investment. Indexes are not managed investment products and cannot be invested in directly. This material is based on information that is considered to be reliable, but Research Affiliates® and its related entities (collectively “Research Affiliates”) make this information available on an “as is” basis without a duty to update, make warranties, express or implied, regarding the accuracy of the information contained herein.
Research Affiliates is not responsible for any errors or omissions or for results obtained from the use of this information. Nothing contained in this material is intended to constitute legal, tax, securities, financial or investment advice, nor an opinion regarding the appropriateness of any investment. The information contained in this material should not be acted upon without obtaining advice from a licensed professional.
Research Affiliates, LLC, is an investment adviser registered under the Investment Advisors Act of 1940 with the U.S. Securities and Exchange Commission (SEC). Our registration as an investment adviser does not imply a certain level of skill or training. Investors should be aware of the risks associated with data sources and quantitative processes used in our investment management process.
Errors may exist in data acquired from third party vendors, the construction of model portfolios, and in coding related to the index and portfolio construction process. While Research Affiliates takes steps to identify data and process errors so as to minimize the potential impact of such errors on index and portfolio performance, we cannot guarantee that such errors will not occur. The trademarks Fundamental Index™, RAFI™, Research Affiliates Equity™ and the Research Affiliates™ trademark and corporate name and all related logos are the exclusive intellectual property of Research Affiliates, LLC and in some cases are registered trademarks in the U.S. and other countries.
Various features of the Fundamental Index™ methodology, including an accounting data-based non-capitalization data processing system and method for creating and weighting an index of securities, are protected by various patents, and patent-pending intellectual property of Research Affiliates, LLC. (See all applicable US Patents, Patent Publications, Patent Pending intellectual property and protected trademarks located at http:/ /www.researchaffiliates.com/Pages/ legal.aspx#d, which are fully incorporated herein.) Any use of these trademarks, logos, patented or patent pending methodologies without the prior written permission of Research Affiliates, LLC, is expressly prohibited. Research Affiliates, LLC, reserves the right to take any and all necessary action to preserve all of its rights, title, and interest in and to these marks, patents or pending patents. The views and opinions expressed are those of the author and not necessarily those of Research Affiliates, LLC.
The opinions are subject to change without notice. ©2015 Research Affiliates, LLC. All rights reserved. 620 Newport Center Drive, Suite 900 | Newport Beach, CA 92660 | + 1 (949) 325 - 8700 | www.researchaffiliates.com Page 6 .
Tony Parker breaks down defenses with his quick dribble. Boris Diaw excels as a passer. Manu Ginobili provides a spark off of the bench.
Tiago Splitter rebounds. Kawhi Leonard defends against the other team’s best player. Danny Green hits corner threes, and so on. The Spurs have perfected a winning formula, signing quality players to fill complementary roles. The San Antonio Spurs’ proven strategy of utilizing complementary capabilities can also be employed in constructing investment portfolios.
Asset classes that perform well in isolation can be promising as stand-alone options, but they become far more attractive when combined with others whose strengths are dissimilar. In investing, as in team sports, diversification makes it possible to excel regardless of the competition and the playing conditions. That’s a platitude.
But we take another step and propose that the wellestablished value premium can be considered a diversifying asset class. Global Value Premia The existence of a value premium, most notably documented by Fama and French (1992), is widely accepted. Further, the value premium is robust across countries. Figure 1 shows the annualized value premium, as measured by the excess returns of longonly capitalization-weighted value equity indices over long-only cap-weighted core equity indices, for 11 of the world’s 12 largest economies (Arnott, 2007; West, 2011).
The median value premium is 60 bps, and none of the markets exhibits a negative value premium over the period from August 1996 to June 2014. A correlation matrix (Table 1) using the same monthly return time series shows that the excess returns attributable to these country-specific value premia are far less than perfectly correlated. The average cross correlation is only 0.21. Interestingly, the highest correlations belong to some of the largest developed countries. It should not be a surprise, given the size of its equity market, that the United States has the largest average correlation (0.34) with other countries’ value premia. Canada is not far behind at 0.32. The other countries with correlations above 0.2 are also developed markets.
In contrast, Australia and the emerging markets (Brazil, India, and China) exhibit the lowest average correlations. Media Contact Hewes Communications + 1 (212) 207-9450 hewesteam@hewescomm.com . FUNDAMENTALS January 2015 Figure 1. Annualized Value Style Premium by Country (August 1996–June 2014) 9% 8.3% 8% 6% 5% 4% 3% 2.5% 2% Japan Italy India Germany Country Value Premium 0.2% 0.4% US 0.4% 0.1% France China Canada 1.2% 0.9% 0.6% 0.6% Brazil 0% 1.0% Australia 1% UK Value-Added Return 7% Median Source: Research Affiliates based on data from Russell Indexes via FactSet. Table 1. Cross-Country Correlations of Value Premia Australia Australia Brazil Canada China France Germany India Italy Japan U.K. U.S. 1 -0.08 0.19 0.08 0.16 0.22 -0.07 0.18 0.14 0.22 0.18 Brazil Canada 1 0.00 -0.05 0.11 -0.01 0.17 0.11 0.00 0.07 0.00 1 0.32 0.43 0.43 0.25 0.14 0.39 0.32 0.70 China 1 0.01 0.15 0.14 0.25 0.21 0.06 0.26 France Germany 1 0.40 0.08 0.33 0.18 0.40 0.37 1 0.13 0.36 0.21 0.35 0.50 India Italy Japan 1 0.11 0.05 0.07 0.20 1 0.46 0.42 0.42 1 0.26 0.42 U.K. 1 0.31 U.S. 1 Source: Research Affiliates based on data from Russell Indexes via FactSet. The low correlations across borders mean that a global portfolio accessing individual countries’ value premia would have less volatility than its average component. However, 60 bps of excess return does not make for a terribly interesting investment option.
We need to find higher expected returns in order to create an attractive investment. Fundamentally Weighted Indices Long-time readers of Research Affiliates’ publications know that, in the long run, fundamentally weighted strategies tend to outperform cap-weighted value strategies due to the dynamic nature of their value tilt. This dynamic exposure is an inherent by-product of the strategies’ regular rebalances (Hsu, 2014). Like the value premium itself, this excess return is robust across countries.
However, the magnitude of long-term excess returns from fundamentally weighted strategies is substantially greater than the premium captured by cap-weighted value style indices (Hsu, 2014). A cap-weighted value index is constructed in accordance with price- based methodologies. Companies are typically selected by valuation measures such as the price-to-book ratio. Their capitalization-based weights in the index increase as their share prices appreciate; conversely, their weights decline as prices fall.
Ironically, the more expensive—and therefore the less like a value stock—a “value” holding becomes, the greater its weight in a cap-weighted value index. Selecting and weighting stocks on the basis of fundamental values (such as sales, cash flow, dividends, and book value), and periodically rebalancing to fundamental weights, breaks this link 620 Newport Center Drive, Suite 900 | Newport Beach, CA 92660 | + 1 (949) 325 - 8700 | www.researchaffiliates.com Page 2 . FUNDAMENTALS January 2015 between a stock’s price and its weight in the portfolio, resulting in added value relative to the cap-weighted index. have higher returns and less volatility than the average country. The data confirm this assumption. An equally weighted portfolio would have had an annualized return of 2.5% and an annualized volatility of 4.9% versus 2.1% and 8.4%, respectively, for the average country. Series are not meaningfully correlated across countries (Table 2). Again, the United States and Canada have the largest average cross correlations at 0.37 and 0.31, respectively.
The overall average correlation of 0.23 is nearly identical to the 0.21 observed for the value premia. Figure 2 illustrates the value added by the Russell Fundamental Index® Series over the period August 1996—June 2014. The median annualized value added by these strategies is 2.2%1 and the return premium is again positive in each country. Gearing Up the Portfolio This low correlation between the excess returns from each country suggests that, with monthly rebalancing, an equally weighted portfolio comprising all 11 countries’ excess returns would Similar to the value premium, the excess returns of the Russell Fundamental Index One way to potentially capture incremental returns is through a market-neutral long-short portfolio. For the period August 1996 through Figure 2. Annualized Russell Fundamental Index Excess Returns (August 1996–June 2014) Value-Added Return 4% 3.7% 3.6% 3% 2.5% 2.2% 2% 1% 2.2% 1.6% 2.3% 2.1% 1.5% 0.9% Russell Fundamental Index Excess Return US UK Japan Italy India Germany France China Canada Brazil 0% Australia 0.3% Median Source: Research Affiliates based on data from Russell Indexes. Table 2.
Cross-Country Correlations of Fundamentally Weighted Portfolios’ Excess Returns Australia Australia Brazil Canada China France Germany India Italy Japan U.K. U.S. 1 0.10 0.17 0.29 0.13 0.30 0.25 0.13 0.18 0.07 0.34 Brazil Canada 1 0.04 -0.06 0.05 0.11 0.20 0.07 0.02 0.00 0.09 1 0.37 0.42 0.37 0.42 0.04 0.36 0.20 0.72 China 1 0.30 0.12 0.30 0.22 0.38 0.17 0.41 France Germany 1 0.27 0.22 0.22 0.27 0.23 0.39 1 0.16 0.24 0.29 0.14 0.32 India Italy Japan 1 0.21 0.27 0.18 0.46 1 0.26 0.20 0.25 1 0.16 0.42 U.K. 1 0.32 U.S. 1 Source: Research Affiliates based on data from Russell Indexes. 620 Newport Center Drive, Suite 900 | Newport Beach, CA 92660 | + 1 (949) 325 - 8700 | www.researchaffiliates.com Page 3 . FUNDAMENTALS weighted strategies and short capweighted indices will not necessarily experience a similar decline in riskadjusted returns due to low rates and high valuations. “ In investing, as in basketball, diversification makes it possible to excel. Table 3 shows how the market-neutral long–short strategy would have performed in comparison with asset class returns over the same period. For reference, “first pillar” asset classes include developed market equities; “second pillar,” mainstream fixedincome strategies; and “third pillar,” diversified inflation hedges such as emerging market stocks, emerging market bonds, and high yield bonds. As a stand-alone option, this global market-neutral long–short portfolio would have generated a Sharpe ratio superior to that of first pillar equities but below those of second and third pillar assets. Present-day yields and valuation levels will make it challenging for both stocks and bonds to replicate the returns realized in the declining rate environment reflected in Table 3’s historical timeframe. However, a portfolio that is long fundamentally “ June 2014, a simulated portfolio with equal exposures to long positions in fundamentally weighted indices in each of the 11 countries, and short positions in the corresponding cap-weighted indices, would have generated an annualized return of 5% and an annualized volatility of 5%.
This outcome would have generated an attractive Sharpe ratio of 0.52.2 January 2015 The value added by rebalancing strategies is based on the presence of mispricing in the market, not the level of yields and valuations. Investors can reasonably expect rebalancing strategies to remain advantageous over the long term unless markets become perfectly efficient—an improbable development, given that market inefficiencies have existed as long as there have been markets! And if the added value persists, so will the magnitude of the Sharpe ratio. Observe, too, that this portfolio’s hypothetical returns reflect a simple approach utilizing broadly diversified indices backed by collateral earning only the risk-free rate of return. Several other ways to enhance returns come to mind.
In the long portfolio, including only the largest active positions in fundamentally weighted indices (relative to cap-weighted indices) might result in more concentrated exposure to the companies most responsible for the excess returns. Actively managing the fixed-income collateral would offer the possibility of outperforming the return on cash. Either of these changes would likely increase the already attractive Sharpe ratio of 0.52.
Yet, as appealing as this investment looks on a stand-alone basis, its true promise lies in its potential to diversify an investment program. Diversifying an Asset Mix The correlation, or more accurately the lack of correlation, of the returns of this long–short portfolio with major asset classes makes the idea truly interesting. Figure 3 shows that the global long fundamentally weighted/ short cap-weighted portfolio actually has a negative average correlation with the three-pillar asset classes to which we frequently refer (West, 2013). An investment strategy that offers an attractive Sharpe ratio and returns that are negatively correlated with all major asset classes is essentially the Holy Grail of portfolio construction.
A 5% annual return will not achieve any but the most modest spending objectives on its own, but the diversification benefits offer the potential to make a truly meaningful improvement to an overall portfolio’s risk and return characteristics. Table 3. Simulated Market-Neutral Long–Short Performance (August 1996–June 2014) Annualized Return Annualized Volatility Sharpe Ratio Global Long-Short Strategy* 5.0% 5.0% 0.52 Average of First Pillar 8.1% 16.6% 0.34 Average of Second Pillar 7.3% 7.0% 0.70 Average of Third Pillar 8.0% 9.5% 0.60 *Long country-specific fundamentally weighted indices; short the corresponding cap-weighted indices. Source: Research Affiliates based on data from FactSet. 620 Newport Center Drive, Suite 900 | Newport Beach, CA 92660 | + 1 (949) 325 - 8700 | www.researchaffiliates.com Page 4 . FUNDAMENTALS January 2015 Figure 3. Sharpe Ratios and Average Cross Correlations 1.75 Core Fixed Income 1.50 1.25 Sharpe Ratio TIPS 1.00 Bank Loans Long Treasury Local Curr EM Bonds Long Credit High Yield EM Bonds 0.75 Convertibles Long Fund'l/Short Cap REITs 0.50 Large Cap US Equities Small Cap US Equities Developed ex US Equities 0.25 EM Equities Commodities 0.00 -0.20 -0.10 0.00 0.10 0.20 0.30 0.40 0.50 Average Correlation to the Three-Pillar Asset Classes Source: Research Affiliates based on data from from FactSet. None of the asset classes has a negative average cross correlation, even after we include the global long–short portfolio. A portfolio comprised 50% of first-pillar developed equities, 30% second-pillar mainstream bonds, and 20% third-pillar inflation hedges already contains considerably more global diversification, more inflation protection, and less reliance on equity market beta than the average simulated three-pillar investment portfolio. As a result, it hypothetically generates attractive performance over the same measurement period we have been considering.
However, as shown in Table 4, introducing a 10% allocation to the global market-neutral portfolio would have improved the risk-adjusted performance even of the 50/30/20 portfolio. Thus, adding this global market-neutral strategy has the potential to increase the Sharpe ratio of even the most diversified portfolios. With today’s low yields and correspondingly modest expected returns for mainstream stocks and bonds, such further diversification may never have been more reasonable. range. A team composed solely of Boris Diaws would probably be unsuccessful, but the San Antonio Spurs leaned heavily on Diaw on their way to last year’s NBA championship.
He had a specific role in which he fittingly complemented his teammates’ skills. In Closing A portfolio comprising long positions in individual fundamentally weighted country indices and short positions in capweighted country indices might prove to be the Boris Diaw of a diversified portfolio. Investors would be unlikely to meet their return targets by concentrating all their assets in such a strategy. However, given its high Sharpe ratio and low correlation with widely used asset classes, it seems a suitable addition to a robust asset mix. In isolation, Boris Diaw is an aboveaverage basketball player. As a power forward, he has the ability to rebound and score around the basket.
However, because of his unique skill set, he truly shines as part of a team. He is large enough to guard post players, yet he has the situational awareness necessary to be a great passer and the sure touch necessary to be a threat from three-point Table 4. Diversifying a Three-Pillar Portfolio (August 1996−June 2014) Annualized Return 50/30/20 45/27/18/10* Annualized Volatility Sharpe Ratio 8.2% 10.2% 0.57 7.9% 9.0% 0.61 *45% first pillar, 27% second pillar, 18% third pillar, and 10% global market-neutral long fundamentally weighted/short cap-weighted. Source: Research Affiliates based on data from FactSet. 620 Newport Center Drive, Suite 900 | Newport Beach, CA 92660 | + 1 (949) 325 - 8700 | www.researchaffiliates.com Page 5 .
FUNDAMENTALS Endnotes 1. 2. In this case, the mean, 2.1%, is quite close to the median due to the absence of outliers. We used the risk-free rate, proxied by one-month U.S. Treasury bills, to represent a conservative return from the collateral that would back such a strategy. January 2015 Fama, Eugene F., and Kenneth R. French. 1992.
“The Cross-Section of Expected Stock Returns.” Journal of Finance, vol. 47, no. 2 (June):427–465. Hsu, Jason.
2014. “Value Investing: Smart Beta vs. Style Indices.” Journal of Index Investing, vol.
5, no. 1 (Summer):121–126. References West, John. 2011.
“Sector Weights: On Average Wrong, but Dynamically Right.” Research Affiliates (May). Arnott, Rob. 2007. “Dynamic Style and Size Exposures.” Research Affiliates (August). ———.
2013. “Attention 3-D Shoppers.” Research Affiliates (July). Disclosures The material contained in this document is for general information purposes only. It is not intended as an offer or a solicitation for the purchase and/or sale of any security, derivative, commodity, or financial instrument, nor is it advice or a recommendation to enter into any transaction.
Research results relate only to a hypothetical model of past performance (i.e., a simulation) and not to an asset management product. No allowance has been made for trading costs or management fees, which would reduce investment performance. Actual results may differ.
Index returns represent back-tested performance based on rules used in the creation of the index, are not a guarantee of future performance, and are not indicative of any specific investment. Indexes are not managed investment products and cannot be invested in directly. This material is based on information that is considered to be reliable, but Research Affiliates® and its related entities (collectively “Research Affiliates”) make this information available on an “as is” basis without a duty to update, make warranties, express or implied, regarding the accuracy of the information contained herein.
Research Affiliates is not responsible for any errors or omissions or for results obtained from the use of this information. Nothing contained in this material is intended to constitute legal, tax, securities, financial or investment advice, nor an opinion regarding the appropriateness of any investment. The information contained in this material should not be acted upon without obtaining advice from a licensed professional.
Research Affiliates, LLC, is an investment adviser registered under the Investment Advisors Act of 1940 with the U.S. Securities and Exchange Commission (SEC). Our registration as an investment adviser does not imply a certain level of skill or training. Investors should be aware of the risks associated with data sources and quantitative processes used in our investment management process.
Errors may exist in data acquired from third party vendors, the construction of model portfolios, and in coding related to the index and portfolio construction process. While Research Affiliates takes steps to identify data and process errors so as to minimize the potential impact of such errors on index and portfolio performance, we cannot guarantee that such errors will not occur. The trademarks Fundamental Index™, RAFI™, Research Affiliates Equity™ and the Research Affiliates™ trademark and corporate name and all related logos are the exclusive intellectual property of Research Affiliates, LLC and in some cases are registered trademarks in the U.S. and other countries.
Various features of the Fundamental Index™ methodology, including an accounting data-based non-capitalization data processing system and method for creating and weighting an index of securities, are protected by various patents, and patent-pending intellectual property of Research Affiliates, LLC. (See all applicable US Patents, Patent Publications, Patent Pending intellectual property and protected trademarks located at http:/ /www.researchaffiliates.com/Pages/ legal.aspx#d, which are fully incorporated herein.) Any use of these trademarks, logos, patented or patent pending methodologies without the prior written permission of Research Affiliates, LLC, is expressly prohibited. Research Affiliates, LLC, reserves the right to take any and all necessary action to preserve all of its rights, title, and interest in and to these marks, patents or pending patents. The views and opinions expressed are those of the author and not necessarily those of Research Affiliates, LLC.
The opinions are subject to change without notice. ©2015 Research Affiliates, LLC. All rights reserved. 620 Newport Center Drive, Suite 900 | Newport Beach, CA 92660 | + 1 (949) 325 - 8700 | www.researchaffiliates.com Page 6 .


