


Description
FUNDAMENTALS
™
November 2015
Reeling In Small-Cap Alpha
Vitali Kalesnik, Ph.D., and Noah Beck
Vitali Kalesnik, Ph.D.
“
Small size alone
does not guarantee
outperformance.
“
KEY POINTS
1.
2.
3.
Stocks of small companies have
higher incidences of price volatility and mispricing, increasing
opportunities for investors to earn
excess returns.
Implementing
outperforming
strategies, such as value or
momentum, in the small-cap
universe amplifies their alphagenerating potential.
High trading costs of small-cap
stocks disadvantages passive
implementation when compared
to skilled active management.
Although we live at the edge of the Pacific
Ocean, our weekend adventures often take
us inland to enjoy the lakes and streams
of California and her neighboring states. A
favorite pastime is fresh-water fishing. For
most, the lure of fishing is a combination
of serene beauty, contemplative quiet, and
the satisfaction of reeling in as many big
fish as possible. We admit that the first
two attractions are very appealing in their
restorative powers, particularly to officeweary asset managers, but we can’t help
being most inspired by the basic challenge
of catching a lot of big fish.
The folklore claims 10% of fishermen catch 90% of the fish. What do the top 10% know that the others don’t? Small-Cap Alpha: Abundant, but Unreliable Investors’ search for alpha is not dissimilar to the strategies of skilled and experienced fishermen. First, the skilled know the right location.
They use multiple lines and hooks or lures to increase their opportunities. And they attract greater numbers of fish by chumming—adding scent or bait to the water. In the world of asset management, we can think of risk and mispricing as the chum that attracts alpha. Just as all fishing locations are not equal—contrast the teeming Lake Tahoe with the perishing Salton Sea—not all segments of the equity market are equal in the opportunities they present for finding alpha. have significantly higher return dispersion Lake Tahoe is well known for both its abundance and diversity of fish.
The academic literature has made a similar case for small stocks, often believed to be a deep pool into which an investor can cast her net and pull out a weighty haul of alpha. Stocks of small companies vary significantly in price volatility, are more prone to defaults, and have high trading costs. In combination, these characteristics create an unpredictable risk distribution for small-cap stocks, and the same traits contribute to their frequently being mispriced. In addition, many known anomalies, or risk factors, among small companies, creating numerous opportunities for alpha production. Our research shows, however, that small stocks are not a dependable source of standalone premium.
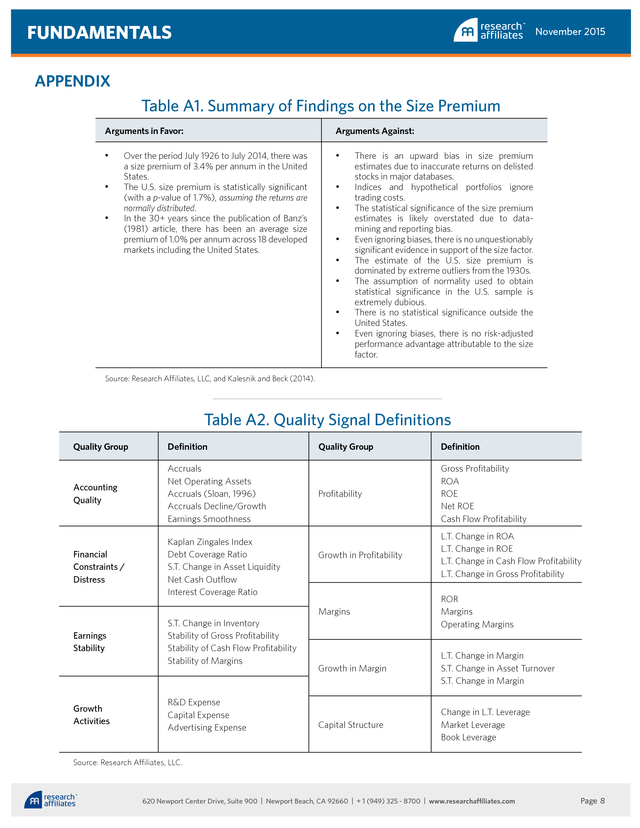
Granted, the small-cap universe is plentiful—there are thousands more small companies than large companies—and diverse—the U.S. economy encourages virtually any type of business or strategy an entrepreneur can envision—but these traits alone are insufficient to ensure small caps will unfailingly produce an excess return. Media Contacts United States and Canada Hewes Communications + 1 (212) 207-9450 hewesteam@hewescomm.com Europe JPES Partners (London) +44 (0) 20 7520 7620 ra@jpespartners.com . FUNDAMENTALS Many market participants believe that, just like value stocks outperform growth stocks, and positive momentum stocks outperform negative momentum stocks, small-cap stocks outperform large-cap stocks. In a recent article (Kalesnik and Beck, 2014), we discuss the evidence that supports the size premium. Table A1 in the Appendix lists the main arguments in favor and against small size as a standalone source of premium. In our view, the arguments against are much stronger than the arguments in favor: we judge the evidence that smallcap companies, in general, outperform large-cap companies to be unreliable. Our advice to the equity investor is to examine that small cap you are considering to be sure it has the alpha-producing qualities you seek—if November 2015 A Fertile Fishing Spot The higher price volatility of small caps Even if small companies are not as a group reliably outperforming large companies, small-cap stocks still hold significant promise for investors—they are a fertile fishing spot for alpha. Small caps, like other investment strategies, benefit from two potential sources of outperformance: 1) exposure to sources of risk that are compensated with higher returns, and 2) systematic sources of mispricing that can be exploited. is evident at both portfolio and stockspecific levels.
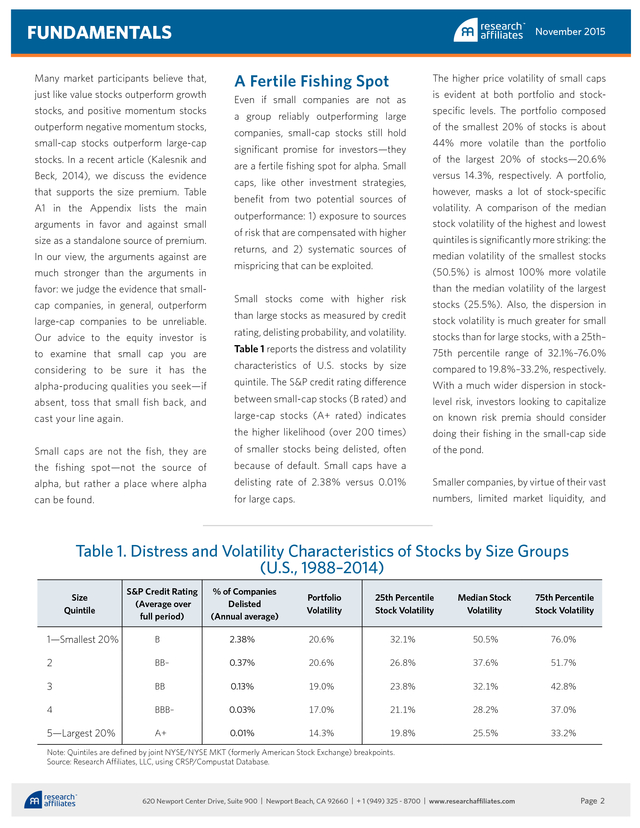
The portfolio composed of the smallest 20% of stocks is about 44% more volatile than the portfolio of the largest 20% of stocks—20.6% versus 14.3%, respectively. A portfolio, however, masks a lot of stock-specific volatility. A comparison of the median stock volatility of the highest and lowest quintiles is significantly more striking: the median volatility of the smallest stocks (50.5%) is almost 100% more volatile Small stocks come with higher risk than large stocks as measured by credit rating, delisting probability, and volatility. Table 1 reports the distress and volatility characteristics of U.S.
stocks by size quintile. The S&P credit rating difference than the median volatility of the largest stocks (25.5%). Also, the dispersion in stock volatility is much greater for small stocks than for large stocks, with a 25th– 75th percentile range of 32.1%–76.0% compared to 19.8%–33.2%, respectively. With a much wider dispersion in stock- between small-cap stocks (B rated) and level risk, investors looking to capitalize large-cap stocks (A+ rated) indicates on known risk premia should consider the higher likelihood (over 200 times) doing their fishing in the small-cap side Small caps are not the fish, they are of smaller stocks being delisted, often of the pond. the fishing spot—not the source of because of default.
Small caps have a alpha, but rather a place where alpha delisting rate of 2.38% versus 0.01% Smaller companies, by virtue of their vast can be found. for large caps. numbers, limited market liquidity, and absent, toss that small fish back, and cast your line again. Table 1. Distress and Volatility Characteristics of Stocks by Size Groups (U.S., 1988–2014) Size Quintile S&P Credit Rating (Average over full period) % of Companies Delisted (Annual average) Portfolio Volatility 25th Percentile Stock Volatility Median Stock Volatility 75th Percentile Stock Volatility 1—Smallest 20% B 2.38% 20.6% 32.1% 50.5% 76.0% 2 BB– 0.37% 20.6% 26.8% 37.6% 51.7% 3 BB 0.13% 19.0% 23.8% 32.1% 42.8% 4 BBB– 0.03% 17.0% 21.1% 28.2% 37.0% 5—Largest 20% A+ 0.01% 14.3% 19.8% 25.5% 33.2% Note: Quintiles are defined by joint NYSE/NYSE MKT (formerly American Stock Exchange) breakpoints. Source: Research Affiliates, LLC, using CRSP/Compustat Database. 620 Newport Center Drive, Suite 900 | Newport Beach, CA 92660 | + 1 (949) 325 - 8700 | www.researchaffiliates.com Page 2 . FUNDAMENTALS November 2015 as a category to have very light analyst coverage. Therefore, much less is known years. Large trading costs make potential trades of small-cap stocks less profitable, allowing the mispricing to persist. “ by, or available to, the average investor about the fundamental strength of most small companies. Investors struggle to the fish, they are the digest this complexity and to translate the information they are able to discern into efficient prices.
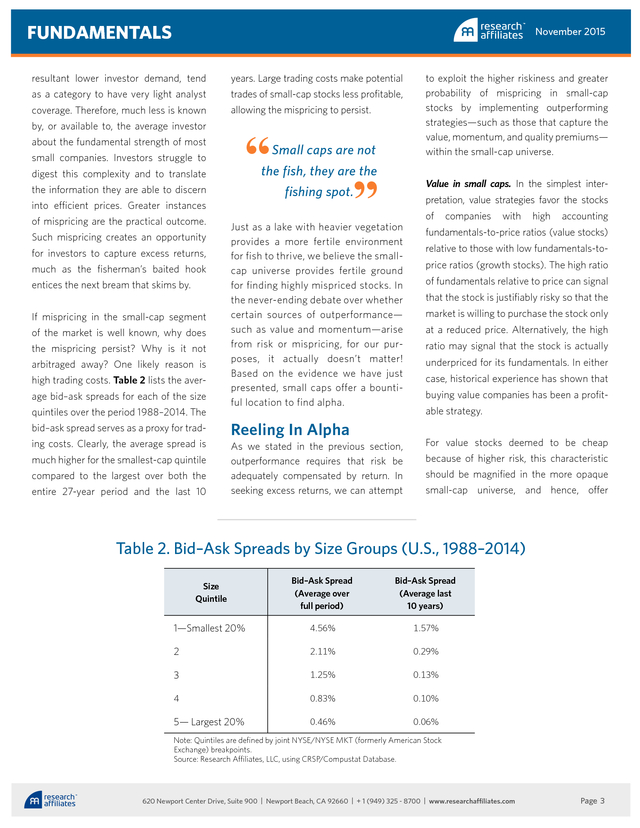
Greater instances of mispricing are the practical outcome. Such mispricing creates an opportunity for investors to capture excess returns, much as the fisherman’s baited hook entices the next bream that skims by. If mispricing in the small-cap segment of the market is well known, why does the mispricing persist? Why is it not arbitraged away? One likely reason is high trading costs. Table 2 lists the average bid–ask spreads for each of the size quintiles over the period 1988–2014. The bid–ask spread serves as a proxy for trading costs.
Clearly, the average spread is much higher for the smallest-cap quintile compared to the largest over both the entire 27-year period and the last 10 Small caps are not “ resultant lower investor demand, tend Value in small caps. In the simplest inter- fishing spot. pretation, value strategies favor the stocks Just as a lake with heavier vegetation provides a more fertile environment for fish to thrive, we believe the smallcap universe provides fertile ground for finding highly mispriced stocks. In the never-ending debate over whether certain sources of outperformance— such as value and momentum—arise from risk or mispricing, for our purposes, it actually doesn’t matter! Based on the evidence we have just presented, small caps offer a bountiful location to find alpha. Reeling In Alpha to exploit the higher riskiness and greater probability of mispricing in small-cap stocks by implementing outperforming strategies—such as those that capture the value, momentum, and quality premiums— within the small-cap universe. As we stated in the previous section, outperformance requires that risk be adequately compensated by return.
In seeking excess returns, we can attempt of companies with high accounting fundamentals-to-price ratios (value stocks) relative to those with low fundamentals-toprice ratios (growth stocks). The high ratio of fundamentals relative to price can signal that the stock is justifiably risky so that the market is willing to purchase the stock only at a reduced price. Alternatively, the high ratio may signal that the stock is actually underpriced for its fundamentals.
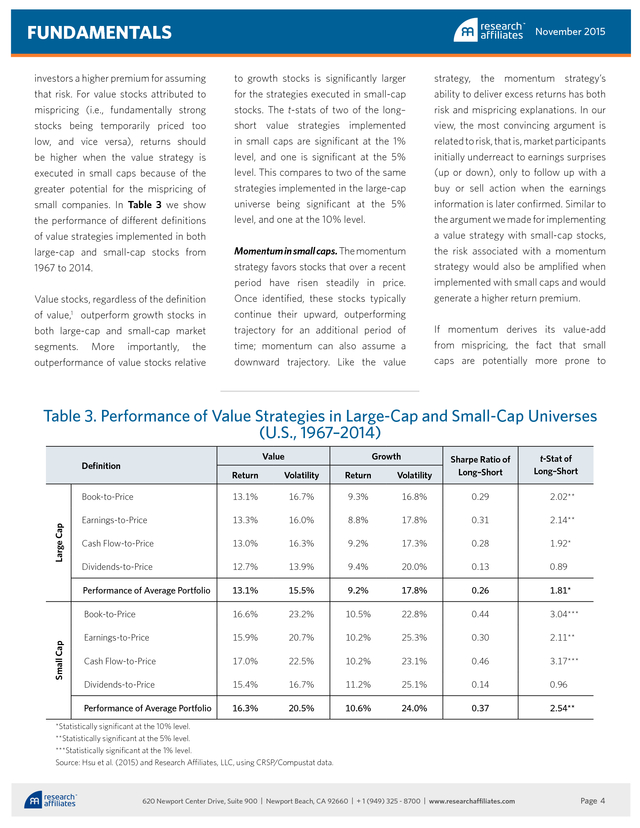
In either case, historical experience has shown that buying value companies has been a profitable strategy. For value stocks deemed to be cheap because of higher risk, this characteristic should be magnified in the more opaque small-cap universe, and hence, offer Table 2. Bid–Ask Spreads by Size Groups (U.S., 1988–2014) Size Quintile Bid–Ask Spread (Average over full period) Bid–Ask Spread (Average last 10 years) 1—Smallest 20% 4.56% 1.57% 2 2.11% 0.29% 3 1.25% 0.13% 4 0.83% 0.10% 5— Largest 20% 0.46% 0.06% Note: Quintiles are defined by joint NYSE/NYSE MKT (formerly American Stock Exchange) breakpoints. Source: Research Affiliates, LLC, using CRSP/Compustat Database. 620 Newport Center Drive, Suite 900 | Newport Beach, CA 92660 | + 1 (949) 325 - 8700 | www.researchaffiliates.com Page 3 . FUNDAMENTALS November 2015 investors a higher premium for assuming that risk. For value stocks attributed to mispricing (i.e., fundamentally strong stocks being temporarily priced too low, and vice versa), returns should be higher when the value strategy is executed in small caps because of the greater potential for the mispricing of small companies. In Table 3 we show the performance of different definitions to growth stocks is significantly larger for the strategies executed in small-cap stocks. The t-stats of two of the long– short value strategies implemented in small caps are significant at the 1% level, and one is significant at the 5% level.
This compares to two of the same strategies implemented in the large-cap universe being significant at the 5% level, and one at the 10% level. of value strategies implemented in both large-cap and small-cap stocks from Momentum in small caps. The momentum 1967 to 2014. strategy favors stocks that over a recent period have risen steadily in price. Value stocks, regardless of the definition Once identified, these stocks typically of value, outperform growth stocks in continue their upward, outperforming both large-cap and small-cap market trajectory for an additional period of segments. the time; momentum can also assume a outperformance of value stocks relative downward trajectory. Like the value strategy, the momentum strategy’s ability to deliver excess returns has both risk and mispricing explanations.
In our view, the most convincing argument is related to risk, that is, market participants initially underreact to earnings surprises (up or down), only to follow up with a buy or sell action when the earnings information is later confirmed. Similar to the argument we made for implementing a value strategy with small-cap stocks, the risk associated with a momentum strategy would also be amplified when implemented with small caps and would generate a higher return premium. 1 More importantly, If momentum derives its value-add from mispricing, the fact that small caps are potentially more prone to Table 3. Performance of Value Strategies in Large-Cap and Small-Cap Universes (U.S., 1967–2014) Value Growth t-Stat of Long–Short Return Volatility Return Volatility Sharpe Ratio of Long–Short Book-to-Price 13.1% 16.7% 9.3% 16.8% 0.29 2.02** Earnings-to-Price 13.3% 16.0% 8.8% 17.8% 0.31 2.14** Cash Flow-to-Price 13.0% 16.3% 9.2% 17.3% 0.28 1.92* Dividends-to-Price 12.7% 13.9% 9.4% 20.0% 0.13 0.89 Performance of Average Portfolio 13.1% 15.5% 9.2% 17.8% 0.26 1.81* Book-to-Price 16.6% 23.2% 10.5% 22.8% 0.44 3.04*** Earnings-to-Price 15.9% 20.7% 10.2% 25.3% 0.30 2.11** Cash Flow-to-Price 17.0% 22.5% 10.2% 23.1% 0.46 3.17*** Dividends-to-Price 15.4% 16.7% 11.2% 25.1% 0.14 0.96 Performance of Average Portfolio 16.3% 20.5% 10.6% 24.0% 0.37 2.54** Small Cap Large Cap Definition *Statistically significant at the 10% level. **Statistically significant at the 5% level. ***Statistically significant at the 1% level. Source: Hsu et al.
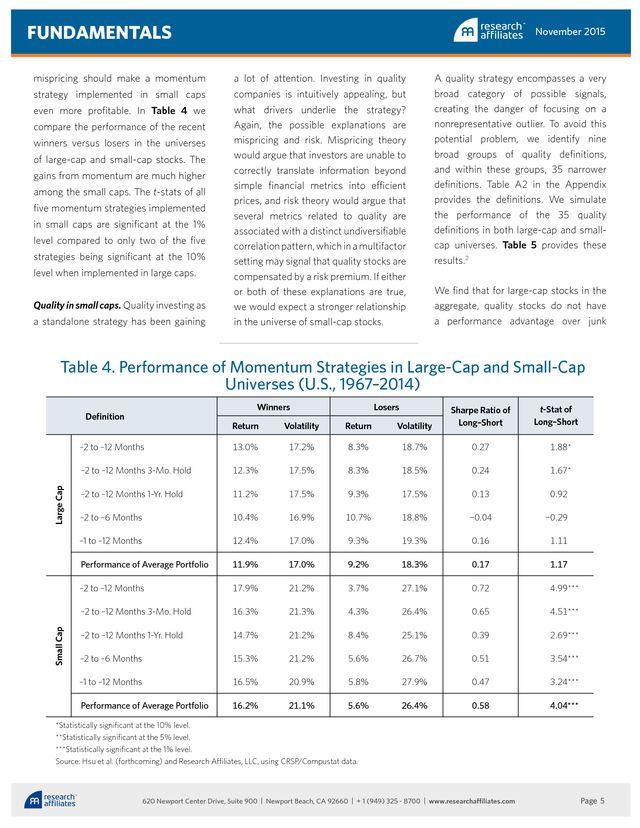
(2015) and Research Affiliates, LLC, using CRSP/Compustat data. 620 Newport Center Drive, Suite 900 | Newport Beach, CA 92660 | + 1 (949) 325 - 8700 | www.researchaffiliates.com Page 4 . FUNDAMENTALS mispricing should make a momentum strategy implemented in small caps even more profitable. In Table 4 we compare the performance of the recent winners versus losers in the universes of large-cap and small-cap stocks. The gains from momentum are much higher among the small caps. The t-stats of all five momentum strategies implemented in small caps are significant at the 1% level compared to only two of the five strategies being significant at the 10% level when implemented in large caps. Quality in small caps.
Quality investing as a standalone strategy has been gaining November 2015 a lot of attention. Investing in quality companies is intuitively appealing, but what drivers underlie the strategy? Again, the possible explanations are mispricing and risk. Mispricing theory would argue that investors are unable to correctly translate information beyond simple financial metrics into efficient prices, and risk theory would argue that several metrics related to quality are associated with a distinct undiversifiable correlation pattern, which in a multifactor setting may signal that quality stocks are compensated by a risk premium.
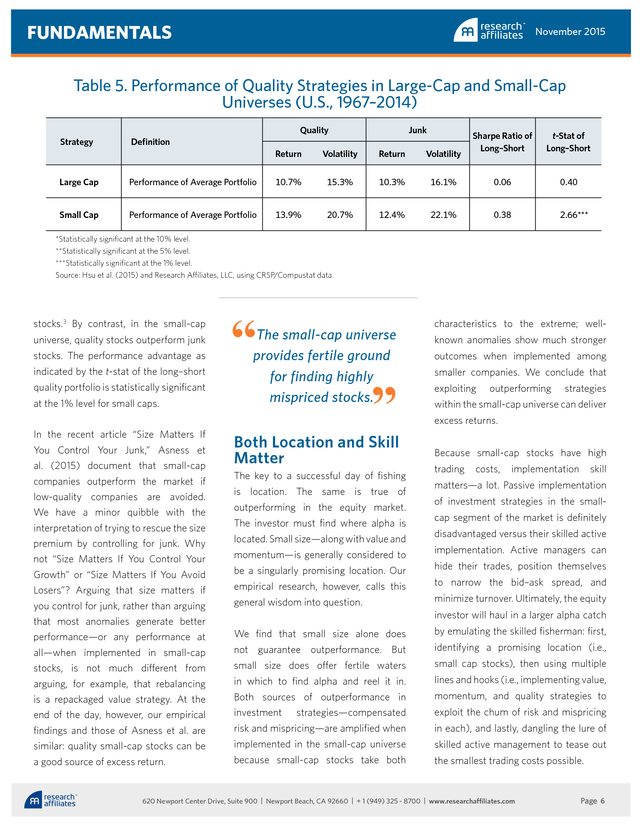
If either or both of these explanations are true, we would expect a stronger relationship in the universe of small-cap stocks. A quality strategy encompasses a very broad category of possible signals, creating the danger of focusing on a nonrepresentative outlier. To avoid this potential problem, we identify nine broad groups of quality definitions, and within these groups, 35 narrower definitions. Table A2 in the Appendix provides the definitions.
We simulate the performance of the 35 quality definitions in both large-cap and smallcap universes. Table 5 provides these results.2 We find that for large-cap stocks in the aggregate, quality stocks do not have a performance advantage over junk Table 4. Performance of Momentum Strategies in Large-Cap and Small-Cap Universes (U.S., 1967–2014) Winners Losers t-Stat of Long–Short Return Volatility Return Volatility Sharpe Ratio of Long–Short –2 to –12 Months 13.0% 17.2% 8.3% 18.7% 0.27 1.88* –2 to –12 Months 3-Mo.
Hold 12.3% 17.5% 8.3% 18.5% 0.24 1.67* –2 to –12 Months 1-Yr. Hold 11.2% 17.5% 9.3% 17.5% 0.13 0.92 –2 to –6 Months 10.4% 16.9% 10.7% 18.8% -0.04 -0.29 –1 to –12 Months 12.4% 17.0% 9.3% 19.3% 0.16 1.11 Performance of Average Portfolio 11.9% 17.0% 9.2% 18.3% 0.17 1.17 –2 to –12 Months 17.9% 21.2% 3.7% 27.1% 0.72 4.99*** –2 to –12 Months 3-Mo. Hold 16.3% 21.3% 4.3% 26.4% 0.65 4.51*** –2 to –12 Months 1-Yr.
Hold 14.7% 21.2% 8.4% 25.1% 0.39 2.69*** –2 to –6 Months 15.3% 21.2% 5.6% 26.7% 0.51 3.54*** –1 to –12 Months 16.5% 20.9% 5.8% 27.9% 0.47 3.24*** Performance of Average Portfolio 16.2% 21.1% 5.6% 26.4% 0.58 4.04*** Small Cap Large Cap Definition *Statistically significant at the 10% level. **Statistically significant at the 5% level. ***Statistically significant at the 1% level. Source: Hsu et al. (forthcoming) and Research Affiliates, LLC, using CRSP/Compustat data. 620 Newport Center Drive, Suite 900 | Newport Beach, CA 92660 | + 1 (949) 325 - 8700 | www.researchaffiliates.com Page 5 . FUNDAMENTALS November 2015 Table 5. Performance of Quality Strategies in Large-Cap and Small-Cap Universes (U.S., 1967–2014) Strategy Large Cap Small Cap Quality Definition Junk Sharpe Ratio of Long–Short t-Stat of Long–Short Return Volatility Return Volatility Performance of Average Portfolio 10.7% 15.3% 10.3% 16.1% 0.06 0.40 Performance of Average Portfolio 13.9% 20.7% 12.4% 22.1% 0.38 2.66*** *Statistically significant at the 10% level. **Statistically significant at the 5% level. ***Statistically significant at the 1% level. Source: Hsu et al. (2015) and Research Affiliates, LLC, using CRSP/Compustat data. universe, quality stocks outperform junk stocks. The performance advantage as indicated by the t-stat of the long–short quality portfolio is statistically significant at the 1% level for small caps. In the recent article “Size Matters If You Control Your Junk,” Asness et al.
(2015) document that small-cap companies outperform the market if low-quality companies are avoided. We have a minor quibble with the interpretation of trying to rescue the size premium by controlling for junk. Why not “Size Matters If You Control Your Growth” or “Size Matters If You Avoid Losers”? Arguing that size matters if you control for junk, rather than arguing that most anomalies generate better performance—or any performance at all—when implemented in small-cap stocks, is not much different from arguing, for example, that rebalancing is a repackaged value strategy. At the end of the day, however, our empirical findings and those of Asness et al.
are similar: quality small-cap stocks can be a good source of excess return. “ The small-cap universe provides fertile ground for finding highly mispriced stocks. “ stocks.3 By contrast, in the small-cap Both Location and Skill Matter The key to a successful day of fishing is location. The same is true of outperforming in the equity market. The investor must find where alpha is located. Small size—along with value and momentum—is generally considered to be a singularly promising location.
Our empirical research, however, calls this characteristics to the extreme; wellknown anomalies show much stronger outcomes when implemented among smaller companies. We conclude that exploiting outperforming strategies within the small-cap universe can deliver excess returns. Because small-cap stocks have high trading costs, implementation skill matters—a lot. Passive implementation of investment strategies in the smallcap segment of the market is definitely disadvantaged versus their skilled active implementation.
Active managers can hide their trades, position themselves to narrow the bid–ask spread, and general wisdom into question. minimize turnover. Ultimately, the equity We find that small size alone does by emulating the skilled fisherman: first, not guarantee outperformance. But identifying a promising location (i.e., small size does offer fertile waters small cap stocks), then using multiple in which to find alpha and reel it in. lines and hooks (i.e., implementing value, Both sources of outperformance in momentum, and quality strategies to investment investor will haul in a larger alpha catch strategies—compensated exploit the chum of risk and mispricing risk and mispricing—are amplified when in each), and lastly, dangling the lure of implemented in the small-cap universe skilled active management to tease out because small-cap stocks take both the smallest trading costs possible. 620 Newport Center Drive, Suite 900 | Newport Beach, CA 92660 | + 1 (949) 325 - 8700 | www.researchaffiliates.com Page 6 .
FUNDAMENTALS Endnotes 1. 2. 3. November 2015 References The only value strategy that lacks statistical significance in Table 3 is the strategy defined by dividend yield. It comes with significant volatility reduction, a feature, however, that can make the strategy attractive to some investors. The lower volatility of the high dividend–yield portfolio increases the volatility of the long–short portfolio used in the statistical test and renders the difference statistically insignificant. Hsu et al. (forthcoming) document that in terms of Sharpe ratios, the value strategy defined as dividend yields provides an economically and statistically significant advantage. We show only the aggregate results in the interest of space. We interpret these findings as a lack of robustness for quality as a broad investment category.
It does not mean that individual definitions of quality may not have investment merits; further characteristics may be of interest and deserve more detailed study. Asness, Cliff, Andrea Frazzini, Ronen Israel, Tobias Moskowitz, and Lasse Heje Pederson. 2015. “Size Matters If You Control Your Junk.” Fama–Miller working paper (January).
Available at SSRN. Banz, Rolf. 1981. “The Relationship Between Return and Market Value of Common Stocks.” Journal of Financial Economics, vol.
9, no. 1 (March): 3–18. Hsu, Jason, Vitali Kalesnik, Helge Kostka, and Noah Beck. Forthcoming.
“Factor Zoology.” Research Affiliates working paper. Kalesnik, Vitali, and Noah Beck. 2014. “Busting the Myth About Size.” Research Affiliates Simply Stated, December.
Available at http:/ /www.researchaffiliates. com/Our%20Ideas/Insights/Fundamentals/Pages/284_Busting_the_Myth_ About_Size.aspx. Sloan, Richard. 1996. “Do Stock Prices Fully Reflect Information in Accruals and Cash Flows About Future Earnings?” The Accounting Review, vol.
71, no. 3 (July): 289–315. The authors wish to thank Chris Brightman, CFA, and Kay Jaitly, CFA, for their substantial contributions to this article. Disclosures The material contained in this document is for general information purposes only. It is not intended as an offer or a solicitation for the purchase and/or sale of any security, derivative, commodity, or financial instrument, nor is it advice or a recommendation to enter into any transaction.
Research results relate only to a hypothetical model of past performance (i.e., a simulation) and not to an asset management product. No allowance has been made for trading costs or management fees, which would reduce investment performance. Actual results may differ.
Index returns represent back-tested performance based on rules used in the creation of the index, are not a guarantee of future performance, and are not indicative of any specific investment. Indexes are not managed investment products and cannot be invested in directly. This material is based on information that is considered to be reliable, but Research Affiliates™ and its related entities (collectively “Research Affiliates”) make this information available on an “as is” basis without a duty to update, make warranties, express or implied, regarding the accuracy of the information contained herein.
Research Affiliates is not responsible for any errors or omissions or for results obtained from the use of this information. Nothing contained in this material is intended to constitute legal, tax, securities, financial or investment advice, nor an opinion regarding the appropriateness of any investment. The information contained in this material should not be acted upon without obtaining advice from a licensed professional.
Research Affiliates, LLC, is an investment adviser registered under the Investment Advisors Act of 1940 with the U.S. Securities and Exchange Commission (SEC). Our registration as an investment adviser does not imply a certain level of skill or training. Investors should be aware of the risks associated with data sources and quantitative processes used in our investment management process.
Errors may exist in data acquired from third party vendors, the construction of model portfolios, and in coding related to the index and portfolio construction process. While Research Affiliates takes steps to identify data and process errors so as to minimize the potential impact of such errors on index and portfolio performance, we cannot guarantee that such errors will not occur. The trademarks Fundamental Index™, RAFI™, Research Affiliates Equity™, RAE™, and the Research Affiliates™ trademark and corporate name and all related logos are the exclusive intellectual property of Research Affiliates, LLC and in some cases are registered trademarks in the U.S. and other countries. Various features of the Fundamental Index™ methodology, including an accounting data-based non-capitalization data processing system and method for creating and weighting an index of securities, are protected by various patents, and patent-pending intellectual property of Research Affiliates, LLC. (See all applicable US Patents, Patent Publications, Patent Pending intellectual property and protected trademarks located at http:/ /www.researchaffiliates.com/ Pages/ legal.aspx#d, which are fully incorporated herein.) Any use of these trademarks, logos, patented or patent pending methodologies without the prior written permission of Research Affiliates, LLC, is expressly prohibited.
Research Affiliates, LLC, reserves the right to take any and all necessary action to preserve all of its rights, title, and interest in and to these marks, patents or pending patents. The views and opinions expressed are those of the author and not necessarily those of Research Affiliates, LLC. The opinions are subject to change without notice. ©2015 Research Affiliates, LLC. All rights reserved. 620 Newport Center Drive, Suite 900 | Newport Beach, CA 92660 | + 1 (949) 325 - 8700 | www.researchaffiliates.com Page 7 .
FUNDAMENTALS November 2015 APPENDIX Table A1. Summary of Findings on the Size Premium Arguments in Favor: Arguments Against: • • • • Over the period July 1926 to July 2014, there was a size premium of 3.4% per annum in the United States. The U.S. size premium is statistically significant (with a p-value of 1.7%), assuming the returns are normally distributed. In the 30+ years since the publication of Banz’s (1981) article, there has been an average size premium of 1.0% per annum across 18 developed markets including the United States. • • • • • • • T here is an upward bias in size premium estimates due to inaccurate returns on delisted stocks in major databases. Indices and hypothetical portfolios ignore trading costs. The statistical significance of the size premium estimates is likely overstated due to datamining and reporting bias. Even ignoring biases, there is no unquestionably significant evidence in support of the size factor. T he estimate of the U.S. size premium is dominated by extreme outliers from the 1930s. T he assumption of normality used to obtain statistical significance in the U.S.
sample is extremely dubious. T here is no statistical significance outside the United States. E ven ignoring biases, there is no risk-adjusted performance advantage attributable to the size factor. Source: Research Affiliates, LLC, and Kalesnik and Beck (2014). Table A2. Quality Signal Definitions Quality Group Definition Accounting Quality Accruals Net Operating Assets Accruals (Sloan, 1996) Accruals Decline/Growth Earnings Smoothness Financial Constraints / Distress Kaplan Zingales Index Debt Coverage Ratio S.T. Change in Asset Liquidity Net Cash Outflow Interest Coverage Ratio Earnings Stability Growth Activities S.T.
Change in Inventory Stability of Gross Profitability Stability of Cash Flow Profitability Stability of Margins R&D Expense Capital Expense Advertising Expense Quality Group Definition Profitability Gross Profitability ROA ROE Net ROE Cash Flow Profitability Growth in Profitability L.T. Change in ROA L.T. Change in ROE L.T.
Change in Cash Flow Profitability L.T. Change in Gross Profitability Margins ROR Margins Operating Margins Growth in Margin L.T. Change in Margin S.T.
Change in Asset Turnover S.T. Change in Margin Capital Structure Change in L.T. Leverage Market Leverage Book Leverage Source: Research Affiliates, LLC. 620 Newport Center Drive, Suite 900 | Newport Beach, CA 92660 | + 1 (949) 325 - 8700 | www.researchaffiliates.com Page 8 .
The folklore claims 10% of fishermen catch 90% of the fish. What do the top 10% know that the others don’t? Small-Cap Alpha: Abundant, but Unreliable Investors’ search for alpha is not dissimilar to the strategies of skilled and experienced fishermen. First, the skilled know the right location.
They use multiple lines and hooks or lures to increase their opportunities. And they attract greater numbers of fish by chumming—adding scent or bait to the water. In the world of asset management, we can think of risk and mispricing as the chum that attracts alpha. Just as all fishing locations are not equal—contrast the teeming Lake Tahoe with the perishing Salton Sea—not all segments of the equity market are equal in the opportunities they present for finding alpha. have significantly higher return dispersion Lake Tahoe is well known for both its abundance and diversity of fish.
The academic literature has made a similar case for small stocks, often believed to be a deep pool into which an investor can cast her net and pull out a weighty haul of alpha. Stocks of small companies vary significantly in price volatility, are more prone to defaults, and have high trading costs. In combination, these characteristics create an unpredictable risk distribution for small-cap stocks, and the same traits contribute to their frequently being mispriced. In addition, many known anomalies, or risk factors, among small companies, creating numerous opportunities for alpha production. Our research shows, however, that small stocks are not a dependable source of standalone premium.
Granted, the small-cap universe is plentiful—there are thousands more small companies than large companies—and diverse—the U.S. economy encourages virtually any type of business or strategy an entrepreneur can envision—but these traits alone are insufficient to ensure small caps will unfailingly produce an excess return. Media Contacts United States and Canada Hewes Communications + 1 (212) 207-9450 hewesteam@hewescomm.com Europe JPES Partners (London) +44 (0) 20 7520 7620 ra@jpespartners.com . FUNDAMENTALS Many market participants believe that, just like value stocks outperform growth stocks, and positive momentum stocks outperform negative momentum stocks, small-cap stocks outperform large-cap stocks. In a recent article (Kalesnik and Beck, 2014), we discuss the evidence that supports the size premium. Table A1 in the Appendix lists the main arguments in favor and against small size as a standalone source of premium. In our view, the arguments against are much stronger than the arguments in favor: we judge the evidence that smallcap companies, in general, outperform large-cap companies to be unreliable. Our advice to the equity investor is to examine that small cap you are considering to be sure it has the alpha-producing qualities you seek—if November 2015 A Fertile Fishing Spot The higher price volatility of small caps Even if small companies are not as a group reliably outperforming large companies, small-cap stocks still hold significant promise for investors—they are a fertile fishing spot for alpha. Small caps, like other investment strategies, benefit from two potential sources of outperformance: 1) exposure to sources of risk that are compensated with higher returns, and 2) systematic sources of mispricing that can be exploited. is evident at both portfolio and stockspecific levels.
The portfolio composed of the smallest 20% of stocks is about 44% more volatile than the portfolio of the largest 20% of stocks—20.6% versus 14.3%, respectively. A portfolio, however, masks a lot of stock-specific volatility. A comparison of the median stock volatility of the highest and lowest quintiles is significantly more striking: the median volatility of the smallest stocks (50.5%) is almost 100% more volatile Small stocks come with higher risk than large stocks as measured by credit rating, delisting probability, and volatility. Table 1 reports the distress and volatility characteristics of U.S.
stocks by size quintile. The S&P credit rating difference than the median volatility of the largest stocks (25.5%). Also, the dispersion in stock volatility is much greater for small stocks than for large stocks, with a 25th– 75th percentile range of 32.1%–76.0% compared to 19.8%–33.2%, respectively. With a much wider dispersion in stock- between small-cap stocks (B rated) and level risk, investors looking to capitalize large-cap stocks (A+ rated) indicates on known risk premia should consider the higher likelihood (over 200 times) doing their fishing in the small-cap side Small caps are not the fish, they are of smaller stocks being delisted, often of the pond. the fishing spot—not the source of because of default.
Small caps have a alpha, but rather a place where alpha delisting rate of 2.38% versus 0.01% Smaller companies, by virtue of their vast can be found. for large caps. numbers, limited market liquidity, and absent, toss that small fish back, and cast your line again. Table 1. Distress and Volatility Characteristics of Stocks by Size Groups (U.S., 1988–2014) Size Quintile S&P Credit Rating (Average over full period) % of Companies Delisted (Annual average) Portfolio Volatility 25th Percentile Stock Volatility Median Stock Volatility 75th Percentile Stock Volatility 1—Smallest 20% B 2.38% 20.6% 32.1% 50.5% 76.0% 2 BB– 0.37% 20.6% 26.8% 37.6% 51.7% 3 BB 0.13% 19.0% 23.8% 32.1% 42.8% 4 BBB– 0.03% 17.0% 21.1% 28.2% 37.0% 5—Largest 20% A+ 0.01% 14.3% 19.8% 25.5% 33.2% Note: Quintiles are defined by joint NYSE/NYSE MKT (formerly American Stock Exchange) breakpoints. Source: Research Affiliates, LLC, using CRSP/Compustat Database. 620 Newport Center Drive, Suite 900 | Newport Beach, CA 92660 | + 1 (949) 325 - 8700 | www.researchaffiliates.com Page 2 . FUNDAMENTALS November 2015 as a category to have very light analyst coverage. Therefore, much less is known years. Large trading costs make potential trades of small-cap stocks less profitable, allowing the mispricing to persist. “ by, or available to, the average investor about the fundamental strength of most small companies. Investors struggle to the fish, they are the digest this complexity and to translate the information they are able to discern into efficient prices.
Greater instances of mispricing are the practical outcome. Such mispricing creates an opportunity for investors to capture excess returns, much as the fisherman’s baited hook entices the next bream that skims by. If mispricing in the small-cap segment of the market is well known, why does the mispricing persist? Why is it not arbitraged away? One likely reason is high trading costs. Table 2 lists the average bid–ask spreads for each of the size quintiles over the period 1988–2014. The bid–ask spread serves as a proxy for trading costs.
Clearly, the average spread is much higher for the smallest-cap quintile compared to the largest over both the entire 27-year period and the last 10 Small caps are not “ resultant lower investor demand, tend Value in small caps. In the simplest inter- fishing spot. pretation, value strategies favor the stocks Just as a lake with heavier vegetation provides a more fertile environment for fish to thrive, we believe the smallcap universe provides fertile ground for finding highly mispriced stocks. In the never-ending debate over whether certain sources of outperformance— such as value and momentum—arise from risk or mispricing, for our purposes, it actually doesn’t matter! Based on the evidence we have just presented, small caps offer a bountiful location to find alpha. Reeling In Alpha to exploit the higher riskiness and greater probability of mispricing in small-cap stocks by implementing outperforming strategies—such as those that capture the value, momentum, and quality premiums— within the small-cap universe. As we stated in the previous section, outperformance requires that risk be adequately compensated by return.
In seeking excess returns, we can attempt of companies with high accounting fundamentals-to-price ratios (value stocks) relative to those with low fundamentals-toprice ratios (growth stocks). The high ratio of fundamentals relative to price can signal that the stock is justifiably risky so that the market is willing to purchase the stock only at a reduced price. Alternatively, the high ratio may signal that the stock is actually underpriced for its fundamentals.
In either case, historical experience has shown that buying value companies has been a profitable strategy. For value stocks deemed to be cheap because of higher risk, this characteristic should be magnified in the more opaque small-cap universe, and hence, offer Table 2. Bid–Ask Spreads by Size Groups (U.S., 1988–2014) Size Quintile Bid–Ask Spread (Average over full period) Bid–Ask Spread (Average last 10 years) 1—Smallest 20% 4.56% 1.57% 2 2.11% 0.29% 3 1.25% 0.13% 4 0.83% 0.10% 5— Largest 20% 0.46% 0.06% Note: Quintiles are defined by joint NYSE/NYSE MKT (formerly American Stock Exchange) breakpoints. Source: Research Affiliates, LLC, using CRSP/Compustat Database. 620 Newport Center Drive, Suite 900 | Newport Beach, CA 92660 | + 1 (949) 325 - 8700 | www.researchaffiliates.com Page 3 . FUNDAMENTALS November 2015 investors a higher premium for assuming that risk. For value stocks attributed to mispricing (i.e., fundamentally strong stocks being temporarily priced too low, and vice versa), returns should be higher when the value strategy is executed in small caps because of the greater potential for the mispricing of small companies. In Table 3 we show the performance of different definitions to growth stocks is significantly larger for the strategies executed in small-cap stocks. The t-stats of two of the long– short value strategies implemented in small caps are significant at the 1% level, and one is significant at the 5% level.
This compares to two of the same strategies implemented in the large-cap universe being significant at the 5% level, and one at the 10% level. of value strategies implemented in both large-cap and small-cap stocks from Momentum in small caps. The momentum 1967 to 2014. strategy favors stocks that over a recent period have risen steadily in price. Value stocks, regardless of the definition Once identified, these stocks typically of value, outperform growth stocks in continue their upward, outperforming both large-cap and small-cap market trajectory for an additional period of segments. the time; momentum can also assume a outperformance of value stocks relative downward trajectory. Like the value strategy, the momentum strategy’s ability to deliver excess returns has both risk and mispricing explanations.
In our view, the most convincing argument is related to risk, that is, market participants initially underreact to earnings surprises (up or down), only to follow up with a buy or sell action when the earnings information is later confirmed. Similar to the argument we made for implementing a value strategy with small-cap stocks, the risk associated with a momentum strategy would also be amplified when implemented with small caps and would generate a higher return premium. 1 More importantly, If momentum derives its value-add from mispricing, the fact that small caps are potentially more prone to Table 3. Performance of Value Strategies in Large-Cap and Small-Cap Universes (U.S., 1967–2014) Value Growth t-Stat of Long–Short Return Volatility Return Volatility Sharpe Ratio of Long–Short Book-to-Price 13.1% 16.7% 9.3% 16.8% 0.29 2.02** Earnings-to-Price 13.3% 16.0% 8.8% 17.8% 0.31 2.14** Cash Flow-to-Price 13.0% 16.3% 9.2% 17.3% 0.28 1.92* Dividends-to-Price 12.7% 13.9% 9.4% 20.0% 0.13 0.89 Performance of Average Portfolio 13.1% 15.5% 9.2% 17.8% 0.26 1.81* Book-to-Price 16.6% 23.2% 10.5% 22.8% 0.44 3.04*** Earnings-to-Price 15.9% 20.7% 10.2% 25.3% 0.30 2.11** Cash Flow-to-Price 17.0% 22.5% 10.2% 23.1% 0.46 3.17*** Dividends-to-Price 15.4% 16.7% 11.2% 25.1% 0.14 0.96 Performance of Average Portfolio 16.3% 20.5% 10.6% 24.0% 0.37 2.54** Small Cap Large Cap Definition *Statistically significant at the 10% level. **Statistically significant at the 5% level. ***Statistically significant at the 1% level. Source: Hsu et al.
(2015) and Research Affiliates, LLC, using CRSP/Compustat data. 620 Newport Center Drive, Suite 900 | Newport Beach, CA 92660 | + 1 (949) 325 - 8700 | www.researchaffiliates.com Page 4 . FUNDAMENTALS mispricing should make a momentum strategy implemented in small caps even more profitable. In Table 4 we compare the performance of the recent winners versus losers in the universes of large-cap and small-cap stocks. The gains from momentum are much higher among the small caps. The t-stats of all five momentum strategies implemented in small caps are significant at the 1% level compared to only two of the five strategies being significant at the 10% level when implemented in large caps. Quality in small caps.
Quality investing as a standalone strategy has been gaining November 2015 a lot of attention. Investing in quality companies is intuitively appealing, but what drivers underlie the strategy? Again, the possible explanations are mispricing and risk. Mispricing theory would argue that investors are unable to correctly translate information beyond simple financial metrics into efficient prices, and risk theory would argue that several metrics related to quality are associated with a distinct undiversifiable correlation pattern, which in a multifactor setting may signal that quality stocks are compensated by a risk premium.
If either or both of these explanations are true, we would expect a stronger relationship in the universe of small-cap stocks. A quality strategy encompasses a very broad category of possible signals, creating the danger of focusing on a nonrepresentative outlier. To avoid this potential problem, we identify nine broad groups of quality definitions, and within these groups, 35 narrower definitions. Table A2 in the Appendix provides the definitions.
We simulate the performance of the 35 quality definitions in both large-cap and smallcap universes. Table 5 provides these results.2 We find that for large-cap stocks in the aggregate, quality stocks do not have a performance advantage over junk Table 4. Performance of Momentum Strategies in Large-Cap and Small-Cap Universes (U.S., 1967–2014) Winners Losers t-Stat of Long–Short Return Volatility Return Volatility Sharpe Ratio of Long–Short –2 to –12 Months 13.0% 17.2% 8.3% 18.7% 0.27 1.88* –2 to –12 Months 3-Mo.
Hold 12.3% 17.5% 8.3% 18.5% 0.24 1.67* –2 to –12 Months 1-Yr. Hold 11.2% 17.5% 9.3% 17.5% 0.13 0.92 –2 to –6 Months 10.4% 16.9% 10.7% 18.8% -0.04 -0.29 –1 to –12 Months 12.4% 17.0% 9.3% 19.3% 0.16 1.11 Performance of Average Portfolio 11.9% 17.0% 9.2% 18.3% 0.17 1.17 –2 to –12 Months 17.9% 21.2% 3.7% 27.1% 0.72 4.99*** –2 to –12 Months 3-Mo. Hold 16.3% 21.3% 4.3% 26.4% 0.65 4.51*** –2 to –12 Months 1-Yr.
Hold 14.7% 21.2% 8.4% 25.1% 0.39 2.69*** –2 to –6 Months 15.3% 21.2% 5.6% 26.7% 0.51 3.54*** –1 to –12 Months 16.5% 20.9% 5.8% 27.9% 0.47 3.24*** Performance of Average Portfolio 16.2% 21.1% 5.6% 26.4% 0.58 4.04*** Small Cap Large Cap Definition *Statistically significant at the 10% level. **Statistically significant at the 5% level. ***Statistically significant at the 1% level. Source: Hsu et al. (forthcoming) and Research Affiliates, LLC, using CRSP/Compustat data. 620 Newport Center Drive, Suite 900 | Newport Beach, CA 92660 | + 1 (949) 325 - 8700 | www.researchaffiliates.com Page 5 . FUNDAMENTALS November 2015 Table 5. Performance of Quality Strategies in Large-Cap and Small-Cap Universes (U.S., 1967–2014) Strategy Large Cap Small Cap Quality Definition Junk Sharpe Ratio of Long–Short t-Stat of Long–Short Return Volatility Return Volatility Performance of Average Portfolio 10.7% 15.3% 10.3% 16.1% 0.06 0.40 Performance of Average Portfolio 13.9% 20.7% 12.4% 22.1% 0.38 2.66*** *Statistically significant at the 10% level. **Statistically significant at the 5% level. ***Statistically significant at the 1% level. Source: Hsu et al. (2015) and Research Affiliates, LLC, using CRSP/Compustat data. universe, quality stocks outperform junk stocks. The performance advantage as indicated by the t-stat of the long–short quality portfolio is statistically significant at the 1% level for small caps. In the recent article “Size Matters If You Control Your Junk,” Asness et al.
(2015) document that small-cap companies outperform the market if low-quality companies are avoided. We have a minor quibble with the interpretation of trying to rescue the size premium by controlling for junk. Why not “Size Matters If You Control Your Growth” or “Size Matters If You Avoid Losers”? Arguing that size matters if you control for junk, rather than arguing that most anomalies generate better performance—or any performance at all—when implemented in small-cap stocks, is not much different from arguing, for example, that rebalancing is a repackaged value strategy. At the end of the day, however, our empirical findings and those of Asness et al.
are similar: quality small-cap stocks can be a good source of excess return. “ The small-cap universe provides fertile ground for finding highly mispriced stocks. “ stocks.3 By contrast, in the small-cap Both Location and Skill Matter The key to a successful day of fishing is location. The same is true of outperforming in the equity market. The investor must find where alpha is located. Small size—along with value and momentum—is generally considered to be a singularly promising location.
Our empirical research, however, calls this characteristics to the extreme; wellknown anomalies show much stronger outcomes when implemented among smaller companies. We conclude that exploiting outperforming strategies within the small-cap universe can deliver excess returns. Because small-cap stocks have high trading costs, implementation skill matters—a lot. Passive implementation of investment strategies in the smallcap segment of the market is definitely disadvantaged versus their skilled active implementation.
Active managers can hide their trades, position themselves to narrow the bid–ask spread, and general wisdom into question. minimize turnover. Ultimately, the equity We find that small size alone does by emulating the skilled fisherman: first, not guarantee outperformance. But identifying a promising location (i.e., small size does offer fertile waters small cap stocks), then using multiple in which to find alpha and reel it in. lines and hooks (i.e., implementing value, Both sources of outperformance in momentum, and quality strategies to investment investor will haul in a larger alpha catch strategies—compensated exploit the chum of risk and mispricing risk and mispricing—are amplified when in each), and lastly, dangling the lure of implemented in the small-cap universe skilled active management to tease out because small-cap stocks take both the smallest trading costs possible. 620 Newport Center Drive, Suite 900 | Newport Beach, CA 92660 | + 1 (949) 325 - 8700 | www.researchaffiliates.com Page 6 .
FUNDAMENTALS Endnotes 1. 2. 3. November 2015 References The only value strategy that lacks statistical significance in Table 3 is the strategy defined by dividend yield. It comes with significant volatility reduction, a feature, however, that can make the strategy attractive to some investors. The lower volatility of the high dividend–yield portfolio increases the volatility of the long–short portfolio used in the statistical test and renders the difference statistically insignificant. Hsu et al. (forthcoming) document that in terms of Sharpe ratios, the value strategy defined as dividend yields provides an economically and statistically significant advantage. We show only the aggregate results in the interest of space. We interpret these findings as a lack of robustness for quality as a broad investment category.
It does not mean that individual definitions of quality may not have investment merits; further characteristics may be of interest and deserve more detailed study. Asness, Cliff, Andrea Frazzini, Ronen Israel, Tobias Moskowitz, and Lasse Heje Pederson. 2015. “Size Matters If You Control Your Junk.” Fama–Miller working paper (January).
Available at SSRN. Banz, Rolf. 1981. “The Relationship Between Return and Market Value of Common Stocks.” Journal of Financial Economics, vol.
9, no. 1 (March): 3–18. Hsu, Jason, Vitali Kalesnik, Helge Kostka, and Noah Beck. Forthcoming.
“Factor Zoology.” Research Affiliates working paper. Kalesnik, Vitali, and Noah Beck. 2014. “Busting the Myth About Size.” Research Affiliates Simply Stated, December.
Available at http:/ /www.researchaffiliates. com/Our%20Ideas/Insights/Fundamentals/Pages/284_Busting_the_Myth_ About_Size.aspx. Sloan, Richard. 1996. “Do Stock Prices Fully Reflect Information in Accruals and Cash Flows About Future Earnings?” The Accounting Review, vol.
71, no. 3 (July): 289–315. The authors wish to thank Chris Brightman, CFA, and Kay Jaitly, CFA, for their substantial contributions to this article. Disclosures The material contained in this document is for general information purposes only. It is not intended as an offer or a solicitation for the purchase and/or sale of any security, derivative, commodity, or financial instrument, nor is it advice or a recommendation to enter into any transaction.
Research results relate only to a hypothetical model of past performance (i.e., a simulation) and not to an asset management product. No allowance has been made for trading costs or management fees, which would reduce investment performance. Actual results may differ.
Index returns represent back-tested performance based on rules used in the creation of the index, are not a guarantee of future performance, and are not indicative of any specific investment. Indexes are not managed investment products and cannot be invested in directly. This material is based on information that is considered to be reliable, but Research Affiliates™ and its related entities (collectively “Research Affiliates”) make this information available on an “as is” basis without a duty to update, make warranties, express or implied, regarding the accuracy of the information contained herein.
Research Affiliates is not responsible for any errors or omissions or for results obtained from the use of this information. Nothing contained in this material is intended to constitute legal, tax, securities, financial or investment advice, nor an opinion regarding the appropriateness of any investment. The information contained in this material should not be acted upon without obtaining advice from a licensed professional.
Research Affiliates, LLC, is an investment adviser registered under the Investment Advisors Act of 1940 with the U.S. Securities and Exchange Commission (SEC). Our registration as an investment adviser does not imply a certain level of skill or training. Investors should be aware of the risks associated with data sources and quantitative processes used in our investment management process.
Errors may exist in data acquired from third party vendors, the construction of model portfolios, and in coding related to the index and portfolio construction process. While Research Affiliates takes steps to identify data and process errors so as to minimize the potential impact of such errors on index and portfolio performance, we cannot guarantee that such errors will not occur. The trademarks Fundamental Index™, RAFI™, Research Affiliates Equity™, RAE™, and the Research Affiliates™ trademark and corporate name and all related logos are the exclusive intellectual property of Research Affiliates, LLC and in some cases are registered trademarks in the U.S. and other countries. Various features of the Fundamental Index™ methodology, including an accounting data-based non-capitalization data processing system and method for creating and weighting an index of securities, are protected by various patents, and patent-pending intellectual property of Research Affiliates, LLC. (See all applicable US Patents, Patent Publications, Patent Pending intellectual property and protected trademarks located at http:/ /www.researchaffiliates.com/ Pages/ legal.aspx#d, which are fully incorporated herein.) Any use of these trademarks, logos, patented or patent pending methodologies without the prior written permission of Research Affiliates, LLC, is expressly prohibited.
Research Affiliates, LLC, reserves the right to take any and all necessary action to preserve all of its rights, title, and interest in and to these marks, patents or pending patents. The views and opinions expressed are those of the author and not necessarily those of Research Affiliates, LLC. The opinions are subject to change without notice. ©2015 Research Affiliates, LLC. All rights reserved. 620 Newport Center Drive, Suite 900 | Newport Beach, CA 92660 | + 1 (949) 325 - 8700 | www.researchaffiliates.com Page 7 .
FUNDAMENTALS November 2015 APPENDIX Table A1. Summary of Findings on the Size Premium Arguments in Favor: Arguments Against: • • • • Over the period July 1926 to July 2014, there was a size premium of 3.4% per annum in the United States. The U.S. size premium is statistically significant (with a p-value of 1.7%), assuming the returns are normally distributed. In the 30+ years since the publication of Banz’s (1981) article, there has been an average size premium of 1.0% per annum across 18 developed markets including the United States. • • • • • • • T here is an upward bias in size premium estimates due to inaccurate returns on delisted stocks in major databases. Indices and hypothetical portfolios ignore trading costs. The statistical significance of the size premium estimates is likely overstated due to datamining and reporting bias. Even ignoring biases, there is no unquestionably significant evidence in support of the size factor. T he estimate of the U.S. size premium is dominated by extreme outliers from the 1930s. T he assumption of normality used to obtain statistical significance in the U.S.
sample is extremely dubious. T here is no statistical significance outside the United States. E ven ignoring biases, there is no risk-adjusted performance advantage attributable to the size factor. Source: Research Affiliates, LLC, and Kalesnik and Beck (2014). Table A2. Quality Signal Definitions Quality Group Definition Accounting Quality Accruals Net Operating Assets Accruals (Sloan, 1996) Accruals Decline/Growth Earnings Smoothness Financial Constraints / Distress Kaplan Zingales Index Debt Coverage Ratio S.T. Change in Asset Liquidity Net Cash Outflow Interest Coverage Ratio Earnings Stability Growth Activities S.T.
Change in Inventory Stability of Gross Profitability Stability of Cash Flow Profitability Stability of Margins R&D Expense Capital Expense Advertising Expense Quality Group Definition Profitability Gross Profitability ROA ROE Net ROE Cash Flow Profitability Growth in Profitability L.T. Change in ROA L.T. Change in ROE L.T.
Change in Cash Flow Profitability L.T. Change in Gross Profitability Margins ROR Margins Operating Margins Growth in Margin L.T. Change in Margin S.T.
Change in Asset Turnover S.T. Change in Margin Capital Structure Change in L.T. Leverage Market Leverage Book Leverage Source: Research Affiliates, LLC. 620 Newport Center Drive, Suite 900 | Newport Beach, CA 92660 | + 1 (949) 325 - 8700 | www.researchaffiliates.com Page 8 .


