Monthly Economic Outlook by Scott J. Brown, Ph.D. - March 7, 2016
Raymond James Financial Services


Description
Economic Research
Published by Raymond James & Associates
Scott J. Brown, Ph.D., (727) 567-2603, Scott.J.Brown@RaymondJames.com
March 7, 2016
Monthly Economic Outlook ______________________________________________________________________________________
Cognitive Dissonance
Core Consumer Price Inflation, y/y % ch.
The consumer outlook remains positive, driven by job
gains, wage growth, and a further decline in gasoline prices.
Consumers are concerned about the overall economy, but
generally feel better about their own financial situation.
Businesses remain mostly cautious amid concerns about
global growth, fear of “recession,” and election-year
uncertainty. Foreign trade and an inventory correction are likely
to be moderate drags on GDP growth in the near term.
The Fed remains in tightening mode, but recent financial
market developments should keep monetary policy on hold in
the near term. A June hike is likely to be on the table, but the
decision to move will remain data-dependent.
Real GDP rose at a 1.0% annual rate in the government’s
nd
2 estimate for the fourth quarter, restrained by a wider trade
deficit, a minor inventory correction, and a decline in business
fixed investment.
Strains appear to have continued into early 2016. However, domestic demand is expected to remain relatively strong, led by a rebound in consumer spending growth. Real Private Domestic Final Purchases (consumer spending, business fixed investment, and residential fixed investment) rose at a 1.7% annual rate in 4Q15, up 2.7% y/y. Contributions To U.S.
GDP Growth, % 6 Pers. Spd. Resid. Inv. Exports Ch.
Invent. 5 Bus. Inv. Gov't Imports Real GDP 6 5 4 4 3 3 2 2 1 1 0 0 -1 -1 -2 -3 -2 Source: BEA -3 13.1 13.2 13.3 13.4 14.1 14.2 14.3 14.4 15.1 15.2 15.3 15.4 16.1 16.2 16.3 16.4 Nonfarm payrolls rose by 242,000 in the initial estimate for February. The three-month average was 228,000, well over twice the pace needed to be consistent with the growth in the working-age population (about 100,000).
The unemployment rate held steady at 4.9%, while labor force participation picked up. Many potential workers, currently on the sidelines, out of work but not classified as “unemployed,” are likely to re-enter the labor force as the job market tightens and wage growth picks up. However, the pace of job growth is expected to slow eventually as job market slack is reduced.
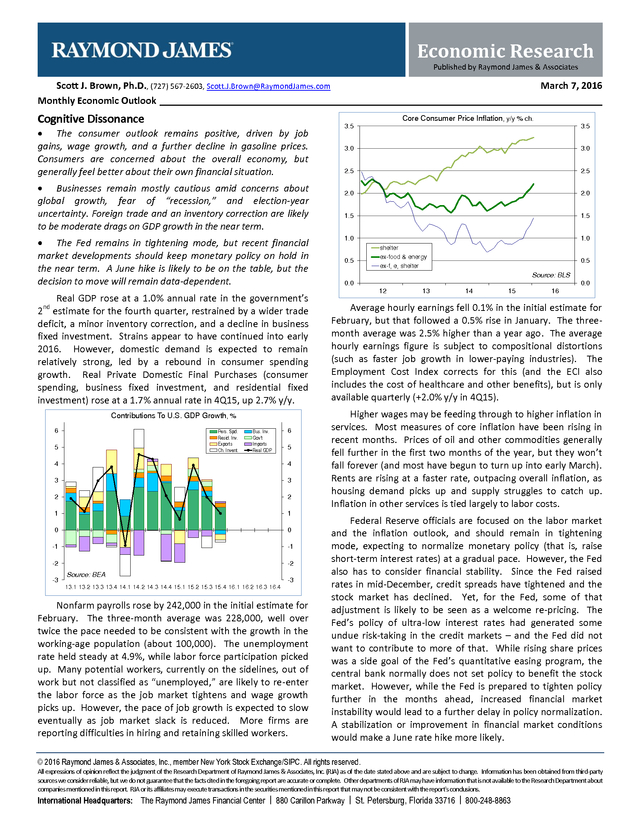
More firms are reporting difficulties in hiring and retaining skilled workers. 3.5 3.5 3.0 3.0 2.5 2.5 2.0 2.0 1.5 1.5 1.0 0.5 1.0 shelter ex-food & energy ex-f, e, shelter 0.5 Source: BLS 0.0 0.0 12 13 14 15 16 Average hourly earnings fell 0.1% in the initial estimate for February, but that followed a 0.5% rise in January. The threemonth average was 2.5% higher than a year ago. The average hourly earnings figure is subject to compositional distortions (such as faster job growth in lower-paying industries).
The Employment Cost Index corrects for this (and the ECI also includes the cost of healthcare and other benefits), but is only available quarterly (+2.0% y/y in 4Q15). Higher wages may be feeding through to higher inflation in services. Most measures of core inflation have been rising in recent months. Prices of oil and other commodities generally fell further in the first two months of the year, but they won’t fall forever (and most have begun to turn up into early March). Rents are rising at a faster rate, outpacing overall inflation, as housing demand picks up and supply struggles to catch up. Inflation in other services is tied largely to labor costs. Federal Reserve officials are focused on the labor market and the inflation outlook, and should remain in tightening mode, expecting to normalize monetary policy (that is, raise short-term interest rates) at a gradual pace.
However, the Fed also has to consider financial stability. Since the Fed raised rates in mid-December, credit spreads have tightened and the stock market has declined. Yet, for the Fed, some of that adjustment is likely to be seen as a welcome re-pricing.
The Fed’s policy of ultra-low interest rates had generated some undue risk-taking in the credit markets – and the Fed did not want to contribute to more of that. While rising share prices was a side goal of the Fed’s quantitative easing program, the central bank normally does not set policy to benefit the stock market. However, while the Fed is prepared to tighten policy further in the months ahead, increased financial market instability would lead to a further delay in policy normalization. A stabilization or improvement in financial market conditions would make a June rate hike more likely. © 2016 Raymond James & Associates, Inc., member New York Stock Exchange/SIPC.
All rights reserved. All expressions of opinion reflect the judgment of the Research Department of Raymond James & Associates, Inc. (RJA) as of the date stated above and are subject to change. Information has been obtained from third-party sources we consider reliable, but we do not guarantee that the facts cited in the foregoing report are accurate or complete.
Other departments of RJA may have information that is not available to the Research Department about companies mentioned in this report. RJA or its affiliates may execute transactions in the securities mentioned in this report that may not be consistent with the report's conclusions. A Jl R s ic h T h b s a r t n e i International Headquarters: The Raymond James Financial Center | 880 Carillon Parkway | St. Petersburg, Florida 33716 | 800-248-8863 .
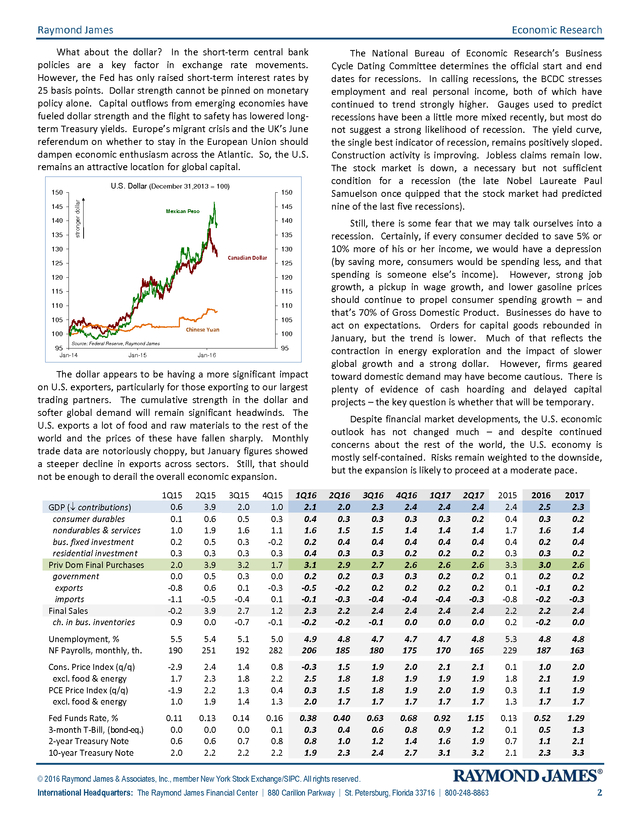
Raymond James Economic Research What about the dollar? In the short-term central bank policies are a key factor in exchange rate movements. However, the Fed has only raised short-term interest rates by 25 basis points. Dollar strength cannot be pinned on monetary policy alone. Capital outflows from emerging economies have fueled dollar strength and the flight to safety has lowered longterm Treasury yields. Europe’s migrant crisis and the UK’s June referendum on whether to stay in the European Union should dampen economic enthusiasm across the Atlantic.
So, the U.S. remains an attractive location for global capital. U.S. Dollar (December 31,2013 = 100) 145 140 135 stronger dollar 150 150 145 Mexican Peso 140 135 130 130 Canadian Dollar 125 125 120 120 115 115 110 110 105 105 Chinese Yuan 100 95 100 Source: Federal Reserve, Raymond James Jan-14 95 Jan-15 Jan-16 The dollar appears to be having a more significant impact on U.S. exporters, particularly for those exporting to our largest trading partners.
The cumulative strength in the dollar and softer global demand will remain significant headwinds. The U.S. exports a lot of food and raw materials to the rest of the world and the prices of these have fallen sharply.
Monthly trade data are notoriously choppy, but January figures showed a steeper decline in exports across sectors. Still, that should not be enough to derail the overall economic expansion. The National Bureau of Economic Research’s Business Cycle Dating Committee determines the official start and end dates for recessions. In calling recessions, the BCDC stresses employment and real personal income, both of which have continued to trend strongly higher.
Gauges used to predict recessions have been a little more mixed recently, but most do not suggest a strong likelihood of recession. The yield curve, the single best indicator of recession, remains positively sloped. Construction activity is improving. Jobless claims remain low. The stock market is down, a necessary but not sufficient condition for a recession (the late Nobel Laureate Paul Samuelson once quipped that the stock market had predicted nine of the last five recessions). Still, there is some fear that we may talk ourselves into a recession.
Certainly, if every consumer decided to save 5% or 10% more of his or her income, we would have a depression (by saving more, consumers would be spending less, and that spending is someone else’s income). However, strong job growth, a pickup in wage growth, and lower gasoline prices should continue to propel consumer spending growth – and that’s 70% of Gross Domestic Product. Businesses do have to act on expectations.
Orders for capital goods rebounded in January, but the trend is lower. Much of that reflects the contraction in energy exploration and the impact of slower global growth and a strong dollar. However, firms geared toward domestic demand may have become cautious.
There is plenty of evidence of cash hoarding and delayed capital projects – the key question is whether that will be temporary. Despite financial market developments, the U.S. economic outlook has not changed much – and despite continued concerns about the rest of the world, the U.S. economy is mostly self-contained.
Risks remain weighted to the downside, but the expansion is likely to proceed at a moderate pace. GDP ( contributions) consumer durables nondurables & services bus. fixed investment residential investment Priv Dom Final Purchases government exports imports Final Sales ch. in bus.
inventories 1Q15 0.6 0.1 1.0 0.2 0.3 2.0 0.0 -0.8 -1.1 -0.2 0.9 2Q15 3.9 0.6 1.9 0.5 0.3 3.9 0.5 0.6 -0.5 3.9 0.0 3Q15 2.0 0.5 1.6 0.3 0.3 3.2 0.3 0.1 -0.4 2.7 -0.7 4Q15 1.0 0.3 1.1 -0.2 0.3 1.7 0.0 -0.3 0.1 1.2 -0.1 1Q16 2.1 0.4 1.6 0.2 0.4 3.1 0.2 -0.5 -0.1 2.3 -0.2 2Q16 2.0 0.3 1.5 0.4 0.3 2.9 0.2 -0.2 -0.3 2.2 -0.2 3Q16 2.3 0.3 1.5 0.4 0.3 2.7 0.3 0.2 -0.4 2.4 -0.1 4Q16 2.4 0.3 1.4 0.4 0.2 2.6 0.3 0.2 -0.4 2.4 0.0 1Q17 2.4 0.3 1.4 0.4 0.2 2.6 0.2 0.2 -0.4 2.4 0.0 2Q17 2.4 0.2 1.4 0.4 0.2 2.6 0.2 0.2 -0.3 2.4 0.0 2015 2.4 0.4 1.7 0.4 0.3 3.3 0.1 0.1 -0.8 2.2 0.2 2016 2.5 0.3 1.6 0.2 0.3 3.0 0.2 -0.1 -0.2 2.2 -0.2 2017 2.3 0.2 1.4 0.4 0.2 2.6 0.2 0.2 -0.3 2.4 0.0 Unemployment, % NF Payrolls, monthly, th. 5.5 190 5.4 251 5.1 192 5.0 282 4.9 206 4.8 185 4.7 180 4.7 175 4.7 170 4.8 165 5.3 229 4.8 187 4.8 163 Cons. Price Index (q/q) excl. food & energy PCE Price Index (q/q) excl.
food & energy -2.9 1.7 -1.9 1.0 2.4 2.3 2.2 1.9 1.4 1.8 1.3 1.4 0.8 2.2 0.4 1.3 -0.3 2.5 0.3 2.0 1.5 1.8 1.5 1.7 1.9 1.8 1.8 1.7 2.0 1.9 1.9 1.7 2.1 1.9 2.0 1.7 2.1 1.9 1.9 1.7 0.1 1.8 0.3 1.3 1.0 2.1 1.1 1.7 2.0 1.9 1.9 1.7 Fed Funds Rate, % 3-month T-Bill, (bond-eq.) 2-year Treasury Note 10-year Treasury Note 0.11 0.0 0.6 2.0 0.13 0.0 0.6 2.2 0.14 0.0 0.7 2.2 0.16 0.1 0.8 2.2 0.38 0.3 0.8 1.9 0.40 0.4 1.0 2.3 0.63 0.6 1.2 2.4 0.68 0.8 1.4 2.7 0.92 0.9 1.6 3.1 1.15 1.2 1.9 3.2 0.13 0.1 0.7 2.1 0.52 0.5 1.1 2.3 1.29 1.3 2.1 3.3 © 2016 Raymond James & Associates, Inc., member New York Stock Exchange/SIPC. All rights reserved. International Headquarters: The Raymond James Financial Center | 880 Carillon Parkway | St. Petersburg, Florida 33716 | 800-248-8863 2 .
Strains appear to have continued into early 2016. However, domestic demand is expected to remain relatively strong, led by a rebound in consumer spending growth. Real Private Domestic Final Purchases (consumer spending, business fixed investment, and residential fixed investment) rose at a 1.7% annual rate in 4Q15, up 2.7% y/y. Contributions To U.S.
GDP Growth, % 6 Pers. Spd. Resid. Inv. Exports Ch.
Invent. 5 Bus. Inv. Gov't Imports Real GDP 6 5 4 4 3 3 2 2 1 1 0 0 -1 -1 -2 -3 -2 Source: BEA -3 13.1 13.2 13.3 13.4 14.1 14.2 14.3 14.4 15.1 15.2 15.3 15.4 16.1 16.2 16.3 16.4 Nonfarm payrolls rose by 242,000 in the initial estimate for February. The three-month average was 228,000, well over twice the pace needed to be consistent with the growth in the working-age population (about 100,000).
The unemployment rate held steady at 4.9%, while labor force participation picked up. Many potential workers, currently on the sidelines, out of work but not classified as “unemployed,” are likely to re-enter the labor force as the job market tightens and wage growth picks up. However, the pace of job growth is expected to slow eventually as job market slack is reduced.
More firms are reporting difficulties in hiring and retaining skilled workers. 3.5 3.5 3.0 3.0 2.5 2.5 2.0 2.0 1.5 1.5 1.0 0.5 1.0 shelter ex-food & energy ex-f, e, shelter 0.5 Source: BLS 0.0 0.0 12 13 14 15 16 Average hourly earnings fell 0.1% in the initial estimate for February, but that followed a 0.5% rise in January. The threemonth average was 2.5% higher than a year ago. The average hourly earnings figure is subject to compositional distortions (such as faster job growth in lower-paying industries).
The Employment Cost Index corrects for this (and the ECI also includes the cost of healthcare and other benefits), but is only available quarterly (+2.0% y/y in 4Q15). Higher wages may be feeding through to higher inflation in services. Most measures of core inflation have been rising in recent months. Prices of oil and other commodities generally fell further in the first two months of the year, but they won’t fall forever (and most have begun to turn up into early March). Rents are rising at a faster rate, outpacing overall inflation, as housing demand picks up and supply struggles to catch up. Inflation in other services is tied largely to labor costs. Federal Reserve officials are focused on the labor market and the inflation outlook, and should remain in tightening mode, expecting to normalize monetary policy (that is, raise short-term interest rates) at a gradual pace.
However, the Fed also has to consider financial stability. Since the Fed raised rates in mid-December, credit spreads have tightened and the stock market has declined. Yet, for the Fed, some of that adjustment is likely to be seen as a welcome re-pricing.
The Fed’s policy of ultra-low interest rates had generated some undue risk-taking in the credit markets – and the Fed did not want to contribute to more of that. While rising share prices was a side goal of the Fed’s quantitative easing program, the central bank normally does not set policy to benefit the stock market. However, while the Fed is prepared to tighten policy further in the months ahead, increased financial market instability would lead to a further delay in policy normalization. A stabilization or improvement in financial market conditions would make a June rate hike more likely. © 2016 Raymond James & Associates, Inc., member New York Stock Exchange/SIPC.
All rights reserved. All expressions of opinion reflect the judgment of the Research Department of Raymond James & Associates, Inc. (RJA) as of the date stated above and are subject to change. Information has been obtained from third-party sources we consider reliable, but we do not guarantee that the facts cited in the foregoing report are accurate or complete.
Other departments of RJA may have information that is not available to the Research Department about companies mentioned in this report. RJA or its affiliates may execute transactions in the securities mentioned in this report that may not be consistent with the report's conclusions. A Jl R s ic h T h b s a r t n e i International Headquarters: The Raymond James Financial Center | 880 Carillon Parkway | St. Petersburg, Florida 33716 | 800-248-8863 .
Raymond James Economic Research What about the dollar? In the short-term central bank policies are a key factor in exchange rate movements. However, the Fed has only raised short-term interest rates by 25 basis points. Dollar strength cannot be pinned on monetary policy alone. Capital outflows from emerging economies have fueled dollar strength and the flight to safety has lowered longterm Treasury yields. Europe’s migrant crisis and the UK’s June referendum on whether to stay in the European Union should dampen economic enthusiasm across the Atlantic.
So, the U.S. remains an attractive location for global capital. U.S. Dollar (December 31,2013 = 100) 145 140 135 stronger dollar 150 150 145 Mexican Peso 140 135 130 130 Canadian Dollar 125 125 120 120 115 115 110 110 105 105 Chinese Yuan 100 95 100 Source: Federal Reserve, Raymond James Jan-14 95 Jan-15 Jan-16 The dollar appears to be having a more significant impact on U.S. exporters, particularly for those exporting to our largest trading partners.
The cumulative strength in the dollar and softer global demand will remain significant headwinds. The U.S. exports a lot of food and raw materials to the rest of the world and the prices of these have fallen sharply.
Monthly trade data are notoriously choppy, but January figures showed a steeper decline in exports across sectors. Still, that should not be enough to derail the overall economic expansion. The National Bureau of Economic Research’s Business Cycle Dating Committee determines the official start and end dates for recessions. In calling recessions, the BCDC stresses employment and real personal income, both of which have continued to trend strongly higher.
Gauges used to predict recessions have been a little more mixed recently, but most do not suggest a strong likelihood of recession. The yield curve, the single best indicator of recession, remains positively sloped. Construction activity is improving. Jobless claims remain low. The stock market is down, a necessary but not sufficient condition for a recession (the late Nobel Laureate Paul Samuelson once quipped that the stock market had predicted nine of the last five recessions). Still, there is some fear that we may talk ourselves into a recession.
Certainly, if every consumer decided to save 5% or 10% more of his or her income, we would have a depression (by saving more, consumers would be spending less, and that spending is someone else’s income). However, strong job growth, a pickup in wage growth, and lower gasoline prices should continue to propel consumer spending growth – and that’s 70% of Gross Domestic Product. Businesses do have to act on expectations.
Orders for capital goods rebounded in January, but the trend is lower. Much of that reflects the contraction in energy exploration and the impact of slower global growth and a strong dollar. However, firms geared toward domestic demand may have become cautious.
There is plenty of evidence of cash hoarding and delayed capital projects – the key question is whether that will be temporary. Despite financial market developments, the U.S. economic outlook has not changed much – and despite continued concerns about the rest of the world, the U.S. economy is mostly self-contained.
Risks remain weighted to the downside, but the expansion is likely to proceed at a moderate pace. GDP ( contributions) consumer durables nondurables & services bus. fixed investment residential investment Priv Dom Final Purchases government exports imports Final Sales ch. in bus.
inventories 1Q15 0.6 0.1 1.0 0.2 0.3 2.0 0.0 -0.8 -1.1 -0.2 0.9 2Q15 3.9 0.6 1.9 0.5 0.3 3.9 0.5 0.6 -0.5 3.9 0.0 3Q15 2.0 0.5 1.6 0.3 0.3 3.2 0.3 0.1 -0.4 2.7 -0.7 4Q15 1.0 0.3 1.1 -0.2 0.3 1.7 0.0 -0.3 0.1 1.2 -0.1 1Q16 2.1 0.4 1.6 0.2 0.4 3.1 0.2 -0.5 -0.1 2.3 -0.2 2Q16 2.0 0.3 1.5 0.4 0.3 2.9 0.2 -0.2 -0.3 2.2 -0.2 3Q16 2.3 0.3 1.5 0.4 0.3 2.7 0.3 0.2 -0.4 2.4 -0.1 4Q16 2.4 0.3 1.4 0.4 0.2 2.6 0.3 0.2 -0.4 2.4 0.0 1Q17 2.4 0.3 1.4 0.4 0.2 2.6 0.2 0.2 -0.4 2.4 0.0 2Q17 2.4 0.2 1.4 0.4 0.2 2.6 0.2 0.2 -0.3 2.4 0.0 2015 2.4 0.4 1.7 0.4 0.3 3.3 0.1 0.1 -0.8 2.2 0.2 2016 2.5 0.3 1.6 0.2 0.3 3.0 0.2 -0.1 -0.2 2.2 -0.2 2017 2.3 0.2 1.4 0.4 0.2 2.6 0.2 0.2 -0.3 2.4 0.0 Unemployment, % NF Payrolls, monthly, th. 5.5 190 5.4 251 5.1 192 5.0 282 4.9 206 4.8 185 4.7 180 4.7 175 4.7 170 4.8 165 5.3 229 4.8 187 4.8 163 Cons. Price Index (q/q) excl. food & energy PCE Price Index (q/q) excl.
food & energy -2.9 1.7 -1.9 1.0 2.4 2.3 2.2 1.9 1.4 1.8 1.3 1.4 0.8 2.2 0.4 1.3 -0.3 2.5 0.3 2.0 1.5 1.8 1.5 1.7 1.9 1.8 1.8 1.7 2.0 1.9 1.9 1.7 2.1 1.9 2.0 1.7 2.1 1.9 1.9 1.7 0.1 1.8 0.3 1.3 1.0 2.1 1.1 1.7 2.0 1.9 1.9 1.7 Fed Funds Rate, % 3-month T-Bill, (bond-eq.) 2-year Treasury Note 10-year Treasury Note 0.11 0.0 0.6 2.0 0.13 0.0 0.6 2.2 0.14 0.0 0.7 2.2 0.16 0.1 0.8 2.2 0.38 0.3 0.8 1.9 0.40 0.4 1.0 2.3 0.63 0.6 1.2 2.4 0.68 0.8 1.4 2.7 0.92 0.9 1.6 3.1 1.15 1.2 1.9 3.2 0.13 0.1 0.7 2.1 0.52 0.5 1.1 2.3 1.29 1.3 2.1 3.3 © 2016 Raymond James & Associates, Inc., member New York Stock Exchange/SIPC. All rights reserved. International Headquarters: The Raymond James Financial Center | 880 Carillon Parkway | St. Petersburg, Florida 33716 | 800-248-8863 2 .


