Fixed Income Quarterly Outlook 2016 - Market Perspectives – 1st Quarter 2016
Raymond James Financial Services


Description
1st Quarter, 2016
FixedIncomeQuarterly
MARKET PERSPECTIVES – FIXED INCOME SERVICES
“Be at war with your vices,
at peace with your
neighbors and let every
new-year find you a better
man.”
– Benjamin Franklin
Fixed Income Outlook 2016
In 2016, expect the Treasury yield curve may continue to flatten, due
in part to the Federal Reserve’s (Fed’s) “liftoff” intervention on the
very short-end, but don’t necessarily expect meaningfully higher
intermediate or long-term rates. The fixed income outlook may be a
slightly refurbished version of its 2015 prototype: “Looking ahead for
2015, don’t expect rates to rise”. That foreshadowing proved
accurate where beyond three years, there were immaterial changes
in interest rates throughout the year. Despite small intermittent
periods of volatility, the 5- to 10-year part of the curve ended
virtually unchanged for the year.
Global Forces
The bond market is now heavily influenced by global forces,
economies, unrest and wars, in addition to more traditional factors
such as domestic economic data, politics, and central bank
intervention.
All of these factors are likely to play a part in how 2016 unfolds. It may be wise to de-emphasize the use of historic occurrences and/or forecasting models when predicting the market’s future. Formulas are changing. We have entered an era where worldwide central bank intervention is at an unprecedented level. The Federal Reserve’s balance sheet has ballooned from $880 billion in January 2008 to $4.4 trillion in November 2015.
At a time when the U.S. is beginning to raise short-term interest rates, a wide divergence with international monetary policy exists. FIQ Contributors: Doug Drabik Sr. Fixed Income Strategist Benjamin Streed, CFA Fixed Income Strategist Drew O’Neil Fixed Income Strategist In this Report: ï‚· Fixed Income Outlook(pp1-3) ï‚· Moody’s 2016 Muni and Corporate Outlook (pp4-6) o Oil Prices Sharpen Regional Economic Differences (p4) o State Tax Rates and Ratings (p6) ï‚· Strategy Talk Simplified (pp7-8) ï‚· A Deeper Dive Into Yield (p9) ï‚· Trending News (p10) ï‚· Corporates: Sector Analysis and Current Value (pp11-12) o Appendix B: Example Issuers (p16) ï‚· Plans of Action (p13) ï‚· Additional Fixed Income Resources (p14) ï‚· Appendix A: Individual Tax Charts (p15) 1|Page .
FIQ 1st Quarter, 2016 Interest rate nonconformity will likely tempt large institutions and/or sovereignties to seek the higher rates of U.S. Treasuries, pumping up demand and tempering any quick rise in the world’s largest and most liquid market. In addition, Europe is increasing its quantitative easing program, and the general global policy outside the U.S. is one of easing.
Japan is the latest country to implement negative rates. One could argue that several Fed rate hikes would merely dampen the U.S. easing policy and not yet be one of tightening. Supply Treasury debt supply will likely be falling in 2016.
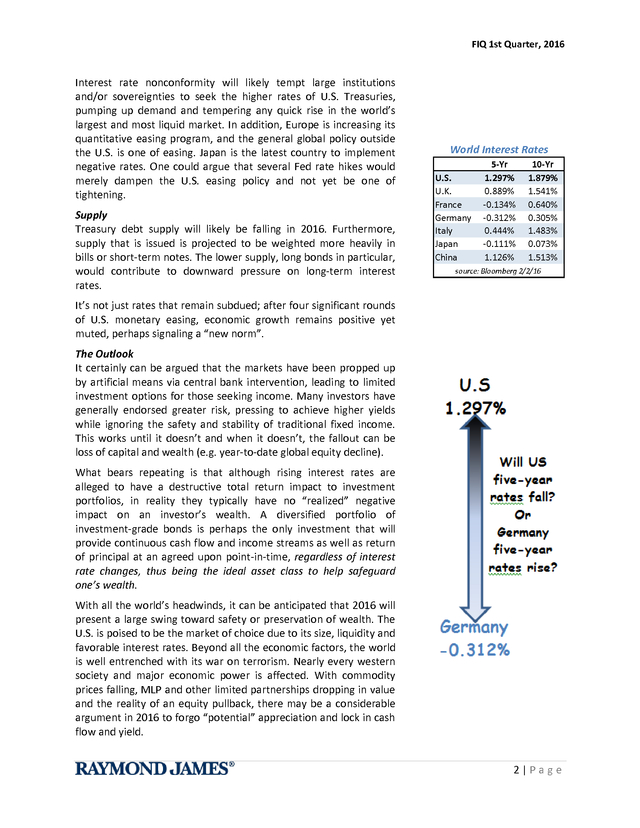
Furthermore, supply that is issued is projected to be weighted more heavily in bills or short-term notes. The lower supply, long bonds in particular, would contribute to downward pressure on long-term interest rates. World Interest Rates U.S. U.K. France Germany Italy Japan China 5-Yr 1.297% 0.889% -0.134% -0.312% 0.444% -0.111% 1.126% 10-Yr 1.879% 1.541% 0.640% 0.305% 1.483% 0.073% 1.513% source: Bloomberg 2/2/16 It’s not just rates that remain subdued; after four significant rounds of U.S. monetary easing, economic growth remains positive yet muted, perhaps signaling a “new norm”. The Outlook It certainly can be argued that the markets have been propped up by artificial means via central bank intervention, leading to limited investment options for those seeking income.
Many investors have generally endorsed greater risk, pressing to achieve higher yields while ignoring the safety and stability of traditional fixed income. This works until it doesn’t and when it doesn’t, the fallout can be loss of capital and wealth (e.g. year-to-date global equity decline). What bears repeating is that although rising interest rates are alleged to have a destructive total return impact to investment portfolios, in reality they typically have no “realized” negative impact on an investor’s wealth. A diversified portfolio of investment-grade bonds is perhaps the only investment that will provide continuous cash flow and income streams as well as return of principal at an agreed upon point-in-time, regardless of interest rate changes, thus being the ideal asset class to help safeguard one’s wealth. With all the world’s headwinds, it can be anticipated that 2016 will present a large swing toward safety or preservation of wealth.
The U.S. is poised to be the market of choice due to its size, liquidity and favorable interest rates. Beyond all the economic factors, the world is well entrenched with its war on terrorism.
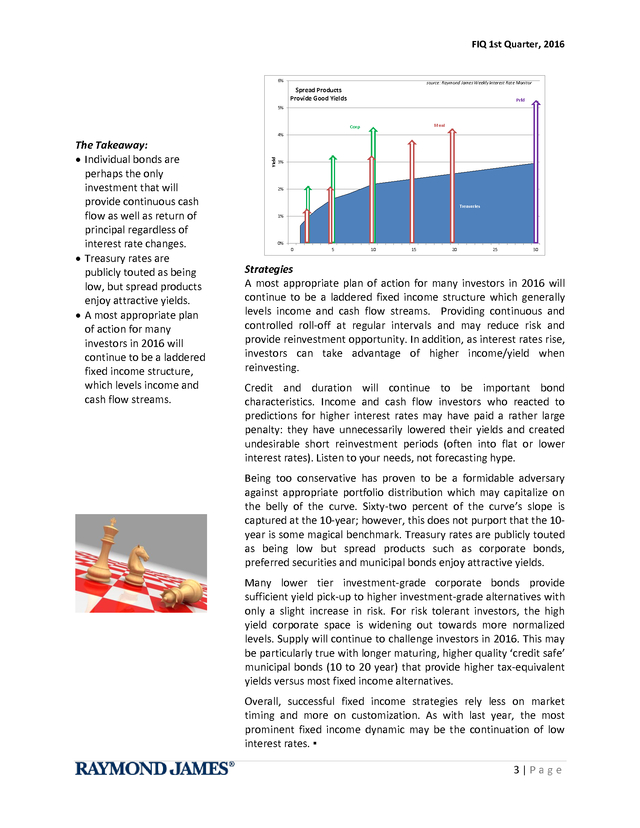
Nearly every western society and major economic power is affected. With commodity prices falling, MLP and other limited partnerships dropping in value and the reality of an equity pullback, there may be a considerable argument in 2016 to forgo “potential” appreciation and lock in cash flow and yield. 2|Page . FIQ 1st Quarter, 2016 6% source: Raymond James Weekly Interest Rate Monitor Spread Products Provide Good Yields Prfd 5% Muni Corp The Takeaway: ï‚· Individual bonds are perhaps the only investment that will provide continuous cash flow as well as return of principal regardless of interest rate changes. ï‚· Treasury rates are publicly touted as being low, but spread products enjoy attractive yields. ï‚· A most appropriate plan of action for many investors in 2016 will continue to be a laddered fixed income structure, which levels income and cash flow streams. Yield 4% 3% 2% Treasuries 1% 0% 0 5 10 15 20 25 30 Strategies A most appropriate plan of action for many investors in 2016 will continue to be a laddered fixed income structure which generally levels income and cash flow streams. Providing continuous and controlled roll-off at regular intervals and may reduce risk and provide reinvestment opportunity. In addition, as interest rates rise, investors can take advantage of higher income/yield when reinvesting. Credit and duration will continue to be important bond characteristics. Income and cash flow investors who reacted to predictions for higher interest rates may have paid a rather large penalty: they have unnecessarily lowered their yields and created undesirable short reinvestment periods (often into flat or lower interest rates).
Listen to your needs, not forecasting hype. Being too conservative has proven to be a formidable adversary against appropriate portfolio distribution which may capitalize on the belly of the curve. Sixty-two percent of the curve’s slope is captured at the 10-year; however, this does not purport that the 10year is some magical benchmark. Treasury rates are publicly touted as being low but spread products such as corporate bonds, preferred securities and municipal bonds enjoy attractive yields. Many lower tier investment-grade corporate bonds provide sufficient yield pick-up to higher investment-grade alternatives with only a slight increase in risk.
For risk tolerant investors, the high yield corporate space is widening out towards more normalized levels. Supply will continue to challenge investors in 2016. This may be particularly true with longer maturing, higher quality ‘credit safe’ municipal bonds (10 to 20 year) that provide higher tax-equivalent yields versus most fixed income alternatives. Overall, successful fixed income strategies rely less on market timing and more on customization.
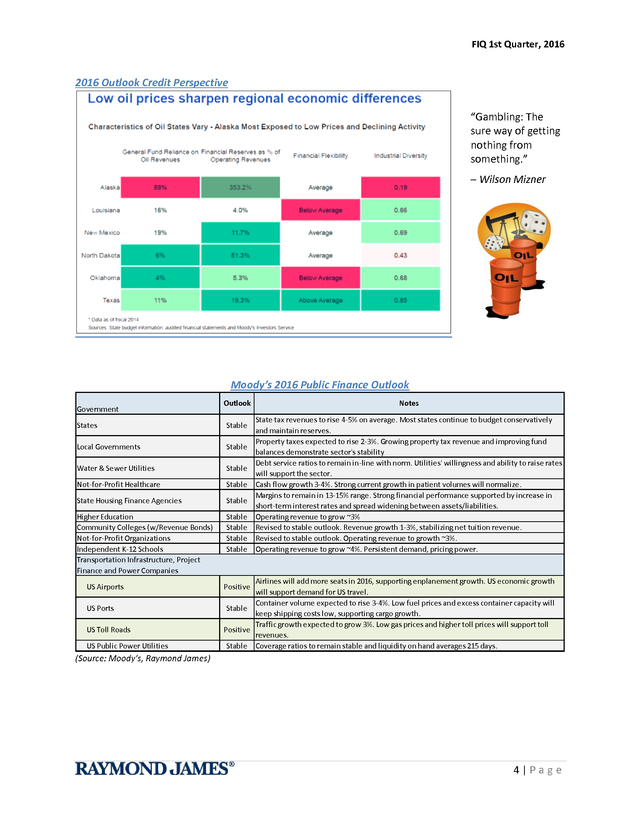
As with last year, the most prominent fixed income dynamic may be the continuation of low interest rates. â–ª 3|Page . FIQ 1st Quarter, 2016 2016 Outlook Credit Perspective “Gambling: The sure way of getting nothing from something.” – Wilson Mizner Moody’s 2016 Public Finance Outlook Government Outlook States Stable Local Governments Stable Water & Sewer Utilities Stable Not-for-Profit Healthcare Stable State Housing Finance Agencies Stable Higher Education Community Colleges (w/Revenue Bonds) Not-for-Profit Organizations Independent K-12 Schools Transportation Infrastructure, Project Finance and Power Companies Stable Stable Stable Stable US Airports US Ports US Toll Roads US Public Power Utilities Notes State tax revenues to rise 4-5% on average. Most states continue to budget conservatively and maintain reserves. Property taxes expected to rise 2-3%. Growing property tax revenue and improving fund balances demonstrate sector's stability Debt service ratios to remain in-line with norm. Utilities' willingness and ability to raise rates will support the sector. Cash flow growth 3-4%.
Strong current growth in patient volumes will normalize. Margins to remain in 13-15% range. Strong financial performance supported by increase in short-term interest rates and spread widening between assets/liabilities. Operating revenue to grow ~3% Revised to stable outlook. Revenue growth 1-3%, stabilizing net tuition revenue. Revised to stable outlook.
Operating revenue to growth ~3%. Operating revenue to grow ~4%. Persistent demand, pricing power. Airlines will add more seats in 2016, supporting enplanement growth. US economic growth will support demand for US travel. Container volume expected to rise 3-4%.
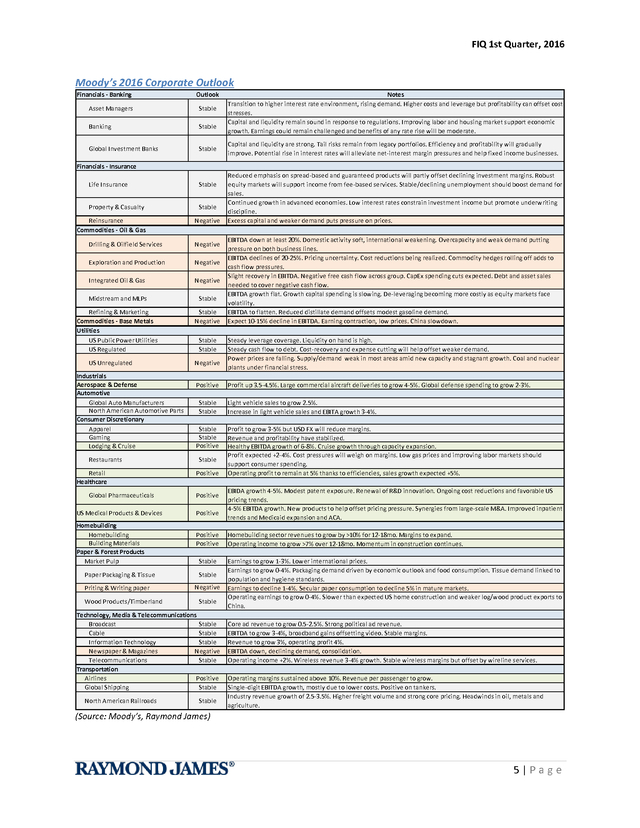
Low fuel prices and excess container capacity will Stable keep shipping costs low, supporting cargo growth. Traffic growth expected to grow 3%. Low gas prices and higher toll prices will support toll Positive revenues. Stable Coverage ratios to remain stable and liquidity on hand averages 215 days. Positive (Source: Moody’s, Raymond James) 4|Page . FIQ 1st Quarter, 2016 Moody’s 2016 Corporate Outlook Financials - Banking Outlook Asset Managers Stable Banking Stable Global Investment Banks Stable Notes Transition to higher interest rate environment, rising demand. Higher costs and leverage but profitability can offset cost stresses. Capital and liquidity remain sound in response to regulations. Improving labor and housing market support economic growth. Earnings could remain challenged and benefits of any rate rise will be moderate. Capital and liquidity are strong.
Tail risks remain from legacy portfolios. Efficiency and profitability will gradually improve. Potential rise in interest rates will alleviate net-interest margin pressures and help fixed income businesses. Financials - Insurance Life Insurance Property & Casualty Reinsurance Commodities - Oil & Gas Stable Stable Negative Drilling & Oilfield Services Negative Exploration and Production Negative Integrated Oil & Gas Negative Midstream and MLPs Stable Refining & Marketing Commodities - Base Metals Utilities US Public Power Utilities US Regulated Stable Negative US Unregulated Industrials Aerospace & Defense Automotive Global Auto Manufacturers North American Automotive Parts Consumer Discretionary Apparel Gaming Lodging & Cruise Restaurants Retail Healthcare Stable Stable Negative Positive Stable Stable Stable Stable Positive Stable Positive Global Pharmaceuticals Positive US Medical Products & Devices Positive Homebuilding Homebuilding Building Materials Paper & Forest Products Market Pulp Paper Packaging & Tissue Priting & Writing paper Wood Products/Timberland Positive Positive Stable Stable Negative Stable Technology, Media & Telecommunications Broadcast Stable Cable Stable Information Technology Stable Newspaper & Magazines Negative Telecommunications Stable Transportation Airlines Positive Global Shipping Stable North American Railroads Stable Reduced emphasis on spread-based and guaranteed products will partly offset declining investment margins.
Robust equity markets will support income from fee-based services. Stable/declining unemployment should boost demand for sales. Continued growth in advanced economies. Low interest rates constrain investment income but promote underwriting discipline. Excess capital and weaker demand puts pressure on prices. EBITDA down at least 20%.
Domestic activity soft, international weakening. Overcapacity and weak demand putting pressure on both business lines. EBITDA declines of 20-25%. Pricing uncertainty.
Cost reductions being realized. Commodity hedges rolling off adds to cash flow pressures. Slight recovery in EBITDA. Negative free cash flow across group.
CapEx spending cuts expected. Debt and asset sales needed to cover negative cash flow. EBITDA growth flat. Growth capital spending is slowing.
De-leveraging becoming more costly as equity markets face volatility. EBITDA to flatten. Reduced distillate demand offsets modest gasoline demand. Expect 10-15% decline in EBITDA. Earning contraction, low prices.
China slowdown. Steady leverage coverage. Liquidity on hand is high. Steady cash flow to debt. Cost-recovery and expense cutting will help offset weaker demand. Power prices are falling.
Supply/demand weak in most areas amid new capacity and stagnant growth. Coal and nuclear plants under financial stress. Profit up 3.5-4.5%. Large commercial aircraft deliveries to grow 4-5%.
Global defense spending to grow 2-3%. Light vehicle sales to grow 2.5%. Increase in light vehicle sales and EBITA growth 3-4%. Profit to grow 3-5% but USD FX will reduce margins. Revenue and profitability have stabilized. Healthy EBITDA growth of 6-8%. Cruise growth through capacity expansion. Profit expected +2-4%. Cost pressures will weigh on margins.
Low gas prices and improving labor markets should support consumer spending. Operating profit to remain at 5% thanks to efficiencies, sales growth expected +5%. EBIDA growth 4-5%. Modest patent exposure. Renewal of R&D innovation.
Ongoing cost reductions and favorable US pricing trends. 4-5% EBITDA growth. New products to help offset pricing pressure. Synergies from large-scale M&A.
Improved inpatient trends and Medicaid expansion and ACA. Homebuilding sector revenues to grow by >10% for 12-18mo. Margins to expand. Operating income to grow >7% over 12-18mo. Momentum in construction continues. Earnings to grow 1-3%.
Lower international prices. Earnings to grow 0-4%. Packaging demand driven by economic outlook and food consumption. Tissue demand linked to population and hygiene standards. Earnings to decline 1-4%.
Secular paper consumption to decline 5% in mature markets. Operating earnings to grow 0-4%. Slower than expected US home construction and weaker log/wood product exports to China. Core ad revenue to grow 0.5-2.5%. Strong political ad revenue. EBITDA to grow 3-4%, broadband gains offsetting video.
Stable margins. Revenue to grow 3%, operating profit 4%. EBITDA down, declining demand, consolidation. Operating income +2%. Wireless revenue 3-4% growth. Stable wireless margins but offset by wireline services. Operating margins sustained above 10%.
Revenue per passenger to grow. Single-digit EBITDA growth, mostly due to lower costs. Positive on tankers. Industry revenue growth of 2.5-3.5%. Higher freight volume and strong core pricing.
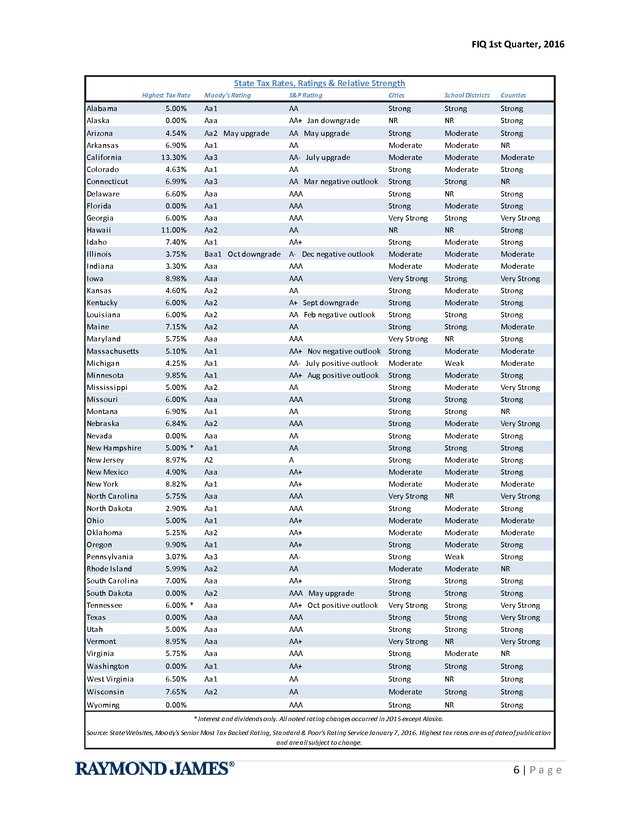
Headwinds in oil, metals and agriculture. (Source: Moody’s, Raymond James) 5|Page . FIQ 1st Quarter, 2016 State Tax Rates, Ratings & Relative Strength Highest Tax Rate Alabama Alaska Arizona Arkansas California Colorado Connecticut Delaware Florida Georgia Hawaii Idaho Illinois Indiana Iowa Kansas Kentucky Louisiana Maine Maryland Massachusetts Michigan Minnesota Mississippi Missouri Montana Nebraska Nevada New Hampshire New Jersey New Mexico New York North Carolina North Dakota Ohio Oklahoma Oregon Pennsylvania Rhode Island South Carolina South Dakota Tennessee Texas Utah Vermont Virginia Moody's Rating 4.54% 6.90% 13.30% 4.63% 6.99% 6.60% 0.00% 6.00% 11.00% 7.40% 3.75% 3.30% 8.98% 4.60% 6.00% 6.00% 7.15% 5.75% 5.10% 4.25% 9.85% 5.00% 6.00% 6.90% 6.84% 0.00% 5.00% * 8.97% 4.90% 8.82% 5.75% 2.90% 5.00% 5.25% 9.90% 3.07% 5.99% 7.00% 0.00% 6.00% * 0.00% 5.00% 8.95% 5.75% S&P Rating Cities School Districts Counties Aa1 Aaa 5.00% 0.00% AA AA+ Jan downgrade Strong NR Strong NR Strong Strong Aa2 May upgrade Aa1 Aa3 Aa1 Aa3 Aaa Aa1 Aaa Aa2 Aa1 Baa1 Oct downgrade Aaa Aaa Aa2 Aa2 Aa2 Aa2 Aaa Aa1 Aa1 Aa1 Aa2 Aaa Aa1 Aa2 Aaa Aa1 A2 Aaa Aa1 Aaa Aa1 Aa1 Aa2 Aa1 Aa3 Aa2 Aaa Aa2 Aaa Aaa Aaa Aaa Aaa AA May upgrade AA AA- July upgrade AA AA Mar negative outlook AAA AAA AAA AA AA+ A- Dec negative outlook AAA AAA AA A+ Sept downgrade AA Feb negative outlook AA AAA AA+ Nov negative outlook AA- July positive outlook AA+ Aug positive outlook AA AAA AA AAA AA AA A AA+ AA+ AAA AAA AA+ AA+ AA+ AAAA AA+ AAA May upgrade AA+ Oct positive outlook AAA AAA AA+ AAA Strong Moderate Moderate Strong Strong Strong Strong Very Strong NR Strong Moderate Moderate Very Strong Strong Strong Strong Strong Very Strong Strong Moderate Strong Strong Strong Strong Strong Strong Strong Strong Moderate Moderate Very Strong Strong Moderate Moderate Strong Strong Moderate Strong Strong Very Strong Strong Strong Very Strong Strong Moderate Moderate Moderate Moderate Strong NR Moderate Strong NR Moderate Moderate Moderate Strong Moderate Moderate Strong Strong NR Moderate Weak Moderate Moderate Strong Strong Moderate Moderate Strong Moderate Moderate Moderate NR Moderate Moderate Moderate Moderate Weak Moderate Strong Strong Strong Strong Strong NR Moderate Strong NR Moderate Strong NR Strong Strong Very Strong Strong Strong Moderate Moderate Very Strong Strong Strong Strong Moderate Strong Moderate Moderate Strong Very Strong Strong NR Very Strong Strong Strong Strong Strong Moderate Very Strong Strong Moderate Moderate Strong Strong NR Strong Strong Very Strong Very Strong Strong Very Strong NR Washington 0.00% Aa1 AA+ Strong Strong Strong West Virginia 6.50% Aa1 AA Strong NR Strong Wisconsin 7.65% Aa2 AA Moderate Strong Strong Wyoming 0.00% AAA Strong NR Strong * Interest and dividends only. All noted rating changes occurred in 2015 except Alaska. Source: State Websites, Moody's Senior Most Tax Backed Rating, Standard & Poor's Rating Service January 7, 2016. Highest tax rates are as of date of publication and are all subject to change. 6|Page . FIQ 1st Quarter, 2016 Strategy Talk Simplified For many years we’ve been bombarded with the idea that interest rates have but one way to go… up; however, the reality is that all those predictions have been wrong. Decisions are often made with considerations that become discarded certainties. Numerous recommendations have suggested either lowering duration or completely staying out of fixed income securities, both suggestions that have not fared well over the past several years. Our strategy talk suggests leaving prognosticating out of the equation. The one constant over the years is that we all are terrible at predicting the future.
Know what you own and why you own it. A portfolio’s allocation to fixed income preserves wealth and provides the predictable cash flow and income to do so. Trying to achieve this through other means doesn’t always work out.
According to a January 2016 article appearing in the Chicago Tribune (Choe, Stan. “Dividends on the Chopping Block as Profit Growth Peters Out” Associated Press), about 500 companies cut or halted their dividends last year. In addition to a board of directors determined dividend, those companies that cut dividends usually don’t do so because profits and growth of the company are thriving, suggesting that the equity price may be under equal stress. Monies committed to growth should be in growth potential assets just the same as monies dedicated to preservation of wealth and/or income may be better invested in individual fixed income investments. “The journey of a thousand miles begins with one step.” – Lao Tzu Among all the reasons that fixed income protects wealth, the two key characteristics to invoke are: the stated maturity and the predictable cash flow and income.
When a company announces the amount of dividends they will pay their stockholders, it is determined only after their non-optional interest payments are made to bond holders. The feast and/or famine payments that make growth assets desirable for growth reasons are just different than the more predictable wealth preservation assets. Again, know what you own and why you own it. Effective Maturity vs.
Stated Maturity: A stated maturity is simply when the bond is scheduled to mature. If a bond includes a call option and that call is likely to happen, the shorter effective maturity will reflect when the face value is likely to be returned. In a rising rate environment, bonds that once were “expected” to be called and reflect a shorter effective maturity, may all of a sudden extend out, creating a very different time line (longer) than what may have been expected. What to do: Consider bonds with longer or no calls to provide an effective maturity closer to the stated maturity.
This will allow the portfolio to generate and collect the income longer which is desirable in a flat and/or falling interest rate environment. â–ª 7|Page . FIQ 1st Quarter, 2016 Cash Flow vs. Income: Income is what a bond earns (the yield) and cash flow is what money a bond is paying (the coupon). The coupon times the face value of a bond determines the amount of cash flow generated by a bond. In practice, some of this cash flow may represent income and some of it may represent return of premium paid.
Income is calculated by multiplying the yield times the amount of an investment. Income or yield is what the bond holder is earning. Accuracy of Predictions? “As the Olympic torch neared Lake Placid, N.Y. in 1980, signaling the opening of that year’s Winter Olympics, newspapers and magazines throughout the world offered predictions who would win medals in the major sports.
Not a single publication gave the American men’s hockey team a chance against the world powers.” – Don Yaeger What to do: Always remember that yield trumps all other characteristics. Do not sacrifice yield for other characteristics which are usually coveted because of their beneficial features under certain circumstances. For example, we have preached the benefits of a high coupon bond in that it generates a greater cash flow which in turn may be invested more quickly in a rising interest rate environment.
The assumption is that given a choice between two bonds with the same yield where one is a high coupon (say 5.00%) and one is a lower coupon (say 3.00%), the higher coupon bond will benefit the investor as interest rates rise. High coupon bonds have afforded similar or even better yields; however, if a lower coupon bond provides a significantly better yield, that income is realized (actual) and not predicated on whether rates will rise. The market has shifted and the yield-to-worst and sometimes the yield-tomaturity on many higher coupon bonds pale by comparison. Duration Drift: Modified duration measures the price sensitivity of a bond.
A duration of 2, in simplified terms, means that for every 1% or 100 basis point (bp) move in interest rates, a bond holder can expect about a 2% move in the bond’s market price. In other words, if interest rates rise 1%, the bond price will fall about 2% for a bond with a duration of 2. In a low interest rate environment, it may be assumed that a high coupon bond will get called before the stated maturity on its call date.
If interest rates rise significantly, that assumption may go away. The bond may now “drift” to its much longer stated maturity, increasing its duration and subjecting it to a much greater price fluctuation. What to do: Again, know what you own. If interest rates remain flat and low, many of the call options will play out and the bonds will be redeemed early.
If interest rates rise, some bonds will extend to being redeemed on their longer stated maturity dates. Look for bonds with more call protection or with no calls to reduce or eliminate duration drift. â–ª 8|Page .
FIQ 1st Quarter, 2016 A Deeper Dive Into Yield Finding portfolio appropriate bonds encompasses a wide variety of criteria including: maturity, duration, coupon, issuer, rating, optionality, sector, and yield. Individual goals (purpose) and risk tolerance are driving forces for bond suitability. There is no “perfect” bond. For example, the bond perspective of a 50 year old not requiring any income from a $2,000,000 portfolio is very different than that of a 75 year old, dependent solely on income sourced from a $500,000 fixed income portfolio.
The point is that all bond characteristics require independent analysis for each unique investor. Optimizing yield is the ultimate goal, yet a more insightful way to view this would be the goal to optimize yield given an individual’s risk profile. Working backwards, a bond’s yield may be a very telling piece of information in that yield reflects a bond’s worth based on the combination of all the characteristics of maturity, duration, coupon, issuer’s credit worthiness, etc. Corporate Spreads Widening Sector/AvgMat Now 1yr Ago AA-Rated 9y 109 82 Finance 6y 92 78 Industrial 10y 113 84 Utility 14y 130 79 A-Rated 10y 142 82 Finance 7y 128 78 Industrial 11y 152 84 Utility 16y 143 79 BBB-Rated 10y 261 191 Finance 8y 194 174 Industrial 11y 312 203 Utility 13y 213 161 source: YieldBook, Raymond James as of 2/1/16 Assume there are two seemingly similar bonds with the same coupons, similar call structures and the same maturities, yet one is yielding 2.5% and the other 6%. Obviously there is a difference of risk not explained by the bond structures.
The yield difference alerts us to further inquiry. Perhaps one of the issuers is exposed to a possible takeover or merger. Maybe a sector is exposed to market barriers. It may be pending litigation or overexposure to an emerging market economy that is struggling.
There are many reasons potentially explaining why two seemingly similar bonds with similar characteristics have this yield divergence but that discrepancy can direct the attention to defining the risks and determining appropriateness. YTM 2.63% 2.16% 2.75% 2.99% 3.04% 2.70% 3.19% 3.46% 4.24% 3.41% 4.78% 3.93% 1yr 2yr 5yr 10yr 15yr 20yr 25yr 30yr AAA Municipal G.O. YTM TEY 1yrAgo 0.40% 0.66% 0.23% 0.66% 1.09% 0.68% 1.00% 1.66% 1.56% 1.71% 2.83% 2.90% 2.16% 3.58% 3.58% 2.44% 4.04% 3.94% 2.69% 4.45% 4.12% 2.75% 4.55% 4.21% taxable equivalent yield based on 39.6% bracket source: Bloomberg, MMD, Raymond James 2/1/16 By defining risk and evaluating whether that risk is acceptable, an investor can optimize their return (yield). Although Treasury yields are flat to falling, most buy-and-hold investors purchase spread product such as corporate bonds, municipal bonds, CDs, preferred securities and agency bonds. Spreads are widening meaning the yields on spread products are holding despite the general Treasury yield decline.
â–ª 9|Page . FIQ 1st Quarter, 2016 “Never make predictions, especially about the future.” – Casey Stengel Muni Default Rates IG Moody's Rated Issuers 1-Yr 5-Yr Issuers General Obligation 8,600 AAA 0.00% 0.00% AA 0.00% 0.00% A 0.00% 0.01% Baa 0.01% 0.03% Non-GO 8,400 AAA 0.00% 0.00% AA 0.00% 0.01% A 0.01% 0.06% Baa 0.02% 0.29% source: Moody's Data Report July 2015 Corporate Default Rates Investment-Grade Default Rate 1-Yr 5-Yr Issuers Global 0.06% 0.90% 8,857 N. America 0.00% 0.07% 4,146 Europe 0.00% 2.38% 2,517 Asia-Pacific 0.00% 0.00% 1,165 Industrials 0.00% 0.00% 4,122 Finance 0.00% 1.85% 3,038 1,691 Utilities, Sov 0.21% 0.25% & Project Fin source: Moody's Data Report January, 2016 Trending News: Public Finance ï‚· S&P’s 3rd quarter 2015 marked the 12th straight quarter of more upgrades versus downgrades. (S&P) o Stronger finances reason in 198 of 285 upgrades. o Deteriorating finances and liquidity main reasons for downgrades. o California led way with 90 upgrades. ï‚· Seven rated bond issues defaulted. (S&P) o Puerto Rico Public Finance Corporation defaulted on 4 series (August). o Dowling College, Charter School of Boynton Beach and Stockton Redevelopment Agency, CA each defaulted. rd ï‚· S&P 3 quarter upgrade/downgrade: Local governments 159 upgrades/50 downgrades; Utilities 29 upgrades/21 downgrades; Not-for-profit health care 18 upgrades/4 downgrades; Higher education 10 upgrades/18 downgrades; Charter schools 2 upgrades/5 downgrades; Transportation 11 upgrades/2 downgrades. ï‚· States upgraded 2015: Arizona (Aa2/AA, Moody’s/S&P); California (AA-, S&P); South Dakota (AAA, S&P). ï‚· States downgraded 2015: Illinois (Baa1, Moody’s); Kentucky (A+, S&P); Alaska (AA+, S&P/2016). ï‚· Federal budget (2016) maintains Public Housing Capital Fund appropriation at $1.9 billion (4th consecutive year). Protects revenue stream of Public Housing Authorities (PHAs).
Historically, capital funding for public housing is vulnerable to appropriation cuts. Levels cut 8 times from 2001-2013. It stabilized in 2013 and has remained flat.
This has been credit positive. (source: Moody’s) Corporate ï‚· Moody’s placed 175 energy and mining companies on review for possible downgrade (January 21). ï‚· Moody’s lowered their forward price projections across the commodities spectrum. The range of possible outcomes upon conclusion of the review for given issuers varies from possible confirmation of ratings to multi-notch downgrades. ï‚· North American one-year investment-grade corporate default rate = 0.00%.
Five-year = 0.07% (source: Moody’s) ï‚· North American one-year [Caa-C] default rate = 4.90%. The five-year default rate [Caa-C] = 23.26%. (source: Moody’s) â–ª 10 | P a g e .
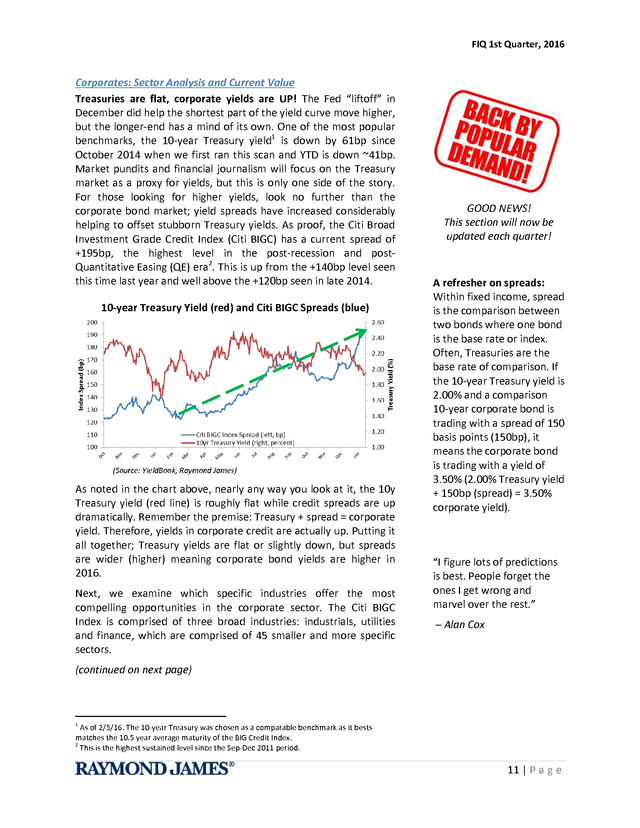
FIQ 1st Quarter, 2016 Corporates: Sector Analysis and Current Value Treasuries are flat, corporate yields are UP! The Fed “liftoff” in December did help the shortest part of the yield curve move higher, but the longer-end has a mind of its own. One of the most popular benchmarks, the 10-year Treasury yield1 is down by 61bp since October 2014 when we first ran this scan and YTD is down ~41bp. Market pundits and financial journalism will focus on the Treasury market as a proxy for yields, but this is only one side of the story. For those looking for higher yields, look no further than the corporate bond market; yield spreads have increased considerably helping to offset stubborn Treasury yields. As proof, the Citi Broad Investment Grade Credit Index (Citi BIGC) has a current spread of +195bp, the highest level in the post-recession and postQuantitative Easing (QE) era2. This is up from the +140bp level seen this time last year and well above the +120bp seen in late 2014. 10-year Treasury Yield (red) and Citi BIGC Spreads (blue) (Source: YieldBook, Raymond James) As noted in the chart above, nearly any way you look at it, the 10y Treasury yield (red line) is roughly flat while credit spreads are up dramatically.
Remember the premise: Treasury + spread = corporate yield. Therefore, yields in corporate credit are actually up. Putting it all together; Treasury yields are flat or slightly down, but spreads are wider (higher) meaning corporate bond yields are higher in 2016. Next, we examine which specific industries offer the most compelling opportunities in the corporate sector.
The Citi BIGC Index is comprised of three broad industries: industrials, utilities and finance, which are comprised of 45 smaller and more specific sectors. GOOD NEWS! This section will now be updated each quarter! A refresher on spreads: Within fixed income, spread is the comparison between two bonds where one bond is the base rate or index. Often, Treasuries are the base rate of comparison. If the 10â€year Treasury yield is 2.00% and a comparison 10-year corporate bond is trading with a spread of 150 basis points (150bp), it means the corporate bond is trading with a yield of 3.50% (2.00% Treasury yield + 150bp (spread) = 3.50% corporate yield). “I figure lots of predictions is best. People forget the ones I get wrong and marvel over the rest.” – Alan Cox (continued on next page) 1 As of 2/5/16.
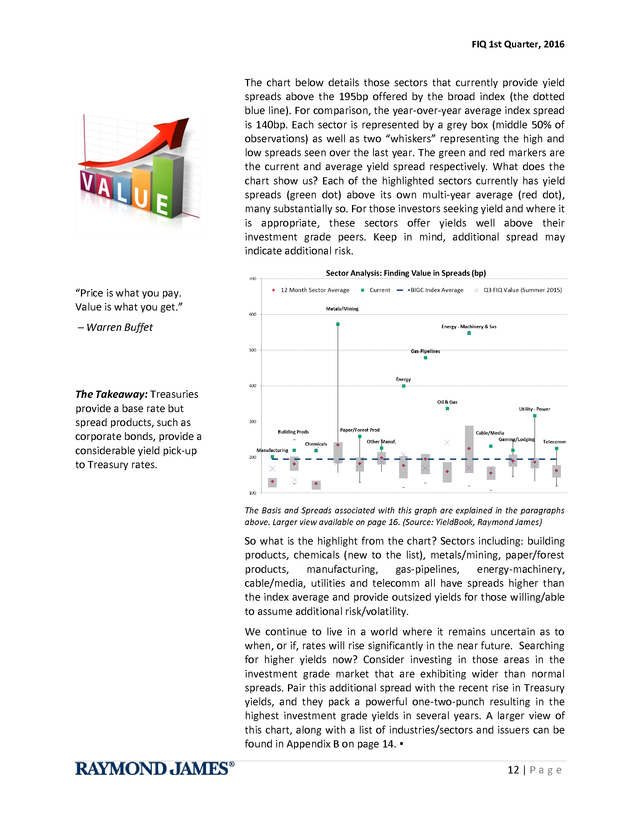
The 10-year Treasury was chosen as a comparable benchmark as it bests matches the 10.5 year average maturity of the BIG Credit Index. 2 This is the highest sustained level since the Sep-Dec 2011 period. 11 | P a g e . FIQ 1st Quarter, 2016 The chart below details those sectors that currently provide yield spreads above the 195bp offered by the broad index (the dotted blue line). For comparison, the year-over-year average index spread is 140bp. Each sector is represented by a grey box (middle 50% of observations) as well as two “whiskers” representing the high and low spreads seen over the last year. The green and red markers are the current and average yield spread respectively.
What does the chart show us? Each of the highlighted sectors currently has yield spreads (green dot) above its own multi-year average (red dot), many substantially so. For those investors seeking yield and where it is appropriate, these sectors offer yields well above their investment grade peers. Keep in mind, additional spread may indicate additional risk. “Price is what you pay. Value is what you get.” – Warren Buffet The Takeaway: Treasuries provide a base rate but spread products, such as corporate bonds, provide a considerable yield pick-up to Treasury rates. The Basis and Spreads associated with this graph are explained in the paragraphs above.
Larger view available on page 16. (Source: YieldBook, Raymond James) So what is the highlight from the chart? Sectors including: building products, chemicals (new to the list), metals/mining, paper/forest products, manufacturing, gas-pipelines, energy-machinery, cable/media, utilities and telecomm all have spreads higher than the index average and provide outsized yields for those willing/able to assume additional risk/volatility. We continue to live in a world where it remains uncertain as to when, or if, rates will rise significantly in the near future. Searching for higher yields now? Consider investing in those areas in the investment grade market that are exhibiting wider than normal spreads.
Pair this additional spread with the recent rise in Treasury yields, and they pack a powerful one-two-punch resulting in the highest investment grade yields in several years. A larger view of this chart, along with a list of industries/sectors and issuers can be found in Appendix B on page 14. â–ª 12 | P a g e .
FIQ 1st Quarter, 2016 Plans of Action Know What You Own: Fixed income securities have provided one of the better total returns over the past couple of years; however, don’t be sucked into believing this is their primary purpose. Equities, for example, will always carry a much higher potential for price growth and thus greater total return than fixed income securities. Unfortunately, recent history is demonstrating that with greater upward potential also comes greater potential for principal loss. Fixed income securities provide a known cash flow and income stream with a stated maturity and return of face value. This is their strength just as growth is equity’s strength.
Don’t try to substitute one for the other based on a brief moment in time. Think long-term when investing. Spread Products Are Delivering: We are at historically low Treasury interest rate levels. It is hard to be excited about 2.00% yields.
This is not always about growing wealth but sometimes about not losing wealth. Spreads have widened on many products, so although Treasury yields seem dismal, corporate bonds, municipal bonds, CDs on the short-end and preferred securities are offering reliable income at levels well above Treasury rates in a market with minimal negative inflation effect. “If you do not change direction, you may end up where you are heading.” – Gautama Buddha Laddered Portfolios: Simply put, rate predicting is speculating. Don’t speculate with the portion of your portfolio which is the foundation of your wealth and retirement. Investing in securities which are going to protect if ‘xyz’ occurs may prove harmful to one’s wealth.
Invest the foundation portfolio dollars based on today, not what you think might happen tomorrow. A laddered portfolio may prevent the need for forward projection, possibly provide a higher return and allow continual portfolio roll-off to be reinvested under whatever changing interest rate environment occurs. Don’t Stuff Your Money Under the Mattress: We don’t want to guess interest rates but we need to recognize our surroundings. Examine the current environment: All economic powers, with the exception of the U.S., are currently easing monetary policy. The dollar continues to stay strong, thus impeding corporate profits. Inflation remains a “non-factor”.
Growth in China, the largest commodity consumer, is completely in a downward spiral. Commodity demand is low and therefore prices and commodity companies are getting pummeled. Oil continues to be weak. Equities are already down 7% on the year. Is there any reason to believe interest rates will be significantly higher in the foreseeable future? Of course we don’t know.
We do know that sitting on the sideline will provide no return. Stay invested, stay the course. Despite the contrary proclamation, duration has actually been an investor’s friend over the past several years. â–ª 13 | P a g e .
FIQ 1st Quarter, 2016 Additional Fixed Income and Strategy Resources Doug Drabik - Sr. Fixed Income Strategist Benjamin Streed, CFA - Fixed Income Strategist Drew O’Neil - Fixed Income Strategist The Fixed Income Strategy Group provides market commentary, portfolio analysis and strategy to Raymond James advisors for the benefit of their clients. We are part of the larger 13 person Fixed Income Services Group (FISG). RaymondJames.com is a vast resource for those seeking fixed income market commentaries, strategies, education materials and index/yield data. Please visit our public webpage at http://raymondjames.com/fixin.htm for popular resources which include: “Every client with the means to properly diversify, can have a customized bond portfolio that will perform as intended regardless of interest rate moves.
“ ï‚· ï‚· ï‚· ï‚· ï‚· ï‚· Bond Market Update Fixed Income Market Commentary by Kevin Giddis Weekly Interest Rate Monitor Fixed Income Weekly Primer Taxable Fixed Income Chartbook Weekly Index Monitor - FISG of Raymond James Investments we cover: ï‚· Treasuries/Agencies ï‚· Brokered CDs ï‚· Corporate bonds ï‚· MBS/CMOs ï‚· Tax-exempt municipals bonds ï‚· Taxable municipal bonds ï‚· Preferred securities 14 | P a g e . FIQ 1st Quarter, 2016 Appendix A 10% 15% 25% 28% 33% 35% 39.60% 2015 Federal Tax Rates Single Married Joint Less than 9,225 Less than 18,450 9,225 - 37,450 18,450 - 74,900 37,450 - 90,750 74,900 - 151,200 90,750 - 189,300 151,200 - 230,450 189,300 - 411,500 230,450 - 411,500 411,500 - 413,200 411,500 - 464,850 More than 413,200 More than 464,850 Head of Household Less than 13,150 13,150 - 50,200 50,200 - 129,600 129,600 - 209,850 209,850 - 411,500 411,500 - 439,000 More than 439,000 Capital Gains Tax Rates Maximum Effective Maximum Rate Rate with 3.8% Surtax Holding Period Assets Held One Year or Less 39.6% 43.4%* Assets Held More Than One Year and Sold by Individuals in the 39.6% Tax Bracket or Above 20.0% 23.8%* Assets Held More Than One Year and Sold by Individuals in the 25% to 35% Tax Brackets 15.0% 18.8%** Assets Held More than One Year and Sold by Individuals in the 15% Bracket or Below 0.0% 0.00% * The a ddi tiona l 3.8% Medi ca re s urtax wi l l a ppl y to thes e taxpa yers . ** The a ddi tiona l 3.8% Medi ca re s urtax ma y a ppl y to thes e taxpa yers . Alternative Minimum Tax (AMT) AMT Exemption AMT Exemption Filing Status 2015 Threshold 2015 Married Filing Jointly and $83,400 $158,900 Surviving Spouses Single or Head of Household $53,600 $119,200 Married Filing Separately $41,700 $79,450 Annual Gift Tax Exclusion: $14,000 Estate Tax Exclusion: $5,430,000 Source: Raymond James: “2015 Tax and Financial Planning Flier” Consult your professional tax advisor for questions relating to your individual situation. 15 | P a g e . FIQ 1st Quarter, 2016 Appendix B (refer to page 11-12 for corresponding article): Sector/Subgroup Industry Building Products Example Issuers Carlisle, CRH, Mohawk Industries, Stanley Black & Decker Chemicals Manf. CF Industries, Cabot, Dow Chemical, DuPont, Eastman Chemical, Monsanto, Mosaic, SherwinWilliams Metals/Mining Barrick Gold, BHP Billiton, Freeport-McMoran, Goldcorp, Newmont Mining, Rio Tinto, Southern Copper, Teck Resources, Vale Paper/Forest Products Domtar, Georgia-Pacific, International Paper, Packaging Corp of America, Weyerhaeuser Other Manufacturing Industrials Eaton, Ford Motor, Johnson Controls, MeadWestvaco, NVR, Rock-Tenn, Sonoco Products, Whirlpool Integrated BP, Chevron, ConocoPhillips, Exxon Mobil, Statoil Pipelines Kinder Morgan, Oneok, Plains All American, Sunoco Logistics, Williams Partners Energy Exploration/Production Continental Resources, Noble Energy, Murphy Oil, Canadian Natural Resources Services/Equipment Cable/Media Service Gaming/Lodging Utility - Power Utilities Cameron International, Ensco, Nabors, Noble(NE), Weatherford CBS, Comcast, Cox Communications, Discovery Communications, NBC Universal, Time Warner Cable, Viacom, Walt Disney Co. Carnival Corp, Host Hotels, Hyatt, Marriott, Starwood Hotels, Wyndham Dominion, Entergy, Exelon Generation, Southern Power Utility Telecomm AT&T, Nippon, Qwest, Verizon, Vodafone source: Raymond James The Basis and Spreads associated with this graph are explained in the paragraphs on page 11-12. (Source: YieldBook, Raymond James) 16 | P a g e . FIQ 1st Quarter, 2016 The author of this material is a Trader in the Fixed Income Department of Raymond James & Associates (RJA), and is not an Analyst. Any opinions expressed may differ from opinions expressed by other departments of RJA, including our Equity Research Department, and are subject to change without notice. The data and information contained herein was obtained from sources considered to be reliable, but RJA does not guarantee its accuracy and/or completeness. Neither the information nor any opinions expressed constitute a solicitation for the purchase or sale of any security referred to herein. This material may include analysis of sectors, securities and/or derivatives that RJA may have positions, long or short, held proprietarily. RJA or its affiliates may execute transactions which may not be consistent with the report’s conclusions.
RJA may also have performed investment banking services for the issuers of such securities. Investors should discuss the risks inherent in bonds with their Raymond James Financial Advisor. Risks include, but are not limited to, changes in interest rates, liquidity, credit quality, volatility, and duration.
Past performance is no assurance of future results. This communication is intended to improve the efficiency with which Financial Advisors obtain information relevant to their client's fixed income holdings. This information should not be construed as a directive from the RJ&A Fixed Income Department to buy or sell the securities noted above. Prior to transacting in any security, please discuss the suitability, potential returns, and associated risks of the transactions(s) with your Raymond James Financial Advisor. Investing involves risk and you may incur a profit or a loss.
The value of fixed income securities fluctuates and investors may receive more or less than their original investments if sold prior to maturity. Bonds are subject to price change and availability. Investments in debt securities involve a variety of risks, including credit risk, interest rate risk, and liquidity risk.
Investments in debt securities rated below investment grade (commonly referred to as “junk bonds”) may be subject to greater levels of credit and liquidity risk than investments in investment grade securities. Investors who own fixed income securities should be aware of the relationship between interest rates and the price of those securities. As a general rule, the price of a bond moves inversely to changes in interest rates.
Diversification does not ensure a profit or protect against a loss. The information contained herein has been prepared from sources believed reliable but is not guaranteed by Raymond James & Associates, Inc. (RJA) and is not a complete summary or statement of all available data, nor is it to be construed as an offer to buy or sell any securities referred to herein. Trading ideas expressed are subject to change without notice and do not take into account the particular investment objectives, financial situation or needs of individual investors.
Investors are urged to obtain and review the relevant documents in their entirety. RJA is providing this communication on the condition that it will not form the primary basis for any investment decision you may make. Furthermore, because these are only trade ideas, investors should assume that RJA will not produce any follow-up.
Employees of RJA or its affiliates may, at times, release written or oral commentary, technical analysis or trading strategies that differ from the opinions expressed within. RJA and/or its employees involved in the preparation or the issuance of this communication may have positions in the securities discussed herein. Securities identified herein are subject to availability and changes in price.
All prices and/or yields are indications for informational purposes only. Additional information is available upon request. Raymond James & Associates, Inc., member New York Stock Exchange/SIPC. Raymond James Financial Services, Inc., member FINRA/SIPC Ref.
2016-006939 until 02/08/2017 © 2016 Raymond James & Associates, Inc., member New York Stock Exchange/SIPC © 2016 Raymond James Financial Services, Inc., member FINRA/SIPC Raymond James Corporate Headquarters â— 880 Carillon Parkway, St. Petersburg, FL 33716 17 | P a g e .
All of these factors are likely to play a part in how 2016 unfolds. It may be wise to de-emphasize the use of historic occurrences and/or forecasting models when predicting the market’s future. Formulas are changing. We have entered an era where worldwide central bank intervention is at an unprecedented level. The Federal Reserve’s balance sheet has ballooned from $880 billion in January 2008 to $4.4 trillion in November 2015.
At a time when the U.S. is beginning to raise short-term interest rates, a wide divergence with international monetary policy exists. FIQ Contributors: Doug Drabik Sr. Fixed Income Strategist Benjamin Streed, CFA Fixed Income Strategist Drew O’Neil Fixed Income Strategist In this Report: ï‚· Fixed Income Outlook(pp1-3) ï‚· Moody’s 2016 Muni and Corporate Outlook (pp4-6) o Oil Prices Sharpen Regional Economic Differences (p4) o State Tax Rates and Ratings (p6) ï‚· Strategy Talk Simplified (pp7-8) ï‚· A Deeper Dive Into Yield (p9) ï‚· Trending News (p10) ï‚· Corporates: Sector Analysis and Current Value (pp11-12) o Appendix B: Example Issuers (p16) ï‚· Plans of Action (p13) ï‚· Additional Fixed Income Resources (p14) ï‚· Appendix A: Individual Tax Charts (p15) 1|Page .
FIQ 1st Quarter, 2016 Interest rate nonconformity will likely tempt large institutions and/or sovereignties to seek the higher rates of U.S. Treasuries, pumping up demand and tempering any quick rise in the world’s largest and most liquid market. In addition, Europe is increasing its quantitative easing program, and the general global policy outside the U.S. is one of easing.
Japan is the latest country to implement negative rates. One could argue that several Fed rate hikes would merely dampen the U.S. easing policy and not yet be one of tightening. Supply Treasury debt supply will likely be falling in 2016.
Furthermore, supply that is issued is projected to be weighted more heavily in bills or short-term notes. The lower supply, long bonds in particular, would contribute to downward pressure on long-term interest rates. World Interest Rates U.S. U.K. France Germany Italy Japan China 5-Yr 1.297% 0.889% -0.134% -0.312% 0.444% -0.111% 1.126% 10-Yr 1.879% 1.541% 0.640% 0.305% 1.483% 0.073% 1.513% source: Bloomberg 2/2/16 It’s not just rates that remain subdued; after four significant rounds of U.S. monetary easing, economic growth remains positive yet muted, perhaps signaling a “new norm”. The Outlook It certainly can be argued that the markets have been propped up by artificial means via central bank intervention, leading to limited investment options for those seeking income.
Many investors have generally endorsed greater risk, pressing to achieve higher yields while ignoring the safety and stability of traditional fixed income. This works until it doesn’t and when it doesn’t, the fallout can be loss of capital and wealth (e.g. year-to-date global equity decline). What bears repeating is that although rising interest rates are alleged to have a destructive total return impact to investment portfolios, in reality they typically have no “realized” negative impact on an investor’s wealth. A diversified portfolio of investment-grade bonds is perhaps the only investment that will provide continuous cash flow and income streams as well as return of principal at an agreed upon point-in-time, regardless of interest rate changes, thus being the ideal asset class to help safeguard one’s wealth. With all the world’s headwinds, it can be anticipated that 2016 will present a large swing toward safety or preservation of wealth.
The U.S. is poised to be the market of choice due to its size, liquidity and favorable interest rates. Beyond all the economic factors, the world is well entrenched with its war on terrorism.
Nearly every western society and major economic power is affected. With commodity prices falling, MLP and other limited partnerships dropping in value and the reality of an equity pullback, there may be a considerable argument in 2016 to forgo “potential” appreciation and lock in cash flow and yield. 2|Page . FIQ 1st Quarter, 2016 6% source: Raymond James Weekly Interest Rate Monitor Spread Products Provide Good Yields Prfd 5% Muni Corp The Takeaway: ï‚· Individual bonds are perhaps the only investment that will provide continuous cash flow as well as return of principal regardless of interest rate changes. ï‚· Treasury rates are publicly touted as being low, but spread products enjoy attractive yields. ï‚· A most appropriate plan of action for many investors in 2016 will continue to be a laddered fixed income structure, which levels income and cash flow streams. Yield 4% 3% 2% Treasuries 1% 0% 0 5 10 15 20 25 30 Strategies A most appropriate plan of action for many investors in 2016 will continue to be a laddered fixed income structure which generally levels income and cash flow streams. Providing continuous and controlled roll-off at regular intervals and may reduce risk and provide reinvestment opportunity. In addition, as interest rates rise, investors can take advantage of higher income/yield when reinvesting. Credit and duration will continue to be important bond characteristics. Income and cash flow investors who reacted to predictions for higher interest rates may have paid a rather large penalty: they have unnecessarily lowered their yields and created undesirable short reinvestment periods (often into flat or lower interest rates).
Listen to your needs, not forecasting hype. Being too conservative has proven to be a formidable adversary against appropriate portfolio distribution which may capitalize on the belly of the curve. Sixty-two percent of the curve’s slope is captured at the 10-year; however, this does not purport that the 10year is some magical benchmark. Treasury rates are publicly touted as being low but spread products such as corporate bonds, preferred securities and municipal bonds enjoy attractive yields. Many lower tier investment-grade corporate bonds provide sufficient yield pick-up to higher investment-grade alternatives with only a slight increase in risk.
For risk tolerant investors, the high yield corporate space is widening out towards more normalized levels. Supply will continue to challenge investors in 2016. This may be particularly true with longer maturing, higher quality ‘credit safe’ municipal bonds (10 to 20 year) that provide higher tax-equivalent yields versus most fixed income alternatives. Overall, successful fixed income strategies rely less on market timing and more on customization.
As with last year, the most prominent fixed income dynamic may be the continuation of low interest rates. â–ª 3|Page . FIQ 1st Quarter, 2016 2016 Outlook Credit Perspective “Gambling: The sure way of getting nothing from something.” – Wilson Mizner Moody’s 2016 Public Finance Outlook Government Outlook States Stable Local Governments Stable Water & Sewer Utilities Stable Not-for-Profit Healthcare Stable State Housing Finance Agencies Stable Higher Education Community Colleges (w/Revenue Bonds) Not-for-Profit Organizations Independent K-12 Schools Transportation Infrastructure, Project Finance and Power Companies Stable Stable Stable Stable US Airports US Ports US Toll Roads US Public Power Utilities Notes State tax revenues to rise 4-5% on average. Most states continue to budget conservatively and maintain reserves. Property taxes expected to rise 2-3%. Growing property tax revenue and improving fund balances demonstrate sector's stability Debt service ratios to remain in-line with norm. Utilities' willingness and ability to raise rates will support the sector. Cash flow growth 3-4%.
Strong current growth in patient volumes will normalize. Margins to remain in 13-15% range. Strong financial performance supported by increase in short-term interest rates and spread widening between assets/liabilities. Operating revenue to grow ~3% Revised to stable outlook. Revenue growth 1-3%, stabilizing net tuition revenue. Revised to stable outlook.
Operating revenue to growth ~3%. Operating revenue to grow ~4%. Persistent demand, pricing power. Airlines will add more seats in 2016, supporting enplanement growth. US economic growth will support demand for US travel. Container volume expected to rise 3-4%.
Low fuel prices and excess container capacity will Stable keep shipping costs low, supporting cargo growth. Traffic growth expected to grow 3%. Low gas prices and higher toll prices will support toll Positive revenues. Stable Coverage ratios to remain stable and liquidity on hand averages 215 days. Positive (Source: Moody’s, Raymond James) 4|Page . FIQ 1st Quarter, 2016 Moody’s 2016 Corporate Outlook Financials - Banking Outlook Asset Managers Stable Banking Stable Global Investment Banks Stable Notes Transition to higher interest rate environment, rising demand. Higher costs and leverage but profitability can offset cost stresses. Capital and liquidity remain sound in response to regulations. Improving labor and housing market support economic growth. Earnings could remain challenged and benefits of any rate rise will be moderate. Capital and liquidity are strong.
Tail risks remain from legacy portfolios. Efficiency and profitability will gradually improve. Potential rise in interest rates will alleviate net-interest margin pressures and help fixed income businesses. Financials - Insurance Life Insurance Property & Casualty Reinsurance Commodities - Oil & Gas Stable Stable Negative Drilling & Oilfield Services Negative Exploration and Production Negative Integrated Oil & Gas Negative Midstream and MLPs Stable Refining & Marketing Commodities - Base Metals Utilities US Public Power Utilities US Regulated Stable Negative US Unregulated Industrials Aerospace & Defense Automotive Global Auto Manufacturers North American Automotive Parts Consumer Discretionary Apparel Gaming Lodging & Cruise Restaurants Retail Healthcare Stable Stable Negative Positive Stable Stable Stable Stable Positive Stable Positive Global Pharmaceuticals Positive US Medical Products & Devices Positive Homebuilding Homebuilding Building Materials Paper & Forest Products Market Pulp Paper Packaging & Tissue Priting & Writing paper Wood Products/Timberland Positive Positive Stable Stable Negative Stable Technology, Media & Telecommunications Broadcast Stable Cable Stable Information Technology Stable Newspaper & Magazines Negative Telecommunications Stable Transportation Airlines Positive Global Shipping Stable North American Railroads Stable Reduced emphasis on spread-based and guaranteed products will partly offset declining investment margins.
Robust equity markets will support income from fee-based services. Stable/declining unemployment should boost demand for sales. Continued growth in advanced economies. Low interest rates constrain investment income but promote underwriting discipline. Excess capital and weaker demand puts pressure on prices. EBITDA down at least 20%.
Domestic activity soft, international weakening. Overcapacity and weak demand putting pressure on both business lines. EBITDA declines of 20-25%. Pricing uncertainty.
Cost reductions being realized. Commodity hedges rolling off adds to cash flow pressures. Slight recovery in EBITDA. Negative free cash flow across group.
CapEx spending cuts expected. Debt and asset sales needed to cover negative cash flow. EBITDA growth flat. Growth capital spending is slowing.
De-leveraging becoming more costly as equity markets face volatility. EBITDA to flatten. Reduced distillate demand offsets modest gasoline demand. Expect 10-15% decline in EBITDA. Earning contraction, low prices.
China slowdown. Steady leverage coverage. Liquidity on hand is high. Steady cash flow to debt. Cost-recovery and expense cutting will help offset weaker demand. Power prices are falling.
Supply/demand weak in most areas amid new capacity and stagnant growth. Coal and nuclear plants under financial stress. Profit up 3.5-4.5%. Large commercial aircraft deliveries to grow 4-5%.
Global defense spending to grow 2-3%. Light vehicle sales to grow 2.5%. Increase in light vehicle sales and EBITA growth 3-4%. Profit to grow 3-5% but USD FX will reduce margins. Revenue and profitability have stabilized. Healthy EBITDA growth of 6-8%. Cruise growth through capacity expansion. Profit expected +2-4%. Cost pressures will weigh on margins.
Low gas prices and improving labor markets should support consumer spending. Operating profit to remain at 5% thanks to efficiencies, sales growth expected +5%. EBIDA growth 4-5%. Modest patent exposure. Renewal of R&D innovation.
Ongoing cost reductions and favorable US pricing trends. 4-5% EBITDA growth. New products to help offset pricing pressure. Synergies from large-scale M&A.
Improved inpatient trends and Medicaid expansion and ACA. Homebuilding sector revenues to grow by >10% for 12-18mo. Margins to expand. Operating income to grow >7% over 12-18mo. Momentum in construction continues. Earnings to grow 1-3%.
Lower international prices. Earnings to grow 0-4%. Packaging demand driven by economic outlook and food consumption. Tissue demand linked to population and hygiene standards. Earnings to decline 1-4%.
Secular paper consumption to decline 5% in mature markets. Operating earnings to grow 0-4%. Slower than expected US home construction and weaker log/wood product exports to China. Core ad revenue to grow 0.5-2.5%. Strong political ad revenue. EBITDA to grow 3-4%, broadband gains offsetting video.
Stable margins. Revenue to grow 3%, operating profit 4%. EBITDA down, declining demand, consolidation. Operating income +2%. Wireless revenue 3-4% growth. Stable wireless margins but offset by wireline services. Operating margins sustained above 10%.
Revenue per passenger to grow. Single-digit EBITDA growth, mostly due to lower costs. Positive on tankers. Industry revenue growth of 2.5-3.5%. Higher freight volume and strong core pricing.
Headwinds in oil, metals and agriculture. (Source: Moody’s, Raymond James) 5|Page . FIQ 1st Quarter, 2016 State Tax Rates, Ratings & Relative Strength Highest Tax Rate Alabama Alaska Arizona Arkansas California Colorado Connecticut Delaware Florida Georgia Hawaii Idaho Illinois Indiana Iowa Kansas Kentucky Louisiana Maine Maryland Massachusetts Michigan Minnesota Mississippi Missouri Montana Nebraska Nevada New Hampshire New Jersey New Mexico New York North Carolina North Dakota Ohio Oklahoma Oregon Pennsylvania Rhode Island South Carolina South Dakota Tennessee Texas Utah Vermont Virginia Moody's Rating 4.54% 6.90% 13.30% 4.63% 6.99% 6.60% 0.00% 6.00% 11.00% 7.40% 3.75% 3.30% 8.98% 4.60% 6.00% 6.00% 7.15% 5.75% 5.10% 4.25% 9.85% 5.00% 6.00% 6.90% 6.84% 0.00% 5.00% * 8.97% 4.90% 8.82% 5.75% 2.90% 5.00% 5.25% 9.90% 3.07% 5.99% 7.00% 0.00% 6.00% * 0.00% 5.00% 8.95% 5.75% S&P Rating Cities School Districts Counties Aa1 Aaa 5.00% 0.00% AA AA+ Jan downgrade Strong NR Strong NR Strong Strong Aa2 May upgrade Aa1 Aa3 Aa1 Aa3 Aaa Aa1 Aaa Aa2 Aa1 Baa1 Oct downgrade Aaa Aaa Aa2 Aa2 Aa2 Aa2 Aaa Aa1 Aa1 Aa1 Aa2 Aaa Aa1 Aa2 Aaa Aa1 A2 Aaa Aa1 Aaa Aa1 Aa1 Aa2 Aa1 Aa3 Aa2 Aaa Aa2 Aaa Aaa Aaa Aaa Aaa AA May upgrade AA AA- July upgrade AA AA Mar negative outlook AAA AAA AAA AA AA+ A- Dec negative outlook AAA AAA AA A+ Sept downgrade AA Feb negative outlook AA AAA AA+ Nov negative outlook AA- July positive outlook AA+ Aug positive outlook AA AAA AA AAA AA AA A AA+ AA+ AAA AAA AA+ AA+ AA+ AAAA AA+ AAA May upgrade AA+ Oct positive outlook AAA AAA AA+ AAA Strong Moderate Moderate Strong Strong Strong Strong Very Strong NR Strong Moderate Moderate Very Strong Strong Strong Strong Strong Very Strong Strong Moderate Strong Strong Strong Strong Strong Strong Strong Strong Moderate Moderate Very Strong Strong Moderate Moderate Strong Strong Moderate Strong Strong Very Strong Strong Strong Very Strong Strong Moderate Moderate Moderate Moderate Strong NR Moderate Strong NR Moderate Moderate Moderate Strong Moderate Moderate Strong Strong NR Moderate Weak Moderate Moderate Strong Strong Moderate Moderate Strong Moderate Moderate Moderate NR Moderate Moderate Moderate Moderate Weak Moderate Strong Strong Strong Strong Strong NR Moderate Strong NR Moderate Strong NR Strong Strong Very Strong Strong Strong Moderate Moderate Very Strong Strong Strong Strong Moderate Strong Moderate Moderate Strong Very Strong Strong NR Very Strong Strong Strong Strong Strong Moderate Very Strong Strong Moderate Moderate Strong Strong NR Strong Strong Very Strong Very Strong Strong Very Strong NR Washington 0.00% Aa1 AA+ Strong Strong Strong West Virginia 6.50% Aa1 AA Strong NR Strong Wisconsin 7.65% Aa2 AA Moderate Strong Strong Wyoming 0.00% AAA Strong NR Strong * Interest and dividends only. All noted rating changes occurred in 2015 except Alaska. Source: State Websites, Moody's Senior Most Tax Backed Rating, Standard & Poor's Rating Service January 7, 2016. Highest tax rates are as of date of publication and are all subject to change. 6|Page . FIQ 1st Quarter, 2016 Strategy Talk Simplified For many years we’ve been bombarded with the idea that interest rates have but one way to go… up; however, the reality is that all those predictions have been wrong. Decisions are often made with considerations that become discarded certainties. Numerous recommendations have suggested either lowering duration or completely staying out of fixed income securities, both suggestions that have not fared well over the past several years. Our strategy talk suggests leaving prognosticating out of the equation. The one constant over the years is that we all are terrible at predicting the future.
Know what you own and why you own it. A portfolio’s allocation to fixed income preserves wealth and provides the predictable cash flow and income to do so. Trying to achieve this through other means doesn’t always work out.
According to a January 2016 article appearing in the Chicago Tribune (Choe, Stan. “Dividends on the Chopping Block as Profit Growth Peters Out” Associated Press), about 500 companies cut or halted their dividends last year. In addition to a board of directors determined dividend, those companies that cut dividends usually don’t do so because profits and growth of the company are thriving, suggesting that the equity price may be under equal stress. Monies committed to growth should be in growth potential assets just the same as monies dedicated to preservation of wealth and/or income may be better invested in individual fixed income investments. “The journey of a thousand miles begins with one step.” – Lao Tzu Among all the reasons that fixed income protects wealth, the two key characteristics to invoke are: the stated maturity and the predictable cash flow and income.
When a company announces the amount of dividends they will pay their stockholders, it is determined only after their non-optional interest payments are made to bond holders. The feast and/or famine payments that make growth assets desirable for growth reasons are just different than the more predictable wealth preservation assets. Again, know what you own and why you own it. Effective Maturity vs.
Stated Maturity: A stated maturity is simply when the bond is scheduled to mature. If a bond includes a call option and that call is likely to happen, the shorter effective maturity will reflect when the face value is likely to be returned. In a rising rate environment, bonds that once were “expected” to be called and reflect a shorter effective maturity, may all of a sudden extend out, creating a very different time line (longer) than what may have been expected. What to do: Consider bonds with longer or no calls to provide an effective maturity closer to the stated maturity.
This will allow the portfolio to generate and collect the income longer which is desirable in a flat and/or falling interest rate environment. â–ª 7|Page . FIQ 1st Quarter, 2016 Cash Flow vs. Income: Income is what a bond earns (the yield) and cash flow is what money a bond is paying (the coupon). The coupon times the face value of a bond determines the amount of cash flow generated by a bond. In practice, some of this cash flow may represent income and some of it may represent return of premium paid.
Income is calculated by multiplying the yield times the amount of an investment. Income or yield is what the bond holder is earning. Accuracy of Predictions? “As the Olympic torch neared Lake Placid, N.Y. in 1980, signaling the opening of that year’s Winter Olympics, newspapers and magazines throughout the world offered predictions who would win medals in the major sports.
Not a single publication gave the American men’s hockey team a chance against the world powers.” – Don Yaeger What to do: Always remember that yield trumps all other characteristics. Do not sacrifice yield for other characteristics which are usually coveted because of their beneficial features under certain circumstances. For example, we have preached the benefits of a high coupon bond in that it generates a greater cash flow which in turn may be invested more quickly in a rising interest rate environment.
The assumption is that given a choice between two bonds with the same yield where one is a high coupon (say 5.00%) and one is a lower coupon (say 3.00%), the higher coupon bond will benefit the investor as interest rates rise. High coupon bonds have afforded similar or even better yields; however, if a lower coupon bond provides a significantly better yield, that income is realized (actual) and not predicated on whether rates will rise. The market has shifted and the yield-to-worst and sometimes the yield-tomaturity on many higher coupon bonds pale by comparison. Duration Drift: Modified duration measures the price sensitivity of a bond.
A duration of 2, in simplified terms, means that for every 1% or 100 basis point (bp) move in interest rates, a bond holder can expect about a 2% move in the bond’s market price. In other words, if interest rates rise 1%, the bond price will fall about 2% for a bond with a duration of 2. In a low interest rate environment, it may be assumed that a high coupon bond will get called before the stated maturity on its call date.
If interest rates rise significantly, that assumption may go away. The bond may now “drift” to its much longer stated maturity, increasing its duration and subjecting it to a much greater price fluctuation. What to do: Again, know what you own. If interest rates remain flat and low, many of the call options will play out and the bonds will be redeemed early.
If interest rates rise, some bonds will extend to being redeemed on their longer stated maturity dates. Look for bonds with more call protection or with no calls to reduce or eliminate duration drift. â–ª 8|Page .
FIQ 1st Quarter, 2016 A Deeper Dive Into Yield Finding portfolio appropriate bonds encompasses a wide variety of criteria including: maturity, duration, coupon, issuer, rating, optionality, sector, and yield. Individual goals (purpose) and risk tolerance are driving forces for bond suitability. There is no “perfect” bond. For example, the bond perspective of a 50 year old not requiring any income from a $2,000,000 portfolio is very different than that of a 75 year old, dependent solely on income sourced from a $500,000 fixed income portfolio.
The point is that all bond characteristics require independent analysis for each unique investor. Optimizing yield is the ultimate goal, yet a more insightful way to view this would be the goal to optimize yield given an individual’s risk profile. Working backwards, a bond’s yield may be a very telling piece of information in that yield reflects a bond’s worth based on the combination of all the characteristics of maturity, duration, coupon, issuer’s credit worthiness, etc. Corporate Spreads Widening Sector/AvgMat Now 1yr Ago AA-Rated 9y 109 82 Finance 6y 92 78 Industrial 10y 113 84 Utility 14y 130 79 A-Rated 10y 142 82 Finance 7y 128 78 Industrial 11y 152 84 Utility 16y 143 79 BBB-Rated 10y 261 191 Finance 8y 194 174 Industrial 11y 312 203 Utility 13y 213 161 source: YieldBook, Raymond James as of 2/1/16 Assume there are two seemingly similar bonds with the same coupons, similar call structures and the same maturities, yet one is yielding 2.5% and the other 6%. Obviously there is a difference of risk not explained by the bond structures.
The yield difference alerts us to further inquiry. Perhaps one of the issuers is exposed to a possible takeover or merger. Maybe a sector is exposed to market barriers. It may be pending litigation or overexposure to an emerging market economy that is struggling.
There are many reasons potentially explaining why two seemingly similar bonds with similar characteristics have this yield divergence but that discrepancy can direct the attention to defining the risks and determining appropriateness. YTM 2.63% 2.16% 2.75% 2.99% 3.04% 2.70% 3.19% 3.46% 4.24% 3.41% 4.78% 3.93% 1yr 2yr 5yr 10yr 15yr 20yr 25yr 30yr AAA Municipal G.O. YTM TEY 1yrAgo 0.40% 0.66% 0.23% 0.66% 1.09% 0.68% 1.00% 1.66% 1.56% 1.71% 2.83% 2.90% 2.16% 3.58% 3.58% 2.44% 4.04% 3.94% 2.69% 4.45% 4.12% 2.75% 4.55% 4.21% taxable equivalent yield based on 39.6% bracket source: Bloomberg, MMD, Raymond James 2/1/16 By defining risk and evaluating whether that risk is acceptable, an investor can optimize their return (yield). Although Treasury yields are flat to falling, most buy-and-hold investors purchase spread product such as corporate bonds, municipal bonds, CDs, preferred securities and agency bonds. Spreads are widening meaning the yields on spread products are holding despite the general Treasury yield decline.
â–ª 9|Page . FIQ 1st Quarter, 2016 “Never make predictions, especially about the future.” – Casey Stengel Muni Default Rates IG Moody's Rated Issuers 1-Yr 5-Yr Issuers General Obligation 8,600 AAA 0.00% 0.00% AA 0.00% 0.00% A 0.00% 0.01% Baa 0.01% 0.03% Non-GO 8,400 AAA 0.00% 0.00% AA 0.00% 0.01% A 0.01% 0.06% Baa 0.02% 0.29% source: Moody's Data Report July 2015 Corporate Default Rates Investment-Grade Default Rate 1-Yr 5-Yr Issuers Global 0.06% 0.90% 8,857 N. America 0.00% 0.07% 4,146 Europe 0.00% 2.38% 2,517 Asia-Pacific 0.00% 0.00% 1,165 Industrials 0.00% 0.00% 4,122 Finance 0.00% 1.85% 3,038 1,691 Utilities, Sov 0.21% 0.25% & Project Fin source: Moody's Data Report January, 2016 Trending News: Public Finance ï‚· S&P’s 3rd quarter 2015 marked the 12th straight quarter of more upgrades versus downgrades. (S&P) o Stronger finances reason in 198 of 285 upgrades. o Deteriorating finances and liquidity main reasons for downgrades. o California led way with 90 upgrades. ï‚· Seven rated bond issues defaulted. (S&P) o Puerto Rico Public Finance Corporation defaulted on 4 series (August). o Dowling College, Charter School of Boynton Beach and Stockton Redevelopment Agency, CA each defaulted. rd ï‚· S&P 3 quarter upgrade/downgrade: Local governments 159 upgrades/50 downgrades; Utilities 29 upgrades/21 downgrades; Not-for-profit health care 18 upgrades/4 downgrades; Higher education 10 upgrades/18 downgrades; Charter schools 2 upgrades/5 downgrades; Transportation 11 upgrades/2 downgrades. ï‚· States upgraded 2015: Arizona (Aa2/AA, Moody’s/S&P); California (AA-, S&P); South Dakota (AAA, S&P). ï‚· States downgraded 2015: Illinois (Baa1, Moody’s); Kentucky (A+, S&P); Alaska (AA+, S&P/2016). ï‚· Federal budget (2016) maintains Public Housing Capital Fund appropriation at $1.9 billion (4th consecutive year). Protects revenue stream of Public Housing Authorities (PHAs).
Historically, capital funding for public housing is vulnerable to appropriation cuts. Levels cut 8 times from 2001-2013. It stabilized in 2013 and has remained flat.
This has been credit positive. (source: Moody’s) Corporate ï‚· Moody’s placed 175 energy and mining companies on review for possible downgrade (January 21). ï‚· Moody’s lowered their forward price projections across the commodities spectrum. The range of possible outcomes upon conclusion of the review for given issuers varies from possible confirmation of ratings to multi-notch downgrades. ï‚· North American one-year investment-grade corporate default rate = 0.00%.
Five-year = 0.07% (source: Moody’s) ï‚· North American one-year [Caa-C] default rate = 4.90%. The five-year default rate [Caa-C] = 23.26%. (source: Moody’s) â–ª 10 | P a g e .
FIQ 1st Quarter, 2016 Corporates: Sector Analysis and Current Value Treasuries are flat, corporate yields are UP! The Fed “liftoff” in December did help the shortest part of the yield curve move higher, but the longer-end has a mind of its own. One of the most popular benchmarks, the 10-year Treasury yield1 is down by 61bp since October 2014 when we first ran this scan and YTD is down ~41bp. Market pundits and financial journalism will focus on the Treasury market as a proxy for yields, but this is only one side of the story. For those looking for higher yields, look no further than the corporate bond market; yield spreads have increased considerably helping to offset stubborn Treasury yields. As proof, the Citi Broad Investment Grade Credit Index (Citi BIGC) has a current spread of +195bp, the highest level in the post-recession and postQuantitative Easing (QE) era2. This is up from the +140bp level seen this time last year and well above the +120bp seen in late 2014. 10-year Treasury Yield (red) and Citi BIGC Spreads (blue) (Source: YieldBook, Raymond James) As noted in the chart above, nearly any way you look at it, the 10y Treasury yield (red line) is roughly flat while credit spreads are up dramatically.
Remember the premise: Treasury + spread = corporate yield. Therefore, yields in corporate credit are actually up. Putting it all together; Treasury yields are flat or slightly down, but spreads are wider (higher) meaning corporate bond yields are higher in 2016. Next, we examine which specific industries offer the most compelling opportunities in the corporate sector.
The Citi BIGC Index is comprised of three broad industries: industrials, utilities and finance, which are comprised of 45 smaller and more specific sectors. GOOD NEWS! This section will now be updated each quarter! A refresher on spreads: Within fixed income, spread is the comparison between two bonds where one bond is the base rate or index. Often, Treasuries are the base rate of comparison. If the 10â€year Treasury yield is 2.00% and a comparison 10-year corporate bond is trading with a spread of 150 basis points (150bp), it means the corporate bond is trading with a yield of 3.50% (2.00% Treasury yield + 150bp (spread) = 3.50% corporate yield). “I figure lots of predictions is best. People forget the ones I get wrong and marvel over the rest.” – Alan Cox (continued on next page) 1 As of 2/5/16.
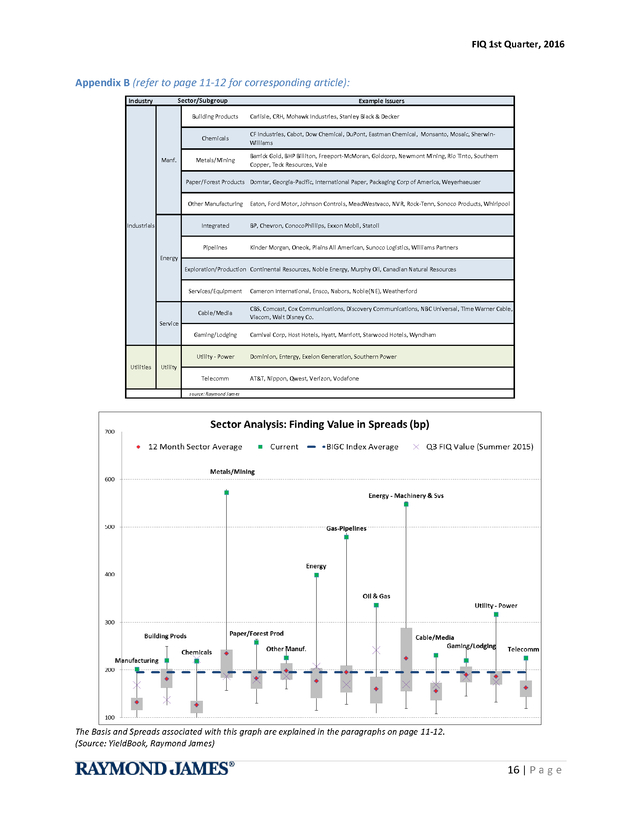
The 10-year Treasury was chosen as a comparable benchmark as it bests matches the 10.5 year average maturity of the BIG Credit Index. 2 This is the highest sustained level since the Sep-Dec 2011 period. 11 | P a g e . FIQ 1st Quarter, 2016 The chart below details those sectors that currently provide yield spreads above the 195bp offered by the broad index (the dotted blue line). For comparison, the year-over-year average index spread is 140bp. Each sector is represented by a grey box (middle 50% of observations) as well as two “whiskers” representing the high and low spreads seen over the last year. The green and red markers are the current and average yield spread respectively.
What does the chart show us? Each of the highlighted sectors currently has yield spreads (green dot) above its own multi-year average (red dot), many substantially so. For those investors seeking yield and where it is appropriate, these sectors offer yields well above their investment grade peers. Keep in mind, additional spread may indicate additional risk. “Price is what you pay. Value is what you get.” – Warren Buffet The Takeaway: Treasuries provide a base rate but spread products, such as corporate bonds, provide a considerable yield pick-up to Treasury rates. The Basis and Spreads associated with this graph are explained in the paragraphs above.
Larger view available on page 16. (Source: YieldBook, Raymond James) So what is the highlight from the chart? Sectors including: building products, chemicals (new to the list), metals/mining, paper/forest products, manufacturing, gas-pipelines, energy-machinery, cable/media, utilities and telecomm all have spreads higher than the index average and provide outsized yields for those willing/able to assume additional risk/volatility. We continue to live in a world where it remains uncertain as to when, or if, rates will rise significantly in the near future. Searching for higher yields now? Consider investing in those areas in the investment grade market that are exhibiting wider than normal spreads.
Pair this additional spread with the recent rise in Treasury yields, and they pack a powerful one-two-punch resulting in the highest investment grade yields in several years. A larger view of this chart, along with a list of industries/sectors and issuers can be found in Appendix B on page 14. â–ª 12 | P a g e .
FIQ 1st Quarter, 2016 Plans of Action Know What You Own: Fixed income securities have provided one of the better total returns over the past couple of years; however, don’t be sucked into believing this is their primary purpose. Equities, for example, will always carry a much higher potential for price growth and thus greater total return than fixed income securities. Unfortunately, recent history is demonstrating that with greater upward potential also comes greater potential for principal loss. Fixed income securities provide a known cash flow and income stream with a stated maturity and return of face value. This is their strength just as growth is equity’s strength.
Don’t try to substitute one for the other based on a brief moment in time. Think long-term when investing. Spread Products Are Delivering: We are at historically low Treasury interest rate levels. It is hard to be excited about 2.00% yields.
This is not always about growing wealth but sometimes about not losing wealth. Spreads have widened on many products, so although Treasury yields seem dismal, corporate bonds, municipal bonds, CDs on the short-end and preferred securities are offering reliable income at levels well above Treasury rates in a market with minimal negative inflation effect. “If you do not change direction, you may end up where you are heading.” – Gautama Buddha Laddered Portfolios: Simply put, rate predicting is speculating. Don’t speculate with the portion of your portfolio which is the foundation of your wealth and retirement. Investing in securities which are going to protect if ‘xyz’ occurs may prove harmful to one’s wealth.
Invest the foundation portfolio dollars based on today, not what you think might happen tomorrow. A laddered portfolio may prevent the need for forward projection, possibly provide a higher return and allow continual portfolio roll-off to be reinvested under whatever changing interest rate environment occurs. Don’t Stuff Your Money Under the Mattress: We don’t want to guess interest rates but we need to recognize our surroundings. Examine the current environment: All economic powers, with the exception of the U.S., are currently easing monetary policy. The dollar continues to stay strong, thus impeding corporate profits. Inflation remains a “non-factor”.
Growth in China, the largest commodity consumer, is completely in a downward spiral. Commodity demand is low and therefore prices and commodity companies are getting pummeled. Oil continues to be weak. Equities are already down 7% on the year. Is there any reason to believe interest rates will be significantly higher in the foreseeable future? Of course we don’t know.
We do know that sitting on the sideline will provide no return. Stay invested, stay the course. Despite the contrary proclamation, duration has actually been an investor’s friend over the past several years. â–ª 13 | P a g e .
FIQ 1st Quarter, 2016 Additional Fixed Income and Strategy Resources Doug Drabik - Sr. Fixed Income Strategist Benjamin Streed, CFA - Fixed Income Strategist Drew O’Neil - Fixed Income Strategist The Fixed Income Strategy Group provides market commentary, portfolio analysis and strategy to Raymond James advisors for the benefit of their clients. We are part of the larger 13 person Fixed Income Services Group (FISG). RaymondJames.com is a vast resource for those seeking fixed income market commentaries, strategies, education materials and index/yield data. Please visit our public webpage at http://raymondjames.com/fixin.htm for popular resources which include: “Every client with the means to properly diversify, can have a customized bond portfolio that will perform as intended regardless of interest rate moves.
“ ï‚· ï‚· ï‚· ï‚· ï‚· ï‚· Bond Market Update Fixed Income Market Commentary by Kevin Giddis Weekly Interest Rate Monitor Fixed Income Weekly Primer Taxable Fixed Income Chartbook Weekly Index Monitor - FISG of Raymond James Investments we cover: ï‚· Treasuries/Agencies ï‚· Brokered CDs ï‚· Corporate bonds ï‚· MBS/CMOs ï‚· Tax-exempt municipals bonds ï‚· Taxable municipal bonds ï‚· Preferred securities 14 | P a g e . FIQ 1st Quarter, 2016 Appendix A 10% 15% 25% 28% 33% 35% 39.60% 2015 Federal Tax Rates Single Married Joint Less than 9,225 Less than 18,450 9,225 - 37,450 18,450 - 74,900 37,450 - 90,750 74,900 - 151,200 90,750 - 189,300 151,200 - 230,450 189,300 - 411,500 230,450 - 411,500 411,500 - 413,200 411,500 - 464,850 More than 413,200 More than 464,850 Head of Household Less than 13,150 13,150 - 50,200 50,200 - 129,600 129,600 - 209,850 209,850 - 411,500 411,500 - 439,000 More than 439,000 Capital Gains Tax Rates Maximum Effective Maximum Rate Rate with 3.8% Surtax Holding Period Assets Held One Year or Less 39.6% 43.4%* Assets Held More Than One Year and Sold by Individuals in the 39.6% Tax Bracket or Above 20.0% 23.8%* Assets Held More Than One Year and Sold by Individuals in the 25% to 35% Tax Brackets 15.0% 18.8%** Assets Held More than One Year and Sold by Individuals in the 15% Bracket or Below 0.0% 0.00% * The a ddi tiona l 3.8% Medi ca re s urtax wi l l a ppl y to thes e taxpa yers . ** The a ddi tiona l 3.8% Medi ca re s urtax ma y a ppl y to thes e taxpa yers . Alternative Minimum Tax (AMT) AMT Exemption AMT Exemption Filing Status 2015 Threshold 2015 Married Filing Jointly and $83,400 $158,900 Surviving Spouses Single or Head of Household $53,600 $119,200 Married Filing Separately $41,700 $79,450 Annual Gift Tax Exclusion: $14,000 Estate Tax Exclusion: $5,430,000 Source: Raymond James: “2015 Tax and Financial Planning Flier” Consult your professional tax advisor for questions relating to your individual situation. 15 | P a g e . FIQ 1st Quarter, 2016 Appendix B (refer to page 11-12 for corresponding article): Sector/Subgroup Industry Building Products Example Issuers Carlisle, CRH, Mohawk Industries, Stanley Black & Decker Chemicals Manf. CF Industries, Cabot, Dow Chemical, DuPont, Eastman Chemical, Monsanto, Mosaic, SherwinWilliams Metals/Mining Barrick Gold, BHP Billiton, Freeport-McMoran, Goldcorp, Newmont Mining, Rio Tinto, Southern Copper, Teck Resources, Vale Paper/Forest Products Domtar, Georgia-Pacific, International Paper, Packaging Corp of America, Weyerhaeuser Other Manufacturing Industrials Eaton, Ford Motor, Johnson Controls, MeadWestvaco, NVR, Rock-Tenn, Sonoco Products, Whirlpool Integrated BP, Chevron, ConocoPhillips, Exxon Mobil, Statoil Pipelines Kinder Morgan, Oneok, Plains All American, Sunoco Logistics, Williams Partners Energy Exploration/Production Continental Resources, Noble Energy, Murphy Oil, Canadian Natural Resources Services/Equipment Cable/Media Service Gaming/Lodging Utility - Power Utilities Cameron International, Ensco, Nabors, Noble(NE), Weatherford CBS, Comcast, Cox Communications, Discovery Communications, NBC Universal, Time Warner Cable, Viacom, Walt Disney Co. Carnival Corp, Host Hotels, Hyatt, Marriott, Starwood Hotels, Wyndham Dominion, Entergy, Exelon Generation, Southern Power Utility Telecomm AT&T, Nippon, Qwest, Verizon, Vodafone source: Raymond James The Basis and Spreads associated with this graph are explained in the paragraphs on page 11-12. (Source: YieldBook, Raymond James) 16 | P a g e . FIQ 1st Quarter, 2016 The author of this material is a Trader in the Fixed Income Department of Raymond James & Associates (RJA), and is not an Analyst. Any opinions expressed may differ from opinions expressed by other departments of RJA, including our Equity Research Department, and are subject to change without notice. The data and information contained herein was obtained from sources considered to be reliable, but RJA does not guarantee its accuracy and/or completeness. Neither the information nor any opinions expressed constitute a solicitation for the purchase or sale of any security referred to herein. This material may include analysis of sectors, securities and/or derivatives that RJA may have positions, long or short, held proprietarily. RJA or its affiliates may execute transactions which may not be consistent with the report’s conclusions.
RJA may also have performed investment banking services for the issuers of such securities. Investors should discuss the risks inherent in bonds with their Raymond James Financial Advisor. Risks include, but are not limited to, changes in interest rates, liquidity, credit quality, volatility, and duration.
Past performance is no assurance of future results. This communication is intended to improve the efficiency with which Financial Advisors obtain information relevant to their client's fixed income holdings. This information should not be construed as a directive from the RJ&A Fixed Income Department to buy or sell the securities noted above. Prior to transacting in any security, please discuss the suitability, potential returns, and associated risks of the transactions(s) with your Raymond James Financial Advisor. Investing involves risk and you may incur a profit or a loss.
The value of fixed income securities fluctuates and investors may receive more or less than their original investments if sold prior to maturity. Bonds are subject to price change and availability. Investments in debt securities involve a variety of risks, including credit risk, interest rate risk, and liquidity risk.
Investments in debt securities rated below investment grade (commonly referred to as “junk bonds”) may be subject to greater levels of credit and liquidity risk than investments in investment grade securities. Investors who own fixed income securities should be aware of the relationship between interest rates and the price of those securities. As a general rule, the price of a bond moves inversely to changes in interest rates.
Diversification does not ensure a profit or protect against a loss. The information contained herein has been prepared from sources believed reliable but is not guaranteed by Raymond James & Associates, Inc. (RJA) and is not a complete summary or statement of all available data, nor is it to be construed as an offer to buy or sell any securities referred to herein. Trading ideas expressed are subject to change without notice and do not take into account the particular investment objectives, financial situation or needs of individual investors.
Investors are urged to obtain and review the relevant documents in their entirety. RJA is providing this communication on the condition that it will not form the primary basis for any investment decision you may make. Furthermore, because these are only trade ideas, investors should assume that RJA will not produce any follow-up.
Employees of RJA or its affiliates may, at times, release written or oral commentary, technical analysis or trading strategies that differ from the opinions expressed within. RJA and/or its employees involved in the preparation or the issuance of this communication may have positions in the securities discussed herein. Securities identified herein are subject to availability and changes in price.
All prices and/or yields are indications for informational purposes only. Additional information is available upon request. Raymond James & Associates, Inc., member New York Stock Exchange/SIPC. Raymond James Financial Services, Inc., member FINRA/SIPC Ref.
2016-006939 until 02/08/2017 © 2016 Raymond James & Associates, Inc., member New York Stock Exchange/SIPC © 2016 Raymond James Financial Services, Inc., member FINRA/SIPC Raymond James Corporate Headquarters â— 880 Carillon Parkway, St. Petersburg, FL 33716 17 | P a g e .


