


Description
Economic Research
Published by Raymond James & Associates
Scott J. Brown, Ph.D., (727) 567-2603, Scott.J.Brown@RaymondJames.com
November 19, 2015
Monthly Economic Outlook ______________________________________________________________________________________
Fed Set to Begin Normalization
Average Hourly Earnings, year-over-year % change
U.S. economic activity has appeared mixed, but generally
moderate into 4Q15, with a strong (but somewhat slower)
trend in job growth and low inflation.
Downside risks (to the U.S. economy) from the rest of the
world appear less worrisome than a couple of months ago.
Federal Reserve officials have signaled a strong likelihood
that short-term interest rates will be raised in December.
More importantly, while further policy tightening will be datadependent, the pace of rate increases is expected to be gradual. 2.5 2.5 2.0 2.0 1.5 1.5 1.0 1.0 nominal 0.5 0.5 real 0.0 Real GDP rose at a 1.5% annual rate in the initial estimate for 3Q15, restrained by a large drag (1.4 percentage points) from slower inventory growth. Monthly data indicate that inventories did not slow as much as assumed in the advance GDP report, so we should see an upward revision to the third quarter growth estimate. Real final sales to private domestic purchasers (GDP less net exports, the change in inventories, and government) rose at a 3.2% pace, continuing a strong trend. Real Final Sales to Private Domestic Purchasers, % ch. 6 6 4 4 2 2 0 0 -2 -2 -4 quarterly (annual rate) -4 year-over-year % ch. -6 -6 -8 -8 Source: Bureau of Economic Analysis -10 07 08 09 10 11 12 13 14 -10 15 Financial market participants often focus too much on the headline economic data, without appreciating the details and the nuance under the surface.
The fixation on the monthly nonfarm payroll figure is a good example. There is a fair amount of statistical noise in the employment data. Seasonal adjustment is often difficult and job gains can be easily shifted from one month to the next.
Hence, it’s important to focus on the underlying trend. The three-month average reduces, but does not eliminate, the noise in the data. Nonfarm payrolls were reported to have risen by 271,000 in the initial estimate for October.
More importantly, the three-month average was +187,000 – strong, but somewhat below the average pace of 2014 (+260,000) and the first half of this year (+213,000). The ADP payroll survey showed a pickup in hiring by smaller firms in October, after a slowing in the previous three months. 0.0 Source: BLS -0.5 Jan-13 -0.5 Jan-14 Jan-15 The unemployment rate fell to 5.0% in October, the lowest since April 2008. The employment/population ratio edged up to 59.3%, little changed over the last year and still about 3.5 percentage points lower than it was before the recession (much of that likely reflects the aging of the population).
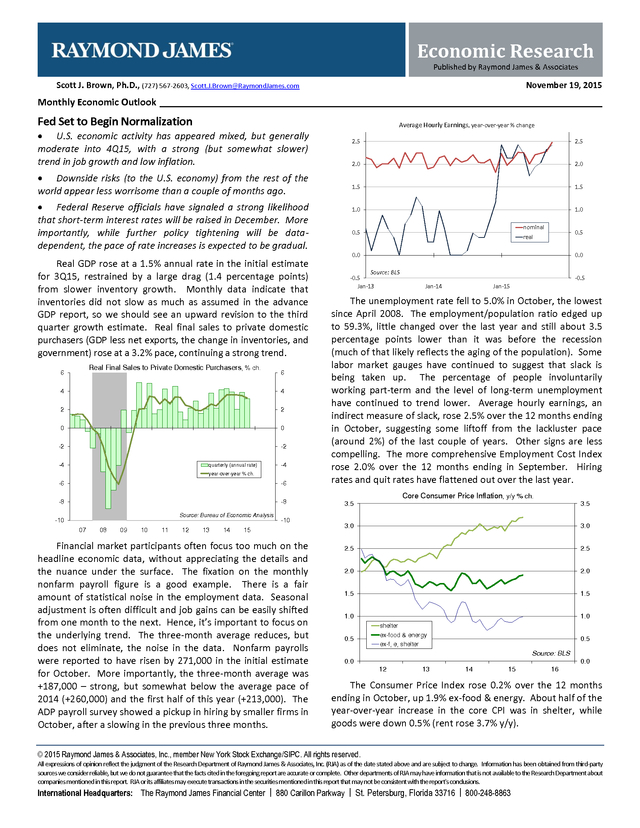
Some labor market gauges have continued to suggest that slack is being taken up. The percentage of people involuntarily working part-term and the level of long-term unemployment have continued to trend lower. Average hourly earnings, an indirect measure of slack, rose 2.5% over the 12 months ending in October, suggesting some liftoff from the lackluster pace (around 2%) of the last couple of years.
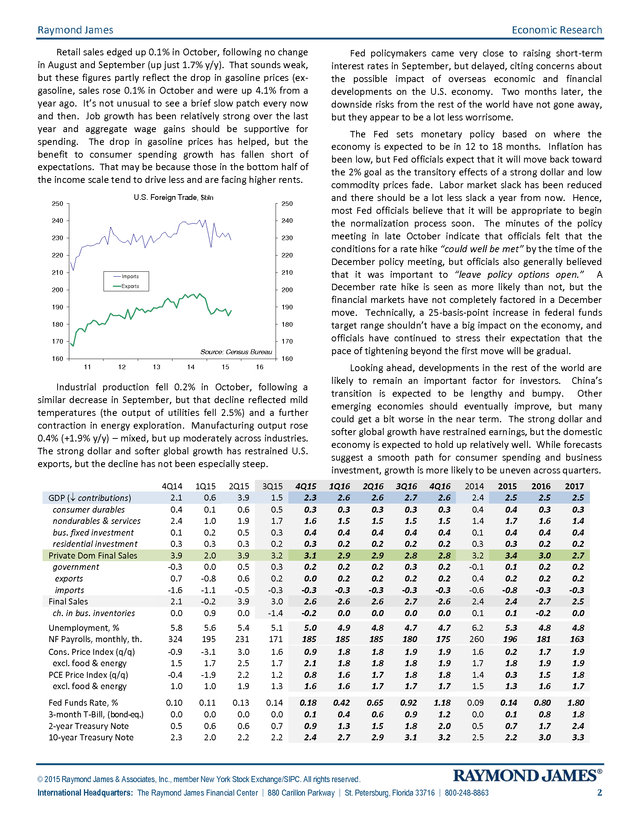
Other signs are less compelling. The more comprehensive Employment Cost Index rose 2.0% over the 12 months ending in September. Hiring rates and quit rates have flattened out over the last year. Core Consumer Price Inflation, y/y % ch. 3.5 3.5 3.0 3.0 2.5 2.5 2.0 2.0 1.5 1.5 1.0 0.5 1.0 shelter ex-food & energy ex-f, e, shelter 0.5 Source: BLS 0.0 0.0 12 13 14 15 16 The Consumer Price Index rose 0.2% over the 12 months ending in October, up 1.9% ex-food & energy.
About half of the year-over-year increase in the core CPI was in shelter, while goods were down 0.5% (rent rose 3.7% y/y). © 2015 Raymond James & Associates, Inc., member New York Stock Exchange/SIPC. All rights reserved. All expressions of opinion reflect the judgment of the Research Department of Raymond James & Associates, Inc. (RJA) as of the date stated above and are subject to change.
Information has been obtained from third-party sources we consider reliable, but we do not guarantee that the facts cited in the foregoing report are accurate or complete. Other departments of RJA may have information that is not available to the Research Department about companies mentioned in this report. RJA or its affiliates may execute transactions in the securities mentioned in this report that may not be consistent with the report's conclusions. A Jl R s ic h T h b s a r t n e i International Headquarters: The Raymond James Financial Center | 880 Carillon Parkway | St.
Petersburg, Florida 33716 | 800-248-8863 . Raymond James Economic Research Retail sales edged up 0.1% in October, following no change in August and September (up just 1.7% y/y). That sounds weak, but these figures partly reflect the drop in gasoline prices (exgasoline, sales rose 0.1% in October and were up 4.1% from a year ago. It’s not unusual to see a brief slow patch every now and then. Job growth has been relatively strong over the last year and aggregate wage gains should be supportive for spending.
The drop in gasoline prices has helped, but the benefit to consumer spending growth has fallen short of expectations. That may be because those in the bottom half of the income scale tend to drive less and are facing higher rents. U.S. Foreign Trade, $bln 250 250 240 240 230 230 220 220 210 210 Imports Exports 200 200 190 190 180 180 170 170 Source: Census Bureau 160 160 11 12 13 14 15 16 Industrial production fell 0.2% in October, following a similar decrease in September, but that decline reflected mild temperatures (the output of utilities fell 2.5%) and a further contraction in energy exploration.
Manufacturing output rose 0.4% (+1.9% y/y) – mixed, but up moderately across industries. The strong dollar and softer global growth has restrained U.S. exports, but the decline has not been especially steep. Fed policymakers came very close to raising short-term interest rates in September, but delayed, citing concerns about the possible impact of overseas economic and financial developments on the U.S. economy. Two months later, the downside risks from the rest of the world have not gone away, but they appear to be a lot less worrisome. The Fed sets monetary policy based on where the economy is expected to be in 12 to 18 months.
Inflation has been low, but Fed officials expect that it will move back toward the 2% goal as the transitory effects of a strong dollar and low commodity prices fade. Labor market slack has been reduced and there should be a lot less slack a year from now. Hence, most Fed officials believe that it will be appropriate to begin the normalization process soon.
The minutes of the policy meeting in late October indicate that officials felt that the conditions for a rate hike “could well be met” by the time of the December policy meeting, but officials also generally believed that it was important to “leave policy options open.” A December rate hike is seen as more likely than not, but the financial markets have not completely factored in a December move. Technically, a 25-basis-point increase in federal funds target range shouldn’t have a big impact on the economy, and officials have continued to stress their expectation that the pace of tightening beyond the first move will be gradual. Looking ahead, developments in the rest of the world are likely to remain an important factor for investors. China’s transition is expected to be lengthy and bumpy.
Other emerging economies should eventually improve, but many could get a bit worse in the near term. The strong dollar and softer global growth have restrained earnings, but the domestic economy is expected to hold up relatively well. While forecasts suggest a smooth path for consumer spending and business investment, growth is more likely to be uneven across quarters. GDP ( contributions) consumer durables nondurables & services bus.
fixed investment residential investment Private Dom Final Sales government exports imports Final Sales ch. in bus. inventories 4Q14 2.1 0.4 2.4 0.1 0.3 3.9 -0.3 0.7 -1.6 2.1 0.0 1Q15 0.6 0.1 1.0 0.2 0.3 2.0 0.0 -0.8 -1.1 -0.2 0.9 2Q15 3.9 0.6 1.9 0.5 0.3 3.9 0.5 0.6 -0.5 3.9 0.0 3Q15 1.5 0.5 1.7 0.3 0.2 3.2 0.3 0.2 -0.3 3.0 -1.4 4Q15 2.3 0.3 1.6 0.4 0.3 3.1 0.2 0.0 -0.3 2.6 -0.2 1Q16 2.6 0.3 1.5 0.4 0.2 2.9 0.2 0.2 -0.3 2.6 0.0 2Q16 2.6 0.3 1.5 0.4 0.2 2.9 0.2 0.2 -0.3 2.6 0.0 3Q16 2.7 0.3 1.5 0.4 0.2 2.8 0.3 0.2 -0.3 2.7 0.0 4Q16 2.6 0.3 1.5 0.4 0.2 2.8 0.2 0.2 -0.3 2.6 0.0 2014 2.4 0.4 1.4 0.1 0.3 3.2 -0.1 0.4 -0.6 2.4 0.1 2015 2.5 0.4 1.7 0.4 0.3 3.4 0.1 0.2 -0.8 2.4 0.1 2016 2.5 0.3 1.6 0.4 0.2 3.0 0.2 0.2 -0.3 2.7 -0.2 2017 2.5 0.3 1.4 0.4 0.2 2.7 0.2 0.2 -0.3 2.5 0.0 Unemployment, % NF Payrolls, monthly, th. Cons.
Price Index (q/q) excl. food & energy PCE Price Index (q/q) excl. food & energy 5.8 324 -0.9 1.5 -0.4 1.0 5.6 195 -3.1 1.7 -1.9 1.0 5.4 231 3.0 2.5 2.2 1.9 5.1 171 1.6 1.7 1.2 1.3 5.0 185 0.9 2.1 0.8 1.6 4.9 185 1.8 1.8 1.6 1.6 4.8 185 1.8 1.8 1.7 1.7 4.7 180 1.9 1.8 1.8 1.7 4.7 175 1.9 1.9 1.8 1.7 6.2 260 1.6 1.7 1.4 1.5 5.3 196 0.2 1.8 0.3 1.3 4.8 181 1.7 1.9 1.5 1.6 4.8 163 1.9 1.9 1.8 1.7 Fed Funds Rate, % 3-month T-Bill, (bond-eq.) 2-year Treasury Note 10-year Treasury Note 0.10 0.0 0.5 2.3 0.11 0.0 0.6 2.0 0.13 0.0 0.6 2.2 0.14 0.0 0.7 2.2 0.18 0.1 0.9 2.4 0.42 0.4 1.3 2.7 0.65 0.6 1.5 2.9 0.92 0.9 1.8 3.1 1.18 1.2 2.0 3.2 0.09 0.0 0.5 2.5 0.14 0.1 0.7 2.2 0.80 0.8 1.7 3.0 1.80 1.8 2.4 3.3 © 2015 Raymond James & Associates, Inc., member New York Stock Exchange/SIPC.
All rights reserved. International Headquarters: The Raymond James Financial Center | 880 Carillon Parkway | St. Petersburg, Florida 33716 | 800-248-8863 2 .
More importantly, while further policy tightening will be datadependent, the pace of rate increases is expected to be gradual. 2.5 2.5 2.0 2.0 1.5 1.5 1.0 1.0 nominal 0.5 0.5 real 0.0 Real GDP rose at a 1.5% annual rate in the initial estimate for 3Q15, restrained by a large drag (1.4 percentage points) from slower inventory growth. Monthly data indicate that inventories did not slow as much as assumed in the advance GDP report, so we should see an upward revision to the third quarter growth estimate. Real final sales to private domestic purchasers (GDP less net exports, the change in inventories, and government) rose at a 3.2% pace, continuing a strong trend. Real Final Sales to Private Domestic Purchasers, % ch. 6 6 4 4 2 2 0 0 -2 -2 -4 quarterly (annual rate) -4 year-over-year % ch. -6 -6 -8 -8 Source: Bureau of Economic Analysis -10 07 08 09 10 11 12 13 14 -10 15 Financial market participants often focus too much on the headline economic data, without appreciating the details and the nuance under the surface.
The fixation on the monthly nonfarm payroll figure is a good example. There is a fair amount of statistical noise in the employment data. Seasonal adjustment is often difficult and job gains can be easily shifted from one month to the next.
Hence, it’s important to focus on the underlying trend. The three-month average reduces, but does not eliminate, the noise in the data. Nonfarm payrolls were reported to have risen by 271,000 in the initial estimate for October.
More importantly, the three-month average was +187,000 – strong, but somewhat below the average pace of 2014 (+260,000) and the first half of this year (+213,000). The ADP payroll survey showed a pickup in hiring by smaller firms in October, after a slowing in the previous three months. 0.0 Source: BLS -0.5 Jan-13 -0.5 Jan-14 Jan-15 The unemployment rate fell to 5.0% in October, the lowest since April 2008. The employment/population ratio edged up to 59.3%, little changed over the last year and still about 3.5 percentage points lower than it was before the recession (much of that likely reflects the aging of the population).
Some labor market gauges have continued to suggest that slack is being taken up. The percentage of people involuntarily working part-term and the level of long-term unemployment have continued to trend lower. Average hourly earnings, an indirect measure of slack, rose 2.5% over the 12 months ending in October, suggesting some liftoff from the lackluster pace (around 2%) of the last couple of years.
Other signs are less compelling. The more comprehensive Employment Cost Index rose 2.0% over the 12 months ending in September. Hiring rates and quit rates have flattened out over the last year. Core Consumer Price Inflation, y/y % ch. 3.5 3.5 3.0 3.0 2.5 2.5 2.0 2.0 1.5 1.5 1.0 0.5 1.0 shelter ex-food & energy ex-f, e, shelter 0.5 Source: BLS 0.0 0.0 12 13 14 15 16 The Consumer Price Index rose 0.2% over the 12 months ending in October, up 1.9% ex-food & energy.
About half of the year-over-year increase in the core CPI was in shelter, while goods were down 0.5% (rent rose 3.7% y/y). © 2015 Raymond James & Associates, Inc., member New York Stock Exchange/SIPC. All rights reserved. All expressions of opinion reflect the judgment of the Research Department of Raymond James & Associates, Inc. (RJA) as of the date stated above and are subject to change.
Information has been obtained from third-party sources we consider reliable, but we do not guarantee that the facts cited in the foregoing report are accurate or complete. Other departments of RJA may have information that is not available to the Research Department about companies mentioned in this report. RJA or its affiliates may execute transactions in the securities mentioned in this report that may not be consistent with the report's conclusions. A Jl R s ic h T h b s a r t n e i International Headquarters: The Raymond James Financial Center | 880 Carillon Parkway | St.
Petersburg, Florida 33716 | 800-248-8863 . Raymond James Economic Research Retail sales edged up 0.1% in October, following no change in August and September (up just 1.7% y/y). That sounds weak, but these figures partly reflect the drop in gasoline prices (exgasoline, sales rose 0.1% in October and were up 4.1% from a year ago. It’s not unusual to see a brief slow patch every now and then. Job growth has been relatively strong over the last year and aggregate wage gains should be supportive for spending.
The drop in gasoline prices has helped, but the benefit to consumer spending growth has fallen short of expectations. That may be because those in the bottom half of the income scale tend to drive less and are facing higher rents. U.S. Foreign Trade, $bln 250 250 240 240 230 230 220 220 210 210 Imports Exports 200 200 190 190 180 180 170 170 Source: Census Bureau 160 160 11 12 13 14 15 16 Industrial production fell 0.2% in October, following a similar decrease in September, but that decline reflected mild temperatures (the output of utilities fell 2.5%) and a further contraction in energy exploration.
Manufacturing output rose 0.4% (+1.9% y/y) – mixed, but up moderately across industries. The strong dollar and softer global growth has restrained U.S. exports, but the decline has not been especially steep. Fed policymakers came very close to raising short-term interest rates in September, but delayed, citing concerns about the possible impact of overseas economic and financial developments on the U.S. economy. Two months later, the downside risks from the rest of the world have not gone away, but they appear to be a lot less worrisome. The Fed sets monetary policy based on where the economy is expected to be in 12 to 18 months.
Inflation has been low, but Fed officials expect that it will move back toward the 2% goal as the transitory effects of a strong dollar and low commodity prices fade. Labor market slack has been reduced and there should be a lot less slack a year from now. Hence, most Fed officials believe that it will be appropriate to begin the normalization process soon.
The minutes of the policy meeting in late October indicate that officials felt that the conditions for a rate hike “could well be met” by the time of the December policy meeting, but officials also generally believed that it was important to “leave policy options open.” A December rate hike is seen as more likely than not, but the financial markets have not completely factored in a December move. Technically, a 25-basis-point increase in federal funds target range shouldn’t have a big impact on the economy, and officials have continued to stress their expectation that the pace of tightening beyond the first move will be gradual. Looking ahead, developments in the rest of the world are likely to remain an important factor for investors. China’s transition is expected to be lengthy and bumpy.
Other emerging economies should eventually improve, but many could get a bit worse in the near term. The strong dollar and softer global growth have restrained earnings, but the domestic economy is expected to hold up relatively well. While forecasts suggest a smooth path for consumer spending and business investment, growth is more likely to be uneven across quarters. GDP ( contributions) consumer durables nondurables & services bus.
fixed investment residential investment Private Dom Final Sales government exports imports Final Sales ch. in bus. inventories 4Q14 2.1 0.4 2.4 0.1 0.3 3.9 -0.3 0.7 -1.6 2.1 0.0 1Q15 0.6 0.1 1.0 0.2 0.3 2.0 0.0 -0.8 -1.1 -0.2 0.9 2Q15 3.9 0.6 1.9 0.5 0.3 3.9 0.5 0.6 -0.5 3.9 0.0 3Q15 1.5 0.5 1.7 0.3 0.2 3.2 0.3 0.2 -0.3 3.0 -1.4 4Q15 2.3 0.3 1.6 0.4 0.3 3.1 0.2 0.0 -0.3 2.6 -0.2 1Q16 2.6 0.3 1.5 0.4 0.2 2.9 0.2 0.2 -0.3 2.6 0.0 2Q16 2.6 0.3 1.5 0.4 0.2 2.9 0.2 0.2 -0.3 2.6 0.0 3Q16 2.7 0.3 1.5 0.4 0.2 2.8 0.3 0.2 -0.3 2.7 0.0 4Q16 2.6 0.3 1.5 0.4 0.2 2.8 0.2 0.2 -0.3 2.6 0.0 2014 2.4 0.4 1.4 0.1 0.3 3.2 -0.1 0.4 -0.6 2.4 0.1 2015 2.5 0.4 1.7 0.4 0.3 3.4 0.1 0.2 -0.8 2.4 0.1 2016 2.5 0.3 1.6 0.4 0.2 3.0 0.2 0.2 -0.3 2.7 -0.2 2017 2.5 0.3 1.4 0.4 0.2 2.7 0.2 0.2 -0.3 2.5 0.0 Unemployment, % NF Payrolls, monthly, th. Cons.
Price Index (q/q) excl. food & energy PCE Price Index (q/q) excl. food & energy 5.8 324 -0.9 1.5 -0.4 1.0 5.6 195 -3.1 1.7 -1.9 1.0 5.4 231 3.0 2.5 2.2 1.9 5.1 171 1.6 1.7 1.2 1.3 5.0 185 0.9 2.1 0.8 1.6 4.9 185 1.8 1.8 1.6 1.6 4.8 185 1.8 1.8 1.7 1.7 4.7 180 1.9 1.8 1.8 1.7 4.7 175 1.9 1.9 1.8 1.7 6.2 260 1.6 1.7 1.4 1.5 5.3 196 0.2 1.8 0.3 1.3 4.8 181 1.7 1.9 1.5 1.6 4.8 163 1.9 1.9 1.8 1.7 Fed Funds Rate, % 3-month T-Bill, (bond-eq.) 2-year Treasury Note 10-year Treasury Note 0.10 0.0 0.5 2.3 0.11 0.0 0.6 2.0 0.13 0.0 0.6 2.2 0.14 0.0 0.7 2.2 0.18 0.1 0.9 2.4 0.42 0.4 1.3 2.7 0.65 0.6 1.5 2.9 0.92 0.9 1.8 3.1 1.18 1.2 2.0 3.2 0.09 0.0 0.5 2.5 0.14 0.1 0.7 2.2 0.80 0.8 1.7 3.0 1.80 1.8 2.4 3.3 © 2015 Raymond James & Associates, Inc., member New York Stock Exchange/SIPC.
All rights reserved. International Headquarters: The Raymond James Financial Center | 880 Carillon Parkway | St. Petersburg, Florida 33716 | 800-248-8863 2 .


