Broken China - Fears of slower growth in China and other emerging economies - August 25, 2015
Raymond James Financial Services


Description
Economic Research
Published by Raymond James & Associates
Scott J. Brown, Ph.D., (727) 567-2603, Scott.J.Brown@RaymondJames.com
August 25, 2015
Monthly Economic Outlook ______________________________________________________________________________________
Broken China
Fears of slower growth in China and other emerging
economies have added to investor anxieties around the world.
While U.S. exporters will face restraints from slower growth
abroad, lower commodity prices should be beneficial for
consumers and domestic-oriented businesses.
The Fed remains on track to begin raising short-term
interest rates, but downward pressure on commodity prices and
the lack of a meaningful pickup in wage growth is likely to lead
the Fed to delay policy action the near term.
China’s stock market correction and its ill-fated attempt to
move to a market-driven exchange rate regime have rattled
investors’ nerves. The stock market decline is the unwinding of
a bubble.
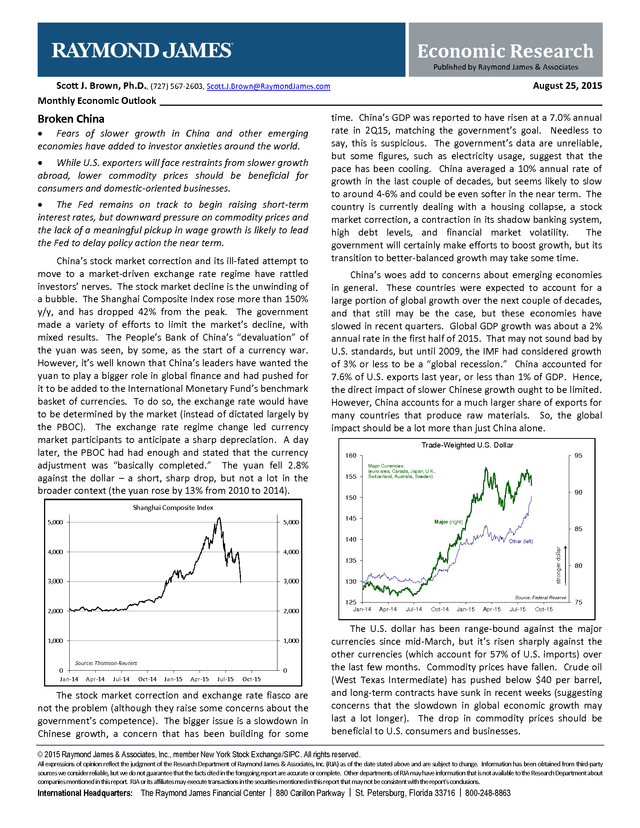
The Shanghai Composite Index rose more than 150% y/y, and has dropped 42% from the peak. The government made a variety of efforts to limit the market’s decline, with mixed results. The People’s Bank of China’s “devaluation” of the yuan was seen, by some, as the start of a currency war. However, it’s well known that China’s leaders have wanted the yuan to play a bigger role in global finance and had pushed for it to be added to the International Monetary Fund’s benchmark basket of currencies.
To do so, the exchange rate would have to be determined by the market (instead of dictated largely by the PBOC). The exchange rate regime change led currency market participants to anticipate a sharp depreciation. A day later, the PBOC had had enough and stated that the currency adjustment was “basically completed.” The yuan fell 2.8% against the dollar – a short, sharp drop, but not a lot in the broader context (the yuan rose by 13% from 2010 to 2014). time.
China’s GDP was reported to have risen at a 7.0% annual rate in 2Q15, matching the government’s goal. Needless to say, this is suspicious. The government’s data are unreliable, but some figures, such as electricity usage, suggest that the pace has been cooling.
China averaged a 10% annual rate of growth in the last couple of decades, but seems likely to slow to around 4-6% and could be even softer in the near term. The country is currently dealing with a housing collapse, a stock market correction, a contraction in its shadow banking system, high debt levels, and financial market volatility. The government will certainly make efforts to boost growth, but its transition to better-balanced growth may take some time. China’s woes add to concerns about emerging economies in general. These countries were expected to account for a large portion of global growth over the next couple of decades, and that still may be the case, but these economies have slowed in recent quarters.
Global GDP growth was about a 2% annual rate in the first half of 2015. That may not sound bad by U.S. standards, but until 2009, the IMF had considered growth of 3% or less to be a “global recession.” China accounted for 7.6% of U.S.
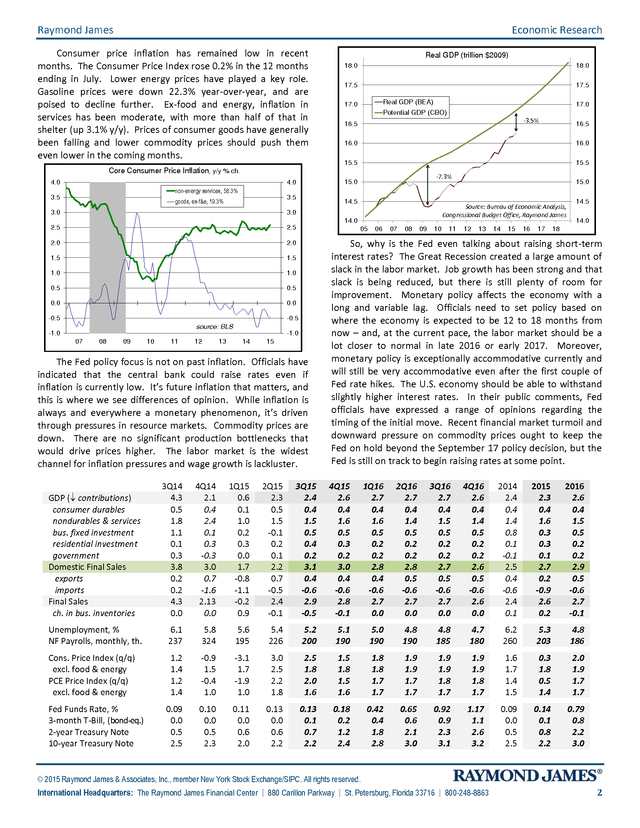
exports last year, or less than 1% of GDP. Hence, the direct impact of slower Chinese growth ought to be limited. However, China accounts for a much larger share of exports for many countries that produce raw materials. So, the global impact should be a lot more than just China alone. Trade-Weighted U.S.
Dollar 160 155 95 Major Currencies: (euro area, Canada, Japan, U.K., Switzerland, Australia, Sweden) 90 150 Shanghai Composite Index 5,000 5,000 145 Major (right) 85 140 stronger dollar 4,000 Other (left) 4,000 135 3,000 3,000 2,000 2,000 1,000 1,000 130 Source: Federal Reserve 125 Source: Thomson-Reuters 0 Jan-14 0 Apr-14 Jul-14 Oct-14 Jan-15 Apr-15 Jul-15 Oct-15 The stock market correction and exchange rate fiasco are not the problem (although they raise some concerns about the government’s competence). The bigger issue is a slowdown in Chinese growth, a concern that has been building for some Jan-14 Apr-14 Jul-14 Oct-14 Jan-15 Apr-15 Jul-15 80 75 Oct-15 The U.S. dollar has been range-bound against the major currencies since mid-March, but it’s risen sharply against the other currencies (which account for 57% of U.S.
imports) over the last few months. Commodity prices have fallen. Crude oil (West Texas Intermediate) has pushed below $40 per barrel, and long-term contracts have sunk in recent weeks (suggesting concerns that the slowdown in global economic growth may last a lot longer).
The drop in commodity prices should be beneficial to U.S. consumers and businesses. © 2015 Raymond James & Associates, Inc., member New York Stock Exchange/SIPC. All rights reserved. All expressions of opinion reflect the judgment of the Research Department of Raymond James & Associates, Inc.
(RJA) as of the date stated above and are subject to change. Information has been obtained from third-party sources we consider reliable, but we do not guarantee that the facts cited in the foregoing report are accurate or complete. Other departments of RJA may have information that is not available to the Research Department about companies mentioned in this report.
RJA or its affiliates may execute transactions in the securities mentioned in this report that may not be consistent with the report's conclusions. A Jl R s ic h T h b s a r t n e i International Headquarters: The Raymond James Financial Center | 880 Carillon Parkway | St. Petersburg, Florida 33716 | 800-248-8863 . Raymond James Economic Research Consumer price inflation has remained low in recent months. The Consumer Price Index rose 0.2% in the 12 months ending in July. Lower energy prices have played a key role. Gasoline prices were down 22.3% year-over-year, and are poised to decline further. Ex-food and energy, inflation in services has been moderate, with more than half of that in shelter (up 3.1% y/y).
Prices of consumer goods have generally been falling and lower commodity prices should push them even lower in the coming months. Real GDP (trillion $2009) 18.0 18.0 17.5 17.5 Real GDP (BEA) 17.0 -3.5% 16.5 16.0 15.5 15.5 -7.3% 15.0 4.0 16.5 16.0 Core Consumer Price Inflation, y/y % ch. 4.0 17.0 Potential GDP (CBO) 15.0 non-energy services, 58.3% 3.5 3.5 goods, ex-f&e, 19.3% 3.0 2.5 2.5 2.0 2.0 1.5 1.5 1.0 1.0 0.5 0.5 0.0 14.5 0.0 Source: Bureau of Economic Analysis, Congressional Budget Office, Raymond James 3.0 14.0 -0.5 05 -0.5 source: BLS -1.0 -1.0 07 08 09 10 11 12 13 14 15 The Fed policy focus is not on past inflation. Officials have indicated that the central bank could raise rates even if inflation is currently low. It’s future inflation that matters, and this is where we see differences of opinion.
While inflation is always and everywhere a monetary phenomenon, it’s driven through pressures in resource markets. Commodity prices are down. There are no significant production bottlenecks that would drive prices higher.
The labor market is the widest channel for inflation pressures and wage growth is lackluster. 06 07 08 09 10 11 12 13 14 15 16 17 14.5 14.0 18 So, why is the Fed even talking about raising short-term interest rates? The Great Recession created a large amount of slack in the labor market. Job growth has been strong and that slack is being reduced, but there is still plenty of room for improvement. Monetary policy affects the economy with a long and variable lag.
Officials need to set policy based on where the economy is expected to be 12 to 18 months from now – and, at the current pace, the labor market should be a lot closer to normal in late 2016 or early 2017. Moreover, monetary policy is exceptionally accommodative currently and will still be very accommodative even after the first couple of Fed rate hikes. The U.S.
economy should be able to withstand slightly higher interest rates. In their public comments, Fed officials have expressed a range of opinions regarding the timing of the initial move. Recent financial market turmoil and downward pressure on commodity prices ought to keep the Fed on hold beyond the September 17 policy decision, but the Fed is still on track to begin raising rates at some point. GDP ( contributions) consumer durables nondurables & services bus.
fixed investment residential investment government Domestic Final Sales exports imports Final Sales ch. in bus. inventories 3Q14 4.3 0.5 1.8 1.1 0.1 0.3 3.8 0.2 0.2 4.3 0.0 4Q14 2.1 0.4 2.4 0.1 0.3 -0.3 3.0 0.7 -1.6 2.13 0.0 1Q15 0.6 0.1 1.0 0.2 0.3 0.0 1.7 -0.8 -1.1 -0.2 0.9 2Q15 2.3 0.5 1.5 -0.1 0.2 0.1 2.2 0.7 -0.5 2.4 -0.1 3Q15 2.4 0.4 1.5 0.5 0.4 0.2 3.1 0.4 -0.6 2.9 -0.5 4Q15 2.6 0.4 1.6 0.5 0.3 0.2 3.0 0.4 -0.6 2.8 -0.1 1Q16 2.7 0.4 1.6 0.5 0.2 0.2 2.8 0.4 -0.6 2.7 0.0 2Q16 2.7 0.4 1.4 0.5 0.2 0.2 2.8 0.5 -0.6 2.7 0.0 3Q16 2.7 0.4 1.5 0.5 0.2 0.2 2.7 0.5 -0.6 2.7 0.0 4Q16 2.6 0.4 1.4 0.5 0.2 0.2 2.6 0.5 -0.6 2.6 0.0 2014 2.4 0.4 1.4 0.8 0.1 -0.1 2.5 0.4 -0.6 2.4 0.1 2015 2.3 0.4 1.6 0.3 0.3 0.1 2.7 0.2 -0.9 2.6 0.2 2016 2.6 0.4 1.5 0.5 0.2 0.2 2.9 0.5 -0.6 2.7 -0.1 Unemployment, % NF Payrolls, monthly, th. 6.1 237 5.8 324 5.6 195 5.4 226 5.2 200 5.1 190 5.0 190 4.8 190 4.8 185 4.7 180 6.2 260 5.3 203 4.8 186 Cons.
Price Index (q/q) excl. food & energy PCE Price Index (q/q) excl. food & energy 1.2 1.4 1.2 1.4 -0.9 1.5 -0.4 1.0 -3.1 1.7 -1.9 1.0 3.0 2.5 2.2 1.8 2.5 1.8 2.0 1.6 1.5 1.8 1.5 1.6 1.8 1.8 1.7 1.7 1.9 1.9 1.7 1.7 1.9 1.9 1.8 1.7 1.9 1.9 1.8 1.7 1.6 1.7 1.4 1.5 0.3 1.8 0.5 1.4 2.0 1.9 1.7 1.7 0.09 0.0 0.5 2.5 0.10 0.0 0.5 2.3 0.11 0.0 0.6 2.0 0.13 0.0 0.6 2.2 0.13 0.1 0.7 2.2 0.18 0.2 1.2 2.4 0.42 0.4 1.8 2.8 0.65 0.6 2.1 3.0 0.92 0.9 2.3 3.1 1.17 1.1 2.6 3.2 0.09 0.0 0.5 2.5 0.14 0.1 0.8 2.2 0.79 0.8 2.2 3.0 Fed Funds Rate, % 3-month T-Bill, (bond-eq.) 2-year Treasury Note 10-year Treasury Note © 2015 Raymond James & Associates, Inc., member New York Stock Exchange/SIPC.
All rights reserved. International Headquarters: The Raymond James Financial Center | 880 Carillon Parkway | St. Petersburg, Florida 33716 | 800-248-8863 2 .
The Shanghai Composite Index rose more than 150% y/y, and has dropped 42% from the peak. The government made a variety of efforts to limit the market’s decline, with mixed results. The People’s Bank of China’s “devaluation” of the yuan was seen, by some, as the start of a currency war. However, it’s well known that China’s leaders have wanted the yuan to play a bigger role in global finance and had pushed for it to be added to the International Monetary Fund’s benchmark basket of currencies.
To do so, the exchange rate would have to be determined by the market (instead of dictated largely by the PBOC). The exchange rate regime change led currency market participants to anticipate a sharp depreciation. A day later, the PBOC had had enough and stated that the currency adjustment was “basically completed.” The yuan fell 2.8% against the dollar – a short, sharp drop, but not a lot in the broader context (the yuan rose by 13% from 2010 to 2014). time.
China’s GDP was reported to have risen at a 7.0% annual rate in 2Q15, matching the government’s goal. Needless to say, this is suspicious. The government’s data are unreliable, but some figures, such as electricity usage, suggest that the pace has been cooling.
China averaged a 10% annual rate of growth in the last couple of decades, but seems likely to slow to around 4-6% and could be even softer in the near term. The country is currently dealing with a housing collapse, a stock market correction, a contraction in its shadow banking system, high debt levels, and financial market volatility. The government will certainly make efforts to boost growth, but its transition to better-balanced growth may take some time. China’s woes add to concerns about emerging economies in general. These countries were expected to account for a large portion of global growth over the next couple of decades, and that still may be the case, but these economies have slowed in recent quarters.
Global GDP growth was about a 2% annual rate in the first half of 2015. That may not sound bad by U.S. standards, but until 2009, the IMF had considered growth of 3% or less to be a “global recession.” China accounted for 7.6% of U.S.
exports last year, or less than 1% of GDP. Hence, the direct impact of slower Chinese growth ought to be limited. However, China accounts for a much larger share of exports for many countries that produce raw materials. So, the global impact should be a lot more than just China alone. Trade-Weighted U.S.
Dollar 160 155 95 Major Currencies: (euro area, Canada, Japan, U.K., Switzerland, Australia, Sweden) 90 150 Shanghai Composite Index 5,000 5,000 145 Major (right) 85 140 stronger dollar 4,000 Other (left) 4,000 135 3,000 3,000 2,000 2,000 1,000 1,000 130 Source: Federal Reserve 125 Source: Thomson-Reuters 0 Jan-14 0 Apr-14 Jul-14 Oct-14 Jan-15 Apr-15 Jul-15 Oct-15 The stock market correction and exchange rate fiasco are not the problem (although they raise some concerns about the government’s competence). The bigger issue is a slowdown in Chinese growth, a concern that has been building for some Jan-14 Apr-14 Jul-14 Oct-14 Jan-15 Apr-15 Jul-15 80 75 Oct-15 The U.S. dollar has been range-bound against the major currencies since mid-March, but it’s risen sharply against the other currencies (which account for 57% of U.S.
imports) over the last few months. Commodity prices have fallen. Crude oil (West Texas Intermediate) has pushed below $40 per barrel, and long-term contracts have sunk in recent weeks (suggesting concerns that the slowdown in global economic growth may last a lot longer).
The drop in commodity prices should be beneficial to U.S. consumers and businesses. © 2015 Raymond James & Associates, Inc., member New York Stock Exchange/SIPC. All rights reserved. All expressions of opinion reflect the judgment of the Research Department of Raymond James & Associates, Inc.
(RJA) as of the date stated above and are subject to change. Information has been obtained from third-party sources we consider reliable, but we do not guarantee that the facts cited in the foregoing report are accurate or complete. Other departments of RJA may have information that is not available to the Research Department about companies mentioned in this report.
RJA or its affiliates may execute transactions in the securities mentioned in this report that may not be consistent with the report's conclusions. A Jl R s ic h T h b s a r t n e i International Headquarters: The Raymond James Financial Center | 880 Carillon Parkway | St. Petersburg, Florida 33716 | 800-248-8863 . Raymond James Economic Research Consumer price inflation has remained low in recent months. The Consumer Price Index rose 0.2% in the 12 months ending in July. Lower energy prices have played a key role. Gasoline prices were down 22.3% year-over-year, and are poised to decline further. Ex-food and energy, inflation in services has been moderate, with more than half of that in shelter (up 3.1% y/y).
Prices of consumer goods have generally been falling and lower commodity prices should push them even lower in the coming months. Real GDP (trillion $2009) 18.0 18.0 17.5 17.5 Real GDP (BEA) 17.0 -3.5% 16.5 16.0 15.5 15.5 -7.3% 15.0 4.0 16.5 16.0 Core Consumer Price Inflation, y/y % ch. 4.0 17.0 Potential GDP (CBO) 15.0 non-energy services, 58.3% 3.5 3.5 goods, ex-f&e, 19.3% 3.0 2.5 2.5 2.0 2.0 1.5 1.5 1.0 1.0 0.5 0.5 0.0 14.5 0.0 Source: Bureau of Economic Analysis, Congressional Budget Office, Raymond James 3.0 14.0 -0.5 05 -0.5 source: BLS -1.0 -1.0 07 08 09 10 11 12 13 14 15 The Fed policy focus is not on past inflation. Officials have indicated that the central bank could raise rates even if inflation is currently low. It’s future inflation that matters, and this is where we see differences of opinion.
While inflation is always and everywhere a monetary phenomenon, it’s driven through pressures in resource markets. Commodity prices are down. There are no significant production bottlenecks that would drive prices higher.
The labor market is the widest channel for inflation pressures and wage growth is lackluster. 06 07 08 09 10 11 12 13 14 15 16 17 14.5 14.0 18 So, why is the Fed even talking about raising short-term interest rates? The Great Recession created a large amount of slack in the labor market. Job growth has been strong and that slack is being reduced, but there is still plenty of room for improvement. Monetary policy affects the economy with a long and variable lag.
Officials need to set policy based on where the economy is expected to be 12 to 18 months from now – and, at the current pace, the labor market should be a lot closer to normal in late 2016 or early 2017. Moreover, monetary policy is exceptionally accommodative currently and will still be very accommodative even after the first couple of Fed rate hikes. The U.S.
economy should be able to withstand slightly higher interest rates. In their public comments, Fed officials have expressed a range of opinions regarding the timing of the initial move. Recent financial market turmoil and downward pressure on commodity prices ought to keep the Fed on hold beyond the September 17 policy decision, but the Fed is still on track to begin raising rates at some point. GDP ( contributions) consumer durables nondurables & services bus.
fixed investment residential investment government Domestic Final Sales exports imports Final Sales ch. in bus. inventories 3Q14 4.3 0.5 1.8 1.1 0.1 0.3 3.8 0.2 0.2 4.3 0.0 4Q14 2.1 0.4 2.4 0.1 0.3 -0.3 3.0 0.7 -1.6 2.13 0.0 1Q15 0.6 0.1 1.0 0.2 0.3 0.0 1.7 -0.8 -1.1 -0.2 0.9 2Q15 2.3 0.5 1.5 -0.1 0.2 0.1 2.2 0.7 -0.5 2.4 -0.1 3Q15 2.4 0.4 1.5 0.5 0.4 0.2 3.1 0.4 -0.6 2.9 -0.5 4Q15 2.6 0.4 1.6 0.5 0.3 0.2 3.0 0.4 -0.6 2.8 -0.1 1Q16 2.7 0.4 1.6 0.5 0.2 0.2 2.8 0.4 -0.6 2.7 0.0 2Q16 2.7 0.4 1.4 0.5 0.2 0.2 2.8 0.5 -0.6 2.7 0.0 3Q16 2.7 0.4 1.5 0.5 0.2 0.2 2.7 0.5 -0.6 2.7 0.0 4Q16 2.6 0.4 1.4 0.5 0.2 0.2 2.6 0.5 -0.6 2.6 0.0 2014 2.4 0.4 1.4 0.8 0.1 -0.1 2.5 0.4 -0.6 2.4 0.1 2015 2.3 0.4 1.6 0.3 0.3 0.1 2.7 0.2 -0.9 2.6 0.2 2016 2.6 0.4 1.5 0.5 0.2 0.2 2.9 0.5 -0.6 2.7 -0.1 Unemployment, % NF Payrolls, monthly, th. 6.1 237 5.8 324 5.6 195 5.4 226 5.2 200 5.1 190 5.0 190 4.8 190 4.8 185 4.7 180 6.2 260 5.3 203 4.8 186 Cons.
Price Index (q/q) excl. food & energy PCE Price Index (q/q) excl. food & energy 1.2 1.4 1.2 1.4 -0.9 1.5 -0.4 1.0 -3.1 1.7 -1.9 1.0 3.0 2.5 2.2 1.8 2.5 1.8 2.0 1.6 1.5 1.8 1.5 1.6 1.8 1.8 1.7 1.7 1.9 1.9 1.7 1.7 1.9 1.9 1.8 1.7 1.9 1.9 1.8 1.7 1.6 1.7 1.4 1.5 0.3 1.8 0.5 1.4 2.0 1.9 1.7 1.7 0.09 0.0 0.5 2.5 0.10 0.0 0.5 2.3 0.11 0.0 0.6 2.0 0.13 0.0 0.6 2.2 0.13 0.1 0.7 2.2 0.18 0.2 1.2 2.4 0.42 0.4 1.8 2.8 0.65 0.6 2.1 3.0 0.92 0.9 2.3 3.1 1.17 1.1 2.6 3.2 0.09 0.0 0.5 2.5 0.14 0.1 0.8 2.2 0.79 0.8 2.2 3.0 Fed Funds Rate, % 3-month T-Bill, (bond-eq.) 2-year Treasury Note 10-year Treasury Note © 2015 Raymond James & Associates, Inc., member New York Stock Exchange/SIPC.
All rights reserved. International Headquarters: The Raymond James Financial Center | 880 Carillon Parkway | St. Petersburg, Florida 33716 | 800-248-8863 2 .


