RSM US Middle Market Business Index - First-of-its-kind index fills gap for middle market-focused economic research
RSM US (formerly McGladrey)


Description
RSM US MIDDLE MARKET
BUSINESS INDEX
. RSM US
MIDDLE MARKET
BUSINESS INDEX
THOUGHT LEADER
Our thought leaders are seasoned professionals, with years of
experience in their fields, and strive to help you and your business succeed.
Thought leaders who have contributed content to this issue include:
Joe Brusuelas, is the chief economist for RSM US LLP. Brusuelas
has 20 years of experience analyzing U.S. monetary policy, labor markets,
fiscal policy, economic indicators and the condition of the U.S. consumer.
As co-founder of the award-winning Bloomberg Economics Brief,
Brusuelas was named one of the 26 economists to follow by the
Huffington Post.
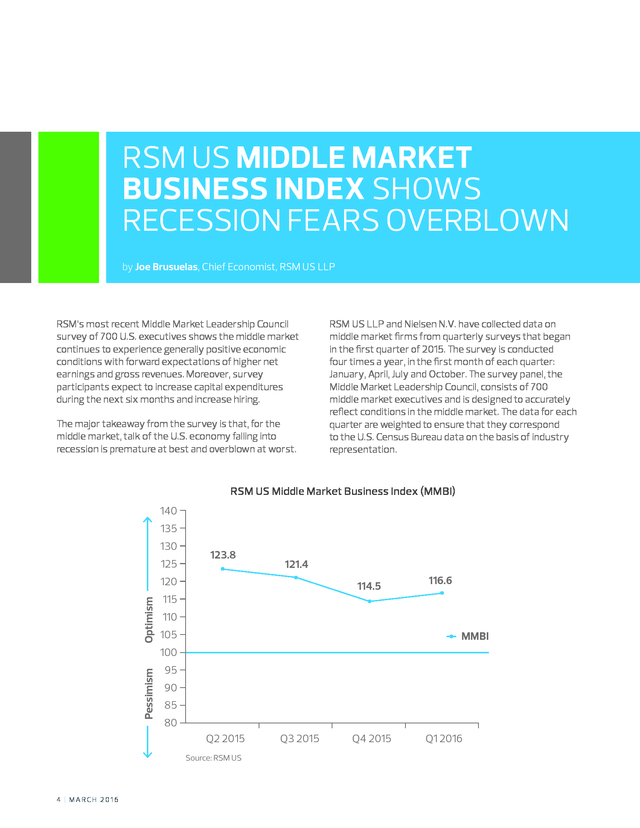
He is a graduate of the University of Southern California and San Diego State University. 2 | MARCH 2016 . TABLE OF CONTENTS RSM US Middle Market Business Index shows recession fears overblown 4 Middle Market Leadership Council: Current perceptions and future expectations 6 This publication represents the views of the author(s), and does not necessarily represent the views of RSM. This publication does not constitute professional advice. RSM US MIDDLE MARKET BUSINESS INDEX | 3 . RSM US MIDDLE MARKET BUSINESS INDEX SHOWS RECESSION FEARS OVERBLOWN by Joe Brusuelas, Chief Economist, RSM US LLP RSM’s most recent Middle Market Leadership Council survey of 700 U.S. executives shows the middle market continues to experience generally positive economic conditions with forward expectations of higher net earnings and gross revenues. Moreover, survey participants expect to increase capital expenditures during the next six months and increase hiring. The major takeaway from the survey is that, for the middle market, talk of the U.S. economy falling into recession is premature at best and overblown at worst. RSM US LLP and Nielsen N.V.
have collected data on middle market firms from quarterly surveys that began in the first quarter of 2015. The survey is conducted four times a year, in the first month of each quarter: January, April, July and October. The survey panel, the Middle Market Leadership Council, consists of 700 middle market executives and is designed to accurately reflect conditions in the middle market.
The data for each quarter are weighted to ensure that they correspond to the U.S. Census Bureau data on the basis of industry representation. RSM US Middle Market Business Index (MMBI) 140 135 130 125 123.8 121.4 Optimism 120 114.5 115 116.6 110 105 MMBI Pessimism 100 95 90 85 80 Q2 2015 Source: RSM US 4 | MARCH 2016 Q3 2015 Q4 2015 Q1 2016 . Developed in partnership with Moody’s Analytics, the RSM US Middle Market Business Index, or MMBI, which is derived from the subset of questions in the survey that ask respondents to report the change in a variety of business indicators, improved to 116.6 in the first quarter of 2016 from the 114.5 reading posted in the fourth quarter of last year as the U.S. economy rebounded from the 1 percent pace of growth in the final three months of 2015. A reading above 100 for the MMBI indicates that the middle market is generally expanding; below 100 indicates that it is generally contracting. The distance from 100 is indicative of the strength of the expansion or contraction. HOW THE MMBI IS CONSTRUCTED The MMBI is borne out of the subset of questions in the survey that ask respondents to report the change in a variety of indicators. Respondents are asked a total of 20 questions patterned after those in other qualitative business surveys, such as those from the Institute of Supply Management and National Federation of Independent Businesses. The 20 questions relate to changes in various measures of their business, such as revenues, profits, capital expenditures, hiring, employee compensation, prices paid, prices received and inventories.
There are also questions that pertain to the economy and outlook, as well as to credit availability and borrowing. For 10 of the questions, respondents are asked to report the change from the previous quarter; for the other 10, they are asked to state the likely direction of these same indicators six months ahead (see Table 1). The MMBI is a composite index computed as an equal weighted sum of the diffusion indexes for 10 survey questions plus 100 to keep the MMBI from becoming negative. The index is designed to capture both current and future conditions, with five questions on respondents’ recent experience and five on their expectations for future activity. Once enough observations exist, each question in the index will be seasonally adjusted when stable seasonality is detected.
The seasonal adjustment will be based on the Census Bureau’s X-12 additive procedure and will utilize a logistic transformation. For this adjustment, the “increase” and “decrease” percentage components of each index question will be tested for seasonality separately and adjusted accordingly if such patterns exist. If no seasonality is detected, the component will be left unadjusted. TABLE 1: RSM US Middle Market Business Index Questions 1. What are your expectations regarding the general economy? 2. What are your expectations regarding your organization’s gross revenues? 3. How would you describe the level of your organization’s most recent quarter net earnings results? 4. What are your expectations regarding your organization’s aggregate capital expenditures or investments? 5. What are your expectations regarding your organization’s overall hiring levels? 6. How would you describe your organization’s current employee compensation level on average? 7. How would you describe current access to credit? 8. What are your expectations regarding your organization’s planned borrowing? 9. How would you describe the current general level of prices received? 10. What are your expectations regarding your organization’s planned inventory levels? RSM US MIDDLE MARKET BUSINESS INDEX | 5 . MIDDLE MARKET LEADERSHIP COUNCIL: CURRENT PERCEPTIONS AND FUTURE EXPECTATIONS METHODOLOGY WHO • A total of 700 senior executives were recruited by Nielsen via phone using a Dun & Bradstreet (D&B) sample • These 700 panel members were invited by Nielsen to participate in four surveys in a one-year period • All respondents were qualified as: - U.S. full-time senior executive decision-maker • Selected industries - Agriculture, forestry, fishing and hunting; Mining, quarrying, and oil and gas extraction; Utilities; Construction; Manufacturing; Wholesale trade; Retail trade; Transportation and warehousing; Information; Finance and insurance; Real estate and rental and leasing; Professional, scientific, and technical services; Administrative and support and waste management and remediation services; Educational services; Health care and social assistance; Arts, entertainment, and recreation; Accommodation and food services; Other services (except public administration) • • • Nonfinancial or financial services company revenue $10M-$1B Financial institution represented by assets AUM $250M-$10B Involved or responsible for business strategy or financial management strategy WHEN • Interviews conducted on a quarterly basis over a 12-month period HOW • Potential respondents were emailed a link to an online survey • Follow-up calls were made to respondents who did not respond to the online survey; they were given the option to complete the survey via telephone GENERAL ECONOMY PERFORMANCE Improve(d) Somewhat/Substantially Q2 2015 39% 20% % Remain Unchanged 41% Current (N=210) 54% 15% Q3 2015 41% 40% 16% 19% Worsen(ed) Somewhat/Substantially Q4 2015 24% 35% 35% 24% 31% 43% 41% 41% 41% Future (N=210) Current (N=252) Future (N=252) Current (N=208) Future (N=208) Q1 2016 27% 38% 36% 31% 37% 31% Current (N=424) Future (N=424) • First, thinking about the general economy this quarter versus last quarter, how would you describe the current general economy? Would you say the general economy has . . . • What are your expectations regarding the general economy over the next six months? Do you expect the general economy will .
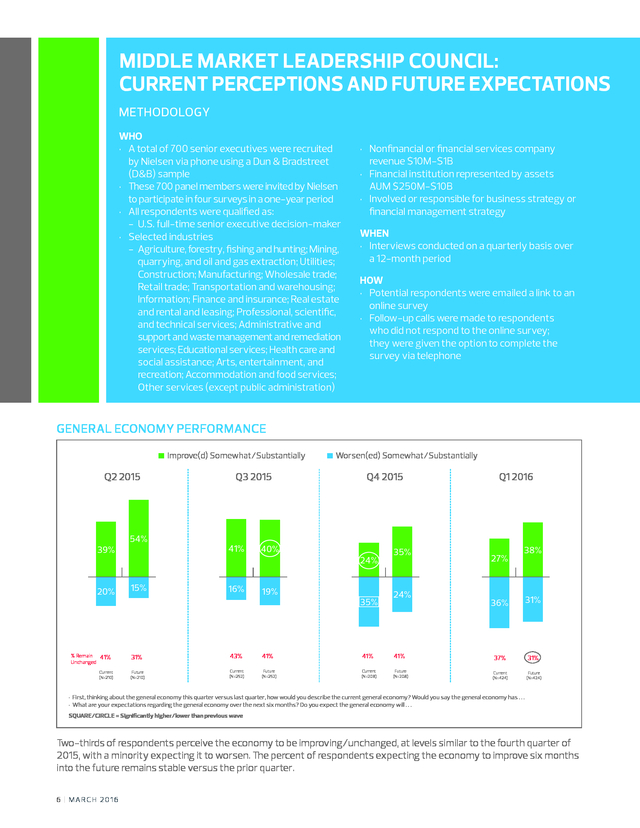
. . SQUARE/CIRCLE = Significantly higher/lower than previous wave Two-thirds of respondents perceive the economy to be improving/unchanged, at levels similar to the fourth quarter of 2015, with a minority expecting it to worsen. The percent of respondents expecting the economy to improve six months into the future remains stable versus the prior quarter. 6 | MARCH 2016 .
GROSS REVENUE PERFORMANCE Increase(d) Somewhat/Substantially Q2 2015 Q3 2015 66% 46% 26% % Remain Unchanged 46% 11% 25% Decrease(d) Somewhat/Substantially Q4 2015 62% 41% 13% 28% Q1 2016 60% 51% 38% 19% 14% 26% 28% 23% 29% 25% 31% 30% 35% 25% Current (N=210) Future (N=210) Current (N=250) Future (N=250) Current (N=208) Future (N=208) Current (N=424) Future (N=426) • Thinking about your organization’s gross revenues/all incoming funds this quarter versus last quarter, how would you describe current gross revenues/all incoming funds? Would you say gross revenues/all incoming funds have . . . • What are your expectations regarding your organization’s gross revenues/all incoming funds over the next six months? Do you expect gross revenues/all incoming funds to . .
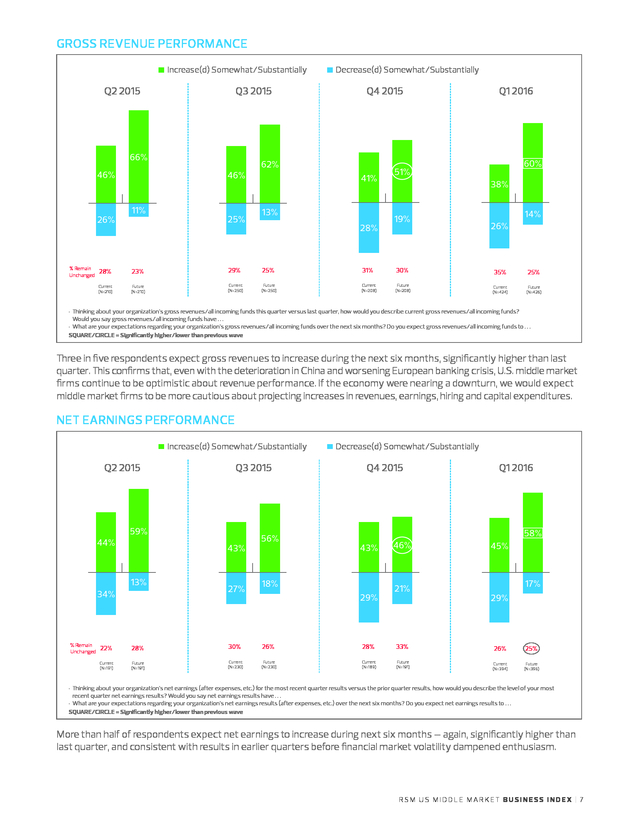
. SQUARE/CIRCLE = Significantly higher/lower than previous wave Three in five respondents expect gross revenues to increase during the next six months, significantly higher than last quarter. This confirms that, even with the deterioration in China and worsening European banking crisis, U.S. middle market firms continue to be optimistic about revenue performance.
If the economy were nearing a downturn, we would expect middle market firms to be more cautious about projecting increases in revenues, earnings, hiring and capital expenditures. NET EARNINGS PERFORMANCE Increase(d) Somewhat/Substantially Q2 2015 44% 59% 43% 13% 34% % Remain Unchanged Q3 2015 27% 56% Decrease(d) Somewhat/Substantially Q4 2015 Q1 2016 58% 43% 18% 29% 46% 21% 45% 17% 29% 22% 28% 30% 26% 28% 33% 26% 25% Current (N=191) Future (N=191) Current (N=230) Future (N=230) Current (N=189) Future (N=191) Current (N=394) Future (N=396) • Thinking about your organization’s net earnings (after expenses, etc.) for the most recent quarter results versus the prior quarter results, how would you describe the level of your most recent quarter net earnings results? Would you say net earnings results have . . . • What are your expectations regarding your organization’s net earnings results (after expenses, etc.) over the next six months? Do you expect net earnings results to .
. . SQUARE/CIRCLE = Significantly higher/lower than previous wave More than half of respondents expect net earnings to increase during next six months – again, significantly higher than last quarter, and consistent with results in earlier quarters before financial market volatility dampened enthusiasm. RSM US MIDDLE MARKET BUSINESS INDEX | 7 . AGGREGATE CAPITAL EXPENDITURES/INVESTMENTS’ PERFORMANCE Increase(d) Somewhat/Substantially Q2 2015 38% 22% % Remain Unchanged Q3 2015 51% 32% 14% 41% 18% 15% Decrease(d) Somewhat/Substantially Q4 2015 Q1 2016 44% 32% 36% 35% 23% 25% 20% 19% 40% 35% 50% 44% 45% 39% 45% 37% Current (N=209) Future (N=210) Current (N=250) Future (N=252) Current (N=207) Future (N=207) Current (N=424) Future (N=425) • Thinking about your organization’s aggregate capital expenditures or investments this quarter versus last quarter, how would you describe your organization’s current capital expenditures/ investments? Would you say capital expenditures/investments have . . . • What are your expectations regarding your organization’s aggregate capital expenditures or investments over the next six months? Would you say capital expenditures/investments will . .
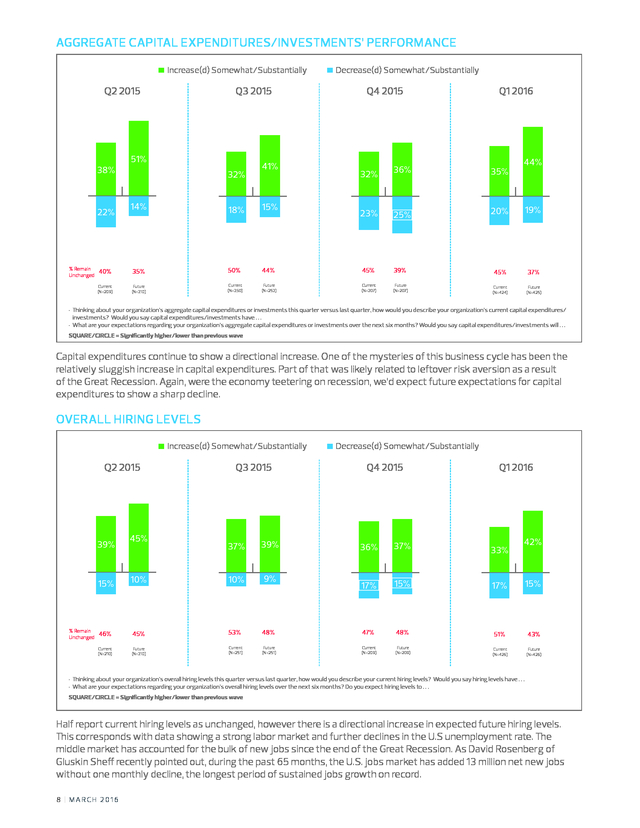
. SQUARE/CIRCLE = Significantly higher/lower than previous wave Capital expenditures continue to show a directional increase. One of the mysteries of this business cycle has been the relatively sluggish increase in capital expenditures. Part of that was likely related to leftover risk aversion as a result of the Great Recession.
Again, were the economy teetering on recession, we’d expect future expectations for capital expenditures to show a sharp decline. OVERALL HIRING LEVELS Increase(d) Somewhat/Substantially Q2 2015 45% Q3 2015 37% 39% 10% 10% 9% 46% 45% 53% Current (N=210) Future (N=210) Current (N=251) 39% 15% % Remain Unchanged Decrease(d) Somewhat/Substantially Q4 2015 Q1 2016 42% 36% 37% 33% 17% 15% 17% 15% 48% 47% 48% 51% 43% Future (N=251) Current (N=209) Future (N=209) Current (N=426) Future (N=426) • Thinking about your organization’s overall hiring levels this quarter versus last quarter, how would you describe your current hiring levels? Would you say hiring levels have . . . • What are your expectations regarding your organization’s overall hiring levels over the next six months? Do you expect hiring levels to .
. . SQUARE/CIRCLE = Significantly higher/lower than previous wave Half report current hiring levels as unchanged, however there is a directional increase in expected future hiring levels. This corresponds with data showing a strong labor market and further declines in the U.S unemployment rate. The middle market has accounted for the bulk of new jobs since the end of the Great Recession.
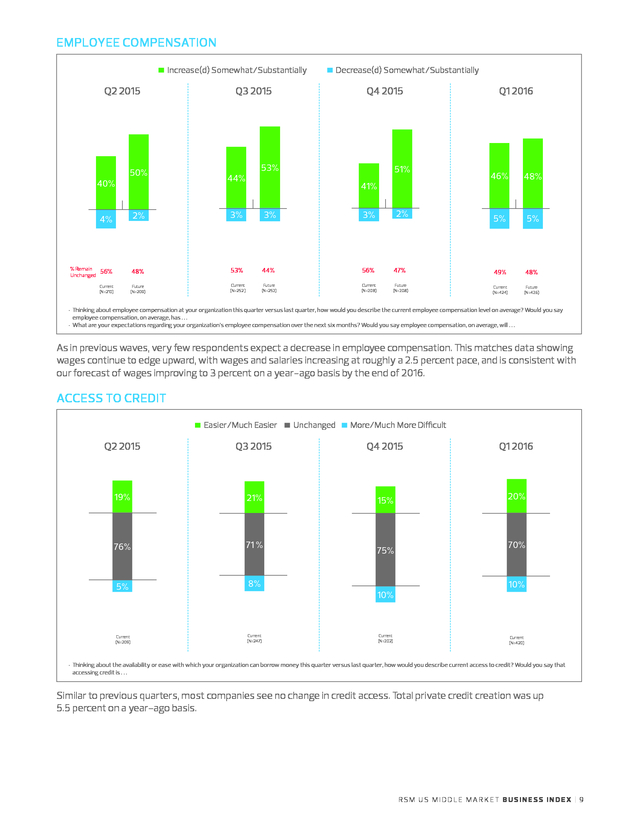
As David Rosenberg of Gluskin Sheff recently pointed out, during the past 65 months, the U.S. jobs market has added 13 million net new jobs without one monthly decline, the longest period of sustained jobs growth on record. 8 | MARCH 2016 . EMPLOYEE COMPENSATION Increase(d) Somewhat/Substantially Q2 2015 50% 40% Q3 2015 Decrease(d) Somewhat/Substantially Q4 2015 53% 44% 51% 41% 2% 3% Q1 2016 46% 48% 5% 5% 2% 3% 3% 56% 48% 53% 44% 56% 47% 49% 48% Current (N=210) Future (N=209) Current (N=252 ) Future (N=252) Current (N=208) Future (N=208) Current (N=424) Future (N=426) 4% % Remain Unchanged • Thinking about employee compensation at your organization this quarter versus last quarter, how would you describe the current employee compensation level on average? Would you say employee compensation, on average, has . . . • What are your expectations regarding your organization’s employee compensation over the next six months? Would you say employee compensation, on average, will . .
. As in previous waves, very few respondents expect a decrease in employee compensation. This matches data showing wages continue to edge upward, with wages and salaries increasing at roughly a 2.5 percent pace, and is consistent with our forecast of wages improving to 3 percent on a year-ago basis by the end of 2016. ACCESS TO CREDIT Easier/Much Easier Unchanged More/Much More Difficult Q2 2015 Q3 2015 Q4 2015 Q1 2016 19% 21% 15% 20% 76% 71 % 5% 8% Current (N=209) Current (N=247) 75% 10% Current (N=202) 70% 10% Current (N=420) • Thinking about the availability or ease with which your organization can borrow money this quarter versus last quarter, how would you describe current access to credit? Would you say that accessing credit is . .
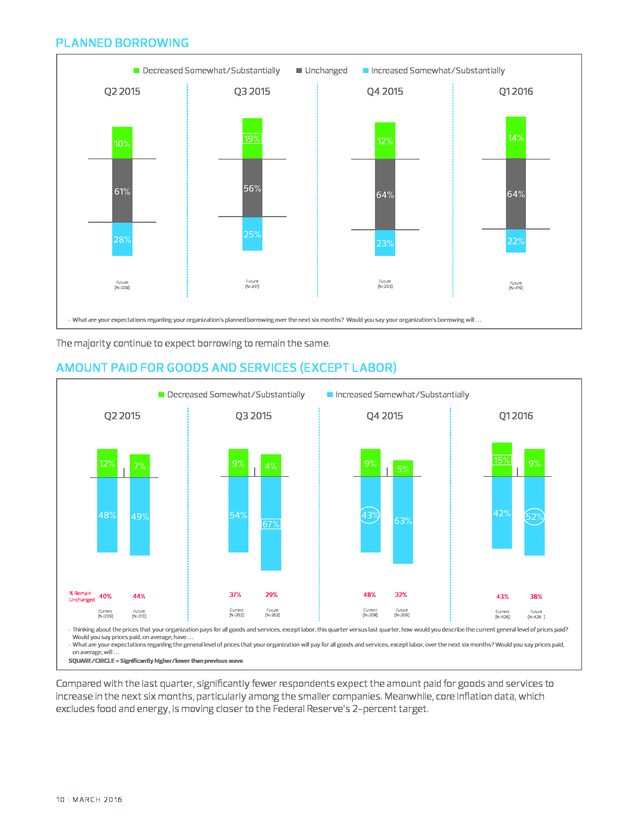
. Similar to previous quarters, most companies see no change in credit access. Total private credit creation was up 5.5 percent on a year-ago basis. RSM US MIDDLE MARKET BUSINESS INDEX | 9 . PLANNED BORROWING Decreased Somewhat/Substantially Q2 2015 Unchanged Increased Somewhat/Substantially Q3 2015 Q4 2015 Q1 2016 19% 12% 14% 64% 64% 23% 22% 10% 56% 61% 25% 28% Future (N=251) Future (N=209) Future (N=203) Future (N=419) • What are your expectations regarding your organization’s planned borrowing over the next six months? Would you say your organization’s borrowing will . . . The majority continue to expect borrowing to remain the same. AMOUNT PAID FOR GOODS AND SERVICES (EXCEPT LABOR) Decreased Somewhat/Substantially Q2 2015 Q3 2015 Increased Somewhat/Substantially Q4 2015 15% 9% 42% 52% 12% 9% 48% 49% 54% 40% 44% 37% 29% 48% 32% 43% 38% Current (N=209) % Remain Unchanged 7% Future (N=210) Current (N=252) Future (N=252) Current (N=208) Future (N=209) Current (N=426) Future (N=426 ) 4% 67% 9% Q1 2016 43% 5% 63% • Thinking about the prices that your organization pays for all goods and services, except labor, this quarter versus last quarter, how would you describe the current general level of prices paid? Would you say prices paid, on average, have . .
. • What are your expectations regarding the general level of prices that your organization will pay for all goods and services, except labor, over the next six months? Would you say prices paid, on average, will . . . SQUARE/CIRCLE = Significantly higher/lower than previous wave Compared with the last quarter, significantly fewer respondents expect the amount paid for goods and services to increase in the next six months, particularly among the smaller companies.
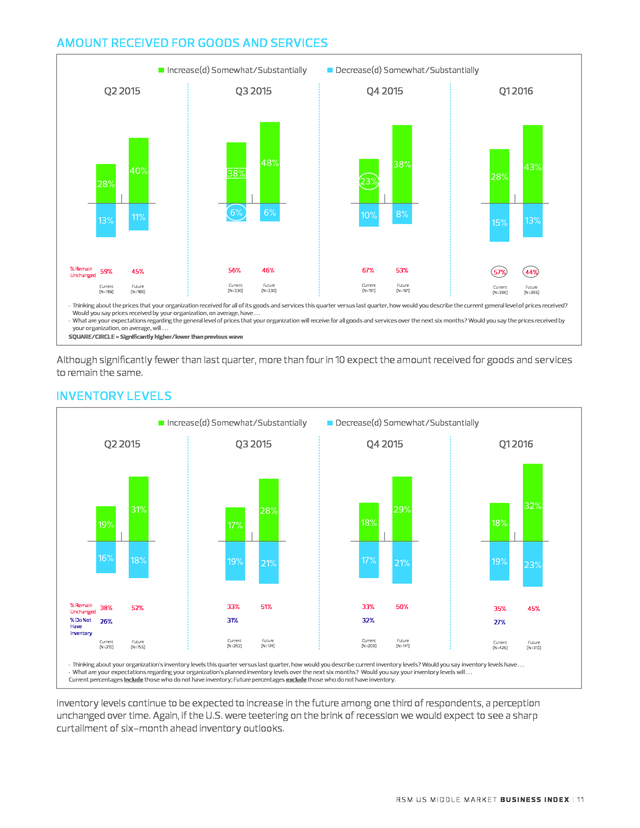
Meanwhile, core inflation data, which excludes food and energy, is moving closer to the Federal Reserve’s 2-percent target. 10 | MARCH 2016 . AMOUNT RECEIVED FOR GOODS AND SERVICES Increase(d) Somewhat/Substantially Q2 2015 Q3 2015 13% % Remain Unchanged Q4 2015 48% 40% 38% 11% 6% 6% 28% Decrease(d) Somewhat/Substantially Q1 2016 38% 28% 23% 10% 8% 43% 15% 13% 59% 45% 56% 46% 67% 53% 57% 44% Current (N=189) Future (N=189) Current (N=230) Future (N=230) Current (N=191) Future (N=191) Current (N=396) Future (N=396) • Thinking about the prices that your organization received for all of its goods and services this quarter versus last quarter, how would you describe the current general level of prices received? Would you say prices received by your organization, on average, have . . . • What are your expectations regarding the general level of prices that your organization will receive for all goods and services over the next six months? Would you say the prices received by your organization, on average, will . .
. SQUARE/CIRCLE = Significantly higher/lower than previous wave Although significantly fewer than last quarter, more than four in 10 expect the amount received for goods and services to remain the same. INVENTORY LEVELS Increase(d) Somewhat/Substantially Q2 2015 Q3 2015 31% 19% Decrease(d) Somewhat/Substantially Q4 2015 32% 29% 28% 18% 17% Q1 2016 18% 16% % Remain Unchanged % Do Not Have Inventory 18% 19% 21% 17% 21% 19% 23% 38% 52% 33% 51% 33% 50% 35% 45% 31% 26% Current (N=210) Future (N=155) Current (N=252) 32% Future (N=174) Current (N=209) 27% Future (N=141) Current (N=426) Future (N=310) • Thinking about your organization’s inventory levels this quarter versus last quarter, how would you describe current inventory levels? Would you say inventory levels have . . . • What are your expectations regarding your organization’s planned inventory levels over the next six months? Would you say your inventory levels will .
. . Current percentages include those who do not have inventory; Future percentages exclude those who do not have inventory. Inventory levels continue to be expected to increase in the future among one third of respondents, a perception unchanged over time. Again, if the U.S.
were teetering on the brink of recession we would expect to see a sharp curtailment of six-month ahead inventory outlooks. RSM US MIDDLE MARKET BUSINESS INDEX | 11 . For more information on RSM, please visit www.rsmus.com. For media inquiries, please contact Terri Andrews, National Public Relations Director, +1 980 233 4710 or Terri.Andrews@rsmus.com. www.rsmus.com This document contains general information, may be based on authorities that are subject to change, and is not a substitute for professional advice or services. This document does not constitute audit, tax, consulting, business, financial, investment, legal or other professional advice, and you should consult a qualified professional advisor before taking any action based on the information herein. RSM US LLP, its affiliates and related entities are not responsible for any loss resulting from or relating to reliance on this document by any person. Internal Revenue Service rules require us to inform you that this communication may be deemed a solicitation to provide tax services.
This communication is being sent to individuals who have subscribed to receive it or who we believe would have an interest in the topics discussed. RSM US LLP is a limited liability partnership and the U.S. member firm of RSM International, a global network of independent audit, tax and consulting firms. The member firms of RSM International collaborate to provide services to global clients, but are separate and distinct legal entities that cannot obligate each other.
Each member firm is responsible only for its own acts and omissions, and not those of any other party. Visit rsmus.com/aboutus for more information regarding RSM US LLP and RSM International. RSM® and the RSM logo are registered trademarks of RSM International Association. The power of being understood® is a registered trademark of RSM US LLP. © 2016 RSM US LLP.
All Rights Reserved. SV-NT-ALL-ALL-0416 .
He is a graduate of the University of Southern California and San Diego State University. 2 | MARCH 2016 . TABLE OF CONTENTS RSM US Middle Market Business Index shows recession fears overblown 4 Middle Market Leadership Council: Current perceptions and future expectations 6 This publication represents the views of the author(s), and does not necessarily represent the views of RSM. This publication does not constitute professional advice. RSM US MIDDLE MARKET BUSINESS INDEX | 3 . RSM US MIDDLE MARKET BUSINESS INDEX SHOWS RECESSION FEARS OVERBLOWN by Joe Brusuelas, Chief Economist, RSM US LLP RSM’s most recent Middle Market Leadership Council survey of 700 U.S. executives shows the middle market continues to experience generally positive economic conditions with forward expectations of higher net earnings and gross revenues. Moreover, survey participants expect to increase capital expenditures during the next six months and increase hiring. The major takeaway from the survey is that, for the middle market, talk of the U.S. economy falling into recession is premature at best and overblown at worst. RSM US LLP and Nielsen N.V.
have collected data on middle market firms from quarterly surveys that began in the first quarter of 2015. The survey is conducted four times a year, in the first month of each quarter: January, April, July and October. The survey panel, the Middle Market Leadership Council, consists of 700 middle market executives and is designed to accurately reflect conditions in the middle market.
The data for each quarter are weighted to ensure that they correspond to the U.S. Census Bureau data on the basis of industry representation. RSM US Middle Market Business Index (MMBI) 140 135 130 125 123.8 121.4 Optimism 120 114.5 115 116.6 110 105 MMBI Pessimism 100 95 90 85 80 Q2 2015 Source: RSM US 4 | MARCH 2016 Q3 2015 Q4 2015 Q1 2016 . Developed in partnership with Moody’s Analytics, the RSM US Middle Market Business Index, or MMBI, which is derived from the subset of questions in the survey that ask respondents to report the change in a variety of business indicators, improved to 116.6 in the first quarter of 2016 from the 114.5 reading posted in the fourth quarter of last year as the U.S. economy rebounded from the 1 percent pace of growth in the final three months of 2015. A reading above 100 for the MMBI indicates that the middle market is generally expanding; below 100 indicates that it is generally contracting. The distance from 100 is indicative of the strength of the expansion or contraction. HOW THE MMBI IS CONSTRUCTED The MMBI is borne out of the subset of questions in the survey that ask respondents to report the change in a variety of indicators. Respondents are asked a total of 20 questions patterned after those in other qualitative business surveys, such as those from the Institute of Supply Management and National Federation of Independent Businesses. The 20 questions relate to changes in various measures of their business, such as revenues, profits, capital expenditures, hiring, employee compensation, prices paid, prices received and inventories.
There are also questions that pertain to the economy and outlook, as well as to credit availability and borrowing. For 10 of the questions, respondents are asked to report the change from the previous quarter; for the other 10, they are asked to state the likely direction of these same indicators six months ahead (see Table 1). The MMBI is a composite index computed as an equal weighted sum of the diffusion indexes for 10 survey questions plus 100 to keep the MMBI from becoming negative. The index is designed to capture both current and future conditions, with five questions on respondents’ recent experience and five on their expectations for future activity. Once enough observations exist, each question in the index will be seasonally adjusted when stable seasonality is detected.
The seasonal adjustment will be based on the Census Bureau’s X-12 additive procedure and will utilize a logistic transformation. For this adjustment, the “increase” and “decrease” percentage components of each index question will be tested for seasonality separately and adjusted accordingly if such patterns exist. If no seasonality is detected, the component will be left unadjusted. TABLE 1: RSM US Middle Market Business Index Questions 1. What are your expectations regarding the general economy? 2. What are your expectations regarding your organization’s gross revenues? 3. How would you describe the level of your organization’s most recent quarter net earnings results? 4. What are your expectations regarding your organization’s aggregate capital expenditures or investments? 5. What are your expectations regarding your organization’s overall hiring levels? 6. How would you describe your organization’s current employee compensation level on average? 7. How would you describe current access to credit? 8. What are your expectations regarding your organization’s planned borrowing? 9. How would you describe the current general level of prices received? 10. What are your expectations regarding your organization’s planned inventory levels? RSM US MIDDLE MARKET BUSINESS INDEX | 5 . MIDDLE MARKET LEADERSHIP COUNCIL: CURRENT PERCEPTIONS AND FUTURE EXPECTATIONS METHODOLOGY WHO • A total of 700 senior executives were recruited by Nielsen via phone using a Dun & Bradstreet (D&B) sample • These 700 panel members were invited by Nielsen to participate in four surveys in a one-year period • All respondents were qualified as: - U.S. full-time senior executive decision-maker • Selected industries - Agriculture, forestry, fishing and hunting; Mining, quarrying, and oil and gas extraction; Utilities; Construction; Manufacturing; Wholesale trade; Retail trade; Transportation and warehousing; Information; Finance and insurance; Real estate and rental and leasing; Professional, scientific, and technical services; Administrative and support and waste management and remediation services; Educational services; Health care and social assistance; Arts, entertainment, and recreation; Accommodation and food services; Other services (except public administration) • • • Nonfinancial or financial services company revenue $10M-$1B Financial institution represented by assets AUM $250M-$10B Involved or responsible for business strategy or financial management strategy WHEN • Interviews conducted on a quarterly basis over a 12-month period HOW • Potential respondents were emailed a link to an online survey • Follow-up calls were made to respondents who did not respond to the online survey; they were given the option to complete the survey via telephone GENERAL ECONOMY PERFORMANCE Improve(d) Somewhat/Substantially Q2 2015 39% 20% % Remain Unchanged 41% Current (N=210) 54% 15% Q3 2015 41% 40% 16% 19% Worsen(ed) Somewhat/Substantially Q4 2015 24% 35% 35% 24% 31% 43% 41% 41% 41% Future (N=210) Current (N=252) Future (N=252) Current (N=208) Future (N=208) Q1 2016 27% 38% 36% 31% 37% 31% Current (N=424) Future (N=424) • First, thinking about the general economy this quarter versus last quarter, how would you describe the current general economy? Would you say the general economy has . . . • What are your expectations regarding the general economy over the next six months? Do you expect the general economy will .
. . SQUARE/CIRCLE = Significantly higher/lower than previous wave Two-thirds of respondents perceive the economy to be improving/unchanged, at levels similar to the fourth quarter of 2015, with a minority expecting it to worsen. The percent of respondents expecting the economy to improve six months into the future remains stable versus the prior quarter. 6 | MARCH 2016 .
GROSS REVENUE PERFORMANCE Increase(d) Somewhat/Substantially Q2 2015 Q3 2015 66% 46% 26% % Remain Unchanged 46% 11% 25% Decrease(d) Somewhat/Substantially Q4 2015 62% 41% 13% 28% Q1 2016 60% 51% 38% 19% 14% 26% 28% 23% 29% 25% 31% 30% 35% 25% Current (N=210) Future (N=210) Current (N=250) Future (N=250) Current (N=208) Future (N=208) Current (N=424) Future (N=426) • Thinking about your organization’s gross revenues/all incoming funds this quarter versus last quarter, how would you describe current gross revenues/all incoming funds? Would you say gross revenues/all incoming funds have . . . • What are your expectations regarding your organization’s gross revenues/all incoming funds over the next six months? Do you expect gross revenues/all incoming funds to . .
. SQUARE/CIRCLE = Significantly higher/lower than previous wave Three in five respondents expect gross revenues to increase during the next six months, significantly higher than last quarter. This confirms that, even with the deterioration in China and worsening European banking crisis, U.S. middle market firms continue to be optimistic about revenue performance.
If the economy were nearing a downturn, we would expect middle market firms to be more cautious about projecting increases in revenues, earnings, hiring and capital expenditures. NET EARNINGS PERFORMANCE Increase(d) Somewhat/Substantially Q2 2015 44% 59% 43% 13% 34% % Remain Unchanged Q3 2015 27% 56% Decrease(d) Somewhat/Substantially Q4 2015 Q1 2016 58% 43% 18% 29% 46% 21% 45% 17% 29% 22% 28% 30% 26% 28% 33% 26% 25% Current (N=191) Future (N=191) Current (N=230) Future (N=230) Current (N=189) Future (N=191) Current (N=394) Future (N=396) • Thinking about your organization’s net earnings (after expenses, etc.) for the most recent quarter results versus the prior quarter results, how would you describe the level of your most recent quarter net earnings results? Would you say net earnings results have . . . • What are your expectations regarding your organization’s net earnings results (after expenses, etc.) over the next six months? Do you expect net earnings results to .
. . SQUARE/CIRCLE = Significantly higher/lower than previous wave More than half of respondents expect net earnings to increase during next six months – again, significantly higher than last quarter, and consistent with results in earlier quarters before financial market volatility dampened enthusiasm. RSM US MIDDLE MARKET BUSINESS INDEX | 7 . AGGREGATE CAPITAL EXPENDITURES/INVESTMENTS’ PERFORMANCE Increase(d) Somewhat/Substantially Q2 2015 38% 22% % Remain Unchanged Q3 2015 51% 32% 14% 41% 18% 15% Decrease(d) Somewhat/Substantially Q4 2015 Q1 2016 44% 32% 36% 35% 23% 25% 20% 19% 40% 35% 50% 44% 45% 39% 45% 37% Current (N=209) Future (N=210) Current (N=250) Future (N=252) Current (N=207) Future (N=207) Current (N=424) Future (N=425) • Thinking about your organization’s aggregate capital expenditures or investments this quarter versus last quarter, how would you describe your organization’s current capital expenditures/ investments? Would you say capital expenditures/investments have . . . • What are your expectations regarding your organization’s aggregate capital expenditures or investments over the next six months? Would you say capital expenditures/investments will . .
. SQUARE/CIRCLE = Significantly higher/lower than previous wave Capital expenditures continue to show a directional increase. One of the mysteries of this business cycle has been the relatively sluggish increase in capital expenditures. Part of that was likely related to leftover risk aversion as a result of the Great Recession.
Again, were the economy teetering on recession, we’d expect future expectations for capital expenditures to show a sharp decline. OVERALL HIRING LEVELS Increase(d) Somewhat/Substantially Q2 2015 45% Q3 2015 37% 39% 10% 10% 9% 46% 45% 53% Current (N=210) Future (N=210) Current (N=251) 39% 15% % Remain Unchanged Decrease(d) Somewhat/Substantially Q4 2015 Q1 2016 42% 36% 37% 33% 17% 15% 17% 15% 48% 47% 48% 51% 43% Future (N=251) Current (N=209) Future (N=209) Current (N=426) Future (N=426) • Thinking about your organization’s overall hiring levels this quarter versus last quarter, how would you describe your current hiring levels? Would you say hiring levels have . . . • What are your expectations regarding your organization’s overall hiring levels over the next six months? Do you expect hiring levels to .
. . SQUARE/CIRCLE = Significantly higher/lower than previous wave Half report current hiring levels as unchanged, however there is a directional increase in expected future hiring levels. This corresponds with data showing a strong labor market and further declines in the U.S unemployment rate. The middle market has accounted for the bulk of new jobs since the end of the Great Recession.
As David Rosenberg of Gluskin Sheff recently pointed out, during the past 65 months, the U.S. jobs market has added 13 million net new jobs without one monthly decline, the longest period of sustained jobs growth on record. 8 | MARCH 2016 . EMPLOYEE COMPENSATION Increase(d) Somewhat/Substantially Q2 2015 50% 40% Q3 2015 Decrease(d) Somewhat/Substantially Q4 2015 53% 44% 51% 41% 2% 3% Q1 2016 46% 48% 5% 5% 2% 3% 3% 56% 48% 53% 44% 56% 47% 49% 48% Current (N=210) Future (N=209) Current (N=252 ) Future (N=252) Current (N=208) Future (N=208) Current (N=424) Future (N=426) 4% % Remain Unchanged • Thinking about employee compensation at your organization this quarter versus last quarter, how would you describe the current employee compensation level on average? Would you say employee compensation, on average, has . . . • What are your expectations regarding your organization’s employee compensation over the next six months? Would you say employee compensation, on average, will . .
. As in previous waves, very few respondents expect a decrease in employee compensation. This matches data showing wages continue to edge upward, with wages and salaries increasing at roughly a 2.5 percent pace, and is consistent with our forecast of wages improving to 3 percent on a year-ago basis by the end of 2016. ACCESS TO CREDIT Easier/Much Easier Unchanged More/Much More Difficult Q2 2015 Q3 2015 Q4 2015 Q1 2016 19% 21% 15% 20% 76% 71 % 5% 8% Current (N=209) Current (N=247) 75% 10% Current (N=202) 70% 10% Current (N=420) • Thinking about the availability or ease with which your organization can borrow money this quarter versus last quarter, how would you describe current access to credit? Would you say that accessing credit is . .
. Similar to previous quarters, most companies see no change in credit access. Total private credit creation was up 5.5 percent on a year-ago basis. RSM US MIDDLE MARKET BUSINESS INDEX | 9 . PLANNED BORROWING Decreased Somewhat/Substantially Q2 2015 Unchanged Increased Somewhat/Substantially Q3 2015 Q4 2015 Q1 2016 19% 12% 14% 64% 64% 23% 22% 10% 56% 61% 25% 28% Future (N=251) Future (N=209) Future (N=203) Future (N=419) • What are your expectations regarding your organization’s planned borrowing over the next six months? Would you say your organization’s borrowing will . . . The majority continue to expect borrowing to remain the same. AMOUNT PAID FOR GOODS AND SERVICES (EXCEPT LABOR) Decreased Somewhat/Substantially Q2 2015 Q3 2015 Increased Somewhat/Substantially Q4 2015 15% 9% 42% 52% 12% 9% 48% 49% 54% 40% 44% 37% 29% 48% 32% 43% 38% Current (N=209) % Remain Unchanged 7% Future (N=210) Current (N=252) Future (N=252) Current (N=208) Future (N=209) Current (N=426) Future (N=426 ) 4% 67% 9% Q1 2016 43% 5% 63% • Thinking about the prices that your organization pays for all goods and services, except labor, this quarter versus last quarter, how would you describe the current general level of prices paid? Would you say prices paid, on average, have . .
. • What are your expectations regarding the general level of prices that your organization will pay for all goods and services, except labor, over the next six months? Would you say prices paid, on average, will . . . SQUARE/CIRCLE = Significantly higher/lower than previous wave Compared with the last quarter, significantly fewer respondents expect the amount paid for goods and services to increase in the next six months, particularly among the smaller companies.
Meanwhile, core inflation data, which excludes food and energy, is moving closer to the Federal Reserve’s 2-percent target. 10 | MARCH 2016 . AMOUNT RECEIVED FOR GOODS AND SERVICES Increase(d) Somewhat/Substantially Q2 2015 Q3 2015 13% % Remain Unchanged Q4 2015 48% 40% 38% 11% 6% 6% 28% Decrease(d) Somewhat/Substantially Q1 2016 38% 28% 23% 10% 8% 43% 15% 13% 59% 45% 56% 46% 67% 53% 57% 44% Current (N=189) Future (N=189) Current (N=230) Future (N=230) Current (N=191) Future (N=191) Current (N=396) Future (N=396) • Thinking about the prices that your organization received for all of its goods and services this quarter versus last quarter, how would you describe the current general level of prices received? Would you say prices received by your organization, on average, have . . . • What are your expectations regarding the general level of prices that your organization will receive for all goods and services over the next six months? Would you say the prices received by your organization, on average, will . .
. SQUARE/CIRCLE = Significantly higher/lower than previous wave Although significantly fewer than last quarter, more than four in 10 expect the amount received for goods and services to remain the same. INVENTORY LEVELS Increase(d) Somewhat/Substantially Q2 2015 Q3 2015 31% 19% Decrease(d) Somewhat/Substantially Q4 2015 32% 29% 28% 18% 17% Q1 2016 18% 16% % Remain Unchanged % Do Not Have Inventory 18% 19% 21% 17% 21% 19% 23% 38% 52% 33% 51% 33% 50% 35% 45% 31% 26% Current (N=210) Future (N=155) Current (N=252) 32% Future (N=174) Current (N=209) 27% Future (N=141) Current (N=426) Future (N=310) • Thinking about your organization’s inventory levels this quarter versus last quarter, how would you describe current inventory levels? Would you say inventory levels have . . . • What are your expectations regarding your organization’s planned inventory levels over the next six months? Would you say your inventory levels will .
. . Current percentages include those who do not have inventory; Future percentages exclude those who do not have inventory. Inventory levels continue to be expected to increase in the future among one third of respondents, a perception unchanged over time. Again, if the U.S.
were teetering on the brink of recession we would expect to see a sharp curtailment of six-month ahead inventory outlooks. RSM US MIDDLE MARKET BUSINESS INDEX | 11 . For more information on RSM, please visit www.rsmus.com. For media inquiries, please contact Terri Andrews, National Public Relations Director, +1 980 233 4710 or Terri.Andrews@rsmus.com. www.rsmus.com This document contains general information, may be based on authorities that are subject to change, and is not a substitute for professional advice or services. This document does not constitute audit, tax, consulting, business, financial, investment, legal or other professional advice, and you should consult a qualified professional advisor before taking any action based on the information herein. RSM US LLP, its affiliates and related entities are not responsible for any loss resulting from or relating to reliance on this document by any person. Internal Revenue Service rules require us to inform you that this communication may be deemed a solicitation to provide tax services.
This communication is being sent to individuals who have subscribed to receive it or who we believe would have an interest in the topics discussed. RSM US LLP is a limited liability partnership and the U.S. member firm of RSM International, a global network of independent audit, tax and consulting firms. The member firms of RSM International collaborate to provide services to global clients, but are separate and distinct legal entities that cannot obligate each other.
Each member firm is responsible only for its own acts and omissions, and not those of any other party. Visit rsmus.com/aboutus for more information regarding RSM US LLP and RSM International. RSM® and the RSM logo are registered trademarks of RSM International Association. The power of being understood® is a registered trademark of RSM US LLP. © 2016 RSM US LLP.
All Rights Reserved. SV-NT-ALL-ALL-0416 .


