


Description
RETHINKING RISK
AND RISK MANAGEMENT
. PAGE 2
In our post-financial crisis world, it seems that no investment firm can afford to downplay
the importance of managing risk when pitching their services. From having been on the receiving end of many of these pitches we know that descriptions of risk management can be
frustratingly vague and jargon-filled. An intelligent layperson without a background in
Modern Portfolio Theory may struggle to understand why his investment advisor is prattling
on about minimizing volatility and combining lowly-correlated assets when what really
matters to the investor is simple: “Don’t lose money!”
Tenet #1: Risk is not a number;
risk is primarily the likelihood of
losing money and falling short of
one’s goals
Most investment risk models are grounded in
Modern Portfolio Theory (MPT), which uses the
framework in the chart to the right to describe the world.
MPT postulates that the riskier an asset class,
the greater the expected return an investor
will demand to own it. Needing a proxy for an
asset class’s risk, the academics who developed MPT settled on a simple measure that
could easily be quantified and fed into a
model: the historical volatility of returns (aka
standard deviation).
The theory assumes that an investor’s goal is to capture the highest return possible at any given level of volatility, or alternatively, to earn a given level of return with as little volatility as possible. According to MPT, building a portfolio to achieve this goal is then simply an exercise in optimization. Return While our asset allocation and risk management systems served us well through the recent financial crisis, we continually seek to improve them. Over the past few years we have made several refinements to our approach based on insights gained from observing turbulent markets and exchanging ideas with skilled money managers.
The evolution of our risk management framework also reflects our dissatisfaction with the conventional tools employed by the financial industry. The purpose of this article is to explain the key tenets of our approach to managing risk and to highlight some important differences from commonly used methods. Volatility . PAGE 3 While using volatility as a proxy for risk may be We believe investors should focus on avoiding convenient to plug into a mathematical model, permanent losses of purchasing power rather we have yet to meet a client who thinks of risk than on minimizing volatility. In addition to in terms of standard deviation. Very few people the gradual erosion of value brought about by intuitively understand what to expect from a inflation, there are a few ways in which perportfolio with 8% volatility, or how its risk commanent impairment of pares to that of a 12% volatilwealth can occur. James ity portfolio.
Instead, a famMontier of GMO points to Failure to meet these three: 1) valuation risk – ily might need a 3% return to maintain their lifestyle. A objectives, not when an investor pays too pension fund might require fluctuations in the value much for an asset; 2) funda7% to meet its actuarial of the portfolio, is the mental risk – when the intrinneeds, while a particular sic value of an investment real risk. foundation might seek a 5% falls because of economic real return to meet its charichanges or deterioration in table donation target. Failure to meet these management; and 3) financial risk – when an objectives, not fluctuations in the value of the investor is forced out of an investment beportfolio, is the real risk. cause of leverage or a need for immediate liThe current investment environment neatly illustrates the pitfalls of equating volatility with risk.
Consider an investor who wished to avoid volatility altogether. To achieve this goal, he could place all of his assets in cash instruments. For a US-based investor today, this would mean accepting an annual yield of less than half a percent indefinitely.
Meanwhile, inflation has been running at a yearly rate of 3% and for decades the US dollar has been depreciating against the currencies of our trading partners at a similar clip. A volatilityminimizing strategy of holding cash would almost surely lead to a significant loss of purchasing power over time. If your objective is to at least maintain the real value of your assets, you cannot view this zero-volatility approach as riskless. In fact, a volatility-minimizing investment strategy may have the perverse effect of maximizing the odds of failing to meet your financial goals. quidity.
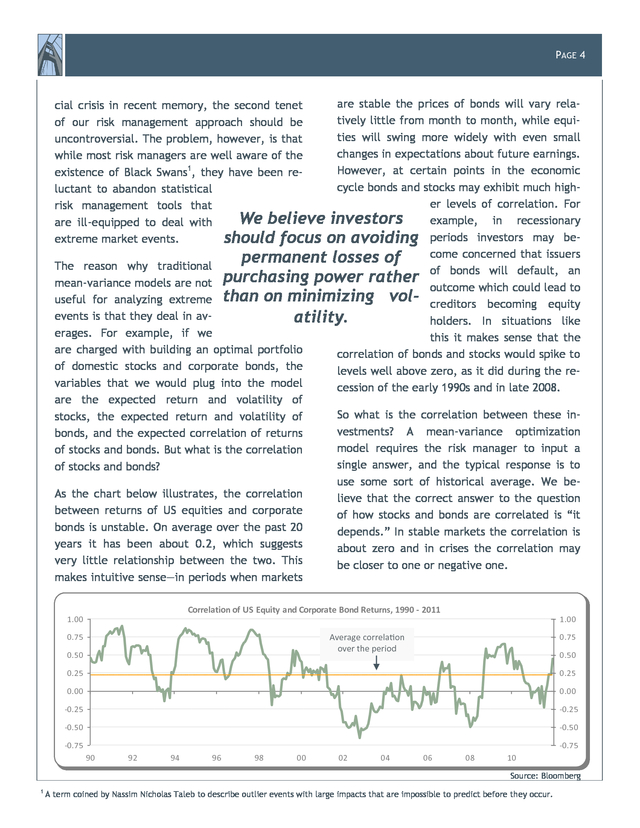
As we will discuss in the following sections, we seek to capture, quantify and balance these drivers of permanent losses in our risk model. Tenet #2: Markets behave fundamentally differently during periods of euphoria and panic. To be useful a risk model must capture these differences Even before 2008 it was widely accepted that extreme events are both more frequent and more severe in financial markets than standard statistical models would suggest. To quote Ric Kayne: “Everyone understands the things that happen within two standard deviations, but everything important in financial history takes place outside of two standard deviations.” In the wake of the worst finan- . PAGE 4 are stable the prices of bonds will vary relacial crisis in recent memory, the second tenet tively little from month to month, while equiof our risk management approach should be ties will swing more widely with even small uncontroversial. The problem, however, is that changes in expectations about future earnings. while most risk managers are well aware of the 1 However, at certain points in the economic existence of Black Swans , they have been recycle bonds and stocks may exhibit much highluctant to abandon statistical er levels of correlation. For risk management tools that We believe investors example, in recessionary are ill-equipped to deal with extreme market events. should focus on avoiding periods investors may become concerned that issuers permanent losses of The reason why traditional of bonds will default, an mean-variance models are not purchasing power rather outcome which could lead to useful for analyzing extreme than on minimizing vol- creditors becoming equity events is that they deal in avatility. holders. In situations like erages.
For example, if we this it makes sense that the are charged with building an optimal portfolio correlation of bonds and stocks would spike to of domestic stocks and corporate bonds, the levels well above zero, as it did during the revariables that we would plug into the model cession of the early 1990s and in late 2008. are the expected return and volatility of So what is the correlation between these instocks, the expected return and volatility of vestments? A mean-variance optimization bonds, and the expected correlation of returns model requires the risk manager to input a of stocks and bonds. But what is the correlation single answer, and the typical response is to of stocks and bonds? use some sort of historical average. We beAs the chart below illustrates, the correlation lieve that the correct answer to the question between returns of US equities and corporate of how stocks and bonds are correlated is “it bonds is unstable.
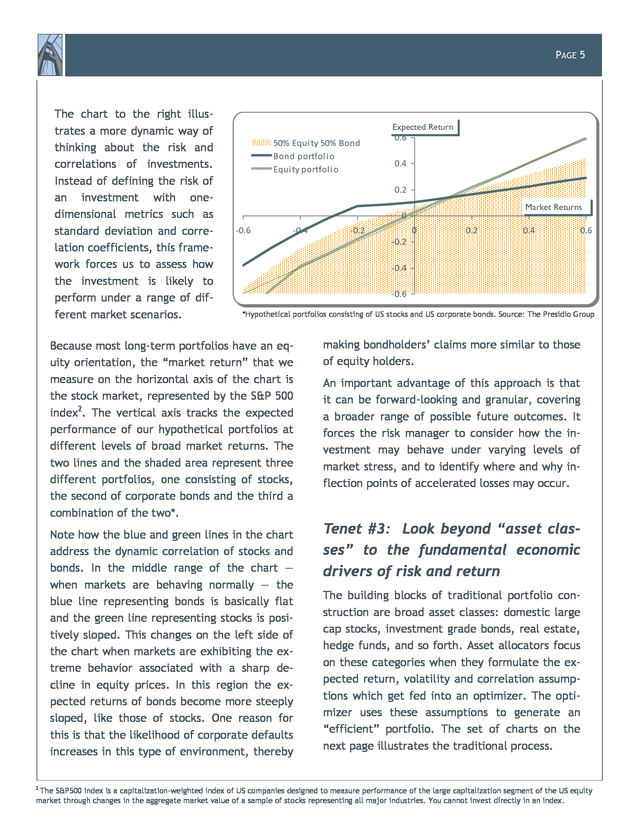
On average over the past 20 depends.” In stable markets the correlation is years it has been about 0.2, which suggests about zero and in crises the correlation may very little relationship between the two. This be closer to one or negative one. makes intuitive sense—in periods when markets Correlation of US Equity and Corporate Bond Returns, 1990 --2011 Correlation of US Equity and Corporate Bond Returns, 1990 2011 1.00 1.00 1.00 1.00 Average correlation over the period 0.75 0.75 0.50 0.50 0.75 0.75 0.50 0.50 0.25 0.25 0.25 0.25 0.00 0.00 0.00 0.00 -0.25 -0.25 -0.25 -0.25 -0.50 -0.50 -0.50 -0.50 -0.75 -0.75 -0.75 -0.75 90 90 92 92 94 94 96 96 98 98 00 00 02 02 04 04 06 06 08 08 10 10 Source: Bloomberg 1 A term coined by Nassim Nicholas Taleb to describe outlier events with large impacts that are impossible to predict before they occur. . PAGE 5 The chart to the right illustrates a more dynamic way of thinking about the risk and correlations of investments. Instead of defining the risk of an investment with onedimensional metrics such as standard deviation and correlation coefficients, this framework forces us to assess how the investment is likely to perform under a range of different market scenarios. Expected Return 50% Equi ty 50% Bond 50% Equi ty 50% Bond Bond portfol iio Bond portfol o Equi ty portfol iio Equi ty portfol o 0.4 0.4 0.2 0.2 Market Returns 0 0 -0.6 -0.6 -0.4 -0.4 -0.2 -0.2 -0.2 -0.2 0 0 0.2 0.2 0.4 0.4 0.6 0.6 -0.4 -0.4 -0.6 -0.6 *Hypothetical portfolios consisting of US stocks and US corporate bonds. Source: The Presidio Group Because most long-term portfolios have an equity orientation, the “market return” that we measure on the horizontal axis of the chart is the stock market, represented by the S&P 500 index2. The vertical axis tracks the expected performance of our hypothetical portfolios at different levels of broad market returns. The two lines and the shaded area represent three different portfolios, one consisting of stocks, the second of corporate bonds and the third a combination of the two*. Note how the blue and green lines in the chart address the dynamic correlation of stocks and bonds.
In the middle range of the chart ― when markets are behaving normally ― the blue line representing bonds is basically flat and the green line representing stocks is positively sloped. This changes on the left side of the chart when markets are exhibiting the extreme behavior associated with a sharp decline in equity prices. In this region the expected returns of bonds become more steeply sloped, like those of stocks.
One reason for this is that the likelihood of corporate defaults increases in this type of environment, thereby 2 0.6 0.6 making bondholders’ claims more similar to those of equity holders. An important advantage of this approach is that it can be forward-looking and granular, covering a broader range of possible future outcomes. It forces the risk manager to consider how the investment may behave under varying levels of market stress, and to identify where and why inflection points of accelerated losses may occur. Tenet #3: Look beyond “asset classes” to the fundamental economic drivers of risk and return The building blocks of traditional portfolio construction are broad asset classes: domestic large cap stocks, investment grade bonds, real estate, hedge funds, and so forth. Asset allocators focus on these categories when they formulate the expected return, volatility and correlation assumptions which get fed into an optimizer.
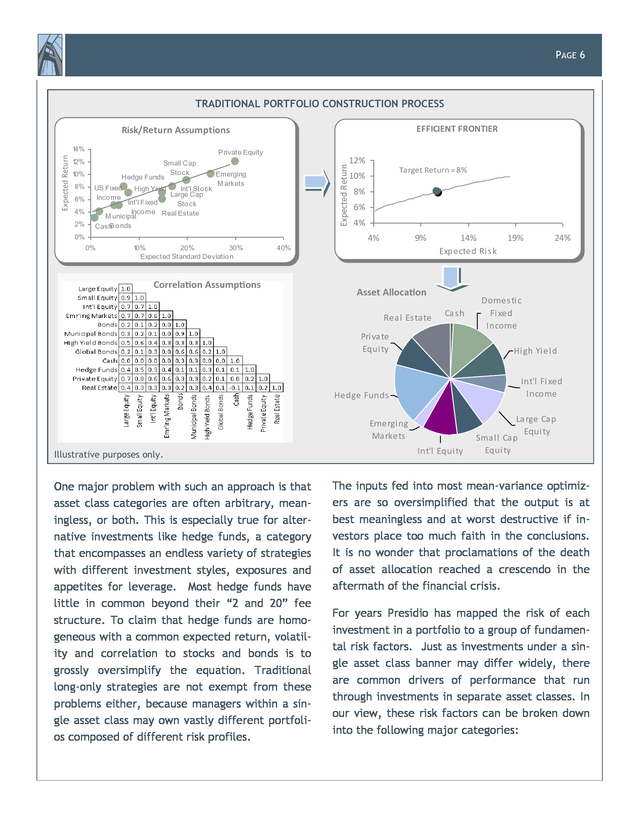
The optimizer uses these assumptions to generate an “efficient” portfolio. The set of charts on the next page illustrates the traditional process. The S&P500 index is a capitalization-weighted index of US companies designed to measure performance of the large capitalization segment of the US equity market through changes in the aggregate market value of a sample of stocks representing all major industries. You cannot invest directly in an index. .
PAGE 6 TRADITIONAL PORTFOLIO CONSTRUCTION PROCESS EFFICIENT FRONTIER EFFICIENT FRONTIER 1 4% 4% 1 1 2% 2% 1 1 0% 0% 1 8% 8% 6% 6% 4% 4% 2% 2% 0% 0% P rivate Equity P rivate Equity Small Cap Small Cap Sto ck Emerging Emerging Hedge Funds Sto ck Hedge Funds M arkets US Fixed High Yield Int'l Sto ck M arkets US Fixed High Yield Large Cap ck Int'l Sto Large Cap Inco me Inco me Int'l Fixed Sto ck Int'l Fixed Sto ck Inco me Real Estate Inco me Real Estate M unicipal M unicipal B o nds CashB o nds Cash 0% 0% 1 0% 0% 20% 30% 1 20% 30% Expected Standard Deviatio nn Expected Standard Deviatio 12% 12% 10% 10% Expected Return Expected Return Expected Return Risk/Return Assumptions Risk/Return Assumptions 40% 40% Correlation Assumptions Target Return = 8% Target Return = 8% 8% 8% 6% 6% 4% 4% 4% 4% 9% 9% 14% 19% 14% 19% Expected Ri sskk Expected Ri Asset Allocation Rea l Es ta te Ca s h Pri va te Equi ty Int'l Fi xed Income Emergi ng Ma rkets One major problem with such an approach is that asset class categories are often arbitrary, meaningless, or both. This is especially true for alternative investments like hedge funds, a category that encompasses an endless variety of strategies with different investment styles, exposures and appetites for leverage. Most hedge funds have little in common beyond their “2 and 20” fee structure. To claim that hedge funds are homogeneous with a common expected return, volatility and correlation to stocks and bonds is to grossly oversimplify the equation.
Traditional long-only strategies are not exempt from these problems either, because managers within a single asset class may own vastly different portfolios composed of different risk profiles. Domes ti c Fi xed Income Hi gh Yi el d Hedge Funds Illustrative purposes only. 24% 24% Int'l Equi ty La rge Ca p Equi ty Sma l l Ca p Equi ty The inputs fed into most mean-variance optimizers are so oversimplified that the output is at best meaningless and at worst destructive if investors place too much faith in the conclusions. It is no wonder that proclamations of the death of asset allocation reached a crescendo in the aftermath of the financial crisis. For years Presidio has mapped the risk of each investment in a portfolio to a group of fundamental risk factors. Just as investments under a single asset class banner may differ widely, there are common drivers of performance that run through investments in separate asset classes. In our view, these risk factors can be broken down into the following major categories: .
PAGE 7 ments is driven by changes in the level of interest rates in the economy. This is most obviously true for high grade bonds, whose prices fluctuate inversely with market yields. Interest rates drive the prices of other types of assets in less obvious ways, for example by affecting the discount rate at which future cash flows are valued. makes it vulnerable to “left tail” events, such as a terrorist attack or the failure of a large bank. Our framework accounts for leverage at both the underlying instrument level (for example, debt incurred by the companies in which an equity manager invests), as well as at the manager level (eg, leverage applied by a long/short equity hedge fund manager who borrows from a prime broker). CURRENCY: For a US-based investor, changes LIQUIDITY: Investors are exposed to liquidity in the exchange rate of the dollar versus foreign currencies will affect the value of his portfolio.
It is important to note that investors are exposed to currency risk even if all of the assets they own are denominated in their home currency. In a globalized world we all consume an international basket of goods and services. If our home currency loses value against those of our trading partners then our capacity to spend on foreign goods and services will be impaired. risk to the degree that they are unable to convert their financial assets to cash at will. During turbulent periods in financial markets, sellers of illiquid assets must accept significant discounts.
Therefore illiquidity, like leverage, enhances an investor’s exposure to the market cycle and to left tail events. INTEREST RATES: The value of many invest- EQUITY MARKET CYCLE: Changes in the rate of economic growth (and expectations for future growth) affect the value of financial assets. This is most readily apparent in equities, whose value is heavily influenced by actual and expected earnings growth rates. Growth rates also drive the value of many credit instruments. LEVERAGE: The use of leverage, whether explicitly through debt or implicitly through financial instruments which expose an investor to potential losses in excess of his upfront investment, is a common risk factor across a range of asset classes and investment strategies.
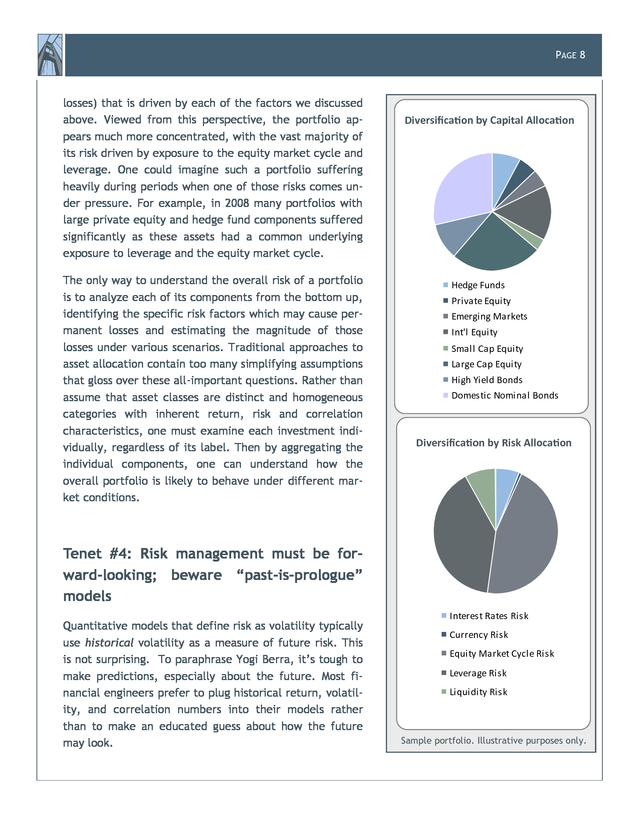
Leverage will magnify an investment’s exposure to the equity market cycle and likely In constructing a portfolio and monitoring its risk over time, we believe it is necessary to drill down to these basic drivers of investment performance. An investor who focuses only on asset class categories and ignores these drivers might draw the wrong conclusion about how diversified his portfolio really is. The two pie charts on the next page illustrate this point.
The pie on the top represents a conventional view of asset allocation, which considers the dollars allocated to a variety of asset classes. As the pinwheel-like appearance of the pie suggests, the portfolio seems reasonably diversified with no one wedge too much larger than any other. A risk factor-based analysis of that same portfolio tells a very different story. The pie chart on the bottom breaks down the percentage of the portfolio’s risk (as defined by potential .
PAGE 8 losses) that is driven by each of the factors we discussed above. Viewed from this perspective, the portfolio appears much more concentrated, with the vast majority of its risk driven by exposure to the equity market cycle and leverage. One could imagine such a portfolio suffering heavily during periods when one of those risks comes under pressure. For example, in 2008 many portfolios with large private equity and hedge fund components suffered significantly as these assets had a common underlying exposure to leverage and the equity market cycle. The only way to understand the overall risk of a portfolio is to analyze each of its components from the bottom up, identifying the specific risk factors which may cause permanent losses and estimating the magnitude of those losses under various scenarios.
Traditional approaches to asset allocation contain too many simplifying assumptions that gloss over these all-important questions. Rather than assume that asset classes are distinct and homogeneous categories with inherent return, risk and correlation characteristics, one must examine each investment individually, regardless of its label. Then by aggregating the individual components, one can understand how the overall portfolio is likely to behave under different market conditions. Diversification by Capital Allocation Hedge Funds Private Equity Emerging Markets Int'l Equity Small Cap Equity Large Cap Equity High Yield Bonds Domestic Nominal Bonds Diversification by Risk Allocation Tenet #4: Risk management must be forward-looking; beware “past-is-prologue” models Quantitative models that define risk as volatility typically use historical volatility as a measure of future risk.
This is not surprising. To paraphrase Yogi Berra, it’s tough to make predictions, especially about the future. Most financial engineers prefer to plug historical return, volatility, and correlation numbers into their models rather than to make an educated guess about how the future may look. Interest Rates Risk Currency Risk Equity Market Cycle Risk Leverage Risk Liquidity Risk Sample portfolio.
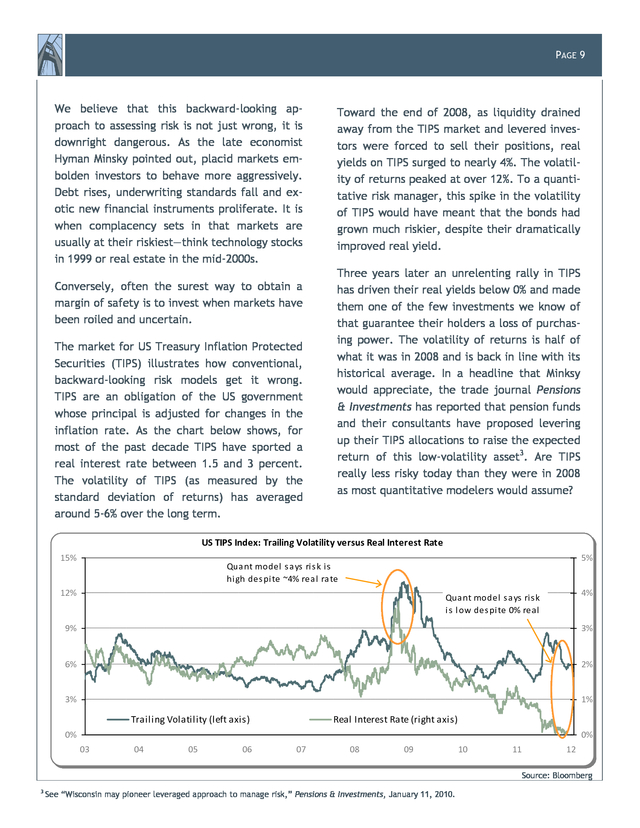
Illustrative purposes only. . PAGE 9 We believe that this backward-looking approach to assessing risk is not just wrong, it is downright dangerous. As the late economist Hyman Minsky pointed out, placid markets embolden investors to behave more aggressively. Debt rises, underwriting standards fall and exotic new financial instruments proliferate. It is when complacency sets in that markets are usually at their riskiest—think technology stocks in 1999 or real estate in the mid-2000s. Conversely, often the surest way to obtain a margin of safety is to invest when markets have been roiled and uncertain. The market for US Treasury Inflation Protected Securities (TIPS) illustrates how conventional, backward-looking risk models get it wrong. TIPS are an obligation of the US government whose principal is adjusted for changes in the inflation rate. As the chart below shows, for most of the past decade TIPS have sported a real interest rate between 1.5 and 3 percent. The volatility of TIPS (as measured by the standard deviation of returns) has averaged around 5-6% over the long term. Toward the end of 2008, as liquidity drained away from the TIPS market and levered investors were forced to sell their positions, real yields on TIPS surged to nearly 4%.
The volatility of returns peaked at over 12%. To a quantitative risk manager, this spike in the volatility of TIPS would have meant that the bonds had grown much riskier, despite their dramatically improved real yield. Three years later an unrelenting rally in TIPS has driven their real yields below 0% and made them one of the few investments we know of that guarantee their holders a loss of purchasing power. The volatility of returns is half of what it was in 2008 and is back in line with its historical average.
In a headline that Minksy would appreciate, the trade journal Pensions & Investments has reported that pension funds and their consultants have proposed levering up their TIPS allocations to raise the expected return of this low-volatility asset3. Are TIPS really less risky today than they were in 2008 as most quantitative modelers would assume? US TIPS Index: Trailing Volatility versus Real Interest Rate US TIPS Index: Trailing Volatility versus Real Interest Rate 15% 15% 5% 5% Qua nt model ssa ys ri ssk iiss Qua nt model a ys ri k hi gh des pi te ~4% rea ll ra te hi gh des pi te ~4% rea ra te 12% 12% 4% 4% Qua nt model ssa ys ri ssk Qua nt model a ys ri k iiss llow des pi te 0% rea ll ow des pi te 0% rea 9% 9% 3% 3% 6% 6% 2% 2% 3% 3% 1% 1% Trailing Volatility (left axis) Trailing Volatility (left axis) Real Interest Rate (right axis) Real Interest Rate (right axis) 0% 0% 0% 0% 03 03 04 04 05 05 06 06 07 07 08 08 09 09 10 10 11 11 12 12 Source: Bloomberg 3 See “Wisconsin may pioneer leveraged approach to manage risk,” Pensions & Investments, January 11, 2010. . PAGE 10 We would argue that at a negative real interest rate TIPS are the riskiest they have ever been, no matter what the models say. This “past-is-prologue” method of assessing risk is not confined to the world of academics and consultants. It is widely employed by investors whose actions affect us all. For example, over the past two decades the world’s major investment banks embraced Value at Risk (VaR), a methodology that sought to boil down to a simple metric the myriad of risks that resided within a bank’s balance sheet. The output of a VaR model is a single number, namely the max- imum dollar loss a portfolio is expected to generate over a short period of time.
The inputs are historical price movements over a specified period, such as the past 250 trading days, crunched with the same statistical techniques as a mean-variance asset allocation model. During the placid markets of the mid-2000s, the VaR models employed by Lehman Brothers and Bear Stearns fooled these firms into thinking they could safely increase their leverage. Needless to say, the “maximum potential losses” predicted by the models during that period proved to be a fraction of the actual losses experienced by the banks. Most investors recognize that they must assume certain risks if they hope to preserve or grow their wealth. One of the key roles of an advisor is to identify these risks properly and illuminate the trade-offs between risk and return the investor faces across a broad range of uncertain future environments. Unfortunately, the reductive, backward-looking quantitative tools adopted by much of the investment industry are not up to this task. Some risk management practices remind us of the old saw about the drunk searching for his keys on a dark night.
Asked by a passer-by if he is sure he dropped them near the streetlamp the drunk replies “No, but this is where the light is good.” Like the drunk on the sidewalk, a financial engineer armed with a spreadsheet and a subscription to Factset can keep busy crunching historical standard deviations and correlation coefficients, but these will tell him very little about where the true risks in a portfolio lurk. Running through each of the tenets outlined in this paper is the view that by combining the discipline of a numerical model with informed judgment we can improve on the results generated by traditional risk models. Injecting judgment into the framework improves both the inputs and the outputs of our risk model. The inputs are better because our assumptions are forward-looking rather than historical and are based on our understanding of fundamental economic drivers rather than artificial asset class categories.
The outputs are better because our definition of risk is more aligned with what really matters to investors, namely avoiding permanent losses of wealth. â–¡ . FOR MORE INFORMATION, CALL US AT (877) 449-1999 OR REACH OUT TO A LOCAL OFFICE: |SAN FRANCISCO 415-449-1050 |DALLAS 214-855-2200 Current weighting of certain sectors, asset classes, and other assumptions are subjective. No assurance can be given that these assessments will prove to be correct. The difference between assumptions regarding the correlation between risk and return may not be accurate whereby the specific investments within each asset class could vary materially. Current weightings and commentary are not intended to represent investment advice that is appropriate for all investors. Each investor’s portfolio must be constructed based on the individual’s financial resources, investment goals, risk tolerance, investment time horizon, tax situation and other relevant factors.
Presidio does not provide tax or legal advice. Investors should seek advice from their investment professional to review their specific information. Asset allocation does not guarantee a profit or protection from losses in a declining market.
Investments, when sold, may be worth more or less than the original purchase price. These insights come from Presidio Wealth Advisory LLC, a SEC Registered Investment Advisory firm, is a subsidiary of The Presidio Group LLC. There are no warranties, expressed or implied as to the accuracy, completeness, or results obtained from any information in this material. Past performance does not guarantee future results. This material is proprietary and is not allowed to be reproduced, other than for your own persona, noncommercial use, without prior written permission from Presidio. Published March 2012.
© 2012 All rights reserved. .
The theory assumes that an investor’s goal is to capture the highest return possible at any given level of volatility, or alternatively, to earn a given level of return with as little volatility as possible. According to MPT, building a portfolio to achieve this goal is then simply an exercise in optimization. Return While our asset allocation and risk management systems served us well through the recent financial crisis, we continually seek to improve them. Over the past few years we have made several refinements to our approach based on insights gained from observing turbulent markets and exchanging ideas with skilled money managers.
The evolution of our risk management framework also reflects our dissatisfaction with the conventional tools employed by the financial industry. The purpose of this article is to explain the key tenets of our approach to managing risk and to highlight some important differences from commonly used methods. Volatility . PAGE 3 While using volatility as a proxy for risk may be We believe investors should focus on avoiding convenient to plug into a mathematical model, permanent losses of purchasing power rather we have yet to meet a client who thinks of risk than on minimizing volatility. In addition to in terms of standard deviation. Very few people the gradual erosion of value brought about by intuitively understand what to expect from a inflation, there are a few ways in which perportfolio with 8% volatility, or how its risk commanent impairment of pares to that of a 12% volatilwealth can occur. James ity portfolio.
Instead, a famMontier of GMO points to Failure to meet these three: 1) valuation risk – ily might need a 3% return to maintain their lifestyle. A objectives, not when an investor pays too pension fund might require fluctuations in the value much for an asset; 2) funda7% to meet its actuarial of the portfolio, is the mental risk – when the intrinneeds, while a particular sic value of an investment real risk. foundation might seek a 5% falls because of economic real return to meet its charichanges or deterioration in table donation target. Failure to meet these management; and 3) financial risk – when an objectives, not fluctuations in the value of the investor is forced out of an investment beportfolio, is the real risk. cause of leverage or a need for immediate liThe current investment environment neatly illustrates the pitfalls of equating volatility with risk.
Consider an investor who wished to avoid volatility altogether. To achieve this goal, he could place all of his assets in cash instruments. For a US-based investor today, this would mean accepting an annual yield of less than half a percent indefinitely.
Meanwhile, inflation has been running at a yearly rate of 3% and for decades the US dollar has been depreciating against the currencies of our trading partners at a similar clip. A volatilityminimizing strategy of holding cash would almost surely lead to a significant loss of purchasing power over time. If your objective is to at least maintain the real value of your assets, you cannot view this zero-volatility approach as riskless. In fact, a volatility-minimizing investment strategy may have the perverse effect of maximizing the odds of failing to meet your financial goals. quidity.
As we will discuss in the following sections, we seek to capture, quantify and balance these drivers of permanent losses in our risk model. Tenet #2: Markets behave fundamentally differently during periods of euphoria and panic. To be useful a risk model must capture these differences Even before 2008 it was widely accepted that extreme events are both more frequent and more severe in financial markets than standard statistical models would suggest. To quote Ric Kayne: “Everyone understands the things that happen within two standard deviations, but everything important in financial history takes place outside of two standard deviations.” In the wake of the worst finan- . PAGE 4 are stable the prices of bonds will vary relacial crisis in recent memory, the second tenet tively little from month to month, while equiof our risk management approach should be ties will swing more widely with even small uncontroversial. The problem, however, is that changes in expectations about future earnings. while most risk managers are well aware of the 1 However, at certain points in the economic existence of Black Swans , they have been recycle bonds and stocks may exhibit much highluctant to abandon statistical er levels of correlation. For risk management tools that We believe investors example, in recessionary are ill-equipped to deal with extreme market events. should focus on avoiding periods investors may become concerned that issuers permanent losses of The reason why traditional of bonds will default, an mean-variance models are not purchasing power rather outcome which could lead to useful for analyzing extreme than on minimizing vol- creditors becoming equity events is that they deal in avatility. holders. In situations like erages.
For example, if we this it makes sense that the are charged with building an optimal portfolio correlation of bonds and stocks would spike to of domestic stocks and corporate bonds, the levels well above zero, as it did during the revariables that we would plug into the model cession of the early 1990s and in late 2008. are the expected return and volatility of So what is the correlation between these instocks, the expected return and volatility of vestments? A mean-variance optimization bonds, and the expected correlation of returns model requires the risk manager to input a of stocks and bonds. But what is the correlation single answer, and the typical response is to of stocks and bonds? use some sort of historical average. We beAs the chart below illustrates, the correlation lieve that the correct answer to the question between returns of US equities and corporate of how stocks and bonds are correlated is “it bonds is unstable.
On average over the past 20 depends.” In stable markets the correlation is years it has been about 0.2, which suggests about zero and in crises the correlation may very little relationship between the two. This be closer to one or negative one. makes intuitive sense—in periods when markets Correlation of US Equity and Corporate Bond Returns, 1990 --2011 Correlation of US Equity and Corporate Bond Returns, 1990 2011 1.00 1.00 1.00 1.00 Average correlation over the period 0.75 0.75 0.50 0.50 0.75 0.75 0.50 0.50 0.25 0.25 0.25 0.25 0.00 0.00 0.00 0.00 -0.25 -0.25 -0.25 -0.25 -0.50 -0.50 -0.50 -0.50 -0.75 -0.75 -0.75 -0.75 90 90 92 92 94 94 96 96 98 98 00 00 02 02 04 04 06 06 08 08 10 10 Source: Bloomberg 1 A term coined by Nassim Nicholas Taleb to describe outlier events with large impacts that are impossible to predict before they occur. . PAGE 5 The chart to the right illustrates a more dynamic way of thinking about the risk and correlations of investments. Instead of defining the risk of an investment with onedimensional metrics such as standard deviation and correlation coefficients, this framework forces us to assess how the investment is likely to perform under a range of different market scenarios. Expected Return 50% Equi ty 50% Bond 50% Equi ty 50% Bond Bond portfol iio Bond portfol o Equi ty portfol iio Equi ty portfol o 0.4 0.4 0.2 0.2 Market Returns 0 0 -0.6 -0.6 -0.4 -0.4 -0.2 -0.2 -0.2 -0.2 0 0 0.2 0.2 0.4 0.4 0.6 0.6 -0.4 -0.4 -0.6 -0.6 *Hypothetical portfolios consisting of US stocks and US corporate bonds. Source: The Presidio Group Because most long-term portfolios have an equity orientation, the “market return” that we measure on the horizontal axis of the chart is the stock market, represented by the S&P 500 index2. The vertical axis tracks the expected performance of our hypothetical portfolios at different levels of broad market returns. The two lines and the shaded area represent three different portfolios, one consisting of stocks, the second of corporate bonds and the third a combination of the two*. Note how the blue and green lines in the chart address the dynamic correlation of stocks and bonds.
In the middle range of the chart ― when markets are behaving normally ― the blue line representing bonds is basically flat and the green line representing stocks is positively sloped. This changes on the left side of the chart when markets are exhibiting the extreme behavior associated with a sharp decline in equity prices. In this region the expected returns of bonds become more steeply sloped, like those of stocks.
One reason for this is that the likelihood of corporate defaults increases in this type of environment, thereby 2 0.6 0.6 making bondholders’ claims more similar to those of equity holders. An important advantage of this approach is that it can be forward-looking and granular, covering a broader range of possible future outcomes. It forces the risk manager to consider how the investment may behave under varying levels of market stress, and to identify where and why inflection points of accelerated losses may occur. Tenet #3: Look beyond “asset classes” to the fundamental economic drivers of risk and return The building blocks of traditional portfolio construction are broad asset classes: domestic large cap stocks, investment grade bonds, real estate, hedge funds, and so forth. Asset allocators focus on these categories when they formulate the expected return, volatility and correlation assumptions which get fed into an optimizer.
The optimizer uses these assumptions to generate an “efficient” portfolio. The set of charts on the next page illustrates the traditional process. The S&P500 index is a capitalization-weighted index of US companies designed to measure performance of the large capitalization segment of the US equity market through changes in the aggregate market value of a sample of stocks representing all major industries. You cannot invest directly in an index. .
PAGE 6 TRADITIONAL PORTFOLIO CONSTRUCTION PROCESS EFFICIENT FRONTIER EFFICIENT FRONTIER 1 4% 4% 1 1 2% 2% 1 1 0% 0% 1 8% 8% 6% 6% 4% 4% 2% 2% 0% 0% P rivate Equity P rivate Equity Small Cap Small Cap Sto ck Emerging Emerging Hedge Funds Sto ck Hedge Funds M arkets US Fixed High Yield Int'l Sto ck M arkets US Fixed High Yield Large Cap ck Int'l Sto Large Cap Inco me Inco me Int'l Fixed Sto ck Int'l Fixed Sto ck Inco me Real Estate Inco me Real Estate M unicipal M unicipal B o nds CashB o nds Cash 0% 0% 1 0% 0% 20% 30% 1 20% 30% Expected Standard Deviatio nn Expected Standard Deviatio 12% 12% 10% 10% Expected Return Expected Return Expected Return Risk/Return Assumptions Risk/Return Assumptions 40% 40% Correlation Assumptions Target Return = 8% Target Return = 8% 8% 8% 6% 6% 4% 4% 4% 4% 9% 9% 14% 19% 14% 19% Expected Ri sskk Expected Ri Asset Allocation Rea l Es ta te Ca s h Pri va te Equi ty Int'l Fi xed Income Emergi ng Ma rkets One major problem with such an approach is that asset class categories are often arbitrary, meaningless, or both. This is especially true for alternative investments like hedge funds, a category that encompasses an endless variety of strategies with different investment styles, exposures and appetites for leverage. Most hedge funds have little in common beyond their “2 and 20” fee structure. To claim that hedge funds are homogeneous with a common expected return, volatility and correlation to stocks and bonds is to grossly oversimplify the equation.
Traditional long-only strategies are not exempt from these problems either, because managers within a single asset class may own vastly different portfolios composed of different risk profiles. Domes ti c Fi xed Income Hi gh Yi el d Hedge Funds Illustrative purposes only. 24% 24% Int'l Equi ty La rge Ca p Equi ty Sma l l Ca p Equi ty The inputs fed into most mean-variance optimizers are so oversimplified that the output is at best meaningless and at worst destructive if investors place too much faith in the conclusions. It is no wonder that proclamations of the death of asset allocation reached a crescendo in the aftermath of the financial crisis. For years Presidio has mapped the risk of each investment in a portfolio to a group of fundamental risk factors. Just as investments under a single asset class banner may differ widely, there are common drivers of performance that run through investments in separate asset classes. In our view, these risk factors can be broken down into the following major categories: .
PAGE 7 ments is driven by changes in the level of interest rates in the economy. This is most obviously true for high grade bonds, whose prices fluctuate inversely with market yields. Interest rates drive the prices of other types of assets in less obvious ways, for example by affecting the discount rate at which future cash flows are valued. makes it vulnerable to “left tail” events, such as a terrorist attack or the failure of a large bank. Our framework accounts for leverage at both the underlying instrument level (for example, debt incurred by the companies in which an equity manager invests), as well as at the manager level (eg, leverage applied by a long/short equity hedge fund manager who borrows from a prime broker). CURRENCY: For a US-based investor, changes LIQUIDITY: Investors are exposed to liquidity in the exchange rate of the dollar versus foreign currencies will affect the value of his portfolio.
It is important to note that investors are exposed to currency risk even if all of the assets they own are denominated in their home currency. In a globalized world we all consume an international basket of goods and services. If our home currency loses value against those of our trading partners then our capacity to spend on foreign goods and services will be impaired. risk to the degree that they are unable to convert their financial assets to cash at will. During turbulent periods in financial markets, sellers of illiquid assets must accept significant discounts.
Therefore illiquidity, like leverage, enhances an investor’s exposure to the market cycle and to left tail events. INTEREST RATES: The value of many invest- EQUITY MARKET CYCLE: Changes in the rate of economic growth (and expectations for future growth) affect the value of financial assets. This is most readily apparent in equities, whose value is heavily influenced by actual and expected earnings growth rates. Growth rates also drive the value of many credit instruments. LEVERAGE: The use of leverage, whether explicitly through debt or implicitly through financial instruments which expose an investor to potential losses in excess of his upfront investment, is a common risk factor across a range of asset classes and investment strategies.
Leverage will magnify an investment’s exposure to the equity market cycle and likely In constructing a portfolio and monitoring its risk over time, we believe it is necessary to drill down to these basic drivers of investment performance. An investor who focuses only on asset class categories and ignores these drivers might draw the wrong conclusion about how diversified his portfolio really is. The two pie charts on the next page illustrate this point.
The pie on the top represents a conventional view of asset allocation, which considers the dollars allocated to a variety of asset classes. As the pinwheel-like appearance of the pie suggests, the portfolio seems reasonably diversified with no one wedge too much larger than any other. A risk factor-based analysis of that same portfolio tells a very different story. The pie chart on the bottom breaks down the percentage of the portfolio’s risk (as defined by potential .
PAGE 8 losses) that is driven by each of the factors we discussed above. Viewed from this perspective, the portfolio appears much more concentrated, with the vast majority of its risk driven by exposure to the equity market cycle and leverage. One could imagine such a portfolio suffering heavily during periods when one of those risks comes under pressure. For example, in 2008 many portfolios with large private equity and hedge fund components suffered significantly as these assets had a common underlying exposure to leverage and the equity market cycle. The only way to understand the overall risk of a portfolio is to analyze each of its components from the bottom up, identifying the specific risk factors which may cause permanent losses and estimating the magnitude of those losses under various scenarios.
Traditional approaches to asset allocation contain too many simplifying assumptions that gloss over these all-important questions. Rather than assume that asset classes are distinct and homogeneous categories with inherent return, risk and correlation characteristics, one must examine each investment individually, regardless of its label. Then by aggregating the individual components, one can understand how the overall portfolio is likely to behave under different market conditions. Diversification by Capital Allocation Hedge Funds Private Equity Emerging Markets Int'l Equity Small Cap Equity Large Cap Equity High Yield Bonds Domestic Nominal Bonds Diversification by Risk Allocation Tenet #4: Risk management must be forward-looking; beware “past-is-prologue” models Quantitative models that define risk as volatility typically use historical volatility as a measure of future risk.
This is not surprising. To paraphrase Yogi Berra, it’s tough to make predictions, especially about the future. Most financial engineers prefer to plug historical return, volatility, and correlation numbers into their models rather than to make an educated guess about how the future may look. Interest Rates Risk Currency Risk Equity Market Cycle Risk Leverage Risk Liquidity Risk Sample portfolio.
Illustrative purposes only. . PAGE 9 We believe that this backward-looking approach to assessing risk is not just wrong, it is downright dangerous. As the late economist Hyman Minsky pointed out, placid markets embolden investors to behave more aggressively. Debt rises, underwriting standards fall and exotic new financial instruments proliferate. It is when complacency sets in that markets are usually at their riskiest—think technology stocks in 1999 or real estate in the mid-2000s. Conversely, often the surest way to obtain a margin of safety is to invest when markets have been roiled and uncertain. The market for US Treasury Inflation Protected Securities (TIPS) illustrates how conventional, backward-looking risk models get it wrong. TIPS are an obligation of the US government whose principal is adjusted for changes in the inflation rate. As the chart below shows, for most of the past decade TIPS have sported a real interest rate between 1.5 and 3 percent. The volatility of TIPS (as measured by the standard deviation of returns) has averaged around 5-6% over the long term. Toward the end of 2008, as liquidity drained away from the TIPS market and levered investors were forced to sell their positions, real yields on TIPS surged to nearly 4%.
The volatility of returns peaked at over 12%. To a quantitative risk manager, this spike in the volatility of TIPS would have meant that the bonds had grown much riskier, despite their dramatically improved real yield. Three years later an unrelenting rally in TIPS has driven their real yields below 0% and made them one of the few investments we know of that guarantee their holders a loss of purchasing power. The volatility of returns is half of what it was in 2008 and is back in line with its historical average.
In a headline that Minksy would appreciate, the trade journal Pensions & Investments has reported that pension funds and their consultants have proposed levering up their TIPS allocations to raise the expected return of this low-volatility asset3. Are TIPS really less risky today than they were in 2008 as most quantitative modelers would assume? US TIPS Index: Trailing Volatility versus Real Interest Rate US TIPS Index: Trailing Volatility versus Real Interest Rate 15% 15% 5% 5% Qua nt model ssa ys ri ssk iiss Qua nt model a ys ri k hi gh des pi te ~4% rea ll ra te hi gh des pi te ~4% rea ra te 12% 12% 4% 4% Qua nt model ssa ys ri ssk Qua nt model a ys ri k iiss llow des pi te 0% rea ll ow des pi te 0% rea 9% 9% 3% 3% 6% 6% 2% 2% 3% 3% 1% 1% Trailing Volatility (left axis) Trailing Volatility (left axis) Real Interest Rate (right axis) Real Interest Rate (right axis) 0% 0% 0% 0% 03 03 04 04 05 05 06 06 07 07 08 08 09 09 10 10 11 11 12 12 Source: Bloomberg 3 See “Wisconsin may pioneer leveraged approach to manage risk,” Pensions & Investments, January 11, 2010. . PAGE 10 We would argue that at a negative real interest rate TIPS are the riskiest they have ever been, no matter what the models say. This “past-is-prologue” method of assessing risk is not confined to the world of academics and consultants. It is widely employed by investors whose actions affect us all. For example, over the past two decades the world’s major investment banks embraced Value at Risk (VaR), a methodology that sought to boil down to a simple metric the myriad of risks that resided within a bank’s balance sheet. The output of a VaR model is a single number, namely the max- imum dollar loss a portfolio is expected to generate over a short period of time.
The inputs are historical price movements over a specified period, such as the past 250 trading days, crunched with the same statistical techniques as a mean-variance asset allocation model. During the placid markets of the mid-2000s, the VaR models employed by Lehman Brothers and Bear Stearns fooled these firms into thinking they could safely increase their leverage. Needless to say, the “maximum potential losses” predicted by the models during that period proved to be a fraction of the actual losses experienced by the banks. Most investors recognize that they must assume certain risks if they hope to preserve or grow their wealth. One of the key roles of an advisor is to identify these risks properly and illuminate the trade-offs between risk and return the investor faces across a broad range of uncertain future environments. Unfortunately, the reductive, backward-looking quantitative tools adopted by much of the investment industry are not up to this task. Some risk management practices remind us of the old saw about the drunk searching for his keys on a dark night.
Asked by a passer-by if he is sure he dropped them near the streetlamp the drunk replies “No, but this is where the light is good.” Like the drunk on the sidewalk, a financial engineer armed with a spreadsheet and a subscription to Factset can keep busy crunching historical standard deviations and correlation coefficients, but these will tell him very little about where the true risks in a portfolio lurk. Running through each of the tenets outlined in this paper is the view that by combining the discipline of a numerical model with informed judgment we can improve on the results generated by traditional risk models. Injecting judgment into the framework improves both the inputs and the outputs of our risk model. The inputs are better because our assumptions are forward-looking rather than historical and are based on our understanding of fundamental economic drivers rather than artificial asset class categories.
The outputs are better because our definition of risk is more aligned with what really matters to investors, namely avoiding permanent losses of wealth. â–¡ . FOR MORE INFORMATION, CALL US AT (877) 449-1999 OR REACH OUT TO A LOCAL OFFICE: |SAN FRANCISCO 415-449-1050 |DALLAS 214-855-2200 Current weighting of certain sectors, asset classes, and other assumptions are subjective. No assurance can be given that these assessments will prove to be correct. The difference between assumptions regarding the correlation between risk and return may not be accurate whereby the specific investments within each asset class could vary materially. Current weightings and commentary are not intended to represent investment advice that is appropriate for all investors. Each investor’s portfolio must be constructed based on the individual’s financial resources, investment goals, risk tolerance, investment time horizon, tax situation and other relevant factors.
Presidio does not provide tax or legal advice. Investors should seek advice from their investment professional to review their specific information. Asset allocation does not guarantee a profit or protection from losses in a declining market.
Investments, when sold, may be worth more or less than the original purchase price. These insights come from Presidio Wealth Advisory LLC, a SEC Registered Investment Advisory firm, is a subsidiary of The Presidio Group LLC. There are no warranties, expressed or implied as to the accuracy, completeness, or results obtained from any information in this material. Past performance does not guarantee future results. This material is proprietary and is not allowed to be reproduced, other than for your own persona, noncommercial use, without prior written permission from Presidio. Published March 2012.
© 2012 All rights reserved. .


