


Description
1825 NW Corporate Blvd., Suite 300 • Boca Raton, FL 33431 • Tel: 561-241-2425 • www.polencapital.com
October 18, 2016
Polen Global Growth Portfolio
3rd Quarter 2016 Commentary
Summary:
ï‚· In the 3rd quarter of 2016, the Polen Global Growth Portfolio (the “Portfolio”) returned 6.48% before fees,
compared to 5.30% for the MSCI Allâ€Country World Index, a difference of 1.18%.
ï‚· The portfolio’s annualized return since inception on January 1st, 2015 is 8.58% before fees compared to
2.31% for MSCI ACWI, a difference of 6.27%.
ï‚· We believe investment performance since inception has been driven by consistent, doubleâ€digit earnings
growth and we expect this to continue in 2016 and going forward.
ï‚· Approximately 14% growth in earnings per share is expected for the Portfolio in 2016, compared to 1%
growth in earnings per share for the Global stock market index.
Investment Performance Commentary:
In the 3rd quarter of 2016, the Polen Global Growth Portfolio returned 6.48% before fees compared to 5.30% for
the MSCI Allâ€Country World Index, a difference of 1.18%. Most portfolio holdings, sectors and regions contributed
positively to investment performance last quarter, with the strongest absolute performance coming from several
holdings in the technology sector and the Asiaâ€Pacific region. Weaker investment performance came from the
very few investments the Portfolio holds in the materials and industrials sectors.
Yearâ€toâ€date investment performance was 4.93% at the end of the quarter, clearly in positive territory, but some
way behind MSCI ACWI at 6.60%, a difference of 1.67%. The Portfolio is managed for absolute returns, rather than
relative return, and I expect business performance – specifically compound earnings growth – to be the main
driver of investment performance over the years. Realistically, periods of some relative underperformance
compared to stock markets are likely, if not inevitable, along the way. That said, it is still useful to think through
the reasons for any lag in relative performance, mainly as a check on the quality of the businesses the Portfolio
holds.
The macroeconomic environment mentioned in past commentaries – especially the 1st quarter 2016 commentary
– has persisted, with relatively slow and uneven growth but with some increasing signs of price disâ€inflation
appearing through the year and signs of price deflation here and there. Developed economies continue to underâ€
achieve their potential growth rates mainly, it seems, due to selfâ€inflicted and structural challenges, and both the
United States and the Euro area are currently seeing growth in gross domestic product of less than 2%. Consumer
prices are increasing slightly according to government statistics but barely and, in any case, not enough to dissuade
central banks from a continuing and very aggressive policy stance, typically including quantitative easing and
targeting historically low short†and longâ€term interest rates. For example, it is not easy to identify any developed
economy with 10â€year government bonds yielding more than 2% and bond yields nearer 0% are increasingly
normal. A common thread from our last research trip to visit consumer and healthcare businesses based in Europe
was management comments indicating a slower growth environment in emerging markets compared to the last
few years. Among the largest emerging market economies, China is experiencing at least a mild slowdown in
Please reference the supplemental information to the composite performance which accompanies this commentary.
. growth according to official data. Brazil and Russia are in recession. Of the four BRICs, only India continues to
perform relatively well.
This is not a promising backdrop for growth in corporate earnings, yet global stock markets have performed
reasonably well so far this year. Extremely low interest rates help to explain this disconnect. On one hand,
traditionally defensive sectors of the stock market including consumer staples, telecommunications and utilities
are performing relatively well. For some investors, stocks in these sectors have been acceptable substitutes for
bonds because of their relatively recurring revenues and dividend yields near or above yields available on
government bonds. Low interest rates are also fueling “risk on” stock market sentiment, helping to explain even
stronger performance in proâ€cyclical sectors including energy, industrials and materials. These three sectors
comprise just over 20% of the global stock market index and, with doubleâ€digit gains in each sector, have
contributed close to 3.5% or almost half of the stock market’s performance this year.
As an investment team, we quite often find the quality of earnings we are looking for among consumer staples
companies but not always the rate of sustainable growth we are looking for. Both quality and growth rate of
earnings are lacking across almost all energy, industrial and materials companies from our point of view. In these
sectors, the outlook for earnings may or may not improve in the shortâ€term but the Portfolio remains effectively
underweight with holdings limited to companies in sectors with more persistent and sustainable earnings.
Overview of the Portfolio:
The Portfolio remains concentrated with investments in 30 businesses. Sixteen holdings are based in the United
States and 14 in the rest of the world. Revenues provide a clearer picture of economic exposure and, on this basis,
the Portfolio has close to 50% exposure to the United States and 50% to the rest of the world. The Portfolio also
has a strong bias to larger cap and globally competitive businesses which remain the backbone of the holdings and
more than 75% of assets. These companies tend to have the advantages to compete successfully in many different
countries. This approach is intended to lessen the impact of macroeconomic risks on the Portfolio, especially
country and currencyâ€specific risk. There are currently no holdings listed on stock exchanges in emerging markets,
although emerging market economies are 15% †20% of total revenues.
Earlier in the year, the Portfolio was on track to generate earnings growth in the range of 12% †14% in U.S. dollars
in 2016. Coming into the home stretch, that range seems a little conservative. Relative strength of currencies
including the U.S. dollar and Swiss Franc has been a slight headwind to earnings growth but more than offset by
resilient, underlying earnings performance. Earnings growth of 14% †15% is now more realistic this year. This
range is consistent with the outlook for the next five years. As mentioned in the 1st Quarter commentary,
consensus estimates of earnings growth for the broader global stock market always looked a bit generous. As the
year has gone on, those estimates have come down, and consensus expectations are now 0% †1% earnings growth
in 2016.
Performance Attribution:
Contributors to performance included ARM Holdings plc, Tencent Holdings Ltd. and Alibaba Group Holdings Ltd.
ARM is discussed in some more detail below.
Tencent was included in the Portfolio at inception and is now a top five holding. The company has successfully
bundled and integrated a range of online services used by almost 700 million smartphone subscribers in China.
Tencent provides services that seem to have become indispensable to users including messaging, social
networking, voice calls, browsing, gaming ecommerce and payments, among many others. The WeChat app might
be used to book a hospital appointment, or pay a parking ticket or by parents to stay in touch with small children.
Please reference the supplemental information to the composite performance which accompanies this commentary.
. Infants too young to carry a mobile phone may have a cuddly toy that is also a connected device to chat with mum
and dad. The app might be better described as a kind of operating system that helps users navigate the day. It has
become such a part of people lives that it now accounts for about 33% of the time Chinese mobile phone users
spend online. About half of all users have linked their bank accounts to the WeChat app, which is routinely used
for a variety of online and offline payments. If all of this sounds hard to imagine, it is because nothing outside
China has come close to the usefulness WeChat provides. To most WeChat users, Western apps would look like a
step backward in time. You might say that to understand the future of the mobile internet, the West should look
to China, except even the strongest internet enterprises in the United States will struggle to achieve the
integration of offerings WeChat has. It is still relatively early in seeing how much revenue Tencent can generate
from its current base of users, but the strong engagement Tencent enjoys from a very large population and a
scalable business model indicates a highly sustainable stream of earnings to come. Tencent’s share price has
appreciated approximately inâ€line with earnings growth, which is expected to be around 30% in U.S. dollars this
year. While some growth has been coming from further expansion in the number of WeChat users, recent
earnings reports have shown that most earnings growth has been driven by increasing revenue per user across
smartphone games, advertising and social networking. At the time of writing, Tencent’s market capitalization of
approximately $250 billion makes it the most valuable public company based outside the United States.
Alibaba was also a contributor to investment performance. In previous commentaries I have outlined our
conviction in Alibaba as a sustainable growth business. I said that the company provides and operates the
technology that connects buyers and sellers, enabling most of the eâ€commerce in the world’s second largest
economy, which is woefully underâ€served by traditional, bricks and mortar retailers. As with Tencent, there is no
precise comparison we can make with a familiar online business in the West. Alibaba is not technically an online
retailer, like Amazon, for example, because it owns little or no inventory. If it were a retailer though, it would be
the world’s largest, slightly ahead of Walâ€Mart with more than $500 billion of sales across its two retail
marketplaces. Recent earnings reports have indicated continued growth in the number of shoppers. The number
is approaching 500 million, or approximately 60% of China’s internet population. Customers seem to be very
comfortable with the range of product offerings, the convenience, the overnight delivery Alibaba’s logistics
partners are frequently able to provide, and the secure payment method provided through Alipay, which was
critical to the company’s early success and ability to scale. Shoppers are, on average, ordering more than once a
week. To put this in context, Alibaba and its partners are handling in the region of 25 billion individual orders per
year, or 70 million orders every day. The sheer magnitude of orders helps to explain why Amazon has struggled to
bring its model to the Chinese market. A growing number of Alibaba customers are spending about $19 on an
average order and about 50 cents per order comes to Alibaba in the form of advertising and other revenues. This
take rate has been edging up recently as Alibaba deepens its engagement with shoppers. With very little capital
investment needed, the balance sheet is asset light and debt free. This also means that much of the revenue tends
to convert to free cash flow and Alibaba seems likely to generate 20 – 25 cents per order (40% †50% of revenue) in
free cash flow again this year. It has been remarkable to see wild swings in stock market sentiment around such a
consistent business, but as with other holdings in the Portfolio, we anticipate earnings performance will resolve
any doubts over time. A reasonable expectation would be 25% growth in earnings and cash flow in 2016.
The main detractor from performance last quarter was the relatively small holding in Novo Nordisk A/S. Novo is
the leading diabetes care business in the world with a track record of innovation and consistent, profitable growth.
Diabetes is both a pandemic that affects about 400 million people and a chronic disease that can lead to increased
risk of heart attack, stroke, kidney failure and blindness, among other complications. The diabetes patient
population continues to grow as a result of dietary trends, rising incidence of obesity and the rate of urbanization
in emerging markets, yet relatively few patients receive the care they need. The primary treatment for diabetes is
a range of insulin analogs that do not cure diabetes but effectively and safely control the disease, reducing the risk
of complications and even more serious illness (and of course the costly additional burden for health care
systems). Still, only about 50 million people, or less than 15% of the patient population, use insulin, which suggests
Please reference the supplemental information to the composite performance which accompanies this commentary.
. a long runway of growth for the company. Novo’s market share of insulin is about 40% but its shares are higher, in
the 50% †60% range, in nextâ€generation diabetes products. This market positon reflects the company’s
commitment to science and innovation over the decades, as well as a $2 billion annual investment in research and
development that fuels a healthy product pipeline. The margin of safety around the business is partly the
recurring, usually at least daily, use of insulin to control diabetes and partly the company’s commitment to science,
but also its financial strength. Over the last 5 years the business has generated $20 billion in free cash flow after
its investment in research and sales (almost all of which has been returned to shareholders). Other competitive
advantages include lowâ€cost production and a global sales footprint. In summary, Novo has many of the attributes
of a steady and sustainable growth business. In 2016, earnings per share will probably grow in the low doubleâ€
digits, roughly inâ€line with our expectation for the next several years. However, the company’s share price
suffered a correction during the 3rd Quarter. The stock has become a poster child of sorts for the opaque,
convoluted and perhaps dysfunctional way insulin prices are being set in the United States. For some patients, the
cost of insulin is soaring but rising prices seem to be benefiting pharmacy benefit managers who control
distribution, rather than manufacturers like Novo Nordisk. There is no doubt that market power has shifted in a
way that benefits intermediaries in the United States, an important market for Novo and around 50% of the
group’s sales. Following a recent research visit to the company’s headquarters in Copenhagen, and given a
potentially more attractive level at which to add to the holding, we are reâ€evaluating the investment case.
Changes to the Portfolio:
The investment in ARM Holdings plc was sold during the quarter. ARM is one of the world’s leading technology
enterprises based outside the United States and is a great example of our ability to find the highestâ€quality
business regardless of their domicile. The company’s engineers design processor chips used in mobile phones and
a range of other connected devices. Over the years, it has specialized in processors designed to extract more
computing power and performance from limited battery life. Through continuous improvements in design an ARM
smartphone, for example, provides more computing power than the supercomputers of the early 1990s even
though battery life, unfortunately, has barely changed. As rival Intel has struggled to make any inroads in smart
devices, ARM’s designs have become industry standard and are now used in more than 90% of all mobile phones.
Putting this another way, almost 5 billion people – most of world’s population, in fact – rely on an ARMâ€powered
mobile phone every day and throughout the day. ARM is probably the most pervasive technology company almost
no one has heard of. But besides mobile phones, ARM’s designs are used in a range of other consumer electronics
products. This year, the company will earn an average royalty of a few cents (5.5 cents, to be precise) on more
than 16 billion devices that will be shipped to customers. Looking ahead to the next 5â€10 years, ARM is in a strong
positon to maintain its leadership in mobile computing and extend its technology into less mature markets
including networking equipment, server computers, and connected devices that will become the internet of things.
We have been looking forward to doubleâ€digit unit growth, mostly recurring royalty revenues at very high margins
and strong generation of free cash flow over time, although with some cyclicality along the way. However, we
have parted company with ARM sooner than expected, following an offer made for the company by SoftBank
Group Corp. in July. SoftBank’s cash offer of GBP 17 per share represented a premium of 71% to the yearâ€toâ€date
average price. It also implied a multiple of 50 times adjusted earnings per share for 2016, based on our estimates.
This compares to the price to the earnings multiple of 25 that we have been using to estimate an expected return
for the investment. In effect, the offer compressed the returns we expected from compounding over the next four
to five years into 2016. Further, the offer was recommended by ARM’s board of directors. Given the adequate
premium and the very low probability of any higher offer in my view the position was sold from the Portfolio.
An investment in Align Technology Inc. was added to the Portfolio during the quarter. Align is a midâ€sized medical
devices company that manufactures small, clear, customized plastic braces used by orthodontists and dentists to
straighten teeth. It is also a global market leader that is leading and driving the development of a product category
as clear plastic braces become a better alternative to traditional metal wire orthodontics for many patients. This
Please reference the supplemental information to the composite performance which accompanies this commentary.
. category seems particularly attractive because straight (and white) teeth have become increasingly important or
even needsâ€based to both adults and teenagers. Demand is still discretionary, but braces are increasingly seen as a
kind of investment in personal and professional success, as well as selfâ€image. Most sales come from the Invisalign
brand which is well established and often requested by name. Although Invisalign dominates the space with more
than 90% share of clear braces and more than 4 million cases to date, the company is still in the early stages of
realizing its growth opportunity, with no more than 10% share of its addressable market. We believe the
competitive moat around the business is very strong for a company of this size. Aside from the brand that
resonates with consumers, Align has forged strong relationships with the approximately 50,000 orthodontist and
dental practices it serves. Wouldâ€be competitors have been slow to enter the space but, even if they can work
around the patents protecting designs unique to Invisalign designs, they may struggle to match Align’s material
science, the science that allows a lightweight and removable piece of plastic to safely and effectively move bones
in the jaw. The knowâ€how required to manufacture customized braces at scale and the digital asset – the
accumulation of knowledge and experience over more than 15 years used to design molds before braces are
printed †are additional, formidable competitive barriers. The investment has been added to the Portfolio with a
view to adding to the holding over time.
Outlook:
The Portfolio continues to hold relatively few highâ€quality growth businesses with each holding being selected for
its ability to sustain earnings growth. Portfolio turnover has remained low this year and less than 10% annualized
since inception. The Portfolio will continue to hold many of the same businesses it has since inception, although
turnover is likely to pick up a little from here to a more normal range of 10% †20% as I review a small number of
investment candidates to further reduce cash. Looking into the remainder of 2016 and beyond, I anticipate doubleâ€
digit compound earnings growth will be the main driver of investment returns.
Thank you for your investment in the Polen Global Growth Portfolio.
Sincerely,
Julian Pick, CFA
The commentary is not intended as a guarantee of profitable outcomes. Any forwardâ€looking statements are based on certain
expectations and assumptions that are susceptible to changes in circumstances.
Please reference the supplemental information to the composite performance which accompanies this commentary.
. Historical Performance
Polen Global Growth Performance †September 30, 2016
Polen (Gross)
Polen (Net)
MSCI ACWI
3Q16
6.48%
6.26%
5.30%
YTD
4.93%
4.25%
6.60%
1 Year
13.61%
12.65%
11.96%
Since Inception (1/1/15)
8.58%
7.66%
2.31%
*Returns are trailing through 09/30/16. Annualized returns are presented for periods greater than 1 year.
Please reference the supplemental information to the composite performance which accompanies this commentary.
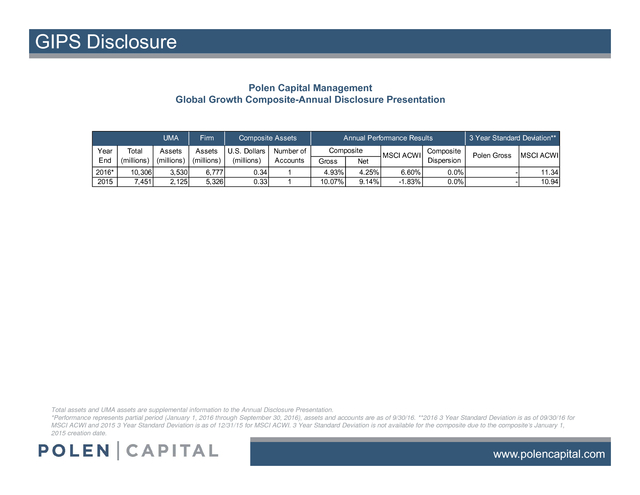
. GIPS Disclosure
Polen Capital Management
Global Growth Composite-Annual Disclosure Presentation
UMA
Year
End
2016*
2015
Total
(millions)
10,306
7,451
Assets
(millions)
3,530
2,125
Firm
Composite Assets
Assets U.S. Dollars
(millions)
(millions)
6,777
5,326
0.34
0.33
Number of
Accounts
1
1
Annual Performance Results
Composite
Gross
Net
4.93%
10.07%
4.25%
9.14%
MSCI ACWI
6.60%
-1.83%
3 Year Standard Deviation**
Composite
Dispersion
0.0%
0.0%
Polen Gross
MSCI ACWI
-
11.34
10.94
Total assets and UMA assets are supplemental information to the Annual Disclosure Presentation.
*Performance represents partial period (January 1, 2016 through September 30, 2016), assets and accounts are as of 9/30/16. **2016 3 Year Standard Deviation is as of 09/30/16 for
MSCI ACWI and 2015 3 Year Standard Deviation is as of 12/31/15 for MSCI ACWI. 3 Year Standard Deviation is not available for the composite due to the composite’s January 1,
2015 creation date.
www.polencapital.com
.
GIPS Disclosure The Global Growth Composite created on January 1, 2015 contains fully discretionary global growth accounts that are not managed within a wrap fee structure and for comparison purposes is measured against MSCI ACWI. Prior to October 18, 2016, the benchmark for the Global Growth Composite was the MSCI ACWI variant with gross dividends. As of October 18, 2016, the benchmark was changed to the MSCI ACWI variant with net dividends, to more accurately reflect the Global Growth Composite’s strategy. Polen Capital invests exclusively in a portfolio of high quality liquid companies. Polen Capital Management claims compliance with the Global Investment Performance Standards (GIPS®) and has prepared and presented this report in compliance with the GIPS standards.
Polen Capital Management has been independently verified by Ashland Partners & Company LLP for the periods April 1, 1992 through December 31, 2015. The verification is available upon request. Verification assesses whether (1) the firm has complied with all the composite construction requirements of the GIPS standards on a firm-wide basis and (2) the firm’s policies and procedures are designed to calculate and present performance in compliance with the GIPS standards. Verification does not ensure the accuracy of any specific composite presentation. Polen Capital Management is an independent registered investment adviser.
The firm maintains a complete list and description of composites, which is available upon request. In July 2007, the firm was reorganized from an S-corporation into an LLC and changed names from Polen Capital Management, Inc. to Polen Capital Management, LLC. Results are based on fully discretionary accounts under management, including those accounts no longer with the firm.
Past performance is not indicative of future results. The U.S. Dollar is the currency used to express performance. Returns are presented gross and net of management fees and include the reinvestment of all income.
Net of fee performance was calculated using actual management fees. The annual composite dispersion presented is an asset-weighted standard deviation calculated for the accounts in the composite the entire year. Policies for valuing portfolios, calculating performance, and preparing compliant presentations are available upon request. The management fee schedule is as follows: Institutional: Per annum fees for managing accounts are 85 basis points (0.85%) on the first $50 Million and 65 basis points (0.65%) on all assets above $50 Million of assets under management.
HNW: Per annum fees for managing accounts are 150 basis points (1.5%) of the first $500,000 of assets under management and 100 basis points (1.0%) of amounts above $500,000 of assets under management. Actual investment advisory fees incurred by clients may vary. Past performance does not guarantee future results and future accuracy and profitable results cannot be guaranteed. Performance figures are presented gross and net of management fees and have been calculated after the deduction of all transaction costs and commissions.
Polen Capital is a SEC registered investment advisor and its investment advisory fees are described in its Form ADV Part 2A. The advisory fees will reduce client’s returns. The chart below depicts the effect of a 1% management fee on the growth of one dollar over a 10 year period at 10% (9% after fees) and 20% (19% after fees) assumed rates of return. The MSCI ACWI Index is a market capitalization weighted index designed to provide a broad measure of equity-market performance throughout the world.
The MSCI ACWI is maintained by Morgan Stanley Capital International, and is comprised of stocks from both developed and emerging markets. The information provided in this document should not be construed as a recommendation to purchase or sell any particular security. There is no assurance that any securities discussed herein will remain the composite or that the securities sold will not be repurchased. The securities discussed do not represent the composite’s entire portfolio.
Actual holdings will vary depending on the size of the account, cash flows, and restrictions. It should not be assumed that any of the securities transactions or holdings discussed will prove to be profitable, or that the investment recommendations or decisions we make in the future will be profitable or will equal the investment performance of the securities discussed herein. A complete list of our past specific recommendations for the last year is available upon request. Return 1 Year 2 Years 3 Years 4 Years 5 Years 6 Years 7 Years 8 Years 9 Years 10 Years 10% 1.1 1.21 1.33 1.46 1.61 1.71 1.95 2.14 2.36 2.59 9% 1.09 1.19 1.3 1.41 1.54 1.68 1.83 1.99 2.17 2.39 20% 1.2 1.44 1.73 2.07 2.49 2.99 3.58 4.3 5.16 6.19 19% 1.19 1.42 1.69 2.01 2.39 2.84 3.38 4.02 4.79 5.69 www.polencapital.com .


