


Description
. CSX Corporation Announces Third Quarter Earnings
Highlights:
•
With macroeconomic and energy headwinds impacting most markets, CSX once again delivered solid financial results in the
third quarter
•
Earnings per share were $0.48 and operating ratio was 69.0 percent, reflecting continued strong cost performance
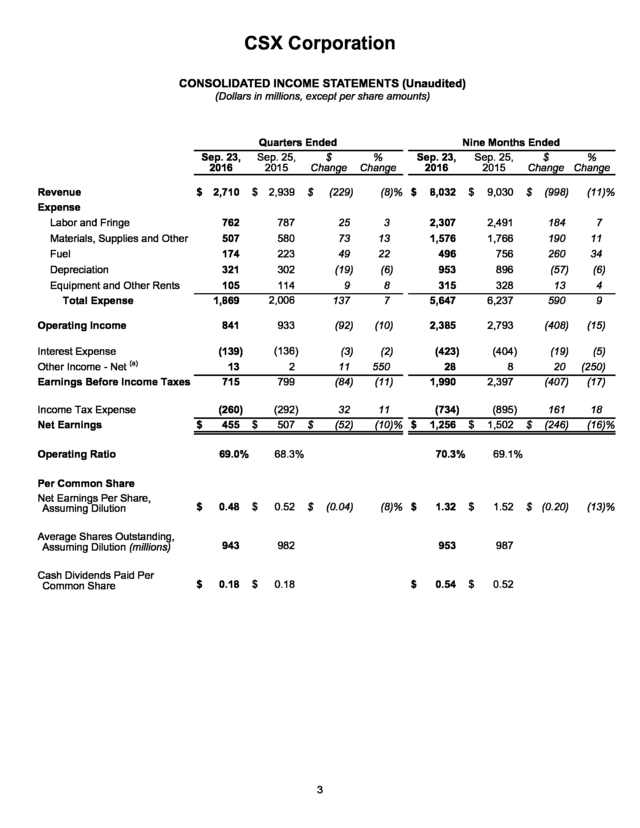
JACKSONVILLE, Fla. - October 12, 2016 - CSX Corporation (Nasdaq: CSX) today announced third quarter 2016 net earnings of
$455 million, or $0.48 per share, down from $507 million, or $0.52 per share, in the same period of last year.
“CSX continues to drive strong cost performance and efficiency in this dynamic market environment while meeting or exceeding
customer expectations,” said Michael J. Ward, chairman and chief executive officer. “Our financial results demonstrate CSX’s ability
to deliver value for shareholders and customers in the current business climate as we position the company to maximize opportunities
in 2017 and beyond.”
Revenue for the quarter declined 8 percent, consistent with volume declines of 8 percent overall, including coal volume declines of
21 percent.
At the same time, expenses improved 7 percent in the quarter, primarily driven by $112 million of efficiency gains and $53 million of volume-related cost reductions. As these cost savings partially offset the impact of lower volume and changing business mix, operating income declined 10 percent to $841 million and the operating ratio increased 70 basis points year-over-year to 69.0 percent. While the U.S. dollar strength and low global commodity prices persisted in the quarter, CSX is positioning itself to maximize shareholder value by leveraging network improvements, technology enhancements and superior service to capture growth opportunities and achieve a mid-60s operating ratio longer term. Table of Contents The accompanying unaudited CSX CORPORATION CONTACTS: financial information should be 500 Water Street, C900 Consolidated Financial Statements........p. 3 read in conjunction with the Jacksonville, FL 32202 INVESTOR RELATIONS Operating Statistics...............................p.
16 Company’s most recent www.csx.com David Baggs Network Map.........................................p. 17 Annual Report on Form 10-K, (904) 359-4812 Quarterly Reports on Form MEDIA 10-Q, and any Current Melanie Cost Reports on Form 8-K. (904) 359-1702 1 . CSX executives will conduct a quarterly earnings conference call with the investment community on October 13, 2016, from 8:30 a.m. to 9:30 a.m. Eastern time. Investors, media and the public may listen to the conference call by dialing 1-888-EARN-CSX (888-327-6279) and asking for the CSX earnings call.
Callers outside the U.S., dial 1-773-756-0199. Participants should dial in 10 minutes prior to the call. In conjunction with the call, a live webcast will be accessible and presentation materials will be posted on the company's website at http://investors.csx.com.
Following the earnings call, an internet replay of the presentation will be archived on the company website. This earnings announcement, as well as additional detailed financial information, is contained in the CSX Quarterly Financial Report available through the company’s website at http://investors.csx.com and on Form 8-K with the Securities and Exchange Commission. About CSX and its Disclosures CSX, based in Jacksonville, Florida, is a premier transportation company. It provides rail, intermodal and rail-to-truck transload services and solutions to customers across a broad array of markets, including energy, industrial, construction, agricultural, and consumer products. For nearly 190 years, CSX has played a critical role in the nation's economic expansion and industrial development.
Its network connects every major metropolitan area in the eastern United States, where nearly two-thirds of the nation's population resides. It also links more than 240 short-line railroads and more than 70 ocean, river and lake ports with major population centers and farming towns alike. This announcement, as well as additional financial information, is available on the company's website at http://investors.csx.com. CSX also uses social media channels to communicate information about the company. Although social media channels are not intended to be the primary method of disclosure for material information, it is possible that certain information CSX posts on social media could be deemed to be material.
Therefore, we encourage investors, the media, and others interested in the company to review the information we post on Twitter (http://twitter.com/CSX) and on Slideshare (http://www.slideshare.net/HowTomorrowMoves). The social media channels used by CSX may be updated from time to time. More information about CSX Corporation and its subsidiaries is available at www.csx.com and on Facebook (http:// www.facebook.com/OfficialCSX). Forward-looking Statements This information and other statements by the company may contain forward-looking statements within the meaning of the Private Securities Litigation Reform Act with respect to, among other items: projections and estimates of earnings, revenues, margins, volumes, rates, cost-savings, expenses, taxes, liquidity, capital expenditures, dividends, share repurchases or other financial items, statements of management's plans, strategies and objectives for future operations, and management's expectations as to future performance and operations and the time by which objectives will be achieved, statements concerning proposed new services, and statements regarding future economic, industry or market conditions or performance. Forward-looking statements are typically identified by words or phrases such as “will,” “should,” “believe,” “expect,” “anticipate,” “project,” “estimate,” “preliminary” and similar expressions. Forward-looking statements speak only as of the date they are made, and the company undertakes no obligation to update or revise any forward-looking statement. If the company updates any forward-looking statement, no inference should be drawn that the company will make additional updates with respect to that statement or any other forward-looking statements. Forward-looking statements are subject to a number of risks and uncertainties, and actual performance or results could differ materially from that anticipated by any forward-looking statements.
Factors that may cause actual results to differ materially from those contemplated by any forwardlooking statements include, among others; (i) the company's success in implementing its financial and operational initiatives; (ii) changes in domestic or international economic, political or business conditions, including those affecting the transportation industry (such as the impact of industry competition, conditions, performance and consolidation); (iii) legislative or regulatory changes; (iv) the inherent business risks associated with safety and security; (v) the outcome of claims and litigation involving or affecting the company; (vi) natural events such as severe weather conditions or pandemic health crises; and (vii) the inherent uncertainty associated with projecting economic and business conditions. Other important assumptions and factors that could cause actual results to differ materially from those in the forward-looking statements are specified in the company's SEC reports, accessible on the SEC's website at www.sec.gov and the company's website at www.csx.com. 2 . CSX Corporation CONSOLIDATED INCOME STATEMENTS (Unaudited) (Dollars in millions, except per share amounts) Sep. 23, 2016 Revenue $ Expense Labor and Fringe Materials, Supplies and Other Fuel Depreciation Equipment and Other Rents Total Expense 2,710 Quarters Ended Sep. 25, $ 2015 Change $ 2,939 $ (229) Nine Months Ended Sep. 23, Sep.
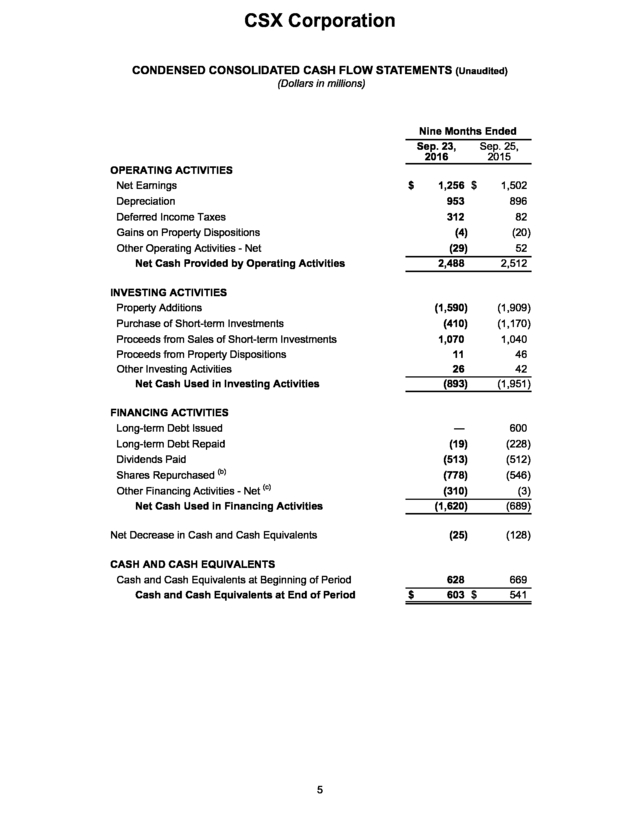
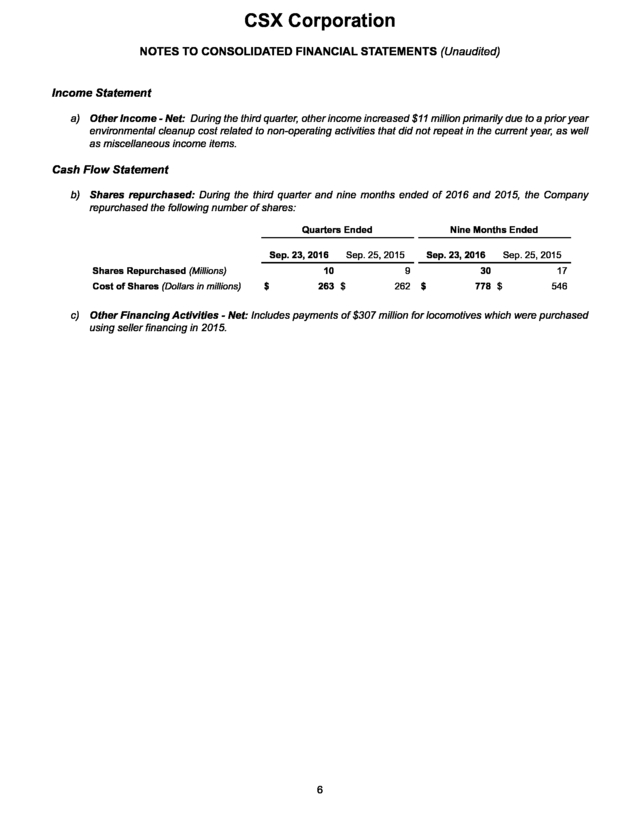
25, $ % 2016 2015 Change Change % Change (8)% $ 8,032 $ 9,030 $ (998) (11)% 762 507 174 321 105 1,869 787 580 223 302 114 2,006 25 73 49 (19) 9 137 3 13 22 (6) 8 7 2,307 1,576 496 953 315 5,647 2,491 1,766 756 896 328 6,237 184 190 260 (57) 13 590 7 11 34 (6) 4 9 841 933 (92) (10) 2,385 2,793 (408) (15) Interest Expense Other Income - Net (a) Earnings Before Income Taxes (139) 13 715 (136) (3) 11 (84) (2) 550 (11) (423) 28 1,990 (404) 8 2,397 (19) 20 (407) (5) (250) (17) Income Tax Expense Net Earnings (260) 455 $ (292) 507 $ 32 (52) 11 (10)% $ (734) 1,256 $ (895) 1,502 $ 161 (246) 18 (16)% 69.0% 68.3% 70.3% 69.1% $ (0.20) (13)% Operating Income $ Operating Ratio Per Common Share Net Earnings Per Share, Assuming Dilution $ Average Shares Outstanding, Assuming Dilution (millions) Cash Dividends Paid Per Common Share 0.48 2 799 $ 943 $ 0.18 0.52 $ (0.04) (8)% $ 982 $ 1.32 $ 953 0.18 $ 3 0.54 1.52 987 $ 0.52 . CSX Corporation CONDENSED CONSOLIDATED BALANCE SHEETS (Dollars in millions) (Unaudited) Sep. 23, 2016 Dec. 25, 2015 ASSETS Cash and Cash Equivalents Short-term Investments Other Current Assets Properties - Net Investment in Affiliates and Other Companies Other Long-term Assets Total Assets $ $ 603 $ 152 1,408 30,782 1,433 303 34,681 $ 628 810 1,402 30,174 1,394 337 34,745 631 $ 1,632 9,888 9,505 1,355 23,011 20 1,932 10,515 9,179 1,431 23,077 11,670 34,681 $ 11,668 34,745 LIABILITIES AND SHAREHOLDERS' EQUITY Current Maturities of Long-term Debt Other Current Liabilities Long-term Debt Deferred Income Taxes Other Long-term Liabilities Total Liabilities $ Total Shareholders' Equity Total Liabilities and Shareholders' Equity $ Certain prior year data has been reclassified to conform to the current presentation. 4 . CSX Corporation CONDENSED CONSOLIDATED CASH FLOW STATEMENTS (Unaudited) (Dollars in millions) Nine Months Ended Sep. 23, Sep. 25, 2016 2015 OPERATING ACTIVITIES Net Earnings Depreciation Deferred Income Taxes Gains on Property Dispositions Other Operating Activities - Net Net Cash Provided by Operating Activities $ 1,256 $ 953 312 (4) (29) 2,488 1,502 896 82 (20) 52 2,512 INVESTING ACTIVITIES Property Additions Purchase of Short-term Investments Proceeds from Sales of Short-term Investments Proceeds from Property Dispositions Other Investing Activities Net Cash Used in Investing Activities (1,590) (410) 1,070 11 26 (893) (1,909) (1,170) 1,040 46 42 (1,951) FINANCING ACTIVITIES Long-term Debt Issued Long-term Debt Repaid Dividends Paid Shares Repurchased (b) Other Financing Activities - Net (c) Net Cash Used in Financing Activities — (19) (513) (778) (310) (1,620) 600 (228) (512) (546) (3) (689) Net Decrease in Cash and Cash Equivalents (25) (128) CASH AND CASH EQUIVALENTS Cash and Cash Equivalents at Beginning of Period Cash and Cash Equivalents at End of Period 628 603 $ 5 $ 669 541 . CSX Corporation NOTES TO CONSOLIDATED FINANCIAL STATEMENTS (Unaudited) Income Statement a) Other Income - Net: During the third quarter, other income increased $11 million primarily due to a prior year environmental cleanup cost related to non-operating activities that did not repeat in the current year, as well as miscellaneous income items. Cash Flow Statement b) Shares repurchased: During the third quarter and nine months ended of 2016 and 2015, the Company repurchased the following number of shares: Quarters Ended Sep. 23, 2016 Shares Repurchased (Millions) Cost of Shares (Dollars in millions) 10 $ 263 $ Nine Months Ended Sep. 25, 2015 Sep. 23, 2016 9 262 30 $ 778 $ Sep.
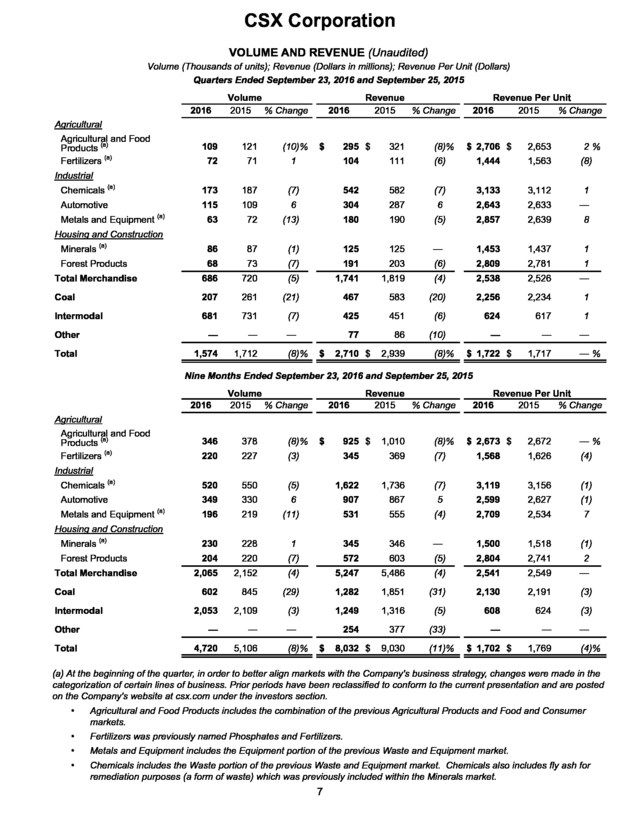
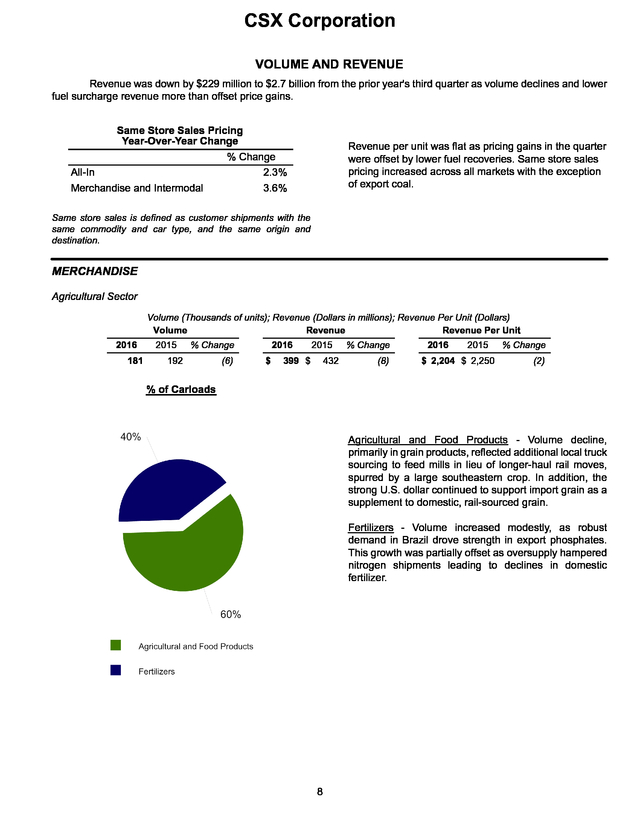
25, 2015 17 546 c) Other Financing Activities - Net: Includes payments of $307 million for locomotives which were purchased using seller financing in 2015. 6 . CSX Corporation VOLUME AND REVENUE (Unaudited) Volume (Thousands of units); Revenue (Dollars in millions); Revenue Per Unit (Dollars) Quarters Ended September 23, 2016 and September 25, 2015 2016 Agricultural Agricultural and Food Products (a) Fertilizers (a) Volume 2015 % Change 109 121 (10)% 72 71 Chemicals (a) 173 Automotive 115 2016 $ Revenue 2015 % Change 295 $ 321 (8)% 1 104 111 187 (7) 542 109 6 304 63 72 (13) Minerals (a) 86 87 Forest Products 68 73 Total Merchandise 686 Coal Intermodal Revenue Per Unit 2016 2015 % Change $ 2,706 $ 2,653 2% (6) 1,444 1,563 582 (7) 3,133 3,112 1 287 6 2,643 2,633 — 180 190 (5) 2,857 2,639 8 (1) 125 125 — 1,453 1,437 1 (7) 191 203 (6) 2,809 2,781 1 720 (5) 1,741 1,819 (4) 2,538 2,526 — 207 261 (21) 467 583 (20) 2,256 2,234 1 681 731 (7) 425 451 (6) 624 617 1 Other — — — 77 86 (10) — — — Total 1,574 1,712 (8) Industrial Metals and Equipment (a) Housing and Construction (8)% $ 2,710 $ 2,939 (8)% $ 1,722 $ 1,717 —% Nine Months Ended September 23, 2016 and September 25, 2015 2016 Agricultural Agricultural and Food Products (a) Fertilizers (a) Volume 2015 % Change 2016 $ Revenue 2015 % Change 925 $ 1,010 (8)% Revenue Per Unit 2016 2015 % Change 346 378 (8)% $ 2,673 $ 2,672 —% 220 227 (3) 345 369 (7) 1,568 1,626 (4) Chemicals (a) 520 550 (5) 1,622 1,736 (7) 3,119 3,156 (1) Automotive 349 330 6 907 867 5 2,599 2,627 (1) Metals and Equipment (a) 196 219 (11) 531 555 (4) 2,709 2,534 7 230 228 1 345 346 — 1,500 1,518 (1) Industrial Housing and Construction Minerals (a) Forest Products 204 220 (7) 572 603 (5) 2,804 2,741 2 2,065 2,152 (4) 5,247 5,486 (4) 2,541 2,549 — 602 845 (29) 1,282 1,851 (31) 2,130 2,191 (3) 2,053 2,109 (3) 1,249 1,316 (5) 608 624 (3) Other — — 254 377 (33) — — Total 4,720 5,106 Total Merchandise Coal Intermodal — (8)% $ 8,032 $ 9,030 (11)% $ 1,702 $ 1,769 — (4)% (a) At the beginning of the quarter, in order to better align markets with the Company's business strategy, changes were made in the categorization of certain lines of business. Prior periods have been reclassified to conform to the current presentation and are posted on the Company's website at csx.com under the investors section. • Agricultural and Food Products includes the combination of the previous Agricultural Products and Food and Consumer markets. • Fertilizers was previously named Phosphates and Fertilizers. • Metals and Equipment includes the Equipment portion of the previous Waste and Equipment market. • Chemicals includes the Waste portion of the previous Waste and Equipment market. Chemicals also includes fly ash for remediation purposes (a form of waste) which was previously included within the Minerals market. 7 . CSX Corporation VOLUME AND REVENUE Revenue was down by $229 million to $2.7 billion from the prior year's third quarter as volume declines and lower fuel surcharge revenue more than offset price gains. Same Store Sales Pricing Year-Over-Year Change % Change All-In 2.3% Merchandise and Intermodal 3.6% Revenue per unit was flat as pricing gains in the quarter were offset by lower fuel recoveries. Same store sales pricing increased across all markets with the exception of export coal. Same store sales is defined as customer shipments with the same commodity and car type, and the same origin and destination. MERCHANDISE Agricultural Sector Volume (Thousands of units); Revenue (Dollars in millions); Revenue Per Unit (Dollars) Volume Revenue Revenue Per Unit 2016 181 2015 % Change 192 (6) 2016 $ 2015 399 $ 432 % Change (8) 2016 2015 $ 2,204 $ 2,250 % Change (2) % of Carloads Agricultural and Food Products - Volume decline, primarily in grain products, reflected additional local truck sourcing to feed mills in lieu of longer-haul rail moves, spurred by a large southeastern crop. In addition, the strong U.S. dollar continued to support import grain as a supplement to domestic, rail-sourced grain. Fertilizers - Volume increased modestly, as robust demand in Brazil drove strength in export phosphates. This growth was partially offset as oversupply hampered nitrogen shipments leading to declines in domestic fertilizer. 8 .
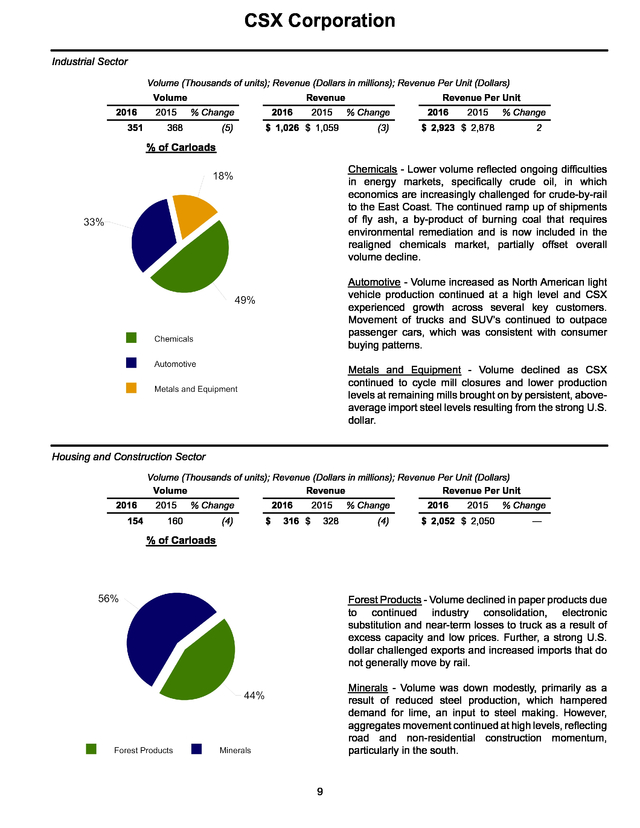
CSX Corporation Industrial Sector Volume (Thousands of units); Revenue (Dollars in millions); Revenue Per Unit (Dollars) Volume 2016 351 2015 Revenue % Change 368 (5) 2016 2015 $ 1,026 $ 1,059 Revenue Per Unit % Change (3) 2016 2015 % Change $ 2,923 $ 2,878 2 % of Carloads Chemicals - Lower volume reflected ongoing difficulties in energy markets, specifically crude oil, in which economics are increasingly challenged for crude-by-rail to the East Coast. The continued ramp up of shipments of fly ash, a by-product of burning coal that requires environmental remediation and is now included in the realigned chemicals market, partially offset overall volume decline. Automotive - Volume increased as North American light vehicle production continued at a high level and CSX experienced growth across several key customers. Movement of trucks and SUV’s continued to outpace passenger cars, which was consistent with consumer buying patterns. Metals and Equipment - Volume declined as CSX continued to cycle mill closures and lower production levels at remaining mills brought on by persistent, aboveaverage import steel levels resulting from the strong U.S. dollar. Housing and Construction Sector Volume (Thousands of units); Revenue (Dollars in millions); Revenue Per Unit (Dollars) Volume Revenue Revenue Per Unit 2016 154 2015 % Change 160 (4) 2016 $ 2015 316 $ 328 % Change (4) 2016 2015 $ 2,052 $ 2,050 % Change — % of Carloads Forest Products - Volume declined in paper products due to continued industry consolidation, electronic substitution and near-term losses to truck as a result of excess capacity and low prices. Further, a strong U.S. dollar challenged exports and increased imports that do not generally move by rail. Minerals - Volume was down modestly, primarily as a result of reduced steel production, which hampered demand for lime, an input to steel making. However, aggregates movement continued at high levels, reflecting road and non-residential construction momentum, particularly in the south. 9 .
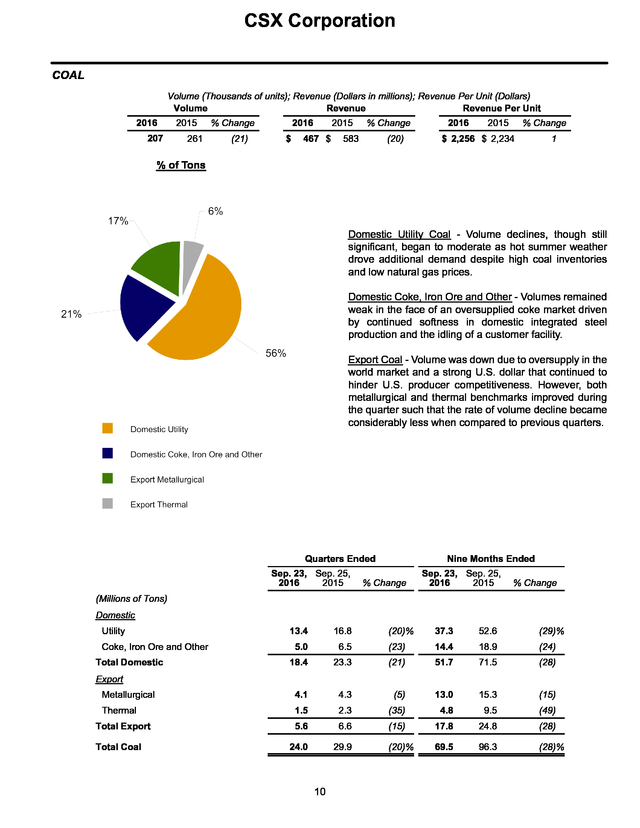
CSX Corporation COAL Volume (Thousands of units); Revenue (Dollars in millions); Revenue Per Unit (Dollars) Volume Revenue Revenue Per Unit 2016 207 2015 261 % Change (21) 2016 $ 2015 467 $ % Change 583 (20) 2016 2015 % Change $ 2,256 $ 2,234 1 % of Tons Domestic Utility Coal - Volume declines, though still significant, began to moderate as hot summer weather drove additional demand despite high coal inventories and low natural gas prices. Domestic Coke, Iron Ore and Other - Volumes remained weak in the face of an oversupplied coke market driven by continued softness in domestic integrated steel production and the idling of a customer facility. Export Coal - Volume was down due to oversupply in the world market and a strong U.S. dollar that continued to hinder U.S. producer competitiveness. However, both metallurgical and thermal benchmarks improved during the quarter such that the rate of volume decline became considerably less when compared to previous quarters. Quarters Ended Sep.
23, Sep. 25, 2016 2015 Nine Months Ended % Change Sep. 23, Sep.
25, 2016 2015 % Change (Millions of Tons) Domestic Utility (20)% 37.3 52.6 (29)% 6.5 (23) 14.4 18.9 (24) 18.4 23.3 (21) 51.7 71.5 (28) Metallurgical 4.1 4.3 (5) 13.0 15.3 (15) Thermal 1.5 2.3 (35) 4.8 9.5 (49) 5.6 6.6 (15) 17.8 24.8 (28) 24.0 29.9 (20)% 69.5 96.3 (28)% Coke, Iron Ore and Other Total Domestic 13.4 16.8 5.0 Export Total Export Total Coal 10 . CSX Corporation INTERMODAL Volume (Thousands of units); Revenue (Dollars in millions); Revenue Per Unit (Dollars) Volume Revenue Revenue Per Unit 2016 681 2015 731 % Change (7) 2016 $ 2015 425 $ % Change 451 (6) 2016 $ 624 $ 2015 617 % Change 1 % of Units Domestic - Volume decreased three percent driven by the competitive loss of some short-haul interchange traffic. Despite ample over-the-road truck capacity, the balance of the domestic portfolio remained near historic highs, reflecting success with CSX’s highway-to-rail conversion program and improved network service offerings and service levels. International - Volume was down 12 percent, reflecting the continued cycling of a prior account loss and the weaker global freight environment. Intermodal Network 11 . CSX Corporation FUEL SURCHARGE Fuel surcharge revenue is included in the individual markets detailed within the volume and revenue explanations above. Fuel lag is the estimated difference between highway diesel prices in the quarter and the prices used for fuel surcharge, which are generally on a two month lag. Quarters Ended Sep. 25, 2015 Nine Months Ended (Dollars in millions) Sep. 23, 2016 Fuel Surcharge Revenue $ 65 $ 128 $ (63) $ 153 $ 452 $ (299) Fuel Lag (Expense) Benefit $ (1) $ 18 $ (19) $ 7 $ 55 $ (48) 12 $ Change Sep.
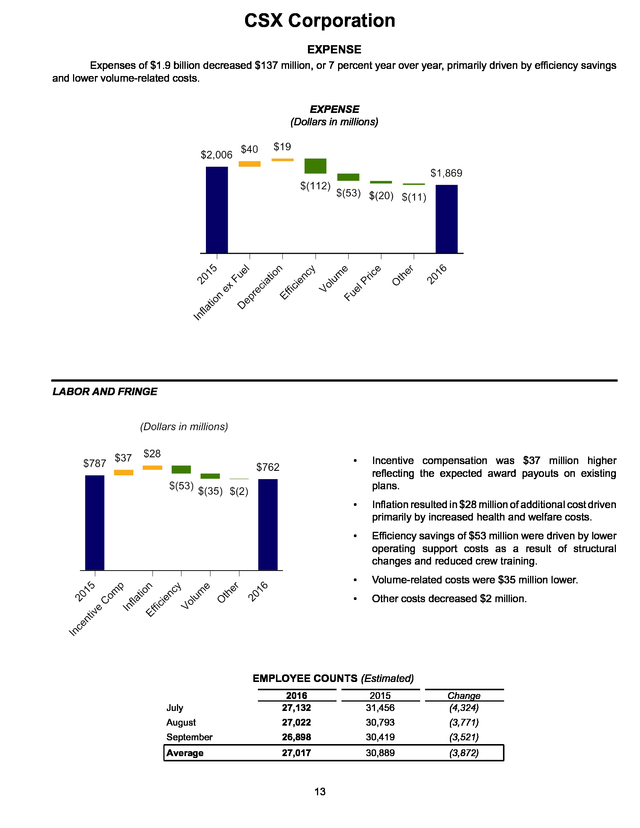
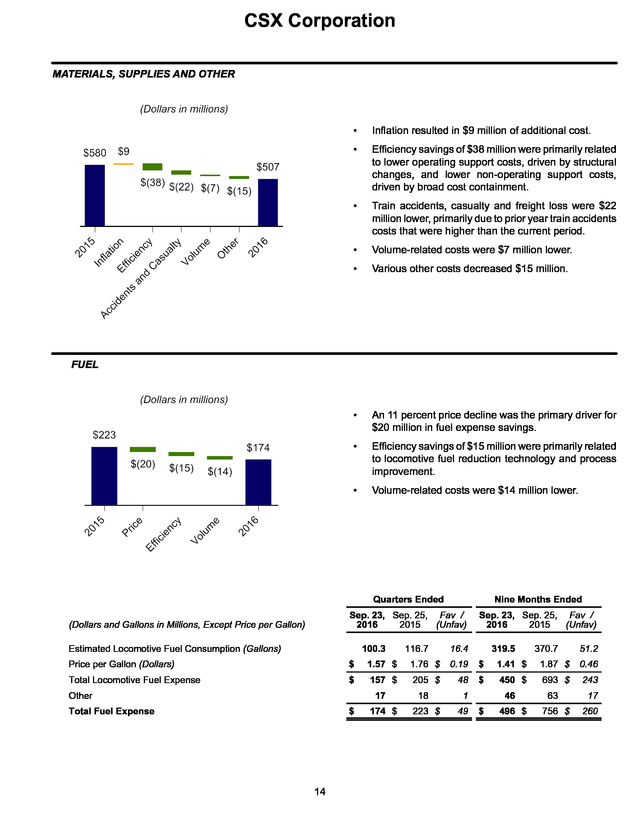
23, 2016 Sep. 25, 2015 $ Change . CSX Corporation EXPENSE Expenses of $1.9 billion decreased $137 million, or 7 percent year over year, primarily driven by efficiency savings and lower volume-related costs. EXPENSE (Dollars in millions) LABOR AND FRINGE • Incentive compensation was $37 million higher reflecting the expected award payouts on existing plans. • Inflation resulted in $28 million of additional cost driven primarily by increased health and welfare costs. • Efficiency savings of $53 million were driven by lower operating support costs as a result of structural changes and reduced crew training. • Volume-related costs were $35 million lower. • Other costs decreased $2 million. EMPLOYEE COUNTS (Estimated) July 2016 27,132 2015 31,456 Change (4,324) August 27,022 30,793 (3,771) September 26,898 30,419 (3,521) Average 27,017 30,889 (3,872) 13 . CSX Corporation MATERIALS, SUPPLIES AND OTHER • Inflation resulted in $9 million of additional cost. • Efficiency savings of $38 million were primarily related to lower operating support costs, driven by structural changes, and lower non-operating support costs, driven by broad cost containment. • Train accidents, casualty and freight loss were $22 million lower, primarily due to prior year train accidents costs that were higher than the current period. • Volume-related costs were $7 million lower. • Various other costs decreased $15 million. • An 11 percent price decline was the primary driver for $20 million in fuel expense savings. • Efficiency savings of $15 million were primarily related to locomotive fuel reduction technology and process improvement. • Volume-related costs were $14 million lower. FUEL Quarters Ended (Dollars and Gallons in Millions, Except Price per Gallon) Nine Months Ended Sep. 23, Sep. 25, Fav / 2016 2015 (Unfav) Sep. 23, Sep.
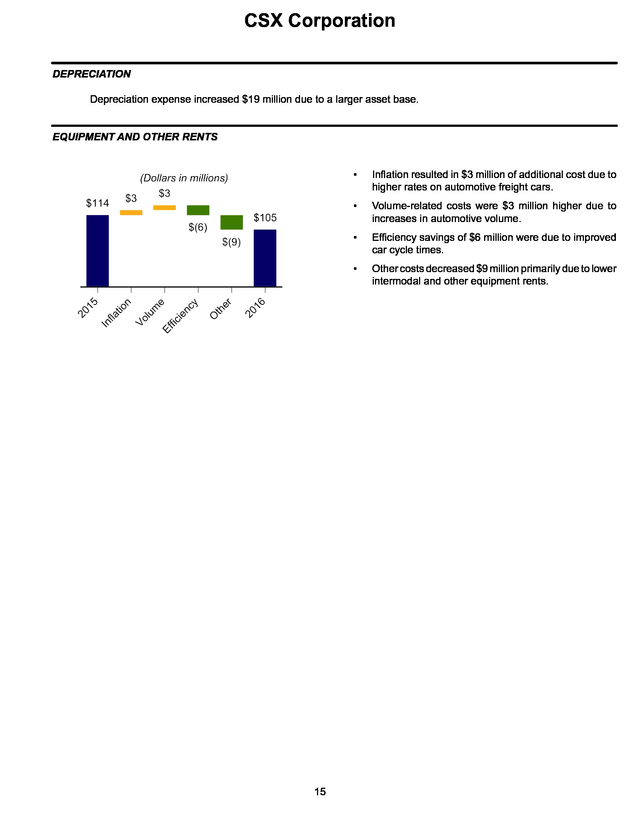
25, Fav / 2016 2015 (Unfav) Estimated Locomotive Fuel Consumption (Gallons) 100.3 116.7 16.4 319.5 370.7 51.2 Price per Gallon (Dollars) $ 1.57 $ 1.76 $ 0.19 $ 1.41 $ 1.87 $ 0.46 Total Locomotive Fuel Expense $ 157 $ 205 $ 48 $ 450 $ 693 $ 243 $ 174 $ $ 496 $ Other 17 Total Fuel Expense 14 18 223 $ 1 49 46 63 756 $ 17 260 . CSX Corporation DEPRECIATION Depreciation expense increased $19 million due to a larger asset base. EQUIPMENT AND OTHER RENTS • • Volume-related costs were $3 million higher due to increases in automotive volume. • Efficiency savings of $6 million were due to improved car cycle times. • 15 Inflation resulted in $3 million of additional cost due to higher rates on automotive freight cars. Other costs decreased $9 million primarily due to lower intermodal and other equipment rents. . CSX Corporation OPERATING STATISTICS (Estimated) TON MILES Quarters Ended Nine Months Ended Sep. 23, Sep. 25, Improvement / 2016 2015 (Deterioration) Sep. 23, Sep.
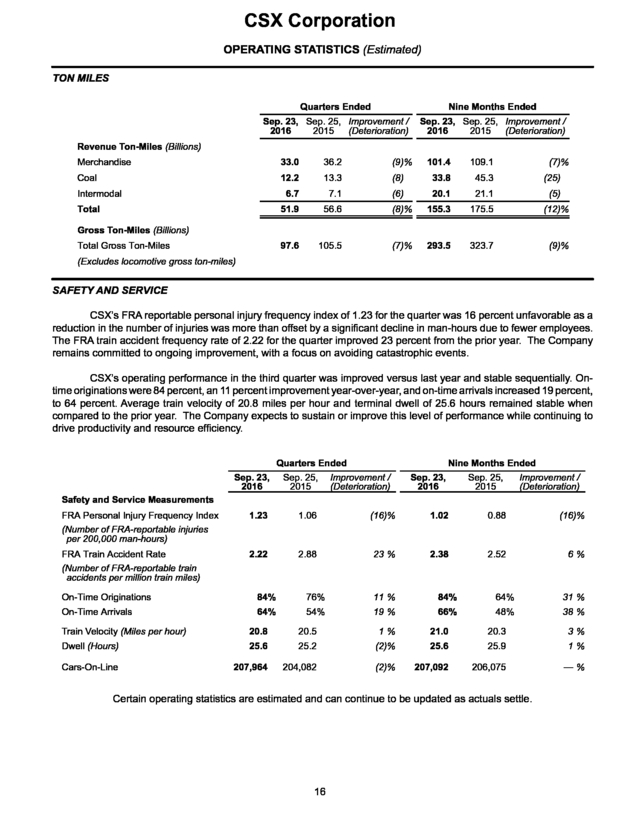
25, Improvement / 2016 2015 (Deterioration) Revenue Ton-Miles (Billions) Merchandise 33.0 36.2 (9)% Coal 12.2 13.3 (8) (6) Intermodal 101.4 109.1 33.8 (7)% 45.3 (25) 6.7 7.1 20.1 21.1 (5) 51.9 56.6 (8)% 155.3 175.5 (12)% 97.6 Total 105.5 (7)% 293.5 323.7 (9)% Gross Ton-Miles (Billions) Total Gross Ton-Miles (Excludes locomotive gross ton-miles) SAFETY AND SERVICE CSX’s FRA reportable personal injury frequency index of 1.23 for the quarter was 16 percent unfavorable as a reduction in the number of injuries was more than offset by a significant decline in man-hours due to fewer employees. The FRA train accident frequency rate of 2.22 for the quarter improved 23 percent from the prior year. The Company remains committed to ongoing improvement, with a focus on avoiding catastrophic events. CSX’s operating performance in the third quarter was improved versus last year and stable sequentially. Ontime originations were 84 percent, an 11 percent improvement year-over-year, and on-time arrivals increased 19 percent, to 64 percent.
Average train velocity of 20.8 miles per hour and terminal dwell of 25.6 hours remained stable when compared to the prior year. The Company expects to sustain or improve this level of performance while continuing to drive productivity and resource efficiency. Sep. 23, 2016 Quarters Ended Sep.
25, Improvement / 2015 (Deterioration) Sep. 23, 2016 Nine Months Ended Sep. 25, Improvement / 2015 (Deterioration) Safety and Service Measurements FRA Personal Injury Frequency Index (Number of FRA-reportable injuries per 200,000 man-hours) 1.23 1.06 (16)% 1.02 0.88 (16)% FRA Train Accident Rate (Number of FRA-reportable train accidents per million train miles) 2.22 2.88 23 % 2.38 2.52 6% On-Time Originations 84% 76% 11 % 84% 64% 31 % On-Time Arrivals 64% 54% 19 % 66% 48% 38 % Train Velocity (Miles per hour) 20.8 20.5 1% 21.0 20.3 3% Dwell (Hours) 25.6 25.2 (2)% 25.6 25.9 1% Cars-On-Line 207,964 204,082 (2)% 207,092 206,075 —% Certain operating statistics are estimated and can continue to be updated as actuals settle. 16 .
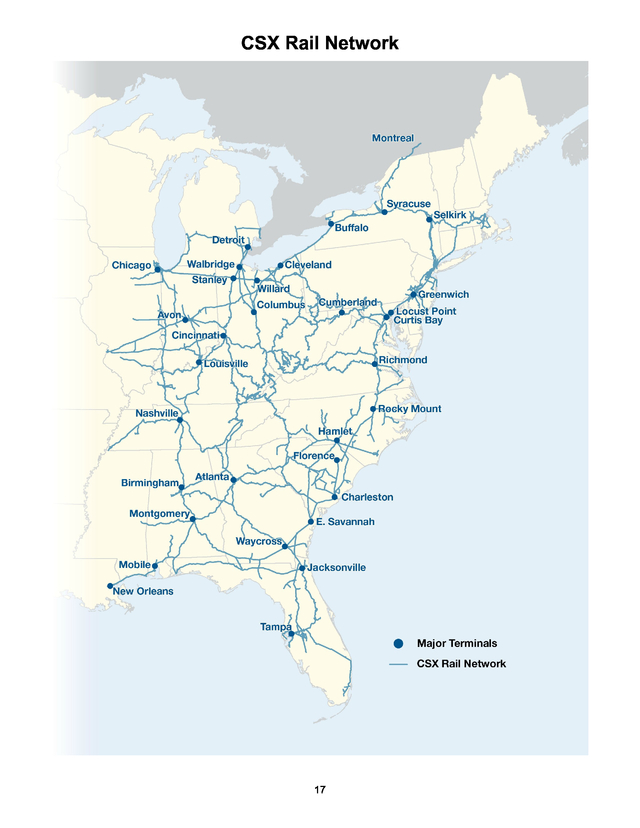
CSX Rail Network 17 .
At the same time, expenses improved 7 percent in the quarter, primarily driven by $112 million of efficiency gains and $53 million of volume-related cost reductions. As these cost savings partially offset the impact of lower volume and changing business mix, operating income declined 10 percent to $841 million and the operating ratio increased 70 basis points year-over-year to 69.0 percent. While the U.S. dollar strength and low global commodity prices persisted in the quarter, CSX is positioning itself to maximize shareholder value by leveraging network improvements, technology enhancements and superior service to capture growth opportunities and achieve a mid-60s operating ratio longer term. Table of Contents The accompanying unaudited CSX CORPORATION CONTACTS: financial information should be 500 Water Street, C900 Consolidated Financial Statements........p. 3 read in conjunction with the Jacksonville, FL 32202 INVESTOR RELATIONS Operating Statistics...............................p.
16 Company’s most recent www.csx.com David Baggs Network Map.........................................p. 17 Annual Report on Form 10-K, (904) 359-4812 Quarterly Reports on Form MEDIA 10-Q, and any Current Melanie Cost Reports on Form 8-K. (904) 359-1702 1 . CSX executives will conduct a quarterly earnings conference call with the investment community on October 13, 2016, from 8:30 a.m. to 9:30 a.m. Eastern time. Investors, media and the public may listen to the conference call by dialing 1-888-EARN-CSX (888-327-6279) and asking for the CSX earnings call.
Callers outside the U.S., dial 1-773-756-0199. Participants should dial in 10 minutes prior to the call. In conjunction with the call, a live webcast will be accessible and presentation materials will be posted on the company's website at http://investors.csx.com.
Following the earnings call, an internet replay of the presentation will be archived on the company website. This earnings announcement, as well as additional detailed financial information, is contained in the CSX Quarterly Financial Report available through the company’s website at http://investors.csx.com and on Form 8-K with the Securities and Exchange Commission. About CSX and its Disclosures CSX, based in Jacksonville, Florida, is a premier transportation company. It provides rail, intermodal and rail-to-truck transload services and solutions to customers across a broad array of markets, including energy, industrial, construction, agricultural, and consumer products. For nearly 190 years, CSX has played a critical role in the nation's economic expansion and industrial development.
Its network connects every major metropolitan area in the eastern United States, where nearly two-thirds of the nation's population resides. It also links more than 240 short-line railroads and more than 70 ocean, river and lake ports with major population centers and farming towns alike. This announcement, as well as additional financial information, is available on the company's website at http://investors.csx.com. CSX also uses social media channels to communicate information about the company. Although social media channels are not intended to be the primary method of disclosure for material information, it is possible that certain information CSX posts on social media could be deemed to be material.
Therefore, we encourage investors, the media, and others interested in the company to review the information we post on Twitter (http://twitter.com/CSX) and on Slideshare (http://www.slideshare.net/HowTomorrowMoves). The social media channels used by CSX may be updated from time to time. More information about CSX Corporation and its subsidiaries is available at www.csx.com and on Facebook (http:// www.facebook.com/OfficialCSX). Forward-looking Statements This information and other statements by the company may contain forward-looking statements within the meaning of the Private Securities Litigation Reform Act with respect to, among other items: projections and estimates of earnings, revenues, margins, volumes, rates, cost-savings, expenses, taxes, liquidity, capital expenditures, dividends, share repurchases or other financial items, statements of management's plans, strategies and objectives for future operations, and management's expectations as to future performance and operations and the time by which objectives will be achieved, statements concerning proposed new services, and statements regarding future economic, industry or market conditions or performance. Forward-looking statements are typically identified by words or phrases such as “will,” “should,” “believe,” “expect,” “anticipate,” “project,” “estimate,” “preliminary” and similar expressions. Forward-looking statements speak only as of the date they are made, and the company undertakes no obligation to update or revise any forward-looking statement. If the company updates any forward-looking statement, no inference should be drawn that the company will make additional updates with respect to that statement or any other forward-looking statements. Forward-looking statements are subject to a number of risks and uncertainties, and actual performance or results could differ materially from that anticipated by any forward-looking statements.
Factors that may cause actual results to differ materially from those contemplated by any forwardlooking statements include, among others; (i) the company's success in implementing its financial and operational initiatives; (ii) changes in domestic or international economic, political or business conditions, including those affecting the transportation industry (such as the impact of industry competition, conditions, performance and consolidation); (iii) legislative or regulatory changes; (iv) the inherent business risks associated with safety and security; (v) the outcome of claims and litigation involving or affecting the company; (vi) natural events such as severe weather conditions or pandemic health crises; and (vii) the inherent uncertainty associated with projecting economic and business conditions. Other important assumptions and factors that could cause actual results to differ materially from those in the forward-looking statements are specified in the company's SEC reports, accessible on the SEC's website at www.sec.gov and the company's website at www.csx.com. 2 . CSX Corporation CONSOLIDATED INCOME STATEMENTS (Unaudited) (Dollars in millions, except per share amounts) Sep. 23, 2016 Revenue $ Expense Labor and Fringe Materials, Supplies and Other Fuel Depreciation Equipment and Other Rents Total Expense 2,710 Quarters Ended Sep. 25, $ 2015 Change $ 2,939 $ (229) Nine Months Ended Sep. 23, Sep.
25, $ % 2016 2015 Change Change % Change (8)% $ 8,032 $ 9,030 $ (998) (11)% 762 507 174 321 105 1,869 787 580 223 302 114 2,006 25 73 49 (19) 9 137 3 13 22 (6) 8 7 2,307 1,576 496 953 315 5,647 2,491 1,766 756 896 328 6,237 184 190 260 (57) 13 590 7 11 34 (6) 4 9 841 933 (92) (10) 2,385 2,793 (408) (15) Interest Expense Other Income - Net (a) Earnings Before Income Taxes (139) 13 715 (136) (3) 11 (84) (2) 550 (11) (423) 28 1,990 (404) 8 2,397 (19) 20 (407) (5) (250) (17) Income Tax Expense Net Earnings (260) 455 $ (292) 507 $ 32 (52) 11 (10)% $ (734) 1,256 $ (895) 1,502 $ 161 (246) 18 (16)% 69.0% 68.3% 70.3% 69.1% $ (0.20) (13)% Operating Income $ Operating Ratio Per Common Share Net Earnings Per Share, Assuming Dilution $ Average Shares Outstanding, Assuming Dilution (millions) Cash Dividends Paid Per Common Share 0.48 2 799 $ 943 $ 0.18 0.52 $ (0.04) (8)% $ 982 $ 1.32 $ 953 0.18 $ 3 0.54 1.52 987 $ 0.52 . CSX Corporation CONDENSED CONSOLIDATED BALANCE SHEETS (Dollars in millions) (Unaudited) Sep. 23, 2016 Dec. 25, 2015 ASSETS Cash and Cash Equivalents Short-term Investments Other Current Assets Properties - Net Investment in Affiliates and Other Companies Other Long-term Assets Total Assets $ $ 603 $ 152 1,408 30,782 1,433 303 34,681 $ 628 810 1,402 30,174 1,394 337 34,745 631 $ 1,632 9,888 9,505 1,355 23,011 20 1,932 10,515 9,179 1,431 23,077 11,670 34,681 $ 11,668 34,745 LIABILITIES AND SHAREHOLDERS' EQUITY Current Maturities of Long-term Debt Other Current Liabilities Long-term Debt Deferred Income Taxes Other Long-term Liabilities Total Liabilities $ Total Shareholders' Equity Total Liabilities and Shareholders' Equity $ Certain prior year data has been reclassified to conform to the current presentation. 4 . CSX Corporation CONDENSED CONSOLIDATED CASH FLOW STATEMENTS (Unaudited) (Dollars in millions) Nine Months Ended Sep. 23, Sep. 25, 2016 2015 OPERATING ACTIVITIES Net Earnings Depreciation Deferred Income Taxes Gains on Property Dispositions Other Operating Activities - Net Net Cash Provided by Operating Activities $ 1,256 $ 953 312 (4) (29) 2,488 1,502 896 82 (20) 52 2,512 INVESTING ACTIVITIES Property Additions Purchase of Short-term Investments Proceeds from Sales of Short-term Investments Proceeds from Property Dispositions Other Investing Activities Net Cash Used in Investing Activities (1,590) (410) 1,070 11 26 (893) (1,909) (1,170) 1,040 46 42 (1,951) FINANCING ACTIVITIES Long-term Debt Issued Long-term Debt Repaid Dividends Paid Shares Repurchased (b) Other Financing Activities - Net (c) Net Cash Used in Financing Activities — (19) (513) (778) (310) (1,620) 600 (228) (512) (546) (3) (689) Net Decrease in Cash and Cash Equivalents (25) (128) CASH AND CASH EQUIVALENTS Cash and Cash Equivalents at Beginning of Period Cash and Cash Equivalents at End of Period 628 603 $ 5 $ 669 541 . CSX Corporation NOTES TO CONSOLIDATED FINANCIAL STATEMENTS (Unaudited) Income Statement a) Other Income - Net: During the third quarter, other income increased $11 million primarily due to a prior year environmental cleanup cost related to non-operating activities that did not repeat in the current year, as well as miscellaneous income items. Cash Flow Statement b) Shares repurchased: During the third quarter and nine months ended of 2016 and 2015, the Company repurchased the following number of shares: Quarters Ended Sep. 23, 2016 Shares Repurchased (Millions) Cost of Shares (Dollars in millions) 10 $ 263 $ Nine Months Ended Sep. 25, 2015 Sep. 23, 2016 9 262 30 $ 778 $ Sep.
25, 2015 17 546 c) Other Financing Activities - Net: Includes payments of $307 million for locomotives which were purchased using seller financing in 2015. 6 . CSX Corporation VOLUME AND REVENUE (Unaudited) Volume (Thousands of units); Revenue (Dollars in millions); Revenue Per Unit (Dollars) Quarters Ended September 23, 2016 and September 25, 2015 2016 Agricultural Agricultural and Food Products (a) Fertilizers (a) Volume 2015 % Change 109 121 (10)% 72 71 Chemicals (a) 173 Automotive 115 2016 $ Revenue 2015 % Change 295 $ 321 (8)% 1 104 111 187 (7) 542 109 6 304 63 72 (13) Minerals (a) 86 87 Forest Products 68 73 Total Merchandise 686 Coal Intermodal Revenue Per Unit 2016 2015 % Change $ 2,706 $ 2,653 2% (6) 1,444 1,563 582 (7) 3,133 3,112 1 287 6 2,643 2,633 — 180 190 (5) 2,857 2,639 8 (1) 125 125 — 1,453 1,437 1 (7) 191 203 (6) 2,809 2,781 1 720 (5) 1,741 1,819 (4) 2,538 2,526 — 207 261 (21) 467 583 (20) 2,256 2,234 1 681 731 (7) 425 451 (6) 624 617 1 Other — — — 77 86 (10) — — — Total 1,574 1,712 (8) Industrial Metals and Equipment (a) Housing and Construction (8)% $ 2,710 $ 2,939 (8)% $ 1,722 $ 1,717 —% Nine Months Ended September 23, 2016 and September 25, 2015 2016 Agricultural Agricultural and Food Products (a) Fertilizers (a) Volume 2015 % Change 2016 $ Revenue 2015 % Change 925 $ 1,010 (8)% Revenue Per Unit 2016 2015 % Change 346 378 (8)% $ 2,673 $ 2,672 —% 220 227 (3) 345 369 (7) 1,568 1,626 (4) Chemicals (a) 520 550 (5) 1,622 1,736 (7) 3,119 3,156 (1) Automotive 349 330 6 907 867 5 2,599 2,627 (1) Metals and Equipment (a) 196 219 (11) 531 555 (4) 2,709 2,534 7 230 228 1 345 346 — 1,500 1,518 (1) Industrial Housing and Construction Minerals (a) Forest Products 204 220 (7) 572 603 (5) 2,804 2,741 2 2,065 2,152 (4) 5,247 5,486 (4) 2,541 2,549 — 602 845 (29) 1,282 1,851 (31) 2,130 2,191 (3) 2,053 2,109 (3) 1,249 1,316 (5) 608 624 (3) Other — — 254 377 (33) — — Total 4,720 5,106 Total Merchandise Coal Intermodal — (8)% $ 8,032 $ 9,030 (11)% $ 1,702 $ 1,769 — (4)% (a) At the beginning of the quarter, in order to better align markets with the Company's business strategy, changes were made in the categorization of certain lines of business. Prior periods have been reclassified to conform to the current presentation and are posted on the Company's website at csx.com under the investors section. • Agricultural and Food Products includes the combination of the previous Agricultural Products and Food and Consumer markets. • Fertilizers was previously named Phosphates and Fertilizers. • Metals and Equipment includes the Equipment portion of the previous Waste and Equipment market. • Chemicals includes the Waste portion of the previous Waste and Equipment market. Chemicals also includes fly ash for remediation purposes (a form of waste) which was previously included within the Minerals market. 7 . CSX Corporation VOLUME AND REVENUE Revenue was down by $229 million to $2.7 billion from the prior year's third quarter as volume declines and lower fuel surcharge revenue more than offset price gains. Same Store Sales Pricing Year-Over-Year Change % Change All-In 2.3% Merchandise and Intermodal 3.6% Revenue per unit was flat as pricing gains in the quarter were offset by lower fuel recoveries. Same store sales pricing increased across all markets with the exception of export coal. Same store sales is defined as customer shipments with the same commodity and car type, and the same origin and destination. MERCHANDISE Agricultural Sector Volume (Thousands of units); Revenue (Dollars in millions); Revenue Per Unit (Dollars) Volume Revenue Revenue Per Unit 2016 181 2015 % Change 192 (6) 2016 $ 2015 399 $ 432 % Change (8) 2016 2015 $ 2,204 $ 2,250 % Change (2) % of Carloads Agricultural and Food Products - Volume decline, primarily in grain products, reflected additional local truck sourcing to feed mills in lieu of longer-haul rail moves, spurred by a large southeastern crop. In addition, the strong U.S. dollar continued to support import grain as a supplement to domestic, rail-sourced grain. Fertilizers - Volume increased modestly, as robust demand in Brazil drove strength in export phosphates. This growth was partially offset as oversupply hampered nitrogen shipments leading to declines in domestic fertilizer. 8 .
CSX Corporation Industrial Sector Volume (Thousands of units); Revenue (Dollars in millions); Revenue Per Unit (Dollars) Volume 2016 351 2015 Revenue % Change 368 (5) 2016 2015 $ 1,026 $ 1,059 Revenue Per Unit % Change (3) 2016 2015 % Change $ 2,923 $ 2,878 2 % of Carloads Chemicals - Lower volume reflected ongoing difficulties in energy markets, specifically crude oil, in which economics are increasingly challenged for crude-by-rail to the East Coast. The continued ramp up of shipments of fly ash, a by-product of burning coal that requires environmental remediation and is now included in the realigned chemicals market, partially offset overall volume decline. Automotive - Volume increased as North American light vehicle production continued at a high level and CSX experienced growth across several key customers. Movement of trucks and SUV’s continued to outpace passenger cars, which was consistent with consumer buying patterns. Metals and Equipment - Volume declined as CSX continued to cycle mill closures and lower production levels at remaining mills brought on by persistent, aboveaverage import steel levels resulting from the strong U.S. dollar. Housing and Construction Sector Volume (Thousands of units); Revenue (Dollars in millions); Revenue Per Unit (Dollars) Volume Revenue Revenue Per Unit 2016 154 2015 % Change 160 (4) 2016 $ 2015 316 $ 328 % Change (4) 2016 2015 $ 2,052 $ 2,050 % Change — % of Carloads Forest Products - Volume declined in paper products due to continued industry consolidation, electronic substitution and near-term losses to truck as a result of excess capacity and low prices. Further, a strong U.S. dollar challenged exports and increased imports that do not generally move by rail. Minerals - Volume was down modestly, primarily as a result of reduced steel production, which hampered demand for lime, an input to steel making. However, aggregates movement continued at high levels, reflecting road and non-residential construction momentum, particularly in the south. 9 .
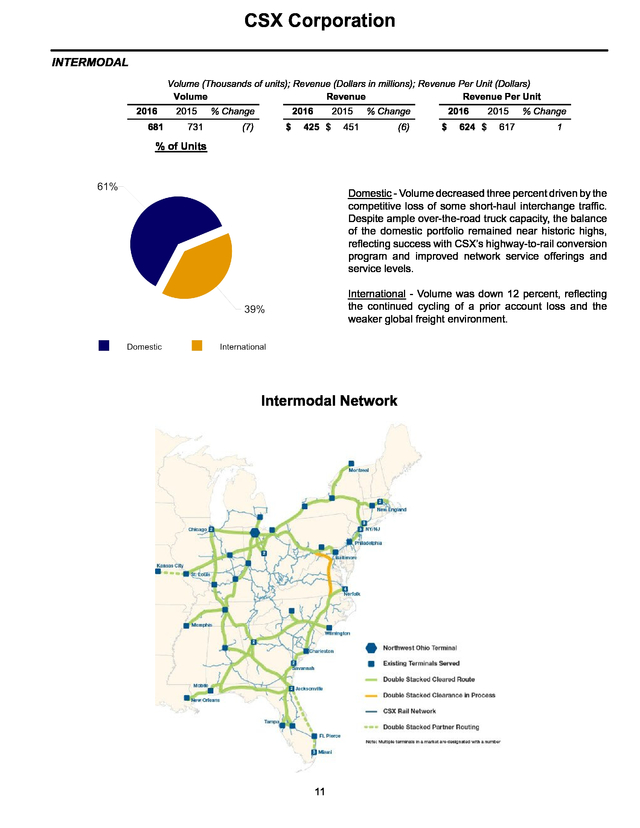
CSX Corporation COAL Volume (Thousands of units); Revenue (Dollars in millions); Revenue Per Unit (Dollars) Volume Revenue Revenue Per Unit 2016 207 2015 261 % Change (21) 2016 $ 2015 467 $ % Change 583 (20) 2016 2015 % Change $ 2,256 $ 2,234 1 % of Tons Domestic Utility Coal - Volume declines, though still significant, began to moderate as hot summer weather drove additional demand despite high coal inventories and low natural gas prices. Domestic Coke, Iron Ore and Other - Volumes remained weak in the face of an oversupplied coke market driven by continued softness in domestic integrated steel production and the idling of a customer facility. Export Coal - Volume was down due to oversupply in the world market and a strong U.S. dollar that continued to hinder U.S. producer competitiveness. However, both metallurgical and thermal benchmarks improved during the quarter such that the rate of volume decline became considerably less when compared to previous quarters. Quarters Ended Sep.
23, Sep. 25, 2016 2015 Nine Months Ended % Change Sep. 23, Sep.
25, 2016 2015 % Change (Millions of Tons) Domestic Utility (20)% 37.3 52.6 (29)% 6.5 (23) 14.4 18.9 (24) 18.4 23.3 (21) 51.7 71.5 (28) Metallurgical 4.1 4.3 (5) 13.0 15.3 (15) Thermal 1.5 2.3 (35) 4.8 9.5 (49) 5.6 6.6 (15) 17.8 24.8 (28) 24.0 29.9 (20)% 69.5 96.3 (28)% Coke, Iron Ore and Other Total Domestic 13.4 16.8 5.0 Export Total Export Total Coal 10 . CSX Corporation INTERMODAL Volume (Thousands of units); Revenue (Dollars in millions); Revenue Per Unit (Dollars) Volume Revenue Revenue Per Unit 2016 681 2015 731 % Change (7) 2016 $ 2015 425 $ % Change 451 (6) 2016 $ 624 $ 2015 617 % Change 1 % of Units Domestic - Volume decreased three percent driven by the competitive loss of some short-haul interchange traffic. Despite ample over-the-road truck capacity, the balance of the domestic portfolio remained near historic highs, reflecting success with CSX’s highway-to-rail conversion program and improved network service offerings and service levels. International - Volume was down 12 percent, reflecting the continued cycling of a prior account loss and the weaker global freight environment. Intermodal Network 11 . CSX Corporation FUEL SURCHARGE Fuel surcharge revenue is included in the individual markets detailed within the volume and revenue explanations above. Fuel lag is the estimated difference between highway diesel prices in the quarter and the prices used for fuel surcharge, which are generally on a two month lag. Quarters Ended Sep. 25, 2015 Nine Months Ended (Dollars in millions) Sep. 23, 2016 Fuel Surcharge Revenue $ 65 $ 128 $ (63) $ 153 $ 452 $ (299) Fuel Lag (Expense) Benefit $ (1) $ 18 $ (19) $ 7 $ 55 $ (48) 12 $ Change Sep.
23, 2016 Sep. 25, 2015 $ Change . CSX Corporation EXPENSE Expenses of $1.9 billion decreased $137 million, or 7 percent year over year, primarily driven by efficiency savings and lower volume-related costs. EXPENSE (Dollars in millions) LABOR AND FRINGE • Incentive compensation was $37 million higher reflecting the expected award payouts on existing plans. • Inflation resulted in $28 million of additional cost driven primarily by increased health and welfare costs. • Efficiency savings of $53 million were driven by lower operating support costs as a result of structural changes and reduced crew training. • Volume-related costs were $35 million lower. • Other costs decreased $2 million. EMPLOYEE COUNTS (Estimated) July 2016 27,132 2015 31,456 Change (4,324) August 27,022 30,793 (3,771) September 26,898 30,419 (3,521) Average 27,017 30,889 (3,872) 13 . CSX Corporation MATERIALS, SUPPLIES AND OTHER • Inflation resulted in $9 million of additional cost. • Efficiency savings of $38 million were primarily related to lower operating support costs, driven by structural changes, and lower non-operating support costs, driven by broad cost containment. • Train accidents, casualty and freight loss were $22 million lower, primarily due to prior year train accidents costs that were higher than the current period. • Volume-related costs were $7 million lower. • Various other costs decreased $15 million. • An 11 percent price decline was the primary driver for $20 million in fuel expense savings. • Efficiency savings of $15 million were primarily related to locomotive fuel reduction technology and process improvement. • Volume-related costs were $14 million lower. FUEL Quarters Ended (Dollars and Gallons in Millions, Except Price per Gallon) Nine Months Ended Sep. 23, Sep. 25, Fav / 2016 2015 (Unfav) Sep. 23, Sep.
25, Fav / 2016 2015 (Unfav) Estimated Locomotive Fuel Consumption (Gallons) 100.3 116.7 16.4 319.5 370.7 51.2 Price per Gallon (Dollars) $ 1.57 $ 1.76 $ 0.19 $ 1.41 $ 1.87 $ 0.46 Total Locomotive Fuel Expense $ 157 $ 205 $ 48 $ 450 $ 693 $ 243 $ 174 $ $ 496 $ Other 17 Total Fuel Expense 14 18 223 $ 1 49 46 63 756 $ 17 260 . CSX Corporation DEPRECIATION Depreciation expense increased $19 million due to a larger asset base. EQUIPMENT AND OTHER RENTS • • Volume-related costs were $3 million higher due to increases in automotive volume. • Efficiency savings of $6 million were due to improved car cycle times. • 15 Inflation resulted in $3 million of additional cost due to higher rates on automotive freight cars. Other costs decreased $9 million primarily due to lower intermodal and other equipment rents. . CSX Corporation OPERATING STATISTICS (Estimated) TON MILES Quarters Ended Nine Months Ended Sep. 23, Sep. 25, Improvement / 2016 2015 (Deterioration) Sep. 23, Sep.
25, Improvement / 2016 2015 (Deterioration) Revenue Ton-Miles (Billions) Merchandise 33.0 36.2 (9)% Coal 12.2 13.3 (8) (6) Intermodal 101.4 109.1 33.8 (7)% 45.3 (25) 6.7 7.1 20.1 21.1 (5) 51.9 56.6 (8)% 155.3 175.5 (12)% 97.6 Total 105.5 (7)% 293.5 323.7 (9)% Gross Ton-Miles (Billions) Total Gross Ton-Miles (Excludes locomotive gross ton-miles) SAFETY AND SERVICE CSX’s FRA reportable personal injury frequency index of 1.23 for the quarter was 16 percent unfavorable as a reduction in the number of injuries was more than offset by a significant decline in man-hours due to fewer employees. The FRA train accident frequency rate of 2.22 for the quarter improved 23 percent from the prior year. The Company remains committed to ongoing improvement, with a focus on avoiding catastrophic events. CSX’s operating performance in the third quarter was improved versus last year and stable sequentially. Ontime originations were 84 percent, an 11 percent improvement year-over-year, and on-time arrivals increased 19 percent, to 64 percent.
Average train velocity of 20.8 miles per hour and terminal dwell of 25.6 hours remained stable when compared to the prior year. The Company expects to sustain or improve this level of performance while continuing to drive productivity and resource efficiency. Sep. 23, 2016 Quarters Ended Sep.
25, Improvement / 2015 (Deterioration) Sep. 23, 2016 Nine Months Ended Sep. 25, Improvement / 2015 (Deterioration) Safety and Service Measurements FRA Personal Injury Frequency Index (Number of FRA-reportable injuries per 200,000 man-hours) 1.23 1.06 (16)% 1.02 0.88 (16)% FRA Train Accident Rate (Number of FRA-reportable train accidents per million train miles) 2.22 2.88 23 % 2.38 2.52 6% On-Time Originations 84% 76% 11 % 84% 64% 31 % On-Time Arrivals 64% 54% 19 % 66% 48% 38 % Train Velocity (Miles per hour) 20.8 20.5 1% 21.0 20.3 3% Dwell (Hours) 25.6 25.2 (2)% 25.6 25.9 1% Cars-On-Line 207,964 204,082 (2)% 207,092 206,075 —% Certain operating statistics are estimated and can continue to be updated as actuals settle. 16 .
CSX Rail Network 17 .


