Economic Perspectives 4th Quarter 2015 - January 12, 2016
Plante Moran Financial Advisors


Description
4th Quarter 2015
Economic Dashboard
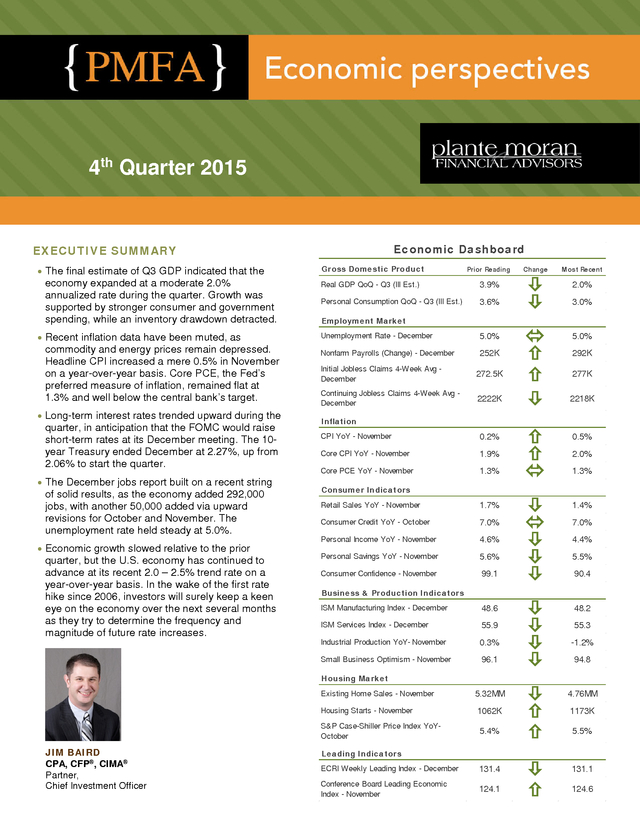
EXECUTIVE SUMMARY
• The final estimate of Q3 GDP indicated that the
economy expanded at a moderate 2.0%
annualized rate during the quarter. Growth was
supported by stronger consumer and government
spending, while an inventory drawdown detracted.
• Recent inflation data have been muted, as
commodity and energy prices remain depressed.
Headline CPI increased a mere 0.5% in November
on a year-over-year basis. Core PCE, the Fed’s
preferred measure of inflation, remained flat at
1.3% and well below the central bank’s target.
• Long-term interest rates trended upward during the
quarter, in anticipation that the FOMC would raise
short-term rates at its December meeting. The 10year Treasury ended December at 2.27%, up from
2.06% to start the quarter.
• The December jobs report built on a recent string
of solid results, as the economy added 292,000
jobs, with another 50,000 added via upward
revisions for October and November.
The unemployment rate held steady at 5.0%. • Economic growth slowed relative to the prior quarter, but the U.S. economy has continued to advance at its recent 2.0 – 2.5% trend rate on a year-over-year basis. In the wake of the first rate hike since 2006, investors will surely keep a keen eye on the economy over the next several months as they try to determine the frequency and magnitude of future rate increases. Gross Domestic Product Prior Reading Real GDP QoQ - Q3 (III Est.) 3.9% Personal Consumption QoQ - Q3 (III Est.) 3.6% Employment Market Unemployment Rate - December 5.0% Nonfarm Payrolls (Change) - December 252K Initial Jobless Claims 4-Week Avg December 272.5K Continuing Jobless Claims 4-Week Avg December 2222K Inflation CPI YoY - November 0.2% Core CPI YoY - November 1.9% Core PCE YoY - November 1.3% Consumer Indicators Retail Sales YoY - November 1.7% Consumer Credit YoY - October 7.0% Personal Income YoY - November 4.6% Personal Savings YoY - November 5.6% Consumer Confidence - November 99.1 Business & Production Indicators ISM Manufacturing Index - December 48.6 ISM Services Index - December 55.9 Industrial Production YoY- November 0.3% Small Business Optimism - November 96.1 Housing Market Existing Home Sales - November Housing Starts - November S&P Case-Shiller Price Index YoYOctober JIM BAIRD CPA, CFP®, CIMA® Partner, Chief Investment Officer 5.32MM 1062K 5.4% Leading Indicators ECRI Weekly Leading Index - December 131.4 Conference Board Leading Economic Index - November 124.1 Change                        Most Recent 2.0% 3.0% 5.0% 292K 277K 2218K 0.5% 2.0% 1.3% 1.4% 7.0% 4.4% 5.5% 90.4 48.2 55.3 -1.2% 94.8 4.76MM 1173K 5.5% 131.1 124.6 .
2 OVERVIEW “There is nothing wrong with change, if it is in the right direction.” – Winston Churchill In December, a key step toward a meaningful change in the direction of monetary policy was taken when the Fed raised short-term interest rates by 0.25% for the first time since 2006. While the rate hike was widely anticipated by economists and investors alike, it was a critical move toward normalization from the ultraaccommodative era in which interest rates were kept at effectively 0% for the past seven years. With the first rate hike now behind us, attention has shifted toward the timing and degree of future interest rate hikes. Currently, expectations are for a gradual pace of increase, with rates to remain low (relative to historical standards) for years to come. Ultimately, the decision to raise rates reflects the Fed’s view that “economic activity will continue to expand at a moderate pace and labor market indicators will continue to strengthen.” Although the U.S.
economy may not be growing at the same pace as in past expansions, economic momentum remains largely positive. Consumer confidence remains strong, supporting consumption 70 growth, the labor market is near (or perhaps at) full employment, and the housing market continues to show signs of strength. On the other hand, inflation remains below the Fed’s target, held in check by falling energy costs, and recent manufacturing data have been weak. Against this backdrop, the Fed is faced with the difficult task of normalizing interest rates without jeopardizing the current expansion. Globally, another shift has been occurring, the transition from exportdriven growth to consumer-driven growth for a number of emerging market economies.
This trend helps to explain the slowing growth in emerging economies, such as China, where a fast-growing middle class has emerged and begun spending While monetary policy can change in money on things such as healthcare, one day, the effect of any change is entertainment, and education, while not fully absorbed by the economy the manufacturing sector has for several quarters. Other changes weakened. This transition can create may transpire over multiple years or transitory hurdles to growth, but is even decades.
For example, the U.S. expected to be a long-term positive economy has become increasingly for the global economy. driven by the services sector, while Overall, the recent rate hike serves manufacturing has become less as a vote of confidence that the U.S. impactful. From 1970 to 2014, economy is on solid footing, though manufacturing as a component of much of the rest of the developed U.S.
GDP fell from roughly 23% to world is still lagging, as key central just 12%. Although recent banks abroad continue to ease manufacturing surveys have policy. Recognizing that the Fed’s delivered soft readings (as the chart actions have a lagged and gradual below illustrates), the services sector effect, policy makers must take has held solidly in expansionary calculated risks, and make territory.
While the recent contraction assumptions about the direction of within the manufacturing sector has the economy. As the Goldilocks created some concern, environment of moderate economic manufacturing’s shrinking growth and tame inflation persists, contribution to the U.S. economy the Fed clearly expects continued should help alleviate concerns of an progress beyond the near term. MANUFACTURING VS.
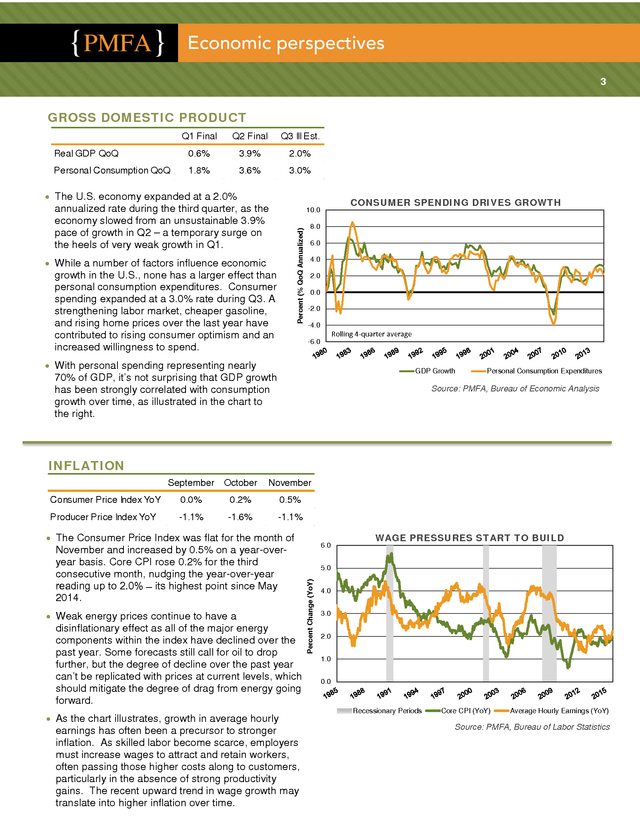
NONMANUFACTURING: A TWOSPEED ECONOMY 65 60 Index Level impending recession – particularly given the relative strength of the services sector. 55 INSIGHTS Throughout much of 2015, there has been a growing divergence between the economic health of the manufacturing and services sectors of the economy. While the services sector remains squarely in expansionary territory, recent ISM readings suggest the manufacturing sector has begun to contract. 50 45 40 35 30 Recession ISM Services Index ISM Manufacturing Index Source: PMFA, Institute for Supply Management While a contractionary reading (below 50) in the ISM Manufacturing Index has typically occurred during past recessions, it also commonly accompanies a typical mid-cycle slowdown (as noted three prior times in the past two expansions). Furthermore, strong readings from the services sector paint a more positive picture, as services tend to hold up better during such slowdowns and represents a much larger part of the overall economy. .
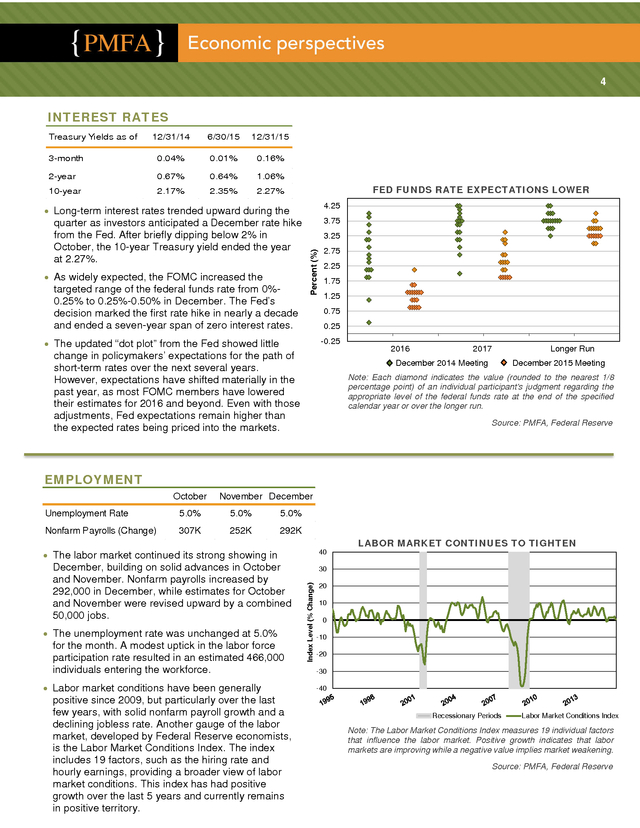
3 GROSS DOMESTIC PRODUCT Q1 Final Q2 Final Q3 III Est. Real GDP QoQ 0.6% 3.9% 2.0% Personal Consumption QoQ 1.8% 3.6% 3.0% • The U.S. economy expanded at a 2.0% annualized rate during the third quarter, as the economy slowed from an unsustainable 3.9% pace of growth in Q2 – a temporary surge on the heels of very weak growth in Q1. CONSUMER SPENDING DRIVES GROWTH Percent (% QoQ Annualized) 10.0 • While a number of factors influence economic growth in the U.S., none has a larger effect than personal consumption expenditures. Consumer spending expanded at a 3.0% rate during Q3. A strengthening labor market, cheaper gasoline, and rising home prices over the last year have contributed to rising consumer optimism and an increased willingness to spend. 8.0 6.0 4.0 2.0 0.0 -2.0 -4.0 Rolling 4-quarter average -6.0 • With personal spending representing nearly GDP Growth 70% of GDP, it’s not surprising that GDP growth has been strongly correlated with consumption growth over time, as illustrated in the chart to the right. Personal Consumption Expenditures Source: PMFA, Bureau of Economic Analysis INFLATION September October November Consumer Price Index YoY 0.0% 0.2% 0.5% Producer Price Index YoY -1.1% -1.6% -1.1% • The Consumer Price Index was flat for the month of • Weak energy prices continue to have a disinflationary effect as all of the major energy components within the index have declined over the past year.
Some forecasts still call for oil to drop further, but the degree of decline over the past year can’t be replicated with prices at current levels, which should mitigate the degree of drag from energy going forward. • As the chart illustrates, growth in average hourly earnings has often been a precursor to stronger inflation. As skilled labor become scarce, employers must increase wages to attract and retain workers, often passing those higher costs along to customers, particularly in the absence of strong productivity gains. The recent upward trend in wage growth may translate into higher inflation over time. 6.0 WAGE PRESSURES START TO BUILD 5.0 Percent Change (YoY) November and increased by 0.5% on a year-overyear basis.
Core CPI rose 0.2% for the third consecutive month, nudging the year-over-year reading up to 2.0% ̶ its highest point since May 2014. T 4.0 3.0 2.0 1.0 0.0 Recessionary Periods Core CPI (YoY) Average Hourly Earnings (YoY) Source: PMFA, Bureau of Labor Statistics . 4 INTEREST RATES 12/31/14 6/30/15 12/31/15 3-month 0.04% 0.01% 0.16% 2-year 0.67% 0.64% 1.06% 10-year 2.17% 2.35% 2.27% Treasury Yields as of FED FUNDS RATE EXPECTATIONS LOWER 4.25 • Long-term interest rates trended upward during the • As widely expected, the FOMC increased the targeted range of the federal funds rate from 0%0.25% to 0.25%-0.50% in December. The Fed’s decision marked the first rate hike in nearly a decade and ended a seven-year span of zero interest rates. 3.75 3.25 Percent (%) quarter as investors anticipated a December rate hike from the Fed. After briefly dipping below 2% in October, the 10-year Treasury yield ended the year at 2.27%. 2.75 2.25 1.75 1.25 0.75 0.25 • The updated “dot plot” from the Fed showed little -0.25 change in policymakers’ expectations for the path of short-term rates over the next several years. However, expectations have shifted materially in the past year, as most FOMC members have lowered their estimates for 2016 and beyond. Even with those adjustments, Fed expectations remain higher than the expected rates being priced into the markets. 2016 2017 December 2014 Meeting Longer Run December 2015 Meeting Note: Each diamond indicates the value (rounded to the nearest 1/8 percentage point) of an individual participant’s judgment regarding the appropriate level of the federal funds rate at the end of the specified calendar year or over the longer run. Source: PMFA, Federal Reserve EMPLOYMENT October November December Unemployment Rate 5.0% 5.0% 5.0% Nonfarm Payrolls (Change) 307K 252K 292K • The labor market continued its strong showing in • The unemployment rate was unchanged at 5.0% for the month.
A modest uptick in the labor force participation rate resulted in an estimated 466,000 individuals entering the workforce. • Labor market conditions have been generally positive since 2009, but particularly over the last few years, with solid nonfarm payroll growth and a declining jobless rate. Another gauge of the labor market, developed by Federal Reserve economists, is the Labor Market Conditions Index. The index includes 19 factors, such as the hiring rate and hourly earnings, providing a broader view of labor market conditions.
This index has had positive growth over the last 5 years and currently remains in positive territory. LABOR MARKET CONTINUES TO TIGHTEN 30 Index Level (% Change) December, building on solid advances in October and November. Nonfarm payrolls increased by 292,000 in December, while estimates for October and November were revised upward by a combined 50,000 jobs. 40 20 10 0 -10 -20 -30 -40 Recessionary Periods Labor Market Conditions Index Note: The Labor Market Conditions Index measures 19 individual factors that influence the labor market. Positive growth indicates that labor markets are improving while a negative value implies market weakening. Source: PMFA, Federal Reserve .
5 Past performance does not guarantee future results. All investments include risk and have the potential for loss as well as gain. Data sources for peer group comparisons, returns, and standard statistical data are provided by the sources referenced and are based on data obtained from recognized statistical services or other sources believed to be reliable. However, some or all information has not been verified prior to the analysis, and we do not make any representations as to its accuracy or completeness. Any analysis nonfactual in nature constitutes only current opinions, which are subject to change.
Benchmarks or indices are included for information purposes only to reflect the current market environment; no index is a directly tradable investment. There may be instances when consultant opinions regarding any fundamental or quantitative analysis may not agree. Sources for the Economic Dashboard include PMFA, Bureau of Economic Analysis (BEA), Bureau of Labor Statistics (BLS), U.S. Department of Labor, U.S.
Census Bureau, Federal Reserve, The Conference Board, Institute for Supply Management (ISM), National Federation of Independent Business (NFIB), U.S. Department of Housing and Urban Development, National Association of Realtors, Standard & Poor’s (S&P), and the Economic Cycle Research Institute (ECRI). Plante Moran Financial Advisors (PMFA) publishes this update to convey general information about market conditions and not for the purpose of providing investment advice. Investment in any of the companies or sectors mentioned herein may not be appropriate for you.
You should consult a representative from PMFA for investment advice regarding your own situation. .
The unemployment rate held steady at 5.0%. • Economic growth slowed relative to the prior quarter, but the U.S. economy has continued to advance at its recent 2.0 – 2.5% trend rate on a year-over-year basis. In the wake of the first rate hike since 2006, investors will surely keep a keen eye on the economy over the next several months as they try to determine the frequency and magnitude of future rate increases. Gross Domestic Product Prior Reading Real GDP QoQ - Q3 (III Est.) 3.9% Personal Consumption QoQ - Q3 (III Est.) 3.6% Employment Market Unemployment Rate - December 5.0% Nonfarm Payrolls (Change) - December 252K Initial Jobless Claims 4-Week Avg December 272.5K Continuing Jobless Claims 4-Week Avg December 2222K Inflation CPI YoY - November 0.2% Core CPI YoY - November 1.9% Core PCE YoY - November 1.3% Consumer Indicators Retail Sales YoY - November 1.7% Consumer Credit YoY - October 7.0% Personal Income YoY - November 4.6% Personal Savings YoY - November 5.6% Consumer Confidence - November 99.1 Business & Production Indicators ISM Manufacturing Index - December 48.6 ISM Services Index - December 55.9 Industrial Production YoY- November 0.3% Small Business Optimism - November 96.1 Housing Market Existing Home Sales - November Housing Starts - November S&P Case-Shiller Price Index YoYOctober JIM BAIRD CPA, CFP®, CIMA® Partner, Chief Investment Officer 5.32MM 1062K 5.4% Leading Indicators ECRI Weekly Leading Index - December 131.4 Conference Board Leading Economic Index - November 124.1 Change                        Most Recent 2.0% 3.0% 5.0% 292K 277K 2218K 0.5% 2.0% 1.3% 1.4% 7.0% 4.4% 5.5% 90.4 48.2 55.3 -1.2% 94.8 4.76MM 1173K 5.5% 131.1 124.6 .
2 OVERVIEW “There is nothing wrong with change, if it is in the right direction.” – Winston Churchill In December, a key step toward a meaningful change in the direction of monetary policy was taken when the Fed raised short-term interest rates by 0.25% for the first time since 2006. While the rate hike was widely anticipated by economists and investors alike, it was a critical move toward normalization from the ultraaccommodative era in which interest rates were kept at effectively 0% for the past seven years. With the first rate hike now behind us, attention has shifted toward the timing and degree of future interest rate hikes. Currently, expectations are for a gradual pace of increase, with rates to remain low (relative to historical standards) for years to come. Ultimately, the decision to raise rates reflects the Fed’s view that “economic activity will continue to expand at a moderate pace and labor market indicators will continue to strengthen.” Although the U.S.
economy may not be growing at the same pace as in past expansions, economic momentum remains largely positive. Consumer confidence remains strong, supporting consumption 70 growth, the labor market is near (or perhaps at) full employment, and the housing market continues to show signs of strength. On the other hand, inflation remains below the Fed’s target, held in check by falling energy costs, and recent manufacturing data have been weak. Against this backdrop, the Fed is faced with the difficult task of normalizing interest rates without jeopardizing the current expansion. Globally, another shift has been occurring, the transition from exportdriven growth to consumer-driven growth for a number of emerging market economies.
This trend helps to explain the slowing growth in emerging economies, such as China, where a fast-growing middle class has emerged and begun spending While monetary policy can change in money on things such as healthcare, one day, the effect of any change is entertainment, and education, while not fully absorbed by the economy the manufacturing sector has for several quarters. Other changes weakened. This transition can create may transpire over multiple years or transitory hurdles to growth, but is even decades.
For example, the U.S. expected to be a long-term positive economy has become increasingly for the global economy. driven by the services sector, while Overall, the recent rate hike serves manufacturing has become less as a vote of confidence that the U.S. impactful. From 1970 to 2014, economy is on solid footing, though manufacturing as a component of much of the rest of the developed U.S.
GDP fell from roughly 23% to world is still lagging, as key central just 12%. Although recent banks abroad continue to ease manufacturing surveys have policy. Recognizing that the Fed’s delivered soft readings (as the chart actions have a lagged and gradual below illustrates), the services sector effect, policy makers must take has held solidly in expansionary calculated risks, and make territory.
While the recent contraction assumptions about the direction of within the manufacturing sector has the economy. As the Goldilocks created some concern, environment of moderate economic manufacturing’s shrinking growth and tame inflation persists, contribution to the U.S. economy the Fed clearly expects continued should help alleviate concerns of an progress beyond the near term. MANUFACTURING VS.
NONMANUFACTURING: A TWOSPEED ECONOMY 65 60 Index Level impending recession – particularly given the relative strength of the services sector. 55 INSIGHTS Throughout much of 2015, there has been a growing divergence between the economic health of the manufacturing and services sectors of the economy. While the services sector remains squarely in expansionary territory, recent ISM readings suggest the manufacturing sector has begun to contract. 50 45 40 35 30 Recession ISM Services Index ISM Manufacturing Index Source: PMFA, Institute for Supply Management While a contractionary reading (below 50) in the ISM Manufacturing Index has typically occurred during past recessions, it also commonly accompanies a typical mid-cycle slowdown (as noted three prior times in the past two expansions). Furthermore, strong readings from the services sector paint a more positive picture, as services tend to hold up better during such slowdowns and represents a much larger part of the overall economy. .
3 GROSS DOMESTIC PRODUCT Q1 Final Q2 Final Q3 III Est. Real GDP QoQ 0.6% 3.9% 2.0% Personal Consumption QoQ 1.8% 3.6% 3.0% • The U.S. economy expanded at a 2.0% annualized rate during the third quarter, as the economy slowed from an unsustainable 3.9% pace of growth in Q2 – a temporary surge on the heels of very weak growth in Q1. CONSUMER SPENDING DRIVES GROWTH Percent (% QoQ Annualized) 10.0 • While a number of factors influence economic growth in the U.S., none has a larger effect than personal consumption expenditures. Consumer spending expanded at a 3.0% rate during Q3. A strengthening labor market, cheaper gasoline, and rising home prices over the last year have contributed to rising consumer optimism and an increased willingness to spend. 8.0 6.0 4.0 2.0 0.0 -2.0 -4.0 Rolling 4-quarter average -6.0 • With personal spending representing nearly GDP Growth 70% of GDP, it’s not surprising that GDP growth has been strongly correlated with consumption growth over time, as illustrated in the chart to the right. Personal Consumption Expenditures Source: PMFA, Bureau of Economic Analysis INFLATION September October November Consumer Price Index YoY 0.0% 0.2% 0.5% Producer Price Index YoY -1.1% -1.6% -1.1% • The Consumer Price Index was flat for the month of • Weak energy prices continue to have a disinflationary effect as all of the major energy components within the index have declined over the past year.
Some forecasts still call for oil to drop further, but the degree of decline over the past year can’t be replicated with prices at current levels, which should mitigate the degree of drag from energy going forward. • As the chart illustrates, growth in average hourly earnings has often been a precursor to stronger inflation. As skilled labor become scarce, employers must increase wages to attract and retain workers, often passing those higher costs along to customers, particularly in the absence of strong productivity gains. The recent upward trend in wage growth may translate into higher inflation over time. 6.0 WAGE PRESSURES START TO BUILD 5.0 Percent Change (YoY) November and increased by 0.5% on a year-overyear basis.
Core CPI rose 0.2% for the third consecutive month, nudging the year-over-year reading up to 2.0% ̶ its highest point since May 2014. T 4.0 3.0 2.0 1.0 0.0 Recessionary Periods Core CPI (YoY) Average Hourly Earnings (YoY) Source: PMFA, Bureau of Labor Statistics . 4 INTEREST RATES 12/31/14 6/30/15 12/31/15 3-month 0.04% 0.01% 0.16% 2-year 0.67% 0.64% 1.06% 10-year 2.17% 2.35% 2.27% Treasury Yields as of FED FUNDS RATE EXPECTATIONS LOWER 4.25 • Long-term interest rates trended upward during the • As widely expected, the FOMC increased the targeted range of the federal funds rate from 0%0.25% to 0.25%-0.50% in December. The Fed’s decision marked the first rate hike in nearly a decade and ended a seven-year span of zero interest rates. 3.75 3.25 Percent (%) quarter as investors anticipated a December rate hike from the Fed. After briefly dipping below 2% in October, the 10-year Treasury yield ended the year at 2.27%. 2.75 2.25 1.75 1.25 0.75 0.25 • The updated “dot plot” from the Fed showed little -0.25 change in policymakers’ expectations for the path of short-term rates over the next several years. However, expectations have shifted materially in the past year, as most FOMC members have lowered their estimates for 2016 and beyond. Even with those adjustments, Fed expectations remain higher than the expected rates being priced into the markets. 2016 2017 December 2014 Meeting Longer Run December 2015 Meeting Note: Each diamond indicates the value (rounded to the nearest 1/8 percentage point) of an individual participant’s judgment regarding the appropriate level of the federal funds rate at the end of the specified calendar year or over the longer run. Source: PMFA, Federal Reserve EMPLOYMENT October November December Unemployment Rate 5.0% 5.0% 5.0% Nonfarm Payrolls (Change) 307K 252K 292K • The labor market continued its strong showing in • The unemployment rate was unchanged at 5.0% for the month.
A modest uptick in the labor force participation rate resulted in an estimated 466,000 individuals entering the workforce. • Labor market conditions have been generally positive since 2009, but particularly over the last few years, with solid nonfarm payroll growth and a declining jobless rate. Another gauge of the labor market, developed by Federal Reserve economists, is the Labor Market Conditions Index. The index includes 19 factors, such as the hiring rate and hourly earnings, providing a broader view of labor market conditions.
This index has had positive growth over the last 5 years and currently remains in positive territory. LABOR MARKET CONTINUES TO TIGHTEN 30 Index Level (% Change) December, building on solid advances in October and November. Nonfarm payrolls increased by 292,000 in December, while estimates for October and November were revised upward by a combined 50,000 jobs. 40 20 10 0 -10 -20 -30 -40 Recessionary Periods Labor Market Conditions Index Note: The Labor Market Conditions Index measures 19 individual factors that influence the labor market. Positive growth indicates that labor markets are improving while a negative value implies market weakening. Source: PMFA, Federal Reserve .
5 Past performance does not guarantee future results. All investments include risk and have the potential for loss as well as gain. Data sources for peer group comparisons, returns, and standard statistical data are provided by the sources referenced and are based on data obtained from recognized statistical services or other sources believed to be reliable. However, some or all information has not been verified prior to the analysis, and we do not make any representations as to its accuracy or completeness. Any analysis nonfactual in nature constitutes only current opinions, which are subject to change.
Benchmarks or indices are included for information purposes only to reflect the current market environment; no index is a directly tradable investment. There may be instances when consultant opinions regarding any fundamental or quantitative analysis may not agree. Sources for the Economic Dashboard include PMFA, Bureau of Economic Analysis (BEA), Bureau of Labor Statistics (BLS), U.S. Department of Labor, U.S.
Census Bureau, Federal Reserve, The Conference Board, Institute for Supply Management (ISM), National Federation of Independent Business (NFIB), U.S. Department of Housing and Urban Development, National Association of Realtors, Standard & Poor’s (S&P), and the Economic Cycle Research Institute (ECRI). Plante Moran Financial Advisors (PMFA) publishes this update to convey general information about market conditions and not for the purpose of providing investment advice. Investment in any of the companies or sectors mentioned herein may not be appropriate for you.
You should consult a representative from PMFA for investment advice regarding your own situation. .


