


Description
Research
The Great Myth of Credit
March 2014
“In the middle of every difficulty lies opportunity”
-Albert Einstein
Natalie N. Trevithick, CFA
Head of Investment Grade Credit
payden.com
LOS ANGELES | BOSTON | LONDON | PARIS
. Executive Summary:
• While both Global IG & HY credit have seen signiï¬cant spread tightening the past
two years, they are still trading near double their pre-crisis tights. Credit also looks
attractive when you consider the percentage that the spread component of a corporate
bond contributes to its total yield, which is well above its historical average.
• Despite Central Banks putting the brakes on quantitative easing, we do not believe
they were the key mechanism driving investors into credit during this move tighter.
Global investors are flush with cash and have seemingly insatiable demand for credit,
particularly from liability driven investors.
• Going forward, credit investors should want to see companies add leverage to their
balance sheets since this is what drives supply. Their best hope at being able to
reinvest future flows at more attractive yields is buying these credits at a concession
in the new issue market post a levering transaction.
The great myth of credit investing is that investors
want stable companies with improving balance sheets.
And this is largely what we have seen companies
try to achieve since the crisis. This brings us to a
catch-22: higher credit quality means accepting a
lower risk premium.
For the past two years investors have been chasing after corporate bonds across the capital structure even seeking out the once unseemly peripheral European “PIIGS”. This has resulted in significant spread compression across both global investment grade (IG) and high yield (HY) credit which tightened by 143bps and 384bps respectively during this two year period. Total returns have also Figure 1 Date 31/12/2008 31/12/2009 31/12/2010 31/12/2011 31/12/2012 31/12/2013 been positive since the financial crisis as evidenced in the table below.
Even in 2011 when fears of the dismantling of Europe roiled markets, the fall in global interest rates more than offset the spread widening. Then in 2013 when the tapering talk caused US, UK & European treasuries to spike higher, IG credit still eked out a small positive return of 0.05% while HY produced strong performance of 7.06%. Given these returns many are quick to posit that this credit boom was artificially created by Central Bank buying of fixed income securities creating a global asset shortage and pushing otherwise unwilling investors into credit. They fear that as we see an BofA Merrill Lynch Global (IG) Corporate Index Total Return -4.73 16.27 7.41 5.16 10.79 0.05 Index Spread 489 176 169 267 152 124 Spread Change on Year 329 -313 -7 98 -115 -28 Index Yield 6.95 4.39 3.89 3.97 2.55 2.98 BofA Merrill Lynch Global High Yield Index Total Return -27.10 60.62 15.21 3.14 18.77 7.06 Index Spread Change Spread on Year 1858 1280 666 -1192 555 -111 807 252 552 -255 423 -129 Index Yield 20.30 9.33 7.65 9.16 6.08 5.69 . end to quantitative easing and the once unstoppable balance sheet expansion that they may be left with no buyers of last resort. We do not believe that to be the case. Given an improving global developed market economy, low expected default rate, and a shortage of high quality assets, we do not foresee an end to investors’ demand for credit, at least for the next couple of years. Let’s start with the most obvious reason to own credit: valuations are still attractive. First off, they are compelling on a spread basis.
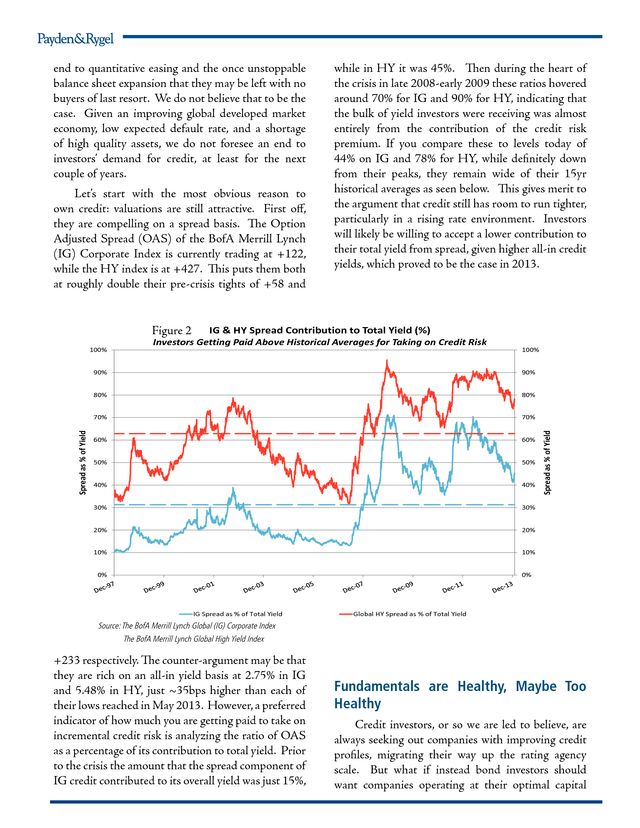
The Option Adjusted Spread (OAS) of the BofA Merrill Lynch (IG) Corporate Index is currently trading at +122, while the HY index is at +427. This puts them both at roughly double their pre-crisis tights of +58 and Figure 2 100% while in HY it was 45%. Then during the heart of the crisis in late 2008-early 2009 these ratios hovered around 70% for IG and 90% for HY, indicating that the bulk of yield investors were receiving was almost entirely from the contribution of the credit risk premium.
If you compare these to levels today of 44% on IG and 78% for HY, while definitely down from their peaks, they remain wide of their 15yr historical averages as seen below. This gives merit to the argument that credit still has room to run tighter, particularly in a rising rate environment. Investors will likely be willing to accept a lower contribution to their total yield from spread, given higher all-in credit yields, which proved to be the case in 2013. IG & HY Spread Contribution to Total Yield (%) Investors Getting Paid Above Historical Averages for Taking on Credit Risk 100% 80% 70% 70% 60% 60% 50% 50% 40% 40% 30% 30% 20% 20% 10% 10% 0% 0% IG Spread as % of Total Yield Spread as % of Yield 90% 80% Spread as % of Yield 90% Global HY Spread as % of Total Yield Source: The BofA Merrill Lynch Global (IG) Corporate Index The BofA Merrill Lynch Global High Yield Index +233 respectively.
The counter-argument may be that they are rich on an all-in yield basis at 2.75% in IG and 5.48% in HY, just ~35bps higher than each of their lows reached in May 2013. However, a preferred indicator of how much you are getting paid to take on incremental credit risk is analyzing the ratio of OAS as a percentage of its contribution to total yield. Prior to the crisis the amount that the spread component of IG credit contributed to its overall yield was just 15%, Fundamentals are Healthy, Maybe Too Healthy Credit investors, or so we are led to believe, are always seeking out companies with improving credit profiles, migrating their way up the rating agency scale.
But what if instead bond investors should want companies operating at their optimal capital . structure? This may involve higher leverage and being lower down on the ratings spectrum. And, this is in fact exactly what companies have been doing as the economy has rebounded from the crisis. From 2007 to today net leverage of non-financials has crept up from 1.4x to 1.7x for IG corporates. Not surprisingly, this was accompanied by a corresponding increase in the weighting of BBBs in the BofA Merrill Lynch Global Corporate Index to 42% today up from 25% in 2007.
Yet despite this decline in credit quality the average coupon cost for IG issuers to come to market with a new issue fell from 6.0% in 2007 to 3.3% currently according to J.P. Morgan research. This has resulted in interest expense becoming a much cheaper component of a company’s financing.
In addition, the incremental cost for a BBB credit to finance a new issue above that of an A rated credit typically falls somewhere in the 25-75bps range. Therefore this relatively minor incremental interest expense saving that could be achieved from defending an A rating may not be justified from a cost of equity perspective. In fact, what should be a bigger concern to investors today is investing in A rated credits with too much cash on hand since it may indicate an impending levering transaction. And if management is unwilling to give shareholders the returns they demand, activist investors are increasingly likely to step in and try to force the process.
Therefore investors shouldn’t focus on a company’s current leverage, but instead should think like an investment banker and consider possible transactions these companies are undoubtedly being pitched. Once the transformative event has taken place, then is the time to become involved as a credit investor, ideally on the back of a new issue that funds the transaction. An Economist article from Feb 15th 2014 on corporate governance lends support to this argument.
In it they cite a study done by Lucian Bebchuk and others of Harvard Law School on “The Long-Term Effects of Hedge-Fund Activism”, which found that not only did the stock performance improve of companies targeted by activist investors between the years 1994 to 2007, but so did their underlying operating performance which continued to get stronger during the 5 year horizon that was studied after the intervention took place. While higher leverage may be of greater concern if we felt we were entering a period of higher defaults, according to Moody’s Investor Services their baseline forecast is that global default rates will fall to 2.3% by the end of this year, down from 2.64% at the end of 2013. In an improving macroeconomic environment, investors should be comfortable allowing companies to operate with higher leverage given their confidence that their investment is money good. Particularly, if they believe they are getting adequately paid for the spread volatility on a risk adjusted basis even if the yield pick-up per unit of leverage ratio is lower than where it has been historically. With Europe apparently out of the woods and the US headed for a growth trajectory close to 3% this year, we expect the volume of merger and acquisition activity, spin-offs, share buybacks and higher dividend payouts to increase in the year ahead.
Private equity investors are also on the prowl. While we believe that LBO chatter will continue to pick-up, the actual number of these transactions will be low. While our typically pessimistic bondholder nature and memory of the credit crisis may be screaming at us to head for the hills, the value conscious investor inside of us should view all these potential leveraging transactions as an opportunity.
The reason for this is that most of these events tend to result in new supply, and that is still the best place for credit investors to derive value. Even last year’s Dell and Heinz LBOs provided investors with a great buying opportunity when they came to the Leveraged Loan market to fund these deals. That is provided you didn’t already have a significant position in their outstanding holdings. Another great example of how a company’s increase in leverage was beneficial to both the corporation and investors is looking at Verizon’s $49 bn bond transaction from last September.
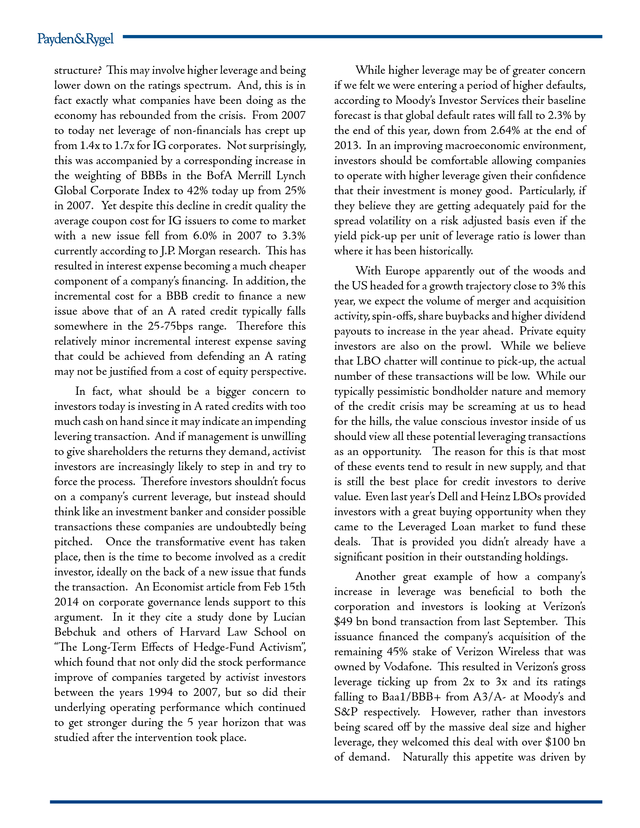
This issuance financed the company’s acquisition of the remaining 45% stake of Verizon Wireless that was owned by Vodafone. This resulted in Verizon’s gross leverage ticking up from 2x to 3x and its ratings falling to Baa1/BBB+ from A3/A- at Moody’s and S&P respectively. However, rather than investors being scared off by the massive deal size and higher leverage, they welcomed this deal with over $100 bn of demand.
Naturally this appetite was driven by . attractive pricing given the 10 year came with a coupon of 5.15% and a spread of 225bps over treasuries, which was over a 100bps concession to where existing Verizon 10 year notes were trading prior to the acquisition announcement, as evidenced in the spread history chart below. As an added bonus, bond spreads have since rallied by 75bps and are now trading at $108 given investors’ confidence in the long term health and viability of Verizon. 250 asset classes such as credit, but their balance sheets are no longer necessary. The world is still flush with cash and the real demand for corporates is driven by institutional investors, which is dominated by pension plans, insurance companies and sovereign wealth funds. In fact, rather than scare investors out of the bond market, rising rates are likely to attract a greater asset allocation from liability driven investors. Looking at Verizon's Secondary Bonds vs 10yr New Issue Figure 3 Leveraging Transactions are a Credit Investor's Best Friend Incremental VZ 10yr new issue concession 200 VZ secondary spread widening ahead of new issue 200 OAS 150 OAS 150 250 100 100 Chatter of possible VZ deal with VOD for Verizon Wireless Announcement of Verizon's VW acquisition Post deal spread tightening in both VZ old and new issues 50 50 0 0 Source: Barclays Capital VZ 2.45 11/01/2022 The demand picture for credit is also supportive of the asset class even if we were to see higher interest rates, which doesn’t seem to be playing out in 2014 despite the taper.
Headlines heralding the “great rotation out of bonds” have not proven correct and are unlikely to occur in the coming years. Looking at weekly fund flow data there tends to be a strong correlation of positive inflows into both equity and credit when there is a riskon sentiment. Perhaps more immediately on the heels of the credit crisis Central Bank buying of treasuries and mortgages pushed more investors into alternative VZ 5.15 09/15/2023 the funding status of pension plans can be an important indicator of where funds are likely to be invested.
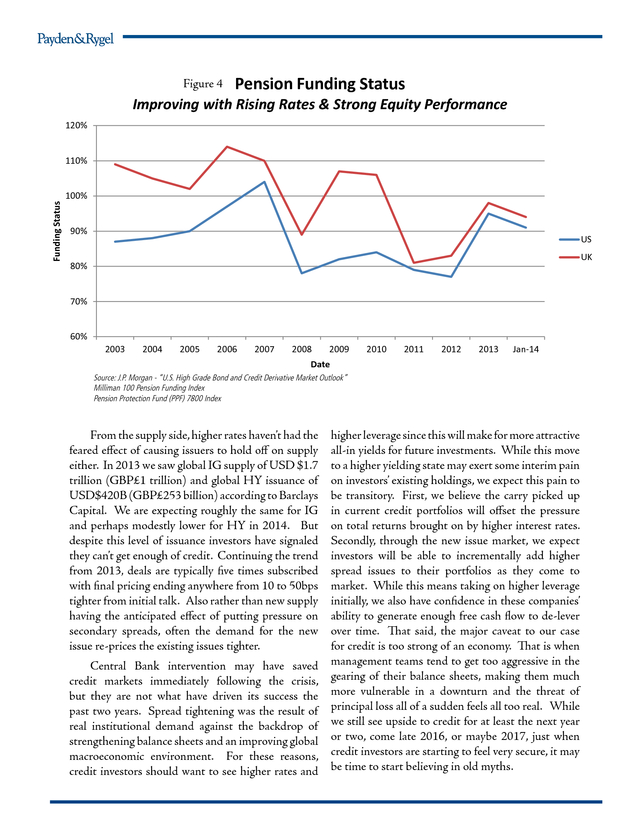
Strong equity performance in 2013 helped close the funding gap of US and UK pension funds as evidenced in the chart below. Also since projected benefit obligations fall when discount rates rise, investors are much more likely to increase their allocation to credit at higher allin yields. While a very quick and rapid rise in rates like we experienced last June may cause spreads to widen in the short-term, it really just serves to increase the attractiveness of the asset class in the longer term. .
Figure 4 Pension Funding Status Improving with Rising Rates & Strong Equity Performance 120% Funding Status 110% 100% 90% US UK 80% 70% 60% 2003 2004 2005 2006 2007 2008 2009 2010 2011 2012 2013 Jan-14 Date Source: J.P. Morgan - “U.S. High Grade Bond and Credit Derivative Market Outlook” Milliman 100 Pension Funding Index Pension Protection Fund (PPF) 7800 Index higher leverage since this will make for more attractive all-in yields for future investments. While this move to a higher yielding state may exert some interim pain on investors’ existing holdings, we expect this pain to be transitory.
First, we believe the carry picked up in current credit portfolios will offset the pressure on total returns brought on by higher interest rates. Secondly, through the new issue market, we expect investors will be able to incrementally add higher spread issues to their portfolios as they come to market. While this means taking on higher leverage initially, we also have confidence in these companies’ ability to generate enough free cash flow to de-lever over time. That said, the major caveat to our case for credit is too strong of an economy.
That is when Central Bank intervention may have saved management teams tend to get too aggressive in the credit markets immediately following the crisis, gearing of their balance sheets, making them much but they are not what have driven its success the more vulnerable in a downturn and the threat of past two years. Spread tightening was the result of principal loss all of a sudden feels all too real. While real institutional demand against the backdrop of we still see upside to credit for at least the next year strengthening balance sheets and an improving global or two, come late 2016, or maybe 2017, just when macroeconomic environment.
For these reasons, credit investors are starting to feel very secure, it may credit investors should want to see higher rates and be time to start believing in old myths. From the supply side, higher rates haven’t had the feared effect of causing issuers to hold off on supply either. In 2013 we saw global IG supply of USD $1.7 trillion (GBP£1 trillion) and global HY issuance of USD$420B (GBP£253 billion) according to Barclays Capital. We are expecting roughly the same for IG and perhaps modestly lower for HY in 2014.
But despite this level of issuance investors have signaled they can’t get enough of credit. Continuing the trend from 2013, deals are typically five times subscribed with final pricing ending anywhere from 10 to 50bps tighter from initial talk. Also rather than new supply having the anticipated effect of putting pressure on secondary spreads, often the demand for the new issue re-prices the existing issues tighter. .
Natalie N. Trevithick, CFA Senior Vice President 2012 – Joined Payden & Rygel Natalie Trevithick is a senior vice president and the lead strategist for investment-grade corporates at Payden & Rygel. Trevithick is responsible for managing corporate bond portfolios across a breadth of fixed-income strategies, including low duration, core and core plus, global, emerging markets and absolute return. Her experience also encompasses the use of derivatives such as interest rate and credit default swaps to manage risk and to develop customized investment solutions for corporate bond portfolios. Prior to joining Payden & Rygel, Trevithick spent six years at PIMCO in a similar capacity as a senior vice president and portfolio manager.
Prior to that, she worked at Barclays Capital as a sell-side trader in New York. Natalie Trevithick holds the Chartered Financial Analyst designation. She earned an MBA from the McCombs School of Business at the University of Texas, Austin. Trevithick earned a Bachelor of Commerce degree at Queen’s University in Kingston, Ontario. .
ESTd SEPT 12 1983 PAYDEN.COM DEDICATED MANDATES AND DUBLIN DOMICILED UCITS FUNDS These strategies and others are also available through separate account vehicles. EQUITY World Equity Fund FIXED INCOME Absolute Return Bond Fund Global Emerging Markets Bond Fund Global Emerging Markets Corporate Bond Fund Global Emerging Markets Local Bond Fund Global Government Bond Index Fund Global High Yield Bond Fund Global Inflation-Linked Bond Fund International Bond Fund International Short Bond Fund Sterling Corporate Bond Fund – Investment Grade US Core Bond Fund LIQUIDITY FUNDS Euro Liquidity – Enhanced Cash Fund Sterling Liquidity – Enhanced Cash Fund Sterling Reserve Fund US Dollar Liquidity – Enhanced Cash Fund .
For the past two years investors have been chasing after corporate bonds across the capital structure even seeking out the once unseemly peripheral European “PIIGS”. This has resulted in significant spread compression across both global investment grade (IG) and high yield (HY) credit which tightened by 143bps and 384bps respectively during this two year period. Total returns have also Figure 1 Date 31/12/2008 31/12/2009 31/12/2010 31/12/2011 31/12/2012 31/12/2013 been positive since the financial crisis as evidenced in the table below.
Even in 2011 when fears of the dismantling of Europe roiled markets, the fall in global interest rates more than offset the spread widening. Then in 2013 when the tapering talk caused US, UK & European treasuries to spike higher, IG credit still eked out a small positive return of 0.05% while HY produced strong performance of 7.06%. Given these returns many are quick to posit that this credit boom was artificially created by Central Bank buying of fixed income securities creating a global asset shortage and pushing otherwise unwilling investors into credit. They fear that as we see an BofA Merrill Lynch Global (IG) Corporate Index Total Return -4.73 16.27 7.41 5.16 10.79 0.05 Index Spread 489 176 169 267 152 124 Spread Change on Year 329 -313 -7 98 -115 -28 Index Yield 6.95 4.39 3.89 3.97 2.55 2.98 BofA Merrill Lynch Global High Yield Index Total Return -27.10 60.62 15.21 3.14 18.77 7.06 Index Spread Change Spread on Year 1858 1280 666 -1192 555 -111 807 252 552 -255 423 -129 Index Yield 20.30 9.33 7.65 9.16 6.08 5.69 . end to quantitative easing and the once unstoppable balance sheet expansion that they may be left with no buyers of last resort. We do not believe that to be the case. Given an improving global developed market economy, low expected default rate, and a shortage of high quality assets, we do not foresee an end to investors’ demand for credit, at least for the next couple of years. Let’s start with the most obvious reason to own credit: valuations are still attractive. First off, they are compelling on a spread basis.
The Option Adjusted Spread (OAS) of the BofA Merrill Lynch (IG) Corporate Index is currently trading at +122, while the HY index is at +427. This puts them both at roughly double their pre-crisis tights of +58 and Figure 2 100% while in HY it was 45%. Then during the heart of the crisis in late 2008-early 2009 these ratios hovered around 70% for IG and 90% for HY, indicating that the bulk of yield investors were receiving was almost entirely from the contribution of the credit risk premium.
If you compare these to levels today of 44% on IG and 78% for HY, while definitely down from their peaks, they remain wide of their 15yr historical averages as seen below. This gives merit to the argument that credit still has room to run tighter, particularly in a rising rate environment. Investors will likely be willing to accept a lower contribution to their total yield from spread, given higher all-in credit yields, which proved to be the case in 2013. IG & HY Spread Contribution to Total Yield (%) Investors Getting Paid Above Historical Averages for Taking on Credit Risk 100% 80% 70% 70% 60% 60% 50% 50% 40% 40% 30% 30% 20% 20% 10% 10% 0% 0% IG Spread as % of Total Yield Spread as % of Yield 90% 80% Spread as % of Yield 90% Global HY Spread as % of Total Yield Source: The BofA Merrill Lynch Global (IG) Corporate Index The BofA Merrill Lynch Global High Yield Index +233 respectively.
The counter-argument may be that they are rich on an all-in yield basis at 2.75% in IG and 5.48% in HY, just ~35bps higher than each of their lows reached in May 2013. However, a preferred indicator of how much you are getting paid to take on incremental credit risk is analyzing the ratio of OAS as a percentage of its contribution to total yield. Prior to the crisis the amount that the spread component of IG credit contributed to its overall yield was just 15%, Fundamentals are Healthy, Maybe Too Healthy Credit investors, or so we are led to believe, are always seeking out companies with improving credit profiles, migrating their way up the rating agency scale.
But what if instead bond investors should want companies operating at their optimal capital . structure? This may involve higher leverage and being lower down on the ratings spectrum. And, this is in fact exactly what companies have been doing as the economy has rebounded from the crisis. From 2007 to today net leverage of non-financials has crept up from 1.4x to 1.7x for IG corporates. Not surprisingly, this was accompanied by a corresponding increase in the weighting of BBBs in the BofA Merrill Lynch Global Corporate Index to 42% today up from 25% in 2007.
Yet despite this decline in credit quality the average coupon cost for IG issuers to come to market with a new issue fell from 6.0% in 2007 to 3.3% currently according to J.P. Morgan research. This has resulted in interest expense becoming a much cheaper component of a company’s financing.
In addition, the incremental cost for a BBB credit to finance a new issue above that of an A rated credit typically falls somewhere in the 25-75bps range. Therefore this relatively minor incremental interest expense saving that could be achieved from defending an A rating may not be justified from a cost of equity perspective. In fact, what should be a bigger concern to investors today is investing in A rated credits with too much cash on hand since it may indicate an impending levering transaction. And if management is unwilling to give shareholders the returns they demand, activist investors are increasingly likely to step in and try to force the process.
Therefore investors shouldn’t focus on a company’s current leverage, but instead should think like an investment banker and consider possible transactions these companies are undoubtedly being pitched. Once the transformative event has taken place, then is the time to become involved as a credit investor, ideally on the back of a new issue that funds the transaction. An Economist article from Feb 15th 2014 on corporate governance lends support to this argument.
In it they cite a study done by Lucian Bebchuk and others of Harvard Law School on “The Long-Term Effects of Hedge-Fund Activism”, which found that not only did the stock performance improve of companies targeted by activist investors between the years 1994 to 2007, but so did their underlying operating performance which continued to get stronger during the 5 year horizon that was studied after the intervention took place. While higher leverage may be of greater concern if we felt we were entering a period of higher defaults, according to Moody’s Investor Services their baseline forecast is that global default rates will fall to 2.3% by the end of this year, down from 2.64% at the end of 2013. In an improving macroeconomic environment, investors should be comfortable allowing companies to operate with higher leverage given their confidence that their investment is money good. Particularly, if they believe they are getting adequately paid for the spread volatility on a risk adjusted basis even if the yield pick-up per unit of leverage ratio is lower than where it has been historically. With Europe apparently out of the woods and the US headed for a growth trajectory close to 3% this year, we expect the volume of merger and acquisition activity, spin-offs, share buybacks and higher dividend payouts to increase in the year ahead.
Private equity investors are also on the prowl. While we believe that LBO chatter will continue to pick-up, the actual number of these transactions will be low. While our typically pessimistic bondholder nature and memory of the credit crisis may be screaming at us to head for the hills, the value conscious investor inside of us should view all these potential leveraging transactions as an opportunity.
The reason for this is that most of these events tend to result in new supply, and that is still the best place for credit investors to derive value. Even last year’s Dell and Heinz LBOs provided investors with a great buying opportunity when they came to the Leveraged Loan market to fund these deals. That is provided you didn’t already have a significant position in their outstanding holdings. Another great example of how a company’s increase in leverage was beneficial to both the corporation and investors is looking at Verizon’s $49 bn bond transaction from last September.
This issuance financed the company’s acquisition of the remaining 45% stake of Verizon Wireless that was owned by Vodafone. This resulted in Verizon’s gross leverage ticking up from 2x to 3x and its ratings falling to Baa1/BBB+ from A3/A- at Moody’s and S&P respectively. However, rather than investors being scared off by the massive deal size and higher leverage, they welcomed this deal with over $100 bn of demand.
Naturally this appetite was driven by . attractive pricing given the 10 year came with a coupon of 5.15% and a spread of 225bps over treasuries, which was over a 100bps concession to where existing Verizon 10 year notes were trading prior to the acquisition announcement, as evidenced in the spread history chart below. As an added bonus, bond spreads have since rallied by 75bps and are now trading at $108 given investors’ confidence in the long term health and viability of Verizon. 250 asset classes such as credit, but their balance sheets are no longer necessary. The world is still flush with cash and the real demand for corporates is driven by institutional investors, which is dominated by pension plans, insurance companies and sovereign wealth funds. In fact, rather than scare investors out of the bond market, rising rates are likely to attract a greater asset allocation from liability driven investors. Looking at Verizon's Secondary Bonds vs 10yr New Issue Figure 3 Leveraging Transactions are a Credit Investor's Best Friend Incremental VZ 10yr new issue concession 200 VZ secondary spread widening ahead of new issue 200 OAS 150 OAS 150 250 100 100 Chatter of possible VZ deal with VOD for Verizon Wireless Announcement of Verizon's VW acquisition Post deal spread tightening in both VZ old and new issues 50 50 0 0 Source: Barclays Capital VZ 2.45 11/01/2022 The demand picture for credit is also supportive of the asset class even if we were to see higher interest rates, which doesn’t seem to be playing out in 2014 despite the taper.
Headlines heralding the “great rotation out of bonds” have not proven correct and are unlikely to occur in the coming years. Looking at weekly fund flow data there tends to be a strong correlation of positive inflows into both equity and credit when there is a riskon sentiment. Perhaps more immediately on the heels of the credit crisis Central Bank buying of treasuries and mortgages pushed more investors into alternative VZ 5.15 09/15/2023 the funding status of pension plans can be an important indicator of where funds are likely to be invested.
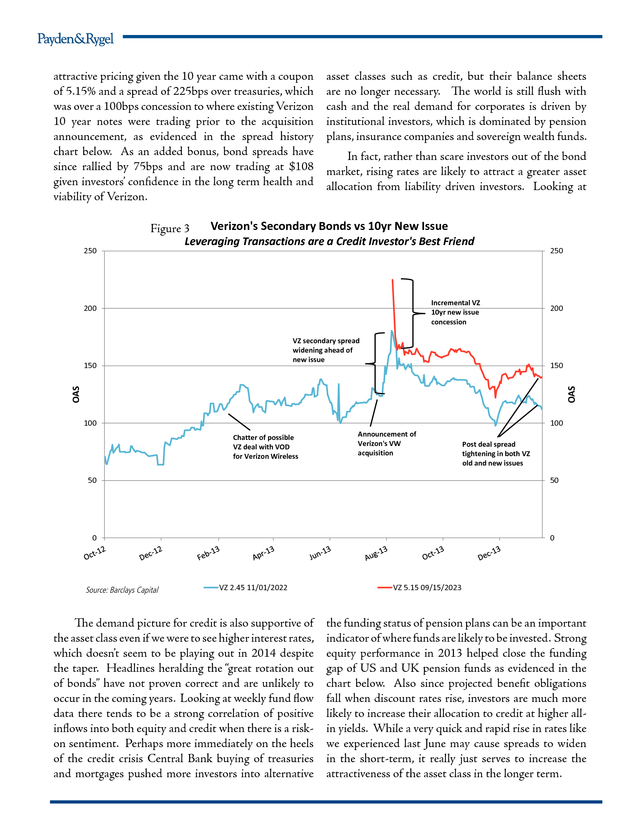
Strong equity performance in 2013 helped close the funding gap of US and UK pension funds as evidenced in the chart below. Also since projected benefit obligations fall when discount rates rise, investors are much more likely to increase their allocation to credit at higher allin yields. While a very quick and rapid rise in rates like we experienced last June may cause spreads to widen in the short-term, it really just serves to increase the attractiveness of the asset class in the longer term. .
Figure 4 Pension Funding Status Improving with Rising Rates & Strong Equity Performance 120% Funding Status 110% 100% 90% US UK 80% 70% 60% 2003 2004 2005 2006 2007 2008 2009 2010 2011 2012 2013 Jan-14 Date Source: J.P. Morgan - “U.S. High Grade Bond and Credit Derivative Market Outlook” Milliman 100 Pension Funding Index Pension Protection Fund (PPF) 7800 Index higher leverage since this will make for more attractive all-in yields for future investments. While this move to a higher yielding state may exert some interim pain on investors’ existing holdings, we expect this pain to be transitory.
First, we believe the carry picked up in current credit portfolios will offset the pressure on total returns brought on by higher interest rates. Secondly, through the new issue market, we expect investors will be able to incrementally add higher spread issues to their portfolios as they come to market. While this means taking on higher leverage initially, we also have confidence in these companies’ ability to generate enough free cash flow to de-lever over time. That said, the major caveat to our case for credit is too strong of an economy.
That is when Central Bank intervention may have saved management teams tend to get too aggressive in the credit markets immediately following the crisis, gearing of their balance sheets, making them much but they are not what have driven its success the more vulnerable in a downturn and the threat of past two years. Spread tightening was the result of principal loss all of a sudden feels all too real. While real institutional demand against the backdrop of we still see upside to credit for at least the next year strengthening balance sheets and an improving global or two, come late 2016, or maybe 2017, just when macroeconomic environment.
For these reasons, credit investors are starting to feel very secure, it may credit investors should want to see higher rates and be time to start believing in old myths. From the supply side, higher rates haven’t had the feared effect of causing issuers to hold off on supply either. In 2013 we saw global IG supply of USD $1.7 trillion (GBP£1 trillion) and global HY issuance of USD$420B (GBP£253 billion) according to Barclays Capital. We are expecting roughly the same for IG and perhaps modestly lower for HY in 2014.
But despite this level of issuance investors have signaled they can’t get enough of credit. Continuing the trend from 2013, deals are typically five times subscribed with final pricing ending anywhere from 10 to 50bps tighter from initial talk. Also rather than new supply having the anticipated effect of putting pressure on secondary spreads, often the demand for the new issue re-prices the existing issues tighter. .
Natalie N. Trevithick, CFA Senior Vice President 2012 – Joined Payden & Rygel Natalie Trevithick is a senior vice president and the lead strategist for investment-grade corporates at Payden & Rygel. Trevithick is responsible for managing corporate bond portfolios across a breadth of fixed-income strategies, including low duration, core and core plus, global, emerging markets and absolute return. Her experience also encompasses the use of derivatives such as interest rate and credit default swaps to manage risk and to develop customized investment solutions for corporate bond portfolios. Prior to joining Payden & Rygel, Trevithick spent six years at PIMCO in a similar capacity as a senior vice president and portfolio manager.
Prior to that, she worked at Barclays Capital as a sell-side trader in New York. Natalie Trevithick holds the Chartered Financial Analyst designation. She earned an MBA from the McCombs School of Business at the University of Texas, Austin. Trevithick earned a Bachelor of Commerce degree at Queen’s University in Kingston, Ontario. .
ESTd SEPT 12 1983 PAYDEN.COM DEDICATED MANDATES AND DUBLIN DOMICILED UCITS FUNDS These strategies and others are also available through separate account vehicles. EQUITY World Equity Fund FIXED INCOME Absolute Return Bond Fund Global Emerging Markets Bond Fund Global Emerging Markets Corporate Bond Fund Global Emerging Markets Local Bond Fund Global Government Bond Index Fund Global High Yield Bond Fund Global Inflation-Linked Bond Fund International Bond Fund International Short Bond Fund Sterling Corporate Bond Fund – Investment Grade US Core Bond Fund LIQUIDITY FUNDS Euro Liquidity – Enhanced Cash Fund Sterling Liquidity – Enhanced Cash Fund Sterling Reserve Fund US Dollar Liquidity – Enhanced Cash Fund .


