


Description
PAYDEN EQUITY INCOME FUND
DECEMBER 31, 2015
STOCK | GLOBAL BOND | US BOND | TAX-EXEMPT BOND
FUND HIGHLIGHTS
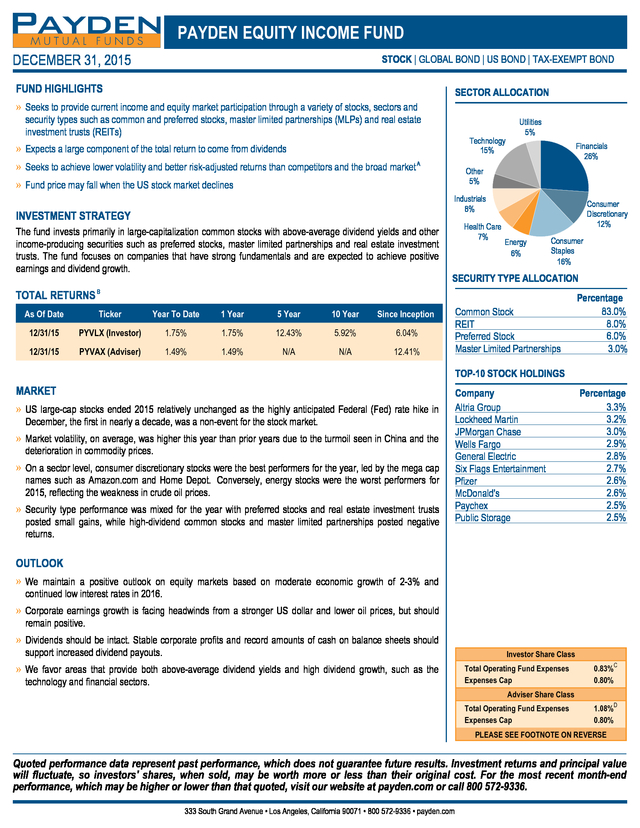
SECTOR ALLOCATION
» Seeks to provide current income and equity market participation through a variety of stocks, sectors and
security types such as common and preferred stocks, master limited partnerships (MLPs) and real estate
investment trusts (REITs)
Technology
15%
» Expects a large component of the total return to come from dividends
» Seeks to achieve lower volatility and better risk-adjusted returns than competitors and the broad market A
Seeks to achieve lower volatility and better risk-adjusted returns than competitors and the broad market
Utilities
5%
Financials
26%
Other
5%
» Fund price may fall when the US stock market declines
Industrials
8%
INVESTMENT STRATEGY
The fund invests primarily in large-capitalization common stocks with above-average dividend yields and other
income-producing securities such as preferred stocks, master limited partnerships and real estate investment
trusts. The fund focuses on companies that have strong fundamentals and are expected to achieve positive
earnings and dividend growth.
TOTAL RETURNS
TOTAL RETURNS B
As Of Date
Ticker
Year To Date
1 Year
5 Year
10 Year
PYVLX (Investor)
1.75%
1.75%
12.43%
5.92%
6.04%
12/31/15
PYVAX (Adviser)
1.49%
1.49%
N/A
N/A
Energy
6%
Consumer
Staples
16%
SECURITY TYPE ALLOCATION
Since Inception
Since Inception
12/31/15
Health Care
7%
Consumer
Discretionary
12%
12.41%
Common Stock
REIT
Preferred Stock
Master Limited Partnerships
Percentage
83.0%
8.0%
6.0%
3.0%
TOP-10 STOCK HOLDINGS
MARKET
» US large-cap stocks ended 2015 relatively unchanged as the highly anticipated Federal (Fed) rate hike in
December, the first in nearly a decade, was a non-event for the stock market.
» Market volatility, on average, was higher this year than prior years due to the turmoil seen in China and the
deterioration in commodity prices.
» On a sector level, consumer discretionary stocks were the best performers for the year, led by the mega cap
names such as Amazon.com and Home Depot. Conversely, energy stocks were the worst performers for
2015, reflecting the weakness in crude oil prices.
» Security type performance was mixed for the year with preferred stocks and real estate investment trusts
posted small gains, while high-dividend common stocks and master limited partnerships posted negative
returns.
Company
Altria Group
Lockheed Martin
JPMorgan Chase
Wells Fargo
General Electric
Six Flags Entertainment
Pfizer
McDonald's
Paychex
Public Storage
Percentage
3.3%
3.2%
3.0%
2.9%
2.8%
2.7%
2.6%
2.6%
2.5%
2.5%
OUTLOOK
» We maintain a positive outlook on equity markets based on moderate economic growth of 2-3% and
continued low interest rates in 2016.
» Corporate earnings growth is facing headwinds from a stronger US dollar and lower oil prices, but should
remain positive.
» Dividends should be intact. Stable corporate profits and record amounts of cash on balance sheets should
support increased dividend payouts.
» We favor areas that provide both above-average dividend yields and high dividend growth, such as the
technology and financial sectors.
Investor Share Class
Total Operating Fund Expenses
Expenses Cap
0.83%
0.80%
C
Adviser Share Class
Total Operating Fund Expenses
Expenses Cap
1.08%D
0.80%
PLEASE SEE FOOTNOTE ON REVERSE
Quoted performance data represent past performance, which does not guarantee future results.
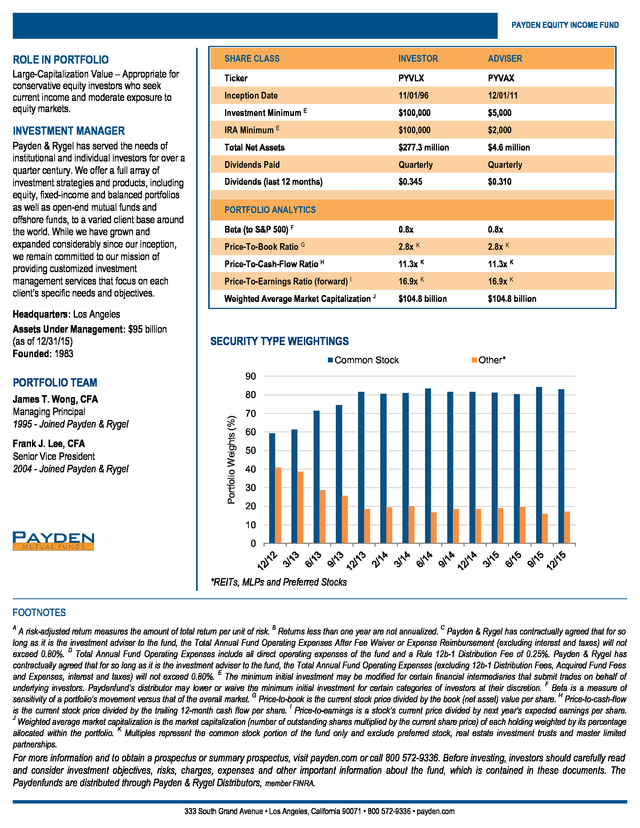
Investment returns and principal value will fluctuate, so investors' shares, when sold, may be worth more or less than their original cost. For the most recent month-end performance, which may be higher or lower than that quoted, visit our website at payden.com or call 800 572-9336. 333 South Grand Avenue • Los Angeles, California 90071 • 800 572-9336 • payden.com . PAYDEN EQUITY INCOME FUND ROLE IN PORTFOLIO SHARE CLASS INVESTOR ADVISER Large-Capitalization Value – Appropriate for conservative equity investors who seek current income and moderate exposure to equity markets. Ticker Ticker PYVLX PYVLX PYVAX PYVAX Inception Date Inception Date Investment Minimum Investment Minimum E 11/01/96 11/01/96 12/01/11 12/01/11 $100,000 $100,000 $5,000 $5,000 INVESTMENT MANAGER IRA Minimum E IRA Minimum Total Net Assets Total Net Assets $100,000 $100,000 $2,000 $2,000 $277.3 million $277.3 million $4.6 million $4.6 million Dividends Paid Dividends Paid Dividends (last 12 months) Dividends (last 12 months) Quarterly Quarterly Quarterly Quarterly $0.345 $0.345 $0.310 $0.310 Beta (to S&P 500) Beta (to S&P 500) F 0.8x 0.8x 0.8x 0.8x Price-To-Book Ratio G Price-To-Book Ratio Price-To-Cash-Flow Ratio Price-To-Cash-Flow Ratio H 2.8x K 2.8x 2.8x 2.8x K 11.3x 11.3x K 11.3x 11.3x K 16.9x K 16.9x 16.9x K 16.9x $104.8 billion $104.8 billion $104.8 billion $104.8 billion Payden & Rygel has served the needs of institutional and individual investors for over a quarter century. We offer a full array of investment strategies and products, including equity, fixed-income and balanced portfolios as well as open-end mutual funds and offshore funds, to a varied client base around the world. While we have grown and expanded considerably since our inception, we remain committed to our mission of providing customized investment management services that focus on each client’s specific needs and objectives. Headquarters: Los Angeles Assets Under Management: $95 billion (as of 12/31/15) Founded: 1983 PORTFOLIO ANALYTICS Price-To-Earnings Ratio (forward) I Price-To-Earnings Ratio (forward) Weighted Average Market Capitalization Weighted Average Market Capitalization J SECURITY TYPE WEIGHTINGS Common Stock 90 PORTFOLIO TEAM Frank J. Lee, CFA Senior Vice President 2004 - Joined Payden & Rygel 80 Portfolio Weights (%) James T.
Wong, CFA Managing Principal 1995 - Joined Payden & Rygel Other* 70 60 50 40 30 20 10 0 *REITs, MLPs and Preferred Stocks FOOTNOTES A risk-adjusted return measures the amount of total return per unit of risk. B Returns less than one year are not annualized. C Payden & Rygel has contractually agreed that for so A risk-adjusted return measures the amount of total return per unit of risk.
B Returns less than one year are not annualized. C Payden & Rygel has contractually agreed that for so long as it is the investment adviser to the fund, the Total Annual Fund Operating Expenses After Fee Waiver or Expense Reimbursement (excluding interest and taxes) will not long as it is the investment adviser to the fund, the Total Annual Fund Operating Expenses After Fee Waiver or Expense Reimbursement (excluding interest and taxes) will not exceed 0.80%. D Total Annual Fund Operating Expenses include all direct operating expenses of the fund and a Rule 12b-1 Distribution Fee of 0.25%.
Payden & Rygel has exceed 0.80%. D Total Annual Fund Operating Expenses include all direct operating expenses of the fund and a Rule 12b-1 Distribution Fee of 0.25%. Payden & Rygel has contractually agreed that for so long as it is the investment adviser to the fund, the Total Annual Fund Operating Expenses (excluding 12b-1 Distribution Fees, Acquired Fund Fees contractually agreed that for so long as it is the investment adviser to the fund, the Total Annual Fund Operating Expenses (excluding 12b-1 Distribution Fees, Acquired Fund Fees and Expenses, interest and taxes) will not exceed 0.80%.
E The minimum initial investment may be modified for certain financial intermediaries that submit trades on behalf of and Expenses, interest and taxes) will not exceed 0.80%. E The minimum initial investment may be modified for certain financial intermediaries that submit trades on behalf of underlying investors. Paydenfund’s distributor may lower or waive the minimum initial investment for certain categories of investors at their discretion.
F Beta is a measure of underlying investors. Paydenfund’s distributor may lower or waive the minimum initial investment for certain categories of investors at their discretion. F Beta is a measure of sensitivity of a portfolio’s movement versus that of the overall market.
G Price-to-book is the current stock price divided by the book (net asset) value per share. H Price-to-cash-flow sensitivity of a portfolio’s movement versus that of the overall market. G Price-to-book is the current stock price divided by the book (net asset) value per share.
H Price-to-cash-flow is the current stock price divided by the trailing 12-month cash flow per share. I Price-to-earnings is a stock’s current price divided by next year’s expected earnings per share. is the current stock price divided by the trailing 12-month cash flow per share. I Price-to-earnings is a stock’s current price divided by next year’s expected earnings per share. J Weighted average market capitalization is the market capitalization (number of outstanding shares multiplied by the current share price) of each holding weighted by its percentage J Weighted average market capitalization is the market capitalization (number of outstanding shares multiplied by the current share price) of each holding weighted by its percentage allocated within the portfolio.
K Multiples represent the common stock portion of the fund only and exclude preferred stock, real estate investment trusts and master limited allocated within the portfolio. K Multiples represent the common stock portion of the fund only and exclude preferred stock, real estate investment trusts and master limited partnerships. partnerships. A A For more information and to obtain a prospectus or summary prospectus, visit payden.com or call 800 572-9336. Before investing, investors should carefully read and consider investment objectives, risks, charges, expenses and other important information about the fund, which is contained in these documents.
The Paydenfunds are distributed through Payden & Rygel Distributors, member FINRA. 333 South Grand Avenue • Los Angeles, California 90071 • 800 572-9336 • payden.com .


