


Description
ANNUAL REPORT
O C T O B E R 31, 2015
.
. Contents
•
President’s Letter
1
Management Discussion & Analysis
6
Portfolio Highlights & Investments
78
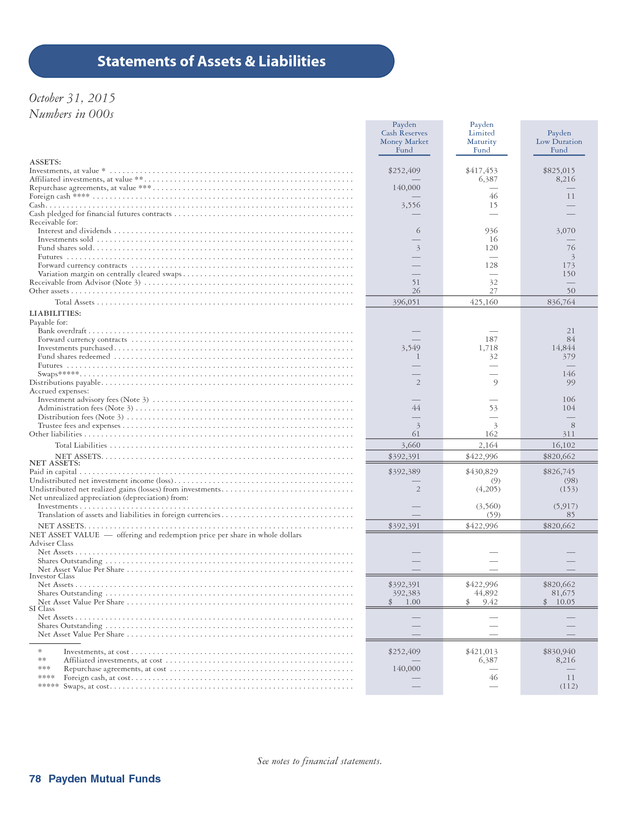
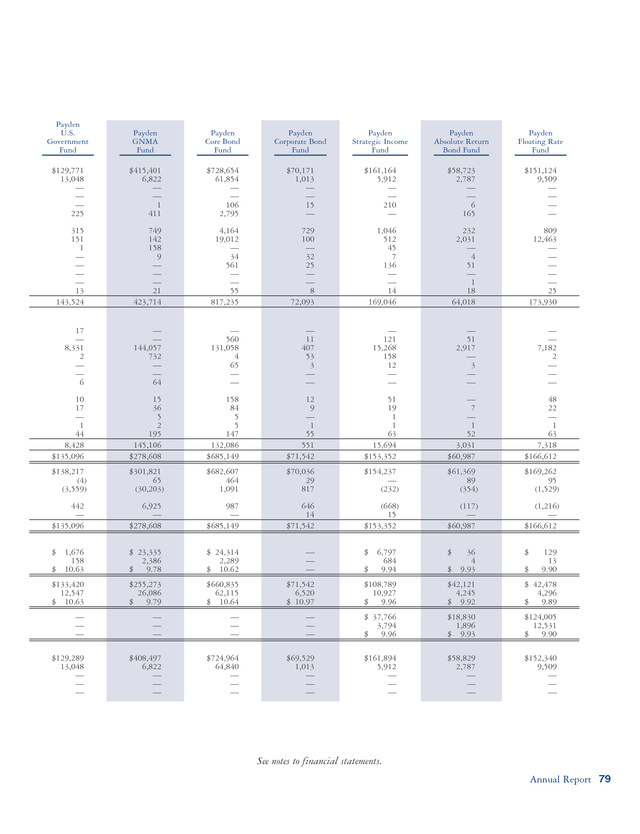
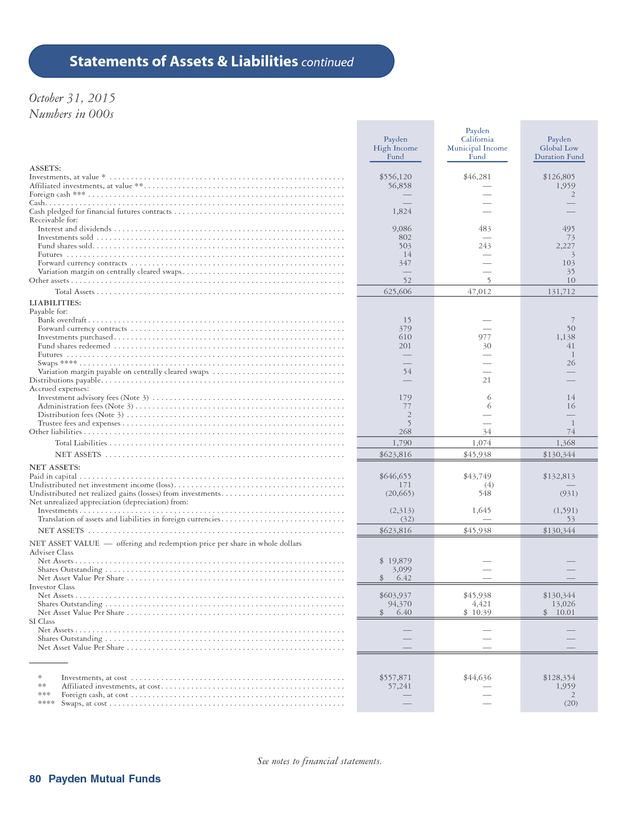
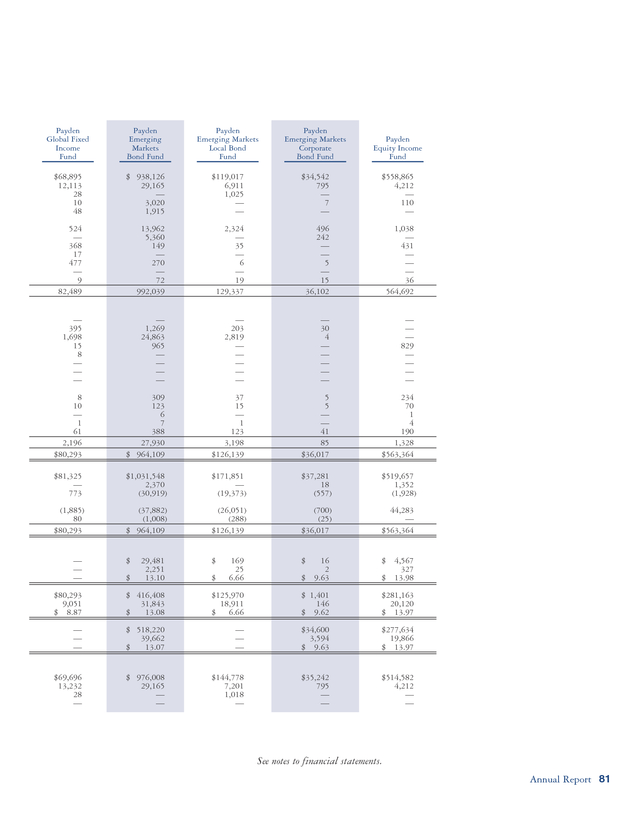
Statements of Assets & Liabilities
82
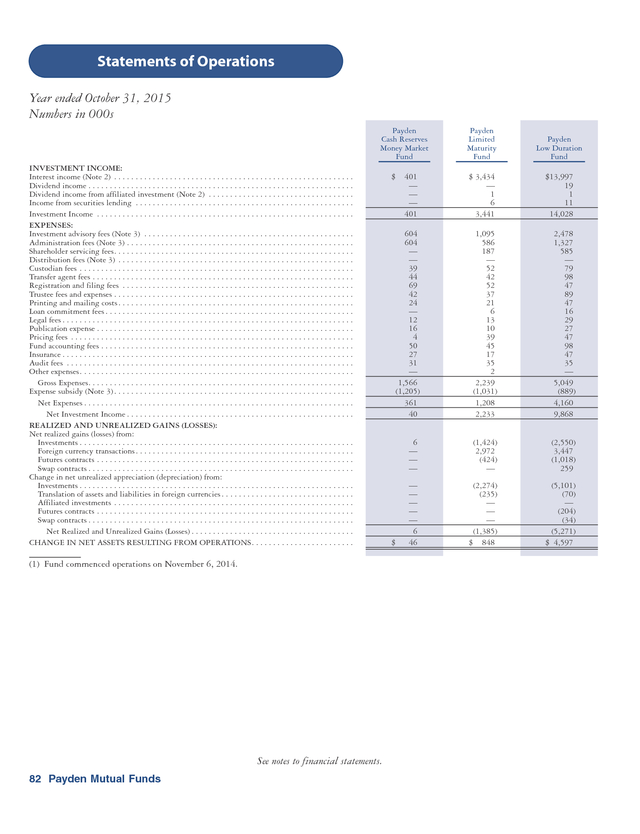
Statements of Operations
86
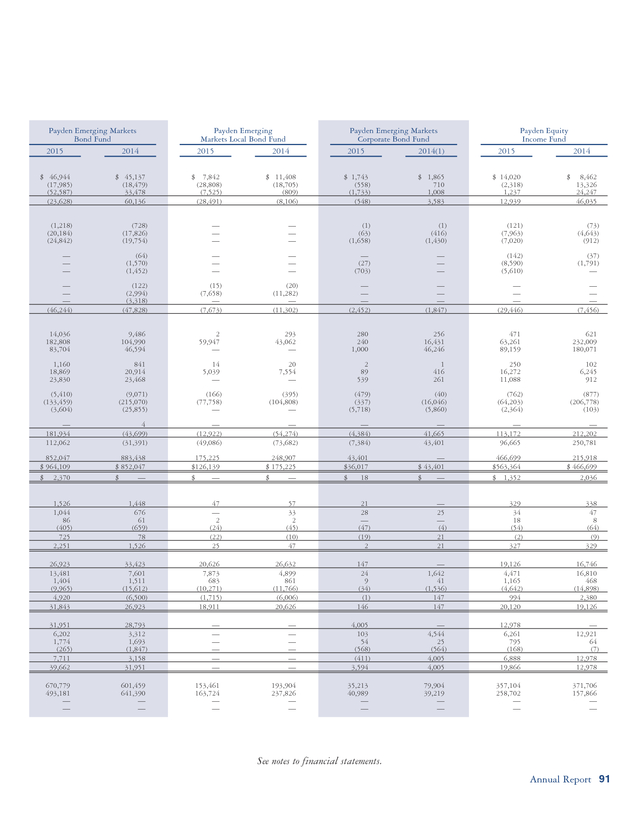
Statements of Changes in Net Assets
92
Notes to Financial Statements
118
Financial Highlights
136
Report of Independent Registered Public Accounting Firm
137
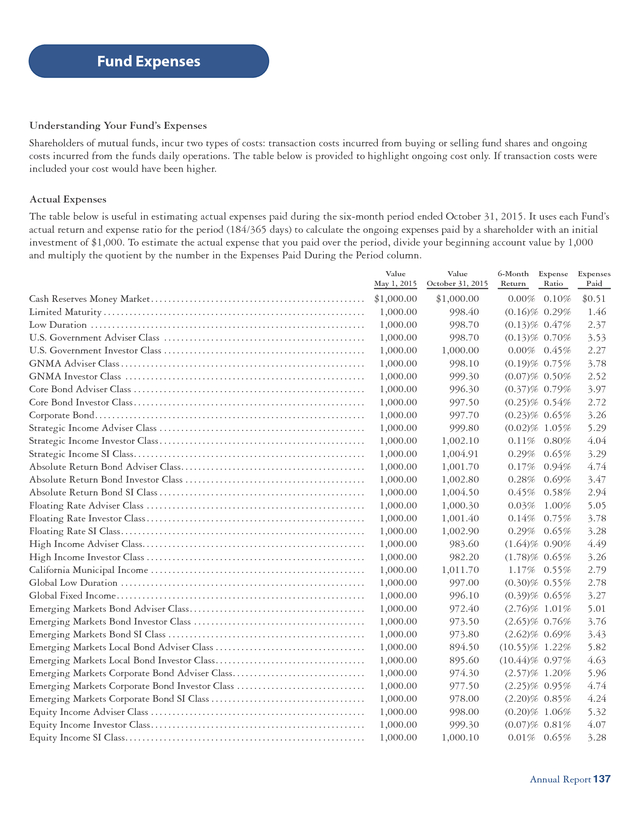
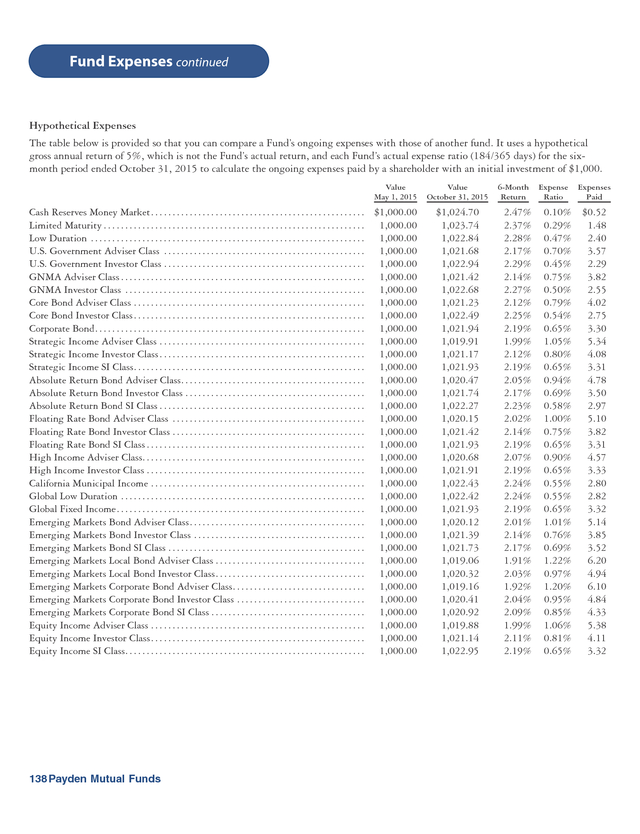
Fund Expenses
139
Approval of Investment Advisory Agreement
146
Trustees & Officers
Annual Report
. President’s Letter
Dear Shareholders,
As investment managers, we evaluate future trends in the economy and translate them into investment
decisions for your fund. Over the past several years, low interest rates and concerns about when interest
rates might rise dominated discussions. Well, we no longer have to wonder when rates will rise as the
Federal Reserve Board raised its overnight interest rate in December. However, deeper questions
remain: how fast will rates rise, how far will they go and what will be the impact of rising rates on the
global economy?
First, we think the Federal Reserve Board will move slowly and gradually.
Remember, the muchanticipated rate hike was just ¼ of 1%. The US economy is not in perfect condition and inflation is still low, so there is no urgency for the Fed to move quickly. The broad consensus believes short-term interest rates will end 2016 at around 1%.
Meanwhile, other global economies face a range of economic and political challenges and global central banks seem to be in no rush to raise interest rates. As a result, we think low interest rates will still be a dominant global theme in 2016. Second, we think there are reasons for optimism for our longer-term prospects. For example, the United States is a leader in innovation and things are changing quickly with breakthroughs like driverless cars, delivery drones, 3D printers and 4D movies.
Ultimately, innovation will provide the seeds of future economic growth and employment, though the journey may be difficult one for workers who will need to retool their skillsets for the 21st century economy. The most important message we can give our shareholders is that we are thinking about all these factors impacting financial markets. Since the global economy is now interconnected, financial markets have also converged. Investors used to look only to bonds as their income source.
Today, investors look to a variety of tools, including stocks, currencies and bonds, to find income opportunities. We expect this trend to continue in the years ahead. We thank you for continuing to place your trust in us. Most important, we wish health and happiness for you and your families in the New Year, Joan A.
Payden President & CEO . Management Discussion & Analysis Short Duration Strategies During the fiscal year ended October 31, 2015, Central Bank activity continued to be the dominant market influence amidst slowing global growth and weakness within commodities. The Federal Reserve Board kept interest rates unchanged despite the U.S. unemployment rate dropping to 5%. The Bank of China cut interest rates six times as economic growth continued its decline, while the European Central Bank embarked on a €60 billion asset purchase program, which included purchases of government bonds, covered bonds and asset-backed securities. Low inflation remained persistently low in developed economies, such as the Eurozone and Japan, as oil prices went from $80/barrel to less than $45/barrel during the period. Both the U.S.
Treasury one-year and two-year maturity yields rose 23 basis points, ending the fiscal year at 0.32% and 0.72%, respectively. The U.S. Treasury curve flattened with the increasing likelihood of the first rate hike since June 2006.
The interest rate differential between the two-year and five-year maturity U.S. Treasury securities fell 32 basis points. Investors demanded greater yield/risk premiums from corporate bond issuers. Yield premiums rose along with general market volatility due to the slowing economic environment.
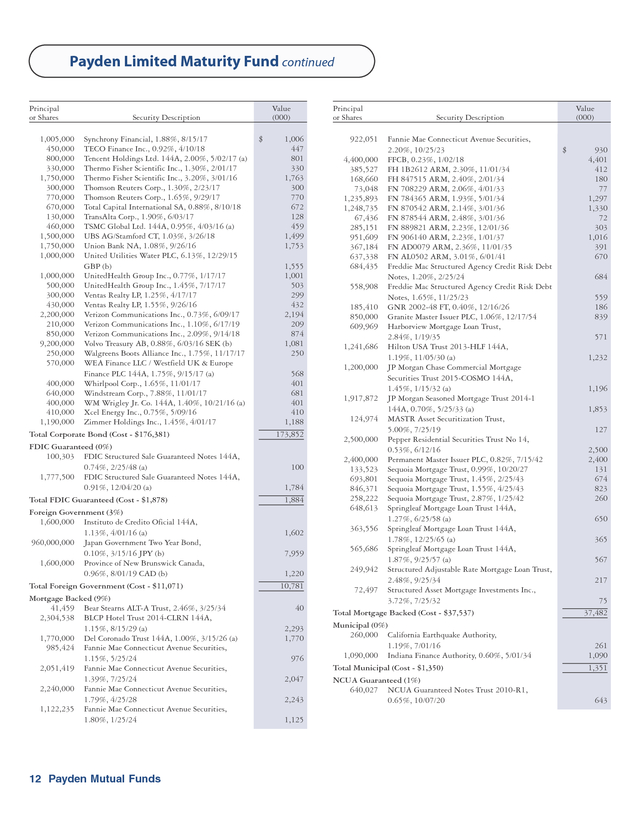
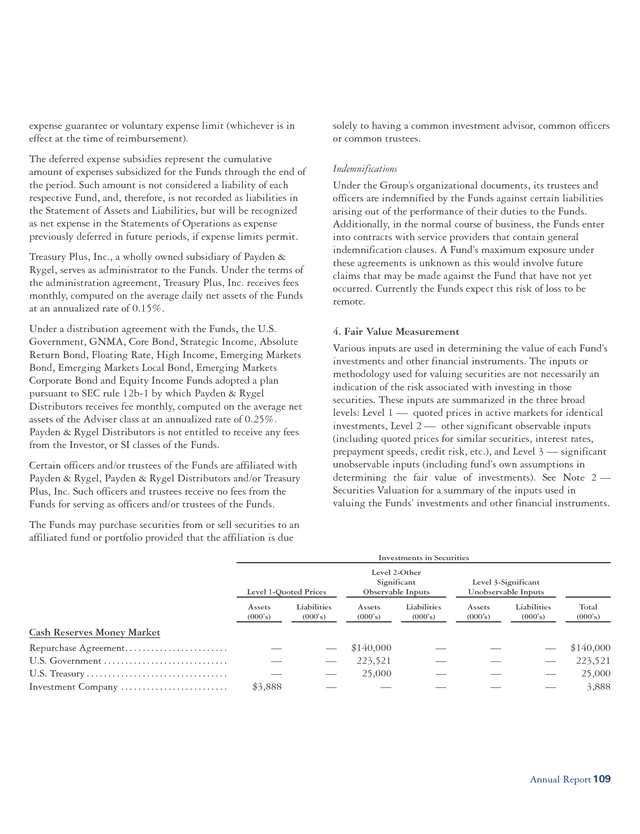
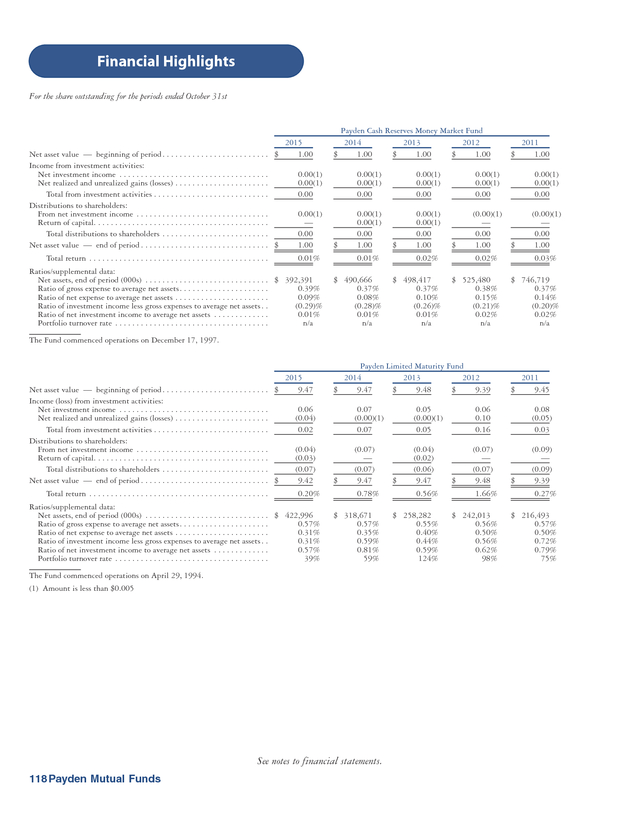
Issuer spreads within the sector widened materially on commodity pressure. The Payden Cash Reserves Money Market Fund (PBHXX) continued to provide stable daily liquidity. For the fiscal year ended October 31, 2015, the Fund returned 0.01%, matching the return of 0.01% for the Lipper Government Money Market Average. Money market rates remained low as the Federal Reserve Board kept its low interest rate policy unchanged. The Payden Limited Maturity Fund (PYLMX) returned 0.20% for the fiscal year ended October 31, 2015, compared to a return of 0.02% for its benchmark, the Bank of America Merrill Lynch Three-Month U.S. Treasury Bill Index.
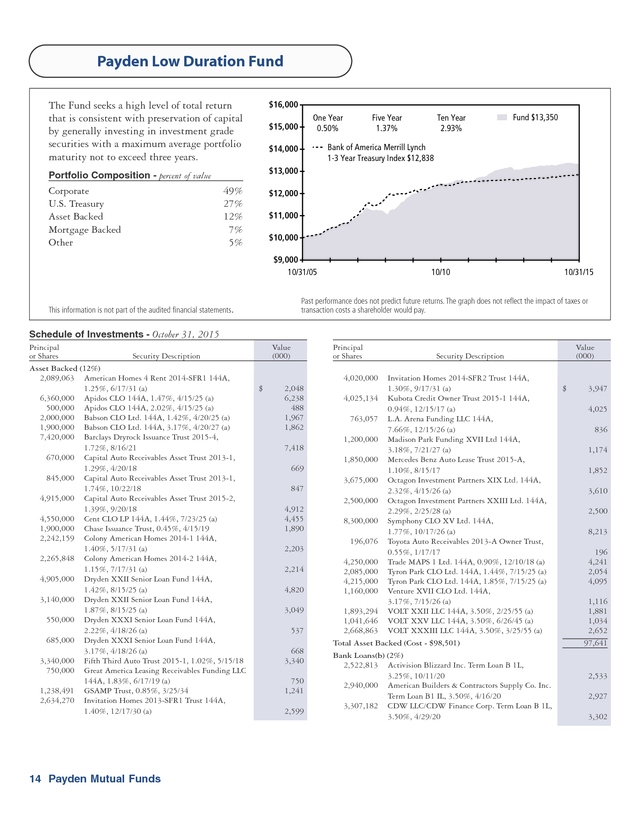
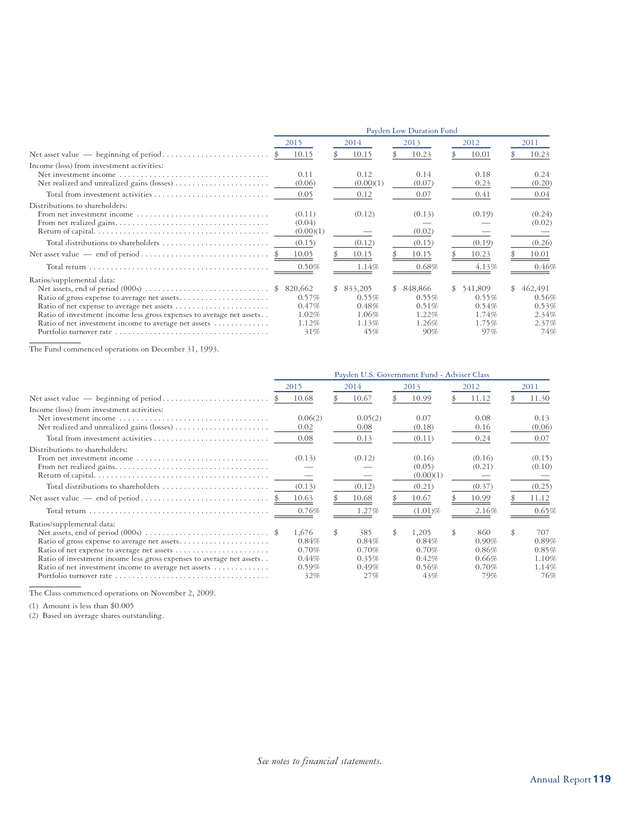
The long relative duration positioning, in addition to the yield premium on both U.S. corporate bonds and securitized products, were the largest contributors to outperformance. The Payden Low Duration Fund (PYSBX) returned 0.50% for the fiscal year ended October 31, 2015, compared to a return of 0.78% for its benchmark, the Bank of America Merrill Lynch 1-3 Year U.S. Treasury Index.
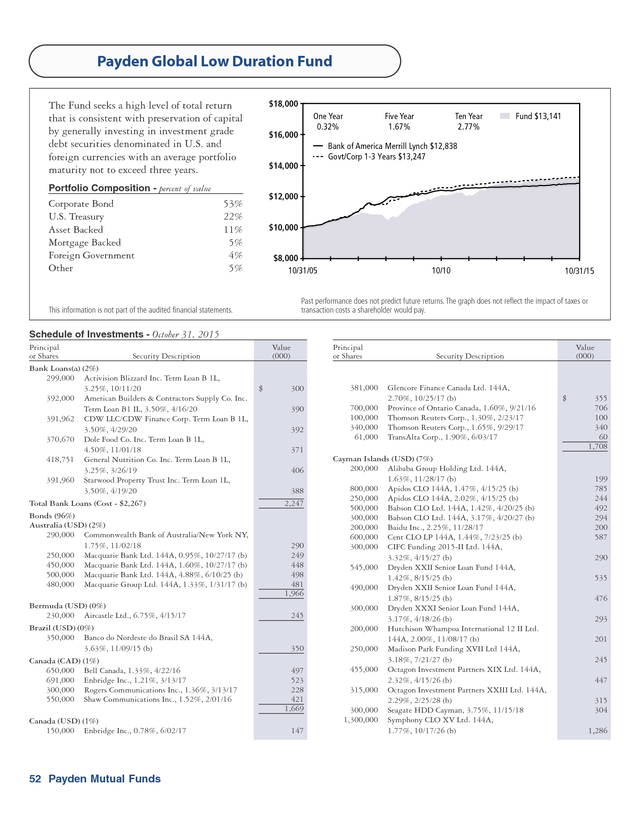
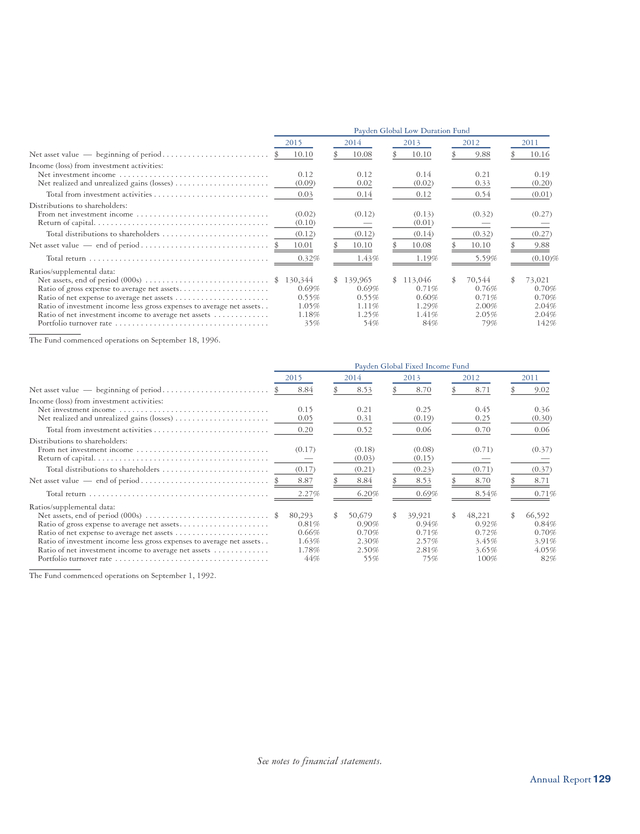
Despite strong performance from corporate bonds, the Fund’s defensive curve positioning was the largest contributor to underperformance as the Federal Reserve Board continued to keep its zero interest rate policy unchanged. The Payden Global Low Duration Fund (PYGSX) returned 0.32% for fiscal year ended October 31, 2015, compared to a return of 0.88% for its benchmark, the Bank of America Merrill Lynch 1-3 Year U.S. Corporate & Government Index. Despite strong performance from corporate bonds, the Fund’s defensive curve positioning was the largest contributor to underperformance as the Federal Reserve Board continued to keep its zero interest rate policy unchanged. The Payden U.S.
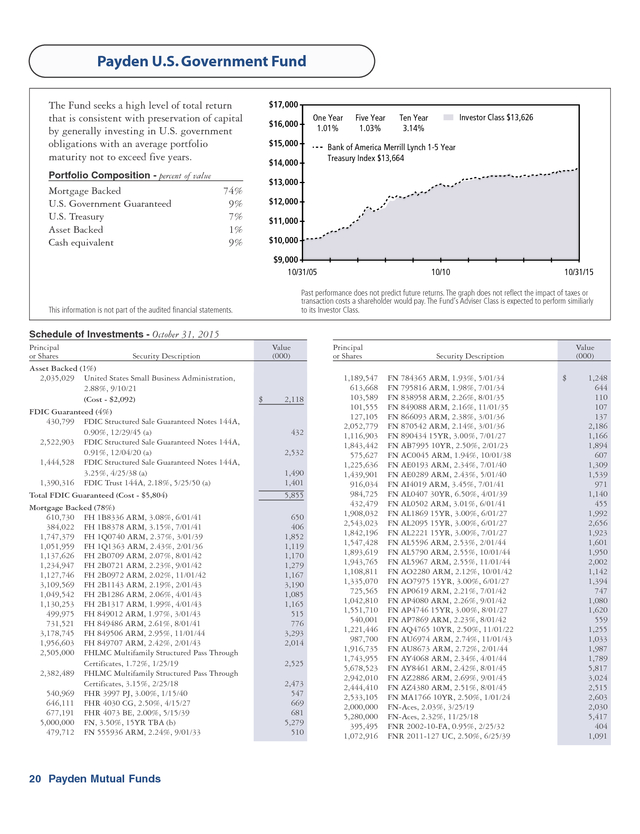
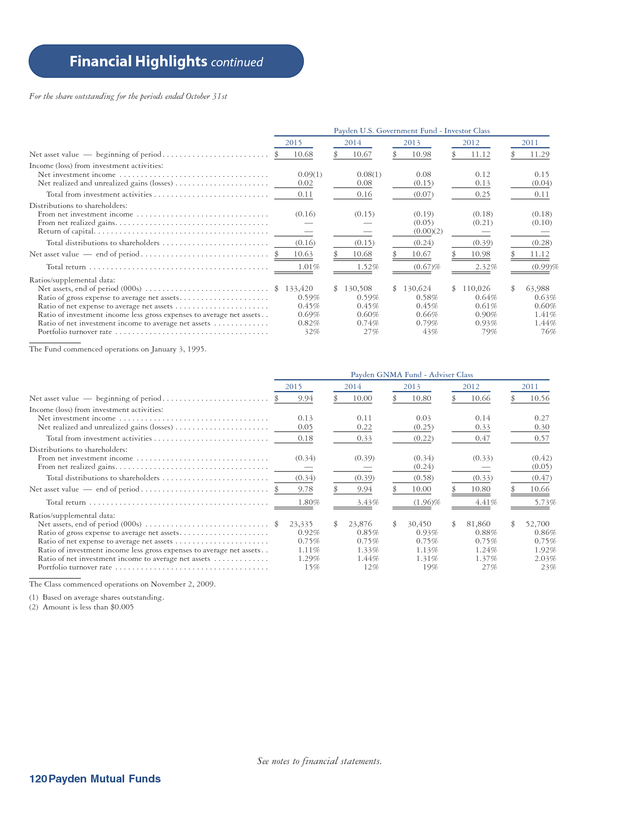
Government Fund Investor Class (PYUSX ) returned 1.01% for the fiscal year ended October 31, 2015, compared to a return of 1.41% for its benchmark, the Bank of America Merrill Lynch 1-5 Year U.S. Treasury Index. The Fund’s Advisor Class (PYUWX) returned 0.76% for the fiscal year.
The Fund underperformed its benchmark primarily due to a conservative structure over the latter half of the fiscal year with the belief that interest rates would rise over the period when in fact rates fell. In addition, the Fund is significantly overweight short average life agency mortgage-backed securities that underperformed similar average life U.S. Treasury securities.
As the Federal Reserve Board moves off its zero rate interest policy, the likelihood of increased rate volatility is relatively high. We expect a gradual increase in rates rather than any sharp move to higher rates. The Fund expects to maintain a shorter average life relative to its benchmark, while looking to scale into the market at higher yield levels.
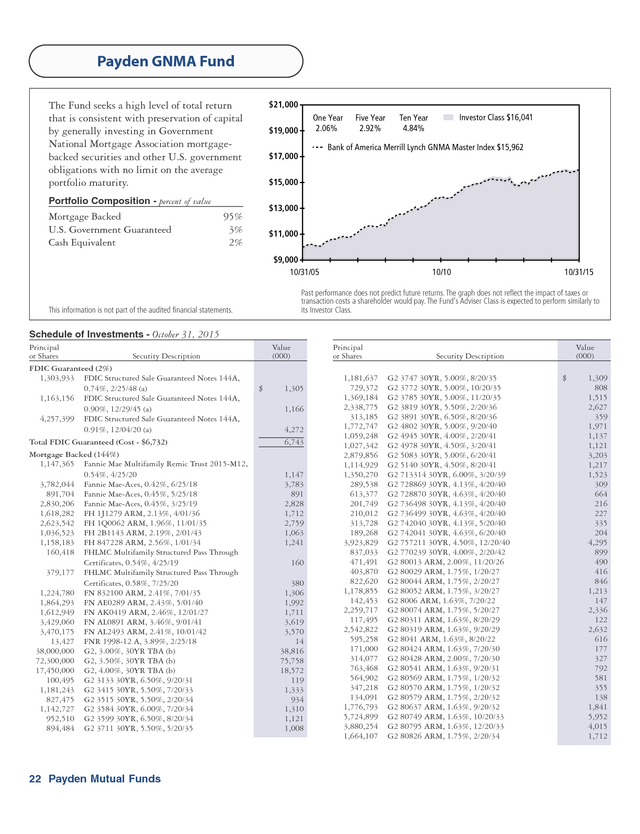
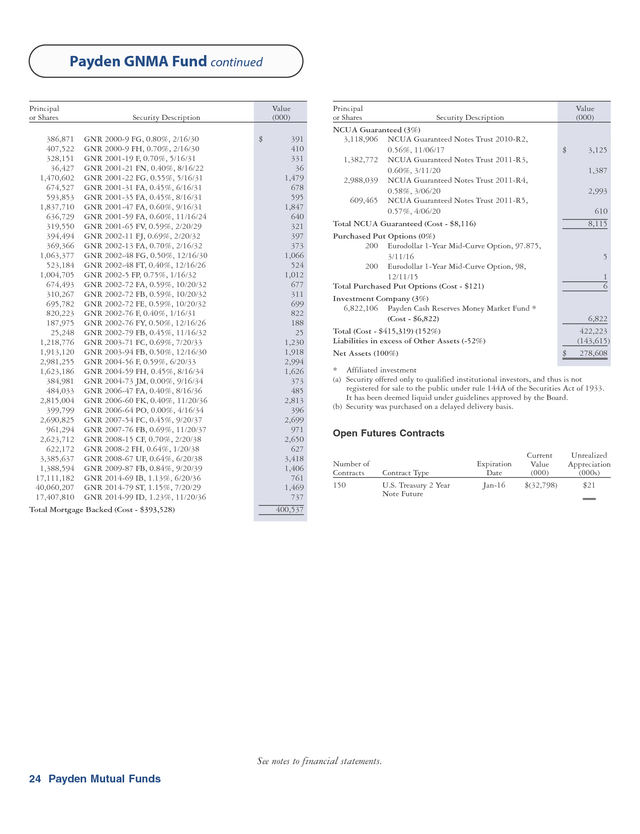
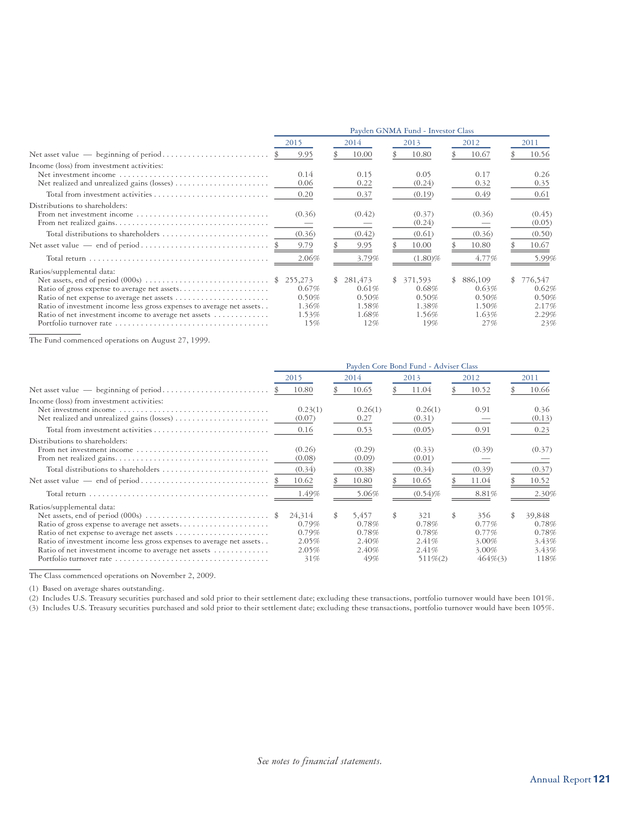
The Fund uses U.S. Treasury futures and eurodollar futures to hedge certain risks from mortgage securities that are not prevalent in its all U.S. Treasury benchmark. Intermediate Duration Bond Strategies The Payden GNMA Fund Investor Class (PYGNX) returned 2.06% for the fiscal year ended October 31, 2015, compared to a return of 1.87% for its benchmark, the Bank of America Merrill Lynch GNMA Master Index.
The Fund’s Adviser Class (PYGWX) returned 1.80% for the year. U.S. interest rates were range-bound for the past year as the Federal Reserve Board maintained its zero rate interest policy.
Ginnie Mae securities benefit from a range-bound period as prepayment risk remains low, providing higher yield to investors. The Fund was able to outperform the index by its exposure to specified mortgage pools that had a slower prepayment experience than the benchmark. Over the coming year, our expectation is for a gradually rising rate environment as the Federal Reserve Board raises rates for the first time since June of 2006.
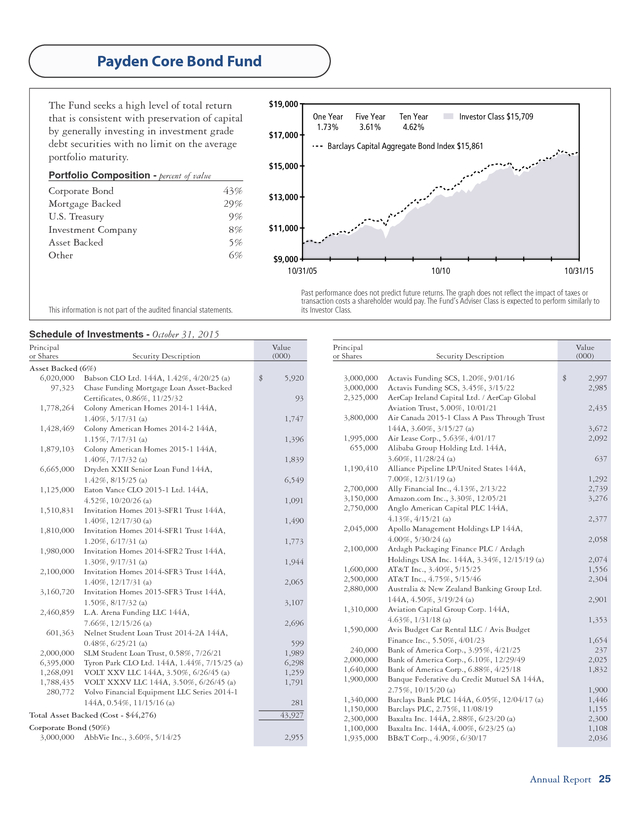
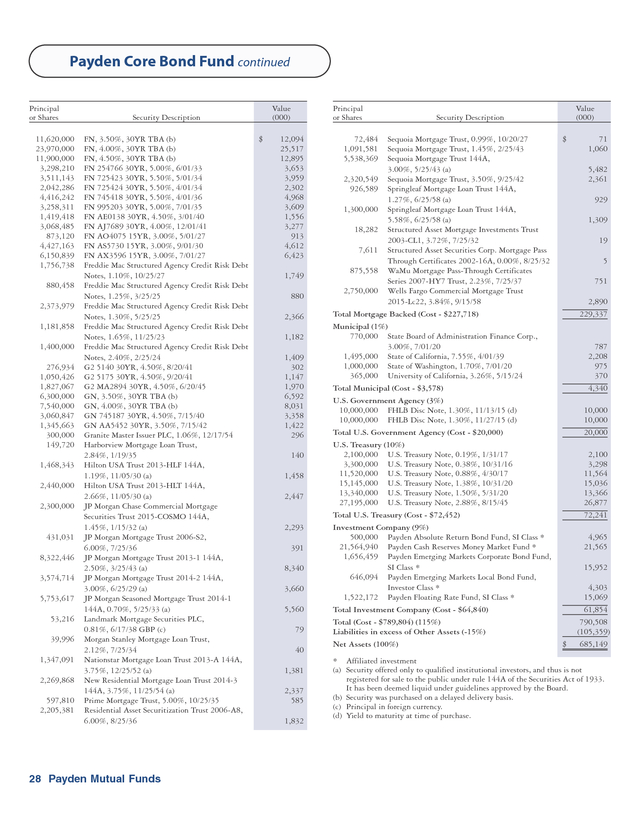
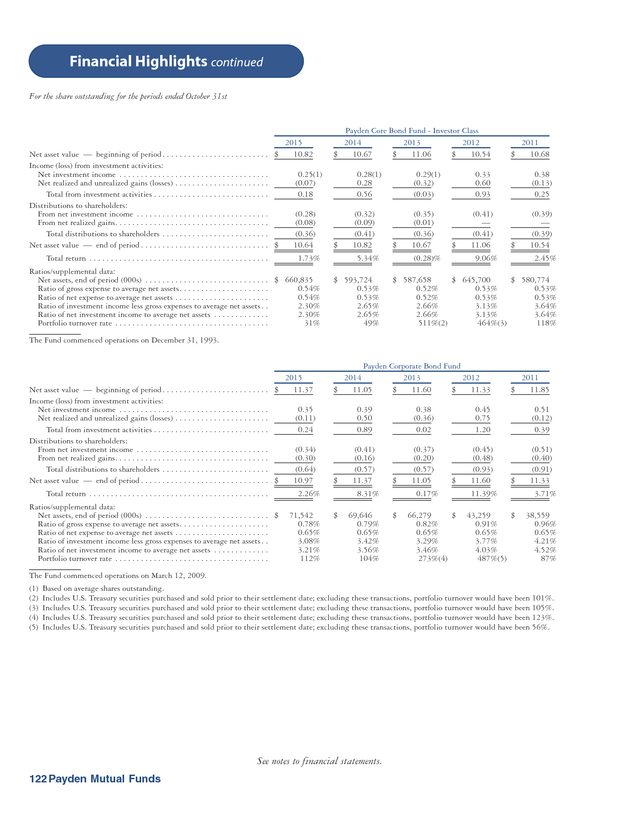
We do not foresee a sharp increase in longer term rates as the Federal Annual Report 1 . Management Discussion & Analysis continued Reserve Board moves off its zero rate policy. The Fund will be positioned to maximize yield by overweighting higher coupon mortgages and will continue to tactically use U.S. Treasury futures and eurodollars to hedge exposures to shifts in the yield curve that have the potential to negatively impact price performance. The Payden Core Bond Fund Investor Class (PYCBX) returned 1.73% for the fiscal year ended October 31, 2015, compared to a return of 1.96% for its benchmark, the Barclays Capital Aggregate Bond Index. The Fund’s Adviser Class (PYCWX) returned 1.49% for the same period. Over the fiscal year, interest rate movements along the U.S.
Treasury yield curve were mixed. Ten-year U.S. Treasury bonds moved 0.19% lower, compared to two-year bonds which ended the period 0.23% higher.
In the investment grade corporate, high yield, and emerging market asset classes, wider spread premiums detracted from returns. The Fund’s relative underperformance was driven by an overweight allocation to these non-U.S. Treasury asset classes.
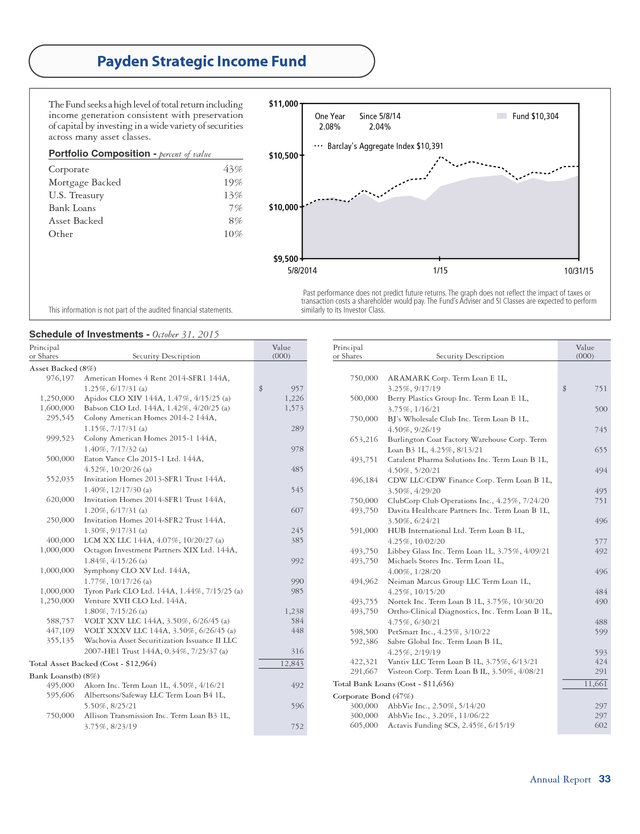
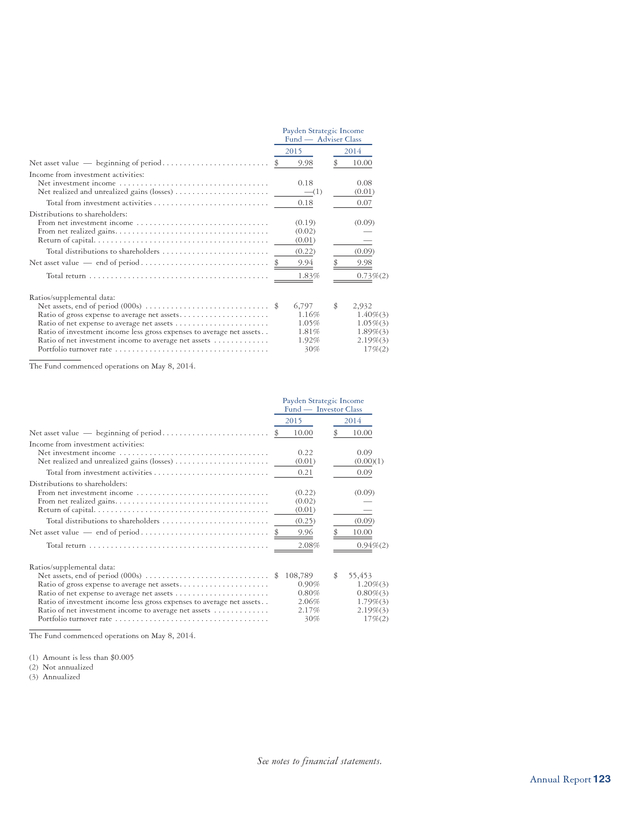
In addition, the Fund’s active currency strategy took advantage of the strengthening U.S. dollar and contributed to a positive return for the period. Strong credit fundamentals and compelling valuations continue to support our overweight allocation to credit sectors. With the Federal Reserve Board likely to continue increasing the Federal Funds Rate within the next few months, the Fund is underweight duration and increasing yield to help offset the potential of a rising rate environment. The Payden Strategic Income Investor Class (PYSGX) returned 2.08% for the fiscal year ended October 31, 2015, compared to a return of 1.96% for its benchmark, the Barclays Capital Aggregate Bond Index.
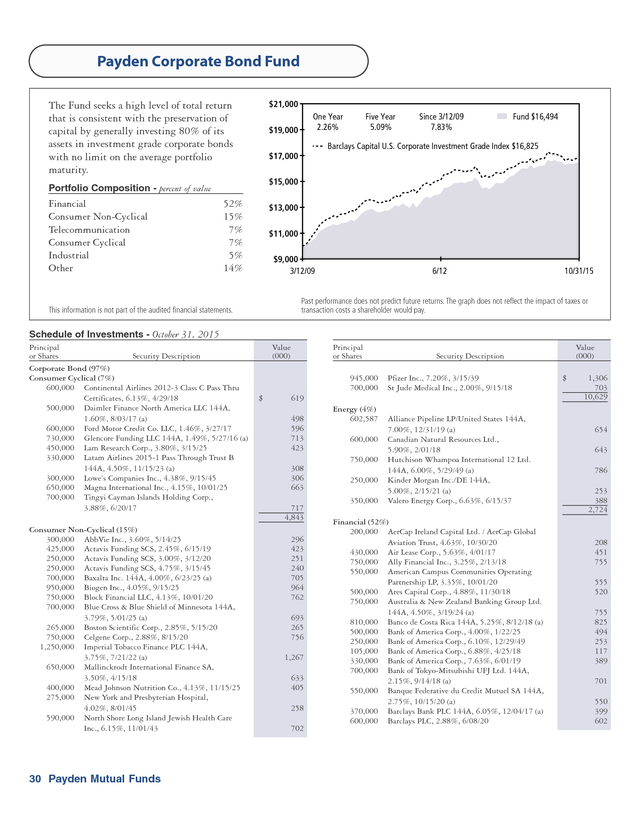
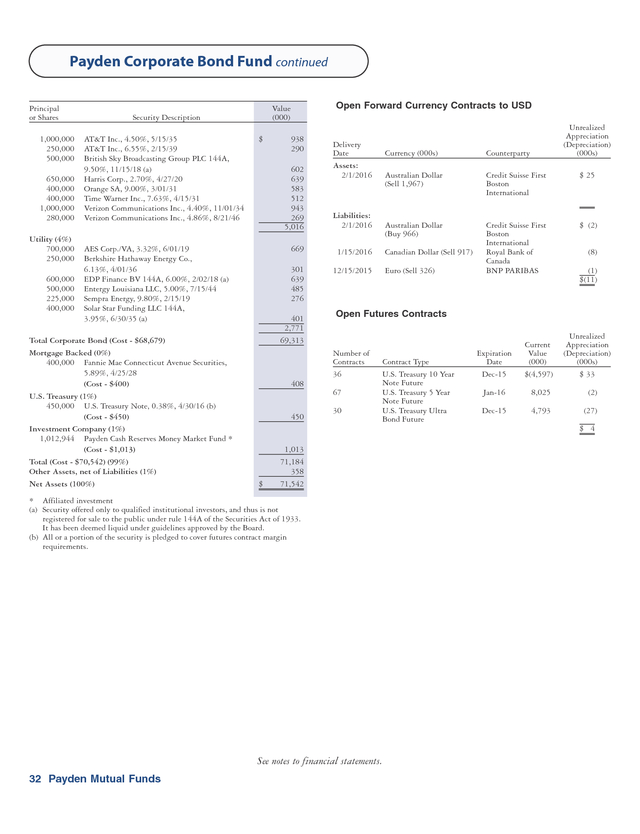
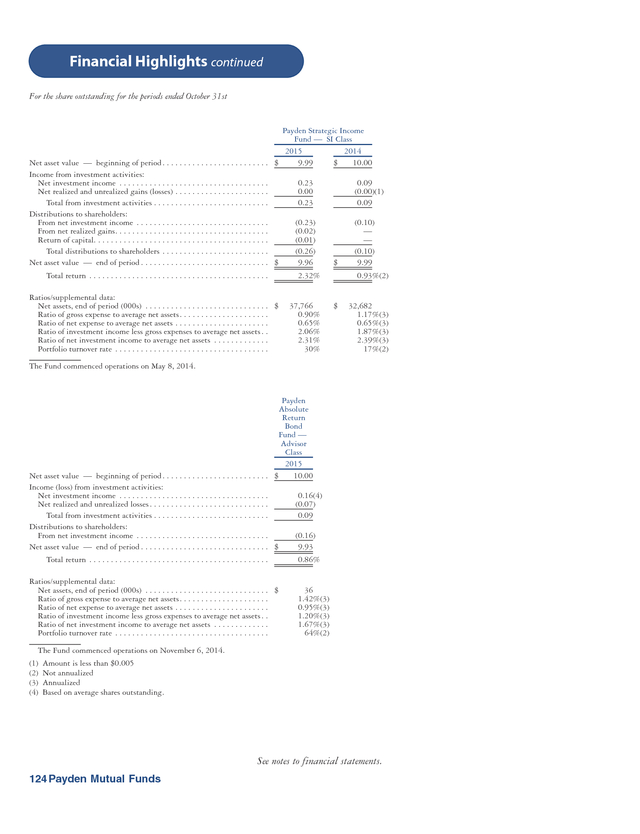
The Fund’s Adviser Class (PYSWX) returned 1.83% and its SI Class (PYSIX) returned 2.32% for the same period. The Payden Corporate Bond Fund (PYACX) generated a return of 2.26% for the fiscal year ended October 31, 2015, compared to a return of 1.05% for its benchmark, the Barclay’s Capital U.S. Corporate Investment Grade Index. The Fund used futures and U.S. Treasury securities as a means of hedging duration to be flat to the benchmark.
In early 2015, the Fund held credit protection with the High Yield Credit Default Swap Index. Currency swaps were also used to reflect market views, and at various times the Fund took positions in the euro, Japanese yen, Australian dollar, and Canadian dollar. Over the fiscal year, corporate bonds struggled to provide returns as spreads widened 41 basis points across the corporate market.
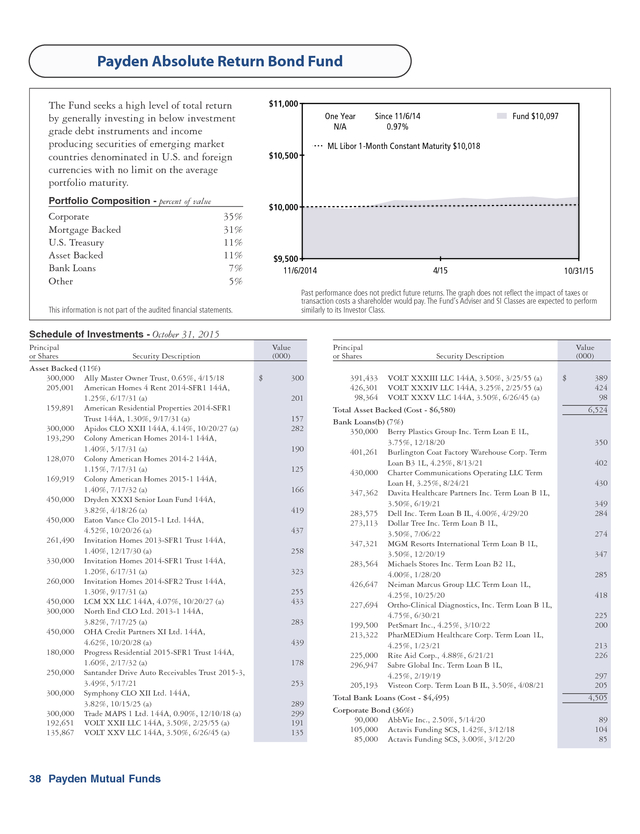
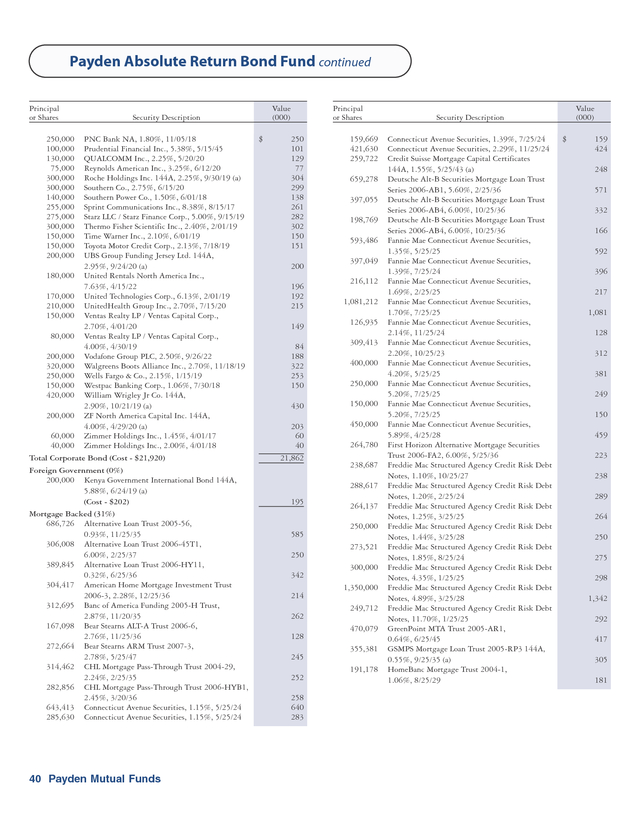
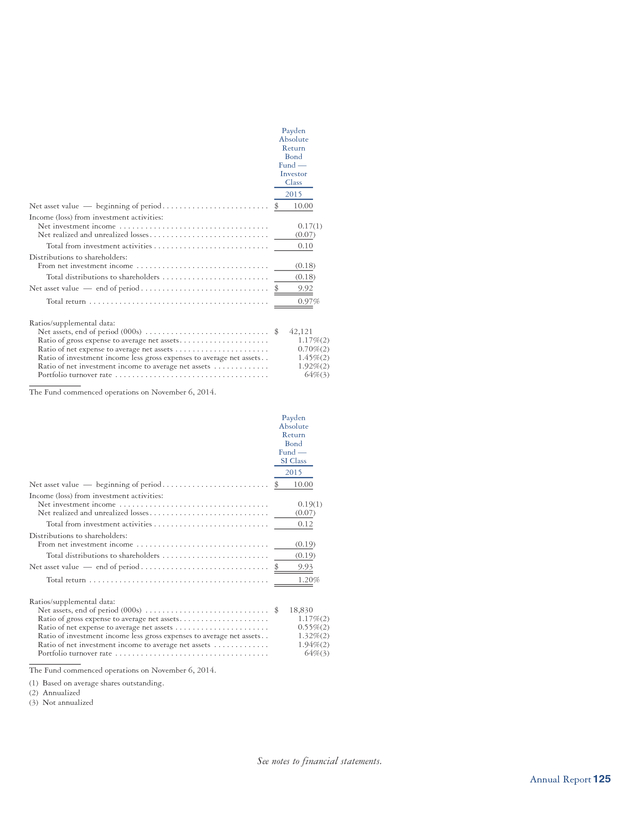
The largest boost to performance was from strong security selection. In addition, the Fund benefited from its high yield securities. The Payden Absolute Return Bond Fund, Investor Class (PYSGX) was launched November 6, 2014 and returned 0.97% for the period ended October 31, 2015, compared to a return of 0.18% for its cash alternative target, 1-month LIBOR. The Fund’s Adviser Class (PYAWX) returned 0.86% and its SI Class (PYAIX) returned 1.20% for the same period.
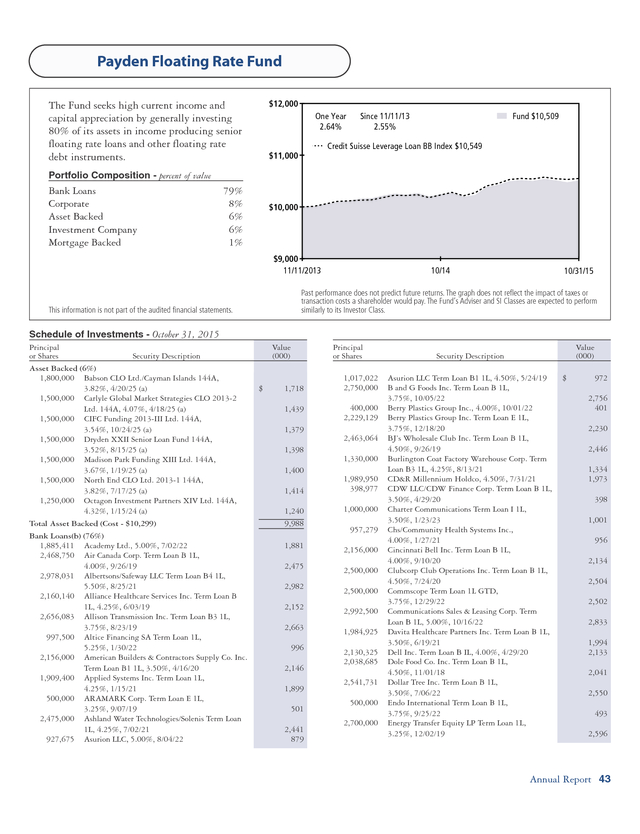
Fund allocations to private-labeled mortgage-backed securities had the largest positive contributions to return during the period. With weakness in commodity prices weighing heavily on high yield markets and some emerging market countries, both asset classes were detractors from performance. Despite elevated volatility in bond markets and diverging growth outlooks between developed and emerging economies, the Fund has managed to outperform its benchmark return over the period. We continue to find attractively valued investments and opportunities abound with corporations issuing a record amount of debt in 2015. Loan Strategy The floating rate, high yield loan market generated one of the better total returns in the fixed income market for the fiscal year ended October 31, 2015.
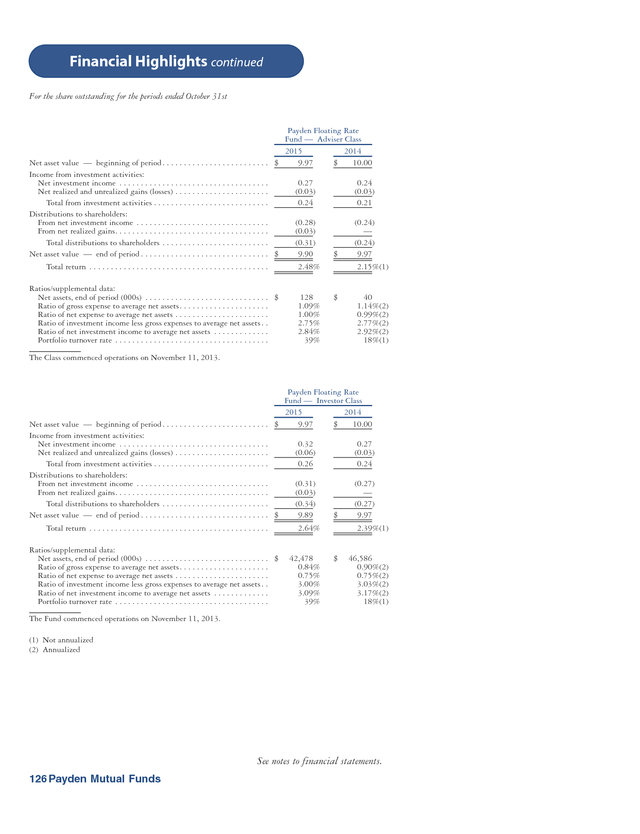
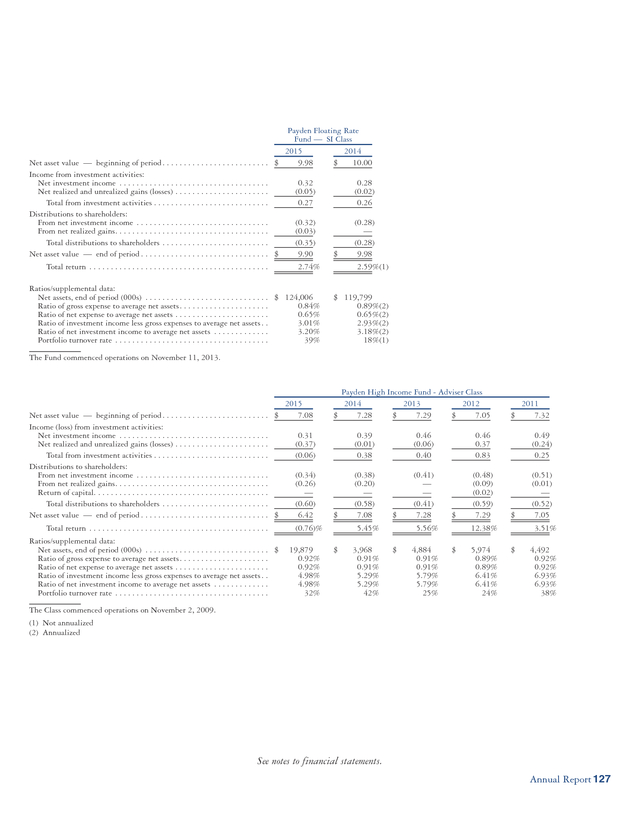
Similar to 2014, the loan market has benefitted from the almost $100 billion in new collateralized loan obligations (CLOs) that have been created in 2015 to-date. This new capital has created demand for new loans. For the year ended October 31, 2015, the Payden Floating Rate Fund, Investor Class (PYFRX) returned 2.64%, while, the Fund’s Adviser Class (PYFAX) returned 2.48% and its SI Class (PYFIX) returned 2.74%. The Fund’s benchmark, the Credit Suisse BB Loan Index, returned 3.12% for the same period.
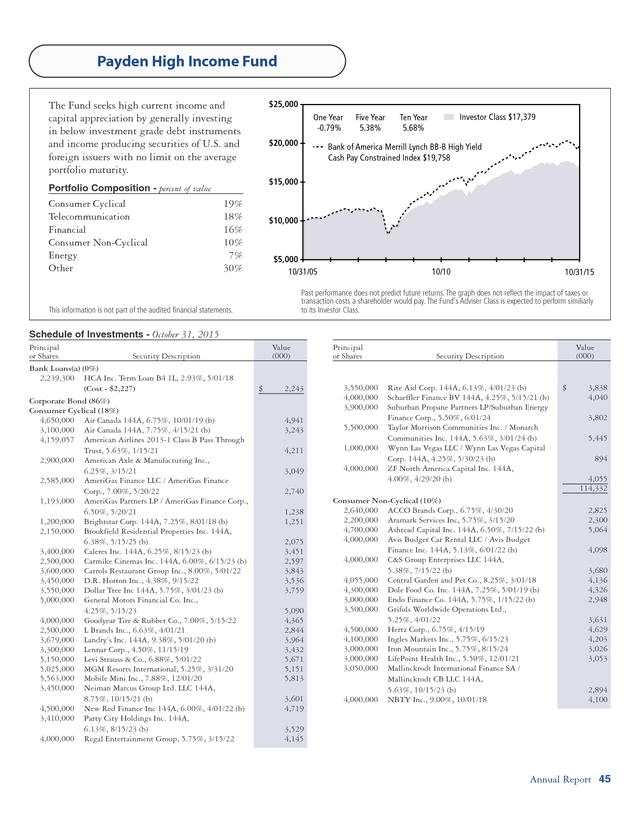
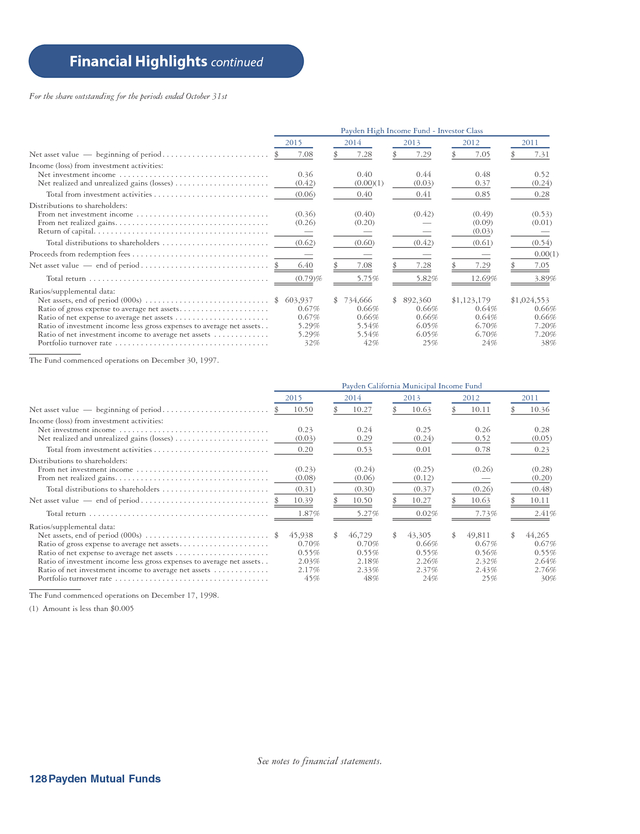
The Fund benefitted from its relative lack of energy and commodity exposure and generally higher-quality orientation. However, the Fund’s relative performance was negatively impacted by loan holdings rated single B, which under-performed the higher-quality BB rated loans of the index. 2 Payden Mutual Funds . High Yield Bond Strategy The high yield bond market had a more challenging period during the fiscal year ended October 31, 2015. Volatility in the energy and commodity sectors had a negative impact on the high yield bond market, as these two sectors comprise almost 20% of the broad high yield bond market. The Payden High Income, Investor Class (PYHRX) returned -0.79%, while the Fund’s Adviser Class (PYHWX) returned -0.76% for the fiscal year ended October 31, 2015. The Fund’s benchmark, the Bank of America Merrill Lynch BB-B High Yield Cash Pay Constrained Index, returned -0.63% for the fiscal year. A significant underweight to the energy sector and security selection therein added to relative performance during the fiscal year. Underweights and not owning positions in such large energy high yield issuers as Linn Energy and California Resource Corporation added materially to relative performance. Sub-optimal security selection in both the utility and commodities sectors detracted from relative performance.
The utility sector was negatively impacted by lower natural gas prices in the U.S., which hurt power utilities in the U.S. as it limited their ability to raise electricity prices. Portfolio holdings such as the alternative energy producer TerraForm Global and the electric utility Genon Energy Inc.
detracted from performance as the lower gas prices caused price dislocations in the U.S. electric power industry. Tax Exempt Strategies The municipal bond market performed strongly over the 12-months ended October 31, 2015. This performance was largely driven on the backdrop of a stable U.S.
Treasury market and improving credit fundamentals as broad U.S. economic growth has enabled state and local governments to stabilize budgets. Demand for municipal debt has proven supportive to offset the impacts of increased new issue supply as municipal issuers continue to refund outstanding debt at lower rates.
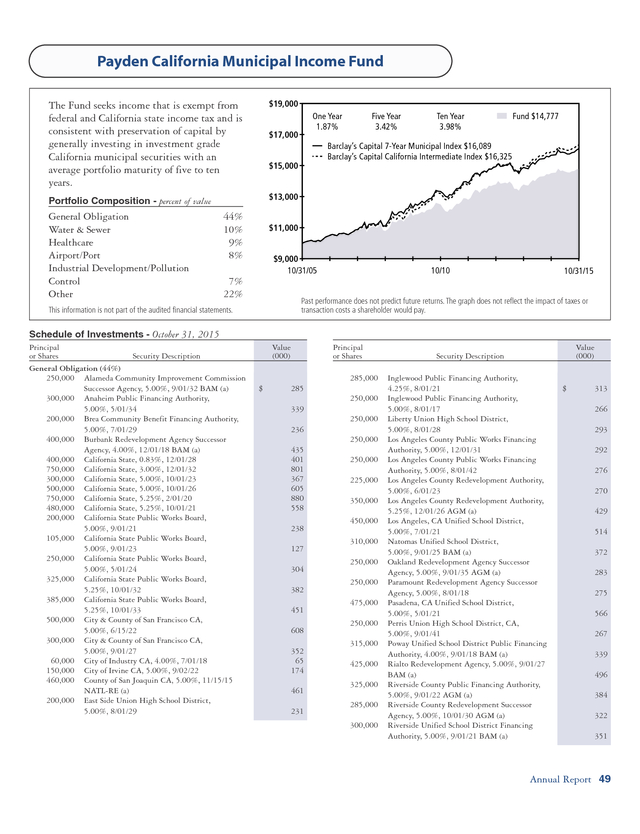
Municipal yield levels remained within a reasonable range of fair value relative to U.S. Treasury yields over the fiscal year. For the fiscal year ended October 31, 2015, the Payden California Municipal Income Fund (PYCRX) returned 1.87%. The Fund’s benchmarks, the Barclays Capital California Intermediate Index and the Barclays Capital 7-Year Municipal Index, returned 2.77% and 2.72%, respectively, for the same period.
The Fund’s underweight positioning to intermediate maturities was the primary contributor to the Fund’s underperformance as intermediate maturities were the top performers. This defensive positioning should help to offset the impact of an anticipated rising interest rate environment. Global Bond Strategy Global government bonds gave a mixed performance in the 12-months ended October 31, 2015. Bond markets, particularly in Europe, rallied strongly in early 2015, following the announcement of a substantial quantitative easing package by the European Central Bank.
Bond yields bottomed in mid-April at historically low levels, with 2-year maturity bond yields in many European markets going negative for the first time in response to the imposition of negative short-term interest rates by the European Central Bank and a number of central banks elsewhere in Europe. However, during April to June 2015 bond yields rose once again, as deflationary pressures eased and real yields rose. During July to September 2015, bond yields declined once again, as the Chinese economy showed further signs of weakness, which put significant downward pressure on commodity prices and inflation rates around the world.
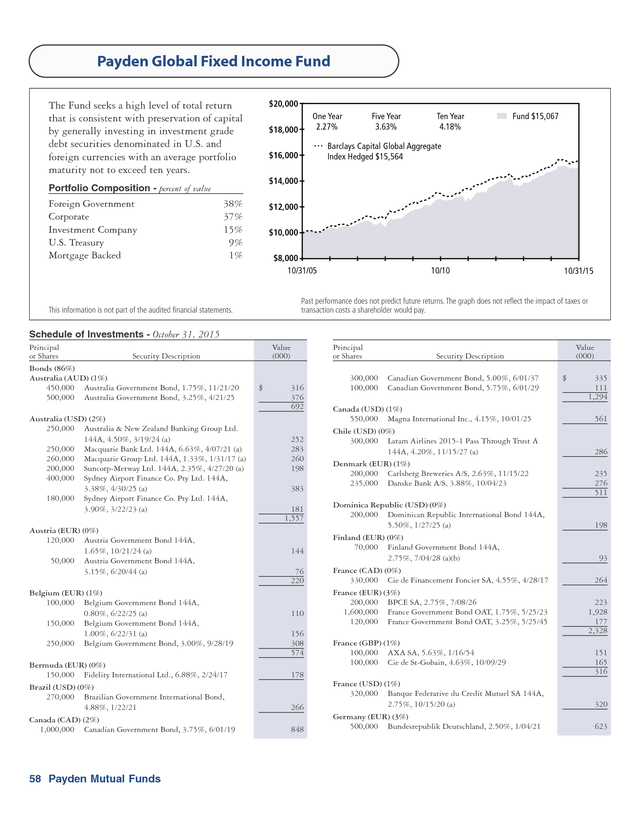
This led to a widening in credit spreads, particularly in the high yield bond market. The growing divergence in prospective monetary policy between the U.S., where rates did rise, and Europe/China/Japan, where rates could go lower still, led to a strong rally in the U.S. dollar versus the major currencies and in particular the emerging market commodity-linked currencies. For the year ended October 31, 2015, the Payden Global Fixed Income Fund (PYGFX) returned 2.27%, underperforming its benchmark, the Lehman Global Aggregate Index Hedged into USD, which returned 2.72%.
The primary detractors from relative returns were the Fund’s out-of-index allocations to the emerging markets and high yield sectors, as significant weakness in the price of oil and other commodities led to credit spread widening and underperformance relative to government bonds. The Fund’s overweight allocation to investment grade corporate bonds had a further modest negative performance impact, given the slight widening in yield spreads in the sector. Allocations to the mortgage-backed and asset-backed sectors added value.
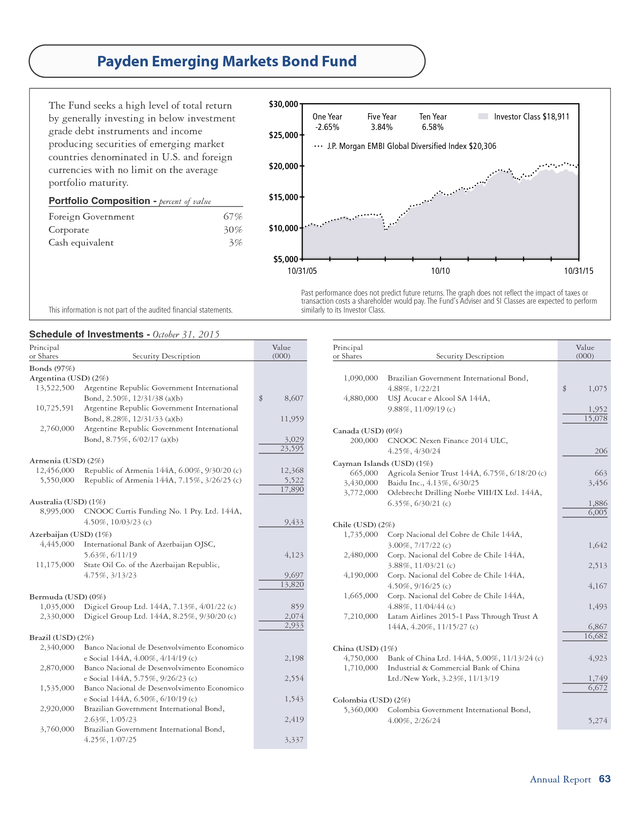
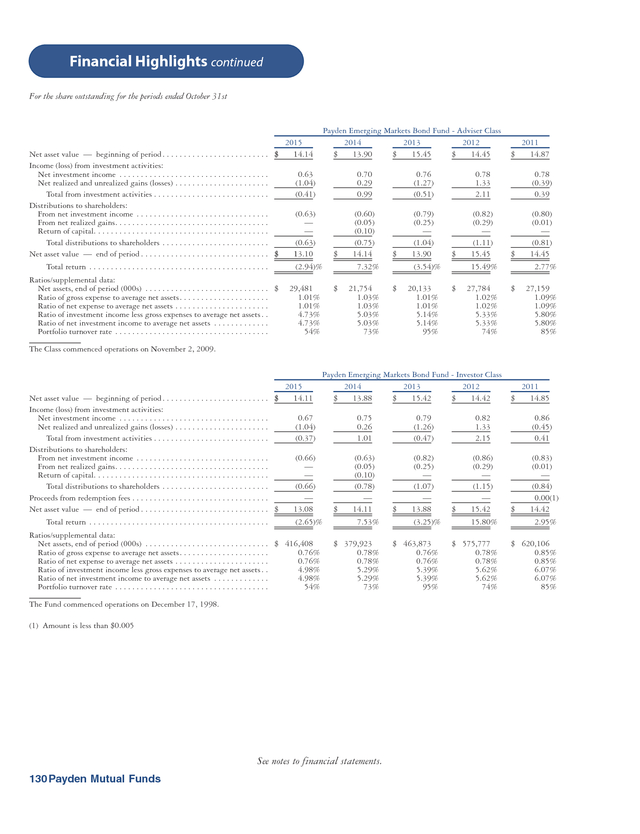
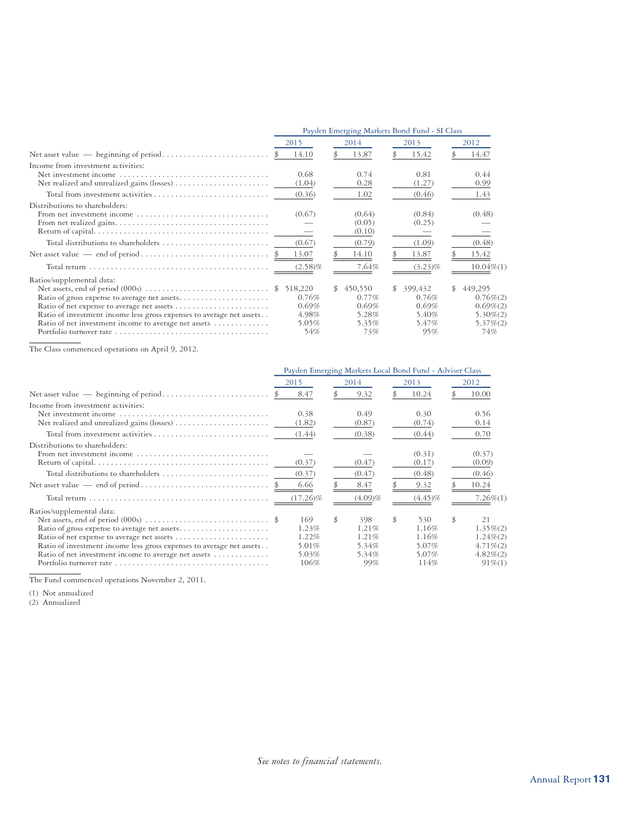
Active currency management had a significant positive performance impact, however, given the Fund’s long U.S. dollar position versus a number of currencies. Annual Report 3 . Management Discussion & Analysis continued Emerging Market Bond Strategies For the fiscal year ended October 31, 2015, emerging markets debt performance was generally weak, though dollar-pay bonds fared better than local currency bonds. The asset class was challenged by commodity price volatility, lack of clarity regarding the Federal Reserve Board’s monetary policy trajectory, and weaker economic performance in large emerging markets, including Brazil and China. Although spreads widened in both dollar-pay sovereign and corporate debt, total returns remained positive amid a supportive U.S. Treasury environment. In local currency debt, yields rose and currencies depreciated sharply against a strong U.S. dollar, leading to negative total returns. The Payden Emerging Markets Bond Fund, Investor Class (PYEMX) returned -2.65%, the Fund’s Adviser Class (PYEWX) returned -2.94%, and the Fund’s SI Class (PYEIX) returned -2.58% for the fiscal year ended October 31, 2015.
The Fund’s benchmark, the JP Morgan Emerging Market Bond Index Global Diversified, returned 0.39% for the same period. The Fund strategically reduced commodity and off-index corporate positions throughout the period. In Latin America, the Fund prefers Mexico exposure on sustained reform prospects, and is overweight Dominican Republic, Panama and Honduras as stronger growth countries that benefit from lower oil prices.
The Fund is underweight Brazil on economic and political headwinds, and cautious in oil-reliant Colombia and Ecuador. In Emerging Europe, the Fund is overweight Romania due to a positive fundamental outlook, and prefers Armenia and Georgia on compelling valuations. The Fund is underweight in Poland (on tight valuations), Russia and Turkey.
In Asia, the Fund is overweight India (on reform momentum), as well as Indonesia and Sri Lanka. Malaysia and the Philippines are underweights on tight valuations. In the Middle East and Africa, the Fund has exposure to Ghana and Senegal based on attractive valuations, while Lebanon and South Africa are underweights.
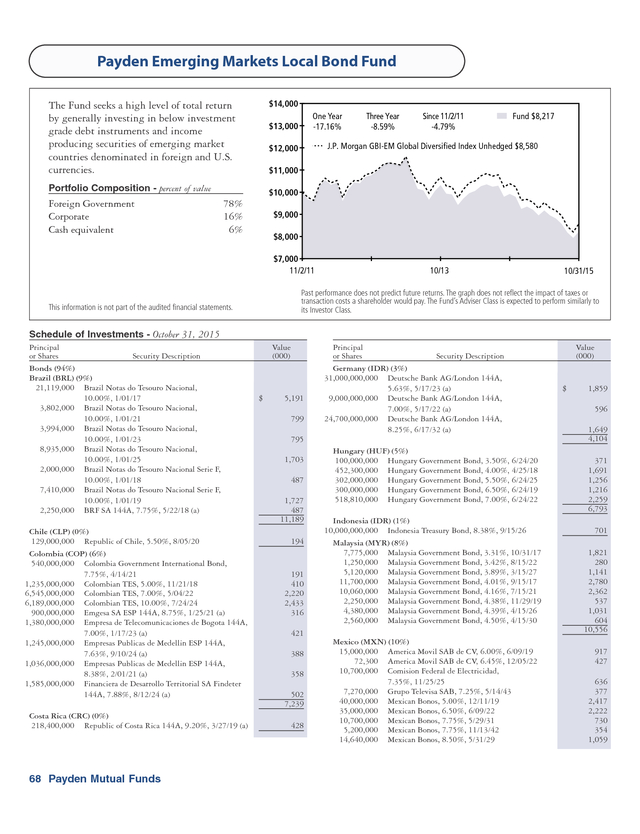
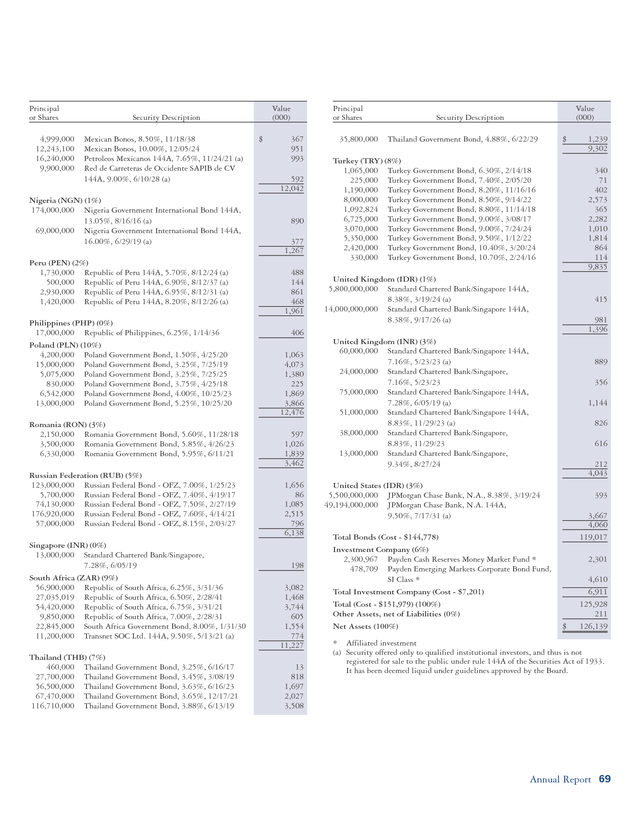
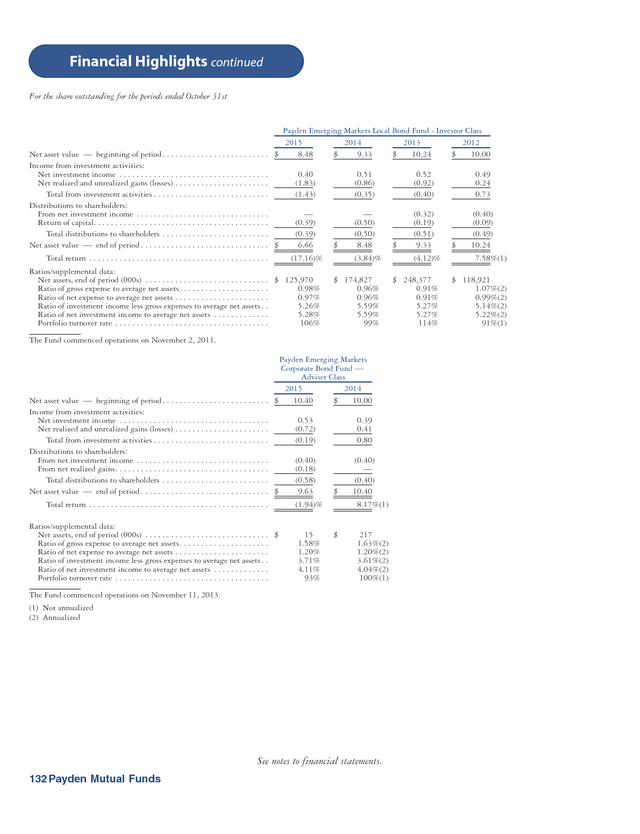
The Fund has a modest net short currency position and holds select corporates where the underlying sovereign view is positive. The Fund’s off-benchmark allocation to corporates was a key detractor from performance. Among sovereigns, an underweight to Russia and exposure to Zambia made negative contributions. In quasi-sovereigns, exposure to state oil companies, particularly in Kazakhstan and Mexico, detracted from performance. The Payden Emerging Markets Local Bond Fund, Investor Class (PYELX) returned -17.16%, and the Fund’s Adviser Class (PYEAX) returned -17.26% for the fiscal year ended October 31, 2015.
The Fund’s benchmark the JP Morgan Global Bond Index Emerging Market Global Diversified returned -17.42% for the period. In Latin America, the Fund holds an overweight in Mexican rates based on relative curve steepness, an underweight to Brazilian rates and the real, as well as an underweight to the Colombian peso on weak current account dynamics. In Emerging Europe, the Fund is overweight rates in Poland given low regional inflation, while underweight Turkish rates and the lira.
In Asia, the Fund is overweight Indian rates and the rupee, underweight Malaysian rates and the ringgit, underweight the Thai baht, and has a short position in the Chinese yuan. In South Africa, the Fund is neutral rates while underweight the currency. The Fund also holds a short euro position. The Fund outperformed by selecting better performing local debt in India, Indonesia, Romania and Poland.
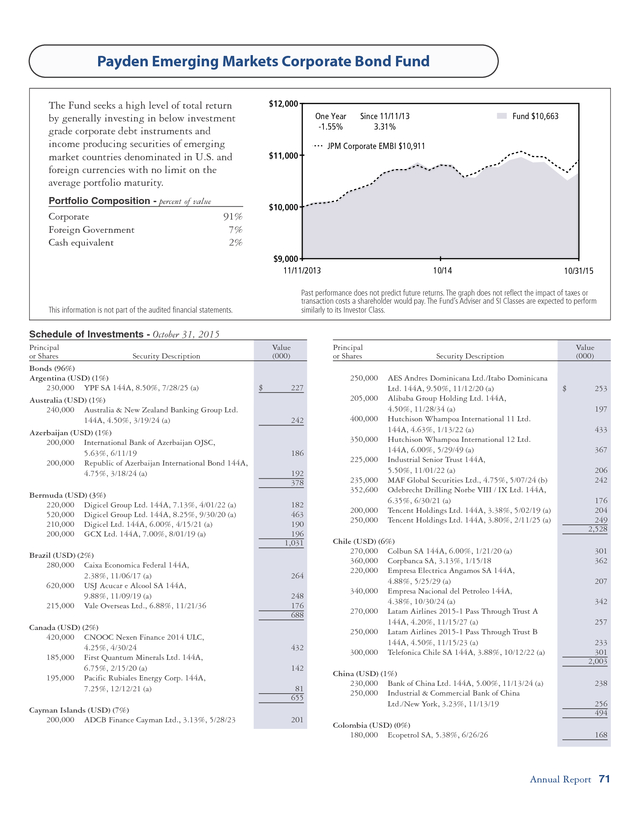
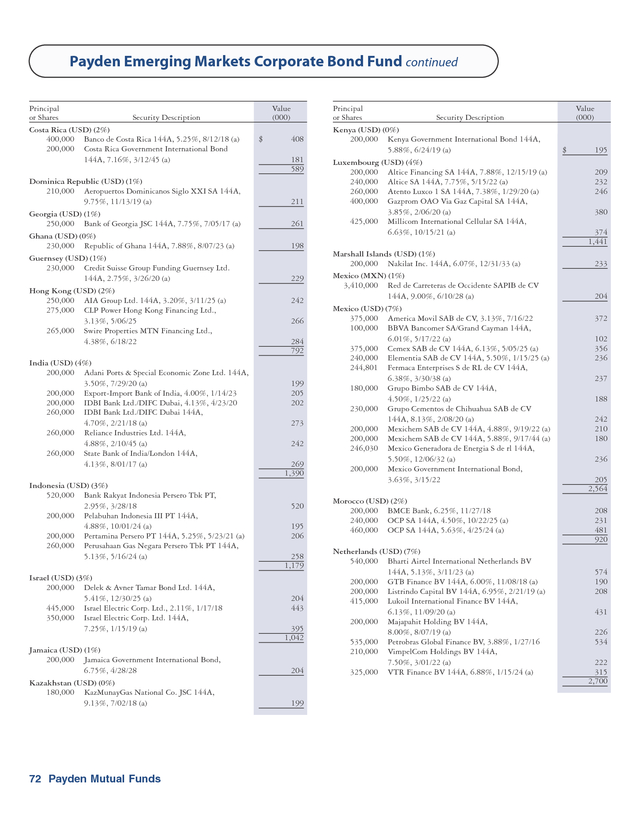
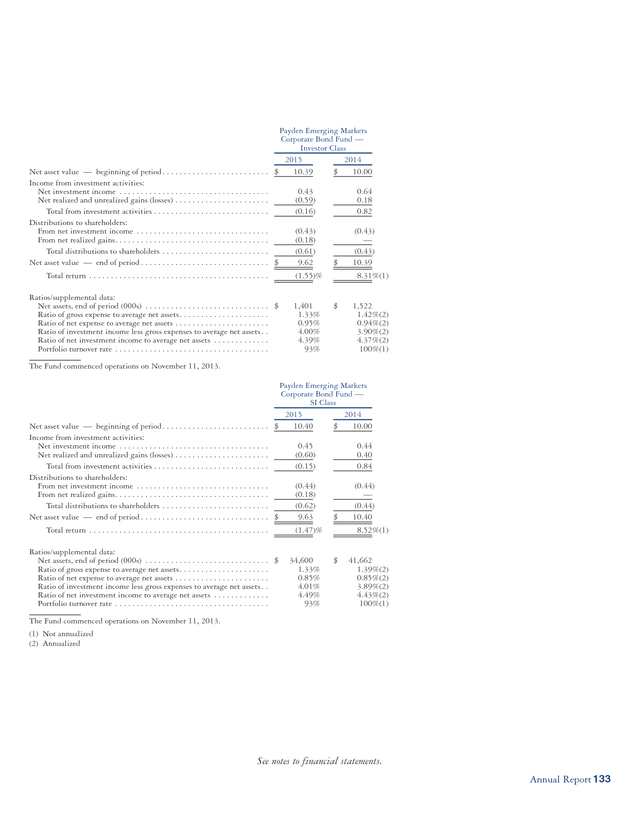
A short position in the euro, Malaysian ringgit, Brazilian real and South African rand also benefitted relative returns. The Payden Emerging Market Corporate Bond Fund, Investor Class (PYCEX) returned -1.55%, the Fund’s Adviser Class (PYCAX) returned -1.94%, and the Fund’s SI Class (PYCIX) returned -1.47% for the fiscal year ended October 31, 2015. The Fund’s benchmark, the JP Morgan Corporate Emerging Market Bond Index Broad Diversified, returned 0.93% for the same period. The Fund strategically reduced commodity positions throughout the period. In Latin America, the Fund holds overweight positions in Mexico, Chile and Jamaica, as well as the utilities and industrial sectors.
Underweight positions include Brazil, Colombia and Peru, as well as the financial, energy and metals & mining sectors. In Europe, overweights include Poland, Azerbaijan and the telecom sector, while underweights are concentrated in Russia and Turkey. In Asia, an underweight is expressed through South Korea, Thailand and the Philippines (on tight valuations), as well as the financial and consumer sectors.
Select Asia overweights include India, Indonesia, high-quality Chinese credits, and the telecom sector. The Fund is underweight the Middle East and Africa via Qatar and South Africa, against a select overweight in Morocco. An overweight allocation to high yield corporates was negative for relative returns. Specific Fund positions in Brazilian industrials, high yield Chinese entities (in the real estate and consumer sectors) and Colombian oil and gas detracted from performance. Underweights in Russia and Ukraine were negative as credit markets recovered following weak performance in 2014. 4 Payden Mutual Funds .
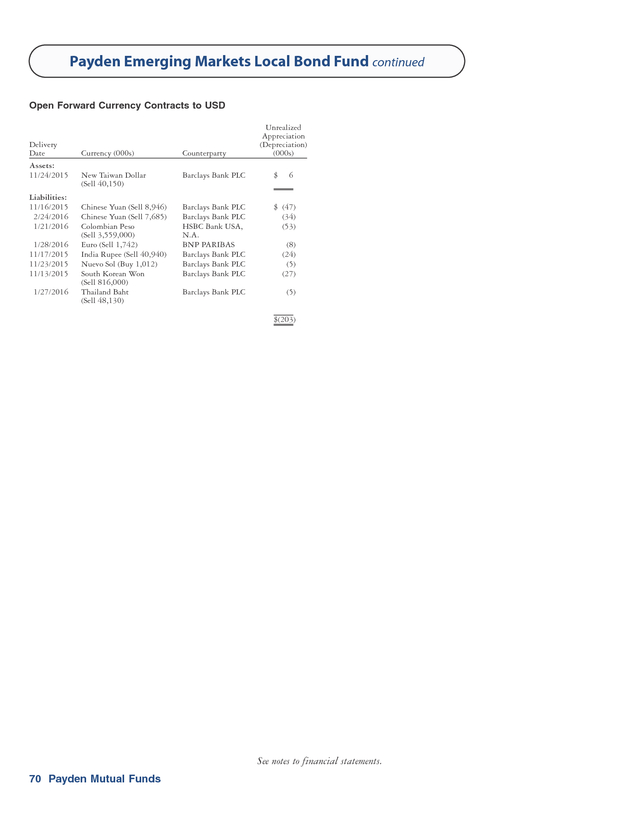
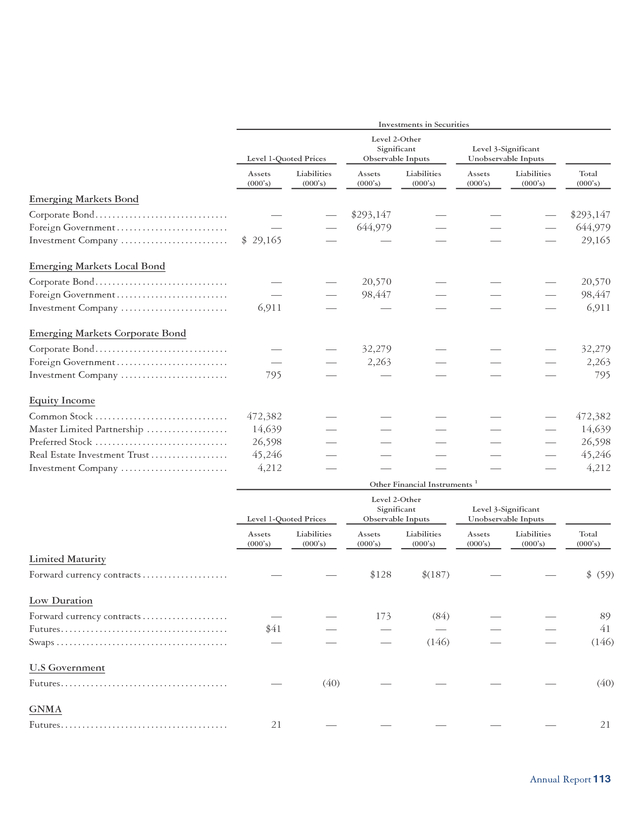
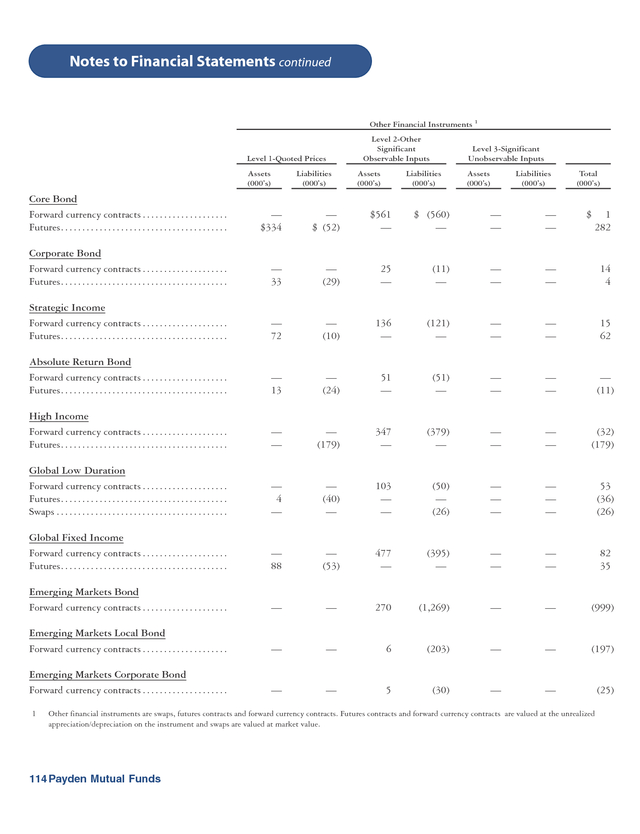
The Funds use currency forward contracts to manage risk and express fundamental views. The Funds use U.S. Treasury futures to manage interest rate risk in times of market volatility. U.S. Equity Strategy The U.S.
equity markets posted positive returns for the fiscal year ended October 31, 2015 as continued growth in the economy and gains in the labor market, together with accommodative global central banks, offset declining corporate profits, volatile markets overseas, and the collapse in oil prices. For the first nine months of the fiscal year, the markets had slowly grinded higher with the S&P 500 index trading in the tightest 6-month range in the history of the index since 1928. Despite economic weakness in Europe and fears of a Greek exit, the stock market rallied through the early summer as the European Central Bank began its own stimulus program and corporate earnings came in better-than-expected.
However, the summer brought a change in sentiment as China’s equity market began to suffer a dramatic selloff, leading to fears of a global economic slowdown due to subpar growth in China and emerging markets. Equity markets worldwide accelerated downward after the Chinese government surprised market participants by devaluing the yuan on August 11, 2015. Major stock indices fell into correction territory in late August.
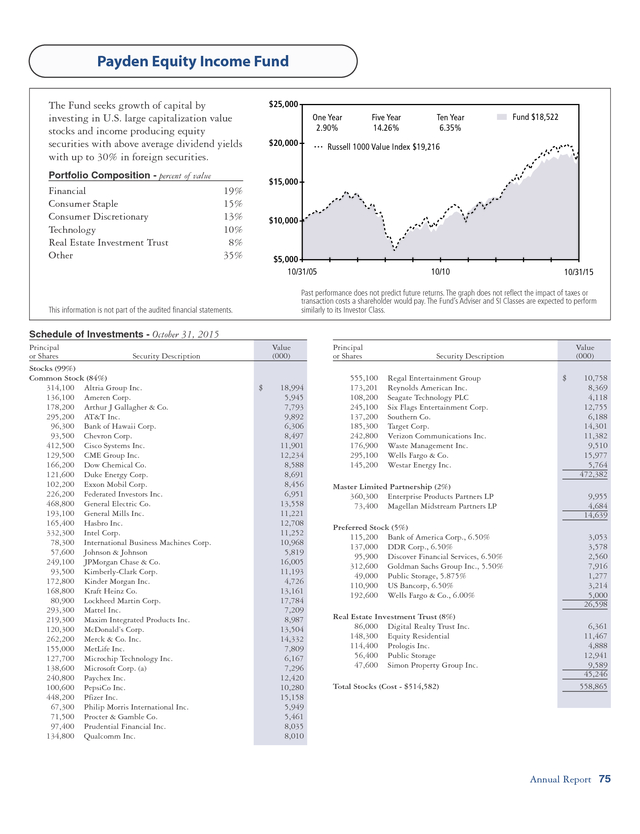
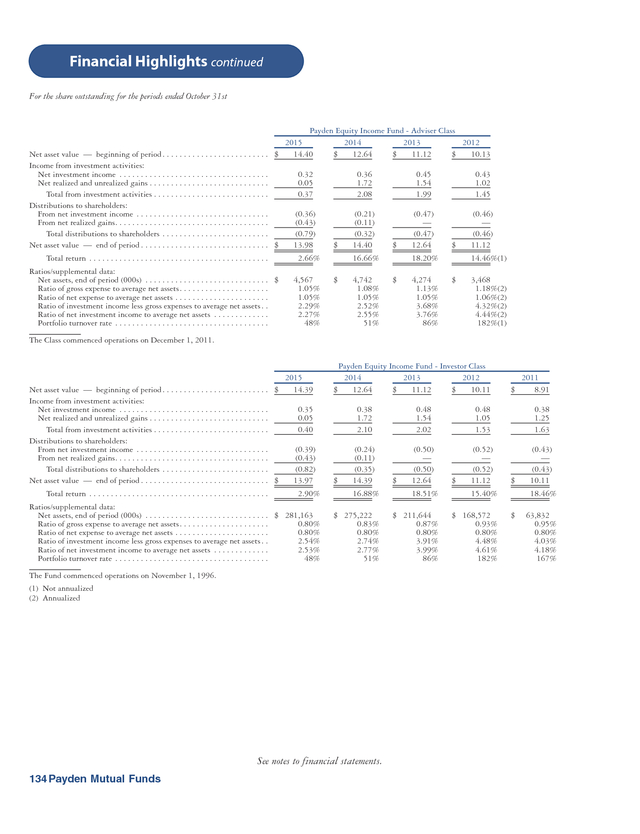
Contributing to the volatility, the Federal Reserve Board delayed hiking interest rates in September, citing weakness in overseas markets. But, the negative sentiment quickly turned around in October and the stock market bounced off of the lows. The fiscal year ended on a positive tone as macro concerns faded, with China stabilizing, central banks of Europe and Japan continuing to ease and earnings coming in better than expected. The Payden Equity Income Fund, Investor Class (PYVLX) which is comprised of large-cap value stocks, returned 2.90% for the fiscal year ended October 31, 2015, while the Fund’s Adviser Class (PYVAX) returned 2.66% and the Fund’s SI Class (PYVSX) returned 3.04% for the fiscal year.
The Fund’s benchmark, the Russell 1000 Value Index, returned 0.54% for the same time period. The Fund outperformed its benchmark due to its strong security selection, while the allocation to other security types detracted from relative performance. The allocation to real estate investment trusts and preferred stocks were positive contributors, but the allocation to master limited partnerships was a negative contributor as energy related stocks sold off with commodity prices. Within individual stock selection, the strongest areas of stock selection were in the consumer staples and industrials sectors, while the weakest area was in the health care sector.
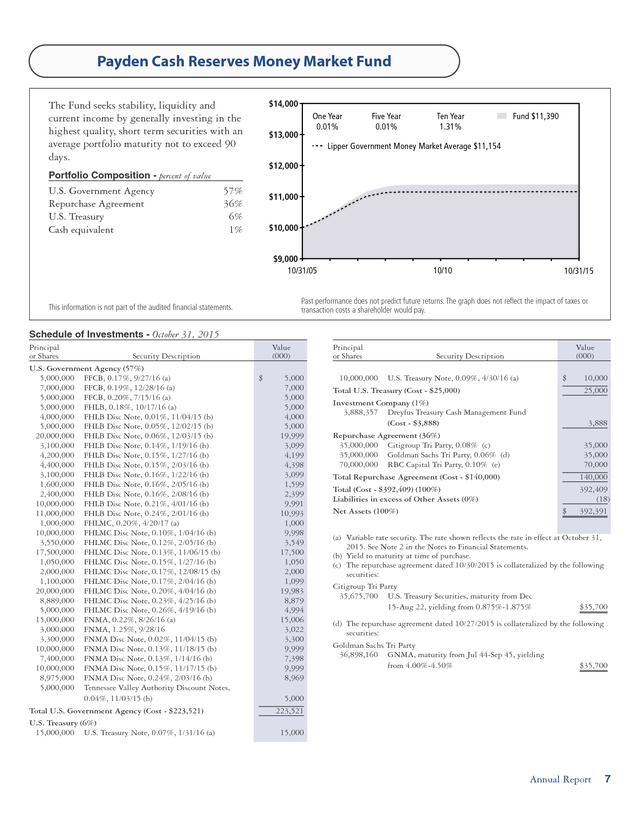
Strong performers in the Fund were food company Kraft Heinz and discount retailer Target. Annual Report 5 . Portfolio Highlights & Investments Investment Abbreviations AMBAC - American Municipal Bond Assurance Co. ARM - Adjustable Rate Mortgage FDIC - Federal Deposit Insurance Corporation FFCB - Federal Farm Credit Bank FG - Freddie Mac Gold Pool FH - Freddie Mac Non Gold Pool FHLB - Federal Home Loan Banks FHLMC - Federal Home Loan Mortgage Company (Freddie Mac) FHR - Freddie Mac REMICS FN - Fannie Mae Pool FNMA - Federal National Mortgage Association (Fannie Mae) FNR - Fannie Mae REMICS FNW - Fannie Mae Whole Loan G2 - Ginnie Mae II pool GN - Ginnie Mae I pool GNMA - Government National Mortgage Association (Ginnie Mae) GNR - Ginnie Mae REMICS NCUA - National Credit Union Administration REMICS - Real Estate Mortgage Investment Conduits 6 Payden Mutual Funds . Payden Cash Reserves Money Market Fund $14,000 The Fund seeks stability, liquidity and current income by generally investing in the highest quality, short term securities with an average portfolio maturity not to exceed 90 days. One Year 0.01% $13,000 Five Year 0.01% Ten Year 1.31% Fund $11,390 Lipper Government Money Market Average $11,154 $12,000 Portfolio Composition - percent of value U.S. Government Agency Repurchase Agreement U.S. Treasury Cash equivalent 57% 36% 6% 1% $11,000 $10,000 $9,000 10/31/05 10/10 10/31/15 Past performance does not predict future returns. The graph does not reflect the impact of taxes or transaction costs a shareholder would pay. This information is not part of the audited financial statements. Schedule of Investments - October 31, 2015 Principal or Shares Security Description U.S.
Government Agency (57%) 5,000,000 FFCB, 0.17%, 9/27/16 (a) 7,000,000 FFCB, 0.19%, 12/28/16 (a) 5,000,000 FFCB, 0.20%, 7/15/16 (a) 5,000,000 FHLB, 0.18%, 10/17/16 (a) 4,000,000 FHLB Disc Note, 0.01%, 11/04/15 (b) 5,000,000 FHLB Disc Note, 0.05%, 12/02/15 (b) 20,000,000 FHLB Disc Note, 0.06%, 12/03/15 (b) 3,100,000 FHLB Disc Note, 0.14%, 1/19/16 (b) 4,200,000 FHLB Disc Note, 0.15%, 1/27/16 (b) 4,400,000 FHLB Disc Note, 0.15%, 2/03/16 (b) 3,100,000 FHLB Disc Note, 0.16%, 1/22/16 (b) 1,600,000 FHLB Disc Note, 0.16%, 2/05/16 (b) 2,400,000 FHLB Disc Note, 0.16%, 2/08/16 (b) 10,000,000 FHLB Disc Note, 0.21%, 4/01/16 (b) 11,000,000 FHLB Disc Note, 0.24%, 2/01/16 (b) 1,000,000 FHLMC, 0.20%, 4/20/17 (a) 10,000,000 FHLMC Disc Note, 0.10%, 1/04/16 (b) 3,550,000 FHLMC Disc Note, 0.12%, 2/05/16 (b) 17,500,000 FHLMC Disc Note, 0.13%, 11/06/15 (b) 1,050,000 FHLMC Disc Note, 0.15%, 1/27/16 (b) 2,000,000 FHLMC Disc Note, 0.17%, 12/08/15 (b) 1,100,000 FHLMC Disc Note, 0.17%, 2/04/16 (b) 20,000,000 FHLMC Disc Note, 0.20%, 4/04/16 (b) 8,889,000 FHLMC Disc Note, 0.23%, 4/25/16 (b) 5,000,000 FHLMC Disc Note, 0.26%, 4/19/16 (b) 15,000,000 FNMA, 0.22%, 8/26/16 (a) 3,000,000 FNMA, 1.25%, 9/28/16 3,300,000 FNMA Disc Note, 0.02%, 11/04/15 (b) 10,000,000 FNMA Disc Note, 0.13%, 11/18/15 (b) 7,400,000 FNMA Disc Note, 0.13%, 1/14/16 (b) 10,000,000 FNMA Disc Note, 0.15%, 11/17/15 (b) 8,975,000 FNMA Disc Note, 0.24%, 2/03/16 (b) 5,000,000 Tennessee Valley Authority Discount Notes, 0.04%, 11/03/15 (b) Total U.S. Government Agency (Cost - $223,521) U.S. Treasury (6%) 15,000,000 U.S.
Treasury Note, 0.07%, 1/31/16 (a) Value (000) $ 5,000 7,000 5,000 5,000 4,000 5,000 19,999 3,099 4,199 4,398 3,099 1,599 2,399 9,991 10,993 1,000 9,998 3,549 17,500 1,050 2,000 1,099 19,983 8,879 4,994 15,006 3,022 3,300 9,999 7,398 9,999 8,969 Principal or Shares Value (000) Security Description 10,000,000 U.S. Treasury Note, 0.09%, 4/30/16 (a) Total U.S. Treasury (Cost - $25,000) Investment Company (1%) 3,888,357 Dreyfus Treasury Cash Management Fund (Cost - $3,888) Repurchase Agreement (36%) 35,000,000 Citigroup Tri Party, 0.08% (c) 35,000,000 Goldman Sachs Tri Party, 0.06% (d) 70,000,000 RBC Capital Tri Party, 0.10% (e) Total Repurchase Agreement (Cost - $140,000) Total (Cost - $392,409) (100%) Liabilities in excess of Other Assets (0%) Net Assets (100%) $ 10,000 25,000 3,888 $ 35,000 35,000 70,000 140,000 392,409 (18) 392,391 (a) Variable rate security.
The rate shown reflects the rate in effect at October 31, 2015. See Note 2 in the Notes to Financial Statements. (b) Yield to maturity at time of purchase. (c) The repurchase agreement dated 10/30/2015 is collateralized by the following securities: Citigroup Tri Party 35,675,700 U.S. Treasury Securities, maturity from Dec 15-Aug 22, yielding from 0.875%-1.875% $35,700 (d) The repurchase agreement dated 10/27/2015 is collateralized by the following securities: Goldman Sachs Tri Party 36,898,160 GNMA, maturity from Jul 44-Sep 45, yielding from 4.00%-4.50% $35,700 5,000 223,521 15,000 Annual Report 7 .
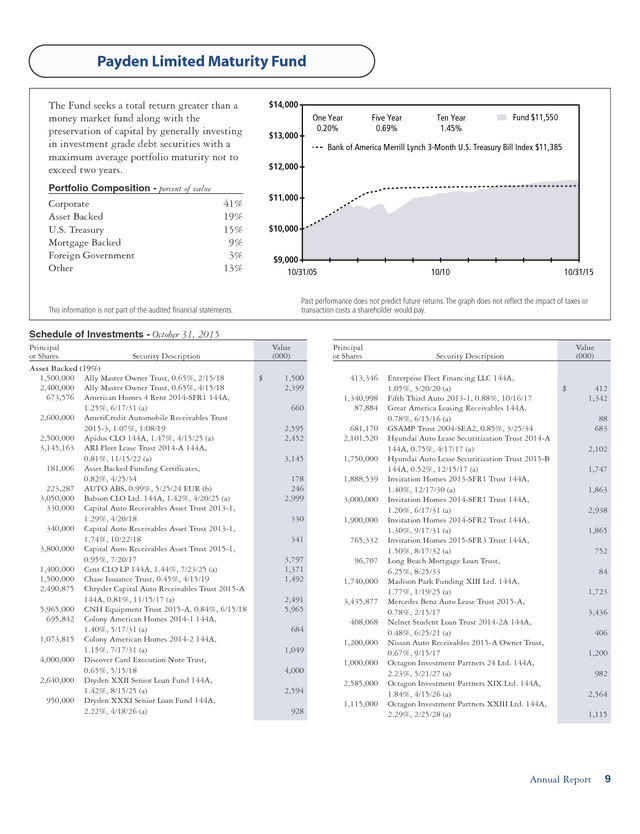
Payden Cash Reserves Money Market Fund continued (e) The repurchase agreement dated 10/30/2015 is collateralized by the following securities: RBC Capital Tri Party 61,728,569 FNMA, maturity from Oct 25-Oct 45, yielding from 2.50%-5.00% $56,283 14,527,101 GNMA, maturity from Jul 40-May 65, yielding from 2.588%-4.00% 15,117 Total Collateral Value of RBC Capital $71,400 Offsetting Assets and Liabilities The Fund’s investments in repurchase agreements were all subject to enforceable Master Repurchase Agreements. Repurchase Agreements on a gross basis were as follows: (000s) Repurchase Agreement Total gross amount of repurchase agreements presented on the Statements of Assets and Liabilities Non-cash Collateral Net Amount See notes to financial statements. 8 Payden Mutual Funds $140,000 (70,000) $70,000 . Payden Limited Maturity Fund $14,000 The Fund seeks a total return greater than a money market fund along with the preservation of capital by generally investing in investment grade debt securities with a maximum average portfolio maturity not to exceed two years. One Year 0.20% $13,000 Five Year 0.69% Ten Year 1.45% Fund $11,550 Bank of America Merrill Lynch 3-Month U.S. Treasury Bill Index $11,385 $12,000 Portfolio Composition - percent of value Corporate Asset Backed U.S. Treasury Mortgage Backed Foreign Government Other $11,000 41% 19% 15% 9% 3% 13% $10,000 $9,000 10/31/05 10/10 10/31/15 Past performance does not predict future returns. The graph does not reflect the impact of taxes or transaction costs a shareholder would pay. This information is not part of the audited financial statements. Schedule of Investments - October 31, 2015 Principal or Shares Security Description Asset Backed (19%) 1,500,000 Ally Master Owner Trust, 0.65%, 2/15/18 2,400,000 Ally Master Owner Trust, 0.65%, 4/15/18 673,576 American Homes 4 Rent 2014-SFR1 144A, 1.25%, 6/17/31 (a) 2,600,000 AmeriCredit Automobile Receivables Trust 2015-3, 1.07%, 1/08/19 2,500,000 Apidos CLO 144A, 1.47%, 4/15/25 (a) 3,145,163 ARI Fleet Lease Trust 2014-A 144A, 0.81%, 11/15/22 (a) 181,006 Asset Backed Funding Certificates, 0.82%, 4/25/34 223,287 AUTO ABS, 0.99%, 5/25/24 EUR (b) 3,050,000 Babson CLO Ltd.
144A, 1.42%, 4/20/25 (a) 330,000 Capital Auto Receivables Asset Trust 2013-1, 1.29%, 4/20/18 340,000 Capital Auto Receivables Asset Trust 2013-1, 1.74%, 10/22/18 3,800,000 Capital Auto Receivables Asset Trust 2015-1, 0.95%, 7/20/17 1,400,000 Cent CLO LP 144A, 1.44%, 7/23/25 (a) 1,500,000 Chase Issuance Trust, 0.45%, 4/15/19 2,490,875 Chrysler Capital Auto Receivables Trust 2015-A 144A, 0.81%, 11/15/17 (a) 5,965,000 CNH Equipment Trust 2015-A, 0.84%, 6/15/18 695,842 Colony American Homes 2014-1 144A, 1.40%, 5/17/31 (a) 1,073,815 Colony American Homes 2014-2 144A, 1.15%, 7/17/31 (a) 4,000,000 Discover Card Execution Note Trust, 0.65%, 5/15/18 2,640,000 Dryden XXII Senior Loan Fund 144A, 1.42%, 8/15/25 (a) 950,000 Dryden XXXI Senior Loan Fund 144A, 2.22%, 4/18/26 (a) Value (000) $ Principal or Shares 1,500 2,399 413,346 660 1,340,998 87,884 2,595 2,452 681,170 2,101,520 3,145 1,750,000 178 246 2,999 1,888,539 330 1,900,000 341 765,332 3,797 1,371 1,492 96,707 2,491 5,965 684 1,049 4,000 2,594 928 3,000,000 1,740,000 3,435,877 408,068 1,200,000 1,000,000 2,585,000 1,115,000 Value (000) Security Description Enterprise Fleet Financing LLC 144A, 1.05%, 3/20/20 (a) Fifth Third Auto 2013-1, 0.88%, 10/16/17 Great America Leasing Receivables 144A, 0.78%, 6/15/16 (a) GSAMP Trust 2004-SEA2, 0.85%, 3/25/34 Hyundai Auto Lease Securitization Trust 2014-A 144A, 0.75%, 4/17/17 (a) Hyundai Auto Lease Securitization Trust 2015-B 144A, 0.52%, 12/15/17 (a) Invitation Homes 2013-SFR1 Trust 144A, 1.40%, 12/17/30 (a) Invitation Homes 2014-SFR1 Trust 144A, 1.20%, 6/17/31 (a) Invitation Homes 2014-SFR2 Trust 144A, 1.30%, 9/17/31 (a) Invitation Homes 2015-SFR3 Trust 144A, 1.50%, 8/17/32 (a) Long Beach Mortgage Loan Trust, 6.25%, 8/25/33 Madison Park Funding XIII Ltd. 144A, 1.77%, 1/19/25 (a) Mercedes Benz Auto Lease Trust 2015-A, 0.78%, 2/15/17 Nelnet Student Loan Trust 2014-2A 144A, 0.48%, 6/25/21 (a) Nissan Auto Receivables 2015-A Owner Trust, 0.67%, 9/15/17 Octagon Investment Partners 24 Ltd. 144A, 2.23%, 5/21/27 (a) Octagon Investment Partners XIX Ltd.
144A, 1.84%, 4/15/26 (a) Octagon Investment Partners XXIII Ltd. 144A, 2.29%, 2/25/28 (a) $ 412 1,342 88 683 2,102 1,747 1,863 2,938 1,865 752 84 1,723 3,436 406 1,200 982 2,564 1,115 Annual Report 9 . Payden Limited Maturity Fund continued Principal or Shares Value (000) Security Description Option One Mortgage Loan Trust 2005-4 Asset-Backed Certificates Series 2005-4, 0.46%, 11/25/35 2,000,000 Progress Residential 2015-SFR1 Trust 144A, 1.60%, 2/17/32 (a) 510,625 SLM Student Loan Trust, 0.56%, 4/25/17 3,955,000 Symphony CLO XV Ltd. 144A, 1.77%, 10/17/26 (a) 3,220,000 Trade MAPS 1 Ltd. 144A, 0.90%, 12/10/18 (a) 2,530,000 Tyron Park CLO Ltd. 144A, 1.44%, 7/15/25 (a) 2,910,828 Volkswagen Auto Lease Trust 2015-A, 0.87%, 6/20/17 Total Asset Backed (Cost - $82,823) Bank Loans(c) (1%) 747,500 Activision Blizzard Inc.
Term Loan B 1L, 3.25%, 10/11/20 857,857 ARAMARK Corp. Term Loan E 1L, 3.25%, 9/07/19 1,046,878 General Nutrition Co. Inc.
Term Loan B 1L, 3.25%, 3/04/19 Total Bank Loans (Cost - $2,650) Commercial Paper (6%) 4,000,000 Airgas 144A, 0.00%, 12/23/15 (a) 4,000,000 Ameren 144A, 0.00%, 11/12/15 (a) 4,000,000 Amphenol 144A, 0.00%, 11/19/15 (a) 3,500,000 Aon 144A, 0.00%, 11/03/15 (a) 2,500,000 Hyundai Capital 144A, 0.00%, 11/17/15 (a) 3,500,000 Reckitt Benckiser Treasury 144A, 0.00%, 1/12/16 (a) 2,500,000 Thomson Reuters 144A, 0.00%, 11/18/15 (a) Total Commercial Paper (Cost - $23,992) Corporate Bond (41%) 1,500,000 Abbey National Treasury Services PLC/Stamford CT, 0.85%, 3/13/17 2,330,000 AbbVie Inc., 1.80%, 5/14/18 1,840,000 Actavis Funding SCS, 1.20%, 9/01/16 600,000 Actavis Funding SCS, 1.30%, 6/15/17 920,000 Actavis Funding SCS, 1.42%, 3/12/18 940,000 Actavis Funding SCS, 1.85%, 3/01/17 980,000 AES Corp./VA, 3.32%, 6/01/19 1,550,000 Air Lease Corp., 4.50%, 1/15/16 735,000 Aircastle Ltd., 6.75%, 4/15/17 500,000 Alibaba Group Holding Ltd. 144A, 1.63%, 11/28/17 (a) 750,000 Allied Irish Banks PLC, 2.88%, 11/28/16 EUR (b) 1,000,000 Ally Financial Inc., 3.50%, 7/18/16 1,240,000 American Express Co., 0.92%, 5/22/18 1,610,000 Amgen Inc., 0.71%, 5/22/17 400,000 Anglo American Capital PLC 144A, 1.27%, 4/15/16 (a) 780,000 ANZ New Zealand International Ltd./London 144A, 0.84%, 4/27/17 (a) 710,000 ANZ New Zealand International Ltd./London 144A, 1.13%, 3/24/16 (a) Principal or Shares 695,429 10 Payden Mutual Funds 1,500,000 $ 690 1,978 509 1,150,000 440,000 1,600,000 3,913 3,213 2,492 1,350,000 1,600,000 700,000 160,000 670,000 2,909 82,222 770,000 930,000 750 859 1,015 2,624 3,998 4,000 3,999 3,500 2,500 3,498 2,500 23,995 1,720,000 860,000 1,200,000 770,000 1,000,000 600,000 1,540,000 1,350,000 1,100,000 210,000 1,220,000 1,170,000 1,750,000 1,500,000 300,000 1,150,000 1,497 2,333 1,838 595 915 943 936 1,560 783 497 841 1,009 1,239 1,606 398 780 711 350,000 500,000 1,770,000 2,430,000 390,000 1,000,000 2,225,000 750,000 750,000 1,100,000 1,000,000 680,000 600,000 790,000 940,000 1,600,000 1,050,000 Value (000) Security Description Ardagh Packaging Finance PLC / Ardagh Holdings USA Inc. 144A, 3.34%, 12/15/19 (a) ASIF III Jersey Ltd., 5.38%, 10/14/16 GBP (b) AutoZone Inc., 1.30%, 1/13/17 Aviation Capital Group Corp.
144A, 2.88%, 9/17/18 (a) Bank of America Corp., 0.80%, 3/28/18 EUR (b) Bank of America Corp., 0.88%, 5/02/17 Bank of America Corp., 1.70%, 8/25/17 Bank of America Corp., 3.88%, 3/22/17 Bank of New York Mellon Corp., 0.89%, 8/01/18 Bank of Tokyo-Mitsubishi UFJ Ltd. 144A, 1.20%, 3/10/17 (a) Bank of Tokyo-Mitsubishi UFJ Ltd. 144A, 1.45%, 9/08/17 (a) Barclays Bank PLC, 0.90%, 2/17/17 Barclays PLC, 2.00%, 3/16/18 BAT International Finance PLC 144A, 0.85%, 6/15/18 (a) Baxalta Inc.
144A, 1.10%, 6/22/18 (a) Bear Stearns Companies LLC, 5.55%, 1/22/17 Becton Dickinson and Co., 0.79%, 6/15/16 Becton Dickinson and Co., 1.45%, 5/15/17 Bell Canada, 1.33%, 4/22/16 CAD (b) BNZ International Funding Ltd./London 144A, 1.90%, 2/26/18 (a) BP Capital Markets PLC, 0.82%, 5/10/18 BP Capital Markets PLC, 0.96%, 9/26/18 BP Capital Markets PLC, 1.67%, 2/13/18 BPCE SA, 1.16%, 2/10/17 Branch Banking & Trust Co., 0.66%, 9/13/16 British Telecommunications PLC, 1.25%, 2/14/17 British Telecommunications PLC, 8.50%, 12/07/16 GBP (b) Cameron International Corp., 1.40%, 6/15/17 Canadian Natural Resources Ltd., 1.75%, 1/15/18 Capital One NA/Mclean VA, 1.01%, 2/05/18 Carnival Corp., 1.20%, 2/05/16 Celgene Corp., 2.13%, 8/15/18 CIT Group Inc., 4.25%, 8/15/17 Citigroup Inc., 0.60%, 6/09/16 Citigroup Inc., 1.24%, 11/30/17 EUR (b) Citigroup Inc., 1.85%, 11/24/17 Citizens Bank NA/Providence RI, 1.60%, 12/04/17 CNH Capital LLC, 3.88%, 11/01/15 CNH Industrial Capital LLC 144A, 3.88%, 7/16/18 (a) CNPC General Capital Ltd. 144A, 1.21%, 5/14/17 (a) Commonwealth Bank of Australia/New York NY, 1.75%, 11/02/18 Compass Bank, 1.85%, 9/29/17 ConAgra Foods Inc., 0.69%, 7/21/16 ConocoPhillips Co., 0.65%, 5/15/18 $ 1,481 1,839 440 1,601 1,473 1,586 702 165 670 766 930 1,720 859 1,200 768 1,048 600 1,540 1,032 1,102 209 1,216 1,175 1,756 1,497 300 1,904 347 493 1,763 2,433 393 1,025 2,216 825 753 1,092 1,000 683 598 789 936 1,595 1,044 . Principal or Shares 1,090,000 1,800,000 1,200,000 900,000 1,840,000 1,860,000 800,000 1,000,000 1,270,000 350,000 600,000 650,000 200,000 800,000 500,000 1,460,000 610,000 1,000,000 520,000 300,000 800,000 1,800,000 1,000,000 2,270,000 106,000 1,750,000 1,200,000 400,000 1,700,000 1,510,000 980,000 880,000 620,000 550,000 300,000 990,000 720,000 480,000 1,000,000 800,000 170,000 1,200,000 Value (000) Security Description Credit Agricole SA/London 144A, 1.12%, 4/15/19 (a) Credit Agricole SA/London 144A, 1.30%, 6/10/20 (a) Credit Suisse/New York NY, 0.82%, 5/26/17 Credit Suisse/New York NY, 1.01%, 1/29/18 CVS Health Corp., 1.90%, 7/20/18 Daimler Finance North America LLC 144A, 0.63%, 3/02/17 (a) Daimler Finance North America LLC 144A, 1.38%, 8/01/17 (a) DISH DBS Corp., 7.13%, 2/01/16 Dominion Resources Inc./VA, 1.25%, 3/15/17 Enbridge Inc., 0.78%, 6/02/17 Enbridge Inc., 0.98%, 10/01/16 Enbridge Inc., 1.21%, 3/13/17 CAD (b) ERAC USA Finance LLC 144A, 1.40%, 4/15/16 (a) Fifth Third Bank/Cincinnati OH, 1.15%, 11/18/16 Ford Credit Canada Ltd., 1.32%, 3/18/16 CAD (b) Ford Motor Credit Co. LLC, 1.17%, 3/12/19 Ford Motor Credit Co. LLC, 1.59%, 5/09/16 Ford Motor Credit Co. LLC, 2.15%, 1/09/18 Freeport-McMoRan Inc., 2.30%, 11/14/17 GATX Corp., 1.25%, 3/04/17 GE Capital UK Funding, 0.74%, 3/20/17 GBP (b) General Motors Financial Co.
Inc., 1.68%, 4/10/18 General Motors Financial Co. Inc., 2.75%, 5/15/16 Glencore Funding LLC 144A, 1.68%, 1/15/19 (a) Glencore Funding LLC 144A, 2.13%, 4/16/18 (a) Goldman Sachs Group Inc., 3.63%, 2/07/16 HBOS PLC, 0.77%, 9/01/16 EUR (b) Hess Corp., 1.30%, 6/15/17 Hewlett Packard Enterprise Co. 144A, 2.25%, 10/05/18 (a) Hewlett Packard Enterprise Co.
144A, 2.45%, 10/05/17 (a) HSBC Bank PLC 144A, 0.96%, 5/15/18 (a) HSBC USA Inc., 0.78%, 3/03/17 HSBC USA Inc., 1.21%, 9/24/18 Huntington National Bank, 1.30%, 11/20/16 Huntington National Bank, 1.35%, 8/02/16 Hyundai Capital America 144A, 1.45%, 2/06/17 (a) Imperial Tobacco Finance PLC 144A, 2.05%, 7/20/18 (a) Industrial & Commercial Bank of China Ltd./New York, 2.35%, 11/13/17 International Lease Finance Corp., 3.88%, 4/15/18 Jackson National Life Global Funding 144A, 1.25%, 2/21/17 (a) Johnson Controls Inc., 1.40%, 11/02/17 JPMorgan Chase & Co., 1.07%, 5/30/17 GBP (b) $ Principal or Shares 1,083 1,802 1,197 899 1,855 1,848 795 1,013 1,265 344 598 492 200 802 382 1,430 612 1,001 491 298 1,230 1,797 1,007 1,819 93 1,764 1,321 397 1,600,000 490,000 900,000 370,000 350,000 1,640,000 1,590,000 1,300,000 640,000 1,600,000 820,000 1,570,000 670,000 1,500,000 620,000 1,750,000 1,750,000 1,900,000 930,000 1,130,000 1,360,000 1,070,000 1,250,000 1,000,000 500,000 2,560,000 600,000 640,000 500,000 650,000 1,706 1,515 978 878 622 550 301 1,000,000 900,000 660,000 1,200,000 630,000 500,000 986 1,600,000 721 484 700,000 1,130,000 1,017 800,000 799 169 1,827 920,000 2,000,000 Value (000) Security Description JPMorgan Chase & Co., 1.27%, 1/23/20 Kinder Morgan Inc./DE, 2.00%, 12/01/17 Kroger Co., 0.85%, 10/17/16 L-3 Communications Corp., 1.50%, 5/28/17 Lowe’s Companies Inc., 0.94%, 9/14/18 Macquarie Bank Ltd. 144A, 0.95%, 10/27/17 (a) Macquarie Group Ltd. 144A, 1.33%, 1/31/17 (a) Martin Marietta Materials Inc., 1.43%, 6/30/17 Mitsubishi UFJ Trust & Banking Corp.
144A, 1.60%, 10/16/17 (a) Mizuho Bank Ltd. 144A, 0.75%, 4/16/17 (a) Mizuho Bank Ltd. 144A, 0.78%, 9/25/17 (a) Morgan Stanley, 1.06%, 7/23/19 Morgan Stanley, 1.60%, 4/25/18 Morgan Stanley, 3.80%, 4/29/16 Morgan Stanley, 6.63%, 4/01/18 National City Bank/Cleveland OH, 0.70%, 6/07/17 NBCUniversal Enterprise Inc.
144A, 1.01%, 4/15/18 (a) Nederlandse Waterschapsbank NV 144A, 1.25%, 9/18/17 (a) New York Life Global Funding 144A, 1.55%, 11/02/18 (a) Nissan Motor Acceptance Corp. 144A, 1.00%, 3/15/16 (a) Nomura Holdings Inc., 1.79%, 9/13/16 Nordea Bank AB 144A, 1.17%, 9/17/18 (a) NSTAR Electric Co., 0.56%, 5/17/16 NXP BV / NXP Funding LLC 144A, 3.50%, 9/15/16 (a) PACCAR Financial Corp., 0.93%, 12/06/18 Penske Truck Leasing Co. LP / PTL Finance Corp.
144A, 2.50%, 3/15/16 (a) Perrigo Co. PLC 144A, 1.30%, 11/08/16 (a) Reliance Standard Life Global Funding II 144A, 2.15%, 10/15/18 (a) Reynolds American Inc., 2.30%, 6/12/18 Rogers Communications Inc., 1.36%, 3/13/17 CAD (b) Sabine Pass LNG LP, 7.50%, 11/30/16 Santander Bank NA, 2.00%, 1/12/18 Seagate HDD Cayman, 3.75%, 11/15/18 Shaw Communications Inc., 1.52%, 2/01/16 CAD (b) Sinopec Capital 2013 Ltd. 144A, 1.25%, 4/24/16 (a) Societe Des Autoroutes Paris-Rhin-Rhone, 0.71%, 3/31/19 EUR (b) Standard Chartered PLC 144A, 0.67%, 9/08/17 (a) Statoil ASA, 0.80%, 11/08/18 Sumitomo Mitsui Banking Corp., 0.75%, 1/10/17 Sumitomo Mitsui Banking Corp., 1.14%, 3/18/16 GBP (b) Suntory Holdings Ltd.
144A, 1.65%, 9/29/17 (a) SunTrust Bank/Atlanta GA, 0.76%, 2/15/17 $ 1,602 480 899 365 351 1,632 1,593 1,292 638 1,595 817 1,554 679 1,523 689 1,742 1,752 1,909 929 1,132 1,367 1,076 1,249 1,007 502 2,573 594 640 508 495 1,037 897 668 918 631 554 1,584 695 1,128 1,235 918 1,995 Annual Report 11 . Payden Limited Maturity Fund continued Principal or Shares Value (000) Security Description 1,005,000 450,000 800,000 330,000 1,750,000 300,000 770,000 670,000 130,000 460,000 1,500,000 1,750,000 1,000,000 Synchrony Financial, 1.88%, 8/15/17 TECO Finance Inc., 0.92%, 4/10/18 Tencent Holdings Ltd. 144A, 2.00%, 5/02/17 (a) Thermo Fisher Scientific Inc., 1.30%, 2/01/17 Thermo Fisher Scientific Inc., 3.20%, 3/01/16 Thomson Reuters Corp., 1.30%, 2/23/17 Thomson Reuters Corp., 1.65%, 9/29/17 Total Capital International SA, 0.88%, 8/10/18 TransAlta Corp., 1.90%, 6/03/17 TSMC Global Ltd. 144A, 0.95%, 4/03/16 (a) UBS AG/Stamford CT, 1.03%, 3/26/18 Union Bank NA, 1.08%, 9/26/16 United Utilities Water PLC, 6.13%, 12/29/15 GBP (b) 1,000,000 UnitedHealth Group Inc., 0.77%, 1/17/17 500,000 UnitedHealth Group Inc., 1.45%, 7/17/17 300,000 Ventas Realty LP, 1.25%, 4/17/17 430,000 Ventas Realty LP, 1.55%, 9/26/16 2,200,000 Verizon Communications Inc., 0.73%, 6/09/17 210,000 Verizon Communications Inc., 1.10%, 6/17/19 850,000 Verizon Communications Inc., 2.09%, 9/14/18 9,200,000 Volvo Treasury AB, 0.88%, 6/03/16 SEK (b) 250,000 Walgreens Boots Alliance Inc., 1.75%, 11/17/17 570,000 WEA Finance LLC / Westfield UK & Europe Finance PLC 144A, 1.75%, 9/15/17 (a) 400,000 Whirlpool Corp., 1.65%, 11/01/17 640,000 Windstream Corp., 7.88%, 11/01/17 400,000 WM Wrigley Jr. Co.
144A, 1.40%, 10/21/16 (a) 410,000 Xcel Energy Inc., 0.75%, 5/09/16 1,190,000 Zimmer Holdings Inc., 1.45%, 4/01/17 Total Corporate Bond (Cost - $176,381) FDIC Guaranteed (0%) 100,303 FDIC Structured Sale Guaranteed Notes 144A, 0.74%, 2/25/48 (a) 1,777,500 FDIC Structured Sale Guaranteed Notes 144A, 0.91%, 12/04/20 (a) Total FDIC Guaranteed (Cost - $1,878) Foreign Government (3%) 1,600,000 Instituto de Credito Oficial 144A, 1.13%, 4/01/16 (a) 960,000,000 Japan Government Two Year Bond, 0.10%, 3/15/16 JPY (b) 1,600,000 Province of New Brunswick Canada, 0.96%, 8/01/19 CAD (b) Total Foreign Government (Cost - $11,071) Mortgage Backed (9%) 41,459 Bear Stearns ALT-A Trust, 2.46%, 3/25/34 2,304,538 BLCP Hotel Trust 2014-CLRN 144A, 1.15%, 8/15/29 (a) 1,770,000 Del Coronado Trust 144A, 1.00%, 3/15/26 (a) 985,424 Fannie Mae Connecticut Avenue Securities, 1.15%, 5/25/24 2,051,419 Fannie Mae Connecticut Avenue Securities, 1.39%, 7/25/24 2,240,000 Fannie Mae Connecticut Avenue Securities, 1.79%, 4/25/28 1,122,235 Fannie Mae Connecticut Avenue Securities, 1.80%, 1/25/24 12 Payden Mutual Funds $ Principal or Shares 1,006 447 801 330 1,763 300 770 672 128 459 1,499 1,753 1,555 1,001 503 299 432 2,194 209 874 1,081 250 568 401 681 401 410 1,188 173,852 100 1,784 1,884 1,602 7,959 1,220 10,781 40 2,293 1,770 976 2,047 2,243 1,125 Value (000) Security Description 922,051 Fannie Mae Connecticut Avenue Securities, 2.20%, 10/25/23 4,400,000 FFCB, 0.23%, 1/02/18 385,527 FH 1B2612 ARM, 2.30%, 11/01/34 168,660 FH 847515 ARM, 2.40%, 2/01/34 73,048 FN 708229 ARM, 2.06%, 4/01/33 1,235,893 FN 784365 ARM, 1.93%, 5/01/34 1,248,735 FN 870542 ARM, 2.14%, 3/01/36 67,436 FN 878544 ARM, 2.48%, 3/01/36 285,151 FN 889821 ARM, 2.23%, 12/01/36 951,609 FN 906140 ARM, 2.23%, 1/01/37 367,184 FN AD0079 ARM, 2.36%, 11/01/35 637,338 FN AL0502 ARM, 3.01%, 6/01/41 684,435 Freddie Mac Structured Agency Credit Risk Debt Notes, 1.20%, 2/25/24 558,908 Freddie Mac Structured Agency Credit Risk Debt Notes, 1.65%, 11/25/23 185,410 GNR 2002-48 FT, 0.40%, 12/16/26 850,000 Granite Master Issuer PLC, 1.06%, 12/17/54 609,969 Harborview Mortgage Loan Trust, 2.84%, 1/19/35 1,241,686 Hilton USA Trust 2013-HLF 144A, 1.19%, 11/05/30 (a) 1,200,000 JP Morgan Chase Commercial Mortgage Securities Trust 2015-COSMO 144A, 1.45%, 1/15/32 (a) 1,917,872 JP Morgan Seasoned Mortgage Trust 2014-1 144A, 0.70%, 5/25/33 (a) 124,974 MASTR Asset Securitization Trust, 5.00%, 7/25/19 2,500,000 Pepper Residential Securities Trust No 14, 0.53%, 6/12/16 2,400,000 Permanent Master Issuer PLC, 0.82%, 7/15/42 133,523 Sequoia Mortgage Trust, 0.99%, 10/20/27 693,801 Sequoia Mortgage Trust, 1.45%, 2/25/43 846,371 Sequoia Mortgage Trust, 1.55%, 4/25/43 258,222 Sequoia Mortgage Trust, 2.87%, 1/25/42 648,613 Springleaf Mortgage Loan Trust 144A, 1.27%, 6/25/58 (a) 363,556 Springleaf Mortgage Loan Trust 144A, 1.78%, 12/25/65 (a) 565,686 Springleaf Mortgage Loan Trust 144A, 1.87%, 9/25/57 (a) 249,942 Structured Adjustable Rate Mortgage Loan Trust, 2.48%, 9/25/34 72,497 Structured Asset Mortgage Investments Inc., 3.72%, 7/25/32 Total Mortgage Backed (Cost - $37,537) Municipal (0%) 260,000 California Earthquake Authority, 1.19%, 7/01/16 1,090,000 Indiana Finance Authority, 0.60%, 5/01/34 Total Municipal (Cost - $1,350) NCUA Guaranteed (1%) 640,027 NCUA Guaranteed Notes Trust 2010-R1, 0.65%, 10/07/20 $ 930 4,401 412 180 77 1,297 1,330 72 303 1,016 391 670 684 559 186 839 571 1,232 1,196 1,853 127 2,500 2,400 131 674 823 260 650 365 567 217 75 37,482 261 1,090 1,351 643 . Principal or Shares NCUA Guaranteed Notes Trust 2010-R2, 0.56%, 11/06/17 1,831,217 NCUA Guaranteed Notes Trust 2010-R3, 0.75%, 12/08/20 606,718 NCUA Guaranteed Notes Trust 2011-R1, 0.65%, 1/08/20 42,193 NCUA Guaranteed Notes Trust 2011-R2, 0.59%, 2/06/20 402,682 NCUA Guaranteed Notes Trust 2011-R5, 0.57%, 4/06/20 Total NCUA Guaranteed (Cost - $3,842) U.S. Government Agency (3%) 14,400,000 FHLMC, 0.20%, 4/20/17 (Cost - $14,397) U.S. Treasury (15%) 5,500,000 U.S. Treasury Note, 0.16%, 10/31/16 (d) 22,210,000 U.S.
Treasury Note, 0.19%, 1/31/17 1,000,000 U.S. Treasury Note, 0.25%, 4/15/16 5,000,000 U.S. Treasury Note, 0.38%, 5/31/16 16,800,000 U.S.
Treasury Note, 0.50%, 8/31/16 14,510,000 U.S. Treasury Note, 0.63%, 9/30/17 Total U.S. Treasury (Cost - $65,051) Purchased Put Options (0%) 146 Eurodollar 1-Year Mid-Curve Option, 97.5, 3/11/16 85 Eurodollar 1-Year Mid-Curve Option, 97.875, 12/11/15 Total Purchased Put Options (Cost - $41) Investment Company (2%) 6,386,564 Payden Cash Reserves Money Market Fund * (Cost - $6,387) Total (Cost - $427,400) (100%) Liabilities in excess of Other Assets (0%) Net Assets (100%) Open Forward Currency Contracts to USD Value (000) Security Description 311,891 $ 313 1,845 609 42 403 3,855 Delivery Date Assets: 11/9/2015 11/9/2015 11/9/2015 Liabilities: 11/9/2015 11/9/2015 Unrealized Appreciation (Depreciation) (000s) Currency (000s) Counterparty Euro (Sell 4,835) Japanese Yen (Sell 960,500) Swedish Krona (Sell 9,256) Citibank, N.A. Barclays Bank PLC BNP PARIBAS $ 88 15 25 $ 128 British Pound (Sell 6,357) HSBC Bank USA, N.A. Royal Bank of Canada $(176) Canadian Dollar (Sell 5,942) (11) $(187) 14,402 5,499 22,209 1,000 5,002 16,814 14,479 65,003 1 1 2 $ 6,387 423,840 (844) 422,996 * Affiliated investment (a) Security offered only to qualified institutional investors, and thus is not registered for sale to the public under rule 144A of the Securities Act of 1933. It has been deemed liquid under guidelines approved by the Board. (b) Principal in foreign currency. (c) Variable rate security.
The rate shown reflects the rate in effect at October 31, 2015. The stated maturity is subject to prepayments. See Note 2 in the Notes to Financial Statements. (d) All or a portion of the security is pledged to cover futures contract margin requirements. See notes to financial statements. Annual Report 13 .
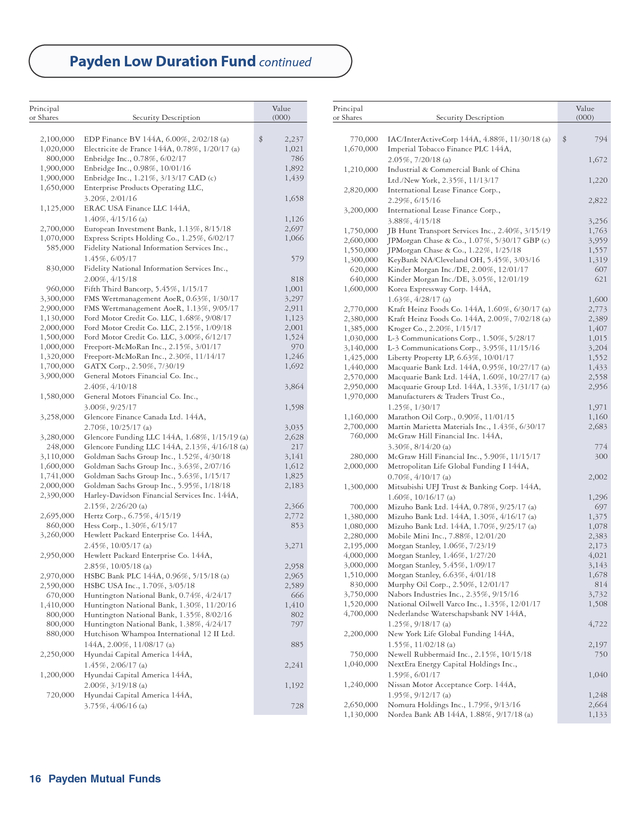
Payden Low Duration Fund The Fund seeks a high level of total return that is consistent with preservation of capital by generally investing in investment grade securities with a maximum average portfolio maturity not to exceed three years. $16,000 Portfolio Composition - percent of value $13,000 Corporate U.S. Treasury Asset Backed Mortgage Backed Other One Year 0.50% $15,000 Ten Year 2.93% Fund $13,350 Bank of America Merrill Lynch 1-3 Year Treasury Index $12,838 $14,000 49% 27% 12% 7% 5% Five Year 1.37% $12,000 $11,000 $10,000 $9,000 10/31/05 10/10 10/31/15 Past performance does not predict future returns. The graph does not reflect the impact of taxes or transaction costs a shareholder would pay. This information is not part of the audited financial statements. Schedule of Investments - October 31, 2015 Principal or Shares Security Description Asset Backed (12%) 2,089,063 American Homes 4 Rent 2014-SFR1 144A, 1.25%, 6/17/31 (a) 6,360,000 Apidos CLO 144A, 1.47%, 4/15/25 (a) 500,000 Apidos CLO 144A, 2.02%, 4/15/25 (a) 2,000,000 Babson CLO Ltd. 144A, 1.42%, 4/20/25 (a) 1,900,000 Babson CLO Ltd.
144A, 3.17%, 4/20/27 (a) 7,420,000 Barclays Dryrock Issuance Trust 2015-4, 1.72%, 8/16/21 670,000 Capital Auto Receivables Asset Trust 2013-1, 1.29%, 4/20/18 845,000 Capital Auto Receivables Asset Trust 2013-1, 1.74%, 10/22/18 4,915,000 Capital Auto Receivables Asset Trust 2015-2, 1.39%, 9/20/18 4,550,000 Cent CLO LP 144A, 1.44%, 7/23/25 (a) 1,900,000 Chase Issuance Trust, 0.45%, 4/15/19 2,242,159 Colony American Homes 2014-1 144A, 1.40%, 5/17/31 (a) 2,265,848 Colony American Homes 2014-2 144A, 1.15%, 7/17/31 (a) 4,905,000 Dryden XXII Senior Loan Fund 144A, 1.42%, 8/15/25 (a) 3,140,000 Dryden XXII Senior Loan Fund 144A, 1.87%, 8/15/25 (a) 550,000 Dryden XXXI Senior Loan Fund 144A, 2.22%, 4/18/26 (a) 685,000 Dryden XXXI Senior Loan Fund 144A, 3.17%, 4/18/26 (a) 3,340,000 Fifth Third Auto Trust 2015-1, 1.02%, 5/15/18 750,000 Great America Leasing Receivables Funding LLC 144A, 1.83%, 6/17/19 (a) 1,238,491 GSAMP Trust, 0.85%, 3/25/34 2,634,270 Invitation Homes 2013-SFR1 Trust 144A, 1.40%, 12/17/30 (a) 14 Payden Mutual Funds Value (000) Principal or Shares Value (000) Security Description 4,020,000 $ 2,048 6,238 488 1,967 1,862 7,418 669 847 4,912 4,455 1,890 2,203 2,214 4,820 3,049 537 668 3,340 750 1,241 2,599 Invitation Homes 2014-SFR2 Trust 144A, 1.30%, 9/17/31 (a) 4,025,134 Kubota Credit Owner Trust 2015-1 144A, 0.94%, 12/15/17 (a) 763,057 L.A. Arena Funding LLC 144A, 7.66%, 12/15/26 (a) 1,200,000 Madison Park Funding XVII Ltd 144A, 3.18%, 7/21/27 (a) 1,850,000 Mercedes Benz Auto Lease Trust 2015-A, 1.10%, 8/15/17 3,675,000 Octagon Investment Partners XIX Ltd. 144A, 2.32%, 4/15/26 (a) 2,500,000 Octagon Investment Partners XXIII Ltd.
144A, 2.29%, 2/25/28 (a) 8,300,000 Symphony CLO XV Ltd. 144A, 1.77%, 10/17/26 (a) 196,076 Toyota Auto Receivables 2013-A Owner Trust, 0.55%, 1/17/17 4,250,000 Trade MAPS 1 Ltd. 144A, 0.90%, 12/10/18 (a) 2,085,000 Tyron Park CLO Ltd.
144A, 1.44%, 7/15/25 (a) 4,215,000 Tyron Park CLO Ltd. 144A, 1.85%, 7/15/25 (a) 1,160,000 Venture XVII CLO Ltd. 144A, 3.17%, 7/15/26 (a) 1,893,294 VOLT XXII LLC 144A, 3.50%, 2/25/55 (a) 1,041,646 VOLT XXV LLC 144A, 3.50%, 6/26/45 (a) 2,668,863 VOLT XXXIII LLC 144A, 3.50%, 3/25/55 (a) Total Asset Backed (Cost - $98,501) Bank Loans(b) (2%) 2,522,813 Activision Blizzard Inc.
Term Loan B 1L, 3.25%, 10/11/20 2,940,000 American Builders & Contractors Supply Co. Inc. Term Loan B1 IL, 3.50%, 4/16/20 3,307,182 CDW LLC/CDW Finance Corp. Term Loan B 1L, 3.50%, 4/29/20 $ 3,947 4,025 836 1,174 1,852 3,610 2,500 8,213 196 4,241 2,054 4,095 1,116 1,881 1,034 2,652 97,641 2,533 2,927 3,302 .
Principal or Shares Value (000) Security Description Dole Food Co. Inc. Term Loan B 1L, 4.50%, 11/01/18 3,825,466 General Nutrition Co. Inc.
Term Loan B 1L, 3.25%, 3/26/19 2,939,698 Starwood Property Trust Inc. Term Loan 1L, 3.50%, 4/19/20 Total Bank Loans (Cost - $18,333) Commercial Paper (1%) 5,000,000 Consolidated Edison 144A, 0.00%, 11/04/15 (a) (Cost - $5,000) Corporate Bond (50%) 2,923,000 Abbey National Treasury Services PLC, 1.38%, 3/13/17 2,680,000 AbbVie Inc., 1.75%, 11/06/17 2,850,000 AbbVie Inc., 1.80%, 5/14/18 1,400,000 Actavis Funding SCS, 1.30%, 6/15/17 1,640,000 Actavis Funding SCS, 1.59%, 3/12/20 3,242,000 Actavis Funding SCS, 2.35%, 3/12/18 2,210,000 AES Corp./VA, 3.32%, 6/01/19 1,200,000 AIA Group Ltd. 144A, 2.25%, 3/11/19 (a) 5,200,000 Air Lease Corp., 4.50%, 1/15/16 1,615,000 Aircastle Ltd., 6.75%, 4/15/17 1,200,000 Alibaba Group Holding Ltd.
144A, 1.63%, 11/28/17 (a) 400,000 Alibaba Group Holding Ltd. 144A, 2.50%, 11/28/19 (a) 1,565,000 Alliance Data Systems Corp. 144A, 5.25%, 12/01/17 (a) 1,725,000 Allied Irish Banks PLC, 2.88%, 11/28/16 EUR (c) 2,110,000 Ally Financial Inc., 3.25%, 9/29/17 3,100,000 American Express Co., 0.92%, 5/22/18 1,000,000 Anglo American Capital PLC 144A, 1.27%, 4/15/16 (a) 2,000,000 Anthem Inc., 2.38%, 2/15/17 2,400,000 ANZ New Zealand International Ltd./London 144A, 1.75%, 3/29/18 (a) 1,520,000 Ardagh Packaging Finance PLC / Ardagh Holdings USA Inc.
144A, 3.34%, 12/15/19 (a) 1,650,000 Astoria Financial Corp., 5.00%, 6/19/17 850,000 Autodesk Inc., 1.95%, 12/15/17 450,000 Avis Budget Car Rental LLC / Avis Budget Finance Inc., 3.07%, 12/01/17 870,000 Avis Budget Car Rental LLC / Avis Budget Finance Inc., 4.88%, 11/15/17 930,000 Baidu Inc., 2.25%, 11/28/17 3,815,000 Bank of America Corp., 1.20%, 4/01/19 1,580,000 Bank of America Corp., 1.36%, 1/15/19 1,510,000 Bank of America Corp., 1.70%, 8/25/17 1,180,000 Bank of America Corp., 3.75%, 7/12/16 1,750,000 Bank of Tokyo-Mitsubishi UFJ Ltd. 144A, 1.20%, 3/10/17 (a) 2,000,000 Bank of Tokyo-Mitsubishi UFJ Ltd. 144A, 1.45%, 9/08/17 (a) 2,510,000 Barclays Bank PLC, 0.90%, 2/17/17 1,260,000 BAT International Finance PLC 144A, 0.85%, 6/15/18 (a) Principal or Shares 2,780,025 1,680,000 $ 2,783 3,709 2,910 18,164 5,000 2,925 2,707 2,854 1,388 1,622 3,259 2,111 1,202 5,233 1,720 1,194 394 1,620 1,935 2,128 3,097 995 2,025 2,402 1,501 1,721 854 454 893 931 3,809 1,588 1,515 1,203 690,000 3,500,000 5,000,000 5,140,000 880,000 2,962,000 2,500,000 931,000 1,510,000 2,030,000 1,550,000 2,370,000 600,000 760,000 1,440,000 1,465,000 1,500,000 2,140,000 520,000 730,000 990,000 1,068,000 2,920,000 2,100,000 3,500,000 2,478,000 2,700,000 1,730,000 1,400,000 1,400,000 925,000 1,890,000 1,740,000 1,550,000 3,050,000 1,420,000 4,010,000 1,600,000 1,800,000 2,200,000 1,742 2,000 2,510 1,260 730,000 1,175,000 2,600,000 2,070,000 1,040,000 Value (000) Security Description BAT International Finance PLC 144A, 1.85%, 6/15/18 (a) Baxalta Inc.
144A, 2.00%, 6/22/18 (a) BB&T Corp., 0.99%, 2/01/19 Bear Stearns Companies LLC, 5.55%, 1/22/17 Becton Dickinson and Co., 1.45%, 5/15/17 Becton Dickinson and Co., 1.80%, 12/15/17 Bell Canada, 1.33%, 4/22/16 CAD (c) BNZ International Funding Ltd./London 144A, 1.90%, 2/26/18 (a) Boardwalk Pipelines LP, 5.88%, 11/15/16 BP Capital Markets PLC, 0.96%, 9/26/18 BPCE SA, 1.57%, 4/25/16 BPCE SA, 1.63%, 2/10/17 BPCE SA, 1.63%, 1/26/18 British Telecommunications PLC, 1.25%, 2/14/17 Cameron International Corp., 1.40%, 6/15/17 Canadian Natural Resources Ltd., 1.75%, 1/15/18 Capital One Financial Corp., 6.15%, 9/01/16 Capital One NA/Mclean VA, 1.50%, 9/05/17 Capital One NA/Mclean VA, 1.65%, 2/05/18 Carnival Corp., 1.88%, 12/15/17 CC Holdings GS V LLC / Crown Castle GS III Corp., 2.38%, 12/15/17 Celgene Corp., 2.13%, 8/15/18 CIT Group Inc., 5.25%, 3/15/18 Citigroup Inc., 1.12%, 4/01/16 Citigroup Inc., 1.24%, 11/30/17 EUR (c) Citigroup Inc., 1.55%, 8/14/17 Citigroup Inc., 5.50%, 2/15/17 Citizens Bank NA/Providence RI, 1.60%, 12/04/17 CNH Industrial Capital LLC 144A, 3.88%, 7/16/18 (a) CNOOC Finance 2013 Ltd., 1.13%, 5/09/16 CNPC General Capital Ltd. 144A, 1.21%, 5/14/17 (a) Coca-Cola Co., 0.88%, 10/27/17 Commonwealth Bank of Australia/New York NY, 1.75%, 11/02/18 Compass Bank, 1.85%, 9/29/17 ConocoPhillips Co., 1.50%, 5/15/18 Credit Agricole SA 144A, 1.17%, 10/03/16 (a) Credit Agricole SA/London 144A, 1.12%, 4/15/19 (a) Credit Suisse/New York NY, 1.38%, 5/26/17 Credit Suisse/New York NY, 1.75%, 1/29/18 Daimler Finance North America LLC 144A, 1.38%, 8/01/17 (a) Daimler Finance North America LLC 144A, 1.65%, 3/02/18 (a) DBS Bank Ltd. 144A, 0.93%, 7/15/21 (a) DENTSPLY International Inc., 2.75%, 8/15/16 Discover Bank/Greenwood DE, 2.60%, 11/13/18 DISH DBS Corp., 4.63%, 7/15/17 Duke Energy Corp., 0.70%, 4/03/17 $ 1,689 689 3,489 5,240 5,140 885 2,264 2,505 959 1,505 2,038 1,554 2,379 600 754 1,419 1,524 1,493 2,129 523 735 998 1,123 2,924 2,311 3,500 2,604 2,680 1,739 1,399 1,395 923 1,888 1,733 1,549 3,061 1,411 4,008 1,605 1,788 2,188 729 1,189 2,616 2,132 1,038 Annual Report 15 .
Payden Low Duration Fund continued Principal or Shares 2,100,000 1,020,000 800,000 1,900,000 1,900,000 1,650,000 1,125,000 2,700,000 1,070,000 585,000 830,000 960,000 3,300,000 2,900,000 1,130,000 2,000,000 1,500,000 1,000,000 1,320,000 1,700,000 3,900,000 1,580,000 3,258,000 3,280,000 248,000 3,110,000 1,600,000 1,741,000 2,000,000 2,390,000 2,695,000 860,000 3,260,000 2,950,000 2,970,000 2,590,000 670,000 1,410,000 800,000 800,000 880,000 2,250,000 1,200,000 720,000 Value (000) Security Description EDP Finance BV 144A, 6.00%, 2/02/18 (a) Electricite de France 144A, 0.78%, 1/20/17 (a) Enbridge Inc., 0.78%, 6/02/17 Enbridge Inc., 0.98%, 10/01/16 Enbridge Inc., 1.21%, 3/13/17 CAD (c) Enterprise Products Operating LLC, 3.20%, 2/01/16 ERAC USA Finance LLC 144A, 1.40%, 4/15/16 (a) European Investment Bank, 1.13%, 8/15/18 Express Scripts Holding Co., 1.25%, 6/02/17 Fidelity National Information Services Inc., 1.45%, 6/05/17 Fidelity National Information Services Inc., 2.00%, 4/15/18 Fifth Third Bancorp, 5.45%, 1/15/17 FMS Wertmanagement AoeR, 0.63%, 1/30/17 FMS Wertmanagement AoeR, 1.13%, 9/05/17 Ford Motor Credit Co. LLC, 1.68%, 9/08/17 Ford Motor Credit Co. LLC, 2.15%, 1/09/18 Ford Motor Credit Co. LLC, 3.00%, 6/12/17 Freeport-McMoRan Inc., 2.15%, 3/01/17 Freeport-McMoRan Inc., 2.30%, 11/14/17 GATX Corp., 2.50%, 7/30/19 General Motors Financial Co.
Inc., 2.40%, 4/10/18 General Motors Financial Co. Inc., 3.00%, 9/25/17 Glencore Finance Canada Ltd. 144A, 2.70%, 10/25/17 (a) Glencore Funding LLC 144A, 1.68%, 1/15/19 (a) Glencore Funding LLC 144A, 2.13%, 4/16/18 (a) Goldman Sachs Group Inc., 1.52%, 4/30/18 Goldman Sachs Group Inc., 3.63%, 2/07/16 Goldman Sachs Group Inc., 5.63%, 1/15/17 Goldman Sachs Group Inc., 5.95%, 1/18/18 Harley-Davidson Financial Services Inc.
144A, 2.15%, 2/26/20 (a) Hertz Corp., 6.75%, 4/15/19 Hess Corp., 1.30%, 6/15/17 Hewlett Packard Enterprise Co. 144A, 2.45%, 10/05/17 (a) Hewlett Packard Enterprise Co. 144A, 2.85%, 10/05/18 (a) HSBC Bank PLC 144A, 0.96%, 5/15/18 (a) HSBC USA Inc., 1.70%, 3/05/18 Huntington National Bank, 0.74%, 4/24/17 Huntington National Bank, 1.30%, 11/20/16 Huntington National Bank, 1.35%, 8/02/16 Huntington National Bank, 1.38%, 4/24/17 Hutchison Whampoa International 12 II Ltd. 144A, 2.00%, 11/08/17 (a) Hyundai Capital America 144A, 1.45%, 2/06/17 (a) Hyundai Capital America 144A, 2.00%, 3/19/18 (a) Hyundai Capital America 144A, 3.75%, 4/06/16 (a) 16 Payden Mutual Funds $ Principal or Shares 2,237 1,021 786 1,892 1,439 770,000 1,670,000 1,210,000 2,820,000 1,658 3,200,000 1,126 2,697 1,066 579 818 1,001 3,297 2,911 1,123 2,001 1,524 970 1,246 1,692 3,864 1,750,000 2,600,000 1,550,000 1,300,000 620,000 640,000 1,600,000 2,770,000 2,380,000 1,385,000 1,030,000 3,140,000 1,425,000 1,440,000 2,570,000 2,950,000 1,970,000 1,598 3,035 2,628 217 3,141 1,612 1,825 2,183 2,366 2,772 853 3,271 2,958 2,965 2,589 666 1,410 802 797 1,160,000 2,700,000 760,000 280,000 2,000,000 1,300,000 700,000 1,380,000 1,080,000 2,280,000 2,195,000 4,000,000 3,000,000 1,510,000 830,000 3,750,000 1,520,000 4,700,000 2,200,000 885 2,241 750,000 1,040,000 1,192 1,240,000 728 2,650,000 1,130,000 Value (000) Security Description IAC/InterActiveCorp 144A, 4.88%, 11/30/18 (a) Imperial Tobacco Finance PLC 144A, 2.05%, 7/20/18 (a) Industrial & Commercial Bank of China Ltd./New York, 2.35%, 11/13/17 International Lease Finance Corp., 2.29%, 6/15/16 International Lease Finance Corp., 3.88%, 4/15/18 JB Hunt Transport Services Inc., 2.40%, 3/15/19 JPMorgan Chase & Co., 1.07%, 5/30/17 GBP (c) JPMorgan Chase & Co., 1.22%, 1/25/18 KeyBank NA/Cleveland OH, 5.45%, 3/03/16 Kinder Morgan Inc./DE, 2.00%, 12/01/17 Kinder Morgan Inc./DE, 3.05%, 12/01/19 Korea Expressway Corp.
144A, 1.63%, 4/28/17 (a) Kraft Heinz Foods Co. 144A, 1.60%, 6/30/17 (a) Kraft Heinz Foods Co. 144A, 2.00%, 7/02/18 (a) Kroger Co., 2.20%, 1/15/17 L-3 Communications Corp., 1.50%, 5/28/17 L-3 Communications Corp., 3.95%, 11/15/16 Liberty Property LP, 6.63%, 10/01/17 Macquarie Bank Ltd.
144A, 0.95%, 10/27/17 (a) Macquarie Bank Ltd. 144A, 1.60%, 10/27/17 (a) Macquarie Group Ltd. 144A, 1.33%, 1/31/17 (a) Manufacturers & Traders Trust Co., 1.25%, 1/30/17 Marathon Oil Corp., 0.90%, 11/01/15 Martin Marietta Materials Inc., 1.43%, 6/30/17 McGraw Hill Financial Inc.
144A, 3.30%, 8/14/20 (a) McGraw Hill Financial Inc., 5.90%, 11/15/17 Metropolitan Life Global Funding I 144A, 0.70%, 4/10/17 (a) Mitsubishi UFJ Trust & Banking Corp. 144A, 1.60%, 10/16/17 (a) Mizuho Bank Ltd. 144A, 0.78%, 9/25/17 (a) Mizuho Bank Ltd.
144A, 1.30%, 4/16/17 (a) Mizuho Bank Ltd. 144A, 1.70%, 9/25/17 (a) Mobile Mini Inc., 7.88%, 12/01/20 Morgan Stanley, 1.06%, 7/23/19 Morgan Stanley, 1.46%, 1/27/20 Morgan Stanley, 5.45%, 1/09/17 Morgan Stanley, 6.63%, 4/01/18 Murphy Oil Corp., 2.50%, 12/01/17 Nabors Industries Inc., 2.35%, 9/15/16 National Oilwell Varco Inc., 1.35%, 12/01/17 Nederlandse Waterschapsbank NV 144A, 1.25%, 9/18/17 (a) New York Life Global Funding 144A, 1.55%, 11/02/18 (a) Newell Rubbermaid Inc., 2.15%, 10/15/18 NextEra Energy Capital Holdings Inc., 1.59%, 6/01/17 Nissan Motor Acceptance Corp. 144A, 1.95%, 9/12/17 (a) Nomura Holdings Inc., 1.79%, 9/13/16 Nordea Bank AB 144A, 1.88%, 9/17/18 (a) $ 794 1,672 1,220 2,822 3,256 1,763 3,959 1,557 1,319 607 621 1,600 2,773 2,389 1,407 1,015 3,204 1,552 1,433 2,558 2,956 1,971 1,160 2,683 774 300 2,002 1,296 697 1,375 1,078 2,383 2,173 4,021 3,143 1,678 814 3,732 1,508 4,722 2,197 750 1,040 1,248 2,664 1,133 .
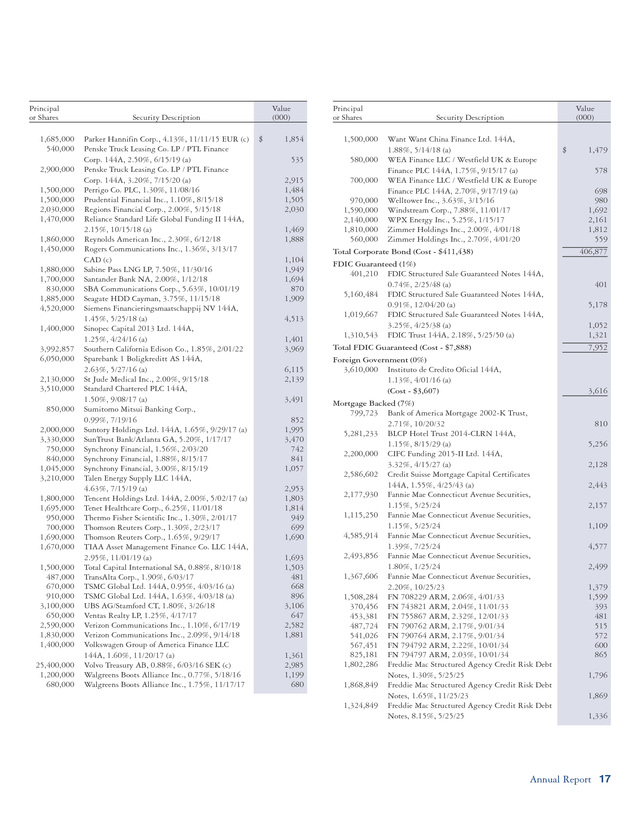
Principal or Shares 1,685,000 540,000 2,900,000 1,500,000 1,500,000 2,030,000 1,470,000 1,860,000 1,450,000 1,880,000 1,700,000 830,000 1,885,000 4,520,000 1,400,000 3,992,857 6,050,000 2,130,000 3,510,000 850,000 2,000,000 3,330,000 750,000 840,000 1,045,000 3,210,000 1,800,000 1,695,000 950,000 700,000 1,690,000 1,670,000 1,500,000 487,000 670,000 910,000 3,100,000 650,000 2,590,000 1,830,000 1,400,000 25,400,000 1,200,000 680,000 Value (000) Security Description Parker Hannifin Corp., 4.13%, 11/11/15 EUR (c) Penske Truck Leasing Co. LP / PTL Finance Corp. 144A, 2.50%, 6/15/19 (a) Penske Truck Leasing Co. LP / PTL Finance Corp.
144A, 3.20%, 7/15/20 (a) Perrigo Co. PLC, 1.30%, 11/08/16 Prudential Financial Inc., 1.10%, 8/15/18 Regions Financial Corp., 2.00%, 5/15/18 Reliance Standard Life Global Funding II 144A, 2.15%, 10/15/18 (a) Reynolds American Inc., 2.30%, 6/12/18 Rogers Communications Inc., 1.36%, 3/13/17 CAD (c) Sabine Pass LNG LP, 7.50%, 11/30/16 Santander Bank NA, 2.00%, 1/12/18 SBA Communications Corp., 5.63%, 10/01/19 Seagate HDD Cayman, 3.75%, 11/15/18 Siemens Financieringsmaatschappij NV 144A, 1.45%, 5/25/18 (a) Sinopec Capital 2013 Ltd. 144A, 1.25%, 4/24/16 (a) Southern California Edison Co., 1.85%, 2/01/22 Sparebank 1 Boligkreditt AS 144A, 2.63%, 5/27/16 (a) St Jude Medical Inc., 2.00%, 9/15/18 Standard Chartered PLC 144A, 1.50%, 9/08/17 (a) Sumitomo Mitsui Banking Corp., 0.99%, 7/19/16 Suntory Holdings Ltd.
144A, 1.65%, 9/29/17 (a) SunTrust Bank/Atlanta GA, 5.20%, 1/17/17 Synchrony Financial, 1.56%, 2/03/20 Synchrony Financial, 1.88%, 8/15/17 Synchrony Financial, 3.00%, 8/15/19 Talen Energy Supply LLC 144A, 4.63%, 7/15/19 (a) Tencent Holdings Ltd. 144A, 2.00%, 5/02/17 (a) Tenet Healthcare Corp., 6.25%, 11/01/18 Thermo Fisher Scientific Inc., 1.30%, 2/01/17 Thomson Reuters Corp., 1.30%, 2/23/17 Thomson Reuters Corp., 1.65%, 9/29/17 TIAA Asset Management Finance Co. LLC 144A, 2.95%, 11/01/19 (a) Total Capital International SA, 0.88%, 8/10/18 TransAlta Corp., 1.90%, 6/03/17 TSMC Global Ltd.
144A, 0.95%, 4/03/16 (a) TSMC Global Ltd. 144A, 1.63%, 4/03/18 (a) UBS AG/Stamford CT, 1.80%, 3/26/18 Ventas Realty LP, 1.25%, 4/17/17 Verizon Communications Inc., 1.10%, 6/17/19 Verizon Communications Inc., 2.09%, 9/14/18 Volkswagen Group of America Finance LLC 144A, 1.60%, 11/20/17 (a) Volvo Treasury AB, 0.88%, 6/03/16 SEK (c) Walgreens Boots Alliance Inc., 0.77%, 5/18/16 Walgreens Boots Alliance Inc., 1.75%, 11/17/17 $ Principal or Shares 1,854 535 2,915 1,484 1,505 2,030 1,469 1,888 1,104 1,949 1,694 870 1,909 4,513 1,401 3,969 6,115 2,139 3,491 852 1,995 3,470 742 841 1,057 2,953 1,803 1,814 949 699 1,690 1,693 1,503 481 668 896 3,106 647 2,582 1,881 1,361 2,985 1,199 680 Value (000) Security Description 1,500,000 Want Want China Finance Ltd. 144A, 1.88%, 5/14/18 (a) 580,000 WEA Finance LLC / Westfield UK & Europe Finance PLC 144A, 1.75%, 9/15/17 (a) 700,000 WEA Finance LLC / Westfield UK & Europe Finance PLC 144A, 2.70%, 9/17/19 (a) 970,000 Welltower Inc., 3.63%, 3/15/16 1,590,000 Windstream Corp., 7.88%, 11/01/17 2,140,000 WPX Energy Inc., 5.25%, 1/15/17 1,810,000 Zimmer Holdings Inc., 2.00%, 4/01/18 560,000 Zimmer Holdings Inc., 2.70%, 4/01/20 Total Corporate Bond (Cost - $411,438) FDIC Guaranteed (1%) 401,210 FDIC Structured Sale Guaranteed Notes 144A, 0.74%, 2/25/48 (a) 5,160,484 FDIC Structured Sale Guaranteed Notes 144A, 0.91%, 12/04/20 (a) 1,019,667 FDIC Structured Sale Guaranteed Notes 144A, 3.25%, 4/25/38 (a) 1,310,543 FDIC Trust 144A, 2.18%, 5/25/50 (a) Total FDIC Guaranteed (Cost - $7,888) Foreign Government (0%) 3,610,000 Instituto de Credito Oficial 144A, 1.13%, 4/01/16 (a) (Cost - $3,607) Mortgage Backed (7%) 799,723 Bank of America Mortgage 2002-K Trust, 2.71%, 10/20/32 5,281,233 BLCP Hotel Trust 2014-CLRN 144A, 1.15%, 8/15/29 (a) 2,200,000 CIFC Funding 2015-II Ltd.
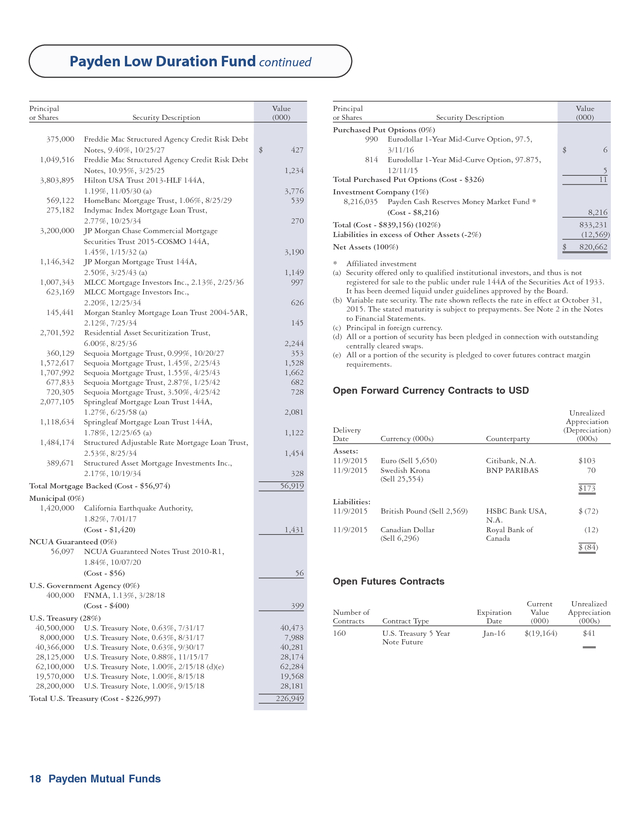
144A, 3.32%, 4/15/27 (a) 2,586,602 Credit Suisse Mortgage Capital Certificates 144A, 1.55%, 4/25/43 (a) 2,177,930 Fannie Mae Connecticut Avenue Securities, 1.15%, 5/25/24 1,115,250 Fannie Mae Connecticut Avenue Securities, 1.15%, 5/25/24 4,585,914 Fannie Mae Connecticut Avenue Securities, 1.39%, 7/25/24 2,493,856 Fannie Mae Connecticut Avenue Securities, 1.80%, 1/25/24 1,367,606 Fannie Mae Connecticut Avenue Securities, 2.20%, 10/25/23 1,508,284 FN 708229 ARM, 2.06%, 4/01/33 370,456 FN 743821 ARM, 2.04%, 11/01/33 453,381 FN 755867 ARM, 2.32%, 12/01/33 487,724 FN 790762 ARM, 2.17%, 9/01/34 541,026 FN 790764 ARM, 2.17%, 9/01/34 567,451 FN 794792 ARM, 2.22%, 10/01/34 825,181 FN 794797 ARM, 2.03%, 10/01/34 1,802,286 Freddie Mac Structured Agency Credit Risk Debt Notes, 1.30%, 5/25/25 1,868,849 Freddie Mac Structured Agency Credit Risk Debt Notes, 1.65%, 11/25/23 1,324,849 Freddie Mac Structured Agency Credit Risk Debt Notes, 8.15%, 5/25/25 $ 1,479 578 698 980 1,692 2,161 1,812 559 406,877 401 5,178 1,052 1,321 7,952 3,616 810 5,256 2,128 2,443 2,157 1,109 4,577 2,499 1,379 1,599 393 481 515 572 600 865 1,796 1,869 1,336 Annual Report 17 . Payden Low Duration Fund continued Principal or Shares Value (000) Security Description 375,000 Freddie Mac Structured Agency Credit Risk Debt Notes, 9.40%, 10/25/27 1,049,516 Freddie Mac Structured Agency Credit Risk Debt Notes, 10.95%, 3/25/25 3,803,895 Hilton USA Trust 2013-HLF 144A, 1.19%, 11/05/30 (a) 569,122 HomeBanc Mortgage Trust, 1.06%, 8/25/29 275,182 Indymac Index Mortgage Loan Trust, 2.77%, 10/25/34 3,200,000 JP Morgan Chase Commercial Mortgage Securities Trust 2015-COSMO 144A, 1.45%, 1/15/32 (a) 1,146,342 JP Morgan Mortgage Trust 144A, 2.50%, 3/25/43 (a) 1,007,343 MLCC Mortgage Investors Inc., 2.13%, 2/25/36 623,169 MLCC Mortgage Investors Inc., 2.20%, 12/25/34 145,441 Morgan Stanley Mortgage Loan Trust 2004-5AR, 2.12%, 7/25/34 2,701,592 Residential Asset Securitization Trust, 6.00%, 8/25/36 360,129 Sequoia Mortgage Trust, 0.99%, 10/20/27 1,572,617 Sequoia Mortgage Trust, 1.45%, 2/25/43 1,707,992 Sequoia Mortgage Trust, 1.55%, 4/25/43 677,833 Sequoia Mortgage Trust, 2.87%, 1/25/42 720,305 Sequoia Mortgage Trust, 3.50%, 4/25/42 2,077,105 Springleaf Mortgage Loan Trust 144A, 1.27%, 6/25/58 (a) 1,118,634 Springleaf Mortgage Loan Trust 144A, 1.78%, 12/25/65 (a) 1,484,174 Structured Adjustable Rate Mortgage Loan Trust, 2.53%, 8/25/34 389,671 Structured Asset Mortgage Investments Inc., 2.17%, 10/19/34 Total Mortgage Backed (Cost - $56,974) Municipal (0%) 1,420,000 California Earthquake Authority, 1.82%, 7/01/17 (Cost - $1,420) NCUA Guaranteed (0%) 56,097 NCUA Guaranteed Notes Trust 2010-R1, 1.84%, 10/07/20 (Cost - $56) U.S. Government Agency (0%) 400,000 FNMA, 1.13%, 3/28/18 (Cost - $400) U.S. Treasury (28%) 40,500,000 U.S. Treasury Note, 0.63%, 7/31/17 8,000,000 U.S.
Treasury Note, 0.63%, 8/31/17 40,366,000 U.S. Treasury Note, 0.63%, 9/30/17 28,125,000 U.S. Treasury Note, 0.88%, 11/15/17 62,100,000 U.S.
Treasury Note, 1.00%, 2/15/18 (d)(e) 19,570,000 U.S. Treasury Note, 1.00%, 8/15/18 28,200,000 U.S. Treasury Note, 1.00%, 9/15/18 Total U.S.
Treasury (Cost - $226,997) 18 Payden Mutual Funds $ 427 1,234 3,776 539 270 3,190 1,149 997 626 145 2,244 353 1,528 1,662 682 728 Principal or Shares Security Description Purchased Put Options (0%) 990 Eurodollar 1-Year Mid-Curve Option, 97.5, 3/11/16 814 Eurodollar 1-Year Mid-Curve Option, 97.875, 12/11/15 Total Purchased Put Options (Cost - $326) Investment Company (1%) 8,216,035 Payden Cash Reserves Money Market Fund * (Cost - $8,216) Total (Cost - $839,156) (102%) Liabilities in excess of Other Assets (-2%) Net Assets (100%) 1,454 328 56,919 6 5 11 $ 8,216 833,231 (12,569) 820,662 Open Forward Currency Contracts to USD Delivery Date Assets: 11/9/2015 11/9/2015 Currency (000s) Counterparty Euro (Sell 5,650) Swedish Krona (Sell 25,554) Citibank, N.A. BNP PARIBAS Unrealized Appreciation (Depreciation) (000s) $103 70 $173 Liabilities: 11/9/2015 1,431 $ * Affiliated investment (a) Security offered only to qualified institutional investors, and thus is not registered for sale to the public under rule 144A of the Securities Act of 1933. It has been deemed liquid under guidelines approved by the Board. (b) Variable rate security. The rate shown reflects the rate in effect at October 31, 2015. The stated maturity is subject to prepayments.
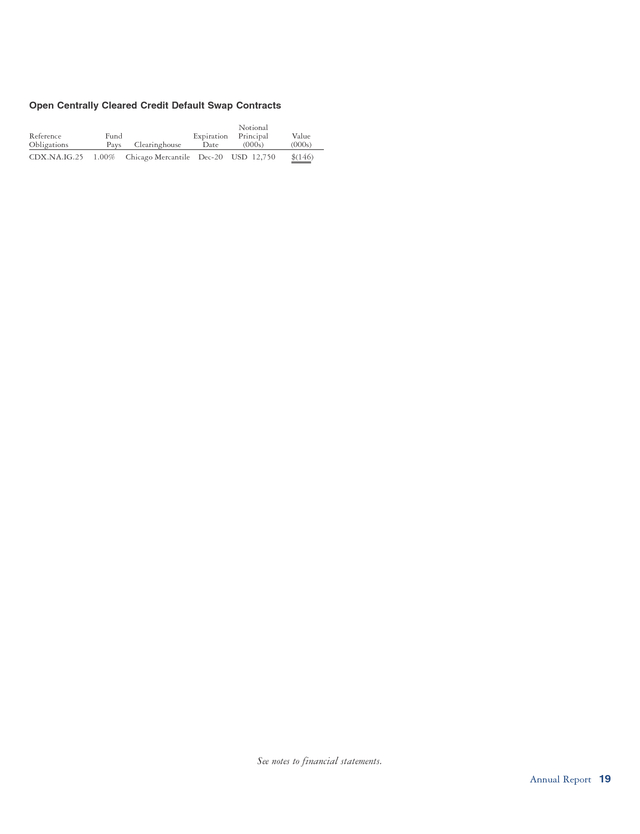
See Note 2 in the Notes to Financial Statements. (c) Principal in foreign currency. (d) All or a portion of security has been pledged in connection with outstanding centrally cleared swaps. (e) All or a portion of the security is pledged to cover futures contract margin requirements. 2,081 1,122 Value (000) 11/9/2015 British Pound (Sell 2,569) Canadian Dollar (Sell 6,296) HSBC Bank USA, N.A. Royal Bank of Canada $ (72) (12) $ (84) 56 Open Futures Contracts 399 40,473 7,988 40,281 28,174 62,284 19,568 28,181 226,949 Number of Contracts 160 Contract Type U.S. Treasury 5 Year Note Future Expiration Date Jan-16 Current Value (000) $(19,164) Unrealized Appreciation (000s) $41 . Open Centrally Cleared Credit Default Swap Contracts Reference Obligations CDX.NA.IG.25 Notional Fund Expiration Principal Pays Clearinghouse Date (000s) 1.00% Chicago Mercantile Dec-20 USD 12,750 Value (000s) $(146) See notes to financial statements. Annual Report 19 . Payden U.S. Government Fund $17,000 The Fund seeks a high level of total return that is consistent with preservation of capital by generally investing in U.S. government obligations with an average portfolio maturity not to exceed five years. $15,000 Five Year 1.03% Investor Class $13,626 Ten Year 3.14% Bank of America Merrill Lynch 1-5 Year Treasury Index $13,664 $14,000 Portfolio Composition - percent of value Mortgage Backed U.S. Government Guaranteed U.S.
Treasury Asset Backed Cash equivalent One Year 1.01% $16,000 $13,000 74% 9% 7% 1% 9% $12,000 $11,000 $10,000 $9,000 10/31/05 10/10 10/31/15 Past performance does not predict future returns. The graph does not reflect the impact of taxes or transaction costs a shareholder would pay. The Fund’s Adviser Class is expected to perform similiarly to its Investor Class. This information is not part of the audited financial statements. Schedule of Investments - October 31, 2015 Principal or Shares Security Description Asset Backed (1%) 2,035,029 United States Small Business Administration, 2.88%, 9/10/21 (Cost - $2,092) FDIC Guaranteed (4%) 430,799 FDIC Structured Sale Guaranteed Notes 144A, 0.90%, 12/29/45 (a) 2,522,903 FDIC Structured Sale Guaranteed Notes 144A, 0.91%, 12/04/20 (a) 1,444,528 FDIC Structured Sale Guaranteed Notes 144A, 3.25%, 4/25/38 (a) 1,390,316 FDIC Trust 144A, 2.18%, 5/25/50 (a) Total FDIC Guaranteed (Cost - $5,804) Mortgage Backed (78%) 610,730 FH 1B8336 ARM, 3.08%, 6/01/41 384,022 FH 1B8378 ARM, 3.15%, 7/01/41 1,747,379 FH 1Q0740 ARM, 2.37%, 3/01/39 1,051,959 FH 1Q1363 ARM, 2.43%, 2/01/36 1,137,626 FH 2B0709 ARM, 2.07%, 8/01/42 1,234,947 FH 2B0721 ARM, 2.23%, 9/01/42 1,127,746 FH 2B0972 ARM, 2.02%, 11/01/42 3,109,569 FH 2B1143 ARM, 2.19%, 2/01/43 1,049,542 FH 2B1286 ARM, 2.06%, 4/01/43 1,130,253 FH 2B1317 ARM, 1.99%, 4/01/43 499,975 FH 849012 ARM, 1.97%, 3/01/43 731,521 FH 849486 ARM, 2.61%, 8/01/41 3,178,745 FH 849506 ARM, 2.95%, 11/01/44 1,956,603 FH 849707 ARM, 2.42%, 2/01/43 2,505,000 FHLMC Multifamily Structured Pass Through Certificates, 1.72%, 1/25/19 2,382,489 FHLMC Multifamily Structured Pass Through Certificates, 3.15%, 2/25/18 540,969 FHR 3997 PJ, 3.00%, 1/15/40 646,111 FHR 4030 CG, 2.50%, 4/15/27 677,191 FHR 4073 BE, 2.00%, 5/15/39 5,000,000 FN, 3.50%, 15YR TBA (b) 479,712 FN 555936 ARM, 2.24%, 9/01/33 20 Payden Mutual Funds Value (000) $ Principal or Shares 2,118 432 2,532 1,490 1,401 5,855 650 406 1,852 1,119 1,170 1,279 1,167 3,190 1,085 1,165 515 776 3,293 2,014 2,525 2,473 547 669 681 5,279 510 1,189,547 613,668 103,589 101,555 127,105 2,052,779 1,116,903 1,843,442 575,627 1,225,636 1,439,901 916,034 984,725 432,479 1,908,032 2,543,023 1,842,196 1,547,428 1,893,619 1,943,765 1,108,811 1,335,070 725,565 1,042,810 1,551,710 540,001 1,221,446 987,700 1,916,735 1,743,955 5,678,523 2,942,010 2,444,410 2,533,105 2,000,000 5,280,000 395,495 1,072,916 Value (000) Security Description FN 784365 ARM, 1.93%, 5/01/34 FN 795816 ARM, 1.98%, 7/01/34 FN 838958 ARM, 2.26%, 8/01/35 FN 849088 ARM, 2.16%, 11/01/35 FN 866093 ARM, 2.38%, 3/01/36 FN 870542 ARM, 2.14%, 3/01/36 FN 890434 15YR, 3.00%, 7/01/27 FN AB7995 10YR, 2.50%, 2/01/23 FN AC0045 ARM, 1.94%, 10/01/38 FN AE0193 ARM, 2.34%, 7/01/40 FN AE0289 ARM, 2.43%, 5/01/40 FN AI4019 ARM, 3.45%, 7/01/41 FN AL0407 30YR, 6.50%, 4/01/39 FN AL0502 ARM, 3.01%, 6/01/41 FN AL1869 15YR, 3.00%, 6/01/27 FN AL2095 15YR, 3.00%, 6/01/27 FN AL2221 15YR, 3.00%, 7/01/27 FN AL5596 ARM, 2.53%, 2/01/44 FN AL5790 ARM, 2.55%, 10/01/44 FN AL5967 ARM, 2.55%, 11/01/44 FN AO2280 ARM, 2.12%, 10/01/42 FN AO7975 15YR, 3.00%, 6/01/27 FN AP0619 ARM, 2.21%, 7/01/42 FN AP4080 ARM, 2.26%, 9/01/42 FN AP4746 15YR, 3.00%, 8/01/27 FN AP7869 ARM, 2.23%, 8/01/42 FN AQ4765 10YR, 2.50%, 11/01/22 FN AU6974 ARM, 2.74%, 11/01/43 FN AU8673 ARM, 2.72%, 2/01/44 FN AY4068 ARM, 2.34%, 4/01/44 FN AY8461 ARM, 2.42%, 8/01/45 FN AZ2886 ARM, 2.69%, 9/01/45 FN AZ4380 ARM, 2.51%, 8/01/45 FN MA1766 10YR, 2.50%, 1/01/24 FN-Aces, 2.03%, 3/25/19 FN-Aces, 2.32%, 11/25/18 FNR 2002-10-FA, 0.95%, 2/25/32 FNR 2011-127 UC, 2.50%, 6/25/39 $ 1,248 644 110 107 137 2,186 1,166 1,894 607 1,309 1,539 971 1,140 455 1,992 2,656 1,923 1,601 1,950 2,002 1,142 1,394 747 1,080 1,620 559 1,255 1,033 1,987 1,789 5,817 3,024 2,515 2,603 2,030 5,417 404 1,091 .
Principal or Shares Value (000) Security Description 562,402 FNW 2002-W6-2A, 6.79%, 6/25/42 501,039 G2 3515 30YR, 5.50%, 2/20/34 2,375,227 G2 5301 15YR, 3.50%, 2/20/27 1,237,982 G2 778200 20YR, 4.00%, 2/20/32 779,968 G2 778203 20YR, 4.75%, 2/20/32 695,971 G2 82457 ARM, 1.75%, 1/20/40 1,531,475 GN 728153, 5.50%, 10/15/29 884,293 GN 737791 30YR, 4.50%, 12/15/40 692,341 GNR 2008-32 PA, 4.00%, 8/16/37 698,882 GNR 2009-26 BA, 4.00%, 1/16/38 17,251,599 GNR 2014-79 ST, 1.15%, 7/20/29 Total Mortgage Backed (Cost - $104,548) NCUA Guaranteed (6%) 1,174,016 NCUA Guaranteed Notes Trust 2010-A1, 0.54%, 12/07/20 920,813 NCUA Guaranteed Notes Trust 2010-R1, 0.65%, 10/07/20 61,985 NCUA Guaranteed Notes Trust 2010-R1, 1.84%, 10/07/20 2,532,859 NCUA Guaranteed Notes Trust 2010-R3, 2.40%, 12/08/20 1,197,215 NCUA Guaranteed Notes Trust 2011-R2, 0.59%, 2/06/20 1,392,252 NCUA Guaranteed Notes Trust 2011-R4, 0.58%, 3/06/20 282,422 NCUA Guaranteed Notes Trust 2011-R5, 0.57%, 4/06/20 20,006 NCUA Guaranteed Notes Trust 2011-R6, 0.58%, 5/07/20 Total NCUA Guaranteed (Cost - $7,616) U.S. Treasury (7%) 3,185,276 U.S. Treasury Inflation Indexed Bonds, 0.13%, 4/15/20 2,000,000 U.S. Treasury Note, 1.38%, 7/31/18 2,000,000 U.S.
Treasury Note, 1.38%, 2/28/19 2,000,000 U.S. Treasury Note, 1.63%, 6/30/19 Total U.S. Treasury (Cost - $9,203) $ Principal or Shares 651 565 2,511 1,331 858 716 1,727 970 734 744 633 104,949 1,174 Value (000) Security Description Purchased Put Options (0%) 185 Eurodollar 1-Year Mid-Curve Option, 97.5, 3/11/16 (Cost - $26) Investment Company (10%) 13,048,513 Payden Cash Reserves Money Market Fund * (Cost - $13,048) Total (Cost - $142,337) (106%) Liabilities in excess of Other Assets (-6%) Net Assets (100%) $ 1 $ 13,048 142,819 (7,723) 135,096 * Affiliated investment (a) Security offered only to qualified institutional investors, and thus is not registered for sale to the public under rule 144A of the Securities Act of 1933. It has been deemed liquid under guidelines approved by the Board. (b) Security was purchased on a delayed delivery basis. 925 62 2,564 1,201 1,395 Open Futures Contracts Number of Contracts 50 Contract Type U.S.
Treasury 5 Year Note Future Expiration Date Jan-16 Current Value (000) $5,989 Unrealized Depreciation (000s) $(40) 283 20 7,624 3,164 2,021 2,014 2,025 9,224 See notes to financial statements. Annual Report 21 . Payden GNMA Fund $21,000 The Fund seeks a high level of total return that is consistent with preservation of capital by generally investing in Government National Mortgage Association mortgagebacked securities and other U.S. government obligations with no limit on the average portfolio maturity. Five Year 2.92% Investor Class $16,041 Ten Year 4.84% Bank of America Merrill Lynch GNMA Master Index $15,962 $17,000 $15,000 Portfolio Composition - percent of value Mortgage Backed U.S. Government Guaranteed Cash Equivalent One Year 2.06% $19,000 $13,000 95% 3% 2% $11,000 $9,000 10/31/05 10/10 10/31/15 Past performance does not predict future returns. The graph does not reflect the impact of taxes or transaction costs a shareholder would pay.
The Fund’s Adviser Class is expected to perform similarly to its Investor Class. This information is not part of the audited financial statements. Schedule of Investments - October 31, 2015 Principal or Shares Security Description FDIC Guaranteed (2%) 1,303,933 FDIC Structured Sale Guaranteed Notes 144A, 0.74%, 2/25/48 (a) 1,163,156 FDIC Structured Sale Guaranteed Notes 144A, 0.90%, 12/29/45 (a) 4,257,399 FDIC Structured Sale Guaranteed Notes 144A, 0.91%, 12/04/20 (a) Total FDIC Guaranteed (Cost - $6,732) Mortgage Backed (144%) 1,147,365 Fannie Mae Multifamily Remic Trust 2015-M12, 0.54%, 4/25/20 3,782,044 Fannie Mae-Aces, 0.42%, 6/25/18 891,704 Fannie Mae-Aces, 0.45%, 5/25/18 2,830,206 Fannie Mae-Aces, 0.45%, 3/25/19 1,618,282 FH 1J1279 ARM, 2.13%, 4/01/36 2,623,542 FH 1Q0062 ARM, 1.96%, 11/01/35 1,036,523 FH 2B1143 ARM, 2.19%, 2/01/43 1,158,183 FH 847228 ARM, 2.56%, 1/01/34 160,418 FHLMC Multifamily Structured Pass Through Certificates, 0.54%, 4/25/19 379,177 FHLMC Multifamily Structured Pass Through Certificates, 0.58%, 7/25/20 1,224,780 FN 832100 ARM, 2.41%, 7/01/35 1,864,293 FN AE0289 ARM, 2.43%, 5/01/40 1,612,949 FN AK0419 ARM, 2.46%, 12/01/27 3,429,060 FN AL0891 ARM, 3.46%, 9/01/41 3,470,175 FN AL2493 ARM, 2.41%, 10/01/42 13,427 FNR 1998-12 A, 3.89%, 2/25/18 38,000,000 G2, 3.00%, 30YR TBA (b) 72,300,000 G2, 3.50%, 30YR TBA (b) 17,450,000 G2, 4.00%, 30YR TBA (b) 100,495 G2 3133 30YR, 6.50%, 9/20/31 1,181,243 G2 3415 30YR, 5.50%, 7/20/33 827,475 G2 3515 30YR, 5.50%, 2/20/34 1,142,727 G2 3584 30YR, 6.00%, 7/20/34 952,510 G2 3599 30YR, 6.50%, 8/20/34 894,484 G2 3711 30YR, 5.50%, 5/20/35 22 Payden Mutual Funds Value (000) $ Principal or Shares 1,305 1,166 4,272 6,743 1,147 3,783 891 2,828 1,712 2,759 1,063 1,241 160 380 1,306 1,992 1,711 3,619 3,570 14 38,816 75,758 18,572 119 1,333 934 1,310 1,121 1,008 1,181,637 729,372 1,369,184 2,338,775 313,185 1,772,747 1,059,248 1,027,342 2,879,856 1,114,929 1,350,270 289,538 613,377 201,749 210,012 313,728 189,268 3,923,829 837,033 471,491 403,870 822,620 1,178,855 142,453 2,259,717 117,495 2,542,822 595,258 171,000 314,077 763,468 564,902 347,218 134,091 1,776,793 5,724,899 3,880,254 1,664,107 Value (000) Security Description G2 3747 30YR, 5.00%, 8/20/35 G2 3772 30YR, 5.00%, 10/20/35 G2 3785 30YR, 5.00%, 11/20/35 G2 3819 30YR, 5.50%, 2/20/36 G2 3891 30YR, 6.50%, 8/20/36 G2 4802 30YR, 5.00%, 9/20/40 G2 4945 30YR, 4.00%, 2/20/41 G2 4978 30YR, 4.50%, 3/20/41 G2 5083 30YR, 5.00%, 6/20/41 G2 5140 30YR, 4.50%, 8/20/41 G2 713314 30YR, 6.00%, 3/20/39 G2 728869 30YR, 4.13%, 4/20/40 G2 728870 30YR, 4.63%, 4/20/40 G2 736498 30YR, 4.13%, 4/20/40 G2 736499 30YR, 4.63%, 4/20/40 G2 742040 30YR, 4.13%, 5/20/40 G2 742041 30YR, 4.63%, 6/20/40 G2 757211 30YR, 4.50%, 12/20/40 G2 770239 30YR, 4.00%, 2/20/42 G2 80013 ARM, 2.00%, 11/20/26 G2 80029 ARM, 1.75%, 1/20/27 G2 80044 ARM, 1.75%, 2/20/27 G2 80052 ARM, 1.75%, 3/20/27 G2 8006 ARM, 1.63%, 7/20/22 G2 80074 ARM, 1.75%, 5/20/27 G2 80311 ARM, 1.63%, 8/20/29 G2 80319 ARM, 1.63%, 9/20/29 G2 8041 ARM, 1.63%, 8/20/22 G2 80424 ARM, 1.63%, 7/20/30 G2 80428 ARM, 2.00%, 7/20/30 G2 80541 ARM, 1.63%, 9/20/31 G2 80569 ARM, 1.75%, 1/20/32 G2 80570 ARM, 1.75%, 1/20/32 G2 80579 ARM, 1.75%, 2/20/32 G2 80637 ARM, 1.63%, 9/20/32 G2 80749 ARM, 1.63%, 10/20/33 G2 80795 ARM, 1.63%, 12/20/33 G2 80826 ARM, 1.75%, 2/20/34 $ 1,309 808 1,515 2,627 359 1,971 1,137 1,121 3,203 1,217 1,523 309 664 216 227 335 204 4,295 899 490 416 846 1,213 147 2,336 122 2,632 616 177 327 792 581 355 138 1,841 5,952 4,015 1,712 . Principal or Shares 2,460,246 458,497 459,721 22,426 89,127 1,749,966 638,408 606,079 2,342,514 440,084 4,529,935 2,706,229 288,691 125,417 4,395,604 2,383,290 936,953 1,102,260 307,131 236,715 223,439 117,493 1,083,148 93,906 142,957 63,121 445,668 1,489,671 4,566,822 6,382,897 2,845,831 5,507,645 7,223,517 2,667,517 10,000,000 919,091 7,665,625 8,538,926 2,953,977 109,222 86,103 199,095 93,267 117,530 144,387 105,506 45,389 428,081 1,161,233 64,218 83,003 54,272 259,638 148,560 103,669 238,553 316,056 137,945 218,158 102,867 Value (000) Security Description G2 80835 ARM, 1.75%, 2/20/34 G2 80837 ARM, 1.75%, 2/20/34 G2 81018 ARM, 1.63%, 8/20/34 G2 81044 ARM, 1.63%, 8/20/34 G2 8121 ARM, 1.75%, 1/20/23 G2 81214 ARM, 1.75%, 1/20/35 G2 81220 ARM, 1.75%, 1/20/35 G2 81278 ARM, 1.75%, 3/20/35 G2 81282 ARM, 1.75%, 3/20/35 G2 81938 ARM, 1.63%, 7/20/37 G2 82074 ARM, 1.75%, 5/20/38 G2 82107 ARM, 1.63%, 7/20/38 G2 82151 ARM, 1.63%, 9/20/38 G2 8228 ARM, 1.63%, 7/20/23 G2 82457 ARM, 1.75%, 1/20/40 G2 82463 ARM, 2.75%, 1/20/40 G2 83031 ARM, 2.50%, 1/20/42 G2 83048 ARM, 3.00%, 2/20/42 G2 8358 ARM, 1.75%, 1/20/24 G2 8359 ARM, 1.75%, 1/20/24 G2 8371 ARM, 1.75%, 2/20/24 G2 8373 ARM, 1.75%, 2/20/24 G2 8547 ARM, 2.00%, 11/20/24 G2 8580 ARM, 2.00%, 1/20/25 G2 8595 ARM, 2.00%, 2/20/25 G2 8855 ARM, 2.00%, 10/20/21 G2 8968 ARM, 1.63%, 9/20/26 G2 8991 ARM, 1.63%, 10/20/26 G2 MA1012 30YR, 3.50%, 5/20/43 G2 MA1089 30YR, 3.00%, 6/20/43 G2 MA1285 30YR, 3.50%, 9/20/43 G2 MA1520 30YR, 3.00%, 12/20/43 G2 MA2372 30YR, 4.00%, 11/20/44 G2 MA2894 30YR, 4.50%, 6/20/45 GN, 4.00%, 30YR TBA (b) GN 366983 30YR, 4.00%, 6/15/41 GN 367090 30YR, 4.50%, 7/15/41 GN 367092 30YR, 4.50%, 7/15/41 GN 455989 15YR, 5.00%, 7/15/26 GN 524825 30YR, 5.47%, 10/15/29 GN 524869 30YR, 5.47%, 1/15/30 GN 524925 30YR, 5.47%, 2/15/30 GN 524968 30YR, 5.47%, 3/15/30 GN 524996 30YR, 5.47%, 5/15/30 GN 525015 30YR, 5.47%, 6/15/30 GN 525033 30YR, 5.47%, 7/15/30 GN 546392 30YR, 5.47%, 2/15/31 GN 558954 20YR, 5.25%, 5/15/29 GN 558956 30YR, 4.50%, 6/15/29 GN 596009 30YR, 5.75%, 7/15/32 GN 596023 30YR, 5.75%, 7/15/32 GN 596035 30YR, 5.75%, 8/15/32 GN 596054 30YR, 5.75%, 8/15/32 GN 596071 30YR, 5.75%, 8/15/32 GN 596072 30YR, 5.75%, 7/15/32 GN 596090 30YR, 5.75%, 8/15/32 GN 596135 30YR, 5.75%, 8/15/32 GN 596166 30YR, 5.75%, 8/15/32 GN 596178 30YR, 5.75%, 9/15/32 GN 596197 30YR, 5.75%, 8/15/32 $ 2,530 472 477 23 92 1,799 656 623 2,410 454 4,685 2,808 298 130 4,519 2,478 965 1,144 316 244 230 121 1,123 98 148 65 462 1,546 4,799 6,556 2,989 5,657 7,694 2,877 10,652 980 8,459 9,352 3,271 122 96 222 104 131 161 118 51 478 1,268 72 93 61 294 167 116 269 357 155 247 116 Principal or Shares 159,840 31,145 182,330 41,827 63,056 141,977 191,499 444,238 314,093 172,347 161,881 184,209 228,051 120,896 192,144 202,174 1,049,506 304,010 106,423 93,804 590,707 151,256 94,513 110,514 61,687 1,444,663 1,428,797 1,951,946 597,641 2,644,182 3,397,537 925,589 556,275 5,743,975 1,188,804 107,950 116,156 505,903 182,428 6,395,800 131,196 190,840 65,340 286,492 869,360 678,542 787,249 826,060 126,137 63,220 508,507 636,847 1,555,489 1,721,999 397,014 99,369 329,829 86,330 103,595 140,777 Value (000) Security Description GN 596225 30YR, 5.75%, 9/15/32 GN 596231 30YR, 5.75%, 9/15/32 GN 596237 30YR, 5.75%, 9/15/32 GN 596312 30YR, 5.75%, 9/15/32 GN 596313 30YR, 5.75%, 9/15/32 GN 596396 30YR, 5.75%, 9/15/32 GN 601699 30YR, 5.70%, 12/15/32 GN 601738 30YR, 5.25%, 1/15/33 GN 601772 30YR, 5.25%, 1/15/33 GN 601774 30YR, 5.25%, 1/15/33 GN 601775 30YR, 5.70%, 1/15/33 GN 601786 30YR, 5.25%, 2/15/33 GN 601791 30YR, 5.25%, 2/15/33 GN 601810 30YR, 5.25%, 2/15/33 GN 601845 30YR, 5.25%, 2/15/33 GN 601858 30YR, 5.70%, 2/15/33 GN 601872 30YR, 5.25%, 3/15/33 GN 601937 30YR, 5.25%, 3/15/33 GN 602002 30YR, 5.25%, 3/15/33 GN 602043 30YR, 5.25%, 4/15/33 GN 605099 30YR, 5.50%, 3/15/34 GN 613272 30YR, 5.25%, 5/15/33 GN 613354 30YR, 5.45%, 7/15/33 GN 613355 30YR, 5.70%, 4/15/33 GN 613379 30YR, 5.45%, 7/15/33 GN 616826 30YR, 5.50%, 1/15/35 GN 629903 35YR, 5.80%, 6/15/42 GN 673234 30YR, 6.00%, 11/15/38 GN 677318 30YR, 6.00%, 9/15/38 GN 704439 30YR, 4.50%, 3/15/39 GN 710868 30YR, 5.50%, 9/15/39 GN 728153 20YR, 5.50%, 10/15/29 GN 728159 20YR, 5.25%, 11/15/29 GN 734089 30YR, 4.00%, 12/15/40 GN 743362 30YR, 4.75%, 6/15/40 GN 743363 30YR, 4.25%, 5/15/40 GN 743502 30YR, 4.25%, 6/15/40 GN 743503 30YR, 4.75%, 6/15/40 GN 743611 30YR, 4.75%, 6/15/40 GN 745187 30YR, 4.50%, 7/15/40 GN 747368 30YR, 4.75%, 7/15/40 GN 747491 30YR, 4.75%, 7/15/40 GN 747740 30YR, 4.25%, 9/15/40 GN 747741 30YR, 4.75%, 9/15/40 GN 761040 30YR, 4.25%, 3/15/41 GN 762726 30YR, 4.25%, 3/15/41 GN 763012 30YR, 4.25%, 4/15/41 GN 763216 30YR, 4.25%, 4/15/41 GN 768721 30YR, 4.25%, 4/15/41 GN 768886 30YR, 4.25%, 6/15/41 GN 781636 30YR, 5.50%, 7/15/33 GN 781810 30YR, 5.50%, 10/15/34 GN 782835 30YR, 6.00%, 12/15/39 GN 782858 30YR, 6.00%, 11/15/39 GNR 1999-18 FA, 0.50%, 5/16/29 GNR 1999-40 FE, 0.75%, 11/16/29 GNR 1999-40 FK, 0.75%, 11/16/29 GNR 1999-45 FC, 0.60%, 12/16/29 GNR 1999-45 FH, 0.65%, 12/16/29 GNR 2000-22 FG, 0.40%, 5/16/30 $ 180 35 205 47 71 160 215 495 350 191 182 204 253 134 213 227 1,189 339 118 104 675 168 106 124 69 1,619 1,456 2,222 685 2,892 3,856 1,044 620 6,142 1,314 116 125 555 199 7,016 143 208 70 313 934 731 844 893 136 68 581 724 1,769 1,958 398 100 332 86 104 141 Annual Report 23 . Payden GNMA Fund continued Principal or Shares Value (000) Security Description 386,871 GNR 2000-9 FG, 0.80%, 2/16/30 407,522 GNR 2000-9 FH, 0.70%, 2/16/30 328,151 GNR 2001-19 F, 0.70%, 5/16/31 36,427 GNR 2001-21 FN, 0.40%, 8/16/22 1,470,602 GNR 2001-22 FG, 0.55%, 5/16/31 674,527 GNR 2001-31 FA, 0.45%, 6/16/31 593,853 GNR 2001-35 FA, 0.45%, 8/16/31 1,837,710 GNR 2001-47 FA, 0.60%, 9/16/31 636,729 GNR 2001-59 FA, 0.60%, 11/16/24 319,550 GNR 2001-65 FV, 0.59%, 2/20/29 394,494 GNR 2002-11 FJ, 0.69%, 2/20/32 369,366 GNR 2002-13 FA, 0.70%, 2/16/32 1,063,377 GNR 2002-48 FG, 0.50%, 12/16/30 523,184 GNR 2002-48 FT, 0.40%, 12/16/26 1,004,705 GNR 2002-5 FP, 0.75%, 1/16/32 674,493 GNR 2002-72 FA, 0.59%, 10/20/32 310,267 GNR 2002-72 FB, 0.59%, 10/20/32 695,782 GNR 2002-72 FE, 0.59%, 10/20/32 820,223 GNR 2002-76 F, 0.40%, 1/16/31 187,975 GNR 2002-76 FY, 0.50%, 12/16/26 25,248 GNR 2002-79 FB, 0.45%, 11/16/32 1,218,776 GNR 2003-71 FC, 0.69%, 7/20/33 1,913,120 GNR 2003-94 FB, 0.50%, 12/16/30 2,981,255 GNR 2004-56 F, 0.59%, 6/20/33 1,623,186 GNR 2004-59 FH, 0.45%, 8/16/34 384,981 GNR 2004-73 JM, 0.00%, 9/16/34 484,033 GNR 2006-47 FA, 0.40%, 8/16/36 2,815,004 GNR 2006-60 FK, 0.40%, 11/20/36 399,799 GNR 2006-64 PO, 0.00%, 4/16/34 2,690,825 GNR 2007-54 FC, 0.45%, 9/20/37 961,294 GNR 2007-76 FB, 0.69%, 11/20/37 2,623,712 GNR 2008-15 CF, 0.70%, 2/20/38 622,172 GNR 2008-2 FH, 0.64%, 1/20/38 3,385,637 GNR 2008-67 UF, 0.64%, 6/20/38 1,388,594 GNR 2009-87 FB, 0.84%, 9/20/39 17,111,182 GNR 2014-69 IB, 1.13%, 6/20/36 40,060,207 GNR 2014-79 ST, 1.15%, 7/20/29 17,407,810 GNR 2014-99 ID, 1.23%, 11/20/36 Total Mortgage Backed (Cost - $393,528) $ 391 410 331 36 1,479 678 595 1,847 640 321 397 373 1,066 524 1,012 677 311 699 822 188 25 1,230 1,918 2,994 1,626 373 485 2,813 396 2,699 971 2,650 627 3,418 1,406 761 1,469 737 400,537 Principal or Shares Security Description NCUA Guaranteed (3%) 3,118,906 NCUA Guaranteed Notes Trust 2010-R2, 0.56%, 11/06/17 1,382,772 NCUA Guaranteed Notes Trust 2011-R3, 0.60%, 3/11/20 2,988,039 NCUA Guaranteed Notes Trust 2011-R4, 0.58%, 3/06/20 609,465 NCUA Guaranteed Notes Trust 2011-R5, 0.57%, 4/06/20 Total NCUA Guaranteed (Cost - $8,116) Purchased Put Options (0%) 200 Eurodollar 1-Year Mid-Curve Option, 97.875, 3/11/16 200 Eurodollar 1-Year Mid-Curve Option, 98, 12/11/15 Total Purchased Put Options (Cost - $121) Investment Company (3%) 6,822,106 Payden Cash Reserves Money Market Fund * (Cost - $6,822) Total (Cost - $415,319) (152%) Liabilities in excess of Other Assets (-52%) Net Assets (100%) $ 3,125 1,387 2,993 610 8,115 5 1 6 $ 6,822 422,223 (143,615) 278,608 * Affiliated investment (a) Security offered only to qualified institutional investors, and thus is not registered for sale to the public under rule 144A of the Securities Act of 1933. It has been deemed liquid under guidelines approved by the Board. (b) Security was purchased on a delayed delivery basis. Open Futures Contracts Number of Contracts 150 Contract Type U.S. Treasury 2 Year Note Future See notes to financial statements. 24 Payden Mutual Funds Value (000) Expiration Date Jan-16 Current Value (000) $(32,798) Unrealized Appreciation (000s) $21 . Payden Core Bond Fund $19,000 The Fund seeks a high level of total return that is consistent with preservation of capital by generally investing in investment grade debt securities with no limit on the average portfolio maturity. One Year 1.73% $17,000 Five Year 3.61% Investor Class $15,709 Ten Year 4.62% Barclays Capital Aggregate Bond Index $15,861 $15,000 Portfolio Composition - percent of value Corporate Bond Mortgage Backed U.S. Treasury Investment Company Asset Backed Other 43% 29% 9% 8% 5% 6% $13,000 $11,000 $9,000 10/31/05 10/10 10/31/15 Past performance does not predict future returns. The graph does not reflect the impact of taxes or transaction costs a shareholder would pay. The Fund’s Adviser Class is expected to perform similarly to its Investor Class. This information is not part of the audited financial statements. Schedule of Investments - October 31, 2015 Principal or Shares Security Description Asset Backed (6%) 6,020,000 Babson CLO Ltd.
144A, 1.42%, 4/20/25 (a) 97,323 Chase Funding Mortgage Loan Asset-Backed Certificates, 0.86%, 11/25/32 1,778,264 Colony American Homes 2014-1 144A, 1.40%, 5/17/31 (a) 1,428,469 Colony American Homes 2014-2 144A, 1.15%, 7/17/31 (a) 1,879,103 Colony American Homes 2015-1 144A, 1.40%, 7/17/32 (a) 6,665,000 Dryden XXII Senior Loan Fund 144A, 1.42%, 8/15/25 (a) 1,125,000 Eaton Vance CLO 2015-1 Ltd. 144A, 4.52%, 10/20/26 (a) 1,510,831 Invitation Homes 2013-SFR1 Trust 144A, 1.40%, 12/17/30 (a) 1,810,000 Invitation Homes 2014-SFR1 Trust 144A, 1.20%, 6/17/31 (a) 1,980,000 Invitation Homes 2014-SFR2 Trust 144A, 1.30%, 9/17/31 (a) 2,100,000 Invitation Homes 2014-SFR3 Trust 144A, 1.40%, 12/17/31 (a) 3,160,720 Invitation Homes 2015-SFR3 Trust 144A, 1.50%, 8/17/32 (a) 2,460,859 L.A. Arena Funding LLC 144A, 7.66%, 12/15/26 (a) 601,363 Nelnet Student Loan Trust 2014-2A 144A, 0.48%, 6/25/21 (a) 2,000,000 SLM Student Loan Trust, 0.58%, 7/26/21 6,395,000 Tyron Park CLO Ltd.
144A, 1.44%, 7/15/25 (a) 1,268,091 VOLT XXV LLC 144A, 3.50%, 6/26/45 (a) 1,788,435 VOLT XXXV LLC 144A, 3.50%, 6/26/45 (a) 280,772 Volvo Financial Equipment LLC Series 2014-1 144A, 0.54%, 11/15/16 (a) Total Asset Backed (Cost - $44,276) Corporate Bond (50%) 3,000,000 AbbVie Inc., 3.60%, 5/14/25 Value (000) $ Principal or Shares 5,920 93 3,000,000 3,000,000 2,325,000 1,747 3,800,000 1,396 1,995,000 655,000 1,839 1,190,410 6,549 1,091 1,490 1,773 1,944 2,065 3,107 2,696 599 1,989 6,298 1,259 1,791 281 43,927 2,955 2,700,000 3,150,000 2,750,000 2,045,000 2,100,000 1,600,000 2,500,000 2,880,000 1,310,000 1,590,000 240,000 2,000,000 1,640,000 1,900,000 1,340,000 1,150,000 2,300,000 1,100,000 1,935,000 Value (000) Security Description Actavis Funding SCS, 1.20%, 9/01/16 Actavis Funding SCS, 3.45%, 3/15/22 AerCap Ireland Capital Ltd. / AerCap Global Aviation Trust, 5.00%, 10/01/21 Air Canada 2015-1 Class A Pass Through Trust 144A, 3.60%, 3/15/27 (a) Air Lease Corp., 5.63%, 4/01/17 Alibaba Group Holding Ltd. 144A, 3.60%, 11/28/24 (a) Alliance Pipeline LP/United States 144A, 7.00%, 12/31/19 (a) Ally Financial Inc., 4.13%, 2/13/22 Amazon.com Inc., 3.30%, 12/05/21 Anglo American Capital PLC 144A, 4.13%, 4/15/21 (a) Apollo Management Holdings LP 144A, 4.00%, 5/30/24 (a) Ardagh Packaging Finance PLC / Ardagh Holdings USA Inc.
144A, 3.34%, 12/15/19 (a) AT&T Inc., 3.40%, 5/15/25 AT&T Inc., 4.75%, 5/15/46 Australia & New Zealand Banking Group Ltd. 144A, 4.50%, 3/19/24 (a) Aviation Capital Group Corp. 144A, 4.63%, 1/31/18 (a) Avis Budget Car Rental LLC / Avis Budget Finance Inc., 5.50%, 4/01/23 Bank of America Corp., 3.95%, 4/21/25 Bank of America Corp., 6.10%, 12/29/49 Bank of America Corp., 6.88%, 4/25/18 Banque Federative du Credit Mutuel SA 144A, 2.75%, 10/15/20 (a) Barclays Bank PLC 144A, 6.05%, 12/04/17 (a) Barclays PLC, 2.75%, 11/08/19 Baxalta Inc. 144A, 2.88%, 6/23/20 (a) Baxalta Inc.
144A, 4.00%, 6/23/25 (a) BB&T Corp., 4.90%, 6/30/17 $ 2,997 2,985 2,435 3,672 2,092 637 1,292 2,739 3,276 2,377 2,058 2,074 1,556 2,304 2,901 1,353 1,654 237 2,025 1,832 1,900 1,446 1,155 2,300 1,108 2,036 Annual Report 25 . Payden Core Bond Fund continued Principal or Shares 1,353,000 1,440,000 3,920,000 1,500,000 3,100,000 2,805,000 3,000,000 860,000 1,500,000 2,300,000 1,500,000 2,300,000 2,650,000 3,800,000 710,000 1,860,000 1,125,000 900,000 1,200,000 1,100,000 2,000,000 1,220,653 1,643,508 700,000 2,215,000 3,000,000 1,695,000 1,165,000 2,000,000 2,217,000 2,400,000 1,025,000 3,200,000 1,800,000 1,454,117 1,350,000 2,730,000 1,330,000 1,980,000 4,045,000 1,505,000 2,700,000 Value (000) Security Description BBVA Banco Continental SA 144A, 2.25%, 7/29/16 (a) BBVA Banco Continental SA 144A, 3.25%, 4/08/18 (a) Bear Stearns Companies LLC, 5.55%, 1/22/17 Berry Plastics Corp., 5.13%, 7/15/23 Biogen Inc., 4.05%, 9/15/25 Block Financial LLC, 4.13%, 10/01/20 BNZ International Funding Ltd./London 144A, 1.90%, 2/26/18 (a) Boston Scientific Corp., 2.85%, 5/15/20 CCO Holdings LLC / CCO Holdings Capital Corp., 7.38%, 6/01/20 Celgene Corp., 3.55%, 8/15/22 CHS/Community Health Systems Inc., 8.00%, 11/15/19 Citigroup Inc., 4.45%, 9/29/27 Citizens Bank NA/Providence RI, 2.45%, 12/04/19 Citizens Financial Group Inc. 144A, 4.15%, 9/28/22 (a) CNH Industrial Capital LLC, 3.63%, 4/15/18 CNPC General Capital Ltd. 144A, 1.45%, 4/16/16 (a) Compass Bank, 2.75%, 9/29/19 Compass Bank, 3.88%, 4/10/25 Credit Suisse Group Funding Guernsey Ltd. 144A, 2.75%, 3/26/20 (a) Credit Suisse Group Funding Guernsey Ltd. 144A, 3.75%, 3/26/25 (a) CVS Health Corp., 4.88%, 7/20/35 CVS Pass-Through Trust 144A, 5.79%, 1/10/26 (a) CVS Pass-Through Trust Series 2014 144A, 4.16%, 8/10/36 (a) DaVita HealthCare Partners Inc., 5.13%, 7/15/24 Dean Foods Co. 144A, 6.50%, 3/15/23 (a) Deutsche Bank AG, 2.95%, 8/20/20 Dignity Health, 3.13%, 11/01/22 Dignity Health, 4.50%, 11/01/42 Discover Bank/Greenwood DE, 3.10%, 6/04/20 Dow Chemical Co., 9.40%, 5/15/39 Entergy Louisiana LLC, 5.00%, 7/15/44 Exelon Generation Co.
LLC, 6.20%, 10/01/17 Fairfax U.S. Inc. 144A, 4.88%, 8/13/24 (a) FedEx Corp., 4.50%, 2/01/65 Fermaca Enterprises S de RL de CV 144A, 6.38%, 3/30/38 (a) Fifth Third Bank/Cincinnati OH, 2.15%, 8/20/18 Ford Motor Credit Co.
LLC, 2.24%, 6/15/18 FS Investment Corp., 4.25%, 1/15/20 General Motors Financial Co. Inc., 3.10%, 1/15/19 Glencore Funding LLC 144A, 1.49%, 5/27/16 (a) Goldman Sachs Group Inc., 1.52%, 4/30/18 Goldman Sachs Group Inc., 2.55%, 10/23/19 26 Payden Mutual Funds $ 1,365 1,465 4,108 1,489 3,144 2,852 3,006 860 1,560 2,341 1,567 2,303 Principal or Shares 2,500,000 2,040,000 3,060,000 2,205,000 2,000,000 2,650,000 3,000,000 1,000,000 2,200,000 1,700,000 1,500,000 4,050,000 2,633 1,440,000 3,867 715 2,500,000 2,050,000 1,861 1,117 840 680,000 1,197 900,000 2,000,000 1,078 2,112 920,000 1,362 1,619 712 2,342 3,012 1,694 1,116 2,025 3,249 2,327 1,097 3,166 1,603 1,410 1,360 2,723 1,345 1,988 3,951 1,520 2,721 3,180,000 2,370,000 3,760,000 1,760,000 2,100,000 3,450,000 3,700,000 1,400,000 2,150,000 2,260,000 2,400,000 2,890,000 1,500,000 1,570,000 1,340,000 2,100,000 1,843,000 2,200,000 1,540,000 322,000 1,500,000 1,440,000 2,350,000 2,000,000 2,100,000 Value (000) Security Description Harris Corp., 2.70%, 4/27/20 HCA Inc., 5.88%, 5/01/23 Heathrow Funding Ltd. 144A, 4.88%, 7/15/21 (a) Hertz Corp., 6.75%, 4/15/19 Hewlett Packard Enterprise Co.
144A, 2.45%, 10/05/17 (a) Hewlett Packard Enterprise Co. 144A, 4.90%, 10/15/25 (a) Hewlett Packard Enterprise Co. 144A, 6.20%, 10/15/35 (a) Hexion U.S.
Finance Corp., 6.63%, 4/15/20 HSBC USA Inc., 2.00%, 8/07/18 Hyundai Capital America 144A, 2.60%, 3/19/20 (a) Icahn Enterprises LP / Icahn Enterprises Finance Corp., 3.50%, 3/15/17 Imperial Tobacco Finance PLC 144A, 3.75%, 7/21/22 (a) Industrial & Commercial Bank of China Ltd./New York, 3.23%, 11/13/19 ING Bank NV 144A, 2.05%, 8/17/18 (a) Inter-American Development Bank, 3.88%, 9/17/19 International Lease Finance Corp., 2.29%, 6/15/16 Iron Mountain Inc., 5.75%, 8/15/24 Jackson National Life Global Funding 144A, 0.57%, 7/29/16 (a) Jackson National Life Global Funding 144A, 1.88%, 10/15/18 (a) JPMorgan Chase & Co., 1.22%, 1/25/18 Kaiser Foundation Hospitals, 3.50%, 4/01/22 Kennametal Inc., 2.65%, 11/01/19 KeyCorp, 2.90%, 9/15/20 Kinder Morgan Inc./DE, 5.30%, 12/01/34 KKR Group Finance Co. II LLC 144A, 5.50%, 2/01/43 (a) Kraft Heinz Foods Co. 144A, 3.50%, 7/15/22 (a) Lam Research Corp., 3.80%, 3/15/25 Latam Airlines 2015-1 Pass Through Trust A 144A, 4.20%, 11/15/27 (a) LifePoint Health Inc., 5.50%, 12/01/21 Lloyds Bank PLC, 2.00%, 8/17/18 Macquarie Bank Ltd.
144A, 2.00%, 8/15/16 (a) Massachusetts Mutual Life Insurance Co. 144A, 4.50%, 4/15/65 (a) McGraw Hill Financial Inc., 5.90%, 11/15/17 MDC Holdings Inc., 6.00%, 1/15/43 Mead Johnson Nutrition Co., 4.13%, 11/15/25 MeadWestvaco Corp., 7.95%, 2/15/31 Medtronic Inc., 3.15%, 3/15/22 MetLife Inc., 6.40%, 12/15/36 MetLife Inc., 10.75%, 8/01/39 Mobile Mini Inc., 7.88%, 12/01/20 Morgan Stanley, 1.17%, 1/24/19 Morgan Stanley, 4.35%, 9/08/26 Morgan Stanley, 5.45%, 7/29/49 Morgan Stanley, 5.55%, 12/29/49 $ 2,459 2,173 3,363 2,268 2,007 2,624 2,935 852 2,203 1,673 1,521 4,106 1,473 2,512 2,235 680 908 2,001 922 3,193 2,445 3,734 1,775 1,773 3,579 3,776 1,315 2,048 2,300 2,416 2,913 1,391 1,680 1,092 2,126 2,415 2,252 1,693 508 1,567 1,435 2,389 1,970 2,100 . Principal or Shares 1,889,000 1,300,000 1,400,000 1,000,000 3,545,000 1,000,000 1,700,000 3,015,000 1,450,000 2,150,000 1,470,000 2,375,000 1,960,000 2,350,000 1,850,000 1,725,000 1,000,000 2,300,000 1,580,000 3,250,000 867,000 2,525,000 835,000 1,645,000 4,030,000 1,675,000 1,055,000 1,370,000 1,950,000 3,600,000 5,270,000 2,750,000 1,650,000 2,675,000 2,270,000 2,050,000 Value (000) Security Description Nationwide Building Society 144A, 6.25%, 2/25/20 (a) Nationwide Mutual Insurance Co. 144A, 9.38%, 8/15/39 (a) New Red Finance Inc 144A, 6.00%, 4/01/22 (a) New Red Finance Inc. 144A, 4.63%, 1/15/22 (a) North Shore Long Island Jewish Health Care Inc., 6.15%, 11/01/43 Novelis Inc./GA, 8.75%, 12/15/20 Old Republic International Corp., 4.88%, 10/01/24 Orange SA, 9.00%, 3/01/31 Pacific Life Insurance Co. 144A, 9.25%, 6/15/39 (a) Penske Truck Leasing Co.
LP / PTL Finance Corp. 144A, 3.38%, 2/01/22 (a) People’s United Bank, 4.00%, 7/15/24 Perrigo Finance PLC, 3.50%, 12/15/21 Petroleos Mexicanos, 4.88%, 1/18/24 Prudential Financial Inc., 5.63%, 6/15/43 QUALCOMM Inc., 2.25%, 5/20/20 Quest Diagnostics Inc., 3.50%, 3/30/25 Reynolds Group Issuer Inc. / Reynolds Group Issuer LLC/Reynolds Group Issuer Lu, 6.88%, 2/15/21 Ryder System Inc., 2.50%, 5/11/20 Santander Holdings USA Inc./PA, 2.65%, 4/17/20 Santander UK Group Holdings PLC 144A, 4.75%, 9/15/25 (a) Scentre Group Trust 1 / Scentre Group Trust 2 144A, 2.38%, 11/05/19 (a) Select Income REIT, 4.50%, 2/01/25 Senior Housing Properties Trust, 4.75%, 5/01/24 Senior Housing Properties Trust, 6.75%, 4/15/20 Sinopec Capital 2013 Ltd.
144A, 1.88%, 4/24/18 (a) Sompo Japan Insurance Inc. 144A, 5.33%, 3/28/73 (a) Southeast Supply Header LLC 144A, 4.25%, 6/15/24 (a) Sparebank 1 Boligkreditt AS 144A, 2.63%, 5/27/16 (a) Sumitomo Mitsui Banking Corp., 2.45%, 1/16/20 Suncorp-Metway Ltd. 144A, 2.35%, 4/27/20 (a) Suntory Holdings Ltd.
144A, 2.55%, 9/29/19 (a) Sydney Airport Finance Co. Pty Ltd. 144A, 3.38%, 4/30/25 (a) Synchrony Financial, 2.70%, 2/03/20 Teachers Insurance & Annuity Association of America 144A, 6.85%, 12/16/39 (a) Tencent Holdings Ltd.
144A, 3.38%, 5/02/19 (a) TIAA Asset Management Finance Co. LLC 144A, 2.95%, 11/01/19 (a) $ Principal or Shares 2,192 1,977 1,468 1,017 4,219 1,007 1,771 4,391 2,147 2,102 1,460 2,327 1,963 2,465 1,841 1,673 1,047 2,271 1,564 3,251 859 2,414 827 1,834 4,010 1,784 1,021 1,385 1,955 3,573 5,298 2,631 1,629 3,367 2,320 2,078 1,000,000 2,995,000 2,195,000 2,295,000 1,300,000 2,800,000 Value (000) Security Description T-Mobile USA Inc., 6.25%, 4/01/21 Transatlantic Holdings Inc., 8.00%, 11/30/39 Tribune Media Co. 144A, 5.88%, 7/15/22 (a) TSMC Global Ltd.
144A, 1.63%, 4/03/18 (a) UBS AG/Stamford CT, 5.75%, 4/25/18 UBS Group Funding Jersey Ltd. 144A, 2.95%, 9/24/20 (a) 1,350,000 Valero Energy Corp., 6.63%, 6/15/37 3,140,000 Vereit Operating Partnership LP, 3.00%, 2/06/19 3,990,000 Verizon Communications Inc., 6.40%, 9/15/33 5,085,000 Welltower Inc, 4.13%, 4/01/19 965,000 Williams Companies Inc., 8.75%, 3/15/32 Total Corporate Bond (Cost - $338,388) FDIC Guaranteed (0%) 401,371 FDIC Structured Sale Guaranteed Notes 144A, 0.91%, 12/04/20 (a) (Cost - $402) Foreign Government (3%) 1,470,000 Indonesia Government International Bond 144A, 3.75%, 4/25/22 (a) 3,920,000 Mexico Government International Bond, 3.63%, 3/15/22 2,720,000 Panama Government International Bond, 5.20%, 1/30/20 3,000,000 Philippine Government International Bond, 4.00%, 1/15/21 2,989,000 Poland Government International Bond, 5.13%, 4/21/21 2,800,000 Romanian Government International Bond 144A, 4.38%, 8/22/23 (a) Total Foreign Government (Cost - $18,150) Mortgage Backed (33%) 1,758,118 Credit Suisse Mortgage Capital Certificates 144A, 1.55%, 5/25/43 (a) 2,290,000 Del Coronado Trust 144A, 1.00%, 3/15/26 (a) 2,185,071 Fannie Mae Connecticut Avenue Securities, 1.15%, 5/25/24 1,170,400 Fannie Mae Connecticut Avenue Securities, 1.15%, 5/25/24 1,641,401 Fannie Mae Connecticut Avenue Securities, 1.39%, 7/25/24 5,053,460 Fannie Mae Connecticut Avenue Securities, 1.40%, 5/25/25 1,454,750 Fannie Mae Connecticut Avenue Securities, 1.80%, 1/25/24 680,709 Fannie Mae Connecticut Avenue Securities, 2.20%, 10/25/23 1,500,000 Fannie Mae Connecticut Avenue Securities, 5.89%, 4/25/28 8,595,000 FFCB, 0.23%, 1/17/18 6,790,846 FG Q12837 30YR, 3.00%, 11/01/42 8,605,000 FHLB, 5.50%, 7/15/36 5,010,000 FN, 2.50%, 15YR TBA (b) 16,860,000 FN, 3.00%, 30YR TBA (b) 700,000 FN, 3.00%, 15YR TBA (b) $ 1,035 3,895 2,261 2,260 1,419 2,805 1,498 3,050 4,624 5,364 949 340,316 403 1,461 4,024 2,985 3,278 3,390 2,952 18,090 1,682 2,290 2,164 1,163 1,639 5,039 1,458 687 1,530 8,595 6,870 11,452 5,100 17,038 728 Annual Report 27 . Payden Core Bond Fund continued Principal or Shares 11,620,000 23,970,000 11,900,000 3,298,210 3,511,143 2,042,286 4,416,242 3,258,311 1,419,418 3,068,485 873,120 4,427,163 6,150,839 1,756,738 880,458 2,373,979 1,181,858 1,400,000 276,934 1,050,426 1,827,067 6,300,000 7,540,000 3,060,847 1,345,663 300,000 149,720 1,468,343 2,440,000 2,300,000 431,031 8,322,446 3,574,714 5,753,617 53,216 39,996 1,347,091 2,269,868 597,810 2,205,381 Value (000) Security Description FN, 3.50%, 30YR TBA (b) FN, 4.00%, 30YR TBA (b) FN, 4.50%, 30YR TBA (b) FN 254766 30YR, 5.00%, 6/01/33 FN 725423 30YR, 5.50%, 5/01/34 FN 725424 30YR, 5.50%, 4/01/34 FN 745418 30YR, 5.50%, 4/01/36 FN 995203 30YR, 5.00%, 7/01/35 FN AE0138 30YR, 4.50%, 3/01/40 FN AJ7689 30YR, 4.00%, 12/01/41 FN AO4075 15YR, 3.00%, 5/01/27 FN AS5730 15YR, 3.00%, 9/01/30 FN AX3596 15YR, 3.00%, 7/01/27 Freddie Mac Structured Agency Credit Risk Debt Notes, 1.10%, 10/25/27 Freddie Mac Structured Agency Credit Risk Debt Notes, 1.25%, 3/25/25 Freddie Mac Structured Agency Credit Risk Debt Notes, 1.30%, 5/25/25 Freddie Mac Structured Agency Credit Risk Debt Notes, 1.65%, 11/25/23 Freddie Mac Structured Agency Credit Risk Debt Notes, 2.40%, 2/25/24 G2 5140 30YR, 4.50%, 8/20/41 G2 5175 30YR, 4.50%, 9/20/41 G2 MA2894 30YR, 4.50%, 6/20/45 GN, 3.50%, 30YR TBA (b) GN, 4.00%, 30YR TBA (b) GN 745187 30YR, 4.50%, 7/15/40 GN AA5452 30YR, 3.50%, 7/15/42 Granite Master Issuer PLC, 1.06%, 12/17/54 Harborview Mortgage Loan Trust, 2.84%, 1/19/35 Hilton USA Trust 2013-HLF 144A, 1.19%, 11/05/30 (a) Hilton USA Trust 2013-HLT 144A, 2.66%, 11/05/30 (a) JP Morgan Chase Commercial Mortgage Securities Trust 2015-COSMO 144A, 1.45%, 1/15/32 (a) JP Morgan Mortgage Trust 2006-S2, 6.00%, 7/25/36 JP Morgan Mortgage Trust 2013-1 144A, 2.50%, 3/25/43 (a) JP Morgan Mortgage Trust 2014-2 144A, 3.00%, 6/25/29 (a) JP Morgan Seasoned Mortgage Trust 2014-1 144A, 0.70%, 5/25/33 (a) Landmark Mortgage Securities PLC, 0.81%, 6/17/38 GBP (c) Morgan Stanley Mortgage Loan Trust, 2.12%, 7/25/34 Nationstar Mortgage Loan Trust 2013-A 144A, 3.75%, 12/25/52 (a) New Residential Mortgage Loan Trust 2014-3 144A, 3.75%, 11/25/54 (a) Prime Mortgage Trust, 5.00%, 10/25/35 Residential Asset Securitization Trust 2006-A8, 6.00%, 8/25/36 28 Payden Mutual Funds $ Principal or Shares 12,094 25,517 12,895 3,653 3,959 2,302 4,968 3,609 1,556 3,277 913 4,612 6,423 1,749 880 2,366 1,182 1,409 302 1,147 1,970 6,592 8,031 3,358 1,422 296 140 1,458 2,447 2,293 391 8,340 3,660 5,560 79 40 1,381 2,337 585 1,832 72,484 1,091,581 5,538,369 Value (000) Security Description Sequoia Mortgage Trust, 0.99%, 10/20/27 Sequoia Mortgage Trust, 1.45%, 2/25/43 Sequoia Mortgage Trust 144A, 3.00%, 5/25/43 (a) 2,320,549 Sequoia Mortgage Trust, 3.50%, 9/25/42 926,589 Springleaf Mortgage Loan Trust 144A, 1.27%, 6/25/58 (a) 1,300,000 Springleaf Mortgage Loan Trust 144A, 5.58%, 6/25/58 (a) 18,282 Structured Asset Mortgage Investments Trust 2003-CL1, 3.72%, 7/25/32 7,611 Structured Asset Securities Corp. Mortgage Pass Through Certificates 2002-16A, 0.00%, 8/25/32 875,558 WaMu Mortgage Pass-Through Certificates Series 2007-HY7 Trust, 2.23%, 7/25/37 2,750,000 Wells Fargo Commercial Mortgage Trust 2015-Lc22, 3.84%, 9/15/58 Total Mortgage Backed (Cost - $227,718) Municipal (1%) 770,000 State Board of Administration Finance Corp., 3.00%, 7/01/20 1,495,000 State of California, 7.55%, 4/01/39 1,000,000 State of Washington, 1.70%, 7/01/20 365,000 University of California, 3.26%, 5/15/24 Total Municipal (Cost - $3,578) U.S. Government Agency (3%) 10,000,000 FHLB Disc Note, 1.30%, 11/13/15 (d) 10,000,000 FHLB Disc Note, 1.30%, 11/27/15 (d) Total U.S. Government Agency (Cost - $20,000) U.S.
Treasury (10%) 2,100,000 U.S. Treasury Note, 0.19%, 1/31/17 3,300,000 U.S. Treasury Note, 0.38%, 10/31/16 11,520,000 U.S.
Treasury Note, 0.88%, 4/30/17 15,145,000 U.S. Treasury Note, 1.38%, 10/31/20 13,340,000 U.S. Treasury Note, 1.50%, 5/31/20 27,195,000 U.S.
Treasury Note, 2.88%, 8/15/45 Total U.S. Treasury (Cost - $72,452) Investment Company (9%) 500,000 Payden Absolute Return Bond Fund, SI Class * 21,564,940 Payden Cash Reserves Money Market Fund * 1,656,459 Payden Emerging Markets Corporate Bond Fund, SI Class * 646,094 Payden Emerging Markets Local Bond Fund, Investor Class * 1,522,172 Payden Floating Rate Fund, SI Class * Total Investment Company (Cost - $64,840) Total (Cost - $789,804) (115%) Liabilities in excess of Other Assets (-15%) Net Assets (100%) $ 71 1,060 5,482 2,361 929 1,309 19 5 751 2,890 229,337 787 2,208 975 370 4,340 10,000 10,000 20,000 2,100 3,298 11,564 15,036 13,366 26,877 72,241 4,965 21,565 15,952 $ 4,303 15,069 61,854 790,508 (105,359) 685,149 * Affiliated investment (a) Security offered only to qualified institutional investors, and thus is not registered for sale to the public under rule 144A of the Securities Act of 1933. It has been deemed liquid under guidelines approved by the Board. (b) Security was purchased on a delayed delivery basis. (c) Principal in foreign currency. (d) Yield to maturity at time of purchase. . Open Forward Currency Contracts to USD Delivery Date Assets: 2/1/2016 12/15/2015 12/15/2015 Liabilities: 2/1/2016 2/24/2016 12/15/2015 11/24/2015 11/24/2015 11/24/2015 1/27/2016 Currency (000s) Australian Dollar (Sell 27,401) British Pound (Buy 6,371) Euro (Sell 13,192) Counterparty Unrealized Appreciation (Depreciation) (000s) Credit Suisse First Boston International Citibank, N.A. $ 352 BNP PARIBAS 180 $ 561 Credit Suisse First Boston International Barclays Bank PLC $ (14) 29 Open Futures Contracts Number of Contracts 72 282 160 31 Australian Dollar (Buy 12,970) Chinese Yuan (Sell 52,587) Euro (Sell 5,586) New Taiwan Dollar (Sell 106,220) South Korean Won (Buy 5,803,000) South Korean Won (Sell 5,803,000) Thailand Baht (Sell 295,030) BNP PARIBAS HSBC Bank USA, N.A. BNP PARIBAS BNP PARIBAS Barclays Bank PLC Contract Type U.S. Long Bond Future U.S. Treasury 10 Year Note Future U.S. Treasury 5 Year Note Future U.S.
Ultra Bond Future Expiration Date Dec-15 Dec-15 Current Value (000) $(11,263) (36,008) Unrealized Appreciation (Depreciation) (000s) $177 36 Jan-16 (19,164) 121 Dec-15 4,952 (52) $282 (232) (17) (21) (36) (211) (29) $(560) See notes to financial statements. Annual Report 29 . Payden Corporate Bond Fund $21,000 The Fund seeks a high level of total return that is consistent with the preservation of capital by generally investing 80% of its assets in investment grade corporate bonds with no limit on the average portfolio maturity. Five Year 5.09% Since 3/12/09 7.83% Fund $16,494 Barclays Capital U.S. Corporate Investment Grade Index $16,825 $17,000 $15,000 Portfolio Composition - percent of value Financial Consumer Non-Cyclical Telecommunication Consumer Cyclical Industrial Other One Year 2.26% $19,000 52% 15% 7% 7% 5% 14% $13,000 $11,000 $9,000 3/12/09 6/12 10/31/15 Past performance does not predict future returns. The graph does not reflect the impact of taxes or transaction costs a shareholder would pay. This information is not part of the audited financial statements. Schedule of Investments - October 31, 2015 Principal or Shares Security Description Corporate Bond (97%) Consumer Cyclical (7%) 600,000 Continental Airlines 2012-3 Class C Pass Thru Certificates, 6.13%, 4/29/18 500,000 Daimler Finance North America LLC 144A, 1.60%, 8/03/17 (a) 600,000 Ford Motor Credit Co. LLC, 1.46%, 3/27/17 730,000 Glencore Funding LLC 144A, 1.49%, 5/27/16 (a) 450,000 Lam Research Corp., 3.80%, 3/15/25 330,000 Latam Airlines 2015-1 Pass Through Trust B 144A, 4.50%, 11/15/23 (a) 300,000 Lowe’s Companies Inc., 4.38%, 9/15/45 650,000 Magna International Inc., 4.15%, 10/01/25 700,000 Tingyi Cayman Islands Holding Corp., 3.88%, 6/20/17 Consumer Non-Cyclical (15%) 300,000 AbbVie Inc., 3.60%, 5/14/25 425,000 Actavis Funding SCS, 2.45%, 6/15/19 250,000 Actavis Funding SCS, 3.00%, 3/12/20 250,000 Actavis Funding SCS, 4.75%, 3/15/45 700,000 Baxalta Inc.
144A, 4.00%, 6/23/25 (a) 950,000 Biogen Inc., 4.05%, 9/15/25 750,000 Block Financial LLC, 4.13%, 10/01/20 700,000 Blue Cross & Blue Shield of Minnesota 144A, 3.79%, 5/01/25 (a) 265,000 Boston Scientific Corp., 2.85%, 5/15/20 750,000 Celgene Corp., 2.88%, 8/15/20 1,250,000 Imperial Tobacco Finance PLC 144A, 3.75%, 7/21/22 (a) 650,000 Mallinckrodt International Finance SA, 3.50%, 4/15/18 400,000 Mead Johnson Nutrition Co., 4.13%, 11/15/25 275,000 New York and Presbyterian Hospital, 4.02%, 8/01/45 590,000 North Shore Long Island Jewish Health Care Inc., 6.15%, 11/01/43 30 Payden Mutual Funds Value (000) Principal or Shares 945,000 700,000 $ Pfizer Inc., 7.20%, 3/15/39 St Jude Medical Inc., 2.00%, 9/15/18 619 498 596 713 423 Energy (4%) 602,587 600,000 750,000 308 306 663 717 4,843 296 423 251 240 705 964 762 693 265 756 1,267 633 405 258 702 250,000 350,000 Value (000) Security Description Alliance Pipeline LP/United States 144A, 7.00%, 12/31/19 (a) Canadian Natural Resources Ltd., 5.90%, 2/01/18 Hutchison Whampoa International 12 Ltd. 144A, 6.00%, 5/29/49 (a) Kinder Morgan Inc./DE 144A, 5.00%, 2/15/21 (a) Valero Energy Corp., 6.63%, 6/15/37 Financial (52%) 200,000 AerCap Ireland Capital Ltd. / AerCap Global Aviation Trust, 4.63%, 10/30/20 430,000 Air Lease Corp., 5.63%, 4/01/17 750,000 Ally Financial Inc., 3.25%, 2/13/18 550,000 American Campus Communities Operating Partnership LP, 3.35%, 10/01/20 500,000 Ares Capital Corp., 4.88%, 11/30/18 750,000 Australia & New Zealand Banking Group Ltd. 144A, 4.50%, 3/19/24 (a) 810,000 Banco de Costa Rica 144A, 5.25%, 8/12/18 (a) 500,000 Bank of America Corp., 4.00%, 1/22/25 250,000 Bank of America Corp., 6.10%, 12/29/49 105,000 Bank of America Corp., 6.88%, 4/25/18 330,000 Bank of America Corp., 7.63%, 6/01/19 700,000 Bank of Tokyo-Mitsubishi UFJ Ltd. 144A, 2.15%, 9/14/18 (a) 550,000 Banque Federative du Credit Mutuel SA 144A, 2.75%, 10/15/20 (a) 370,000 Barclays Bank PLC 144A, 6.05%, 12/04/17 (a) 600,000 Barclays PLC, 2.88%, 6/08/20 $ 1,306 703 10,629 654 643 786 253 388 2,724 208 451 755 555 520 755 825 494 253 117 389 701 550 399 602 .
Principal or Shares 252,000 600,000 500,000 250,000 500,000 200,000 500,000 625,000 500,000 750,000 290,000 1,000,000 500,000 205,000 350,000 600,000 460,000 350,000 315,000 500,000 600,000 300,000 700,000 750,000 450,000 440,000 250,000 300,000 510,000 550,000 505,000 50,000 400,000 250,000 300,000 600,000 640,000 500,000 450,000 340,000 1,000,000 325,000 200,000 400,000 Value (000) Security Description BBVA Banco Continental SA 144A, 2.25%, 7/29/16 (a) BPCE SA 144A, 4.50%, 3/15/25 (a) Citigroup Inc., 4.45%, 9/29/27 Citigroup Inc., 5.90%, 12/29/49 Compass Bank, 1.85%, 9/29/17 Corp. Financiera de Desarrollo SA 144A, 3.25%, 7/15/19 (a) Credit Suisse Group Funding Guernsey Ltd. 144A, 3.80%, 9/15/22 (a) Digital Delta Holdings LLC 144A, 3.40%, 10/01/20 (a) Discover Bank/Greenwood DE, 3.10%, 6/04/20 Fairfax U.S. Inc. 144A, 4.88%, 8/13/24 (a) FS Investment Corp., 4.25%, 1/15/20 General Electric Capital Corp., 6.38%, 11/15/67 General Motors Financial Co.
Inc., 3.20%, 7/13/20 General Motors Financial Co. Inc., 4.75%, 8/15/17 Goldman Sachs Group Inc., 4.25%, 10/21/25 Goldman Sachs Group Inc., 5.63%, 1/15/17 Goldman Sachs Group Inc., 7.50%, 2/15/19 Goodman Funding Ltd. 144A, 6.00%, 3/22/22 (a) HBOS PLC 144A, 6.75%, 5/21/18 (a) Hospitality Properties Trust, 4.50%, 3/15/25 International Lease Finance Corp., 2.29%, 6/15/16 Intesa Sanpaolo SPA 144A, 7.70%, 12/29/49 (a) Jackson National Life Global Funding 144A, 1.88%, 10/15/18 (a) JPMorgan Chase & Co., 2.55%, 10/29/20 KeyCorp, 2.90%, 9/15/20 Kimco Realty Corp., 3.40%, 11/01/22 Lloyds TSB Bank PLC 144A, 6.50%, 9/14/20 (a) Macquarie Bank Ltd.
144A, 4.88%, 6/10/25 (a) Macquarie Bank Ltd. 144A, 6.63%, 4/07/21 (a) Meiji Yasuda Life Insurance Co. 144A, 5.20%, 10/20/45 (a) MetLife Inc., 6.40%, 12/15/36 MetLife Inc., 10.75%, 8/01/39 Morgan Stanley, 4.35%, 9/08/26 Morgan Stanley, 5.55%, 12/29/49 Mubadala GE Capital Ltd.
144A, 3.00%, 11/10/19 (a) Nationwide Mutual Insurance Co. 144A, 9.38%, 8/15/39 (a) Navient Corp., 6.13%, 3/25/24 Nordea Bank AB 144A, 1.88%, 9/17/18 (a) Pacific Life Insurance Co. 144A, 9.25%, 6/15/39 (a) People’s United Bank, 4.00%, 7/15/24 Pershing Square Holdings Ltd.
144A, 5.50%, 7/15/22 (a) Prudential Financial Inc., 5.63%, 6/15/43 Prudential Financial Inc., 5.88%, 9/15/42 Prudential Financial Inc., 8.88%, 6/15/38 Principal or Shares 625,000 $ 254 592 501 249 498 250,000 650,000 430,000 201 700,000 505 629 506 742 293 1,071 497 213 351 629 536 390 348 487 600 304 701 748 454 441 289 299 577 569 555 79 407 250 470,000 365,000 270,000 780,000 250,000 250,000 550,000 670,000 250,000 1,000,000 600,000 Value (000) Security Description QBE Insurance Group Ltd. 144A, 2.40%, 5/01/18 (a) RBS Citizens Financial Group Inc. 144A, 4.15%, 9/28/22 (a) Royal Bank of Scotland Group PLC, 5.13%, 5/28/24 Santander Holdings USA Inc./PA, 2.65%, 4/17/20 Santander UK Group Holdings PLC 144A, 4.75%, 9/15/25 (a) Select Income REIT, 4.50%, 2/01/25 Senior Housing Properties Trust, 6.75%, 4/15/20 Sompo Japan Insurance Inc.
144A, 5.33%, 3/28/73 (a) Suncorp-Metway Ltd. 144A, 2.35%, 4/27/20 (a) Synchrony Financial, 2.70%, 2/03/20 Synchrony Financial, 3.75%, 8/15/21 Teachers Insurance & Annuity Association of America 144A, 4.90%, 9/15/44 (a) Transatlantic Holdings Inc., 8.00%, 11/30/39 Trinity Acquisition PLC, 6.13%, 8/15/43 UBS Group Funding Jersey Ltd. 144A, 4.13%, 9/24/25 (a) WEA Finance LLC / Westfield UK & Europe Finance PLC 144A, 3.25%, 10/05/20 (a) Healthcare (1%) 110,000 Dignity Health, 3.13%, 11/01/22 740,000 Dignity Health, 4.50%, 11/01/42 150,000 Kaiser Foundation Hospitals, 3.50%, 4/01/22 Industrial (4%) 440,000 Aviation Capital Group Corp.
144A, 4.63%, 1/31/18 (a) 400,000 FedEx Corp., 4.50%, 2/01/65 450,000 Keysight Technologies Inc. 144A, 3.30%, 10/30/19 (a) 350,000 Penske Truck Leasing Co. LP / PTL Finance Corp.
144A, 3.05%, 1/09/20 (a) 500,000 Pentair Finance SA, 2.90%, 9/15/18 825,000 Sydney Airport Finance Co. Pty Ltd. 144A, 3.38%, 4/30/25 (a) 300,000 Textron Inc., 5.60%, 12/01/17 300 913 580 501 666 338 945 341 213 457 Material (2%) 350,000 Anglo American Capital PLC 144A, 4.13%, 4/15/21 (a) 155,000 Dow Chemical Co., 9.40%, 5/15/39 445,000 Westvaco Corp., 7.95%, 2/15/31 $ 628 254 668 426 700 449 407 288 774 247 252 571 871 274 1,006 606 37,014 110 709 155 974 454 356 446 350 502 790 320 3,218 303 227 583 1,113 Technology (1%) 500,000 Dun & Bradstreet Corp., 4.00%, 6/15/20 500,000 Hewlett Packard Enterprise Co.
144A, 3.60%, 10/15/20 (a) 507 504 1,011 Telecommunication (7%) 175,000 21st Century Fox America Inc., 9.50%, 7/15/24 240 Annual Report 31 . Payden Corporate Bond Fund continued Principal or Shares 1,000,000 250,000 500,000 650,000 400,000 400,000 1,000,000 280,000 Utility (4%) 700,000 250,000 600,000 500,000 225,000 400,000 AT&T Inc., 4.50%, 5/15/35 AT&T Inc., 6.55%, 2/15/39 British Sky Broadcasting Group PLC 144A, 9.50%, 11/15/18 (a) Harris Corp., 2.70%, 4/27/20 Orange SA, 9.00%, 3/01/31 Time Warner Inc., 7.63%, 4/15/31 Verizon Communications Inc., 4.40%, 11/01/34 Verizon Communications Inc., 4.86%, 8/21/46 $ 938 290 602 639 583 512 943 269 5,016 AES Corp./VA, 3.32%, 6/01/19 Berkshire Hathaway Energy Co., 6.13%, 4/01/36 EDP Finance BV 144A, 6.00%, 2/02/18 (a) Entergy Louisiana LLC, 5.00%, 7/15/44 Sempra Energy, 9.80%, 2/15/19 Solar Star Funding LLC 144A, 3.95%, 6/30/35 (a) Total Corporate Bond (Cost - $68,679) Mortgage Backed (0%) 400,000 Fannie Mae Connecticut Avenue Securities, 5.89%, 4/25/28 (Cost - $400) U.S. Treasury (1%) 450,000 U.S. Treasury Note, 0.38%, 4/30/16 (b) (Cost - $450) Investment Company (1%) 1,012,944 Payden Cash Reserves Money Market Fund * (Cost - $1,013) Total (Cost - $70,542) (99%) Other Assets, net of Liabilities (1%) Net Assets (100%) Open Forward Currency Contracts to USD Value (000) Security Description Delivery Date Assets: 2/1/2016 Currency (000s) 301 639 485 276 12/15/2015 401 2,771 69,313 Credit Suisse First Boston International Royal Bank of Canada BNP PARIBAS $ (2) Canadian Dollar (Sell 917) Euro (Sell 326) 408 67 30 Contract Type U.S. Treasury 10 Year Note Future U.S.
Treasury 5 Year Note Future U.S. Treasury Ultra Bond Future (8) (1) $(11) Unrealized Appreciation (Depreciation) (000s) $ 33 Expiration Date Dec-15 Current Value (000) $(4,597) Jan-16 8,025 (2) Dec-15 4,793 (27) $ 4 $ 1,013 71,184 358 71,542 * Affiliated investment (a) Security offered only to qualified institutional investors, and thus is not registered for sale to the public under rule 144A of the Securities Act of 1933. It has been deemed liquid under guidelines approved by the Board. (b) All or a portion of the security is pledged to cover futures contract margin requirements. See notes to financial statements. 32 Payden Mutual Funds $ 25 Open Futures Contracts Number of Contracts 36 450 Credit Suisse First Boston International Australian Dollar (Buy 966) 1/15/2016 Counterparty Australian Dollar (Sell 1,967) Liabilities: 2/1/2016 669 Unrealized Appreciation (Depreciation) (000s) . Payden Strategic Income Fund The Fund seeks a high level of total return including income generation consistent with preservation of capital by investing in a wide variety of securities across many asset classes. $11,000 Portfolio Composition - percent of value $10,500 Corporate Mortgage Backed U.S. Treasury Bank Loans Asset Backed Other One Year 2.08% Fund $10,304 Since 5/8/14 2.04% Barclay's Aggregate Index $10,391 43% 19% 13% 7% 8% 10% $10,000 $9,500 5/8/2014 1/15 10/31/15 Past performance does not predict future returns. The graph does not reflect the impact of taxes or transaction costs a shareholder would pay. The Fund’s Adviser and SI Classes are expected to perform similarly to its Investor Class. This information is not part of the audited financial statements. Schedule of Investments - October 31, 2015 Principal or Shares Security Description Asset Backed (8%) 976,197 American Homes 4 Rent 2014-SFR1 144A, 1.25%, 6/17/31 (a) 1,250,000 Apidos CLO XIV 144A, 1.47%, 4/15/25 (a) 1,600,000 Babson CLO Ltd.
144A, 1.42%, 4/20/25 (a) 295,545 Colony American Homes 2014-2 144A, 1.15%, 7/17/31 (a) 999,523 Colony American Homes 2015-1 144A, 1.40%, 7/17/32 (a) 500,000 Eaton Vance Clo 2015-1 Ltd. 144A, 4.52%, 10/20/26 (a) 552,035 Invitation Homes 2013-SFR1 Trust 144A, 1.40%, 12/17/30 (a) 620,000 Invitation Homes 2014-SFR1 Trust 144A, 1.20%, 6/17/31 (a) 250,000 Invitation Homes 2014-SFR2 Trust 144A, 1.30%, 9/17/31 (a) 400,000 LCM XX LLC 144A, 4.07%, 10/20/27 (a) 1,000,000 Octagon Investment Partners XIX Ltd. 144A, 1.84%, 4/15/26 (a) 1,000,000 Symphony CLO XV Ltd.
144A, 1.77%, 10/17/26 (a) 1,000,000 Tyron Park CLO Ltd. 144A, 1.44%, 7/15/25 (a) 1,250,000 Venture XVII CLO Ltd. 144A, 1.80%, 7/15/26 (a) 588,757 VOLT XXV LLC 144A, 3.50%, 6/26/45 (a) 447,109 VOLT XXXV LLC 144A, 3.50%, 6/26/45 (a) 355,135 Wachovia Asset Securitization Issuance II LLC 2007-HE1 Trust 144A, 0.34%, 7/25/37 (a) Total Asset Backed (Cost - $12,964) Bank Loans(b) (8%) 495,000 Akorn Inc.
Term Loan 1L, 4.50%, 4/16/21 595,606 Albertsons/Safeway LLC Term Loan B4 1L, 5.50%, 8/25/21 750,000 Allison Transmission Inc. Term Loan B3 1L, 3.75%, 8/23/19 Value (000) Principal or Shares Value (000) Security Description 750,000 $ 957 1,226 1,573 289 978 485 545 607 245 385 992 990 985 1,238 584 448 316 12,843 492 596 752 ARAMARK Corp. Term Loan E 1L, 3.25%, 9/17/19 500,000 Berry Plastics Group Inc.
Term Loan E 1L, 3.75%, 1/16/21 750,000 BJ’s Wholesale Club Inc. Term Loan B 1L, 4.50%, 9/26/19 653,216 Burlington Coat Factory Warehouse Corp. Term Loan B3 1L, 4.25%, 8/13/21 493,751 Catalent Pharma Solutions Inc.
Term Loan B 1L, 4.50%, 5/20/21 496,184 CDW LLC/CDW Finance Corp. Term Loan B 1L, 3.50%, 4/29/20 750,000 ClubCorp Club Operations Inc., 4.25%, 7/24/20 493,750 Davita Healthcare Partners Inc. Term Loan B 1L, 3.50%, 6/24/21 591,000 HUB International Ltd.
Term Loan B 1L, 4.25%, 10/02/20 493,750 Libbey Glass Inc. Term Loan 1L, 3.75%, 4/09/21 493,750 Michaels Stores Inc. Term Loan 1L, 4.00%, 1/28/20 494,962 Neiman Marcus Group LLC Term Loan 1L, 4.25%, 10/15/20 493,755 Nortek Inc.
Term Loan B 1L, 3.75%, 10/30/20 493,750 Ortho-Clinical Diagnostics, Inc. Term Loan B 1L, 4.75%, 6/30/21 598,500 PetSmart Inc., 4.25%, 3/10/22 592,386 Sabre Global Inc. Term Loan B 1L, 4.25%, 2/19/19 422,321 Vantiv LLC Term Loan B 1L, 3.75%, 6/13/21 291,667 Visteon Corp.
Term Loan B IL, 3.50%, 4/08/21 Total Bank Loans (Cost - $11,656) Corporate Bond (47%) 300,000 AbbVie Inc., 2.50%, 5/14/20 300,000 AbbVie Inc., 3.20%, 11/06/22 605,000 Actavis Funding SCS, 2.45%, 6/15/19 $ 751 500 745 655 494 495 751 496 577 492 496 484 490 488 599 593 424 291 11,661 297 297 602 Annual Report 33 . Payden Strategic Income Fund continued Principal or Shares 260,000 300,000 230,000 620,000 400,000 200,000 8,700,000 261,964 300,000 450,000 305,000 300,000 300,000 350,000 800,000 500,000 300,000 325,000 210,000 475,000 450,000 275,000 350,000 350,000 650,000 585,000 250,000 870,000 700,000 500,000 190,000 300,000 80,000 300,000 540,000 300,000 400,000 210,000 300,000 300,000 200,000 700,000 Value (000) Security Description Actavis Funding SCS, 3.00%, 3/12/20 AerCap Aviation Solutions BV, 6.38%, 5/30/17 Air Canada 144A, 8.75%, 4/01/20 (a) Air Lease Corp., 5.63%, 4/01/17 Aircastle Ltd., 5.50%, 2/15/22 Alexandria Real Estate Equities Inc., 2.75%, 1/15/20 America Movil SAB de CV, 6.00%, 6/09/19 MXN (c) American Airlines 2013-2 Class B Pass Through Trust, 5.60%, 7/15/20 American Axle & Manufacturing Inc., 6.25%, 3/15/21 American Campus Communities Operating Partnership LP, 3.35%, 10/01/20 American Express Credit Corp., 1.55%, 9/22/17 Anglo American Capital PLC 144A, 4.13%, 4/15/21 (a) Ardagh Packaging Finance PLC 144A, 9.13%, 10/15/20 (a) Ardagh Packaging Finance PLC / Ardagh Holdings USA Inc. 144A, 3.34%, 12/15/19 (a) AT&T Inc., 3.40%, 5/15/25 Australia & New Zealand Banking Group Ltd. 144A, 4.50%, 3/19/24 (a) AutoZone Inc., 1.30%, 1/13/17 Bank of America Corp., 6.10%, 12/29/49 Bank of America Corp., 6.88%, 4/25/18 Bank of Tokyo-Mitsubishi UFJ Ltd. 144A, 2.70%, 9/09/18 (a) Banque Federative du Credit Mutuel SA 144A, 2.75%, 10/15/20 (a) Barclays Bank PLC 144A, 6.05%, 12/04/17 (a) Barclays PLC, 2.88%, 6/08/20 Baxalta Inc. 144A, 2.88%, 6/23/20 (a) BB&T Corp., 4.90%, 6/30/17 BBVA Banco Continental SA 144A, 3.25%, 4/08/18 (a) Bear Stearns Companies LLC, 5.55%, 1/22/17 Biogen Inc., 3.63%, 9/15/22 Block Financial LLC, 4.13%, 10/01/20 Blue Cross & Blue Shield of Minnesota 144A, 3.79%, 5/01/25 (a) Boston Scientific Corp., 2.85%, 5/15/20 Capital One Bank USA NA, 2.30%, 6/05/19 Capital One Financial Corp., 6.15%, 9/01/16 CCO Holdings LLC / CCO Holdings Capital Corp., 5.75%, 9/01/23 Celgene Corp., 2.88%, 8/15/20 CenturyLink Inc., 6.45%, 6/15/21 CF Industries Inc., 6.88%, 5/01/18 Chrysler Group LLC / CG Co.-Issuer Inc., 8.25%, 6/15/21 CHS/Community Health Systems Inc., 8.00%, 11/15/19 Citigroup Inc., 0.60%, 6/09/16 Citigroup Inc., 1.55%, 8/14/17 Citigroup Inc., 4.45%, 9/29/27 34 Payden Mutual Funds $ Principal or Shares 262 314 252 650 424 145,000 425,000 198 600,000 950,000 500,000 300,000 532 155,000 330,000 269 315 454 306 259 315 346 778 504 300 329 235 484 450 297 351 350 684 595 262 886 712 495 190 298 83 309 544 304 443 225 314 299 200 701 350,000 635,000 400,000 500,000 300,000 400,000 150,000 425,000 350,000 500,000 205,000 850,000 400,000 300,000 350,000 220,000 235,000 450,000 500,000 300,000 550,000 600,000 300,000 200,000 465,000 1,050,000 350,000 225,000 300,000 530,000 400,000 247,000 300,000 1,100,000 600,000 750,000 450,000 500,000 Value (000) Security Description CNH Industrial Capital LLC, 3.63%, 4/15/18 Continental Airlines 2012-3 Class C Pass Thru Certificates, 6.13%, 4/29/18 Continental Resources Inc./OK, 5.00%, 9/15/22 Corp.
Nacional del Cobre de Chile 144A, 3.88%, 11/03/21 (a) Credit Suisse/New York NY, 6.00%, 2/15/18 CVS Health Corp., 3.88%, 7/20/25 Dana Holding Corp., 5.38%, 9/15/21 DaVita HealthCare Partners Inc., 5.13%, 7/15/24 DCP Midstream LLC 144A, 9.75%, 3/15/19 (a) Deutsche Bank AG, 2.95%, 8/20/20 Discover Bank/Greenwood DE, 3.10%, 6/04/20 DISH DBS Corp., 5.88%, 11/15/24 Dole Food Co. Inc. 144A, 7.25%, 5/01/19 (a) E*TRADE Financial Corp., 5.38%, 11/15/22 Eastman Chemical Co., 2.40%, 6/01/17 Edison International, 3.75%, 9/15/17 EDP Finance BV 144A, 6.00%, 2/02/18 (a) Entergy Louisiana LLC, 5.00%, 7/15/44 EP Energy LLC / EP Energy Finance Inc., 9.38%, 5/01/20 Export-Import Bank of India, 3.88%, 10/02/19 Express Scripts Holding Co., 2.25%, 6/15/19 Fifth Third Bank/Cincinnati OH, 2.15%, 8/20/18 Ford Motor Credit Co.
LLC, 2.24%, 6/15/18 Ford Motor Credit Co. LLC, 6.63%, 8/15/17 FS Investment Corp., 4.25%, 1/15/20 GATX Corp., 2.50%, 3/15/19 General Electric Capital Corp., 6.38%, 11/15/67 Glencore Funding LLC 144A, 1.49%, 5/27/16 (a) Goldman Sachs Group Inc., 2.60%, 4/23/20 Goldman Sachs Group Inc., 7.50%, 2/15/19 Goodyear Tire & Rubber Co., 6.50%, 3/01/21 HBOS PLC 144A, 6.75%, 5/21/18 (a) Hertz Corp., 6.75%, 4/15/19 Hewlett Packard Enterprise Co. 144A, 3.60%, 10/15/20 (a) Hexion U.S.
Finance Corp., 6.63%, 4/15/20 Hospitality Properties Trust, 4.50%, 3/15/25 HPHT Finance 15 Ltd. 144A, 2.25%, 3/17/18 (a) HSBC USA Inc., 2.00%, 8/07/18 Hyundai Capital America 144A, 1.45%, 2/06/17 (a) Hyundai Capital America 144A, 1.88%, 8/09/16 (a) Icahn Enterprises LP / Icahn Enterprises Finance Corp., 3.50%, 3/15/17 Imperial Tobacco Finance PLC 144A, 2.95%, 7/21/20 (a) Industrial & Commercial Bank of China Ltd./New York, 2.35%, 11/13/17 Jackson National Life Global Funding 144A, 1.88%, 10/15/18 (a) John Deere Capital Corp., 2.30%, 9/16/19 Johnson Controls Inc., 1.40%, 11/02/17 $ 146 438 140 334 650 979 512 305 381 638 405 480 302 429 152 441 373 485 179 884 400 302 349 237 238 447 535 293 553 700 320 221 478 1,059 298 219 299 531 398 248 304 1,106 605 752 454 497 . Principal or Shares 525,000 360,000 500,000 435,000 300,000 750,000 300,000 450,000 400,000 470,000 350,000 150,000 392,000 450,000 165,000 500,000 650,000 100,000 500,000 200,000 250,000 300,000 400,000 350,000 250,000 600,000 420,000 400,000 400,000 280,000 300,000 300,000 250,000 300,000 250,000 600,000 500,000 475,000 475,000 300,000 200,000 600,000 500,000 200,000 Value (000) Security Description KazMunayGas National Co. JSC 144A, 6.38%, 4/09/21 (a) KeyCorp, 2.90%, 9/15/20 Keysight Technologies Inc. 144A, 3.30%, 10/30/19 (a) Kilroy Realty LP, 5.00%, 11/03/15 Kinder Morgan Inc./DE, 3.05%, 12/01/19 Kraft Heinz Foods Co. 144A, 3.50%, 7/15/22 (a) Laredo Petroleum Inc., 7.38%, 5/01/22 Latam Airlines 2015-1 Pass Through Trust A 144A, 4.20%, 11/15/27 (a) Levi Strauss & Co., 6.88%, 5/01/22 LifePoint Health Inc., 5.50%, 12/01/21 Lloyds Bank PLC, 2.00%, 8/17/18 Macquarie Group Ltd.
144A, 3.00%, 12/03/18 (a) Macquarie Group Ltd. 144A, 4.88%, 8/10/17 (a) Martin Marietta Materials Inc., 1.43%, 6/30/17 MeadWestvaco Corp., 7.38%, 9/01/19 Medtronic Inc., 3.15%, 3/15/22 Meiji Yasuda Life Insurance Co. 144A, 5.20%, 10/20/45 (a) MetLife Inc., 5.25%, 12/29/49 Microsoft Corp., 1.85%, 2/12/20 Mizuho Bank Ltd.
144A, 0.78%, 9/25/17 (a) Mizuho Bank Ltd. 144A, 1.55%, 10/17/17 (a) Mobile Mini Inc., 7.88%, 12/01/20 Morgan Stanley, 4.35%, 9/08/26 Morgan Stanley, 5.55%, 12/29/49 Morgan Stanley, 5.95%, 12/28/17 Mubadala GE Capital Ltd. 144A, 3.00%, 11/10/19 (a) MUFG Union Bank NA, 5.95%, 5/11/16 Nationwide Building Society 144A, 6.25%, 2/25/20 (a) NBTY Inc., 9.00%, 10/01/18 New Red Finance Inc 144A, 6.00%, 4/01/22 (a) New Red Finance Inc.
144A, 4.63%, 1/15/22 (a) NextEra Energy Capital Holdings Inc., 2.06%, 9/01/17 Novelis Inc./GA, 8.75%, 12/15/20 Numericable Group SA 144A, 6.00%, 5/15/22 (a) Orange SA, 9.00%, 3/01/31 Pacific LifeCorp 144A, 6.00%, 2/10/20 (a) Party City Holdings Inc. 144A, 6.13%, 8/15/23 (a) Penske Truck Leasing Co. LP / PTL Finance Corp.
144A, 3.38%, 2/01/22 (a) Pernod Ricard SA 144A, 4.25%, 7/15/22 (a) Perrigo Co. PLC, 2.30%, 11/08/18 Pertamina Persero PT 144A, 5.25%, 5/23/21 (a) Pfizer Inc., 6.20%, 3/15/19 PG&E Corp., 2.40%, 3/01/19 QBE Insurance Group Ltd. 144A, 2.40%, 5/01/18 (a) Principal or Shares 500,000 $ 532 363 495 435 291 765 298 429 440 478 352 152 409 447 190 512 672 101 502 199 249 314 407 350 272 600 431 464 410 294 305 302 252 302 364 678 518 464 493 296 206 683 503 201 300,000 300,000 253,000 230,000 400,000 600,000 750,000 168,000 350,000 450,000 250,000 250,000 845,000 400,000 400,000 500,000 490,000 300,000 600,000 550,000 300,000 150,000 150,000 320,000 300,000 450,000 500,000 400,000 500,000 300,000 114,000 500,000 350,000 400,000 700,000 700,000 455,000 165,000 500,000 Value (000) Security Description Reynolds Group Issuer Inc./Reynolds Group Issuer LLC, 7.13%, 4/15/19 Royal Bank of Scotland Group PLC, 1.88%, 3/31/17 Royal Bank of Scotland Group PLC, 5.13%, 5/28/24 Ryder System Inc., 2.50%, 3/01/17 Ryder System Inc., 2.50%, 5/11/20 Sabine Pass LNG LP, 7.50%, 11/30/16 Santander Holdings USA Inc./PA, 2.65%, 4/17/20 Santander UK Group Holdings PLC 144A, 4.75%, 9/15/25 (a) Scentre Group Trust 1 / Scentre Group Trust 2 144A, 2.38%, 11/05/19 (a) Select Income REIT, 4.50%, 2/01/25 Senior Housing Properties Trust, 4.75%, 5/01/24 Senior Housing Properties Trust, 6.75%, 4/15/20 Sinclair Television Group Inc.
144A, 6.38%, 11/01/21 (a) Sinopec Group Overseas Development 2012 Ltd. 144A, 3.90%, 5/17/22 (a) Softbank Corp. 144A, 4.50%, 4/15/20 (a) Sonic Automotive Inc., 5.00%, 5/15/23 Southwest Airlines Co., 2.75%, 11/06/19 Starz LLC / Starz Finance Corp., 5.00%, 9/15/19 Suburban Propane Partners LP/Suburban Energy Finance Corp., 5.50%, 6/01/24 Sumitomo Mitsui Banking Corp., 1.95%, 7/23/18 Suncorp-Metway Ltd. 144A, 2.35%, 4/27/20 (a) Synchrony Financial, 1.88%, 8/15/17 Synchrony Financial, 3.75%, 8/15/21 Talen Energy Supply LLC 144A, 4.63%, 7/15/19 (a) Tencent Holdings Ltd.
144A, 3.38%, 5/02/19 (a) Tenet Healthcare Corp., 8.13%, 4/01/22 Tesco PLC 144A, 5.50%, 11/15/17 (a) Thermo Fisher Scientific Inc., 3.30%, 2/15/22 TIAA Asset Management Finance Co. LLC 144A, 2.95%, 11/01/19 (a) Time Warner Cable Inc., 6.75%, 7/01/18 T-Mobile USA Inc., 6.25%, 4/01/21 TransAlta Corp., 1.90%, 6/03/17 TSMC Global Ltd. 144A, 1.63%, 4/03/18 (a) Tyson Foods Inc., 2.65%, 8/15/19 U.S.
Steel Corp., 6.88%, 4/01/21 UBS AG/Stamford CT, 5.75%, 4/25/18 UBS Group Funding Jersey Ltd. 144A, 2.95%, 9/24/20 (a) Vereit Operating Partnership LP, 3.00%, 2/06/19 Vornado Realty LP, 2.50%, 6/30/19 WEA Finance LLC / Westfield UK & Europe Finance PLC 144A, 2.70%, 9/17/19 (a) $ 510 299 308 256 227 415 594 750 166 335 446 279 259 871 397 391 507 502 293 601 546 300 151 138 327 319 476 501 405 555 310 113 492 353 292 764 701 442 164 499 Annual Report 35 . Payden Strategic Income Fund continued Principal or Shares Value (000) Security Description 250,000 Williams Companies Inc., 8.75%, 3/15/32 300,000 Windstream Corp., 7.50%, 6/01/22 Total Corporate Bond (Cost - $72,994) Foreign Government (5%) 755,000 Croatia Government International Bond 144A, 6.38%, 3/24/21 (a) 710,000 Dominican Republic International Bond 144A, 7.50%, 5/06/21 (a) 566,000 Hungary Government International Bond, 4.13%, 2/19/18 460,000 Indonesia Government International Bond 144A, 5.88%, 3/13/20 (a) 355,000 Indonesia Government International Bond, 5.88%, 3/13/20 (d) 1,160,000 Mexico Government International Bond, 3.63%, 3/15/22 525,000 Panama Government International Bond, 5.20%, 1/30/20 545,000 Philippine Government International Bond, 4.00%, 1/15/21 520,000 Poland Government International Bond, 5.13%, 4/21/21 430,000 Republic of Georgia 144A, 6.88%, 4/12/21 (a) 642,000 Romanian Government International Bond 144A, 6.75%, 2/07/22 (a) 575,000 United Republic of Tanzania, 6.54%, 3/09/20 (d) Total Foreign Government (Cost - $7,858) Mortgage Backed (20%) 277,676 Alternative Loan Trust 2005-47CB, 5.50%, 10/25/35 319,985 Alternative Loan Trust 2005-54CB, 5.13%, 11/25/35 407,608 Alternative Loan Trust 2007-9T1, 6.00%, 5/25/37 632,251 American Home Mortgage Investment Trust 2006-3, 2.28%, 12/25/36 493,205 Banc of America Funding 2005-H Trust, 2.87%, 11/20/35 736,473 BCAP LLC Trust 2007-AA2, 6.00%, 4/25/37 327,564 CHL Mortgage Pass-Through Trust 2004-29, 2.24%, 2/25/35 399,572 Credit Suisse Mortgage Capital Certificates 144A, 1.55%, 5/25/43 (a) 262,733 CSMC Mortgage-Backed Trust 2006-7, 6.00%, 8/25/36 999,706 Fannie Mae Connecticut Avenue Securities, 1.15%, 5/25/24 1,000,000 Fannie Mae Connecticut Avenue Securities, 2.80%, 5/25/24 500,000 Fannie Mae Connecticut Avenue Securities, 3.09%, 7/25/24 500,000 Fannie Mae Connecticut Avenue Securities, 3.19%, 7/25/24 1,000,000 Fannie Mae Connecticut Avenue Securities, 5.20%, 7/25/25 400,000 Fannie Mae Connecticut Avenue Securities, 5.89%, 4/25/28 36 Payden Mutual Funds $ Principal or Shares 246 250 72,380 814 774 593 511 395 1,191 576 596 590 461 767 563 7,831 255 297 333 444 413 624 262 382 228 990 873 451 451 1,000 408 1,750,000 54,938 Value (000) Security Description FHLB, 5.50%, 7/15/36 FHLMC Multifamily Structured Pass Through Certificates, 0.54%, 4/25/19 2,700,000 FN, 3.00%, 15YR TBA (e) 3,800,000 FN, 3.50%, 15YR TBA (e) 2,900,000 FN, 4.50%, 30YR TBA (e) 824,621 Freddie Mac Structured Agency Credit Risk Debt Notes, 1.20%, 2/25/24 775,177 Freddie Mac Structured Agency Credit Risk Debt Notes, 1.30%, 5/25/25 1,000,000 Freddie Mac Structured Agency Credit Risk Debt Notes, 1.85%, 4/25/24 195,000 Freddie Mac Structured Agency Credit Risk Debt Notes, 2.40%, 2/25/24 1,000,000 Freddie Mac Structured Agency Credit Risk Debt Notes, 3.80%, 4/25/24 500,000 Freddie Mac Structured Agency Credit Risk Debt Notes, 7.75%, 12/25/27 249,972 Freddie Mac Structured Agency Credit Risk Debt Notes, 8.15%, 5/25/25 500,000 Freddie Mac Structured Agency Credit Risk Debt Notes, 8.99%, 3/25/28 250,000 Freddie Mac Structured Agency Credit Risk Debt Notes, 9.40%, 10/25/27 249,885 Freddie Mac Structured Agency Credit Risk Debt Notes, 10.95%, 3/25/25 561,057 GSMPS Mortgage Loan Trust 2005-RP2 144A, 0.55%, 3/25/35 (a) 1,034,738 Hilton USA Trust 2013-HLF 144A, 1.19%, 11/05/30 (a) 450,000 JP Morgan Chase Commercial Mortgage Securities Trust 2015-COSMO 144A, 1.45%, 1/15/32 (a) 106,730 JP Morgan Mortgage Trust 2006-A4, 2.69%, 6/25/36 687,805 JP Morgan Mortgage Trust 2013-1 144A, 2.50%, 3/25/43 (a) 471,391 JP Morgan Mortgage Trust 2014-2 144A, 3.00%, 6/25/29 (a) 1,187,254 JP Morgan Seasoned Mortgage Trust 2014-1 144A, 0.70%, 5/25/33 (a) 275,541 Nationstar Mortgage Loan Trust 2013-A 144A, 3.75%, 12/25/52 (a) 267,044 New Residential Mortgage Loan Trust 2015-1 144A, 3.75%, 5/28/52 (a) 260,219 PHH Alternative Mortgage Trust Series 2007-1, 6.00%, 2/25/37 388,849 RFMSI Series 2006-SA2 Trust, 3.61%, 8/25/36 464,832 WaMu Mortgage Pass Through Certificates, 2.40%, 9/25/36 Total Mortgage Backed (Cost - $31,477) Municipal (0%) 250,000 District of Columbia Water & Sewer Authority, 4.81%, 10/01/14 (Cost - $250) U.S. Treasury (15%) 440,000 U.S. Treasury Note, 0.19%, 1/31/17 $ 2,329 55 2,809 4,012 3,143 824 773 988 196 935 501 252 495 285 294 485 1,027 449 93 689 483 1,147 282 275 227 338 422 31,219 250 440 . Principal or Shares Value (000) Security Description 340,000 U.S. Treasury Note, 0.88%, 4/30/17 4,500,000 U.S. Treasury Note, 0.88%, 7/15/18 3,050,000 U.S. Treasury Note, 1.38%, 10/31/20 8,345,000 U.S.
Treasury Note, 1.50%, 5/31/20 (f) 2,855,000 U.S. Treasury Note, 2.00%, 8/15/25 2,250,000 U.S. Treasury Note, 2.13%, 5/15/25 779,000 U.S.
Treasury Note, 3.00%, 5/15/45 Total U.S. Treasury (Cost - $22,448) $ Delivery Date Assets: 2/1/2016 96 197 111 108 107 123 103 113 202 1,160 Real Estate Investment Trust (1%) 6,280 BioMed Realty Trust Inc. 2,980 Digital Realty Trust Inc. 4,200 Equity Residential 1,600 Public Storage 1,250 Simon Property Group Inc. 147 220 325 367 252 1,311 2,471 Unrealized Appreciation (Depreciation) (000s) Currency (000s) 12/15/2015 Counterparty Australian Dollar (Sell 6,356) Credit Suisse First Boston International Citibank, N.A. $ 82 BNP PARIBAS Credit Suisse First Boston International 45 1 British Pound (Buy 1,488) Euro (Sell 3,027) Mexican Peso (Sell 8,830) 12/15/2015 11/19/2015 Stocks (2%) Preferred Stock (1%) 3,750 Alexandria Real Estate Equities Inc., 6.45% 7,500 Bank of America Corp., 6.50% 4,250 DDR Corp., 6.50% 4,050 Discover Financial Services, 6.50% 4,050 First Republic Bank, 6.70% 4,800 Goldman Sachs Group Inc., 5.50% 3,550 US Bancorp, 6.50% 4,700 Vornado Realty Trust, 5.40% 7,800 Wells Fargo & Co., 6.00% Total Stocks (Cost - $2,247) Investment Company (4%) 5,912,079 Payden Cash Reserves Money Market Fund * (Cost - $5,912) Total (Cost - $167,806) (109%) Liabilities in excess of Other Assets (-9%) Net Assets (100%) 341 4,487 3,028 8,361 2,818 2,246 788 22,509 Open Forward Currency Contracts to USD 8 $ 136 Liabilities: 2/1/2016 Australian Dollar (Buy 3,125) 2/24/2016 Chinese Yuan (Sell 12,034) Euro (Sell 1,177) New Taiwan Dollar (Sell 21,760) South Korean Won (Buy 1,189,000) South Korean Won (Sell 1,189,000) Thailand Baht (Sell 68,420) 12/15/2015 11/24/2015 11/24/2015 11/24/2015 1/27/2016 Credit Suisse First Boston International Barclays Bank PLC BNP PARIBAS HSBC Bank USA, N.A. BNP PARIBAS BNP PARIBAS $ (5) (49) (6) (4) (7) (43) Barclays Bank PLC (7) $(121) Open Futures Contracts $ 5,912 167,076 (13,724) 153,352 * Affiliated investment (a) Security offered only to qualified institutional investors, and thus is not registered for sale to the public under rule 144A of the Securities Act of 1933. It has been deemed liquid under guidelines approved by the Board. (b) Variable rate security. The rate shown reflects the rate in effect at October 31, 2015.
The stated maturity is subject to prepayments. See Note 2 in the Notes to Financial Statements. (c) Principal in foreign currency. (d) Security offered and sold outside the United States, and thus is exempt from registration under Regulation S of the Securities Act of 1933. It has been deemed liquid under guidelines approved by the Board. (e) Security was purchased on a delayed delivery basis. (f) All or a portion of the security is pledged to cover futures contract margin requirements. Number of Contracts 20 30 6 Contract Type U.S.
Long Bond Future U.S. Treasury 5 Year Note Future U.S. Treasury Ultra Bond Future Expiration Date Dec-15 Jan-16 Dec-15 Current Value (000) $(3,129) (3,593) 959 Unrealized Appreciation Depreciation (000s) $ 49 23 (10) $ 62 See notes to financial statements. Annual Report 37 .
Payden Absolute Return Bond Fund $11,000 The Fund seeks a high level of total return by generally investing in below investment grade debt instruments and income producing securities of emerging market countries denominated in U.S. and foreign currencies with no limit on the average portfolio maturity. One Year N/A ML Libor 1-Month Constant Maturity $10,018 $10,500 Portfolio Composition - percent of value Corporate Mortgage Backed U.S. Treasury Asset Backed Bank Loans Other Fund $10,097 Since 11/6/14 0.97% $10,000 35% 31% 11% 11% 7% 5% $9,500 11/6/2014 4/15 10/31/15 Past performance does not predict future returns. The graph does not reflect the impact of taxes or transaction costs a shareholder would pay.
The Fund’s Adviser and SI Classes are expected to perform similarly to its Investor Class. This information is not part of the audited financial statements. Schedule of Investments - October 31, 2015 Principal or Shares Security Description Asset Backed (11%) 300,000 Ally Master Owner Trust, 0.65%, 4/15/18 205,001 American Homes 4 Rent 2014-SFR1 144A, 1.25%, 6/17/31 (a) 159,891 American Residential Properties 2014-SFR1 Trust 144A, 1.30%, 9/17/31 (a) 300,000 Apidos CLO XXII 144A, 4.14%, 10/20/27 (a) 193,290 Colony American Homes 2014-1 144A, 1.40%, 5/17/31 (a) 128,070 Colony American Homes 2014-2 144A, 1.15%, 7/17/31 (a) 169,919 Colony American Homes 2015-1 144A, 1.40%, 7/17/32 (a) 450,000 Dryden XXXI Senior Loan Fund 144A, 3.82%, 4/18/26 (a) 450,000 Eaton Vance Clo 2015-1 Ltd. 144A, 4.52%, 10/20/26 (a) 261,490 Invitation Homes 2013-SFR1 Trust 144A, 1.40%, 12/17/30 (a) 330,000 Invitation Homes 2014-SFR1 Trust 144A, 1.20%, 6/17/31 (a) 260,000 Invitation Homes 2014-SFR2 Trust 144A, 1.30%, 9/17/31 (a) 450,000 LCM XX LLC 144A, 4.07%, 10/20/27 (a) 300,000 North End CLO Ltd. 2013-1 144A, 3.82%, 7/17/25 (a) 450,000 OHA Credit Partners XI Ltd.
144A, 4.62%, 10/20/28 (a) 180,000 Progress Residential 2015-SFR1 Trust 144A, 1.60%, 2/17/32 (a) 250,000 Santander Drive Auto Receivables Trust 2015-3, 3.49%, 5/17/21 300,000 Symphony CLO XII Ltd. 144A, 3.82%, 10/15/25 (a) 300,000 Trade MAPS 1 Ltd. 144A, 0.90%, 12/10/18 (a) 192,651 VOLT XXII LLC 144A, 3.50%, 2/25/55 (a) 135,867 VOLT XXV LLC 144A, 3.50%, 6/26/45 (a) 38 Payden Mutual Funds Value (000) $ Principal or Shares 300 201 157 282 190 125 166 419 437 258 323 255 433 283 439 178 253 289 299 191 135 Value (000) Security Description 391,433 VOLT XXXIII LLC 144A, 3.50%, 3/25/55 (a) 426,301 VOLT XXXIV LLC 144A, 3.25%, 2/25/55 (a) 98,364 VOLT XXXV LLC 144A, 3.50%, 6/26/45 (a) Total Asset Backed (Cost - $6,580) Bank Loans(b) (7%) 350,000 Berry Plastics Group Inc.
Term Loan E 1L, 3.75%, 12/18/20 401,261 Burlington Coat Factory Warehouse Corp. Term Loan B3 1L, 4.25%, 8/13/21 430,000 Charter Communications Operating LLC Term Loan H, 3.25%, 8/24/21 347,362 Davita Healthcare Partners Inc. Term Loan B 1L, 3.50%, 6/19/21 283,575 Dell Inc.
Term Loan B IL, 4.00%, 4/29/20 273,113 Dollar Tree Inc. Term Loan B 1L, 3.50%, 7/06/22 347,321 MGM Resorts International Term Loan B 1L, 3.50%, 12/20/19 283,564 Michaels Stores Inc. Term Loan B2 1L, 4.00%, 1/28/20 426,647 Neiman Marcus Group LLC Term Loan 1L, 4.25%, 10/25/20 227,694 Ortho-Clinical Diagnostics, Inc.
Term Loan B 1L, 4.75%, 6/30/21 199,500 PetSmart Inc., 4.25%, 3/10/22 213,322 PharMEDium Healthcare Corp. Term Loan 1L, 4.25%, 1/23/21 225,000 Rite Aid Corp., 4.88%, 6/21/21 296,947 Sabre Global Inc. Term Loan B 1L, 4.25%, 2/19/19 205,193 Visteon Corp.
Term Loan B IL, 3.50%, 4/08/21 Total Bank Loans (Cost - $4,495) Corporate Bond (36%) 90,000 AbbVie Inc., 2.50%, 5/14/20 105,000 Actavis Funding SCS, 1.42%, 3/12/18 85,000 Actavis Funding SCS, 3.00%, 3/12/20 $ 389 424 98 6,524 350 402 430 349 284 274 347 285 418 225 200 213 226 297 205 4,505 89 104 85 . Principal or Shares 285,000 180,000 270,000 110,000 150,000 200,000 100,000 210,000 110,000 150,000 205,000 145,000 100,000 210,000 110,000 210,000 60,000 150,000 360,000 150,000 200,000 150,000 70,000 150,000 150,000 130,000 150,000 150,000 290,000 330,000 310,000 110,000 100,000 150,000 130,000 160,000 250,000 350,000 250,000 420,000 100,000 200,000 150,000 140,000 150,000 300,000 Value (000) Security Description AES Corp./VA, 3.32%, 6/01/19 Air Canada 144A, 8.75%, 4/01/20 (a) Air Lease Corp., 2.13%, 1/15/18 Allstate Corp., 5.75%, 8/15/53 Ally Financial Inc., 3.00%, 7/18/16 American Airlines 2015-2 Class B Pass Through Trust, 4.40%, 9/22/23 American Axle & Manufacturing Inc., 6.25%, 3/15/21 Amgen Inc., 2.13%, 5/01/20 Amgen Inc., 3.88%, 11/15/21 Anthem Inc., 2.30%, 7/15/18 Ardagh Packaging Finance PLC / Ardagh Holdings USA Inc. 144A, 3.34%, 12/15/19 (a) Argos Merger Sub Inc. 144A, 7.13%, 3/15/23 (a) Arizona Public Service Co., 2.20%, 1/15/20 AT&T Inc., 2.45%, 6/30/20 AT&T Inc., 3.40%, 5/15/25 AT&T Inc., 4.50%, 5/15/35 AT&T Inc., 4.75%, 5/15/46 AutoZone Inc., 2.50%, 4/15/21 Aviation Capital Group Corp. 144A, 2.88%, 9/17/18 (a) Bank of Montreal, 1.45%, 4/09/18 Barclays PLC, 2.88%, 6/08/20 Barrick North America Finance LLC, 4.40%, 5/30/21 BAT International Finance PLC 144A, 1.85%, 6/15/18 (a) Baxalta Inc.
144A, 2.88%, 6/23/20 (a) Baxalta Inc. 144A, 5.25%, 6/23/45 (a) Baylor Scott & White Holdings, 2.12%, 11/15/20 BBVA Banco Continental SA 144A, 2.25%, 7/29/16 (a) Biogen Inc., 2.90%, 9/15/20 Block Financial LLC, 4.13%, 10/01/20 BNZ International Funding Ltd./London 144A, 1.90%, 2/26/18 (a) Boston Scientific Corp., 3.85%, 5/15/25 CNH Industrial Capital LLC, 3.25%, 2/01/17 CommScope Inc. 144A, 4.38%, 6/15/20 (a) ConAgra Foods Inc., 0.69%, 7/21/16 Continental Airlines 2012-3 Class C Pass Thru Certificates, 6.13%, 4/29/18 Cooperatieve Centrale Raiffeisen-Boerenleenbank BA/Netherlands, 3.88%, 2/08/22 Credit Suisse/New York NY, 1.70%, 4/27/18 CSX Corp., 7.38%, 2/01/19 CVS Health Corp., 2.80%, 7/20/20 Dominion Resources Inc./VA, 2.50%, 12/01/19 Dun & Bradstreet Corp., 4.00%, 6/15/20 E*TRADE Financial Corp., 5.38%, 11/15/22 ERAC USA Finance LLC 144A, 2.80%, 11/01/18 (a) Exelon Generation Co.
LLC, 2.95%, 1/15/20 Express Scripts Holding Co., 1.25%, 6/02/17 Fifth Third Bank/Cincinnati OH, 2.38%, 4/25/19 $ Principal or Shares 272 197 267 115 150 200,000 150,000 215,000 200 310,000 100,000 150,000 180,000 120,000 105 208 116 151 202 153 100 208 107 197 55 148 360 149 201 149 70 150 153 150,000 90,000 240,000 240,000 160,000 70,000 180,000 200,000 170,000 150,000 150,000 129 110,000 120,000 150,000 180,000 190,000 151 151 295 140,000 125,000 100,000 331 309 111 102 150 250,000 134 170 249 406 255 421 101 214 153 141 149 302 180,000 230,000 160,000 420,000 200,000 150,000 450,000 320,000 100,000 190,000 240,000 330,000 40,000 200,000 Value (000) Security Description Ford Motor Credit Co. LLC, 2.60%, 11/04/19 Ford Motor Credit Co. LLC, 3.98%, 6/15/16 Frontier Communications Corp., 6.25%, 9/15/21 General Motors Financial Co.
Inc., 3.15%, 1/15/20 Gilead Sciences Inc., 2.55%, 9/01/20 Glencore Funding LLC 144A, 1.49%, 5/27/16 (a) Goldman Sachs Group Inc., 2.55%, 10/23/19 Goodyear Tire & Rubber Co., 7.00%, 5/15/22 Harley-Davidson Financial Services Inc. 144A, 2.15%, 2/26/20 (a) HealthSouth Corp., 5.75%, 11/01/24 Hewlett Packard Enterprise Co. 144A, 2.45%, 10/05/17 (a) Hewlett Packard Enterprise Co.
144A, 2.85%, 10/05/18 (a) HSBC USA Inc., 1.70%, 3/05/18 Hyundai Capital America 144A, 2.00%, 3/19/18 (a) Hyundai Capital America 144A, 2.40%, 10/30/18 (a) Imperial Tobacco Finance PLC 144A, 2.05%, 7/20/18 (a) JPMorgan Chase & Co., 2.25%, 1/23/20 KeyCorp, 2.30%, 12/13/18 Keysight Technologies Inc. 144A, 3.30%, 10/30/19 (a) Kinder Morgan Inc./DE, 3.05%, 12/01/19 Kraft Heinz Foods Co. 144A, 2.80%, 7/02/20 (a) Kroger Co., 6.15%, 1/15/20 Landry’s Inc.
144A, 9.38%, 5/01/20 (a) Latam Airlines 2015-1 Pass Through Trust A 144A, 4.20%, 11/15/27 (a) Level 3 Financing Inc., 6.13%, 1/15/21 Macquarie Group Ltd. 144A, 6.00%, 1/14/20 (a) Majapahit Holding BV 144A, 8.00%, 8/07/19 (a) Manufacturers & Traders Trust Co., 2.10%, 2/06/20 McGraw Hill Financial Inc. 144A, 3.30%, 8/14/20 (a) Medtronic Inc., 2.50%, 3/15/20 Metropolitan Life Global Funding I 144A, 2.30%, 4/10/19 (a) Microsoft Corp., 2.38%, 2/12/22 Mitsubishi UFJ Trust & Banking Corp.
144A, 1.60%, 10/16/17 (a) Mondelez International Inc., 2.25%, 2/01/19 Morgan Stanley, 2.80%, 6/16/20 National Australia Bank Ltd. 144A, 2.40%, 12/09/19 (a) Navient Corp., 6.00%, 1/25/17 New Red Finance Inc. 144A, 6.00%, 4/01/22 (a) New York Life Global Funding 144A, 2.10%, 1/02/19 (a) Oracle Corp., 2.38%, 1/15/19 Peabody Energy Corp., 6.25%, 11/15/21 Perrigo Co.
PLC, 2.30%, 11/08/18 $ 198 152 193 150 313 98 151 196 119 90 241 241 160 70 180 200 169 151 149 107 121 172 194 181 148 139 113 247 183 234 162 419 199 151 454 322 103 199 242 337 6 197 Annual Report 39 . Payden Absolute Return Bond Fund continued Principal or Shares Value (000) Security Description 250,000 100,000 130,000 75,000 300,000 300,000 140,000 255,000 275,000 300,000 150,000 150,000 200,000 PNC Bank NA, 1.80%, 11/05/18 Prudential Financial Inc., 5.38%, 5/15/45 QUALCOMM Inc., 2.25%, 5/20/20 Reynolds American Inc., 3.25%, 6/12/20 Roche Holdings Inc. 144A, 2.25%, 9/30/19 (a) Southern Co., 2.75%, 6/15/20 Southern Power Co., 1.50%, 6/01/18 Sprint Communications Inc., 8.38%, 8/15/17 Starz LLC / Starz Finance Corp., 5.00%, 9/15/19 Thermo Fisher Scientific Inc., 2.40%, 2/01/19 Time Warner Inc., 2.10%, 6/01/19 Toyota Motor Credit Corp., 2.13%, 7/18/19 UBS Group Funding Jersey Ltd. 144A, 2.95%, 9/24/20 (a) 180,000 United Rentals North America Inc., 7.63%, 4/15/22 170,000 United Technologies Corp., 6.13%, 2/01/19 210,000 UnitedHealth Group Inc., 2.70%, 7/15/20 150,000 Ventas Realty LP / Ventas Capital Corp., 2.70%, 4/01/20 80,000 Ventas Realty LP / Ventas Capital Corp., 4.00%, 4/30/19 200,000 Vodafone Group PLC, 2.50%, 9/26/22 320,000 Walgreens Boots Alliance Inc., 2.70%, 11/18/19 250,000 Wells Fargo & Co., 2.15%, 1/15/19 150,000 Westpac Banking Corp., 1.06%, 7/30/18 420,000 William Wrigley Jr Co. 144A, 2.90%, 10/21/19 (a) 200,000 ZF North America Capital Inc.
144A, 4.00%, 4/29/20 (a) 60,000 Zimmer Holdings Inc., 1.45%, 4/01/17 40,000 Zimmer Holdings Inc., 2.00%, 4/01/18 Total Corporate Bond (Cost - $21,920) Foreign Government (0%) 200,000 Kenya Government International Bond 144A, 5.88%, 6/24/19 (a) (Cost - $202) Mortgage Backed (31%) 686,726 Alternative Loan Trust 2005-56, 0.93%, 11/25/35 306,008 Alternative Loan Trust 2006-45T1, 6.00%, 2/25/37 389,845 Alternative Loan Trust 2006-HY11, 0.32%, 6/25/36 304,417 American Home Mortgage Investment Trust 2006-3, 2.28%, 12/25/36 312,695 Banc of America Funding 2005-H Trust, 2.87%, 11/20/35 167,098 Bear Stearns ALT-A Trust 2006-6, 2.76%, 11/25/36 272,664 Bear Stearns ARM Trust 2007-3, 2.78%, 5/25/47 314,462 CHL Mortgage Pass-Through Trust 2004-29, 2.24%, 2/25/35 282,856 CHL Mortgage Pass-Through Trust 2006-HYB1, 2.45%, 3/20/36 643,413 Connecticut Avenue Securities, 1.15%, 5/25/24 285,630 Connecticut Avenue Securities, 1.15%, 5/25/24 40 Payden Mutual Funds $ Principal or Shares 250 101 129 77 304 299 138 261 282 302 150 151 200 196 192 215 149 84 188 322 253 150 159,669 421,630 259,722 659,278 397,055 198,769 593,486 397,049 216,112 1,081,212 126,935 309,413 400,000 250,000 430 150,000 203 60 40 21,862 450,000 264,780 238,687 288,617 195 264,137 250,000 585 273,521 250 300,000 342 1,350,000 214 249,712 262 470,079 128 355,381 245 191,178 252 258 640 283 Value (000) Security Description Connecticut Avenue Securities, 1.39%, 7/25/24 Connecticut Avenue Securities, 2.29%, 11/25/24 Credit Suisse Mortgage Capital Certificates 144A, 1.55%, 5/25/43 (a) Deutsche Alt-B Securities Mortgage Loan Trust Series 2006-AB1, 5.60%, 2/25/36 Deutsche Alt-B Securities Mortgage Loan Trust Series 2006-AB4, 6.00%, 10/25/36 Deutsche Alt-B Securities Mortgage Loan Trust Series 2006-AB4, 6.00%, 10/25/36 Fannie Mae Connecticut Avenue Securities, 1.35%, 5/25/25 Fannie Mae Connecticut Avenue Securities, 1.39%, 7/25/24 Fannie Mae Connecticut Avenue Securities, 1.69%, 2/25/25 Fannie Mae Connecticut Avenue Securities, 1.70%, 7/25/25 Fannie Mae Connecticut Avenue Securities, 2.14%, 11/25/24 Fannie Mae Connecticut Avenue Securities, 2.20%, 10/25/23 Fannie Mae Connecticut Avenue Securities, 4.20%, 5/25/25 Fannie Mae Connecticut Avenue Securities, 5.20%, 7/25/25 Fannie Mae Connecticut Avenue Securities, 5.20%, 7/25/25 Fannie Mae Connecticut Avenue Securities, 5.89%, 4/25/28 First Horizon Alternative Mortgage Securities Trust 2006-FA2, 6.00%, 5/25/36 Freddie Mac Structured Agency Credit Risk Debt Notes, 1.10%, 10/25/27 Freddie Mac Structured Agency Credit Risk Debt Notes, 1.20%, 2/25/24 Freddie Mac Structured Agency Credit Risk Debt Notes, 1.25%, 3/25/25 Freddie Mac Structured Agency Credit Risk Debt Notes, 1.44%, 3/25/28 Freddie Mac Structured Agency Credit Risk Debt Notes, 1.85%, 8/25/24 Freddie Mac Structured Agency Credit Risk Debt Notes, 4.35%, 1/25/25 Freddie Mac Structured Agency Credit Risk Debt Notes, 4.89%, 3/25/28 Freddie Mac Structured Agency Credit Risk Debt Notes, 11.70%, 1/25/25 GreenPoint MTA Trust 2005-AR1, 0.64%, 6/25/45 GSMPS Mortgage Loan Trust 2005-RP3 144A, 0.55%, 9/25/35 (a) HomeBanc Mortgage Trust 2004-1, 1.06%, 8/25/29 $ 159 424 248 571 332 166 592 396 217 1,081 128 312 381 249 150 459 223 238 289 264 250 275 298 1,342 292 417 305 181 . Principal or Shares Value (000) Security Description JP Morgan Chase Commercial Mortgage Securities Trust 2015-COSMO 144A, 1.45%, 1/15/32 (a) 325,772 JP Morgan Mortgage Trust 2006-A3, 2.84%, 5/25/36 356,273 JP Morgan Mortgage Trust 2014-IVR3 144A, 3.00%, 9/25/44 (a) 362,566 Merrill Lynch Mortgage Backed Securities Trust Series 2007-2, 2.73%, 8/25/36 186,923 New Residential Mortgage Loan Trust 2014-3 144A, 5.67%, 11/25/54 (a) 133,522 New Residential Mortgage Loan Trust 2015-1 144A, 3.75%, 5/28/52 (a) 144,477 Provident Funding Mortgage Loan Trust 2005-2, 2.55%, 10/25/35 400,902 RALI Series 2005-QS14 Trust, 6.00%, 9/25/35 114,448 Sequoia Mortgage Trust, 0.99%, 10/20/27 252,358 Sequoia Mortgage Trust 2007-1, 2.51%, 2/20/47 270,255 Springleaf Mortgage Loan Trust 2013-1 144A, 1.27%, 6/25/58 (a) 498,999 Structured Asset Mortgage Investments II Trust 2006-AR7, 0.41%, 8/25/36 136,715 WaMu Mortgage Pass Through Certificates, 2.40%, 9/25/36 453,596 WaMu Mortgage Pass-Through Certificates, 0.48%, 11/25/45 103,494 WaMu Mortgage Pass-Through Certificates, 0.49%, 10/25/45 186,464 WaMu Mortgage Pass-Through Certificates, 0.49%, 12/25/45 510,700 WaMu Mortgage Pass-Through Certificates, 0.81%, 8/25/45 137,035 WaMu Mortgage Pass-Through Certificates, 2.09%, 6/25/37 429,493 WaMu Mortgage Pass-Through Certificates, 2.38%, 7/25/37 295,312 WaMu Mortgage Pass-Through Certificates, 2.41%, 8/25/46 66,152 Wells Fargo Mortgage Backed Securities Trust, 2.70%, 6/25/35 Total Mortgage Backed (Cost - $18,713) U.S. Treasury (11%) 5,500,000 U.S. Treasury Bill, 0.00%, 4/21/16 (c) 1,400,000 U.S. Treasury Bill, 0.06%, 12/17/15 (c) Total U.S.
Treasury (Cost - $6,896) Purchased Put Options (0%) 203 iShares 20+ Year Treasury Bond ETF, 114, 11/20/15 116 iShares 20+ Year Treasury Bond ETF, 115, 11/27/15 55 S&P 500 Index, 1750, 11/20/15 105 S&P 500 Index, 1750, 11/30/15 Total Purchased Put Options (Cost - $23) Investment Company (5%) 2,786,618 Payden Cash Reserves Money Market Fund * (Cost - $2,787) Principal or Shares 230,000 $ 229 292 362 337 199 137 144 369 112 221 271 Total (Cost - $61,616) (101%) Liabilities in excess of Other Assets (-1%) Net Assets (100%) 398 96 Delivery Date Assets: 2/1/2016 12/15/2015 12/15/2015 Liabilities: 2/1/2016 350 123 11/24/2015 387 11/24/2015 1/27/2016 255 $ 61,510 (523) 60,987 Open Forward Currency Contracts to USD 2/24/2016 12/15/2015 11/24/2015 170 $ * Affiliated investment (a) Security offered only to qualified institutional investors, and thus is not registered for sale to the public under rule 144A of the Securities Act of 1933. It has been deemed liquid under guidelines approved by the Board. (b) Variable rate security. The rate shown reflects the rate in effect at October 31, 2015. The stated maturity is subject to prepayments.
See Note 2 in the Notes to Financial Statements. (c) Yield to maturity at time of purchase. 392 124 Value (000) Security Description Unrealized Appreciation (Depreciation) (000s) Currency (000s) Counterparty Australian Dollar (Sell 2,515) Credit Suisse First Boston International Citibank, N.A. BNP PARIBAS $ 32 Credit Suisse First Boston International Barclays Bank PLC BNP PARIBAS HSBC Bank USA, N.A. BNP PARIBAS $ (2) British Pound (Buy 562) Euro (Sell 1,162) Australian Dollar (Buy 1,238) Chinese Yuan (Sell 4,600) Euro (Sell 505) New Taiwan Dollar (Sell 9,290) South Korean Won (Buy 508,000) South Korean Won (Sell 508,000) Thailand Baht (Sell 27,080) BNP PARIBAS Barclays Bank PLC 3 16 $ 51 (20) (2) (2) (3) (19) (3) $(51) 62 18,728 5,495 1,400 6,895 1 1 3 9 14 2,787 Annual Report 41 . Payden Absolute Return Bond Fund continued Open Futures Contracts Number of Contracts 29 11 37 2 14 14 1 Contract Type 90-Day Sterling Future Australian 10 Year Bond Future Australian 3 Year Bond Future U.S. Long Bond Future U.S. Treasury 10 Year Note Future U.S. Treasury 5 Year Note Future U.S.
Treasury Ultra Bond Future Unrealized Appreciation (Depreciation) (000s) $(10) — Expiration Date Jun-16 Dec-15 Current Value (000) $(5,547) (1,014) Dec-15 2,963 4 Dec-15 Dec-15 (313) 1,788 5 (12) Jan-16 (1,677) (2) Dec-15 (160) 4 $(11) See notes to financial statements. 42 Payden Mutual Funds . Payden Floating Rate Fund $12,000 The Fund seeks high current income and capital appreciation by generally investing 80% of its assets in income producing senior floating rate loans and other floating rate debt instruments. One Year 2.64% Fund $10,509 Since 11/11/13 2.55% Credit Suisse Leverage Loan BB Index $10,549 $11,000 Portfolio Composition - percent of value Bank Loans Corporate Asset Backed Investment Company Mortgage Backed 79% 8% 6% 6% 1% $10,000 $9,000 11/11/2013 10/14 10/31/15 Past performance does not predict future returns. The graph does not reflect the impact of taxes or transaction costs a shareholder would pay. The Fund’s Adviser and SI Classes are expected to perform similarly to its Investor Class. This information is not part of the audited financial statements. Schedule of Investments - October 31, 2015 Principal or Shares Security Description Asset Backed (6%) 1,800,000 Babson CLO Ltd./Cayman Islands 144A, 3.82%, 4/20/25 (a) 1,500,000 Carlyle Global Market Strategies CLO 2013-2 Ltd. 144A, 4.07%, 4/18/25 (a) 1,500,000 CIFC Funding 2013-III Ltd.
144A, 3.54%, 10/24/25 (a) 1,500,000 Dryden XXII Senior Loan Fund 144A, 3.52%, 8/15/25 (a) 1,500,000 Madison Park Funding XIII Ltd. 144A, 3.67%, 1/19/25 (a) 1,500,000 North End CLO Ltd. 2013-1 144A, 3.82%, 7/17/25 (a) 1,250,000 Octagon Investment Partners XIV Ltd.
144A, 4.32%, 1/15/24 (a) Total Asset Backed (Cost - $10,299) Bank Loans(b) (76%) 1,885,411 Academy Ltd., 5.00%, 7/02/22 2,468,750 Air Canada Corp. Term Loan B 1L, 4.00%, 9/26/19 2,978,031 Albertsons/Safeway LLC Term Loan B4 1L, 5.50%, 8/25/21 2,160,140 Alliance Healthcare Services Inc. Term Loan B 1L, 4.25%, 6/03/19 2,656,083 Allison Transmission Inc.
Term Loan B3 1L, 3.75%, 8/23/19 997,500 Altice Financing SA Term Loan 1L, 5.25%, 1/30/22 2,156,000 American Builders & Contractors Supply Co. Inc. Term Loan B1 1L, 3.50%, 4/16/20 1,909,400 Applied Systems Inc. Term Loan 1L, 4.25%, 1/15/21 500,000 ARAMARK Corp.
Term Loan E 1L, 3.25%, 9/07/19 2,475,000 Ashland Water Technologies/Solenis Term Loan 1L, 4.25%, 7/02/21 927,675 Asurion LLC, 5.00%, 8/04/22 Value (000) $ Principal or Shares 1,718 1,439 1,017,022 2,750,000 400,000 2,229,129 1,379 2,463,064 1,398 1,330,000 1,400 1,414 1,240 9,988 1,881 2,475 2,982 2,152 2,663 996 2,146 1,899 501 2,441 879 1,989,950 398,977 1,000,000 957,279 2,156,000 2,500,000 2,500,000 2,992,500 1,984,925 2,130,325 2,038,685 2,541,731 500,000 2,700,000 Value (000) Security Description Asurion LLC Term Loan B1 1L, 4.50%, 5/24/19 B and G Foods Inc. Term Loan B 1L, 3.75%, 10/05/22 Berry Plastics Group Inc., 4.00%, 10/01/22 Berry Plastics Group Inc. Term Loan E 1L, 3.75%, 12/18/20 BJ’s Wholesale Club Inc.
Term Loan B 1L, 4.50%, 9/26/19 Burlington Coat Factory Warehouse Corp. Term Loan B3 1L, 4.25%, 8/13/21 CD&R Millennium Holdco, 4.50%, 7/31/21 CDW LLC/CDW Finance Corp. Term Loan B 1L, 3.50%, 4/29/20 Charter Communications Term Loan I 1L, 3.50%, 1/23/23 Chs/Community Health Systems Inc., 4.00%, 1/27/21 Cincinnati Bell Inc.
Term Loan B 1L, 4.00%, 9/10/20 Clubcorp Club Operations Inc. Term Loan B 1L, 4.50%, 7/24/20 Commscope Term Loan 1L GTD, 3.75%, 12/29/22 Communications Sales & Leasing Corp. Term Loan B 1L, 5.00%, 10/16/22 Davita Healthcare Partners Inc.
Term Loan B 1L, 3.50%, 6/19/21 Dell Inc. Term Loan B IL, 4.00%, 4/29/20 Dole Food Co. Inc.
Term Loan B 1L, 4.50%, 11/01/18 Dollar Tree Inc. Term Loan B 1L, 3.50%, 7/06/22 Endo International Term Loan B 1L, 3.75%, 9/25/22 Energy Transfer Equity LP Term Loan 1L, 3.25%, 12/02/19 $ 972 2,756 401 2,230 2,446 1,334 1,973 398 1,001 956 2,134 2,504 2,502 2,833 1,994 2,133 2,041 2,550 493 2,596 Annual Report 43 . Payden Floating Rate Fund continued Principal or Shares 985,000 2,462,500 1,124,812 1,691,205 1,176,090 2,495,103 2,468,750 2,000,000 1,975,000 1,663,851 1,448,311 1,176,000 1,984,694 1,975,000 1,572,727 2,156,096 2,468,777 1,596,398 1,381,102 2,468,750 2,500,000 2,992,500 940,556 388,243 982,500 1,970,849 2,500,000 2,800,000 2,455,808 1,975,000 1,451,852 2,000,000 Value (000) Security Description Fiat SpA Term Loan B 1L, 3.25%, 12/29/18 Grifols SA Term Loan B 1L, 3.00%, 3/07/21 Harbor Freight Tools USA Inc. Term Loan B 1L, 4.75%, 7/26/19 Hilton Worldwide Finance LLC Term Loan B2, 4.00%, 10/26/20 HUB International Ltd. Term Loan B 1L, 4.25%, 10/02/20 Ineos U.S. Finance LLC Term Loan 1L, 4.25%, 3/12/22 Interactive Data Corp.
Term Loan B 1L, 4.75%, 4/24/21 International Finance Corp. Term Loan B 1L, 3.50%, 2/27/21 Kindred Healthcare Inc. Term Loan B 1L, 4.00%, 3/28/21 La Quinta Intermediate Holdings LLC Term Loan B 1L, 4.25%, 4/14/21 Landry’s Inc., 4.00%, 4/24/18 Live Nation Entertainment Inc.
Term Loan B1, 3.50%, 8/16/20 MGM Resorts International Term Loan B 1L, 3.50%, 12/20/19 Michaels Stores, Inc. Term Loan B2 1L, 4.00%, 1/28/20 MPH Acquisition Holdings LLC Term Loan B 1L, 4.25%, 3/31/21 Neiman Marcus Group LLC Term Loan 1L, 4.25%, 10/25/20 Nortek Inc. Term Loan B 1L, 3.75%, 10/30/20 Numericable SFR Term Loan B1 1L, 4.50%, 4/23/20 Numericable SFR Term Loan B2 1L, 4.50%, 4/23/20 Ortho-Clinical Diagnostics, Inc.
Term Loan B 1L, 4.75%, 6/30/21 Party City Term Loan B 1L, 4.25%, 8/06/22 PetSmart Inc., 4.25%, 3/10/22 PharMEDium Healthcare Corp. Term Loan 1L, 4.25%, 1/23/21 Pinnacle Entertainment Inc. Term Loan B2 1L, 3.75%, 8/13/20 Realogy Group LLC Term Loan B 1L, 3.75%, 3/05/20 Restaurant Brands Term Loan B2 1L, 3.75%, 12/12/21 Reynolds Group Holdings Inc., 4.50%, 12/01/18 Rite Aid Corp., 4.88%, 6/21/21 Sabre Inc.
Term Loan B 1L, 4.25%, 2/19/19 SBA Communications Corp. Term Loan B 1L, 3.25%, 3/31/21 Signode Industrial Group Term Loan B 1L, 4.00%, 5/01/21 Smart & Final Term Loan B 1L, 4.00%, 11/15/19 $ Principal or Shares 983 2,462 1,130 1,697 1,148 2,466 2,472 2,003 1,969 1,651 1,452 1,179 1,984 1,982 1,555 2,110 2,450 1,578 1,365 2,438 2,503 2,997 940 389 984 1,977 2,508 2,811 2,459 1,959,799 Starwood Property Trust Inc. Term Loan 1L, 3.50%, 4/19/20 1,970,000 Stena Term Loan B 1L, 4.00%, 3/03/21 500,000 Sterigenics-Nordion Term Loan B 1L, 4.25%, 4/27/22 1,464,736 TransDigm Inc.
Term Loan C 1L, 3.75%, 2/28/20 2,200,000 UPC Financing Partnership Term Loan 1L, 3.25%, 6/30/21 1,689,286 Vantiv LLC Term Loan B 1L, 3.75%, 6/13/21 1,166,667 Visteon Corp. Term Loan B IL, 3.50%, 4/08/21 Total Bank Loans (Cost - $127,690) Corporate Bond (7%) 2,500,000 AES Corp./VA, 3.32%, 6/01/19 2,000,000 Ardagh Packaging Finance PLC / Ardagh Holdings USA Inc. 144A, 3.34%, 12/15/19 (a) 1,000,000 Avis Budget Car Rental LLC / Avis Budget Finance Inc., 3.07%, 12/01/17 462,000 Bumble Bee Acquisition Corp.
144A, 9.00%, 12/15/17 (a) 1,000,000 Continental Airlines 2012-3 Class C Pass Thru Certificates, 6.13%, 4/29/18 1,000,000 Dana Holding Corp., 6.75%, 2/15/21 1,210,000 Landry’s Inc. 144A, 9.38%, 5/01/20 (a) 1,000,000 Navient Corp., 6.00%, 1/25/17 1,000,000 Novelis Inc., 8.38%, 12/15/17 1,000,000 Tenet Healthcare Corp. 144A, 3.84%, 6/15/20 (a) Total Corporate Bond (Cost - $12,326) Mortgage Backed (1%) 675,000 Freddie Mac Structured Agency Credit Risk Debt Notes, 3.80%, 4/25/24 350,000 Freddie Mac Structured Agency Credit Risk Debt Notes, 7.75%, 12/25/27 999,886 Freddie Mac Structured Agency Credit Risk Debt Notes, 8.15%, 5/25/25 Total Mortgage Backed (Cost - $2,025) Investment Company (6%) 9,508,911 Payden Cash Reserves Money Market Fund * (Cost - $9,509) Total (Cost - $161,849) (96%) Other Assets, net of Liabilities (4%) Net Assets (100%) $ 1,940 1,684 496 1,448 2,167 1,695 1,164 126,885 2,388 1,975 1,008 476 1,031 1,044 1,304 1,029 1,009 997 12,261 631 351 1,008 1,990 $ 9,509 160,633 5,979 166,612 * Affiliated investment (a) Security offered only to qualified institutional investors, and thus is not registered for sale to the public under rule 144A of the Securities Act of 1933. It has been deemed liquid under guidelines approved by the Board. (b) Variable rate security.
The rate shown reflects the rate in effect at October 31, 2015. The stated maturity is subject to prepayments. See Note 2 in the Notes to Financial Statements. 1,964 1,429 1,994 See notes to financial statements. 44 Payden Mutual Funds Value (000) Security Description .
Payden High Income Fund $25,000 The Fund seeks high current income and capital appreciation by generally investing in below investment grade debt instruments and income producing securities of U.S. and foreign issuers with no limit on the average portfolio maturity. One Year -0.79% $20,000 Investor Class $17,379 Ten Year 5.68% Bank of America Merrill Lynch BB-B High Yield Cash Pay Constrained Index $19,758 $15,000 Portfolio Composition - percent of value Consumer Cyclical Telecommunication Financial Consumer Non-Cyclical Energy Other Five Year 5.38% 19% 18% 16% 10% 7% 30% $10,000 $5,000 10/31/05 10/10 10/31/15 Past performance does not predict future returns. The graph does not reflect the impact of taxes or transaction costs a shareholder would pay. The Fund’s Adviser Class is expected to perform similiarly to its Investor Class. This information is not part of the audited financial statements. Schedule of Investments - October 31, 2015 Principal or Shares Security Description Bank Loans(a) (0%) 2,239,300 HCA Inc.
Term Loan B4 1L, 2.93%, 5/01/18 (Cost - $2,227) Corporate Bond (86%) Consumer Cyclical (18%) 4,650,000 Air Canada 144A, 6.75%, 10/01/19 (b) 3,100,000 Air Canada 144A, 7.75%, 4/15/21 (b) 4,159,057 American Airlines 2013-1 Class B Pass Through Trust, 5.63%, 1/15/21 2,900,000 American Axle & Manufacturing Inc., 6.25%, 3/15/21 2,585,000 AmeriGas Finance LLC / AmeriGas Finance Corp., 7.00%, 5/20/22 1,193,000 AmeriGas Partners LP / AmeriGas Finance Corp., 6.50%, 5/20/21 1,200,000 Brightstar Corp. 144A, 7.25%, 8/01/18 (b) 2,150,000 Brookfield Residential Properties Inc. 144A, 6.38%, 5/15/25 (b) 3,400,000 Caleres Inc.
144A, 6.25%, 8/15/23 (b) 2,500,000 Carmike Cinemas Inc. 144A, 6.00%, 6/15/23 (b) 3,600,000 Carrols Restaurant Group Inc., 8.00%, 5/01/22 3,450,000 D.R. Horton Inc., 4.38%, 9/15/22 3,550,000 Dollar Tree Inc 144A, 5.75%, 3/01/23 (b) 5,000,000 General Motors Financial Co.
Inc., 4.25%, 5/15/23 4,000,000 Goodyear Tire & Rubber Co., 7.00%, 5/15/22 2,500,000 L Brands Inc., 6.63%, 4/01/21 3,679,000 Landry’s Inc. 144A, 9.38%, 5/01/20 (b) 3,300,000 Lennar Corp., 4.50%, 11/15/19 5,150,000 Levi Strauss & Co., 6.88%, 5/01/22 5,025,000 MGM Resorts International, 5.25%, 3/31/20 5,563,000 Mobile Mini Inc., 7.88%, 12/01/20 3,450,000 Neiman Marcus Group Ltd. LLC 144A, 8.75%, 10/15/21 (b) 4,500,000 New Red Finance Inc 144A, 6.00%, 4/01/22 (b) 3,410,000 Party City Holdings Inc.
144A, 6.13%, 8/15/23 (b) 4,000,000 Regal Entertainment Group, 5.75%, 3/15/22 Value (000) $ 2,243 Principal or Shares 3,550,000 4,000,000 3,900,000 4,941 3,243 5,500,000 4,211 1,000,000 3,049 4,000,000 Value (000) Security Description Rite Aid Corp. 144A, 6.13%, 4/01/23 (b) Schaeffler Finance BV 144A, 4.25%, 5/15/21 (b) Suburban Propane Partners LP/Suburban Energy Finance Corp., 5.50%, 6/01/24 Taylor Morrison Communities Inc. / Monarch Communities Inc.
144A, 5.63%, 3/01/24 (b) Wynn Las Vegas LLC / Wynn Las Vegas Capital Corp. 144A, 4.25%, 5/30/23 (b) ZF North America Capital Inc. 144A, 4.00%, 4/29/20 (b) 2,740 1,238 1,251 2,075 3,451 2,597 3,843 3,536 3,759 5,090 4,365 2,844 3,964 3,432 5,671 5,151 5,813 3,601 4,719 Consumer Non-Cyclical (10%) 2,640,000 ACCO Brands Corp., 6.75%, 4/30/20 2,200,000 Aramark Services Inc, 5.75%, 3/15/20 4,700,000 Ashtead Capital Inc.
144A, 6.50%, 7/15/22 (b) 4,000,000 Avis Budget Car Rental LLC / Avis Budget Finance Inc. 144A, 5.13%, 6/01/22 (b) 4,000,000 C&S Group Enterprises LLC 144A, 5.38%, 7/15/22 (b) 4,055,000 Central Garden and Pet Co., 8.25%, 3/01/18 4,300,000 Dole Food Co. Inc.
144A, 7.25%, 5/01/19 (b) 3,000,000 Endo Finance Co. 144A, 5.75%, 1/15/22 (b) 3,500,000 Grifols Worldwide Operations Ltd., 5.25%, 4/01/22 4,500,000 Hertz Corp., 6.75%, 4/15/19 4,100,000 Ingles Markets Inc., 5.75%, 6/15/23 3,000,000 Iron Mountain Inc., 5.75%, 8/15/24 3,000,000 LifePoint Health Inc., 5.50%, 12/01/21 3,050,000 Mallinckrodt International Finance SA / Mallinckrodt CB LLC 144A, 5.63%, 10/15/23 (b) 4,000,000 NBTY Inc., 9.00%, 10/01/18 $ 3,838 4,040 3,802 5,445 894 4,055 114,332 2,825 2,300 5,064 4,098 3,680 4,136 4,326 2,948 3,631 4,629 4,203 3,026 3,053 2,894 4,100 3,529 4,145 Annual Report 45 . Payden High Income Fund continued Principal or Shares 3,600,000 3,500,000 Energy (7%) 1,000,000 2,650,000 5,200,000 4,700,000 4,750,000 2,000,000 6,000,000 3,000,000 2,200,000 5,500,000 1,850,000 2,700,000 3,000,000 5,075,000 Value (000) Security Description Reynolds Group Issuer Inc. / Reynolds Group Issuer LLC, 6.88%, 2/15/21 United Rentals North America Inc., 7.63%, 4/15/22 Principal or Shares 4,000,000 $ 3,771 3,815 62,499 3,500,000 4,500,000 3,000,000 Chesapeake Energy Corp., 6.88%, 11/15/20 DCP Midstream LLC 144A, 9.75%, 3/15/19 (b) EP Energy LLC / EP Energy Finance Inc., 9.38%, 5/01/20 Laredo Petroleum Inc., 7.38%, 5/01/22 Nielsen Co. Luxembourg SARL 144A, 5.50%, 10/01/21 (b) Noble Holding International Ltd., 5.95%, 4/01/25 Peabody Energy Corp., 6.50%, 9/15/20 Sabine Pass Liquefaction LLC, 5.63%, 2/01/21 Sabine Pass Liquefaction LLC, 5.75%, 5/15/24 SM Energy Co., 6.50%, 1/01/23 Sunoco LP / Sunoco Finance Corp. 144A, 5.50%, 8/01/20 (b) Sunoco LP / Sunoco Finance Corp.
144A, 6.38%, 4/01/23 (b) Tesoro Corp., 5.38%, 10/01/22 WPX Energy Inc., 6.00%, 1/15/22 Financial (16%) 3,500,000 AerCap Ireland Capital Ltd. / AerCap Global Aviation Trust, 5.00%, 10/01/21 4,100,000 Aircastle Ltd., 5.13%, 3/15/21 3,000,000 Ally Financial Inc., 3.50%, 1/27/19 8,800,000 Ally Financial Inc., 4.13%, 2/13/22 3,800,000 Argos Merger Sub Inc. 144A, 7.13%, 3/15/23 (b) 2,700,000 BNP Paribas SA 144A, 7.38%, 12/29/49 (b) 3,000,000 CIT Group Inc., 5.00%, 8/15/22 4,600,000 CIT Group Inc., 5.38%, 5/15/20 4,700,000 Citigroup Inc., 5.95%, 7/29/49 3,500,000 Communications Sales & Leasing Inc.
144A, 6.00%, 4/15/23 (b) 3,550,000 Credit Acceptance Corp. 144A, 7.38%, 3/15/23 (b) 3,600,000 E*TRADE Financial Corp., 5.38%, 11/15/22 3,500,000 Hartford Financial Services Group Inc., 8.13%, 6/15/38 3,500,000 Hockey Merger Sub 2 Inc. 144A, 7.88%, 10/01/21 (b) 4,300,000 Icahn Enterprises LP / Icahn Enterprises Finance Corp., 6.00%, 8/01/20 4,300,000 International Lease Finance Corp., 4.63%, 4/15/21 2,600,000 International Lease Finance Corp., 8.63%, 1/15/22 1,600,000 MetLife Inc., 5.25%, 12/29/49 4,000,000 Morgan Stanley, 5.45%, 7/29/49 3,250,000 Navient Corp., 4.88%, 6/17/19 3,000,000 Navient Corp., 6.00%, 1/25/17 46 Payden Mutual Funds 682 2,886 4,550 4,665 4,940 1,610 825 2,993 2,134 5,447 1,906 2,734 3,056 4,491 42,919 3,666 4,336 3,026 8,927 4,009 2,798 3,169 4,974 4,671 3,412 3,683 3,858 3,896 Pershing Square Holdings Ltd.
144A, 5.50%, 7/15/22 (b) Radian Group Inc., 5.25%, 6/15/20 Royal Bank of Scotland Group PLC, 6.10%, 6/10/23 Royal Bank of Scotland Group PLC, 7.50%, 12/29/49 Healthcare (6%) 2,400,000 CHS/Community Health Systems Inc., 6.88%, 2/01/22 2,000,000 CHS/Community Health Systems Inc., 8.00%, 11/15/19 4,000,000 Crimson Merger Sub Inc. 144A, 6.63%, 5/15/22 (b) 4,000,000 DaVita HealthCare Partners Inc., 5.75%, 8/15/22 4,750,000 HCA Inc., 6.50%, 2/15/20 4,950,000 HCA Inc., 7.50%, 2/15/22 3,000,000 HealthSouth Corp., 5.75%, 11/01/24 5,740,000 Tenet Healthcare Corp., 5.00%, 3/01/19 2,200,000 Tenet Healthcare Corp., 5.50%, 3/01/19 1,000,000 Tenet Healthcare Corp., 8.00%, 8/01/20 Industrial (5%) 4,000,000 Ardagh Packaging Finance PLC 144A, 9.13%, 10/15/20 (b) 4,280,000 Ardagh Packaging Finance PLC / Ardagh Holdings USA Inc. 144A, 3.34%, 12/15/19 (b) 2,200,000 Ball Corp., 5.25%, 7/01/25 3,300,000 Berry Plastics Corp., 5.13%, 7/15/23 4,550,000 Bombardier Inc.
144A, 5.75%, 3/15/22 (b) 3,200,000 Novelis Inc./GA, 8.75%, 12/15/20 3,500,000 Spirit Aerosystems Inc., 6.75%, 12/15/20 3,200,000 Trinseo Materials Operating SCA / Trinseo Materials Finance Inc. 144A, 6.75%, 5/01/22 (b) 2,800,000 Triumph Group Inc., 4.88%, 4/01/21 Material (3%) 3,000,000 3,600,000 5,600,000 1,000,000 2,000,000 3,200,000 3,500 2,000,000 A Schulman Inc. 144A, 6.88%, 6/01/23 (b) Alcoa Inc., 5.87%, 2/23/22 ArcelorMittal, 7.00%, 2/25/22 Ashland Inc., 4.75%, 8/15/22 Commercial Metals Co., 4.88%, 5/15/23 INEOS Group Holdings SA 144A, 6.13%, 8/15/18 (b) PolyOne Corp., 7.38%, 9/15/20 4,504 4,461 3,208 1,619 3,940 3,152 3,086 Value (000) Security Description Technology (2%) 520,000 First Data Corp.
144A, 6.75%, 11/01/20 (b) 2,424,000 First Data Corp. 144A, 8.25%, 1/15/21 (b) 2,424,000 First Data Corp., 12.63%, 1/15/21 4,460,000 Freescale Semiconductor Inc. 144A, 6.00%, 1/15/22 (b) 3,500,000 Infor U.S.
Inc. 144A, 6.50%, 5/15/22 (b) $ 3,780 3,504 4,903 3,112 97,194 2,430 2,090 3,475 4,215 5,326 5,717 3,015 5,640 2,178 1,040 35,126 4,205 4,227 2,244 3,275 3,540 3,224 3,640 3,216 2,513 30,084 2,993 3,780 5,334 1,004 1,780 3,236 2,092 20,219 549 2,548 2,785 4,761 3,325 13,968 . Principal or Shares Telecommunication (18%) 3,200,000 Altice SA 144A, 7.75%, 5/15/22 (b) 3,050,000 CCO Holdings LLC / CCO Holdings Capital Corp., 5.13%, 2/15/23 3,300,000 CCO Holdings LLC / CCO Holdings Capital Corp., 6.50%, 4/30/21 3,660,000 CenturyLink Inc., 5.80%, 3/15/22 5,000,000 CenturyLink Inc., 6.45%, 6/15/21 3,500,000 Cogent Communications Group Inc. 144A, 5.38%, 3/01/22 (b) 3,200,000 CommScope Technologies Finance LLC 144A, 6.00%, 6/15/25 (b) 3,800,000 Consolidated Communications Inc. 144A, 6.50%, 10/01/22 (b) 3,490,000 CSC Holdings LLC, 8.63%, 2/15/19 5,500,000 DISH DBS Corp., 5.88%, 7/15/22 4,750,000 DISH DBS Corp., 6.75%, 6/01/21 4,000,000 Frontier Communications Corp., 7.63%, 4/15/24 2,100,000 Frontier Communications Corp. 144A, 10.50%, 9/15/22 (b) 4,150,000 Intelsat Jackson Holdings SA, 7.25%, 10/15/20 3,500,000 Level 3 Financing Inc., 5.63%, 2/01/23 4,215,000 Numericable Group SA 144A, 6.00%, 5/15/22 (b) 2,600,000 Numericable Group SA 144A, 6.25%, 5/15/24 (b) 4,320,000 SBA Communications Corp., 5.63%, 10/01/19 4,600,000 Sinclair Television Group Inc., 6.38%, 11/01/21 1,700,000 Softbank Corp.
144A, 4.50%, 4/15/20 (b) 1,230,000 Sprint Capital Corp., 6.88%, 11/15/28 9,000,000 Sprint Capital Corp., 6.90%, 5/01/19 2,200,000 Sprint Communications Inc., 6.00%, 11/15/22 1,500,000 Sprint Corp., 7.88%, 9/15/23 5,000,000 Starz LLC / Starz Finance Corp., 5.00%, 9/15/19 3,650,000 Telecom Italia SPA 144A, 5.30%, 5/30/24 (b) 5,500,000 T-Mobile USA Inc., 6.25%, 4/01/21 3,240,000 Tribune Media Co. 144A, 5.88%, 7/15/22 (b) 2,540,000 Windstream Corp., 6.38%, 8/01/23 4,350,000 Windstream Corp., 7.50%, 6/01/22 1,590,000 Windstream Corp., 7.88%, 11/01/17 Utility (1%) 1,900,000 4,000,000 Value (000) Security Description Calpine Corp. 144A, 7.88%, 1/15/23 (b) Talen Energy Supply LLC 144A, 4.63%, 7/15/19 (b) Total Corporate Bond (Cost - $537,110) Mortgage Backed (1%) 1,450,000 Freddie Mac Structured Agency Credit Risk Debt Notes, 7.75%, 12/25/27 2,174,752 Freddie Mac Structured Agency Credit Risk Debt Notes, 8.15%, 5/25/25 375,000 Freddie Mac Structured Agency Credit Risk Debt Notes, 9.40%, 10/25/27 1,949,101 Freddie Mac Structured Agency Credit Risk Debt Notes, 10.95%, 3/25/25 Total Mortgage Backed (Cost - $5,949) $ Principal or Shares 3,088 3,065 3,469 3,573 5,063 3,465 3,256 3,380 3,717 5,404 4,916 3,600 2,184 3,808 3,609 4,236 2,607 4,531 4,761 1,689 1,024 8,663 1,885 1,391 5,126 3,682 5,692 3,337 2,022 3,632 1,692 111,567 Value (000) Security Description Stocks (2%) Preferred Stock (1%) 3,401 Ally Financial Inc., 7.00% 144A (b) 62,700 Goldman Sachs Group Inc., 5.95% 64,000 JPMorgan Chase & Co., 6.15% 60,900 Wells Fargo & Co., 6.00% $ 3,483 1,604 1,613 1,581 8,281 Real Estate Investment Trust (1%) 23,100 Equity Residential 8,700 Public Storage 9,000 Simon Property Group Inc. 1,786 1,997 1,813 Total Stocks (Cost - $12,585) Investment Company (9%) 39,270,540 Payden Cash Reserves Money Market Fund * 900,000 Payden Emerging Markets Corporate Bond Fund, SI Class * 901,064 Payden Floating Rate Fund, SI Class * Total Investment Company (Cost - $57,241) Total (Cost - $615,112) (98%) Other Assets, net of Liabilities (2%) Net Assets (100%) 5,596 13,877 39,271 $ 8,667 8,920 56,858 612,978 10,838 623,816 * Affiliated investment (a) Variable rate security.
The rate shown reflects the rate in effect at October 31, 2015. The stated maturity is subject to prepayments. See Note 2 in the Notes to Financial Statements. (b) Security offered only to qualified institutional investors, and thus is not registered for sale to the public under rule 144A of the Securities Act of 1933. It has been deemed liquid under guidelines approved by the Board. 2,050 3,679 5,729 533,637 1,452 2,193 427 2,291 6,363 Annual Report 47 .
Payden High Income Fund continued Open Forward Currency Contracts to USD Delivery Date Assets: 2/1/2016 12/15/2015 12/15/2015 Liabilities: 2/1/2016 2/24/2016 12/15/2015 11/24/2015 11/24/2015 1/27/2016 Currency (000s) Australian Dollar (Sell 16,952) British Pound (Buy 3,930) Euro (Sell 8,138) Australian Dollar (Buy 8,198) Chinese Yuan (Sell 39,637) Euro (Sell 3,276) South Korean Won (Buy 3,645,000) South Korean Won (Sell 3,645,000) Thailand Baht (Sell 214,670) Counterparty Unrealized Appreciation (Depreciation) (000s) Credit Suisse First Boston International Citibank, N.A. $ 218 BNP PARIBAS Number of Contracts 182 Contract Type U.S. Treasury 10 Year Note Future 111 $ 347 Credit Suisse First Boston International Barclays Bank PLC Open Futures Contracts $ (13) 18 (175) BNP PARIBAS BNP PARIBAS (15) (22) BNP PARIBAS (133) Barclays Bank PLC (21) $(379) See notes to financial statements. 48 Payden Mutual Funds Expiration Date Dec-15 Current Value (000) $23,239 Unrealized Depreciation (000s) $(179) . Payden California Municipal Income Fund The Fund seeks income that is exempt from federal and California state income tax and is consistent with preservation of capital by generally investing in investment grade California municipal securities with an average portfolio maturity of five to ten years. $19,000 Portfolio Composition - percent of value $13,000 General Obligation Water & Sewer Healthcare Airport/Port Industrial Development/Pollution Control Other One Year 1.87% $17,000 Five Year 3.42% Ten Year 3.98% Fund $14,777 Barclay’s Capital 7-Year Municipal Index $16,089 Barclay’s Capital California Intermediate Index $16,325 $15,000 44% 10% 9% 8% $11,000 $9,000 10/31/05 7% 22% 10/10 10/31/15 Past performance does not predict future returns. The graph does not reflect the impact of taxes or transaction costs a shareholder would pay. This information is not part of the audited financial statements. Schedule of Investments - October 31, 2015 Principal or Shares Security Description General Obligation (44%) 250,000 Alameda Community Improvement Commission Successor Agency, 5.00%, 9/01/32 BAM (a) 300,000 Anaheim Public Financing Authority, 5.00%, 5/01/34 200,000 Brea Community Benefit Financing Authority, 5.00%, 7/01/29 400,000 Burbank Redevelopment Agency Successor Agency, 4.00%, 12/01/18 BAM (a) 400,000 California State, 0.83%, 12/01/28 750,000 California State, 3.00%, 12/01/32 300,000 California State, 5.00%, 10/01/23 500,000 California State, 5.00%, 10/01/26 750,000 California State, 5.25%, 2/01/20 480,000 California State, 5.25%, 10/01/21 200,000 California State Public Works Board, 5.00%, 9/01/21 105,000 California State Public Works Board, 5.00%, 9/01/23 250,000 California State Public Works Board, 5.00%, 5/01/24 325,000 California State Public Works Board, 5.25%, 10/01/32 385,000 California State Public Works Board, 5.25%, 10/01/33 500,000 City & County of San Francisco CA, 5.00%, 6/15/22 300,000 City & County of San Francisco CA, 5.00%, 9/01/27 60,000 City of Industry CA, 4.00%, 7/01/18 150,000 City of Irvine CA, 5.00%, 9/02/22 460,000 County of San Joaquin CA, 5.00%, 11/15/15 NATL-RE (a) 200,000 East Side Union High School District, 5.00%, 8/01/29 Value (000) Principal or Shares 285,000 $ 285 250,000 339 250,000 236 250,000 435 401 801 367 605 880 558 238 127 304 382 451 608 352 65 174 461 231 250,000 225,000 350,000 450,000 310,000 250,000 250,000 475,000 250,000 315,000 425,000 325,000 285,000 300,000 Value (000) Security Description Inglewood Public Financing Authority, 4.25%, 8/01/21 Inglewood Public Financing Authority, 5.00%, 8/01/17 Liberty Union High School District, 5.00%, 8/01/28 Los Angeles County Public Works Financing Authority, 5.00%, 12/01/31 Los Angeles County Public Works Financing Authority, 5.00%, 8/01/42 Los Angeles County Redevelopment Authority, 5.00%, 6/01/23 Los Angeles County Redevelopment Authority, 5.25%, 12/01/26 AGM (a) Los Angeles, CA Unified School District, 5.00%, 7/01/21 Natomas Unified School District, 5.00%, 9/01/25 BAM (a) Oakland Redevelopment Agency Successor Agency, 5.00%, 9/01/35 AGM (a) Paramount Redevelopment Agency Successor Agency, 5.00%, 8/01/18 Pasadena, CA Unified School District, 5.00%, 5/01/21 Perris Union High School District, CA, 5.00%, 9/01/41 Poway Unified School District Public Financing Authority, 4.00%, 9/01/18 BAM (a) Rialto Redevelopment Agency, 5.00%, 9/01/27 BAM (a) Riverside County Public Financing Authority, 5.00%, 9/01/22 AGM (a) Riverside County Redevelopment Successor Agency, 5.00%, 10/01/30 AGM (a) Riverside Unified School District Financing Authority, 5.00%, 9/01/21 BAM (a) $ 313 266 293 292 276 270 429 514 372 283 275 566 267 339 496 384 322 351 Annual Report 49 . Payden California Municipal Income Fund continued Principal or Shares Value (000) Security Description Sacramento Area Flood Control Agency, 5.00%, 12/01/37 BAM (a) 325,000 Sacramento Redevelopment Agency Successor Agency, 2.00%, 12/01/17 300,000 Sacramento Redevelopment Agency Successor Agency, 5.00%, 12/01/23 BAM (a) 450,000 San Carlos, CA Elementary School District, 0.00%, 10/01/18 NATL-RE (a) 550,000 San Diego Public Facilities Financing Authority, 5.00%, 10/15/32 120,000 San Jose Financing Authority, 5.00%, 6/01/28 50,000 San Marino Unified School District, 5.00%, 6/01/23 500,000 San Mateo Joint Powers Financing Authority, 4.00%, 6/15/21 790,000 San Ysidro School District, 0.00%, 8/01/47 AGM (a) 200,000 Simi Valley Public Financing Authority, 5.00%, 10/01/29 100,000 State of California, 4.50%, 8/01/26 250,000 State of California, 5.00%, 4/01/17 250,000 State of California, 5.00%, 2/01/25 350,000 Union City Community Redevelopment Agency, 5.00%, 10/01/35 300,000 University of California, 5.00%, 5/15/20 250,000 Ventura County, CA Public Financing Authority, 5.00%, 11/01/21 490,000 West Contra Costa Unified School District, 5.00%, 8/01/22 Total General Obligation (Cost - $19,629) Revenue (54%) Airport/Port (8%) 160,000 Alameda Corridor, CA Transportation Authority, 5.00%, 10/01/23 300,000 City of Long Beach CA, 5.00%, 5/15/19 100,000 City of San Jose CA Airport Revenue, 5.00%, 3/01/28 175,000 City of San Jose CA Airport Revenue, 5.00%, 3/01/29 210,000 Los Angeles, CA Department of Airports, 4.00%, 5/15/18 300,000 Los Angeles, CA Department of Airports, 5.00%, 5/15/18 745,000 Los Angeles, CA Harbor Department, 5.00%, 8/01/19 535,000 Port of Oakland, 5.00%, 11/01/15 NATL-RE (a) 340,000 San Francisco, CA City & County Airports Commission, 5.00%, 5/01/21 365,000 San Francisco, CA City & County Airports Commission, 5.25%, 5/01/18 NATL-RE (a) Principal or Shares Value (000) Security Description 450,000 Education (3%) 100,000 California Educational Facilities Authority, 5.00%, 10/01/21 50 Payden Mutual Funds $ 476 300,000 332 250,000 358 400,000 407 250,000 635 140 60 569 101 235 105 266 299 399 334 299 590 20,213 195 343 117 203 228 333 856 535 387 406 3,603 118 California Educational Facilities Authority, 5.00%, 10/01/31 California Municipal Finance Authority, 5.00%, 4/01/18 California Municipal Finance Authority, 5.00%, 4/01/41 California Municipal Finance Authority, 5.00%, 10/01/42 BAM (a) Electric & Gas (4%) 400,000 Northern California Power Agency, 5.00%, 7/01/18 665,000 Southern California Public Power Authority, 5.00%, 7/01/18 465,000 State of California Department of Water Resources Power Supply Revenue, 5.00%, 5/01/21 190,000 State of California Department of Water Resources Power Supply Revenue, 5.00%, 5/01/21 Facilities (2%) 575,000 California State Public Works Board, 5.00%, 6/01/23 Healthcare (9%) 750,000 Abag Finance Authority for Nonprofit Corps, 5.00%, 8/01/32 100,000 California Health Facilities Financing Authority, 0.12%, 7/01/16 300,000 California Health Facilities Financing Authority, 4.00%, 8/15/21 150,000 California Health Facilities Financing Authority, 5.00%, 3/01/17 340,000 California Health Facilities Financing Authority, 5.00%, 10/01/18 710,000 California Health Facilities Financing Authority, 5.00%, 11/15/27 250,000 California Health Facilities Financing Authority, 5.00%, 7/01/43 250,000 California Health Facilities Financing Authority, 5.00%, 7/01/43 205,000 California Health Facilities Financing Authority, 5.25%, 3/01/28 410,000 City of Torrance CA, 5.00%, 9/01/22 Industrial (1%) 160,000 Parish of St. Charles LA, 4.00%, 12/01/40 Industrial Development/Pollution Control (7%) 400,000 California Infrastructure & Economic Development Bank, 0.29%, 4/01/38 500,000 California Infrastructure & Economic Development Bank, 0.29%, 10/01/47 750,000 California Infrastructure & Economic Development Bank, 4.00%, 2/01/21 $ 340 270 424 272 1,424 444 740 515 210 1,909 695 860 100 341 158 380 818 292 287 235 467 3,938 171 398 496 842 . Principal or Shares 300,000 300,000 105,000 300,000 390,000 100,000 Lease (2%) 410,000 500,000 Value (000) Security Description California Municipal Finance Authority, 1.13%, 2/01/39 California Statewide Communities Development Authority, 4.25%, 11/01/33 FGIC (a) California Statewide Communities Development Authority, 4.25%, 11/01/33 FGIC (a) Palm Springs Community Redevelopment Agency Successor Agency, 5.00%, 9/01/29 AGM (a) Palm Springs Community Redevelopment Agency Successor Agency, 5.00%, 9/01/31 AGM (a) Successor Agency to the Upland Community Redevelopment Agency, 5.00%, 9/01/23 AGM (a) California State Public Works Board, 5.00%, 12/01/18 County of Los Angeles CA, 5.00%, 3/01/21 Resource Recovery (1%) 500,000 South Bayside, CA Waste Management Authority, 5.25%, 9/01/24 Tax Allocation (1%) 415,000 Riverside County, CA Economic Development Agency, 7.25%, 12/01/40 20,000 San Dimas, CA Redevelopment Agency, 6.75%, 9/01/16 AGM (a) Transportation (6%) 250,000 Bay Area Toll Authority, 0.61%, 4/01/34 500,000 Bay Area Toll Authority, 1.50%, 4/01/47 500,000 Foothill-Eastern Transportation Corridor Agency, 5.00%, 1/15/53 1,000,000 Foothill-Eastern Transportation Corridor Agency, 5.50%, 1/15/53 275,000 Sonoma-Marin Area Rail Transit District, 5.00%, 3/01/27 $ Principal or Shares 300 311 109 347 445 120 3,368 461 590 1,051 571 508 20 528 248 506 543 1,123 Value (000) Security Description Water & Sewer (10%) 200,000 Brentwood, CA Infrastructure Financing Authority, 5.50%, 7/01/20 495,000 Central Marin Sanitation Agency, CA, 5.00%, 9/01/18 NATL-RE (a) 500,000 City of San Francisco, CA Public Utilities Commission, 5.00%, 11/01/20 310,000 City of San Francisco, CA Public Utilities Commission, 5.00%, 11/01/24 250,000 El Dorado, CA Irrigation District / El Dorado County Water Agency, 5.00%, 3/01/29 AGM (a) 300,000 Metropolitan Water District of Southern CA, 0.39%, 7/01/36 500,000 Metropolitan Water District of Southern CA, 5.00%, 7/01/17 250,000 Sacramento County Sanitation Districts Financing Authority, 5.00%, 12/01/22 550,000 San Diego County, CA Water Authority, 5.00%, 5/01/21 AGM (a) 300,000 South Placer Wastewater Authority, CA, 0.34%, 11/01/17 500,000 State of California Department of Water Resources, 0.31%, 12/01/35 Total Revenue (Cost - $23,487) Investment Company (3%) 1,520,203 Dreyfus General CA Municipal Money Market Fund (Cost - $1,520) Total (Cost - $44,636) (101%) Liabilities in excess of Other Assets (-1%) Net Assets (100%) $ 225 514 593 373 288 300 537 306 609 299 499 4,543 24,548 $ 1,520 46,281 (343) 45,938 (a) Payment of principal and/or interest is insured against default by a monoline insurer. AGM Assured Guaranty Municipal Corporation BAM Build America Mutual FGIC Financial Guaranty Insurance Corporation NATL-RE National Public Finance Guarantee Corporation 327 2,747 See notes to financial statements. Annual Report 51 . Payden Global Low Duration Fund $18,000 The Fund seeks a high level of total return that is consistent with preservation of capital by generally investing in investment grade debt securities denominated in U.S. and foreign currencies with an average portfolio maturity not to exceed three years. $16,000 Five Year 1.67% Ten Year 2.77% Fund $13,141 Bank of America Merrill Lynch $12,838 Govt/Corp 1-3 Years $13,247 $14,000 Portfolio Composition - percent of value Corporate Bond U.S. Treasury Asset Backed Mortgage Backed Foreign Government Other One Year 0.32% $12,000 53% 22% 11% 5% 4% 5% $10,000 $8,000 10/31/05 10/10 10/31/15 Past performance does not predict future returns. The graph does not reflect the impact of taxes or transaction costs a shareholder would pay. This information is not part of the audited financial statements. Schedule of Investments - October 31, 2015 Principal or Shares Security Description Bank Loans(a) (2%) 299,000 Activision Blizzard Inc.
Term Loan B 1L, 3.25%, 10/11/20 392,000 American Builders & Contractors Supply Co. Inc. Term Loan B1 IL, 3.50%, 4/16/20 391,962 CDW LLC/CDW Finance Corp. Term Loan B 1L, 3.50%, 4/29/20 370,670 Dole Food Co.
Inc. Term Loan B 1L, 4.50%, 11/01/18 418,751 General Nutrition Co. Inc.
Term Loan B 1L, 3.25%, 3/26/19 391,960 Starwood Property Trust Inc. Term Loan 1L, 3.50%, 4/19/20 Total Bank Loans (Cost - $2,267) Bonds (96%) Australia (USD) (2%) 290,000 Commonwealth Bank of Australia/New York NY, 1.75%, 11/02/18 250,000 Macquarie Bank Ltd. 144A, 0.95%, 10/27/17 (b) 450,000 Macquarie Bank Ltd.
144A, 1.60%, 10/27/17 (b) 500,000 Macquarie Bank Ltd. 144A, 4.88%, 6/10/25 (b) 480,000 Macquarie Group Ltd. 144A, 1.33%, 1/31/17 (b) Bermuda (USD) (0%) 230,000 Aircastle Ltd., 6.75%, 4/15/17 Brazil (USD) (0%) 350,000 Banco do Nordeste do Brasil SA 144A, 3.63%, 11/09/15 (b) Canada (CAD) (1%) 650,000 Bell Canada, 1.33%, 4/22/16 691,000 Enbridge Inc., 1.21%, 3/13/17 300,000 Rogers Communications Inc., 1.36%, 3/13/17 550,000 Shaw Communications Inc., 1.52%, 2/01/16 Canada (USD) (1%) 150,000 Enbridge Inc., 0.78%, 6/02/17 52 Payden Mutual Funds Value (000) $ Principal or Shares 300 381,000 390 700,000 100,000 340,000 61,000 392 Glencore Finance Canada Ltd.
144A, 2.70%, 10/25/17 (b) Province of Ontario Canada, 1.60%, 9/21/16 Thomson Reuters Corp., 1.30%, 2/23/17 Thomson Reuters Corp., 1.65%, 9/29/17 TransAlta Corp., 1.90%, 6/03/17 371 406 388 2,247 290 249 448 498 481 1,966 245 350 497 523 228 421 1,669 147 Value (000) Security Description Cayman Islands (USD) (7%) 200,000 Alibaba Group Holding Ltd. 144A, 1.63%, 11/28/17 (b) 800,000 Apidos CLO 144A, 1.47%, 4/15/25 (b) 250,000 Apidos CLO 144A, 2.02%, 4/15/25 (b) 500,000 Babson CLO Ltd. 144A, 1.42%, 4/20/25 (b) 300,000 Babson CLO Ltd.
144A, 3.17%, 4/20/27 (b) 200,000 Baidu Inc., 2.25%, 11/28/17 600,000 Cent CLO LP 144A, 1.44%, 7/23/25 (b) 300,000 CIFC Funding 2015-II Ltd. 144A, 3.32%, 4/15/27 (b) 545,000 Dryden XXII Senior Loan Fund 144A, 1.42%, 8/15/25 (b) 490,000 Dryden XXII Senior Loan Fund 144A, 1.87%, 8/15/25 (b) 300,000 Dryden XXXI Senior Loan Fund 144A, 3.17%, 4/18/26 (b) 200,000 Hutchison Whampoa International 12 II Ltd. 144A, 2.00%, 11/08/17 (b) 250,000 Madison Park Funding XVII Ltd 144A, 3.18%, 7/21/27 (b) 455,000 Octagon Investment Partners XIX Ltd. 144A, 2.32%, 4/15/26 (b) 315,000 Octagon Investment Partners XXIII Ltd.
144A, 2.29%, 2/25/28 (b) 300,000 Seagate HDD Cayman, 3.75%, 11/15/18 1,300,000 Symphony CLO XV Ltd. 144A, 1.77%, 10/17/26 (b) $ 355 706 100 340 60 1,708 199 785 244 492 294 200 587 290 535 476 293 201 245 447 315 304 1,286 . Principal or Shares 300,000 775,000 490,000 250,000 Value (000) Security Description Tencent Holdings Ltd. 144A, 2.00%, 5/02/17 (b) Tyron Park CLO Ltd. 144A, 1.44%, 7/15/25 (b) Tyron Park CLO Ltd. 144A, 1.85%, 7/15/25 (b) Venture XVII CLO Ltd.
144A, 3.17%, 7/15/26 (b) Chile (USD) (0%) 300,000 Banco Santander Chile 144A, 1.22%, 4/11/17 (b) China (USD) (0%) 250,000 Industrial & Commercial Bank of China Ltd./New York, 2.35%, 11/13/17 Denmark (EUR) (0%) 250,000 Jyske Bank A/S, 0.46%, 6/19/17 Denmark (GBP) (0%) 200,000 Carlsberg Breweries A/S, 7.25%, 11/28/16 Denmark (USD) (1%) 1,100,000 Denmark Government International Bond 144A, 0.88%, 3/20/17 (b) France (USD) (1%) 650,000 BPCE SA, 1.63%, 1/26/18 635,000 Caisse d’Amortissement de la Dette Sociale 144A, 1.25%, 3/12/18 (b) 540,000 Credit Agricole SA/London 144A, 1.12%, 4/15/19 (b) Germany (USD) (2%) 570,000 FMS Wertmanagement AoeR, 0.63%, 1/30/17 600,000 FMS Wertmanagement AoeR, 1.13%, 9/05/17 1,000,000 KFW, 0.88%, 12/15/17 Hong Kong (USD) (0%) 200,000 AIA Group Ltd. 144A, 2.25%, 3/11/19 (b) Ireland (EUR) (1%) 450,000 Allied Irish Banks PLC, 2.88%, 11/28/16 300,000 Elsevier Finance SA via Aquarius + Investments PLC, 0.47%, 5/20/17 Ireland (GBP) (0%) 250,000 GE Capital UK Funding, 0.74%, 3/20/17 Ireland (USD) (1%) 300,000 Ardagh Packaging Finance PLC / Ardagh Holdings USA Inc. 144A, 3.34%, 12/15/19 (b) 1,600,000 Trade MAPS 1 Ltd.
144A, 0.90%, 12/10/18 (b) Ivory Coast (USD) (0%) 510,000 African Development Bank, 0.75%, 11/03/17 Japan (USD) (2%) 290,000 Bank of Tokyo-Mitsubishi UFJ Ltd. 144A, 1.20%, 3/10/17 (b) 400,000 Bank of Tokyo-Mitsubishi UFJ Ltd. 144A, 1.45%, 9/08/17 (b) 260,000 Mitsubishi UFJ Trust & Banking Corp.
144A, 1.60%, 10/16/17 (b) 250,000 Mizuho Bank Ltd. 144A, 1.30%, 4/16/17 (b) 500,000 Mizuho Bank Ltd. 144A, 1.55%, 10/17/17 (b) $ Principal or Shares 300 763 476 241 8,973 296 252 276 326 1,105 652 636 537 1,825 570 602 998 2,170 200 505 331 836 384 296 1,597 1,893 509 289 400 259 249 498 200,000 340,000 400,000 Value (000) Security Description Mizuho Bank Ltd.
144A, 1.70%, 9/25/17 (b) Nomura Holdings Inc., 1.79%, 9/13/16 Suntory Holdings Ltd. 144A, 1.65%, 9/29/17 (b) Luxembourg (USD) (2%) 300,000 Actavis Funding SCS, 1.30%, 6/15/17 260,000 Actavis Funding SCS, 1.59%, 3/12/20 350,000 Actavis Funding SCS, 1.85%, 3/01/17 520,000 Actavis Funding SCS, 2.35%, 3/12/18 480,000 Mallinckrodt International Finance SA, 3.50%, 4/15/18 467 1,896 New Zealand (USD) (1%) 310,000 ANZ New Zealand International Ltd./London 144A, 1.40%, 4/27/17 (b) 400,000 ANZ New Zealand International Ltd./London 144A, 1.75%, 3/29/18 (b) 400,000 BNZ International Funding Ltd./London 144A, 1.90%, 2/26/18 (b) Panama (USD) (0%) 70,000 Carnival Corp., 1.88%, 12/15/17 Singapore (USD) (0%) 126,000 DBS Bank Ltd. 144A, 0.93%, 7/15/21 (b) South Korea (USD) (0%) 300,000 Korea Expressway Corp.
144A, 1.63%, 4/28/17 (b) Spain (USD) (1%) 640,000 Instituto de Credito Oficial 144A, 1.13%, 4/01/16 (b) Sweden (SEK) (0%) 4,300,000 Volvo Treasury AB, 0.88%, 6/03/16 Sweden (USD) (1%) 350,000 Kommuninvest I Sverige AB 144A, 0.88%, 12/13/16 (b) 620,000 Kommuninvest I Sverige AB 144A, 1.13%, 10/09/18 (b) 200 342 399 2,636 298 257 351 523 Netherlands (USD) (3%) 1,000,000 Bank Nederlandse Gemeenten 144A, 0.88%, 2/21/17 (b) 450,000 EDP Finance BV 144A, 6.00%, 2/02/18 (b) 700,000 MDC-GMTN BV 144A, 3.75%, 4/20/16 (b) 700,000 Nederlandse Waterschapsbank NV 144A, 1.25%, 9/18/17 (b) 610,000 Siemens Financieringsmaatschappij NV 144A, 1.45%, 5/25/18 (b) Norway (USD) (1%) 500,000 Kommunalbanken AS 144A, 0.88%, 10/03/16 (b) 200,000 Sparebank 1 Boligkreditt AS 144A, 2.63%, 5/27/16 (b) $ 1,001 479 710 703 609 3,502 310 400 401 1,111 501 202 703 70 126 300 641 505 351 616 967 Annual Report 53 . Payden Global Low Duration Fund continued Principal or Shares Value (000) Security Description Switzerland (USD) (1%) 780,000 Credit Suisse/New York NY, 1.38%, 5/26/17 300,000 Credit Suisse/New York NY, 1.75%, 1/29/18 500,000 UBS AG/Stamford CT, 1.80%, 3/26/18 United Kingdom (EUR) (0%) 370,000 Yorkshire Building Society, 2.13%, 3/18/19 United Kingdom (GBP) (1%) 220,000 Prudential PLC, 1.25%, 11/16/15 250,000 United Utilities Water PLC, 6.13%, 12/29/15 United Kingdom (USD) (4%) 550,000 Abbey National Treasury Services PLC, 1.65%, 9/29/17 200,000 Anglo American Capital PLC 144A, 1.27%, 4/15/16 (b) 800,000 Bank of England Euro Note 144A, 1.25%, 3/16/18 (b) 170,000 BAT International Finance PLC 144A, 0.85%, 6/15/18 (b) 220,000 BAT International Finance PLC 144A, 1.85%, 6/15/18 (b) 440,000 BP Capital Markets PLC, 1.67%, 2/13/18 750,000 Granite Master Issuer PLC, 1.06%, 12/17/54 390,000 HSBC Bank PLC 144A, 0.96%, 5/15/18 (b) 250,000 Imperial Tobacco Finance PLC 144A, 2.05%, 7/20/18 (b) 400,000 Nationwide Building Society 144A, 2.35%, 1/21/20 (b) 700,000 Standard Chartered PLC 144A, 1.50%, 9/08/17 (b) United States (EUR) (1%) 500,000 Bank of America Corp., 0.80%, 3/28/18 350,000 Citigroup Inc., 1.24%, 11/30/17 225,000 Parker Hannifin Corp., 4.13%, 11/11/15 United States (GBP) (1%) 450,000 JPMorgan Chase & Co., 1.07%, 5/30/17 United States (USD) (59%) 380,000 AbbVie Inc., 1.80%, 5/14/18 420,000 AES Corp./VA, 3.32%, 6/01/19 600,000 Air Lease Corp., 4.50%, 1/15/16 175,000 Alliance Data Systems Corp. 144A, 5.25%, 12/01/17 (b) 420,000 Ally Financial Inc., 3.25%, 9/29/17 263,573 American Homes 4 Rent 2014-SFR1 144A, 1.25%, 6/17/31 (b) 315,000 AmeriGas Partners LP / AmeriGas Finance Corp., 6.25%, 8/20/19 460,000 Anthem Inc., 2.38%, 2/15/17 160,000 Aramark Services Inc, 5.75%, 3/15/20 160,000 Astoria Financial Corp., 5.00%, 6/19/17 80,000 AT&T Inc., 5.50%, 2/01/18 110,000 Autodesk Inc., 1.95%, 12/15/17 265,000 Avis Budget Car Rental LLC / Avis Budget Finance Inc., 4.88%, 11/15/17 54 Payden Mutual Funds $ Principal or Shares 780 301 501 1,582 423 200,000 450,000 310,000 100,000 70,000 167,599 339 389 728 90,000 660,000 125,000 250,000 552 150,000 90,000 199 90,000 805 195,000 370,000 350,000 90,000 170 221 442 740 389 250 401 696 4,865 546 385 247 1,178 130,000 150,000 720,000 980,000 400,000 725,000 220,000 142,000 280,270 492,576 250,000 210,000 338,722 685 381 401 604 240,000 350,000 181 424 300,000 230,000 200,000 414,164 258 208,343 323 466 167 167 87 111 959,535 272 415,643 402,237 Value (000) Security Description Bank of America Corp., 0.88%, 5/02/17 Bank of America Corp., 1.36%, 1/15/19 Bank of America Corp., 1.70%, 8/25/17 Bank of America Corp., 3.75%, 7/12/16 Bank of America Corp., 3.88%, 3/22/17 Bank of America Mortgage 2002-K Trust, 2.71%, 10/20/32 Baxalta Inc. 144A, 2.00%, 6/22/18 (b) Becton Dickinson and Co., 1.45%, 5/15/17 Boardwalk Pipelines LP, 5.88%, 11/15/16 California Earthquake Authority, 1.82%, 7/01/17 Cameron International Corp., 1.40%, 6/15/17 Capital Auto Receivables Asset Trust 2013-1, 1.29%, 4/20/18 Capital Auto Receivables Asset Trust 2013-1, 1.74%, 10/22/18 Capital One Financial Corp., 6.15%, 9/01/16 Capital One NA/Mclean VA, 1.50%, 9/05/17 Capital One NA/Mclean VA, 1.65%, 2/05/18 CC Holdings GS V LLC / Crown Castle GS III Corp., 2.38%, 12/15/17 Celgene Corp., 2.13%, 8/15/18 CIT Group Inc., 5.25%, 3/15/18 Citigroup Inc., 1.55%, 8/14/17 Citigroup Inc., 1.80%, 2/05/18 Citizens Bank NA/Providence RI, 1.60%, 12/04/17 CNH Capital LLC, 3.25%, 2/01/17 CNH Capital LLC, 3.88%, 11/01/15 Coca-Cola Co., 0.88%, 10/27/17 Colony American Homes 2014-1 144A, 1.40%, 5/17/31 (b) Colony American Homes 2014-2 144A, 1.15%, 7/17/31 (b) Compass Bank, 1.85%, 9/29/17 ConocoPhillips Co., 1.50%, 5/15/18 Credit Suisse Mortgage Capital Certificates 144A, 1.55%, 4/25/43 (b) CVS Health Corp., 1.90%, 7/20/18 Daimler Finance North America LLC 144A, 1.65%, 3/02/18 (b) Discover Bank/Greenwood DE, 2.60%, 11/13/18 DISH DBS Corp., 4.63%, 7/15/17 Express Scripts Holding Co., 1.25%, 6/02/17 Fannie Mae Connecticut Avenue Securities, 1.15%, 5/25/24 Fannie Mae Connecticut Avenue Securities, 1.15%, 5/25/24 Fannie Mae Connecticut Avenue Securities, 1.39%, 7/25/24 Fannie Mae Connecticut Avenue Securities, 1.80%, 1/25/24 Fannie Mae Connecticut Avenue Securities, 2.20%, 10/25/23 $ 198 452 311 102 72 170 90 660 129 252 149 90 90 203 368 348 91 131 158 720 979 397 730 220 142 275 481 249 210 320 242 348 302 237 199 410 207 958 417 406 . Principal or Shares 745,403 339,889 256,411 75,000 110,000 125,000 300,000 200,000 256,166 249,972 249,885 100,000 300,000 600,000 320,000 650,000 39,000 410,000 210,000 165,132 380,000 390,000 180,000 490,000 460,000 532,151 450,000 250,000 370,000 190,000 100,000 100,000 140,000 250,000 Value (000) Security Description FDIC Structured Sale Guaranteed Notes 144A, 0.91%, 12/04/20 (b) FDIC Structured Sale Guaranteed Notes 144A, 3.25%, 4/25/38 (b) FDIC Trust 144A, 2.18%, 5/25/50 (b) Fidelity National Information Services Inc., 1.45%, 6/05/17 Fidelity National Information Services Inc., 2.00%, 4/15/18 Fifth Third Bancorp, 5.45%, 1/15/17 Ford Motor Credit Co. LLC, 2.15%, 1/09/18 Ford Motor Credit Co. LLC, 3.00%, 6/12/17 Freddie Mac Structured Agency Credit Risk Debt Notes, 1.65%, 11/25/23 Freddie Mac Structured Agency Credit Risk Debt Notes, 8.15%, 5/25/25 Freddie Mac Structured Agency Credit Risk Debt Notes, 10.95%, 3/25/25 Freeport-McMoRan Inc., 2.15%, 3/01/17 GATX Corp., 2.50%, 7/30/19 General Motors Financial Co. Inc., 2.40%, 4/10/18 General Motors Financial Co.
Inc., 3.00%, 9/25/17 Glencore Funding LLC 144A, 1.68%, 1/15/19 (b) Glencore Funding LLC 144A, 2.13%, 4/16/18 (b) Goldman Sachs Group Inc., 1.52%, 4/30/18 Goldman Sachs Group Inc., 3.63%, 2/07/16 GSAMP Trust 2004-SEA2, 0.85%, 3/25/34 Harley-Davidson Financial Services Inc. 144A, 2.15%, 2/26/20 (b) Hertz Corp., 6.75%, 4/15/19 Hess Corp., 1.30%, 6/15/17 Hewlett Packard Enterprise Co. 144A, 2.45%, 10/05/17 (b) Hewlett Packard Enterprise Co.
144A, 2.85%, 10/05/18 (b) Hilton USA Trust 2013-HLF 144A, 1.19%, 11/05/30 (b) HSBC USA Inc., 1.70%, 3/05/18 Huntington National Bank, 1.38%, 4/24/17 Hyundai Capital America 144A, 1.45%, 2/06/17 (b) Hyundai Capital America 144A, 2.00%, 3/19/18 (b) Hyundai Capital America 144A, 2.13%, 10/02/17 (b) Hyundai Capital America 144A, 3.75%, 4/06/16 (b) IAC/InterActiveCorp 144A, 4.88%, 11/30/18 (b) Icahn Enterprises LP / Icahn Enterprises Finance Corp., 3.50%, 3/15/17 Principal or Shares 380,000 $ 748 410,000 351 258 348,653 74 1,300,000 108 130 300 203 840,000 280,000 500,000 256 252 294 97 299 200,000 570,000 100,000 110,000 370,000 320,000 564,589 595 118,698 324 521 34 414 212 165 376 401 178 492 461 370,000 190,000 600,000 50,771 100,000 370,000 300,000 650,000 400,000 250,000 100,000 500,000 200,000 340,000 528 450 249 110,000 110,000 369 400,000 189 200,000 760,000 270,000 275,673 100 101 144 254 200,000 220,000 300,000 100,000 185,014 221,124 Value (000) Security Description International Lease Finance Corp., 2.29%, 6/15/16 International Lease Finance Corp., 3.88%, 4/15/18 Invitation Homes 2013-SFR1 Trust 144A, 1.40%, 12/17/30 (b) Invitation Homes 2014-SFR1 Trust 144A, 1.20%, 6/17/31 (b) Invitation Homes 2014-SFR2 Trust 144A, 1.30%, 9/17/31 (b) JB Hunt Transport Services Inc., 2.40%, 3/15/19 JP Morgan Chase Commercial Mortgage Securities Trust 2015-COSMO 144A, 1.45%, 1/15/32 (b) JPMorgan Chase & Co., 1.22%, 1/25/18 JPMorgan Chase & Co., 1.35%, 2/15/17 Kinder Morgan Inc./DE, 2.00%, 12/01/17 Kinder Morgan Inc./DE, 3.05%, 12/01/19 Kraft Heinz Foods Co. 144A, 1.60%, 6/30/17 (b) Kraft Heinz Foods Co. 144A, 2.00%, 7/02/18 (b) Kubota Credit Owner Trust 2015-1 144A, 0.94%, 12/15/17 (b) L.A.
Arena Funding LLC 144A, 7.66%, 12/15/26 (b) L-3 Communications Corp., 1.50%, 5/28/17 Liberty Property LP, 6.63%, 10/01/17 Martin Marietta Materials Inc., 1.43%, 6/30/17 MASTR Asset Securitization Trust 2004-6, 5.00%, 7/25/19 McGraw Hill Financial Inc. 144A, 3.30%, 8/14/20 (b) Mobile Mini Inc., 7.88%, 12/01/20 Morgan Stanley, 1.06%, 7/23/19 Morgan Stanley, 1.46%, 1/27/20 Morgan Stanley, 5.45%, 1/09/17 Morgan Stanley, 6.63%, 4/01/18 Murphy Oil Corp., 2.50%, 12/01/17 Nabors Industries Inc., 2.35%, 9/15/16 National Oilwell Varco Inc., 1.35%, 12/01/17 New York Life Global Funding 144A, 1.55%, 11/02/18 (b) Newell Rubbermaid Inc., 2.15%, 10/15/18 Penske Truck Leasing Co. LP / PTL Finance Corp.
144A, 2.50%, 6/15/19 (b) Penske Truck Leasing Co. LP / PTL Finance Corp. 144A, 3.20%, 7/15/20 (b) Prudential Financial Inc., 1.10%, 8/15/18 QUALCOMM Inc., 1.40%, 5/18/18 Regions Financial Corp., 2.00%, 5/15/18 Residential Asset Securitization Trust 2006-A8, 6.00%, 8/25/36 Reynolds American Inc., 3.25%, 6/12/20 Sabine Pass LNG LP, 7.50%, 11/30/16 Santander Bank NA, 2.00%, 1/12/18 SBA Communications Corp., 5.63%, 10/01/19 Sequoia Mortgage Trust, 1.45%, 2/25/43 Sequoia Mortgage Trust, 1.55%, 4/25/43 $ 380 417 344 1,273 825 282 498 201 571 98 107 370 321 565 130 365 207 596 51 102 387 297 653 419 278 98 498 198 339 110 109 402 201 757 270 229 205 228 299 105 180 215 Annual Report 55 .
Payden Global Low Duration Fund continued Principal or Shares 77,871 650,000 185,318 290,845 465,000 120,000 170,000 220,000 505,000 235,000 150,000 290,000 360,000 390,000 7,005,000 500,000 7,035,000 800,000 4,410,000 2,850,000 5,700,000 150,000 180,000 120,000 390,000 250,000 560,000 265,726 135,867 444,811 240,000 390,000 120,000 230,000 280,000 100,000 Value (000) Security Description Sequoia Mortgage Trust, 3.50%, 4/25/42 Southern California Edison Co., 1.85%, 2/01/22 Springleaf Mortgage Loan Trust 144A, 1.27%, 6/25/58 (b) Springleaf Mortgage Loan Trust 144A, 1.78%, 12/25/65 (b) SunTrust Bank/Atlanta GA, 5.20%, 1/17/17 Synchrony Financial, 1.56%, 2/03/20 Synchrony Financial, 1.88%, 8/15/17 Synchrony Financial, 3.00%, 8/15/19 Talen Energy Supply LLC 144A, 4.63%, 7/15/19 (b) Tenet Healthcare Corp., 6.25%, 11/01/18 Thermo Fisher Scientific Inc., 1.30%, 2/01/17 TIAA Asset Management Finance Co. LLC 144A, 2.95%, 11/01/19 (b) T-Mobile USA Inc. 144A, 5.25%, 9/01/18 (b) Toyota Motor Credit Corp., 1.55%, 7/13/18 U.S. Treasury Note, 0.50%, 1/31/17 (c)(d) U.S.
Treasury Note, 0.63%, 7/31/17 U.S. Treasury Note, 0.63%, 9/30/17 U.S. Treasury Note, 0.88%, 11/15/17 U.S.
Treasury Note, 1.00%, 2/15/18 U.S. Treasury Note, 1.00%, 8/15/18 U.S. Treasury Note, 1.00%, 9/15/18 UnitedHealth Group Inc., 1.45%, 7/17/17 UnitedHealth Group Inc., 1.90%, 7/16/18 Ventas Realty LP, 1.25%, 4/17/17 Verizon Communications Inc., 1.35%, 6/09/17 Verizon Communications Inc., 2.09%, 9/14/18 Volkswagen Group of America Finance LLC 144A, 1.25%, 5/23/17 (b) VOLT XXII LLC 144A, 3.50%, 2/25/55 (b) VOLT XXV LLC 144A, 3.50%, 6/26/45 (b) VOLT XXXIII LLC 144A, 3.50%, 3/25/55 (b) WEA Finance LLC / Westfield UK & Europe Finance PLC 144A, 1.75%, 9/15/17 (b) Windstream Corp., 7.88%, 11/01/17 WM Wrigley Jr.
Co. 144A, 2.00%, 10/20/17 (b) WPX Energy Inc., 5.25%, 1/15/17 Zimmer Holdings Inc., 2.00%, 4/01/18 Zimmer Holdings Inc., 2.70%, 4/01/20 Virgin Islands (British) (USD) (1%) 200,000 CNOOC Finance 2013 Ltd., 1.13%, 5/09/16 300,000 CNPC General Capital Ltd. 144A, 1.21%, 5/14/17 (b) 200,000 TSMC Global Ltd.
144A, 1.63%, 4/03/18 (b) 210,000 Want Want China Finance Ltd. 144A, 1.88%, 5/14/18 (b) Total Bonds (Cost - $125,943) Purchased Put Options (0%) 447 Eurodollar 1-Year Mid-Curve Option, 97.5, 3/11/16 352 Eurodollar 1-Year Mid-Curve Option, 97.875, 12/11/15 Total Purchased Put Options (Cost - $144) 56 Payden Mutual Funds $ Principal or Shares 79 646 186 292 485 119 170 222 464 251 150 294 369 392 7,003 500 7,020 801 4,423 2,850 5,696 151 182 120 391 257 546 264 135 442 Investment Company (1%) 1,958,844 Payden Cash Reserves Money Market Fund * (Cost - $1,959) Total (Cost - $130,313) (99%) Other Assets, net of Liabilities (1%) Net Assets (100%) 200 299 197 207 903 124,553 3 2 5 $ $ 1,959 128,764 1,580 130,344 * Affiliated investment (a) Variable rate security. The rate shown reflects the rate in effect at October 31, 2015.
The stated maturity is subject to prepayments. See Note 2 in the Notes to Financial Statements. (b) Security offered only to qualified institutional investors, and thus is not registered for sale to the public under rule 144A of the Securities Act of 1933. It has been deemed liquid under guidelines approved by the Board. (c) All or a portion of security has been pledged in connection with outstanding centrally cleared swaps. (d) All or a portion of the security is pledged to cover futures contract margin requirements. Open Forward Currency Contracts to USD Delivery Date Assets: 12/15/2015 11/9/2015 11/9/2015 Unrealized Appreciation (Depreciation) (000s) Currency (000s) Counterparty Euro (Sell 1,051) Euro (Sell 2,488) Swedish Krona (Sell 4,326) BNP PARIBAS Citibank, N.A. BNP PARIBAS $ 46 45 12 $103 Liabilities: 11/9/2015 11/9/2015 12/15/2015 239 415 121 232 280 100 76,749 Value (000) Security Description British Pound (Sell 1,406) Canadian Dollar (Sell 2,186) Euro (Buy 1,051) HSBC Bank USA, N.A. Royal Bank of Canada BNP PARIBAS $ (39) (4) (7) $ (50) Open Futures Contracts Number of Contracts 38 18 36 Contract Type U.S. Treasury 10 Year Note Future U.S.
Treasury 2 Year Note Future U.S. Treasury 5 Year Note Future Expiration Date Dec-15 Current Value (000) $ 4,852 Unrealized Appreciation (Depreciation) (000s) $(37) Jan-16 3,936 (3) Jan-16 (4,312) 4 $(36) . Open Centrally Cleared Credit Default Swap Contracts Reference Obligations CDX.NA.IG.25 Notional Fund Expiration Principal Pays Clearinghouse Date (000s) 1.00% Chicago Mercantile Dec-20 USD 2,250 Value (000s) $(26) See notes to financial statements. Annual Report 57 . Payden Global Fixed Income Fund $20,000 The Fund seeks a high level of total return that is consistent with preservation of capital by generally investing in investment grade debt securities denominated in U.S. and foreign currencies with an average portfolio maturity not to exceed ten years. Five Year 3.63% Ten Year 4.18% Fund $15,067 Barclays Capital Global Aggregate Index Hedged $15,564 $16,000 $14,000 Portfolio Composition - percent of value Foreign Government Corporate Investment Company U.S. Treasury Mortgage Backed One Year 2.27% $18,000 38% 37% 15% 9% 1% $12,000 $10,000 $8,000 10/31/05 10/10 10/31/15 Past performance does not predict future returns. The graph does not reflect the impact of taxes or transaction costs a shareholder would pay. This information is not part of the audited financial statements. Schedule of Investments - October 31, 2015 Principal or Shares Security Description Bonds (86%) Australia (AUD) (1%) 450,000 Australia Government Bond, 1.75%, 11/21/20 500,000 Australia Government Bond, 3.25%, 4/21/25 Australia (USD) (2%) 250,000 Australia & New Zealand Banking Group Ltd. 144A, 4.50%, 3/19/24 (a) 250,000 Macquarie Bank Ltd.
144A, 6.63%, 4/07/21 (a) 260,000 Macquarie Group Ltd. 144A, 1.33%, 1/31/17 (a) 200,000 Suncorp-Metway Ltd. 144A, 2.35%, 4/27/20 (a) 400,000 Sydney Airport Finance Co.
Pty Ltd. 144A, 3.38%, 4/30/25 (a) 180,000 Sydney Airport Finance Co. Pty Ltd.
144A, 3.90%, 3/22/23 (a) Austria (EUR) (0%) 120,000 Austria Government Bond 144A, 1.65%, 10/21/24 (a) 50,000 Austria Government Bond 144A, 3.15%, 6/20/44 (a) Belgium (EUR) (1%) 100,000 Belgium Government Bond 144A, 0.80%, 6/22/25 (a) 150,000 Belgium Government Bond 144A, 1.00%, 6/22/31 (a) 250,000 Belgium Government Bond, 3.00%, 9/28/19 Bermuda (EUR) (0%) 150,000 Fidelity International Ltd., 6.88%, 2/24/17 Brazil (USD) (0%) 270,000 Brazilian Government International Bond, 4.88%, 1/22/21 Canada (CAD) (2%) 1,000,000 Canadian Government Bond, 3.75%, 6/01/19 58 Payden Mutual Funds Value (000) $ Principal or Shares 316 376 692 252 283 260 198 383 181 1,557 144 76 220 110 156 308 574 300,000 100,000 Canadian Government Bond, 5.00%, 6/01/37 Canadian Government Bond, 5.75%, 6/01/29 Canada (USD) (1%) 550,000 Magna International Inc., 4.15%, 10/01/25 Chile (USD) (0%) 300,000 Latam Airlines 2015-1 Pass Through Trust A 144A, 4.20%, 11/15/27 (a) Denmark (EUR) (1%) 200,000 Carlsberg Breweries A/S, 2.63%, 11/15/22 235,000 Danske Bank A/S, 3.88%, 10/04/23 Dominica Republic (USD) (0%) 200,000 Dominican Republic International Bond 144A, 5.50%, 1/27/25 (a) Finland (EUR) (0%) 70,000 Finland Government Bond 144A, 2.75%, 7/04/28 (a)(b) France (CAD) (0%) 330,000 Cie de Financement Foncier SA, 4.55%, 4/28/17 France (EUR) (3%) 200,000 BPCE SA, 2.75%, 7/08/26 1,600,000 France Government Bond OAT, 1.75%, 5/25/23 120,000 France Government Bond OAT, 3.25%, 5/25/45 France (GBP) (1%) 100,000 AXA SA, 5.63%, 1/16/54 100,000 Cie de St-Gobain, 4.63%, 10/09/29 178 266 848 Value (000) Security Description France (USD) (1%) 320,000 Banque Federative du Credit Mutuel SA 144A, 2.75%, 10/15/20 (a) Germany (EUR) (3%) 500,000 Bundesrepublik Deutschland, 2.50%, 1/04/21 $ 335 111 1,294 561 286 235 276 511 198 93 264 223 1,928 177 2,328 151 165 316 320 623 . Principal or Shares 100,000 350,000 350,000 Value (000) Security Description Bundesrepublik Deutschland, 3.25%, 7/04/42 Bundesrepublik Deutschland, 4.75%, 7/04/34 Bundesrepublik Deutschland, 4.75%, 7/04/40 Germany (USD) (1%) 710,000 Deutsche Bank AG, 2.95%, 8/20/20 Indonesia (USD) (0%) 200,000 Indonesia Government International Bond 144A, 4.13%, 1/15/25 (a) Ireland (EUR) (1%) 190,000 Aquarius and Investments PLC for Zurich Insurance Co. Ltd., 4.25%, 10/02/43 50,000 GE Capital European Funding, 2.25%, 7/20/20 100,000 Ireland Government Bond, 3.40%, 3/18/24 Ireland (GBP) (0%) 130,000 GE Capital UK Funding, 4.38%, 7/31/19 Ireland (USD) (0%) 250,000 Perrigo Finance PLC, 3.50%, 12/15/21 Italy (EUR) (3%) 850,000 Italy Buoni Poliennali Del Tesoro, 4.50%, 8/01/18 700,000 Italy Buoni Poliennali Del Tesoro, 4.50%, 5/01/23 220,000 Italy Buoni Poliennali Del Tesoro, 5.00%, 8/01/39 Jamaica (USD) (0%) 200,000 Jamaica Government International Bond, 6.75%, 4/28/28 Japan (GBP) (0%) 120,000 Sumitomo Mitsui Banking Corp., 1.14%, 3/18/16 Japan (JPY) (18%) 200,000,000 Japan Government Five Year Bond, 0.10%, 6/20/19 180,000,000 Japan Government Five Year Bond, 0.10%, 9/20/19 325,000,000 Japan Government Ten Year Bond, 0.80%, 9/20/23 160,000,000 Japan Government Ten Year Bond, 1.20%, 6/20/21 95,500,000 Japan Government Thirty Year Bond, 2.00%, 9/20/40 125,000,000 Japan Government Thirty Year Bond, 2.20%, 9/20/39 120,000,000 Japan Government Twenty Year Bond, 1.00%, 3/20/23 50,000,000 Japan Government Twenty Year Bond, 1.70%, 9/20/33 400,000,000 Japan Government Two Year Bond, 0.10%, 10/15/17 Japan (USD) (0%) 200,000 Mitsubishi UFJ Trust & Banking Corp. 144A, 1.60%, 10/16/17 (a) $ 162 628 680 2,093 713 196 229 59 132 420 216 245 1,046 952 353 2,351 204 185 1,663 1,496 Principal or Shares Security Description Kenya (USD) (0%) 200,000 Kenya Government International Bond 144A, 5.88%, 6/24/19 (a) Luxembourg (EUR) (0%) 100,000 KBC Internationale Financieringsmaatschappij NV, 2.13%, 9/10/18 130,000 Prologis International Funding II SA, 2.88%, 4/04/22 Luxembourg (USD) (0%) 100,000 Actavis Funding SCS, 3.80%, 3/15/25 Mexico (MXN) (1%) 5,500,000 Mexican Bonos, 6.50%, 6/10/21 Mexico (USD) (0%) 295,000 Petroleos Mexicanos, 3.50%, 1/30/23 Morocco (USD) (0%) 200,000 Morocco Government International Bond 144A, 4.25%, 12/11/22 (a) Netherlands (EUR) (1%) 200,000 Achmea Bank NV, 1.13%, 4/25/22 680,000 Netherlands Government Bond 144A, 2.25%, 7/15/22 (a) Netherlands (USD) (1%) 260,000 Cooperatieve Centrale Raiffeisen-Boerenleenbank BA/Netherlands, 4.63%, 12/01/23 200,000 EDP Finance BV 144A, 6.00%, 2/02/18 (a) 380,000 ING Bank NV 144A, 2.05%, 8/17/18 (a) Panama (USD) (0%) 200,000 Panama Government International Bond, 3.75%, 3/16/25 Poland (PLN) (0%) 500,000 Poland Government Bond, 5.25%, 10/25/20 Spain (EUR) (2%) 180,000 Spain Government Bond, 2.75%, 4/30/19 140,000 Spain Government Bond 144A, 4.20%, 1/31/37 (a) 500,000 Spain Government Bond 144A, 5.85%, 1/31/22 (a) 2,831 1,411 917 1,244 1,060 468 3,321 14,411 Sweden (EUR) (0%) 200,000 SBAB Bank AB, 2.38%, 9/04/20 Switzerland (USD) (1%) 625,000 UBS Group Funding Jersey Ltd. 144A, 2.95%, 9/24/20 (a) United Kingdom (EUR) (1%) 200,000 Aviva PLC, 3.88%, 7/03/44 230,000 Leeds Building Society, 1.38%, 5/05/22 200,000 Yorkshire Building Society, 1.25%, 3/17/22 United Kingdom (GBP) (5%) 110,000 Aviva PLC, 6.13%, 11/14/36 75,000 Barclays Bank PLC, 6.75%, 1/16/23 120,000 BUPA Finance PLC, 5.00%, 4/25/23 Value (000) $ 195 115 152 267 99 352 275 202 214 848 1,062 272 213 382 867 198 149 214 195 711 1,120 234 626 224 248 216 688 178 124 189 199 Annual Report 59 .
Payden Global Fixed Income Fund continued Principal or Shares 110,000 100,000 150,000 150,000 150,000 260,000 50,000 200,000 300,000 150,000 150,000 Value (000) Security Description HSBC Bank PLC, 5.38%, 11/04/30 InterContinental Hotels Group PLC, 6.00%, 12/09/16 Nationwide Building Society, 2.25%, 4/29/22 Society of Lloyd’s, 4.75%, 10/30/24 United Kingdom Gilt, 2.25%, 9/07/23 United Kingdom Gilt, 4.25%, 12/07/55 United Kingdom Gilt, 4.25%, 12/07/55 United Kingdom Gilt, 4.75%, 3/07/20 United Kingdom Gilt, 4.75%, 12/07/38 United Kingdom Gilt, 5.00%, 3/07/25 Virgin Money PLC, 2.25%, 4/21/20 United Kingdom (USD) (2%) 350,000 Barclays PLC, 2.88%, 6/08/20 950,000 Imperial Tobacco Finance PLC 144A, 2.95%, 7/21/20 (a) 300,000 Lloyds Bank PLC, 1.75%, 5/14/18 100,000 Nationwide Building Society 144A, 6.25%, 2/25/20 (a) United States (EUR) (2%) 660,000 Apple Inc., 1.38%, 1/17/24 350,000 Eli Lilly & Co., 1.63%, 6/02/26 100,000 Morgan Stanley, 5.38%, 8/10/20 United States (GBP) (0%) 110,000 Textron Inc., 6.63%, 4/07/20 United States (USD) (31%) 225,000 21st Century Fox America Inc., 4.50%, 2/15/21 140,000 AbbVie Inc., 2.50%, 5/14/20 140,000 AbbVie Inc., 3.20%, 11/06/22 150,000 Air Lease Corp., 4.25%, 9/15/24 160,000 Airgas Inc., 3.05%, 8/01/20 300,000 Amazon.com Inc., 2.50%, 11/29/22 300,000 Amgen Inc., 2.70%, 5/01/22 300,000 Amgen Inc., 3.63%, 5/15/22 450,000 AT&T Inc., 3.00%, 6/30/22 120,000 Bank of America Corp., 4.00%, 4/01/24 130,000 Bank of America Corp., 6.88%, 4/25/18 155,000 Baxalta Inc. 144A, 3.60%, 6/23/22 (a) 210,000 Bear Stearns Companies LLC, 5.55%, 1/22/17 100,000 BioMed Realty LP, 3.85%, 4/15/16 515,000 Block Financial LLC, 4.13%, 10/01/20 140,000 Blue Cross & Blue Shield of Minnesota 144A, 3.79%, 5/01/25 (a) 135,000 Boston Scientific Corp., 2.85%, 5/15/20 300,000 Capital One Financial Corp., 4.75%, 7/15/21 300,000 Celgene Corp., 3.25%, 8/15/22 30,000 Celgene Corp., 3.55%, 8/15/22 600,000 Citigroup Inc., 4.45%, 9/29/27 95,000 Continental Resources Inc./OK, 5.00%, 9/15/22 460,000 CVS Health Corp., 2.80%, 7/20/20 90,000 Dignity Health, 3.13%, 11/01/22 300,000 Discover Bank/Greenwood DE, 3.10%, 6/04/20 152,000 Dow Chemical Co., 9.40%, 5/15/39 250,000 Exelon Generation Co. LLC, 2.95%, 1/15/20 60 Payden Mutual Funds $ Principal or Shares 181 200,000 161 226 234 240 577 111 356 639 295 226 3,737 420,000 200,000 160,000 110,000 50,000 300,000 351 200,000 335,000 280,000 956 301 300,000 44,162 950,000 16,983 116 1,724 736 387 132 1,255 191 244 139 139 148 162 293 295 308 442 124 145 157 220 101 524 139 135 329 300 31 601 86 468 90 304 223 251 320,000 110,000 450,000 250,000 260,000 450,000 75,000 145,000 115,000 45,000 55,000 200,000 300,000 100,000 170,000 50,000 150,000 130,000 75,000 63,000 200,000 160,000 110,000 152,000 125,000 300,000 110,000 105,000 150,000 110,000 Value (000) Security Description Fifth Third Bank/Cincinnati OH, 2.15%, 8/20/18 FNMA 30YR TBA, 4.50% (c) Ford Motor Credit Co. LLC, 2.24%, 6/15/18 Ford Motor Credit Co.
LLC, 6.63%, 8/15/17 FS Investment Corp., 4.25%, 1/15/20 General Electric Capital Corp., 5.88%, 1/14/38 General Motors Financial Co. Inc., 3.20%, 7/13/20 Goldman Sachs Group Inc., 2.55%, 10/23/19 GreenPoint Mortgage Funding Trust, 0.76%, 6/25/45 Hewlett Packard Enterprise Co. 144A, 4.40%, 10/15/22 (a) Hospitality Properties Trust, 4.50%, 3/15/25 HSBC USA Inc., 2.00%, 8/07/18 Hyundai Capital America 144A, 2.60%, 3/19/20 (a) Indymac Index Mortgage Loan Trust, 2.77%, 10/25/34 JPMorgan Chase & Co., 3.20%, 1/25/23 JPMorgan Chase & Co., 4.35%, 8/15/21 KeyCorp, 2.90%, 9/15/20 Kinder Morgan Inc./DE, 4.30%, 6/01/25 KKR Group Finance Co.
II LLC 144A, 5.50%, 2/01/43 (a) Kraft Heinz Foods Co. 144A, 2.80%, 7/02/20 (a) Lam Research Corp., 3.80%, 3/15/25 McKesson Corp., 3.80%, 3/15/24 MDC Holdings Inc., 6.00%, 1/15/43 MetLife Inc., 6.40%, 12/15/36 MetLife Inc., 10.75%, 8/01/39 Metropolitan Edison Co. 144A, 3.50%, 3/15/23 (a) Morgan Stanley, 3.88%, 4/29/24 Murphy Oil Corp., 2.50%, 12/01/17 Nationwide Mutual Insurance Co.
144A, 9.38%, 8/15/39 (a) NBCUniversal Media LLC, 6.40%, 4/30/40 Old Republic International Corp., 4.88%, 10/01/24 Oracle Corp., 2.50%, 5/15/22 Owens Corning, 4.20%, 12/15/22 Pacific Life Insurance Co. 144A, 9.25%, 6/15/39 (a) Penske Truck Leasing Co. LP / PTL Finance Corp.
144A, 3.20%, 7/15/20 (a) Penske Truck Leasing Co. LP / PTL Finance Corp. 144A, 3.38%, 2/01/22 (a) Prudential Financial Inc., 5.63%, 6/15/43 Prudential Financial Inc., 7.38%, 6/15/19 Quest Diagnostics Inc., 3.50%, 3/30/25 Ryder System Inc., 2.50%, 5/11/20 Santander Holdings USA Inc./PA, 2.65%, 4/17/20 Select Income REIT, 4.50%, 2/01/25 Sempra Energy, 9.80%, 2/15/19 State Street Corp., 4.96%, 3/15/18 $ 202 455 199 172 111 62 298 302 24 959 195 336 276 17 319 118 454 227 270 452 70 148 94 49 87 197 309 98 259 64 156 129 76 93 201 156 115 179 121 296 109 100 184 117 .
Principal or Shares 200,000 175,000 450,000 280,000 1,250,000 100,000 226,000 1,850,000 350,000 1,450,000 450,000 1,000,000 300,000 210,000 170,000 80,000 300,000 215,000 Synchrony Financial, 4.25%, 8/15/24 TIAA Asset Management Finance Co. LLC 144A, 2.95%, 11/01/19 (a) U.S. Treasury Bill, 0.00%, 11/05/15 (d) U.S. Treasury Bond, 4.38%, 2/15/38 U.S.
Treasury Note, 0.38%, 1/15/16 (e) U.S. Treasury Note, 0.75%, 3/31/18 U.S. Treasury Note, 0.88%, 1/31/17 (e) U.S.
Treasury Note, 0.88%, 2/28/17 U.S. Treasury Note, 1.25%, 4/30/19 U.S. Treasury Note, 1.50%, 5/31/20 U.S.
Treasury Note, 2.00%, 8/15/25 U.S. Treasury Note, 3.00%, 5/15/42 UnitedHealth Group Inc., 1.90%, 7/16/18 Vereit Operating Partnership LP, 3.00%, 2/06/19 Verizon Communications Inc., 6.40%, 2/15/38 Wachovia Corp., 5.50%, 8/01/35 Wells Fargo & Co., 4.48%, 1/16/24 Welltower, Inc., 4.95%, 1/15/21 $ 201 177 450 358 1,251 100 227 1,858 350 1,453 444 1,020 304 204 199 90 317 233 24,489 Uruguay (USD) (0%) 160,000 Uruguay Government International Bond, 4.38%, 10/27/27 110,000 Uruguay Government International Bond, 4.50%, 8/14/24 Total Bonds (Cost - $69,696) Investment Company (15%) 2,815,027 Payden Cash Reserves Money Market Fund * 316,916 Payden Emerging Markets Bond Fund, SI Class * 99,500 Payden Floating Rate Fund, SI Class * 651,672 Payden High Income Fund, Investor Class * Total Investment Company (Cost - $13,232) Total (Cost - $82,928) (101%) Liabilities in excess of Other Assets (-1%) Net Assets (100%) Open Forward Currency Contracts to USD Value (000) Security Description Delivery Date Assets: 2/1/2016 12/15/2015 12/1/2015 12/1/2015 Credit Suisse First Boston International Citibank, N.A. British Pound (Buy 1,556) British Pound (Sell 293) 11/9/2015 Euro (Sell 5,670) 11/9/2015 Japanese Yen (Sell 1,785,600) Poland Zloty (Sell 587) Swiss Franc (Sell 215) 11/27/2015 11/9/2015 Liabilities: 11/9/2015 12/1/2015 * Affiliated investment (a) Security offered only to qualified institutional investors, and thus is not registered for sale to the public under rule 144A of the Securities Act of 1933. It has been deemed liquid under guidelines approved by the Board. (b) Security offered and sold outside the United States, and thus is exempt from registration under Regulation S of the Securities Act of 1933. It has been deemed liquid under guidelines approved by the Board. (c) Security was purchased on a delayed delivery basis. (d) Yield to maturity at time of purchase. (e) All or a portion of the security is pledged to cover futures contract margin requirements. Australian Dollar (Sell 6,573) 12/15/2015 11/9/2015 11/9/2015 115 274 68,895 $ Counterparty Canadian Dollar (Buy 293) Euro (Sell 3,127) Euro (Sell 4,467) Euro (Sell 5,321) 159 2,815 4,142 985 4,171 12,113 81,008 (715) 80,293 Currency (000s) 2/1/2016 Australian Dollar (Sell 1,401) Australian Dollar (Buy 423) Australian Dollar (Buy 3,228) 11/9/2015 British Pound (Sell 2,828) 11/9/2015 Canadian Dollar (Sell 2,376) Chinese Yuan (Sell 11,565) Euro (Sell 1,243) Euro (Buy 3,227) 2/24/2016 12/15/2015 12/1/2015 12/1/2015 11/19/2015 11/24/2015 11/24/2015 11/24/2015 12/1/2015 1/27/2016 Japanese Yen (Buy 46,600) Mexican Peso (Sell 5,810) New Taiwan Dollar (Sell 25,960) South Korean Won (Buy 1,181,000) South Korean Won (Sell 1,181,000) Swiss Franc (Buy 215) Thailand Baht (Sell 56,320) HSBC Bank USA, N.A. Royal Bank of Canada BNP PARIBAS Citibank, N.A. Royal Bank of Canada State Street Bank & Trust Co. Barclays Bank PLC Unrealized Appreciation (Depreciation) (000s) $ 84 7 6 4 43 76 99 104 48 Barclays Bank PLC BNP PARIBAS 3 3 $ 477 BNP PARIBAS $ (8) BNP PARIBAS (1) Credit Suisse First Boston International HSBC Bank USA, N.A. Royal Bank of Canada Barclays Bank PLC (5) BNP PARIBAS Royal Bank of Canada Barclays Bank PLC Credit Suisse First Boston International HSBC Bank USA, N.A. BNP PARIBAS (79) (5) (51) (6) (156) (5) (8) (5) (7) BNP PARIBAS (43) BNP PARIBAS Barclays Bank PLC (11) (5) $(395) Annual Report 61 .
Payden Global Fixed Income Fund continued Open Futures Contracts Number of Contracts 61 23 74 2 3 7 25 2 34 17 35 10 Contract Type 90-Day Sterling Future Australian 10 Year Bond Future Australian 3 Year Bond Future Canadian 10 Year Bond Future Euro-Bobl Future Euro-Bund Future Euro-Schatz Future U.S. Long Bond Future U.S. Treasury 10 Year Note Future U.S. Treasury 2 Year Note Future U.S.
Treasury 5 Year Note Future U.S. Ultra Bond Future Expiration Date Jun-16 Current Value (000) $(11,668) Unrealized Appreciation (Depreciation) (000s) $(20) Dec-15 (2,122) — Dec-15 5,926 8 Dec-15 215 (2) Dec-15 Dec-15 Dec-15 Dec-15 Dec-15 427 1,210 3,065 (313) (4,341) 4 21 6 6 43 Jan-16 3,717 (13) Jan-16 (4,192) (1) Dec-15 1,598 (17) $ 35 See notes to financial statements. 62 Payden Mutual Funds . Payden Emerging Markets Bond Fund The Fund seeks a high level of total return by generally investing in below investment grade debt instruments and income producing securities of emerging market countries denominated in U.S. and foreign currencies with no limit on the average portfolio maturity. $30,000 Portfolio Composition - percent of value $15,000 Foreign Government Corporate Cash equivalent One Year -2.65% $25,000 Five Year 3.84% Ten Year 6.58% Investor Class $18,911 J.P. Morgan EMBI Global Diversified Index $20,306 $20,000 67% 30% 3% $10,000 $5,000 10/31/05 10/10 10/31/15 Past performance does not predict future returns. The graph does not reflect the impact of taxes or transaction costs a shareholder would pay.
The Fund’s Adviser and SI Classes are expected to perform similarly to its Investor Class. This information is not part of the audited financial statements. Schedule of Investments - October 31, 2015 Principal or Shares Security Description Bonds (97%) Argentina (USD) (2%) 13,522,500 Argentine Republic Government International Bond, 2.50%, 12/31/38 (a)(b) 10,725,591 Argentine Republic Government International Bond, 8.28%, 12/31/33 (a)(b) 2,760,000 Argentine Republic Government International Bond, 8.75%, 6/02/17 (a)(b) Armenia (USD) (2%) 12,456,000 Republic of Armenia 144A, 6.00%, 9/30/20 (c) 5,550,000 Republic of Armenia 144A, 7.15%, 3/26/25 (c) Australia (USD) (1%) 8,995,000 CNOOC Curtis Funding No. 1 Pty. Ltd.
144A, 4.50%, 10/03/23 (c) Azerbaijan (USD) (1%) 4,445,000 International Bank of Azerbaijan OJSC, 5.63%, 6/11/19 11,175,000 State Oil Co. of the Azerbaijan Republic, 4.75%, 3/13/23 Bermuda (USD) (0%) 1,035,000 Digicel Group Ltd. 144A, 7.13%, 4/01/22 (c) 2,330,000 Digicel Group Ltd.
144A, 8.25%, 9/30/20 (c) Brazil (USD) (2%) 2,340,000 Banco Nacional de Desenvolvimento Economico e Social 144A, 4.00%, 4/14/19 (c) 2,870,000 Banco Nacional de Desenvolvimento Economico e Social 144A, 5.75%, 9/26/23 (c) 1,535,000 Banco Nacional de Desenvolvimento Economico e Social 144A, 6.50%, 6/10/19 (c) 2,920,000 Brazilian Government International Bond, 2.63%, 1/05/23 3,760,000 Brazilian Government International Bond, 4.25%, 1/07/25 Value (000) Principal or Shares 1,090,000 $ 8,607 4,880,000 Value (000) Security Description Brazilian Government International Bond, 4.88%, 1/22/21 USJ Acucar e Alcool SA 144A, 9.88%, 11/09/19 (c) $ 1,952 15,078 11,959 3,029 23,595 12,368 5,522 17,890 9,433 4,123 9,697 13,820 859 2,074 2,933 2,198 2,554 1,543 2,419 1,075 Canada (USD) (0%) 200,000 CNOOC Nexen Finance 2014 ULC, 4.25%, 4/30/24 Cayman Islands (USD) (1%) 665,000 Agricola Senior Trust 144A, 6.75%, 6/18/20 (c) 3,430,000 Baidu Inc., 4.13%, 6/30/25 3,772,000 Odebrecht Drilling Norbe VIII/IX Ltd. 144A, 6.35%, 6/30/21 (c) Chile (USD) (2%) 1,735,000 Corp Nacional del Cobre de Chile 144A, 3.00%, 7/17/22 (c) 2,480,000 Corp. Nacional del Cobre de Chile 144A, 3.88%, 11/03/21 (c) 4,190,000 Corp.
Nacional del Cobre de Chile 144A, 4.50%, 9/16/25 (c) 1,665,000 Corp. Nacional del Cobre de Chile 144A, 4.88%, 11/04/44 (c) 7,210,000 Latam Airlines 2015-1 Pass Through Trust A 144A, 4.20%, 11/15/27 (c) China (USD) (1%) 4,750,000 Bank of China Ltd. 144A, 5.00%, 11/13/24 (c) 1,710,000 Industrial & Commercial Bank of China Ltd./New York, 3.23%, 11/13/19 Colombia (USD) (2%) 5,360,000 Colombia Government International Bond, 4.00%, 2/26/24 206 663 3,456 1,886 6,005 1,642 2,513 4,167 1,493 6,867 16,682 4,923 1,749 6,672 5,274 3,337 Annual Report 63 .
Payden Emerging Markets Bond Fund continued Principal or Shares 1,250,000 2,060,000 4,270,000 3,765,000 Value (000) Security Description Colombia Government International Bond, 5.00%, 6/15/45 Colombia Government International Bond, 5.63%, 2/26/44 Colombia Government International Bond, 6.13%, 1/18/41 Colombia Government International Bond, 7.38%, 9/18/37 Costa Rica (USD) (2%) 4,770,000 Banco de Costa Rica 144A, 5.25%, 8/12/18 (c) 4,710,000 Banco Nacional de Costa Rica 144A, 4.88%, 11/01/18 (c) 2,160,000 Costa Rica Government International Bond 144A, 7.16%, 3/12/45 (c) 6,375,000 Republic of Costa Rica 144A, 7.00%, 4/04/44 (c) Croatia (USD) (2%) 2,550,000 Croatia Government International Bond 144A, 6.00%, 1/26/24 (c) 3,625,000 Croatia Government International Bond, 6.38%, 3/24/21 (d) 2,685,000 Croatia Government International Bond 144A, 6.38%, 3/24/21 (c) 9,470,000 Croatia Government International Bond, 6.75%, 11/05/19 (d) Dominica Republic (USD) (4%) 1,600,000 Aeropuertos Dominicanos Siglo XXI SA 144A, 9.75%, 11/13/19 (c) 8,230,000 Dominican Republic International Bond 144A, 5.50%, 1/27/25 (c) 2,985,000 Dominican Republic International Bond 144A, 6.60%, 1/28/24 (c) 3,450,000 Dominican Republic International Bond 144A, 6.85%, 1/27/45 (c) 11,965,000 Dominican Republic International Bond 144A, 7.45%, 4/30/44 (c) 9,855,000 Dominican Republic International Bond 144A, 7.50%, 5/06/21 (c) El Salvador (USD) (1%) 4,615,000 Republic of El Salvador 144A, 5.88%, 1/30/25 (c) 1,980,000 Republic of El Salvador 144A, 6.38%, 1/18/27 (c) 2,265,000 Republic of El Salvador 144A, 7.38%, 12/01/19 (c) Georgia (USD) (2%) 4,120,000 Bank of Georgia JSC 144A, 7.75%, 7/05/17 (c) 8,385,000 Georgian Railway JSC 144A, 7.75%, 7/11/22 (c) 8,920,000 Republic of Georgia 144A, 6.88%, 4/12/21 (c) Ghana (USD) (3%) 4,480,000 Ghana Government International Bond 144A, 10.75%, 10/14/30 (c) 64 Payden Mutual Funds $ 1,116 Principal or Shares 5,640,000 9,430,000 6,465,000 Republic of Ghana 144A, 7.88%, 8/07/23 (c) Republic of Ghana 144A, 8.13%, 1/18/26 (c) Republic of Ghana, 8.50%, 10/04/17 (d) 2,003 4,409 4,386 17,188 4,860 Guatemala (USD) (0%) 4,160,000 Guatemala Government Bond 144A, 5.75%, 6/06/22 (c) Honduras (USD) (2%) 6,340,000 Honduras Government International Bond 144A, 7.50%, 3/15/24 (c) 8,485,000 Republic of Honduras 144A, 8.75%, 12/16/20 (c) 4,745 1,958 5,761 17,324 2,709 3,911 2,896 10,318 19,834 1,610 8,168 3,186 3,459 12,683 10,742 39,848 4,119 Hungary (USD) (3%) 3,120,000 Hungary Government International Bond, 5.38%, 3/25/24 5,480,000 Magyar Export-Import Bank Zrt 144A, 4.00%, 1/30/20 (c) 2,495,000 MFB Magyar Fejlesztesi Bank Zrt 144A, 6.25%, 10/21/20 (c) 6,120,000 Republic of Hungary, 4.13%, 2/19/18 6,330,000 Republic of Hungary, 6.25%, 1/29/20 India (USD) (1%) 4,015,000 Export-Import Bank of India, 4.00%, 1/14/23 1,971,000 IDBI Bank Ltd./DIFC Dubai, 4.13%, 4/23/20 Indonesia (USD) (5%) 7,695,000 Indonesia Government International Bond 144A, 4.13%, 1/15/25 (c) 3,660,000 Indonesia Government International Bond 144A, 5.38%, 10/17/23 (c) 3,790,000 Indonesia Government International Bond 144A, 5.88%, 1/15/24 (c) 4,975,000 Indonesia Government International Bond 144A, 8.50%, 10/12/35 (c) 2,770,000 Indonesia Government International Bond, 8.50%, 10/12/35 (d) 720,000 Pelabuhan Indonesia III PT 144A, 4.88%, 10/01/24 (c) 4,905,000 Pertamina Persero PT 144A, 5.25%, 5/23/21 (c) 10,630,000 Pertamina Persero PT 144A, 6.00%, 5/03/42 (c) 4,970,000 Perusahaan Gas Negara Persero Tbk PT 144A, 5.13%, 5/16/24 (c) 2,300,000 Republic of Indonesia 144A, 5.25%, 1/17/42 (c) 1,777 2,336 8,232 4,299 8,802 9,560 22,661 4,759 Value (000) Security Description Ivory Coast (USD) (2%) 11,710,000 Ivory Coast Government International Bond 144A, 5.75%, 12/31/32 (c) 4,700,000 Ivory Coast Government International Bond 144A, 6.38%, 3/03/28 (c) Jamaica (USD) (2%) 7,970,000 Jamaica Government International Bond, 6.75%, 4/28/28 $ 4,866 8,054 6,538 24,217 4,430 6,736 9,514 16,250 3,455 5,591 2,791 6,419 7,159 25,415 4,104 1,991 6,095 7,532 3,936 4,199 6,530 3,636 700 5,042 9,270 4,941 2,196 47,982 10,466 4,353 14,819 8,129 . Principal or Shares 4,215,000 3,340,000 Value (000) Security Description Jamaica Government International Bond, 7.63%, 7/09/25 Jamaica Government International Bond, 7.88%, 7/28/45 Kazakhstan (USD) (3%) 10,230,000 Development Bank of Kazakhstan JSC 144A, 4.13%, 12/10/22 (c) 4,110,000 KazAgro National Management Holding JSC 144A, 4.63%, 5/24/23 (c) 3,710,000 Kazakhstan Government International Bond 144A, 4.88%, 10/14/44 (c) 2,170,000 Kazakhstan Government International Bond 144A, 6.50%, 7/21/45 (c) 1,050,000 KazMunayGas National Co. JSC 144A, 5.75%, 4/30/43 (c) 3,310,000 KazMunayGas National Co. JSC 144A, 6.00%, 11/07/44 (c) 4,860,000 KazMunayGas National Co. JSC 144A, 6.38%, 4/09/21 (c) Kenya (USD) (1%) 13,946,000 Kenya Government International Bond 144A, 5.88%, 6/24/19 (c) Lithuania (USD) (0%) 1,930,000 Lithuania Government International Bond 144A, 6.13%, 3/09/21 (c) Luxembourg (USD) (0%) 2,485,000 BC Luxco 1 SA 144A, 7.38%, 1/29/20 (c) 2,040,000 Millicom International Cellular SA 144A, 6.63%, 10/15/21 (c) Malaysia (USD) (1%) 4,790,000 Petronas Capital Ltd.
144A, 3.13%, 3/18/22 (c) 2,220,000 Petronas Capital Ltd. 144A, 3.50%, 3/18/25 (c) 2,205,000 Petronas Capital Ltd. 144A, 4.50%, 3/18/45 (c) Mexico (MXN) (1%) 32,700,000 Grupo Televisa SAB, 7.25%, 5/14/43 71,600,000 Red de Carreteras de Occidente SAPIB de CV 144A, 9.00%, 6/10/28 (c) Mexico (USD) (5%) 2,275,000 Comision Federal de Electricidad 144A, 4.88%, 1/15/24 (c) 1,845,000 Comision Federal de Electricidad 144A, 5.75%, 2/14/42 (c) 7,355,000 Comision Federal de Electricidad 144A, 6.13%, 6/16/45 (c) 1,782,150 Fermaca Enterprises S de RL de CV 144A, 6.38%, 3/30/38 (c) 2,280,000 Mexichem SAB de CV 144A, 5.88%, 9/17/44 (c) 3,530,000 Mexico Government International Bond, 4.00%, 10/02/23 9,865,000 Mexico Government International Bond, 4.60%, 1/23/46 Principal or Shares 443,000 $ 4,616 1,715,000 3,382 16,127 4,670,000 2,520,000 10,110,000 Value (000) Security Description Mexico Government International Bond, 5.55%, 1/21/45 Mexico Government International Bond, 6.05%, 1/11/40 Petroleos Mexicanos, 4.88%, 1/24/22 Petroleos Mexicanos, 6.38%, 1/23/45 Petroleos Mexicanos, 6.63%, 6/15/35 $ 1,944 4,774 2,400 9,996 47,434 8,996 3,363 3,071 Mongolia (USD) (0%) 1,460,000 Republic of Mongolia 144A, 5.13%, 12/05/22 (c) Morocco (USD) (1%) 1,890,000 BMCE Bank, 6.25%, 11/27/18 7,150,000 OCP SA 144A, 5.63%, 4/25/24 (c) 2,126 813 2,606 4,927 25,902 13,575 2,264 2,355 1,795 4,150 4,705 2,153 2,104 8,962 1,698 4,279 5,977 2,338 1,741 7,153 1,729 2,049 3,652 9,187 471 Netherlands (USD) (2%) 8,560,000 Kazakhstan Temir Zholy Finance BV 144A, 6.38%, 10/06/20 (c) 2,350,000 Kazakhstan Temir Zholy Finance BV 144A, 6.95%, 7/10/42 (c) 1,640,000 Majapahit Holding BV 144A, 7.75%, 1/20/20 (c) 700,000 Majapahit Holding BV 144A, 8.00%, 8/07/19 (c) 2,890,000 VimpelCom Holdings BV 144A, 7.50%, 3/01/22 (c) 2,600,000 VTR Finance BV 144A, 6.88%, 1/15/24 (c) Nigeria (USD) (1%) 3,515,000 Nigeria Government International Bond 144A, 6.75%, 1/28/21 (c) 2,550,000 Zenith Bank PLC 144A, 6.25%, 4/22/19 (c) Pakistan (USD) (1%) 5,540,000 Pakistan Government International Bond 144A, 7.25%, 4/15/19 (c) 1,665,000 Pakistan Government International Bond 144A, 8.25%, 4/15/24 (c) 4,900,000 Pakistan Government International Bond 144A, 8.25%, 9/30/25 (c) Panama (USD) (4%) 2,980,000 Avianca Holdings SA / Avianca Leasing LLC / Grupo Taca Holdings Ltd.
144A, 8.38%, 5/10/20 (c) 4,105,000 Panama Government International Bond, 3.75%, 3/16/25 550,000 Panama Government International Bond, 4.00%, 9/22/24 4,180,000 Republic of Panama, 5.20%, 1/30/20 14,840,000 Republic of Panama, 6.70%, 1/26/36 3,135,000 Republic of Panama, 9.38%, 4/01/29 Paraguay (USD) (1%) 790,000 Republic of Paraguay 144A, 4.63%, 1/25/23 (c) 7,550,000 Republic of Paraguay 144A, 6.10%, 8/11/44 (c) 1,228 1,963 7,488 9,451 8,418 1,951 1,855 791 3,054 2,522 18,591 3,481 2,357 5,838 5,777 1,787 5,247 12,811 2,451 4,074 558 4,588 18,439 4,628 34,738 802 7,701 8,503 Annual Report 65 . Payden Emerging Markets Bond Fund continued Principal or Shares Security Description Peru (USD) (2%) 2,920,000 Abengoa Transmision Sur SA 144A, 6.88%, 4/30/43 (c) 5,160,000 Peruvian Government International Bond, 5.63%, 11/18/50 4,280,000 Peruvian Government International Bond, 7.35%, 7/21/25 7,035,000 Republic of Peru, 6.55%, 3/14/37 Philippines (USD) (3%) 3,515,000 Power Sector Assets & Liabilities Management Corp. 144A, 7.39%, 12/02/24 (c) 2,610,000 Republic of Philippines, 4.20%, 1/21/24 7,765,000 Republic of Philippines, 6.38%, 10/23/34 4,993,000 Republic of Philippines, 7.75%, 1/14/31 Poland (USD) (1%) 2,230,000 Poland Government International Bond, 4.00%, 1/22/24 4,685,000 Republic of Poland, 3.00%, 3/17/23 Romania (USD) (3%) 9,240,000 Romanian Government International Bond 144A, 4.38%, 8/22/23 (c) 8,940,000 Romanian Government International Bond 144A, 4.88%, 1/22/24 (c) 3,620,000 Romanian Government International Bond 144A, 6.13%, 1/22/44 (c) 8,240,000 Romanian Government International Bond 144A, 6.75%, 2/07/22 (c) Russian Federation (USD) (1%) 2,000,000 Russian Foreign Bond - Eurobond 144A, 3.50%, 1/16/19 (c) 5,700,000 Russian Foreign Bond - Eurobond 144A, 4.88%, 9/16/23 (c) 3,300,000 Russian Foreign Bond - Eurobond 144A, 5.00%, 4/29/20 (c) Senegal (USD) (2%) 11,675,000 Republic of Senegal 144A, 6.25%, 7/30/24 (c) 7,550,000 Republic of Senegal 144A, 8.75%, 5/13/21 (c) Serbia (USD) (1%) 5,560,000 Republic of Serbia 144A, 5.25%, 11/21/17 (c) 6,550,000 Republic of Serbia 144A, 5.88%, 12/03/18 (c) Singapore (INR) (0%) 70,000,000 Standard Chartered Bank/Singapore, 7.28%, 6/05/19 South Africa (USD) (1%) 8,190,000 Eskom Holdings SOC Ltd. 144A, 5.75%, 1/26/21 (c) 4,080,000 South Africa Government International Bond, 5.88%, 5/30/22 Sri Lanka (USD) (4%) 2,570,000 Bank of Ceylon 144A, 6.88%, 5/03/17 (c) 66 Payden Mutual Funds Value (000) $ 3,033 Principal or Shares 4,630,000 12,270,000 4,430,000 5,586 2,565,000 5,532 8,530 22,681 4,270,000 5,230,000 4,605 2,905 10,445 7,235 25,190 2,380 4,741 7,121 9,741 9,743 4,293 9,843 33,620 2,022 5,903 3,476 11,401 10,905 8,165 19,070 5,808 6,971 12,779 1,068 National Savings Bank 144A, 8.88%, 9/18/18 (c) Republic of Sri Lanka 144A, 5.88%, 7/25/22 (c) Sri Lanka Government International Bond 144A, 5.13%, 4/11/19 (c) Sri Lanka Government International Bond 144A, 6.00%, 1/14/19 (c) Sri Lanka Government International Bond 144A, 6.25%, 7/27/21 (c) Sri Lanka Government International Bond 144A, 6.85%, 11/03/25 (c) Sweden (USD) (0%) 4,150,000 Eileme 2 AB 144A, 11.63%, 1/31/20 (c) Tanzania (USD) (1%) 14,055,000 United Republic of Tanzania, 6.54%, 3/09/20 (d) Tunisia (USD) (1%) 12,055,000 Banque Centrale de Tunisie SA 144A, 5.75%, 1/30/25 (c) Turkey (USD) (3%) 7,540,000 Export Credit Bank of Turkey 144A, 5.00%, 9/23/21 (c) 2,120,000 Export Credit Bank of Turkey 144A, 5.88%, 4/24/19 (c) 2,700,000 Republic of Turkey, 4.88%, 4/16/43 4,570,000 Republic of Turkey, 6.88%, 3/17/36 4,610,000 Republic of Turkey, 7.38%, 2/05/25 3,700,000 Republic of Turkey, 8.00%, 2/14/34 4,570,000 Turkiye Vakiflar Bankasi Tao 144A, 5.00%, 10/31/18 (c) Ukraine (USD) (1%) 5,645,000 Ukraine Government International Bond 144A, 7.50%, 4/17/23 (c) 3,600,000 Ukraine Government International Bond 144A, 7.75%, 9/23/20 (c) 5,830,000 Ukraine Government International Bond 144A, 7.80%, 11/28/22 (c) United Kingdom (INR) (2%) 295,000,000 Standard Chartered Bank/Singapore 144A, 7.16%, 5/23/23 (c) 81,000,000 Standard Chartered Bank/Singapore, 7.16%, 5/23/23 250,000,000 Standard Chartered Bank/Singapore 144A, 7.28%, 6/05/19 (c) 234,000,000 Standard Chartered Bank/Singapore, 7.28%, 6/05/19 50,000,000 Standard Chartered Bank/Singapore, 8.83%, 11/29/23 43,000,000 Standard Chartered Bank/Singapore, 9.34%, 8/27/24 7,630 4,493 12,123 2,644 Value (000) Security Description United States (USD) (0%) 3,500,000 Cemex Finance LLC 144A, 9.38%, 10/12/22 (c) Uruguay (USD) (3%) 13,835,525 Uruguay Government International Bond, 4.38%, 10/27/27 $ 4,960 11,846 4,364 2,585 4,257 5,223 35,879 4,503 13,756 11,354 7,548 2,227 2,437 5,270 5,524 4,746 4,653 32,405 4,502 2,844 4,606 11,952 4,373 1,201 3,812 3,569 810 701 14,466 3,824 13,801 . Principal or Shares 8,264,000 6,749,580 Uruguay Government International Bond, 4.50%, 8/14/24 Uruguay Government International Bond, 5.10%, 6/18/50 $ 8,615 6,075 28,491 Venezuela (USD) (2%) 14,560,000 Petroleos de Venezuela SA, 5.38%, 4/12/27 6,620,000 Petroleos de Venezuela SA 144A, 6.00%, 11/15/26 (c) 5,540,000 Petroleos de Venezuela SA, 9.00%, 11/17/21 (d) 8,550,000 Republic of Venezuela, 6.00%, 12/09/20 (d) 2,640,000 Republic of Venezuela, 7.00%, 3/31/38 (d) 6,584,000 Republic of Venezuela, 7.65%, 4/21/25 (d) 5,096 2,356 2,315 3,270 997 2,518 16,552 Delivery Date Assets: 11/19/2015 11/27/2015 10,631 2,259 12,890 Virgin Islands (British) (USD) (0%) 935,000 State Grid Overseas Investment 2013 Ltd. 144A, 4.38%, 5/22/43 (c) Zambia (USD) (1%) 1,190,000 Republic of Zambia 144A, 5.38%, 9/20/22 (c) 9,025,000 Zambia Government International Bond 144A, 8.50%, 4/14/24 (c) 6,330,000 Zambia Government International Bond 144A, 8.97%, 7/30/27 (c) Currency (000s) Counterparty Mexican Peso (Sell 101,010) Credit Suisse First Boston International BNP PARIBAS South African Rand (Sell 65,250) Unrealized Appreciation (Depreciation) (000s) $ 1/21/2016 11/13/2015 11/13/2015 Chinese Yuan (Sell 63,442) Colombian Peso (Sell 21,885,000) Euro (Sell 4,425) India Rupee (Sell 384,430) South Korean Won (Sell 5,862,000) Turkish Lira (Sell 14,751) 14 256 $ Liabilities: 2/24/2016 1/28/2016 11/17/2015 Vietnam (USD) (1%) 10,775,000 Vietnam Government International Bond 144A, 4.80%, 11/19/24 (c) 2,030,000 Vietnam Government International Bond 144A, 6.75%, 1/29/20 (c) Total Bonds (Cost - $976,008) Investment Company (3%) 29,165,065 Payden Cash Reserves Money Market Fund * (Cost - $29,165) Total (Cost - $1,005,173) (100%) Liabilities in excess of Other Assets (0%) Net Assets (100%) Open Forward Currency Contracts to USD Value (000) Security Description 270 Barclays Bank PLC $ (280) HSBC Bank USA, N.A. BNP PARIBAS Barclays Bank PLC (306) Barclays Bank PLC (194) Barclays Bank PLC (242) $(1,269) (21) (226) 946 888 7,658 5,349 13,895 938,126 $ 29,165 967,291 (3,182) 964,109 * Affiliated investment (a) Issuer filed for bankruptcy and/or is in default of principal and/or interest payments. (b) Non-income producing security. (c) Security offered only to qualified institutional investors, and thus is not registered for sale to the public under rule 144A of the Securities Act of 1933. It has been deemed liquid under guidelines approved by the Board. (d) Security offered and sold outside the United States, and thus is exempt from registration under Regulation S of the Securities Act of 1933. It has been deemed liquid under guidelines approved by the Board. See notes to financial statements. Annual Report 67 . Payden Emerging Markets Local Bond Fund $14,000 The Fund seeks a high level of total return by generally investing in below investment grade debt instruments and income producing securities of emerging market countries denominated in foreign and U.S. currencies. Three Year -8.59% Since 11/2/11 -4.79% Fund $8,217 J.P. Morgan GBI-EM Global Diversified Index Unhedged $8,580 $12,000 $11,000 Portfolio Composition - percent of value Foreign Government Corporate Cash equivalent One Year -17.16% $13,000 $10,000 78% 16% 6% $9,000 $8,000 $7,000 11/2/11 10/13 10/31/15 Past performance does not predict future returns. The graph does not reflect the impact of taxes or transaction costs a shareholder would pay. The Fund’s Adviser Class is expected to perform similarly to its Investor Class. This information is not part of the audited financial statements. Schedule of Investments - October 31, 2015 Principal or Shares Security Description Bonds (94%) Brazil (BRL) (9%) 21,119,000 Brazil Notas do Tesouro Nacional, 10.00%, 1/01/17 3,802,000 Brazil Notas do Tesouro Nacional, 10.00%, 1/01/21 3,994,000 Brazil Notas do Tesouro Nacional, 10.00%, 1/01/23 8,935,000 Brazil Notas do Tesouro Nacional, 10.00%, 1/01/25 2,000,000 Brazil Notas do Tesouro Nacional Serie F, 10.00%, 1/01/18 7,410,000 Brazil Notas do Tesouro Nacional Serie F, 10.00%, 1/01/19 2,250,000 BRF SA 144A, 7.75%, 5/22/18 (a) Chile (CLP) (0%) 129,000,000 Republic of Chile, 5.50%, 8/05/20 Colombia (COP) (6%) 540,000,000 Colombia Government International Bond, 7.75%, 4/14/21 1,235,000,000 Colombian TES, 5.00%, 11/21/18 6,545,000,000 Colombian TES, 7.00%, 5/04/22 6,189,000,000 Colombian TES, 10.00%, 7/24/24 900,000,000 Emgesa SA ESP 144A, 8.75%, 1/25/21 (a) 1,380,000,000 Empresa de Telecomunicaciones de Bogota 144A, 7.00%, 1/17/23 (a) 1,245,000,000 Empresas Publicas de Medellin ESP 144A, 7.63%, 9/10/24 (a) 1,036,000,000 Empresas Publicas de Medellin ESP 144A, 8.38%, 2/01/21 (a) 1,585,000,000 Financiera de Desarrollo Territorial SA Findeter 144A, 7.88%, 8/12/24 (a) Costa Rica (CRC) (0%) 218,400,000 Republic of Costa Rica 144A, 9.20%, 3/27/19 (a) 68 Payden Mutual Funds Value (000) $ 5,191 799 Principal or Shares Security Description Germany (IDR) (3%) 31,000,000,000 Deutsche Bank AG/London 144A, 5.63%, 5/17/23 (a) 9,000,000,000 Deutsche Bank AG/London 144A, 7.00%, 5/17/22 (a) 24,700,000,000 Deutsche Bank AG/London 144A, 8.25%, 6/17/32 (a) 795 1,703 487 1,727 487 11,189 194 191 410 2,220 2,433 316 Hungary (HUF) (5%) 100,000,000 Hungary Government Bond, 3.50%, 6/24/20 452,300,000 Hungary Government Bond, 4.00%, 4/25/18 302,000,000 Hungary Government Bond, 5.50%, 6/24/25 300,000,000 Hungary Government Bond, 6.50%, 6/24/19 518,810,000 Hungary Government Bond, 7.00%, 6/24/22 Indonesia (IDR) (1%) 10,000,000,000 Indonesia Treasury Bond, 8.38%, 9/15/26 Malaysia (MYR) (8%) 7,775,000 Malaysia Government Bond, 3.31%, 10/31/17 1,250,000 Malaysia Government Bond, 3.42%, 8/15/22 5,120,000 Malaysia Government Bond, 3.89%, 3/15/27 11,700,000 Malaysia Government Bond, 4.01%, 9/15/17 10,060,000 Malaysia Government Bond, 4.16%, 7/15/21 2,250,000 Malaysia Government Bond, 4.38%, 11/29/19 4,380,000 Malaysia Government Bond, 4.39%, 4/15/26 2,560,000 Malaysia Government Bond, 4.50%, 4/15/30 421 388 358 502 7,239 428 Mexico (MXN) (10%) 15,000,000 America Movil SAB de CV, 6.00%, 6/09/19 72,300 America Movil SAB de CV, 6.45%, 12/05/22 10,700,000 Comision Federal de Electricidad, 7.35%, 11/25/25 7,270,000 Grupo Televisa SAB, 7.25%, 5/14/43 40,000,000 Mexican Bonos, 5.00%, 12/11/19 35,000,000 Mexican Bonos, 6.50%, 6/09/22 10,700,000 Mexican Bonos, 7.75%, 5/29/31 5,200,000 Mexican Bonos, 7.75%, 11/13/42 14,640,000 Mexican Bonos, 8.50%, 5/31/29 Value (000) $ 1,859 596 1,649 4,104 371 1,691 1,256 1,216 2,259 6,793 701 1,821 280 1,141 2,780 2,362 537 1,031 604 10,556 917 427 636 377 2,417 2,222 730 354 1,059 .
Principal or Shares 4,999,000 12,243,100 16,240,000 9,900,000 Value (000) Security Description Mexican Bonos, 8.50%, 11/18/38 Mexican Bonos, 10.00%, 12/05/24 Petroleos Mexicanos 144A, 7.65%, 11/24/21 (a) Red de Carreteras de Occidente SAPIB de CV 144A, 9.00%, 6/10/28 (a) Nigeria (NGN) (1%) 174,000,000 Nigeria Government International Bond 144A, 13.05%, 8/16/16 (a) 69,000,000 Nigeria Government International Bond 144A, 16.00%, 6/29/19 (a) Peru (PEN) (2%) 1,730,000 Republic of Peru 144A, 5.70%, 8/12/24 (a) 500,000 Republic of Peru 144A, 6.90%, 8/12/37 (a) 2,930,000 Republic of Peru 144A, 6.95%, 8/12/31 (a) 1,420,000 Republic of Peru 144A, 8.20%, 8/12/26 (a) Philippines (PHP) (0%) 17,000,000 Republic of Philippines, 6.25%, 1/14/36 Poland (PLN) (10%) 4,200,000 Poland Government Bond, 1.50%, 4/25/20 15,000,000 Poland Government Bond, 3.25%, 7/25/19 5,075,000 Poland Government Bond, 3.25%, 7/25/25 830,000 Poland Government Bond, 3.75%, 4/25/18 6,542,000 Poland Government Bond, 4.00%, 10/25/23 13,000,000 Poland Government Bond, 5.25%, 10/25/20 Romania (RON) (3%) 2,150,000 Romania Government Bond, 5.60%, 11/28/18 3,500,000 Romania Government Bond, 5.85%, 4/26/23 6,330,000 Romania Government Bond, 5.95%, 6/11/21 Russian Federation (RUB) (5%) 123,000,000 Russian Federal Bond - OFZ, 7.00%, 1/25/23 5,700,000 Russian Federal Bond - OFZ, 7.40%, 4/19/17 74,130,000 Russian Federal Bond - OFZ, 7.50%, 2/27/19 176,920,000 Russian Federal Bond - OFZ, 7.60%, 4/14/21 57,000,000 Russian Federal Bond - OFZ, 8.15%, 2/03/27 Singapore (INR) (0%) 13,000,000 Standard Chartered Bank/Singapore, 7.28%, 6/05/19 South Africa (ZAR) (9%) 56,900,000 Republic of South Africa, 6.25%, 3/31/36 27,035,019 Republic of South Africa, 6.50%, 2/28/41 54,420,000 Republic of South Africa, 6.75%, 3/31/21 9,850,000 Republic of South Africa, 7.00%, 2/28/31 22,845,000 South Africa Government Bond, 8.00%, 1/31/30 11,200,000 Transnet SOC Ltd. 144A, 9.50%, 5/13/21 (a) Thailand (THB) (7%) 460,000 Thailand Government Bond, 3.25%, 6/16/17 27,700,000 Thailand Government Bond, 3.45%, 3/08/19 56,500,000 Thailand Government Bond, 3.63%, 6/16/23 67,470,000 Thailand Government Bond, 3.65%, 12/17/21 116,710,000 Thailand Government Bond, 3.88%, 6/13/19 $ Principal or Shares 367 951 993 592 12,042 890 377 1,267 488 144 861 468 1,961 35,800,000 Value (000) Security Description Thailand Government Bond, 4.88%, 6/22/29 $ Turkey (TRY) (8%) 1,065,000 Turkey Government Bond, 6.30%, 2/14/18 225,000 Turkey Government Bond, 7.40%, 2/05/20 1,190,000 Turkey Government Bond, 8.20%, 11/16/16 8,000,000 Turkey Government Bond, 8.50%, 9/14/22 1,092,824 Turkey Government Bond, 8.80%, 11/14/18 6,725,000 Turkey Government Bond, 9.00%, 3/08/17 3,070,000 Turkey Government Bond, 9.00%, 7/24/24 5,350,000 Turkey Government Bond, 9.50%, 1/12/22 2,420,000 Turkey Government Bond, 10.40%, 3/20/24 330,000 Turkey Government Bond, 10.70%, 2/24/16 340 71 402 2,573 365 2,282 1,010 1,814 864 114 9,835 United Kingdom (IDR) (1%) 5,800,000,000 Standard Chartered Bank/Singapore 144A, 8.38%, 3/19/24 (a) 14,000,000,000 Standard Chartered Bank/Singapore 144A, 8.38%, 9/17/26 (a) 415 981 1,396 406 1,063 4,073 1,380 225 1,869 3,866 12,476 597 1,026 1,839 3,462 1,656 86 1,085 2,515 796 6,138 198 3,082 1,468 3,744 605 1,554 774 11,227 13 818 1,697 2,027 3,508 1,239 9,302 United Kingdom (INR) (3%) 60,000,000 Standard Chartered Bank/Singapore 144A, 7.16%, 5/23/23 (a) 24,000,000 Standard Chartered Bank/Singapore, 7.16%, 5/23/23 75,000,000 Standard Chartered Bank/Singapore 144A, 7.28%, 6/05/19 (a) 51,000,000 Standard Chartered Bank/Singapore 144A, 8.83%, 11/29/23 (a) 38,000,000 Standard Chartered Bank/Singapore, 8.83%, 11/29/23 13,000,000 Standard Chartered Bank/Singapore, 9.34%, 8/27/24 889 356 1,144 826 616 212 4,043 United States (IDR) (3%) 5,500,000,000 JPMorgan Chase Bank, N.A., 8.38%, 3/19/24 49,194,000,000 JPMorgan Chase Bank, N.A. 144A, 9.50%, 7/17/31 (a) Total Bonds (Cost - $144,778) Investment Company (6%) 2,300,967 Payden Cash Reserves Money Market Fund * 478,709 Payden Emerging Markets Corporate Bond Fund, SI Class * Total Investment Company (Cost - $7,201) Total (Cost - $151,979) (100%) Other Assets, net of Liabilities (0%) Net Assets (100%) 393 3,667 4,060 119,017 2,301 $ 4,610 6,911 125,928 211 126,139 * Affiliated investment (a) Security offered only to qualified institutional investors, and thus is not registered for sale to the public under rule 144A of the Securities Act of 1933. It has been deemed liquid under guidelines approved by the Board. Annual Report 69 . Payden Emerging Markets Local Bond Fund continued Open Forward Currency Contracts to USD Delivery Date Assets: 11/24/2015 Liabilities: 11/16/2015 2/24/2016 1/21/2016 1/28/2016 11/17/2015 11/23/2015 11/13/2015 1/27/2016 Unrealized Appreciation (Depreciation) (000s) Currency (000s) Counterparty New Taiwan Dollar (Sell 40,150) Barclays Bank PLC $ Chinese Yuan (Sell 8,946) Chinese Yuan (Sell 7,685) Colombian Peso (Sell 3,559,000) Euro (Sell 1,742) India Rupee (Sell 40,940) Nuevo Sol (Buy 1,012) South Korean Won (Sell 816,000) Thailand Baht (Sell 48,130) Barclays Bank PLC Barclays Bank PLC HSBC Bank USA, N.A. BNP PARIBAS Barclays Bank PLC Barclays Bank PLC Barclays Bank PLC $ (47) (34) (53) Barclays Bank PLC (5) 6 (8) (24) (5) (27) $(203) See notes to financial statements. 70 Payden Mutual Funds . Payden Emerging Markets Corporate Bond Fund $12,000 The Fund seeks a high level of total return by generally investing in below investment grade corporate debt instruments and income producing securities of emerging market countries denominated in U.S. and foreign currencies with no limit on the average portfolio maturity. One Year -1.55% JPM Corporate EMBI $10,911 $11,000 Portfolio Composition - percent of value Corporate Foreign Government Cash equivalent Fund $10,663 Since 11/11/13 3.31% $10,000 91% 7% 2% $9,000 11/11/2013 10/14 10/31/15 Past performance does not predict future returns. The graph does not reflect the impact of taxes or transaction costs a shareholder would pay. The Fund’s Adviser and SI Classes are expected to perform similarly to its Investor Class. This information is not part of the audited financial statements. Schedule of Investments - October 31, 2015 Principal or Shares Security Description Bonds (96%) Argentina (USD) (1%) 230,000 YPF SA 144A, 8.50%, 7/28/25 (a) Australia (USD) (1%) 240,000 Australia & New Zealand Banking Group Ltd. 144A, 4.50%, 3/19/24 (a) Azerbaijan (USD) (1%) 200,000 International Bank of Azerbaijan OJSC, 5.63%, 6/11/19 200,000 Republic of Azerbaijan International Bond 144A, 4.75%, 3/18/24 (a) Bermuda (USD) (3%) 220,000 Digicel Group Ltd.
144A, 7.13%, 4/01/22 (a) 520,000 Digicel Group Ltd. 144A, 8.25%, 9/30/20 (a) 210,000 Digicel Ltd. 144A, 6.00%, 4/15/21 (a) 200,000 GCX Ltd.
144A, 7.00%, 8/01/19 (a) Brazil (USD) (2%) 280,000 Caixa Economica Federal 144A, 2.38%, 11/06/17 (a) 620,000 USJ Acucar e Alcool SA 144A, 9.88%, 11/09/19 (a) 215,000 Vale Overseas Ltd., 6.88%, 11/21/36 Canada (USD) (2%) 420,000 CNOOC Nexen Finance 2014 ULC, 4.25%, 4/30/24 185,000 First Quantum Minerals Ltd. 144A, 6.75%, 2/15/20 (a) 195,000 Pacific Rubiales Energy Corp. 144A, 7.25%, 12/12/21 (a) Cayman Islands (USD) (7%) 200,000 ADCB Finance Cayman Ltd., 3.13%, 5/28/23 Value (000) Principal or Shares 250,000 $ 227 205,000 242 400,000 350,000 186 192 378 182 463 190 196 1,031 264 248 176 688 432 142 81 655 201 225,000 235,000 352,600 200,000 250,000 Value (000) Security Description AES Andres Dominicana Ltd./Itabo Dominicana Ltd.
144A, 9.50%, 11/12/20 (a) Alibaba Group Holding Ltd. 144A, 4.50%, 11/28/34 (a) Hutchison Whampoa International 11 Ltd. 144A, 4.63%, 1/13/22 (a) Hutchison Whampoa International 12 Ltd. 144A, 6.00%, 5/29/49 (a) Industrial Senior Trust 144A, 5.50%, 11/01/22 (a) MAF Global Securities Ltd., 4.75%, 5/07/24 (b) Odebrecht Drilling Norbe VIII / IX Ltd. 144A, 6.35%, 6/30/21 (a) Tencent Holdings Ltd.
144A, 3.38%, 5/02/19 (a) Tencent Holdings Ltd. 144A, 3.80%, 2/11/25 (a) Chile (USD) (6%) 270,000 Colbun SA 144A, 6.00%, 1/21/20 (a) 360,000 Corpbanca SA, 3.13%, 1/15/18 220,000 Empresa Electrica Angamos SA 144A, 4.88%, 5/25/29 (a) 340,000 Empresa Nacional del Petroleo 144A, 4.38%, 10/30/24 (a) 270,000 Latam Airlines 2015-1 Pass Through Trust A 144A, 4.20%, 11/15/27 (a) 250,000 Latam Airlines 2015-1 Pass Through Trust B 144A, 4.50%, 11/15/23 (a) 300,000 Telefonica Chile SA 144A, 3.88%, 10/12/22 (a) China (USD) (1%) 230,000 Bank of China Ltd. 144A, 5.00%, 11/13/24 (a) 250,000 Industrial & Commercial Bank of China Ltd./New York, 3.23%, 11/13/19 Colombia (USD) (0%) 180,000 Ecopetrol SA, 5.38%, 6/26/26 $ 253 197 433 367 206 242 176 204 249 2,528 301 362 207 342 257 233 301 2,003 238 256 494 168 Annual Report 71 .
Payden Emerging Markets Corporate Bond Fund continued Principal or Shares Security Description Costa Rica (USD) (2%) 400,000 Banco de Costa Rica 144A, 5.25%, 8/12/18 (a) 200,000 Costa Rica Government International Bond 144A, 7.16%, 3/12/45 (a) Dominica Republic (USD) (1%) 210,000 Aeropuertos Dominicanos Siglo XXI SA 144A, 9.75%, 11/13/19 (a) Georgia (USD) (1%) 250,000 Bank of Georgia JSC 144A, 7.75%, 7/05/17 (a) Ghana (USD) (0%) 230,000 Republic of Ghana 144A, 7.88%, 8/07/23 (a) Guernsey (USD) (1%) 230,000 Credit Suisse Group Funding Guernsey Ltd. 144A, 2.75%, 3/26/20 (a) Hong Kong (USD) (2%) 250,000 AIA Group Ltd. 144A, 3.20%, 3/11/25 (a) 275,000 CLP Power Hong Kong Financing Ltd., 3.13%, 5/06/25 265,000 Swire Properties MTN Financing Ltd., 4.38%, 6/18/22 India (USD) (4%) 200,000 Adani Ports & Special Economic Zone Ltd. 144A, 3.50%, 7/29/20 (a) 200,000 Export-Import Bank of India, 4.00%, 1/14/23 200,000 IDBI Bank Ltd./DIFC Dubai, 4.13%, 4/23/20 260,000 IDBI Bank Ltd./DIFC Dubai 144A, 4.70%, 2/21/18 (a) 260,000 Reliance Industries Ltd. 144A, 4.88%, 2/10/45 (a) 260,000 State Bank of India/London 144A, 4.13%, 8/01/17 (a) Indonesia (USD) (3%) 520,000 Bank Rakyat Indonesia Persero Tbk PT, 2.95%, 3/28/18 200,000 Pelabuhan Indonesia III PT 144A, 4.88%, 10/01/24 (a) 200,000 Pertamina Persero PT 144A, 5.25%, 5/23/21 (a) 260,000 Perusahaan Gas Negara Persero Tbk PT 144A, 5.13%, 5/16/24 (a) Israel (USD) (3%) 200,000 Delek & Avner Tamar Bond Ltd.
144A, 5.41%, 12/30/25 (a) 445,000 Israel Electric Corp. Ltd., 2.11%, 1/17/18 350,000 Israel Electric Corp. Ltd.
144A, 7.25%, 1/15/19 (a) Jamaica (USD) (1%) 200,000 Jamaica Government International Bond, 6.75%, 4/28/28 Kazakhstan (USD) (0%) 180,000 KazMunayGas National Co. JSC 144A, 9.13%, 7/02/18 (a) 72 Payden Mutual Funds Value (000) $ 408 181 589 211 261 Principal or Shares Security Description Kenya (USD) (0%) 200,000 Kenya Government International Bond 144A, 5.88%, 6/24/19 (a) Luxembourg (USD) (4%) 200,000 Altice Financing SA 144A, 7.88%, 12/15/19 (a) 240,000 Altice SA 144A, 7.75%, 5/15/22 (a) 260,000 Atento Luxco 1 SA 144A, 7.38%, 1/29/20 (a) 400,000 Gazprom OAO Via Gaz Capital SA 144A, 3.85%, 2/06/20 (a) 425,000 Millicom International Cellular SA 144A, 6.63%, 10/15/21 (a) 198 229 242 266 284 792 199 205 202 273 242 269 1,390 520 195 206 258 1,179 204 443 395 1,042 204 199 Marshall Islands (USD) (1%) 200,000 Nakilat Inc. 144A, 6.07%, 12/31/33 (a) Mexico (MXN) (1%) 3,410,000 Red de Carreteras de Occidente SAPIB de CV 144A, 9.00%, 6/10/28 (a) Mexico (USD) (7%) 375,000 America Movil SAB de CV, 3.13%, 7/16/22 100,000 BBVA Bancomer SA/Grand Cayman 144A, 6.01%, 5/17/22 (a) 375,000 Cemex SAB de CV 144A, 6.13%, 5/05/25 (a) 240,000 Elementia SAB de CV 144A, 5.50%, 1/15/25 (a) 244,801 Fermaca Enterprises S de RL de CV 144A, 6.38%, 3/30/38 (a) 180,000 Grupo Bimbo SAB de CV 144A, 4.50%, 1/25/22 (a) 230,000 Grupo Cementos de Chihuahua SAB de CV 144A, 8.13%, 2/08/20 (a) 200,000 Mexichem SAB de CV 144A, 4.88%, 9/19/22 (a) 200,000 Mexichem SAB de CV 144A, 5.88%, 9/17/44 (a) 246,030 Mexico Generadora de Energia S de rl 144A, 5.50%, 12/06/32 (a) 200,000 Mexico Government International Bond, 3.63%, 3/15/22 Morocco (USD) (2%) 200,000 BMCE Bank, 6.25%, 11/27/18 240,000 OCP SA 144A, 4.50%, 10/22/25 (a) 460,000 OCP SA 144A, 5.63%, 4/25/24 (a) Netherlands (USD) (7%) 540,000 Bharti Airtel International Netherlands BV 144A, 5.13%, 3/11/23 (a) 200,000 GTB Finance BV 144A, 6.00%, 11/08/18 (a) 200,000 Listrindo Capital BV 144A, 6.95%, 2/21/19 (a) 415,000 Lukoil International Finance BV 144A, 6.13%, 11/09/20 (a) 200,000 Majapahit Holding BV 144A, 8.00%, 8/07/19 (a) 535,000 Petrobras Global Finance BV, 3.88%, 1/27/16 210,000 VimpelCom Holdings BV 144A, 7.50%, 3/01/22 (a) 325,000 VTR Finance BV 144A, 6.88%, 1/15/24 (a) Value (000) $ 195 209 232 246 380 374 1,441 233 204 372 102 356 236 237 188 242 210 180 236 205 2,564 208 231 481 920 574 190 208 431 226 534 222 315 2,700 .
Principal or Shares Security Description Panama (USD) (0%) 220,000 Avianca Holdings SA / Avianca Leasing LLC / Grupo Taca Holdings Ltd. 144A, 8.38%, 5/10/20 (a) Paraguay (USD) (1%) 385,000 Banco Regional SAECA 144A, 8.13%, 1/24/19 (a) Peru (USD) (1%) 200,000 Abengoa Transmision Sur SA 144A, 6.88%, 4/30/43 (a) 180,000 Scotiabank Peru SA 144A, 4.50%, 12/13/27 (a) Philippines (USD) (1%) 200,000 International Container Terminal Services Inc., 7.38%, 3/17/20 Qatar (USD) (1%) 250,000 Ras Laffan Liquefied Natural Gas Co. Ltd. III 144A, 5.84%, 9/30/27 (a) Senegal (USD) (1%) 200,000 Republic of Senegal 144A, 8.75%, 5/13/21 (a) Singapore (USD) (5%) 360,000 BOC Aviation Pte Ltd., 4.38%, 5/02/23 350,000 DBS Bank Ltd., 3.63%, 9/21/22 (b) 320,000 Flextronics International Ltd., 4.63%, 2/15/20 355,000 Oversea-Chinese Banking Corp.
Ltd. 144A, 3.15%, 3/11/23 (a) 250,000 TBG Global Pte Ltd. 144A, 4.63%, 4/03/18 (a) South Korea (USD) (4%) 260,000 Korea Development Bank, 3.00%, 3/17/19 350,000 Korea Gas Corp.
144A, 2.88%, 7/29/18 (a) 440,000 Korea Hydro & Nuclear Power Co. Ltd. 144A, 2.88%, 10/02/18 (a) 210,000 SK Telecom Co.
Ltd. 144A, 2.13%, 5/01/18 (a) Spain (USD) (1%) 200,000 Banco Bilbao Vizcaya Argentaria SA, 9.00%, 5/29/49 Sri Lanka (USD) (1%) 200,000 National Savings Bank 144A, 8.88%, 9/18/18 (a) 200,000 Sri Lanka Government International Bond 144A, 5.13%, 4/11/19 (a) Sweden (USD) (2%) 220,000 Eileme 2 AB 144A, 11.63%, 1/31/20 (a) 480,000 PKO Finance AB 144A, 4.63%, 9/26/22 (a) Tanzania (USD) (0%) 200,000 Tanzania Government International Bond, 6.54%, 3/09/20 (b) Thailand (USD) (2%) 425,000 Bangkok Bank PCL/Hong Kong 144A, 4.80%, 10/18/20 (a) 250,000 Thai Oil PCL 144A, 3.63%, 1/23/23 (a) Turkey (USD) (3%) 330,000 Akbank TAS 144A, 4.00%, 1/24/20 (a) Value (000) Principal or Shares 550,000 $ 181 397 208 175 383 228 284 216 369 359 333 359 250 1,670 268 358 450 211 1,287 216 214 197 411 239 503 742 270,000 Value (000) Security Description Turkiye Garanti Bankasi AS 144A, 4.00%, 9/13/17 (a) Turkiye Vakiflar Bankasi Tao 144A, 5.00%, 10/31/18 (a) $ 558 275 1,157 United Arab Emirates (USD) (3%) 470,000 DP World Ltd. 144A, 6.85%, 7/02/37 (a) 270,000 First Gulf Bank PJSC, 3.25%, 1/14/19 200,000 Ruwais Power Co.
PJSC 144A, 6.00%, 8/31/36 (a) 499 278 224 1,001 United States (USD) (4%) 195,000 AT&T Inc., 4.75%, 5/15/46 180,000 Baxalta Inc. 144A, 4.00%, 6/23/25 (a) 270,000 Cemex Finance LLC 144A, 9.38%, 10/12/22 (a) 200,000 FS Investment Corp., 4.25%, 1/15/20 230,000 Goldman Sachs Group Inc., 2.60%, 4/23/20 255,000 Hyundai Capital America 144A, 2.40%, 10/30/18 (a) 230,000 Morgan Stanley, 5.55%, 12/29/49 180 182 295 202 231 255 230 1,575 Vietnam (USD) (1%) 200,000 Vietnam Government International Bond 144A, 4.80%, 11/19/24 (a) 100,000 Vietnam Government International Bond 144A, 6.75%, 1/29/20 (a) Virgin Islands (British) (USD) (1%) 450,000 Sinopec Group Overseas Development 2015 Ltd. 144A, 2.50%, 4/28/20 (a) Zambia (USD) (0%) 200,000 Zambia Government International Bond 144A, 8.97%, 7/30/27 (a) Total Bonds (Cost - $35,242) Investment Company (2%) 794,527 Payden Cash Reserves Money Market Fund * (Cost - $795) Total (Cost - $36,037) (98%) Other Assets, net of Liabilities (2%) Net Assets (100%) 198 111 309 444 169 34,542 $ 795 35,337 680 36,017 * Affiliated investment (a) Security offered only to qualified institutional investors, and thus is not registered for sale to the public under rule 144A of the Securities Act of 1933. It has been deemed liquid under guidelines approved by the Board. (b) Security offered and sold outside the United States, and thus is exempt from registration under Regulation S of the Securities Act of 1933. It has been deemed liquid under guidelines approved by the Board. 196 463 248 711 324 Annual Report 73 .
Payden Emerging Markets Corporate Bond Fund continued Open Forward Currency Contracts to USD Delivery Date Assets: 11/19/2015 11/27/2015 Currency (000s) Counterparty Mexican Peso (Sell 3,420) Credit Suisse First Boston International BNP PARIBAS South African Rand (Sell 1,220) Unrealized Appreciation (Depreciation) (000s) $— 5 $ 5 Liabilities: 2/24/2016 1/21/2016 1/28/2016 11/13/2015 11/13/2015 Chinese Yuan (Sell 1,155) Colombian Peso (Sell 544,000) Euro (Sell 166) South Korean Won (Sell 212,000) Turkish Lira (Sell 550) Barclays Bank PLC HSBC Bank USA, N.A. BNP PARIBAS Barclays Bank PLC $ (5) (8) Barclays Bank PLC (9) $(30) (1) (7) See notes to financial statements. 74 Payden Mutual Funds . Payden Equity Income Fund $25,000 The Fund seeks growth of capital by investing in U.S. large capitalization value stocks and income producing equity securities with above average dividend yields with up to 30% in foreign securities. One Year 2.90% $20,000 Portfolio Composition - percent of value Financial Consumer Staple Consumer Discretionary Technology Real Estate Investment Trust Other Five Year 14.26% Ten Year 6.35% Fund $18,522 Russell 1000 Value Index $19,216 $15,000 19% 15% 13% 10% 8% 35% $10,000 $5,000 10/31/05 10/10 10/31/15 Past performance does not predict future returns. The graph does not reflect the impact of taxes or transaction costs a shareholder would pay. The Fund’s Adviser and SI Classes are expected to perform similarly to its Investor Class. This information is not part of the audited financial statements. Schedule of Investments - October 31, 2015 Principal or Shares Security Description Stocks (99%) Common Stock (84%) 314,100 Altria Group Inc. 136,100 Ameren Corp. 178,200 Arthur J Gallagher & Co. 295,200 AT&T Inc. 96,300 Bank of Hawaii Corp. 93,500 Chevron Corp. 412,500 Cisco Systems Inc. 129,500 CME Group Inc. 166,200 Dow Chemical Co. 121,600 Duke Energy Corp. 102,200 Exxon Mobil Corp. 226,200 Federated Investors Inc. 468,800 General Electric Co. 193,100 General Mills Inc. 165,400 Hasbro Inc. 332,300 Intel Corp. 78,300 International Business Machines Corp. 57,600 Johnson & Johnson 249,100 JPMorgan Chase & Co. 93,500 Kimberly-Clark Corp. 172,800 Kinder Morgan Inc. 168,800 Kraft Heinz Co. 80,900 Lockheed Martin Corp. 293,300 Mattel Inc. 219,300 Maxim Integrated Products Inc. 120,300 McDonald’s Corp. 262,200 Merck & Co.
Inc. 155,000 MetLife Inc. 127,700 Microchip Technology Inc. 138,600 Microsoft Corp. (a) 240,800 Paychex Inc. 100,600 PepsiCo Inc. 448,200 Pfizer Inc. 67,300 Philip Morris International Inc. 71,500 Procter & Gamble Co. 97,400 Prudential Financial Inc. 134,800 Qualcomm Inc. Value (000) $ 18,994 5,945 7,793 9,892 6,306 8,497 11,901 12,234 8,588 8,691 8,456 6,951 13,558 11,221 12,708 11,252 10,968 5,819 16,005 11,193 4,726 13,161 17,784 7,209 8,987 13,504 14,332 7,809 6,167 7,296 12,420 10,280 15,158 5,949 5,461 8,035 8,010 Principal or Shares 555,100 173,201 108,200 245,100 137,200 185,300 242,800 176,900 295,100 145,200 Value (000) Security Description Regal Entertainment Group Reynolds American Inc. Seagate Technology PLC Six Flags Entertainment Corp. Southern Co. Target Corp. Verizon Communications Inc. Waste Management Inc. Wells Fargo & Co. Westar Energy Inc. Master Limited Partnership (2%) 360,300 Enterprise Products Partners LP 73,400 Magellan Midstream Partners LP Preferred Stock (5%) 115,200 Bank of America Corp., 6.50% 137,000 DDR Corp., 6.50% 95,900 Discover Financial Services, 6.50% 312,600 Goldman Sachs Group Inc., 5.50% 49,000 Public Storage, 5.875% 110,900 US Bancorp, 6.50% 192,600 Wells Fargo & Co., 6.00% Real Estate Investment Trust (8%) 86,000 Digital Realty Trust Inc. 148,300 Equity Residential 114,400 Prologis Inc. 56,400 Public Storage 47,600 Simon Property Group Inc. Total Stocks (Cost - $514,582) $ 10,758 8,369 4,118 12,755 6,188 14,301 11,382 9,510 15,977 5,764 472,382 9,955 4,684 14,639 3,053 3,578 2,560 7,916 1,277 3,214 5,000 26,598 6,361 11,467 4,888 12,941 9,589 45,246 558,865 Annual Report 75 . Payden Equity Income Fund continued Principal or Shares Investment Company (1%) 4,211,442 Payden Cash Reserves Money Market Fund * (Cost - $4,212) Total Investment Company (Cost - $4,212) Total (Cost - $518,794) (100%) Other Assets, net of Liabilities (0%) Net Assets (100%) * Value (000) Security Description $ $ (a) All or a portion of the security is pledged to cover futures contract margin requirements. 4,212 4,212 563,077 287 563,364 Affiliated investment See notes to financial statements. 76 Payden Mutual Funds . (THIS PAGE INTENTIONALLY LEFT BLANK) . Statements of Assets & Liabilities October 31, 2015 Numbers in 000s Payden Cash Reserves Money Market Fund Payden Limited Maturity Fund Payden Low Duration Fund $252,409 — 140,000 — 3,556 — $417,453 6,387 — 46 15 — $825,015 8,216 — 11 — — 6 — 3 — — — 51 26 396,051 936 16 120 — 128 — 32 27 425,160 3,070 — 76 3 173 150 — 50 836,764 — — 3,549 1 — — 2 — 187 1,718 32 — — 9 21 84 14,844 379 — 146 99 — 44 — 3 61 3,660 $392,391 — 53 — 3 162 2,164 $422,996 106 104 — 8 311 16,102 $820,662 $392,389 — 2 $430,829 (9) (4,205) $826,745 (98) (153) — — $392,391 (3,560) (59) $422,996 (5,917) 85 $820,662 — — — — — — — — — $392,391 392,383 $ 1.00 $422,996 44,892 $ 9.42 $820,662 81,675 $ 10.05 — — — — — — — — — $252,409 — 140,000 — — $421,013 6,387 — 46 — $830,940 8,216 — 11 (112) ASSETS: Investments, at value * . . . .
. . .
. . .
. . .
. . .
. . .
. . .
. . .
. . .
. . .
. . .
. . .
. . .
. . .
. . .
. . .
. . .
. . .
. . Affiliated investments, at value ** . .
. . .
. . .
. . .
. . .
. . .
. . .
. . .
. . .
. . .
. . .
. . .
. . .
. . .
. . .
. . .
. . Repurchase agreements, at value *** . .
. . .
. . .
. . .
. . .
. . .
. . .
. . .
. . .
. . .
. . .
. . .
. . .
. . .
. . .
. . . Foreign cash **** .
. . .
. . .
. . .
. . .
. . .
. . .
. . .
. . .
. . .
. . .
. . .
. . .
. . .
. . .
. . .
. . .
. . .
. . .
. . .
. . . Cash.
. . .
. . .
. . .
. . .
. . .
. . .
. . .
. . .
. . .
. . .
. . .
. . .
. . .
. . .
. . .
. . .
. . .
. . .
. . .
. . .
. . .
. . .
. . .
. . Cash pledged for financial futures contracts . .
. . .
. . .
. . .
. . .
. . .
. . .
. . .
. . .
. . .
. . .
. . .
. . .
. . .
. Receivable for: Interest and dividends . . .
. . .
. . .
. . .
. . .
. . .
. . .
. . .
. . .
. . .
. . .
. . .
. . .
. . .
. . .
. . .
. . .
. . .
. . Investments sold . .
. . .
. . .
. . .
. . .
. . .
. . .
. . .
. . .
. . .
. . .
. . .
. . .
. . .
. . .
. . .
. . .
. . .
. . .
. . .
. Fund shares sold. . .
. . .
. . .
. . .
. . .
. . .
. . .
. . .
. . .
. . .
. . .
. . .
. . .
. . .
. . .
. . .
. . .
. . .
. . .
. . .
. Futures . . .
. . .
. . .
. . .
. . .
. . .
. . .
. . .
. . .
. . .
. . .
. . .
. . .
. . .
. . .
. . .
. . .
. . .
. . .
. . .
. . .
. . .
. Forward currency contracts . . .
. . .
. . .
. . .
. . .
. . .
. . .
. . .
. . .
. . .
. . .
. . .
. . .
. . .
. . .
. . .
. . .
. Variation margin on centrally cleared swaps . . .
. . .
. . .
. . .
. . .
. . .
. . .
. . .
. . .
. . .
. . .
. . .
. . .
. Receivable from Advisor (Note 3) . . .
. . .
. . .
. . .
. . .
. . .
. . .
. . .
. . .
. . .
. . .
. . .
. . .
. . .
. . .
. . .
. Other assets . . .
. . .
. . .
. . .
. . .
. . .
. . .
. . .
. . .
. . .
. . .
. . .
. . .
. . .
. . .
. . .
. . .
. . .
. . .
. . .
. . .
. . . Total Assets .
. . .
. . .
. . .
. . .
. . .
. . .
. . .
. . .
. . .
. . .
. . .
. . .
. . .
. . .
. . .
. . .
. . .
. . .
. . .
. . LIABILITIES: Payable for: Bank overdraft . .
. . .
. . .
. . .
. . .
. . .
. . .
. . .
. . .
. . .
. . .
. . .
. . .
. . .
. . .
. . .
. . .
. . .
. . .
. . .
. . . Forward currency contracts .
. . .
. . .
. . .
. . .
. . .
. . .
. . .
. . .
. . .
. . .
. . .
. . .
. . .
. . .
. . .
. . .
. . . Investments purchased .
. . .
. . .
. . .
. . .
. . .
. . .
. . .
. . .
. . .
. . .
. . .
. . .
. . .
. . .
. . .
. . .
. . .
. . .
. Fund shares redeemed . . .
. . .
. . .
. . .
. . .
. . .
. . .
. . .
. . .
. . .
. . .
. . .
. . .
. . .
. . .
. . .
. . .
. . .
. . Futures . .
. . .
. . .
. . .
. . .
. . .
. . .
. . .
. . .
. . .
. . .
. . .
. . .
. . .
. . .
. . .
. . .
. . .
. . .
. . .
. . .
. . .
. . Swaps*****. .
. . .
. . .
. . .
. . .
. . .
. . .
. . .
. . .
. . .
. . .
. . .
. . .
. . .
. . .
. . .
. . .
. . .
. . .
. . .
. . .
. . Distributions payable. .
. . .
. . .
. . .
. . .
. . .
. . .
. . .
. . .
. . .
. . .
. . .
. . .
. . .
. . .
. . .
. . .
. . .
. . .
. . . Accrued expenses: Investment advisory fees (Note 3) .
. . .
. . .
. . .
. . .
. . .
. . .
. . .
. . .
. . .
. . .
. . .
. . .
. . .
. . .
. . .
. Administration fees (Note 3) . . .
. . .
. . .
. . .
. . .
. . .
. . .
. . .
. . .
. . .
. . .
. . .
. . .
. . .
. . .
. . .
. . . Distribution fees (Note 3) .
. . .
. . .
. . .
. . .
. . .
. . .
. . .
. . .
. . .
. . .
. . .
. . .
. . .
. . .
. . .
. . .
. . .
. Trustee fees and expenses . . .
. . .
. . .
. . .
. . .
. . .
. . .
. . .
. . .
. . .
. . .
. . .
. . .
. . .
. . .
. . .
. . .
. . . Other liabilities .
. . .
. . .
. . .
. . .
. . .
. . .
. . .
. . .
. . .
. . .
. . .
. . .
. . .
. . .
. . .
. . .
. . .
. . .
. . .
. . .
. . Total Liabilities . .
. . .
. . .
. . .
. . .
. . .
. . .
. . .
. . .
. . .
. . .
. . .
. . .
. . .
. . .
. . .
. . .
. . .
. . .
. NET ASSETS. . .
. . .
. . .
. . .
. . .
. . .
. . .
. . .
. . .
. . .
. . .
. . .
. . .
. . .
. . .
. . .
. . .
. . .
. . .
. . NET ASSETS: Paid in capital . .
. . .
. . .
. . .
. . .
. . .
. . .
. . .
. . .
. . .
. . .
. . .
. . .
. . .
. . .
. . .
. . .
. . .
. . .
. . .
. . .
. . Undistributed net investment income (loss) . .
. . .
. . .
. . .
. . .
. . .
. . .
. . .
. . .
. . .
. . .
. . .
. . .
. . .
. Undistributed net realized gains (losses) from investments . . .
. . .
. . .
. . .
. . .
. . .
. . .
. . .
. . .
. . .
. Net unrealized appreciation (depreciation) from: Investments . . .
. . .
. . .
. . .
. . .
. . .
. . .
. . .
. . .
. . .
. . .
. . .
. . .
. . .
. . .
. . .
. . .
. . .
. . .
. . .
. . .
. Translation of assets and liabilities in foreign currencies . . .
. . .
. . .
. . .
. . .
. . .
. . .
. . .
. . .
. . .
. NET ASSETS. . .
. . .
. . .
. . .
. . .
. . .
. . .
. . .
. . .
. . .
. . .
. . .
. . .
. . .
. . .
. . .
. . .
. . .
. . .
. . .
. . . NET ASSET VALUE — offering and redemption price per share in whole dollars Adviser Class Net Assets .
. . .
. . .
. . .
. . .
. . .
. . .
. . .
. . .
. . .
. . .
. . .
. . .
. . .
. . .
. . .
. . .
. . .
. . .
. . .
. . .
. . .
. Shares Outstanding . . .
. . .
. . .
. . .
. . .
. . .
. . .
. . .
. . .
. . .
. . .
. . .
. . .
. . .
. . .
. . .
. . .
. . .
. . .
. Net Asset Value Per Share . . .
. . .
. . .
. . .
. . .
. . .
. . .
. . .
. . .
. . .
. . .
. . .
. . .
. . .
. . .
. . .
. . .
. . Investor Class Net Assets . .
. . .
. . .
. . .
. . .
. . .
. . .
. . .
. . .
. . .
. . .
. . .
. . .
. . .
. . .
. . .
. . .
. . .
. . .
. . .
. . .
. . . Shares Outstanding .
. . .
. . .
. . .
. . .
. . .
. . .
. . .
. . .
. . .
. . .
. . .
. . .
. . .
. . .
. . .
. . .
. . .
. . .
. . . Net Asset Value Per Share .
. . .
. . .
. . .
. . .
. . .
. . .
. . .
. . .
. . .
. . .
. . .
. . .
. . .
. . .
. . .
. . .
. . .
. SI Class Net Assets . . .
. . .
. . .
. . .
. . .
. . .
. . .
. . .
. . .
. . .
. . .
. . .
. . .
. . .
. . .
. . .
. . .
. . .
. . .
. . .
. . .
. . Shares Outstanding . .
. . .
. . .
. . .
. . .
. . .
. . .
. . .
. . .
. . .
. . .
. . .
. . .
. . .
. . .
. . .
. . .
. . .
. . .
. . Net Asset Value Per Share . .
. . .
. . .
. . .
. . .
. . .
. . .
. . .
. . .
. . .
. . .
. . .
. . .
. . .
. . .
. . .
. . .
. . . * ** *** **** ***** Investments, at cost .
. . .
. . .
. . .
. . .
. . .
. . .
. . .
. . .
. . .
. . .
. . .
. . .
. . .
. . .
. . .
. . .
. . . Affiliated investments, at cost .
. . .
. . .
. . .
. . .
. . .
. . .
. . .
. . .
. . .
. . .
. . .
. . .
. . .
. . .
. Repurchase agreements, at cost . . .
. . .
. . .
. . .
. . .
. . .
. . .
. . .
. . .
. . .
. . .
. . .
. . .
. . .
. Foreign cash, at cost . . .
. . .
. . .
. . .
. . .
. . .
. . .
. . .
. . .
. . .
. . .
. . .
. . .
. . .
. . .
. . .
. . .
. Swaps, at cost. . .
. . .
. . .
. . .
. . .
. . .
. . .
. . .
. . .
. . .
. . .
. . .
. . .
. . .
. . .
. . .
. . .
. . .
. . . See notes to financial statements. 78 Payden Mutual Funds .
Payden U.S. Government Fund Payden GNMA Fund Payden Core Bond Fund Payden Corporate Bond Fund Payden Strategic Income Fund Payden Absolute Return Bond Fund Payden Floating Rate Fund $129,771 13,048 — — — 225 $415,401 6,822 — — 1 411 $728,654 61,854 — — 106 2,795 $70,171 1,013 — — 15 — $161,164 5,912 — — 210 — $58,723 2,787 — — 6 165 $151,124 9,509 — — — — 315 151 1 — — — — 13 143,524 749 142 158 9 — — — 21 423,714 4,164 19,012 — 34 561 — — 55 817,235 729 100 — 32 25 — — 8 72,093 1,046 512 45 7 136 — — 14 169,046 232 2,031 — 4 51 — 1 18 64,018 809 12,463 — — — — — 25 173,930 17 — 8,331 2 — — 6 — — 144,057 732 — — 64 — 560 131,058 4 65 — — — 11 407 53 3 — — — 121 15,268 158 12 — — — 51 2,917 — 3 — — — — 7,182 2 — — — 10 17 — 1 44 8,428 $135,096 15 36 5 2 195 145,106 $278,608 158 84 5 5 147 132,086 $685,149 12 9 — 1 55 551 $71,542 51 19 1 1 63 15,694 $153,352 — 7 — 1 52 3,031 $60,987 48 22 — 1 63 7,318 $166,612 $138,217 (4) (3,559) $301,821 65 (30,203) $682,607 464 1,091 $70,036 29 817 $154,237 — (232) $61,369 89 (354) $169,262 95 (1,529) 442 — $135,096 6,925 — $278,608 987 — $685,149 646 14 $71,542 (668) 15 $153,352 (117) — $60,987 (1,216) — $166,612 $ 1,676 158 $ 10.63 $ 23,335 2,386 $ 9.78 $ 24,314 2,289 $ 10.62 — — — $ $ $ $133,420 12,547 $ 10.63 $255,273 26,086 $ 9.79 $660,835 62,115 $ 10.64 $71,542 6,520 $ 10.97 $108,789 10,927 $ 9.96 $42,121 4,245 $ 9.92 $ 42,478 4,296 $ 9.89 — — — — — — — — — — — — $ 37,766 3,794 $ 9.96 $18,830 1,896 $ 9.93 $124,005 12,531 $ 9.90 $129,289 13,048 — — — $408,497 6,822 — — — $724,964 64,840 — — — $69,529 1,013 — — — $161,894 5,912 — — — $58,829 2,787 — — — $152,340 9,509 — — — $ 6,797 684 9.94 $ 36 4 9.93 $ 129 13 9.90 See notes to financial statements. Annual Report 79 . Statements of Assets & Liabilities continued October 31, 2015 Numbers in 000s Payden High Income Fund ASSETS: Investments, at value * . . . .
. . .
. . .
. . .
. . .
. . .
. . .
. . .
. . .
. . .
. . .
. . .
. . .
. . .
. . .
. . .
. . .
. . . Affiliated investments, at value **.
. . .
. . .
. . .
. . .
. . .
. . .
. . .
. . .
. . .
. . .
. . .
. . .
. . .
. . .
. . .
. Foreign cash *** . . .
. . .
. . .
. . .
. . .
. . .
. . .
. . .
. . .
. . .
. . .
. . .
. . .
. . .
. . .
. . .
. . .
. . .
. . .
. . . Cash.
. . .
. . .
. . .
. . .
. . .
. . .
. . .
. . .
. . .
. . .
. . .
. . .
. . .
. . .
. . .
. . .
. . .
. . .
. . .
. . .
. . .
. . .
. . . Cash pledged for financial futures contracts .
. . .
. . .
. . .
. . .
. . .
. . .
. . .
. . .
. . .
. . .
. . .
. . .
. . . Receivable for: Interest and dividends .
. . .
. . .
. . .
. . .
. . .
. . .
. . .
. . .
. . .
. . .
. . .
. . .
. . .
. . .
. . .
. . .
. . .
. . Investments sold . .
. . .
. . .
. . .
. . .
. . .
. . .
. . .
. . .
. . .
. . .
. . .
. . .
. . .
. . .
. . .
. . .
. . .
. . .
. . Fund shares sold. .
. . .
. . .
. . .
. . .
. . .
. . .
. . .
. . .
. . .
. . .
. . .
. . .
. . .
. . .
. . .
. . .
. . .
. . .
. . . Futures .
. . .
. . .
. . .
. . .
. . .
. . .
. . .
. . .
. . .
. . .
. . .
. . .
. . .
. . .
. . .
. . .
. . .
. . .
. . .
. . .
. . .
. Forward currency contracts . . .
. . .
. . .
. . .
. . .
. . .
. . .
. . .
. . .
. . .
. . .
. . .
. . .
. . .
. . .
. . .
. . Variation margin on centrally cleared swaps . .
. . .
. . .
. . .
. . .
. . .
. . .
. . .
. . .
. . .
. . .
. . .
. . . Other assets .
. . .
. . .
. . .
. . .
. . .
. . .
. . .
. . .
. . .
. . .
. . .
. . .
. . .
. . .
. . .
. . .
. . .
. . .
. . .
. . .
. . . Total Assets .
. . .
. . .
. . .
. . .
. . .
. . .
. . .
. . .
. . .
. . .
. . .
. . .
. . .
. . .
. . .
. . .
. . .
. . .
. . . LIABILITIES: Payable for: Bank overdraft .
. . .
. . .
. . .
. . .
. . .
. . .
. . .
. . .
. . .
. . .
. . .
. . .
. . .
. . .
. . .
. . .
. . .
. . .
. . .
. . Forward currency contracts . .
. . .
. . .
. . .
. . .
. . .
. . .
. . .
. . .
. . .
. . .
. . .
. . .
. . .
. . .
. . .
. . . Investments purchased .
. . .
. . .
. . .
. . .
. . .
. . .
. . .
. . .
. . .
. . .
. . .
. . .
. . .
. . .
. . .
. . .
. . .
. . Fund shares redeemed . .
. . .
. . .
. . .
. . .
. . .
. . .
. . .
. . .
. . .
. . .
. . .
. . .
. . .
. . .
. . .
. . .
. . .
. Futures . . .
. . .
. . .
. . .
. . .
. . .
. . .
. . .
. . .
. . .
. . .
. . .
. . .
. . .
. . .
. . .
. . .
. . .
. . .
. . .
. . .
. . Swaps **** . .
. . .
. . .
. . .
. . .
. . .
. . .
. . .
. . .
. . .
. . .
. . .
. . .
. . .
. . .
. . .
. . .
. . .
. . .
. . .
. . . Variation margin payable on centrally cleared swaps .
. . .
. . .
. . .
. . .
. . .
. . .
. . .
. . .
. . .
. . . Distributions payable.
. . .
. . .
. . .
. . .
. . .
. . .
. . .
. . .
. . .
. . .
. . .
. . .
. . .
. . .
. . .
. . .
. . .
. . .
. . Accrued expenses: Investment advisory fees (Note 3) . .
. . .
. . .
. . .
. . .
. . .
. . .
. . .
. . .
. . .
. . .
. . .
. . .
. . .
. . .
. Administration fees (Note 3) . . .
. . .
. . .
. . .
. . .
. . .
. . .
. . .
. . .
. . .
. . .
. . .
. . .
. . .
. . .
. . .
. Distribution fees (Note 3) . . .
. . .
. . .
. . .
. . .
. . .
. . .
. . .
. . .
. . .
. . .
. . .
. . .
. . .
. . .
. . .
. . . Trustee fees and expenses .
. . .
. . .
. . .
. . .
. . .
. . .
. . .
. . .
. . .
. . .
. . .
. . .
. . .
. . .
. . .
. . .
. . . Other liabilities .
. . .
. . .
. . .
. . .
. . .
. . .
. . .
. . .
. . .
. . .
. . .
. . .
. . .
. . .
. . .
. . .
. . .
. . .
. . .
. . . Total Liabilities .
. . .
. . .
. . .
. . .
. . .
. . .
. . .
. . .
. . .
. . .
. . .
. . .
. . .
. . .
. . .
. . .
. . .
. . . NET ASSETS .
. . .
. . .
. . .
. . .
. . .
. . .
. . .
. . .
. . .
. . .
. . .
. . .
. . .
. . .
. . .
. . .
. . .
. . .
. NET ASSETS: Paid in capital . . .
. . .
. . .
. . .
. . .
. . .
. . .
. . .
. . .
. . .
. . .
. . .
. . .
. . .
. . .
. . .
. . .
. . .
. . .
. . .
. . Undistributed net investment income (loss) . .
. . .
. . .
. . .
. . .
. . .
. . .
. . .
. . .
. . .
. . .
. . .
. . .
. . Undistributed net realized gains (losses) from investments. .
. . .
. . .
. . .
. . .
. . .
. . .
. . .
. . .
. . . Net unrealized appreciation (depreciation) from: Investments .
. . .
. . .
. . .
. . .
. . .
. . .
. . .
. . .
. . .
. . .
. . .
. . .
. . .
. . .
. . .
. . .
. . .
. . .
. . .
. . .
. Translation of assets and liabilities in foreign currencies . . .
. . .
. . .
. . .
. . .
. . .
. . .
. . .
. . .
. . NET ASSETS . .
. . .
. . .
. . .
. . .
. . .
. . .
. . .
. . .
. . .
. . .
. . .
. . .
. . .
. . .
. . .
. . .
. . .
. . .
. . .
. NET ASSET VALUE — offering and redemption price per share in whole dollars Adviser Class Net Assets . . .
. . .
. . .
. . .
. . .
. . .
. . .
. . .
. . .
. . .
. . .
. . .
. . .
. . .
. . .
. . .
. . .
. . .
. . .
. . .
. . . Shares Outstanding .
. . .
. . .
. . .
. . .
. . .
. . .
. . .
. . .
. . .
. . .
. . .
. . .
. . .
. . .
. . .
. . .
. . .
. . .
. Net Asset Value Per Share . . .
. . .
. . .
. . .
. . .
. . .
. . .
. . .
. . .
. . .
. . .
. . .
. . .
. . .
. . .
. . .
. . . Investor Class Net Assets .
. . .
. . .
. . .
. . .
. . .
. . .
. . .
. . .
. . .
. . .
. . .
. . .
. . .
. . .
. . .
. . .
. . .
. . .
. . .
. . .
. . Shares Outstanding . .
. . .
. . .
. . .
. . .
. . .
. . .
. . .
. . .
. . .
. . .
. . .
. . .
. . .
. . .
. . .
. . .
. . .
. . . Net Asset Value Per Share .
. . .
. . .
. . .
. . .
. . .
. . .
. . .
. . .
. . .
. . .
. . .
. . .
. . .
. . .
. . .
. . .
. . SI Class Net Assets . .
. . .
. . .
. . .
. . .
. . .
. . .
. . .
. . .
. . .
. . .
. . .
. . .
. . .
. . .
. . .
. . .
. . .
. . .
. . .
. . .
. Shares Outstanding . . .
. . .
. . .
. . .
. . .
. . .
. . .
. . .
. . .
. . .
. . .
. . .
. . .
. . .
. . .
. . .
. . .
. . .
. . Net Asset Value Per Share . .
. . .
. . .
. . .
. . .
. . .
. . .
. . .
. . .
. . .
. . .
. . .
. . .
. . .
. . .
. . .
. . .
. * ** *** **** Investments, at cost . . .
. . .
. . .
. . .
. . .
. . .
. . .
. . .
. . .
. . .
. . .
. . .
. . .
. . .
. . .
. . .
. . Affiliated investments, at cost . .
. . .
. . .
. . .
. . .
. . .
. . .
. . .
. . .
. . .
. . .
. . .
. . .
. . .
. . Foreign cash, at cost . .
. . .
. . .
. . .
. . .
. . .
. . .
. . .
. . .
. . .
. . .
. . .
. . .
. . .
. . .
. . .
. . . Swaps, at cost .
. . .
. . .
. . .
. . .
. . .
. . .
. . .
. . .
. . .
. . .
. . .
. . .
. . .
. . .
. . .
. . .
. . .
. . . Payden California Municipal Income Fund Payden Global Low Duration Fund $556,120 56,858 — — 1,824 $46,281 — — — — $126,805 1,959 2 — — 9,086 802 503 14 347 — 52 625,606 483 — 243 — — — 5 47,012 495 73 2,227 3 103 35 10 131,712 15 379 610 201 — — 54 — — — 977 30 — — — 21 7 50 1,138 41 1 26 — — 179 77 2 5 268 1,790 $623,816 6 6 — — 34 1,074 $45,938 14 16 — 1 74 1,368 $130,344 $646,655 171 (20,665) $43,749 (4) 548 $132,813 — (931) (2,313) (32) $623,816 1,645 — $45,938 (1,591) 53 $130,344 $ 19,879 3,099 $ 6.42 — — — — — — $603,937 94,370 $ 6.40 $45,938 4,421 $ 10.39 $130,344 13,026 $ 10.01 — — — — — — — — — $557,871 57,241 — — $44,636 — — — $128,354 1,959 2 (20) See notes to financial statements. 80 Payden Mutual Funds .
Payden Global Fixed Income Fund Payden Emerging Markets Bond Fund Payden Emerging Markets Local Bond Fund Payden Emerging Markets Corporate Bond Fund Payden Equity Income Fund $68,895 12,113 28 10 48 $ 938,126 29,165 — 3,020 1,915 $119,017 6,911 1,025 — — $34,542 795 — 7 — $558,865 4,212 — 110 — 524 — 368 17 477 — 9 82,489 13,962 5,360 149 — 270 — 72 992,039 2,324 — 35 — 6 — 19 129,337 496 242 — — 5 — 15 36,102 1,038 — 431 — — — 36 564,692 — 395 1,698 15 8 — — — — 1,269 24,863 965 — — — — — 203 2,819 — — — — — — 30 4 — — — — — — — — 829 — — — — 8 10 — 1 61 2,196 $80,293 309 123 6 7 388 27,930 $ 964,109 37 15 — 1 123 3,198 $126,139 5 5 — — 41 85 $36,017 234 70 1 4 190 1,328 $563,364 $81,325 — 773 $1,031,548 2,370 (30,919) $171,851 — (19,373) $37,281 18 (557) $519,657 1,352 (1,928) (1,885) 80 $80,293 (37,882) (1,008) $ 964,109 (26,051) (288) $126,139 (700) (25) $36,017 44,283 — $563,364 $ $ $ $ — — — $ 29,481 2,251 13.10 $ 169 25 6.66 $ 16 2 9.63 $ 4,567 327 13.98 $80,293 9,051 $ 8.87 $ 416,408 31,843 $ 13.08 $125,970 18,911 $ 6.66 $ 1,401 146 $ 9.62 $281,163 20,120 $ 13.97 — — — $ 518,220 39,662 $ 13.07 — — — $34,600 3,594 $ 9.63 $277,634 19,866 $ 13.97 $69,696 13,232 28 — $ 976,008 29,165 — — $144,778 7,201 1,018 — $35,242 795 — — $514,582 4,212 — — See notes to financial statements. Annual Report 81 . Statements of Operations Year ended October 31, 2015 Numbers in 000s Payden Cash Reserves Money Market Fund INVESTMENT INCOME: Interest income (Note 2) . . . .
. . .
. . .
. . .
. . .
. . .
. . .
. . .
. . .
. . .
. . .
. . .
. . .
. . .
. . .
. . .
. . .
. . .
. Dividend income . . .
. . .
. . .
. . .
. . .
. . .
. . .
. . .
. . .
. . .
. . .
. . .
. . .
. . .
. . .
. . .
. . .
. . .
. . .
. . .
. . Dividend income from affiliated investment (Note 2) . .
. . .
. . .
. . .
. . .
. . .
. . .
. . .
. . .
. . .
. . .
. . Income from securities lending . .
. . .
. . .
. . .
. . .
. . .
. . .
. . .
. . .
. . .
. . .
. . .
. . .
. . .
. . .
. . .
. . .
. Investment Income . . .
. . .
. . .
. . .
. . .
. . .
. . .
. . .
. . .
. . .
. . .
. . .
. . .
. . .
. . .
. . .
. . .
. . .
. . .
. . . EXPENSES: Investment advisory fees (Note 3) .
. . .
. . .
. . .
. . .
. . .
. . .
. . .
. . .
. . .
. . .
. . .
. . .
. . .
. . .
. . .
. . . Administration fees (Note 3) .
. . .
. . .
. . .
. . .
. . .
. . .
. . .
. . .
. . .
. . .
. . .
. . .
. . .
. . .
. . .
. . .
. . .
. Shareholder servicing fees. . .
. . .
. . .
. . .
. . .
. . .
. . .
. . .
. . .
. . .
. . .
. . .
. . .
. . .
. . .
. . .
. . .
. . .
. . Distribution fees (Note 3) . .
. . .
. . .
. . .
. . .
. . .
. . .
. . .
. . .
. . .
. . .
. . .
. . .
. . .
. . .
. . .
. . .
. . .
. . Custodian fees . .
. . .
. . .
. . .
. . .
. . .
. . .
. . .
. . .
. . .
. . .
. . .
. . .
. . .
. . .
. . .
. . .
. . .
. . .
. . .
. . .
. . Transfer agent fees . .
. . .
. . .
. . .
. . .
. . .
. . .
. . .
. . .
. . .
. . .
. . .
. . .
. . .
. . .
. . .
. . .
. . .
. . .
. . .
. . Registration and filing fees . .
. . .
. . .
. . .
. . .
. . .
. . .
. . .
. . .
. . .
. . .
. . .
. . .
. . .
. . .
. . .
. . .
. . .
. Trustee fees and expenses . . .
. . .
. . .
. . .
. . .
. . .
. . .
. . .
. . .
. . .
. . .
. . .
. . .
. . .
. . .
. . .
. . .
. . .
. . Printing and mailing costs . .
. . .
. . .
. . .
. . .
. . .
. . .
. . .
. . .
. . .
. . .
. . .
. . .
. . .
. . .
. . .
. . .
. . .
. . Loan commitment fees . .
. . .
. . .
. . .
. . .
. . .
. . .
. . .
. . .
. . .
. . .
. . .
. . .
. . .
. . .
. . .
. . .
. . .
. . .
. . Legal fees . .
. . .
. . .
. . .
. . .
. . .
. . .
. . .
. . .
. . .
. . .
. . .
. . .
. . .
. . .
. . .
. . .
. . .
. . .
. . .
. . .
. . .
. . . Publication expense .
. . .
. . .
. . .
. . .
. . .
. . .
. . .
. . .
. . .
. . .
. . .
. . .
. . .
. . .
. . .
. . .
. . .
. . .
. . .
. . Pricing fees . .
. . .
. . .
. . .
. . .
. . .
. . .
. . .
. . .
. . .
. . .
. . .
. . .
. . .
. . .
. . .
. . .
. . .
. . .
. . .
. . .
. . .
. Fund accounting fees . . .
. . .
. . .
. . .
. . .
. . .
. . .
. . .
. . .
. . .
. . .
. . .
. . .
. . .
. . .
. . .
. . .
. . .
. . .
. . Insurance . .
. . .
. . .
. . .
. . .
. . .
. . .
. . .
. . .
. . .
. . .
. . .
. . .
. . .
. . .
. . .
. . .
. . .
. . .
. . .
. . .
. . .
. . . Audit fees .
. . .
. . .
. . .
. . .
. . .
. . .
. . .
. . .
. . .
. . .
. . .
. . .
. . .
. . .
. . .
. . .
. . .
. . .
. . .
. . .
. . .
. . . Other expenses.
. . .
. . .
. . .
. . .
. . .
. . .
. . .
. . .
. . .
. . .
. . .
. . .
. . .
. . .
. . .
. . .
. . .
. . .
. . .
. . .
. . . Gross Expenses.
. . .
. . .
. . .
. . .
. . .
. . .
. . .
. . .
. . .
. . .
. . .
. . .
. . .
. . .
. . .
. . .
. . .
. . .
. . .
. . .
. Expense subsidy (Note 3) . . .
. . .
. . .
. . .
. . .
. . .
. . .
. . .
. . .
. . .
. . .
. . .
. . .
. . .
. . .
. . .
. . .
. . .
. . Net Expenses . .
. . .
. . .
. . .
. . .
. . .
. . .
. . .
. . .
. . .
. . .
. . .
. . .
. . .
. . .
. . .
. . .
. . .
. . .
. . .
. . .
. Net Investment Income . . .
. . .
. . .
. . .
. . .
. . .
. . .
. . .
. . .
. . .
. . .
. . .
. . .
. . .
. . .
. . .
. . .
. . REALIZED AND UNREALIZED GAINS (LOSSES): Net realized gains (losses) from: Investments . .
. . .
. . .
. . .
. . .
. . .
. . .
. . .
. . .
. . .
. . .
. . .
. . .
. . .
. . .
. . .
. . .
. . .
. . .
. . .
. . .
. . Foreign currency transactions . .
. . .
. . .
. . .
. . .
. . .
. . .
. . .
. . .
. . .
. . .
. . .
. . .
. . .
. . .
. . .
. . .
. Futures contracts . . .
. . .
. . .
. . .
. . .
. . .
. . .
. . .
. . .
. . .
. . .
. . .
. . .
. . .
. . .
. . .
. . .
. . .
. . .
. . . Swap contracts .
. . .
. . .
. . .
. . .
. . .
. . .
. . .
. . .
. . .
. . .
. . .
. . .
. . .
. . .
. . .
. . .
. . .
. . .
. . .
. . .
. Change in net unrealized appreciation (depreciation) from: Investments . . .
. . .
. . .
. . .
. . .
. . .
. . .
. . .
. . .
. . .
. . .
. . .
. . .
. . .
. . .
. . .
. . .
. . .
. . .
. . .
. . .
. Translation of assets and liabilities in foreign currencies . . .
. . .
. . .
. . .
. . .
. . .
. . .
. . .
. . .
. . .
. Affiliated investments . . .
. . .
. . .
. . .
. . .
. . .
. . .
. . .
. . .
. . .
. . .
. . .
. . .
. . .
. . .
. . .
. . .
. . .
. . Futures contracts . .
. . .
. . .
. . .
. . .
. . .
. . .
. . .
. . .
. . .
. . .
. . .
. . .
. . .
. . .
. . .
. . .
. . .
. . .
. . .
. Swap contracts . . .
. . .
. . .
. . .
. . .
. . .
. . .
. . .
. . .
. . .
. . .
. . .
. . .
. . .
. . .
. . .
. . .
. . .
. . .
. . .
. . Net Realized and Unrealized Gains (Losses) . .
. . .
. . .
. . .
. . .
. . .
. . .
. . .
. . .
. . .
. . .
. . .
. . . CHANGE IN NET ASSETS RESULTING FROM OPERATIONS.
. . .
. . .
. . .
. . .
. . .
. . .
. . .
. . (1) Fund commenced operations on November 6, 2014. See notes to financial statements. 82 Payden Mutual Funds 401 — — — 401 $ 3,434 — 1 6 3,441 $13,997 19 1 11 14,028 1,095 586 187 — 52 42 52 37 21 6 13 10 39 45 17 35 2 2,239 (1,031) 1,208 2,233 2,478 1,327 585 — 79 98 47 89 47 16 29 27 47 98 47 35 — 5,049 (889) 4,160 9,868 6 — — — $ Payden Low Duration Fund 604 604 — — 39 44 69 42 24 — 12 16 4 50 27 31 — 1,566 (1,205) 361 40 $ Payden Limited Maturity Fund (1,424) 2,972 (424) — (2,550) 3,447 (1,018) 259 — — — — — 6 46 (2,274) (235) — — — (1,385) $ 848 (5,101) (70) — (204) (34) (5,271) $ 4,597 . Payden U.S. Government Fund Payden GNMA Fund Payden Core Bond Fund Payden Corporate Bond Fund Payden Strategic Income Fund Payden Absolute Return Bond Fund(1) Payden Floating Rate Fund $1,605 — 1 — 1,606 $ 5,863 — 1 — 5,864 $16,347 — 1,562 20 17,929 $ 2,634 — — 4 2,638 $3,532 97 — 4 3,633 $1,155 — — — 1,155 $ 6,715 — 1 — 6,716 354 189 8 2 21 31 38 12 7 2 4 5 11 18 7 35 — 744 (174) 570 1,036 778 432 388 57 44 61 48 29 17 5 9 13 24 34 16 38 — 1,993 (495) 1,498 4,366 1,771 949 184 55 53 61 43 62 35 11 20 18 28 71 29 37 4 3,431 — 3,431 14,498 239 102 51 — 18 18 23 7 4 1 2 3 13 12 3 37 — 533 (90) 443 2,195 674 184 33 15 19 43 33 11 11 2 4 2 32 17 4 36 — 1,120 (174) 946 2,687 225 68 — — 26 32 55 4 27 1 7 2 24 10 — 42 4 527 (239) 288 867 960 262 6 — 14 45 38 17 12 — 6 5 20 24 9 51 3 1,472 (284) 1,188 5,528 88 — 6 — 1,458 — (1,109) (35) 5,936 2,614 (1,822) (3,164) 771 81 84 (113) (725) 569 (75) — 106 97 (383) (57) (1,527) — — — 155 — — (56) — 193 $1,229 747 — — 266 28 1,355 $ 5,721 (7,466) (89) (2,608) 490 1,900 (4,209) $10,289 (1,479) 14 — (49) 69 (622) $ 1,573 (136) 41 — 62 — (264) $2,423 (106) — — (11) — (354) $ 513 622 — — — — (905) $ 4,623 See notes to financial statements. Annual Report 83 . Statements of Operations continued Year ended October 31, 2015 Numbers in 000s Payden High Income Fund INVESTMENT INCOME: Interest income (Note 2) . . . .
. . .
. . .
. . .
. . .
. . .
. . .
. . .
. . .
. . .
. . .
. . .
. . .
. . .
. . .
. . .
. . .
. . Dividend income . .
. . .
. . .
. . .
. . .
. . .
. . .
. . .
. . .
. . .
. . .
. . .
. . .
. . .
. . .
. . .
. . .
. . .
. . .
. . .
. Dividend income from affiliated investment (Note 2) . . .
. . .
. . .
. . .
. . .
. . .
. . .
. . .
. . .
. . .
. . Income from securities lending . .
. . .
. . .
. . .
. . .
. . .
. . .
. . .
. . .
. . .
. . .
. . .
. . .
. . .
. . .
. . .
. . Foreign tax withholdings . .
. . .
. . .
. . .
. . .
. . .
. . .
. . .
. . .
. . .
. . .
. . .
. . .
. . .
. . .
. . .
. . .
. . .
. Investment Income . . .
. . .
. . .
. . .
. . .
. . .
. . .
. . .
. . .
. . .
. . .
. . .
. . .
. . .
. . .
. . .
. . .
. . .
. . .
. EXPENSES: Investment advisory fees (Note 3) . . .
. . .
. . .
. . .
. . .
. . .
. . .
. . .
. . .
. . .
. . .
. . .
. . .
. . .
. . .
. . Administration fees (Note 3) . .
. . .
. . .
. . .
. . .
. . .
. . .
. . .
. . .
. . .
. . .
. . .
. . .
. . .
. . .
. . .
. . .
. Shareholder servicing fees. . .
. . .
. . .
. . .
. . .
. . .
. . .
. . .
. . .
. . .
. . .
. . .
. . .
. . .
. . .
. . .
. . .
. . . Distribution fees (Note 3) .
. . .
. . .
. . .
. . .
. . .
. . .
. . .
. . .
. . .
. . .
. . .
. . .
. . .
. . .
. . .
. . .
. . .
. Custodian fees . . .
. . .
. . .
. . .
. . .
. . .
. . .
. . .
. . .
. . .
. . .
. . .
. . .
. . .
. . .
. . .
. . .
. . .
. . .
. . .
. . Transfer agent fees . .
. . .
. . .
. . .
. . .
. . .
. . .
. . .
. . .
. . .
. . .
. . .
. . .
. . .
. . .
. . .
. . .
. . .
. . .
. . . Registration and filing fees .
. . .
. . .
. . .
. . .
. . .
. . .
. . .
. . .
. . .
. . .
. . .
. . .
. . .
. . .
. . .
. . .
. . . Trustee fees and expenses .
. . .
. . .
. . .
. . .
. . .
. . .
. . .
. . .
. . .
. . .
. . .
. . .
. . .
. . .
. . .
. . .
. . .
. . Printing and mailing costs. .
. . .
. . .
. . .
. . .
. . .
. . .
. . .
. . .
. . .
. . .
. . .
. . .
. . .
. . .
. . .
. . .
. . . Loan commitment fees .
. . .
. . .
. . .
. . .
. . .
. . .
. . .
. . .
. . .
. . .
. . .
. . .
. . .
. . .
. . .
. . .
. . .
. . .
. Legal fees . . .
. . .
. . .
. . .
. . .
. . .
. . .
. . .
. . .
. . .
. . .
. . .
. . .
. . .
. . .
. . .
. . .
. . .
. . .
. . .
. . .
. . . Publication expense .
. . .
. . .
. . .
. . .
. . .
. . .
. . .
. . .
. . .
. . .
. . .
. . .
. . .
. . .
. . .
. . .
. . .
. . .
. . . Pricing fees .
. . .
. . .
. . .
. . .
. . .
. . .
. . .
. . .
. . .
. . .
. . .
. . .
. . .
. . .
. . .
. . .
. . .
. . .
. . .
. . .
. . . Fund accounting fees .
. . .
. . .
. . .
. . .
. . .
. . .
. . .
. . .
. . .
. . .
. . .
. . .
. . .
. . .
. . .
. . .
. . .
. . .
. . Insurance . .
. . .
. . .
. . .
. . .
. . .
. . .
. . .
. . .
. . .
. . .
. . .
. . .
. . .
. . .
. . .
. . .
. . .
. . .
. . .
. . .
. . .
. Audit fees . . .
. . .
. . .
. . .
. . .
. . .
. . .
. . .
. . .
. . .
. . .
. . .
. . .
. . .
. . .
. . .
. . .
. . .
. . .
. . .
. . .
. . Other expenses. .
. . .
. . .
. . .
. . .
. . .
. . .
. . .
. . .
. . .
. . .
. . .
. . .
. . .
. . .
. . .
. . .
. . .
. . .
. . .
. . . Gross Expenses .
. . .
. . .
. . .
. . .
. . .
. . .
. . .
. . .
. . .
. . .
. . .
. . .
. . .
. . .
. . .
. . .
. . .
. . .
. . .
. Expense subsidy (Note 3) . . .
. . .
. . .
. . .
. . .
. . .
. . .
. . .
. . .
. . .
. . .
. . .
. . .
. . .
. . .
. . .
. . .
. . . Net Expenses .
. . .
. . .
. . .
. . .
. . .
. . .
. . .
. . .
. . .
. . .
. . .
. . .
. . .
. . .
. . .
. . .
. . .
. . .
. . .
. . . Net Investment Income .
. . .
. . .
. . .
. . .
. . .
. . .
. . .
. . .
. . .
. . .
. . .
. . .
. . .
. . .
. . .
. . .
. . REALIZED AND UNREALIZED GAINS (LOSSES): Net realized gains (losses) from: Investments . .
. . .
. . .
. . .
. . .
. . .
. . .
. . .
. . .
. . .
. . .
. . .
. . .
. . .
. . .
. . .
. . .
. . .
. . .
. . .
. . . Foreign currency transactions.
. . .
. . .
. . .
. . .
. . .
. . .
. . .
. . .
. . .
. . .
. . .
. . .
. . .
. . .
. . .
. . . Affiliated investments .
. . .
. . .
. . .
. . .
. . .
. . .
. . .
. . .
. . .
. . .
. . .
. . .
. . .
. . .
. . .
. . .
. . .
. . Futures contracts . .
. . .
. . .
. . .
. . .
. . .
. . .
. . .
. . .
. . .
. . .
. . .
. . .
. . .
. . .
. . .
. . .
. . .
. . .
. . Swap contracts . .
. . .
. . .
. . .
. . .
. . .
. . .
. . .
. . .
. . .
. . .
. . .
. . .
. . .
. . .
. . .
. . .
. . .
. . .
. . .
. Change in net unrealized appreciation (depreciation) from: Investments . . .
. . .
. . .
. . .
. . .
. . .
. . .
. . .
. . .
. . .
. . .
. . .
. . .
. . .
. . .
. . .
. . .
. . .
. . .
. . .
. . Translation of assets and liabilities in foreign currencies . .
. . .
. . .
. . .
. . .
. . .
. . .
. . .
. . .
. . . Affiliated investments .
. . .
. . .
. . .
. . .
. . .
. . .
. . .
. . .
. . .
. . .
. . .
. . .
. . .
. . .
. . .
. . .
. . .
. . Futures contracts . .
. . .
. . .
. . .
. . .
. . .
. . .
. . .
. . .
. . .
. . .
. . .
. . .
. . .
. . .
. . .
. . .
. . .
. . .
. . Swap contracts . .
. . .
. . .
. . .
. . .
. . .
. . .
. . .
. . .
. . .
. . .
. . .
. . .
. . .
. . .
. . .
. . .
. . .
. . .
. . .
. Net Realized and Unrealized Gains (Losses) . . .
. . .
. . .
. . .
. . .
. . .
. . .
. . .
. . .
. . .
. . .
. . . CHANGE IN NET ASSETS RESULTING FROM OPERATIONS.
. . .
. . .
. . .
. . .
. . .
. . .
. . . Payden California Municipal Income Fund Payden Global Low Duration Fund $ 38,512 581 567 186 — 39,846 $1,220 — — — — 1,220 $ 2,129 10 — 2 — 2,141 2,341 1,003 535 29 51 101 86 69 38 13 22 26 15 76 40 42 — 4,487 — 4,487 35,359 143 67 8 — 4 16 2 4 2 1 1 2 13 11 2 35 — 311 (65) 246 974 371 185 85 — 34 24 21 12 6 2 4 4 36 18 8 38 — 848 (167) 681 1,460 (21,790) 2,075 — (854) 23 549 — — — — (1,597) 1,756 — (255) 45 (20,392) (108) (734) (138) — (41,918) $ (6,559) (700) — — — — (151) $ 823 (941) (59) — (27) (6) (1,084) $ 376 See notes to financial statements. 84 Payden Mutual Funds .
Payden Global Fixed Income Fund Payden Emerging Markets Bond Fund Payden Emerging Markets Local Bond Fund Payden Emerging Markets Corporate Bond Fund Payden Equity Income Fund $1,014 — 501 1 — 1,516 $ 53,711 — 2 74 (21) 53,766 $ 9,147 — 177 — (46) 9,278 $ 2,066 — — 9 — 2,075 $ 32 17,951 1 12 — 17,996 186 93 64 — 30 19 24 6 5 1 2 2 17 12 2 38 2 503 (91) 412 1,104 4,218 1,406 776 65 91 105 37 94 67 17 30 27 20 103 45 42 11 7,154 (332) 6,822 46,944 893 223 2 1 127 33 54 15 9 3 6 7 19 21 9 42 — 1,464 (28) 1,436 7,842 311 58 — — 6 35 28 4 4 1 1 3 12 10 2 42 — 517 (185) 332 1,743 2,711 813 327 12 44 83 59 54 37 10 18 10 3 61 20 35 — 4,297 (321) 3,976 14,020 (546) 2,295 (337) (162) — (21,201) 3,216 — — — (28,008) (747) — — (53) (608) 50 — — — (1,460) 3 — (861) — (730) 107 (589) 14 — 52 $1,156 (50,606) (1,981) — — — (70,572) $(23,628) (6,947) (280) (298) — — (36,333) $(28,491) (1,708) (25) — — — (2,291) $ (548) 1,237 — — — — (1,081) $12,939 See notes to financial statements. Annual Report 85 . Statements of Changes in Net Assets For the years ended October 31st, Numbers in 000s Payden Cash Reserves Money Market Fund 2015 2014 Payden Limited Maturity Fund 2015 2014 INCREASE (DECREASE) IN NET ASSETS: FROM OPERATIONS: Net investment income . . . .
. . .
. . .
. . .
. . .
. . . Net realized gains (losses) on investments .
. . .
. . . Change in net unrealized appreciation/(depreciation) Change in Net Assets Resulting from Operations. . . . . . . . . . . . . . . . . . . . . FROM DISTRIBUTIONS TO SHAREHOLDERS: Net investment income: Adviser Class .
. . .
. . .
. . .
. . .
. . .
. . .
. . .
. . .
. . .
. . . Investor Class .
. . .
. . .
. . .
. . .
. . .
. . .
. . .
. . .
. . .
. . . Net realized gains from investments: Adviser Class .
. . .
. . .
. . .
. . .
. . .
. . .
. . .
. . .
. . .
. . . Investor Class .
. . .
. . .
. . .
. . .
. . .
. . .
. . .
. . .
. . .
. . . Return of capital: Investor Class .
. . .
. . .
. . .
. . .
. . .
. . .
. . .
. . .
. . .
. . . Change in Net Assets from Distributions to Shareholders FROM CAPITAL TRANSACTIONS: Proceeds from fund shares sold: Adviser Class .
. . .
. . .
. . .
. . .
. . .
. . .
. . .
. . . Investor Class .
. . .
. . .
. . .
. . .
. . .
. . .
. . .
. . . Reinvestment of distributions: Adviser Class .
. . .
. . .
. . .
. . .
. . .
. . .
. . .
. . . Investor Class .
. . .
. . .
. . .
. . .
. . .
. . .
. . .
. . . Cost of fund shares redeemed: Adviser Class .
. . .
. . .
. . .
. . .
. . .
. . .
. . .
. . . Investor Class .
. . .
. . .
. . .
. . .
. . .
. . .
. . .
. . . Change in Net Assets from Capital Transactions Total Change in Net Assets .
. . .
. . .
. . .
. . . . . . . . . . . . . . . . . . . . . . . . . . . . . . . . . . . . . . . . . . . . . . . . . . . . . . . . . . . . . . . . . . . . . . 40 6 — 46 52 — — 52 $ 2,233 1,124 (2,509) 848 $ 2,519 1,684 (1,649) 2,554 — (40) — (50) — (1,596) — (2,444) ................. ................. — — — — — — — — ................. ................. — (40) (2) (52) (1,266) (2,862) — (2,444) ....................... ....................... — 30,676,204 — 25,153,180 — 411,658 — 293,849 ....................... ....................... — 14 — 11 — 2,750 — 2,311 — (30,774,499) (98,281) (98,275) — (25,160,942) (7,751) (7,751) — (308,069) 106,339 104,325 — (235,881) 60,279 60,389 498,417 490,666 (3) 318,671 $ 422,996 $ (9) 258,282 $ 318,671 $ 19 . . . . . . . . . . . . . . . . . . . . . . . . . . . . . . . . . . . . . . . . . . . . . . . . . . . . . . . . . . . . . . . . . . . . . . . . . . . . . . . . . . . . . . . . . . . . $ $ 490,666 392,391 — $ $ . . . . . . . . . . . . . . . . . . . . . . . . . . . . . . . . . . . . . . . . . . . . . . . . . . . . . . . . . . . . . . . . . . . . . . . . . . . . . . . . . . . . . . . . . . . . . . . . . . . . . . . . . . . . . . . . . . . . . . . . . . . . . . . . . . . . . . . . . . — — — — — — — — — — — — — — — — — — — — — — — — . . . . . . . . . . . . . . . . . . . . . . . . . . . . . . . . . . . . . . . . . . . . . . . . . . . . . . . . . . . . . . . . . . . . . . . . . . . . . . . . . . . . . . . . . . . . . . . . . . . . . . . . . . . . . . . . . . . . . . . . . . . . . . . . . . . . . . . . . . 490,664 30,676,204 14 (30,774,499) (98,281) 392,383 498,415 25,153,180 11 (25,160,942) (7,751) 490,664 33,648 43,514 291 (32,561) 11,244 44,892 27,283 31,010 244 (24,889) 6,365 33,648 . . . . . . . . . . . . . . . . . . . . . . . . . . . . . . . . . . . . . . . . . . . . . . . . . . . . . . . . . . . . . . . . . . . . . . . . . . . . . . . . . . . . . . . . . . . . — — — — — — — — 159,806 126,143 18,796 6,880 215,081 165,689 7,050 7,496 See notes to financial statements. 86 Payden Mutual Funds $ ................. ................. NET ASSETS: Beginning of period . .
. . .
. . .
. . .
. . .
. . .
. . .
. . .
. . .
. . .
. . .
. . .
. . .
. . .
. . . End of period .
. . .
. . .
. . .
. . .
. . .
. . .
. . .
. . .
. . .
. . .
. . .
. . .
. . .
. . .
. . .
. . Accumulated net investment income/(loss) . .
. . .
. . .
. . .
. . .
. . .
. . .
. . .
. . .
. . . FUND SHARES OF BENEFICIAL INTEREST: Adviser Class: Outstanding shares at beginning of period .
. . .
. . Shares sold . .
. . .
. . .
. . .
. . .
. . .
. . .
. . .
. . .
. Shares issued in reinvestment of distributions . . .
. Shares redeemed . . .
. . .
. . .
. . .
. . .
. . .
. . .
. . Change in shares outstanding. .
. . .
. . .
. . .
. . .
. Outstanding shares at end of period . . .
. . .
. . .
. Investor Class: Outstanding shares at beginning of period . . .
. . . Shares sold .
. . .
. . .
. . .
. . .
. . .
. . .
. . .
. . .
. . Shares issued in reinvestment of distributions . .
. . Shares redeemed . .
. . .
. . .
. . .
. . .
. . .
. . .
. . . Change in shares outstanding.
. . .
. . .
. . .
. . .
. . Outstanding shares at end of period . .
. . .
. . .
. . LONG TERM INVESTMENT ACTIVITY: Purchase of investments (excluding government). . Sale of investments (excluding government) .
. . .
. Purchase of government securities. . .
. . .
. . .
. . . Sale of government securities .
. . .
. . .
. . .
. . .
. . $ . Payden Low Duration Fund 2015 2014 $ Payden U.S. Government Fund 2015 2014 $ 1,036 94 99 1,229 $ 971 (113) 1,077 1,935 Payden GNMA Fund 2015 $ 4,366 314 1,041 5,721 Payden Core Bond Fund 2014 $ 2015 2014 5,518 1,281 4,412 11,211 $ 14,498 3,564 (7,773) 10,289 $ 15,398 7,315 7,153 29,866 9,868 138 (5,409) 4,597 $ 10,917 2,372 (2,690) 10,599 — (9,704) — (10,925) (12) (1,845) (8) (1,855) (778) (9,730) (1,059) (12,947) (549) (16,315) (9) (17,322) (3,410) — — — — — — — — — — (150) (4,359) (3) (4,549) (207) (13,321) — (10,925) — (1,857) — (1,863) — (10,508) — (14,006) — (21,373) — (21,883) — 630,953 — 622,667 1,459 25,583 478 22,869 7,721 44,178 5,669 47,999 20,936 149,778 5,239 128,102 — 11,794 — 9,705 12 1,770 7 1,782 619 8,884 820 11,691 700 20,144 10 21,589 — (646,566) (3,819) (12,543) — (647,707) (15,335) (15,661) (173) (23,820) 4,831 4,203 (1,305) (24,839) (1,008) (936) (8,500) (74,856) (21,954) (26,741) (12,864) (147,214) (93,899) (96,694) (2,359) (92,147) 97,052 85,968 (117) (151,604) 3,219 11,202 833,205 $ 820,662 $ (98) 848,866 $ 833,205 $ (106) 130,893 $135,096 $ (4) 131,829 $130,893 $ (6) 305,349 $278,608 $ 65 402,043 $ 305,349 $ 185 599,181 $685,149 $ 464 587,979 $ 599,181 $ — — — — — — — — — — — — — 36 137 1 (16) 122 158 113 45 1 (123) (77) 36 2,402 781 62 (859) (16) 2,386 3,046 574 83 (1,301) (644) 2,402 505 1,939 65 (220) 1,784 2,289 30 485 1 (11) 475 505 82,101 62,468 1,169 (64,063) (426) 81,675 83,593 61,282 955 (63,729) (1,492) 82,101 12,221 2,393 166 (2,233) 326 12,547 12,241 2,144 167 (2,331) (20) 12,221 28,291 4,467 898 (7,570) (2,205) 26,086 37,149 4,847 1,181 (14,886) (8,858) 28,291 54,894 13,880 1,877 (8,536) 7,221 62,115 55,074 11,962 2,023 (14,165) (180) 54,894 259,402 376,572 14,091 25,829 528,216 425,179 17,300 4,426 276 1,051 38,152 40,012 762 765 34,051 32,526 944 1,371 65,256 88,326 237 8,162 59,886 146,534 295,999 172,322 48,561 33,463 275,291 326,836 28,588 72,178 See notes to financial statements. Annual Report 87 . Statements of Changes in Net Assets continued For the years ended October 31st, Numbers in 000s Payden Corporate Bond Fund Payden Strategic Income Fund 2015 2014(1) 2015 INCREASE (DECREASE) IN NET ASSETS: FROM OPERATIONS: Net investment income . . . .
. . .
. . .
. . .
. . .
. . .
. . .
. . Net realized gains (losses) on investments . .
. . .
. . .
. . .
. Change in net unrealized appreciation/(depreciation) . . .
. . Change in Net Assets Resulting from Operations. .
. . .
. FROM DISTRIBUTIONS TO SHAREHOLDERS: Net investment income: Adviser Class . . .
. . .
. . .
. . .
. . .
. . .
. . .
. . .
. . .
. . .
. Investor Class . . .
. . .
. . .
. . .
. . .
. . .
. . .
. . .
. . .
. . .
. SI Class . . .
. . .
. . .
. . .
. . .
. . .
. . .
. . .
. . .
. . .
. . .
. . Net realized gains from investments: Adviser Class . .
. . .
. . .
. . .
. . .
. . .
. . .
. . .
. . .
. . .
. . Investor Class . .
. . .
. . .
. . .
. . .
. . .
. . .
. . .
. . .
. . .
. . SI Class . .
. . .
. . .
. . .
. . .
. . .
. . .
. . .
. . .
. . .
. . .
. . . Return of capital: Adviser Class .
. . .
. . .
. . .
. . .
. . .
. . .
. . .
. . .
. . .
. . . Investor Class .
. . .
. . .
. . .
. . .
. . .
. . .
. . .
. . .
. . .
. . . Institutional Class .
. . .
. . .
. . .
. . .
. . .
. . .
. . .
. . .
. . . Change in Net Assets from Distributions to Shareholders FROM CAPITAL TRANSACTIONS: Proceeds from fund shares sold: Adviser Class .
. . .
. . .
. . .
. . .
. . .
. . .
. . .
. . .
. . .
. . . Investor Class .
. . .
. . .
. . .
. . .
. . .
. . .
. . .
. . .
. . .
. . . SI Class .
. . .
. . .
. . .
. . .
. . .
. . .
. . .
. . .
. . .
. . .
. . .
. Reinvestment of distributions: Adviser Class . . .
. . .
. . .
. . .
. . .
. . .
. . .
. . .
. . .
. . .
. Investor Class . . .
. . .
. . .
. . .
. . .
. . .
. . .
. . .
. . .
. . .
. SI Class . . .
. . .
. . .
. . .
. . .
. . .
. . .
. . .
. . .
. . .
. . .
. . Cost of fund shares redeemed: Adviser Class . .
. . .
. . .
. . .
. . .
. . .
. . .
. . .
. . .
. . .
. . Investor Class . .
. . .
. . .
. . .
. . .
. . .
. . .
. . .
. . .
. . .
. . SI Class . .
. . .
. . .
. . .
. . .
. . .
. . .
. . .
. . .
. . .
. . .
. . . Change in Net Assets from Capital Transactions .
. . .
. . Total Change in Net Assets . .
. . .
. . .
. . .
. . .
. . .
. NET ASSETS: Beginning of period . . .
. . .
. . .
. . .
. . .
. . .
. . .
. . .
. . . End of period .
. . .
. . .
. . .
. . .
. . .
. . .
. . .
. . .
. . .
. . . Accumulated net investment income/(loss) .
. . .
. . .
. . .
. . FUND SHARES OF BENEFICIAL INTEREST: Adviser Class: Outstanding shares at beginning of period . .
. . .
. . .
. . .
. Shares sold . . .
. . .
. . .
. . .
. . .
. . .
. . .
. . .
. . .
. . .
. . . Shares issued in reinvestment of distributions .
. . .
. . .
. . . Shares redeemed .
. . .
. . .
. . .
. . .
. . .
. . .
. . .
. . .
. . .
. Change in shares outstanding. . .
. . .
. . .
. . .
. . .
. . .
. . . Outstanding shares at end of period .
. . .
. . .
. . .
. . .
. . . Investor Class: Outstanding shares at beginning of period .
. . .
. . .
. . .
. . Shares sold . .
. . .
. . .
. . .
. . .
. . .
. . .
. . .
. . .
. . .
. . .
. Shares issued in reinvestment of distributions . . .
. . .
. . .
. Shares redeemed . . .
. . .
. . .
. . .
. . .
. . .
. . .
. . .
. . .
. . Change in shares outstanding. .
. . .
. . .
. . .
. . .
. . .
. . .
. Outstanding shares at end of period . . .
. . .
. . .
. . .
. . .
. SI Class: Outstanding shares at beginning of period . . .
. . .
. . .
. . . Shares sold .
. . .
. . .
. . .
. . .
. . .
. . .
. . .
. . .
. . .
. . .
. . Shares issued in reinvestment of distributions . .
. . .
. . .
. . Shares redeemed . .
. . .
. . .
. . .
. . .
. . .
. . .
. . .
. . .
. . . Change in shares outstanding.
. . .
. . .
. . .
. . .
. . .
. . .
. . Outstanding shares at end of period . .
. . .
. . .
. . .
. . .
. . LONG TERM INVESTMENT ACTIVITY: Purchase of investments (excluding government). .
. . .
. . . Sale of investments (excluding government) .
. . .
. . .
. . .
. Purchase of government securities. . .
. . .
. . .
. . .
. . .
. . . Sale of government securities .
. . .
. . .
. . .
. . .
. . .
. . .
. . 2014 . . . . $ 2,195 823 (1,445) 1,573 $ 2,332 1,704 1,232 5,268 ................. ................. ................. — (2,118) — — (2,423) — (114) (1,866) (754) (10) (485) (277) ................. ................. ................. — (1,780) — — (942) — (8) (124) (49) — — — . . . . . . . . — — — (3,898) — — — (3,365) (6) (98) (39) (3,058) — — — (772) ................. ................. ................. — 25,274 — — 17,816 — 4,719 72,935 10,695 3,029 62,830 32,542 ................. ................. ................. — 3,868 — — 3,340 — 128 2,033 833 10 465 273 . . . . . — (24,921) — 4,221 1,896 — (19,692) — 1,464 3,367 (952) (21,223) (6,248) 62,920 62,285 (102) (7,587) — 91,460 91,067 ................. ................. ................. 69,646 $ 71,542 $ 29 66,279 $ 69,646 $ — 91,067 $153,352 $ — — $91,067 $ 18 . . . . . . . . . . . . . . . . . . . . . . . . . . . . . . . . . . . . . . . . . . . . . . . . . . . . . . . . . . . . . . . . . . . . . . . . . . . . . . . . . . . . . . . . . . . . . . . . . . . . . . . . . . . . . . . . . . . . . . . . . . . . . . . . . . . . . . . . . . . . . . . . . . . . . . . . . . . . . . . . . . . . . . . . . . . . . . . . . . . . . . . . . . . . . . . . . . . . . . . . . . . . 2,687 (231) (33) 2,423 $ 735 264 (620) 379 . . . . . . . . . . . . . . . . . . . . . . . . . . . . . . . . . . . . . . . . . . . . . . . . . . . . . . . . . . . . . . . . . . . . . . . . . . . . . . . . . . . . . . . . . . . . . . . . . . . . . . — — — — — — — — — — — — 294 473 13 (96) 390 684 — 303 1 (10) 294 294 . . . . . . . . . . . . . . . . . . . . . . . . . . . . . . . . . . . . . . . . . . . . . . . . . . . . . . . . . . . . . . . . . . . . . . . . . . . . . . . . . . . . . . . . . . . . . . . . . . . . . . 6,125 2,283 350 (2,238) 395 6,520 5,996 1,577 301 (1,749) 129 6,125 5,546 7,305 204 (2,128) 5,381 10,927 — 6,255 46 (755) 5,546 5,546 . . . . . . . . . . . . . . . . . . . . . . . . . . . . . . . . . . . . . . . . . . . . . . . . . . . . . . . . . . . . . . . . . . . . . . . . . . . . . . . . . . . . . . . . . . . . . . . . . . . . . . — — — — — — — — — — — — 3,273 1,061 84 (624) 521 3,794 — 3,246 27 — 3,273 3,273 . . . . . . . . . . . . . . . . . . . . . . . . . . . . . . . . . . . . . . . . . . . . . . . . . . . . . . . . . . . . . . . . . . . . 79,672 73,694 — — 65,983 67,441 — — 86,658 36,290 5,476 2,368 83,086 10,189 5,320 104 (1) Fund commenced operations on May 8, 2014. (2) Fund commenced operations on November 6, 2014. (3) Fund commenced operations on November 11, 2013. See notes to financial statements. 88 Payden Mutual Funds $ . Payden Absolute Return Bond Fund 2015(2) $ 867 (237) (117) 513 Payden Floating Rate Fund 2015 2014(3) $ 5,528 (1,527) 622 4,623 $ Payden High Income Fund 2015 2014 3,980 565 (1,838) 2,707 $ 35,359 (20,546) (21,372) (6,559) $ 45,040 26,658 (26,714) 44,984 Payden California Municipal Income Fund 2015 2014 $ 974 549 (700) 823 $ 1,001 341 833 2,175 — (541) (354) (3) (1,645) (3,810) (1) (1,357) (2,596) (551) (35,146) — (225) (45,147) — — (974) — — (1,001) — — — — — (160) (408) — — — (140) (26,457) — (128) (23,951) — — (342) — — (246) — — — — (895) — — — (6,026) — — — (3,954) — — — (62,294) — — — (69,451) — — — (1,316) — — — (1,247) 46 42,664 19,135 659 19,388 6,951 40 86,086 142,964 51,663 123,488 — 982 114,159 — — 12,840 — — 11,205 — — 540 254 3 1,761 3,122 1 1,180 1,723 395 46,728 — 346 51,530 — — 1,012 — — 1,020 — (10) (839) (421) 61,369 60,987 (575) (24,795) (4,924) 1,590 187 — (40,404) (23,918) 167,672 166,425 (35,242) (232,997) — (45,965) (114,818) (2,118) (299,042) — (134,143) (158,610) — (14,150) — (298) (791) — (9,729) — 2,496 3,424 — $60,987 $ 89 166,425 $166,612 $ 95 — $166,425 $ 26 738,634 $ 623,816 $ 171 897,244 $ 738,634 $ 434 46,729 $ 45,938 $ (4) 43,305 $46,729 $ (4) — 5 — (1) 4 4 4 66 — (57) 9 13 — 4 — — 4 4 560 7,827 61 (5,349) 2,539 3,099 671 136 49 (296) (111) 560 — — — — — — — — — — — — — 4,275 54 (84) 4,245 4,245 4,673 1,949 177 (2,503) (377) 4,296 — 8,555 118 (4,000) 4,673 4,673 103,767 18,661 7,076 (35,134) (9,397) 94,370 122,531 15,878 7,244 (41,886) (18,764) 103,767 4,449 1,236 97 (1,361) (28) 4,421 4,217 1,079 99 (946) 232 4,449 — 1,913 25 (42) 1,896 1,896 12,008 700 313 (490) 523 12,531 — 14,209 172 (2,373) 12,008 12,008 — — — — — — — — — — — — — — — — — — — — — — — — 67,321 21,172 8,772 2,990 61,337 68,747 1,350 — 179,401 19,297 1,800 2,059 199,578 306,860 5,950 — 336,062 485,948 — — 19,466 21,103 — — 23,016 20,593 — — See notes to financial statements. Annual Report 89 . Statements of Changes in Net Assets continued For the years ended October 31st Numbers in 000s INCREASE (DECREASE) IN NET ASSETS: FROM OPERATIONS: Net investment income . . . .
. . .
. . .
. . .
. . .
. . .
. . .
. . Net realized gains (losses) on investments . .
. . .
. . .
. . .
. Change in net unrealized appreciation/(depreciation) . . .
. . Change in Net Assets Resulting from Operations. .
. . .
. FROM DISTRIBUTIONS TO SHAREHOLDERS: Net investment income: Adviser Class . . .
. . .
. . .
. . .
. . .
. . .
. . .
. . .
. . .
. . .
. Investor Class . . .
. . .
. . .
. . .
. . .
. . .
. . .
. . .
. . .
. . .
. SI Class . . .
. . .
. . .
. . .
. . .
. . .
. . .
. . .
. . .
. . .
. . .
. . Net realized gains from investments: Adviser Class . .
. . .
. . .
. . .
. . .
. . .
. . .
. . .
. . .
. . .
. . Investor Class . .
. . .
. . .
. . .
. . .
. . .
. . .
. . .
. . .
. . .
. . SI Class . .
. . .
. . .
. . .
. . .
. . .
. . .
. . .
. . .
. . .
. . .
. . . Return of capital: Adviser Class .
. . .
. . .
. . .
. . .
. . .
. . .
. . .
. . .
. . .
. . . Investor Class .
. . .
. . .
. . .
. . .
. . .
. . .
. . .
. . .
. . .
. . . SI Class .
. . .
. . .
. . .
. . .
. . .
. . .
. . .
. . .
. . .
. . .
. . .
. Change in Net Assets from Distributions to Shareholders FROM CAPITAL TRANSACTIONS: Proceeds from fund shares sold: Adviser Class . . .
. . .
. . .
. . .
. . .
. . .
. . .
. . .
. . .
. . .
. Investor Class . . .
. . .
. . .
. . .
. . .
. . .
. . .
. . .
. . .
. . .
. SI Class . . .
. . .
. . .
. . .
. . .
. . .
. . .
. . .
. . .
. . .
. . .
. . Reinvestment of distributions: Adviser Class . .
. . .
. . .
. . .
. . .
. . .
. . .
. . .
. . .
. . .
. . Investor Class . .
. . .
. . .
. . .
. . .
. . .
. . .
. . .
. . .
. . .
. . SI Class . .
. . .
. . .
. . .
. . .
. . .
. . .
. . .
. . .
. . .
. . .
. . . Cost of fund shares redeemed: Adviser Class .
. . .
. . .
. . .
. . .
. . .
. . .
. . .
. . .
. . .
. . . Investor Class .
. . .
. . .
. . .
. . .
. . .
. . .
. . .
. . .
. . .
. . . SI Class .
. . .
. . .
. . .
. . .
. . .
. . .
. . .
. . .
. . .
. . .
. . .
. Proceeds from redemption fees (Note 3): Investor Class . . .
. . .
. . .
. . .
. . .
. . .
. . .
. . .
. . .
. . .
. Change in Net Assets from Capital Transactions . . .
. . . Total Change in Net Assets .
. . .
. . .
. . .
. . .
. . .
. . NET ASSETS: Beginning of period . .
. . .
. . .
. . .
. . .
. . .
. . .
. . .
. . .
. End of period . . .
. . .
. . .
. . .
. . .
. . .
. . .
. . .
. . .
. . .
. Accumulated net investment income/(loss) . . .
. . .
. . .
. . . FUND SHARES OF BENEFICIAL INTEREST: Adviser Class: Outstanding shares at beginning of period .
. . .
. . .
. . .
. . Shares sold . .
. . .
. . .
. . .
. . .
. . .
. . .
. . .
. . .
. . .
. . .
. Shares issued in reinvestment of distributions . . .
. . .
. . .
. Shares redeemed . . .
. . .
. . .
. . .
. . .
. . .
. . .
. . .
. . .
. . Change in shares outstanding. .
. . .
. . .
. . .
. . .
. . .
. . .
. Outstanding shares at end of period . . .
. . .
. . .
. . .
. . .
. Investor Class: Outstanding shares at beginning of period . . .
. . .
. . .
. . . Shares sold .
. . .
. . .
. . .
. . .
. . .
. . .
. . .
. . .
. . .
. . .
. . Shares issued in reinvestment of distributions . .
. . .
. . .
. . Shares redeemed . .
. . .
. . .
. . .
. . .
. . .
. . .
. . .
. . .
. . . Change in shares outstanding.
. . .
. . .
. . .
. . .
. . .
. . .
. . Outstanding shares at end of period . .
. . .
. . .
. . .
. . .
. . SI Class: Outstanding shares at beginning of period . .
. . .
. . .
. . .
. Shares sold . . .
. . .
. . .
. . .
. . .
. . .
. . .
. . .
. . .
. . .
. . . Shares issued in reinvestment of distributions .
. . .
. . .
. . . Shares redeemed .
. . .
. . .
. . .
. . .
. . .
. . .
. . .
. . .
. . .
. Change in shares outstanding. . .
. . .
. . .
. . .
. . .
. . .
. . . Outstanding shares at end of period .
. . .
. . .
. . .
. . .
. . . LONG TERM INVESTMENT ACTIVITY: Purchase of investments (excluding government).
. . .
. . .
. Sale of investments (excluding government) . . .
. . .
. . .
. . Purchase of government securities. .
. . .
. . .
. . .
. . .
. . .
. Sale of government securities . . .
. . .
. . .
. . .
. . .
. . .
. . . Payden Global Low Duration Fund 2015 2014 . . . . . . . . . . . . . . . . . . . . . . . . . . . . . . . . . . . . . . . . . . . . . . . . . . . . . . . . . . . . . . . . . . . . $ 1,460 (51) (1,033) 376 1,606 1,001 (830) 1,777 $ 1,104 1,250 (1,198) 1,156 $ 1,085 2,079 (585) 2,579 ................. ................. ................. — (202) — — (1,577) — — (1,243) — — (925) — ................. ................. ................. — — — — — — — — — — — — . . . . — (1,293) — (1,495) — — — (1,577) — — — (1,243) — (133) — (1,058) ................. ................. ................. — 40,486 — — 54,242 — — 45,868 — — 16,570 — ................. ................. ................. — 1,465 — — 1,446 — — 1,181 — — 1,016 — ................. ................. ................. — (50,453) — — (28,969) — — (17,348) — — (8,349) — ................. ................. ................. — (8,502) (9,621) — 26,719 26,919 — 29,701 29,614 — 9,237 10,758 ................. ................. ................. 139,965 $130,344 $ — 113,046 $139,965 $ 29 50,679 $ 80,293 $ — 39,921 $50,679 $ — . . . . . . . . . . . . . . . . . . . . . . . . . . . . . . . . . . . . . . . . . . . . . . . . . . . . . . . . . . . . . . . . . . . . . . . . . . . . . . . . . . . . . . . . . . . . . . . . . . . . . . . . . . . . . . . . . . . . . . . . . . . . . . . . . . . . . . . . . . . . . . . . . . . . . . . . . . . . . . . . . . . . . . — — — — — — — — — — — — — — — — — — — — — — — — . . . . . . . . . . . . . . . . . . . . . . . . . . . . . . . . . . . . . . . . . . . . . . . . . . . . . . . . . . . . . . . . . . . . . . . . . . . . . . . . . . . . . . . . . . . . . . . . . . . . . . 13,857 4,025 145 (5,001) (831) 13,026 11,219 5,361 143 (2,866) 2,638 13,857 5,733 5,137 132 (1,951) 3,318 9,051 4,678 1,903 117 (965) 1,055 5,733 . . . . . . . . . . . . . . . . . . . . . . . . . . . . . . . . . . . . . . . . . . . . . . . . . . . . . . . . . . . . . . . . . . . . . . . . . . . . . . . . . . . . . . . . . . . . . . . . . . . . . . — — — — — — — — — — — — — — — — — — — — — — — — . . . . . . . . . . . . . . . . . . . . . . . . . . . . . . . . . . . . . . . . . . . . . . . . . . . . . . . . . . . . . . . . . . . . 41,834 61,908 1,789 3,745 96,918 67,993 2,970 231 55,119 26,073 — — 31,466 23,323 — — (1) Fund commenced operations on November 11, 2013. See notes to financial statements. 90 Payden Mutual Funds $ Payden Global Fixed Income Fund 2015 2014 .
Payden Emerging Markets Bond Fund 2015 2014 $ 46,944 (17,985) (52,587) (23,628) $ 45,137 (18,479) 33,478 60,136 (1,218) (20,184) (24,842) Payden Emerging Markets Local Bond Fund 2015 2014 $ Payden Emerging Markets Corporate Bond Fund 2015 2014(1) Payden Equity Income Fund 2015 2014 7,842 (28,808) (7,525) (28,491) $ 11,408 (18,705) (809) (8,106) $ 1,743 (558) (1,733) (548) $ 1,865 710 1,008 3,583 $ 14,020 (2,318) 1,237 12,939 $ 8,462 13,326 24,247 46,035 (728) (17,826) (19,754) — — — — — — (1) (63) (1,658) (1) (416) (1,430) (121) (7,963) (7,020) (73) (4,643) (912) — — — (64) (1,570) (1,452) — — — — — — — (27) (703) — — — (142) (8,590) (5,610) (37) (1,791) — — — — (46,244) (122) (2,994) (3,318) (47,828) (15) (7,658) — (7,673) (20) (11,282) — (11,302) — — — (2,452) — — — (1,847) — — — (29,446) — — — (7,456) 14,036 182,808 83,704 9,486 104,990 46,594 2 59,947 — 293 43,062 — 280 240 1,000 256 16,431 46,246 471 63,261 89,159 621 232,009 180,071 1,160 18,869 23,830 841 20,914 23,468 14 5,039 — 20 7,554 — 2 89 539 1 416 261 250 16,272 11,088 102 6,245 912 (5,410) (133,459) (3,604) (9,071) (215,070) (25,855) (166) (77,758) — (395) (104,808) — (479) (337) (5,718) (40) (16,046) (5,860) (762) (64,203) (2,364) (877) (206,778) (103) — 181,934 112,062 4 (43,699) (31,391) — (12,922) (49,086) — (54,274) (73,682) — (4,384) (7,384) — 41,665 43,401 — 113,172 96,665 — 212,202 250,781 852,047 $ 964,109 $ 2,370 883,438 $ 852,047 $ — 175,225 $126,139 $ — 248,907 $ 175,225 $ — 43,401 $36,017 $ 18 — $ 43,401 $ — 466,699 $563,364 $ 1,352 215,918 $ 466,699 2,036 1,526 1,044 86 (405) 725 2,251 1,448 676 61 (659) 78 1,526 47 — 2 (24) (22) 25 57 33 2 (45) (10) 47 21 28 — (47) (19) 2 — 25 — (4) 21 21 329 34 18 (54) (2) 327 338 47 8 (64) (9) 329 26,923 13,481 1,404 (9,965) 4,920 31,843 33,423 7,601 1,511 (15,612) (6,500) 26,923 20,626 7,873 683 (10,271) (1,715) 18,911 26,632 4,899 861 (11,766) (6,006) 20,626 147 24 9 (34) (1) 146 — 1,642 41 (1,536) 147 147 19,126 4,471 1,165 (4,642) 994 20,120 16,746 16,810 468 (14,898) 2,380 19,126 31,951 6,202 1,774 (265) 7,711 39,662 28,793 3,312 1,693 (1,847) 3,158 31,951 — — — — — — — — — — — — 4,005 103 54 (568) (411) 3,594 — 4,544 25 (564) 4,005 4,005 12,978 6,261 795 (168) 6,888 19,866 — 12,921 64 (7) 12,978 12,978 670,779 493,181 — — 601,459 641,390 — — 153,461 163,724 — — 193,904 237,826 — — 35,213 40,989 — — 79,904 39,219 — — 357,104 258,702 — — 371,706 157,866 — — See notes to financial statements. Annual Report 91 . Notes to Financial Statements October 31, 2015 1. Organization and Related Matters The Payden & Rygel Investment Group (the “Group” or “Paydenfunds”) is a no-load, open-end registered investment company organized as a Massachusetts business trust on January 22, 1992 and registered under the Investment Company Act of 1940 (the “1940 Act”), as amended. Each of its nineteen funds (each a “Fund,” collectively the “Funds”) is a series of the Group, and is authorized to issue unlimited shares at $0.001 par value. This report includes eighteen of the Funds.
The Payden/Kravitz Cash Balance Plan Fund is contained in a separate report. Each of the Funds, other than the Cash Reserves Money Market and High Income Funds, has been classified as non-diversified. Effective February 28, 2015, Institutional Class changed its name to the SI Class. 2. Significant Accounting Policies The following is a summary of significant accounting policies followed by the Funds. The Financial Accounting Standards Board (“FASB”) Accounting Standards Codification (“ASC”) is the exclusive reference of authoritative U.S.
generally accepted accounting principles (“GAAP”) recognized by the FASB to be applied by nongovernmental entities. Rules and interpretive releases of the Securities and Exchange Commission (“SEC”) under authority of federal laws are also sources of authoritative GAAP for SEC registrants. Each Fund’s financial statements are prepared in accordance with GAAP. The Funds are considered investment companies under FASB ASC 946, Financial Services - Investment Companies. The preparation of financial statements in conformity with GAAP requires management to make estimates and assumptions that affect the reported amounts of assets and liabilities and disclosure of contingent assets and liabilities at the date of the financial statements and the reported amounts of income and expenses during the reporting period.
Actual results could differ from those estimates. Securities Valuation Domestic and foreign fixed income securities and other assets for which market quotations are readily available (other than obligations with original maturities of sixty days or less) are valued on the basis of quotes obtained from brokers and dealers or pricing services. Such quotations take into account appropriate factors such as institutional-sized trading in similar groups of securities, yield, quality, coupon rate, maturity, type 92 Payden Mutual Funds of issue, trading characteristics and other data. Debt securities with original maturities of sixty days or less and securities in the Cash Reserves Money Market Fund are valued at amortized cost, which approximates fair value. Publicly traded equity securities, whether in the U.S.
or outside the U.S., for which market quotations are readily available, generally will be valued at the official closing price or the last sale price on the exchange or market where they are principally traded, or if there have been no sales during the day, at the last bid price. Securities traded only on the over-the-counter (“OTC”) market are valued at the latest bid price. Investments in investment companies are valued at their net asset values as reported by such companies. Options, futures, swaps and other similar instruments are valued at the official closing price, in the case of exchange traded derivatives, or on the basis of information provided by pricing services, quotes obtained from brokers and dealers, and market trades in the case of other securities. Fixed income or equity securities for which market quotations are not readily available are priced at their fair value as determined in good faith under procedures established pursuant to the Valuation and Liquidity Guidelines applicable to each of the Funds.
In considering fair value of a security, one or more factors are taken into consideration depending on the circumstances at the time, including for example: the cost of the security or the last reported sales price of the security as a starting point; changes in interest rates; changes in yield spreads of similarly rated or structured securities; fundamental analytical information relating to the security; the value of other similar securities traded on other markets or among dealers; the general financial condition of the issuer; recent developments affecting the issuer; information, including price quotations, from other financial institutions or analysts; or government actions or pronouncements and other significant events affecting the economy, the markets, the fundamental value of the issuer or of the issuer’s industry. Shares of open-end investment companies are valued at their respective net asset value. Fair value pricing adjustments may occur when (1) developments occur (a “significant event”) that will affect the value of a Fund’s holdings, and (2) the significant event occurs after the close of the markets on which the securities trade, but before the time when the net asset value is computed for a Fund. A significant event may relate to a single issuer or an entire market. . Risks Unforeseen events in the markets may at times result in an unusually high degree of volatility in the markets, which could adversely affect the Funds causing a decline in value. Investing in debt securities may include failure of an issuer to make timely interest or principal payments, or a decline or the perception of a decline in credit quality. In addition, the value of the debt security may decline due to general market conditions that are not specifically related to a particular company including industry earnings outlook, changes in interest or currency rates or perception of a specific industry. Investing in foreign securities may include certain risks and considerations not typically associated with investing in U.S. securities, such as fluctuating currency values and changing local and regional economic, political and social conditions, which may result in greater market volatility. In addition, certain foreign securities may not be as liquid as U.S. securities. An investment in the Payden Cash Reserves Money Market Fund is not insured or guaranteed by the Federal Deposit Insurance Corporation or any other government agency. Although the Fund seeks to preserve the value of your investment at $1.00 per share, it is possible to lose money by investing in the Fund. Investment Transactions and Related Income Investment transactions are accounted for on the date the security is purchased or sold (trade date) for financial reporting purposes.
Interest income is recognized on an accrual basis. Premiums and discounts are amortized or accreted over the expected life of the security using the effective interest method. Dividend income is recorded on the ex-dividend date. Realized gains or losses on investment transactions are determined on the identified cost basis. Bank Loans Floating-Rate Loan Interests (“Bank Loans”) in which the Fund invests generally pay interest at rates which are periodically predetermined by reference to a base lending rate plus a premium. These base lending rates are generally (i) the lending rate offered by one or more major European banks, such as the London Inter-Bank Offered Rate (“LIBOR”), (ii) the prime rate offered by one or more United States banks or (iii) the certificate of deposit rate.
Certain Bank Loans are subject to a LIBOR floor that establishes a minimum LIBOR rate. The interest rate shown on the Schedule of Investments reflects the rate in effect at October 31st. When a range of rates is disclosed, the Fund holds more than one position within the same tranche at varying rates. Foreign Currency Translation The accounting records of the Funds are maintained in U.S. dollars.
Each of the Funds (except Cash Reserves Money Market, U.S. Government, GNMA and California Municipal Income Funds) may purchase securities that are denominated in foreign currencies. Investment securities and other assets and liabilities denominated in a foreign currency are translated into U.S.
dollars at the current exchange rates. Purchases and sales of securities, income and expenses are translated into U.S. dollars at the exchange rates on the dates of the respective transactions. Each of these Funds does not isolate that portion of the results of operations resulting from changes in foreign exchange rates from the fluctuations arising from changes in security prices. Reported net realized foreign exchange gains or losses arise from purchases and sales and maturities of securities, purchases and sales of foreign currencies, currency gains or losses realized between the trade and settlement dates of securities transactions, and the differences between the amounts of income or expenses recorded on each of these Fund’s books and the U.S.
dollar equivalents of the amounts actually received or paid. Net unrealized appreciation/depreciation from translation of assets and liabilities denominated in foreign currency arise from changes in the value of assets and liabilities resulting from changes in the foreign exchange rates. Repurchase Agreements The Payden Cash Reserves Money Market Fund entered into repurchase agreements (agreements to purchase U.S. Treasury notes and bills, subject to the seller’s agreement to repurchase them at a specified time and price) with well-established registered securities dealers or banks.
Repurchase agreements are the equivalent of loans by the Fund. With respect to such agreements, it is the Fund’s policy to take possession of the underlying securities, except for tri-party agreements where an independent custodian takes possession. On a daily basis the Fund or the tri-party custodian mark-to-market such securities to ensure that the value, including accrued interest, is at least equal to the amount to be repaid to the Fund under the agreement.
If the seller defaults, and the fair value of the collateral declines, realization of the collateral by the Fund may be delayed or limited. Master Repurchase Agreements (“MRA”) permit the Fund, under certain circumstances, including an event of default (such as bankruptcy or insolvency), to offset payables and/or Annual Report 93 . Notes to Financial Statements continued receivables under the MRA with collateral held and/or posted to the counterparty and create one single net payment due to or from the Fund. However, bankruptcy or insolvency laws of a particular jurisdiction may impose restrictions on or prohibitions against such a right of offset in the event of the MRA counterparty’s bankruptcy or insolvency. Pursuant to the terms of the MRA, the Fund receives or posts securities as collateral with a market value in excess of the repurchase price to be paid or received by the Fund upon the maturity of the transaction. Upon a bankruptcy or insolvency of the MRA counterparty, the Fund is considered an unsecured creditor with respect to excess collateral and, as such, the return of excess collateral may be delayed. The Payden Cash Reserves Money Market Fund’s repurchase agreements by counterparty, which are subject to offset under a MRA, is included within the Fund’s Schedule of Investments. For financial statement purposes, the Fund does not offset financial assets and financial liabilities, that are subject to MRA on the Statement of Assets and Liabilities. Forward Currency Contracts Some Funds entered into forward contracts to protect against adverse currency movements or as speculative investments.
The forward currency contracts are adjusted by the daily exchange rate of the underlying currency and any gains or losses are recorded for financial statement purposes as unrealized gain or loss until the contact settlement date or an offsetting forward currency contract has been executed, at which time the Fund records a realized gain or loss equal to the difference between the value of the contract at the time it was opened and the value at the time it was closed. Risk may arise upon entering into these contracts from the potential inability of counterparties to meet the terms of their contracts and from unanticipated movements in the value of a foreign currency relative to the U.S. dollar. Futures Contracts Some Funds entered into futures transactions to enhance potential gain in circumstances where hedging is not involved. The purchase or sale of futures contracts and options on futures contracts provides for the future sale by one party and purchase by another party of a specified quantity of a financial instrument or foreign currency at a fixed price on a future date. Upon entering into such a contract, a Fund is required to deposit and maintain initial margin deposit of cash or securities as required by the exchange on which the contract is traded. 94 Payden Mutual Funds Pursuant to the contract, that Fund agrees to receive from or pay to the broker an amount equal to the daily fluctuations in the value of the contract.
Such receipts or payments are known as variation margin and are recorded as unrealized gains or losses by that Fund. When the contract is closed, that Fund records a realized gain or loss equal to the difference between the value of the contract at the time it was opened and the value at the time it was closed. The potential risk to the Funds is that the change in value of the underlying securities may not correlate to the change in value of the contracts. Stock index futures contracts are an agreement pursuant to which two parties agree to take or make delivery of an amount of cash equal to the difference between the value of the index at the close of the last trading day of the contract and the price at which the index contract was originally written.
Variation margin accounting procedures apply to these index futures contracts. Each Fund invests in these futures contracts to permit the Fund to meet its objectives at a lower cost than investing directly in equity securities, while permitting the equivalent of an investment in a portfolio of equity securities. The potential risk to a Fund is that the change in value of the underlying index may not correlate to the change in value of the contracts. Swap Contracts Some Funds may enter into swap agreements, in which a Fund and a counterparty agree either to make periodic net payments on a specified notional amount or a net payment upon termination.
Swap agreements are privately negotiated in the OTC market and may be entered into as a bilateral contract (“OTC swaps”) or centrally cleared (“centrally cleared swaps”). Swaps are marked-to-market daily and changes in value are recorded as unrealized appreciation (depreciation) and realized gain/(loss) is recorded at termination of the contract. Swap transactions involve, to varying degrees, elements of interest rate, credit and market risk in excess of the amounts recognized in the Statement of Assets and Liabilities. Such risks involve the possibility that there will be no liquid market for these agreements, that the counterparty to the agreements may default on its obligation to perform or disagree as to the meaning of the contractual terms in the agreements, and that there may be unfavorable changes in interest rates, credit spreads and/or market values associated with these transactions. A Fund may enter into credit default swaps to manage its exposure to the market or certain sectors of the market, to reduce its risk exposure to defaults of corporate and/or sovereign issuers or to create exposure to corporate and/or sovereign issuers to which it is not otherwise exposed (credit risk). A .
Fund may either buy or sell (write) credit default swaps on single-name issuers (corporate or sovereign), a combination or basket of single-name issuers or traded indexes. Credit default swaps on single-name issuers are agreements in which the protection buyer pays fixed periodic payments to the seller in consideration for a guarantee from the protection seller to make a specific payment should a negative credit event take place with respect to the referenced entity (e.g., bankruptcy, failure to pay, obligation accelerators, repudiation, moratorium or restructuring). Credit default swaps on traded indexes are agreements in which the buyer pays fixed periodic payments to the seller in consideration for a guarantee from the seller to make a specific payment should a write-down, principal or interest shortfall or default of all or individual underlying securities included in the index occur. As a buyer, if an underlying credit event occurs, the Fund will either (i) receive from the seller an amount equal to the notional amount of the swap and deliver the referenced security or underlying securities comprising the index, or (ii) receive a net settlement of cash equal to the notional amount of the swap less the recovery value of the security or underlying securities comprising the index. As a seller (writer), if an underlying credit event occurs, the Fund will either pay the buyer an amount equal to the notional amount of the swap and take delivery of the referenced security or underlying securities comprising the index or pay a net settlement of cash equal to the notional amount of the swap less the recovery value of the security or underlying securities comprising the index. A Fund may enter into total return swaps to obtain exposure to a security or market without owning such security or investing directly in that market or to transfer the risk/return of one market (e.g., fixed income) to another market (e.g., equity) (equity risk and/or interest rate risk).
Total return swaps are agreements in which there is an exchange of cash flows whereby one party commits to make payments based on the total return (coupons plus capital gains/losses) of an underlying instrument in exchange for fixed or floating rate interest payments. To the extent the total return of the instrument or index underlying the transaction exceeds or falls short of the offsetting interest rate obligation, the Fund will receive a payment from or make a payment to the counterparty. A Fund may enter into interest rate swaps to gain or reduce exposure to interest rates or to manage duration, the yield curve or interest rate risk by economically hedging the value of the fixed rate bonds which may decrease when interest rates rise (interest rate risk). Interest rate swaps are agreements in which one party pays a stream of interest payments, either fixed or floating rate, for another party’s stream of interest payments, either fixed or floating, on the same notional amount for a specified period of time.
In more complex swaps, the notional principal amount may decline (or amortize) over time. For financial reporting purposes, swap interest and amortization is classified as realized or unrealized gain or loss on swap contracts. Options Transactions Option techniques may be utilized by a Fund to hedge against changes in interest rates, foreign currency exchange rates or security prices in order to establish more definitely the effective return on securities or currencies held or intended to be acquired by the Fund, to reduce the volatility of the currency exposure associated with investment in non-U.S. securities, or as an efficient means of adjusting exposure to the bond, equity and currency markets. In addition, the Fund may enter into such transactions to enhance potential gain in circumstances where hedging is not involved.
When a Fund writes a covered call or put option, an amount equal to the premium received is reflected as an asset and equivalent liability. The amount of the liability is subsequently marked-to-market to reflect the current value of the option. If an option expires on its stipulated expiration date or if the Fund enters into a closing purchase transaction, a gain or loss is realized.
If a written call option is exercised, a gain or loss is realized for the sale of the underlying security and the proceeds from the sale are increased by the premium originally received. If a written put option is exercised, the cost of the security acquired is decreased by the premium originally received. As writer of an option, the Fund has no control over whether the underlying securities are subsequently sold (call) or purchased (put) and, as a result, bears the market risk of an unfavorable change in the price of the security underlying the written option. When the Fund purchases a call or put option, an amount equal to the premium paid is included in the Fund’s Statement of Assets and Liabilities as an investment, and is subsequently marked-to-market to reflect the current value of the option.
If an option expires on the stipulated expiration date or if a Fund enters into a closing sale transaction, a gain or loss is realized. If the Fund exercises a call option, the cost of the security acquired is increased by the premium paid for the call. If the Fund exercises a put option, a gain or loss is realized from the sale of the underlying security, and the proceeds from such sale are decreased by the premium originally paid.
Written and purchased options are non-income producing securities. Annual Report 95 . Notes to Financial Statements continued Derivative Financial Instruments The Funds engage in various portfolio investment strategies using derivative contracts both to increase the returns of the Fund and/or to economically hedge its exposure to certain risks such as credit risk, equity risk, interest rate risk and foreign currency exchange rate risk. These contracts may be transacted on an exchange or OTC. The following tables show the Funds’ exposure to different types of market risks as it relates to derivative investments in the Statements of Assets and Liabilities and the Statements of Operations. Statement of Assets and Liabilities Fair Values of Derivative Instruments as of October 31, 2015 (000s) Underlying Risk Derivative Derivative Assets ($) Liabilities ($) Limited Maturity Interest rate1 . . .
. . .
. . .
. . .
. . .
. . .
. . .
. . .
. . .
. . .
. Foreign currency2,3 . . .
. . .
. . .
. . .
. . .
. . .
. . .
. . .
. . . Total .
. . .
. . .
. . .
. . .
. . .
. . .
. . .
. . .
. . .
. . .
. . .
. 2 128 130 — (187) (187) Low Duration Credit 4 . . .
. . .
. . .
. . .
. . .
. . .
. . .
. . .
. . .
. . .
. . .
. . Interest rate1,5 . .
. . .
. . .
. . .
. . .
. . .
. . .
. . .
. . .
. . .
. Foreign currency2,3 . . .
. . .
. . .
. . .
. . .
. . .
. . .
. . .
. . . Total .
. . .
. . .
. . .
. . .
. . .
. . .
. . .
. . .
. . .
. . .
. . .
. — 52 173 225 (146) — (84) (230) U.S. Government Interest rate1,5 . .
. . .
. . .
. . .
. . .
. . .
. . .
. . .
. . .
. . .
. 1 (40) GNMA Interest rate1,5 . . .
. . .
. . .
. . .
. . .
. . .
. . .
. . .
. . .
. . . 27 — Core Bond Interest rate5 .
. . .
. . .
. . .
. . .
. . .
. . .
. . .
. . .
. . .
. . . Foreign currency2,3 .
. . .
. . .
. . .
. . .
. . .
. . .
. . .
. . .
. . Total . .
. . .
. . .
. . .
. . .
. . .
. . .
. . .
. . .
. . .
. . .
. . . 334 561 895 (52) (560) (612) Corporate Bond Interest rate5 .
. . .
. . .
. . .
. . .
. . .
. . .
. . .
. . .
. . .
. . . Foreign currency2,3 .
. . .
. . .
. . .
. . .
. . .
. . .
. . .
. . .
. . Total . .
. . .
. . .
. . .
. . .
. . .
. . .
. . .
. . .
. . .
. . .
. . . 33 25 58 (29) (11) (40) Strategic Income Interest rate5 .
. . .
. . .
. . .
. . .
. . .
. . .
. . .
. . .
. . .
. . . Foreign currency2,3 .
. . .
. . .
. . .
. . .
. . .
. . .
. . .
. . .
. . Total . .
. . .
. . .
. . .
. . .
. . .
. . .
. . .
. . .
. . .
. . .
. . . 72 136 208 (10) (121) (131) Derivative Derivative Assets ($) Liabilities ($) Underlying Risk Absolute Return Bond Interest rate5 .
. . .
. . .
. . .
. . .
. . .
. . .
. . .
. . .
. . .
. . . Foreign currency2,3 .
. . .
. . .
. . .
. . .
. . .
. . .
. . .
. . .
. . Equity1. .
. . .
. . .
. . .
. . .
. . .
. . .
. . .
. . .
. . .
. . .
. . .
. Total . . .
. . .
. . .
. . .
. . .
. . .
. . .
. . .
. . .
. . .
. . .
. . 15 51 12 78 (24) (51) — (75) High Income Interest rate5 . .
. . .
. . .
. . .
. . .
. . .
. . .
. . .
. . .
. . .
. . Foreign currency2,3 . .
. . .
. . .
. . .
. . .
. . .
. . .
. . .
. . .
. Total . . .
. . .
. . .
. . .
. . .
. . .
. . .
. . .
. . .
. . .
. . .
. . — 347 347 (179) (379) (558) Global Low Duration Credit4 . .
. . .
. . .
. . .
. . .
. . .
. . .
. . .
. . .
. . .
. . .
. . .
. Interest rate1,5 . . .
. . .
. . .
. . .
. . .
. . .
. . .
. . .
. . .
. . . Foreign currency2,3 .
. . .
. . .
. . .
. . .
. . .
. . .
. . .
. . .
. . Total . .
. . .
. . .
. . .
. . .
. . .
. . .
. . .
. . .
. . .
. . .
. . . — 9 103 112 (26) (40) (50) (116) Global Fixed Income Interest rate5 .
. . .
. . .
. . .
. . .
. . .
. . .
. . .
. . .
. . .
. . . Foreign currency2,3 .
. . .
. . .
. . .
. . .
. . .
. . .
. . .
. . .
. . Total . .
. . .
. . .
. . .
. . .
. . .
. . .
. . .
. . .
. . .
. . .
. . . 88 477 565 (53) (395) (448) Emerging Markets Bond Foreign currency2,3 .
. . .
. . .
. . .
. . .
. . .
. . .
. . .
. . .
. . 270 (1,269) Emerging Markets Local Bond Foreign currency2,3 . .
. . .
. . .
. . .
. . .
. . .
. . .
. . .
. . .
. 6 (203) Emerging Markets Corporate Bond Foreign currency2,3 . . .
. . .
. . .
. . .
. . .
. . .
. . .
. . .
. . . 5 (30) Statement of Assets and Liabilities location: 1 Includes options purchased at value as reported in the Schedule of Investments. 2 Payable for forward currency contracts. 3 Receivable for forward currency contracts. 4 Payable for swap contracts. 5 Includes cumulative appreciation/depreciation of futures contracts as reported in Schedule of Investments.
Only last day’s variation margin is reported within the Statement of Assets and Liabilities as Receivable/Payable for futures. The Effect of Derivative Instruments on the Statement of Operations For the Period Ended October 31, 2015 (000s) Amount of Realized Gain or (Loss) on Derivatives Recognized in Income Forward Currency Underlying risk Futures1 Contracts2 Options3 Swaps4 Total Limited Maturity Interest rate . . .
. . .
. . .
. . .
. . $ (424) — $ (32) — $ (456) Foreign exchange .
. . .
. . .
. . . — $2,972 — — 2,972 Total .
. . .
. . .
. . .
. . .
. . .
. . . (424) 2,972 (32) — 2,516 Low Duration Credit .
. . .
. . .
. . .
. . .
. . .
. . Interest rate . .
. . .
. . .
. . .
. . . Foreign exchange .
. . .
. . .
. . . Total .
. . .
. . .
. . .
. . .
. . .
. . . — — 3,447 3,447 — (473) — (473) $259 — — 259 259 (1,491) 3,447 2,215 U.S.
Government Interest rate . . .
. . .
. . .
. . .
. . 96 Payden Mutual Funds — (1,018) — (1,018) 6 — (37) — (31) . Amount of Realized Gain or (Loss) on Derivatives Recognized in Income Underlying risk Forward Currency Futures1 Contracts2 Options3 Swaps4 Total GNMA Interest rate . . . .
. . .
. . .
. . .
. $(1,109) — — $ (35) $(1,144) Core Bond Interest rate . .
. . .
. . .
. . .
. . . Foreign exchange .
. . .
. . .
. . . Total .
. . .
. . .
. . .
. . .
. . .
. . . (1,822) — (1,822) — $2,614 2,614 — — — Corporate Bond Credit .
. . .
. . .
. . .
. . .
. . .
. . Interest rate . .
. . .
. . .
. . .
. . . Foreign exchange .
. . .
. . .
. . . Total .
. . .
. . .
. . .
. . .
. . .
. . . — 84 — 84 — — 81 81 — — — — (113) — — (113) (113) 84 81 52 Strategic Income Interest rate .
. . .
. . .
. . .
. . .
. Foreign exchange . . .
. . .
. . .
. Total . . .
. . .
. . .
. . .
. . .
. . .
. (75) — (75) — 569 569 — — — — — — (75) 569 494 Absolute Return Bond Credit . . .
. . .
. . .
. . .
. . .
. . . Equity .
. . .
. . .
. . .
. . .
. . .
. . Interest rate . .
. . .
. . .
. . .
. . . Foreign exchange .
. . .
. . .
. . . Total .
. . .
. . .
. . .
. . .
. . .
. . . — — (383) — (383) — — — 97 97 — $ 85 (14) — 71 (57) — — — (57) (57) 85 (397) 97 (272) High Income Credit .
. . .
. . .
. . .
. . .
. . .
. . Equity . .
. . .
. . .
. . .
. . .
. . .
. Interest rate . . .
. . .
. . .
. . .
. . Foreign exchange . .
. . .
. . .
. . Total . .
. . .
. . .
. . .
. . .
. . .
. . — — (854) — (854) — — — 2,075 2,075 — (218) — — (218) 23 — — — 23 23 (218) (854) 2,075 1,026 (3,164) (4,986) — 2,614 (3,164) (2,372) 3 4 Net realized gains (losses) from written option contracts and purchased options, which are included in net realized gain on investments. Net realized gains (losses) from swap contracts. The Effect of Derivative Instruments on the Statement of Operations For the Period Ended October 31, 2015 (000s) Change in Unrealized Appreciation or (Depreciation) on Derivatives Recognized in Income Forward Currency Underlying risk Futures5 Contracts6 Options7 Swaps8 Total Limited Maturity Interest rate. .
. . .
. . .
. . .
. . .
. — — $ (40) — $ (40) Foreign exchange. . .
. . .
. . .
. . — $(235) — — (235) Total. .
. . .
. . .
. . .
. . .
. . .
. . . — (235) (40) — (275) Low Duration Credit .
. . .
. . .
. . .
. . .
. . .
. . . Interest rate.
. . .
. . .
. . .
. . .
. . Foreign exchange. .
. . .
. . .
. . . Total.
. . .
. . .
. . .
. . .
. . .
. . .
. — $(204) — (204) — — (70) (70) U.S. Government Interest rate. .
. . .
. . .
. . .
. . .
. (56) — (25) — (81) GNMA Interest rate. . .
. . .
. . .
. . .
. . . 266 — (115) 28 179 Core Bond Interest rate.
. . .
. . .
. . .
. . .
. . Foreign exchange. .
. . .
. . .
. . . Total.
. . .
. . .
. . .
. . .
. . .
. . .
. 490 — 490 — (89) (89) — — — Corporate Bond Credit . . .
. . .
. . .
. . .
. . .
. . .
. Interest rate. . .
. . .
. . .
. . .
. . . Foreign exchange.
. . .
. . .
. . .
. Total. . .
. . .
. . .
. . .
. . .
. . .
. . — (49) — (49) — — 14 14 — — — — 69 — — 69 69 (49) 14 34 Strategic Income Interest Rate . .
. . .
. . .
. . .
. . . Foreign exchange.
. . .
. . .
. . .
. Total. . .
. . .
. . .
. . .
. . .
. . .
. . 62 — 62 — 41 41 — — — — — — 62 41 103 — (11) (11) — — — (6) (3) (9) — — — (6) (14) (20) — $ (34) (317) — — — (317) (34) (34) (521) (70) (625) 1,900 $2,390 — (89) 1,900 2,301 Global Low Duration Credit . .
. . .
. . .
. . .
. . .
. . .
. Equity . . .
. . .
. . .
. . .
. . .
. . . Interest rate .
. . .
. . .
. . .
. . .
. Foreign exchange . . .
. . .
. . .
. Total . . .
. . .
. . .
. . .
. . .
. . .
. — — (255) — (255) — — — 1,756 1,756 — 1 (78) — (77) 45 — — — 45 45 1 (333) 1,756 1,469 Global Fixed Income Interest rate . . .
. . .
. . .
. . .
. . Foreign exchange . .
. . .
. . .
. . Total . .
. . .
. . .
. . .
. . .
. . .
. . (162) — (162) — 2,295 2,295 — — — — — — (162) 2,295 2,133 Emerging Markets Bond Foreign exchange . .
. . .
. . .
. . — 3,216 — — 3,216 Absolute Return Bond Equity . .
. . .
. . .
. . .
. . .
. . .
. . Interest rate. .
. . .
. . .
. . .
. . .
. Total. . .
. . .
. . .
. . .
. . .
. . .
. . Emerging Markets Local Bond Interest rate . .
. . .
. . .
. . .
. . . Foreign exchange .
. . .
. . .
. . . Total .
. . .
. . .
. . .
. . .
. . .
. . . — — — — (747) (747) — — — (53) — (53) (53) (747) (800) High Income Interest rate.
. . .
. . .
. . .
. . .
. . Foreign exchange. .
. . .
. . .
. . . Total.
. . .
. . .
. . .
. . .
. . .
. . .
. (138) — (138) — (108) (108) — — — — — — (138) (108) (246) Emerging Markets Corporate Bond Foreign exchange . . .
. . .
. . .
. — 50 — — 50 Equity Income Equity . . .
. . .
. . .
. . .
. . .
. . . Foreign exchange .
. . .
. . .
. . . Total .
. . .
. . .
. . .
. . .
. . .
. . . — 3 3 (214) — (214) Global Low Duration Credit .
. . .
. . .
. . .
. . .
. . .
. . . Interest rate.
. . .
. . .
. . .
. . .
. . Foreign exchange. .
. . .
. . .
. . . Total.
. . .
. . .
. . .
. . .
. . .
. . .
. — (27) — (27) — — (59) (59) — (139) — (139) (6) — — (6) (6) (166) (59) (231) Global Fixed Income Interest rate. . .
. . .
. . .
. . .
. . . Foreign exchange.
. . .
. . .
. . .
. Total. . .
. . .
. . .
. . .
. . .
. . .
. . 14 — 14 — 107 107 — — — — — — 14 107 121 1 2 (861) — (861) — (1,075) — 3 — (1,072) Net realized gains (losses) from futures contracts. Net realized gains (losses) from foreign currency transactions which could include other currency related gains and losses. Annual Report 97 . Notes to Financial Statements continued Change in Unrealized Appreciation or (Depreciation) on Derivatives Recognized in Income Forward Currency Underlying risk Futures5 Contracts6 Options7 Swaps8 Total Emerging Markets Bond Foreign exchange. . . .
. . .
. . .
. — $(1,981) — — $(1,981) Emerging Markets Local Bond Foreign exchange. . .
. . .
. . .
. . — (280) — — (280) Emerging Markets Corporate Bond Foreign exchange. .
. . .
. . .
. . . — (25) — — (25) 5 6 7 8 Change in net unrealized appreciation (depreciation) from futures contracts. Change in net unrealized appreciation (depreciation) from translation of assets and liabilities in foreign currencies which includes other currency related appreciation (depreciation). Change in net unrealized appreciation (depreciation) from written option contracts and purchased options which are included in change in unrealized appreciation (depreciation) on investments. Change in net unrealized appreciation (depreciation) from swap contracts. During the period ended October 31, 2015 the average notional amount of derivatives as a percent of average net assets were as follows: Foreign currency Limited Maturity.
. . .
. . .
. . .
. . .
. . .
. . Low Duration . .
. . .
. . .
. . .
. . .
. . .
. . . U.S.
Government. . .
. . .
. . .
. . .
. . .
. . . GNMA .
. . .
. . .
. . .
. . .
. . .
. . .
. . .
. . . Core Bond .
. . .
. . .
. . .
. . .
. . .
. . .
. . .
. Corporate Bond . . .
. . .
. . .
. . .
. . .
. . .
. Strategic Income . . .
. . .
. . .
. . .
. . .
. . . Absolute Return Bond.
. . .
. . .
. . .
. . .
. High Income . . .
. . .
. . .
. . .
. . .
. . .
. . . Global Low Duration.
. . .
. . .
. . .
. . .
. . Global Fixed Income . .
. . .
. . .
. . .
. . .
. Emerging Markets Bond . . .
. . .
. . .
. . . Emerging Markets Local Bond.
. . .
. . .
. Emerging Markets Corporate Bond . . .
. Equity Income. . .
. . .
. . .
. . .
. . .
. . .
. . 7% 3% 0% 0% 9% 3% 10% 9% 6% 10% 76% 8% 14% 2% 1% Credit Interest rate Equity 0% 1% 0% 0% 0% 2% 0% 2% 0% 1% 0% 0% 0% 0% 0% 35% 45% 30% 43% 11% 45% 8% 47% 39% 50% 76% 0% 116% 0% 0% 0% 0% 0% 0% 0% 0% 0% 0% 0% 0% 0% 0% 0% 0% 0% Counterparty Credit Risk A derivative contract may suffer a mark-to-market loss if the value of the contract decreases due to an unfavorable change in the market rates or values of the underlying instrument. Losses can also occur if the counterparty does not perform under the contract. A Fund’s risk of loss from counterparty credit risk on OTC derivatives is generally limited to the aggregate unrealized gain netted against any collateral held by a Fund.
For OTC options purchased, a Fund bears the risk of loss of the amount of the premiums paid plus the positive change in market values net of any collateral held by such Fund should the counterparty fail to perform under the contracts. Options written by the Fund does 98 Payden Mutual Funds not typically give rise to counterparty credit risk, as options written generally obligate the Fund, and not the counterparty to perform. With exchange traded purchased options and futures and centrally cleared swaps, there is decreased counterparty credit risk to a Fund since the exchange or clearinghouse guarantees against a possible default. The clearinghouse stands between the buyer and the seller of the contract; therefore, the credit risk is limited to failure of the clearinghouse.
While offset rights may exist under applicable law, a Fund does not have a contractual right of offset against a clearing broker or clearinghouse in the event of a default (including the bankruptcy or insolvency) of the clearing broker or clearinghouse. Additionally, credit risk exists in exchange traded futures and centrally cleared swaps with respect to initial and variation margin that is held in a clearing broker’s customer accounts. While clearing brokers are required to segregate customer margin from their own assets, in the event that a clearing broker becomes insolvent or goes into bankruptcy and at that time there is a shortfall in the aggregate amount of margin held by the clearing broker for all its clients, typically the shortfall would be allocated on a pro rata basis across all the clearing broker’s customers, potentially resulting in losses to a Fund. In order to better define its contractual rights and to secure rights that will help a Fund mitigate its counterparty risk, a Fund may enter into an International Swaps and Derivatives Association, Inc.
Master Agreement (“ISDA Master Agreement”) or similar agreement with its derivative contract counterparties. An ISDA Master Agreement is a bilateral agreement between a Fund and a counterparty that governs certain OTC derivatives and typically contains, among other things, collateral posting terms and netting provisions in the event of a default and/or termination event. Under an ISDA Master Agreement, the Fund may, under certain circumstances, offset with the counterparty certain derivative financial instruments’ payables and/or receivables with collateral held and/or posted and create one single net payment.
The provisions of the ISDA Master Agreement typically permit a single net payment in the event of default (close-out netting), including the bankruptcy or insolvency of the counterparty. However, bankruptcy or insolvency laws of a particular jurisdiction may impose restrictions on or prohibitions against the right of offset in bankruptcy, insolvency or other events. In addition, certain ISDA Master Agreements allow counterparties to OTC derivatives to terminate derivative contracts prior to maturity in the event the Fund’s net assets decline by a stated percentage or the Fund fails to meet the terms of its ISDA Master Agreements, which would cause the Fund to accelerate payment of any net liability owed to the counterparty. .
Collateral Requirements For derivatives traded under an ISDA Master Agreement, the collateral requirements are typically calculated by netting the mark to market amount for each transaction under such agreement and comparing that amount to the value of any collateral currently pledged by a Fund and the counterparty. Cash collateral that has been pledged to cover obligations of a Fund and cash collateral received from the counterparty, if any, is reported separately on the Statement of Assets and Liabilities as cash pledged as collateral and cash received as collateral, respectively. Non-cash collateral pledged by the Fund, if any, is noted in the Schedule of Investments. Generally, the amount of collateral due from or to a party has to exceed a minimum transfer amount threshold (e.g. $500,000) before a transfer is required, which is determined at the close of business of a Fund and additional required collateral is delivered to/ pledged by a Fund on the next business day.
Typically, a Fund and counterparties are not permitted to sell, re-pledge or use the collateral they receive. To the extent amounts due to a Fund from its counterparties are not fully collateralized, contractually or otherwise, the Fund bears the risk of loss from counterparty non-performance. A Fund attempts to mitigate counterparty risk by only entering into agreements with counterparties that it believes have the financial resources to honor their obligations and by monitoring the financial stability of those counterparties. For financial reporting purposes, the Funds do not offset derivative assets and derivative liabilities that are subject to netting arrangements in the Statements of Assets and Liabilities. At October 31, 2015, the Funds’ derivative assets and liabilities (by type) on a gross basis are as follows (000s): Assets Liabilities Limited Maturity Derivative Financial Instruments: Purchased Put Options1 .
. . .
. . .
. . .
. . .
. . .
. . .
. . .
. . .
. . $ Forward Currency Contracts .
. . .
. . .
. . .
. . .
. . .
. . .
. . .
. . Total derivative assets and liabilities in the Statements of Assets and Liabilities . .
. . .
. . .
. . .
. . .
. . .
. . .
. . .
. . .
. Derivatives not subject to a master netting agreement or similar agreement “(MNA”) . . .
. . .
. . .
. . .
. . .
. . .
. . .
. . .
. . Total derivative assets and liabilities subject to a MNA. .
. . .
. $ 2 128 $ — 187 130 187 (90) 40 $ Low Duration Derivative Financial Instruments: Futures Contracts . .
. . .
. . .
. . .
. . .
. . .
. . .
. . .
. . .
. . .
. . .
$ 3 Centrally Cleared Swaps . . .
. . .
. . .
. . .
. . .
. . .
. . .
. . .
. . . 150 11 Purchased Put Options1 .
. . .
. . .
. . .
. . .
. . .
. . .
. . .
. . .
. . Forward Currency Contracts . .
. . .
. . .
. . .
. . .
. . .
. . .
. . .
. 173 Total derivative assets and liabilities in the Statements of Assets and Liabilities . . .
. . .
. . .
. . .
. . .
. . .
. . .
. . .
. . .
. . .
. 337 Derivatives not subject to a MNA. . .
. . .
. . .
. . .
. . .
. . .
. . .
. (267) Total derivative assets and liabilities subject to a MNA. .
. . .
. $ 70 — $ 146 — 84 230 (146) $ 84 U.S. Government Derivative Financial Instruments: Purchased Put Options1 .
. . .
. . .
. . .
. . .
. . .
. . .
. . .
. . .
. . $ 1 Total derivative assets and liabilities in the Statements of Assets and Liabilities .
. . .
. . .
. . .
. . .
. . .
. . .
. . .
. . .
. . .
. . . 1 Derivatives not subject to a MNA.
. . .
. . .
. . .
. . .
. . .
. . .
. . . (1) Total derivative assets and liabilities subject to a MNA.
. . .
. . $ — — — — — GNMA Derivative Financial Instruments: Futures Contracts .
. . .
. . .
. . .
. . .
. . .
. . .
. . .
. . .
. . .
. . .
. $ 9 6 Purchased Put Options1 . .
. . .
. . .
. . .
. . .
. . .
. . .
. . .
. . .
. Total derivative assets and liabilities in the Statements of Assets and Liabilities . . .
. . .
. . .
. . .
. . .
. . .
. . .
. . .
. . . 15 Derivatives not subject to a MNA.
. . .
. . .
. . .
. . .
. . .
. . .
. . . (15) Total derivative assets and liabilities subject to a MNA.
. . .
. . $ — Core Bond Derivative Financial Instruments: Futures Contracts .
. . .
. . .
. . .
. . .
. . .
. . .
. . .
. . .
. . .
. . .
. $ 34 Forward Currency Contracts . .
. . .
. . .
. . .
. . .
. . .
. . .
. . .
. 561 Total derivative assets and liabilities in the Statements of Assets and Liabilities . . .
. . .
. . .
. . .
. . .
. . .
. . .
. . .
. . .
. . .
. 595 Derivatives not subject to a MNA. . .
. . .
. . .
. . .
. . .
. . .
. . .
. (63) Total derivative assets and liabilities subject to a MNA. . .
. . .
$ 532 Corporate Bond Derivative Financial Instruments: Futures Contracts . . .
. . .
. . .
. . .
. . .
. . .
. . .
. . .
. . .
. . .
. . $ 32 Forward Currency Contracts .
. . .
. . .
. . .
. . .
. . .
. . .
. . .
. . 25 Total derivative assets and liabilities in the Statements of Assets and Liabilities . .
. . .
. . .
. . .
. . .
. . .
. . .
. . .
. . .
. . .
. . 57 Derivatives not subject to a MNA. .
. . .
. . .
. . .
. . .
. . .
. . .
. . (32) Total derivative assets and liabilities subject to a MNA. .
. . .
. $ 25 — — — — — $ 65 560 625 (65) $ 560 $ 3 11 — 187 14 (3) $ 11 Annual Report 99 . Notes to Financial Statements continued Assets Liabilities Strategic Income Derivative Financial Instruments: Futures Contracts . . . .
. . .
. . .
. . .
. . .
. . .
. . .
. . .
. . .
. . .
. $ 7$ 12 Forward Currency Contracts . .
. . .
. . .
. . .
. . .
. . .
. . .
. . .
. 136 121 Total derivative assets and liabilities in the Statements of Assets and Liabilities . . .
. . .
. . .
. . .
. . .
. . .
. . .
. . .
. . .
. . .
. 143 133 Derivatives not subject to a MNA. . .
. . .
. . .
. . .
. . .
. . .
. . .
. (15) (12) Total derivative assets and liabilities subject to a MNA. . .
. . .
$ 128 $ 121 Absolute Return Bond Derivative Financial Instruments: Futures Contracts . . .
. . .
. . .
. . .
. . .
. . .
. . .
. . .
. . .
. . .
. . $ Purchased Put Options1 .
. . .
. . .
. . .
. . .
. . .
. . .
. . .
. . .
. . Forward Currency Contracts . .
. . .
. . .
. . .
. . .
. . .
. . .
. . .
. Total derivative assets and liabilities in the Statements of Assets and Liabilities . . .
. . .
. . .
. . .
. . .
. . .
. . .
. . .
. . .
. . .
. Derivatives not subject to a MNA. . .
. . .
. . .
. . .
. . .
. . .
. . .
. Total derivative assets and liabilities subject to a MNA. . .
. . .
$ High Income Derivative Financial Instruments: Centrally Cleared Swaps . . .
. . .
. . .
. . .
. . .
. . .
. . .
. . .
. . . Futures Contracts .
. . .
. . .
. . .
. . .
. . .
. . .
. . .
. . .
. . .
. . .
. $ Forward Currency Contracts . .
. . .
. . .
. . .
. . .
. . .
. . .
. . .
. Total derivative assets and liabilities in the Statements of Assets and Liabilities . . .
. . .
. . .
. . .
. . .
. . .
. . .
. . .
. . .
. . .
. Derivatives not subject to a MNA. . .
. . .
. . .
. . .
. . .
. . .
. . .
. Total derivative assets and liabilities subject to a MNA. . .
. . .
$ Global Low Duration Derivative Financial Instruments: Futures Contracts . . .
. . .
. . .
. . .
. . .
. . .
. . .
. . .
. . .
. . .
. . $ Centrally Cleared Swaps .
. . .
. . .
. . .
. . .
. . .
. . .
. . .
. . .
. . Purchased Put Options1 . .
. . .
. . .
. . .
. . .
. . .
. . .
. . .
. . .
. Forward Currency Contracts . . .
. . .
. . .
. . .
. . .
. . .
. . .
. . . Total derivative assets and liabilities in the Statements of Assets and Liabilities .
. . .
. . .
. . .
. . .
. . .
. . .
. . .
. . .
. . .
. . . Derivatives not subject to a MNA.
. . .
. . .
. . .
. . .
. . .
. . .
. . . Total derivative assets and liabilities subject to a MNA.
. . .
. . $ 4$ 14 51 3 — 51 69 (21) 48 $ 54 (3) 51 —$ 14 347 54 — 379 361 (32) 329 $ 433 (54) 379 3$ 35 5 103 1 26 — 50 146 (88) 58 $ 77 (27) 50 Emerging Market Local Bond Derivative Financial Instruments: Forward Currency Contracts .
. . .
. . .
. . .
. . .
. . .
. . .
. . .
. . $ Total derivative assets and liabilities in the Statements of Assets and Liabilities .
. . .
. . .
. . .
. . .
. . .
. . .
. . .
. . .
. . .
. . . Derivatives not subject to a MNA.
. . .
. . .
. . .
. . .
. . .
. . .
. . . Total derivative assets and liabilities subject to a MNA.
. . .
. . $ Emerging Market Corporate Bond Derivative Financial Instruments: Forward Currency Contracts .
. . .
. . .
. . .
. . .
. . .
. . .
. . .
. . $ Total derivative assets and liabilities in the Statements of Assets and Liabilities .
. . .
. . .
. . .
. . .
. . .
. . .
. . .
. . .
. . .
. . . Derivatives not subject to a MNA.
. . .
. . .
. . .
. . .
. . .
. . .
. . . Total derivative assets and liabilities subject to a MNA.
. . .
. . $ 1 Global Fixed Income Derivative Financial Instruments: Futures Contracts .
. . .
. . .
. . .
. . .
. . .
. . .
. . .
. . .
. . .
. . .
. $ 17 $ Forward Currency Contracts . .
. . .
. . .
. . .
. . .
. . .
. . .
. . .
. 477 Total derivative assets and liabilities in the Statements of Assets and Liabilities . . .
. . .
. . .
. . .
. . .
. . .
. . .
. . .
. . .
. . .
. 494 Derivatives not subject to a MNA. . .
. . .
. . .
. . .
. . .
. . .
. . .
. (100) Total derivative assets and liabilities subject to a MNA. . .
. . .
$ 394 $ 100 Payden Mutual Funds Assets Liabilities Emerging Market Bond Derivative Financial Instruments: Forward Currency Contracts . . .
. . .
. . .
. . .
. . .
. . .
. . .
. . .
$ 270 $ 1,269 Total derivative assets and liabilities in the Statements of Assets and Liabilities . . .
. . .
. . .
. . .
. . .
. . .
. . .
. . .
. . .
. . .
. 270 1,269 Derivatives not subject to a MNA. . .
. . .
. . .
. . .
. . .
. . .
. . .
. — — Total derivative assets and liabilities subject to a MNA. . .
. . .
$ 270 $ 1,269 8 395 403 (8) 395 6$ 203 6 — 6$ 203 — 203 5$ 30 5 — 5$ 30 — 30 Includes options purchased at value which is included in Investments at value and reported in the Schedule of Investments. . The following tables present the Funds’ derivative assets and liabilities by counterparty net of amounts available for offset under a MNA and net of the related collateral received by the Fund as of October 31, 2015 (000s): Limited Maturity Counterparty Barclays Bank PLC . . . .
. . .
. . .
. . .
. . .
. . .
. . .
. . .
. . .
. . .
. . .
. . .
. . BNP PARIBAS . .
. . .
. . .
. . .
. . .
. . .
. . .
. . .
. . .
. . .
. . .
. . .
. . .
. . .
. Total. . .
. . .
. . .
. . .
. . .
. . .
. . .
. . .
. . .
. . .
. . .
. . .
. . .
. . .
. . .
. . .
. . .
. . Counterparty HSBC Bank USA, N.A.. .
. . .
. . .
. . .
. . .
. . .
. . .
. . .
. . .
. . .
. . .
. . . Royal Bank of Canada .
. . .
. . .
. . .
. . .
. . .
. . .
. . .
. . .
. . .
. . .
. . .
. . Total. .
. . .
. . .
. . .
. . .
. . .
. . .
. . .
. . .
. . .
. . .
. . .
. . .
. . .
. . .
. . .
. . .
. . . Cash Derivative Assets Derivatives Non-Cash Subject to MNA by Available Collateral Collateral Net Amount of for Offset Received Received Derivative Assets1 Counterparty $ 15 25 $ 40 Derivative Liabilities Subject to MNA by Counterparty $176 11 $187 — — — Derivatives Available for Offset — — — — — — Non-Cash Collateral Pledged — — — — — — Cash Collateral Pledged — — — $ 15 25 $ 40 Net Amount of Derivative Liabilities2 $176 11 $187 Low Duration Counterparty BNP PARIBAS .
. . .
. . .
. . .
. . .
. . .
. . .
. . .
. . .
. . .
. . .
. . .
. . .
. . .
. . Counterparty HSBC Bank USA, N.A.. .
. . .
. . .
. . .
. . .
. . .
. . .
. . .
. . .
. . .
. . .
. . . Royal Bank of Canada .
. . .
. . .
. . .
. . .
. . .
. . .
. . .
. . .
. . .
. . .
. . .
. . Total. .
. . .
. . .
. . .
. . .
. . .
. . .
. . .
. . .
. . .
. . .
. . .
. . .
. . .
. . .
. . .
. . .
. . . Derivative Assets Subject to MNA by Counterparty $ 70 Derivative Liabilities Subject to MNA by Counterparty $ 72 12 $ 84 Derivatives Available for Offset — Derivatives Available for Offset — — — Non-Cash Collateral Pledged — Non-Cash Collateral Pledged — — — Cash Collateral Pledged — Cash Collateral Pledged — — — Net Amount of Derivative Liabilities2 $ 70 Net Amount of Derivative Liabilities2 $ 72 12 $ 84 Core Bond Counterparty BNP PARIBAS .
. . .
. . .
. . .
. . .
. . .
. . .
. . .
. . .
. . .
. . .
. . .
. . .
. . .
. . Credit Suisse First Boston International. .
. . .
. . .
. . .
. . .
. . .
. . . Total.
. . .
. . .
. . .
. . .
. . .
. . .
. . .
. . .
. . .
. . .
. . .
. . .
. . .
. . .
. . .
. . .
. . .
. Counterparty Barclays Bank PLC . . .
. . .
. . .
. . .
. . .
. . .
. . .
. . .
. . .
. . .
. . .
. . .
. . . BNP PARIBAS .
. . .
. . .
. . .
. . .
. . .
. . .
. . .
. . .
. . .
. . .
. . .
. . .
. . .
. . Credit Suisse First Boston International. .
. . .
. . .
. . .
. . .
. . .
. . . HSBC Bank USA, N.A..
. . .
. . .
. . .
. . .
. . .
. . .
. . .
. . .
. . .
. . .
. . .
. Total. . .
. . .
. . .
. . .
. . .
. . .
. . .
. . .
. . .
. . .
. . .
. . .
. . .
. . .
. . .
. . .
. . .
. . Derivative Assets Subject to MNA by Counterparty Derivatives Available for Offset3 Non-Cash Collateral Received Cash Collateral Received $180 352 $532 $(180) (14) $(194) — — — Derivative Liabilities Subject to MNA by Counterparty Derivatives Available for Offset3 Non-Cash Collateral Pledged Cash Collateral Pledged4 Net Amount of Derivative Liabilities2 $261 264 14 21 $560 — $(180) (14) — $(194) — — — — — $(261) — — (21) $(282) — $ 84 — — $ 84 — — — Net Amount of Derivative Assets1 — $338 $338 Annual Report 101 . Notes to Financial Statements continued Corporate Bond Counterparty Credit Suisse First Boston International. . . .
. . .
. . .
. . .
. . .
. . .
. Counterparty BNP PARIBAS . . .
. . .
. . .
. . .
. . .
. . .
. . .
. . .
. . .
. . .
. . .
. . .
. . .
. . . Credit Suisse First Boston International.
. . .
. . .
. . .
. . .
. . .
. . .
. Royal Bank of Canada . . .
. . .
. . .
. . .
. . .
. . .
. . .
. . .
. . .
. . .
. . .
. . . Total.
. . .
. . .
. . .
. . .
. . .
. . .
. . .
. . .
. . .
. . .
. . .
. . .
. . .
. . .
. . .
. . .
. . .
. Derivative Assets Subject to MNA by Counterparty Derivatives Available for Offset3 Non-Cash Collateral Received Cash Collateral Received Net Amount of Derivative Assets1 $ 25 $ (2) — — $23 Derivative Liabilities Subject to MNA by Counterparty Derivatives Available for Offset3 Non-Cash Collateral Pledged Cash Collateral Pledged Net Amount of Derivative Liabilities2 1 2 8 $ 11 — $ (2) — $ (2) — — — — — — — — $ 1 — 8 $ 9 Derivative Assets Subject to MNA by Counterparty Derivatives Available for Offset3 Non-Cash Collateral Received Cash Collateral Received Net Amount of Derivative Assets1 $ 45 83 $128 $(45) (5) $(50) — — — — — — — $78 $78 Derivative Liabilities Subject to MNA by Counterparty Derivatives Available for Offset3 Non-Cash Collateral Pledged Cash Collateral Pledged Net Amount of Derivative Liabilities2 $ 56 56 5 4 $121 — $(45) (5) — $(50) — — — — — — — — — — $56 11 — 4 $71 Derivative Assets Subject to MNA by Counterparty Derivatives Available for Offset3 Non-Cash Collateral Received Cash Collateral Received Net Amount of Derivative Assets1 $ 16 32 $ 48 $(16) (2) $(18) — — — — — — — $30 $30 $ Strategic Income Counterparty BNP PARIBAS . . .
. . .
. . .
. . .
. . .
. . .
. . .
. . .
. . .
. . .
. . .
. . .
. . .
. . . Credit Suisse First Boston International.
. . .
. . .
. . .
. . .
. . .
. . .
. Total. . .
. . .
. . .
. . .
. . .
. . .
. . .
. . .
. . .
. . .
. . .
. . .
. . .
. . .
. . .
. . .
. . .
. . Counterparty Barclays Bank PLC . .
. . .
. . .
. . .
. . .
. . .
. . .
. . .
. . .
. . .
. . .
. . .
. . .
. BNP PARIBAS . . .
. . .
. . .
. . .
. . .
. . .
. . .
. . .
. . .
. . .
. . .
. . .
. . .
. . . Credit Suisse First Boston International.
. . .
. . .
. . .
. . .
. . .
. . .
. HSBC Bank USA, N.A.. . .
. . .
. . .
. . .
. . .
. . .
. . .
. . .
. . .
. . .
. . .
. . Total. .
. . .
. . .
. . .
. . .
. . .
. . .
. . .
. . .
. . .
. . .
. . .
. . .
. . .
. . .
. . .
. . .
. . . Absolute Return Bond Counterparty BNP PARIBAS .
. . .
. . .
. . .
. . .
. . .
. . .
. . .
. . .
. . .
. . .
. . .
. . .
. . .
. . Credit Suisse First Boston International. .
. . .
. . .
. . .
. . .
. . .
. . . Total.
. . .
. . .
. . .
. . .
. . .
. . .
. . .
. . .
. . .
. . .
. . .
. . .
. . .
. . .
. . .
. . .
. . .
. 102 Payden Mutual Funds . Counterparty Barclays Bank PLC . . . .
. . .
. . .
. . .
. . .
. . .
. . .
. . .
. . .
. . .
. . .
. . .
. . BNP PARIBAS . .
. . .
. . .
. . .
. . .
. . .
. . .
. . .
. . .
. . .
. . .
. . .
. . .
. . .
. Credit Suisse First Boston International. . .
. . .
. . .
. . .
. . .
. . .
. . HSBC Bank USA, N.A.. .
. . .
. . .
. . .
. . .
. . .
. . .
. . .
. . .
. . .
. . .
. . . Total.
. . .
. . .
. . .
. . .
. . .
. . .
. . .
. . .
. . .
. . .
. . .
. . .
. . .
. . .
. . .
. . .
. . .
. Derivative Liabilities Subject to MNA by Counterparty Derivatives Available for Offset3 Non-Cash Collateral Pledged $ 23 24 2 2 $ 51 — $ (16) (2) — $ (18) — — — — — Derivative Assets Subject to MNA by Counterparty Derivatives Available for Offset3 Non-Cash Collateral Received $111 218 $329 $(111) (13) $(124) — — — Derivative Liabilities Subject to MNA by Counterparty Derivatives Available for Offset3 Non-Cash Collateral Pledged Cash Collateral Pledged4 $196 170 13 $379 — $(111) (13) $(124) — — — — $(196) (59) — $(255) Derivative Assets Subject to MNA by Counterparty Derivatives Available for Offset3 Non-Cash Collateral Received Cash Collateral Received Cash Collateral Pledged — — — — — Net Amount of Derivative Liabilities2 $ 23 8 — 2 $ 33 High Income Counterparty BNP PARIBAS . . .
. . .
. . .
. . .
. . .
. . .
. . .
. . .
. . .
. . .
. . .
. . .
. . .
. . . Credit Suisse First Boston International.
. . .
. . .
. . .
. . .
. . .
. . .
. Total. . .
. . .
. . .
. . .
. . .
. . .
. . .
. . .
. . .
. . .
. . .
. . .
. . .
. . .
. . .
. . .
. . .
. . Counterparty Barclays Bank PLC . .
. . .
. . .
. . .
. . .
. . .
. . .
. . .
. . .
. . .
. . .
. . .
. . .
. BNP PARIBAS . . .
. . .
. . .
. . .
. . .
. . .
. . .
. . .
. . .
. . .
. . .
. . .
. . .
. . . Credit Suisse First Boston International.
. . .
. . .
. . .
. . .
. . .
. . .
. Total. . .
. . .
. . .
. . .
. . .
. . .
. . .
. . .
. . .
. . .
. . .
. . .
. . .
. . .
. . .
. . .
. . .
. . Cash Collateral Received — — — Net Amount of Derivative Assets1 — $205 $205 Net Amount of Derivative Liabilities — — — — Global Low Duration Counterparty BNP PARIBAS . .
. . .
. . .
. . .
. . .
. . .
. . .
. . .
. . .
. . .
. . .
. . .
. . .
. . .
. Counterparty BNP PARIBAS . . .
. . .
. . .
. . .
. . .
. . .
. . .
. . .
. . .
. . .
. . .
. . .
. . .
. . . HSBC Bank USA, N.A..
. . .
. . .
. . .
. . .
. . .
. . .
. . .
. . .
. . .
. . .
. . .
. Royal Bank of Canada . . .
. . .
. . .
. . .
. . .
. . .
. . .
. . .
. . .
. . .
. . .
. . . Total.
. . .
. . .
. . .
. . .
. . .
. . .
. . .
. . .
. . .
. . .
. . .
. . .
. . .
. . .
. . .
. . .
. . .
. $ 58 Derivative Liabilities Subject to MNA by Counterparty $ 7 39 4 $ 50 $ (7) Derivatives Available for Offset3 $ (7) — — $ (7) — Non-Cash Collateral Pledged — — — — — Cash Collateral Pledged — — — — Net Amount of Derivative Assets1 $ 51 Net Amount of Derivative Liabilities2 — $ 39 4 $ 43 Annual Report 103 . Notes to Financial Statements continued Global Fixed Income Counterparty Barclays Bank PLC . . . .
. . .
. . .
. . .
. . .
. . .
. . .
. . .
. . .
. . .
. . .
. . .
. . BNP PARIBAS . .
. . .
. . .
. . .
. . .
. . .
. . .
. . .
. . .
. . .
. . .
. . .
. . .
. . .
. Credit Suisse First Boston International. . .
. . .
. . .
. . .
. . .
. . .
. . HSBC Bank USA, N.A.. .
. . .
. . .
. . .
. . .
. . .
. . .
. . .
. . .
. . .
. . .
. . . Royal Bank of Canada .
. . .
. . .
. . .
. . .
. . .
. . .
. . .
. . .
. . .
. . .
. . .
. . State Street Bank & Trust Co. .
. . .
. . .
. . .
. . .
. . .
. . .
. . .
. . .
. . .
. Total. . .
. . .
. . .
. . .
. . .
. . .
. . .
. . .
. . .
. . .
. . .
. . .
. . .
. . .
. . .
. . .
. . .
. . Counterparty Barclays Bank PLC . .
. . .
. . .
. . .
. . .
. . .
. . .
. . .
. . .
. . .
. . .
. . .
. . .
. BNP PARIBAS . . .
. . .
. . .
. . .
. . .
. . .
. . .
. . .
. . .
. . .
. . .
. . .
. . .
. . . Credit Suisse First Boston International.
. . .
. . .
. . .
. . .
. . .
. . .
. HSBC Bank USA, N.A.. . .
. . .
. . .
. . .
. . .
. . .
. . .
. . .
. . .
. . .
. . .
. . Royal Bank of Canada . .
. . .
. . .
. . .
. . .
. . .
. . .
. . .
. . .
. . .
. . .
. . .
. Total. . .
. . .
. . .
. . .
. . .
. . .
. . .
. . .
. . .
. . .
. . .
. . .
. . .
. . .
. . .
. . .
. . .
. . Derivative Assets Subject to MNA by Counterparty Derivatives Available for Offset3 Non-Cash Collateral Received 51 46 84 6 103 104 $ 394 $ (51) (46) (13) (6) (103) — $(219) — — — — — — — Derivative Liabilities Subject to MNA by Counterparty Derivatives Available for Offset3 Non-Cash Collateral Pledged 61 76 13 84 161 $ 395 $ (51) (46) (13) (6) (103) $(219) — — — — — — Derivative Assets Subject to MNA by Counterparty Derivatives Available for Offset3 Non-Cash Collateral Received $ 256 14 $ 270 $ (21) — $ (21) — — — Derivative Liabilities Subject to MNA by Counterparty Derivatives Available for Offset3 Non-Cash Collateral Pledged Cash Collateral Pledged4 Net Amount of Derivative Liabilities2 $ 942 21 306 $1,269 — $ (21) — $ (21) — — — — $ (942) — (260) $(1,202) — — $ 46 $ 46 $ $ Cash Collateral Received — — — — — — — Cash Collateral Pledged — — — — — — Net Amount of Derivative Assets1 — — $ 71 — — 104 $175 Net Amount of Derivative Liabilities2 $ 10 30 — 78 58 $176 Emerging Markets Bond Counterparty BNP PARIBAS . .
. . .
. . .
. . .
. . .
. . .
. . .
. . .
. . .
. . .
. . .
. . .
. . .
. . .
. Credit Suisse First Boston International. . .
. . .
. . .
. . .
. . .
. . .
. . Total. .
. . .
. . .
. . .
. . .
. . .
. . .
. . .
. . .
. . .
. . .
. . .
. . .
. . .
. . .
. . .
. . .
. . . Counterparty Barclays Bank PLC .
. . .
. . .
. . .
. . .
. . .
. . .
. . .
. . .
. . .
. . .
. . .
. . .
. . BNP PARIBAS . .
. . .
. . .
. . .
. . .
. . .
. . .
. . .
. . .
. . .
. . .
. . .
. . .
. . .
. HSBC Bank USA, N.A.. . .
. . .
. . .
. . .
. . .
. . .
. . .
. . .
. . .
. . .
. . .
. . Total. .
. . .
. . .
. . .
. . .
. . .
. . .
. . .
. . .
. . .
. . .
. . .
. . .
. . .
. . .
. . .
. . .
. . . 104 Payden Mutual Funds Cash Collateral Received — — — Net Amount of Derivative Assets1 $235 14 $249 .
Emerging Markets Local Bond Counterparty Derivative Assets Subject to MNA by Counterparty Derivatives Available for Offset3 Non-Cash Collateral Received Cash Collateral Received $ (6) — — Derivative Assets Subject to MNA by Counterparty Derivatives Available for Offset3 Non-Cash Collateral Received Cash Collateral Received Net Amount of Derivative Assets1 $142 8 53 $203 $ (6) — — $ (6) — — — — — — — — $136 8 53 $197 Derivative Assets Subject to MNA by Counterparty Derivatives Available for Offset3 Non-Cash Collateral Received Cash Collateral Received Net Amount of Derivative Assets1 $ (1) — — Derivative Liabilities Subject to MNA by Counterparty Derivatives Available for Offset3 Non-Cash Collateral Pledged Cash Collateral Pledged Net Amount of Derivative Liabilities2 $ 21 1 8 $ 30 — $ (1) — $ (1) — — — — — — — — $ 21 — 8 $ 29 Barclays Bank PLC . . . .
. . .
. . .
. . .
. . .
. . .
. . .
. . .
. . .
. . .
. . .
. . .
. . Counterparty $ Barclays Bank PLC . .
. . .
. . .
. . .
. . .
. . .
. . .
. . .
. . .
. . .
. . .
. . .
. . .
. BNP PARIBAS . . .
. . .
. . .
. . .
. . .
. . .
. . .
. . .
. . .
. . .
. . .
. . .
. . .
. . . HSBC Bank USA, N.A..
. . .
. . .
. . .
. . .
. . .
. . .
. . .
. . .
. . .
. . .
. . .
. Total. . .
. . .
. . .
. . .
. . .
. . .
. . .
. . .
. . .
. . .
. . .
. . .
. . .
. . .
. . .
. . .
. . .
. . 6 Net Amount of Derivative Assets — Emerging Markets Corporate Bond Counterparty BNP PARIBAS . .
. . .
. . .
. . .
. . .
. . .
. . .
. . .
. . .
. . .
. . .
. . .
. . .
. . .
. Counterparty $ Barclays Bank PLC . . .
. . .
. . .
. . .
. . .
. . .
. . .
. . .
. . .
. . .
. . .
. . .
. . . BNP PARIBAS .
. . .
. . .
. . .
. . .
. . .
. . .
. . .
. . .
. . .
. . .
. . .
. . .
. . .
. . HSBC Bank USA, N.A.. .
. . .
. . .
. . .
. . .
. . .
. . .
. . .
. . .
. . .
. . .
. . . Total.
. . .
. . .
. . .
. . .
. . .
. . .
. . .
. . .
. . .
. . .
. . .
. . .
. . .
. . .
. . .
. . .
. . .
. 1 2 3 4 5 $ 4 Net amount represents the net amount receivable from the counterparty in the event of default. Net amount represents the net amount payable from the counterparty in the event of default. The amount of derivatives for offset is limited to the amount of assets and/or liabilities that are subject to a MNA. Excess of collateral pledged to the individual counterparty may not be shown for financial reporting purposes. Credit Enhancements Certain obligations held in the Funds have credit enhancement or liquidity features that may, under certain circumstances, provide for repayment of principal and interest on the obligation upon demand date, interest rate reset date or final maturity. These enhancements may include: letters of credit, liquidity guarantees, security purchase agreements, and third party insurance (e.g. AGM, AMBAC and BAM). TBA Sale Commitments Some Funds entered into TBA sale commitments, within dollar roll agreements, to hedge their portfolio position or to sell mortgage backed securities they own under delayed delivery arrangements.
Proceeds from TBA sale commitments are not received until the contractual settlement date. During the time a TBA sale commitment is outstanding, equivalent deliverable securities, or an offsetting TBA purchase commitment deliverable on or before the sale commitment date, are held as “cover” for the transaction. Unsettled TBA sale commitments are valued at approximately the current value of the underlying securities. The contract is “marked-to-market” daily and the change in the value is recorded by the Fund as an unrealized gain or loss.
If the TBA sale commitment is closed through the acquisition of an offsetting purchase commitment, the Fund realizes a gain or loss from the sale of the securities based upon the unit price established at the date the Fund entered the commitment. Securities Lending Pursuant to a securities lending agreement with The Bank of New York Mellon, the Funds (except Cash Reserves Money Market) may lend securities to qualified institutions. It is each Annual Report 105 . Notes to Financial Statements continued Fund’s policy that at origination all loans are secured by collateral of at least 102% of the value of the U.S. securities loaned and 105% of the value of the foreign securities loaned. Collateral equivalent to at least 100% of the market value of securities on loan is maintained at all times. The collateral is maintained by the custodian. Cash collateral is reinvested in the Payden Cash Reserves Money Market Fund.
The Funds are entitled to receive all of the income on securities loaned, in addition to income earned as a result of the lending transaction. Although each security loaned is fully collateralized, each Fund bears the risk of delay in receiving additional collateral or in recovery of or loss of rights in the securities loaned should the borrower fail to return the securities in a timely manner. The Funds maintain the right to recall the securities on loan for voting purposes. The income earned by each Fund is disclosed in the Statement of Operations. Distributions to Shareholders Distributions to shareholders are recorded on the ex-dividend date.
Dividends from net investment income and net realized gains on foreign currency transactions are declared and paid monthly for all Funds except the Cash Reserves Money Market, Limited Maturity, Short Bond, U.S. Government, GNMA and California Municipal Income Funds, which are declared daily and paid monthly and Equity Income Fund, which is declared and paid quarterly. Net realized gains on investments, if any, are declared and distributed at least annually.
All distributions are paid in the form of additional shares unless cash payment is requested. Securities lending transactions are entered into by a Fund under Master Securities Lending Agreements (“MSLA”) which provide the right, in the event of default (including bankruptcy or insolvency), for the non-defaulting party to liquidate the collateral and calculate a net exposure to the defaulting party or request additional collateral. In the event that a borrower defaults, a Fund, as lender, would offset the market value of the collateral received against the market value of the securities loaned. The value of the collateral is typically greater than that of the market value of the securities loaned, leaving the lender with a net amount payable to the defaulting party.
However, bankruptcy or insolvency laws of a particular jurisdiction may impose restrictions on or prohibitions against such a right of offset in the event of a MSLA counterparty’s bankruptcy or insolvency. Under the MSLA, the borrower can resell or repledge the loaned securities, and a Fund can reinvest cash collateral, or, upon an event of default, resell or re-pledge the collateral. Federal Income Taxes It is the policy of each Fund to meet the requirements for qualification as a regulated investment company as defined in Subchapter M of the Internal Revenue Code (the “Code”), and to make distributions of net investment income and net realized gains sufficient to relieve it from all Federal income or excise taxes. As of and during the period ended October 31, 2015, the Funds did not record any liability for uncertain tax positions. Accordingly, no provision for Federal income or excise tax is necessary. The Fund’s securities lending agreements by counterparty, which are subject to offset under a MSLA, if applicable, is included within each Fund’s Schedule of Investments under the heading “Offsetting Assets and Liabilities”.
For financial reporting purposes, the Funds do not offset financial assets and financial liabilities that are subject to MSLA on the Statements of Assets and Liabilities. Beginning March 20, 2015 the Group began terminating securities lending. As of May 8, 2015 all securities on loan were returned to the Funds. 106 Payden Mutual Funds Distributions to shareholders are determined in accordance with income tax regulations, which may differ from GAAP. Each Fund files a tax return annually using tax accounting methods required under provisions of the Code, which may differ from GAAP, the basis on which these financial statements are prepared. The differences arise primarily from the treatment of foreign currency transactions and futures contracts and the deferral of certain losses under Federal income tax regulations. Accordingly, the amounts of net investment income and net realized gains or losses reported in these financial statements may differ from those reported in each Fund’s tax return. Return of capital distributions and net investment losses for tax purposes, if any, are reclassified to paid in capital. As of and during the period ended October 31, 2015, the Funds did not have any liabilities for any unrecognized tax positions. The Funds recognize interest and penalties, if any, related to unrecognized tax positions as income tax expense in the Statements of Operations.
During the period, the Funds did not incur any interest or penalties. Each of the tax years in the four-year period ended October 31, 2015 remains subject to examination by the Internal Revenue Service and state taxing authorities. . Affiliated Investments Each of the Paydenfunds (except the Cash Reserves Money Market and California Municipal Income Funds) invests in other Funds of the Group (an “Affiliated Fund”). The income Fund Investments in Cash Reserves Money Market Fund Limited Maturity . . .
. . .
. . .
. . .
. . .
. . .
. . .
. . .
. . .
. . .
. . .
. . .
. . Low Duration . .
. . .
. . .
. . .
. . .
. . .
. . .
. . .
. . .
. . .
. . .
. . .
. . .
. . . U.S.
Government . . .
. . .
. . .
. . .
. . .
. . .
. . .
. . .
. . .
. . .
. . .
. . .
. . GNMA . .
. . .
. . .
. . .
. . .
. . .
. . .
. . .
. . .
. . .
. . .
. . .
. . .
. . .
. . .
. . . Core Bond .
. . .
. . .
. . .
. . .
. . .
. . .
. . .
. . .
. . .
. . .
. . .
. . .
. . .
. . .
. Corporate Bond. . .
. . .
. . .
. . .
. . .
. . .
. . .
. . .
. . .
. . .
. . .
. . .
. . .
. Strategic Income. . .
. . .
. . .
. . .
. . .
. . .
. . .
. . .
. . .
. . .
. . .
. . .
. . . Absolute Return Bond .
. . .
. . .
. . .
. . .
. . .
. . .
. . .
. . .
. . .
. . .
. . Floating Rate. .
. . .
. . .
. . .
. . .
. . .
. . .
. . .
. . .
. . .
. . .
. . .
. . .
. . .
. High Income . . .
. . .
. . .
. . .
. . .
. . .
. . .
. . .
. . .
. . .
. . .
. . .
. . .
. . . Global Low Duration .
. . .
. . .
. . .
. . .
. . .
. . .
. . .
. . .
. . .
. . .
. . . Global Fixed Income.
. . .
. . .
. . .
. . .
. . .
. . .
. . .
. . .
. . .
. . .
. . .
. Emerging Markets Bond . . .
. . .
. . .
. . .
. . .
. . .
. . .
. . .
. . .
. . .
. Emerging Markets Local Bond . . .
. . .
. . .
. . .
. . .
. . .
. . .
. . .
. Emerging Markets Corporate Bond . . .
. . .
. . .
. . .
. . .
. . .
. . . Equity Income .
. . .
. . .
. . .
. . .
. . .
. . .
. . .
. . .
. . .
. . .
. . .
. . .
. . . Investments in High Income Fund — Investor Class Global Fixed Income.
. . .
. . .
. . .
. . .
. . .
. . .
. . .
. . .
. . .
. . .
. . .
. Investments in Floating Rate Fund — SI Class Core Bond . . .
. . .
. . .
. . .
. . .
. . .
. . .
. . .
. . .
. . .
. . .
. . .
. . .
. . .
. . High Income . .
. . .
. . .
. . .
. . .
. . .
. . .
. . .
. . .
. . .
. . .
. . .
. . .
. . .
. Global Fixed Income. . .
. . .
. . .
. . .
. . .
. . .
. . .
. . .
. . .
. . .
. . .
. . Investments in Emerging Markets Bond Fund — SI Class Global Fixed Income. .
. . .
. . .
. . .
. . .
. . .
. . .
. . .
. . .
. . .
. . .
. . . Investments in Emerging Markets Corporate Bond Fund — SI Class Core Bond .
. . .
. . .
. . .
. . .
. . .
. . .
. . .
. . .
. . .
. . .
. . .
. . .
. . .
. . .
. High Income . . .
. . .
. . .
. . .
. . .
. . .
. . .
. . .
. . .
. . .
. . .
. . .
. . .
. . . Emerging Markets Local Bond .
. . .
. . .
. . .
. . .
. . .
. . .
. . .
. . . Investments in Emerging Markets Local Bond Fund — Investor Class Core Bond .
. . .
. . .
. . .
. . .
. . .
. . .
. . .
. . .
. . .
. . .
. . .
. . .
. . .
. . .
. Global Fixed Income. . .
. . .
. . .
. . .
. . .
. . .
. . .
. . .
. . .
. . .
. . .
. . and both realized and the change in unrealized gains and losses earned by each Fund from the Affiliated Funds for the period is disclosed in the Statements of Operations. The table below details the transactions of each Fund in Affiliated Funds. Value October 31, 2014 $20,346,364 54,772,743 8,940,063 3,490,609 23,784,686 10,993,989 8,641,858 — 5,993,145 60,647,206 9,807,464 3,059,342 56,274,108 6,486,481 6,725,392 21,452,555 Purchases Sales Dividends $1,318,393,828 $1,332,353,628 $ 527 1,334,111,706 1,380,668,414 524 1,833,263,780 1,829,155,330 739 1,618,894,500 1,615,563,003 633 2,052,014,796 2,054,234,542 824 452,299,207 462,280,252 183 1,162,553,690 1,165,283,469 475 1,018,794,151 1,016,007,533 421 3,244,990,744 3,241,474,978 1,295 5,269,609,460 5,290,986,126 2,068 267,034,382 274,883,002 105 410,750,733 410,995,048 162 5,310,566,020 5,337,675,063 2,107 689,484,452 693,669,966 276 228,188,704 234,119,569 91 1,606,725,601 1,623,966,714 662 $ 4,613,834 Value October 31, 2015 $ 6,386,564 8,216,035 13,048,513 6,822,106 21,564,940 1,012,944 5,912,079 2,786,618 9,508,911 39,270,540 1,958,844 2,815,027 29,165,065 2,300,967 794,527 4,211,442 — — $231,995 $ 4,170,698 — 4,000,000 — — $479,485 166,866 — 31,198 $15,069,499 8,920,536 985,055 $ 4,468,516 — — $211,890 $ 4,142,092 $17,227,177 9,360,000 3,907,515 — — 1,000,000 — $733,480 — 398,520 — 176,875 $15,951,703 8,667,000 4,609,969 — $253,850 617,764 25,589 $ 4,302,987 — — $ 94,700 $ 4,965,000 $15,191,272 4,960,298 993,028 $ $ $ 5,478,879 767,004 Investments in Absolute Return Bond Fund — SI Class Core Bond .
. . .
. . .
. . .
. . .
. . .
. . .
. . .
. . .
. . .
. . .
. . .
. . .
. . .
. . .
. Custodian Credits The Funds have entered into an agreement with the custodian, whereby they earn custodian fee credits for temporary cash — — — $ $ 5,000,000 balances. These credits, which offset custodian fees that may be charged to the Funds, are based on 75% of the daily effective Annual Report 107 . Notes to Financial Statements continued federal funds rate and are disclosed, subject to rounding, in the Statements of Operations. by the Group are allocated among the Funds of the Group on the basis of relative net assets. Fund-specific expenses are charged to each Fund as incurred. Line of Credit The Paydenfunds (except Cash Reserves Money Market) have entered into a Credit Agreement with Bank of New York Mellon under which the bank has agreed to make loans to one or more of the Funds upon request by such Fund(s) and subject to the conditions of the Credit Agreement. The interest rate for any such loan will vary depending upon the type of borrowing chosen by the Fund. The aggregate of all such loans to the Funds may not exceed $75 million.
No Fund took a loan during the period, nor did any Fund have a loan outstanding at the end of the period. 3. Related Party Transactions Payden & Rygel (the “Adviser”) provides investment advisory services to the Funds. Under the terms of the investment advisory agreement, it is entitled to receive fees monthly, computed on the average daily net assets of each of the Funds separately at an annualized rate.
The rates for each Fund are shown in the table below. Other Income and realized and unrealized gain/loss are allocated to each class based on relative net assets. Shared expenses incurred Adviser Fees Investor Class Between $0–500 Million Cash Reserves Money Market . .
. . .
. . . Limited Maturity .
. . .
. . .
. . .
. . .
. . .
. . Low Duration . .
. . .
. . .
. . .
. . .
. . .
. . .
. U.S. Government . .
. . .
. . .
. . .
. . .
. . .
. GNMA . . .
. . .
. . .
. . .
. . .
. . .
. . .
. . .
. . Core Bond . .
. . .
. . .
. . .
. . .
. . .
. . .
. . .
. Corporate Bond . . .
. . .
. . .
. . .
. . .
. . .
. Strategic Income. . .
. . .
. . .
. . .
. . .
. . .
. Absolute Return Bond . . .
. . .
. . .
. . .
. Floating Rate . . .
. . .
. . .
. . .
. . .
. . .
. . . High Income.
. . .
. . .
. . .
. . .
. . .
. . .
. . . California Municipal Income .
. . .
. . .
. Global Low Duration. . .
. . .
. . .
. . .
. . . Global Fixed Income .
. . .
. . .
. . .
. . .
. . Emerging Markets Bond . .
. . .
. . .
. . .
. Emerging Markets Local Bond. . .
. . .
. Emerging Markets Corporate Bond . . . Equity Income .
. . .
. . .
. . .
. . .
. . .
. . .
. Between $0.5–1 Billion Between $1–2 Billion Over $2 Billion Expense Guarantee 0.15% 0.28% 0.28% 0.28% 0.27% 0.28% 0.35% 0.55% 0.50% 0.55% 0.35% 0.32% 0.30% 0.30% 0.45% 0.60% 0.80% 0.50% 0.15% 0.28% 0.28% 0.28% 0.27% 0.28% 0.35% 0.55% 0.50% 0.55% 0.35% 0.32% 0.30% 0.30% 0.45% 0.60% 0.80% 0.50% 0.15% 0.25% 0.25% 0.25% 0.27% 0.25% 0.35% 0.55% 0.50% 0.55% 0.35% 0.25% 0.30% 0.30% 0.45% 0.60% 0.80% 0.50% 0.15% 0.25% 0.25% 0.25% 0.27% 0.25% 0.35% 0.55% 0.50% 0.55% 0.35% 0.25% 0.25% 0.25% 0.45% 0.60% 0.80% 0.30% 0.50% 0.60% 0.60% 0.60% 0.50% 0.60% 1.00% n/a n/a n/a 0.75% 0.80% 0.70% 0.70% 1.25% 1.50% n/a 0.80% The Adviser agreed to guarantee that, for so long as it acts as investment adviser to the Funds, the expenses of the Funds, including advisory fees (exclusive of interest, 12b-1 fees, and taxes) will not exceed the percentages indicated above (“Expense Guarantee”) of that Fund’s average daily net assets on an annualized basis. The adviser also voluntarily agreed to temporarily limit certain Funds’ total expenses (“Voluntary Expense Limit”), including advisory fees, to the percentages indicated above of that Fund’s average daily net assets on an 108 Payden Mutual Funds Current Voluntary Expense Limit 0.25% 0.29% 0.47% 0.45% n/a n/a 0.65% 0.80% 0.70% 0.75% n/a 0.55% 0.55% 0.65% n/a 0.99% 0.95% n/a 3 Year Deferred Expense Subsidy FY 2013 FY 2014 FY 2015 $1,269,683 $1,525,458 393,598 682,077 237,852 701,944 174,255 180,662 1,238,187 360,087 — — 103,973 93,484 — 142,838 — — — 263,494 — — 51,157 65,834 101,433 177,907 106,512 87,672 293,712 342,910 — — — 221,119 152,607 187,200 $1,204,702 1,030,707 889,095 174,481 495,315 — 89,819 173,558 238,584 283,782 — 65,250 166,652 90,888 332,289 27,915 184,904 406,103 annualized basis through February 28, 2016 (exclusive of interest and taxes). Each Fund remains liable to the Adviser for expenses subsidized in any fiscal year up to a maximum of three years from the end of the period in which the expenses were subsidized as long as any reimbursement will not cause the annual expense ratio for the year in which it is made to exceed the amount of the . expense guarantee or voluntary expense limit (whichever is in effect at the time of reimbursement). solely to having a common investment advisor, common officers or common trustees. The deferred expense subsidies represent the cumulative amount of expenses subsidized for the Funds through the end of the period. Such amount is not considered a liability of each respective Fund, and, therefore, is not recorded as liabilities in the Statement of Assets and Liabilities, but will be recognized as net expense in the Statements of Operations as expense previously deferred in future periods, if expense limits permit. Indemnifications Under the Group’s organizational documents, its trustees and officers are indemnified by the Funds against certain liabilities arising out of the performance of their duties to the Funds. Additionally, in the normal course of business, the Funds enter into contracts with service providers that contain general indemnification clauses. A Fund’s maximum exposure under these agreements is unknown as this would involve future claims that may be made against the Fund that have not yet occurred. Currently the Funds expect this risk of loss to be remote. Treasury Plus, Inc., a wholly owned subsidiary of Payden & Rygel, serves as administrator to the Funds.
Under the terms of the administration agreement, Treasury Plus, Inc. receives fees monthly, computed on the average daily net assets of the Funds at an annualized rate of 0.15%. Under a distribution agreement with the Funds, the U.S. Government, GNMA, Core Bond, Strategic Income, Absolute Return Bond, Floating Rate, High Income, Emerging Markets Bond, Emerging Markets Local Bond, Emerging Markets Corporate Bond and Equity Income Funds adopted a plan pursuant to SEC rule 12b-1 by which Payden & Rygel Distributors receives fee monthly, computed on the average net assets of the Adviser class at an annualized rate of 0.25%. Payden & Rygel Distributors is not entitled to receive any fees from the Investor, or SI classes of the Funds. 4. Fair Value Measurement Various inputs are used in determining the value of each Fund’s investments and other financial instruments.
The inputs or methodology used for valuing securities are not necessarily an indication of the risk associated with investing in those securities. These inputs are summarized in the three broad levels: Level 1 — quoted prices in active markets for identical investments, Level 2 — other significant observable inputs (including quoted prices for similar securities, interest rates, prepayment speeds, credit risk, etc.), and Level 3 — significant unobservable inputs (including fund’s own assumptions in determining the fair value of investments). See Note 2 — Securities Valuation for a summary of the inputs used in valuing the Funds’ investments and other financial instruments. Certain officers and/or trustees of the Funds are affiliated with Payden & Rygel, Payden & Rygel Distributors and/or Treasury Plus, Inc.
Such officers and trustees receive no fees from the Funds for serving as officers and/or trustees of the Funds. The Funds may purchase securities from or sell securities to an affiliated fund or portfolio provided that the affiliation is due Investments in Securities Level 1-Quoted Prices Assets (000’s) Cash Reserves Money Market Repurchase Agreement. . .
. . .
. . .
. . .
. . .
. . .
. . .
. . . U.S.
Government . . .
. . .
. . .
. . .
. . .
. . .
. . .
. . .
. . .
. . U.S. Treasury .
. . .
. . .
. . .
. . .
. . .
. . .
. . .
. . .
. . .
. . .
. . Investment Company . .
. . .
. . .
. . .
. . .
. . .
. . .
. . .
. . — — — $3,888 Liabilities (000’s) — — — — Level 2-Other Significant Observable Inputs Assets (000’s) $140,000 223,521 25,000 — Level 3-Significant Unobservable Inputs Liabilities (000’s) — — — — Assets (000’s) Liabilities (000’s) — — — — — — — — Total (000’s) $140,000 223,521 25,000 3,888 Annual Report 109 . Notes to Financial Statements continued Investments in Securities Level 1-Quoted Prices Assets (000’s) Liabilities (000’s) Level 2-Other Significant Observable Inputs Assets (000’s) Level 3-Significant Unobservable Inputs Liabilities (000’s) Assets (000’s) Liabilities (000’s) Total (000’s) Limited Maturity Asset Backed . . . .
. . .
. . .
. . .
. . .
. . .
. . .
. . .
. . .
. . .
. . Bank Loans . .
. . .
. . .
. . .
. . .
. . .
. . .
. . .
. . .
. . .
. . .
. . . Commercial Paper .
. . .
. . .
. . .
. . .
. . .
. . .
. . .
. . .
. . . Corporate Bond.
. . .
. . .
. . .
. . .
. . .
. . .
. . .
. . .
. . .
. . . Foreign Government .
. . .
. . .
. . .
. . .
. . .
. . .
. . .
. . .
. Mortgage Backed . . .
. . .
. . .
. . .
. . .
. . .
. . .
. . .
. . .
. . Municipal . .
. . .
. . .
. . .
. . .
. . .
. . .
. . .
. . .
. . .
. . .
. . .
. U.S. Government . .
. . .
. . .
. . .
. . .
. . .
. . .
. . .
. . .
. . . Options Purchased .
. . .
. . .
. . .
. . .
. . .
. . .
. . .
. . .
. . . Investment Company .
. . .
. . .
. . .
. . .
. . .
. . .
. . .
. . . — — — — — — — — $ 2 6,387 — — — — — — — — — — $ 82,222 2,624 23,995 173,852 10,781 37,482 1,351 85,144 — — — — — — — — — — — — — — — — — — — — — — — — — — — — — — — — $ 82,222 2,624 23,995 173,852 10,781 37,482 1,351 85,144 2 6,387 Low Duration Asset Backed .
. . .
. . .
. . .
. . .
. . .
. . .
. . .
. . .
. . .
. . .
. . Bank Loans . .
. . .
. . .
. . .
. . .
. . .
. . .
. . .
. . .
. . .
. . .
. . . Commercial Paper .
. . .
. . .
. . .
. . .
. . .
. . .
. . .
. . .
. . . Corporate Bond.
. . .
. . .
. . .
. . .
. . .
. . .
. . .
. . .
. . .
. . . Foreign Government .
. . .
. . .
. . .
. . .
. . .
. . .
. . .
. . .
. Mortgage Backed . . .
. . .
. . .
. . .
. . .
. . .
. . .
. . .
. . .
. . Municipal . .
. . .
. . .
. . .
. . .
. . .
. . .
. . .
. . .
. . .
. . .
. . .
. U.S. Government . .
. . .
. . .
. . .
. . .
. . .
. . .
. . .
. . .
. . . Options Purchased .
. . .
. . .
. . .
. . .
. . .
. . .
. . .
. . .
. . . Investment Company .
. . .
. . .
. . .
. . .
. . .
. . .
. . .
. . . — — — — — — — — 11 8,216 — — — — — — — — — — 97,641 18,164 5,000 406,877 3,616 56,919 1,431 235,356 — — — — — — — — — — — — — — — — — — — — — — — — — — — — — — — — 97,641 18,164 5,000 406,877 3,616 56,919 1,431 235,356 11 8,216 U.S.
Government Asset Backed . . .
. . .
. . .
. . .
. . .
. . .
. . .
. . .
. . .
. . .
. . . Mortgage Backed .
. . .
. . .
. . .
. . .
. . .
. . .
. . .
. . .
. . .
. U.S. Government . .
. . .
. . .
. . .
. . .
. . .
. . .
. . .
. . .
. . . Options Purchased .
. . .
. . .
. . .
. . .
. . .
. . .
. . .
. . .
. . . Investment Company .
. . .
. . .
. . .
. . .
. . .
. . .
. . .
. . . — — — 1 13,048 — — — — — 2,118 104,949 22,703 — — — — — — — — — — — — — — — — — 2,118 104,949 22,703 1 13,048 GNMA Mortgage Backed .
. . .
. . .
. . .
. . .
. . .
. . .
. . .
. . .
. . .
. U.S. Government . .
. . .
. . .
. . .
. . .
. . .
. . .
. . .
. . .
. . . Options Purchased .
. . .
. . .
. . .
. . .
. . .
. . .
. . .
. . .
. . . Investment Company .
. . .
. . .
. . .
. . .
. . .
. . .
. . .
. . . — — 6 6,822 — — — — 400,537 14,858 — — — — — — — — — — — — — — 400,537 14,858 6 6,822 110 Payden Mutual Funds .
Investments in Securities Level 1-Quoted Prices Assets (000’s) Liabilities (000’s) Level 2-Other Significant Observable Inputs Assets (000’s) Level 3-Significant Unobservable Inputs Liabilities (000’s) Assets (000’s) Liabilities (000’s) Total (000’s) Core Bond Asset Backed . . . .
. . .
. . .
. . .
. . .
. . .
. . .
. . .
. . .
. . .
. . Corporate Bond. .
. . .
. . .
. . .
. . .
. . .
. . .
. . .
. . .
. . .
. . Foreign Government . .
. . .
. . .
. . .
. . .
. . .
. . .
. . .
. . . Mortgage Backed .
. . .
. . .
. . .
. . .
. . .
. . .
. . .
. . .
. . .
. Municipal . . .
. . .
. . .
. . .
. . .
. . .
. . .
. . .
. . .
. . .
. . .
. . . U.S.
Government . . .
. . .
. . .
. . .
. . .
. . .
. . .
. . .
. . .
. . Investment Company . .
. . .
. . .
. . .
. . .
. . .
. . .
. . .
. . — — — — — — $61,854 — — — — — — — $ 43,927 340,316 18,090 229,337 4,340 92,644 — — — — — — — — — — — — — — — — — — — — — — $ 43,927 340,316 18,090 229,337 4,340 92,644 61,854 Corporate Bond Corporate Bond. .
. . .
. . .
. . .
. . .
. . .
. . .
. . .
. . .
. . .
. . Mortgage Backed . .
. . .
. . .
. . .
. . .
. . .
. . .
. . .
. . .
. . . U.S.
Government . . .
. . .
. . .
. . .
. . .
. . .
. . .
. . .
. . .
. . Investment Company . .
. . .
. . .
. . .
. . .
. . .
. . .
. . .
. . — — — 1,013 — — — — 69,313 408 450 — — — — — — — — — — — — — 69,313 408 450 1,013 Strategic Income Asset Backed . .
. . .
. . .
. . .
. . .
. . .
. . .
. . .
. . .
. . .
. . .
. Bank Loans . . .
. . .
. . .
. . .
. . .
. . .
. . .
. . .
. . .
. . .
. . .
. . Corporate Bond. .
. . .
. . .
. . .
. . .
. . .
. . .
. . .
. . .
. . .
. . Foreign Government . .
. . .
. . .
. . .
. . .
. . .
. . .
. . .
. . . Mortgage Backed .
. . .
. . .
. . .
. . .
. . .
. . .
. . .
. . .
. . .
. Municipal . . .
. . .
. . .
. . .
. . .
. . .
. . .
. . .
. . .
. . .
. . .
. . . Preferred Stock .
. . .
. . .
. . .
. . .
. . .
. . .
. . .
. . .
. . .
. . . Real Estate Investment Trust .
. . .
. . .
. . .
. . .
. . .
. . U.S. Government .
. . .
. . .
. . .
. . .
. . .
. . .
. . .
. . .
. . .
. Investment Company . . .
. . .
. . .
. . .
. . .
. . .
. . .
. . .
. — — — — — — 1,160 1,311 — 5,912 — — — — — — — — — — 12,843 11,661 72,380 7,831 31,219 250 — — 22,509 — — — — — — — — — — — — — — — — — — — — — — — — — — — — — — — 12,843 11,661 72,380 7,831 31,219 250 1,160 1,311 22,509 5,912 Absolute Return Bond Asset Backed . . .
. . .
. . .
. . .
. . .
. . .
. . .
. . .
. . .
. . .
. . . Bank Loans .
. . .
. . .
. . .
. . .
. . .
. . .
. . .
. . .
. . .
. . .
. . .
. Corporate Bond. . .
. . .
. . .
. . .
. . .
. . .
. . .
. . .
. . .
. . .
. Foreign Government . . .
. . .
. . .
. . .
. . .
. . .
. . .
. . .
. . Mortgage Backed . .
. . .
. . .
. . .
. . .
. . .
. . .
. . .
. . .
. . . U.S.
Government . . .
. . .
. . .
. . .
. . .
. . .
. . .
. . .
. . .
. . Options Purchased . .
. . .
. . .
. . .
. . .
. . .
. . .
. . .
. . .
. . Investment Company . .
. . .
. . .
. . .
. . .
. . .
. . .
. . .
. . — — — — — — 14 2,787 — — — — — — — — 6,524 4,505 21,862 195 18,728 6,895 — — — — — — — — — — — — — — — — — — — — — — — — — — 6,524 4,505 21,862 195 18,728 6,895 14 2,787 Annual Report 111 . Notes to Financial Statements continued Investments in Securities Level 1-Quoted Prices Assets (000’s) Liabilities (000’s) Level 2-Other Significant Observable Inputs Assets (000’s) Level 3-Significant Unobservable Inputs Liabilities (000’s) Assets (000’s) Liabilities (000’s) Total (000’s) Floating Rate Asset Backed . . . .
. . .
. . .
. . .
. . .
. . .
. . .
. . .
. . .
. . .
. . Bank Loans . .
. . .
. . .
. . .
. . .
. . .
. . .
. . .
. . .
. . .
. . .
. . . Corporate Bond.
. . .
. . .
. . .
. . .
. . .
. . .
. . .
. . .
. . .
. . . Mortgage Backed .
. . .
. . .
. . .
. . .
. . .
. . .
. . .
. . .
. . .
. Investment Company . . .
. . .
. . .
. . .
. . .
. . .
. . .
. . .
. — — — — $ 9,509 — — — — — $ 9,988 126,885 12,261 1,990 — — — — — — — — — — — — — — — — $ 9,988 126,885 12,261 1,990 9,509 High Income Bank Loans . . .
. . .
. . .
. . .
. . .
. . .
. . .
. . .
. . .
. . .
. . .
. . Corporate Bonds . .
. . .
. . .
. . .
. . .
. . .
. . .
. . .
. . .
. . .
. Mortgage Backed . . .
. . .
. . .
. . .
. . .
. . .
. . .
. . .
. . .
. . Preferred Stock . .
. . .
. . .
. . .
. . .
. . .
. . .
. . .
. . .
. . .
. . Real Estate Investment Trusts . .
. . .
. . .
. . .
. . .
. . . Investment Company .
. . .
. . .
. . .
. . .
. . .
. . .
. . .
. . . — — — 8,281 5,596 56,858 — — — — — — 2,243 533,637 6,363 — — — — — — — — — — — — — — — — — — — — — 2,243 533,637 6,363 8,281 5,596 56,858 California Municipal Income Municipal .
. . .
. . .
. . .
. . .
. . .
. . .
. . .
. . .
. . .
. . .
. . .
. . Investment Company . .
. . .
. . .
. . .
. . .
. . .
. . .
. . .
. . — 1,520 — — 44,761 — — — — — — — 44,761 1,520 Global Low Duration Asset Backed . .
. . .
. . .
. . .
. . .
. . .
. . .
. . .
. . .
. . .
. . .
. Bank Loans . . .
. . .
. . .
. . .
. . .
. . .
. . .
. . .
. . .
. . .
. . .
. . Corporate Bond. .
. . .
. . .
. . .
. . .
. . .
. . .
. . .
. . .
. . .
. . Foreign Government . .
. . .
. . .
. . .
. . .
. . .
. . .
. . .
. . . Mortgage Backed .
. . .
. . .
. . .
. . .
. . .
. . .
. . .
. . .
. . .
. Municipal . . .
. . .
. . .
. . .
. . .
. . .
. . .
. . .
. . .
. . .
. . .
. . . U.S.
Government . . .
. . .
. . .
. . .
. . .
. . .
. . .
. . .
. . .
. . Options Purchased . .
. . .
. . .
. . .
. . .
. . .
. . .
. . .
. . .
. . Investment Company . .
. . .
. . .
. . .
. . .
. . .
. . .
. . .
. . — — — — — — — 5 1,959 — — — — — — — — — 14,413 2,247 67,900 5,361 6,977 252 29,650 — — — — — — — — — — — — — — — — — — — — — — — — — — — — — 14,413 2,247 67,900 5,361 6,977 252 29,650 5 1,959 Global Fixed Income Corporate Bond. .
. . .
. . .
. . .
. . .
. . .
. . .
. . .
. . .
. . .
. . Foreign Government . .
. . .
. . .
. . .
. . .
. . .
. . .
. . .
. . . Mortgage Backed .
. . .
. . .
. . .
. . .
. . .
. . .
. . .
. . .
. . .
. U.S. Government . .
. . .
. . .
. . .
. . .
. . .
. . .
. . .
. . .
. . . Investment Company .
. . .
. . .
. . .
. . .
. . .
. . .
. . .
. . . — — — — 12,113 — — — — — 30,501 30,387 496 7,511 — — — — — — — — — — — — — — — — 30,501 30,387 496 7,511 12,113 112 Payden Mutual Funds .
Investments in Securities Level 1-Quoted Prices Assets (000’s) Liabilities (000’s) Level 2-Other Significant Observable Inputs Assets (000’s) Level 3-Significant Unobservable Inputs Liabilities (000’s) Assets (000’s) Liabilities (000’s) Total (000’s) Emerging Markets Bond Corporate Bond. . . .
. . .
. . .
. . .
. . .
. . .
. . .
. . .
. . .
. . . Foreign Government .
. . .
. . .
. . .
. . .
. . .
. . .
. . .
. . .
. Investment Company . . .
. . .
. . .
. . .
. . .
. . .
. . .
. . .
. — — $ 29,165 — — — $293,147 644,979 — — — — — — — — — — $293,147 644,979 29,165 Emerging Markets Local Bond Corporate Bond. . .
. . .
. . .
. . .
. . .
. . .
. . .
. . .
. . .
. . .
. Foreign Government . . .
. . .
. . .
. . .
. . .
. . .
. . .
. . .
. . Investment Company . .
. . .
. . .
. . .
. . .
. . .
. . .
. . .
. . — — 6,911 — — — 20,570 98,447 — — — — — — — — — — 20,570 98,447 6,911 Emerging Markets Corporate Bond Corporate Bond. .
. . .
. . .
. . .
. . .
. . .
. . .
. . .
. . .
. . .
. . Foreign Government . .
. . .
. . .
. . .
. . .
. . .
. . .
. . .
. . . Investment Company .
. . .
. . .
. . .
. . .
. . .
. . .
. . .
. . . — — 795 — — — 32,279 2,263 — — — — — — — — — — 32,279 2,263 795 Equity Income Common Stock .
. . .
. . .
. . .
. . .
. . .
. . .
. . .
. . .
. . .
. . . Master Limited Partnership .
. . .
. . .
. . .
. . .
. . .
. . . Preferred Stock .
. . .
. . .
. . .
. . .
. . .
. . .
. . .
. . .
. . .
. . . Real Estate Investment Trust .
. . .
. . .
. . .
. . .
. . .
. . Investment Company . .
. . .
. . .
. . .
. . .
. . .
. . .
. . .
. . 472,382 14,639 26,598 45,246 4,212 — — — — — — — — — — — — — — — — — — — — — — — — — 472,382 14,639 26,598 45,246 4,212 Other Financial Instruments 1 Level 1-Quoted Prices Assets (000’s) Liabilities (000’s) Level 2-Other Significant Observable Inputs Assets (000’s) Level 3-Significant Unobservable Inputs Liabilities (000’s) Assets (000’s) Liabilities (000’s) Total (000’s) Limited Maturity Forward currency contracts . .
. . .
. . .
. . .
. . .
. . .
. . . — — $128 $(187) — — $ (59) Low Duration Forward currency contracts .
. . .
. . .
. . .
. . .
. . .
. . .
. Futures. . .
. . .
. . .
. . .
. . .
. . .
. . .
. . .
. . .
. . .
. . .
. . .
. . . Swaps .
. . .
. . .
. . .
. . .
. . .
. . .
. . .
. . .
. . .
. . .
. . .
. . .
. . . — $41 — — — — 173 — — (84) — (146) — — — — — — 89 41 (146) U.S Government Futures.
. . .
. . .
. . .
. . .
. . .
. . .
. . .
. . .
. . .
. . .
. . .
. . .
. . — (40) — — — — (40) GNMA Futures. .
. . .
. . .
. . .
. . .
. . .
. . .
. . .
. . .
. . .
. . .
. . .
. . .
. 21 — — — — — 21 Annual Report 113 . Notes to Financial Statements continued Other Financial Instruments 1 Level 1-Quoted Prices Assets (000’s) Liabilities (000’s) Level 2-Other Significant Observable Inputs Assets (000’s) Level 3-Significant Unobservable Inputs Liabilities (000’s) Assets (000’s) Liabilities (000’s) Total (000’s) Core Bond Forward currency contracts . . . .
. . .
. . .
. . .
. . .
. . .
. Futures. . .
. . .
. . .
. . .
. . .
. . .
. . .
. . .
. . .
. . .
. . .
. . .
. . . — $334 — $ (52) $561 — $ (560) — — — — — Corporate Bond Forward currency contracts .
. . .
. . .
. . .
. . .
. . .
. . .
. Futures. . .
. . .
. . .
. . .
. . .
. . .
. . .
. . .
. . .
. . .
. . .
. . .
. . . — 33 — (29) 25 — (11) — — — — — 14 4 Strategic Income Forward currency contracts .
. . .
. . .
. . .
. . .
. . .
. . .
. Futures. . .
. . .
. . .
. . .
. . .
. . .
. . .
. . .
. . .
. . .
. . .
. . .
. . . — 72 — (10) 136 — (121) — — — — — 15 62 Absolute Return Bond Forward currency contracts .
. . .
. . .
. . .
. . .
. . .
. . .
. Futures. . .
. . .
. . .
. . .
. . .
. . .
. . .
. . .
. . .
. . .
. . .
. . .
. . . — 13 — (24) 51 — (51) — — — — — — (11) High Income Forward currency contracts .
. . .
. . .
. . .
. . .
. . .
. . .
. Futures. . .
. . .
. . .
. . .
. . .
. . .
. . .
. . .
. . .
. . .
. . .
. . .
. . . — — — (179) 347 — (379) — — — — — (32) (179) Global Low Duration Forward currency contracts .
. . .
. . .
. . .
. . .
. . .
. . .
. Futures. . .
. . .
. . .
. . .
. . .
. . .
. . .
. . .
. . .
. . .
. . .
. . .
. . . Swaps .
. . .
. . .
. . .
. . .
. . .
. . .
. . .
. . .
. . .
. . .
. . .
. . .
. . . — 4 — — (40) — 103 — — (50) — (26) — — — — — — 53 (36) (26) Global Fixed Income Forward currency contracts .
. . .
. . .
. . .
. . .
. . .
. . .
. Futures. . .
. . .
. . .
. . .
. . .
. . .
. . .
. . .
. . .
. . .
. . .
. . .
. . . — 88 — (53) 477 — (395) — — — — — 82 35 Emerging Markets Bond Forward currency contracts .
. . .
. . .
. . .
. . .
. . .
. . .
. — — 270 (1,269) — — (999) Emerging Markets Local Bond Forward currency contracts . . .
. . .
. . .
. . .
. . .
. . .
. . — — 6 (203) — — (197) Emerging Markets Corporate Bond Forward currency contracts . .
. . .
. . .
. . .
. . .
. . .
. . . — — 5 (30) — — (25) 1 $ 1 282 Other financial instruments are swaps, futures contracts and forward currency contracts.
Futures contracts and forward currency contracts are valued at the unrealized appreciation/depreciation on the instrument and swaps are valued at market value. 114 Payden Mutual Funds . 5. Federal Tax Information (amounts in 000s) Increase/ (Decrease) Undistributed Net Investment Income Distributions from net investment income and net realized capital gains are determined in accordance with U.S. federal income tax regulations, which may differ from those amounts determined under GAAP. These book/tax differences are either temporary or permanent in nature.
To the extent these differences are permanent, they are charged or credited to undistributed net investment income, accumulated net realized gains or paid-in capital, as appropriate, in the period that the differences arise. Accordingly, the following permanent differences as of October 31, 2015, primarily attributable to foreign currency gains/losses and mortgage backed securities and swaps, were reclassified to the following accounts. These reclassifications had no effect on net assets or net asset value per share (amounts in thousands): Increase/ (Decrease) Undistributed Net Investment Income Cash Reserves Money Market .
. . Limited Maturity . .
. . .
. . .
. . .
. . Low Duration . .
. . .
. . .
. . .
. . .
. . U.S. Government .
. . .
. . .
. . .
. . . GNMA .
. . .
. . .
. . .
. . .
. . .
. . .
. . . Core Bond .
. . .
. . .
. . .
. . .
. . .
. . . Corporate Bond .
. . .
. . .
. . .
. . .
. . Strategic Income . .
. . .
. . .
. . .
. . . Absolute Return Bond .
. . .
. . .
. . Floating Rate. .
. . .
. . .
. . .
. . .
. . . High Income .
. . .
. . .
. . .
. . .
. . .
. Global Low Duration . . .
. . .
. . .
. $ 3 (665) (156) 823 6,022 2,830 (48) 29 117 (1) 75 $(1,287) Increase/ (Decrease) Net Realized Gains Global Fixed Income . . .
. . .
. . .
. Emerging Markets Bond . . .
. . .
. Emerging Markets Local Bond . . Emerging Markets Corporate Bond . .
. . .
. . .
. . .
. . .
. . .
. . .
. . .
. Equity Income. . .
. . .
. . .
. . .
. . .
. Increase/ (Decrease) Paid in Capital $ (3) 665 156 (823) (6,022) (2,830) 48 (29) (117) 1 (75) $ 1,287 — — — — — — — — — — — — Increase/ (Decrease) Net Realized Gains Increase/ (Decrease) Paid in Capital 139 1,670 (7,842) (139) (1,670) 25,430 — — $(17,588) (3) 400 3 (395) — (5) For Federal income tax purposes the following Funds had capital loss carryforwards at year end in the amount indicated below. The carryforwards are available to offset future capital gains, if any. The following Funds used capital loss carryforwards to reduce required capital gain distributions for the year ended October 31, 2015: Cash Reserves Money Market ($1), Limited Maturity ($1,544), Global Low Duration ($1,140) and Global Fixed Income ($384). Under the Regulated Investment Company Modernization Act of 2010, the Funds will be permitted to carry forward capital losses incurred in taxable years beginning after December 22, 2010 (“post-enactment”), for an unlimited period.
However, any losses incurred during those future taxable years will be required to be utilized prior to the losses incurred in preenactment taxable years. Additionally, post-enactment capital losses that are carried forward will retain their character as either short or long term capital losses rather than being considered all short term. At October 31, 2015 the following Funds had available for Federal income tax purposes unused capital losses as follows (000’s): Expires 2016 Limited Maturity . .
. . .
. . .
. . .
. . .
. . .
. . .
. . .
. . .
. . .
. . .
. . .
. . .
. U.S. Government . .
. . .
. . .
. . .
. . .
. . .
. . .
. . .
. . .
. . .
. . .
. . .
. . .
. GNMA. . .
. . .
. . .
. . .
. . .
. . .
. . .
. . .
. . .
. . .
. . .
. . .
. . .
. . .
. . .
. . .
. Strategic Income . . .
. . .
. . .
. . .
. . .
. . .
. . .
. . .
. . .
. . .
. . .
. . .
. . .
. Absolute Return Bond . . .
. . .
. . .
. . .
. . .
. . .
. . .
. . .
. . .
. . .
. . .
. Floating Rate . . .
. . .
. . .
. . .
. . .
. . .
. . .
. . .
. . .
. . .
. . .
. . .
. . .
. . .
. High Income . . .
. . .
. . .
. . .
. . .
. . .
. . .
. . .
. . .
. . .
. . .
. . .
. . .
. . .
. Global Low Duration. . .
. . .
. . .
. . .
. . .
. . .
. . .
. . .
. . .
. . .
. . .
. . . Emerging Markets Bond .
. . .
. . .
. . .
. . .
. . .
. . .
. . .
. . .
. . .
. . .
. Emerging Markets Local Bond . . .
. . .
. . .
. . .
. . .
. . .
. . .
. . .
. . . Emerging Markets Corporate Bond .
. . .
. . .
. . .
. . .
. . .
. . .
. . . Equity Income .
. . .
. . .
. . .
. . .
. . .
. . .
. . .
. . .
. . .
. . .
. . .
. . .
. . .
. . * Post-enactment carryforward losses. $1,248 — — — — — — — — — — — Expires 2017 $2,201 — — — — — — — — — — — Expires 2018 $287 — — — — — — 914 — — — — Expires 2019 $527 — — — — — — — — — — — Unlimited* — $ 3,615 32,377 198 370 1,525 20,856 — 29,161 18,439 565 1,922 Total $ 4,263 3,615 32,377 198 370 1,525 20,856 914 29,161 18,439 565 1,922 Annual Report 115 . Notes to Financial Statements continued The tax character of distributions paid during the fiscal years ended October 31st is as follows (000’s): Cash Reserves Money Market . . . .
. . .
. . .
. . .
. . .
. . .
. . .
. . .
. . .
. . Limited Maturity . .
. . .
. . .
. . .
. . .
. . .
. . .
. . .
. . .
. . .
. . .
. . .
. . .
. Low Duration . . .
. . .
. . .
. . .
. . .
. . .
. . .
. . .
. . .
. . .
. . .
. . .
. . .
. . . U.S.
Government . . .
. . .
. . .
. . .
. . .
. . .
. . .
. . .
. . .
. . .
. . .
. . .
. . . GNMA.
. . .
. . .
. . .
. . .
. . .
. . .
. . .
. . .
. . .
. . .
. . .
. . .
. . .
. . .
. . .
. Core Bond. . .
. . .
. . .
. . .
. . .
. . .
. . .
. . .
. . .
. . .
. . .
. . .
. . .
. . .
. . . Corporate Bond.
. . .
. . .
. . .
. . .
. . .
. . .
. . .
. . .
. . .
. . .
. . .
. . .
. . .
. Strategic Income . . .
. . .
. . .
. . .
. . .
. . .
. . .
. . .
. . .
. . .
. . .
. . .
. . .
. Absolute Return Bond . . .
. . .
. . .
. . .
. . .
. . .
. . .
. . .
. . .
. . .
. . .
. . Floating Rate . .
. . .
. . .
. . .
. . .
. . .
. . .
. . .
. . .
. . .
. . .
. . .
. . .
. . .
. High Income . . .
. . .
. . .
. . .
. . .
. . .
. . .
. . .
. . .
. . .
. . .
. . .
. . .
. . . California Municipal Income.
. . .
. . .
. . .
. . .
. . .
. . .
. . .
. . .
. . .
. . . Global Low Duration .
. . .
. . .
. . .
. . .
. . .
. . .
. . .
. . .
. . .
. . .
. . .
. . Global Fixed Income. .
. . .
. . .
. . .
. . .
. . .
. . .
. . .
. . .
. . .
. . .
. . .
. . Emerging Markets Bond . .
. . .
. . .
. . .
. . .
. . .
. . .
. . .
. . .
. . .
. . .
. . Emerging Markets Local Bond . .
. . .
. . .
. . .
. . .
. . .
. . .
. . .
. . .
. . . Emerging Markets Corporate Bond.
. . .
. . .
. . .
. . .
. . .
. . .
. . .
. . .
. Equity Income . . .
. . .
. . .
. . .
. . .
. . .
. . .
. . .
. . .
. . .
. . .
. . .
. . .
. . 2014 2015 Tax-Exempt Ordinary Long Term Return of Tax-Exempt Ordinary Long Term Return of Income Income Capital Gains Capital Income Income Capital Gains Capital — $ 50 — $ 2 — $ 40 — — — 2,444 — — — 1,596 — $1,266 — 10,925 — — — 9,749 $ 3,365 207 — 1,863 — — — 1,857 — — — 14,006 — — — 10,508 — — — 17,331 $ 4,552 — — 17,673 3,700 — — 2,423 942 — — 3,135 763 — — 772 — — — 2,777 138 143 — — — — — 895 — — — 3954 — — — 6,026 — — — 45,372 24,079 — — 37,945 24,349 — $1,001 — 246 — $974 25 317 — — 1,577 — — — 202 — 1,293 — 925 — 133 — 837 406 — — 38,308 3,086 6,434 — 46,244 — — — — — 11,302 — — — 7,673 — 1,847 — — — 2,430 22 — — 5,312 2,144 — — 17,584 11,862 — At October 31, 2015, net unrealized appreciation (depreciation) on investments for Federal income tax purposes is as follows (000’s): Cost of Investments Federal Income Tax Purposes Cash Reserves Money Market. .
. . .
. . .
. . .
. . .
. . .
. . .
. . .
. . .
. . .
. . .
. . .
. . .
. . .
. . Limited Maturity . .
. . .
. . .
. . .
. . .
. . .
. . .
. . .
. . .
. . .
. . .
. . .
. . .
. . .
. . .
. . .
. . .
. . .
. Low Duration . . .
. . .
. . .
. . .
. . .
. . .
. . .
. . .
. . .
. . .
. . .
. . .
. . .
. . .
. . .
. . .
. . .
. . .
. . . U.S.
Government . . .
. . .
. . .
. . .
. . .
. . .
. . .
. . .
. . .
. . .
. . .
. . .
. . .
. . .
. . .
. . .
. . .
. . . GNMA .
. . .
. . .
. . .
. . .
. . .
. . .
. . .
. . .
. . .
. . .
. . .
. . .
. . .
. . .
. . .
. . .
. . .
. . .
. . .
. . .
. . Core Bond . .
. . .
. . .
. . .
. . .
. . .
. . .
. . .
. . .
. . .
. . .
. . .
. . .
. . .
. . .
. . .
. . .
. . .
. . .
. . .
. Corporate Bond . . .
. . .
. . .
. . .
. . .
. . .
. . .
. . .
. . .
. . .
. . .
. . .
. . .
. . .
. . .
. . .
. . .
. . .
. Strategic Income . . .
. . .
. . .
. . .
. . .
. . .
. . .
. . .
. . .
. . .
. . .
. . .
. . .
. . .
. . .
. . .
. . .
. . . Absolute Return Bond .
. . .
. . .
. . .
. . .
. . .
. . .
. . .
. . .
. . .
. . .
. . .
. . .
. . .
. . .
. . .
. . . Floating Rate.
. . .
. . .
. . .
. . .
. . .
. . .
. . .
. . .
. . .
. . .
. . .
. . .
. . .
. . .
. . .
. . .
. . .
. . .
. . . High Income .
. . .
. . .
. . .
. . .
. . .
. . .
. . .
. . .
. . .
. . .
. . .
. . .
. . .
. . .
. . .
. . .
. . .
. . .
. . . California Municipal Income .
. . .
. . .
. . .
. . .
. . .
. . .
. . .
. . .
. . .
. . .
. . .
. . .
. . .
. . . Global Low Duration .
. . .
. . .
. . .
. . .
. . .
. . .
. . .
. . .
. . .
. . .
. . .
. . .
. . .
. . .
. . .
. . .
. Global Fixed Income. . .
. . .
. . .
. . .
. . .
. . .
. . .
. . .
. . .
. . .
. . .
. . .
. . .
. . .
. . .
. . .
. . . Emerging Markets Bond .
. . .
. . .
. . .
. . .
. . .
. . .
. . .
. . .
. . .
. . .
. . .
. . .
. . .
. . .
. . .
. Emerging Markets Local Bond . . .
. . .
. . .
. . .
. . .
. . .
. . .
. . .
. . .
. . .
. . .
. . .
. . .
. . Emerging Markets Corporate Bond . .
. . .
. . .
. . .
. . .
. . .
. . .
. . .
. . .
. . .
. . .
. . .
. . Equity Income . .
. . .
. . .
. . .
. . .
. . .
. . .
. . .
. . .
. . .
. . .
. . .
. . .
. . .
. . .
. . .
. . .
. . .
. . . 116 Payden Mutual Funds $ 392,409 427,401 839,194 142,321 413,123 789,220 70,542 167,752 61,616 161,854 615,112 44,636 130,315 82,962 1,007,624 153,052 36,046 518,800 Gross Unrealized Appreciation on Investments $ — 432 2,332 735 10,021 9,306 1,283 1,065 245 327 14,955 1,690 347 1,372 15,023 1,496 441 56,741 Gross Unrealized Depreciation on Investments Net Unrealized Appreciation (Depreciation) on Investments — $ (3,993) (8,295) (237) (921) (8,018) (641) (1,741) (351) (1,548) (17,089) (45) (1,898) (3,326) (55,356) (28,620) (1,150) (12,464) — $ (3,561) (5,963) 498 9,100 1,288 642 (676) (106) (1,221) (2,134) 1,645 (1,551) (1,954) (40,333) (27,124) (709) 44,277 .
At October 31, 2015, the components of accumulated earnings (deficit) for Federal income tax purposes are as follows (000’s): Undistributed Realized Long Term Capital Gains Undistributed Ordinary Income Cash Reserves Money Market. . . .
. . .
. Limited Maturity . . .
. . .
. . .
. . .
. . .
. . .
. Low Duration . . .
. . .
. . .
. . .
. . .
. . .
. . .
. U.S. Government . .
. . .
. . .
. . .
. . .
. . .
. . GNMA . .
. . .
. . .
. . .
. . .
. . .
. . .
. . .
. . .
. . Core Bond. .
. . .
. . .
. . .
. . .
. . .
. . .
. . .
. . . Corporate Bond.
. . .
. . .
. . .
. . .
. . .
. . .
. . Strategic Income. .
. . .
. . .
. . .
. . .
. . .
. . . Absolute Return Bond .
. . .
. . .
. . .
. . .
. Floating Rate. . .
. . .
. . .
. . .
. . .
. . .
. . .
. . High Income . .
. . .
. . .
. . .
. . .
. . .
. . .
. . . California Municipal Income .
. . .
. . .
. Global Low Duration . . .
. . .
. . .
. . .
. . . Global Fixed Income.
. . .
. . .
. . .
. . .
. . . Emerging Markets Bond .
. . .
. . .
. . .
. . Emerging Markets Local Bond . .
. . .
. Emerging Markets Corporate Bond . . Equity Income. .
. . .
. . .
. . .
. . .
. . .
. . .
. . $ 4 — — 2 128 934 355 — 88 96 172 17 — — 2,370 — 18 1,352 — — — — — $370 509 — — — — 548 — 927 — — — — 6. Exempt Interest Income Designation (unaudited) Exempt Interest Dividends ($000s) California Municipal Income .
. . .
. . .
. . .
. . .
. . .
. . Exempt Interest Dividends Per Share 974 Capital Loss Carryforwards — $ (4,263) — (3,615) (32,377) — — (198) (370) (1,525) (20,856) — (914) — (29,161) (18,439) (565) (1,922) Distributions Payable $ (2) (9) (99) (6) (64) — — — — — — (21) — — — — — — Net Unrealized Appreciation (Depreciation) — $ (3,561) (5,984) 498 9,100 1,238 642 (687) (100) (1,221) (2,155) 1,645 (1,555) (1,959) (40,648) (27,273) (717) 44,277 Total Distributions Earnings (Deficit) $ 2 (7,833) (6,083) (3,121) (23,213) 2,542 1,506 (885) (382) (2,650) (22,839) 2,189 (2,469) (1,032) (67,439) (45,712) (1,264) 43,707 7. Subsequent Events The Funds have evaluated subsequent events through the issuance of the financial statements and have determined that no other events have occurred that require disclosure. 0.23 Annual Report 117 .
Financial Highlights For the share outstanding for the periods ended October 31st 2015 Net asset value — beginning of period . . . .
. . .
. . .
. . .
. . .
. . .
. . .
. . .
$ 1.00 Income from investment activities: Net investment income . . .
. . .
. . .
. . .
. . .
. . .
. . .
. . .
. . .
. . .
. . .
. . 0.00(1) Net realized and unrealized gains (losses) . .
. . .
. . .
. . .
. . .
. . .
. . .
. . 0.00(1) Total from investment activities . .
. . .
. . .
. . .
. . .
. . .
. . .
. . .
. . .
. 0.00 Distributions to shareholders: From net investment income . . .
. . .
. . .
. . .
. . .
. . .
. . .
. . .
. . .
. . .
. 0.00(1) Return of capital. . .
. . .
. . .
. . .
. . .
. . .
. . .
. . .
. . .
. . .
. . .
. . .
. . .
. . — Total distributions to shareholders . .
. . .
. . .
. . .
. . .
. . .
. . .
. . .
. . 0.00 Net asset value — end of period . .
. . .
. . .
. . .
. . .
. . .
. . .
. . .
. . .
. . .
. $ 1.00 Total return . .
. . .
. . .
. . .
. . .
. . .
. . .
. . .
. . .
. . .
. . .
. . .
. . .
. . .
. Payden Cash Reserves Money Market Fund 2014 2013 2012 $ 1.00 $ 1.00 $ 1.00 $ 2011 1.00 0.00(1) 0.00(1) 0.00 $ 0.00(1) 0.00(1) 0.00 0.00(1) 0.00(1) 0.00 0.00(1) 0.00(1) 0.00 0.00(1) 0.00(1) 0.00 1.00 0.00(1) 0.00(1) 0.00 1.00 (0.00)(1) — 0.00 1.00 (0.00)(1) — 0.00 1.00 $ $ $ 0.01% 0.01% 0.02% 0.02% 0.03% Ratios/supplemental data: Net assets, end of period (000s) . . .
. . .
. . .
. . .
. . .
. . .
. . .
. . .
. . .
. . $ 392,391 Ratio of gross expense to average net assets.
. . .
. . .
. . .
. . .
. . .
. . .
. . 0.39% Ratio of net expense to average net assets . .
. . .
. . .
. . .
. . .
. . .
. . .
. . 0.09% Ratio of investment income less gross expenses to average net assets . . (0.29)% Ratio of net investment income to average net assets .
. . .
. . .
. . .
. . . 0.01% Portfolio turnover rate .
. . .
. . .
. . .
. . .
. . .
. . .
. . .
. . .
. . .
. . .
. . .
. . n/a $ 490,666 0.37% 0.08% (0.28)% 0.01% n/a $ 498,417 0.37% 0.10% (0.26)% 0.01% n/a $ 525,480 0.38% 0.15% (0.21)% 0.02% n/a $ 746,719 0.37% 0.14% (0.20)% 0.02% n/a The Fund commenced operations on December 17, 1997. 2015 Net asset value — beginning of period . .
. . .
. . .
. . .
. . .
. . .
. . .
. . .
. . $ 9.47 Income (loss) from investment activities: Net investment income .
. . .
. . .
. . .
. . .
. . .
. . .
. . .
. . .
. . .
. . .
. . .
. 0.06 Net realized and unrealized gains (losses) . . .
. . .
. . .
. . .
. . .
. . .
. . .
. (0.04) Total from investment activities . . .
. . .
. . .
. . .
. . .
. . .
. . .
. . .
. . . 0.02 Distributions to shareholders: From net investment income .
. . .
. . .
. . .
. . .
. . .
. . .
. . .
. . .
. . .
. . . (0.04) Return of capital.
. . .
. . .
. . .
. . .
. . .
. . .
. . .
. . .
. . .
. . .
. . .
. . .
. . .
. (0.03) Total distributions to shareholders . . .
. . .
. . .
. . .
. . .
. . .
. . .
. . .
. (0.07) Net asset value — end of period . . .
. . .
. . .
. . .
. . .
. . .
. . .
. . .
. . .
. . .
$ 9.42 Total return . . .
. . .
. . .
. . .
. . .
. . .
. . .
. . .
. . .
. . .
. . .
. . .
. . .
. . . Payden Limited Maturity Fund 2014 2013 2012 $ 9.47 $ 9.48 $ 9.39 $ 2011 9.45 0.07 (0.00)(1) 0.07 $ 0.05 (0.00)(1) 0.05 0.06 0.10 0.16 0.08 (0.05) 0.03 (0.07) — (0.07) 9.47 (0.04) (0.02) (0.06) 9.47 (0.07) — (0.07) 9.48 (0.09) — (0.09) 9.39 $ $ $ 0.20% 0.78% 0.56% 1.66% 0.27% Ratios/supplemental data: Net assets, end of period (000s) .
. . .
. . .
. . .
. . .
. . .
. . .
. . .
. . .
. . .
. $ 422,996 Ratio of gross expense to average net assets. .
. . .
. . .
. . .
. . .
. . .
. . .
. 0.57% Ratio of net expense to average net assets . . .
. . .
. . .
. . .
. . .
. . .
. . .
. 0.31% Ratio of investment income less gross expenses to average net assets . . 0.31% Ratio of net investment income to average net assets . .
. . .
. . .
. . .
. . 0.57% Portfolio turnover rate . .
. . .
. . .
. . .
. . .
. . .
. . .
. . .
. . .
. . .
. . .
. . .
. 39% $ 318,671 0.57% 0.35% 0.59% 0.81% 59% $ 258,282 0.55% 0.40% 0.44% 0.59% 124% $ 242,013 0.56% 0.50% 0.56% 0.62% 98% $ 216,493 0.57% 0.50% 0.72% 0.79% 75% The Fund commenced operations on April 29, 1994. (1) Amount is less than $0.005 See notes to financial statements. 118 Payden Mutual Funds . 2015 Net asset value — beginning of period . . . .
. . .
. . .
. . .
. . .
. . .
. . .
. . .
$ 10.15 Income (loss) from investment activities: Net investment income . . .
. . .
. . .
. . .
. . .
. . .
. . .
. . .
. . .
. . .
. . .
. . 0.11 Net realized and unrealized gains (losses) . .
. . .
. . .
. . .
. . .
. . .
. . .
. . (0.06) Total from investment activities . .
. . .
. . .
. . .
. . .
. . .
. . .
. . .
. . .
. 0.05 Distributions to shareholders: From net investment income . . .
. . .
. . .
. . .
. . .
. . .
. . .
. . .
. . .
. . .
. (0.11) From net realized gains. . .
. . .
. . .
. . .
. . .
. . .
. . .
. . .
. . .
. . .
. . .
. . . (0.04) Return of capital.
. . .
. . .
. . .
. . .
. . .
. . .
. . .
. . .
. . .
. . .
. . .
. . .
. . .
. (0.00)(1) Total distributions to shareholders . . .
. . .
. . .
. . .
. . .
. . .
. . .
. . .
. (0.15) Net asset value — end of period . . .
. . .
. . .
. . .
. . .
. . .
. . .
. . .
. . .
. . .
$ 10.05 Total return . . .
. . .
. . .
. . .
. . .
. . .
. . .
. . .
. . .
. . .
. . .
. . .
. . .
. . . Payden Low Duration Fund 2014 2013 2012 $ 10.15 $ 10.23 $ 10.01 $ 2011 10.23 0.12 (0.00)(1) 0.12 0.18 0.23 0.41 0.24 (0.20) 0.04 (0.12) $ 0.14 (0.07) 0.07 (0.13) — (0.02) (0.15) 10.15 (0.19) — — (0.19) 10.23 (0.24) (0.02) — (0.26) 10.01 — (0.12) 10.15 $ $ $ 0.50% 1.14% 0.68% 4.13% 0.46% Ratios/supplemental data: Net assets, end of period (000s) .
. . .
. . .
. . .
. . .
. . .
. . .
. . .
. . .
. . .
. $ 820,662 Ratio of gross expense to average net assets. .
. . .
. . .
. . .
. . .
. . .
. . .
. 0.57% Ratio of net expense to average net assets . . .
. . .
. . .
. . .
. . .
. . .
. . .
. 0.47% Ratio of investment income less gross expenses to average net assets . . 1.02% Ratio of net investment income to average net assets . .
. . .
. . .
. . .
. . 1.12% Portfolio turnover rate . .
. . .
. . .
. . .
. . .
. . .
. . .
. . .
. . .
. . .
. . .
. . .
. 31% $ 833,205 0.55% 0.48% 1.06% 1.13% 45% $ 848,866 0.55% 0.51% 1.22% 1.26% 90% $ 541,809 0.55% 0.54% 1.74% 1.75% 97% $ 462,491 0.56% 0.53% 2.34% 2.37% 74% The Fund commenced operations on December 31, 1993. 2015 Net asset value — beginning of period . . .
. . .
. . .
. . .
. . .
. . .
. . .
. . .
. $ 10.68 Income (loss) from investment activities: Net investment income . .
. . .
. . .
. . .
. . .
. . .
. . .
. . .
. . .
. . .
. . .
. . . 0.06(2) Net realized and unrealized gains (losses) .
. . .
. . .
. . .
. . .
. . .
. . .
. . . 0.02 Total from investment activities .
. . .
. . .
. . .
. . .
. . .
. . .
. . .
. . .
. . 0.08 Distributions to shareholders: From net investment income . .
. . .
. . .
. . .
. . .
. . .
. . .
. . .
. . .
. . .
. . (0.13) From net realized gains. .
. . .
. . .
. . .
. . .
. . .
. . .
. . .
. . .
. . .
. . .
. . .
. — Return of capital. . .
. . .
. . .
. . .
. . .
. . .
. . .
. . .
. . .
. . .
. . .
. . .
. . .
. . — Total distributions to shareholders . .
. . .
. . .
. . .
. . .
. . .
. . .
. . .
. . (0.13) Net asset value — end of period . .
. . .
. . .
. . .
. . .
. . .
. . .
. . .
. . .
. . .
. $ 10.63 Total return . .
. . .
. . .
. . .
. . .
. . .
. . .
. . .
. . .
. . .
. . .
. . .
. . .
. . .
. Ratios/supplemental data: Net assets, end of period (000s) . . .
. . .
. . .
. . .
. . .
. . .
. . .
. . .
. . .
. . $ Ratio of gross expense to average net assets.
. . .
. . .
. . .
. . .
. . .
. . .
. . Ratio of net expense to average net assets . .
. . .
. . .
. . .
. . .
. . .
. . .
. . Ratio of investment income less gross expenses to average net assets . . Ratio of net investment income to average net assets .
. . .
. . .
. . .
. . . Portfolio turnover rate .
. . .
. . .
. . .
. . .
. . .
. . .
. . .
. . .
. . .
. . .
. . .
. . Payden U.S. Government Fund - Adviser Class 2014 2013 2012 $ 10.67 $ 10.99 $ 11.12 0.05(2) 0.08 0.13 $ 0.76% 1,676 0.84% 0.70% 0.44% 0.59% 32% (0.12) — — (0.12) 10.68 0.07 (0.18) (0.11) $ 1.27% $ 385 0.84% 0.70% 0.35% 0.49% 27% (0.16) (0.05) (0.00)(1) (0.21) 10.67 1,205 0.84% 0.70% 0.42% 0.56% 43% 2011 11.30 0.08 0.16 0.24 $ (1.01)% $ $ 0.13 (0.06) 0.07 (0.16) (0.21) — (0.37) 10.99 (0.15) (0.10) — (0.25) 11.12 $ 2.16% $ 860 0.90% 0.86% 0.66% 0.70% 79% 0.65% $ 707 0.89% 0.85% 1.10% 1.14% 76% The Class commenced operations on November 2, 2009. (1) Amount is less than $0.005 (2) Based on average shares outstanding. See notes to financial statements. Annual Report 119 .
Financial Highlights continued For the share outstanding for the periods ended October 31st 2015 Net asset value — beginning of period . . . .
. . .
. . .
. . .
. . .
. . .
. . .
. . .
$ 10.68 Income (loss) from investment activities: Net investment income . . .
. . .
. . .
. . .
. . .
. . .
. . .
. . .
. . .
. . .
. . .
. . 0.09(1) Net realized and unrealized gains (losses) . .
. . .
. . .
. . .
. . .
. . .
. . .
. . 0.02 Total from investment activities . .
. . .
. . .
. . .
. . .
. . .
. . .
. . .
. . .
. 0.11 Distributions to shareholders: From net investment income . . .
. . .
. . .
. . .
. . .
. . .
. . .
. . .
. . .
. . .
. (0.16) From net realized gains. . .
. . .
. . .
. . .
. . .
. . .
. . .
. . .
. . .
. . .
. . .
. . . — Return of capital.
. . .
. . .
. . .
. . .
. . .
. . .
. . .
. . .
. . .
. . .
. . .
. . .
. . .
. — Total distributions to shareholders . . .
. . .
. . .
. . .
. . .
. . .
. . .
. . .
. (0.16) Net asset value — end of period . . .
. . .
. . .
. . .
. . .
. . .
. . .
. . .
. . .
. . .
$ 10.63 Total return . . .
. . .
. . .
. . .
. . .
. . .
. . .
. . .
. . .
. . .
. . .
. . .
. . .
. . . Payden U.S.
Government Fund - Investor Class 2014 2013 2012 $ 10.67 $ 10.98 $ 11.12 0.08(1) 0.08 0.16 $ (0.15) — — (0.15) 10.68 0.08 (0.15) (0.07) $ (0.19) (0.05) (0.00)(2) (0.24) 10.67 $ 2011 11.29 0.12 0.13 0.25 $ 0.15 (0.04) 0.11 (0.18) (0.21) — (0.39) 10.98 (0.18) (0.10) — (0.28) 11.12 1.01% 1.52% (0.67)% Ratios/supplemental data: Net assets, end of period (000s) . . .
. . .
. . .
. . .
. . .
. . .
. . .
. . .
. . .
. . $ 133,420 Ratio of gross expense to average net assets.
. . .
. . .
. . .
. . .
. . .
. . .
. . 0.59% Ratio of net expense to average net assets . .
. . .
. . .
. . .
. . .
. . .
. . .
. . 0.45% Ratio of investment income less gross expenses to average net assets . . 0.69% Ratio of net investment income to average net assets .
. . .
. . .
. . .
. . . 0.82% Portfolio turnover rate .
. . .
. . .
. . .
. . .
. . .
. . .
. . .
. . .
. . .
. . .
. . .
. . 32% $ 130,508 0.59% 0.45% 0.60% 0.74% 27% $ 130,624 0.58% 0.45% 0.66% 0.79% 43% $ 110,026 0.64% 0.61% 0.90% 0.93% 79% $ 2.32% (0.99)% $ 63,988 0.63% 0.60% 1.41% 1.44% 76% The Fund commenced operations on January 3, 1995. 2015 Net asset value — beginning of period . .
. . .
. . .
. . .
. . .
. . .
. . .
. . .
. . $ 9.94 Income (loss) from investment activities: Net investment income .
. . .
. . .
. . .
. . .
. . .
. . .
. . .
. . .
. . .
. . .
. . .
. 0.13 Net realized and unrealized gains (losses) . . .
. . .
. . .
. . .
. . .
. . .
. . .
. 0.05 Total from investment activities . . .
. . .
. . .
. . .
. . .
. . .
. . .
. . .
. . . 0.18 Distributions to shareholders: From net investment income .
. . .
. . .
. . .
. . .
. . .
. . .
. . .
. . .
. . .
. . . (0.34) From net realized gains.
. . .
. . .
. . .
. . .
. . .
. . .
. . .
. . .
. . .
. . .
. . .
. . — Total distributions to shareholders . .
. . .
. . .
. . .
. . .
. . .
. . .
. . .
. . (0.34) Net asset value — end of period . .
. . .
. . .
. . .
. . .
. . .
. . .
. . .
. . .
. . .
. $ 9.78 Total return . .
. . .
. . .
. . .
. . .
. . .
. . .
. . .
. . .
. . .
. . .
. . .
. . .
. . .
. Ratios/supplemental data: Net assets, end of period (000s) . . .
. . .
. . .
. . .
. . .
. . .
. . .
. . .
. . .
. . $ Ratio of gross expense to average net assets.
. . .
. . .
. . .
. . .
. . .
. . .
. . Ratio of net expense to average net assets . .
. . .
. . .
. . .
. . .
. . .
. . .
. . Ratio of investment income less gross expenses to average net assets . . Ratio of net investment income to average net assets .
. . .
. . .
. . .
. . . Portfolio turnover rate .
. . .
. . .
. . .
. . .
. . .
. . .
. . .
. . .
. . .
. . .
. . .
. . Payden GNMA Fund - Adviser Class 2014 2013 2012 $ 10.00 $ 10.80 $ 10.66 $ 0.03 (0.25) (0.22) 0.14 0.33 0.47 0.27 0.30 0.57 (0.39) — (0.39) 9.94 (0.34) (0.24) (0.58) 10.00 (0.33) — (0.33) 10.80 (0.42) (0.05) (0.47) 10.66 $ 3.43% $ 23,876 0.85% 0.75% 1.33% 1.44% 12% The Class commenced operations on November 2, 2009. (1) Based on average shares outstanding. (2) Amount is less than $0.005 See notes to financial statements. 120 Payden Mutual Funds 2011 10.56 0.11 0.22 0.33 1.80% 23,335 0.92% 0.75% 1.11% 1.29% 15% $ $ (1.96)% $ 30,450 0.93% 0.75% 1.13% 1.31% 19% $ 4.41% $ 81,860 0.88% 0.75% 1.24% 1.37% 27% 5.73% $ 52,700 0.86% 0.75% 1.92% 2.03% 23% . 2015 Net asset value — beginning of period . . . .
. . .
. . .
. . .
. . .
. . .
. . .
. . .
$ 9.95 Income (loss) from investment activities: Net investment income . . .
. . .
. . .
. . .
. . .
. . .
. . .
. . .
. . .
. . .
. . .
. . 0.14 Net realized and unrealized gains (losses) . .
. . .
. . .
. . .
. . .
. . .
. . .
. . 0.06 Total from investment activities . .
. . .
. . .
. . .
. . .
. . .
. . .
. . .
. . .
. 0.20 Distributions to shareholders: From net investment income . . .
. . .
. . .
. . .
. . .
. . .
. . .
. . .
. . .
. . .
. (0.36) From net realized gains. . .
. . .
. . .
. . .
. . .
. . .
. . .
. . .
. . .
. . .
. . .
. . . — Total distributions to shareholders .
. . .
. . .
. . .
. . .
. . .
. . .
. . .
. . . (0.36) Net asset value — end of period .
. . .
. . .
. . .
. . .
. . .
. . .
. . .
. . .
. . .
. . $ 9.79 Total return .
. . .
. . .
. . .
. . .
. . .
. . .
. . .
. . .
. . .
. . .
. . .
. . .
. . .
. . Payden GNMA Fund - Investor Class 2014 2013 2012 $ 10.00 $ 10.80 $ 10.67 $ 2011 10.56 0.15 0.22 0.37 $ 0.05 (0.24) (0.19) 0.17 0.32 0.49 0.26 0.35 0.61 (0.42) — (0.42) 9.95 (0.37) (0.24) (0.61) 10.00 (0.36) — (0.36) 10.80 (0.45) (0.05) (0.50) 10.67 $ $ $ 2.06% 3.79% (1.80)% 4.77% 5.99% Ratios/supplemental data: Net assets, end of period (000s) . .
. . .
. . .
. . .
. . .
. . .
. . .
. . .
. . .
. . .
$ 255,273 Ratio of gross expense to average net assets. . .
. . .
. . .
. . .
. . .
. . .
. . . 0.67% Ratio of net expense to average net assets .
. . .
. . .
. . .
. . .
. . .
. . .
. . . 0.50% Ratio of investment income less gross expenses to average net assets .
. 1.36% Ratio of net investment income to average net assets . . .
. . .
. . .
. . .
. 1.53% Portfolio turnover rate . . .
. . .
. . .
. . .
. . .
. . .
. . .
. . .
. . .
. . .
. . .
. . . 15% $ 281,473 0.61% 0.50% 1.58% 1.68% 12% $ 371,593 0.68% 0.50% 1.38% 1.56% 19% $ 886,109 0.63% 0.50% 1.50% 1.63% 27% $ 776,547 0.62% 0.50% 2.17% 2.29% 23% The Fund commenced operations on August 27, 1999. 2015 Net asset value — beginning of period .
. . .
. . .
. . .
. . .
. . .
. . .
. . .
. . .
$ 10.80 Income (loss) from investment activities: Net investment income . . .
. . .
. . .
. . .
. . .
. . .
. . .
. . .
. . .
. . .
. . .
. . 0.23(1) Net realized and unrealized gains (losses) . .
. . .
. . .
. . .
. . .
. . .
. . .
. . (0.07) Total from investment activities . .
. . .
. . .
. . .
. . .
. . .
. . .
. . .
. . .
. 0.16 Distributions to shareholders: From net investment income . . .
. . .
. . .
. . .
. . .
. . .
. . .
. . .
. . .
. . .
. (0.26) From net realized gains. . .
. . .
. . .
. . .
. . .
. . .
. . .
. . .
. . .
. . .
. . .
. . . (0.08) Total distributions to shareholders .
. . .
. . .
. . .
. . .
. . .
. . .
. . .
. . . (0.34) Net asset value — end of period .
. . .
. . .
. . .
. . .
. . .
. . .
. . .
. . .
. . .
. . $ 10.62 Total return .
. . .
. . .
. . .
. . .
. . .
. . .
. . .
. . .
. . .
. . .
. . .
. . .
. . .
. . Ratios/supplemental data: Net assets, end of period (000s) . .
. . .
. . .
. . .
. . .
. . .
. . .
. . .
. . .
. . .
$ Ratio of gross expense to average net assets. . .
. . .
. . .
. . .
. . .
. . .
. . . Ratio of net expense to average net assets .
. . .
. . .
. . .
. . .
. . .
. . .
. . . Ratio of investment income less gross expenses to average net assets .
. Ratio of net investment income to average net assets . . .
. . .
. . .
. . .
. Portfolio turnover rate . . .
. . .
. . .
. . .
. . .
. . .
. . .
. . .
. . .
. . .
. . .
. . . Payden Core Bond Fund - Adviser Class 2014 2013 2012 $ 10.65 $ 11.04 $ 10.52 0.26(1) 0.27 0.53 $ 1.49% 24,314 0.79% 0.79% 2.05% 2.05% 31% (0.29) (0.09) (0.38) 10.80 0.26(1) (0.31) (0.05) $ 5.06% $ 5,457 0.78% 0.78% 2.40% 2.40% 49% (0.33) (0.01) (0.34) 10.65 $ 0.91 — 0.91 $ 0.36 (0.13) 0.23 (0.39) — (0.39) 11.04 (0.37) — (0.37) 10.52 $ (0.54)% $ 2011 10.66 8.81% 321 $ 0.78% 0.78% 2.41% 2.41% 511%(2) 356 $ 0.77% 0.77% 3.00% 3.00% 464%(3) 2.30% 39,848 0.78% 0.78% 3.43% 3.43% 118% The Class commenced operations on November 2, 2009. (1) Based on average shares outstanding. (2) Includes U.S.
Treasury securities purchased and sold prior to their settlement date; excluding these transactions, portfolio turnover would have been 101%. (3) Includes U.S. Treasury securities purchased and sold prior to their settlement date; excluding these transactions, portfolio turnover would have been 105%. See notes to financial statements. Annual Report 121 . Financial Highlights continued For the share outstanding for the periods ended October 31st 2015 Net asset value — beginning of period . . . .
. . .
. . .
. . .
. . .
. . .
. . .
. . .
$ 10.82 Income (loss) from investment activities: Net investment income . . .
. . .
. . .
. . .
. . .
. . .
. . .
. . .
. . .
. . .
. . .
. . 0.25(1) Net realized and unrealized gains (losses) . .
. . .
. . .
. . .
. . .
. . .
. . .
. . (0.07) Total from investment activities . .
. . .
. . .
. . .
. . .
. . .
. . .
. . .
. . .
. 0.18 Distributions to shareholders: From net investment income . . .
. . .
. . .
. . .
. . .
. . .
. . .
. . .
. . .
. . .
. (0.28) From net realized gains. . .
. . .
. . .
. . .
. . .
. . .
. . .
. . .
. . .
. . .
. . .
. . . (0.08) Total distributions to shareholders .
. . .
. . .
. . .
. . .
. . .
. . .
. . .
. . . (0.36) Net asset value — end of period .
. . .
. . .
. . .
. . .
. . .
. . .
. . .
. . .
. . .
. . $ 10.64 Total return .
. . .
. . .
. . .
. . .
. . .
. . .
. . .
. . .
. . .
. . .
. . .
. . .
. . .
. . Payden Core Bond Fund - Investor Class 2014 2013 2012 $ 10.67 $ 11.06 $ 10.54 0.28(1) 0.28 0.56 $ (0.32) (0.09) (0.41) 10.82 1.73% $ 593,724 0.53% 0.53% 2.65% 2.65% 49% $ 5.34% Ratios/supplemental data: Net assets, end of period (000s) . .
. . .
. . .
. . .
. . .
. . .
. . .
. . .
. . .
. . .
$ 660,835 Ratio of gross expense to average net assets. . .
. . .
. . .
. . .
. . .
. . .
. . . 0.54% Ratio of net expense to average net assets .
. . .
. . .
. . .
. . .
. . .
. . .
. . . 0.54% Ratio of investment income less gross expenses to average net assets .
. 2.30% Ratio of net investment income to average net assets . . .
. . .
. . .
. . .
. 2.30% Portfolio turnover rate . . .
. . .
. . .
. . .
. . .
. . .
. . .
. . .
. . .
. . .
. . .
. . . 31% 0.29(1) (0.32) (0.03) (0.35) (0.01) (0.36) 10.67 $ 2011 10.68 0.33 0.60 0.93 $ (0.28)% 0.38 (0.13) 0.25 (0.41) — (0.41) 11.06 (0.39) — (0.39) 10.54 $ 9.06% 2.45% $ 587,658 $ 645,700 $ 580,774 0.52% 0.53% 0.53% 0.52% 0.53% 0.53% 2.66% 3.13% 3.64% 2.66% 3.13% 3.64% 511%(2) 464%(3) 118% The Fund commenced operations on December 31, 1993. 2015 Net asset value — beginning of period .
. . .
. . .
. . .
. . .
. . .
. . .
. . .
. . .
$ 11.37 Income (loss) from investment activities: Net investment income . . .
. . .
. . .
. . .
. . .
. . .
. . .
. . .
. . .
. . .
. . .
. . 0.35 Net realized and unrealized gains (losses) . .
. . .
. . .
. . .
. . .
. . .
. . .
. . (0.11) Total from investment activities . .
. . .
. . .
. . .
. . .
. . .
. . .
. . .
. . .
. 0.24 Distributions to shareholders: From net investment income . . .
. . .
. . .
. . .
. . .
. . .
. . .
. . .
. . .
. . .
. (0.34) From net realized gains. . .
. . .
. . .
. . .
. . .
. . .
. . .
. . .
. . .
. . .
. . .
. . . (0.30) Total distributions to shareholders .
. . .
. . .
. . .
. . .
. . .
. . .
. . .
. . . (0.64) Net asset value — end of period .
. . .
. . .
. . .
. . .
. . .
. . .
. . .
. . .
. . .
. . $ 10.97 Total return .
. . .
. . .
. . .
. . .
. . .
. . .
. . .
. . .
. . .
. . .
. . .
. . .
. . .
. . Ratios/supplemental data: Net assets, end of period (000s) . .
. . .
. . .
. . .
. . .
. . .
. . .
. . .
. . .
. . .
$ Ratio of gross expense to average net assets. . .
. . .
. . .
. . .
. . .
. . .
. . . Ratio of net expense to average net assets .
. . .
. . .
. . .
. . .
. . .
. . .
. . . Ratio of investment income less gross expenses to average net assets .
. Ratio of net investment income to average net assets . . .
. . .
. . .
. . .
. Portfolio turnover rate . . .
. . .
. . .
. . .
. . .
. . .
. . .
. . .
. . .
. . .
. . .
. . . Payden Corporate Bond Fund 2014 2013 2012 $ 11.05 $ 11.60 $ 11.33 2011 11.85 0.39 0.50 0.89 $ 2.26% 71,542 0.78% 0.65% 3.08% 3.21% 112% $ 0.38 (0.36) 0.02 0.45 0.75 1.20 0.51 (0.12) 0.39 (0.41) (0.16) (0.57) 11.37 (0.37) (0.20) (0.57) 11.05 (0.45) (0.48) (0.93) 11.60 (0.51) (0.40) (0.91) 11.33 $ 8.31% $ 69,646 0.79% 0.65% 3.42% 3.56% 104% $ 0.17% $ 66,279 $ 0.82% 0.65% 3.29% 3.46% 273%(4) $ 11.39% 43,259 $ 0.91% 0.65% 3.77% 4.03% 487%(5) 3.71% 38,559 0.96% 0.65% 4.21% 4.52% 87% The Fund commenced operations on March 12, 2009. (1) (2) (3) (4) (5) Based on average shares outstanding. Includes U.S.
Treasury securities purchased and sold prior to their settlement date; excluding these transactions, portfolio turnover would have been 101%. Includes U.S. Treasury securities purchased and sold prior to their settlement date; excluding these transactions, portfolio turnover would have been 105%. Includes U.S. Treasury securities purchased and sold prior to their settlement date; excluding these transactions, portfolio turnover would have been 123%. Includes U.S.
Treasury securities purchased and sold prior to their settlement date; excluding these transactions, portfolio turnover would have been 56%. See notes to financial statements. 122 Payden Mutual Funds . Payden Strategic Income Fund — Adviser Class 2015 2014 Net asset value — beginning of period . . . .
. . .
. . .
. . .
. . .
. . .
. . .
. . .
$ 9.98 $ 10.00 Income from investment activities: Net investment income . . .
. . .
. . .
. . .
. . .
. . .
. . .
. . .
. . .
. . .
. . .
. . 0.18 0.08 Net realized and unrealized gains (losses) . .
. . .
. . .
. . .
. . .
. . .
. . .
. . —(1) (0.01) Total from investment activities . .
. . .
. . .
. . .
. . .
. . .
. . .
. . .
. . .
. 0.18 0.07 Distributions to shareholders: From net investment income . . .
. . .
. . .
. . .
. . .
. . .
. . .
. . .
. . .
. . .
. (0.19) (0.09) From net realized gains. . .
. . .
. . .
. . .
. . .
. . .
. . .
. . .
. . .
. . .
. . .
. . . (0.02) — Return of capital.
. . .
. . .
. . .
. . .
. . .
. . .
. . .
. . .
. . .
. . .
. . .
. . .
. . .
. (0.01) — Total distributions to shareholders . . .
. . .
. . .
. . .
. . .
. . .
. . .
. . .
. (0.22) (0.09) Net asset value — end of period . . .
. . .
. . .
. . .
. . .
. . .
. . .
. . .
. . .
. . .
$ 9.94 $ 9.98 Total return . . .
. . .
. . .
. . .
. . .
. . .
. . .
. . .
. . .
. . .
. . .
. . .
. . .
. . . Ratios/supplemental data: Net assets, end of period (000s) .
. . .
. . .
. . .
. . .
. . .
. . .
. . .
. . .
. . .
. $ Ratio of gross expense to average net assets. .
. . .
. . .
. . .
. . .
. . .
. . .
. Ratio of net expense to average net assets . . .
. . .
. . .
. . .
. . .
. . .
. . .
. Ratio of investment income less gross expenses to average net assets . . Ratio of net investment income to average net assets . .
. . .
. . .
. . .
. . Portfolio turnover rate . .
. . .
. . .
. . .
. . .
. . .
. . .
. . .
. . .
. . .
. . .
. . .
. 1.83% 6,797 1.16% 1.05% 1.81% 1.92% 30% 0.73%(2) $ 2,932 1.40%(3) 1.05%(3) 1.89%(3) 2.19%(3) 17%(2) The Fund commenced operations on May 8, 2014. Payden Strategic Income Fund — Investor Class 2015 2014 Net asset value — beginning of period . . .
. . .
. . .
. . .
. . .
. . .
. . .
. . .
. $ 10.00 $ 10.00 Income from investment activities: Net investment income . .
. . .
. . .
. . .
. . .
. . .
. . .
. . .
. . .
. . .
. . .
. . . 0.22 0.09 Net realized and unrealized gains (losses) .
. . .
. . .
. . .
. . .
. . .
. . .
. . . (0.01) (0.00)(1) Total from investment activities .
. . .
. . .
. . .
. . .
. . .
. . .
. . .
. . .
. . 0.21 0.09 Distributions to shareholders: From net investment income . .
. . .
. . .
. . .
. . .
. . .
. . .
. . .
. . .
. . .
. . (0.22) (0.09) From net realized gains. .
. . .
. . .
. . .
. . .
. . .
. . .
. . .
. . .
. . .
. . .
. . .
. (0.02) — Return of capital. . .
. . .
. . .
. . .
. . .
. . .
. . .
. . .
. . .
. . .
. . .
. . .
. . .
. . (0.01) — Total distributions to shareholders . .
. . .
. . .
. . .
. . .
. . .
. . .
. . .
. . (0.25) (0.09) Net asset value — end of period . .
. . .
. . .
. . .
. . .
. . .
. . .
. . .
. . .
. . .
. $ 9.96 $ 10.00 Total return . .
. . .
. . .
. . .
. . .
. . .
. . .
. . .
. . .
. . .
. . .
. . .
. . .
. . .
. 2.08% Ratios/supplemental data: Net assets, end of period (000s) . . .
. . .
. . .
. . .
. . .
. . .
. . .
. . .
. . .
. . $ 108,789 Ratio of gross expense to average net assets.
. . .
. . .
. . .
. . .
. . .
. . .
. . 0.90% Ratio of net expense to average net assets . .
. . .
. . .
. . .
. . .
. . .
. . .
. . 0.80% Ratio of investment income less gross expenses to average net assets . . 2.06% Ratio of net investment income to average net assets .
. . .
. . .
. . .
. . . 2.17% Portfolio turnover rate .
. . .
. . .
. . .
. . .
. . .
. . .
. . .
. . .
. . .
. . .
. . .
. . 30% 0.94%(2) $ 55,453 1.20%(3) 0.80%(3) 1.79%(3) 2.19%(3) 17%(2) The Fund commenced operations on May 8, 2014. (1) Amount is less than $0.005 (2) Not annualized (3) Annualized See notes to financial statements. Annual Report 123 . Financial Highlights continued For the share outstanding for the periods ended October 31st Payden Strategic Income Fund — SI Class 2015 2014 Net asset value — beginning of period . . . .
. . .
. . .
. . .
. . .
. . .
. . .
. . .
$ 9.99 $ 10.00 Income from investment activities: Net investment income . . .
. . .
. . .
. . .
. . .
. . .
. . .
. . .
. . .
. . .
. . .
. . 0.23 0.09 Net realized and unrealized gains (losses) . .
. . .
. . .
. . .
. . .
. . .
. . .
. . 0.00 (0.00)(1) Total from investment activities . .
. . .
. . .
. . .
. . .
. . .
. . .
. . .
. . .
. 0.23 0.09 Distributions to shareholders: From net investment income . . .
. . .
. . .
. . .
. . .
. . .
. . .
. . .
. . .
. . .
. (0.23) (0.10) From net realized gains. . .
. . .
. . .
. . .
. . .
. . .
. . .
. . .
. . .
. . .
. . .
. . . (0.02) — Return of capital.
. . .
. . .
. . .
. . .
. . .
. . .
. . .
. . .
. . .
. . .
. . .
. . .
. . .
. (0.01) — Total distributions to shareholders . . .
. . .
. . .
. . .
. . .
. . .
. . .
. . .
. (0.26) (0.10) Net asset value — end of period . . .
. . .
. . .
. . .
. . .
. . .
. . .
. . .
. . .
. . .
$ 9.96 $ 9.99 Total return . . .
. . .
. . .
. . .
. . .
. . .
. . .
. . .
. . .
. . .
. . .
. . .
. . .
. . . Ratios/supplemental data: Net assets, end of period (000s) .
. . .
. . .
. . .
. . .
. . .
. . .
. . .
. . .
. . .
. $ Ratio of gross expense to average net assets. .
. . .
. . .
. . .
. . .
. . .
. . .
. Ratio of net expense to average net assets . . .
. . .
. . .
. . .
. . .
. . .
. . .
. Ratio of investment income less gross expenses to average net assets . . Ratio of net investment income to average net assets . .
. . .
. . .
. . .
. . Portfolio turnover rate . .
. . .
. . .
. . .
. . .
. . .
. . .
. . .
. . .
. . .
. . .
. . .
. 2.32% 37,766 0.90% 0.65% 2.06% 2.31% 30% 0.93%(2) $ 32,682 1.17%(3) 0.65%(3) 1.87%(3) 2.39%(3) 17%(2) The Fund commenced operations on May 8, 2014. Payden Absolute Return Bond Fund — Advisor Class 2015 Net asset value — beginning of period . . .
. . .
. . .
. . .
. . .
. . .
. . .
. . .
. $ 10.00 Income (loss) from investment activities: Net investment income . .
. . .
. . .
. . .
. . .
. . .
. . .
. . .
. . .
. . .
. . .
. . . 0.16(4) Net realized and unrealized losses .
. . .
. . .
. . .
. . .
. . .
. . .
. . .
. . .
. . . (0.07) Total from investment activities .
. . .
. . .
. . .
. . .
. . .
. . .
. . .
. . .
. . 0.09 Distributions to shareholders: From net investment income . .
. . .
. . .
. . .
. . .
. . .
. . .
. . .
. . .
. . .
. . (0.16) Net asset value — end of period . .
. . .
. . .
. . .
. . .
. . .
. . .
. . .
. . .
. . .
. $ 9.93 Total return . .
. . .
. . .
. . .
. . .
. . .
. . .
. . .
. . .
. . .
. . .
. . .
. . .
. . .
. Ratios/supplemental data: Net assets, end of period (000s) . . .
. . .
. . .
. . .
. . .
. . .
. . .
. . .
. . .
. . $ Ratio of gross expense to average net assets.
. . .
. . .
. . .
. . .
. . .
. . .
. . Ratio of net expense to average net assets . .
. . .
. . .
. . .
. . .
. . .
. . .
. . Ratio of investment income less gross expenses to average net assets . . Ratio of net investment income to average net assets .
. . .
. . .
. . .
. . . Portfolio turnover rate .
. . .
. . .
. . .
. . .
. . .
. . .
. . .
. . .
. . .
. . .
. . .
. . 0.86% 36 1.42%(3) 0.95%(3) 1.20%(3) 1.67%(3) 64%(2) The Fund commenced operations on November 6, 2014. (1) (2) (3) (4) Amount is less than $0.005 Not annualized Annualized Based on average shares outstanding. See notes to financial statements. 124 Payden Mutual Funds . Payden Absolute Return Bond Fund — Investor Class 2015 Net asset value — beginning of period . . . .
. . .
. . .
. . .
. . .
. . .
. . .
. . .
$ 10.00 Income (loss) from investment activities: Net investment income . . .
. . .
. . .
. . .
. . .
. . .
. . .
. . .
. . .
. . .
. . .
. . 0.17(1) Net realized and unrealized losses . .
. . .
. . .
. . .
. . .
. . .
. . .
. . .
. . .
. . (0.07) Total from investment activities . .
. . .
. . .
. . .
. . .
. . .
. . .
. . .
. . .
. 0.10 Distributions to shareholders: From net investment income . . .
. . .
. . .
. . .
. . .
. . .
. . .
. . .
. . .
. . .
. (0.18) Total distributions to shareholders . . .
. . .
. . .
. . .
. . .
. . .
. . .
. . .
. (0.18) Net asset value — end of period . . .
. . .
. . .
. . .
. . .
. . .
. . .
. . .
. . .
. . .
$ 9.92 Total return . . .
. . .
. . .
. . .
. . .
. . .
. . .
. . .
. . .
. . .
. . .
. . .
. . .
. . . Ratios/supplemental data: Net assets, end of period (000s) .
. . .
. . .
. . .
. . .
. . .
. . .
. . .
. . .
. . .
. $ Ratio of gross expense to average net assets. .
. . .
. . .
. . .
. . .
. . .
. . .
. Ratio of net expense to average net assets . . .
. . .
. . .
. . .
. . .
. . .
. . .
. Ratio of investment income less gross expenses to average net assets . . Ratio of net investment income to average net assets . .
. . .
. . .
. . .
. . Portfolio turnover rate . .
. . .
. . .
. . .
. . .
. . .
. . .
. . .
. . .
. . .
. . .
. . .
. 0.97% 42,121 1.17%(2) 0.70%(2) 1.45%(2) 1.92%(2) 64%(3) The Fund commenced operations on November 6, 2014. Payden Absolute Return Bond Fund — SI Class 2015 Net asset value — beginning of period . . .
. . .
. . .
. . .
. . .
. . .
. . .
. . .
. $ 10.00 Income (loss) from investment activities: Net investment income . .
. . .
. . .
. . .
. . .
. . .
. . .
. . .
. . .
. . .
. . .
. . . 0.19(1) Net realized and unrealized losses .
. . .
. . .
. . .
. . .
. . .
. . .
. . .
. . .
. . . (0.07) Total from investment activities .
. . .
. . .
. . .
. . .
. . .
. . .
. . .
. . .
. . 0.12 Distributions to shareholders: From net investment income . .
. . .
. . .
. . .
. . .
. . .
. . .
. . .
. . .
. . .
. . (0.19) Total distributions to shareholders . .
. . .
. . .
. . .
. . .
. . .
. . .
. . .
. . (0.19) Net asset value — end of period . .
. . .
. . .
. . .
. . .
. . .
. . .
. . .
. . .
. . .
. $ 9.93 Total return . .
. . .
. . .
. . .
. . .
. . .
. . .
. . .
. . .
. . .
. . .
. . .
. . .
. . .
. Ratios/supplemental data: Net assets, end of period (000s) . . .
. . .
. . .
. . .
. . .
. . .
. . .
. . .
. . .
. . $ Ratio of gross expense to average net assets.
. . .
. . .
. . .
. . .
. . .
. . .
. . Ratio of net expense to average net assets . .
. . .
. . .
. . .
. . .
. . .
. . .
. . Ratio of investment income less gross expenses to average net assets . . Ratio of net investment income to average net assets .
. . .
. . .
. . .
. . . Portfolio turnover rate .
. . .
. . .
. . .
. . .
. . .
. . .
. . .
. . .
. . .
. . .
. . .
. . 1.20% 18,830 1.17%(2) 0.55%(2) 1.32%(2) 1.94%(2) 64%(3) The Fund commenced operations on November 6, 2014. (1) Based on average shares outstanding. (2) Annualized (3) Not annualized See notes to financial statements. Annual Report 125 . Financial Highlights continued For the share outstanding for the periods ended October 31st Payden Floating Rate Fund — Adviser Class 2015 2014 Net asset value — beginning of period . . . .
. . .
. . .
. . .
. . .
. . .
. . .
. . .
$ 9.97 $ 10.00 Income from investment activities: Net investment income . . .
. . .
. . .
. . .
. . .
. . .
. . .
. . .
. . .
. . .
. . .
. . 0.27 0.24 Net realized and unrealized gains (losses) . .
. . .
. . .
. . .
. . .
. . .
. . .
. . (0.03) (0.03) Total from investment activities . .
. . .
. . .
. . .
. . .
. . .
. . .
. . .
. . .
. 0.24 0.21 Distributions to shareholders: From net investment income . . .
. . .
. . .
. . .
. . .
. . .
. . .
. . .
. . .
. . .
. (0.28) (0.24) From net realized gains. . .
. . .
. . .
. . .
. . .
. . .
. . .
. . .
. . .
. . .
. . .
. . . (0.03) — Total distributions to shareholders .
. . .
. . .
. . .
. . .
. . .
. . .
. . .
. . . (0.31) (0.24) Net asset value — end of period .
. . .
. . .
. . .
. . .
. . .
. . .
. . .
. . .
. . .
. . $ 9.90 $ 9.97 Total return .
. . .
. . .
. . .
. . .
. . .
. . .
. . .
. . .
. . .
. . .
. . .
. . .
. . .
. . Ratios/supplemental data: Net assets, end of period (000s) . .
. . .
. . .
. . .
. . .
. . .
. . .
. . .
. . .
. . .
$ Ratio of gross expense to average net assets. . .
. . .
. . .
. . .
. . .
. . .
. . . Ratio of net expense to average net assets .
. . .
. . .
. . .
. . .
. . .
. . .
. . . Ratio of investment income less gross expenses to average net assets .
. Ratio of net investment income to average net assets . . .
. . .
. . .
. . .
. Portfolio turnover rate . . .
. . .
. . .
. . .
. . .
. . .
. . .
. . .
. . .
. . .
. . .
. . . 2.48% 128 1.09% 1.00% 2.75% 2.84% 39% 2.15%(1) $ 40 1.14%(2) 0.99%(2) 2.77%(2) 2.92%(2) 18%(1) The Class commenced operations on November 11, 2013. Payden Floating Rate Fund — Investor Class 2015 2014 Net asset value — beginning of period .
. . .
. . .
. . .
. . .
. . .
. . .
. . .
. . .
$ 9.97 $ 10.00 Income from investment activities: Net investment income . . .
. . .
. . .
. . .
. . .
. . .
. . .
. . .
. . .
. . .
. . .
. . 0.32 0.27 Net realized and unrealized gains (losses) . .
. . .
. . .
. . .
. . .
. . .
. . .
. . (0.06) (0.03) Total from investment activities . .
. . .
. . .
. . .
. . .
. . .
. . .
. . .
. . .
. 0.26 0.24 Distributions to shareholders: From net investment income . . .
. . .
. . .
. . .
. . .
. . .
. . .
. . .
. . .
. . .
. (0.31) (0.27) From net realized gains. . .
. . .
. . .
. . .
. . .
. . .
. . .
. . .
. . .
. . .
. . .
. . . (0.03) — Total distributions to shareholders .
. . .
. . .
. . .
. . .
. . .
. . .
. . .
. . . (0.34) (0.27) Net asset value — end of period .
. . .
. . .
. . .
. . .
. . .
. . .
. . .
. . .
. . .
. . $ 9.89 $ 9.97 Total return .
. . .
. . .
. . .
. . .
. . .
. . .
. . .
. . .
. . .
. . .
. . .
. . .
. . .
. . Ratios/supplemental data: Net assets, end of period (000s) . .
. . .
. . .
. . .
. . .
. . .
. . .
. . .
. . .
. . .
$ Ratio of gross expense to average net assets. . .
. . .
. . .
. . .
. . .
. . .
. . . Ratio of net expense to average net assets .
. . .
. . .
. . .
. . .
. . .
. . .
. . . Ratio of investment income less gross expenses to average net assets .
. Ratio of net investment income to average net assets . . .
. . .
. . .
. . .
. Portfolio turnover rate . . .
. . .
. . .
. . .
. . .
. . .
. . .
. . .
. . .
. . .
. . .
. . . 2.64% 42,478 0.84% 0.75% 3.00% 3.09% 39% 2.39%(1) $ 46,586 0.90%(2) 0.75%(2) 3.03%(2) 3.17%(2) 18%(1) The Fund commenced operations on November 11, 2013. (1) Not annualized (2) Annualized See notes to financial statements. 126 Payden Mutual Funds .
Payden Floating Rate Fund — SI Class 2015 2014 Net asset value — beginning of period . . . .
. . .
. . .
. . .
. . .
. . .
. . .
. . .
$ 9.98 $ 10.00 Income from investment activities: Net investment income . . .
. . .
. . .
. . .
. . .
. . .
. . .
. . .
. . .
. . .
. . .
. . 0.32 0.28 Net realized and unrealized gains (losses) . .
. . .
. . .
. . .
. . .
. . .
. . .
. . (0.05) (0.02) Total from investment activities . .
. . .
. . .
. . .
. . .
. . .
. . .
. . .
. . .
. 0.27 0.26 Distributions to shareholders: From net investment income . . .
. . .
. . .
. . .
. . .
. . .
. . .
. . .
. . .
. . .
. (0.32) (0.28) From net realized gains. . .
. . .
. . .
. . .
. . .
. . .
. . .
. . .
. . .
. . .
. . .
. . . (0.03) — Total distributions to shareholders .
. . .
. . .
. . .
. . .
. . .
. . .
. . .
. . . (0.35) (0.28) Net asset value — end of period .
. . .
. . .
. . .
. . .
. . .
. . .
. . .
. . .
. . .
. . $ 9.90 $ 9.98 Total return .
. . .
. . .
. . .
. . .
. . .
. . .
. . .
. . .
. . .
. . .
. . .
. . .
. . .
. . 2.74% 2.59%(1) Ratios/supplemental data: Net assets, end of period (000s) . .
. . .
. . .
. . .
. . .
. . .
. . .
. . .
. . .
. . .
$ 124,006 Ratio of gross expense to average net assets. . .
. . .
. . .
. . .
. . .
. . .
. . . 0.84% Ratio of net expense to average net assets .
. . .
. . .
. . .
. . .
. . .
. . .
. . . 0.65% Ratio of investment income less gross expenses to average net assets .
. 3.01% Ratio of net investment income to average net assets . . .
. . .
. . .
. . .
. 3.20% Portfolio turnover rate . . .
. . .
. . .
. . .
. . .
. . .
. . .
. . .
. . .
. . .
. . .
. . . 39% $ 119,799 0.89%(2) 0.65%(2) 2.93%(2) 3.18%(2) 18%(1) The Fund commenced operations on November 11, 2013. 2015 Net asset value — beginning of period .
. . .
. . .
. . .
. . .
. . .
. . .
. . .
. . .
$ 7.08 Income (loss) from investment activities: Net investment income . . .
. . .
. . .
. . .
. . .
. . .
. . .
. . .
. . .
. . .
. . .
. . 0.31 Net realized and unrealized gains (losses) . .
. . .
. . .
. . .
. . .
. . .
. . .
. . (0.37) Total from investment activities . .
. . .
. . .
. . .
. . .
. . .
. . .
. . .
. . .
. (0.06) Distributions to shareholders: From net investment income . . .
. . .
. . .
. . .
. . .
. . .
. . .
. . .
. . .
. . .
. (0.34) From net realized gains. . .
. . .
. . .
. . .
. . .
. . .
. . .
. . .
. . .
. . .
. . .
. . . (0.26) Return of capital.
. . .
. . .
. . .
. . .
. . .
. . .
. . .
. . .
. . .
. . .
. . .
. . .
. . .
. — Total distributions to shareholders . . .
. . .
. . .
. . .
. . .
. . .
. . .
. . .
. (0.60) Net asset value — end of period . . .
. . .
. . .
. . .
. . .
. . .
. . .
. . .
. . .
. . .
$ 6.42 Total return . . .
. . .
. . .
. . .
. . .
. . .
. . .
. . .
. . .
. . .
. . .
. . .
. . .
. . . Ratios/supplemental data: Net assets, end of period (000s) .
. . .
. . .
. . .
. . .
. . .
. . .
. . .
. . .
. . .
. $ Ratio of gross expense to average net assets. .
. . .
. . .
. . .
. . .
. . .
. . .
. Ratio of net expense to average net assets . . .
. . .
. . .
. . .
. . .
. . .
. . .
. Ratio of investment income less gross expenses to average net assets . . Ratio of net investment income to average net assets . .
. . .
. . .
. . .
. . Portfolio turnover rate . .
. . .
. . .
. . .
. . .
. . .
. . .
. . .
. . .
. . .
. . .
. . .
. Payden High Income Fund - Adviser Class 2014 2013 2012 $ 7.28 $ 7.29 $ 7.05 2011 7.32 0.39 (0.01) 0.38 $ (0.76)% 19,879 0.92% 0.92% 4.98% 4.98% 32% $ 0.46 (0.06) 0.40 0.46 0.37 0.83 0.49 (0.24) 0.25 (0.38) (0.20) — (0.58) 7.08 (0.41) — — (0.41) 7.28 (0.48) (0.09) (0.02) (0.59) 7.29 (0.51) (0.01) — (0.52) 7.05 $ 5.45% $ 3,968 0.91% 0.91% 5.29% 5.29% 42% $ 5.56% $ 4,884 0.91% 0.91% 5.79% 5.79% 25% $ 12.38% $ 5,974 0.89% 0.89% 6.41% 6.41% 24% 3.51% $ 4,492 0.92% 0.92% 6.93% 6.93% 38% The Class commenced operations on November 2, 2009. (1) Not annualized (2) Annualized See notes to financial statements. Annual Report 127 . Financial Highlights continued For the share outstanding for the periods ended October 31st 2015 Net asset value — beginning of period . . . .
. . .
. . .
. . .
. . .
. . .
. . .
. . .
$ 7.08 Income (loss) from investment activities: Net investment income . . .
. . .
. . .
. . .
. . .
. . .
. . .
. . .
. . .
. . .
. . .
. . 0.36 Net realized and unrealized gains (losses) . .
. . .
. . .
. . .
. . .
. . .
. . .
. . (0.42) Total from investment activities . .
. . .
. . .
. . .
. . .
. . .
. . .
. . .
. . .
. (0.06) Distributions to shareholders: From net investment income . . .
. . .
. . .
. . .
. . .
. . .
. . .
. . .
. . .
. . .
. (0.36) From net realized gains. . .
. . .
. . .
. . .
. . .
. . .
. . .
. . .
. . .
. . .
. . .
. . . (0.26) Return of capital.
. . .
. . .
. . .
. . .
. . .
. . .
. . .
. . .
. . .
. . .
. . .
. . .
. . .
. — Total distributions to shareholders . . .
. . .
. . .
. . .
. . .
. . .
. . .
. . .
. (0.62) Proceeds from redemption fees . . .
. . .
. . .
. . .
. . .
. . .
. . .
. . .
. . .
. . .
. . — Net asset value — end of period . .
. . .
. . .
. . .
. . .
. . .
. . .
. . .
. . .
. . .
. $ 6.40 Total return . .
. . .
. . .
. . .
. . .
. . .
. . .
. . .
. . .
. . .
. . .
. . .
. . .
. . .
. Payden High Income Fund - Investor Class 2014 2013 2012 $ 7.28 $ 7.29 $ 7.05 $ 2011 7.31 0.40 (0.00)(1) 0.40 $ 0.44 (0.03) 0.41 0.48 0.37 0.85 0.52 (0.24) 0.28 (0.40) (0.20) — (0.60) — 7.08 (0.42) — — (0.42) — 7.28 (0.49) (0.09) (0.03) (0.61) — 7.29 (0.53) (0.01) — (0.54) 0.00(1) 7.05 $ $ $ (0.79)% 5.75% 5.82% 12.69% 3.89% Ratios/supplemental data: Net assets, end of period (000s) . . .
. . .
. . .
. . .
. . .
. . .
. . .
. . .
. . .
. . $ 603,937 Ratio of gross expense to average net assets.
. . .
. . .
. . .
. . .
. . .
. . .
. . 0.67% Ratio of net expense to average net assets . .
. . .
. . .
. . .
. . .
. . .
. . .
. . 0.67% Ratio of investment income less gross expenses to average net assets . . 5.29% Ratio of net investment income to average net assets .
. . .
. . .
. . .
. . . 5.29% Portfolio turnover rate .
. . .
. . .
. . .
. . .
. . .
. . .
. . .
. . .
. . .
. . .
. . .
. . 32% $ 734,666 0.66% 0.66% 5.54% 5.54% 42% $ 892,360 0.66% 0.66% 6.05% 6.05% 25% $1,123,179 0.64% 0.64% 6.70% 6.70% 24% $1,024,553 0.66% 0.66% 7.20% 7.20% 38% The Fund commenced operations on December 30, 1997. 2015 Net asset value — beginning of period . .
. . .
. . .
. . .
. . .
. . .
. . .
. . .
. . $ 10.50 Income (loss) from investment activities: Net investment income .
. . .
. . .
. . .
. . .
. . .
. . .
. . .
. . .
. . .
. . .
. . .
. 0.23 Net realized and unrealized gains (losses) . . .
. . .
. . .
. . .
. . .
. . .
. . .
. (0.03) Total from investment activities . . .
. . .
. . .
. . .
. . .
. . .
. . .
. . .
. . . 0.20 Distributions to shareholders: From net investment income .
. . .
. . .
. . .
. . .
. . .
. . .
. . .
. . .
. . .
. . . (0.23) From net realized gains.
. . .
. . .
. . .
. . .
. . .
. . .
. . .
. . .
. . .
. . .
. . .
. . (0.08) Total distributions to shareholders . .
. . .
. . .
. . .
. . .
. . .
. . .
. . .
. . (0.31) Net asset value — end of period . .
. . .
. . .
. . .
. . .
. . .
. . .
. . .
. . .
. . .
. $ 10.39 Total return . .
. . .
. . .
. . .
. . .
. . .
. . .
. . .
. . .
. . .
. . .
. . .
. . .
. . .
. Ratios/supplemental data: Net assets, end of period (000s) . . .
. . .
. . .
. . .
. . .
. . .
. . .
. . .
. . .
. . $ Ratio of gross expense to average net assets.
. . .
. . .
. . .
. . .
. . .
. . .
. . Ratio of net expense to average net assets . .
. . .
. . .
. . .
. . .
. . .
. . .
. . Ratio of investment income less gross expenses to average net assets . . Ratio of net investment income to average net assets .
. . .
. . .
. . .
. . . Portfolio turnover rate .
. . .
. . .
. . .
. . .
. . .
. . .
. . .
. . .
. . .
. . .
. . .
. . Payden California Municipal Income Fund 2014 2013 2012 $ 10.27 $ 10.63 $ 10.11 $ 0.25 (0.24) 0.01 0.26 0.52 0.78 0.28 (0.05) 0.23 (0.24) (0.06) (0.30) 10.50 (0.25) (0.12) (0.37) 10.27 (0.26) — (0.26) 10.63 (0.28) (0.20) (0.48) 10.11 $ 5.27% $ 46,729 0.70% 0.55% 2.18% 2.33% 48% The Fund commenced operations on December 17, 1998. (1) Amount is less than $0.005 See notes to financial statements. 128 Payden Mutual Funds 2011 10.36 0.24 0.29 0.53 1.87% 45,938 0.70% 0.55% 2.03% 2.17% 45% $ $ 0.02% $ 43,305 0.66% 0.55% 2.26% 2.37% 24% $ 7.73% $ 49,811 0.67% 0.56% 2.32% 2.43% 25% 2.41% $ 44,265 0.67% 0.55% 2.64% 2.76% 30% . 2015 Net asset value — beginning of period . . . .
. . .
. . .
. . .
. . .
. . .
. . .
. . .
$ 10.10 Income (loss) from investment activities: Net investment income . . .
. . .
. . .
. . .
. . .
. . .
. . .
. . .
. . .
. . .
. . .
. . 0.12 Net realized and unrealized gains (losses) . .
. . .
. . .
. . .
. . .
. . .
. . .
. . (0.09) Total from investment activities . .
. . .
. . .
. . .
. . .
. . .
. . .
. . .
. . .
. 0.03 Distributions to shareholders: From net investment income . . .
. . .
. . .
. . .
. . .
. . .
. . .
. . .
. . .
. . .
. (0.02) Return of capital. . .
. . .
. . .
. . .
. . .
. . .
. . .
. . .
. . .
. . .
. . .
. . .
. . .
. . (0.10) Total distributions to shareholders . .
. . .
. . .
. . .
. . .
. . .
. . .
. . .
. . (0.12) Net asset value — end of period . .
. . .
. . .
. . .
. . .
. . .
. . .
. . .
. . .
. . .
. $ 10.01 Total return . .
. . .
. . .
. . .
. . .
. . .
. . .
. . .
. . .
. . .
. . .
. . .
. . .
. . .
. Payden Global Low Duration Fund 2014 2013 2012 $ 10.08 $ 10.10 $ 9.88 $ 2011 10.16 0.12 0.02 0.14 $ 0.14 (0.02) 0.12 0.21 0.33 0.54 0.19 (0.20) (0.01) (0.12) — (0.12) 10.10 (0.13) (0.01) (0.14) 10.08 (0.32) — (0.32) 10.10 (0.27) — (0.27) 9.88 $ 0.32% 1.43% Ratios/supplemental data: Net assets, end of period (000s) . . .
. . .
. . .
. . .
. . .
. . .
. . .
. . .
. . .
. . $ 130,344 Ratio of gross expense to average net assets.
. . .
. . .
. . .
. . .
. . .
. . .
. . 0.69% Ratio of net expense to average net assets . .
. . .
. . .
. . .
. . .
. . .
. . .
. . 0.55% Ratio of investment income less gross expenses to average net assets . . 1.05% Ratio of net investment income to average net assets .
. . .
. . .
. . .
. . . 1.18% Portfolio turnover rate .
. . .
. . .
. . .
. . .
. . .
. . .
. . .
. . .
. . .
. . .
. . .
. . 35% $ 139,965 0.69% 0.55% 1.11% 1.25% 54% $ 113,046 0.71% 0.60% 1.29% 1.41% 84% $ 1.19% $ 5.59% $ 70,544 0.76% 0.71% 2.00% 2.05% 79% (0.10)% $ 73,021 0.70% 0.70% 2.04% 2.04% 142% The Fund commenced operations on September 18, 1996. 2015 Net asset value — beginning of period . .
. . .
. . .
. . .
. . .
. . .
. . .
. . .
. . $ 8.84 Income (loss) from investment activities: Net investment income .
. . .
. . .
. . .
. . .
. . .
. . .
. . .
. . .
. . .
. . .
. . .
. 0.15 Net realized and unrealized gains (losses) . . .
. . .
. . .
. . .
. . .
. . .
. . .
. 0.05 Total from investment activities . . .
. . .
. . .
. . .
. . .
. . .
. . .
. . .
. . . 0.20 Distributions to shareholders: From net investment income .
. . .
. . .
. . .
. . .
. . .
. . .
. . .
. . .
. . .
. . . (0.17) Return of capital.
. . .
. . .
. . .
. . .
. . .
. . .
. . .
. . .
. . .
. . .
. . .
. . .
. . .
. — Total distributions to shareholders . . .
. . .
. . .
. . .
. . .
. . .
. . .
. . .
. (0.17) Net asset value — end of period . . .
. . .
. . .
. . .
. . .
. . .
. . .
. . .
. . .
. . .
$ 8.87 Total return . . .
. . .
. . .
. . .
. . .
. . .
. . .
. . .
. . .
. . .
. . .
. . .
. . .
. . . Ratios/supplemental data: Net assets, end of period (000s) .
. . .
. . .
. . .
. . .
. . .
. . .
. . .
. . .
. . .
. $ Ratio of gross expense to average net assets. .
. . .
. . .
. . .
. . .
. . .
. . .
. Ratio of net expense to average net assets . . .
. . .
. . .
. . .
. . .
. . .
. . .
. Ratio of investment income less gross expenses to average net assets . . Ratio of net investment income to average net assets . .
. . .
. . .
. . .
. . Portfolio turnover rate . .
. . .
. . .
. . .
. . .
. . .
. . .
. . .
. . .
. . .
. . .
. . .
. Payden Global Fixed Income Fund 2014 2013 2012 $ 8.53 $ 8.70 $ 8.71 2011 9.02 0.21 0.31 0.52 $ 2.27% 80,293 0.81% 0.66% 1.63% 1.78% 44% $ 0.25 (0.19) 0.06 0.45 0.25 0.70 0.36 (0.30) 0.06 (0.18) (0.03) (0.21) 8.84 (0.08) (0.15) (0.23) 8.53 (0.71) — (0.71) 8.70 (0.37) — (0.37) 8.71 $ 6.20% $ 50,679 0.90% 0.70% 2.30% 2.50% 55% $ 0.69% $ 39,921 0.94% 0.71% 2.57% 2.81% 75% $ 8.54% $ 48,221 0.92% 0.72% 3.45% 3.65% 100% 0.71% $ 66,592 0.84% 0.70% 3.91% 4.05% 82% The Fund commenced operations on September 1, 1992. See notes to financial statements. Annual Report 129 . Financial Highlights continued For the share outstanding for the periods ended October 31st Payden Emerging Markets Bond Fund - Adviser Class 2014 2013 2012 $ 13.90 $ 15.45 $ 14.45 2015 14.14 Net asset value — beginning of period . . . .
. . .
. . .
. . .
. . .
. . .
. . .
. . .
$ 1 Income (loss) from investment activities: Net investment income . . .
. . .
. . .
. . .
. . .
. . .
. . .
. . .
. . .
. . .
. . .
. . 0.63 Net realized and unrealized gains (losses) . .
. . .
. . .
. . .
. . .
. . .
. . .
. . (1.04) Total from investment activities . .
. . .
. . .
. . .
. . .
. . .
. . .
. . .
. . .
. (0.41) Distributions to shareholders: From net investment income . . .
. . .
. . .
. . .
. . .
. . .
. . .
. . .
. . .
. . .
. (0.63) From net realized gains. . .
. . .
. . .
. . .
. . .
. . .
. . .
. . .
. . .
. . .
. . .
. . . — Return of capital.
. . .
. . .
. . .
. . .
. . .
. . .
. . .
. . .
. . .
. . .
. . .
. . .
. . .
. — Total distributions to shareholders . . .
. . .
. . .
. . .
. . .
. . .
. . .
. . .
. (0.63) 13.10 Net asset value — end of period . . .
. . .
. . .
. . .
. . .
. . .
. . .
. . .
. . .
. . .
$ 1 Total return . . .
. . .
. . .
. . .
. . .
. . .
. . .
. . .
. . .
. . .
. . .
. . .
. . .
. . . Ratios/supplemental data: Net assets, end of period (000s) .
. . .
. . .
. . .
. . .
. . .
. . .
. . .
. . .
. . .
. $ Ratio of gross expense to average net assets. .
. . .
. . .
. . .
. . .
. . .
. . .
. Ratio of net expense to average net assets . . .
. . .
. . .
. . .
. . .
. . .
. . .
. Ratio of investment income less gross expenses to average net assets . . Ratio of net investment income to average net assets . .
. . .
. . .
. . .
. . Portfolio turnover rate . .
. . .
. . .
. . .
. . .
. . .
. . .
. . .
. . .
. . .
. . .
. . .
. $ 2011 14.87 0.70 0.29 0.99 $ (2.94)% 29,481 1.01% 1.01% 4.73% 4.73% 54% 0.76 (1.27) (0.51) 0.78 1.33 2.11 0.78 (0.39) 0.39 (0.60) (0.05) (0.10) (0.75) 14.14 (0.79) (0.25) — (1.04) 13.90 (0.82) (0.29) — (1.11) 15.45 (0.80) (0.01) — (0.81) 14.45 $ 7.32% $ 21,754 1.03% 1.03% 5.03% 5.03% 73% $ (3.54)% $ 20,133 1.01% 1.01% 5.14% 5.14% 95% $ 15.49% $ 27,784 1.02% 1.02% 5.33% 5.33% 74% 2.77% $ 27,159 1.09% 1.09% 5.80% 5.80% 85% The Class commenced operations on November 2, 2009. 2015 14.11 Net asset value — beginning of period . . .
. . .
. . .
. . .
. . .
. . .
. . .
. . .
. $ 1 Income (loss) from investment activities: Net investment income . .
. . .
. . .
. . .
. . .
. . .
. . .
. . .
. . .
. . .
. . .
. . . 0.67 Net realized and unrealized gains (losses) .
. . .
. . .
. . .
. . .
. . .
. . .
. . . (1.04) Total from investment activities .
. . .
. . .
. . .
. . .
. . .
. . .
. . .
. . .
. . (0.37) Distributions to shareholders: From net investment income . .
. . .
. . .
. . .
. . .
. . .
. . .
. . .
. . .
. . .
. . (0.66) From net realized gains. .
. . .
. . .
. . .
. . .
. . .
. . .
. . .
. . .
. . .
. . .
. . .
. — Return of capital. . .
. . .
. . .
. . .
. . .
. . .
. . .
. . .
. . .
. . .
. . .
. . .
. . .
. . — Total distributions to shareholders . .
. . .
. . .
. . .
. . .
. . .
. . .
. . .
. . (0.66) Proceeds from redemption fees . .
. . .
. . .
. . .
. . .
. . .
. . .
. . .
. . .
. . .
. . . — Net asset value — end of period .
. . .
. . .
. . .
. . .
. . .
. . .
. . .
. . .
. . .
. . $ 13.08 Total return .
. . .
. . .
. . .
. . .
. . .
. . .
. . .
. . .
. . .
. . .
. . .
. . .
. . .
. . Payden Emerging Markets Bond Fund - Investor Class 2014 2013 2012 $ 13.88 $ 15.42 $ 14.42 $ 2011 14.85 0.75 0.26 1.01 $ 0.79 (1.26) (0.47) 0.82 1.33 2.15 0.86 (0.45) 0.41 (0.63) (0.05) (0.10) (0.78) — 14.11 (0.82) (0.25) — (1.07) — 13.88 (0.86) (0.29) — (1.15) — 15.42 (0.83) (0.01) — (0.84) 0.00(1) 14.42 $ $ $ (2.65)% 7.53% (3.25)% 15.80% 2.95% Ratios/supplemental data: Net assets, end of period (000s) . .
. . .
. . .
. . .
. . .
. . .
. . .
. . .
. . .
. . .
$ 416,408 Ratio of gross expense to average net assets. . .
. . .
. . .
. . .
. . .
. . .
. . . 0.76% Ratio of net expense to average net assets .
. . .
. . .
. . .
. . .
. . .
. . .
. . . 0.76% Ratio of investment income less gross expenses to average net assets .
. 4.98% Ratio of net investment income to average net assets . . .
. . .
. . .
. . .
. 4.98% Portfolio turnover rate . . .
. . .
. . .
. . .
. . .
. . .
. . .
. . .
. . .
. . .
. . .
. . . 54% $ 379,923 0.78% 0.78% 5.29% 5.29% 73% $ 463,873 0.76% 0.76% 5.39% 5.39% 95% $ 575,777 0.78% 0.78% 5.62% 5.62% 74% $ 620,106 0.85% 0.85% 6.07% 6.07% 85% The Fund commenced operations on December 17, 1998. (1) Amount is less than $0.005 See notes to financial statements. 130 Payden Mutual Funds .
Payden Emerging Markets Bond Fund - SI Class 2015 2014 2013 2012 Net asset value — beginning of period . . . .
. . .
. . .
. . .
. . .
. . .
. . .
. . .
$ 14.10 $ 13.87 $ 15.42 $ 14.47 Income from investment activities: Net investment income . . .
. . .
. . .
. . .
. . .
. . .
. . .
. . .
. . .
. . .
. . .
. . 0.68 0.74 0.81 0.44 Net realized and unrealized gains (losses) . .
. . .
. . .
. . .
. . .
. . .
. . .
. . (1.04) 0.28 (1.27) 0.99 Total from investment activities . .
. . .
. . .
. . .
. . .
. . .
. . .
. . .
. . .
. (0.36) 1.02 (0.46) 1.43 Distributions to shareholders: From net investment income . . .
. . .
. . .
. . .
. . .
. . .
. . .
. . .
. . .
. . .
. (0.67) (0.64) (0.84) (0.48) From net realized gains. . .
. . .
. . .
. . .
. . .
. . .
. . .
. . .
. . .
. . .
. . .
. . . — (0.05) (0.25) — Return of capital.
. . .
. . .
. . .
. . .
. . .
. . .
. . .
. . .
. . .
. . .
. . .
. . .
. . .
. — (0.10) — — Total distributions to shareholders . . .
. . .
. . .
. . .
. . .
. . .
. . .
. . .
. (0.67) (0.79) (1.09) (0.48) Net asset value — end of period . . .
. . .
. . .
. . .
. . .
. . .
. . .
. . .
. . .
. . .
$ 13.07 $ 14.10 $ 13.87 $ 15.42 (2.58)% 7.64% (3.23)% 10.04%(1) Ratios/supplemental data: Net assets, end of period (000s) . . .
. . .
. . .
. . .
. . .
. . .
. . .
. . .
. . .
. . $ 518,220 Ratio of gross expense to average net assets.
. . .
. . .
. . .
. . .
. . .
. . .
. . 0.76% Ratio of net expense to average net assets . .
. . .
. . .
. . .
. . .
. . .
. . .
. . 0.69% Ratio of investment income less gross expenses to average net assets . . 4.98% Ratio of net investment income to average net assets .
. . .
. . .
. . .
. . . 5.05% Portfolio turnover rate .
. . .
. . .
. . .
. . .
. . .
. . .
. . .
. . .
. . .
. . .
. . .
. . 54% Total return . .
. . .
. . .
. . .
. . .
. . .
. . .
. . .
. . .
. . .
. . .
. . .
. . .
. . .
. $ 450,550 0.77% 0.69% 5.28% 5.35% 73% $ 399,432 0.76% 0.69% 5.40% 5.47% 95% $ 449,295 0.76%(2) 0.69%(2) 5.30%(2) 5.37%(2) 74% The Class commenced operations on April 9, 2012. Payden Emerging Markets Local Bond Fund - Adviser Class 2015 2014 2013 2012 Net asset value — beginning of period . . .
. . .
. . .
. . .
. . .
. . .
. . .
. . .
. $ 8.47 $ 9.32 $ 10.24 $ 10.00 Income from investment activities: Net investment income . .
. . .
. . .
. . .
. . .
. . .
. . .
. . .
. . .
. . .
. . .
. . . 0.38 0.49 0.30 0.56 Net realized and unrealized gains (losses) .
. . .
. . .
. . .
. . .
. . .
. . .
. . . (1.82) (0.87) (0.74) 0.14 Total from investment activities .
. . .
. . .
. . .
. . .
. . .
. . .
. . .
. . .
. . (1.44) (0.38) (0.44) 0.70 Distributions to shareholders: From net investment income . .
. . .
. . .
. . .
. . .
. . .
. . .
. . .
. . .
. . .
. . — — (0.31) (0.37) Return of capital. .
. . .
. . .
. . .
. . .
. . .
. . .
. . .
. . .
. . .
. . .
. . .
. . .
. . . (0.37) (0.47) (0.17) (0.09) Total distributions to shareholders .
. . .
. . .
. . .
. . .
. . .
. . .
. . .
. . . (0.37) (0.47) (0.48) (0.46) Net asset value — end of period .
. . .
. . .
. . .
. . .
. . .
. . .
. . .
. . .
. . .
. . $ 6.66 $ 8.47 $ 9.32 $ 10.24 Total return .
. . .
. . .
. . .
. . .
. . .
. . .
. . .
. . .
. . .
. . .
. . .
. . .
. . .
. . Ratios/supplemental data: Net assets, end of period (000s) . .
. . .
. . .
. . .
. . .
. . .
. . .
. . .
. . .
. . .
$ Ratio of gross expense to average net assets. . .
. . .
. . .
. . .
. . .
. . .
. . . Ratio of net expense to average net assets .
. . .
. . .
. . .
. . .
. . .
. . .
. . . Ratio of investment income less gross expenses to average net assets .
. Ratio of net investment income to average net assets . . .
. . .
. . .
. . .
. Portfolio turnover rate . . .
. . .
. . .
. . .
. . .
. . .
. . .
. . .
. . .
. . .
. . .
. . . (17.26)% 169 1.23% 1.22% 5.01% 5.03% 106% (4.09)% $ 398 1.21% 1.21% 5.34% 5.34% 99% (4.45)% $ 530 1.16% 1.16% 5.07% 5.07% 114% 7.26%(1) $ 21 1.35%(2) 1.24%(2) 4.71%(2) 4.82%(2) 91%(1) The Fund commenced operations November 2, 2011. (1) Not annualized (2) Annualized See notes to financial statements. Annual Report 131 .
Financial Highlights continued For the share outstanding for the periods ended October 31st Payden Emerging Markets Local Bond Fund - Investor Class 2015 2014 2013 2012 Net asset value — beginning of period . . . .
. . .
. . .
. . .
. . .
. . .
. . .
. . .
$ 8.48 $ 9.33 $ 10.24 $ 10.00 Income from investment activities: Net investment income . . .
. . .
. . .
. . .
. . .
. . .
. . .
. . .
. . .
. . .
. . .
. . 0.40 0.51 0.52 0.49 Net realized and unrealized gains (losses) . .
. . .
. . .
. . .
. . .
. . .
. . .
. . (1.83) (0.86) (0.92) 0.24 Total from investment activities . .
. . .
. . .
. . .
. . .
. . .
. . .
. . .
. . .
. (1.43) (0.35) (0.40) 0.73 Distributions to shareholders: From net investment income . . .
. . .
. . .
. . .
. . .
. . .
. . .
. . .
. . .
. . .
. — — (0.32) (0.40) Return of capital. . .
. . .
. . .
. . .
. . .
. . .
. . .
. . .
. . .
. . .
. . .
. . .
. . .
. . (0.39) (0.50) (0.19) (0.09) Total distributions to shareholders . .
. . .
. . .
. . .
. . .
. . .
. . .
. . .
. . (0.39) (0.50) (0.51) (0.49) Net asset value — end of period . .
. . .
. . .
. . .
. . .
. . .
. . .
. . .
. . .
. . .
. $ 6.66 $ 8.48 $ 9.33 $ 10.24 (17.16)% (3.84)% (4.12)% 7.58%(1) Ratios/supplemental data: Net assets, end of period (000s) . .
. . .
. . .
. . .
. . .
. . .
. . .
. . .
. . .
. . .
$ 125,970 Ratio of gross expense to average net assets. . .
. . .
. . .
. . .
. . .
. . .
. . . 0.98% Ratio of net expense to average net assets .
. . .
. . .
. . .
. . .
. . .
. . .
. . . 0.97% Ratio of investment income less gross expenses to average net assets .
. 5.26% Ratio of net investment income to average net assets . . .
. . .
. . .
. . .
. 5.28% Portfolio turnover rate . . .
. . .
. . .
. . .
. . .
. . .
. . .
. . .
. . .
. . .
. . .
. . . 106% Total return .
. . .
. . .
. . .
. . .
. . .
. . .
. . .
. . .
. . .
. . .
. . .
. . .
. . .
. . $ 174,827 0.96% 0.96% 5.59% 5.59% 99% $ 248,377 0.91% 0.91% 5.27% 5.27% 114% $ 118,921 1.07%(2) 0.99%(2) 5.14%(2) 5.22%(2) 91%(1) The Fund commenced operations on November 2, 2011. Payden Emerging Markets Corporate Bond Fund — Adviser Class 2015 2014 Net asset value — beginning of period . .
. . .
. . .
. . .
. . .
. . .
. . .
. . .
. . $ 10.40 $ 10.00 Income from investment activities: Net investment income .
. . .
. . .
. . .
. . .
. . .
. . .
. . .
. . .
. . .
. . .
. . .
. 0.53 0.39 Net realized and unrealized gains (losses) . . .
. . .
. . .
. . .
. . .
. . .
. . .
. (0.72) 0.41 Total from investment activities . . .
. . .
. . .
. . .
. . .
. . .
. . .
. . .
. . . (0.19) 0.80 Distributions to shareholders: From net investment income .
. . .
. . .
. . .
. . .
. . .
. . .
. . .
. . .
. . .
. . . (0.40) (0.40) From net realized gains.
. . .
. . .
. . .
. . .
. . .
. . .
. . .
. . .
. . .
. . .
. . .
. . (0.18) — Total distributions to shareholders . .
. . .
. . .
. . .
. . .
. . .
. . .
. . .
. . (0.58) (0.40) Net asset value — end of period . .
. . .
. . .
. . .
. . .
. . .
. . .
. . .
. . .
. . .
. $ 9.63 $ 10.40 Total return . .
. . .
. . .
. . .
. . .
. . .
. . .
. . .
. . .
. . .
. . .
. . .
. . .
. . .
. Ratios/supplemental data: Net assets, end of period (000s) . . .
. . .
. . .
. . .
. . .
. . .
. . .
. . .
. . .
. . $ Ratio of gross expense to average net assets.
. . .
. . .
. . .
. . .
. . .
. . .
. . Ratio of net expense to average net assets . .
. . .
. . .
. . .
. . .
. . .
. . .
. . Ratio of investment income less gross expenses to average net assets . . Ratio of net investment income to average net assets .
. . .
. . .
. . .
. . . Portfolio turnover rate .
. . .
. . .
. . .
. . .
. . .
. . .
. . .
. . .
. . .
. . .
. . .
. . (1.94)% 15 1.58% 1.20% 3.71% 4.11% 93% 8.17%(1) $ 217 1.63%(2) 1.20%(2) 3.61%(2) 4.04%(2) 100%(1) The Fund commenced operations on November 11, 2013. (1) Not annualized (2) Annualized See notes to financial statements. 132 Payden Mutual Funds . Payden Emerging Markets Corporate Bond Fund — Investor Class 2015 2014 Net asset value — beginning of period . . . .
. . .
. . .
. . .
. . .
. . .
. . .
. . .
$ 10.39 $ 10.00 Income from investment activities: Net investment income . . .
. . .
. . .
. . .
. . .
. . .
. . .
. . .
. . .
. . .
. . .
. . 0.43 0.64 Net realized and unrealized gains (losses) . .
. . .
. . .
. . .
. . .
. . .
. . .
. . (0.59) 0.18 Total from investment activities . .
. . .
. . .
. . .
. . .
. . .
. . .
. . .
. . .
. (0.16) 0.82 Distributions to shareholders: From net investment income . . .
. . .
. . .
. . .
. . .
. . .
. . .
. . .
. . .
. . .
. (0.43) (0.43) From net realized gains. . .
. . .
. . .
. . .
. . .
. . .
. . .
. . .
. . .
. . .
. . .
. . . (0.18) — Total distributions to shareholders .
. . .
. . .
. . .
. . .
. . .
. . .
. . .
. . . (0.61) (0.43) Net asset value — end of period .
. . .
. . .
. . .
. . .
. . .
. . .
. . .
. . .
. . .
. . $ 9.62 $ 10.39 Total return .
. . .
. . .
. . .
. . .
. . .
. . .
. . .
. . .
. . .
. . .
. . .
. . .
. . .
. . Ratios/supplemental data: Net assets, end of period (000s) . .
. . .
. . .
. . .
. . .
. . .
. . .
. . .
. . .
. . .
$ Ratio of gross expense to average net assets. . .
. . .
. . .
. . .
. . .
. . .
. . . Ratio of net expense to average net assets .
. . .
. . .
. . .
. . .
. . .
. . .
. . . Ratio of investment income less gross expenses to average net assets .
. Ratio of net investment income to average net assets . . .
. . .
. . .
. . .
. Portfolio turnover rate . . .
. . .
. . .
. . .
. . .
. . .
. . .
. . .
. . .
. . .
. . .
. . . (1.55)% 1,401 1.33% 0.95% 4.00% 4.39% 93% 8.31%(1) $ 1,522 1.42%(2) 0.94%(2) 3.90%(2) 4.37%(2) 100%(1) The Fund commenced operations on November 11, 2013. Payden Emerging Markets Corporate Bond Fund — SI Class 2015 2014 Net asset value — beginning of period .
. . .
. . .
. . .
. . .
. . .
. . .
. . .
. . .
$ 10.40 $ 10.00 Income from investment activities: Net investment income . . .
. . .
. . .
. . .
. . .
. . .
. . .
. . .
. . .
. . .
. . .
. . 0.45 0.44 Net realized and unrealized gains (losses) . .
. . .
. . .
. . .
. . .
. . .
. . .
. . (0.60) 0.40 Total from investment activities . .
. . .
. . .
. . .
. . .
. . .
. . .
. . .
. . .
. (0.15) 0.84 Distributions to shareholders: From net investment income . . .
. . .
. . .
. . .
. . .
. . .
. . .
. . .
. . .
. . .
. (0.44) (0.44) From net realized gains. . .
. . .
. . .
. . .
. . .
. . .
. . .
. . .
. . .
. . .
. . .
. . . (0.18) — Total distributions to shareholders .
. . .
. . .
. . .
. . .
. . .
. . .
. . .
. . . (0.62) (0.44) Net asset value — end of period .
. . .
. . .
. . .
. . .
. . .
. . .
. . .
. . .
. . .
. . $ 9.63 $ 10.40 Total return .
. . .
. . .
. . .
. . .
. . .
. . .
. . .
. . .
. . .
. . .
. . .
. . .
. . .
. . Ratios/supplemental data: Net assets, end of period (000s) . .
. . .
. . .
. . .
. . .
. . .
. . .
. . .
. . .
. . .
$ Ratio of gross expense to average net assets. . .
. . .
. . .
. . .
. . .
. . .
. . . Ratio of net expense to average net assets .
. . .
. . .
. . .
. . .
. . .
. . .
. . . Ratio of investment income less gross expenses to average net assets .
. Ratio of net investment income to average net assets . . .
. . .
. . .
. . .
. Portfolio turnover rate . . .
. . .
. . .
. . .
. . .
. . .
. . .
. . .
. . .
. . .
. . .
. . . (1.47)% 34,600 1.33% 0.85% 4.01% 4.49% 93% 8.52%(1) $ 41,662 1.39%(2) 0.85%(2) 3.89%(2) 4.43%(2) 100%(1) The Fund commenced operations on November 11, 2013. (1) Not annualized (2) Annualized See notes to financial statements. Annual Report 133 .
Financial Highlights continued For the share outstanding for the periods ended October 31st Payden Equity Income Fund - Adviser Class 2015 2014 2013 2012 Net asset value — beginning of period . . . .
. . .
. . .
. . .
. . .
. . .
. . .
. . .
$ 14.40 $ 12.64 $ 11.12 $ 10.13 Income from investment activities: Net investment income . . .
. . .
. . .
. . .
. . .
. . .
. . .
. . .
. . .
. . .
. . .
. . 0.32 0.36 0.45 0.43 Net realized and unrealized gains . .
. . .
. . .
. . .
. . .
. . .
. . .
. . .
. . .
. . 0.05 1.72 1.54 1.02 Total from investment activities . .
. . .
. . .
. . .
. . .
. . .
. . .
. . .
. . .
. 0.37 2.08 1.99 1.45 Distributions to shareholders: From net investment income . . .
. . .
. . .
. . .
. . .
. . .
. . .
. . .
. . .
. . .
. (0.36) (0.21) (0.47) (0.46) From net realized gains. . .
. . .
. . .
. . .
. . .
. . .
. . .
. . .
. . .
. . .
. . .
. . . (0.43) (0.11) — — Total distributions to shareholders .
. . .
. . .
. . .
. . .
. . .
. . .
. . .
. . . (0.79) (0.32) (0.47) (0.46) Net asset value — end of period .
. . .
. . .
. . .
. . .
. . .
. . .
. . .
. . .
. . .
. . $ 13.98 $ 14.40 $ 12.64 $ 11.12 Total return .
. . .
. . .
. . .
. . .
. . .
. . .
. . .
. . .
. . .
. . .
. . .
. . .
. . .
. . Ratios/supplemental data: Net assets, end of period (000s) . .
. . .
. . .
. . .
. . .
. . .
. . .
. . .
. . .
. . .
$ Ratio of gross expense to average net assets. . .
. . .
. . .
. . .
. . .
. . .
. . . Ratio of net expense to average net assets .
. . .
. . .
. . .
. . .
. . .
. . .
. . . Ratio of investment income less gross expenses to average net assets .
. Ratio of net investment income to average net assets . . .
. . .
. . .
. . .
. Portfolio turnover rate . . .
. . .
. . .
. . .
. . .
. . .
. . .
. . .
. . .
. . .
. . .
. . . 2.66% 4,567 1.05% 1.05% 2.29% 2.27% 48% 16.66% $ 4,742 1.08% 1.05% 2.52% 2.55% 51% 18.20% $ 4,274 1.13% 1.05% 3.68% 3.76% 86% 14.46%(1) $ 3,468 1.18%(2) 1.06%(2) 4.32%(2) 4.44%(2) 182%(1) The Class commenced operations on December 1, 2011. 2015 Net asset value — beginning of period .
. . .
. . .
. . .
. . .
. . .
. . .
. . .
. . .
$ 14.39 Income from investment activities: Net investment income . . .
. . .
. . .
. . .
. . .
. . .
. . .
. . .
. . .
. . .
. . .
. . 0.35 Net realized and unrealized gains . .
. . .
. . .
. . .
. . .
. . .
. . .
. . .
. . .
. . 0.05 Total from investment activities . .
. . .
. . .
. . .
. . .
. . .
. . .
. . .
. . .
. 0.40 Distributions to shareholders: From net investment income . . .
. . .
. . .
. . .
. . .
. . .
. . .
. . .
. . .
. . .
. (0.39) From net realized gains. . .
. . .
. . .
. . .
. . .
. . .
. . .
. . .
. . .
. . .
. . .
. . . (0.43) Total distributions to shareholders .
. . .
. . .
. . .
. . .
. . .
. . .
. . .
. . . (0.82) Net asset value — end of period .
. . .
. . .
. . .
. . .
. . .
. . .
. . .
. . .
. . .
. . $ 13.97 Total return .
. . .
. . .
. . .
. . .
. . .
. . .
. . .
. . .
. . .
. . .
. . .
. . .
. . .
. . Payden Equity Income Fund - Investor Class 2014 2013 2012 $ 12.64 $ 11.12 $ 10.11 $ 0.38 1.72 2.10 $ 0.48 1.54 2.02 0.48 1.05 1.53 0.38 1.25 1.63 (0.24) (0.11) (0.35) 14.39 (0.50) — (0.50) 12.64 (0.52) — (0.52) 11.12 (0.43) — (0.43) 10.11 $ $ 2.90% 16.88% 18.51% Ratios/supplemental data: Net assets, end of period (000s) . .
. . .
. . .
. . .
. . .
. . .
. . .
. . .
. . .
. . .
$ 281,163 Ratio of gross expense to average net assets. . .
. . .
. . .
. . .
. . .
. . .
. . . 0.80% Ratio of net expense to average net assets .
. . .
. . .
. . .
. . .
. . .
. . .
. . . 0.80% Ratio of investment income less gross expenses to average net assets .
. 2.54% Ratio of net investment income to average net assets . . .
. . .
. . .
. . .
. 2.53% Portfolio turnover rate . . .
. . .
. . .
. . .
. . .
. . .
. . .
. . .
. . .
. . .
. . .
. . . 48% $ 275,222 0.83% 0.80% 2.74% 2.77% 51% $ 211,644 0.87% 0.80% 3.91% 3.99% 86% $ 168,572 0.93% 0.80% 4.48% 4.61% 182% $ 15.40% The Fund commenced operations on November 1, 1996. (1) Not annualized (2) Annualized See notes to financial statements. 134 Payden Mutual Funds 2011 8.91 18.46% $ 63,832 0.95% 0.80% 4.03% 4.18% 167% .
Payden Equity Income Fund — SI Class 2015 2014 Net asset value — beginning of period . . . .
. . .
. . .
. . .
. . .
. . .
. . .
. . .
$ 14.39 $ 13.92 Income from investment activities: Net investment income . . .
. . .
. . .
. . .
. . .
. . .
. . .
. . .
. . .
. . .
. . .
. . 0.38 0.09 Net realized and unrealized gains . .
. . .
. . .
. . .
. . .
. . .
. . .
. . .
. . .
. . 0.04 0.46 Total from investment activities . .
. . .
. . .
. . .
. . .
. . .
. . .
. . .
. . .
. 0.42 0.55 Distributions to shareholders: From net investment income . . .
. . .
. . .
. . .
. . .
. . .
. . .
. . .
. . .
. . .
. (0.41) (0.08) From net realized gains. . .
. . .
. . .
. . .
. . .
. . .
. . .
. . .
. . .
. . .
. . .
. . . (0.43) — Total distributions to shareholders .
. . .
. . .
. . .
. . .
. . .
. . .
. . .
. . . (0.84) (0.08) Net asset value — end of period .
. . .
. . .
. . .
. . .
. . .
. . .
. . .
. . .
. . .
. . $ 13.97 $ 14.39 3.04% 3.94%(1) Ratios/supplemental data: Net assets, end of period (000s) .
. . .
. . .
. . .
. . .
. . .
. . .
. . .
. . .
. . .
. $ 277,634 Ratio of gross expense to average net assets. .
. . .
. . .
. . .
. . .
. . .
. . .
. 0.79% Ratio of net expense to average net assets . . .
. . .
. . .
. . .
. . .
. . .
. . .
. 0.65% Ratio of investment income less gross expenses to average net assets . . 2.51% Ratio of net investment income to average net assets . .
. . .
. . .
. . .
. . 2.66% Portfolio turnover rate . .
. . .
. . .
. . .
. . .
. . .
. . .
. . .
. . .
. . .
. . .
. . .
. 48% Total return . . .
. . .
. . .
. . .
. . .
. . .
. . .
. . .
. . .
. . .
. . .
. . .
. . .
. . . $ 186,735 0.83%(2) 0.65%(2) 2.48%(2) 2.64%(2) 51%(1) The Class commenced operations on August 1, 2014. (1) Not annualized (2) Annualized See notes to financial statements. Annual Report 135 .
Report of Independent Registered Public Accounting Firm To the Shareholders and Board of Trustees of The Payden & Rygel Investment Group We have audited the accompanying statements of assets and liabilities, including the schedules of investments, of Payden Cash Reserves Money Market Fund, Payden Limited Maturity Fund, Payden Low Duration Fund, Payden U.S. Government Fund, Payden GNMA Fund, Payden Core Bond Fund, Payden Corporate Bond Fund, Payden Strategic Income Fund, Payden Absolute Return Bond Fund, Payden Floating Rate Fund, Payden High Income Fund, Payden California Municipal Income Fund, Payden Global Low Duration Fund, Payden Global Fixed Income Fund, Payden Emerging Markets Bond Fund, Payden Emerging Markets Local Bond Fund, Payden Emerging Markets Corporate Bond Fund, and Payden Equity Income Fund, eighteen of the funds comprising The Payden & Rygel Investment Group (the “Funds”), as of October 31, 2015, and the related statements of operations, statements of changes in net assets and the financial highlights for each of the periods presented. These financial statements and financial highlights are the responsibility of the Funds’ management. Our responsibility is to express an opinion on these financial statements and financial highlights based on our audits. We conducted our audits in accordance with the standards of the Public Company Accounting Oversight Board (United States). Those standards require that we plan and perform the audit to obtain reasonable assurance about whether the financial statements and financial highlights are free of material misstatement.
The Funds are not required to have, nor were we engaged to perform, audits of their internal control over financial reporting. Our audits included consideration of internal control over financial reporting as a basis for designing audit procedures that are appropriate in the circumstances, but not for the purpose of expressing an opinion on the effectiveness of the Funds’ internal control over financial reporting. Accordingly, we express no such opinion.
An audit also includes examining, on a test basis, evidence supporting the amounts and disclosures in the financial statements, assessing the accounting principles used and significant estimates made by management, as well as evaluating the overall financial statement presentation. Our procedures included confirmation of securities owned as of October 31, 2015, by correspondence with the custodian, brokers and agent banks; when replies were not received from brokers and agent banks, we performed other auditing procedures. We believe that our audits provide a reasonable basis for our opinion. In our opinion, such financial statements and financial highlights referred to above present fairly, in all material respects, the financial position of each of the funds referred to above constituting The Payden & Rygel Investment Group as of October 31, 2015, the results of their operations for the period then ended, and the changes in their net assets and the financial highlights for each of the periods presented, in conformity with accounting principles generally accepted in the United States of America. /s/ DELOITTE & TOUCHE LLP Chicago, Illinois December 21, 2015 136 Payden Mutual Funds .
Fund Expenses Understanding Your Fund’s Expenses Shareholders of mutual funds, incur two types of costs: transaction costs incurred from buying or selling fund shares and ongoing costs incurred from the funds daily operations. The table below is provided to highlight ongoing cost only. If transaction costs were included your cost would have been higher. Actual Expenses The table below is useful in estimating actual expenses paid during the six-month period ended October 31, 2015. It uses each Fund’s actual return and expense ratio for the period (184/365 days) to calculate the ongoing expenses paid by a shareholder with an initial investment of $1,000.
To estimate the actual expense that you paid over the period, divide your beginning account value by 1,000 and multiply the quotient by the number in the Expenses Paid During the Period column. Value May 1, 2015 Cash Reserves Money Market. . .
. . .
. . .
. . .
. . .
. . .
. . .
. . .
. . .
. . .
. . .
. . .
. . .
. . .
. . .
. . .
. . $1,000.00 Limited Maturity .
. . .
. . .
. . .
. . .
. . .
. . .
. . .
. . .
. . .
. . .
. . .
. . .
. . .
. . .
. . .
. . .
. . .
. . .
. . .
. . .
1,000.00 Low Duration . . .
. . .
. . .
. . .
. . .
. . .
. . .
. . .
. . .
. . .
. . .
. . .
. . .
. . .
. . .
. . .
. . .
. . .
. . .
. . .
. . .
. 1,000.00 U.S. Government Adviser Class .
. . .
. . .
. . .
. . .
. . .
. . .
. . .
. . .
. . .
. . .
. . .
. . .
. . .
. . .
. . .
. 1,000.00 U.S. Government Investor Class .
. . .
. . .
. . .
. . .
. . .
. . .
. . .
. . .
. . .
. . .
. . .
. . .
. . .
. . .
. . .
. 1,000.00 GNMA Adviser Class . .
. . .
. . .
. . .
. . .
. . .
. . .
. . .
. . .
. . .
. . .
. . .
. . .
. . .
. . .
. . .
. . .
. . .
. . .
. 1,000.00 GNMA Investor Class . .
. . .
. . .
. . .
. . .
. . .
. . .
. . .
. . .
. . .
. . .
. . .
. . .
. . .
. . .
. . .
. . .
. . .
. . .
1,000.00 Core Bond Adviser Class . . .
. . .
. . .
. . .
. . .
. . .
. . .
. . .
. . .
. . .
. . .
. . .
. . .
. . .
. . .
. . .
. . .
. . .
1,000.00 Core Bond Investor Class. . .
. . .
. . .
. . .
. . .
. . .
. . .
. . .
. . .
. . .
. . .
. . .
. . .
. . .
. . .
. . .
. . .
. . .
1,000.00 Corporate Bond. . .
. . .
. . .
. . .
. . .
. . .
. . .
. . .
. . .
. . .
. . .
. . .
. . .
. . .
. . .
. . .
. . .
. . .
. . .
. . .
. . .
1,000.00 Strategic Income Adviser Class . . .
. . .
. . .
. . .
. . .
. . .
. . .
. . .
. . .
. . .
. . .
. . .
. . .
. . .
. . .
. . .
1,000.00 Strategic Income Investor Class . . .
. . .
. . .
. . .
. . .
. . .
. . .
. . .
. . .
. . .
. . .
. . .
. . .
. . .
. . .
. . .
1,000.00 Strategic Income SI Class. . .
. . .
. . .
. . .
. . .
. . .
. . .
. . .
. . .
. . .
. . .
. . .
. . .
. . .
. . .
. . .
. . .
. . .
1,000.00 Absolute Return Bond Adviser Class. . .
. . .
. . .
. . .
. . .
. . .
. . .
. . .
. . .
. . .
. . .
. . .
. . .
. . .
. 1,000.00 Absolute Return Bond Investor Class . .
. . .
. . .
. . .
. . .
. . .
. . .
. . .
. . .
. . .
. . .
. . .
. . .
. . .
. 1,000.00 Absolute Return Bond SI Class . .
. . .
. . .
. . .
. . .
. . .
. . .
. . .
. . .
. . .
. . .
. . .
. . .
. . .
. . .
. . .
. 1,000.00 Floating Rate Adviser Class . .
. . .
. . .
. . .
. . .
. . .
. . .
. . .
. . .
. . .
. . .
. . .
. . .
. . .
. . .
. . .
. . .
. 1,000.00 Floating Rate Investor Class . .
. . .
. . .
. . .
. . .
. . .
. . .
. . .
. . .
. . .
. . .
. . .
. . .
. . .
. . .
. . .
. . .
. 1,000.00 Floating Rate SI Class. .
. . .
. . .
. . .
. . .
. . .
. . .
. . .
. . .
. . .
. . .
. . .
. . .
. . .
. . .
. . .
. . .
. . .
. . .
. 1,000.00 High Income Adviser Class. .
. . .
. . .
. . .
. . .
. . .
. . .
. . .
. . .
. . .
. . .
. . .
. . .
. . .
. . .
. . .
. . .
. . 1,000.00 High Income Investor Class .
. . .
. . .
. . .
. . .
. . .
. . .
. . .
. . .
. . .
. . .
. . .
. . .
. . .
. . .
. . .
. . .
. . 1,000.00 California Municipal Income .
. . .
. . .
. . .
. . .
. . .
. . .
. . .
. . .
. . .
. . .
. . .
. . .
. . .
. . .
. . .
. . .
. 1,000.00 Global Low Duration . .
. . .
. . .
. . .
. . .
. . .
. . .
. . .
. . .
. . .
. . .
. . .
. . .
. . .
. . .
. . .
. . .
. . .
. . .
. 1,000.00 Global Fixed Income. .
. . .
. . .
. . .
. . .
. . .
. . .
. . .
. . .
. . .
. . .
. . .
. . .
. . .
. . .
. . .
. . .
. . .
. . .
. . 1,000.00 Emerging Markets Bond Adviser Class.
. . .
. . .
. . .
. . .
. . .
. . .
. . .
. . .
. . .
. . .
. . .
. . .
. . .
. 1,000.00 Emerging Markets Bond Investor Class . .
. . .
. . .
. . .
. . .
. . .
. . .
. . .
. . .
. . .
. . .
. . .
. . .
. . 1,000.00 Emerging Markets Bond SI Class .
. . .
. . .
. . .
. . .
. . .
. . .
. . .
. . .
. . .
. . .
. . .
. . .
. . .
. . .
. . .
1,000.00 Emerging Markets Local Bond Adviser Class . . .
. . .
. . .
. . .
. . .
. . .
. . .
. . .
. . .
. . .
. . .
. . 1,000.00 Emerging Markets Local Bond Investor Class.
. . .
. . .
. . .
. . .
. . .
. . .
. . .
. . .
. . .
. . .
. . .
. 1,000.00 Emerging Markets Corporate Bond Adviser Class. .
. . .
. . .
. . .
. . .
. . .
. . .
. . .
. . .
. . .
. . 1,000.00 Emerging Markets Corporate Bond Investor Class .
. . .
. . .
. . .
. . .
. . .
. . .
. . .
. . .
. . .
. . 1,000.00 Emerging Markets Corporate Bond SI Class .
. . .
. . .
. . .
. . .
. . .
. . .
. . .
. . .
. . .
. . .
. . .
. . 1,000.00 Equity Income Adviser Class .
. . .
. . .
. . .
. . .
. . .
. . .
. . .
. . .
. . .
. . .
. . .
. . .
. . .
. . .
. . .
. . .
. 1,000.00 Equity Income Investor Class. .
. . .
. . .
. . .
. . .
. . .
. . .
. . .
. . .
. . .
. . .
. . .
. . .
. . .
. . .
. . .
. . .
1,000.00 Equity Income SI Class. . .
. . .
. . .
. . .
. . .
. . .
. . .
. . .
. . .
. . .
. . .
. . .
. . .
. . .
. . .
. . .
. . .
. . .
. . 1,000.00 Value October 31, 2015 $1,000.00 998.40 998.70 998.70 1,000.00 998.10 999.30 996.30 997.50 997.70 999.80 1,002.10 1,004.91 1,001.70 1,002.80 1,004.50 1,000.30 1,001.40 1,002.90 983.60 982.20 1,011.70 997.00 996.10 972.40 973.50 973.80 894.50 895.60 974.30 977.50 978.00 998.00 999.30 1,000.10 6-Month Return Expense Ratio 0.00% (0.16)% (0.13)% (0.13)% 0.00% (0.19)% (0.07)% (0.37)% (0.25)% (0.23)% (0.02)% 0.11% 0.29% 0.17% 0.28% 0.45% 0.03% 0.14% 0.29% (1.64)% (1.78)% 1.17% (0.30)% (0.39)% (2.76)% (2.65)% (2.62)% (10.55)% (10.44)% (2.57)% (2.25)% (2.20)% (0.20)% (0.07)% 0.01% Expenses Paid 0.10% $0.51 0.29% 1.46 0.47% 2.37 0.70% 3.53 0.45% 2.27 0.75% 3.78 0.50% 2.52 0.79% 3.97 0.54% 2.72 0.65% 3.26 1.05% 5.29 0.80% 4.04 0.65% 3.29 0.94% 4.74 0.69% 3.47 0.58% 2.94 1.00% 5.05 0.75% 3.78 0.65% 3.28 0.90% 4.49 0.65% 3.26 0.55% 2.79 0.55% 2.78 0.65% 3.27 1.01% 5.01 0.76% 3.76 0.69% 3.43 1.22% 5.82 0.97% 4.63 1.20% 5.96 0.95% 4.74 0.85% 4.24 1.06% 5.32 0.81% 4.07 0.65% 3.28 Annual Report 137 .
Fund Expenses continued Hypothetical Expenses The table below is provided so that you can compare a Fund’s ongoing expenses with those of another fund. It uses a hypothetical gross annual return of 5%, which is not the Fund’s actual return, and each Fund’s actual expense ratio (184/365 days) for the sixmonth period ended October 31, 2015 to calculate the ongoing expenses paid by a shareholder with an initial investment of $1,000. Value May 1, 2015 Cash Reserves Money Market. . .
. . .
. . .
. . .
. . .
. . .
. . .
. . .
. . .
. . .
. . .
. . .
. . .
. . .
. . .
. . .
. . $1,000.00 Limited Maturity .
. . .
. . .
. . .
. . .
. . .
. . .
. . .
. . .
. . .
. . .
. . .
. . .
. . .
. . .
. . .
. . .
. . .
. . .
. . .
. . .
1,000.00 Low Duration . . .
. . .
. . .
. . .
. . .
. . .
. . .
. . .
. . .
. . .
. . .
. . .
. . .
. . .
. . .
. . .
. . .
. . .
. . .
. . .
. . .
. 1,000.00 U.S. Government Adviser Class .
. . .
. . .
. . .
. . .
. . .
. . .
. . .
. . .
. . .
. . .
. . .
. . .
. . .
. . .
. . .
. 1,000.00 U.S. Government Investor Class .
. . .
. . .
. . .
. . .
. . .
. . .
. . .
. . .
. . .
. . .
. . .
. . .
. . .
. . .
. . .
. 1,000.00 GNMA Adviser Class . .
. . .
. . .
. . .
. . .
. . .
. . .
. . .
. . .
. . .
. . .
. . .
. . .
. . .
. . .
. . .
. . .
. . .
. . .
. 1,000.00 GNMA Investor Class . .
. . .
. . .
. . .
. . .
. . .
. . .
. . .
. . .
. . .
. . .
. . .
. . .
. . .
. . .
. . .
. . .
. . .
. . .
1,000.00 Core Bond Adviser Class . . .
. . .
. . .
. . .
. . .
. . .
. . .
. . .
. . .
. . .
. . .
. . .
. . .
. . .
. . .
. . .
. . .
. . .
1,000.00 Core Bond Investor Class. . .
. . .
. . .
. . .
. . .
. . .
. . .
. . .
. . .
. . .
. . .
. . .
. . .
. . .
. . .
. . .
. . .
. . .
1,000.00 Corporate Bond. . .
. . .
. . .
. . .
. . .
. . .
. . .
. . .
. . .
. . .
. . .
. . .
. . .
. . .
. . .
. . .
. . .
. . .
. . .
. . .
. . .
1,000.00 Strategic Income Adviser Class . . .
. . .
. . .
. . .
. . .
. . .
. . .
. . .
. . .
. . .
. . .
. . .
. . .
. . .
. . .
. . .
1,000.00 Strategic Income Investor Class . . .
. . .
. . .
. . .
. . .
. . .
. . .
. . .
. . .
. . .
. . .
. . .
. . .
. . .
. . .
. . .
1,000.00 Strategic Income SI Class. . .
. . .
. . .
. . .
. . .
. . .
. . .
. . .
. . .
. . .
. . .
. . .
. . .
. . .
. . .
. . .
. . .
. . .
1,000.00 Absolute Return Bond Adviser Class. . .
. . .
. . .
. . .
. . .
. . .
. . .
. . .
. . .
. . .
. . .
. . .
. . .
. . .
. 1,000.00 Absolute Return Bond Investor Class . .
. . .
. . .
. . .
. . .
. . .
. . .
. . .
. . .
. . .
. . .
. . .
. . .
. . .
. 1,000.00 Absolute Return Bond SI Class . .
. . .
. . .
. . .
. . .
. . .
. . .
. . .
. . .
. . .
. . .
. . .
. . .
. . .
. . .
. . .
. 1,000.00 Floating Rate Bond Adviser Class . .
. . .
. . .
. . .
. . .
. . .
. . .
. . .
. . .
. . .
. . .
. . .
. . .
. . .
. . .
. 1,000.00 Floating Rate Bond Investor Class . .
. . .
. . .
. . .
. . .
. . .
. . .
. . .
. . .
. . .
. . .
. . .
. . .
. . .
. . .
. 1,000.00 Floating Rate Bond SI Class . .
. . .
. . .
. . .
. . .
. . .
. . .
. . .
. . .
. . .
. . .
. . .
. . .
. . .
. . .
. . .
. . .
. 1,000.00 High Income Adviser Class. .
. . .
. . .
. . .
. . .
. . .
. . .
. . .
. . .
. . .
. . .
. . .
. . .
. . .
. . .
. . .
. . .
. . 1,000.00 High Income Investor Class .
. . .
. . .
. . .
. . .
. . .
. . .
. . .
. . .
. . .
. . .
. . .
. . .
. . .
. . .
. . .
. . .
. . 1,000.00 California Municipal Income .
. . .
. . .
. . .
. . .
. . .
. . .
. . .
. . .
. . .
. . .
. . .
. . .
. . .
. . .
. . .
. . .
. 1,000.00 Global Low Duration . .
. . .
. . .
. . .
. . .
. . .
. . .
. . .
. . .
. . .
. . .
. . .
. . .
. . .
. . .
. . .
. . .
. . .
. . .
. 1,000.00 Global Fixed Income. .
. . .
. . .
. . .
. . .
. . .
. . .
. . .
. . .
. . .
. . .
. . .
. . .
. . .
. . .
. . .
. . .
. . .
. . .
. . 1,000.00 Emerging Markets Bond Adviser Class.
. . .
. . .
. . .
. . .
. . .
. . .
. . .
. . .
. . .
. . .
. . .
. . .
. . .
. 1,000.00 Emerging Markets Bond Investor Class . .
. . .
. . .
. . .
. . .
. . .
. . .
. . .
. . .
. . .
. . .
. . .
. . .
. . 1,000.00 Emerging Markets Bond SI Class .
. . .
. . .
. . .
. . .
. . .
. . .
. . .
. . .
. . .
. . .
. . .
. . .
. . .
. . .
. . .
1,000.00 Emerging Markets Local Bond Adviser Class . . .
. . .
. . .
. . .
. . .
. . .
. . .
. . .
. . .
. . .
. . .
. . 1,000.00 Emerging Markets Local Bond Investor Class.
. . .
. . .
. . .
. . .
. . .
. . .
. . .
. . .
. . .
. . .
. . .
. 1,000.00 Emerging Markets Corporate Bond Adviser Class. .
. . .
. . .
. . .
. . .
. . .
. . .
. . .
. . .
. . .
. . 1,000.00 Emerging Markets Corporate Bond Investor Class .
. . .
. . .
. . .
. . .
. . .
. . .
. . .
. . .
. . .
. . 1,000.00 Emerging Markets Corporate Bond SI Class .
. . .
. . .
. . .
. . .
. . .
. . .
. . .
. . .
. . .
. . .
. . .
. . 1,000.00 Equity Income Adviser Class .
. . .
. . .
. . .
. . .
. . .
. . .
. . .
. . .
. . .
. . .
. . .
. . .
. . .
. . .
. . .
. . .
. 1,000.00 Equity Income Investor Class. .
. . .
. . .
. . .
. . .
. . .
. . .
. . .
. . .
. . .
. . .
. . .
. . .
. . .
. . .
. . .
. . .
1,000.00 Equity Income SI Class. . .
. . .
. . .
. . .
. . .
. . .
. . .
. . .
. . .
. . .
. . .
. . .
. . .
. . .
. . .
. . .
. . .
. . .
. . 1,000.00 138 Payden Mutual Funds Value October 31, 2015 $1,024.70 1,023.74 1,022.84 1,021.68 1,022.94 1,021.42 1,022.68 1,021.23 1,022.49 1,021.94 1,019.91 1,021.17 1,021.93 1,020.47 1,021.74 1,022.27 1,020.15 1,021.42 1,021.93 1,020.68 1,021.91 1,022.43 1,022.42 1,021.93 1,020.12 1,021.39 1,021.73 1,019.06 1,020.32 1,019.16 1,020.41 1,020.92 1,019.88 1,021.14 1,022.95 6-Month Return 2.47% 2.37% 2.28% 2.17% 2.29% 2.14% 2.27% 2.12% 2.25% 2.19% 1.99% 2.12% 2.19% 2.05% 2.17% 2.23% 2.02% 2.14% 2.19% 2.07% 2.19% 2.24% 2.24% 2.19% 2.01% 2.14% 2.17% 1.91% 2.03% 1.92% 2.04% 2.09% 1.99% 2.11% 2.19% Expense Ratio Expenses Paid 0.10% $0.52 0.29% 1.48 0.47% 2.40 0.70% 3.57 0.45% 2.29 0.75% 3.82 0.50% 2.55 0.79% 4.02 0.54% 2.75 0.65% 3.30 1.05% 5.34 0.80% 4.08 0.65% 3.31 0.94% 4.78 0.69% 3.50 0.58% 2.97 1.00% 5.10 0.75% 3.82 0.65% 3.31 0.90% 4.57 0.65% 3.33 0.55% 2.80 0.55% 2.82 0.65% 3.32 1.01% 5.14 0.76% 3.85 0.69% 3.52 1.22% 6.20 0.97% 4.94 1.20% 6.10 0.95% 4.84 0.85% 4.33 1.06% 5.38 0.81% 4.11 0.65% 3.32 .
Approval of Investment Advisory Agreement 1. Background Among its other duties, the Board of Trustees (the “Board” or the “Trustees”) of The Payden & Rygel Investment Group (the “P&R Trust”) is responsible for determining whether to initially approve, and subsequently annually renew, the investment management agreement (the “Agreement”) between Payden & Rygel (“Adviser”) and the Trust on behalf of each of the eighteen series covered by this Report (each a “Paydenfund” and collectively, the “Paydenfunds”). Under the Agreement, the Adviser is responsible for providing investment advisory services and overseeing the everyday operations and other service providers of the Paydenfunds. Section 15(c) of the Investment Company Act of 1940 (the “1940 Act”) requires that, after an initial period of up to two years, the Agreement for each Paydenfund will remain in effect only if the Board, including a majority of those Trustees who have no direct or indirect interest in the Agreement, and who are not “interested persons” of the Trust, as that term is defined in the 1940 Act (each an “Independent Trustee,” and collectively, “Independent Trustees”), annually renews that Agreement. Six of the Trust’s nine Trustees are deemed to be Independent Trustees for this purpose. On June 16, 2015, the Board of Trustees of the P&R Trust unanimously approved the Agreement between the Adviser and the P&R Trust with respect to seventeen of the Paydenfunds1 for an additional year through June 30, 2016.
The Board approved the Agreement following the recommendation of the Board’s Audit Committee (the “Committee”), which is composed of all of the P&R Trust’s Independent Trustees. In reaching these decisions, the Board took into account information furnished to it throughout the year at meetings of the Board and the Board’s committees, as well as extensive information prepared specifically in connection with the annual renewal process. Determinations by the Independent Trustees also took into account various factors that they believed, in light of the legal advice furnished to them by Paul Hastings LLP (“Paul Hastings”), their independent legal counsel, and their own business judgment, to be relevant. Earlier, on June 17, 2014, the Committee and the Board unanimously approved the Agreement between the Adviser and the P&R Trust with respect to the eighteenth Paydenfund, the Payden Absolute Return Bond Fund, for an initial two-year period.
In considering the approval of the Adviser for this Paydenfund, the Board and Committee considered the same factors discussed below with respect to the renewal of the Agreement for the other seventeen Paydenfunds, i.e., nature, extent and quality of services to be provided, advisory fee comparisons, total expense comparisons, cost and profitability, including economies of scale, and finally other benefits. However, no performance or other portfolio data was provided with respect to the Payden Absolute Return Bond Fund because it did not commence operations until November 6, 2014. 2. Overview of the Approval or Renewal Process In considering the annual renewal with respect to each of the seventeen Paydenfunds listed above in footnote 1, the Board followed its previously established process.
As part of this process, the Board delegates the initial responsibility for this process and related tasks to its Audit Committee (the “Committee”). These tasks include working with the Adviser and Paul Hastings (1) to develop Section 15(c)-related guidelines and specific requests with respect to the type of information to be provided to the Committee and the Board in connection with the proposed contract renewals, and (2) to evaluate the information provided in response to these guidelines and requests. [1] The Paydenfunds covered by this approval are the Payden Cash Reserves Money Market, Payden Limited Maturity, Payden Low Duration, Payden U.S. Government, Payden GNMA, Payden Core Bond, Payden Strategic Income, Payden Corporate Bond, Payden High Income, Payden Floating Rate, Payden California Municipal Income, Payden Global Low Duration, Payden Global Fixed Income, Payden Emerging Markets Bond, Payden Emerging Markets Local Bond, Payden Emerging Markets Corporate Bond and Payden Equity Income Funds. 139 .
Approval of Investment Advisory Agreement continued Consistent with its established process, the P&R Trust retained Lipper, Inc. (“Lipper”) to prepare a report on each Paydenfund to assist the Committee and the Board in its deliberations. Lipper is an independent provider of investment company data that is widely recognized as a leading source of independent data used by independent directors and trustees of investment companies during their advisory contract review processes. Lipper produced, among other information, performance and expense comparison data regarding each Paydenfund, including data relating to each Paydenfund’s advisory fee rates, total expense ratios, short-term and long-term investment performance, and portfolio turnover rates. Lipper also compared much of this data for each Paydenfund against a universe of investment companies and against a more selective peer group of mutual funds with similar investment objectives and strategies, each of which was selected by Lipper, and, in the case of the investment performance data, against one or more appropriate broad-based benchmark indices.
In each case, Lipper summarized the methodologies it employed to provide the data contained in its reports. In addition, Lipper represented to the Board that its reports were designed specifically to provide the Board with the fee, expense and performance information that is necessary to help the Board satisfy its duties under Section 15(c) of the 1940 Act. Lipper also represented that it, and not the Adviser, had identified the selected comparative peer groups and universes, and that it did so in a manner that was not intended to produce biased results for its clients. In advance of the Board meeting held on June 16, 2015, Paul Hastings requested on behalf of the Committee and the Board, and the Adviser provided, extensive information that was designed to assist the Committee and the Board in their consideration of whether to renew the Agreement for each Paydenfund.
In addition to the data provided by Lipper as described above, this information included, but was not limited to, the following: (1) the nature, extent and quality of services provided or to be provided by the Adviser to the Paydenfund; (2) the Paydenfund’s investment performance; (3) the costs of the services provided to the Paydenfund and the profits realized or potential profits to be realized (if any) by the Adviser and its affiliates from their relationship with the Paydenfund; (4) fees charged by other investment advisers; (5) the extent to which economies of scale have been realized or are anticipated to be realized as the Paydenfund grows; (6) whether the fee schedule set forth in the Agreement reflects any such economies of scale for the benefit of Fund investors; (7) comparisons of services and fee rates with any contracts entered into by the Adviser with other clients to whom the Adviser provides comparable services; and (8) any other benefits derived or anticipated to be derived by the Adviser or its affiliates from their relationship with the Paydenfund. As a general matter, the Board viewed these factors in their totality, with no single factor being the principal factor in determining whether to approve or renew the Agreement. In reaching its decisions regarding the renewal of the Agreement for each Paydenfund, the Board took into account the information described above, other information provided to the Board in connection with this process, and relevant information provided to the Board and to its Committees on an ongoing basis in connection with the Board’s general oversight duties with respect to the Paydenfunds. In addition, the Board received and considered information from Paul Hastings as to certain relevant guidelines that relate to the approval or renewal process under Section 15(c) of the 1940 Act.
While the Board considered the Agreement with respect to all Paydenfunds, the Board received and considered fund-specific information and made its approval or renewal determinations on a fund-by-fund basis. In deciding whether to renew the Agreement for each Paydenfund, each Trustee may have accorded different weight to different factors, and thus, each Trustee may have had a different basis for his or her ultimate decision to vote to renew the Agreement for each Paydenfund. At its meeting on June 16, 2015, the Board voted unanimously to renew the Agreement for each Paydenfund listed above.
Set forth below are certain general factors the Board considered for all of the Paydenfunds, followed by a summary of certain specific factors the Board considered for each particular Paydenfund. 3. Nature, Extent and Quality of Services The Board and Committee considered a number of factors related to the services provided by the Adviser, including the breadth and depth of the Adviser’s investment advisory process, the experience, expertise and quality of the Adviser’s investment professionals, the experience, leadership ability and integrity of the Adviser’s senior management, the long tenure of its key personnel, and the overall financial strength, stability and viability of the Adviser. They also considered the Adviser’s ability and commitment to attract and retain qualified personnel, and its commitment to maintain and enhance its investment advisory resources and information technology systems.
The Board and Committee further considered the Adviser’s strong commitment to compliance with applicable laws and 140 . regulations and the nature and extent of its compliance program and records. Finally, they took into account the administrative, distribution and shareholder services that the Adviser or its affiliates provided each Paydenfund under the Agreement and other agreements. Based on the foregoing, the Board and Committee concluded that the investment advisory and related services provided by the Adviser and its affiliates have benefited and should continue to benefit each Paydenfund and its shareholders. 4. Investment Results At its regular quarterly Board meetings during the past year, the Board reviewed the investment results of each Paydenfund compared to its respective peers and benchmark indices, paying specific attention to any Paydenfund whose performance did not measure up to the Adviser’s expectations and to the Adviser’s plan to deal with that situation.
In addition, as a part of the annual review of the Agreement, the Board and Committee specifically reviewed a report prepared by Lipper, which contained each Paydenfund’s performance for various time periods, i.e., 1-year, 3-years, 5-years and 10-years, as compared to the performance of (1) a group of comparable mutual funds (the “Peer Group”) selected by Lipper, and (2) each Paydenfund’s benchmark index. The Board and Committee concluded that overall the short-term and long-term results for each of the seventeen Paydenfunds have been satisfactory and that each of the seventeen Paydenfunds is performing competitively versus its Peer Group and benchmark index. Following the discussion of the performance of the seventeen Paydenfunds, the Board and Committee concluded that the Adviser’s continued management should benefit each Paydenfund and its shareholders. 5.
Advisory Fees and Total Expenses The Board and the Committee reviewed each Paydenfund’s net operating expense ratio and its various fee and expense components, and compared those fees and expenses to the fee and expense information for the Peer Group for each Paydenfund. They observed that the advisory fees and expenses for each Paydenfund continue to be competitive with the advisory fees and expenses of its Peer Group. The Board and Committee also reviewed information regarding the advisory fees paid by other registered investment companies, pension funds and other institutional clients of the Adviser with respect to similar investment mandates as each of the Paydenfunds. They noted that, although the fees paid by those clients generally were lower than those paid by each Paydenfund, the differences appropriately reflected the significant investment, operational and regulatory differences between advising mutual funds and separately managed institutional accounts. Overall, the Board and Committee concluded that each Paydenfund’s cost structure was fair and reasonable in relation to the services provided, and that each Paydenfund’s shareholders received reasonable value in return for the advisory fees and other amounts paid to the Adviser or its affiliates by the Paydenfund. 6.
Adviser Profitability and Indirect Benefits The Board and Committee reviewed information at the P&R Trust level regarding the Adviser’s cost of providing services to the Paydenfunds, as well as the resulting level of profits to the Adviser. They further reviewed the cost allocation methodology used to determine the Adviser’s profitability of providing services to the Paydenfunds, as well as possible economies of scale that might be achieved. Based on that review, the Board and Committee concluded that the profits earned by the Adviser were not excessive in view of the advisory, administrative and other services provided to the Paydenfunds.
Finally, the Board and Committee noted that the Adviser indirectly benefited from its advisory relationship with the Paydenfunds by its ability to invest more efficiently the assets of small, separately managed accounts in the Paydenfunds, and because the availability of the Paydenfunds enhanced the Adviser’s business reputation and name recognition. 7. Fund-by-Fund Factors The Board considered the following specific factors (among others) in connection with its determination to renew the Agreement with respect to each Paydenfund. If a Paydenfund is described in the following discussions as being in the “1st” quintile, it is in the best of five groups (that is, the group has the best performance or the lowest expenses, as the case may be).
References below to quintiles are based on data provided to the Board in the reports prepared by Lipper. The specific management fee, expense and performance factors outlined below are based on the Investor Class shares of each Paydenfund. Because the Investor Class generally has lower nonmanagement expenses than the Adviser Class of these Funds, the expenses and performance of the Adviser Class will differ from the expenses and performance shown for the Investor Class.
All time periods referenced below ended as of April 30, 2015. 141 . Approval of Investment Advisory Agreement continued Cash Reserves Money Market Fund • Adviser Fee: The Adviser’s annual contractual management fee rate for the Fund is 0.15%, placing it in the 2nd quintile of the group of comparable funds for adviser fees. • Total Expenses: The Fund’s total expenses were in the 1st quintile of the group of comparable funds selected by Lipper for expense comparison purposes. The Adviser has contractually agreed to waive its investment advisory fee or reimburse Fund expenses to the extent that Total Annual Fund Operating Expenses After Fee Waiver or Expense Reimbursement exceed 0.25%. This agreement has a one-year term ending February 28, 2016. It may or may not be renewed. • Performance: The Fund was in the 1st quintile of the group of comparable funds in the one-, five- and ten-year periods, and in the 2nd quintile for the 3-year period. Limited Maturity Fund • Adviser Fee: The Adviser’s annual contractual management fee rate for the Fund is 0.28%, placing it in the 4th quintile of the group of comparable funds for adviser fees. • Total Expenses: The Fund’s total expenses were in the 2nd quintile of the group of comparable funds.
The Adviser has contractually agreed to waive its investment advisory fee or reimburse Fund expenses to the extent that Total Annual Fund Operating Expenses After Fee Waiver or Expense Reimbursement exceed 0.29%. This agreement has a one-year term ending February 28, 2016. It may or may not be renewed. • Performance: The Fund was in the 1st quintile of the group of comparable funds for the one-year period, the 2nd quintile for the three-year period, the 3rd quintile for the five-year period, and the 5th quintile for the ten-year period. Low Duration Fund • Adviser Fee: The Adviser’s annual contractual management fee rate for the Fund is 0.28%, placing it in the 4th quintile of the group of comparable funds for adviser fees. • Total Expenses: The Fund’s total expenses were in the 2nd quintile of the group of comparable funds.
The Adviser has contractually agreed to waive its investment advisory fee or reimburse Fund expenses to the extent that Total Annual Fund Operating Expenses After Fee Waiver or Expense Reimbursement exceed 0.47%. This agreement has a one-year term ending February 28, 2016. It may or may not be renewed. • Performance: The Fund was in the 2nd quintile of the group of comparable funds for the one-, three- and ten-year periods, and the 3rd quintile for the five-year period. U.S.
Government Fund • Adviser Fee: The Adviser’s annual contractual management fee rate for the Fund is 0.28%, placing it in the 3rd quintile of the group of comparable funds for adviser fees.. • Total Expenses: The Fund’s total expenses were in the 1st quintile of the group of comparable funds. The Adviser has contractually agreed to waive its investment advisory fee or reimburse Fund expenses to the extent that Total Annual Fund Operating Expenses After Fee Waiver or Expense Reimbursement exceed 0.45%. This agreement has a one-year term ending February 28, 2016.
It may or may not be renewed. • Performance: The Fund was in the 1st quintile of the group of comparable funds for the one- and three-year periods, and the 2nd quintile for the five- and ten-year periods. 142 . GNMA Fund • Adviser Fee: The Adviser’s annual contractual management fee rate for the Fund is 0.27%, placing it in the 2nd quintile of the group of comparable funds for adviser fees.. • Total Expenses: The Fund’s total expenses were in the 1st quintile of the group of comparable funds. The Adviser has contractually agreed that for so long as it is the investment adviser to the Fund, the Total Annual Fund Operating Expenses will not exceed 0.50%. • Performance: The Fund was in the 1st quintile of the group of comparable funds for the one- and five-year periods, and the 2nd quintile for the three- and ten-year periods.. Core Bond Fund • Adviser Fee: The Adviser’s annual contractual management fee rate for the Fund is 0.28%, placing it in the 2nd quintile of the group of comparable funds for adviser fees. • Total Expenses: The Fund’s total expenses were in the 2nd quintile of the group of comparable funds. • Performance: The Fund was in the 1st quintile of the group of comparable funds for the one- and three-year periods, and the 2nd quintile for the five- and ten-year periods. Strategic Income Fund • Adviser Fee: The Adviser’s annual contractual management fee rate for the Fund is 0.55%, placing it in the 1st quintile of the group of comparable funds for adviser fees. • Total Expenses: The Fund’s total expenses were in the 1st quintile of the group of comparable funds. • Performance: The Fund was in the 2nd quintile of the group of comparable funds for the one-year period. The Fund began operations on May 8, 2014. Corporate Bond Fund • Adviser Fee: The Adviser’s annual contractual management fee rate for the Fund is 0.35%, placing it in the 2nd quintile of the Expense Group for adviser fees. • Total Expenses: The Fund’s total expenses were in the 3rd quintile of the Expense Group. The Adviser has contractually agreed to waive its investment advisory fee or reimburse Fund expenses to the extent that Total Annual Fund Operating Expenses After Fee Waiver or Expense Reimbursement exceed 0.67%.
This agreement has a one-year term ending February 28, 2016. It may or may not be renewed. • Performance: The Fund was in the 1st quintile of the Performance Group for the one- and 3-year periods, and the 2nd quintile for the for five-year period. The Fund began operations on March 12, 2009. High Income Fund • Adviser Fee: The Adviser’s annual contractual management fee rate for the Fund is 0.35%, placing it in the 2nd quintile of the group of comparable funds for adviser fees. •Total Expenses: The Fund’s total expenses were in the 2nd quintile of the group of comparable funds. • Performance: The Fund was in the 2nd quintile of the group of comparable funds for the one-year period, 4th quintile for the threeyear, 3rd quintile for the five-year period, and the 5th quintile for the ten-year period. 143 .
Approval of Investment Advisory Agreement continued Floating Rate Fund • Adviser Fee: The Adviser’s annual contractual management fee rate for the Fund is 0.55%, placing it in the 3rd quintile of the group of comparable funds for adviser fees. • Total Expenses: The Fund’s total expenses were in the 3rd quintile of the group of comparable funds. The Adviser has contractually agreed to waive its investment advisory fee or reimburse Fund expenses to the extent that Total Annual Fund Operating Expenses After Fee Waiver or Expense Reimbursement exceed 0.75%. This agreement has a one-year term ending February 28, 2016. It may or may not be renewed. • Performance: The Fund was in the 1st quintile of the group of comparable funds for the one-year period.
It began operations on November 11, 2013. California Municipal Income Fund • Adviser Fee: The Adviser’s annual contractual management fee rate for the Fund is 0.32%, placing it in the 3rd quintile of the Expense Group for adviser fees. • Total Expenses: The Fund’s total expenses were in the 4th quintile of the group of comparable funds. The Adviser has contractually agreed to waive its investment advisory fee or reimburse Fund expenses to the extent that Total Annual Fund Operating Expenses After Fee Waiver or Expense Reimbursement exceed 0.55%. This agreement has a one-year term ending February 28, 2016.
It may or may not be renewed. • Performance: The Fund was in the 3rd quintile of the group of comparable funds for the one-, five- and 10-year periods, and the 2nd quintile for the three-year period. Global Low Duration Fund • Adviser Fee: The Adviser’s annual contractual management fee rate for the Fund is 0.30%, placing it in the 3rd quintile of the group of comparable funds for adviser fees. • Total Expenses: The Fund’s total expenses were in the 1st quintile of the group of comparable funds. The Adviser has contractually agreed to waive its investment advisory fee or reimburse Fund expenses to the extent that Total Annual Fund Operating Expenses After Fee Waiver or Expense Reimbursement exceed 0.55%. This agreement has a one-year term ending February 28, 2016.
It may or may not be renewed. • Performance: The Fund was in the 2nd quintile of the group of comparable funds for the 1-year period, the 3rd quintile for the three-year period, the 4th quintile for the five-year period, and the 5th quintile for the and ten-year period. Global Fixed Income Fund • Adviser Fee: The Adviser’s annual contractual management fee rate for the Fund is 0.30%, placing it in the 1st quintile of the group of comparable funds for adviser fees. • Total Expenses: The Fund’s total expenses were in the 2nd quintile of the group of comparable funds. The Adviser has contractually agreed that for so long as it is the investment adviser to the Fund, the Total Annual Fund Operating Expenses will not exceed 0.85%. In addition, the Adviser has contractually agreed to waive its investment advisory fee or reimburse Fund expenses to the extent that Total Annual Fund Operating Expenses After Fee Waiver or Expense Reimbursement exceed 0.80%. This agreement has a one-year term ending February 28, 2016.
It may or may not be renewed. • Performance: The Fund was in the 1st quintile of the group of comparable funds for the one- and three-year periods, and the 2nd quintile for the Five- and ten-year periods. 144 . Emerging Markets Bond Fund • Adviser Fee: The Adviser’s annual contractual management fee rate for the Fund is 0.45%, placing it in the 1st quintile of the group of comparable funds for adviser fees. • Total Expenses: The Fund’s total expenses were in the 1st quintile of the group of comparable funds. • Performance: The Fund was in the 1st quintile of the group of comparable funds for the one-year period, and the 2nd quintile for the three-, five- and the ten-year periods. Emerging Markets Local Bond Fund • Adviser Fee: The Adviser’s annual contractual management fee rate for the Fund is 0.60%, placing it in the 3rd quintile of the group of comparable funds for adviser fees. • Total Expenses: The Fund’s total expenses were in the 2nd quintile of the group of comparable funds. • Performance: The Fund was in the 3rd quintile of the group of comparable funds for the one-year period, and the 4th quintile for the three-year period. The Fund began operations on November 2, 2011. Emerging Markets Corporate Bond Fund • Adviser Fee: The Adviser’s annual contractual management fee rate for the Fund is 0.80%, placing it in the 5th quintile of the group of comparable funds for adviser fees. • Total Expenses: The Fund’s total expenses were in the 3rd quintile of the group of comparable funds. The Adviser has contractually agreed to waive its investment advisory fee or reimburse Fund expenses to the extent that Total Annual Fund Operating Expenses After Fee Waiver or Expense Reimbursement exceed 0.95%. This agreement has a one-year term ending February 28, 2016.
It may or may not be renewed. • Performance: The Fund was in the 1st quintile of the group of comparable funds for the one-year period. It began operations on November 11, 2013. Equity Income Fund • Adviser Fee: The Adviser’s annual contractual management fee rate for the Fund is 0.50%, placing it in the 2nd quintile of the group of comparable funds for adviser fees. • Total Expenses: The Fund’s total expenses were in the 2nd quintile of the group of comparable funds. The Adviser has contractually agreed that for so long as it is the investment adviser to the Fund, the Total Annual Fund Operating Expenses will not exceed 0.80%. • Performance: The Fund was in the 1st quintile of the group of comparable funds for the one- and five-year periods, the 3rd quintile for the three-year period, and the 5th quintile for the ten-year period. 145 .
Trustees and Officers Position with Fund Year Elected W. D. Hilton, Jr. Independent Trustee 1993 President and CEO, Trust Service, Inc.; Executive Director, NGC Bodily Injury Trust; and Managing Trustee, Fuller-Austin Trust Thomas V. McKernan, Jr. Independent Trustee 1993 Chairman, Automobile Club of Southern California Rosemarie T.
Nassif Independent Trustee 2008 President Emerita, Holy Names University; Program Director, Conrad Hilton Foundation Andrew J. Policano Independent Trustee 2008 Dean Emeritus and Dean’s Leadership Circle, Professor, The Paul Merage School of Business, University of California, Irvine Dennis C. Poulsen Independent Trustee 1992 Chairman of the Advisory Board, Rose Hills Company Stender E.
Sweeney Independent Trustee 1992 Private Investor Joan A. Payden Interested Trustee 1992 President, CEO and Director, Payden & Rygel Michael E. Salvay Interested Trustee 2009 Managing Principal, Payden & Rygel Mary Beth Syal Interested Trustee 2000 Managing Principal and Director, Payden & Rygel Chairman and CEO 1992 President, CEO and Director, Payden & Rygel Vice President and CFO 2003 Managing Principal, CFO and Director, Payden & Rygel Yot Chattrabhuti Vice President 1997 Principal, Payden & Rygel Bradley F.
Hersh Vice President and Treasurer 1998 Principal and Treasurer, Payden & Rygel David L. Wagner Vice President and CCO 1996 Senior Vice President, Risk Management, Payden & Rygel Edward S. Garlock Secretary 1997 Managing Principal, General Counsel and Director, Payden & Rygel Name & Address Principal Occupation(s) Other Directorships Held 333 S.
Grand Avenue Los Angeles, CA 90071 Trustees (1) Officers (2) Joan A. Payden Brian W. Matthews Additional information about the Trustees can be found in the SAI. (1) Trustees do not have a set term of office, but serve until their resignation, death or removal. (2) Officers are elected by, and serve at the pleasure of, The Board of Trustees. 146 Payden Mutual Funds Director, Badger Meter, Inc.; Director, Rockwell Collins Director, Avis Budget Group, Inc. .
IMPORTANT INFORMATION: The information contained in this report is intended for shareholders of the Payden Mutual Funds only. It is not authorized for distribution to prospective investors unless accompanied or preceded by a current prospectus which provides further details. The performance numbers presented in this report are derived from historical market data. There is no guarantee of future performance nor are Fund shares guaranteed. Investment return and principal value of an investment in a Fund will fluctuate so that an investor’s shares, when redeemed, may be worth more or less than original cost. Fund shares are sold through Payden & Rygel Distributors, member FINRA. The Fund files its complete schedule of portfolio holdings with the Securities and Exchange Commission (SEC) for the first and third quarters of each fiscal year on Form N-Q.
Forms N-Q are available on the SEC’s web site at http://www.sec.gov or the Fund’s Forms N-Q may be reviewed and copied at the SEC’s Public Reference Room in Washington D.C. Information regarding the operation of the SEC’s Public Reference Room may be obtained by calling 1-800 SEC-0330. To view the Fund’s proxy voting guidelines and proxy voting record, visit the SEC’s web site at http://www.sec.gov. You may also call 800 5729336 to request a free copy of the proxy voting guidelines. .
» U.S. BOND FUNDS Payden Cash Reserves Money Market Fund (PBHXX) Payden Limited Maturity Fund (PYLMX) Payden Low Duration Fund (PYSBX) Payden U.S. Government Fund — Adviser Class (PYUWX) Payden U.S. Government Fund — Investor Class (PYUSX) Payden GNMA Fund — Adviser Class (PYGWX) Payden GNMA Fund — Investor Class (PYGNX) Payden Core Bond Fund — Adviser Class (PYCWX) Payden Core Bond Fund — Investor Class (PYCBX) Payden Corporate Bond Fund (PYACX) Payden Strategic Income — Adviser Class (PYSWX) Payden Strategic Income — Investor Class (PYSGX) Payden Strategic Income — SI Class (PYSIX) Payden Absolute Return Bond Fund — Adviser Class (PYAWX) Payden Absolute Return Bond Fund — Investor Class (PYARX) Payden Absolute Return Bond Fund — SI Class (PYAIX) Payden Floating Rate Fund — Adviser Class (PYFAX) Payden Floating Rate Fund — Investor Class (PYFRX) Payden Floating Rate Fund — SI (PYFIX) Payden High Income Fund — Adviser Class (PYHWX) Payden High Income Fund — Investor Class (PYHRX) » TAX EXEMPT BOND FUND Payden California Municipal Income Fund (PYCRX) » GLOBAL BOND FUNDS Payden Global Low Duration Fund (PYGSX) Payden Global Fixed Income Fund (PYGFX) Payden Emerging Markets Bond Fund — Adviser Class (PYEWX) Payden Emerging Markets Bond Fund — Investor Class (PYEMX) Payden Emerging Markets Bond Fund — SI Class (PYEIX) Payden Emerging Markets Local Bond Fund — Adviser Class (PYEAX) Payden Emerging Markets Local Bond Fund — Investor Class (PYELX) Payden Emerging Markets Corporate Bond Fund — Adviser Class (PYCAX) Payden Emerging Markets Corporate Bond Fund — Investor Class (PYCEX) Payden Emerging Markets Corporate Bond Fund — SI Class (PYCIX) » EQUITY FUND Payden Equity Income Fund — Adviser Class (PYVAX) Payden Equity Income Fund — Investor Class (PYVLX) Payden Equity Income Fund — SI Class (PYVSX) PAYDEN MUTUAL FUNDS 333 South Grand Avenue, Los Angeles, California 90071 800 5-PAYDEN 800 572-9336 payden.com .
Remember, the muchanticipated rate hike was just ¼ of 1%. The US economy is not in perfect condition and inflation is still low, so there is no urgency for the Fed to move quickly. The broad consensus believes short-term interest rates will end 2016 at around 1%.
Meanwhile, other global economies face a range of economic and political challenges and global central banks seem to be in no rush to raise interest rates. As a result, we think low interest rates will still be a dominant global theme in 2016. Second, we think there are reasons for optimism for our longer-term prospects. For example, the United States is a leader in innovation and things are changing quickly with breakthroughs like driverless cars, delivery drones, 3D printers and 4D movies.
Ultimately, innovation will provide the seeds of future economic growth and employment, though the journey may be difficult one for workers who will need to retool their skillsets for the 21st century economy. The most important message we can give our shareholders is that we are thinking about all these factors impacting financial markets. Since the global economy is now interconnected, financial markets have also converged. Investors used to look only to bonds as their income source.
Today, investors look to a variety of tools, including stocks, currencies and bonds, to find income opportunities. We expect this trend to continue in the years ahead. We thank you for continuing to place your trust in us. Most important, we wish health and happiness for you and your families in the New Year, Joan A.
Payden President & CEO . Management Discussion & Analysis Short Duration Strategies During the fiscal year ended October 31, 2015, Central Bank activity continued to be the dominant market influence amidst slowing global growth and weakness within commodities. The Federal Reserve Board kept interest rates unchanged despite the U.S. unemployment rate dropping to 5%. The Bank of China cut interest rates six times as economic growth continued its decline, while the European Central Bank embarked on a €60 billion asset purchase program, which included purchases of government bonds, covered bonds and asset-backed securities. Low inflation remained persistently low in developed economies, such as the Eurozone and Japan, as oil prices went from $80/barrel to less than $45/barrel during the period. Both the U.S.
Treasury one-year and two-year maturity yields rose 23 basis points, ending the fiscal year at 0.32% and 0.72%, respectively. The U.S. Treasury curve flattened with the increasing likelihood of the first rate hike since June 2006.
The interest rate differential between the two-year and five-year maturity U.S. Treasury securities fell 32 basis points. Investors demanded greater yield/risk premiums from corporate bond issuers. Yield premiums rose along with general market volatility due to the slowing economic environment.
Issuer spreads within the sector widened materially on commodity pressure. The Payden Cash Reserves Money Market Fund (PBHXX) continued to provide stable daily liquidity. For the fiscal year ended October 31, 2015, the Fund returned 0.01%, matching the return of 0.01% for the Lipper Government Money Market Average. Money market rates remained low as the Federal Reserve Board kept its low interest rate policy unchanged. The Payden Limited Maturity Fund (PYLMX) returned 0.20% for the fiscal year ended October 31, 2015, compared to a return of 0.02% for its benchmark, the Bank of America Merrill Lynch Three-Month U.S. Treasury Bill Index.
The long relative duration positioning, in addition to the yield premium on both U.S. corporate bonds and securitized products, were the largest contributors to outperformance. The Payden Low Duration Fund (PYSBX) returned 0.50% for the fiscal year ended October 31, 2015, compared to a return of 0.78% for its benchmark, the Bank of America Merrill Lynch 1-3 Year U.S. Treasury Index.
Despite strong performance from corporate bonds, the Fund’s defensive curve positioning was the largest contributor to underperformance as the Federal Reserve Board continued to keep its zero interest rate policy unchanged. The Payden Global Low Duration Fund (PYGSX) returned 0.32% for fiscal year ended October 31, 2015, compared to a return of 0.88% for its benchmark, the Bank of America Merrill Lynch 1-3 Year U.S. Corporate & Government Index. Despite strong performance from corporate bonds, the Fund’s defensive curve positioning was the largest contributor to underperformance as the Federal Reserve Board continued to keep its zero interest rate policy unchanged. The Payden U.S.
Government Fund Investor Class (PYUSX ) returned 1.01% for the fiscal year ended October 31, 2015, compared to a return of 1.41% for its benchmark, the Bank of America Merrill Lynch 1-5 Year U.S. Treasury Index. The Fund’s Advisor Class (PYUWX) returned 0.76% for the fiscal year.
The Fund underperformed its benchmark primarily due to a conservative structure over the latter half of the fiscal year with the belief that interest rates would rise over the period when in fact rates fell. In addition, the Fund is significantly overweight short average life agency mortgage-backed securities that underperformed similar average life U.S. Treasury securities.
As the Federal Reserve Board moves off its zero rate interest policy, the likelihood of increased rate volatility is relatively high. We expect a gradual increase in rates rather than any sharp move to higher rates. The Fund expects to maintain a shorter average life relative to its benchmark, while looking to scale into the market at higher yield levels.
The Fund uses U.S. Treasury futures and eurodollar futures to hedge certain risks from mortgage securities that are not prevalent in its all U.S. Treasury benchmark. Intermediate Duration Bond Strategies The Payden GNMA Fund Investor Class (PYGNX) returned 2.06% for the fiscal year ended October 31, 2015, compared to a return of 1.87% for its benchmark, the Bank of America Merrill Lynch GNMA Master Index.
The Fund’s Adviser Class (PYGWX) returned 1.80% for the year. U.S. interest rates were range-bound for the past year as the Federal Reserve Board maintained its zero rate interest policy.
Ginnie Mae securities benefit from a range-bound period as prepayment risk remains low, providing higher yield to investors. The Fund was able to outperform the index by its exposure to specified mortgage pools that had a slower prepayment experience than the benchmark. Over the coming year, our expectation is for a gradually rising rate environment as the Federal Reserve Board raises rates for the first time since June of 2006.
We do not foresee a sharp increase in longer term rates as the Federal Annual Report 1 . Management Discussion & Analysis continued Reserve Board moves off its zero rate policy. The Fund will be positioned to maximize yield by overweighting higher coupon mortgages and will continue to tactically use U.S. Treasury futures and eurodollars to hedge exposures to shifts in the yield curve that have the potential to negatively impact price performance. The Payden Core Bond Fund Investor Class (PYCBX) returned 1.73% for the fiscal year ended October 31, 2015, compared to a return of 1.96% for its benchmark, the Barclays Capital Aggregate Bond Index. The Fund’s Adviser Class (PYCWX) returned 1.49% for the same period. Over the fiscal year, interest rate movements along the U.S.
Treasury yield curve were mixed. Ten-year U.S. Treasury bonds moved 0.19% lower, compared to two-year bonds which ended the period 0.23% higher.
In the investment grade corporate, high yield, and emerging market asset classes, wider spread premiums detracted from returns. The Fund’s relative underperformance was driven by an overweight allocation to these non-U.S. Treasury asset classes.
In addition, the Fund’s active currency strategy took advantage of the strengthening U.S. dollar and contributed to a positive return for the period. Strong credit fundamentals and compelling valuations continue to support our overweight allocation to credit sectors. With the Federal Reserve Board likely to continue increasing the Federal Funds Rate within the next few months, the Fund is underweight duration and increasing yield to help offset the potential of a rising rate environment. The Payden Strategic Income Investor Class (PYSGX) returned 2.08% for the fiscal year ended October 31, 2015, compared to a return of 1.96% for its benchmark, the Barclays Capital Aggregate Bond Index.
The Fund’s Adviser Class (PYSWX) returned 1.83% and its SI Class (PYSIX) returned 2.32% for the same period. The Payden Corporate Bond Fund (PYACX) generated a return of 2.26% for the fiscal year ended October 31, 2015, compared to a return of 1.05% for its benchmark, the Barclay’s Capital U.S. Corporate Investment Grade Index. The Fund used futures and U.S. Treasury securities as a means of hedging duration to be flat to the benchmark.
In early 2015, the Fund held credit protection with the High Yield Credit Default Swap Index. Currency swaps were also used to reflect market views, and at various times the Fund took positions in the euro, Japanese yen, Australian dollar, and Canadian dollar. Over the fiscal year, corporate bonds struggled to provide returns as spreads widened 41 basis points across the corporate market.
The largest boost to performance was from strong security selection. In addition, the Fund benefited from its high yield securities. The Payden Absolute Return Bond Fund, Investor Class (PYSGX) was launched November 6, 2014 and returned 0.97% for the period ended October 31, 2015, compared to a return of 0.18% for its cash alternative target, 1-month LIBOR. The Fund’s Adviser Class (PYAWX) returned 0.86% and its SI Class (PYAIX) returned 1.20% for the same period.
Fund allocations to private-labeled mortgage-backed securities had the largest positive contributions to return during the period. With weakness in commodity prices weighing heavily on high yield markets and some emerging market countries, both asset classes were detractors from performance. Despite elevated volatility in bond markets and diverging growth outlooks between developed and emerging economies, the Fund has managed to outperform its benchmark return over the period. We continue to find attractively valued investments and opportunities abound with corporations issuing a record amount of debt in 2015. Loan Strategy The floating rate, high yield loan market generated one of the better total returns in the fixed income market for the fiscal year ended October 31, 2015.
Similar to 2014, the loan market has benefitted from the almost $100 billion in new collateralized loan obligations (CLOs) that have been created in 2015 to-date. This new capital has created demand for new loans. For the year ended October 31, 2015, the Payden Floating Rate Fund, Investor Class (PYFRX) returned 2.64%, while, the Fund’s Adviser Class (PYFAX) returned 2.48% and its SI Class (PYFIX) returned 2.74%. The Fund’s benchmark, the Credit Suisse BB Loan Index, returned 3.12% for the same period.
The Fund benefitted from its relative lack of energy and commodity exposure and generally higher-quality orientation. However, the Fund’s relative performance was negatively impacted by loan holdings rated single B, which under-performed the higher-quality BB rated loans of the index. 2 Payden Mutual Funds . High Yield Bond Strategy The high yield bond market had a more challenging period during the fiscal year ended October 31, 2015. Volatility in the energy and commodity sectors had a negative impact on the high yield bond market, as these two sectors comprise almost 20% of the broad high yield bond market. The Payden High Income, Investor Class (PYHRX) returned -0.79%, while the Fund’s Adviser Class (PYHWX) returned -0.76% for the fiscal year ended October 31, 2015. The Fund’s benchmark, the Bank of America Merrill Lynch BB-B High Yield Cash Pay Constrained Index, returned -0.63% for the fiscal year. A significant underweight to the energy sector and security selection therein added to relative performance during the fiscal year. Underweights and not owning positions in such large energy high yield issuers as Linn Energy and California Resource Corporation added materially to relative performance. Sub-optimal security selection in both the utility and commodities sectors detracted from relative performance.
The utility sector was negatively impacted by lower natural gas prices in the U.S., which hurt power utilities in the U.S. as it limited their ability to raise electricity prices. Portfolio holdings such as the alternative energy producer TerraForm Global and the electric utility Genon Energy Inc.
detracted from performance as the lower gas prices caused price dislocations in the U.S. electric power industry. Tax Exempt Strategies The municipal bond market performed strongly over the 12-months ended October 31, 2015. This performance was largely driven on the backdrop of a stable U.S.
Treasury market and improving credit fundamentals as broad U.S. economic growth has enabled state and local governments to stabilize budgets. Demand for municipal debt has proven supportive to offset the impacts of increased new issue supply as municipal issuers continue to refund outstanding debt at lower rates.
Municipal yield levels remained within a reasonable range of fair value relative to U.S. Treasury yields over the fiscal year. For the fiscal year ended October 31, 2015, the Payden California Municipal Income Fund (PYCRX) returned 1.87%. The Fund’s benchmarks, the Barclays Capital California Intermediate Index and the Barclays Capital 7-Year Municipal Index, returned 2.77% and 2.72%, respectively, for the same period.
The Fund’s underweight positioning to intermediate maturities was the primary contributor to the Fund’s underperformance as intermediate maturities were the top performers. This defensive positioning should help to offset the impact of an anticipated rising interest rate environment. Global Bond Strategy Global government bonds gave a mixed performance in the 12-months ended October 31, 2015. Bond markets, particularly in Europe, rallied strongly in early 2015, following the announcement of a substantial quantitative easing package by the European Central Bank.
Bond yields bottomed in mid-April at historically low levels, with 2-year maturity bond yields in many European markets going negative for the first time in response to the imposition of negative short-term interest rates by the European Central Bank and a number of central banks elsewhere in Europe. However, during April to June 2015 bond yields rose once again, as deflationary pressures eased and real yields rose. During July to September 2015, bond yields declined once again, as the Chinese economy showed further signs of weakness, which put significant downward pressure on commodity prices and inflation rates around the world.
This led to a widening in credit spreads, particularly in the high yield bond market. The growing divergence in prospective monetary policy between the U.S., where rates did rise, and Europe/China/Japan, where rates could go lower still, led to a strong rally in the U.S. dollar versus the major currencies and in particular the emerging market commodity-linked currencies. For the year ended October 31, 2015, the Payden Global Fixed Income Fund (PYGFX) returned 2.27%, underperforming its benchmark, the Lehman Global Aggregate Index Hedged into USD, which returned 2.72%.
The primary detractors from relative returns were the Fund’s out-of-index allocations to the emerging markets and high yield sectors, as significant weakness in the price of oil and other commodities led to credit spread widening and underperformance relative to government bonds. The Fund’s overweight allocation to investment grade corporate bonds had a further modest negative performance impact, given the slight widening in yield spreads in the sector. Allocations to the mortgage-backed and asset-backed sectors added value.
Active currency management had a significant positive performance impact, however, given the Fund’s long U.S. dollar position versus a number of currencies. Annual Report 3 . Management Discussion & Analysis continued Emerging Market Bond Strategies For the fiscal year ended October 31, 2015, emerging markets debt performance was generally weak, though dollar-pay bonds fared better than local currency bonds. The asset class was challenged by commodity price volatility, lack of clarity regarding the Federal Reserve Board’s monetary policy trajectory, and weaker economic performance in large emerging markets, including Brazil and China. Although spreads widened in both dollar-pay sovereign and corporate debt, total returns remained positive amid a supportive U.S. Treasury environment. In local currency debt, yields rose and currencies depreciated sharply against a strong U.S. dollar, leading to negative total returns. The Payden Emerging Markets Bond Fund, Investor Class (PYEMX) returned -2.65%, the Fund’s Adviser Class (PYEWX) returned -2.94%, and the Fund’s SI Class (PYEIX) returned -2.58% for the fiscal year ended October 31, 2015.
The Fund’s benchmark, the JP Morgan Emerging Market Bond Index Global Diversified, returned 0.39% for the same period. The Fund strategically reduced commodity and off-index corporate positions throughout the period. In Latin America, the Fund prefers Mexico exposure on sustained reform prospects, and is overweight Dominican Republic, Panama and Honduras as stronger growth countries that benefit from lower oil prices.
The Fund is underweight Brazil on economic and political headwinds, and cautious in oil-reliant Colombia and Ecuador. In Emerging Europe, the Fund is overweight Romania due to a positive fundamental outlook, and prefers Armenia and Georgia on compelling valuations. The Fund is underweight in Poland (on tight valuations), Russia and Turkey.
In Asia, the Fund is overweight India (on reform momentum), as well as Indonesia and Sri Lanka. Malaysia and the Philippines are underweights on tight valuations. In the Middle East and Africa, the Fund has exposure to Ghana and Senegal based on attractive valuations, while Lebanon and South Africa are underweights.
The Fund has a modest net short currency position and holds select corporates where the underlying sovereign view is positive. The Fund’s off-benchmark allocation to corporates was a key detractor from performance. Among sovereigns, an underweight to Russia and exposure to Zambia made negative contributions. In quasi-sovereigns, exposure to state oil companies, particularly in Kazakhstan and Mexico, detracted from performance. The Payden Emerging Markets Local Bond Fund, Investor Class (PYELX) returned -17.16%, and the Fund’s Adviser Class (PYEAX) returned -17.26% for the fiscal year ended October 31, 2015.
The Fund’s benchmark the JP Morgan Global Bond Index Emerging Market Global Diversified returned -17.42% for the period. In Latin America, the Fund holds an overweight in Mexican rates based on relative curve steepness, an underweight to Brazilian rates and the real, as well as an underweight to the Colombian peso on weak current account dynamics. In Emerging Europe, the Fund is overweight rates in Poland given low regional inflation, while underweight Turkish rates and the lira.
In Asia, the Fund is overweight Indian rates and the rupee, underweight Malaysian rates and the ringgit, underweight the Thai baht, and has a short position in the Chinese yuan. In South Africa, the Fund is neutral rates while underweight the currency. The Fund also holds a short euro position. The Fund outperformed by selecting better performing local debt in India, Indonesia, Romania and Poland.
A short position in the euro, Malaysian ringgit, Brazilian real and South African rand also benefitted relative returns. The Payden Emerging Market Corporate Bond Fund, Investor Class (PYCEX) returned -1.55%, the Fund’s Adviser Class (PYCAX) returned -1.94%, and the Fund’s SI Class (PYCIX) returned -1.47% for the fiscal year ended October 31, 2015. The Fund’s benchmark, the JP Morgan Corporate Emerging Market Bond Index Broad Diversified, returned 0.93% for the same period. The Fund strategically reduced commodity positions throughout the period. In Latin America, the Fund holds overweight positions in Mexico, Chile and Jamaica, as well as the utilities and industrial sectors.
Underweight positions include Brazil, Colombia and Peru, as well as the financial, energy and metals & mining sectors. In Europe, overweights include Poland, Azerbaijan and the telecom sector, while underweights are concentrated in Russia and Turkey. In Asia, an underweight is expressed through South Korea, Thailand and the Philippines (on tight valuations), as well as the financial and consumer sectors.
Select Asia overweights include India, Indonesia, high-quality Chinese credits, and the telecom sector. The Fund is underweight the Middle East and Africa via Qatar and South Africa, against a select overweight in Morocco. An overweight allocation to high yield corporates was negative for relative returns. Specific Fund positions in Brazilian industrials, high yield Chinese entities (in the real estate and consumer sectors) and Colombian oil and gas detracted from performance. Underweights in Russia and Ukraine were negative as credit markets recovered following weak performance in 2014. 4 Payden Mutual Funds .
The Funds use currency forward contracts to manage risk and express fundamental views. The Funds use U.S. Treasury futures to manage interest rate risk in times of market volatility. U.S. Equity Strategy The U.S.
equity markets posted positive returns for the fiscal year ended October 31, 2015 as continued growth in the economy and gains in the labor market, together with accommodative global central banks, offset declining corporate profits, volatile markets overseas, and the collapse in oil prices. For the first nine months of the fiscal year, the markets had slowly grinded higher with the S&P 500 index trading in the tightest 6-month range in the history of the index since 1928. Despite economic weakness in Europe and fears of a Greek exit, the stock market rallied through the early summer as the European Central Bank began its own stimulus program and corporate earnings came in better-than-expected.
However, the summer brought a change in sentiment as China’s equity market began to suffer a dramatic selloff, leading to fears of a global economic slowdown due to subpar growth in China and emerging markets. Equity markets worldwide accelerated downward after the Chinese government surprised market participants by devaluing the yuan on August 11, 2015. Major stock indices fell into correction territory in late August.
Contributing to the volatility, the Federal Reserve Board delayed hiking interest rates in September, citing weakness in overseas markets. But, the negative sentiment quickly turned around in October and the stock market bounced off of the lows. The fiscal year ended on a positive tone as macro concerns faded, with China stabilizing, central banks of Europe and Japan continuing to ease and earnings coming in better than expected. The Payden Equity Income Fund, Investor Class (PYVLX) which is comprised of large-cap value stocks, returned 2.90% for the fiscal year ended October 31, 2015, while the Fund’s Adviser Class (PYVAX) returned 2.66% and the Fund’s SI Class (PYVSX) returned 3.04% for the fiscal year.
The Fund’s benchmark, the Russell 1000 Value Index, returned 0.54% for the same time period. The Fund outperformed its benchmark due to its strong security selection, while the allocation to other security types detracted from relative performance. The allocation to real estate investment trusts and preferred stocks were positive contributors, but the allocation to master limited partnerships was a negative contributor as energy related stocks sold off with commodity prices. Within individual stock selection, the strongest areas of stock selection were in the consumer staples and industrials sectors, while the weakest area was in the health care sector.
Strong performers in the Fund were food company Kraft Heinz and discount retailer Target. Annual Report 5 . Portfolio Highlights & Investments Investment Abbreviations AMBAC - American Municipal Bond Assurance Co. ARM - Adjustable Rate Mortgage FDIC - Federal Deposit Insurance Corporation FFCB - Federal Farm Credit Bank FG - Freddie Mac Gold Pool FH - Freddie Mac Non Gold Pool FHLB - Federal Home Loan Banks FHLMC - Federal Home Loan Mortgage Company (Freddie Mac) FHR - Freddie Mac REMICS FN - Fannie Mae Pool FNMA - Federal National Mortgage Association (Fannie Mae) FNR - Fannie Mae REMICS FNW - Fannie Mae Whole Loan G2 - Ginnie Mae II pool GN - Ginnie Mae I pool GNMA - Government National Mortgage Association (Ginnie Mae) GNR - Ginnie Mae REMICS NCUA - National Credit Union Administration REMICS - Real Estate Mortgage Investment Conduits 6 Payden Mutual Funds . Payden Cash Reserves Money Market Fund $14,000 The Fund seeks stability, liquidity and current income by generally investing in the highest quality, short term securities with an average portfolio maturity not to exceed 90 days. One Year 0.01% $13,000 Five Year 0.01% Ten Year 1.31% Fund $11,390 Lipper Government Money Market Average $11,154 $12,000 Portfolio Composition - percent of value U.S. Government Agency Repurchase Agreement U.S. Treasury Cash equivalent 57% 36% 6% 1% $11,000 $10,000 $9,000 10/31/05 10/10 10/31/15 Past performance does not predict future returns. The graph does not reflect the impact of taxes or transaction costs a shareholder would pay. This information is not part of the audited financial statements. Schedule of Investments - October 31, 2015 Principal or Shares Security Description U.S.
Government Agency (57%) 5,000,000 FFCB, 0.17%, 9/27/16 (a) 7,000,000 FFCB, 0.19%, 12/28/16 (a) 5,000,000 FFCB, 0.20%, 7/15/16 (a) 5,000,000 FHLB, 0.18%, 10/17/16 (a) 4,000,000 FHLB Disc Note, 0.01%, 11/04/15 (b) 5,000,000 FHLB Disc Note, 0.05%, 12/02/15 (b) 20,000,000 FHLB Disc Note, 0.06%, 12/03/15 (b) 3,100,000 FHLB Disc Note, 0.14%, 1/19/16 (b) 4,200,000 FHLB Disc Note, 0.15%, 1/27/16 (b) 4,400,000 FHLB Disc Note, 0.15%, 2/03/16 (b) 3,100,000 FHLB Disc Note, 0.16%, 1/22/16 (b) 1,600,000 FHLB Disc Note, 0.16%, 2/05/16 (b) 2,400,000 FHLB Disc Note, 0.16%, 2/08/16 (b) 10,000,000 FHLB Disc Note, 0.21%, 4/01/16 (b) 11,000,000 FHLB Disc Note, 0.24%, 2/01/16 (b) 1,000,000 FHLMC, 0.20%, 4/20/17 (a) 10,000,000 FHLMC Disc Note, 0.10%, 1/04/16 (b) 3,550,000 FHLMC Disc Note, 0.12%, 2/05/16 (b) 17,500,000 FHLMC Disc Note, 0.13%, 11/06/15 (b) 1,050,000 FHLMC Disc Note, 0.15%, 1/27/16 (b) 2,000,000 FHLMC Disc Note, 0.17%, 12/08/15 (b) 1,100,000 FHLMC Disc Note, 0.17%, 2/04/16 (b) 20,000,000 FHLMC Disc Note, 0.20%, 4/04/16 (b) 8,889,000 FHLMC Disc Note, 0.23%, 4/25/16 (b) 5,000,000 FHLMC Disc Note, 0.26%, 4/19/16 (b) 15,000,000 FNMA, 0.22%, 8/26/16 (a) 3,000,000 FNMA, 1.25%, 9/28/16 3,300,000 FNMA Disc Note, 0.02%, 11/04/15 (b) 10,000,000 FNMA Disc Note, 0.13%, 11/18/15 (b) 7,400,000 FNMA Disc Note, 0.13%, 1/14/16 (b) 10,000,000 FNMA Disc Note, 0.15%, 11/17/15 (b) 8,975,000 FNMA Disc Note, 0.24%, 2/03/16 (b) 5,000,000 Tennessee Valley Authority Discount Notes, 0.04%, 11/03/15 (b) Total U.S. Government Agency (Cost - $223,521) U.S. Treasury (6%) 15,000,000 U.S.
Treasury Note, 0.07%, 1/31/16 (a) Value (000) $ 5,000 7,000 5,000 5,000 4,000 5,000 19,999 3,099 4,199 4,398 3,099 1,599 2,399 9,991 10,993 1,000 9,998 3,549 17,500 1,050 2,000 1,099 19,983 8,879 4,994 15,006 3,022 3,300 9,999 7,398 9,999 8,969 Principal or Shares Value (000) Security Description 10,000,000 U.S. Treasury Note, 0.09%, 4/30/16 (a) Total U.S. Treasury (Cost - $25,000) Investment Company (1%) 3,888,357 Dreyfus Treasury Cash Management Fund (Cost - $3,888) Repurchase Agreement (36%) 35,000,000 Citigroup Tri Party, 0.08% (c) 35,000,000 Goldman Sachs Tri Party, 0.06% (d) 70,000,000 RBC Capital Tri Party, 0.10% (e) Total Repurchase Agreement (Cost - $140,000) Total (Cost - $392,409) (100%) Liabilities in excess of Other Assets (0%) Net Assets (100%) $ 10,000 25,000 3,888 $ 35,000 35,000 70,000 140,000 392,409 (18) 392,391 (a) Variable rate security.
The rate shown reflects the rate in effect at October 31, 2015. See Note 2 in the Notes to Financial Statements. (b) Yield to maturity at time of purchase. (c) The repurchase agreement dated 10/30/2015 is collateralized by the following securities: Citigroup Tri Party 35,675,700 U.S. Treasury Securities, maturity from Dec 15-Aug 22, yielding from 0.875%-1.875% $35,700 (d) The repurchase agreement dated 10/27/2015 is collateralized by the following securities: Goldman Sachs Tri Party 36,898,160 GNMA, maturity from Jul 44-Sep 45, yielding from 4.00%-4.50% $35,700 5,000 223,521 15,000 Annual Report 7 .
Payden Cash Reserves Money Market Fund continued (e) The repurchase agreement dated 10/30/2015 is collateralized by the following securities: RBC Capital Tri Party 61,728,569 FNMA, maturity from Oct 25-Oct 45, yielding from 2.50%-5.00% $56,283 14,527,101 GNMA, maturity from Jul 40-May 65, yielding from 2.588%-4.00% 15,117 Total Collateral Value of RBC Capital $71,400 Offsetting Assets and Liabilities The Fund’s investments in repurchase agreements were all subject to enforceable Master Repurchase Agreements. Repurchase Agreements on a gross basis were as follows: (000s) Repurchase Agreement Total gross amount of repurchase agreements presented on the Statements of Assets and Liabilities Non-cash Collateral Net Amount See notes to financial statements. 8 Payden Mutual Funds $140,000 (70,000) $70,000 . Payden Limited Maturity Fund $14,000 The Fund seeks a total return greater than a money market fund along with the preservation of capital by generally investing in investment grade debt securities with a maximum average portfolio maturity not to exceed two years. One Year 0.20% $13,000 Five Year 0.69% Ten Year 1.45% Fund $11,550 Bank of America Merrill Lynch 3-Month U.S. Treasury Bill Index $11,385 $12,000 Portfolio Composition - percent of value Corporate Asset Backed U.S. Treasury Mortgage Backed Foreign Government Other $11,000 41% 19% 15% 9% 3% 13% $10,000 $9,000 10/31/05 10/10 10/31/15 Past performance does not predict future returns. The graph does not reflect the impact of taxes or transaction costs a shareholder would pay. This information is not part of the audited financial statements. Schedule of Investments - October 31, 2015 Principal or Shares Security Description Asset Backed (19%) 1,500,000 Ally Master Owner Trust, 0.65%, 2/15/18 2,400,000 Ally Master Owner Trust, 0.65%, 4/15/18 673,576 American Homes 4 Rent 2014-SFR1 144A, 1.25%, 6/17/31 (a) 2,600,000 AmeriCredit Automobile Receivables Trust 2015-3, 1.07%, 1/08/19 2,500,000 Apidos CLO 144A, 1.47%, 4/15/25 (a) 3,145,163 ARI Fleet Lease Trust 2014-A 144A, 0.81%, 11/15/22 (a) 181,006 Asset Backed Funding Certificates, 0.82%, 4/25/34 223,287 AUTO ABS, 0.99%, 5/25/24 EUR (b) 3,050,000 Babson CLO Ltd.
144A, 1.42%, 4/20/25 (a) 330,000 Capital Auto Receivables Asset Trust 2013-1, 1.29%, 4/20/18 340,000 Capital Auto Receivables Asset Trust 2013-1, 1.74%, 10/22/18 3,800,000 Capital Auto Receivables Asset Trust 2015-1, 0.95%, 7/20/17 1,400,000 Cent CLO LP 144A, 1.44%, 7/23/25 (a) 1,500,000 Chase Issuance Trust, 0.45%, 4/15/19 2,490,875 Chrysler Capital Auto Receivables Trust 2015-A 144A, 0.81%, 11/15/17 (a) 5,965,000 CNH Equipment Trust 2015-A, 0.84%, 6/15/18 695,842 Colony American Homes 2014-1 144A, 1.40%, 5/17/31 (a) 1,073,815 Colony American Homes 2014-2 144A, 1.15%, 7/17/31 (a) 4,000,000 Discover Card Execution Note Trust, 0.65%, 5/15/18 2,640,000 Dryden XXII Senior Loan Fund 144A, 1.42%, 8/15/25 (a) 950,000 Dryden XXXI Senior Loan Fund 144A, 2.22%, 4/18/26 (a) Value (000) $ Principal or Shares 1,500 2,399 413,346 660 1,340,998 87,884 2,595 2,452 681,170 2,101,520 3,145 1,750,000 178 246 2,999 1,888,539 330 1,900,000 341 765,332 3,797 1,371 1,492 96,707 2,491 5,965 684 1,049 4,000 2,594 928 3,000,000 1,740,000 3,435,877 408,068 1,200,000 1,000,000 2,585,000 1,115,000 Value (000) Security Description Enterprise Fleet Financing LLC 144A, 1.05%, 3/20/20 (a) Fifth Third Auto 2013-1, 0.88%, 10/16/17 Great America Leasing Receivables 144A, 0.78%, 6/15/16 (a) GSAMP Trust 2004-SEA2, 0.85%, 3/25/34 Hyundai Auto Lease Securitization Trust 2014-A 144A, 0.75%, 4/17/17 (a) Hyundai Auto Lease Securitization Trust 2015-B 144A, 0.52%, 12/15/17 (a) Invitation Homes 2013-SFR1 Trust 144A, 1.40%, 12/17/30 (a) Invitation Homes 2014-SFR1 Trust 144A, 1.20%, 6/17/31 (a) Invitation Homes 2014-SFR2 Trust 144A, 1.30%, 9/17/31 (a) Invitation Homes 2015-SFR3 Trust 144A, 1.50%, 8/17/32 (a) Long Beach Mortgage Loan Trust, 6.25%, 8/25/33 Madison Park Funding XIII Ltd. 144A, 1.77%, 1/19/25 (a) Mercedes Benz Auto Lease Trust 2015-A, 0.78%, 2/15/17 Nelnet Student Loan Trust 2014-2A 144A, 0.48%, 6/25/21 (a) Nissan Auto Receivables 2015-A Owner Trust, 0.67%, 9/15/17 Octagon Investment Partners 24 Ltd. 144A, 2.23%, 5/21/27 (a) Octagon Investment Partners XIX Ltd.
144A, 1.84%, 4/15/26 (a) Octagon Investment Partners XXIII Ltd. 144A, 2.29%, 2/25/28 (a) $ 412 1,342 88 683 2,102 1,747 1,863 2,938 1,865 752 84 1,723 3,436 406 1,200 982 2,564 1,115 Annual Report 9 . Payden Limited Maturity Fund continued Principal or Shares Value (000) Security Description Option One Mortgage Loan Trust 2005-4 Asset-Backed Certificates Series 2005-4, 0.46%, 11/25/35 2,000,000 Progress Residential 2015-SFR1 Trust 144A, 1.60%, 2/17/32 (a) 510,625 SLM Student Loan Trust, 0.56%, 4/25/17 3,955,000 Symphony CLO XV Ltd. 144A, 1.77%, 10/17/26 (a) 3,220,000 Trade MAPS 1 Ltd. 144A, 0.90%, 12/10/18 (a) 2,530,000 Tyron Park CLO Ltd. 144A, 1.44%, 7/15/25 (a) 2,910,828 Volkswagen Auto Lease Trust 2015-A, 0.87%, 6/20/17 Total Asset Backed (Cost - $82,823) Bank Loans(c) (1%) 747,500 Activision Blizzard Inc.
Term Loan B 1L, 3.25%, 10/11/20 857,857 ARAMARK Corp. Term Loan E 1L, 3.25%, 9/07/19 1,046,878 General Nutrition Co. Inc.
Term Loan B 1L, 3.25%, 3/04/19 Total Bank Loans (Cost - $2,650) Commercial Paper (6%) 4,000,000 Airgas 144A, 0.00%, 12/23/15 (a) 4,000,000 Ameren 144A, 0.00%, 11/12/15 (a) 4,000,000 Amphenol 144A, 0.00%, 11/19/15 (a) 3,500,000 Aon 144A, 0.00%, 11/03/15 (a) 2,500,000 Hyundai Capital 144A, 0.00%, 11/17/15 (a) 3,500,000 Reckitt Benckiser Treasury 144A, 0.00%, 1/12/16 (a) 2,500,000 Thomson Reuters 144A, 0.00%, 11/18/15 (a) Total Commercial Paper (Cost - $23,992) Corporate Bond (41%) 1,500,000 Abbey National Treasury Services PLC/Stamford CT, 0.85%, 3/13/17 2,330,000 AbbVie Inc., 1.80%, 5/14/18 1,840,000 Actavis Funding SCS, 1.20%, 9/01/16 600,000 Actavis Funding SCS, 1.30%, 6/15/17 920,000 Actavis Funding SCS, 1.42%, 3/12/18 940,000 Actavis Funding SCS, 1.85%, 3/01/17 980,000 AES Corp./VA, 3.32%, 6/01/19 1,550,000 Air Lease Corp., 4.50%, 1/15/16 735,000 Aircastle Ltd., 6.75%, 4/15/17 500,000 Alibaba Group Holding Ltd. 144A, 1.63%, 11/28/17 (a) 750,000 Allied Irish Banks PLC, 2.88%, 11/28/16 EUR (b) 1,000,000 Ally Financial Inc., 3.50%, 7/18/16 1,240,000 American Express Co., 0.92%, 5/22/18 1,610,000 Amgen Inc., 0.71%, 5/22/17 400,000 Anglo American Capital PLC 144A, 1.27%, 4/15/16 (a) 780,000 ANZ New Zealand International Ltd./London 144A, 0.84%, 4/27/17 (a) 710,000 ANZ New Zealand International Ltd./London 144A, 1.13%, 3/24/16 (a) Principal or Shares 695,429 10 Payden Mutual Funds 1,500,000 $ 690 1,978 509 1,150,000 440,000 1,600,000 3,913 3,213 2,492 1,350,000 1,600,000 700,000 160,000 670,000 2,909 82,222 770,000 930,000 750 859 1,015 2,624 3,998 4,000 3,999 3,500 2,500 3,498 2,500 23,995 1,720,000 860,000 1,200,000 770,000 1,000,000 600,000 1,540,000 1,350,000 1,100,000 210,000 1,220,000 1,170,000 1,750,000 1,500,000 300,000 1,150,000 1,497 2,333 1,838 595 915 943 936 1,560 783 497 841 1,009 1,239 1,606 398 780 711 350,000 500,000 1,770,000 2,430,000 390,000 1,000,000 2,225,000 750,000 750,000 1,100,000 1,000,000 680,000 600,000 790,000 940,000 1,600,000 1,050,000 Value (000) Security Description Ardagh Packaging Finance PLC / Ardagh Holdings USA Inc. 144A, 3.34%, 12/15/19 (a) ASIF III Jersey Ltd., 5.38%, 10/14/16 GBP (b) AutoZone Inc., 1.30%, 1/13/17 Aviation Capital Group Corp.
144A, 2.88%, 9/17/18 (a) Bank of America Corp., 0.80%, 3/28/18 EUR (b) Bank of America Corp., 0.88%, 5/02/17 Bank of America Corp., 1.70%, 8/25/17 Bank of America Corp., 3.88%, 3/22/17 Bank of New York Mellon Corp., 0.89%, 8/01/18 Bank of Tokyo-Mitsubishi UFJ Ltd. 144A, 1.20%, 3/10/17 (a) Bank of Tokyo-Mitsubishi UFJ Ltd. 144A, 1.45%, 9/08/17 (a) Barclays Bank PLC, 0.90%, 2/17/17 Barclays PLC, 2.00%, 3/16/18 BAT International Finance PLC 144A, 0.85%, 6/15/18 (a) Baxalta Inc.
144A, 1.10%, 6/22/18 (a) Bear Stearns Companies LLC, 5.55%, 1/22/17 Becton Dickinson and Co., 0.79%, 6/15/16 Becton Dickinson and Co., 1.45%, 5/15/17 Bell Canada, 1.33%, 4/22/16 CAD (b) BNZ International Funding Ltd./London 144A, 1.90%, 2/26/18 (a) BP Capital Markets PLC, 0.82%, 5/10/18 BP Capital Markets PLC, 0.96%, 9/26/18 BP Capital Markets PLC, 1.67%, 2/13/18 BPCE SA, 1.16%, 2/10/17 Branch Banking & Trust Co., 0.66%, 9/13/16 British Telecommunications PLC, 1.25%, 2/14/17 British Telecommunications PLC, 8.50%, 12/07/16 GBP (b) Cameron International Corp., 1.40%, 6/15/17 Canadian Natural Resources Ltd., 1.75%, 1/15/18 Capital One NA/Mclean VA, 1.01%, 2/05/18 Carnival Corp., 1.20%, 2/05/16 Celgene Corp., 2.13%, 8/15/18 CIT Group Inc., 4.25%, 8/15/17 Citigroup Inc., 0.60%, 6/09/16 Citigroup Inc., 1.24%, 11/30/17 EUR (b) Citigroup Inc., 1.85%, 11/24/17 Citizens Bank NA/Providence RI, 1.60%, 12/04/17 CNH Capital LLC, 3.88%, 11/01/15 CNH Industrial Capital LLC 144A, 3.88%, 7/16/18 (a) CNPC General Capital Ltd. 144A, 1.21%, 5/14/17 (a) Commonwealth Bank of Australia/New York NY, 1.75%, 11/02/18 Compass Bank, 1.85%, 9/29/17 ConAgra Foods Inc., 0.69%, 7/21/16 ConocoPhillips Co., 0.65%, 5/15/18 $ 1,481 1,839 440 1,601 1,473 1,586 702 165 670 766 930 1,720 859 1,200 768 1,048 600 1,540 1,032 1,102 209 1,216 1,175 1,756 1,497 300 1,904 347 493 1,763 2,433 393 1,025 2,216 825 753 1,092 1,000 683 598 789 936 1,595 1,044 . Principal or Shares 1,090,000 1,800,000 1,200,000 900,000 1,840,000 1,860,000 800,000 1,000,000 1,270,000 350,000 600,000 650,000 200,000 800,000 500,000 1,460,000 610,000 1,000,000 520,000 300,000 800,000 1,800,000 1,000,000 2,270,000 106,000 1,750,000 1,200,000 400,000 1,700,000 1,510,000 980,000 880,000 620,000 550,000 300,000 990,000 720,000 480,000 1,000,000 800,000 170,000 1,200,000 Value (000) Security Description Credit Agricole SA/London 144A, 1.12%, 4/15/19 (a) Credit Agricole SA/London 144A, 1.30%, 6/10/20 (a) Credit Suisse/New York NY, 0.82%, 5/26/17 Credit Suisse/New York NY, 1.01%, 1/29/18 CVS Health Corp., 1.90%, 7/20/18 Daimler Finance North America LLC 144A, 0.63%, 3/02/17 (a) Daimler Finance North America LLC 144A, 1.38%, 8/01/17 (a) DISH DBS Corp., 7.13%, 2/01/16 Dominion Resources Inc./VA, 1.25%, 3/15/17 Enbridge Inc., 0.78%, 6/02/17 Enbridge Inc., 0.98%, 10/01/16 Enbridge Inc., 1.21%, 3/13/17 CAD (b) ERAC USA Finance LLC 144A, 1.40%, 4/15/16 (a) Fifth Third Bank/Cincinnati OH, 1.15%, 11/18/16 Ford Credit Canada Ltd., 1.32%, 3/18/16 CAD (b) Ford Motor Credit Co. LLC, 1.17%, 3/12/19 Ford Motor Credit Co. LLC, 1.59%, 5/09/16 Ford Motor Credit Co. LLC, 2.15%, 1/09/18 Freeport-McMoRan Inc., 2.30%, 11/14/17 GATX Corp., 1.25%, 3/04/17 GE Capital UK Funding, 0.74%, 3/20/17 GBP (b) General Motors Financial Co.
Inc., 1.68%, 4/10/18 General Motors Financial Co. Inc., 2.75%, 5/15/16 Glencore Funding LLC 144A, 1.68%, 1/15/19 (a) Glencore Funding LLC 144A, 2.13%, 4/16/18 (a) Goldman Sachs Group Inc., 3.63%, 2/07/16 HBOS PLC, 0.77%, 9/01/16 EUR (b) Hess Corp., 1.30%, 6/15/17 Hewlett Packard Enterprise Co. 144A, 2.25%, 10/05/18 (a) Hewlett Packard Enterprise Co.
144A, 2.45%, 10/05/17 (a) HSBC Bank PLC 144A, 0.96%, 5/15/18 (a) HSBC USA Inc., 0.78%, 3/03/17 HSBC USA Inc., 1.21%, 9/24/18 Huntington National Bank, 1.30%, 11/20/16 Huntington National Bank, 1.35%, 8/02/16 Hyundai Capital America 144A, 1.45%, 2/06/17 (a) Imperial Tobacco Finance PLC 144A, 2.05%, 7/20/18 (a) Industrial & Commercial Bank of China Ltd./New York, 2.35%, 11/13/17 International Lease Finance Corp., 3.88%, 4/15/18 Jackson National Life Global Funding 144A, 1.25%, 2/21/17 (a) Johnson Controls Inc., 1.40%, 11/02/17 JPMorgan Chase & Co., 1.07%, 5/30/17 GBP (b) $ Principal or Shares 1,083 1,802 1,197 899 1,855 1,848 795 1,013 1,265 344 598 492 200 802 382 1,430 612 1,001 491 298 1,230 1,797 1,007 1,819 93 1,764 1,321 397 1,600,000 490,000 900,000 370,000 350,000 1,640,000 1,590,000 1,300,000 640,000 1,600,000 820,000 1,570,000 670,000 1,500,000 620,000 1,750,000 1,750,000 1,900,000 930,000 1,130,000 1,360,000 1,070,000 1,250,000 1,000,000 500,000 2,560,000 600,000 640,000 500,000 650,000 1,706 1,515 978 878 622 550 301 1,000,000 900,000 660,000 1,200,000 630,000 500,000 986 1,600,000 721 484 700,000 1,130,000 1,017 800,000 799 169 1,827 920,000 2,000,000 Value (000) Security Description JPMorgan Chase & Co., 1.27%, 1/23/20 Kinder Morgan Inc./DE, 2.00%, 12/01/17 Kroger Co., 0.85%, 10/17/16 L-3 Communications Corp., 1.50%, 5/28/17 Lowe’s Companies Inc., 0.94%, 9/14/18 Macquarie Bank Ltd. 144A, 0.95%, 10/27/17 (a) Macquarie Group Ltd. 144A, 1.33%, 1/31/17 (a) Martin Marietta Materials Inc., 1.43%, 6/30/17 Mitsubishi UFJ Trust & Banking Corp.
144A, 1.60%, 10/16/17 (a) Mizuho Bank Ltd. 144A, 0.75%, 4/16/17 (a) Mizuho Bank Ltd. 144A, 0.78%, 9/25/17 (a) Morgan Stanley, 1.06%, 7/23/19 Morgan Stanley, 1.60%, 4/25/18 Morgan Stanley, 3.80%, 4/29/16 Morgan Stanley, 6.63%, 4/01/18 National City Bank/Cleveland OH, 0.70%, 6/07/17 NBCUniversal Enterprise Inc.
144A, 1.01%, 4/15/18 (a) Nederlandse Waterschapsbank NV 144A, 1.25%, 9/18/17 (a) New York Life Global Funding 144A, 1.55%, 11/02/18 (a) Nissan Motor Acceptance Corp. 144A, 1.00%, 3/15/16 (a) Nomura Holdings Inc., 1.79%, 9/13/16 Nordea Bank AB 144A, 1.17%, 9/17/18 (a) NSTAR Electric Co., 0.56%, 5/17/16 NXP BV / NXP Funding LLC 144A, 3.50%, 9/15/16 (a) PACCAR Financial Corp., 0.93%, 12/06/18 Penske Truck Leasing Co. LP / PTL Finance Corp.
144A, 2.50%, 3/15/16 (a) Perrigo Co. PLC 144A, 1.30%, 11/08/16 (a) Reliance Standard Life Global Funding II 144A, 2.15%, 10/15/18 (a) Reynolds American Inc., 2.30%, 6/12/18 Rogers Communications Inc., 1.36%, 3/13/17 CAD (b) Sabine Pass LNG LP, 7.50%, 11/30/16 Santander Bank NA, 2.00%, 1/12/18 Seagate HDD Cayman, 3.75%, 11/15/18 Shaw Communications Inc., 1.52%, 2/01/16 CAD (b) Sinopec Capital 2013 Ltd. 144A, 1.25%, 4/24/16 (a) Societe Des Autoroutes Paris-Rhin-Rhone, 0.71%, 3/31/19 EUR (b) Standard Chartered PLC 144A, 0.67%, 9/08/17 (a) Statoil ASA, 0.80%, 11/08/18 Sumitomo Mitsui Banking Corp., 0.75%, 1/10/17 Sumitomo Mitsui Banking Corp., 1.14%, 3/18/16 GBP (b) Suntory Holdings Ltd.
144A, 1.65%, 9/29/17 (a) SunTrust Bank/Atlanta GA, 0.76%, 2/15/17 $ 1,602 480 899 365 351 1,632 1,593 1,292 638 1,595 817 1,554 679 1,523 689 1,742 1,752 1,909 929 1,132 1,367 1,076 1,249 1,007 502 2,573 594 640 508 495 1,037 897 668 918 631 554 1,584 695 1,128 1,235 918 1,995 Annual Report 11 . Payden Limited Maturity Fund continued Principal or Shares Value (000) Security Description 1,005,000 450,000 800,000 330,000 1,750,000 300,000 770,000 670,000 130,000 460,000 1,500,000 1,750,000 1,000,000 Synchrony Financial, 1.88%, 8/15/17 TECO Finance Inc., 0.92%, 4/10/18 Tencent Holdings Ltd. 144A, 2.00%, 5/02/17 (a) Thermo Fisher Scientific Inc., 1.30%, 2/01/17 Thermo Fisher Scientific Inc., 3.20%, 3/01/16 Thomson Reuters Corp., 1.30%, 2/23/17 Thomson Reuters Corp., 1.65%, 9/29/17 Total Capital International SA, 0.88%, 8/10/18 TransAlta Corp., 1.90%, 6/03/17 TSMC Global Ltd. 144A, 0.95%, 4/03/16 (a) UBS AG/Stamford CT, 1.03%, 3/26/18 Union Bank NA, 1.08%, 9/26/16 United Utilities Water PLC, 6.13%, 12/29/15 GBP (b) 1,000,000 UnitedHealth Group Inc., 0.77%, 1/17/17 500,000 UnitedHealth Group Inc., 1.45%, 7/17/17 300,000 Ventas Realty LP, 1.25%, 4/17/17 430,000 Ventas Realty LP, 1.55%, 9/26/16 2,200,000 Verizon Communications Inc., 0.73%, 6/09/17 210,000 Verizon Communications Inc., 1.10%, 6/17/19 850,000 Verizon Communications Inc., 2.09%, 9/14/18 9,200,000 Volvo Treasury AB, 0.88%, 6/03/16 SEK (b) 250,000 Walgreens Boots Alliance Inc., 1.75%, 11/17/17 570,000 WEA Finance LLC / Westfield UK & Europe Finance PLC 144A, 1.75%, 9/15/17 (a) 400,000 Whirlpool Corp., 1.65%, 11/01/17 640,000 Windstream Corp., 7.88%, 11/01/17 400,000 WM Wrigley Jr. Co.
144A, 1.40%, 10/21/16 (a) 410,000 Xcel Energy Inc., 0.75%, 5/09/16 1,190,000 Zimmer Holdings Inc., 1.45%, 4/01/17 Total Corporate Bond (Cost - $176,381) FDIC Guaranteed (0%) 100,303 FDIC Structured Sale Guaranteed Notes 144A, 0.74%, 2/25/48 (a) 1,777,500 FDIC Structured Sale Guaranteed Notes 144A, 0.91%, 12/04/20 (a) Total FDIC Guaranteed (Cost - $1,878) Foreign Government (3%) 1,600,000 Instituto de Credito Oficial 144A, 1.13%, 4/01/16 (a) 960,000,000 Japan Government Two Year Bond, 0.10%, 3/15/16 JPY (b) 1,600,000 Province of New Brunswick Canada, 0.96%, 8/01/19 CAD (b) Total Foreign Government (Cost - $11,071) Mortgage Backed (9%) 41,459 Bear Stearns ALT-A Trust, 2.46%, 3/25/34 2,304,538 BLCP Hotel Trust 2014-CLRN 144A, 1.15%, 8/15/29 (a) 1,770,000 Del Coronado Trust 144A, 1.00%, 3/15/26 (a) 985,424 Fannie Mae Connecticut Avenue Securities, 1.15%, 5/25/24 2,051,419 Fannie Mae Connecticut Avenue Securities, 1.39%, 7/25/24 2,240,000 Fannie Mae Connecticut Avenue Securities, 1.79%, 4/25/28 1,122,235 Fannie Mae Connecticut Avenue Securities, 1.80%, 1/25/24 12 Payden Mutual Funds $ Principal or Shares 1,006 447 801 330 1,763 300 770 672 128 459 1,499 1,753 1,555 1,001 503 299 432 2,194 209 874 1,081 250 568 401 681 401 410 1,188 173,852 100 1,784 1,884 1,602 7,959 1,220 10,781 40 2,293 1,770 976 2,047 2,243 1,125 Value (000) Security Description 922,051 Fannie Mae Connecticut Avenue Securities, 2.20%, 10/25/23 4,400,000 FFCB, 0.23%, 1/02/18 385,527 FH 1B2612 ARM, 2.30%, 11/01/34 168,660 FH 847515 ARM, 2.40%, 2/01/34 73,048 FN 708229 ARM, 2.06%, 4/01/33 1,235,893 FN 784365 ARM, 1.93%, 5/01/34 1,248,735 FN 870542 ARM, 2.14%, 3/01/36 67,436 FN 878544 ARM, 2.48%, 3/01/36 285,151 FN 889821 ARM, 2.23%, 12/01/36 951,609 FN 906140 ARM, 2.23%, 1/01/37 367,184 FN AD0079 ARM, 2.36%, 11/01/35 637,338 FN AL0502 ARM, 3.01%, 6/01/41 684,435 Freddie Mac Structured Agency Credit Risk Debt Notes, 1.20%, 2/25/24 558,908 Freddie Mac Structured Agency Credit Risk Debt Notes, 1.65%, 11/25/23 185,410 GNR 2002-48 FT, 0.40%, 12/16/26 850,000 Granite Master Issuer PLC, 1.06%, 12/17/54 609,969 Harborview Mortgage Loan Trust, 2.84%, 1/19/35 1,241,686 Hilton USA Trust 2013-HLF 144A, 1.19%, 11/05/30 (a) 1,200,000 JP Morgan Chase Commercial Mortgage Securities Trust 2015-COSMO 144A, 1.45%, 1/15/32 (a) 1,917,872 JP Morgan Seasoned Mortgage Trust 2014-1 144A, 0.70%, 5/25/33 (a) 124,974 MASTR Asset Securitization Trust, 5.00%, 7/25/19 2,500,000 Pepper Residential Securities Trust No 14, 0.53%, 6/12/16 2,400,000 Permanent Master Issuer PLC, 0.82%, 7/15/42 133,523 Sequoia Mortgage Trust, 0.99%, 10/20/27 693,801 Sequoia Mortgage Trust, 1.45%, 2/25/43 846,371 Sequoia Mortgage Trust, 1.55%, 4/25/43 258,222 Sequoia Mortgage Trust, 2.87%, 1/25/42 648,613 Springleaf Mortgage Loan Trust 144A, 1.27%, 6/25/58 (a) 363,556 Springleaf Mortgage Loan Trust 144A, 1.78%, 12/25/65 (a) 565,686 Springleaf Mortgage Loan Trust 144A, 1.87%, 9/25/57 (a) 249,942 Structured Adjustable Rate Mortgage Loan Trust, 2.48%, 9/25/34 72,497 Structured Asset Mortgage Investments Inc., 3.72%, 7/25/32 Total Mortgage Backed (Cost - $37,537) Municipal (0%) 260,000 California Earthquake Authority, 1.19%, 7/01/16 1,090,000 Indiana Finance Authority, 0.60%, 5/01/34 Total Municipal (Cost - $1,350) NCUA Guaranteed (1%) 640,027 NCUA Guaranteed Notes Trust 2010-R1, 0.65%, 10/07/20 $ 930 4,401 412 180 77 1,297 1,330 72 303 1,016 391 670 684 559 186 839 571 1,232 1,196 1,853 127 2,500 2,400 131 674 823 260 650 365 567 217 75 37,482 261 1,090 1,351 643 . Principal or Shares NCUA Guaranteed Notes Trust 2010-R2, 0.56%, 11/06/17 1,831,217 NCUA Guaranteed Notes Trust 2010-R3, 0.75%, 12/08/20 606,718 NCUA Guaranteed Notes Trust 2011-R1, 0.65%, 1/08/20 42,193 NCUA Guaranteed Notes Trust 2011-R2, 0.59%, 2/06/20 402,682 NCUA Guaranteed Notes Trust 2011-R5, 0.57%, 4/06/20 Total NCUA Guaranteed (Cost - $3,842) U.S. Government Agency (3%) 14,400,000 FHLMC, 0.20%, 4/20/17 (Cost - $14,397) U.S. Treasury (15%) 5,500,000 U.S. Treasury Note, 0.16%, 10/31/16 (d) 22,210,000 U.S.
Treasury Note, 0.19%, 1/31/17 1,000,000 U.S. Treasury Note, 0.25%, 4/15/16 5,000,000 U.S. Treasury Note, 0.38%, 5/31/16 16,800,000 U.S.
Treasury Note, 0.50%, 8/31/16 14,510,000 U.S. Treasury Note, 0.63%, 9/30/17 Total U.S. Treasury (Cost - $65,051) Purchased Put Options (0%) 146 Eurodollar 1-Year Mid-Curve Option, 97.5, 3/11/16 85 Eurodollar 1-Year Mid-Curve Option, 97.875, 12/11/15 Total Purchased Put Options (Cost - $41) Investment Company (2%) 6,386,564 Payden Cash Reserves Money Market Fund * (Cost - $6,387) Total (Cost - $427,400) (100%) Liabilities in excess of Other Assets (0%) Net Assets (100%) Open Forward Currency Contracts to USD Value (000) Security Description 311,891 $ 313 1,845 609 42 403 3,855 Delivery Date Assets: 11/9/2015 11/9/2015 11/9/2015 Liabilities: 11/9/2015 11/9/2015 Unrealized Appreciation (Depreciation) (000s) Currency (000s) Counterparty Euro (Sell 4,835) Japanese Yen (Sell 960,500) Swedish Krona (Sell 9,256) Citibank, N.A. Barclays Bank PLC BNP PARIBAS $ 88 15 25 $ 128 British Pound (Sell 6,357) HSBC Bank USA, N.A. Royal Bank of Canada $(176) Canadian Dollar (Sell 5,942) (11) $(187) 14,402 5,499 22,209 1,000 5,002 16,814 14,479 65,003 1 1 2 $ 6,387 423,840 (844) 422,996 * Affiliated investment (a) Security offered only to qualified institutional investors, and thus is not registered for sale to the public under rule 144A of the Securities Act of 1933. It has been deemed liquid under guidelines approved by the Board. (b) Principal in foreign currency. (c) Variable rate security.
The rate shown reflects the rate in effect at October 31, 2015. The stated maturity is subject to prepayments. See Note 2 in the Notes to Financial Statements. (d) All or a portion of the security is pledged to cover futures contract margin requirements. See notes to financial statements. Annual Report 13 .
Payden Low Duration Fund The Fund seeks a high level of total return that is consistent with preservation of capital by generally investing in investment grade securities with a maximum average portfolio maturity not to exceed three years. $16,000 Portfolio Composition - percent of value $13,000 Corporate U.S. Treasury Asset Backed Mortgage Backed Other One Year 0.50% $15,000 Ten Year 2.93% Fund $13,350 Bank of America Merrill Lynch 1-3 Year Treasury Index $12,838 $14,000 49% 27% 12% 7% 5% Five Year 1.37% $12,000 $11,000 $10,000 $9,000 10/31/05 10/10 10/31/15 Past performance does not predict future returns. The graph does not reflect the impact of taxes or transaction costs a shareholder would pay. This information is not part of the audited financial statements. Schedule of Investments - October 31, 2015 Principal or Shares Security Description Asset Backed (12%) 2,089,063 American Homes 4 Rent 2014-SFR1 144A, 1.25%, 6/17/31 (a) 6,360,000 Apidos CLO 144A, 1.47%, 4/15/25 (a) 500,000 Apidos CLO 144A, 2.02%, 4/15/25 (a) 2,000,000 Babson CLO Ltd. 144A, 1.42%, 4/20/25 (a) 1,900,000 Babson CLO Ltd.
144A, 3.17%, 4/20/27 (a) 7,420,000 Barclays Dryrock Issuance Trust 2015-4, 1.72%, 8/16/21 670,000 Capital Auto Receivables Asset Trust 2013-1, 1.29%, 4/20/18 845,000 Capital Auto Receivables Asset Trust 2013-1, 1.74%, 10/22/18 4,915,000 Capital Auto Receivables Asset Trust 2015-2, 1.39%, 9/20/18 4,550,000 Cent CLO LP 144A, 1.44%, 7/23/25 (a) 1,900,000 Chase Issuance Trust, 0.45%, 4/15/19 2,242,159 Colony American Homes 2014-1 144A, 1.40%, 5/17/31 (a) 2,265,848 Colony American Homes 2014-2 144A, 1.15%, 7/17/31 (a) 4,905,000 Dryden XXII Senior Loan Fund 144A, 1.42%, 8/15/25 (a) 3,140,000 Dryden XXII Senior Loan Fund 144A, 1.87%, 8/15/25 (a) 550,000 Dryden XXXI Senior Loan Fund 144A, 2.22%, 4/18/26 (a) 685,000 Dryden XXXI Senior Loan Fund 144A, 3.17%, 4/18/26 (a) 3,340,000 Fifth Third Auto Trust 2015-1, 1.02%, 5/15/18 750,000 Great America Leasing Receivables Funding LLC 144A, 1.83%, 6/17/19 (a) 1,238,491 GSAMP Trust, 0.85%, 3/25/34 2,634,270 Invitation Homes 2013-SFR1 Trust 144A, 1.40%, 12/17/30 (a) 14 Payden Mutual Funds Value (000) Principal or Shares Value (000) Security Description 4,020,000 $ 2,048 6,238 488 1,967 1,862 7,418 669 847 4,912 4,455 1,890 2,203 2,214 4,820 3,049 537 668 3,340 750 1,241 2,599 Invitation Homes 2014-SFR2 Trust 144A, 1.30%, 9/17/31 (a) 4,025,134 Kubota Credit Owner Trust 2015-1 144A, 0.94%, 12/15/17 (a) 763,057 L.A. Arena Funding LLC 144A, 7.66%, 12/15/26 (a) 1,200,000 Madison Park Funding XVII Ltd 144A, 3.18%, 7/21/27 (a) 1,850,000 Mercedes Benz Auto Lease Trust 2015-A, 1.10%, 8/15/17 3,675,000 Octagon Investment Partners XIX Ltd. 144A, 2.32%, 4/15/26 (a) 2,500,000 Octagon Investment Partners XXIII Ltd.
144A, 2.29%, 2/25/28 (a) 8,300,000 Symphony CLO XV Ltd. 144A, 1.77%, 10/17/26 (a) 196,076 Toyota Auto Receivables 2013-A Owner Trust, 0.55%, 1/17/17 4,250,000 Trade MAPS 1 Ltd. 144A, 0.90%, 12/10/18 (a) 2,085,000 Tyron Park CLO Ltd.
144A, 1.44%, 7/15/25 (a) 4,215,000 Tyron Park CLO Ltd. 144A, 1.85%, 7/15/25 (a) 1,160,000 Venture XVII CLO Ltd. 144A, 3.17%, 7/15/26 (a) 1,893,294 VOLT XXII LLC 144A, 3.50%, 2/25/55 (a) 1,041,646 VOLT XXV LLC 144A, 3.50%, 6/26/45 (a) 2,668,863 VOLT XXXIII LLC 144A, 3.50%, 3/25/55 (a) Total Asset Backed (Cost - $98,501) Bank Loans(b) (2%) 2,522,813 Activision Blizzard Inc.
Term Loan B 1L, 3.25%, 10/11/20 2,940,000 American Builders & Contractors Supply Co. Inc. Term Loan B1 IL, 3.50%, 4/16/20 3,307,182 CDW LLC/CDW Finance Corp. Term Loan B 1L, 3.50%, 4/29/20 $ 3,947 4,025 836 1,174 1,852 3,610 2,500 8,213 196 4,241 2,054 4,095 1,116 1,881 1,034 2,652 97,641 2,533 2,927 3,302 .
Principal or Shares Value (000) Security Description Dole Food Co. Inc. Term Loan B 1L, 4.50%, 11/01/18 3,825,466 General Nutrition Co. Inc.
Term Loan B 1L, 3.25%, 3/26/19 2,939,698 Starwood Property Trust Inc. Term Loan 1L, 3.50%, 4/19/20 Total Bank Loans (Cost - $18,333) Commercial Paper (1%) 5,000,000 Consolidated Edison 144A, 0.00%, 11/04/15 (a) (Cost - $5,000) Corporate Bond (50%) 2,923,000 Abbey National Treasury Services PLC, 1.38%, 3/13/17 2,680,000 AbbVie Inc., 1.75%, 11/06/17 2,850,000 AbbVie Inc., 1.80%, 5/14/18 1,400,000 Actavis Funding SCS, 1.30%, 6/15/17 1,640,000 Actavis Funding SCS, 1.59%, 3/12/20 3,242,000 Actavis Funding SCS, 2.35%, 3/12/18 2,210,000 AES Corp./VA, 3.32%, 6/01/19 1,200,000 AIA Group Ltd. 144A, 2.25%, 3/11/19 (a) 5,200,000 Air Lease Corp., 4.50%, 1/15/16 1,615,000 Aircastle Ltd., 6.75%, 4/15/17 1,200,000 Alibaba Group Holding Ltd.
144A, 1.63%, 11/28/17 (a) 400,000 Alibaba Group Holding Ltd. 144A, 2.50%, 11/28/19 (a) 1,565,000 Alliance Data Systems Corp. 144A, 5.25%, 12/01/17 (a) 1,725,000 Allied Irish Banks PLC, 2.88%, 11/28/16 EUR (c) 2,110,000 Ally Financial Inc., 3.25%, 9/29/17 3,100,000 American Express Co., 0.92%, 5/22/18 1,000,000 Anglo American Capital PLC 144A, 1.27%, 4/15/16 (a) 2,000,000 Anthem Inc., 2.38%, 2/15/17 2,400,000 ANZ New Zealand International Ltd./London 144A, 1.75%, 3/29/18 (a) 1,520,000 Ardagh Packaging Finance PLC / Ardagh Holdings USA Inc.
144A, 3.34%, 12/15/19 (a) 1,650,000 Astoria Financial Corp., 5.00%, 6/19/17 850,000 Autodesk Inc., 1.95%, 12/15/17 450,000 Avis Budget Car Rental LLC / Avis Budget Finance Inc., 3.07%, 12/01/17 870,000 Avis Budget Car Rental LLC / Avis Budget Finance Inc., 4.88%, 11/15/17 930,000 Baidu Inc., 2.25%, 11/28/17 3,815,000 Bank of America Corp., 1.20%, 4/01/19 1,580,000 Bank of America Corp., 1.36%, 1/15/19 1,510,000 Bank of America Corp., 1.70%, 8/25/17 1,180,000 Bank of America Corp., 3.75%, 7/12/16 1,750,000 Bank of Tokyo-Mitsubishi UFJ Ltd. 144A, 1.20%, 3/10/17 (a) 2,000,000 Bank of Tokyo-Mitsubishi UFJ Ltd. 144A, 1.45%, 9/08/17 (a) 2,510,000 Barclays Bank PLC, 0.90%, 2/17/17 1,260,000 BAT International Finance PLC 144A, 0.85%, 6/15/18 (a) Principal or Shares 2,780,025 1,680,000 $ 2,783 3,709 2,910 18,164 5,000 2,925 2,707 2,854 1,388 1,622 3,259 2,111 1,202 5,233 1,720 1,194 394 1,620 1,935 2,128 3,097 995 2,025 2,402 1,501 1,721 854 454 893 931 3,809 1,588 1,515 1,203 690,000 3,500,000 5,000,000 5,140,000 880,000 2,962,000 2,500,000 931,000 1,510,000 2,030,000 1,550,000 2,370,000 600,000 760,000 1,440,000 1,465,000 1,500,000 2,140,000 520,000 730,000 990,000 1,068,000 2,920,000 2,100,000 3,500,000 2,478,000 2,700,000 1,730,000 1,400,000 1,400,000 925,000 1,890,000 1,740,000 1,550,000 3,050,000 1,420,000 4,010,000 1,600,000 1,800,000 2,200,000 1,742 2,000 2,510 1,260 730,000 1,175,000 2,600,000 2,070,000 1,040,000 Value (000) Security Description BAT International Finance PLC 144A, 1.85%, 6/15/18 (a) Baxalta Inc.
144A, 2.00%, 6/22/18 (a) BB&T Corp., 0.99%, 2/01/19 Bear Stearns Companies LLC, 5.55%, 1/22/17 Becton Dickinson and Co., 1.45%, 5/15/17 Becton Dickinson and Co., 1.80%, 12/15/17 Bell Canada, 1.33%, 4/22/16 CAD (c) BNZ International Funding Ltd./London 144A, 1.90%, 2/26/18 (a) Boardwalk Pipelines LP, 5.88%, 11/15/16 BP Capital Markets PLC, 0.96%, 9/26/18 BPCE SA, 1.57%, 4/25/16 BPCE SA, 1.63%, 2/10/17 BPCE SA, 1.63%, 1/26/18 British Telecommunications PLC, 1.25%, 2/14/17 Cameron International Corp., 1.40%, 6/15/17 Canadian Natural Resources Ltd., 1.75%, 1/15/18 Capital One Financial Corp., 6.15%, 9/01/16 Capital One NA/Mclean VA, 1.50%, 9/05/17 Capital One NA/Mclean VA, 1.65%, 2/05/18 Carnival Corp., 1.88%, 12/15/17 CC Holdings GS V LLC / Crown Castle GS III Corp., 2.38%, 12/15/17 Celgene Corp., 2.13%, 8/15/18 CIT Group Inc., 5.25%, 3/15/18 Citigroup Inc., 1.12%, 4/01/16 Citigroup Inc., 1.24%, 11/30/17 EUR (c) Citigroup Inc., 1.55%, 8/14/17 Citigroup Inc., 5.50%, 2/15/17 Citizens Bank NA/Providence RI, 1.60%, 12/04/17 CNH Industrial Capital LLC 144A, 3.88%, 7/16/18 (a) CNOOC Finance 2013 Ltd., 1.13%, 5/09/16 CNPC General Capital Ltd. 144A, 1.21%, 5/14/17 (a) Coca-Cola Co., 0.88%, 10/27/17 Commonwealth Bank of Australia/New York NY, 1.75%, 11/02/18 Compass Bank, 1.85%, 9/29/17 ConocoPhillips Co., 1.50%, 5/15/18 Credit Agricole SA 144A, 1.17%, 10/03/16 (a) Credit Agricole SA/London 144A, 1.12%, 4/15/19 (a) Credit Suisse/New York NY, 1.38%, 5/26/17 Credit Suisse/New York NY, 1.75%, 1/29/18 Daimler Finance North America LLC 144A, 1.38%, 8/01/17 (a) Daimler Finance North America LLC 144A, 1.65%, 3/02/18 (a) DBS Bank Ltd. 144A, 0.93%, 7/15/21 (a) DENTSPLY International Inc., 2.75%, 8/15/16 Discover Bank/Greenwood DE, 2.60%, 11/13/18 DISH DBS Corp., 4.63%, 7/15/17 Duke Energy Corp., 0.70%, 4/03/17 $ 1,689 689 3,489 5,240 5,140 885 2,264 2,505 959 1,505 2,038 1,554 2,379 600 754 1,419 1,524 1,493 2,129 523 735 998 1,123 2,924 2,311 3,500 2,604 2,680 1,739 1,399 1,395 923 1,888 1,733 1,549 3,061 1,411 4,008 1,605 1,788 2,188 729 1,189 2,616 2,132 1,038 Annual Report 15 .
Payden Low Duration Fund continued Principal or Shares 2,100,000 1,020,000 800,000 1,900,000 1,900,000 1,650,000 1,125,000 2,700,000 1,070,000 585,000 830,000 960,000 3,300,000 2,900,000 1,130,000 2,000,000 1,500,000 1,000,000 1,320,000 1,700,000 3,900,000 1,580,000 3,258,000 3,280,000 248,000 3,110,000 1,600,000 1,741,000 2,000,000 2,390,000 2,695,000 860,000 3,260,000 2,950,000 2,970,000 2,590,000 670,000 1,410,000 800,000 800,000 880,000 2,250,000 1,200,000 720,000 Value (000) Security Description EDP Finance BV 144A, 6.00%, 2/02/18 (a) Electricite de France 144A, 0.78%, 1/20/17 (a) Enbridge Inc., 0.78%, 6/02/17 Enbridge Inc., 0.98%, 10/01/16 Enbridge Inc., 1.21%, 3/13/17 CAD (c) Enterprise Products Operating LLC, 3.20%, 2/01/16 ERAC USA Finance LLC 144A, 1.40%, 4/15/16 (a) European Investment Bank, 1.13%, 8/15/18 Express Scripts Holding Co., 1.25%, 6/02/17 Fidelity National Information Services Inc., 1.45%, 6/05/17 Fidelity National Information Services Inc., 2.00%, 4/15/18 Fifth Third Bancorp, 5.45%, 1/15/17 FMS Wertmanagement AoeR, 0.63%, 1/30/17 FMS Wertmanagement AoeR, 1.13%, 9/05/17 Ford Motor Credit Co. LLC, 1.68%, 9/08/17 Ford Motor Credit Co. LLC, 2.15%, 1/09/18 Ford Motor Credit Co. LLC, 3.00%, 6/12/17 Freeport-McMoRan Inc., 2.15%, 3/01/17 Freeport-McMoRan Inc., 2.30%, 11/14/17 GATX Corp., 2.50%, 7/30/19 General Motors Financial Co.
Inc., 2.40%, 4/10/18 General Motors Financial Co. Inc., 3.00%, 9/25/17 Glencore Finance Canada Ltd. 144A, 2.70%, 10/25/17 (a) Glencore Funding LLC 144A, 1.68%, 1/15/19 (a) Glencore Funding LLC 144A, 2.13%, 4/16/18 (a) Goldman Sachs Group Inc., 1.52%, 4/30/18 Goldman Sachs Group Inc., 3.63%, 2/07/16 Goldman Sachs Group Inc., 5.63%, 1/15/17 Goldman Sachs Group Inc., 5.95%, 1/18/18 Harley-Davidson Financial Services Inc.
144A, 2.15%, 2/26/20 (a) Hertz Corp., 6.75%, 4/15/19 Hess Corp., 1.30%, 6/15/17 Hewlett Packard Enterprise Co. 144A, 2.45%, 10/05/17 (a) Hewlett Packard Enterprise Co. 144A, 2.85%, 10/05/18 (a) HSBC Bank PLC 144A, 0.96%, 5/15/18 (a) HSBC USA Inc., 1.70%, 3/05/18 Huntington National Bank, 0.74%, 4/24/17 Huntington National Bank, 1.30%, 11/20/16 Huntington National Bank, 1.35%, 8/02/16 Huntington National Bank, 1.38%, 4/24/17 Hutchison Whampoa International 12 II Ltd. 144A, 2.00%, 11/08/17 (a) Hyundai Capital America 144A, 1.45%, 2/06/17 (a) Hyundai Capital America 144A, 2.00%, 3/19/18 (a) Hyundai Capital America 144A, 3.75%, 4/06/16 (a) 16 Payden Mutual Funds $ Principal or Shares 2,237 1,021 786 1,892 1,439 770,000 1,670,000 1,210,000 2,820,000 1,658 3,200,000 1,126 2,697 1,066 579 818 1,001 3,297 2,911 1,123 2,001 1,524 970 1,246 1,692 3,864 1,750,000 2,600,000 1,550,000 1,300,000 620,000 640,000 1,600,000 2,770,000 2,380,000 1,385,000 1,030,000 3,140,000 1,425,000 1,440,000 2,570,000 2,950,000 1,970,000 1,598 3,035 2,628 217 3,141 1,612 1,825 2,183 2,366 2,772 853 3,271 2,958 2,965 2,589 666 1,410 802 797 1,160,000 2,700,000 760,000 280,000 2,000,000 1,300,000 700,000 1,380,000 1,080,000 2,280,000 2,195,000 4,000,000 3,000,000 1,510,000 830,000 3,750,000 1,520,000 4,700,000 2,200,000 885 2,241 750,000 1,040,000 1,192 1,240,000 728 2,650,000 1,130,000 Value (000) Security Description IAC/InterActiveCorp 144A, 4.88%, 11/30/18 (a) Imperial Tobacco Finance PLC 144A, 2.05%, 7/20/18 (a) Industrial & Commercial Bank of China Ltd./New York, 2.35%, 11/13/17 International Lease Finance Corp., 2.29%, 6/15/16 International Lease Finance Corp., 3.88%, 4/15/18 JB Hunt Transport Services Inc., 2.40%, 3/15/19 JPMorgan Chase & Co., 1.07%, 5/30/17 GBP (c) JPMorgan Chase & Co., 1.22%, 1/25/18 KeyBank NA/Cleveland OH, 5.45%, 3/03/16 Kinder Morgan Inc./DE, 2.00%, 12/01/17 Kinder Morgan Inc./DE, 3.05%, 12/01/19 Korea Expressway Corp.
144A, 1.63%, 4/28/17 (a) Kraft Heinz Foods Co. 144A, 1.60%, 6/30/17 (a) Kraft Heinz Foods Co. 144A, 2.00%, 7/02/18 (a) Kroger Co., 2.20%, 1/15/17 L-3 Communications Corp., 1.50%, 5/28/17 L-3 Communications Corp., 3.95%, 11/15/16 Liberty Property LP, 6.63%, 10/01/17 Macquarie Bank Ltd.
144A, 0.95%, 10/27/17 (a) Macquarie Bank Ltd. 144A, 1.60%, 10/27/17 (a) Macquarie Group Ltd. 144A, 1.33%, 1/31/17 (a) Manufacturers & Traders Trust Co., 1.25%, 1/30/17 Marathon Oil Corp., 0.90%, 11/01/15 Martin Marietta Materials Inc., 1.43%, 6/30/17 McGraw Hill Financial Inc.
144A, 3.30%, 8/14/20 (a) McGraw Hill Financial Inc., 5.90%, 11/15/17 Metropolitan Life Global Funding I 144A, 0.70%, 4/10/17 (a) Mitsubishi UFJ Trust & Banking Corp. 144A, 1.60%, 10/16/17 (a) Mizuho Bank Ltd. 144A, 0.78%, 9/25/17 (a) Mizuho Bank Ltd.
144A, 1.30%, 4/16/17 (a) Mizuho Bank Ltd. 144A, 1.70%, 9/25/17 (a) Mobile Mini Inc., 7.88%, 12/01/20 Morgan Stanley, 1.06%, 7/23/19 Morgan Stanley, 1.46%, 1/27/20 Morgan Stanley, 5.45%, 1/09/17 Morgan Stanley, 6.63%, 4/01/18 Murphy Oil Corp., 2.50%, 12/01/17 Nabors Industries Inc., 2.35%, 9/15/16 National Oilwell Varco Inc., 1.35%, 12/01/17 Nederlandse Waterschapsbank NV 144A, 1.25%, 9/18/17 (a) New York Life Global Funding 144A, 1.55%, 11/02/18 (a) Newell Rubbermaid Inc., 2.15%, 10/15/18 NextEra Energy Capital Holdings Inc., 1.59%, 6/01/17 Nissan Motor Acceptance Corp. 144A, 1.95%, 9/12/17 (a) Nomura Holdings Inc., 1.79%, 9/13/16 Nordea Bank AB 144A, 1.88%, 9/17/18 (a) $ 794 1,672 1,220 2,822 3,256 1,763 3,959 1,557 1,319 607 621 1,600 2,773 2,389 1,407 1,015 3,204 1,552 1,433 2,558 2,956 1,971 1,160 2,683 774 300 2,002 1,296 697 1,375 1,078 2,383 2,173 4,021 3,143 1,678 814 3,732 1,508 4,722 2,197 750 1,040 1,248 2,664 1,133 .
Principal or Shares 1,685,000 540,000 2,900,000 1,500,000 1,500,000 2,030,000 1,470,000 1,860,000 1,450,000 1,880,000 1,700,000 830,000 1,885,000 4,520,000 1,400,000 3,992,857 6,050,000 2,130,000 3,510,000 850,000 2,000,000 3,330,000 750,000 840,000 1,045,000 3,210,000 1,800,000 1,695,000 950,000 700,000 1,690,000 1,670,000 1,500,000 487,000 670,000 910,000 3,100,000 650,000 2,590,000 1,830,000 1,400,000 25,400,000 1,200,000 680,000 Value (000) Security Description Parker Hannifin Corp., 4.13%, 11/11/15 EUR (c) Penske Truck Leasing Co. LP / PTL Finance Corp. 144A, 2.50%, 6/15/19 (a) Penske Truck Leasing Co. LP / PTL Finance Corp.
144A, 3.20%, 7/15/20 (a) Perrigo Co. PLC, 1.30%, 11/08/16 Prudential Financial Inc., 1.10%, 8/15/18 Regions Financial Corp., 2.00%, 5/15/18 Reliance Standard Life Global Funding II 144A, 2.15%, 10/15/18 (a) Reynolds American Inc., 2.30%, 6/12/18 Rogers Communications Inc., 1.36%, 3/13/17 CAD (c) Sabine Pass LNG LP, 7.50%, 11/30/16 Santander Bank NA, 2.00%, 1/12/18 SBA Communications Corp., 5.63%, 10/01/19 Seagate HDD Cayman, 3.75%, 11/15/18 Siemens Financieringsmaatschappij NV 144A, 1.45%, 5/25/18 (a) Sinopec Capital 2013 Ltd. 144A, 1.25%, 4/24/16 (a) Southern California Edison Co., 1.85%, 2/01/22 Sparebank 1 Boligkreditt AS 144A, 2.63%, 5/27/16 (a) St Jude Medical Inc., 2.00%, 9/15/18 Standard Chartered PLC 144A, 1.50%, 9/08/17 (a) Sumitomo Mitsui Banking Corp., 0.99%, 7/19/16 Suntory Holdings Ltd.
144A, 1.65%, 9/29/17 (a) SunTrust Bank/Atlanta GA, 5.20%, 1/17/17 Synchrony Financial, 1.56%, 2/03/20 Synchrony Financial, 1.88%, 8/15/17 Synchrony Financial, 3.00%, 8/15/19 Talen Energy Supply LLC 144A, 4.63%, 7/15/19 (a) Tencent Holdings Ltd. 144A, 2.00%, 5/02/17 (a) Tenet Healthcare Corp., 6.25%, 11/01/18 Thermo Fisher Scientific Inc., 1.30%, 2/01/17 Thomson Reuters Corp., 1.30%, 2/23/17 Thomson Reuters Corp., 1.65%, 9/29/17 TIAA Asset Management Finance Co. LLC 144A, 2.95%, 11/01/19 (a) Total Capital International SA, 0.88%, 8/10/18 TransAlta Corp., 1.90%, 6/03/17 TSMC Global Ltd.
144A, 0.95%, 4/03/16 (a) TSMC Global Ltd. 144A, 1.63%, 4/03/18 (a) UBS AG/Stamford CT, 1.80%, 3/26/18 Ventas Realty LP, 1.25%, 4/17/17 Verizon Communications Inc., 1.10%, 6/17/19 Verizon Communications Inc., 2.09%, 9/14/18 Volkswagen Group of America Finance LLC 144A, 1.60%, 11/20/17 (a) Volvo Treasury AB, 0.88%, 6/03/16 SEK (c) Walgreens Boots Alliance Inc., 0.77%, 5/18/16 Walgreens Boots Alliance Inc., 1.75%, 11/17/17 $ Principal or Shares 1,854 535 2,915 1,484 1,505 2,030 1,469 1,888 1,104 1,949 1,694 870 1,909 4,513 1,401 3,969 6,115 2,139 3,491 852 1,995 3,470 742 841 1,057 2,953 1,803 1,814 949 699 1,690 1,693 1,503 481 668 896 3,106 647 2,582 1,881 1,361 2,985 1,199 680 Value (000) Security Description 1,500,000 Want Want China Finance Ltd. 144A, 1.88%, 5/14/18 (a) 580,000 WEA Finance LLC / Westfield UK & Europe Finance PLC 144A, 1.75%, 9/15/17 (a) 700,000 WEA Finance LLC / Westfield UK & Europe Finance PLC 144A, 2.70%, 9/17/19 (a) 970,000 Welltower Inc., 3.63%, 3/15/16 1,590,000 Windstream Corp., 7.88%, 11/01/17 2,140,000 WPX Energy Inc., 5.25%, 1/15/17 1,810,000 Zimmer Holdings Inc., 2.00%, 4/01/18 560,000 Zimmer Holdings Inc., 2.70%, 4/01/20 Total Corporate Bond (Cost - $411,438) FDIC Guaranteed (1%) 401,210 FDIC Structured Sale Guaranteed Notes 144A, 0.74%, 2/25/48 (a) 5,160,484 FDIC Structured Sale Guaranteed Notes 144A, 0.91%, 12/04/20 (a) 1,019,667 FDIC Structured Sale Guaranteed Notes 144A, 3.25%, 4/25/38 (a) 1,310,543 FDIC Trust 144A, 2.18%, 5/25/50 (a) Total FDIC Guaranteed (Cost - $7,888) Foreign Government (0%) 3,610,000 Instituto de Credito Oficial 144A, 1.13%, 4/01/16 (a) (Cost - $3,607) Mortgage Backed (7%) 799,723 Bank of America Mortgage 2002-K Trust, 2.71%, 10/20/32 5,281,233 BLCP Hotel Trust 2014-CLRN 144A, 1.15%, 8/15/29 (a) 2,200,000 CIFC Funding 2015-II Ltd.
144A, 3.32%, 4/15/27 (a) 2,586,602 Credit Suisse Mortgage Capital Certificates 144A, 1.55%, 4/25/43 (a) 2,177,930 Fannie Mae Connecticut Avenue Securities, 1.15%, 5/25/24 1,115,250 Fannie Mae Connecticut Avenue Securities, 1.15%, 5/25/24 4,585,914 Fannie Mae Connecticut Avenue Securities, 1.39%, 7/25/24 2,493,856 Fannie Mae Connecticut Avenue Securities, 1.80%, 1/25/24 1,367,606 Fannie Mae Connecticut Avenue Securities, 2.20%, 10/25/23 1,508,284 FN 708229 ARM, 2.06%, 4/01/33 370,456 FN 743821 ARM, 2.04%, 11/01/33 453,381 FN 755867 ARM, 2.32%, 12/01/33 487,724 FN 790762 ARM, 2.17%, 9/01/34 541,026 FN 790764 ARM, 2.17%, 9/01/34 567,451 FN 794792 ARM, 2.22%, 10/01/34 825,181 FN 794797 ARM, 2.03%, 10/01/34 1,802,286 Freddie Mac Structured Agency Credit Risk Debt Notes, 1.30%, 5/25/25 1,868,849 Freddie Mac Structured Agency Credit Risk Debt Notes, 1.65%, 11/25/23 1,324,849 Freddie Mac Structured Agency Credit Risk Debt Notes, 8.15%, 5/25/25 $ 1,479 578 698 980 1,692 2,161 1,812 559 406,877 401 5,178 1,052 1,321 7,952 3,616 810 5,256 2,128 2,443 2,157 1,109 4,577 2,499 1,379 1,599 393 481 515 572 600 865 1,796 1,869 1,336 Annual Report 17 . Payden Low Duration Fund continued Principal or Shares Value (000) Security Description 375,000 Freddie Mac Structured Agency Credit Risk Debt Notes, 9.40%, 10/25/27 1,049,516 Freddie Mac Structured Agency Credit Risk Debt Notes, 10.95%, 3/25/25 3,803,895 Hilton USA Trust 2013-HLF 144A, 1.19%, 11/05/30 (a) 569,122 HomeBanc Mortgage Trust, 1.06%, 8/25/29 275,182 Indymac Index Mortgage Loan Trust, 2.77%, 10/25/34 3,200,000 JP Morgan Chase Commercial Mortgage Securities Trust 2015-COSMO 144A, 1.45%, 1/15/32 (a) 1,146,342 JP Morgan Mortgage Trust 144A, 2.50%, 3/25/43 (a) 1,007,343 MLCC Mortgage Investors Inc., 2.13%, 2/25/36 623,169 MLCC Mortgage Investors Inc., 2.20%, 12/25/34 145,441 Morgan Stanley Mortgage Loan Trust 2004-5AR, 2.12%, 7/25/34 2,701,592 Residential Asset Securitization Trust, 6.00%, 8/25/36 360,129 Sequoia Mortgage Trust, 0.99%, 10/20/27 1,572,617 Sequoia Mortgage Trust, 1.45%, 2/25/43 1,707,992 Sequoia Mortgage Trust, 1.55%, 4/25/43 677,833 Sequoia Mortgage Trust, 2.87%, 1/25/42 720,305 Sequoia Mortgage Trust, 3.50%, 4/25/42 2,077,105 Springleaf Mortgage Loan Trust 144A, 1.27%, 6/25/58 (a) 1,118,634 Springleaf Mortgage Loan Trust 144A, 1.78%, 12/25/65 (a) 1,484,174 Structured Adjustable Rate Mortgage Loan Trust, 2.53%, 8/25/34 389,671 Structured Asset Mortgage Investments Inc., 2.17%, 10/19/34 Total Mortgage Backed (Cost - $56,974) Municipal (0%) 1,420,000 California Earthquake Authority, 1.82%, 7/01/17 (Cost - $1,420) NCUA Guaranteed (0%) 56,097 NCUA Guaranteed Notes Trust 2010-R1, 1.84%, 10/07/20 (Cost - $56) U.S. Government Agency (0%) 400,000 FNMA, 1.13%, 3/28/18 (Cost - $400) U.S. Treasury (28%) 40,500,000 U.S. Treasury Note, 0.63%, 7/31/17 8,000,000 U.S.
Treasury Note, 0.63%, 8/31/17 40,366,000 U.S. Treasury Note, 0.63%, 9/30/17 28,125,000 U.S. Treasury Note, 0.88%, 11/15/17 62,100,000 U.S.
Treasury Note, 1.00%, 2/15/18 (d)(e) 19,570,000 U.S. Treasury Note, 1.00%, 8/15/18 28,200,000 U.S. Treasury Note, 1.00%, 9/15/18 Total U.S.
Treasury (Cost - $226,997) 18 Payden Mutual Funds $ 427 1,234 3,776 539 270 3,190 1,149 997 626 145 2,244 353 1,528 1,662 682 728 Principal or Shares Security Description Purchased Put Options (0%) 990 Eurodollar 1-Year Mid-Curve Option, 97.5, 3/11/16 814 Eurodollar 1-Year Mid-Curve Option, 97.875, 12/11/15 Total Purchased Put Options (Cost - $326) Investment Company (1%) 8,216,035 Payden Cash Reserves Money Market Fund * (Cost - $8,216) Total (Cost - $839,156) (102%) Liabilities in excess of Other Assets (-2%) Net Assets (100%) 1,454 328 56,919 6 5 11 $ 8,216 833,231 (12,569) 820,662 Open Forward Currency Contracts to USD Delivery Date Assets: 11/9/2015 11/9/2015 Currency (000s) Counterparty Euro (Sell 5,650) Swedish Krona (Sell 25,554) Citibank, N.A. BNP PARIBAS Unrealized Appreciation (Depreciation) (000s) $103 70 $173 Liabilities: 11/9/2015 1,431 $ * Affiliated investment (a) Security offered only to qualified institutional investors, and thus is not registered for sale to the public under rule 144A of the Securities Act of 1933. It has been deemed liquid under guidelines approved by the Board. (b) Variable rate security. The rate shown reflects the rate in effect at October 31, 2015. The stated maturity is subject to prepayments.
See Note 2 in the Notes to Financial Statements. (c) Principal in foreign currency. (d) All or a portion of security has been pledged in connection with outstanding centrally cleared swaps. (e) All or a portion of the security is pledged to cover futures contract margin requirements. 2,081 1,122 Value (000) 11/9/2015 British Pound (Sell 2,569) Canadian Dollar (Sell 6,296) HSBC Bank USA, N.A. Royal Bank of Canada $ (72) (12) $ (84) 56 Open Futures Contracts 399 40,473 7,988 40,281 28,174 62,284 19,568 28,181 226,949 Number of Contracts 160 Contract Type U.S. Treasury 5 Year Note Future Expiration Date Jan-16 Current Value (000) $(19,164) Unrealized Appreciation (000s) $41 . Open Centrally Cleared Credit Default Swap Contracts Reference Obligations CDX.NA.IG.25 Notional Fund Expiration Principal Pays Clearinghouse Date (000s) 1.00% Chicago Mercantile Dec-20 USD 12,750 Value (000s) $(146) See notes to financial statements. Annual Report 19 . Payden U.S. Government Fund $17,000 The Fund seeks a high level of total return that is consistent with preservation of capital by generally investing in U.S. government obligations with an average portfolio maturity not to exceed five years. $15,000 Five Year 1.03% Investor Class $13,626 Ten Year 3.14% Bank of America Merrill Lynch 1-5 Year Treasury Index $13,664 $14,000 Portfolio Composition - percent of value Mortgage Backed U.S. Government Guaranteed U.S.
Treasury Asset Backed Cash equivalent One Year 1.01% $16,000 $13,000 74% 9% 7% 1% 9% $12,000 $11,000 $10,000 $9,000 10/31/05 10/10 10/31/15 Past performance does not predict future returns. The graph does not reflect the impact of taxes or transaction costs a shareholder would pay. The Fund’s Adviser Class is expected to perform similiarly to its Investor Class. This information is not part of the audited financial statements. Schedule of Investments - October 31, 2015 Principal or Shares Security Description Asset Backed (1%) 2,035,029 United States Small Business Administration, 2.88%, 9/10/21 (Cost - $2,092) FDIC Guaranteed (4%) 430,799 FDIC Structured Sale Guaranteed Notes 144A, 0.90%, 12/29/45 (a) 2,522,903 FDIC Structured Sale Guaranteed Notes 144A, 0.91%, 12/04/20 (a) 1,444,528 FDIC Structured Sale Guaranteed Notes 144A, 3.25%, 4/25/38 (a) 1,390,316 FDIC Trust 144A, 2.18%, 5/25/50 (a) Total FDIC Guaranteed (Cost - $5,804) Mortgage Backed (78%) 610,730 FH 1B8336 ARM, 3.08%, 6/01/41 384,022 FH 1B8378 ARM, 3.15%, 7/01/41 1,747,379 FH 1Q0740 ARM, 2.37%, 3/01/39 1,051,959 FH 1Q1363 ARM, 2.43%, 2/01/36 1,137,626 FH 2B0709 ARM, 2.07%, 8/01/42 1,234,947 FH 2B0721 ARM, 2.23%, 9/01/42 1,127,746 FH 2B0972 ARM, 2.02%, 11/01/42 3,109,569 FH 2B1143 ARM, 2.19%, 2/01/43 1,049,542 FH 2B1286 ARM, 2.06%, 4/01/43 1,130,253 FH 2B1317 ARM, 1.99%, 4/01/43 499,975 FH 849012 ARM, 1.97%, 3/01/43 731,521 FH 849486 ARM, 2.61%, 8/01/41 3,178,745 FH 849506 ARM, 2.95%, 11/01/44 1,956,603 FH 849707 ARM, 2.42%, 2/01/43 2,505,000 FHLMC Multifamily Structured Pass Through Certificates, 1.72%, 1/25/19 2,382,489 FHLMC Multifamily Structured Pass Through Certificates, 3.15%, 2/25/18 540,969 FHR 3997 PJ, 3.00%, 1/15/40 646,111 FHR 4030 CG, 2.50%, 4/15/27 677,191 FHR 4073 BE, 2.00%, 5/15/39 5,000,000 FN, 3.50%, 15YR TBA (b) 479,712 FN 555936 ARM, 2.24%, 9/01/33 20 Payden Mutual Funds Value (000) $ Principal or Shares 2,118 432 2,532 1,490 1,401 5,855 650 406 1,852 1,119 1,170 1,279 1,167 3,190 1,085 1,165 515 776 3,293 2,014 2,525 2,473 547 669 681 5,279 510 1,189,547 613,668 103,589 101,555 127,105 2,052,779 1,116,903 1,843,442 575,627 1,225,636 1,439,901 916,034 984,725 432,479 1,908,032 2,543,023 1,842,196 1,547,428 1,893,619 1,943,765 1,108,811 1,335,070 725,565 1,042,810 1,551,710 540,001 1,221,446 987,700 1,916,735 1,743,955 5,678,523 2,942,010 2,444,410 2,533,105 2,000,000 5,280,000 395,495 1,072,916 Value (000) Security Description FN 784365 ARM, 1.93%, 5/01/34 FN 795816 ARM, 1.98%, 7/01/34 FN 838958 ARM, 2.26%, 8/01/35 FN 849088 ARM, 2.16%, 11/01/35 FN 866093 ARM, 2.38%, 3/01/36 FN 870542 ARM, 2.14%, 3/01/36 FN 890434 15YR, 3.00%, 7/01/27 FN AB7995 10YR, 2.50%, 2/01/23 FN AC0045 ARM, 1.94%, 10/01/38 FN AE0193 ARM, 2.34%, 7/01/40 FN AE0289 ARM, 2.43%, 5/01/40 FN AI4019 ARM, 3.45%, 7/01/41 FN AL0407 30YR, 6.50%, 4/01/39 FN AL0502 ARM, 3.01%, 6/01/41 FN AL1869 15YR, 3.00%, 6/01/27 FN AL2095 15YR, 3.00%, 6/01/27 FN AL2221 15YR, 3.00%, 7/01/27 FN AL5596 ARM, 2.53%, 2/01/44 FN AL5790 ARM, 2.55%, 10/01/44 FN AL5967 ARM, 2.55%, 11/01/44 FN AO2280 ARM, 2.12%, 10/01/42 FN AO7975 15YR, 3.00%, 6/01/27 FN AP0619 ARM, 2.21%, 7/01/42 FN AP4080 ARM, 2.26%, 9/01/42 FN AP4746 15YR, 3.00%, 8/01/27 FN AP7869 ARM, 2.23%, 8/01/42 FN AQ4765 10YR, 2.50%, 11/01/22 FN AU6974 ARM, 2.74%, 11/01/43 FN AU8673 ARM, 2.72%, 2/01/44 FN AY4068 ARM, 2.34%, 4/01/44 FN AY8461 ARM, 2.42%, 8/01/45 FN AZ2886 ARM, 2.69%, 9/01/45 FN AZ4380 ARM, 2.51%, 8/01/45 FN MA1766 10YR, 2.50%, 1/01/24 FN-Aces, 2.03%, 3/25/19 FN-Aces, 2.32%, 11/25/18 FNR 2002-10-FA, 0.95%, 2/25/32 FNR 2011-127 UC, 2.50%, 6/25/39 $ 1,248 644 110 107 137 2,186 1,166 1,894 607 1,309 1,539 971 1,140 455 1,992 2,656 1,923 1,601 1,950 2,002 1,142 1,394 747 1,080 1,620 559 1,255 1,033 1,987 1,789 5,817 3,024 2,515 2,603 2,030 5,417 404 1,091 .
Principal or Shares Value (000) Security Description 562,402 FNW 2002-W6-2A, 6.79%, 6/25/42 501,039 G2 3515 30YR, 5.50%, 2/20/34 2,375,227 G2 5301 15YR, 3.50%, 2/20/27 1,237,982 G2 778200 20YR, 4.00%, 2/20/32 779,968 G2 778203 20YR, 4.75%, 2/20/32 695,971 G2 82457 ARM, 1.75%, 1/20/40 1,531,475 GN 728153, 5.50%, 10/15/29 884,293 GN 737791 30YR, 4.50%, 12/15/40 692,341 GNR 2008-32 PA, 4.00%, 8/16/37 698,882 GNR 2009-26 BA, 4.00%, 1/16/38 17,251,599 GNR 2014-79 ST, 1.15%, 7/20/29 Total Mortgage Backed (Cost - $104,548) NCUA Guaranteed (6%) 1,174,016 NCUA Guaranteed Notes Trust 2010-A1, 0.54%, 12/07/20 920,813 NCUA Guaranteed Notes Trust 2010-R1, 0.65%, 10/07/20 61,985 NCUA Guaranteed Notes Trust 2010-R1, 1.84%, 10/07/20 2,532,859 NCUA Guaranteed Notes Trust 2010-R3, 2.40%, 12/08/20 1,197,215 NCUA Guaranteed Notes Trust 2011-R2, 0.59%, 2/06/20 1,392,252 NCUA Guaranteed Notes Trust 2011-R4, 0.58%, 3/06/20 282,422 NCUA Guaranteed Notes Trust 2011-R5, 0.57%, 4/06/20 20,006 NCUA Guaranteed Notes Trust 2011-R6, 0.58%, 5/07/20 Total NCUA Guaranteed (Cost - $7,616) U.S. Treasury (7%) 3,185,276 U.S. Treasury Inflation Indexed Bonds, 0.13%, 4/15/20 2,000,000 U.S. Treasury Note, 1.38%, 7/31/18 2,000,000 U.S.
Treasury Note, 1.38%, 2/28/19 2,000,000 U.S. Treasury Note, 1.63%, 6/30/19 Total U.S. Treasury (Cost - $9,203) $ Principal or Shares 651 565 2,511 1,331 858 716 1,727 970 734 744 633 104,949 1,174 Value (000) Security Description Purchased Put Options (0%) 185 Eurodollar 1-Year Mid-Curve Option, 97.5, 3/11/16 (Cost - $26) Investment Company (10%) 13,048,513 Payden Cash Reserves Money Market Fund * (Cost - $13,048) Total (Cost - $142,337) (106%) Liabilities in excess of Other Assets (-6%) Net Assets (100%) $ 1 $ 13,048 142,819 (7,723) 135,096 * Affiliated investment (a) Security offered only to qualified institutional investors, and thus is not registered for sale to the public under rule 144A of the Securities Act of 1933. It has been deemed liquid under guidelines approved by the Board. (b) Security was purchased on a delayed delivery basis. 925 62 2,564 1,201 1,395 Open Futures Contracts Number of Contracts 50 Contract Type U.S.
Treasury 5 Year Note Future Expiration Date Jan-16 Current Value (000) $5,989 Unrealized Depreciation (000s) $(40) 283 20 7,624 3,164 2,021 2,014 2,025 9,224 See notes to financial statements. Annual Report 21 . Payden GNMA Fund $21,000 The Fund seeks a high level of total return that is consistent with preservation of capital by generally investing in Government National Mortgage Association mortgagebacked securities and other U.S. government obligations with no limit on the average portfolio maturity. Five Year 2.92% Investor Class $16,041 Ten Year 4.84% Bank of America Merrill Lynch GNMA Master Index $15,962 $17,000 $15,000 Portfolio Composition - percent of value Mortgage Backed U.S. Government Guaranteed Cash Equivalent One Year 2.06% $19,000 $13,000 95% 3% 2% $11,000 $9,000 10/31/05 10/10 10/31/15 Past performance does not predict future returns. The graph does not reflect the impact of taxes or transaction costs a shareholder would pay.
The Fund’s Adviser Class is expected to perform similarly to its Investor Class. This information is not part of the audited financial statements. Schedule of Investments - October 31, 2015 Principal or Shares Security Description FDIC Guaranteed (2%) 1,303,933 FDIC Structured Sale Guaranteed Notes 144A, 0.74%, 2/25/48 (a) 1,163,156 FDIC Structured Sale Guaranteed Notes 144A, 0.90%, 12/29/45 (a) 4,257,399 FDIC Structured Sale Guaranteed Notes 144A, 0.91%, 12/04/20 (a) Total FDIC Guaranteed (Cost - $6,732) Mortgage Backed (144%) 1,147,365 Fannie Mae Multifamily Remic Trust 2015-M12, 0.54%, 4/25/20 3,782,044 Fannie Mae-Aces, 0.42%, 6/25/18 891,704 Fannie Mae-Aces, 0.45%, 5/25/18 2,830,206 Fannie Mae-Aces, 0.45%, 3/25/19 1,618,282 FH 1J1279 ARM, 2.13%, 4/01/36 2,623,542 FH 1Q0062 ARM, 1.96%, 11/01/35 1,036,523 FH 2B1143 ARM, 2.19%, 2/01/43 1,158,183 FH 847228 ARM, 2.56%, 1/01/34 160,418 FHLMC Multifamily Structured Pass Through Certificates, 0.54%, 4/25/19 379,177 FHLMC Multifamily Structured Pass Through Certificates, 0.58%, 7/25/20 1,224,780 FN 832100 ARM, 2.41%, 7/01/35 1,864,293 FN AE0289 ARM, 2.43%, 5/01/40 1,612,949 FN AK0419 ARM, 2.46%, 12/01/27 3,429,060 FN AL0891 ARM, 3.46%, 9/01/41 3,470,175 FN AL2493 ARM, 2.41%, 10/01/42 13,427 FNR 1998-12 A, 3.89%, 2/25/18 38,000,000 G2, 3.00%, 30YR TBA (b) 72,300,000 G2, 3.50%, 30YR TBA (b) 17,450,000 G2, 4.00%, 30YR TBA (b) 100,495 G2 3133 30YR, 6.50%, 9/20/31 1,181,243 G2 3415 30YR, 5.50%, 7/20/33 827,475 G2 3515 30YR, 5.50%, 2/20/34 1,142,727 G2 3584 30YR, 6.00%, 7/20/34 952,510 G2 3599 30YR, 6.50%, 8/20/34 894,484 G2 3711 30YR, 5.50%, 5/20/35 22 Payden Mutual Funds Value (000) $ Principal or Shares 1,305 1,166 4,272 6,743 1,147 3,783 891 2,828 1,712 2,759 1,063 1,241 160 380 1,306 1,992 1,711 3,619 3,570 14 38,816 75,758 18,572 119 1,333 934 1,310 1,121 1,008 1,181,637 729,372 1,369,184 2,338,775 313,185 1,772,747 1,059,248 1,027,342 2,879,856 1,114,929 1,350,270 289,538 613,377 201,749 210,012 313,728 189,268 3,923,829 837,033 471,491 403,870 822,620 1,178,855 142,453 2,259,717 117,495 2,542,822 595,258 171,000 314,077 763,468 564,902 347,218 134,091 1,776,793 5,724,899 3,880,254 1,664,107 Value (000) Security Description G2 3747 30YR, 5.00%, 8/20/35 G2 3772 30YR, 5.00%, 10/20/35 G2 3785 30YR, 5.00%, 11/20/35 G2 3819 30YR, 5.50%, 2/20/36 G2 3891 30YR, 6.50%, 8/20/36 G2 4802 30YR, 5.00%, 9/20/40 G2 4945 30YR, 4.00%, 2/20/41 G2 4978 30YR, 4.50%, 3/20/41 G2 5083 30YR, 5.00%, 6/20/41 G2 5140 30YR, 4.50%, 8/20/41 G2 713314 30YR, 6.00%, 3/20/39 G2 728869 30YR, 4.13%, 4/20/40 G2 728870 30YR, 4.63%, 4/20/40 G2 736498 30YR, 4.13%, 4/20/40 G2 736499 30YR, 4.63%, 4/20/40 G2 742040 30YR, 4.13%, 5/20/40 G2 742041 30YR, 4.63%, 6/20/40 G2 757211 30YR, 4.50%, 12/20/40 G2 770239 30YR, 4.00%, 2/20/42 G2 80013 ARM, 2.00%, 11/20/26 G2 80029 ARM, 1.75%, 1/20/27 G2 80044 ARM, 1.75%, 2/20/27 G2 80052 ARM, 1.75%, 3/20/27 G2 8006 ARM, 1.63%, 7/20/22 G2 80074 ARM, 1.75%, 5/20/27 G2 80311 ARM, 1.63%, 8/20/29 G2 80319 ARM, 1.63%, 9/20/29 G2 8041 ARM, 1.63%, 8/20/22 G2 80424 ARM, 1.63%, 7/20/30 G2 80428 ARM, 2.00%, 7/20/30 G2 80541 ARM, 1.63%, 9/20/31 G2 80569 ARM, 1.75%, 1/20/32 G2 80570 ARM, 1.75%, 1/20/32 G2 80579 ARM, 1.75%, 2/20/32 G2 80637 ARM, 1.63%, 9/20/32 G2 80749 ARM, 1.63%, 10/20/33 G2 80795 ARM, 1.63%, 12/20/33 G2 80826 ARM, 1.75%, 2/20/34 $ 1,309 808 1,515 2,627 359 1,971 1,137 1,121 3,203 1,217 1,523 309 664 216 227 335 204 4,295 899 490 416 846 1,213 147 2,336 122 2,632 616 177 327 792 581 355 138 1,841 5,952 4,015 1,712 . Principal or Shares 2,460,246 458,497 459,721 22,426 89,127 1,749,966 638,408 606,079 2,342,514 440,084 4,529,935 2,706,229 288,691 125,417 4,395,604 2,383,290 936,953 1,102,260 307,131 236,715 223,439 117,493 1,083,148 93,906 142,957 63,121 445,668 1,489,671 4,566,822 6,382,897 2,845,831 5,507,645 7,223,517 2,667,517 10,000,000 919,091 7,665,625 8,538,926 2,953,977 109,222 86,103 199,095 93,267 117,530 144,387 105,506 45,389 428,081 1,161,233 64,218 83,003 54,272 259,638 148,560 103,669 238,553 316,056 137,945 218,158 102,867 Value (000) Security Description G2 80835 ARM, 1.75%, 2/20/34 G2 80837 ARM, 1.75%, 2/20/34 G2 81018 ARM, 1.63%, 8/20/34 G2 81044 ARM, 1.63%, 8/20/34 G2 8121 ARM, 1.75%, 1/20/23 G2 81214 ARM, 1.75%, 1/20/35 G2 81220 ARM, 1.75%, 1/20/35 G2 81278 ARM, 1.75%, 3/20/35 G2 81282 ARM, 1.75%, 3/20/35 G2 81938 ARM, 1.63%, 7/20/37 G2 82074 ARM, 1.75%, 5/20/38 G2 82107 ARM, 1.63%, 7/20/38 G2 82151 ARM, 1.63%, 9/20/38 G2 8228 ARM, 1.63%, 7/20/23 G2 82457 ARM, 1.75%, 1/20/40 G2 82463 ARM, 2.75%, 1/20/40 G2 83031 ARM, 2.50%, 1/20/42 G2 83048 ARM, 3.00%, 2/20/42 G2 8358 ARM, 1.75%, 1/20/24 G2 8359 ARM, 1.75%, 1/20/24 G2 8371 ARM, 1.75%, 2/20/24 G2 8373 ARM, 1.75%, 2/20/24 G2 8547 ARM, 2.00%, 11/20/24 G2 8580 ARM, 2.00%, 1/20/25 G2 8595 ARM, 2.00%, 2/20/25 G2 8855 ARM, 2.00%, 10/20/21 G2 8968 ARM, 1.63%, 9/20/26 G2 8991 ARM, 1.63%, 10/20/26 G2 MA1012 30YR, 3.50%, 5/20/43 G2 MA1089 30YR, 3.00%, 6/20/43 G2 MA1285 30YR, 3.50%, 9/20/43 G2 MA1520 30YR, 3.00%, 12/20/43 G2 MA2372 30YR, 4.00%, 11/20/44 G2 MA2894 30YR, 4.50%, 6/20/45 GN, 4.00%, 30YR TBA (b) GN 366983 30YR, 4.00%, 6/15/41 GN 367090 30YR, 4.50%, 7/15/41 GN 367092 30YR, 4.50%, 7/15/41 GN 455989 15YR, 5.00%, 7/15/26 GN 524825 30YR, 5.47%, 10/15/29 GN 524869 30YR, 5.47%, 1/15/30 GN 524925 30YR, 5.47%, 2/15/30 GN 524968 30YR, 5.47%, 3/15/30 GN 524996 30YR, 5.47%, 5/15/30 GN 525015 30YR, 5.47%, 6/15/30 GN 525033 30YR, 5.47%, 7/15/30 GN 546392 30YR, 5.47%, 2/15/31 GN 558954 20YR, 5.25%, 5/15/29 GN 558956 30YR, 4.50%, 6/15/29 GN 596009 30YR, 5.75%, 7/15/32 GN 596023 30YR, 5.75%, 7/15/32 GN 596035 30YR, 5.75%, 8/15/32 GN 596054 30YR, 5.75%, 8/15/32 GN 596071 30YR, 5.75%, 8/15/32 GN 596072 30YR, 5.75%, 7/15/32 GN 596090 30YR, 5.75%, 8/15/32 GN 596135 30YR, 5.75%, 8/15/32 GN 596166 30YR, 5.75%, 8/15/32 GN 596178 30YR, 5.75%, 9/15/32 GN 596197 30YR, 5.75%, 8/15/32 $ 2,530 472 477 23 92 1,799 656 623 2,410 454 4,685 2,808 298 130 4,519 2,478 965 1,144 316 244 230 121 1,123 98 148 65 462 1,546 4,799 6,556 2,989 5,657 7,694 2,877 10,652 980 8,459 9,352 3,271 122 96 222 104 131 161 118 51 478 1,268 72 93 61 294 167 116 269 357 155 247 116 Principal or Shares 159,840 31,145 182,330 41,827 63,056 141,977 191,499 444,238 314,093 172,347 161,881 184,209 228,051 120,896 192,144 202,174 1,049,506 304,010 106,423 93,804 590,707 151,256 94,513 110,514 61,687 1,444,663 1,428,797 1,951,946 597,641 2,644,182 3,397,537 925,589 556,275 5,743,975 1,188,804 107,950 116,156 505,903 182,428 6,395,800 131,196 190,840 65,340 286,492 869,360 678,542 787,249 826,060 126,137 63,220 508,507 636,847 1,555,489 1,721,999 397,014 99,369 329,829 86,330 103,595 140,777 Value (000) Security Description GN 596225 30YR, 5.75%, 9/15/32 GN 596231 30YR, 5.75%, 9/15/32 GN 596237 30YR, 5.75%, 9/15/32 GN 596312 30YR, 5.75%, 9/15/32 GN 596313 30YR, 5.75%, 9/15/32 GN 596396 30YR, 5.75%, 9/15/32 GN 601699 30YR, 5.70%, 12/15/32 GN 601738 30YR, 5.25%, 1/15/33 GN 601772 30YR, 5.25%, 1/15/33 GN 601774 30YR, 5.25%, 1/15/33 GN 601775 30YR, 5.70%, 1/15/33 GN 601786 30YR, 5.25%, 2/15/33 GN 601791 30YR, 5.25%, 2/15/33 GN 601810 30YR, 5.25%, 2/15/33 GN 601845 30YR, 5.25%, 2/15/33 GN 601858 30YR, 5.70%, 2/15/33 GN 601872 30YR, 5.25%, 3/15/33 GN 601937 30YR, 5.25%, 3/15/33 GN 602002 30YR, 5.25%, 3/15/33 GN 602043 30YR, 5.25%, 4/15/33 GN 605099 30YR, 5.50%, 3/15/34 GN 613272 30YR, 5.25%, 5/15/33 GN 613354 30YR, 5.45%, 7/15/33 GN 613355 30YR, 5.70%, 4/15/33 GN 613379 30YR, 5.45%, 7/15/33 GN 616826 30YR, 5.50%, 1/15/35 GN 629903 35YR, 5.80%, 6/15/42 GN 673234 30YR, 6.00%, 11/15/38 GN 677318 30YR, 6.00%, 9/15/38 GN 704439 30YR, 4.50%, 3/15/39 GN 710868 30YR, 5.50%, 9/15/39 GN 728153 20YR, 5.50%, 10/15/29 GN 728159 20YR, 5.25%, 11/15/29 GN 734089 30YR, 4.00%, 12/15/40 GN 743362 30YR, 4.75%, 6/15/40 GN 743363 30YR, 4.25%, 5/15/40 GN 743502 30YR, 4.25%, 6/15/40 GN 743503 30YR, 4.75%, 6/15/40 GN 743611 30YR, 4.75%, 6/15/40 GN 745187 30YR, 4.50%, 7/15/40 GN 747368 30YR, 4.75%, 7/15/40 GN 747491 30YR, 4.75%, 7/15/40 GN 747740 30YR, 4.25%, 9/15/40 GN 747741 30YR, 4.75%, 9/15/40 GN 761040 30YR, 4.25%, 3/15/41 GN 762726 30YR, 4.25%, 3/15/41 GN 763012 30YR, 4.25%, 4/15/41 GN 763216 30YR, 4.25%, 4/15/41 GN 768721 30YR, 4.25%, 4/15/41 GN 768886 30YR, 4.25%, 6/15/41 GN 781636 30YR, 5.50%, 7/15/33 GN 781810 30YR, 5.50%, 10/15/34 GN 782835 30YR, 6.00%, 12/15/39 GN 782858 30YR, 6.00%, 11/15/39 GNR 1999-18 FA, 0.50%, 5/16/29 GNR 1999-40 FE, 0.75%, 11/16/29 GNR 1999-40 FK, 0.75%, 11/16/29 GNR 1999-45 FC, 0.60%, 12/16/29 GNR 1999-45 FH, 0.65%, 12/16/29 GNR 2000-22 FG, 0.40%, 5/16/30 $ 180 35 205 47 71 160 215 495 350 191 182 204 253 134 213 227 1,189 339 118 104 675 168 106 124 69 1,619 1,456 2,222 685 2,892 3,856 1,044 620 6,142 1,314 116 125 555 199 7,016 143 208 70 313 934 731 844 893 136 68 581 724 1,769 1,958 398 100 332 86 104 141 Annual Report 23 . Payden GNMA Fund continued Principal or Shares Value (000) Security Description 386,871 GNR 2000-9 FG, 0.80%, 2/16/30 407,522 GNR 2000-9 FH, 0.70%, 2/16/30 328,151 GNR 2001-19 F, 0.70%, 5/16/31 36,427 GNR 2001-21 FN, 0.40%, 8/16/22 1,470,602 GNR 2001-22 FG, 0.55%, 5/16/31 674,527 GNR 2001-31 FA, 0.45%, 6/16/31 593,853 GNR 2001-35 FA, 0.45%, 8/16/31 1,837,710 GNR 2001-47 FA, 0.60%, 9/16/31 636,729 GNR 2001-59 FA, 0.60%, 11/16/24 319,550 GNR 2001-65 FV, 0.59%, 2/20/29 394,494 GNR 2002-11 FJ, 0.69%, 2/20/32 369,366 GNR 2002-13 FA, 0.70%, 2/16/32 1,063,377 GNR 2002-48 FG, 0.50%, 12/16/30 523,184 GNR 2002-48 FT, 0.40%, 12/16/26 1,004,705 GNR 2002-5 FP, 0.75%, 1/16/32 674,493 GNR 2002-72 FA, 0.59%, 10/20/32 310,267 GNR 2002-72 FB, 0.59%, 10/20/32 695,782 GNR 2002-72 FE, 0.59%, 10/20/32 820,223 GNR 2002-76 F, 0.40%, 1/16/31 187,975 GNR 2002-76 FY, 0.50%, 12/16/26 25,248 GNR 2002-79 FB, 0.45%, 11/16/32 1,218,776 GNR 2003-71 FC, 0.69%, 7/20/33 1,913,120 GNR 2003-94 FB, 0.50%, 12/16/30 2,981,255 GNR 2004-56 F, 0.59%, 6/20/33 1,623,186 GNR 2004-59 FH, 0.45%, 8/16/34 384,981 GNR 2004-73 JM, 0.00%, 9/16/34 484,033 GNR 2006-47 FA, 0.40%, 8/16/36 2,815,004 GNR 2006-60 FK, 0.40%, 11/20/36 399,799 GNR 2006-64 PO, 0.00%, 4/16/34 2,690,825 GNR 2007-54 FC, 0.45%, 9/20/37 961,294 GNR 2007-76 FB, 0.69%, 11/20/37 2,623,712 GNR 2008-15 CF, 0.70%, 2/20/38 622,172 GNR 2008-2 FH, 0.64%, 1/20/38 3,385,637 GNR 2008-67 UF, 0.64%, 6/20/38 1,388,594 GNR 2009-87 FB, 0.84%, 9/20/39 17,111,182 GNR 2014-69 IB, 1.13%, 6/20/36 40,060,207 GNR 2014-79 ST, 1.15%, 7/20/29 17,407,810 GNR 2014-99 ID, 1.23%, 11/20/36 Total Mortgage Backed (Cost - $393,528) $ 391 410 331 36 1,479 678 595 1,847 640 321 397 373 1,066 524 1,012 677 311 699 822 188 25 1,230 1,918 2,994 1,626 373 485 2,813 396 2,699 971 2,650 627 3,418 1,406 761 1,469 737 400,537 Principal or Shares Security Description NCUA Guaranteed (3%) 3,118,906 NCUA Guaranteed Notes Trust 2010-R2, 0.56%, 11/06/17 1,382,772 NCUA Guaranteed Notes Trust 2011-R3, 0.60%, 3/11/20 2,988,039 NCUA Guaranteed Notes Trust 2011-R4, 0.58%, 3/06/20 609,465 NCUA Guaranteed Notes Trust 2011-R5, 0.57%, 4/06/20 Total NCUA Guaranteed (Cost - $8,116) Purchased Put Options (0%) 200 Eurodollar 1-Year Mid-Curve Option, 97.875, 3/11/16 200 Eurodollar 1-Year Mid-Curve Option, 98, 12/11/15 Total Purchased Put Options (Cost - $121) Investment Company (3%) 6,822,106 Payden Cash Reserves Money Market Fund * (Cost - $6,822) Total (Cost - $415,319) (152%) Liabilities in excess of Other Assets (-52%) Net Assets (100%) $ 3,125 1,387 2,993 610 8,115 5 1 6 $ 6,822 422,223 (143,615) 278,608 * Affiliated investment (a) Security offered only to qualified institutional investors, and thus is not registered for sale to the public under rule 144A of the Securities Act of 1933. It has been deemed liquid under guidelines approved by the Board. (b) Security was purchased on a delayed delivery basis. Open Futures Contracts Number of Contracts 150 Contract Type U.S. Treasury 2 Year Note Future See notes to financial statements. 24 Payden Mutual Funds Value (000) Expiration Date Jan-16 Current Value (000) $(32,798) Unrealized Appreciation (000s) $21 . Payden Core Bond Fund $19,000 The Fund seeks a high level of total return that is consistent with preservation of capital by generally investing in investment grade debt securities with no limit on the average portfolio maturity. One Year 1.73% $17,000 Five Year 3.61% Investor Class $15,709 Ten Year 4.62% Barclays Capital Aggregate Bond Index $15,861 $15,000 Portfolio Composition - percent of value Corporate Bond Mortgage Backed U.S. Treasury Investment Company Asset Backed Other 43% 29% 9% 8% 5% 6% $13,000 $11,000 $9,000 10/31/05 10/10 10/31/15 Past performance does not predict future returns. The graph does not reflect the impact of taxes or transaction costs a shareholder would pay. The Fund’s Adviser Class is expected to perform similarly to its Investor Class. This information is not part of the audited financial statements. Schedule of Investments - October 31, 2015 Principal or Shares Security Description Asset Backed (6%) 6,020,000 Babson CLO Ltd.
144A, 1.42%, 4/20/25 (a) 97,323 Chase Funding Mortgage Loan Asset-Backed Certificates, 0.86%, 11/25/32 1,778,264 Colony American Homes 2014-1 144A, 1.40%, 5/17/31 (a) 1,428,469 Colony American Homes 2014-2 144A, 1.15%, 7/17/31 (a) 1,879,103 Colony American Homes 2015-1 144A, 1.40%, 7/17/32 (a) 6,665,000 Dryden XXII Senior Loan Fund 144A, 1.42%, 8/15/25 (a) 1,125,000 Eaton Vance CLO 2015-1 Ltd. 144A, 4.52%, 10/20/26 (a) 1,510,831 Invitation Homes 2013-SFR1 Trust 144A, 1.40%, 12/17/30 (a) 1,810,000 Invitation Homes 2014-SFR1 Trust 144A, 1.20%, 6/17/31 (a) 1,980,000 Invitation Homes 2014-SFR2 Trust 144A, 1.30%, 9/17/31 (a) 2,100,000 Invitation Homes 2014-SFR3 Trust 144A, 1.40%, 12/17/31 (a) 3,160,720 Invitation Homes 2015-SFR3 Trust 144A, 1.50%, 8/17/32 (a) 2,460,859 L.A. Arena Funding LLC 144A, 7.66%, 12/15/26 (a) 601,363 Nelnet Student Loan Trust 2014-2A 144A, 0.48%, 6/25/21 (a) 2,000,000 SLM Student Loan Trust, 0.58%, 7/26/21 6,395,000 Tyron Park CLO Ltd.
144A, 1.44%, 7/15/25 (a) 1,268,091 VOLT XXV LLC 144A, 3.50%, 6/26/45 (a) 1,788,435 VOLT XXXV LLC 144A, 3.50%, 6/26/45 (a) 280,772 Volvo Financial Equipment LLC Series 2014-1 144A, 0.54%, 11/15/16 (a) Total Asset Backed (Cost - $44,276) Corporate Bond (50%) 3,000,000 AbbVie Inc., 3.60%, 5/14/25 Value (000) $ Principal or Shares 5,920 93 3,000,000 3,000,000 2,325,000 1,747 3,800,000 1,396 1,995,000 655,000 1,839 1,190,410 6,549 1,091 1,490 1,773 1,944 2,065 3,107 2,696 599 1,989 6,298 1,259 1,791 281 43,927 2,955 2,700,000 3,150,000 2,750,000 2,045,000 2,100,000 1,600,000 2,500,000 2,880,000 1,310,000 1,590,000 240,000 2,000,000 1,640,000 1,900,000 1,340,000 1,150,000 2,300,000 1,100,000 1,935,000 Value (000) Security Description Actavis Funding SCS, 1.20%, 9/01/16 Actavis Funding SCS, 3.45%, 3/15/22 AerCap Ireland Capital Ltd. / AerCap Global Aviation Trust, 5.00%, 10/01/21 Air Canada 2015-1 Class A Pass Through Trust 144A, 3.60%, 3/15/27 (a) Air Lease Corp., 5.63%, 4/01/17 Alibaba Group Holding Ltd. 144A, 3.60%, 11/28/24 (a) Alliance Pipeline LP/United States 144A, 7.00%, 12/31/19 (a) Ally Financial Inc., 4.13%, 2/13/22 Amazon.com Inc., 3.30%, 12/05/21 Anglo American Capital PLC 144A, 4.13%, 4/15/21 (a) Apollo Management Holdings LP 144A, 4.00%, 5/30/24 (a) Ardagh Packaging Finance PLC / Ardagh Holdings USA Inc.
144A, 3.34%, 12/15/19 (a) AT&T Inc., 3.40%, 5/15/25 AT&T Inc., 4.75%, 5/15/46 Australia & New Zealand Banking Group Ltd. 144A, 4.50%, 3/19/24 (a) Aviation Capital Group Corp. 144A, 4.63%, 1/31/18 (a) Avis Budget Car Rental LLC / Avis Budget Finance Inc., 5.50%, 4/01/23 Bank of America Corp., 3.95%, 4/21/25 Bank of America Corp., 6.10%, 12/29/49 Bank of America Corp., 6.88%, 4/25/18 Banque Federative du Credit Mutuel SA 144A, 2.75%, 10/15/20 (a) Barclays Bank PLC 144A, 6.05%, 12/04/17 (a) Barclays PLC, 2.75%, 11/08/19 Baxalta Inc. 144A, 2.88%, 6/23/20 (a) Baxalta Inc.
144A, 4.00%, 6/23/25 (a) BB&T Corp., 4.90%, 6/30/17 $ 2,997 2,985 2,435 3,672 2,092 637 1,292 2,739 3,276 2,377 2,058 2,074 1,556 2,304 2,901 1,353 1,654 237 2,025 1,832 1,900 1,446 1,155 2,300 1,108 2,036 Annual Report 25 . Payden Core Bond Fund continued Principal or Shares 1,353,000 1,440,000 3,920,000 1,500,000 3,100,000 2,805,000 3,000,000 860,000 1,500,000 2,300,000 1,500,000 2,300,000 2,650,000 3,800,000 710,000 1,860,000 1,125,000 900,000 1,200,000 1,100,000 2,000,000 1,220,653 1,643,508 700,000 2,215,000 3,000,000 1,695,000 1,165,000 2,000,000 2,217,000 2,400,000 1,025,000 3,200,000 1,800,000 1,454,117 1,350,000 2,730,000 1,330,000 1,980,000 4,045,000 1,505,000 2,700,000 Value (000) Security Description BBVA Banco Continental SA 144A, 2.25%, 7/29/16 (a) BBVA Banco Continental SA 144A, 3.25%, 4/08/18 (a) Bear Stearns Companies LLC, 5.55%, 1/22/17 Berry Plastics Corp., 5.13%, 7/15/23 Biogen Inc., 4.05%, 9/15/25 Block Financial LLC, 4.13%, 10/01/20 BNZ International Funding Ltd./London 144A, 1.90%, 2/26/18 (a) Boston Scientific Corp., 2.85%, 5/15/20 CCO Holdings LLC / CCO Holdings Capital Corp., 7.38%, 6/01/20 Celgene Corp., 3.55%, 8/15/22 CHS/Community Health Systems Inc., 8.00%, 11/15/19 Citigroup Inc., 4.45%, 9/29/27 Citizens Bank NA/Providence RI, 2.45%, 12/04/19 Citizens Financial Group Inc. 144A, 4.15%, 9/28/22 (a) CNH Industrial Capital LLC, 3.63%, 4/15/18 CNPC General Capital Ltd. 144A, 1.45%, 4/16/16 (a) Compass Bank, 2.75%, 9/29/19 Compass Bank, 3.88%, 4/10/25 Credit Suisse Group Funding Guernsey Ltd. 144A, 2.75%, 3/26/20 (a) Credit Suisse Group Funding Guernsey Ltd. 144A, 3.75%, 3/26/25 (a) CVS Health Corp., 4.88%, 7/20/35 CVS Pass-Through Trust 144A, 5.79%, 1/10/26 (a) CVS Pass-Through Trust Series 2014 144A, 4.16%, 8/10/36 (a) DaVita HealthCare Partners Inc., 5.13%, 7/15/24 Dean Foods Co. 144A, 6.50%, 3/15/23 (a) Deutsche Bank AG, 2.95%, 8/20/20 Dignity Health, 3.13%, 11/01/22 Dignity Health, 4.50%, 11/01/42 Discover Bank/Greenwood DE, 3.10%, 6/04/20 Dow Chemical Co., 9.40%, 5/15/39 Entergy Louisiana LLC, 5.00%, 7/15/44 Exelon Generation Co.
LLC, 6.20%, 10/01/17 Fairfax U.S. Inc. 144A, 4.88%, 8/13/24 (a) FedEx Corp., 4.50%, 2/01/65 Fermaca Enterprises S de RL de CV 144A, 6.38%, 3/30/38 (a) Fifth Third Bank/Cincinnati OH, 2.15%, 8/20/18 Ford Motor Credit Co.
LLC, 2.24%, 6/15/18 FS Investment Corp., 4.25%, 1/15/20 General Motors Financial Co. Inc., 3.10%, 1/15/19 Glencore Funding LLC 144A, 1.49%, 5/27/16 (a) Goldman Sachs Group Inc., 1.52%, 4/30/18 Goldman Sachs Group Inc., 2.55%, 10/23/19 26 Payden Mutual Funds $ 1,365 1,465 4,108 1,489 3,144 2,852 3,006 860 1,560 2,341 1,567 2,303 Principal or Shares 2,500,000 2,040,000 3,060,000 2,205,000 2,000,000 2,650,000 3,000,000 1,000,000 2,200,000 1,700,000 1,500,000 4,050,000 2,633 1,440,000 3,867 715 2,500,000 2,050,000 1,861 1,117 840 680,000 1,197 900,000 2,000,000 1,078 2,112 920,000 1,362 1,619 712 2,342 3,012 1,694 1,116 2,025 3,249 2,327 1,097 3,166 1,603 1,410 1,360 2,723 1,345 1,988 3,951 1,520 2,721 3,180,000 2,370,000 3,760,000 1,760,000 2,100,000 3,450,000 3,700,000 1,400,000 2,150,000 2,260,000 2,400,000 2,890,000 1,500,000 1,570,000 1,340,000 2,100,000 1,843,000 2,200,000 1,540,000 322,000 1,500,000 1,440,000 2,350,000 2,000,000 2,100,000 Value (000) Security Description Harris Corp., 2.70%, 4/27/20 HCA Inc., 5.88%, 5/01/23 Heathrow Funding Ltd. 144A, 4.88%, 7/15/21 (a) Hertz Corp., 6.75%, 4/15/19 Hewlett Packard Enterprise Co.
144A, 2.45%, 10/05/17 (a) Hewlett Packard Enterprise Co. 144A, 4.90%, 10/15/25 (a) Hewlett Packard Enterprise Co. 144A, 6.20%, 10/15/35 (a) Hexion U.S.
Finance Corp., 6.63%, 4/15/20 HSBC USA Inc., 2.00%, 8/07/18 Hyundai Capital America 144A, 2.60%, 3/19/20 (a) Icahn Enterprises LP / Icahn Enterprises Finance Corp., 3.50%, 3/15/17 Imperial Tobacco Finance PLC 144A, 3.75%, 7/21/22 (a) Industrial & Commercial Bank of China Ltd./New York, 3.23%, 11/13/19 ING Bank NV 144A, 2.05%, 8/17/18 (a) Inter-American Development Bank, 3.88%, 9/17/19 International Lease Finance Corp., 2.29%, 6/15/16 Iron Mountain Inc., 5.75%, 8/15/24 Jackson National Life Global Funding 144A, 0.57%, 7/29/16 (a) Jackson National Life Global Funding 144A, 1.88%, 10/15/18 (a) JPMorgan Chase & Co., 1.22%, 1/25/18 Kaiser Foundation Hospitals, 3.50%, 4/01/22 Kennametal Inc., 2.65%, 11/01/19 KeyCorp, 2.90%, 9/15/20 Kinder Morgan Inc./DE, 5.30%, 12/01/34 KKR Group Finance Co. II LLC 144A, 5.50%, 2/01/43 (a) Kraft Heinz Foods Co. 144A, 3.50%, 7/15/22 (a) Lam Research Corp., 3.80%, 3/15/25 Latam Airlines 2015-1 Pass Through Trust A 144A, 4.20%, 11/15/27 (a) LifePoint Health Inc., 5.50%, 12/01/21 Lloyds Bank PLC, 2.00%, 8/17/18 Macquarie Bank Ltd.
144A, 2.00%, 8/15/16 (a) Massachusetts Mutual Life Insurance Co. 144A, 4.50%, 4/15/65 (a) McGraw Hill Financial Inc., 5.90%, 11/15/17 MDC Holdings Inc., 6.00%, 1/15/43 Mead Johnson Nutrition Co., 4.13%, 11/15/25 MeadWestvaco Corp., 7.95%, 2/15/31 Medtronic Inc., 3.15%, 3/15/22 MetLife Inc., 6.40%, 12/15/36 MetLife Inc., 10.75%, 8/01/39 Mobile Mini Inc., 7.88%, 12/01/20 Morgan Stanley, 1.17%, 1/24/19 Morgan Stanley, 4.35%, 9/08/26 Morgan Stanley, 5.45%, 7/29/49 Morgan Stanley, 5.55%, 12/29/49 $ 2,459 2,173 3,363 2,268 2,007 2,624 2,935 852 2,203 1,673 1,521 4,106 1,473 2,512 2,235 680 908 2,001 922 3,193 2,445 3,734 1,775 1,773 3,579 3,776 1,315 2,048 2,300 2,416 2,913 1,391 1,680 1,092 2,126 2,415 2,252 1,693 508 1,567 1,435 2,389 1,970 2,100 . Principal or Shares 1,889,000 1,300,000 1,400,000 1,000,000 3,545,000 1,000,000 1,700,000 3,015,000 1,450,000 2,150,000 1,470,000 2,375,000 1,960,000 2,350,000 1,850,000 1,725,000 1,000,000 2,300,000 1,580,000 3,250,000 867,000 2,525,000 835,000 1,645,000 4,030,000 1,675,000 1,055,000 1,370,000 1,950,000 3,600,000 5,270,000 2,750,000 1,650,000 2,675,000 2,270,000 2,050,000 Value (000) Security Description Nationwide Building Society 144A, 6.25%, 2/25/20 (a) Nationwide Mutual Insurance Co. 144A, 9.38%, 8/15/39 (a) New Red Finance Inc 144A, 6.00%, 4/01/22 (a) New Red Finance Inc. 144A, 4.63%, 1/15/22 (a) North Shore Long Island Jewish Health Care Inc., 6.15%, 11/01/43 Novelis Inc./GA, 8.75%, 12/15/20 Old Republic International Corp., 4.88%, 10/01/24 Orange SA, 9.00%, 3/01/31 Pacific Life Insurance Co. 144A, 9.25%, 6/15/39 (a) Penske Truck Leasing Co.
LP / PTL Finance Corp. 144A, 3.38%, 2/01/22 (a) People’s United Bank, 4.00%, 7/15/24 Perrigo Finance PLC, 3.50%, 12/15/21 Petroleos Mexicanos, 4.88%, 1/18/24 Prudential Financial Inc., 5.63%, 6/15/43 QUALCOMM Inc., 2.25%, 5/20/20 Quest Diagnostics Inc., 3.50%, 3/30/25 Reynolds Group Issuer Inc. / Reynolds Group Issuer LLC/Reynolds Group Issuer Lu, 6.88%, 2/15/21 Ryder System Inc., 2.50%, 5/11/20 Santander Holdings USA Inc./PA, 2.65%, 4/17/20 Santander UK Group Holdings PLC 144A, 4.75%, 9/15/25 (a) Scentre Group Trust 1 / Scentre Group Trust 2 144A, 2.38%, 11/05/19 (a) Select Income REIT, 4.50%, 2/01/25 Senior Housing Properties Trust, 4.75%, 5/01/24 Senior Housing Properties Trust, 6.75%, 4/15/20 Sinopec Capital 2013 Ltd.
144A, 1.88%, 4/24/18 (a) Sompo Japan Insurance Inc. 144A, 5.33%, 3/28/73 (a) Southeast Supply Header LLC 144A, 4.25%, 6/15/24 (a) Sparebank 1 Boligkreditt AS 144A, 2.63%, 5/27/16 (a) Sumitomo Mitsui Banking Corp., 2.45%, 1/16/20 Suncorp-Metway Ltd. 144A, 2.35%, 4/27/20 (a) Suntory Holdings Ltd.
144A, 2.55%, 9/29/19 (a) Sydney Airport Finance Co. Pty Ltd. 144A, 3.38%, 4/30/25 (a) Synchrony Financial, 2.70%, 2/03/20 Teachers Insurance & Annuity Association of America 144A, 6.85%, 12/16/39 (a) Tencent Holdings Ltd.
144A, 3.38%, 5/02/19 (a) TIAA Asset Management Finance Co. LLC 144A, 2.95%, 11/01/19 (a) $ Principal or Shares 2,192 1,977 1,468 1,017 4,219 1,007 1,771 4,391 2,147 2,102 1,460 2,327 1,963 2,465 1,841 1,673 1,047 2,271 1,564 3,251 859 2,414 827 1,834 4,010 1,784 1,021 1,385 1,955 3,573 5,298 2,631 1,629 3,367 2,320 2,078 1,000,000 2,995,000 2,195,000 2,295,000 1,300,000 2,800,000 Value (000) Security Description T-Mobile USA Inc., 6.25%, 4/01/21 Transatlantic Holdings Inc., 8.00%, 11/30/39 Tribune Media Co. 144A, 5.88%, 7/15/22 (a) TSMC Global Ltd.
144A, 1.63%, 4/03/18 (a) UBS AG/Stamford CT, 5.75%, 4/25/18 UBS Group Funding Jersey Ltd. 144A, 2.95%, 9/24/20 (a) 1,350,000 Valero Energy Corp., 6.63%, 6/15/37 3,140,000 Vereit Operating Partnership LP, 3.00%, 2/06/19 3,990,000 Verizon Communications Inc., 6.40%, 9/15/33 5,085,000 Welltower Inc, 4.13%, 4/01/19 965,000 Williams Companies Inc., 8.75%, 3/15/32 Total Corporate Bond (Cost - $338,388) FDIC Guaranteed (0%) 401,371 FDIC Structured Sale Guaranteed Notes 144A, 0.91%, 12/04/20 (a) (Cost - $402) Foreign Government (3%) 1,470,000 Indonesia Government International Bond 144A, 3.75%, 4/25/22 (a) 3,920,000 Mexico Government International Bond, 3.63%, 3/15/22 2,720,000 Panama Government International Bond, 5.20%, 1/30/20 3,000,000 Philippine Government International Bond, 4.00%, 1/15/21 2,989,000 Poland Government International Bond, 5.13%, 4/21/21 2,800,000 Romanian Government International Bond 144A, 4.38%, 8/22/23 (a) Total Foreign Government (Cost - $18,150) Mortgage Backed (33%) 1,758,118 Credit Suisse Mortgage Capital Certificates 144A, 1.55%, 5/25/43 (a) 2,290,000 Del Coronado Trust 144A, 1.00%, 3/15/26 (a) 2,185,071 Fannie Mae Connecticut Avenue Securities, 1.15%, 5/25/24 1,170,400 Fannie Mae Connecticut Avenue Securities, 1.15%, 5/25/24 1,641,401 Fannie Mae Connecticut Avenue Securities, 1.39%, 7/25/24 5,053,460 Fannie Mae Connecticut Avenue Securities, 1.40%, 5/25/25 1,454,750 Fannie Mae Connecticut Avenue Securities, 1.80%, 1/25/24 680,709 Fannie Mae Connecticut Avenue Securities, 2.20%, 10/25/23 1,500,000 Fannie Mae Connecticut Avenue Securities, 5.89%, 4/25/28 8,595,000 FFCB, 0.23%, 1/17/18 6,790,846 FG Q12837 30YR, 3.00%, 11/01/42 8,605,000 FHLB, 5.50%, 7/15/36 5,010,000 FN, 2.50%, 15YR TBA (b) 16,860,000 FN, 3.00%, 30YR TBA (b) 700,000 FN, 3.00%, 15YR TBA (b) $ 1,035 3,895 2,261 2,260 1,419 2,805 1,498 3,050 4,624 5,364 949 340,316 403 1,461 4,024 2,985 3,278 3,390 2,952 18,090 1,682 2,290 2,164 1,163 1,639 5,039 1,458 687 1,530 8,595 6,870 11,452 5,100 17,038 728 Annual Report 27 . Payden Core Bond Fund continued Principal or Shares 11,620,000 23,970,000 11,900,000 3,298,210 3,511,143 2,042,286 4,416,242 3,258,311 1,419,418 3,068,485 873,120 4,427,163 6,150,839 1,756,738 880,458 2,373,979 1,181,858 1,400,000 276,934 1,050,426 1,827,067 6,300,000 7,540,000 3,060,847 1,345,663 300,000 149,720 1,468,343 2,440,000 2,300,000 431,031 8,322,446 3,574,714 5,753,617 53,216 39,996 1,347,091 2,269,868 597,810 2,205,381 Value (000) Security Description FN, 3.50%, 30YR TBA (b) FN, 4.00%, 30YR TBA (b) FN, 4.50%, 30YR TBA (b) FN 254766 30YR, 5.00%, 6/01/33 FN 725423 30YR, 5.50%, 5/01/34 FN 725424 30YR, 5.50%, 4/01/34 FN 745418 30YR, 5.50%, 4/01/36 FN 995203 30YR, 5.00%, 7/01/35 FN AE0138 30YR, 4.50%, 3/01/40 FN AJ7689 30YR, 4.00%, 12/01/41 FN AO4075 15YR, 3.00%, 5/01/27 FN AS5730 15YR, 3.00%, 9/01/30 FN AX3596 15YR, 3.00%, 7/01/27 Freddie Mac Structured Agency Credit Risk Debt Notes, 1.10%, 10/25/27 Freddie Mac Structured Agency Credit Risk Debt Notes, 1.25%, 3/25/25 Freddie Mac Structured Agency Credit Risk Debt Notes, 1.30%, 5/25/25 Freddie Mac Structured Agency Credit Risk Debt Notes, 1.65%, 11/25/23 Freddie Mac Structured Agency Credit Risk Debt Notes, 2.40%, 2/25/24 G2 5140 30YR, 4.50%, 8/20/41 G2 5175 30YR, 4.50%, 9/20/41 G2 MA2894 30YR, 4.50%, 6/20/45 GN, 3.50%, 30YR TBA (b) GN, 4.00%, 30YR TBA (b) GN 745187 30YR, 4.50%, 7/15/40 GN AA5452 30YR, 3.50%, 7/15/42 Granite Master Issuer PLC, 1.06%, 12/17/54 Harborview Mortgage Loan Trust, 2.84%, 1/19/35 Hilton USA Trust 2013-HLF 144A, 1.19%, 11/05/30 (a) Hilton USA Trust 2013-HLT 144A, 2.66%, 11/05/30 (a) JP Morgan Chase Commercial Mortgage Securities Trust 2015-COSMO 144A, 1.45%, 1/15/32 (a) JP Morgan Mortgage Trust 2006-S2, 6.00%, 7/25/36 JP Morgan Mortgage Trust 2013-1 144A, 2.50%, 3/25/43 (a) JP Morgan Mortgage Trust 2014-2 144A, 3.00%, 6/25/29 (a) JP Morgan Seasoned Mortgage Trust 2014-1 144A, 0.70%, 5/25/33 (a) Landmark Mortgage Securities PLC, 0.81%, 6/17/38 GBP (c) Morgan Stanley Mortgage Loan Trust, 2.12%, 7/25/34 Nationstar Mortgage Loan Trust 2013-A 144A, 3.75%, 12/25/52 (a) New Residential Mortgage Loan Trust 2014-3 144A, 3.75%, 11/25/54 (a) Prime Mortgage Trust, 5.00%, 10/25/35 Residential Asset Securitization Trust 2006-A8, 6.00%, 8/25/36 28 Payden Mutual Funds $ Principal or Shares 12,094 25,517 12,895 3,653 3,959 2,302 4,968 3,609 1,556 3,277 913 4,612 6,423 1,749 880 2,366 1,182 1,409 302 1,147 1,970 6,592 8,031 3,358 1,422 296 140 1,458 2,447 2,293 391 8,340 3,660 5,560 79 40 1,381 2,337 585 1,832 72,484 1,091,581 5,538,369 Value (000) Security Description Sequoia Mortgage Trust, 0.99%, 10/20/27 Sequoia Mortgage Trust, 1.45%, 2/25/43 Sequoia Mortgage Trust 144A, 3.00%, 5/25/43 (a) 2,320,549 Sequoia Mortgage Trust, 3.50%, 9/25/42 926,589 Springleaf Mortgage Loan Trust 144A, 1.27%, 6/25/58 (a) 1,300,000 Springleaf Mortgage Loan Trust 144A, 5.58%, 6/25/58 (a) 18,282 Structured Asset Mortgage Investments Trust 2003-CL1, 3.72%, 7/25/32 7,611 Structured Asset Securities Corp. Mortgage Pass Through Certificates 2002-16A, 0.00%, 8/25/32 875,558 WaMu Mortgage Pass-Through Certificates Series 2007-HY7 Trust, 2.23%, 7/25/37 2,750,000 Wells Fargo Commercial Mortgage Trust 2015-Lc22, 3.84%, 9/15/58 Total Mortgage Backed (Cost - $227,718) Municipal (1%) 770,000 State Board of Administration Finance Corp., 3.00%, 7/01/20 1,495,000 State of California, 7.55%, 4/01/39 1,000,000 State of Washington, 1.70%, 7/01/20 365,000 University of California, 3.26%, 5/15/24 Total Municipal (Cost - $3,578) U.S. Government Agency (3%) 10,000,000 FHLB Disc Note, 1.30%, 11/13/15 (d) 10,000,000 FHLB Disc Note, 1.30%, 11/27/15 (d) Total U.S. Government Agency (Cost - $20,000) U.S.
Treasury (10%) 2,100,000 U.S. Treasury Note, 0.19%, 1/31/17 3,300,000 U.S. Treasury Note, 0.38%, 10/31/16 11,520,000 U.S.
Treasury Note, 0.88%, 4/30/17 15,145,000 U.S. Treasury Note, 1.38%, 10/31/20 13,340,000 U.S. Treasury Note, 1.50%, 5/31/20 27,195,000 U.S.
Treasury Note, 2.88%, 8/15/45 Total U.S. Treasury (Cost - $72,452) Investment Company (9%) 500,000 Payden Absolute Return Bond Fund, SI Class * 21,564,940 Payden Cash Reserves Money Market Fund * 1,656,459 Payden Emerging Markets Corporate Bond Fund, SI Class * 646,094 Payden Emerging Markets Local Bond Fund, Investor Class * 1,522,172 Payden Floating Rate Fund, SI Class * Total Investment Company (Cost - $64,840) Total (Cost - $789,804) (115%) Liabilities in excess of Other Assets (-15%) Net Assets (100%) $ 71 1,060 5,482 2,361 929 1,309 19 5 751 2,890 229,337 787 2,208 975 370 4,340 10,000 10,000 20,000 2,100 3,298 11,564 15,036 13,366 26,877 72,241 4,965 21,565 15,952 $ 4,303 15,069 61,854 790,508 (105,359) 685,149 * Affiliated investment (a) Security offered only to qualified institutional investors, and thus is not registered for sale to the public under rule 144A of the Securities Act of 1933. It has been deemed liquid under guidelines approved by the Board. (b) Security was purchased on a delayed delivery basis. (c) Principal in foreign currency. (d) Yield to maturity at time of purchase. . Open Forward Currency Contracts to USD Delivery Date Assets: 2/1/2016 12/15/2015 12/15/2015 Liabilities: 2/1/2016 2/24/2016 12/15/2015 11/24/2015 11/24/2015 11/24/2015 1/27/2016 Currency (000s) Australian Dollar (Sell 27,401) British Pound (Buy 6,371) Euro (Sell 13,192) Counterparty Unrealized Appreciation (Depreciation) (000s) Credit Suisse First Boston International Citibank, N.A. $ 352 BNP PARIBAS 180 $ 561 Credit Suisse First Boston International Barclays Bank PLC $ (14) 29 Open Futures Contracts Number of Contracts 72 282 160 31 Australian Dollar (Buy 12,970) Chinese Yuan (Sell 52,587) Euro (Sell 5,586) New Taiwan Dollar (Sell 106,220) South Korean Won (Buy 5,803,000) South Korean Won (Sell 5,803,000) Thailand Baht (Sell 295,030) BNP PARIBAS HSBC Bank USA, N.A. BNP PARIBAS BNP PARIBAS Barclays Bank PLC Contract Type U.S. Long Bond Future U.S. Treasury 10 Year Note Future U.S. Treasury 5 Year Note Future U.S.
Ultra Bond Future Expiration Date Dec-15 Dec-15 Current Value (000) $(11,263) (36,008) Unrealized Appreciation (Depreciation) (000s) $177 36 Jan-16 (19,164) 121 Dec-15 4,952 (52) $282 (232) (17) (21) (36) (211) (29) $(560) See notes to financial statements. Annual Report 29 . Payden Corporate Bond Fund $21,000 The Fund seeks a high level of total return that is consistent with the preservation of capital by generally investing 80% of its assets in investment grade corporate bonds with no limit on the average portfolio maturity. Five Year 5.09% Since 3/12/09 7.83% Fund $16,494 Barclays Capital U.S. Corporate Investment Grade Index $16,825 $17,000 $15,000 Portfolio Composition - percent of value Financial Consumer Non-Cyclical Telecommunication Consumer Cyclical Industrial Other One Year 2.26% $19,000 52% 15% 7% 7% 5% 14% $13,000 $11,000 $9,000 3/12/09 6/12 10/31/15 Past performance does not predict future returns. The graph does not reflect the impact of taxes or transaction costs a shareholder would pay. This information is not part of the audited financial statements. Schedule of Investments - October 31, 2015 Principal or Shares Security Description Corporate Bond (97%) Consumer Cyclical (7%) 600,000 Continental Airlines 2012-3 Class C Pass Thru Certificates, 6.13%, 4/29/18 500,000 Daimler Finance North America LLC 144A, 1.60%, 8/03/17 (a) 600,000 Ford Motor Credit Co. LLC, 1.46%, 3/27/17 730,000 Glencore Funding LLC 144A, 1.49%, 5/27/16 (a) 450,000 Lam Research Corp., 3.80%, 3/15/25 330,000 Latam Airlines 2015-1 Pass Through Trust B 144A, 4.50%, 11/15/23 (a) 300,000 Lowe’s Companies Inc., 4.38%, 9/15/45 650,000 Magna International Inc., 4.15%, 10/01/25 700,000 Tingyi Cayman Islands Holding Corp., 3.88%, 6/20/17 Consumer Non-Cyclical (15%) 300,000 AbbVie Inc., 3.60%, 5/14/25 425,000 Actavis Funding SCS, 2.45%, 6/15/19 250,000 Actavis Funding SCS, 3.00%, 3/12/20 250,000 Actavis Funding SCS, 4.75%, 3/15/45 700,000 Baxalta Inc.
144A, 4.00%, 6/23/25 (a) 950,000 Biogen Inc., 4.05%, 9/15/25 750,000 Block Financial LLC, 4.13%, 10/01/20 700,000 Blue Cross & Blue Shield of Minnesota 144A, 3.79%, 5/01/25 (a) 265,000 Boston Scientific Corp., 2.85%, 5/15/20 750,000 Celgene Corp., 2.88%, 8/15/20 1,250,000 Imperial Tobacco Finance PLC 144A, 3.75%, 7/21/22 (a) 650,000 Mallinckrodt International Finance SA, 3.50%, 4/15/18 400,000 Mead Johnson Nutrition Co., 4.13%, 11/15/25 275,000 New York and Presbyterian Hospital, 4.02%, 8/01/45 590,000 North Shore Long Island Jewish Health Care Inc., 6.15%, 11/01/43 30 Payden Mutual Funds Value (000) Principal or Shares 945,000 700,000 $ Pfizer Inc., 7.20%, 3/15/39 St Jude Medical Inc., 2.00%, 9/15/18 619 498 596 713 423 Energy (4%) 602,587 600,000 750,000 308 306 663 717 4,843 296 423 251 240 705 964 762 693 265 756 1,267 633 405 258 702 250,000 350,000 Value (000) Security Description Alliance Pipeline LP/United States 144A, 7.00%, 12/31/19 (a) Canadian Natural Resources Ltd., 5.90%, 2/01/18 Hutchison Whampoa International 12 Ltd. 144A, 6.00%, 5/29/49 (a) Kinder Morgan Inc./DE 144A, 5.00%, 2/15/21 (a) Valero Energy Corp., 6.63%, 6/15/37 Financial (52%) 200,000 AerCap Ireland Capital Ltd. / AerCap Global Aviation Trust, 4.63%, 10/30/20 430,000 Air Lease Corp., 5.63%, 4/01/17 750,000 Ally Financial Inc., 3.25%, 2/13/18 550,000 American Campus Communities Operating Partnership LP, 3.35%, 10/01/20 500,000 Ares Capital Corp., 4.88%, 11/30/18 750,000 Australia & New Zealand Banking Group Ltd. 144A, 4.50%, 3/19/24 (a) 810,000 Banco de Costa Rica 144A, 5.25%, 8/12/18 (a) 500,000 Bank of America Corp., 4.00%, 1/22/25 250,000 Bank of America Corp., 6.10%, 12/29/49 105,000 Bank of America Corp., 6.88%, 4/25/18 330,000 Bank of America Corp., 7.63%, 6/01/19 700,000 Bank of Tokyo-Mitsubishi UFJ Ltd. 144A, 2.15%, 9/14/18 (a) 550,000 Banque Federative du Credit Mutuel SA 144A, 2.75%, 10/15/20 (a) 370,000 Barclays Bank PLC 144A, 6.05%, 12/04/17 (a) 600,000 Barclays PLC, 2.88%, 6/08/20 $ 1,306 703 10,629 654 643 786 253 388 2,724 208 451 755 555 520 755 825 494 253 117 389 701 550 399 602 .
Principal or Shares 252,000 600,000 500,000 250,000 500,000 200,000 500,000 625,000 500,000 750,000 290,000 1,000,000 500,000 205,000 350,000 600,000 460,000 350,000 315,000 500,000 600,000 300,000 700,000 750,000 450,000 440,000 250,000 300,000 510,000 550,000 505,000 50,000 400,000 250,000 300,000 600,000 640,000 500,000 450,000 340,000 1,000,000 325,000 200,000 400,000 Value (000) Security Description BBVA Banco Continental SA 144A, 2.25%, 7/29/16 (a) BPCE SA 144A, 4.50%, 3/15/25 (a) Citigroup Inc., 4.45%, 9/29/27 Citigroup Inc., 5.90%, 12/29/49 Compass Bank, 1.85%, 9/29/17 Corp. Financiera de Desarrollo SA 144A, 3.25%, 7/15/19 (a) Credit Suisse Group Funding Guernsey Ltd. 144A, 3.80%, 9/15/22 (a) Digital Delta Holdings LLC 144A, 3.40%, 10/01/20 (a) Discover Bank/Greenwood DE, 3.10%, 6/04/20 Fairfax U.S. Inc. 144A, 4.88%, 8/13/24 (a) FS Investment Corp., 4.25%, 1/15/20 General Electric Capital Corp., 6.38%, 11/15/67 General Motors Financial Co.
Inc., 3.20%, 7/13/20 General Motors Financial Co. Inc., 4.75%, 8/15/17 Goldman Sachs Group Inc., 4.25%, 10/21/25 Goldman Sachs Group Inc., 5.63%, 1/15/17 Goldman Sachs Group Inc., 7.50%, 2/15/19 Goodman Funding Ltd. 144A, 6.00%, 3/22/22 (a) HBOS PLC 144A, 6.75%, 5/21/18 (a) Hospitality Properties Trust, 4.50%, 3/15/25 International Lease Finance Corp., 2.29%, 6/15/16 Intesa Sanpaolo SPA 144A, 7.70%, 12/29/49 (a) Jackson National Life Global Funding 144A, 1.88%, 10/15/18 (a) JPMorgan Chase & Co., 2.55%, 10/29/20 KeyCorp, 2.90%, 9/15/20 Kimco Realty Corp., 3.40%, 11/01/22 Lloyds TSB Bank PLC 144A, 6.50%, 9/14/20 (a) Macquarie Bank Ltd.
144A, 4.88%, 6/10/25 (a) Macquarie Bank Ltd. 144A, 6.63%, 4/07/21 (a) Meiji Yasuda Life Insurance Co. 144A, 5.20%, 10/20/45 (a) MetLife Inc., 6.40%, 12/15/36 MetLife Inc., 10.75%, 8/01/39 Morgan Stanley, 4.35%, 9/08/26 Morgan Stanley, 5.55%, 12/29/49 Mubadala GE Capital Ltd.
144A, 3.00%, 11/10/19 (a) Nationwide Mutual Insurance Co. 144A, 9.38%, 8/15/39 (a) Navient Corp., 6.13%, 3/25/24 Nordea Bank AB 144A, 1.88%, 9/17/18 (a) Pacific Life Insurance Co. 144A, 9.25%, 6/15/39 (a) People’s United Bank, 4.00%, 7/15/24 Pershing Square Holdings Ltd.
144A, 5.50%, 7/15/22 (a) Prudential Financial Inc., 5.63%, 6/15/43 Prudential Financial Inc., 5.88%, 9/15/42 Prudential Financial Inc., 8.88%, 6/15/38 Principal or Shares 625,000 $ 254 592 501 249 498 250,000 650,000 430,000 201 700,000 505 629 506 742 293 1,071 497 213 351 629 536 390 348 487 600 304 701 748 454 441 289 299 577 569 555 79 407 250 470,000 365,000 270,000 780,000 250,000 250,000 550,000 670,000 250,000 1,000,000 600,000 Value (000) Security Description QBE Insurance Group Ltd. 144A, 2.40%, 5/01/18 (a) RBS Citizens Financial Group Inc. 144A, 4.15%, 9/28/22 (a) Royal Bank of Scotland Group PLC, 5.13%, 5/28/24 Santander Holdings USA Inc./PA, 2.65%, 4/17/20 Santander UK Group Holdings PLC 144A, 4.75%, 9/15/25 (a) Select Income REIT, 4.50%, 2/01/25 Senior Housing Properties Trust, 6.75%, 4/15/20 Sompo Japan Insurance Inc.
144A, 5.33%, 3/28/73 (a) Suncorp-Metway Ltd. 144A, 2.35%, 4/27/20 (a) Synchrony Financial, 2.70%, 2/03/20 Synchrony Financial, 3.75%, 8/15/21 Teachers Insurance & Annuity Association of America 144A, 4.90%, 9/15/44 (a) Transatlantic Holdings Inc., 8.00%, 11/30/39 Trinity Acquisition PLC, 6.13%, 8/15/43 UBS Group Funding Jersey Ltd. 144A, 4.13%, 9/24/25 (a) WEA Finance LLC / Westfield UK & Europe Finance PLC 144A, 3.25%, 10/05/20 (a) Healthcare (1%) 110,000 Dignity Health, 3.13%, 11/01/22 740,000 Dignity Health, 4.50%, 11/01/42 150,000 Kaiser Foundation Hospitals, 3.50%, 4/01/22 Industrial (4%) 440,000 Aviation Capital Group Corp.
144A, 4.63%, 1/31/18 (a) 400,000 FedEx Corp., 4.50%, 2/01/65 450,000 Keysight Technologies Inc. 144A, 3.30%, 10/30/19 (a) 350,000 Penske Truck Leasing Co. LP / PTL Finance Corp.
144A, 3.05%, 1/09/20 (a) 500,000 Pentair Finance SA, 2.90%, 9/15/18 825,000 Sydney Airport Finance Co. Pty Ltd. 144A, 3.38%, 4/30/25 (a) 300,000 Textron Inc., 5.60%, 12/01/17 300 913 580 501 666 338 945 341 213 457 Material (2%) 350,000 Anglo American Capital PLC 144A, 4.13%, 4/15/21 (a) 155,000 Dow Chemical Co., 9.40%, 5/15/39 445,000 Westvaco Corp., 7.95%, 2/15/31 $ 628 254 668 426 700 449 407 288 774 247 252 571 871 274 1,006 606 37,014 110 709 155 974 454 356 446 350 502 790 320 3,218 303 227 583 1,113 Technology (1%) 500,000 Dun & Bradstreet Corp., 4.00%, 6/15/20 500,000 Hewlett Packard Enterprise Co.
144A, 3.60%, 10/15/20 (a) 507 504 1,011 Telecommunication (7%) 175,000 21st Century Fox America Inc., 9.50%, 7/15/24 240 Annual Report 31 . Payden Corporate Bond Fund continued Principal or Shares 1,000,000 250,000 500,000 650,000 400,000 400,000 1,000,000 280,000 Utility (4%) 700,000 250,000 600,000 500,000 225,000 400,000 AT&T Inc., 4.50%, 5/15/35 AT&T Inc., 6.55%, 2/15/39 British Sky Broadcasting Group PLC 144A, 9.50%, 11/15/18 (a) Harris Corp., 2.70%, 4/27/20 Orange SA, 9.00%, 3/01/31 Time Warner Inc., 7.63%, 4/15/31 Verizon Communications Inc., 4.40%, 11/01/34 Verizon Communications Inc., 4.86%, 8/21/46 $ 938 290 602 639 583 512 943 269 5,016 AES Corp./VA, 3.32%, 6/01/19 Berkshire Hathaway Energy Co., 6.13%, 4/01/36 EDP Finance BV 144A, 6.00%, 2/02/18 (a) Entergy Louisiana LLC, 5.00%, 7/15/44 Sempra Energy, 9.80%, 2/15/19 Solar Star Funding LLC 144A, 3.95%, 6/30/35 (a) Total Corporate Bond (Cost - $68,679) Mortgage Backed (0%) 400,000 Fannie Mae Connecticut Avenue Securities, 5.89%, 4/25/28 (Cost - $400) U.S. Treasury (1%) 450,000 U.S. Treasury Note, 0.38%, 4/30/16 (b) (Cost - $450) Investment Company (1%) 1,012,944 Payden Cash Reserves Money Market Fund * (Cost - $1,013) Total (Cost - $70,542) (99%) Other Assets, net of Liabilities (1%) Net Assets (100%) Open Forward Currency Contracts to USD Value (000) Security Description Delivery Date Assets: 2/1/2016 Currency (000s) 301 639 485 276 12/15/2015 401 2,771 69,313 Credit Suisse First Boston International Royal Bank of Canada BNP PARIBAS $ (2) Canadian Dollar (Sell 917) Euro (Sell 326) 408 67 30 Contract Type U.S. Treasury 10 Year Note Future U.S.
Treasury 5 Year Note Future U.S. Treasury Ultra Bond Future (8) (1) $(11) Unrealized Appreciation (Depreciation) (000s) $ 33 Expiration Date Dec-15 Current Value (000) $(4,597) Jan-16 8,025 (2) Dec-15 4,793 (27) $ 4 $ 1,013 71,184 358 71,542 * Affiliated investment (a) Security offered only to qualified institutional investors, and thus is not registered for sale to the public under rule 144A of the Securities Act of 1933. It has been deemed liquid under guidelines approved by the Board. (b) All or a portion of the security is pledged to cover futures contract margin requirements. See notes to financial statements. 32 Payden Mutual Funds $ 25 Open Futures Contracts Number of Contracts 36 450 Credit Suisse First Boston International Australian Dollar (Buy 966) 1/15/2016 Counterparty Australian Dollar (Sell 1,967) Liabilities: 2/1/2016 669 Unrealized Appreciation (Depreciation) (000s) . Payden Strategic Income Fund The Fund seeks a high level of total return including income generation consistent with preservation of capital by investing in a wide variety of securities across many asset classes. $11,000 Portfolio Composition - percent of value $10,500 Corporate Mortgage Backed U.S. Treasury Bank Loans Asset Backed Other One Year 2.08% Fund $10,304 Since 5/8/14 2.04% Barclay's Aggregate Index $10,391 43% 19% 13% 7% 8% 10% $10,000 $9,500 5/8/2014 1/15 10/31/15 Past performance does not predict future returns. The graph does not reflect the impact of taxes or transaction costs a shareholder would pay. The Fund’s Adviser and SI Classes are expected to perform similarly to its Investor Class. This information is not part of the audited financial statements. Schedule of Investments - October 31, 2015 Principal or Shares Security Description Asset Backed (8%) 976,197 American Homes 4 Rent 2014-SFR1 144A, 1.25%, 6/17/31 (a) 1,250,000 Apidos CLO XIV 144A, 1.47%, 4/15/25 (a) 1,600,000 Babson CLO Ltd.
144A, 1.42%, 4/20/25 (a) 295,545 Colony American Homes 2014-2 144A, 1.15%, 7/17/31 (a) 999,523 Colony American Homes 2015-1 144A, 1.40%, 7/17/32 (a) 500,000 Eaton Vance Clo 2015-1 Ltd. 144A, 4.52%, 10/20/26 (a) 552,035 Invitation Homes 2013-SFR1 Trust 144A, 1.40%, 12/17/30 (a) 620,000 Invitation Homes 2014-SFR1 Trust 144A, 1.20%, 6/17/31 (a) 250,000 Invitation Homes 2014-SFR2 Trust 144A, 1.30%, 9/17/31 (a) 400,000 LCM XX LLC 144A, 4.07%, 10/20/27 (a) 1,000,000 Octagon Investment Partners XIX Ltd. 144A, 1.84%, 4/15/26 (a) 1,000,000 Symphony CLO XV Ltd.
144A, 1.77%, 10/17/26 (a) 1,000,000 Tyron Park CLO Ltd. 144A, 1.44%, 7/15/25 (a) 1,250,000 Venture XVII CLO Ltd. 144A, 1.80%, 7/15/26 (a) 588,757 VOLT XXV LLC 144A, 3.50%, 6/26/45 (a) 447,109 VOLT XXXV LLC 144A, 3.50%, 6/26/45 (a) 355,135 Wachovia Asset Securitization Issuance II LLC 2007-HE1 Trust 144A, 0.34%, 7/25/37 (a) Total Asset Backed (Cost - $12,964) Bank Loans(b) (8%) 495,000 Akorn Inc.
Term Loan 1L, 4.50%, 4/16/21 595,606 Albertsons/Safeway LLC Term Loan B4 1L, 5.50%, 8/25/21 750,000 Allison Transmission Inc. Term Loan B3 1L, 3.75%, 8/23/19 Value (000) Principal or Shares Value (000) Security Description 750,000 $ 957 1,226 1,573 289 978 485 545 607 245 385 992 990 985 1,238 584 448 316 12,843 492 596 752 ARAMARK Corp. Term Loan E 1L, 3.25%, 9/17/19 500,000 Berry Plastics Group Inc.
Term Loan E 1L, 3.75%, 1/16/21 750,000 BJ’s Wholesale Club Inc. Term Loan B 1L, 4.50%, 9/26/19 653,216 Burlington Coat Factory Warehouse Corp. Term Loan B3 1L, 4.25%, 8/13/21 493,751 Catalent Pharma Solutions Inc.
Term Loan B 1L, 4.50%, 5/20/21 496,184 CDW LLC/CDW Finance Corp. Term Loan B 1L, 3.50%, 4/29/20 750,000 ClubCorp Club Operations Inc., 4.25%, 7/24/20 493,750 Davita Healthcare Partners Inc. Term Loan B 1L, 3.50%, 6/24/21 591,000 HUB International Ltd.
Term Loan B 1L, 4.25%, 10/02/20 493,750 Libbey Glass Inc. Term Loan 1L, 3.75%, 4/09/21 493,750 Michaels Stores Inc. Term Loan 1L, 4.00%, 1/28/20 494,962 Neiman Marcus Group LLC Term Loan 1L, 4.25%, 10/15/20 493,755 Nortek Inc.
Term Loan B 1L, 3.75%, 10/30/20 493,750 Ortho-Clinical Diagnostics, Inc. Term Loan B 1L, 4.75%, 6/30/21 598,500 PetSmart Inc., 4.25%, 3/10/22 592,386 Sabre Global Inc. Term Loan B 1L, 4.25%, 2/19/19 422,321 Vantiv LLC Term Loan B 1L, 3.75%, 6/13/21 291,667 Visteon Corp.
Term Loan B IL, 3.50%, 4/08/21 Total Bank Loans (Cost - $11,656) Corporate Bond (47%) 300,000 AbbVie Inc., 2.50%, 5/14/20 300,000 AbbVie Inc., 3.20%, 11/06/22 605,000 Actavis Funding SCS, 2.45%, 6/15/19 $ 751 500 745 655 494 495 751 496 577 492 496 484 490 488 599 593 424 291 11,661 297 297 602 Annual Report 33 . Payden Strategic Income Fund continued Principal or Shares 260,000 300,000 230,000 620,000 400,000 200,000 8,700,000 261,964 300,000 450,000 305,000 300,000 300,000 350,000 800,000 500,000 300,000 325,000 210,000 475,000 450,000 275,000 350,000 350,000 650,000 585,000 250,000 870,000 700,000 500,000 190,000 300,000 80,000 300,000 540,000 300,000 400,000 210,000 300,000 300,000 200,000 700,000 Value (000) Security Description Actavis Funding SCS, 3.00%, 3/12/20 AerCap Aviation Solutions BV, 6.38%, 5/30/17 Air Canada 144A, 8.75%, 4/01/20 (a) Air Lease Corp., 5.63%, 4/01/17 Aircastle Ltd., 5.50%, 2/15/22 Alexandria Real Estate Equities Inc., 2.75%, 1/15/20 America Movil SAB de CV, 6.00%, 6/09/19 MXN (c) American Airlines 2013-2 Class B Pass Through Trust, 5.60%, 7/15/20 American Axle & Manufacturing Inc., 6.25%, 3/15/21 American Campus Communities Operating Partnership LP, 3.35%, 10/01/20 American Express Credit Corp., 1.55%, 9/22/17 Anglo American Capital PLC 144A, 4.13%, 4/15/21 (a) Ardagh Packaging Finance PLC 144A, 9.13%, 10/15/20 (a) Ardagh Packaging Finance PLC / Ardagh Holdings USA Inc. 144A, 3.34%, 12/15/19 (a) AT&T Inc., 3.40%, 5/15/25 Australia & New Zealand Banking Group Ltd. 144A, 4.50%, 3/19/24 (a) AutoZone Inc., 1.30%, 1/13/17 Bank of America Corp., 6.10%, 12/29/49 Bank of America Corp., 6.88%, 4/25/18 Bank of Tokyo-Mitsubishi UFJ Ltd. 144A, 2.70%, 9/09/18 (a) Banque Federative du Credit Mutuel SA 144A, 2.75%, 10/15/20 (a) Barclays Bank PLC 144A, 6.05%, 12/04/17 (a) Barclays PLC, 2.88%, 6/08/20 Baxalta Inc. 144A, 2.88%, 6/23/20 (a) BB&T Corp., 4.90%, 6/30/17 BBVA Banco Continental SA 144A, 3.25%, 4/08/18 (a) Bear Stearns Companies LLC, 5.55%, 1/22/17 Biogen Inc., 3.63%, 9/15/22 Block Financial LLC, 4.13%, 10/01/20 Blue Cross & Blue Shield of Minnesota 144A, 3.79%, 5/01/25 (a) Boston Scientific Corp., 2.85%, 5/15/20 Capital One Bank USA NA, 2.30%, 6/05/19 Capital One Financial Corp., 6.15%, 9/01/16 CCO Holdings LLC / CCO Holdings Capital Corp., 5.75%, 9/01/23 Celgene Corp., 2.88%, 8/15/20 CenturyLink Inc., 6.45%, 6/15/21 CF Industries Inc., 6.88%, 5/01/18 Chrysler Group LLC / CG Co.-Issuer Inc., 8.25%, 6/15/21 CHS/Community Health Systems Inc., 8.00%, 11/15/19 Citigroup Inc., 0.60%, 6/09/16 Citigroup Inc., 1.55%, 8/14/17 Citigroup Inc., 4.45%, 9/29/27 34 Payden Mutual Funds $ Principal or Shares 262 314 252 650 424 145,000 425,000 198 600,000 950,000 500,000 300,000 532 155,000 330,000 269 315 454 306 259 315 346 778 504 300 329 235 484 450 297 351 350 684 595 262 886 712 495 190 298 83 309 544 304 443 225 314 299 200 701 350,000 635,000 400,000 500,000 300,000 400,000 150,000 425,000 350,000 500,000 205,000 850,000 400,000 300,000 350,000 220,000 235,000 450,000 500,000 300,000 550,000 600,000 300,000 200,000 465,000 1,050,000 350,000 225,000 300,000 530,000 400,000 247,000 300,000 1,100,000 600,000 750,000 450,000 500,000 Value (000) Security Description CNH Industrial Capital LLC, 3.63%, 4/15/18 Continental Airlines 2012-3 Class C Pass Thru Certificates, 6.13%, 4/29/18 Continental Resources Inc./OK, 5.00%, 9/15/22 Corp.
Nacional del Cobre de Chile 144A, 3.88%, 11/03/21 (a) Credit Suisse/New York NY, 6.00%, 2/15/18 CVS Health Corp., 3.88%, 7/20/25 Dana Holding Corp., 5.38%, 9/15/21 DaVita HealthCare Partners Inc., 5.13%, 7/15/24 DCP Midstream LLC 144A, 9.75%, 3/15/19 (a) Deutsche Bank AG, 2.95%, 8/20/20 Discover Bank/Greenwood DE, 3.10%, 6/04/20 DISH DBS Corp., 5.88%, 11/15/24 Dole Food Co. Inc. 144A, 7.25%, 5/01/19 (a) E*TRADE Financial Corp., 5.38%, 11/15/22 Eastman Chemical Co., 2.40%, 6/01/17 Edison International, 3.75%, 9/15/17 EDP Finance BV 144A, 6.00%, 2/02/18 (a) Entergy Louisiana LLC, 5.00%, 7/15/44 EP Energy LLC / EP Energy Finance Inc., 9.38%, 5/01/20 Export-Import Bank of India, 3.88%, 10/02/19 Express Scripts Holding Co., 2.25%, 6/15/19 Fifth Third Bank/Cincinnati OH, 2.15%, 8/20/18 Ford Motor Credit Co.
LLC, 2.24%, 6/15/18 Ford Motor Credit Co. LLC, 6.63%, 8/15/17 FS Investment Corp., 4.25%, 1/15/20 GATX Corp., 2.50%, 3/15/19 General Electric Capital Corp., 6.38%, 11/15/67 Glencore Funding LLC 144A, 1.49%, 5/27/16 (a) Goldman Sachs Group Inc., 2.60%, 4/23/20 Goldman Sachs Group Inc., 7.50%, 2/15/19 Goodyear Tire & Rubber Co., 6.50%, 3/01/21 HBOS PLC 144A, 6.75%, 5/21/18 (a) Hertz Corp., 6.75%, 4/15/19 Hewlett Packard Enterprise Co. 144A, 3.60%, 10/15/20 (a) Hexion U.S.
Finance Corp., 6.63%, 4/15/20 Hospitality Properties Trust, 4.50%, 3/15/25 HPHT Finance 15 Ltd. 144A, 2.25%, 3/17/18 (a) HSBC USA Inc., 2.00%, 8/07/18 Hyundai Capital America 144A, 1.45%, 2/06/17 (a) Hyundai Capital America 144A, 1.88%, 8/09/16 (a) Icahn Enterprises LP / Icahn Enterprises Finance Corp., 3.50%, 3/15/17 Imperial Tobacco Finance PLC 144A, 2.95%, 7/21/20 (a) Industrial & Commercial Bank of China Ltd./New York, 2.35%, 11/13/17 Jackson National Life Global Funding 144A, 1.88%, 10/15/18 (a) John Deere Capital Corp., 2.30%, 9/16/19 Johnson Controls Inc., 1.40%, 11/02/17 $ 146 438 140 334 650 979 512 305 381 638 405 480 302 429 152 441 373 485 179 884 400 302 349 237 238 447 535 293 553 700 320 221 478 1,059 298 219 299 531 398 248 304 1,106 605 752 454 497 . Principal or Shares 525,000 360,000 500,000 435,000 300,000 750,000 300,000 450,000 400,000 470,000 350,000 150,000 392,000 450,000 165,000 500,000 650,000 100,000 500,000 200,000 250,000 300,000 400,000 350,000 250,000 600,000 420,000 400,000 400,000 280,000 300,000 300,000 250,000 300,000 250,000 600,000 500,000 475,000 475,000 300,000 200,000 600,000 500,000 200,000 Value (000) Security Description KazMunayGas National Co. JSC 144A, 6.38%, 4/09/21 (a) KeyCorp, 2.90%, 9/15/20 Keysight Technologies Inc. 144A, 3.30%, 10/30/19 (a) Kilroy Realty LP, 5.00%, 11/03/15 Kinder Morgan Inc./DE, 3.05%, 12/01/19 Kraft Heinz Foods Co. 144A, 3.50%, 7/15/22 (a) Laredo Petroleum Inc., 7.38%, 5/01/22 Latam Airlines 2015-1 Pass Through Trust A 144A, 4.20%, 11/15/27 (a) Levi Strauss & Co., 6.88%, 5/01/22 LifePoint Health Inc., 5.50%, 12/01/21 Lloyds Bank PLC, 2.00%, 8/17/18 Macquarie Group Ltd.
144A, 3.00%, 12/03/18 (a) Macquarie Group Ltd. 144A, 4.88%, 8/10/17 (a) Martin Marietta Materials Inc., 1.43%, 6/30/17 MeadWestvaco Corp., 7.38%, 9/01/19 Medtronic Inc., 3.15%, 3/15/22 Meiji Yasuda Life Insurance Co. 144A, 5.20%, 10/20/45 (a) MetLife Inc., 5.25%, 12/29/49 Microsoft Corp., 1.85%, 2/12/20 Mizuho Bank Ltd.
144A, 0.78%, 9/25/17 (a) Mizuho Bank Ltd. 144A, 1.55%, 10/17/17 (a) Mobile Mini Inc., 7.88%, 12/01/20 Morgan Stanley, 4.35%, 9/08/26 Morgan Stanley, 5.55%, 12/29/49 Morgan Stanley, 5.95%, 12/28/17 Mubadala GE Capital Ltd. 144A, 3.00%, 11/10/19 (a) MUFG Union Bank NA, 5.95%, 5/11/16 Nationwide Building Society 144A, 6.25%, 2/25/20 (a) NBTY Inc., 9.00%, 10/01/18 New Red Finance Inc 144A, 6.00%, 4/01/22 (a) New Red Finance Inc.
144A, 4.63%, 1/15/22 (a) NextEra Energy Capital Holdings Inc., 2.06%, 9/01/17 Novelis Inc./GA, 8.75%, 12/15/20 Numericable Group SA 144A, 6.00%, 5/15/22 (a) Orange SA, 9.00%, 3/01/31 Pacific LifeCorp 144A, 6.00%, 2/10/20 (a) Party City Holdings Inc. 144A, 6.13%, 8/15/23 (a) Penske Truck Leasing Co. LP / PTL Finance Corp.
144A, 3.38%, 2/01/22 (a) Pernod Ricard SA 144A, 4.25%, 7/15/22 (a) Perrigo Co. PLC, 2.30%, 11/08/18 Pertamina Persero PT 144A, 5.25%, 5/23/21 (a) Pfizer Inc., 6.20%, 3/15/19 PG&E Corp., 2.40%, 3/01/19 QBE Insurance Group Ltd. 144A, 2.40%, 5/01/18 (a) Principal or Shares 500,000 $ 532 363 495 435 291 765 298 429 440 478 352 152 409 447 190 512 672 101 502 199 249 314 407 350 272 600 431 464 410 294 305 302 252 302 364 678 518 464 493 296 206 683 503 201 300,000 300,000 253,000 230,000 400,000 600,000 750,000 168,000 350,000 450,000 250,000 250,000 845,000 400,000 400,000 500,000 490,000 300,000 600,000 550,000 300,000 150,000 150,000 320,000 300,000 450,000 500,000 400,000 500,000 300,000 114,000 500,000 350,000 400,000 700,000 700,000 455,000 165,000 500,000 Value (000) Security Description Reynolds Group Issuer Inc./Reynolds Group Issuer LLC, 7.13%, 4/15/19 Royal Bank of Scotland Group PLC, 1.88%, 3/31/17 Royal Bank of Scotland Group PLC, 5.13%, 5/28/24 Ryder System Inc., 2.50%, 3/01/17 Ryder System Inc., 2.50%, 5/11/20 Sabine Pass LNG LP, 7.50%, 11/30/16 Santander Holdings USA Inc./PA, 2.65%, 4/17/20 Santander UK Group Holdings PLC 144A, 4.75%, 9/15/25 (a) Scentre Group Trust 1 / Scentre Group Trust 2 144A, 2.38%, 11/05/19 (a) Select Income REIT, 4.50%, 2/01/25 Senior Housing Properties Trust, 4.75%, 5/01/24 Senior Housing Properties Trust, 6.75%, 4/15/20 Sinclair Television Group Inc.
144A, 6.38%, 11/01/21 (a) Sinopec Group Overseas Development 2012 Ltd. 144A, 3.90%, 5/17/22 (a) Softbank Corp. 144A, 4.50%, 4/15/20 (a) Sonic Automotive Inc., 5.00%, 5/15/23 Southwest Airlines Co., 2.75%, 11/06/19 Starz LLC / Starz Finance Corp., 5.00%, 9/15/19 Suburban Propane Partners LP/Suburban Energy Finance Corp., 5.50%, 6/01/24 Sumitomo Mitsui Banking Corp., 1.95%, 7/23/18 Suncorp-Metway Ltd. 144A, 2.35%, 4/27/20 (a) Synchrony Financial, 1.88%, 8/15/17 Synchrony Financial, 3.75%, 8/15/21 Talen Energy Supply LLC 144A, 4.63%, 7/15/19 (a) Tencent Holdings Ltd.
144A, 3.38%, 5/02/19 (a) Tenet Healthcare Corp., 8.13%, 4/01/22 Tesco PLC 144A, 5.50%, 11/15/17 (a) Thermo Fisher Scientific Inc., 3.30%, 2/15/22 TIAA Asset Management Finance Co. LLC 144A, 2.95%, 11/01/19 (a) Time Warner Cable Inc., 6.75%, 7/01/18 T-Mobile USA Inc., 6.25%, 4/01/21 TransAlta Corp., 1.90%, 6/03/17 TSMC Global Ltd. 144A, 1.63%, 4/03/18 (a) Tyson Foods Inc., 2.65%, 8/15/19 U.S.
Steel Corp., 6.88%, 4/01/21 UBS AG/Stamford CT, 5.75%, 4/25/18 UBS Group Funding Jersey Ltd. 144A, 2.95%, 9/24/20 (a) Vereit Operating Partnership LP, 3.00%, 2/06/19 Vornado Realty LP, 2.50%, 6/30/19 WEA Finance LLC / Westfield UK & Europe Finance PLC 144A, 2.70%, 9/17/19 (a) $ 510 299 308 256 227 415 594 750 166 335 446 279 259 871 397 391 507 502 293 601 546 300 151 138 327 319 476 501 405 555 310 113 492 353 292 764 701 442 164 499 Annual Report 35 . Payden Strategic Income Fund continued Principal or Shares Value (000) Security Description 250,000 Williams Companies Inc., 8.75%, 3/15/32 300,000 Windstream Corp., 7.50%, 6/01/22 Total Corporate Bond (Cost - $72,994) Foreign Government (5%) 755,000 Croatia Government International Bond 144A, 6.38%, 3/24/21 (a) 710,000 Dominican Republic International Bond 144A, 7.50%, 5/06/21 (a) 566,000 Hungary Government International Bond, 4.13%, 2/19/18 460,000 Indonesia Government International Bond 144A, 5.88%, 3/13/20 (a) 355,000 Indonesia Government International Bond, 5.88%, 3/13/20 (d) 1,160,000 Mexico Government International Bond, 3.63%, 3/15/22 525,000 Panama Government International Bond, 5.20%, 1/30/20 545,000 Philippine Government International Bond, 4.00%, 1/15/21 520,000 Poland Government International Bond, 5.13%, 4/21/21 430,000 Republic of Georgia 144A, 6.88%, 4/12/21 (a) 642,000 Romanian Government International Bond 144A, 6.75%, 2/07/22 (a) 575,000 United Republic of Tanzania, 6.54%, 3/09/20 (d) Total Foreign Government (Cost - $7,858) Mortgage Backed (20%) 277,676 Alternative Loan Trust 2005-47CB, 5.50%, 10/25/35 319,985 Alternative Loan Trust 2005-54CB, 5.13%, 11/25/35 407,608 Alternative Loan Trust 2007-9T1, 6.00%, 5/25/37 632,251 American Home Mortgage Investment Trust 2006-3, 2.28%, 12/25/36 493,205 Banc of America Funding 2005-H Trust, 2.87%, 11/20/35 736,473 BCAP LLC Trust 2007-AA2, 6.00%, 4/25/37 327,564 CHL Mortgage Pass-Through Trust 2004-29, 2.24%, 2/25/35 399,572 Credit Suisse Mortgage Capital Certificates 144A, 1.55%, 5/25/43 (a) 262,733 CSMC Mortgage-Backed Trust 2006-7, 6.00%, 8/25/36 999,706 Fannie Mae Connecticut Avenue Securities, 1.15%, 5/25/24 1,000,000 Fannie Mae Connecticut Avenue Securities, 2.80%, 5/25/24 500,000 Fannie Mae Connecticut Avenue Securities, 3.09%, 7/25/24 500,000 Fannie Mae Connecticut Avenue Securities, 3.19%, 7/25/24 1,000,000 Fannie Mae Connecticut Avenue Securities, 5.20%, 7/25/25 400,000 Fannie Mae Connecticut Avenue Securities, 5.89%, 4/25/28 36 Payden Mutual Funds $ Principal or Shares 246 250 72,380 814 774 593 511 395 1,191 576 596 590 461 767 563 7,831 255 297 333 444 413 624 262 382 228 990 873 451 451 1,000 408 1,750,000 54,938 Value (000) Security Description FHLB, 5.50%, 7/15/36 FHLMC Multifamily Structured Pass Through Certificates, 0.54%, 4/25/19 2,700,000 FN, 3.00%, 15YR TBA (e) 3,800,000 FN, 3.50%, 15YR TBA (e) 2,900,000 FN, 4.50%, 30YR TBA (e) 824,621 Freddie Mac Structured Agency Credit Risk Debt Notes, 1.20%, 2/25/24 775,177 Freddie Mac Structured Agency Credit Risk Debt Notes, 1.30%, 5/25/25 1,000,000 Freddie Mac Structured Agency Credit Risk Debt Notes, 1.85%, 4/25/24 195,000 Freddie Mac Structured Agency Credit Risk Debt Notes, 2.40%, 2/25/24 1,000,000 Freddie Mac Structured Agency Credit Risk Debt Notes, 3.80%, 4/25/24 500,000 Freddie Mac Structured Agency Credit Risk Debt Notes, 7.75%, 12/25/27 249,972 Freddie Mac Structured Agency Credit Risk Debt Notes, 8.15%, 5/25/25 500,000 Freddie Mac Structured Agency Credit Risk Debt Notes, 8.99%, 3/25/28 250,000 Freddie Mac Structured Agency Credit Risk Debt Notes, 9.40%, 10/25/27 249,885 Freddie Mac Structured Agency Credit Risk Debt Notes, 10.95%, 3/25/25 561,057 GSMPS Mortgage Loan Trust 2005-RP2 144A, 0.55%, 3/25/35 (a) 1,034,738 Hilton USA Trust 2013-HLF 144A, 1.19%, 11/05/30 (a) 450,000 JP Morgan Chase Commercial Mortgage Securities Trust 2015-COSMO 144A, 1.45%, 1/15/32 (a) 106,730 JP Morgan Mortgage Trust 2006-A4, 2.69%, 6/25/36 687,805 JP Morgan Mortgage Trust 2013-1 144A, 2.50%, 3/25/43 (a) 471,391 JP Morgan Mortgage Trust 2014-2 144A, 3.00%, 6/25/29 (a) 1,187,254 JP Morgan Seasoned Mortgage Trust 2014-1 144A, 0.70%, 5/25/33 (a) 275,541 Nationstar Mortgage Loan Trust 2013-A 144A, 3.75%, 12/25/52 (a) 267,044 New Residential Mortgage Loan Trust 2015-1 144A, 3.75%, 5/28/52 (a) 260,219 PHH Alternative Mortgage Trust Series 2007-1, 6.00%, 2/25/37 388,849 RFMSI Series 2006-SA2 Trust, 3.61%, 8/25/36 464,832 WaMu Mortgage Pass Through Certificates, 2.40%, 9/25/36 Total Mortgage Backed (Cost - $31,477) Municipal (0%) 250,000 District of Columbia Water & Sewer Authority, 4.81%, 10/01/14 (Cost - $250) U.S. Treasury (15%) 440,000 U.S. Treasury Note, 0.19%, 1/31/17 $ 2,329 55 2,809 4,012 3,143 824 773 988 196 935 501 252 495 285 294 485 1,027 449 93 689 483 1,147 282 275 227 338 422 31,219 250 440 . Principal or Shares Value (000) Security Description 340,000 U.S. Treasury Note, 0.88%, 4/30/17 4,500,000 U.S. Treasury Note, 0.88%, 7/15/18 3,050,000 U.S. Treasury Note, 1.38%, 10/31/20 8,345,000 U.S.
Treasury Note, 1.50%, 5/31/20 (f) 2,855,000 U.S. Treasury Note, 2.00%, 8/15/25 2,250,000 U.S. Treasury Note, 2.13%, 5/15/25 779,000 U.S.
Treasury Note, 3.00%, 5/15/45 Total U.S. Treasury (Cost - $22,448) $ Delivery Date Assets: 2/1/2016 96 197 111 108 107 123 103 113 202 1,160 Real Estate Investment Trust (1%) 6,280 BioMed Realty Trust Inc. 2,980 Digital Realty Trust Inc. 4,200 Equity Residential 1,600 Public Storage 1,250 Simon Property Group Inc. 147 220 325 367 252 1,311 2,471 Unrealized Appreciation (Depreciation) (000s) Currency (000s) 12/15/2015 Counterparty Australian Dollar (Sell 6,356) Credit Suisse First Boston International Citibank, N.A. $ 82 BNP PARIBAS Credit Suisse First Boston International 45 1 British Pound (Buy 1,488) Euro (Sell 3,027) Mexican Peso (Sell 8,830) 12/15/2015 11/19/2015 Stocks (2%) Preferred Stock (1%) 3,750 Alexandria Real Estate Equities Inc., 6.45% 7,500 Bank of America Corp., 6.50% 4,250 DDR Corp., 6.50% 4,050 Discover Financial Services, 6.50% 4,050 First Republic Bank, 6.70% 4,800 Goldman Sachs Group Inc., 5.50% 3,550 US Bancorp, 6.50% 4,700 Vornado Realty Trust, 5.40% 7,800 Wells Fargo & Co., 6.00% Total Stocks (Cost - $2,247) Investment Company (4%) 5,912,079 Payden Cash Reserves Money Market Fund * (Cost - $5,912) Total (Cost - $167,806) (109%) Liabilities in excess of Other Assets (-9%) Net Assets (100%) 341 4,487 3,028 8,361 2,818 2,246 788 22,509 Open Forward Currency Contracts to USD 8 $ 136 Liabilities: 2/1/2016 Australian Dollar (Buy 3,125) 2/24/2016 Chinese Yuan (Sell 12,034) Euro (Sell 1,177) New Taiwan Dollar (Sell 21,760) South Korean Won (Buy 1,189,000) South Korean Won (Sell 1,189,000) Thailand Baht (Sell 68,420) 12/15/2015 11/24/2015 11/24/2015 11/24/2015 1/27/2016 Credit Suisse First Boston International Barclays Bank PLC BNP PARIBAS HSBC Bank USA, N.A. BNP PARIBAS BNP PARIBAS $ (5) (49) (6) (4) (7) (43) Barclays Bank PLC (7) $(121) Open Futures Contracts $ 5,912 167,076 (13,724) 153,352 * Affiliated investment (a) Security offered only to qualified institutional investors, and thus is not registered for sale to the public under rule 144A of the Securities Act of 1933. It has been deemed liquid under guidelines approved by the Board. (b) Variable rate security. The rate shown reflects the rate in effect at October 31, 2015.
The stated maturity is subject to prepayments. See Note 2 in the Notes to Financial Statements. (c) Principal in foreign currency. (d) Security offered and sold outside the United States, and thus is exempt from registration under Regulation S of the Securities Act of 1933. It has been deemed liquid under guidelines approved by the Board. (e) Security was purchased on a delayed delivery basis. (f) All or a portion of the security is pledged to cover futures contract margin requirements. Number of Contracts 20 30 6 Contract Type U.S.
Long Bond Future U.S. Treasury 5 Year Note Future U.S. Treasury Ultra Bond Future Expiration Date Dec-15 Jan-16 Dec-15 Current Value (000) $(3,129) (3,593) 959 Unrealized Appreciation Depreciation (000s) $ 49 23 (10) $ 62 See notes to financial statements. Annual Report 37 .
Payden Absolute Return Bond Fund $11,000 The Fund seeks a high level of total return by generally investing in below investment grade debt instruments and income producing securities of emerging market countries denominated in U.S. and foreign currencies with no limit on the average portfolio maturity. One Year N/A ML Libor 1-Month Constant Maturity $10,018 $10,500 Portfolio Composition - percent of value Corporate Mortgage Backed U.S. Treasury Asset Backed Bank Loans Other Fund $10,097 Since 11/6/14 0.97% $10,000 35% 31% 11% 11% 7% 5% $9,500 11/6/2014 4/15 10/31/15 Past performance does not predict future returns. The graph does not reflect the impact of taxes or transaction costs a shareholder would pay.
The Fund’s Adviser and SI Classes are expected to perform similarly to its Investor Class. This information is not part of the audited financial statements. Schedule of Investments - October 31, 2015 Principal or Shares Security Description Asset Backed (11%) 300,000 Ally Master Owner Trust, 0.65%, 4/15/18 205,001 American Homes 4 Rent 2014-SFR1 144A, 1.25%, 6/17/31 (a) 159,891 American Residential Properties 2014-SFR1 Trust 144A, 1.30%, 9/17/31 (a) 300,000 Apidos CLO XXII 144A, 4.14%, 10/20/27 (a) 193,290 Colony American Homes 2014-1 144A, 1.40%, 5/17/31 (a) 128,070 Colony American Homes 2014-2 144A, 1.15%, 7/17/31 (a) 169,919 Colony American Homes 2015-1 144A, 1.40%, 7/17/32 (a) 450,000 Dryden XXXI Senior Loan Fund 144A, 3.82%, 4/18/26 (a) 450,000 Eaton Vance Clo 2015-1 Ltd. 144A, 4.52%, 10/20/26 (a) 261,490 Invitation Homes 2013-SFR1 Trust 144A, 1.40%, 12/17/30 (a) 330,000 Invitation Homes 2014-SFR1 Trust 144A, 1.20%, 6/17/31 (a) 260,000 Invitation Homes 2014-SFR2 Trust 144A, 1.30%, 9/17/31 (a) 450,000 LCM XX LLC 144A, 4.07%, 10/20/27 (a) 300,000 North End CLO Ltd. 2013-1 144A, 3.82%, 7/17/25 (a) 450,000 OHA Credit Partners XI Ltd.
144A, 4.62%, 10/20/28 (a) 180,000 Progress Residential 2015-SFR1 Trust 144A, 1.60%, 2/17/32 (a) 250,000 Santander Drive Auto Receivables Trust 2015-3, 3.49%, 5/17/21 300,000 Symphony CLO XII Ltd. 144A, 3.82%, 10/15/25 (a) 300,000 Trade MAPS 1 Ltd. 144A, 0.90%, 12/10/18 (a) 192,651 VOLT XXII LLC 144A, 3.50%, 2/25/55 (a) 135,867 VOLT XXV LLC 144A, 3.50%, 6/26/45 (a) 38 Payden Mutual Funds Value (000) $ Principal or Shares 300 201 157 282 190 125 166 419 437 258 323 255 433 283 439 178 253 289 299 191 135 Value (000) Security Description 391,433 VOLT XXXIII LLC 144A, 3.50%, 3/25/55 (a) 426,301 VOLT XXXIV LLC 144A, 3.25%, 2/25/55 (a) 98,364 VOLT XXXV LLC 144A, 3.50%, 6/26/45 (a) Total Asset Backed (Cost - $6,580) Bank Loans(b) (7%) 350,000 Berry Plastics Group Inc.
Term Loan E 1L, 3.75%, 12/18/20 401,261 Burlington Coat Factory Warehouse Corp. Term Loan B3 1L, 4.25%, 8/13/21 430,000 Charter Communications Operating LLC Term Loan H, 3.25%, 8/24/21 347,362 Davita Healthcare Partners Inc. Term Loan B 1L, 3.50%, 6/19/21 283,575 Dell Inc.
Term Loan B IL, 4.00%, 4/29/20 273,113 Dollar Tree Inc. Term Loan B 1L, 3.50%, 7/06/22 347,321 MGM Resorts International Term Loan B 1L, 3.50%, 12/20/19 283,564 Michaels Stores Inc. Term Loan B2 1L, 4.00%, 1/28/20 426,647 Neiman Marcus Group LLC Term Loan 1L, 4.25%, 10/25/20 227,694 Ortho-Clinical Diagnostics, Inc.
Term Loan B 1L, 4.75%, 6/30/21 199,500 PetSmart Inc., 4.25%, 3/10/22 213,322 PharMEDium Healthcare Corp. Term Loan 1L, 4.25%, 1/23/21 225,000 Rite Aid Corp., 4.88%, 6/21/21 296,947 Sabre Global Inc. Term Loan B 1L, 4.25%, 2/19/19 205,193 Visteon Corp.
Term Loan B IL, 3.50%, 4/08/21 Total Bank Loans (Cost - $4,495) Corporate Bond (36%) 90,000 AbbVie Inc., 2.50%, 5/14/20 105,000 Actavis Funding SCS, 1.42%, 3/12/18 85,000 Actavis Funding SCS, 3.00%, 3/12/20 $ 389 424 98 6,524 350 402 430 349 284 274 347 285 418 225 200 213 226 297 205 4,505 89 104 85 . Principal or Shares 285,000 180,000 270,000 110,000 150,000 200,000 100,000 210,000 110,000 150,000 205,000 145,000 100,000 210,000 110,000 210,000 60,000 150,000 360,000 150,000 200,000 150,000 70,000 150,000 150,000 130,000 150,000 150,000 290,000 330,000 310,000 110,000 100,000 150,000 130,000 160,000 250,000 350,000 250,000 420,000 100,000 200,000 150,000 140,000 150,000 300,000 Value (000) Security Description AES Corp./VA, 3.32%, 6/01/19 Air Canada 144A, 8.75%, 4/01/20 (a) Air Lease Corp., 2.13%, 1/15/18 Allstate Corp., 5.75%, 8/15/53 Ally Financial Inc., 3.00%, 7/18/16 American Airlines 2015-2 Class B Pass Through Trust, 4.40%, 9/22/23 American Axle & Manufacturing Inc., 6.25%, 3/15/21 Amgen Inc., 2.13%, 5/01/20 Amgen Inc., 3.88%, 11/15/21 Anthem Inc., 2.30%, 7/15/18 Ardagh Packaging Finance PLC / Ardagh Holdings USA Inc. 144A, 3.34%, 12/15/19 (a) Argos Merger Sub Inc. 144A, 7.13%, 3/15/23 (a) Arizona Public Service Co., 2.20%, 1/15/20 AT&T Inc., 2.45%, 6/30/20 AT&T Inc., 3.40%, 5/15/25 AT&T Inc., 4.50%, 5/15/35 AT&T Inc., 4.75%, 5/15/46 AutoZone Inc., 2.50%, 4/15/21 Aviation Capital Group Corp. 144A, 2.88%, 9/17/18 (a) Bank of Montreal, 1.45%, 4/09/18 Barclays PLC, 2.88%, 6/08/20 Barrick North America Finance LLC, 4.40%, 5/30/21 BAT International Finance PLC 144A, 1.85%, 6/15/18 (a) Baxalta Inc.
144A, 2.88%, 6/23/20 (a) Baxalta Inc. 144A, 5.25%, 6/23/45 (a) Baylor Scott & White Holdings, 2.12%, 11/15/20 BBVA Banco Continental SA 144A, 2.25%, 7/29/16 (a) Biogen Inc., 2.90%, 9/15/20 Block Financial LLC, 4.13%, 10/01/20 BNZ International Funding Ltd./London 144A, 1.90%, 2/26/18 (a) Boston Scientific Corp., 3.85%, 5/15/25 CNH Industrial Capital LLC, 3.25%, 2/01/17 CommScope Inc. 144A, 4.38%, 6/15/20 (a) ConAgra Foods Inc., 0.69%, 7/21/16 Continental Airlines 2012-3 Class C Pass Thru Certificates, 6.13%, 4/29/18 Cooperatieve Centrale Raiffeisen-Boerenleenbank BA/Netherlands, 3.88%, 2/08/22 Credit Suisse/New York NY, 1.70%, 4/27/18 CSX Corp., 7.38%, 2/01/19 CVS Health Corp., 2.80%, 7/20/20 Dominion Resources Inc./VA, 2.50%, 12/01/19 Dun & Bradstreet Corp., 4.00%, 6/15/20 E*TRADE Financial Corp., 5.38%, 11/15/22 ERAC USA Finance LLC 144A, 2.80%, 11/01/18 (a) Exelon Generation Co.
LLC, 2.95%, 1/15/20 Express Scripts Holding Co., 1.25%, 6/02/17 Fifth Third Bank/Cincinnati OH, 2.38%, 4/25/19 $ Principal or Shares 272 197 267 115 150 200,000 150,000 215,000 200 310,000 100,000 150,000 180,000 120,000 105 208 116 151 202 153 100 208 107 197 55 148 360 149 201 149 70 150 153 150,000 90,000 240,000 240,000 160,000 70,000 180,000 200,000 170,000 150,000 150,000 129 110,000 120,000 150,000 180,000 190,000 151 151 295 140,000 125,000 100,000 331 309 111 102 150 250,000 134 170 249 406 255 421 101 214 153 141 149 302 180,000 230,000 160,000 420,000 200,000 150,000 450,000 320,000 100,000 190,000 240,000 330,000 40,000 200,000 Value (000) Security Description Ford Motor Credit Co. LLC, 2.60%, 11/04/19 Ford Motor Credit Co. LLC, 3.98%, 6/15/16 Frontier Communications Corp., 6.25%, 9/15/21 General Motors Financial Co.
Inc., 3.15%, 1/15/20 Gilead Sciences Inc., 2.55%, 9/01/20 Glencore Funding LLC 144A, 1.49%, 5/27/16 (a) Goldman Sachs Group Inc., 2.55%, 10/23/19 Goodyear Tire & Rubber Co., 7.00%, 5/15/22 Harley-Davidson Financial Services Inc. 144A, 2.15%, 2/26/20 (a) HealthSouth Corp., 5.75%, 11/01/24 Hewlett Packard Enterprise Co. 144A, 2.45%, 10/05/17 (a) Hewlett Packard Enterprise Co.
144A, 2.85%, 10/05/18 (a) HSBC USA Inc., 1.70%, 3/05/18 Hyundai Capital America 144A, 2.00%, 3/19/18 (a) Hyundai Capital America 144A, 2.40%, 10/30/18 (a) Imperial Tobacco Finance PLC 144A, 2.05%, 7/20/18 (a) JPMorgan Chase & Co., 2.25%, 1/23/20 KeyCorp, 2.30%, 12/13/18 Keysight Technologies Inc. 144A, 3.30%, 10/30/19 (a) Kinder Morgan Inc./DE, 3.05%, 12/01/19 Kraft Heinz Foods Co. 144A, 2.80%, 7/02/20 (a) Kroger Co., 6.15%, 1/15/20 Landry’s Inc.
144A, 9.38%, 5/01/20 (a) Latam Airlines 2015-1 Pass Through Trust A 144A, 4.20%, 11/15/27 (a) Level 3 Financing Inc., 6.13%, 1/15/21 Macquarie Group Ltd. 144A, 6.00%, 1/14/20 (a) Majapahit Holding BV 144A, 8.00%, 8/07/19 (a) Manufacturers & Traders Trust Co., 2.10%, 2/06/20 McGraw Hill Financial Inc. 144A, 3.30%, 8/14/20 (a) Medtronic Inc., 2.50%, 3/15/20 Metropolitan Life Global Funding I 144A, 2.30%, 4/10/19 (a) Microsoft Corp., 2.38%, 2/12/22 Mitsubishi UFJ Trust & Banking Corp.
144A, 1.60%, 10/16/17 (a) Mondelez International Inc., 2.25%, 2/01/19 Morgan Stanley, 2.80%, 6/16/20 National Australia Bank Ltd. 144A, 2.40%, 12/09/19 (a) Navient Corp., 6.00%, 1/25/17 New Red Finance Inc. 144A, 6.00%, 4/01/22 (a) New York Life Global Funding 144A, 2.10%, 1/02/19 (a) Oracle Corp., 2.38%, 1/15/19 Peabody Energy Corp., 6.25%, 11/15/21 Perrigo Co.
PLC, 2.30%, 11/08/18 $ 198 152 193 150 313 98 151 196 119 90 241 241 160 70 180 200 169 151 149 107 121 172 194 181 148 139 113 247 183 234 162 419 199 151 454 322 103 199 242 337 6 197 Annual Report 39 . Payden Absolute Return Bond Fund continued Principal or Shares Value (000) Security Description 250,000 100,000 130,000 75,000 300,000 300,000 140,000 255,000 275,000 300,000 150,000 150,000 200,000 PNC Bank NA, 1.80%, 11/05/18 Prudential Financial Inc., 5.38%, 5/15/45 QUALCOMM Inc., 2.25%, 5/20/20 Reynolds American Inc., 3.25%, 6/12/20 Roche Holdings Inc. 144A, 2.25%, 9/30/19 (a) Southern Co., 2.75%, 6/15/20 Southern Power Co., 1.50%, 6/01/18 Sprint Communications Inc., 8.38%, 8/15/17 Starz LLC / Starz Finance Corp., 5.00%, 9/15/19 Thermo Fisher Scientific Inc., 2.40%, 2/01/19 Time Warner Inc., 2.10%, 6/01/19 Toyota Motor Credit Corp., 2.13%, 7/18/19 UBS Group Funding Jersey Ltd. 144A, 2.95%, 9/24/20 (a) 180,000 United Rentals North America Inc., 7.63%, 4/15/22 170,000 United Technologies Corp., 6.13%, 2/01/19 210,000 UnitedHealth Group Inc., 2.70%, 7/15/20 150,000 Ventas Realty LP / Ventas Capital Corp., 2.70%, 4/01/20 80,000 Ventas Realty LP / Ventas Capital Corp., 4.00%, 4/30/19 200,000 Vodafone Group PLC, 2.50%, 9/26/22 320,000 Walgreens Boots Alliance Inc., 2.70%, 11/18/19 250,000 Wells Fargo & Co., 2.15%, 1/15/19 150,000 Westpac Banking Corp., 1.06%, 7/30/18 420,000 William Wrigley Jr Co. 144A, 2.90%, 10/21/19 (a) 200,000 ZF North America Capital Inc.
144A, 4.00%, 4/29/20 (a) 60,000 Zimmer Holdings Inc., 1.45%, 4/01/17 40,000 Zimmer Holdings Inc., 2.00%, 4/01/18 Total Corporate Bond (Cost - $21,920) Foreign Government (0%) 200,000 Kenya Government International Bond 144A, 5.88%, 6/24/19 (a) (Cost - $202) Mortgage Backed (31%) 686,726 Alternative Loan Trust 2005-56, 0.93%, 11/25/35 306,008 Alternative Loan Trust 2006-45T1, 6.00%, 2/25/37 389,845 Alternative Loan Trust 2006-HY11, 0.32%, 6/25/36 304,417 American Home Mortgage Investment Trust 2006-3, 2.28%, 12/25/36 312,695 Banc of America Funding 2005-H Trust, 2.87%, 11/20/35 167,098 Bear Stearns ALT-A Trust 2006-6, 2.76%, 11/25/36 272,664 Bear Stearns ARM Trust 2007-3, 2.78%, 5/25/47 314,462 CHL Mortgage Pass-Through Trust 2004-29, 2.24%, 2/25/35 282,856 CHL Mortgage Pass-Through Trust 2006-HYB1, 2.45%, 3/20/36 643,413 Connecticut Avenue Securities, 1.15%, 5/25/24 285,630 Connecticut Avenue Securities, 1.15%, 5/25/24 40 Payden Mutual Funds $ Principal or Shares 250 101 129 77 304 299 138 261 282 302 150 151 200 196 192 215 149 84 188 322 253 150 159,669 421,630 259,722 659,278 397,055 198,769 593,486 397,049 216,112 1,081,212 126,935 309,413 400,000 250,000 430 150,000 203 60 40 21,862 450,000 264,780 238,687 288,617 195 264,137 250,000 585 273,521 250 300,000 342 1,350,000 214 249,712 262 470,079 128 355,381 245 191,178 252 258 640 283 Value (000) Security Description Connecticut Avenue Securities, 1.39%, 7/25/24 Connecticut Avenue Securities, 2.29%, 11/25/24 Credit Suisse Mortgage Capital Certificates 144A, 1.55%, 5/25/43 (a) Deutsche Alt-B Securities Mortgage Loan Trust Series 2006-AB1, 5.60%, 2/25/36 Deutsche Alt-B Securities Mortgage Loan Trust Series 2006-AB4, 6.00%, 10/25/36 Deutsche Alt-B Securities Mortgage Loan Trust Series 2006-AB4, 6.00%, 10/25/36 Fannie Mae Connecticut Avenue Securities, 1.35%, 5/25/25 Fannie Mae Connecticut Avenue Securities, 1.39%, 7/25/24 Fannie Mae Connecticut Avenue Securities, 1.69%, 2/25/25 Fannie Mae Connecticut Avenue Securities, 1.70%, 7/25/25 Fannie Mae Connecticut Avenue Securities, 2.14%, 11/25/24 Fannie Mae Connecticut Avenue Securities, 2.20%, 10/25/23 Fannie Mae Connecticut Avenue Securities, 4.20%, 5/25/25 Fannie Mae Connecticut Avenue Securities, 5.20%, 7/25/25 Fannie Mae Connecticut Avenue Securities, 5.20%, 7/25/25 Fannie Mae Connecticut Avenue Securities, 5.89%, 4/25/28 First Horizon Alternative Mortgage Securities Trust 2006-FA2, 6.00%, 5/25/36 Freddie Mac Structured Agency Credit Risk Debt Notes, 1.10%, 10/25/27 Freddie Mac Structured Agency Credit Risk Debt Notes, 1.20%, 2/25/24 Freddie Mac Structured Agency Credit Risk Debt Notes, 1.25%, 3/25/25 Freddie Mac Structured Agency Credit Risk Debt Notes, 1.44%, 3/25/28 Freddie Mac Structured Agency Credit Risk Debt Notes, 1.85%, 8/25/24 Freddie Mac Structured Agency Credit Risk Debt Notes, 4.35%, 1/25/25 Freddie Mac Structured Agency Credit Risk Debt Notes, 4.89%, 3/25/28 Freddie Mac Structured Agency Credit Risk Debt Notes, 11.70%, 1/25/25 GreenPoint MTA Trust 2005-AR1, 0.64%, 6/25/45 GSMPS Mortgage Loan Trust 2005-RP3 144A, 0.55%, 9/25/35 (a) HomeBanc Mortgage Trust 2004-1, 1.06%, 8/25/29 $ 159 424 248 571 332 166 592 396 217 1,081 128 312 381 249 150 459 223 238 289 264 250 275 298 1,342 292 417 305 181 . Principal or Shares Value (000) Security Description JP Morgan Chase Commercial Mortgage Securities Trust 2015-COSMO 144A, 1.45%, 1/15/32 (a) 325,772 JP Morgan Mortgage Trust 2006-A3, 2.84%, 5/25/36 356,273 JP Morgan Mortgage Trust 2014-IVR3 144A, 3.00%, 9/25/44 (a) 362,566 Merrill Lynch Mortgage Backed Securities Trust Series 2007-2, 2.73%, 8/25/36 186,923 New Residential Mortgage Loan Trust 2014-3 144A, 5.67%, 11/25/54 (a) 133,522 New Residential Mortgage Loan Trust 2015-1 144A, 3.75%, 5/28/52 (a) 144,477 Provident Funding Mortgage Loan Trust 2005-2, 2.55%, 10/25/35 400,902 RALI Series 2005-QS14 Trust, 6.00%, 9/25/35 114,448 Sequoia Mortgage Trust, 0.99%, 10/20/27 252,358 Sequoia Mortgage Trust 2007-1, 2.51%, 2/20/47 270,255 Springleaf Mortgage Loan Trust 2013-1 144A, 1.27%, 6/25/58 (a) 498,999 Structured Asset Mortgage Investments II Trust 2006-AR7, 0.41%, 8/25/36 136,715 WaMu Mortgage Pass Through Certificates, 2.40%, 9/25/36 453,596 WaMu Mortgage Pass-Through Certificates, 0.48%, 11/25/45 103,494 WaMu Mortgage Pass-Through Certificates, 0.49%, 10/25/45 186,464 WaMu Mortgage Pass-Through Certificates, 0.49%, 12/25/45 510,700 WaMu Mortgage Pass-Through Certificates, 0.81%, 8/25/45 137,035 WaMu Mortgage Pass-Through Certificates, 2.09%, 6/25/37 429,493 WaMu Mortgage Pass-Through Certificates, 2.38%, 7/25/37 295,312 WaMu Mortgage Pass-Through Certificates, 2.41%, 8/25/46 66,152 Wells Fargo Mortgage Backed Securities Trust, 2.70%, 6/25/35 Total Mortgage Backed (Cost - $18,713) U.S. Treasury (11%) 5,500,000 U.S. Treasury Bill, 0.00%, 4/21/16 (c) 1,400,000 U.S. Treasury Bill, 0.06%, 12/17/15 (c) Total U.S.
Treasury (Cost - $6,896) Purchased Put Options (0%) 203 iShares 20+ Year Treasury Bond ETF, 114, 11/20/15 116 iShares 20+ Year Treasury Bond ETF, 115, 11/27/15 55 S&P 500 Index, 1750, 11/20/15 105 S&P 500 Index, 1750, 11/30/15 Total Purchased Put Options (Cost - $23) Investment Company (5%) 2,786,618 Payden Cash Reserves Money Market Fund * (Cost - $2,787) Principal or Shares 230,000 $ 229 292 362 337 199 137 144 369 112 221 271 Total (Cost - $61,616) (101%) Liabilities in excess of Other Assets (-1%) Net Assets (100%) 398 96 Delivery Date Assets: 2/1/2016 12/15/2015 12/15/2015 Liabilities: 2/1/2016 350 123 11/24/2015 387 11/24/2015 1/27/2016 255 $ 61,510 (523) 60,987 Open Forward Currency Contracts to USD 2/24/2016 12/15/2015 11/24/2015 170 $ * Affiliated investment (a) Security offered only to qualified institutional investors, and thus is not registered for sale to the public under rule 144A of the Securities Act of 1933. It has been deemed liquid under guidelines approved by the Board. (b) Variable rate security. The rate shown reflects the rate in effect at October 31, 2015. The stated maturity is subject to prepayments.
See Note 2 in the Notes to Financial Statements. (c) Yield to maturity at time of purchase. 392 124 Value (000) Security Description Unrealized Appreciation (Depreciation) (000s) Currency (000s) Counterparty Australian Dollar (Sell 2,515) Credit Suisse First Boston International Citibank, N.A. BNP PARIBAS $ 32 Credit Suisse First Boston International Barclays Bank PLC BNP PARIBAS HSBC Bank USA, N.A. BNP PARIBAS $ (2) British Pound (Buy 562) Euro (Sell 1,162) Australian Dollar (Buy 1,238) Chinese Yuan (Sell 4,600) Euro (Sell 505) New Taiwan Dollar (Sell 9,290) South Korean Won (Buy 508,000) South Korean Won (Sell 508,000) Thailand Baht (Sell 27,080) BNP PARIBAS Barclays Bank PLC 3 16 $ 51 (20) (2) (2) (3) (19) (3) $(51) 62 18,728 5,495 1,400 6,895 1 1 3 9 14 2,787 Annual Report 41 . Payden Absolute Return Bond Fund continued Open Futures Contracts Number of Contracts 29 11 37 2 14 14 1 Contract Type 90-Day Sterling Future Australian 10 Year Bond Future Australian 3 Year Bond Future U.S. Long Bond Future U.S. Treasury 10 Year Note Future U.S. Treasury 5 Year Note Future U.S.
Treasury Ultra Bond Future Unrealized Appreciation (Depreciation) (000s) $(10) — Expiration Date Jun-16 Dec-15 Current Value (000) $(5,547) (1,014) Dec-15 2,963 4 Dec-15 Dec-15 (313) 1,788 5 (12) Jan-16 (1,677) (2) Dec-15 (160) 4 $(11) See notes to financial statements. 42 Payden Mutual Funds . Payden Floating Rate Fund $12,000 The Fund seeks high current income and capital appreciation by generally investing 80% of its assets in income producing senior floating rate loans and other floating rate debt instruments. One Year 2.64% Fund $10,509 Since 11/11/13 2.55% Credit Suisse Leverage Loan BB Index $10,549 $11,000 Portfolio Composition - percent of value Bank Loans Corporate Asset Backed Investment Company Mortgage Backed 79% 8% 6% 6% 1% $10,000 $9,000 11/11/2013 10/14 10/31/15 Past performance does not predict future returns. The graph does not reflect the impact of taxes or transaction costs a shareholder would pay. The Fund’s Adviser and SI Classes are expected to perform similarly to its Investor Class. This information is not part of the audited financial statements. Schedule of Investments - October 31, 2015 Principal or Shares Security Description Asset Backed (6%) 1,800,000 Babson CLO Ltd./Cayman Islands 144A, 3.82%, 4/20/25 (a) 1,500,000 Carlyle Global Market Strategies CLO 2013-2 Ltd. 144A, 4.07%, 4/18/25 (a) 1,500,000 CIFC Funding 2013-III Ltd.
144A, 3.54%, 10/24/25 (a) 1,500,000 Dryden XXII Senior Loan Fund 144A, 3.52%, 8/15/25 (a) 1,500,000 Madison Park Funding XIII Ltd. 144A, 3.67%, 1/19/25 (a) 1,500,000 North End CLO Ltd. 2013-1 144A, 3.82%, 7/17/25 (a) 1,250,000 Octagon Investment Partners XIV Ltd.
144A, 4.32%, 1/15/24 (a) Total Asset Backed (Cost - $10,299) Bank Loans(b) (76%) 1,885,411 Academy Ltd., 5.00%, 7/02/22 2,468,750 Air Canada Corp. Term Loan B 1L, 4.00%, 9/26/19 2,978,031 Albertsons/Safeway LLC Term Loan B4 1L, 5.50%, 8/25/21 2,160,140 Alliance Healthcare Services Inc. Term Loan B 1L, 4.25%, 6/03/19 2,656,083 Allison Transmission Inc.
Term Loan B3 1L, 3.75%, 8/23/19 997,500 Altice Financing SA Term Loan 1L, 5.25%, 1/30/22 2,156,000 American Builders & Contractors Supply Co. Inc. Term Loan B1 1L, 3.50%, 4/16/20 1,909,400 Applied Systems Inc. Term Loan 1L, 4.25%, 1/15/21 500,000 ARAMARK Corp.
Term Loan E 1L, 3.25%, 9/07/19 2,475,000 Ashland Water Technologies/Solenis Term Loan 1L, 4.25%, 7/02/21 927,675 Asurion LLC, 5.00%, 8/04/22 Value (000) $ Principal or Shares 1,718 1,439 1,017,022 2,750,000 400,000 2,229,129 1,379 2,463,064 1,398 1,330,000 1,400 1,414 1,240 9,988 1,881 2,475 2,982 2,152 2,663 996 2,146 1,899 501 2,441 879 1,989,950 398,977 1,000,000 957,279 2,156,000 2,500,000 2,500,000 2,992,500 1,984,925 2,130,325 2,038,685 2,541,731 500,000 2,700,000 Value (000) Security Description Asurion LLC Term Loan B1 1L, 4.50%, 5/24/19 B and G Foods Inc. Term Loan B 1L, 3.75%, 10/05/22 Berry Plastics Group Inc., 4.00%, 10/01/22 Berry Plastics Group Inc. Term Loan E 1L, 3.75%, 12/18/20 BJ’s Wholesale Club Inc.
Term Loan B 1L, 4.50%, 9/26/19 Burlington Coat Factory Warehouse Corp. Term Loan B3 1L, 4.25%, 8/13/21 CD&R Millennium Holdco, 4.50%, 7/31/21 CDW LLC/CDW Finance Corp. Term Loan B 1L, 3.50%, 4/29/20 Charter Communications Term Loan I 1L, 3.50%, 1/23/23 Chs/Community Health Systems Inc., 4.00%, 1/27/21 Cincinnati Bell Inc.
Term Loan B 1L, 4.00%, 9/10/20 Clubcorp Club Operations Inc. Term Loan B 1L, 4.50%, 7/24/20 Commscope Term Loan 1L GTD, 3.75%, 12/29/22 Communications Sales & Leasing Corp. Term Loan B 1L, 5.00%, 10/16/22 Davita Healthcare Partners Inc.
Term Loan B 1L, 3.50%, 6/19/21 Dell Inc. Term Loan B IL, 4.00%, 4/29/20 Dole Food Co. Inc.
Term Loan B 1L, 4.50%, 11/01/18 Dollar Tree Inc. Term Loan B 1L, 3.50%, 7/06/22 Endo International Term Loan B 1L, 3.75%, 9/25/22 Energy Transfer Equity LP Term Loan 1L, 3.25%, 12/02/19 $ 972 2,756 401 2,230 2,446 1,334 1,973 398 1,001 956 2,134 2,504 2,502 2,833 1,994 2,133 2,041 2,550 493 2,596 Annual Report 43 . Payden Floating Rate Fund continued Principal or Shares 985,000 2,462,500 1,124,812 1,691,205 1,176,090 2,495,103 2,468,750 2,000,000 1,975,000 1,663,851 1,448,311 1,176,000 1,984,694 1,975,000 1,572,727 2,156,096 2,468,777 1,596,398 1,381,102 2,468,750 2,500,000 2,992,500 940,556 388,243 982,500 1,970,849 2,500,000 2,800,000 2,455,808 1,975,000 1,451,852 2,000,000 Value (000) Security Description Fiat SpA Term Loan B 1L, 3.25%, 12/29/18 Grifols SA Term Loan B 1L, 3.00%, 3/07/21 Harbor Freight Tools USA Inc. Term Loan B 1L, 4.75%, 7/26/19 Hilton Worldwide Finance LLC Term Loan B2, 4.00%, 10/26/20 HUB International Ltd. Term Loan B 1L, 4.25%, 10/02/20 Ineos U.S. Finance LLC Term Loan 1L, 4.25%, 3/12/22 Interactive Data Corp.
Term Loan B 1L, 4.75%, 4/24/21 International Finance Corp. Term Loan B 1L, 3.50%, 2/27/21 Kindred Healthcare Inc. Term Loan B 1L, 4.00%, 3/28/21 La Quinta Intermediate Holdings LLC Term Loan B 1L, 4.25%, 4/14/21 Landry’s Inc., 4.00%, 4/24/18 Live Nation Entertainment Inc.
Term Loan B1, 3.50%, 8/16/20 MGM Resorts International Term Loan B 1L, 3.50%, 12/20/19 Michaels Stores, Inc. Term Loan B2 1L, 4.00%, 1/28/20 MPH Acquisition Holdings LLC Term Loan B 1L, 4.25%, 3/31/21 Neiman Marcus Group LLC Term Loan 1L, 4.25%, 10/25/20 Nortek Inc. Term Loan B 1L, 3.75%, 10/30/20 Numericable SFR Term Loan B1 1L, 4.50%, 4/23/20 Numericable SFR Term Loan B2 1L, 4.50%, 4/23/20 Ortho-Clinical Diagnostics, Inc.
Term Loan B 1L, 4.75%, 6/30/21 Party City Term Loan B 1L, 4.25%, 8/06/22 PetSmart Inc., 4.25%, 3/10/22 PharMEDium Healthcare Corp. Term Loan 1L, 4.25%, 1/23/21 Pinnacle Entertainment Inc. Term Loan B2 1L, 3.75%, 8/13/20 Realogy Group LLC Term Loan B 1L, 3.75%, 3/05/20 Restaurant Brands Term Loan B2 1L, 3.75%, 12/12/21 Reynolds Group Holdings Inc., 4.50%, 12/01/18 Rite Aid Corp., 4.88%, 6/21/21 Sabre Inc.
Term Loan B 1L, 4.25%, 2/19/19 SBA Communications Corp. Term Loan B 1L, 3.25%, 3/31/21 Signode Industrial Group Term Loan B 1L, 4.00%, 5/01/21 Smart & Final Term Loan B 1L, 4.00%, 11/15/19 $ Principal or Shares 983 2,462 1,130 1,697 1,148 2,466 2,472 2,003 1,969 1,651 1,452 1,179 1,984 1,982 1,555 2,110 2,450 1,578 1,365 2,438 2,503 2,997 940 389 984 1,977 2,508 2,811 2,459 1,959,799 Starwood Property Trust Inc. Term Loan 1L, 3.50%, 4/19/20 1,970,000 Stena Term Loan B 1L, 4.00%, 3/03/21 500,000 Sterigenics-Nordion Term Loan B 1L, 4.25%, 4/27/22 1,464,736 TransDigm Inc.
Term Loan C 1L, 3.75%, 2/28/20 2,200,000 UPC Financing Partnership Term Loan 1L, 3.25%, 6/30/21 1,689,286 Vantiv LLC Term Loan B 1L, 3.75%, 6/13/21 1,166,667 Visteon Corp. Term Loan B IL, 3.50%, 4/08/21 Total Bank Loans (Cost - $127,690) Corporate Bond (7%) 2,500,000 AES Corp./VA, 3.32%, 6/01/19 2,000,000 Ardagh Packaging Finance PLC / Ardagh Holdings USA Inc. 144A, 3.34%, 12/15/19 (a) 1,000,000 Avis Budget Car Rental LLC / Avis Budget Finance Inc., 3.07%, 12/01/17 462,000 Bumble Bee Acquisition Corp.
144A, 9.00%, 12/15/17 (a) 1,000,000 Continental Airlines 2012-3 Class C Pass Thru Certificates, 6.13%, 4/29/18 1,000,000 Dana Holding Corp., 6.75%, 2/15/21 1,210,000 Landry’s Inc. 144A, 9.38%, 5/01/20 (a) 1,000,000 Navient Corp., 6.00%, 1/25/17 1,000,000 Novelis Inc., 8.38%, 12/15/17 1,000,000 Tenet Healthcare Corp. 144A, 3.84%, 6/15/20 (a) Total Corporate Bond (Cost - $12,326) Mortgage Backed (1%) 675,000 Freddie Mac Structured Agency Credit Risk Debt Notes, 3.80%, 4/25/24 350,000 Freddie Mac Structured Agency Credit Risk Debt Notes, 7.75%, 12/25/27 999,886 Freddie Mac Structured Agency Credit Risk Debt Notes, 8.15%, 5/25/25 Total Mortgage Backed (Cost - $2,025) Investment Company (6%) 9,508,911 Payden Cash Reserves Money Market Fund * (Cost - $9,509) Total (Cost - $161,849) (96%) Other Assets, net of Liabilities (4%) Net Assets (100%) $ 1,940 1,684 496 1,448 2,167 1,695 1,164 126,885 2,388 1,975 1,008 476 1,031 1,044 1,304 1,029 1,009 997 12,261 631 351 1,008 1,990 $ 9,509 160,633 5,979 166,612 * Affiliated investment (a) Security offered only to qualified institutional investors, and thus is not registered for sale to the public under rule 144A of the Securities Act of 1933. It has been deemed liquid under guidelines approved by the Board. (b) Variable rate security.
The rate shown reflects the rate in effect at October 31, 2015. The stated maturity is subject to prepayments. See Note 2 in the Notes to Financial Statements. 1,964 1,429 1,994 See notes to financial statements. 44 Payden Mutual Funds Value (000) Security Description .
Payden High Income Fund $25,000 The Fund seeks high current income and capital appreciation by generally investing in below investment grade debt instruments and income producing securities of U.S. and foreign issuers with no limit on the average portfolio maturity. One Year -0.79% $20,000 Investor Class $17,379 Ten Year 5.68% Bank of America Merrill Lynch BB-B High Yield Cash Pay Constrained Index $19,758 $15,000 Portfolio Composition - percent of value Consumer Cyclical Telecommunication Financial Consumer Non-Cyclical Energy Other Five Year 5.38% 19% 18% 16% 10% 7% 30% $10,000 $5,000 10/31/05 10/10 10/31/15 Past performance does not predict future returns. The graph does not reflect the impact of taxes or transaction costs a shareholder would pay. The Fund’s Adviser Class is expected to perform similiarly to its Investor Class. This information is not part of the audited financial statements. Schedule of Investments - October 31, 2015 Principal or Shares Security Description Bank Loans(a) (0%) 2,239,300 HCA Inc.
Term Loan B4 1L, 2.93%, 5/01/18 (Cost - $2,227) Corporate Bond (86%) Consumer Cyclical (18%) 4,650,000 Air Canada 144A, 6.75%, 10/01/19 (b) 3,100,000 Air Canada 144A, 7.75%, 4/15/21 (b) 4,159,057 American Airlines 2013-1 Class B Pass Through Trust, 5.63%, 1/15/21 2,900,000 American Axle & Manufacturing Inc., 6.25%, 3/15/21 2,585,000 AmeriGas Finance LLC / AmeriGas Finance Corp., 7.00%, 5/20/22 1,193,000 AmeriGas Partners LP / AmeriGas Finance Corp., 6.50%, 5/20/21 1,200,000 Brightstar Corp. 144A, 7.25%, 8/01/18 (b) 2,150,000 Brookfield Residential Properties Inc. 144A, 6.38%, 5/15/25 (b) 3,400,000 Caleres Inc.
144A, 6.25%, 8/15/23 (b) 2,500,000 Carmike Cinemas Inc. 144A, 6.00%, 6/15/23 (b) 3,600,000 Carrols Restaurant Group Inc., 8.00%, 5/01/22 3,450,000 D.R. Horton Inc., 4.38%, 9/15/22 3,550,000 Dollar Tree Inc 144A, 5.75%, 3/01/23 (b) 5,000,000 General Motors Financial Co.
Inc., 4.25%, 5/15/23 4,000,000 Goodyear Tire & Rubber Co., 7.00%, 5/15/22 2,500,000 L Brands Inc., 6.63%, 4/01/21 3,679,000 Landry’s Inc. 144A, 9.38%, 5/01/20 (b) 3,300,000 Lennar Corp., 4.50%, 11/15/19 5,150,000 Levi Strauss & Co., 6.88%, 5/01/22 5,025,000 MGM Resorts International, 5.25%, 3/31/20 5,563,000 Mobile Mini Inc., 7.88%, 12/01/20 3,450,000 Neiman Marcus Group Ltd. LLC 144A, 8.75%, 10/15/21 (b) 4,500,000 New Red Finance Inc 144A, 6.00%, 4/01/22 (b) 3,410,000 Party City Holdings Inc.
144A, 6.13%, 8/15/23 (b) 4,000,000 Regal Entertainment Group, 5.75%, 3/15/22 Value (000) $ 2,243 Principal or Shares 3,550,000 4,000,000 3,900,000 4,941 3,243 5,500,000 4,211 1,000,000 3,049 4,000,000 Value (000) Security Description Rite Aid Corp. 144A, 6.13%, 4/01/23 (b) Schaeffler Finance BV 144A, 4.25%, 5/15/21 (b) Suburban Propane Partners LP/Suburban Energy Finance Corp., 5.50%, 6/01/24 Taylor Morrison Communities Inc. / Monarch Communities Inc.
144A, 5.63%, 3/01/24 (b) Wynn Las Vegas LLC / Wynn Las Vegas Capital Corp. 144A, 4.25%, 5/30/23 (b) ZF North America Capital Inc. 144A, 4.00%, 4/29/20 (b) 2,740 1,238 1,251 2,075 3,451 2,597 3,843 3,536 3,759 5,090 4,365 2,844 3,964 3,432 5,671 5,151 5,813 3,601 4,719 Consumer Non-Cyclical (10%) 2,640,000 ACCO Brands Corp., 6.75%, 4/30/20 2,200,000 Aramark Services Inc, 5.75%, 3/15/20 4,700,000 Ashtead Capital Inc.
144A, 6.50%, 7/15/22 (b) 4,000,000 Avis Budget Car Rental LLC / Avis Budget Finance Inc. 144A, 5.13%, 6/01/22 (b) 4,000,000 C&S Group Enterprises LLC 144A, 5.38%, 7/15/22 (b) 4,055,000 Central Garden and Pet Co., 8.25%, 3/01/18 4,300,000 Dole Food Co. Inc.
144A, 7.25%, 5/01/19 (b) 3,000,000 Endo Finance Co. 144A, 5.75%, 1/15/22 (b) 3,500,000 Grifols Worldwide Operations Ltd., 5.25%, 4/01/22 4,500,000 Hertz Corp., 6.75%, 4/15/19 4,100,000 Ingles Markets Inc., 5.75%, 6/15/23 3,000,000 Iron Mountain Inc., 5.75%, 8/15/24 3,000,000 LifePoint Health Inc., 5.50%, 12/01/21 3,050,000 Mallinckrodt International Finance SA / Mallinckrodt CB LLC 144A, 5.63%, 10/15/23 (b) 4,000,000 NBTY Inc., 9.00%, 10/01/18 $ 3,838 4,040 3,802 5,445 894 4,055 114,332 2,825 2,300 5,064 4,098 3,680 4,136 4,326 2,948 3,631 4,629 4,203 3,026 3,053 2,894 4,100 3,529 4,145 Annual Report 45 . Payden High Income Fund continued Principal or Shares 3,600,000 3,500,000 Energy (7%) 1,000,000 2,650,000 5,200,000 4,700,000 4,750,000 2,000,000 6,000,000 3,000,000 2,200,000 5,500,000 1,850,000 2,700,000 3,000,000 5,075,000 Value (000) Security Description Reynolds Group Issuer Inc. / Reynolds Group Issuer LLC, 6.88%, 2/15/21 United Rentals North America Inc., 7.63%, 4/15/22 Principal or Shares 4,000,000 $ 3,771 3,815 62,499 3,500,000 4,500,000 3,000,000 Chesapeake Energy Corp., 6.88%, 11/15/20 DCP Midstream LLC 144A, 9.75%, 3/15/19 (b) EP Energy LLC / EP Energy Finance Inc., 9.38%, 5/01/20 Laredo Petroleum Inc., 7.38%, 5/01/22 Nielsen Co. Luxembourg SARL 144A, 5.50%, 10/01/21 (b) Noble Holding International Ltd., 5.95%, 4/01/25 Peabody Energy Corp., 6.50%, 9/15/20 Sabine Pass Liquefaction LLC, 5.63%, 2/01/21 Sabine Pass Liquefaction LLC, 5.75%, 5/15/24 SM Energy Co., 6.50%, 1/01/23 Sunoco LP / Sunoco Finance Corp. 144A, 5.50%, 8/01/20 (b) Sunoco LP / Sunoco Finance Corp.
144A, 6.38%, 4/01/23 (b) Tesoro Corp., 5.38%, 10/01/22 WPX Energy Inc., 6.00%, 1/15/22 Financial (16%) 3,500,000 AerCap Ireland Capital Ltd. / AerCap Global Aviation Trust, 5.00%, 10/01/21 4,100,000 Aircastle Ltd., 5.13%, 3/15/21 3,000,000 Ally Financial Inc., 3.50%, 1/27/19 8,800,000 Ally Financial Inc., 4.13%, 2/13/22 3,800,000 Argos Merger Sub Inc. 144A, 7.13%, 3/15/23 (b) 2,700,000 BNP Paribas SA 144A, 7.38%, 12/29/49 (b) 3,000,000 CIT Group Inc., 5.00%, 8/15/22 4,600,000 CIT Group Inc., 5.38%, 5/15/20 4,700,000 Citigroup Inc., 5.95%, 7/29/49 3,500,000 Communications Sales & Leasing Inc.
144A, 6.00%, 4/15/23 (b) 3,550,000 Credit Acceptance Corp. 144A, 7.38%, 3/15/23 (b) 3,600,000 E*TRADE Financial Corp., 5.38%, 11/15/22 3,500,000 Hartford Financial Services Group Inc., 8.13%, 6/15/38 3,500,000 Hockey Merger Sub 2 Inc. 144A, 7.88%, 10/01/21 (b) 4,300,000 Icahn Enterprises LP / Icahn Enterprises Finance Corp., 6.00%, 8/01/20 4,300,000 International Lease Finance Corp., 4.63%, 4/15/21 2,600,000 International Lease Finance Corp., 8.63%, 1/15/22 1,600,000 MetLife Inc., 5.25%, 12/29/49 4,000,000 Morgan Stanley, 5.45%, 7/29/49 3,250,000 Navient Corp., 4.88%, 6/17/19 3,000,000 Navient Corp., 6.00%, 1/25/17 46 Payden Mutual Funds 682 2,886 4,550 4,665 4,940 1,610 825 2,993 2,134 5,447 1,906 2,734 3,056 4,491 42,919 3,666 4,336 3,026 8,927 4,009 2,798 3,169 4,974 4,671 3,412 3,683 3,858 3,896 Pershing Square Holdings Ltd.
144A, 5.50%, 7/15/22 (b) Radian Group Inc., 5.25%, 6/15/20 Royal Bank of Scotland Group PLC, 6.10%, 6/10/23 Royal Bank of Scotland Group PLC, 7.50%, 12/29/49 Healthcare (6%) 2,400,000 CHS/Community Health Systems Inc., 6.88%, 2/01/22 2,000,000 CHS/Community Health Systems Inc., 8.00%, 11/15/19 4,000,000 Crimson Merger Sub Inc. 144A, 6.63%, 5/15/22 (b) 4,000,000 DaVita HealthCare Partners Inc., 5.75%, 8/15/22 4,750,000 HCA Inc., 6.50%, 2/15/20 4,950,000 HCA Inc., 7.50%, 2/15/22 3,000,000 HealthSouth Corp., 5.75%, 11/01/24 5,740,000 Tenet Healthcare Corp., 5.00%, 3/01/19 2,200,000 Tenet Healthcare Corp., 5.50%, 3/01/19 1,000,000 Tenet Healthcare Corp., 8.00%, 8/01/20 Industrial (5%) 4,000,000 Ardagh Packaging Finance PLC 144A, 9.13%, 10/15/20 (b) 4,280,000 Ardagh Packaging Finance PLC / Ardagh Holdings USA Inc. 144A, 3.34%, 12/15/19 (b) 2,200,000 Ball Corp., 5.25%, 7/01/25 3,300,000 Berry Plastics Corp., 5.13%, 7/15/23 4,550,000 Bombardier Inc.
144A, 5.75%, 3/15/22 (b) 3,200,000 Novelis Inc./GA, 8.75%, 12/15/20 3,500,000 Spirit Aerosystems Inc., 6.75%, 12/15/20 3,200,000 Trinseo Materials Operating SCA / Trinseo Materials Finance Inc. 144A, 6.75%, 5/01/22 (b) 2,800,000 Triumph Group Inc., 4.88%, 4/01/21 Material (3%) 3,000,000 3,600,000 5,600,000 1,000,000 2,000,000 3,200,000 3,500 2,000,000 A Schulman Inc. 144A, 6.88%, 6/01/23 (b) Alcoa Inc., 5.87%, 2/23/22 ArcelorMittal, 7.00%, 2/25/22 Ashland Inc., 4.75%, 8/15/22 Commercial Metals Co., 4.88%, 5/15/23 INEOS Group Holdings SA 144A, 6.13%, 8/15/18 (b) PolyOne Corp., 7.38%, 9/15/20 4,504 4,461 3,208 1,619 3,940 3,152 3,086 Value (000) Security Description Technology (2%) 520,000 First Data Corp.
144A, 6.75%, 11/01/20 (b) 2,424,000 First Data Corp. 144A, 8.25%, 1/15/21 (b) 2,424,000 First Data Corp., 12.63%, 1/15/21 4,460,000 Freescale Semiconductor Inc. 144A, 6.00%, 1/15/22 (b) 3,500,000 Infor U.S.
Inc. 144A, 6.50%, 5/15/22 (b) $ 3,780 3,504 4,903 3,112 97,194 2,430 2,090 3,475 4,215 5,326 5,717 3,015 5,640 2,178 1,040 35,126 4,205 4,227 2,244 3,275 3,540 3,224 3,640 3,216 2,513 30,084 2,993 3,780 5,334 1,004 1,780 3,236 2,092 20,219 549 2,548 2,785 4,761 3,325 13,968 . Principal or Shares Telecommunication (18%) 3,200,000 Altice SA 144A, 7.75%, 5/15/22 (b) 3,050,000 CCO Holdings LLC / CCO Holdings Capital Corp., 5.13%, 2/15/23 3,300,000 CCO Holdings LLC / CCO Holdings Capital Corp., 6.50%, 4/30/21 3,660,000 CenturyLink Inc., 5.80%, 3/15/22 5,000,000 CenturyLink Inc., 6.45%, 6/15/21 3,500,000 Cogent Communications Group Inc. 144A, 5.38%, 3/01/22 (b) 3,200,000 CommScope Technologies Finance LLC 144A, 6.00%, 6/15/25 (b) 3,800,000 Consolidated Communications Inc. 144A, 6.50%, 10/01/22 (b) 3,490,000 CSC Holdings LLC, 8.63%, 2/15/19 5,500,000 DISH DBS Corp., 5.88%, 7/15/22 4,750,000 DISH DBS Corp., 6.75%, 6/01/21 4,000,000 Frontier Communications Corp., 7.63%, 4/15/24 2,100,000 Frontier Communications Corp. 144A, 10.50%, 9/15/22 (b) 4,150,000 Intelsat Jackson Holdings SA, 7.25%, 10/15/20 3,500,000 Level 3 Financing Inc., 5.63%, 2/01/23 4,215,000 Numericable Group SA 144A, 6.00%, 5/15/22 (b) 2,600,000 Numericable Group SA 144A, 6.25%, 5/15/24 (b) 4,320,000 SBA Communications Corp., 5.63%, 10/01/19 4,600,000 Sinclair Television Group Inc., 6.38%, 11/01/21 1,700,000 Softbank Corp.
144A, 4.50%, 4/15/20 (b) 1,230,000 Sprint Capital Corp., 6.88%, 11/15/28 9,000,000 Sprint Capital Corp., 6.90%, 5/01/19 2,200,000 Sprint Communications Inc., 6.00%, 11/15/22 1,500,000 Sprint Corp., 7.88%, 9/15/23 5,000,000 Starz LLC / Starz Finance Corp., 5.00%, 9/15/19 3,650,000 Telecom Italia SPA 144A, 5.30%, 5/30/24 (b) 5,500,000 T-Mobile USA Inc., 6.25%, 4/01/21 3,240,000 Tribune Media Co. 144A, 5.88%, 7/15/22 (b) 2,540,000 Windstream Corp., 6.38%, 8/01/23 4,350,000 Windstream Corp., 7.50%, 6/01/22 1,590,000 Windstream Corp., 7.88%, 11/01/17 Utility (1%) 1,900,000 4,000,000 Value (000) Security Description Calpine Corp. 144A, 7.88%, 1/15/23 (b) Talen Energy Supply LLC 144A, 4.63%, 7/15/19 (b) Total Corporate Bond (Cost - $537,110) Mortgage Backed (1%) 1,450,000 Freddie Mac Structured Agency Credit Risk Debt Notes, 7.75%, 12/25/27 2,174,752 Freddie Mac Structured Agency Credit Risk Debt Notes, 8.15%, 5/25/25 375,000 Freddie Mac Structured Agency Credit Risk Debt Notes, 9.40%, 10/25/27 1,949,101 Freddie Mac Structured Agency Credit Risk Debt Notes, 10.95%, 3/25/25 Total Mortgage Backed (Cost - $5,949) $ Principal or Shares 3,088 3,065 3,469 3,573 5,063 3,465 3,256 3,380 3,717 5,404 4,916 3,600 2,184 3,808 3,609 4,236 2,607 4,531 4,761 1,689 1,024 8,663 1,885 1,391 5,126 3,682 5,692 3,337 2,022 3,632 1,692 111,567 Value (000) Security Description Stocks (2%) Preferred Stock (1%) 3,401 Ally Financial Inc., 7.00% 144A (b) 62,700 Goldman Sachs Group Inc., 5.95% 64,000 JPMorgan Chase & Co., 6.15% 60,900 Wells Fargo & Co., 6.00% $ 3,483 1,604 1,613 1,581 8,281 Real Estate Investment Trust (1%) 23,100 Equity Residential 8,700 Public Storage 9,000 Simon Property Group Inc. 1,786 1,997 1,813 Total Stocks (Cost - $12,585) Investment Company (9%) 39,270,540 Payden Cash Reserves Money Market Fund * 900,000 Payden Emerging Markets Corporate Bond Fund, SI Class * 901,064 Payden Floating Rate Fund, SI Class * Total Investment Company (Cost - $57,241) Total (Cost - $615,112) (98%) Other Assets, net of Liabilities (2%) Net Assets (100%) 5,596 13,877 39,271 $ 8,667 8,920 56,858 612,978 10,838 623,816 * Affiliated investment (a) Variable rate security.
The rate shown reflects the rate in effect at October 31, 2015. The stated maturity is subject to prepayments. See Note 2 in the Notes to Financial Statements. (b) Security offered only to qualified institutional investors, and thus is not registered for sale to the public under rule 144A of the Securities Act of 1933. It has been deemed liquid under guidelines approved by the Board. 2,050 3,679 5,729 533,637 1,452 2,193 427 2,291 6,363 Annual Report 47 .
Payden High Income Fund continued Open Forward Currency Contracts to USD Delivery Date Assets: 2/1/2016 12/15/2015 12/15/2015 Liabilities: 2/1/2016 2/24/2016 12/15/2015 11/24/2015 11/24/2015 1/27/2016 Currency (000s) Australian Dollar (Sell 16,952) British Pound (Buy 3,930) Euro (Sell 8,138) Australian Dollar (Buy 8,198) Chinese Yuan (Sell 39,637) Euro (Sell 3,276) South Korean Won (Buy 3,645,000) South Korean Won (Sell 3,645,000) Thailand Baht (Sell 214,670) Counterparty Unrealized Appreciation (Depreciation) (000s) Credit Suisse First Boston International Citibank, N.A. $ 218 BNP PARIBAS Number of Contracts 182 Contract Type U.S. Treasury 10 Year Note Future 111 $ 347 Credit Suisse First Boston International Barclays Bank PLC Open Futures Contracts $ (13) 18 (175) BNP PARIBAS BNP PARIBAS (15) (22) BNP PARIBAS (133) Barclays Bank PLC (21) $(379) See notes to financial statements. 48 Payden Mutual Funds Expiration Date Dec-15 Current Value (000) $23,239 Unrealized Depreciation (000s) $(179) . Payden California Municipal Income Fund The Fund seeks income that is exempt from federal and California state income tax and is consistent with preservation of capital by generally investing in investment grade California municipal securities with an average portfolio maturity of five to ten years. $19,000 Portfolio Composition - percent of value $13,000 General Obligation Water & Sewer Healthcare Airport/Port Industrial Development/Pollution Control Other One Year 1.87% $17,000 Five Year 3.42% Ten Year 3.98% Fund $14,777 Barclay’s Capital 7-Year Municipal Index $16,089 Barclay’s Capital California Intermediate Index $16,325 $15,000 44% 10% 9% 8% $11,000 $9,000 10/31/05 7% 22% 10/10 10/31/15 Past performance does not predict future returns. The graph does not reflect the impact of taxes or transaction costs a shareholder would pay. This information is not part of the audited financial statements. Schedule of Investments - October 31, 2015 Principal or Shares Security Description General Obligation (44%) 250,000 Alameda Community Improvement Commission Successor Agency, 5.00%, 9/01/32 BAM (a) 300,000 Anaheim Public Financing Authority, 5.00%, 5/01/34 200,000 Brea Community Benefit Financing Authority, 5.00%, 7/01/29 400,000 Burbank Redevelopment Agency Successor Agency, 4.00%, 12/01/18 BAM (a) 400,000 California State, 0.83%, 12/01/28 750,000 California State, 3.00%, 12/01/32 300,000 California State, 5.00%, 10/01/23 500,000 California State, 5.00%, 10/01/26 750,000 California State, 5.25%, 2/01/20 480,000 California State, 5.25%, 10/01/21 200,000 California State Public Works Board, 5.00%, 9/01/21 105,000 California State Public Works Board, 5.00%, 9/01/23 250,000 California State Public Works Board, 5.00%, 5/01/24 325,000 California State Public Works Board, 5.25%, 10/01/32 385,000 California State Public Works Board, 5.25%, 10/01/33 500,000 City & County of San Francisco CA, 5.00%, 6/15/22 300,000 City & County of San Francisco CA, 5.00%, 9/01/27 60,000 City of Industry CA, 4.00%, 7/01/18 150,000 City of Irvine CA, 5.00%, 9/02/22 460,000 County of San Joaquin CA, 5.00%, 11/15/15 NATL-RE (a) 200,000 East Side Union High School District, 5.00%, 8/01/29 Value (000) Principal or Shares 285,000 $ 285 250,000 339 250,000 236 250,000 435 401 801 367 605 880 558 238 127 304 382 451 608 352 65 174 461 231 250,000 225,000 350,000 450,000 310,000 250,000 250,000 475,000 250,000 315,000 425,000 325,000 285,000 300,000 Value (000) Security Description Inglewood Public Financing Authority, 4.25%, 8/01/21 Inglewood Public Financing Authority, 5.00%, 8/01/17 Liberty Union High School District, 5.00%, 8/01/28 Los Angeles County Public Works Financing Authority, 5.00%, 12/01/31 Los Angeles County Public Works Financing Authority, 5.00%, 8/01/42 Los Angeles County Redevelopment Authority, 5.00%, 6/01/23 Los Angeles County Redevelopment Authority, 5.25%, 12/01/26 AGM (a) Los Angeles, CA Unified School District, 5.00%, 7/01/21 Natomas Unified School District, 5.00%, 9/01/25 BAM (a) Oakland Redevelopment Agency Successor Agency, 5.00%, 9/01/35 AGM (a) Paramount Redevelopment Agency Successor Agency, 5.00%, 8/01/18 Pasadena, CA Unified School District, 5.00%, 5/01/21 Perris Union High School District, CA, 5.00%, 9/01/41 Poway Unified School District Public Financing Authority, 4.00%, 9/01/18 BAM (a) Rialto Redevelopment Agency, 5.00%, 9/01/27 BAM (a) Riverside County Public Financing Authority, 5.00%, 9/01/22 AGM (a) Riverside County Redevelopment Successor Agency, 5.00%, 10/01/30 AGM (a) Riverside Unified School District Financing Authority, 5.00%, 9/01/21 BAM (a) $ 313 266 293 292 276 270 429 514 372 283 275 566 267 339 496 384 322 351 Annual Report 49 . Payden California Municipal Income Fund continued Principal or Shares Value (000) Security Description Sacramento Area Flood Control Agency, 5.00%, 12/01/37 BAM (a) 325,000 Sacramento Redevelopment Agency Successor Agency, 2.00%, 12/01/17 300,000 Sacramento Redevelopment Agency Successor Agency, 5.00%, 12/01/23 BAM (a) 450,000 San Carlos, CA Elementary School District, 0.00%, 10/01/18 NATL-RE (a) 550,000 San Diego Public Facilities Financing Authority, 5.00%, 10/15/32 120,000 San Jose Financing Authority, 5.00%, 6/01/28 50,000 San Marino Unified School District, 5.00%, 6/01/23 500,000 San Mateo Joint Powers Financing Authority, 4.00%, 6/15/21 790,000 San Ysidro School District, 0.00%, 8/01/47 AGM (a) 200,000 Simi Valley Public Financing Authority, 5.00%, 10/01/29 100,000 State of California, 4.50%, 8/01/26 250,000 State of California, 5.00%, 4/01/17 250,000 State of California, 5.00%, 2/01/25 350,000 Union City Community Redevelopment Agency, 5.00%, 10/01/35 300,000 University of California, 5.00%, 5/15/20 250,000 Ventura County, CA Public Financing Authority, 5.00%, 11/01/21 490,000 West Contra Costa Unified School District, 5.00%, 8/01/22 Total General Obligation (Cost - $19,629) Revenue (54%) Airport/Port (8%) 160,000 Alameda Corridor, CA Transportation Authority, 5.00%, 10/01/23 300,000 City of Long Beach CA, 5.00%, 5/15/19 100,000 City of San Jose CA Airport Revenue, 5.00%, 3/01/28 175,000 City of San Jose CA Airport Revenue, 5.00%, 3/01/29 210,000 Los Angeles, CA Department of Airports, 4.00%, 5/15/18 300,000 Los Angeles, CA Department of Airports, 5.00%, 5/15/18 745,000 Los Angeles, CA Harbor Department, 5.00%, 8/01/19 535,000 Port of Oakland, 5.00%, 11/01/15 NATL-RE (a) 340,000 San Francisco, CA City & County Airports Commission, 5.00%, 5/01/21 365,000 San Francisco, CA City & County Airports Commission, 5.25%, 5/01/18 NATL-RE (a) Principal or Shares Value (000) Security Description 450,000 Education (3%) 100,000 California Educational Facilities Authority, 5.00%, 10/01/21 50 Payden Mutual Funds $ 476 300,000 332 250,000 358 400,000 407 250,000 635 140 60 569 101 235 105 266 299 399 334 299 590 20,213 195 343 117 203 228 333 856 535 387 406 3,603 118 California Educational Facilities Authority, 5.00%, 10/01/31 California Municipal Finance Authority, 5.00%, 4/01/18 California Municipal Finance Authority, 5.00%, 4/01/41 California Municipal Finance Authority, 5.00%, 10/01/42 BAM (a) Electric & Gas (4%) 400,000 Northern California Power Agency, 5.00%, 7/01/18 665,000 Southern California Public Power Authority, 5.00%, 7/01/18 465,000 State of California Department of Water Resources Power Supply Revenue, 5.00%, 5/01/21 190,000 State of California Department of Water Resources Power Supply Revenue, 5.00%, 5/01/21 Facilities (2%) 575,000 California State Public Works Board, 5.00%, 6/01/23 Healthcare (9%) 750,000 Abag Finance Authority for Nonprofit Corps, 5.00%, 8/01/32 100,000 California Health Facilities Financing Authority, 0.12%, 7/01/16 300,000 California Health Facilities Financing Authority, 4.00%, 8/15/21 150,000 California Health Facilities Financing Authority, 5.00%, 3/01/17 340,000 California Health Facilities Financing Authority, 5.00%, 10/01/18 710,000 California Health Facilities Financing Authority, 5.00%, 11/15/27 250,000 California Health Facilities Financing Authority, 5.00%, 7/01/43 250,000 California Health Facilities Financing Authority, 5.00%, 7/01/43 205,000 California Health Facilities Financing Authority, 5.25%, 3/01/28 410,000 City of Torrance CA, 5.00%, 9/01/22 Industrial (1%) 160,000 Parish of St. Charles LA, 4.00%, 12/01/40 Industrial Development/Pollution Control (7%) 400,000 California Infrastructure & Economic Development Bank, 0.29%, 4/01/38 500,000 California Infrastructure & Economic Development Bank, 0.29%, 10/01/47 750,000 California Infrastructure & Economic Development Bank, 4.00%, 2/01/21 $ 340 270 424 272 1,424 444 740 515 210 1,909 695 860 100 341 158 380 818 292 287 235 467 3,938 171 398 496 842 . Principal or Shares 300,000 300,000 105,000 300,000 390,000 100,000 Lease (2%) 410,000 500,000 Value (000) Security Description California Municipal Finance Authority, 1.13%, 2/01/39 California Statewide Communities Development Authority, 4.25%, 11/01/33 FGIC (a) California Statewide Communities Development Authority, 4.25%, 11/01/33 FGIC (a) Palm Springs Community Redevelopment Agency Successor Agency, 5.00%, 9/01/29 AGM (a) Palm Springs Community Redevelopment Agency Successor Agency, 5.00%, 9/01/31 AGM (a) Successor Agency to the Upland Community Redevelopment Agency, 5.00%, 9/01/23 AGM (a) California State Public Works Board, 5.00%, 12/01/18 County of Los Angeles CA, 5.00%, 3/01/21 Resource Recovery (1%) 500,000 South Bayside, CA Waste Management Authority, 5.25%, 9/01/24 Tax Allocation (1%) 415,000 Riverside County, CA Economic Development Agency, 7.25%, 12/01/40 20,000 San Dimas, CA Redevelopment Agency, 6.75%, 9/01/16 AGM (a) Transportation (6%) 250,000 Bay Area Toll Authority, 0.61%, 4/01/34 500,000 Bay Area Toll Authority, 1.50%, 4/01/47 500,000 Foothill-Eastern Transportation Corridor Agency, 5.00%, 1/15/53 1,000,000 Foothill-Eastern Transportation Corridor Agency, 5.50%, 1/15/53 275,000 Sonoma-Marin Area Rail Transit District, 5.00%, 3/01/27 $ Principal or Shares 300 311 109 347 445 120 3,368 461 590 1,051 571 508 20 528 248 506 543 1,123 Value (000) Security Description Water & Sewer (10%) 200,000 Brentwood, CA Infrastructure Financing Authority, 5.50%, 7/01/20 495,000 Central Marin Sanitation Agency, CA, 5.00%, 9/01/18 NATL-RE (a) 500,000 City of San Francisco, CA Public Utilities Commission, 5.00%, 11/01/20 310,000 City of San Francisco, CA Public Utilities Commission, 5.00%, 11/01/24 250,000 El Dorado, CA Irrigation District / El Dorado County Water Agency, 5.00%, 3/01/29 AGM (a) 300,000 Metropolitan Water District of Southern CA, 0.39%, 7/01/36 500,000 Metropolitan Water District of Southern CA, 5.00%, 7/01/17 250,000 Sacramento County Sanitation Districts Financing Authority, 5.00%, 12/01/22 550,000 San Diego County, CA Water Authority, 5.00%, 5/01/21 AGM (a) 300,000 South Placer Wastewater Authority, CA, 0.34%, 11/01/17 500,000 State of California Department of Water Resources, 0.31%, 12/01/35 Total Revenue (Cost - $23,487) Investment Company (3%) 1,520,203 Dreyfus General CA Municipal Money Market Fund (Cost - $1,520) Total (Cost - $44,636) (101%) Liabilities in excess of Other Assets (-1%) Net Assets (100%) $ 225 514 593 373 288 300 537 306 609 299 499 4,543 24,548 $ 1,520 46,281 (343) 45,938 (a) Payment of principal and/or interest is insured against default by a monoline insurer. AGM Assured Guaranty Municipal Corporation BAM Build America Mutual FGIC Financial Guaranty Insurance Corporation NATL-RE National Public Finance Guarantee Corporation 327 2,747 See notes to financial statements. Annual Report 51 . Payden Global Low Duration Fund $18,000 The Fund seeks a high level of total return that is consistent with preservation of capital by generally investing in investment grade debt securities denominated in U.S. and foreign currencies with an average portfolio maturity not to exceed three years. $16,000 Five Year 1.67% Ten Year 2.77% Fund $13,141 Bank of America Merrill Lynch $12,838 Govt/Corp 1-3 Years $13,247 $14,000 Portfolio Composition - percent of value Corporate Bond U.S. Treasury Asset Backed Mortgage Backed Foreign Government Other One Year 0.32% $12,000 53% 22% 11% 5% 4% 5% $10,000 $8,000 10/31/05 10/10 10/31/15 Past performance does not predict future returns. The graph does not reflect the impact of taxes or transaction costs a shareholder would pay. This information is not part of the audited financial statements. Schedule of Investments - October 31, 2015 Principal or Shares Security Description Bank Loans(a) (2%) 299,000 Activision Blizzard Inc.
Term Loan B 1L, 3.25%, 10/11/20 392,000 American Builders & Contractors Supply Co. Inc. Term Loan B1 IL, 3.50%, 4/16/20 391,962 CDW LLC/CDW Finance Corp. Term Loan B 1L, 3.50%, 4/29/20 370,670 Dole Food Co.
Inc. Term Loan B 1L, 4.50%, 11/01/18 418,751 General Nutrition Co. Inc.
Term Loan B 1L, 3.25%, 3/26/19 391,960 Starwood Property Trust Inc. Term Loan 1L, 3.50%, 4/19/20 Total Bank Loans (Cost - $2,267) Bonds (96%) Australia (USD) (2%) 290,000 Commonwealth Bank of Australia/New York NY, 1.75%, 11/02/18 250,000 Macquarie Bank Ltd. 144A, 0.95%, 10/27/17 (b) 450,000 Macquarie Bank Ltd.
144A, 1.60%, 10/27/17 (b) 500,000 Macquarie Bank Ltd. 144A, 4.88%, 6/10/25 (b) 480,000 Macquarie Group Ltd. 144A, 1.33%, 1/31/17 (b) Bermuda (USD) (0%) 230,000 Aircastle Ltd., 6.75%, 4/15/17 Brazil (USD) (0%) 350,000 Banco do Nordeste do Brasil SA 144A, 3.63%, 11/09/15 (b) Canada (CAD) (1%) 650,000 Bell Canada, 1.33%, 4/22/16 691,000 Enbridge Inc., 1.21%, 3/13/17 300,000 Rogers Communications Inc., 1.36%, 3/13/17 550,000 Shaw Communications Inc., 1.52%, 2/01/16 Canada (USD) (1%) 150,000 Enbridge Inc., 0.78%, 6/02/17 52 Payden Mutual Funds Value (000) $ Principal or Shares 300 381,000 390 700,000 100,000 340,000 61,000 392 Glencore Finance Canada Ltd.
144A, 2.70%, 10/25/17 (b) Province of Ontario Canada, 1.60%, 9/21/16 Thomson Reuters Corp., 1.30%, 2/23/17 Thomson Reuters Corp., 1.65%, 9/29/17 TransAlta Corp., 1.90%, 6/03/17 371 406 388 2,247 290 249 448 498 481 1,966 245 350 497 523 228 421 1,669 147 Value (000) Security Description Cayman Islands (USD) (7%) 200,000 Alibaba Group Holding Ltd. 144A, 1.63%, 11/28/17 (b) 800,000 Apidos CLO 144A, 1.47%, 4/15/25 (b) 250,000 Apidos CLO 144A, 2.02%, 4/15/25 (b) 500,000 Babson CLO Ltd. 144A, 1.42%, 4/20/25 (b) 300,000 Babson CLO Ltd.
144A, 3.17%, 4/20/27 (b) 200,000 Baidu Inc., 2.25%, 11/28/17 600,000 Cent CLO LP 144A, 1.44%, 7/23/25 (b) 300,000 CIFC Funding 2015-II Ltd. 144A, 3.32%, 4/15/27 (b) 545,000 Dryden XXII Senior Loan Fund 144A, 1.42%, 8/15/25 (b) 490,000 Dryden XXII Senior Loan Fund 144A, 1.87%, 8/15/25 (b) 300,000 Dryden XXXI Senior Loan Fund 144A, 3.17%, 4/18/26 (b) 200,000 Hutchison Whampoa International 12 II Ltd. 144A, 2.00%, 11/08/17 (b) 250,000 Madison Park Funding XVII Ltd 144A, 3.18%, 7/21/27 (b) 455,000 Octagon Investment Partners XIX Ltd. 144A, 2.32%, 4/15/26 (b) 315,000 Octagon Investment Partners XXIII Ltd.
144A, 2.29%, 2/25/28 (b) 300,000 Seagate HDD Cayman, 3.75%, 11/15/18 1,300,000 Symphony CLO XV Ltd. 144A, 1.77%, 10/17/26 (b) $ 355 706 100 340 60 1,708 199 785 244 492 294 200 587 290 535 476 293 201 245 447 315 304 1,286 . Principal or Shares 300,000 775,000 490,000 250,000 Value (000) Security Description Tencent Holdings Ltd. 144A, 2.00%, 5/02/17 (b) Tyron Park CLO Ltd. 144A, 1.44%, 7/15/25 (b) Tyron Park CLO Ltd. 144A, 1.85%, 7/15/25 (b) Venture XVII CLO Ltd.
144A, 3.17%, 7/15/26 (b) Chile (USD) (0%) 300,000 Banco Santander Chile 144A, 1.22%, 4/11/17 (b) China (USD) (0%) 250,000 Industrial & Commercial Bank of China Ltd./New York, 2.35%, 11/13/17 Denmark (EUR) (0%) 250,000 Jyske Bank A/S, 0.46%, 6/19/17 Denmark (GBP) (0%) 200,000 Carlsberg Breweries A/S, 7.25%, 11/28/16 Denmark (USD) (1%) 1,100,000 Denmark Government International Bond 144A, 0.88%, 3/20/17 (b) France (USD) (1%) 650,000 BPCE SA, 1.63%, 1/26/18 635,000 Caisse d’Amortissement de la Dette Sociale 144A, 1.25%, 3/12/18 (b) 540,000 Credit Agricole SA/London 144A, 1.12%, 4/15/19 (b) Germany (USD) (2%) 570,000 FMS Wertmanagement AoeR, 0.63%, 1/30/17 600,000 FMS Wertmanagement AoeR, 1.13%, 9/05/17 1,000,000 KFW, 0.88%, 12/15/17 Hong Kong (USD) (0%) 200,000 AIA Group Ltd. 144A, 2.25%, 3/11/19 (b) Ireland (EUR) (1%) 450,000 Allied Irish Banks PLC, 2.88%, 11/28/16 300,000 Elsevier Finance SA via Aquarius + Investments PLC, 0.47%, 5/20/17 Ireland (GBP) (0%) 250,000 GE Capital UK Funding, 0.74%, 3/20/17 Ireland (USD) (1%) 300,000 Ardagh Packaging Finance PLC / Ardagh Holdings USA Inc. 144A, 3.34%, 12/15/19 (b) 1,600,000 Trade MAPS 1 Ltd.
144A, 0.90%, 12/10/18 (b) Ivory Coast (USD) (0%) 510,000 African Development Bank, 0.75%, 11/03/17 Japan (USD) (2%) 290,000 Bank of Tokyo-Mitsubishi UFJ Ltd. 144A, 1.20%, 3/10/17 (b) 400,000 Bank of Tokyo-Mitsubishi UFJ Ltd. 144A, 1.45%, 9/08/17 (b) 260,000 Mitsubishi UFJ Trust & Banking Corp.
144A, 1.60%, 10/16/17 (b) 250,000 Mizuho Bank Ltd. 144A, 1.30%, 4/16/17 (b) 500,000 Mizuho Bank Ltd. 144A, 1.55%, 10/17/17 (b) $ Principal or Shares 300 763 476 241 8,973 296 252 276 326 1,105 652 636 537 1,825 570 602 998 2,170 200 505 331 836 384 296 1,597 1,893 509 289 400 259 249 498 200,000 340,000 400,000 Value (000) Security Description Mizuho Bank Ltd.
144A, 1.70%, 9/25/17 (b) Nomura Holdings Inc., 1.79%, 9/13/16 Suntory Holdings Ltd. 144A, 1.65%, 9/29/17 (b) Luxembourg (USD) (2%) 300,000 Actavis Funding SCS, 1.30%, 6/15/17 260,000 Actavis Funding SCS, 1.59%, 3/12/20 350,000 Actavis Funding SCS, 1.85%, 3/01/17 520,000 Actavis Funding SCS, 2.35%, 3/12/18 480,000 Mallinckrodt International Finance SA, 3.50%, 4/15/18 467 1,896 New Zealand (USD) (1%) 310,000 ANZ New Zealand International Ltd./London 144A, 1.40%, 4/27/17 (b) 400,000 ANZ New Zealand International Ltd./London 144A, 1.75%, 3/29/18 (b) 400,000 BNZ International Funding Ltd./London 144A, 1.90%, 2/26/18 (b) Panama (USD) (0%) 70,000 Carnival Corp., 1.88%, 12/15/17 Singapore (USD) (0%) 126,000 DBS Bank Ltd. 144A, 0.93%, 7/15/21 (b) South Korea (USD) (0%) 300,000 Korea Expressway Corp.
144A, 1.63%, 4/28/17 (b) Spain (USD) (1%) 640,000 Instituto de Credito Oficial 144A, 1.13%, 4/01/16 (b) Sweden (SEK) (0%) 4,300,000 Volvo Treasury AB, 0.88%, 6/03/16 Sweden (USD) (1%) 350,000 Kommuninvest I Sverige AB 144A, 0.88%, 12/13/16 (b) 620,000 Kommuninvest I Sverige AB 144A, 1.13%, 10/09/18 (b) 200 342 399 2,636 298 257 351 523 Netherlands (USD) (3%) 1,000,000 Bank Nederlandse Gemeenten 144A, 0.88%, 2/21/17 (b) 450,000 EDP Finance BV 144A, 6.00%, 2/02/18 (b) 700,000 MDC-GMTN BV 144A, 3.75%, 4/20/16 (b) 700,000 Nederlandse Waterschapsbank NV 144A, 1.25%, 9/18/17 (b) 610,000 Siemens Financieringsmaatschappij NV 144A, 1.45%, 5/25/18 (b) Norway (USD) (1%) 500,000 Kommunalbanken AS 144A, 0.88%, 10/03/16 (b) 200,000 Sparebank 1 Boligkreditt AS 144A, 2.63%, 5/27/16 (b) $ 1,001 479 710 703 609 3,502 310 400 401 1,111 501 202 703 70 126 300 641 505 351 616 967 Annual Report 53 . Payden Global Low Duration Fund continued Principal or Shares Value (000) Security Description Switzerland (USD) (1%) 780,000 Credit Suisse/New York NY, 1.38%, 5/26/17 300,000 Credit Suisse/New York NY, 1.75%, 1/29/18 500,000 UBS AG/Stamford CT, 1.80%, 3/26/18 United Kingdom (EUR) (0%) 370,000 Yorkshire Building Society, 2.13%, 3/18/19 United Kingdom (GBP) (1%) 220,000 Prudential PLC, 1.25%, 11/16/15 250,000 United Utilities Water PLC, 6.13%, 12/29/15 United Kingdom (USD) (4%) 550,000 Abbey National Treasury Services PLC, 1.65%, 9/29/17 200,000 Anglo American Capital PLC 144A, 1.27%, 4/15/16 (b) 800,000 Bank of England Euro Note 144A, 1.25%, 3/16/18 (b) 170,000 BAT International Finance PLC 144A, 0.85%, 6/15/18 (b) 220,000 BAT International Finance PLC 144A, 1.85%, 6/15/18 (b) 440,000 BP Capital Markets PLC, 1.67%, 2/13/18 750,000 Granite Master Issuer PLC, 1.06%, 12/17/54 390,000 HSBC Bank PLC 144A, 0.96%, 5/15/18 (b) 250,000 Imperial Tobacco Finance PLC 144A, 2.05%, 7/20/18 (b) 400,000 Nationwide Building Society 144A, 2.35%, 1/21/20 (b) 700,000 Standard Chartered PLC 144A, 1.50%, 9/08/17 (b) United States (EUR) (1%) 500,000 Bank of America Corp., 0.80%, 3/28/18 350,000 Citigroup Inc., 1.24%, 11/30/17 225,000 Parker Hannifin Corp., 4.13%, 11/11/15 United States (GBP) (1%) 450,000 JPMorgan Chase & Co., 1.07%, 5/30/17 United States (USD) (59%) 380,000 AbbVie Inc., 1.80%, 5/14/18 420,000 AES Corp./VA, 3.32%, 6/01/19 600,000 Air Lease Corp., 4.50%, 1/15/16 175,000 Alliance Data Systems Corp. 144A, 5.25%, 12/01/17 (b) 420,000 Ally Financial Inc., 3.25%, 9/29/17 263,573 American Homes 4 Rent 2014-SFR1 144A, 1.25%, 6/17/31 (b) 315,000 AmeriGas Partners LP / AmeriGas Finance Corp., 6.25%, 8/20/19 460,000 Anthem Inc., 2.38%, 2/15/17 160,000 Aramark Services Inc, 5.75%, 3/15/20 160,000 Astoria Financial Corp., 5.00%, 6/19/17 80,000 AT&T Inc., 5.50%, 2/01/18 110,000 Autodesk Inc., 1.95%, 12/15/17 265,000 Avis Budget Car Rental LLC / Avis Budget Finance Inc., 4.88%, 11/15/17 54 Payden Mutual Funds $ Principal or Shares 780 301 501 1,582 423 200,000 450,000 310,000 100,000 70,000 167,599 339 389 728 90,000 660,000 125,000 250,000 552 150,000 90,000 199 90,000 805 195,000 370,000 350,000 90,000 170 221 442 740 389 250 401 696 4,865 546 385 247 1,178 130,000 150,000 720,000 980,000 400,000 725,000 220,000 142,000 280,270 492,576 250,000 210,000 338,722 685 381 401 604 240,000 350,000 181 424 300,000 230,000 200,000 414,164 258 208,343 323 466 167 167 87 111 959,535 272 415,643 402,237 Value (000) Security Description Bank of America Corp., 0.88%, 5/02/17 Bank of America Corp., 1.36%, 1/15/19 Bank of America Corp., 1.70%, 8/25/17 Bank of America Corp., 3.75%, 7/12/16 Bank of America Corp., 3.88%, 3/22/17 Bank of America Mortgage 2002-K Trust, 2.71%, 10/20/32 Baxalta Inc. 144A, 2.00%, 6/22/18 (b) Becton Dickinson and Co., 1.45%, 5/15/17 Boardwalk Pipelines LP, 5.88%, 11/15/16 California Earthquake Authority, 1.82%, 7/01/17 Cameron International Corp., 1.40%, 6/15/17 Capital Auto Receivables Asset Trust 2013-1, 1.29%, 4/20/18 Capital Auto Receivables Asset Trust 2013-1, 1.74%, 10/22/18 Capital One Financial Corp., 6.15%, 9/01/16 Capital One NA/Mclean VA, 1.50%, 9/05/17 Capital One NA/Mclean VA, 1.65%, 2/05/18 CC Holdings GS V LLC / Crown Castle GS III Corp., 2.38%, 12/15/17 Celgene Corp., 2.13%, 8/15/18 CIT Group Inc., 5.25%, 3/15/18 Citigroup Inc., 1.55%, 8/14/17 Citigroup Inc., 1.80%, 2/05/18 Citizens Bank NA/Providence RI, 1.60%, 12/04/17 CNH Capital LLC, 3.25%, 2/01/17 CNH Capital LLC, 3.88%, 11/01/15 Coca-Cola Co., 0.88%, 10/27/17 Colony American Homes 2014-1 144A, 1.40%, 5/17/31 (b) Colony American Homes 2014-2 144A, 1.15%, 7/17/31 (b) Compass Bank, 1.85%, 9/29/17 ConocoPhillips Co., 1.50%, 5/15/18 Credit Suisse Mortgage Capital Certificates 144A, 1.55%, 4/25/43 (b) CVS Health Corp., 1.90%, 7/20/18 Daimler Finance North America LLC 144A, 1.65%, 3/02/18 (b) Discover Bank/Greenwood DE, 2.60%, 11/13/18 DISH DBS Corp., 4.63%, 7/15/17 Express Scripts Holding Co., 1.25%, 6/02/17 Fannie Mae Connecticut Avenue Securities, 1.15%, 5/25/24 Fannie Mae Connecticut Avenue Securities, 1.15%, 5/25/24 Fannie Mae Connecticut Avenue Securities, 1.39%, 7/25/24 Fannie Mae Connecticut Avenue Securities, 1.80%, 1/25/24 Fannie Mae Connecticut Avenue Securities, 2.20%, 10/25/23 $ 198 452 311 102 72 170 90 660 129 252 149 90 90 203 368 348 91 131 158 720 979 397 730 220 142 275 481 249 210 320 242 348 302 237 199 410 207 958 417 406 . Principal or Shares 745,403 339,889 256,411 75,000 110,000 125,000 300,000 200,000 256,166 249,972 249,885 100,000 300,000 600,000 320,000 650,000 39,000 410,000 210,000 165,132 380,000 390,000 180,000 490,000 460,000 532,151 450,000 250,000 370,000 190,000 100,000 100,000 140,000 250,000 Value (000) Security Description FDIC Structured Sale Guaranteed Notes 144A, 0.91%, 12/04/20 (b) FDIC Structured Sale Guaranteed Notes 144A, 3.25%, 4/25/38 (b) FDIC Trust 144A, 2.18%, 5/25/50 (b) Fidelity National Information Services Inc., 1.45%, 6/05/17 Fidelity National Information Services Inc., 2.00%, 4/15/18 Fifth Third Bancorp, 5.45%, 1/15/17 Ford Motor Credit Co. LLC, 2.15%, 1/09/18 Ford Motor Credit Co. LLC, 3.00%, 6/12/17 Freddie Mac Structured Agency Credit Risk Debt Notes, 1.65%, 11/25/23 Freddie Mac Structured Agency Credit Risk Debt Notes, 8.15%, 5/25/25 Freddie Mac Structured Agency Credit Risk Debt Notes, 10.95%, 3/25/25 Freeport-McMoRan Inc., 2.15%, 3/01/17 GATX Corp., 2.50%, 7/30/19 General Motors Financial Co. Inc., 2.40%, 4/10/18 General Motors Financial Co.
Inc., 3.00%, 9/25/17 Glencore Funding LLC 144A, 1.68%, 1/15/19 (b) Glencore Funding LLC 144A, 2.13%, 4/16/18 (b) Goldman Sachs Group Inc., 1.52%, 4/30/18 Goldman Sachs Group Inc., 3.63%, 2/07/16 GSAMP Trust 2004-SEA2, 0.85%, 3/25/34 Harley-Davidson Financial Services Inc. 144A, 2.15%, 2/26/20 (b) Hertz Corp., 6.75%, 4/15/19 Hess Corp., 1.30%, 6/15/17 Hewlett Packard Enterprise Co. 144A, 2.45%, 10/05/17 (b) Hewlett Packard Enterprise Co.
144A, 2.85%, 10/05/18 (b) Hilton USA Trust 2013-HLF 144A, 1.19%, 11/05/30 (b) HSBC USA Inc., 1.70%, 3/05/18 Huntington National Bank, 1.38%, 4/24/17 Hyundai Capital America 144A, 1.45%, 2/06/17 (b) Hyundai Capital America 144A, 2.00%, 3/19/18 (b) Hyundai Capital America 144A, 2.13%, 10/02/17 (b) Hyundai Capital America 144A, 3.75%, 4/06/16 (b) IAC/InterActiveCorp 144A, 4.88%, 11/30/18 (b) Icahn Enterprises LP / Icahn Enterprises Finance Corp., 3.50%, 3/15/17 Principal or Shares 380,000 $ 748 410,000 351 258 348,653 74 1,300,000 108 130 300 203 840,000 280,000 500,000 256 252 294 97 299 200,000 570,000 100,000 110,000 370,000 320,000 564,589 595 118,698 324 521 34 414 212 165 376 401 178 492 461 370,000 190,000 600,000 50,771 100,000 370,000 300,000 650,000 400,000 250,000 100,000 500,000 200,000 340,000 528 450 249 110,000 110,000 369 400,000 189 200,000 760,000 270,000 275,673 100 101 144 254 200,000 220,000 300,000 100,000 185,014 221,124 Value (000) Security Description International Lease Finance Corp., 2.29%, 6/15/16 International Lease Finance Corp., 3.88%, 4/15/18 Invitation Homes 2013-SFR1 Trust 144A, 1.40%, 12/17/30 (b) Invitation Homes 2014-SFR1 Trust 144A, 1.20%, 6/17/31 (b) Invitation Homes 2014-SFR2 Trust 144A, 1.30%, 9/17/31 (b) JB Hunt Transport Services Inc., 2.40%, 3/15/19 JP Morgan Chase Commercial Mortgage Securities Trust 2015-COSMO 144A, 1.45%, 1/15/32 (b) JPMorgan Chase & Co., 1.22%, 1/25/18 JPMorgan Chase & Co., 1.35%, 2/15/17 Kinder Morgan Inc./DE, 2.00%, 12/01/17 Kinder Morgan Inc./DE, 3.05%, 12/01/19 Kraft Heinz Foods Co. 144A, 1.60%, 6/30/17 (b) Kraft Heinz Foods Co. 144A, 2.00%, 7/02/18 (b) Kubota Credit Owner Trust 2015-1 144A, 0.94%, 12/15/17 (b) L.A.
Arena Funding LLC 144A, 7.66%, 12/15/26 (b) L-3 Communications Corp., 1.50%, 5/28/17 Liberty Property LP, 6.63%, 10/01/17 Martin Marietta Materials Inc., 1.43%, 6/30/17 MASTR Asset Securitization Trust 2004-6, 5.00%, 7/25/19 McGraw Hill Financial Inc. 144A, 3.30%, 8/14/20 (b) Mobile Mini Inc., 7.88%, 12/01/20 Morgan Stanley, 1.06%, 7/23/19 Morgan Stanley, 1.46%, 1/27/20 Morgan Stanley, 5.45%, 1/09/17 Morgan Stanley, 6.63%, 4/01/18 Murphy Oil Corp., 2.50%, 12/01/17 Nabors Industries Inc., 2.35%, 9/15/16 National Oilwell Varco Inc., 1.35%, 12/01/17 New York Life Global Funding 144A, 1.55%, 11/02/18 (b) Newell Rubbermaid Inc., 2.15%, 10/15/18 Penske Truck Leasing Co. LP / PTL Finance Corp.
144A, 2.50%, 6/15/19 (b) Penske Truck Leasing Co. LP / PTL Finance Corp. 144A, 3.20%, 7/15/20 (b) Prudential Financial Inc., 1.10%, 8/15/18 QUALCOMM Inc., 1.40%, 5/18/18 Regions Financial Corp., 2.00%, 5/15/18 Residential Asset Securitization Trust 2006-A8, 6.00%, 8/25/36 Reynolds American Inc., 3.25%, 6/12/20 Sabine Pass LNG LP, 7.50%, 11/30/16 Santander Bank NA, 2.00%, 1/12/18 SBA Communications Corp., 5.63%, 10/01/19 Sequoia Mortgage Trust, 1.45%, 2/25/43 Sequoia Mortgage Trust, 1.55%, 4/25/43 $ 380 417 344 1,273 825 282 498 201 571 98 107 370 321 565 130 365 207 596 51 102 387 297 653 419 278 98 498 198 339 110 109 402 201 757 270 229 205 228 299 105 180 215 Annual Report 55 .
Payden Global Low Duration Fund continued Principal or Shares 77,871 650,000 185,318 290,845 465,000 120,000 170,000 220,000 505,000 235,000 150,000 290,000 360,000 390,000 7,005,000 500,000 7,035,000 800,000 4,410,000 2,850,000 5,700,000 150,000 180,000 120,000 390,000 250,000 560,000 265,726 135,867 444,811 240,000 390,000 120,000 230,000 280,000 100,000 Value (000) Security Description Sequoia Mortgage Trust, 3.50%, 4/25/42 Southern California Edison Co., 1.85%, 2/01/22 Springleaf Mortgage Loan Trust 144A, 1.27%, 6/25/58 (b) Springleaf Mortgage Loan Trust 144A, 1.78%, 12/25/65 (b) SunTrust Bank/Atlanta GA, 5.20%, 1/17/17 Synchrony Financial, 1.56%, 2/03/20 Synchrony Financial, 1.88%, 8/15/17 Synchrony Financial, 3.00%, 8/15/19 Talen Energy Supply LLC 144A, 4.63%, 7/15/19 (b) Tenet Healthcare Corp., 6.25%, 11/01/18 Thermo Fisher Scientific Inc., 1.30%, 2/01/17 TIAA Asset Management Finance Co. LLC 144A, 2.95%, 11/01/19 (b) T-Mobile USA Inc. 144A, 5.25%, 9/01/18 (b) Toyota Motor Credit Corp., 1.55%, 7/13/18 U.S. Treasury Note, 0.50%, 1/31/17 (c)(d) U.S.
Treasury Note, 0.63%, 7/31/17 U.S. Treasury Note, 0.63%, 9/30/17 U.S. Treasury Note, 0.88%, 11/15/17 U.S.
Treasury Note, 1.00%, 2/15/18 U.S. Treasury Note, 1.00%, 8/15/18 U.S. Treasury Note, 1.00%, 9/15/18 UnitedHealth Group Inc., 1.45%, 7/17/17 UnitedHealth Group Inc., 1.90%, 7/16/18 Ventas Realty LP, 1.25%, 4/17/17 Verizon Communications Inc., 1.35%, 6/09/17 Verizon Communications Inc., 2.09%, 9/14/18 Volkswagen Group of America Finance LLC 144A, 1.25%, 5/23/17 (b) VOLT XXII LLC 144A, 3.50%, 2/25/55 (b) VOLT XXV LLC 144A, 3.50%, 6/26/45 (b) VOLT XXXIII LLC 144A, 3.50%, 3/25/55 (b) WEA Finance LLC / Westfield UK & Europe Finance PLC 144A, 1.75%, 9/15/17 (b) Windstream Corp., 7.88%, 11/01/17 WM Wrigley Jr.
Co. 144A, 2.00%, 10/20/17 (b) WPX Energy Inc., 5.25%, 1/15/17 Zimmer Holdings Inc., 2.00%, 4/01/18 Zimmer Holdings Inc., 2.70%, 4/01/20 Virgin Islands (British) (USD) (1%) 200,000 CNOOC Finance 2013 Ltd., 1.13%, 5/09/16 300,000 CNPC General Capital Ltd. 144A, 1.21%, 5/14/17 (b) 200,000 TSMC Global Ltd.
144A, 1.63%, 4/03/18 (b) 210,000 Want Want China Finance Ltd. 144A, 1.88%, 5/14/18 (b) Total Bonds (Cost - $125,943) Purchased Put Options (0%) 447 Eurodollar 1-Year Mid-Curve Option, 97.5, 3/11/16 352 Eurodollar 1-Year Mid-Curve Option, 97.875, 12/11/15 Total Purchased Put Options (Cost - $144) 56 Payden Mutual Funds $ Principal or Shares 79 646 186 292 485 119 170 222 464 251 150 294 369 392 7,003 500 7,020 801 4,423 2,850 5,696 151 182 120 391 257 546 264 135 442 Investment Company (1%) 1,958,844 Payden Cash Reserves Money Market Fund * (Cost - $1,959) Total (Cost - $130,313) (99%) Other Assets, net of Liabilities (1%) Net Assets (100%) 200 299 197 207 903 124,553 3 2 5 $ $ 1,959 128,764 1,580 130,344 * Affiliated investment (a) Variable rate security. The rate shown reflects the rate in effect at October 31, 2015.
The stated maturity is subject to prepayments. See Note 2 in the Notes to Financial Statements. (b) Security offered only to qualified institutional investors, and thus is not registered for sale to the public under rule 144A of the Securities Act of 1933. It has been deemed liquid under guidelines approved by the Board. (c) All or a portion of security has been pledged in connection with outstanding centrally cleared swaps. (d) All or a portion of the security is pledged to cover futures contract margin requirements. Open Forward Currency Contracts to USD Delivery Date Assets: 12/15/2015 11/9/2015 11/9/2015 Unrealized Appreciation (Depreciation) (000s) Currency (000s) Counterparty Euro (Sell 1,051) Euro (Sell 2,488) Swedish Krona (Sell 4,326) BNP PARIBAS Citibank, N.A. BNP PARIBAS $ 46 45 12 $103 Liabilities: 11/9/2015 11/9/2015 12/15/2015 239 415 121 232 280 100 76,749 Value (000) Security Description British Pound (Sell 1,406) Canadian Dollar (Sell 2,186) Euro (Buy 1,051) HSBC Bank USA, N.A. Royal Bank of Canada BNP PARIBAS $ (39) (4) (7) $ (50) Open Futures Contracts Number of Contracts 38 18 36 Contract Type U.S. Treasury 10 Year Note Future U.S.
Treasury 2 Year Note Future U.S. Treasury 5 Year Note Future Expiration Date Dec-15 Current Value (000) $ 4,852 Unrealized Appreciation (Depreciation) (000s) $(37) Jan-16 3,936 (3) Jan-16 (4,312) 4 $(36) . Open Centrally Cleared Credit Default Swap Contracts Reference Obligations CDX.NA.IG.25 Notional Fund Expiration Principal Pays Clearinghouse Date (000s) 1.00% Chicago Mercantile Dec-20 USD 2,250 Value (000s) $(26) See notes to financial statements. Annual Report 57 . Payden Global Fixed Income Fund $20,000 The Fund seeks a high level of total return that is consistent with preservation of capital by generally investing in investment grade debt securities denominated in U.S. and foreign currencies with an average portfolio maturity not to exceed ten years. Five Year 3.63% Ten Year 4.18% Fund $15,067 Barclays Capital Global Aggregate Index Hedged $15,564 $16,000 $14,000 Portfolio Composition - percent of value Foreign Government Corporate Investment Company U.S. Treasury Mortgage Backed One Year 2.27% $18,000 38% 37% 15% 9% 1% $12,000 $10,000 $8,000 10/31/05 10/10 10/31/15 Past performance does not predict future returns. The graph does not reflect the impact of taxes or transaction costs a shareholder would pay. This information is not part of the audited financial statements. Schedule of Investments - October 31, 2015 Principal or Shares Security Description Bonds (86%) Australia (AUD) (1%) 450,000 Australia Government Bond, 1.75%, 11/21/20 500,000 Australia Government Bond, 3.25%, 4/21/25 Australia (USD) (2%) 250,000 Australia & New Zealand Banking Group Ltd. 144A, 4.50%, 3/19/24 (a) 250,000 Macquarie Bank Ltd.
144A, 6.63%, 4/07/21 (a) 260,000 Macquarie Group Ltd. 144A, 1.33%, 1/31/17 (a) 200,000 Suncorp-Metway Ltd. 144A, 2.35%, 4/27/20 (a) 400,000 Sydney Airport Finance Co.
Pty Ltd. 144A, 3.38%, 4/30/25 (a) 180,000 Sydney Airport Finance Co. Pty Ltd.
144A, 3.90%, 3/22/23 (a) Austria (EUR) (0%) 120,000 Austria Government Bond 144A, 1.65%, 10/21/24 (a) 50,000 Austria Government Bond 144A, 3.15%, 6/20/44 (a) Belgium (EUR) (1%) 100,000 Belgium Government Bond 144A, 0.80%, 6/22/25 (a) 150,000 Belgium Government Bond 144A, 1.00%, 6/22/31 (a) 250,000 Belgium Government Bond, 3.00%, 9/28/19 Bermuda (EUR) (0%) 150,000 Fidelity International Ltd., 6.88%, 2/24/17 Brazil (USD) (0%) 270,000 Brazilian Government International Bond, 4.88%, 1/22/21 Canada (CAD) (2%) 1,000,000 Canadian Government Bond, 3.75%, 6/01/19 58 Payden Mutual Funds Value (000) $ Principal or Shares 316 376 692 252 283 260 198 383 181 1,557 144 76 220 110 156 308 574 300,000 100,000 Canadian Government Bond, 5.00%, 6/01/37 Canadian Government Bond, 5.75%, 6/01/29 Canada (USD) (1%) 550,000 Magna International Inc., 4.15%, 10/01/25 Chile (USD) (0%) 300,000 Latam Airlines 2015-1 Pass Through Trust A 144A, 4.20%, 11/15/27 (a) Denmark (EUR) (1%) 200,000 Carlsberg Breweries A/S, 2.63%, 11/15/22 235,000 Danske Bank A/S, 3.88%, 10/04/23 Dominica Republic (USD) (0%) 200,000 Dominican Republic International Bond 144A, 5.50%, 1/27/25 (a) Finland (EUR) (0%) 70,000 Finland Government Bond 144A, 2.75%, 7/04/28 (a)(b) France (CAD) (0%) 330,000 Cie de Financement Foncier SA, 4.55%, 4/28/17 France (EUR) (3%) 200,000 BPCE SA, 2.75%, 7/08/26 1,600,000 France Government Bond OAT, 1.75%, 5/25/23 120,000 France Government Bond OAT, 3.25%, 5/25/45 France (GBP) (1%) 100,000 AXA SA, 5.63%, 1/16/54 100,000 Cie de St-Gobain, 4.63%, 10/09/29 178 266 848 Value (000) Security Description France (USD) (1%) 320,000 Banque Federative du Credit Mutuel SA 144A, 2.75%, 10/15/20 (a) Germany (EUR) (3%) 500,000 Bundesrepublik Deutschland, 2.50%, 1/04/21 $ 335 111 1,294 561 286 235 276 511 198 93 264 223 1,928 177 2,328 151 165 316 320 623 . Principal or Shares 100,000 350,000 350,000 Value (000) Security Description Bundesrepublik Deutschland, 3.25%, 7/04/42 Bundesrepublik Deutschland, 4.75%, 7/04/34 Bundesrepublik Deutschland, 4.75%, 7/04/40 Germany (USD) (1%) 710,000 Deutsche Bank AG, 2.95%, 8/20/20 Indonesia (USD) (0%) 200,000 Indonesia Government International Bond 144A, 4.13%, 1/15/25 (a) Ireland (EUR) (1%) 190,000 Aquarius and Investments PLC for Zurich Insurance Co. Ltd., 4.25%, 10/02/43 50,000 GE Capital European Funding, 2.25%, 7/20/20 100,000 Ireland Government Bond, 3.40%, 3/18/24 Ireland (GBP) (0%) 130,000 GE Capital UK Funding, 4.38%, 7/31/19 Ireland (USD) (0%) 250,000 Perrigo Finance PLC, 3.50%, 12/15/21 Italy (EUR) (3%) 850,000 Italy Buoni Poliennali Del Tesoro, 4.50%, 8/01/18 700,000 Italy Buoni Poliennali Del Tesoro, 4.50%, 5/01/23 220,000 Italy Buoni Poliennali Del Tesoro, 5.00%, 8/01/39 Jamaica (USD) (0%) 200,000 Jamaica Government International Bond, 6.75%, 4/28/28 Japan (GBP) (0%) 120,000 Sumitomo Mitsui Banking Corp., 1.14%, 3/18/16 Japan (JPY) (18%) 200,000,000 Japan Government Five Year Bond, 0.10%, 6/20/19 180,000,000 Japan Government Five Year Bond, 0.10%, 9/20/19 325,000,000 Japan Government Ten Year Bond, 0.80%, 9/20/23 160,000,000 Japan Government Ten Year Bond, 1.20%, 6/20/21 95,500,000 Japan Government Thirty Year Bond, 2.00%, 9/20/40 125,000,000 Japan Government Thirty Year Bond, 2.20%, 9/20/39 120,000,000 Japan Government Twenty Year Bond, 1.00%, 3/20/23 50,000,000 Japan Government Twenty Year Bond, 1.70%, 9/20/33 400,000,000 Japan Government Two Year Bond, 0.10%, 10/15/17 Japan (USD) (0%) 200,000 Mitsubishi UFJ Trust & Banking Corp. 144A, 1.60%, 10/16/17 (a) $ 162 628 680 2,093 713 196 229 59 132 420 216 245 1,046 952 353 2,351 204 185 1,663 1,496 Principal or Shares Security Description Kenya (USD) (0%) 200,000 Kenya Government International Bond 144A, 5.88%, 6/24/19 (a) Luxembourg (EUR) (0%) 100,000 KBC Internationale Financieringsmaatschappij NV, 2.13%, 9/10/18 130,000 Prologis International Funding II SA, 2.88%, 4/04/22 Luxembourg (USD) (0%) 100,000 Actavis Funding SCS, 3.80%, 3/15/25 Mexico (MXN) (1%) 5,500,000 Mexican Bonos, 6.50%, 6/10/21 Mexico (USD) (0%) 295,000 Petroleos Mexicanos, 3.50%, 1/30/23 Morocco (USD) (0%) 200,000 Morocco Government International Bond 144A, 4.25%, 12/11/22 (a) Netherlands (EUR) (1%) 200,000 Achmea Bank NV, 1.13%, 4/25/22 680,000 Netherlands Government Bond 144A, 2.25%, 7/15/22 (a) Netherlands (USD) (1%) 260,000 Cooperatieve Centrale Raiffeisen-Boerenleenbank BA/Netherlands, 4.63%, 12/01/23 200,000 EDP Finance BV 144A, 6.00%, 2/02/18 (a) 380,000 ING Bank NV 144A, 2.05%, 8/17/18 (a) Panama (USD) (0%) 200,000 Panama Government International Bond, 3.75%, 3/16/25 Poland (PLN) (0%) 500,000 Poland Government Bond, 5.25%, 10/25/20 Spain (EUR) (2%) 180,000 Spain Government Bond, 2.75%, 4/30/19 140,000 Spain Government Bond 144A, 4.20%, 1/31/37 (a) 500,000 Spain Government Bond 144A, 5.85%, 1/31/22 (a) 2,831 1,411 917 1,244 1,060 468 3,321 14,411 Sweden (EUR) (0%) 200,000 SBAB Bank AB, 2.38%, 9/04/20 Switzerland (USD) (1%) 625,000 UBS Group Funding Jersey Ltd. 144A, 2.95%, 9/24/20 (a) United Kingdom (EUR) (1%) 200,000 Aviva PLC, 3.88%, 7/03/44 230,000 Leeds Building Society, 1.38%, 5/05/22 200,000 Yorkshire Building Society, 1.25%, 3/17/22 United Kingdom (GBP) (5%) 110,000 Aviva PLC, 6.13%, 11/14/36 75,000 Barclays Bank PLC, 6.75%, 1/16/23 120,000 BUPA Finance PLC, 5.00%, 4/25/23 Value (000) $ 195 115 152 267 99 352 275 202 214 848 1,062 272 213 382 867 198 149 214 195 711 1,120 234 626 224 248 216 688 178 124 189 199 Annual Report 59 .
Payden Global Fixed Income Fund continued Principal or Shares 110,000 100,000 150,000 150,000 150,000 260,000 50,000 200,000 300,000 150,000 150,000 Value (000) Security Description HSBC Bank PLC, 5.38%, 11/04/30 InterContinental Hotels Group PLC, 6.00%, 12/09/16 Nationwide Building Society, 2.25%, 4/29/22 Society of Lloyd’s, 4.75%, 10/30/24 United Kingdom Gilt, 2.25%, 9/07/23 United Kingdom Gilt, 4.25%, 12/07/55 United Kingdom Gilt, 4.25%, 12/07/55 United Kingdom Gilt, 4.75%, 3/07/20 United Kingdom Gilt, 4.75%, 12/07/38 United Kingdom Gilt, 5.00%, 3/07/25 Virgin Money PLC, 2.25%, 4/21/20 United Kingdom (USD) (2%) 350,000 Barclays PLC, 2.88%, 6/08/20 950,000 Imperial Tobacco Finance PLC 144A, 2.95%, 7/21/20 (a) 300,000 Lloyds Bank PLC, 1.75%, 5/14/18 100,000 Nationwide Building Society 144A, 6.25%, 2/25/20 (a) United States (EUR) (2%) 660,000 Apple Inc., 1.38%, 1/17/24 350,000 Eli Lilly & Co., 1.63%, 6/02/26 100,000 Morgan Stanley, 5.38%, 8/10/20 United States (GBP) (0%) 110,000 Textron Inc., 6.63%, 4/07/20 United States (USD) (31%) 225,000 21st Century Fox America Inc., 4.50%, 2/15/21 140,000 AbbVie Inc., 2.50%, 5/14/20 140,000 AbbVie Inc., 3.20%, 11/06/22 150,000 Air Lease Corp., 4.25%, 9/15/24 160,000 Airgas Inc., 3.05%, 8/01/20 300,000 Amazon.com Inc., 2.50%, 11/29/22 300,000 Amgen Inc., 2.70%, 5/01/22 300,000 Amgen Inc., 3.63%, 5/15/22 450,000 AT&T Inc., 3.00%, 6/30/22 120,000 Bank of America Corp., 4.00%, 4/01/24 130,000 Bank of America Corp., 6.88%, 4/25/18 155,000 Baxalta Inc. 144A, 3.60%, 6/23/22 (a) 210,000 Bear Stearns Companies LLC, 5.55%, 1/22/17 100,000 BioMed Realty LP, 3.85%, 4/15/16 515,000 Block Financial LLC, 4.13%, 10/01/20 140,000 Blue Cross & Blue Shield of Minnesota 144A, 3.79%, 5/01/25 (a) 135,000 Boston Scientific Corp., 2.85%, 5/15/20 300,000 Capital One Financial Corp., 4.75%, 7/15/21 300,000 Celgene Corp., 3.25%, 8/15/22 30,000 Celgene Corp., 3.55%, 8/15/22 600,000 Citigroup Inc., 4.45%, 9/29/27 95,000 Continental Resources Inc./OK, 5.00%, 9/15/22 460,000 CVS Health Corp., 2.80%, 7/20/20 90,000 Dignity Health, 3.13%, 11/01/22 300,000 Discover Bank/Greenwood DE, 3.10%, 6/04/20 152,000 Dow Chemical Co., 9.40%, 5/15/39 250,000 Exelon Generation Co. LLC, 2.95%, 1/15/20 60 Payden Mutual Funds $ Principal or Shares 181 200,000 161 226 234 240 577 111 356 639 295 226 3,737 420,000 200,000 160,000 110,000 50,000 300,000 351 200,000 335,000 280,000 956 301 300,000 44,162 950,000 16,983 116 1,724 736 387 132 1,255 191 244 139 139 148 162 293 295 308 442 124 145 157 220 101 524 139 135 329 300 31 601 86 468 90 304 223 251 320,000 110,000 450,000 250,000 260,000 450,000 75,000 145,000 115,000 45,000 55,000 200,000 300,000 100,000 170,000 50,000 150,000 130,000 75,000 63,000 200,000 160,000 110,000 152,000 125,000 300,000 110,000 105,000 150,000 110,000 Value (000) Security Description Fifth Third Bank/Cincinnati OH, 2.15%, 8/20/18 FNMA 30YR TBA, 4.50% (c) Ford Motor Credit Co. LLC, 2.24%, 6/15/18 Ford Motor Credit Co.
LLC, 6.63%, 8/15/17 FS Investment Corp., 4.25%, 1/15/20 General Electric Capital Corp., 5.88%, 1/14/38 General Motors Financial Co. Inc., 3.20%, 7/13/20 Goldman Sachs Group Inc., 2.55%, 10/23/19 GreenPoint Mortgage Funding Trust, 0.76%, 6/25/45 Hewlett Packard Enterprise Co. 144A, 4.40%, 10/15/22 (a) Hospitality Properties Trust, 4.50%, 3/15/25 HSBC USA Inc., 2.00%, 8/07/18 Hyundai Capital America 144A, 2.60%, 3/19/20 (a) Indymac Index Mortgage Loan Trust, 2.77%, 10/25/34 JPMorgan Chase & Co., 3.20%, 1/25/23 JPMorgan Chase & Co., 4.35%, 8/15/21 KeyCorp, 2.90%, 9/15/20 Kinder Morgan Inc./DE, 4.30%, 6/01/25 KKR Group Finance Co.
II LLC 144A, 5.50%, 2/01/43 (a) Kraft Heinz Foods Co. 144A, 2.80%, 7/02/20 (a) Lam Research Corp., 3.80%, 3/15/25 McKesson Corp., 3.80%, 3/15/24 MDC Holdings Inc., 6.00%, 1/15/43 MetLife Inc., 6.40%, 12/15/36 MetLife Inc., 10.75%, 8/01/39 Metropolitan Edison Co. 144A, 3.50%, 3/15/23 (a) Morgan Stanley, 3.88%, 4/29/24 Murphy Oil Corp., 2.50%, 12/01/17 Nationwide Mutual Insurance Co.
144A, 9.38%, 8/15/39 (a) NBCUniversal Media LLC, 6.40%, 4/30/40 Old Republic International Corp., 4.88%, 10/01/24 Oracle Corp., 2.50%, 5/15/22 Owens Corning, 4.20%, 12/15/22 Pacific Life Insurance Co. 144A, 9.25%, 6/15/39 (a) Penske Truck Leasing Co. LP / PTL Finance Corp.
144A, 3.20%, 7/15/20 (a) Penske Truck Leasing Co. LP / PTL Finance Corp. 144A, 3.38%, 2/01/22 (a) Prudential Financial Inc., 5.63%, 6/15/43 Prudential Financial Inc., 7.38%, 6/15/19 Quest Diagnostics Inc., 3.50%, 3/30/25 Ryder System Inc., 2.50%, 5/11/20 Santander Holdings USA Inc./PA, 2.65%, 4/17/20 Select Income REIT, 4.50%, 2/01/25 Sempra Energy, 9.80%, 2/15/19 State Street Corp., 4.96%, 3/15/18 $ 202 455 199 172 111 62 298 302 24 959 195 336 276 17 319 118 454 227 270 452 70 148 94 49 87 197 309 98 259 64 156 129 76 93 201 156 115 179 121 296 109 100 184 117 .
Principal or Shares 200,000 175,000 450,000 280,000 1,250,000 100,000 226,000 1,850,000 350,000 1,450,000 450,000 1,000,000 300,000 210,000 170,000 80,000 300,000 215,000 Synchrony Financial, 4.25%, 8/15/24 TIAA Asset Management Finance Co. LLC 144A, 2.95%, 11/01/19 (a) U.S. Treasury Bill, 0.00%, 11/05/15 (d) U.S. Treasury Bond, 4.38%, 2/15/38 U.S.
Treasury Note, 0.38%, 1/15/16 (e) U.S. Treasury Note, 0.75%, 3/31/18 U.S. Treasury Note, 0.88%, 1/31/17 (e) U.S.
Treasury Note, 0.88%, 2/28/17 U.S. Treasury Note, 1.25%, 4/30/19 U.S. Treasury Note, 1.50%, 5/31/20 U.S.
Treasury Note, 2.00%, 8/15/25 U.S. Treasury Note, 3.00%, 5/15/42 UnitedHealth Group Inc., 1.90%, 7/16/18 Vereit Operating Partnership LP, 3.00%, 2/06/19 Verizon Communications Inc., 6.40%, 2/15/38 Wachovia Corp., 5.50%, 8/01/35 Wells Fargo & Co., 4.48%, 1/16/24 Welltower, Inc., 4.95%, 1/15/21 $ 201 177 450 358 1,251 100 227 1,858 350 1,453 444 1,020 304 204 199 90 317 233 24,489 Uruguay (USD) (0%) 160,000 Uruguay Government International Bond, 4.38%, 10/27/27 110,000 Uruguay Government International Bond, 4.50%, 8/14/24 Total Bonds (Cost - $69,696) Investment Company (15%) 2,815,027 Payden Cash Reserves Money Market Fund * 316,916 Payden Emerging Markets Bond Fund, SI Class * 99,500 Payden Floating Rate Fund, SI Class * 651,672 Payden High Income Fund, Investor Class * Total Investment Company (Cost - $13,232) Total (Cost - $82,928) (101%) Liabilities in excess of Other Assets (-1%) Net Assets (100%) Open Forward Currency Contracts to USD Value (000) Security Description Delivery Date Assets: 2/1/2016 12/15/2015 12/1/2015 12/1/2015 Credit Suisse First Boston International Citibank, N.A. British Pound (Buy 1,556) British Pound (Sell 293) 11/9/2015 Euro (Sell 5,670) 11/9/2015 Japanese Yen (Sell 1,785,600) Poland Zloty (Sell 587) Swiss Franc (Sell 215) 11/27/2015 11/9/2015 Liabilities: 11/9/2015 12/1/2015 * Affiliated investment (a) Security offered only to qualified institutional investors, and thus is not registered for sale to the public under rule 144A of the Securities Act of 1933. It has been deemed liquid under guidelines approved by the Board. (b) Security offered and sold outside the United States, and thus is exempt from registration under Regulation S of the Securities Act of 1933. It has been deemed liquid under guidelines approved by the Board. (c) Security was purchased on a delayed delivery basis. (d) Yield to maturity at time of purchase. (e) All or a portion of the security is pledged to cover futures contract margin requirements. Australian Dollar (Sell 6,573) 12/15/2015 11/9/2015 11/9/2015 115 274 68,895 $ Counterparty Canadian Dollar (Buy 293) Euro (Sell 3,127) Euro (Sell 4,467) Euro (Sell 5,321) 159 2,815 4,142 985 4,171 12,113 81,008 (715) 80,293 Currency (000s) 2/1/2016 Australian Dollar (Sell 1,401) Australian Dollar (Buy 423) Australian Dollar (Buy 3,228) 11/9/2015 British Pound (Sell 2,828) 11/9/2015 Canadian Dollar (Sell 2,376) Chinese Yuan (Sell 11,565) Euro (Sell 1,243) Euro (Buy 3,227) 2/24/2016 12/15/2015 12/1/2015 12/1/2015 11/19/2015 11/24/2015 11/24/2015 11/24/2015 12/1/2015 1/27/2016 Japanese Yen (Buy 46,600) Mexican Peso (Sell 5,810) New Taiwan Dollar (Sell 25,960) South Korean Won (Buy 1,181,000) South Korean Won (Sell 1,181,000) Swiss Franc (Buy 215) Thailand Baht (Sell 56,320) HSBC Bank USA, N.A. Royal Bank of Canada BNP PARIBAS Citibank, N.A. Royal Bank of Canada State Street Bank & Trust Co. Barclays Bank PLC Unrealized Appreciation (Depreciation) (000s) $ 84 7 6 4 43 76 99 104 48 Barclays Bank PLC BNP PARIBAS 3 3 $ 477 BNP PARIBAS $ (8) BNP PARIBAS (1) Credit Suisse First Boston International HSBC Bank USA, N.A. Royal Bank of Canada Barclays Bank PLC (5) BNP PARIBAS Royal Bank of Canada Barclays Bank PLC Credit Suisse First Boston International HSBC Bank USA, N.A. BNP PARIBAS (79) (5) (51) (6) (156) (5) (8) (5) (7) BNP PARIBAS (43) BNP PARIBAS Barclays Bank PLC (11) (5) $(395) Annual Report 61 .
Payden Global Fixed Income Fund continued Open Futures Contracts Number of Contracts 61 23 74 2 3 7 25 2 34 17 35 10 Contract Type 90-Day Sterling Future Australian 10 Year Bond Future Australian 3 Year Bond Future Canadian 10 Year Bond Future Euro-Bobl Future Euro-Bund Future Euro-Schatz Future U.S. Long Bond Future U.S. Treasury 10 Year Note Future U.S. Treasury 2 Year Note Future U.S.
Treasury 5 Year Note Future U.S. Ultra Bond Future Expiration Date Jun-16 Current Value (000) $(11,668) Unrealized Appreciation (Depreciation) (000s) $(20) Dec-15 (2,122) — Dec-15 5,926 8 Dec-15 215 (2) Dec-15 Dec-15 Dec-15 Dec-15 Dec-15 427 1,210 3,065 (313) (4,341) 4 21 6 6 43 Jan-16 3,717 (13) Jan-16 (4,192) (1) Dec-15 1,598 (17) $ 35 See notes to financial statements. 62 Payden Mutual Funds . Payden Emerging Markets Bond Fund The Fund seeks a high level of total return by generally investing in below investment grade debt instruments and income producing securities of emerging market countries denominated in U.S. and foreign currencies with no limit on the average portfolio maturity. $30,000 Portfolio Composition - percent of value $15,000 Foreign Government Corporate Cash equivalent One Year -2.65% $25,000 Five Year 3.84% Ten Year 6.58% Investor Class $18,911 J.P. Morgan EMBI Global Diversified Index $20,306 $20,000 67% 30% 3% $10,000 $5,000 10/31/05 10/10 10/31/15 Past performance does not predict future returns. The graph does not reflect the impact of taxes or transaction costs a shareholder would pay.
The Fund’s Adviser and SI Classes are expected to perform similarly to its Investor Class. This information is not part of the audited financial statements. Schedule of Investments - October 31, 2015 Principal or Shares Security Description Bonds (97%) Argentina (USD) (2%) 13,522,500 Argentine Republic Government International Bond, 2.50%, 12/31/38 (a)(b) 10,725,591 Argentine Republic Government International Bond, 8.28%, 12/31/33 (a)(b) 2,760,000 Argentine Republic Government International Bond, 8.75%, 6/02/17 (a)(b) Armenia (USD) (2%) 12,456,000 Republic of Armenia 144A, 6.00%, 9/30/20 (c) 5,550,000 Republic of Armenia 144A, 7.15%, 3/26/25 (c) Australia (USD) (1%) 8,995,000 CNOOC Curtis Funding No. 1 Pty. Ltd.
144A, 4.50%, 10/03/23 (c) Azerbaijan (USD) (1%) 4,445,000 International Bank of Azerbaijan OJSC, 5.63%, 6/11/19 11,175,000 State Oil Co. of the Azerbaijan Republic, 4.75%, 3/13/23 Bermuda (USD) (0%) 1,035,000 Digicel Group Ltd. 144A, 7.13%, 4/01/22 (c) 2,330,000 Digicel Group Ltd.
144A, 8.25%, 9/30/20 (c) Brazil (USD) (2%) 2,340,000 Banco Nacional de Desenvolvimento Economico e Social 144A, 4.00%, 4/14/19 (c) 2,870,000 Banco Nacional de Desenvolvimento Economico e Social 144A, 5.75%, 9/26/23 (c) 1,535,000 Banco Nacional de Desenvolvimento Economico e Social 144A, 6.50%, 6/10/19 (c) 2,920,000 Brazilian Government International Bond, 2.63%, 1/05/23 3,760,000 Brazilian Government International Bond, 4.25%, 1/07/25 Value (000) Principal or Shares 1,090,000 $ 8,607 4,880,000 Value (000) Security Description Brazilian Government International Bond, 4.88%, 1/22/21 USJ Acucar e Alcool SA 144A, 9.88%, 11/09/19 (c) $ 1,952 15,078 11,959 3,029 23,595 12,368 5,522 17,890 9,433 4,123 9,697 13,820 859 2,074 2,933 2,198 2,554 1,543 2,419 1,075 Canada (USD) (0%) 200,000 CNOOC Nexen Finance 2014 ULC, 4.25%, 4/30/24 Cayman Islands (USD) (1%) 665,000 Agricola Senior Trust 144A, 6.75%, 6/18/20 (c) 3,430,000 Baidu Inc., 4.13%, 6/30/25 3,772,000 Odebrecht Drilling Norbe VIII/IX Ltd. 144A, 6.35%, 6/30/21 (c) Chile (USD) (2%) 1,735,000 Corp Nacional del Cobre de Chile 144A, 3.00%, 7/17/22 (c) 2,480,000 Corp. Nacional del Cobre de Chile 144A, 3.88%, 11/03/21 (c) 4,190,000 Corp.
Nacional del Cobre de Chile 144A, 4.50%, 9/16/25 (c) 1,665,000 Corp. Nacional del Cobre de Chile 144A, 4.88%, 11/04/44 (c) 7,210,000 Latam Airlines 2015-1 Pass Through Trust A 144A, 4.20%, 11/15/27 (c) China (USD) (1%) 4,750,000 Bank of China Ltd. 144A, 5.00%, 11/13/24 (c) 1,710,000 Industrial & Commercial Bank of China Ltd./New York, 3.23%, 11/13/19 Colombia (USD) (2%) 5,360,000 Colombia Government International Bond, 4.00%, 2/26/24 206 663 3,456 1,886 6,005 1,642 2,513 4,167 1,493 6,867 16,682 4,923 1,749 6,672 5,274 3,337 Annual Report 63 .
Payden Emerging Markets Bond Fund continued Principal or Shares 1,250,000 2,060,000 4,270,000 3,765,000 Value (000) Security Description Colombia Government International Bond, 5.00%, 6/15/45 Colombia Government International Bond, 5.63%, 2/26/44 Colombia Government International Bond, 6.13%, 1/18/41 Colombia Government International Bond, 7.38%, 9/18/37 Costa Rica (USD) (2%) 4,770,000 Banco de Costa Rica 144A, 5.25%, 8/12/18 (c) 4,710,000 Banco Nacional de Costa Rica 144A, 4.88%, 11/01/18 (c) 2,160,000 Costa Rica Government International Bond 144A, 7.16%, 3/12/45 (c) 6,375,000 Republic of Costa Rica 144A, 7.00%, 4/04/44 (c) Croatia (USD) (2%) 2,550,000 Croatia Government International Bond 144A, 6.00%, 1/26/24 (c) 3,625,000 Croatia Government International Bond, 6.38%, 3/24/21 (d) 2,685,000 Croatia Government International Bond 144A, 6.38%, 3/24/21 (c) 9,470,000 Croatia Government International Bond, 6.75%, 11/05/19 (d) Dominica Republic (USD) (4%) 1,600,000 Aeropuertos Dominicanos Siglo XXI SA 144A, 9.75%, 11/13/19 (c) 8,230,000 Dominican Republic International Bond 144A, 5.50%, 1/27/25 (c) 2,985,000 Dominican Republic International Bond 144A, 6.60%, 1/28/24 (c) 3,450,000 Dominican Republic International Bond 144A, 6.85%, 1/27/45 (c) 11,965,000 Dominican Republic International Bond 144A, 7.45%, 4/30/44 (c) 9,855,000 Dominican Republic International Bond 144A, 7.50%, 5/06/21 (c) El Salvador (USD) (1%) 4,615,000 Republic of El Salvador 144A, 5.88%, 1/30/25 (c) 1,980,000 Republic of El Salvador 144A, 6.38%, 1/18/27 (c) 2,265,000 Republic of El Salvador 144A, 7.38%, 12/01/19 (c) Georgia (USD) (2%) 4,120,000 Bank of Georgia JSC 144A, 7.75%, 7/05/17 (c) 8,385,000 Georgian Railway JSC 144A, 7.75%, 7/11/22 (c) 8,920,000 Republic of Georgia 144A, 6.88%, 4/12/21 (c) Ghana (USD) (3%) 4,480,000 Ghana Government International Bond 144A, 10.75%, 10/14/30 (c) 64 Payden Mutual Funds $ 1,116 Principal or Shares 5,640,000 9,430,000 6,465,000 Republic of Ghana 144A, 7.88%, 8/07/23 (c) Republic of Ghana 144A, 8.13%, 1/18/26 (c) Republic of Ghana, 8.50%, 10/04/17 (d) 2,003 4,409 4,386 17,188 4,860 Guatemala (USD) (0%) 4,160,000 Guatemala Government Bond 144A, 5.75%, 6/06/22 (c) Honduras (USD) (2%) 6,340,000 Honduras Government International Bond 144A, 7.50%, 3/15/24 (c) 8,485,000 Republic of Honduras 144A, 8.75%, 12/16/20 (c) 4,745 1,958 5,761 17,324 2,709 3,911 2,896 10,318 19,834 1,610 8,168 3,186 3,459 12,683 10,742 39,848 4,119 Hungary (USD) (3%) 3,120,000 Hungary Government International Bond, 5.38%, 3/25/24 5,480,000 Magyar Export-Import Bank Zrt 144A, 4.00%, 1/30/20 (c) 2,495,000 MFB Magyar Fejlesztesi Bank Zrt 144A, 6.25%, 10/21/20 (c) 6,120,000 Republic of Hungary, 4.13%, 2/19/18 6,330,000 Republic of Hungary, 6.25%, 1/29/20 India (USD) (1%) 4,015,000 Export-Import Bank of India, 4.00%, 1/14/23 1,971,000 IDBI Bank Ltd./DIFC Dubai, 4.13%, 4/23/20 Indonesia (USD) (5%) 7,695,000 Indonesia Government International Bond 144A, 4.13%, 1/15/25 (c) 3,660,000 Indonesia Government International Bond 144A, 5.38%, 10/17/23 (c) 3,790,000 Indonesia Government International Bond 144A, 5.88%, 1/15/24 (c) 4,975,000 Indonesia Government International Bond 144A, 8.50%, 10/12/35 (c) 2,770,000 Indonesia Government International Bond, 8.50%, 10/12/35 (d) 720,000 Pelabuhan Indonesia III PT 144A, 4.88%, 10/01/24 (c) 4,905,000 Pertamina Persero PT 144A, 5.25%, 5/23/21 (c) 10,630,000 Pertamina Persero PT 144A, 6.00%, 5/03/42 (c) 4,970,000 Perusahaan Gas Negara Persero Tbk PT 144A, 5.13%, 5/16/24 (c) 2,300,000 Republic of Indonesia 144A, 5.25%, 1/17/42 (c) 1,777 2,336 8,232 4,299 8,802 9,560 22,661 4,759 Value (000) Security Description Ivory Coast (USD) (2%) 11,710,000 Ivory Coast Government International Bond 144A, 5.75%, 12/31/32 (c) 4,700,000 Ivory Coast Government International Bond 144A, 6.38%, 3/03/28 (c) Jamaica (USD) (2%) 7,970,000 Jamaica Government International Bond, 6.75%, 4/28/28 $ 4,866 8,054 6,538 24,217 4,430 6,736 9,514 16,250 3,455 5,591 2,791 6,419 7,159 25,415 4,104 1,991 6,095 7,532 3,936 4,199 6,530 3,636 700 5,042 9,270 4,941 2,196 47,982 10,466 4,353 14,819 8,129 . Principal or Shares 4,215,000 3,340,000 Value (000) Security Description Jamaica Government International Bond, 7.63%, 7/09/25 Jamaica Government International Bond, 7.88%, 7/28/45 Kazakhstan (USD) (3%) 10,230,000 Development Bank of Kazakhstan JSC 144A, 4.13%, 12/10/22 (c) 4,110,000 KazAgro National Management Holding JSC 144A, 4.63%, 5/24/23 (c) 3,710,000 Kazakhstan Government International Bond 144A, 4.88%, 10/14/44 (c) 2,170,000 Kazakhstan Government International Bond 144A, 6.50%, 7/21/45 (c) 1,050,000 KazMunayGas National Co. JSC 144A, 5.75%, 4/30/43 (c) 3,310,000 KazMunayGas National Co. JSC 144A, 6.00%, 11/07/44 (c) 4,860,000 KazMunayGas National Co. JSC 144A, 6.38%, 4/09/21 (c) Kenya (USD) (1%) 13,946,000 Kenya Government International Bond 144A, 5.88%, 6/24/19 (c) Lithuania (USD) (0%) 1,930,000 Lithuania Government International Bond 144A, 6.13%, 3/09/21 (c) Luxembourg (USD) (0%) 2,485,000 BC Luxco 1 SA 144A, 7.38%, 1/29/20 (c) 2,040,000 Millicom International Cellular SA 144A, 6.63%, 10/15/21 (c) Malaysia (USD) (1%) 4,790,000 Petronas Capital Ltd.
144A, 3.13%, 3/18/22 (c) 2,220,000 Petronas Capital Ltd. 144A, 3.50%, 3/18/25 (c) 2,205,000 Petronas Capital Ltd. 144A, 4.50%, 3/18/45 (c) Mexico (MXN) (1%) 32,700,000 Grupo Televisa SAB, 7.25%, 5/14/43 71,600,000 Red de Carreteras de Occidente SAPIB de CV 144A, 9.00%, 6/10/28 (c) Mexico (USD) (5%) 2,275,000 Comision Federal de Electricidad 144A, 4.88%, 1/15/24 (c) 1,845,000 Comision Federal de Electricidad 144A, 5.75%, 2/14/42 (c) 7,355,000 Comision Federal de Electricidad 144A, 6.13%, 6/16/45 (c) 1,782,150 Fermaca Enterprises S de RL de CV 144A, 6.38%, 3/30/38 (c) 2,280,000 Mexichem SAB de CV 144A, 5.88%, 9/17/44 (c) 3,530,000 Mexico Government International Bond, 4.00%, 10/02/23 9,865,000 Mexico Government International Bond, 4.60%, 1/23/46 Principal or Shares 443,000 $ 4,616 1,715,000 3,382 16,127 4,670,000 2,520,000 10,110,000 Value (000) Security Description Mexico Government International Bond, 5.55%, 1/21/45 Mexico Government International Bond, 6.05%, 1/11/40 Petroleos Mexicanos, 4.88%, 1/24/22 Petroleos Mexicanos, 6.38%, 1/23/45 Petroleos Mexicanos, 6.63%, 6/15/35 $ 1,944 4,774 2,400 9,996 47,434 8,996 3,363 3,071 Mongolia (USD) (0%) 1,460,000 Republic of Mongolia 144A, 5.13%, 12/05/22 (c) Morocco (USD) (1%) 1,890,000 BMCE Bank, 6.25%, 11/27/18 7,150,000 OCP SA 144A, 5.63%, 4/25/24 (c) 2,126 813 2,606 4,927 25,902 13,575 2,264 2,355 1,795 4,150 4,705 2,153 2,104 8,962 1,698 4,279 5,977 2,338 1,741 7,153 1,729 2,049 3,652 9,187 471 Netherlands (USD) (2%) 8,560,000 Kazakhstan Temir Zholy Finance BV 144A, 6.38%, 10/06/20 (c) 2,350,000 Kazakhstan Temir Zholy Finance BV 144A, 6.95%, 7/10/42 (c) 1,640,000 Majapahit Holding BV 144A, 7.75%, 1/20/20 (c) 700,000 Majapahit Holding BV 144A, 8.00%, 8/07/19 (c) 2,890,000 VimpelCom Holdings BV 144A, 7.50%, 3/01/22 (c) 2,600,000 VTR Finance BV 144A, 6.88%, 1/15/24 (c) Nigeria (USD) (1%) 3,515,000 Nigeria Government International Bond 144A, 6.75%, 1/28/21 (c) 2,550,000 Zenith Bank PLC 144A, 6.25%, 4/22/19 (c) Pakistan (USD) (1%) 5,540,000 Pakistan Government International Bond 144A, 7.25%, 4/15/19 (c) 1,665,000 Pakistan Government International Bond 144A, 8.25%, 4/15/24 (c) 4,900,000 Pakistan Government International Bond 144A, 8.25%, 9/30/25 (c) Panama (USD) (4%) 2,980,000 Avianca Holdings SA / Avianca Leasing LLC / Grupo Taca Holdings Ltd.
144A, 8.38%, 5/10/20 (c) 4,105,000 Panama Government International Bond, 3.75%, 3/16/25 550,000 Panama Government International Bond, 4.00%, 9/22/24 4,180,000 Republic of Panama, 5.20%, 1/30/20 14,840,000 Republic of Panama, 6.70%, 1/26/36 3,135,000 Republic of Panama, 9.38%, 4/01/29 Paraguay (USD) (1%) 790,000 Republic of Paraguay 144A, 4.63%, 1/25/23 (c) 7,550,000 Republic of Paraguay 144A, 6.10%, 8/11/44 (c) 1,228 1,963 7,488 9,451 8,418 1,951 1,855 791 3,054 2,522 18,591 3,481 2,357 5,838 5,777 1,787 5,247 12,811 2,451 4,074 558 4,588 18,439 4,628 34,738 802 7,701 8,503 Annual Report 65 . Payden Emerging Markets Bond Fund continued Principal or Shares Security Description Peru (USD) (2%) 2,920,000 Abengoa Transmision Sur SA 144A, 6.88%, 4/30/43 (c) 5,160,000 Peruvian Government International Bond, 5.63%, 11/18/50 4,280,000 Peruvian Government International Bond, 7.35%, 7/21/25 7,035,000 Republic of Peru, 6.55%, 3/14/37 Philippines (USD) (3%) 3,515,000 Power Sector Assets & Liabilities Management Corp. 144A, 7.39%, 12/02/24 (c) 2,610,000 Republic of Philippines, 4.20%, 1/21/24 7,765,000 Republic of Philippines, 6.38%, 10/23/34 4,993,000 Republic of Philippines, 7.75%, 1/14/31 Poland (USD) (1%) 2,230,000 Poland Government International Bond, 4.00%, 1/22/24 4,685,000 Republic of Poland, 3.00%, 3/17/23 Romania (USD) (3%) 9,240,000 Romanian Government International Bond 144A, 4.38%, 8/22/23 (c) 8,940,000 Romanian Government International Bond 144A, 4.88%, 1/22/24 (c) 3,620,000 Romanian Government International Bond 144A, 6.13%, 1/22/44 (c) 8,240,000 Romanian Government International Bond 144A, 6.75%, 2/07/22 (c) Russian Federation (USD) (1%) 2,000,000 Russian Foreign Bond - Eurobond 144A, 3.50%, 1/16/19 (c) 5,700,000 Russian Foreign Bond - Eurobond 144A, 4.88%, 9/16/23 (c) 3,300,000 Russian Foreign Bond - Eurobond 144A, 5.00%, 4/29/20 (c) Senegal (USD) (2%) 11,675,000 Republic of Senegal 144A, 6.25%, 7/30/24 (c) 7,550,000 Republic of Senegal 144A, 8.75%, 5/13/21 (c) Serbia (USD) (1%) 5,560,000 Republic of Serbia 144A, 5.25%, 11/21/17 (c) 6,550,000 Republic of Serbia 144A, 5.88%, 12/03/18 (c) Singapore (INR) (0%) 70,000,000 Standard Chartered Bank/Singapore, 7.28%, 6/05/19 South Africa (USD) (1%) 8,190,000 Eskom Holdings SOC Ltd. 144A, 5.75%, 1/26/21 (c) 4,080,000 South Africa Government International Bond, 5.88%, 5/30/22 Sri Lanka (USD) (4%) 2,570,000 Bank of Ceylon 144A, 6.88%, 5/03/17 (c) 66 Payden Mutual Funds Value (000) $ 3,033 Principal or Shares 4,630,000 12,270,000 4,430,000 5,586 2,565,000 5,532 8,530 22,681 4,270,000 5,230,000 4,605 2,905 10,445 7,235 25,190 2,380 4,741 7,121 9,741 9,743 4,293 9,843 33,620 2,022 5,903 3,476 11,401 10,905 8,165 19,070 5,808 6,971 12,779 1,068 National Savings Bank 144A, 8.88%, 9/18/18 (c) Republic of Sri Lanka 144A, 5.88%, 7/25/22 (c) Sri Lanka Government International Bond 144A, 5.13%, 4/11/19 (c) Sri Lanka Government International Bond 144A, 6.00%, 1/14/19 (c) Sri Lanka Government International Bond 144A, 6.25%, 7/27/21 (c) Sri Lanka Government International Bond 144A, 6.85%, 11/03/25 (c) Sweden (USD) (0%) 4,150,000 Eileme 2 AB 144A, 11.63%, 1/31/20 (c) Tanzania (USD) (1%) 14,055,000 United Republic of Tanzania, 6.54%, 3/09/20 (d) Tunisia (USD) (1%) 12,055,000 Banque Centrale de Tunisie SA 144A, 5.75%, 1/30/25 (c) Turkey (USD) (3%) 7,540,000 Export Credit Bank of Turkey 144A, 5.00%, 9/23/21 (c) 2,120,000 Export Credit Bank of Turkey 144A, 5.88%, 4/24/19 (c) 2,700,000 Republic of Turkey, 4.88%, 4/16/43 4,570,000 Republic of Turkey, 6.88%, 3/17/36 4,610,000 Republic of Turkey, 7.38%, 2/05/25 3,700,000 Republic of Turkey, 8.00%, 2/14/34 4,570,000 Turkiye Vakiflar Bankasi Tao 144A, 5.00%, 10/31/18 (c) Ukraine (USD) (1%) 5,645,000 Ukraine Government International Bond 144A, 7.50%, 4/17/23 (c) 3,600,000 Ukraine Government International Bond 144A, 7.75%, 9/23/20 (c) 5,830,000 Ukraine Government International Bond 144A, 7.80%, 11/28/22 (c) United Kingdom (INR) (2%) 295,000,000 Standard Chartered Bank/Singapore 144A, 7.16%, 5/23/23 (c) 81,000,000 Standard Chartered Bank/Singapore, 7.16%, 5/23/23 250,000,000 Standard Chartered Bank/Singapore 144A, 7.28%, 6/05/19 (c) 234,000,000 Standard Chartered Bank/Singapore, 7.28%, 6/05/19 50,000,000 Standard Chartered Bank/Singapore, 8.83%, 11/29/23 43,000,000 Standard Chartered Bank/Singapore, 9.34%, 8/27/24 7,630 4,493 12,123 2,644 Value (000) Security Description United States (USD) (0%) 3,500,000 Cemex Finance LLC 144A, 9.38%, 10/12/22 (c) Uruguay (USD) (3%) 13,835,525 Uruguay Government International Bond, 4.38%, 10/27/27 $ 4,960 11,846 4,364 2,585 4,257 5,223 35,879 4,503 13,756 11,354 7,548 2,227 2,437 5,270 5,524 4,746 4,653 32,405 4,502 2,844 4,606 11,952 4,373 1,201 3,812 3,569 810 701 14,466 3,824 13,801 . Principal or Shares 8,264,000 6,749,580 Uruguay Government International Bond, 4.50%, 8/14/24 Uruguay Government International Bond, 5.10%, 6/18/50 $ 8,615 6,075 28,491 Venezuela (USD) (2%) 14,560,000 Petroleos de Venezuela SA, 5.38%, 4/12/27 6,620,000 Petroleos de Venezuela SA 144A, 6.00%, 11/15/26 (c) 5,540,000 Petroleos de Venezuela SA, 9.00%, 11/17/21 (d) 8,550,000 Republic of Venezuela, 6.00%, 12/09/20 (d) 2,640,000 Republic of Venezuela, 7.00%, 3/31/38 (d) 6,584,000 Republic of Venezuela, 7.65%, 4/21/25 (d) 5,096 2,356 2,315 3,270 997 2,518 16,552 Delivery Date Assets: 11/19/2015 11/27/2015 10,631 2,259 12,890 Virgin Islands (British) (USD) (0%) 935,000 State Grid Overseas Investment 2013 Ltd. 144A, 4.38%, 5/22/43 (c) Zambia (USD) (1%) 1,190,000 Republic of Zambia 144A, 5.38%, 9/20/22 (c) 9,025,000 Zambia Government International Bond 144A, 8.50%, 4/14/24 (c) 6,330,000 Zambia Government International Bond 144A, 8.97%, 7/30/27 (c) Currency (000s) Counterparty Mexican Peso (Sell 101,010) Credit Suisse First Boston International BNP PARIBAS South African Rand (Sell 65,250) Unrealized Appreciation (Depreciation) (000s) $ 1/21/2016 11/13/2015 11/13/2015 Chinese Yuan (Sell 63,442) Colombian Peso (Sell 21,885,000) Euro (Sell 4,425) India Rupee (Sell 384,430) South Korean Won (Sell 5,862,000) Turkish Lira (Sell 14,751) 14 256 $ Liabilities: 2/24/2016 1/28/2016 11/17/2015 Vietnam (USD) (1%) 10,775,000 Vietnam Government International Bond 144A, 4.80%, 11/19/24 (c) 2,030,000 Vietnam Government International Bond 144A, 6.75%, 1/29/20 (c) Total Bonds (Cost - $976,008) Investment Company (3%) 29,165,065 Payden Cash Reserves Money Market Fund * (Cost - $29,165) Total (Cost - $1,005,173) (100%) Liabilities in excess of Other Assets (0%) Net Assets (100%) Open Forward Currency Contracts to USD Value (000) Security Description 270 Barclays Bank PLC $ (280) HSBC Bank USA, N.A. BNP PARIBAS Barclays Bank PLC (306) Barclays Bank PLC (194) Barclays Bank PLC (242) $(1,269) (21) (226) 946 888 7,658 5,349 13,895 938,126 $ 29,165 967,291 (3,182) 964,109 * Affiliated investment (a) Issuer filed for bankruptcy and/or is in default of principal and/or interest payments. (b) Non-income producing security. (c) Security offered only to qualified institutional investors, and thus is not registered for sale to the public under rule 144A of the Securities Act of 1933. It has been deemed liquid under guidelines approved by the Board. (d) Security offered and sold outside the United States, and thus is exempt from registration under Regulation S of the Securities Act of 1933. It has been deemed liquid under guidelines approved by the Board. See notes to financial statements. Annual Report 67 . Payden Emerging Markets Local Bond Fund $14,000 The Fund seeks a high level of total return by generally investing in below investment grade debt instruments and income producing securities of emerging market countries denominated in foreign and U.S. currencies. Three Year -8.59% Since 11/2/11 -4.79% Fund $8,217 J.P. Morgan GBI-EM Global Diversified Index Unhedged $8,580 $12,000 $11,000 Portfolio Composition - percent of value Foreign Government Corporate Cash equivalent One Year -17.16% $13,000 $10,000 78% 16% 6% $9,000 $8,000 $7,000 11/2/11 10/13 10/31/15 Past performance does not predict future returns. The graph does not reflect the impact of taxes or transaction costs a shareholder would pay. The Fund’s Adviser Class is expected to perform similarly to its Investor Class. This information is not part of the audited financial statements. Schedule of Investments - October 31, 2015 Principal or Shares Security Description Bonds (94%) Brazil (BRL) (9%) 21,119,000 Brazil Notas do Tesouro Nacional, 10.00%, 1/01/17 3,802,000 Brazil Notas do Tesouro Nacional, 10.00%, 1/01/21 3,994,000 Brazil Notas do Tesouro Nacional, 10.00%, 1/01/23 8,935,000 Brazil Notas do Tesouro Nacional, 10.00%, 1/01/25 2,000,000 Brazil Notas do Tesouro Nacional Serie F, 10.00%, 1/01/18 7,410,000 Brazil Notas do Tesouro Nacional Serie F, 10.00%, 1/01/19 2,250,000 BRF SA 144A, 7.75%, 5/22/18 (a) Chile (CLP) (0%) 129,000,000 Republic of Chile, 5.50%, 8/05/20 Colombia (COP) (6%) 540,000,000 Colombia Government International Bond, 7.75%, 4/14/21 1,235,000,000 Colombian TES, 5.00%, 11/21/18 6,545,000,000 Colombian TES, 7.00%, 5/04/22 6,189,000,000 Colombian TES, 10.00%, 7/24/24 900,000,000 Emgesa SA ESP 144A, 8.75%, 1/25/21 (a) 1,380,000,000 Empresa de Telecomunicaciones de Bogota 144A, 7.00%, 1/17/23 (a) 1,245,000,000 Empresas Publicas de Medellin ESP 144A, 7.63%, 9/10/24 (a) 1,036,000,000 Empresas Publicas de Medellin ESP 144A, 8.38%, 2/01/21 (a) 1,585,000,000 Financiera de Desarrollo Territorial SA Findeter 144A, 7.88%, 8/12/24 (a) Costa Rica (CRC) (0%) 218,400,000 Republic of Costa Rica 144A, 9.20%, 3/27/19 (a) 68 Payden Mutual Funds Value (000) $ 5,191 799 Principal or Shares Security Description Germany (IDR) (3%) 31,000,000,000 Deutsche Bank AG/London 144A, 5.63%, 5/17/23 (a) 9,000,000,000 Deutsche Bank AG/London 144A, 7.00%, 5/17/22 (a) 24,700,000,000 Deutsche Bank AG/London 144A, 8.25%, 6/17/32 (a) 795 1,703 487 1,727 487 11,189 194 191 410 2,220 2,433 316 Hungary (HUF) (5%) 100,000,000 Hungary Government Bond, 3.50%, 6/24/20 452,300,000 Hungary Government Bond, 4.00%, 4/25/18 302,000,000 Hungary Government Bond, 5.50%, 6/24/25 300,000,000 Hungary Government Bond, 6.50%, 6/24/19 518,810,000 Hungary Government Bond, 7.00%, 6/24/22 Indonesia (IDR) (1%) 10,000,000,000 Indonesia Treasury Bond, 8.38%, 9/15/26 Malaysia (MYR) (8%) 7,775,000 Malaysia Government Bond, 3.31%, 10/31/17 1,250,000 Malaysia Government Bond, 3.42%, 8/15/22 5,120,000 Malaysia Government Bond, 3.89%, 3/15/27 11,700,000 Malaysia Government Bond, 4.01%, 9/15/17 10,060,000 Malaysia Government Bond, 4.16%, 7/15/21 2,250,000 Malaysia Government Bond, 4.38%, 11/29/19 4,380,000 Malaysia Government Bond, 4.39%, 4/15/26 2,560,000 Malaysia Government Bond, 4.50%, 4/15/30 421 388 358 502 7,239 428 Mexico (MXN) (10%) 15,000,000 America Movil SAB de CV, 6.00%, 6/09/19 72,300 America Movil SAB de CV, 6.45%, 12/05/22 10,700,000 Comision Federal de Electricidad, 7.35%, 11/25/25 7,270,000 Grupo Televisa SAB, 7.25%, 5/14/43 40,000,000 Mexican Bonos, 5.00%, 12/11/19 35,000,000 Mexican Bonos, 6.50%, 6/09/22 10,700,000 Mexican Bonos, 7.75%, 5/29/31 5,200,000 Mexican Bonos, 7.75%, 11/13/42 14,640,000 Mexican Bonos, 8.50%, 5/31/29 Value (000) $ 1,859 596 1,649 4,104 371 1,691 1,256 1,216 2,259 6,793 701 1,821 280 1,141 2,780 2,362 537 1,031 604 10,556 917 427 636 377 2,417 2,222 730 354 1,059 .
Principal or Shares 4,999,000 12,243,100 16,240,000 9,900,000 Value (000) Security Description Mexican Bonos, 8.50%, 11/18/38 Mexican Bonos, 10.00%, 12/05/24 Petroleos Mexicanos 144A, 7.65%, 11/24/21 (a) Red de Carreteras de Occidente SAPIB de CV 144A, 9.00%, 6/10/28 (a) Nigeria (NGN) (1%) 174,000,000 Nigeria Government International Bond 144A, 13.05%, 8/16/16 (a) 69,000,000 Nigeria Government International Bond 144A, 16.00%, 6/29/19 (a) Peru (PEN) (2%) 1,730,000 Republic of Peru 144A, 5.70%, 8/12/24 (a) 500,000 Republic of Peru 144A, 6.90%, 8/12/37 (a) 2,930,000 Republic of Peru 144A, 6.95%, 8/12/31 (a) 1,420,000 Republic of Peru 144A, 8.20%, 8/12/26 (a) Philippines (PHP) (0%) 17,000,000 Republic of Philippines, 6.25%, 1/14/36 Poland (PLN) (10%) 4,200,000 Poland Government Bond, 1.50%, 4/25/20 15,000,000 Poland Government Bond, 3.25%, 7/25/19 5,075,000 Poland Government Bond, 3.25%, 7/25/25 830,000 Poland Government Bond, 3.75%, 4/25/18 6,542,000 Poland Government Bond, 4.00%, 10/25/23 13,000,000 Poland Government Bond, 5.25%, 10/25/20 Romania (RON) (3%) 2,150,000 Romania Government Bond, 5.60%, 11/28/18 3,500,000 Romania Government Bond, 5.85%, 4/26/23 6,330,000 Romania Government Bond, 5.95%, 6/11/21 Russian Federation (RUB) (5%) 123,000,000 Russian Federal Bond - OFZ, 7.00%, 1/25/23 5,700,000 Russian Federal Bond - OFZ, 7.40%, 4/19/17 74,130,000 Russian Federal Bond - OFZ, 7.50%, 2/27/19 176,920,000 Russian Federal Bond - OFZ, 7.60%, 4/14/21 57,000,000 Russian Federal Bond - OFZ, 8.15%, 2/03/27 Singapore (INR) (0%) 13,000,000 Standard Chartered Bank/Singapore, 7.28%, 6/05/19 South Africa (ZAR) (9%) 56,900,000 Republic of South Africa, 6.25%, 3/31/36 27,035,019 Republic of South Africa, 6.50%, 2/28/41 54,420,000 Republic of South Africa, 6.75%, 3/31/21 9,850,000 Republic of South Africa, 7.00%, 2/28/31 22,845,000 South Africa Government Bond, 8.00%, 1/31/30 11,200,000 Transnet SOC Ltd. 144A, 9.50%, 5/13/21 (a) Thailand (THB) (7%) 460,000 Thailand Government Bond, 3.25%, 6/16/17 27,700,000 Thailand Government Bond, 3.45%, 3/08/19 56,500,000 Thailand Government Bond, 3.63%, 6/16/23 67,470,000 Thailand Government Bond, 3.65%, 12/17/21 116,710,000 Thailand Government Bond, 3.88%, 6/13/19 $ Principal or Shares 367 951 993 592 12,042 890 377 1,267 488 144 861 468 1,961 35,800,000 Value (000) Security Description Thailand Government Bond, 4.88%, 6/22/29 $ Turkey (TRY) (8%) 1,065,000 Turkey Government Bond, 6.30%, 2/14/18 225,000 Turkey Government Bond, 7.40%, 2/05/20 1,190,000 Turkey Government Bond, 8.20%, 11/16/16 8,000,000 Turkey Government Bond, 8.50%, 9/14/22 1,092,824 Turkey Government Bond, 8.80%, 11/14/18 6,725,000 Turkey Government Bond, 9.00%, 3/08/17 3,070,000 Turkey Government Bond, 9.00%, 7/24/24 5,350,000 Turkey Government Bond, 9.50%, 1/12/22 2,420,000 Turkey Government Bond, 10.40%, 3/20/24 330,000 Turkey Government Bond, 10.70%, 2/24/16 340 71 402 2,573 365 2,282 1,010 1,814 864 114 9,835 United Kingdom (IDR) (1%) 5,800,000,000 Standard Chartered Bank/Singapore 144A, 8.38%, 3/19/24 (a) 14,000,000,000 Standard Chartered Bank/Singapore 144A, 8.38%, 9/17/26 (a) 415 981 1,396 406 1,063 4,073 1,380 225 1,869 3,866 12,476 597 1,026 1,839 3,462 1,656 86 1,085 2,515 796 6,138 198 3,082 1,468 3,744 605 1,554 774 11,227 13 818 1,697 2,027 3,508 1,239 9,302 United Kingdom (INR) (3%) 60,000,000 Standard Chartered Bank/Singapore 144A, 7.16%, 5/23/23 (a) 24,000,000 Standard Chartered Bank/Singapore, 7.16%, 5/23/23 75,000,000 Standard Chartered Bank/Singapore 144A, 7.28%, 6/05/19 (a) 51,000,000 Standard Chartered Bank/Singapore 144A, 8.83%, 11/29/23 (a) 38,000,000 Standard Chartered Bank/Singapore, 8.83%, 11/29/23 13,000,000 Standard Chartered Bank/Singapore, 9.34%, 8/27/24 889 356 1,144 826 616 212 4,043 United States (IDR) (3%) 5,500,000,000 JPMorgan Chase Bank, N.A., 8.38%, 3/19/24 49,194,000,000 JPMorgan Chase Bank, N.A. 144A, 9.50%, 7/17/31 (a) Total Bonds (Cost - $144,778) Investment Company (6%) 2,300,967 Payden Cash Reserves Money Market Fund * 478,709 Payden Emerging Markets Corporate Bond Fund, SI Class * Total Investment Company (Cost - $7,201) Total (Cost - $151,979) (100%) Other Assets, net of Liabilities (0%) Net Assets (100%) 393 3,667 4,060 119,017 2,301 $ 4,610 6,911 125,928 211 126,139 * Affiliated investment (a) Security offered only to qualified institutional investors, and thus is not registered for sale to the public under rule 144A of the Securities Act of 1933. It has been deemed liquid under guidelines approved by the Board. Annual Report 69 . Payden Emerging Markets Local Bond Fund continued Open Forward Currency Contracts to USD Delivery Date Assets: 11/24/2015 Liabilities: 11/16/2015 2/24/2016 1/21/2016 1/28/2016 11/17/2015 11/23/2015 11/13/2015 1/27/2016 Unrealized Appreciation (Depreciation) (000s) Currency (000s) Counterparty New Taiwan Dollar (Sell 40,150) Barclays Bank PLC $ Chinese Yuan (Sell 8,946) Chinese Yuan (Sell 7,685) Colombian Peso (Sell 3,559,000) Euro (Sell 1,742) India Rupee (Sell 40,940) Nuevo Sol (Buy 1,012) South Korean Won (Sell 816,000) Thailand Baht (Sell 48,130) Barclays Bank PLC Barclays Bank PLC HSBC Bank USA, N.A. BNP PARIBAS Barclays Bank PLC Barclays Bank PLC Barclays Bank PLC $ (47) (34) (53) Barclays Bank PLC (5) 6 (8) (24) (5) (27) $(203) See notes to financial statements. 70 Payden Mutual Funds . Payden Emerging Markets Corporate Bond Fund $12,000 The Fund seeks a high level of total return by generally investing in below investment grade corporate debt instruments and income producing securities of emerging market countries denominated in U.S. and foreign currencies with no limit on the average portfolio maturity. One Year -1.55% JPM Corporate EMBI $10,911 $11,000 Portfolio Composition - percent of value Corporate Foreign Government Cash equivalent Fund $10,663 Since 11/11/13 3.31% $10,000 91% 7% 2% $9,000 11/11/2013 10/14 10/31/15 Past performance does not predict future returns. The graph does not reflect the impact of taxes or transaction costs a shareholder would pay. The Fund’s Adviser and SI Classes are expected to perform similarly to its Investor Class. This information is not part of the audited financial statements. Schedule of Investments - October 31, 2015 Principal or Shares Security Description Bonds (96%) Argentina (USD) (1%) 230,000 YPF SA 144A, 8.50%, 7/28/25 (a) Australia (USD) (1%) 240,000 Australia & New Zealand Banking Group Ltd. 144A, 4.50%, 3/19/24 (a) Azerbaijan (USD) (1%) 200,000 International Bank of Azerbaijan OJSC, 5.63%, 6/11/19 200,000 Republic of Azerbaijan International Bond 144A, 4.75%, 3/18/24 (a) Bermuda (USD) (3%) 220,000 Digicel Group Ltd.
144A, 7.13%, 4/01/22 (a) 520,000 Digicel Group Ltd. 144A, 8.25%, 9/30/20 (a) 210,000 Digicel Ltd. 144A, 6.00%, 4/15/21 (a) 200,000 GCX Ltd.
144A, 7.00%, 8/01/19 (a) Brazil (USD) (2%) 280,000 Caixa Economica Federal 144A, 2.38%, 11/06/17 (a) 620,000 USJ Acucar e Alcool SA 144A, 9.88%, 11/09/19 (a) 215,000 Vale Overseas Ltd., 6.88%, 11/21/36 Canada (USD) (2%) 420,000 CNOOC Nexen Finance 2014 ULC, 4.25%, 4/30/24 185,000 First Quantum Minerals Ltd. 144A, 6.75%, 2/15/20 (a) 195,000 Pacific Rubiales Energy Corp. 144A, 7.25%, 12/12/21 (a) Cayman Islands (USD) (7%) 200,000 ADCB Finance Cayman Ltd., 3.13%, 5/28/23 Value (000) Principal or Shares 250,000 $ 227 205,000 242 400,000 350,000 186 192 378 182 463 190 196 1,031 264 248 176 688 432 142 81 655 201 225,000 235,000 352,600 200,000 250,000 Value (000) Security Description AES Andres Dominicana Ltd./Itabo Dominicana Ltd.
144A, 9.50%, 11/12/20 (a) Alibaba Group Holding Ltd. 144A, 4.50%, 11/28/34 (a) Hutchison Whampoa International 11 Ltd. 144A, 4.63%, 1/13/22 (a) Hutchison Whampoa International 12 Ltd. 144A, 6.00%, 5/29/49 (a) Industrial Senior Trust 144A, 5.50%, 11/01/22 (a) MAF Global Securities Ltd., 4.75%, 5/07/24 (b) Odebrecht Drilling Norbe VIII / IX Ltd. 144A, 6.35%, 6/30/21 (a) Tencent Holdings Ltd.
144A, 3.38%, 5/02/19 (a) Tencent Holdings Ltd. 144A, 3.80%, 2/11/25 (a) Chile (USD) (6%) 270,000 Colbun SA 144A, 6.00%, 1/21/20 (a) 360,000 Corpbanca SA, 3.13%, 1/15/18 220,000 Empresa Electrica Angamos SA 144A, 4.88%, 5/25/29 (a) 340,000 Empresa Nacional del Petroleo 144A, 4.38%, 10/30/24 (a) 270,000 Latam Airlines 2015-1 Pass Through Trust A 144A, 4.20%, 11/15/27 (a) 250,000 Latam Airlines 2015-1 Pass Through Trust B 144A, 4.50%, 11/15/23 (a) 300,000 Telefonica Chile SA 144A, 3.88%, 10/12/22 (a) China (USD) (1%) 230,000 Bank of China Ltd. 144A, 5.00%, 11/13/24 (a) 250,000 Industrial & Commercial Bank of China Ltd./New York, 3.23%, 11/13/19 Colombia (USD) (0%) 180,000 Ecopetrol SA, 5.38%, 6/26/26 $ 253 197 433 367 206 242 176 204 249 2,528 301 362 207 342 257 233 301 2,003 238 256 494 168 Annual Report 71 .
Payden Emerging Markets Corporate Bond Fund continued Principal or Shares Security Description Costa Rica (USD) (2%) 400,000 Banco de Costa Rica 144A, 5.25%, 8/12/18 (a) 200,000 Costa Rica Government International Bond 144A, 7.16%, 3/12/45 (a) Dominica Republic (USD) (1%) 210,000 Aeropuertos Dominicanos Siglo XXI SA 144A, 9.75%, 11/13/19 (a) Georgia (USD) (1%) 250,000 Bank of Georgia JSC 144A, 7.75%, 7/05/17 (a) Ghana (USD) (0%) 230,000 Republic of Ghana 144A, 7.88%, 8/07/23 (a) Guernsey (USD) (1%) 230,000 Credit Suisse Group Funding Guernsey Ltd. 144A, 2.75%, 3/26/20 (a) Hong Kong (USD) (2%) 250,000 AIA Group Ltd. 144A, 3.20%, 3/11/25 (a) 275,000 CLP Power Hong Kong Financing Ltd., 3.13%, 5/06/25 265,000 Swire Properties MTN Financing Ltd., 4.38%, 6/18/22 India (USD) (4%) 200,000 Adani Ports & Special Economic Zone Ltd. 144A, 3.50%, 7/29/20 (a) 200,000 Export-Import Bank of India, 4.00%, 1/14/23 200,000 IDBI Bank Ltd./DIFC Dubai, 4.13%, 4/23/20 260,000 IDBI Bank Ltd./DIFC Dubai 144A, 4.70%, 2/21/18 (a) 260,000 Reliance Industries Ltd. 144A, 4.88%, 2/10/45 (a) 260,000 State Bank of India/London 144A, 4.13%, 8/01/17 (a) Indonesia (USD) (3%) 520,000 Bank Rakyat Indonesia Persero Tbk PT, 2.95%, 3/28/18 200,000 Pelabuhan Indonesia III PT 144A, 4.88%, 10/01/24 (a) 200,000 Pertamina Persero PT 144A, 5.25%, 5/23/21 (a) 260,000 Perusahaan Gas Negara Persero Tbk PT 144A, 5.13%, 5/16/24 (a) Israel (USD) (3%) 200,000 Delek & Avner Tamar Bond Ltd.
144A, 5.41%, 12/30/25 (a) 445,000 Israel Electric Corp. Ltd., 2.11%, 1/17/18 350,000 Israel Electric Corp. Ltd.
144A, 7.25%, 1/15/19 (a) Jamaica (USD) (1%) 200,000 Jamaica Government International Bond, 6.75%, 4/28/28 Kazakhstan (USD) (0%) 180,000 KazMunayGas National Co. JSC 144A, 9.13%, 7/02/18 (a) 72 Payden Mutual Funds Value (000) $ 408 181 589 211 261 Principal or Shares Security Description Kenya (USD) (0%) 200,000 Kenya Government International Bond 144A, 5.88%, 6/24/19 (a) Luxembourg (USD) (4%) 200,000 Altice Financing SA 144A, 7.88%, 12/15/19 (a) 240,000 Altice SA 144A, 7.75%, 5/15/22 (a) 260,000 Atento Luxco 1 SA 144A, 7.38%, 1/29/20 (a) 400,000 Gazprom OAO Via Gaz Capital SA 144A, 3.85%, 2/06/20 (a) 425,000 Millicom International Cellular SA 144A, 6.63%, 10/15/21 (a) 198 229 242 266 284 792 199 205 202 273 242 269 1,390 520 195 206 258 1,179 204 443 395 1,042 204 199 Marshall Islands (USD) (1%) 200,000 Nakilat Inc. 144A, 6.07%, 12/31/33 (a) Mexico (MXN) (1%) 3,410,000 Red de Carreteras de Occidente SAPIB de CV 144A, 9.00%, 6/10/28 (a) Mexico (USD) (7%) 375,000 America Movil SAB de CV, 3.13%, 7/16/22 100,000 BBVA Bancomer SA/Grand Cayman 144A, 6.01%, 5/17/22 (a) 375,000 Cemex SAB de CV 144A, 6.13%, 5/05/25 (a) 240,000 Elementia SAB de CV 144A, 5.50%, 1/15/25 (a) 244,801 Fermaca Enterprises S de RL de CV 144A, 6.38%, 3/30/38 (a) 180,000 Grupo Bimbo SAB de CV 144A, 4.50%, 1/25/22 (a) 230,000 Grupo Cementos de Chihuahua SAB de CV 144A, 8.13%, 2/08/20 (a) 200,000 Mexichem SAB de CV 144A, 4.88%, 9/19/22 (a) 200,000 Mexichem SAB de CV 144A, 5.88%, 9/17/44 (a) 246,030 Mexico Generadora de Energia S de rl 144A, 5.50%, 12/06/32 (a) 200,000 Mexico Government International Bond, 3.63%, 3/15/22 Morocco (USD) (2%) 200,000 BMCE Bank, 6.25%, 11/27/18 240,000 OCP SA 144A, 4.50%, 10/22/25 (a) 460,000 OCP SA 144A, 5.63%, 4/25/24 (a) Netherlands (USD) (7%) 540,000 Bharti Airtel International Netherlands BV 144A, 5.13%, 3/11/23 (a) 200,000 GTB Finance BV 144A, 6.00%, 11/08/18 (a) 200,000 Listrindo Capital BV 144A, 6.95%, 2/21/19 (a) 415,000 Lukoil International Finance BV 144A, 6.13%, 11/09/20 (a) 200,000 Majapahit Holding BV 144A, 8.00%, 8/07/19 (a) 535,000 Petrobras Global Finance BV, 3.88%, 1/27/16 210,000 VimpelCom Holdings BV 144A, 7.50%, 3/01/22 (a) 325,000 VTR Finance BV 144A, 6.88%, 1/15/24 (a) Value (000) $ 195 209 232 246 380 374 1,441 233 204 372 102 356 236 237 188 242 210 180 236 205 2,564 208 231 481 920 574 190 208 431 226 534 222 315 2,700 .
Principal or Shares Security Description Panama (USD) (0%) 220,000 Avianca Holdings SA / Avianca Leasing LLC / Grupo Taca Holdings Ltd. 144A, 8.38%, 5/10/20 (a) Paraguay (USD) (1%) 385,000 Banco Regional SAECA 144A, 8.13%, 1/24/19 (a) Peru (USD) (1%) 200,000 Abengoa Transmision Sur SA 144A, 6.88%, 4/30/43 (a) 180,000 Scotiabank Peru SA 144A, 4.50%, 12/13/27 (a) Philippines (USD) (1%) 200,000 International Container Terminal Services Inc., 7.38%, 3/17/20 Qatar (USD) (1%) 250,000 Ras Laffan Liquefied Natural Gas Co. Ltd. III 144A, 5.84%, 9/30/27 (a) Senegal (USD) (1%) 200,000 Republic of Senegal 144A, 8.75%, 5/13/21 (a) Singapore (USD) (5%) 360,000 BOC Aviation Pte Ltd., 4.38%, 5/02/23 350,000 DBS Bank Ltd., 3.63%, 9/21/22 (b) 320,000 Flextronics International Ltd., 4.63%, 2/15/20 355,000 Oversea-Chinese Banking Corp.
Ltd. 144A, 3.15%, 3/11/23 (a) 250,000 TBG Global Pte Ltd. 144A, 4.63%, 4/03/18 (a) South Korea (USD) (4%) 260,000 Korea Development Bank, 3.00%, 3/17/19 350,000 Korea Gas Corp.
144A, 2.88%, 7/29/18 (a) 440,000 Korea Hydro & Nuclear Power Co. Ltd. 144A, 2.88%, 10/02/18 (a) 210,000 SK Telecom Co.
Ltd. 144A, 2.13%, 5/01/18 (a) Spain (USD) (1%) 200,000 Banco Bilbao Vizcaya Argentaria SA, 9.00%, 5/29/49 Sri Lanka (USD) (1%) 200,000 National Savings Bank 144A, 8.88%, 9/18/18 (a) 200,000 Sri Lanka Government International Bond 144A, 5.13%, 4/11/19 (a) Sweden (USD) (2%) 220,000 Eileme 2 AB 144A, 11.63%, 1/31/20 (a) 480,000 PKO Finance AB 144A, 4.63%, 9/26/22 (a) Tanzania (USD) (0%) 200,000 Tanzania Government International Bond, 6.54%, 3/09/20 (b) Thailand (USD) (2%) 425,000 Bangkok Bank PCL/Hong Kong 144A, 4.80%, 10/18/20 (a) 250,000 Thai Oil PCL 144A, 3.63%, 1/23/23 (a) Turkey (USD) (3%) 330,000 Akbank TAS 144A, 4.00%, 1/24/20 (a) Value (000) Principal or Shares 550,000 $ 181 397 208 175 383 228 284 216 369 359 333 359 250 1,670 268 358 450 211 1,287 216 214 197 411 239 503 742 270,000 Value (000) Security Description Turkiye Garanti Bankasi AS 144A, 4.00%, 9/13/17 (a) Turkiye Vakiflar Bankasi Tao 144A, 5.00%, 10/31/18 (a) $ 558 275 1,157 United Arab Emirates (USD) (3%) 470,000 DP World Ltd. 144A, 6.85%, 7/02/37 (a) 270,000 First Gulf Bank PJSC, 3.25%, 1/14/19 200,000 Ruwais Power Co.
PJSC 144A, 6.00%, 8/31/36 (a) 499 278 224 1,001 United States (USD) (4%) 195,000 AT&T Inc., 4.75%, 5/15/46 180,000 Baxalta Inc. 144A, 4.00%, 6/23/25 (a) 270,000 Cemex Finance LLC 144A, 9.38%, 10/12/22 (a) 200,000 FS Investment Corp., 4.25%, 1/15/20 230,000 Goldman Sachs Group Inc., 2.60%, 4/23/20 255,000 Hyundai Capital America 144A, 2.40%, 10/30/18 (a) 230,000 Morgan Stanley, 5.55%, 12/29/49 180 182 295 202 231 255 230 1,575 Vietnam (USD) (1%) 200,000 Vietnam Government International Bond 144A, 4.80%, 11/19/24 (a) 100,000 Vietnam Government International Bond 144A, 6.75%, 1/29/20 (a) Virgin Islands (British) (USD) (1%) 450,000 Sinopec Group Overseas Development 2015 Ltd. 144A, 2.50%, 4/28/20 (a) Zambia (USD) (0%) 200,000 Zambia Government International Bond 144A, 8.97%, 7/30/27 (a) Total Bonds (Cost - $35,242) Investment Company (2%) 794,527 Payden Cash Reserves Money Market Fund * (Cost - $795) Total (Cost - $36,037) (98%) Other Assets, net of Liabilities (2%) Net Assets (100%) 198 111 309 444 169 34,542 $ 795 35,337 680 36,017 * Affiliated investment (a) Security offered only to qualified institutional investors, and thus is not registered for sale to the public under rule 144A of the Securities Act of 1933. It has been deemed liquid under guidelines approved by the Board. (b) Security offered and sold outside the United States, and thus is exempt from registration under Regulation S of the Securities Act of 1933. It has been deemed liquid under guidelines approved by the Board. 196 463 248 711 324 Annual Report 73 .
Payden Emerging Markets Corporate Bond Fund continued Open Forward Currency Contracts to USD Delivery Date Assets: 11/19/2015 11/27/2015 Currency (000s) Counterparty Mexican Peso (Sell 3,420) Credit Suisse First Boston International BNP PARIBAS South African Rand (Sell 1,220) Unrealized Appreciation (Depreciation) (000s) $— 5 $ 5 Liabilities: 2/24/2016 1/21/2016 1/28/2016 11/13/2015 11/13/2015 Chinese Yuan (Sell 1,155) Colombian Peso (Sell 544,000) Euro (Sell 166) South Korean Won (Sell 212,000) Turkish Lira (Sell 550) Barclays Bank PLC HSBC Bank USA, N.A. BNP PARIBAS Barclays Bank PLC $ (5) (8) Barclays Bank PLC (9) $(30) (1) (7) See notes to financial statements. 74 Payden Mutual Funds . Payden Equity Income Fund $25,000 The Fund seeks growth of capital by investing in U.S. large capitalization value stocks and income producing equity securities with above average dividend yields with up to 30% in foreign securities. One Year 2.90% $20,000 Portfolio Composition - percent of value Financial Consumer Staple Consumer Discretionary Technology Real Estate Investment Trust Other Five Year 14.26% Ten Year 6.35% Fund $18,522 Russell 1000 Value Index $19,216 $15,000 19% 15% 13% 10% 8% 35% $10,000 $5,000 10/31/05 10/10 10/31/15 Past performance does not predict future returns. The graph does not reflect the impact of taxes or transaction costs a shareholder would pay. The Fund’s Adviser and SI Classes are expected to perform similarly to its Investor Class. This information is not part of the audited financial statements. Schedule of Investments - October 31, 2015 Principal or Shares Security Description Stocks (99%) Common Stock (84%) 314,100 Altria Group Inc. 136,100 Ameren Corp. 178,200 Arthur J Gallagher & Co. 295,200 AT&T Inc. 96,300 Bank of Hawaii Corp. 93,500 Chevron Corp. 412,500 Cisco Systems Inc. 129,500 CME Group Inc. 166,200 Dow Chemical Co. 121,600 Duke Energy Corp. 102,200 Exxon Mobil Corp. 226,200 Federated Investors Inc. 468,800 General Electric Co. 193,100 General Mills Inc. 165,400 Hasbro Inc. 332,300 Intel Corp. 78,300 International Business Machines Corp. 57,600 Johnson & Johnson 249,100 JPMorgan Chase & Co. 93,500 Kimberly-Clark Corp. 172,800 Kinder Morgan Inc. 168,800 Kraft Heinz Co. 80,900 Lockheed Martin Corp. 293,300 Mattel Inc. 219,300 Maxim Integrated Products Inc. 120,300 McDonald’s Corp. 262,200 Merck & Co.
Inc. 155,000 MetLife Inc. 127,700 Microchip Technology Inc. 138,600 Microsoft Corp. (a) 240,800 Paychex Inc. 100,600 PepsiCo Inc. 448,200 Pfizer Inc. 67,300 Philip Morris International Inc. 71,500 Procter & Gamble Co. 97,400 Prudential Financial Inc. 134,800 Qualcomm Inc. Value (000) $ 18,994 5,945 7,793 9,892 6,306 8,497 11,901 12,234 8,588 8,691 8,456 6,951 13,558 11,221 12,708 11,252 10,968 5,819 16,005 11,193 4,726 13,161 17,784 7,209 8,987 13,504 14,332 7,809 6,167 7,296 12,420 10,280 15,158 5,949 5,461 8,035 8,010 Principal or Shares 555,100 173,201 108,200 245,100 137,200 185,300 242,800 176,900 295,100 145,200 Value (000) Security Description Regal Entertainment Group Reynolds American Inc. Seagate Technology PLC Six Flags Entertainment Corp. Southern Co. Target Corp. Verizon Communications Inc. Waste Management Inc. Wells Fargo & Co. Westar Energy Inc. Master Limited Partnership (2%) 360,300 Enterprise Products Partners LP 73,400 Magellan Midstream Partners LP Preferred Stock (5%) 115,200 Bank of America Corp., 6.50% 137,000 DDR Corp., 6.50% 95,900 Discover Financial Services, 6.50% 312,600 Goldman Sachs Group Inc., 5.50% 49,000 Public Storage, 5.875% 110,900 US Bancorp, 6.50% 192,600 Wells Fargo & Co., 6.00% Real Estate Investment Trust (8%) 86,000 Digital Realty Trust Inc. 148,300 Equity Residential 114,400 Prologis Inc. 56,400 Public Storage 47,600 Simon Property Group Inc. Total Stocks (Cost - $514,582) $ 10,758 8,369 4,118 12,755 6,188 14,301 11,382 9,510 15,977 5,764 472,382 9,955 4,684 14,639 3,053 3,578 2,560 7,916 1,277 3,214 5,000 26,598 6,361 11,467 4,888 12,941 9,589 45,246 558,865 Annual Report 75 . Payden Equity Income Fund continued Principal or Shares Investment Company (1%) 4,211,442 Payden Cash Reserves Money Market Fund * (Cost - $4,212) Total Investment Company (Cost - $4,212) Total (Cost - $518,794) (100%) Other Assets, net of Liabilities (0%) Net Assets (100%) * Value (000) Security Description $ $ (a) All or a portion of the security is pledged to cover futures contract margin requirements. 4,212 4,212 563,077 287 563,364 Affiliated investment See notes to financial statements. 76 Payden Mutual Funds . (THIS PAGE INTENTIONALLY LEFT BLANK) . Statements of Assets & Liabilities October 31, 2015 Numbers in 000s Payden Cash Reserves Money Market Fund Payden Limited Maturity Fund Payden Low Duration Fund $252,409 — 140,000 — 3,556 — $417,453 6,387 — 46 15 — $825,015 8,216 — 11 — — 6 — 3 — — — 51 26 396,051 936 16 120 — 128 — 32 27 425,160 3,070 — 76 3 173 150 — 50 836,764 — — 3,549 1 — — 2 — 187 1,718 32 — — 9 21 84 14,844 379 — 146 99 — 44 — 3 61 3,660 $392,391 — 53 — 3 162 2,164 $422,996 106 104 — 8 311 16,102 $820,662 $392,389 — 2 $430,829 (9) (4,205) $826,745 (98) (153) — — $392,391 (3,560) (59) $422,996 (5,917) 85 $820,662 — — — — — — — — — $392,391 392,383 $ 1.00 $422,996 44,892 $ 9.42 $820,662 81,675 $ 10.05 — — — — — — — — — $252,409 — 140,000 — — $421,013 6,387 — 46 — $830,940 8,216 — 11 (112) ASSETS: Investments, at value * . . . .
. . .
. . .
. . .
. . .
. . .
. . .
. . .
. . .
. . .
. . .
. . .
. . .
. . .
. . .
. . .
. . .
. . .
. . Affiliated investments, at value ** . .
. . .
. . .
. . .
. . .
. . .
. . .
. . .
. . .
. . .
. . .
. . .
. . .
. . .
. . .
. . .
. . Repurchase agreements, at value *** . .
. . .
. . .
. . .
. . .
. . .
. . .
. . .
. . .
. . .
. . .
. . .
. . .
. . .
. . .
. . . Foreign cash **** .
. . .
. . .
. . .
. . .
. . .
. . .
. . .
. . .
. . .
. . .
. . .
. . .
. . .
. . .
. . .
. . .
. . .
. . .
. . .
. . . Cash.
. . .
. . .
. . .
. . .
. . .
. . .
. . .
. . .
. . .
. . .
. . .
. . .
. . .
. . .
. . .
. . .
. . .
. . .
. . .
. . .
. . .
. . .
. . .
. . Cash pledged for financial futures contracts . .
. . .
. . .
. . .
. . .
. . .
. . .
. . .
. . .
. . .
. . .
. . .
. . .
. . .
. Receivable for: Interest and dividends . . .
. . .
. . .
. . .
. . .
. . .
. . .
. . .
. . .
. . .
. . .
. . .
. . .
. . .
. . .
. . .
. . .
. . .
. . Investments sold . .
. . .
. . .
. . .
. . .
. . .
. . .
. . .
. . .
. . .
. . .
. . .
. . .
. . .
. . .
. . .
. . .
. . .
. . .
. . .
. Fund shares sold. . .
. . .
. . .
. . .
. . .
. . .
. . .
. . .
. . .
. . .
. . .
. . .
. . .
. . .
. . .
. . .
. . .
. . .
. . .
. . .
. Futures . . .
. . .
. . .
. . .
. . .
. . .
. . .
. . .
. . .
. . .
. . .
. . .
. . .
. . .
. . .
. . .
. . .
. . .
. . .
. . .
. . .
. . .
. Forward currency contracts . . .
. . .
. . .
. . .
. . .
. . .
. . .
. . .
. . .
. . .
. . .
. . .
. . .
. . .
. . .
. . .
. . .
. Variation margin on centrally cleared swaps . . .
. . .
. . .
. . .
. . .
. . .
. . .
. . .
. . .
. . .
. . .
. . .
. . .
. Receivable from Advisor (Note 3) . . .
. . .
. . .
. . .
. . .
. . .
. . .
. . .
. . .
. . .
. . .
. . .
. . .
. . .
. . .
. . .
. Other assets . . .
. . .
. . .
. . .
. . .
. . .
. . .
. . .
. . .
. . .
. . .
. . .
. . .
. . .
. . .
. . .
. . .
. . .
. . .
. . .
. . .
. . . Total Assets .
. . .
. . .
. . .
. . .
. . .
. . .
. . .
. . .
. . .
. . .
. . .
. . .
. . .
. . .
. . .
. . .
. . .
. . .
. . .
. . LIABILITIES: Payable for: Bank overdraft . .
. . .
. . .
. . .
. . .
. . .
. . .
. . .
. . .
. . .
. . .
. . .
. . .
. . .
. . .
. . .
. . .
. . .
. . .
. . .
. . . Forward currency contracts .
. . .
. . .
. . .
. . .
. . .
. . .
. . .
. . .
. . .
. . .
. . .
. . .
. . .
. . .
. . .
. . .
. . . Investments purchased .
. . .
. . .
. . .
. . .
. . .
. . .
. . .
. . .
. . .
. . .
. . .
. . .
. . .
. . .
. . .
. . .
. . .
. . .
. Fund shares redeemed . . .
. . .
. . .
. . .
. . .
. . .
. . .
. . .
. . .
. . .
. . .
. . .
. . .
. . .
. . .
. . .
. . .
. . .
. . Futures . .
. . .
. . .
. . .
. . .
. . .
. . .
. . .
. . .
. . .
. . .
. . .
. . .
. . .
. . .
. . .
. . .
. . .
. . .
. . .
. . .
. . .
. . Swaps*****. .
. . .
. . .
. . .
. . .
. . .
. . .
. . .
. . .
. . .
. . .
. . .
. . .
. . .
. . .
. . .
. . .
. . .
. . .
. . .
. . .
. . Distributions payable. .
. . .
. . .
. . .
. . .
. . .
. . .
. . .
. . .
. . .
. . .
. . .
. . .
. . .
. . .
. . .
. . .
. . .
. . .
. . . Accrued expenses: Investment advisory fees (Note 3) .
. . .
. . .
. . .
. . .
. . .
. . .
. . .
. . .
. . .
. . .
. . .
. . .
. . .
. . .
. . .
. Administration fees (Note 3) . . .
. . .
. . .
. . .
. . .
. . .
. . .
. . .
. . .
. . .
. . .
. . .
. . .
. . .
. . .
. . .
. . . Distribution fees (Note 3) .
. . .
. . .
. . .
. . .
. . .
. . .
. . .
. . .
. . .
. . .
. . .
. . .
. . .
. . .
. . .
. . .
. . .
. Trustee fees and expenses . . .
. . .
. . .
. . .
. . .
. . .
. . .
. . .
. . .
. . .
. . .
. . .
. . .
. . .
. . .
. . .
. . .
. . . Other liabilities .
. . .
. . .
. . .
. . .
. . .
. . .
. . .
. . .
. . .
. . .
. . .
. . .
. . .
. . .
. . .
. . .
. . .
. . .
. . .
. . .
. . Total Liabilities . .
. . .
. . .
. . .
. . .
. . .
. . .
. . .
. . .
. . .
. . .
. . .
. . .
. . .
. . .
. . .
. . .
. . .
. . .
. NET ASSETS. . .
. . .
. . .
. . .
. . .
. . .
. . .
. . .
. . .
. . .
. . .
. . .
. . .
. . .
. . .
. . .
. . .
. . .
. . .
. . NET ASSETS: Paid in capital . .
. . .
. . .
. . .
. . .
. . .
. . .
. . .
. . .
. . .
. . .
. . .
. . .
. . .
. . .
. . .
. . .
. . .
. . .
. . .
. . .
. . Undistributed net investment income (loss) . .
. . .
. . .
. . .
. . .
. . .
. . .
. . .
. . .
. . .
. . .
. . .
. . .
. . .
. Undistributed net realized gains (losses) from investments . . .
. . .
. . .
. . .
. . .
. . .
. . .
. . .
. . .
. . .
. Net unrealized appreciation (depreciation) from: Investments . . .
. . .
. . .
. . .
. . .
. . .
. . .
. . .
. . .
. . .
. . .
. . .
. . .
. . .
. . .
. . .
. . .
. . .
. . .
. . .
. . .
. Translation of assets and liabilities in foreign currencies . . .
. . .
. . .
. . .
. . .
. . .
. . .
. . .
. . .
. . .
. NET ASSETS. . .
. . .
. . .
. . .
. . .
. . .
. . .
. . .
. . .
. . .
. . .
. . .
. . .
. . .
. . .
. . .
. . .
. . .
. . .
. . .
. . . NET ASSET VALUE — offering and redemption price per share in whole dollars Adviser Class Net Assets .
. . .
. . .
. . .
. . .
. . .
. . .
. . .
. . .
. . .
. . .
. . .
. . .
. . .
. . .
. . .
. . .
. . .
. . .
. . .
. . .
. . .
. Shares Outstanding . . .
. . .
. . .
. . .
. . .
. . .
. . .
. . .
. . .
. . .
. . .
. . .
. . .
. . .
. . .
. . .
. . .
. . .
. . .
. Net Asset Value Per Share . . .
. . .
. . .
. . .
. . .
. . .
. . .
. . .
. . .
. . .
. . .
. . .
. . .
. . .
. . .
. . .
. . .
. . Investor Class Net Assets . .
. . .
. . .
. . .
. . .
. . .
. . .
. . .
. . .
. . .
. . .
. . .
. . .
. . .
. . .
. . .
. . .
. . .
. . .
. . .
. . .
. . . Shares Outstanding .
. . .
. . .
. . .
. . .
. . .
. . .
. . .
. . .
. . .
. . .
. . .
. . .
. . .
. . .
. . .
. . .
. . .
. . .
. . . Net Asset Value Per Share .
. . .
. . .
. . .
. . .
. . .
. . .
. . .
. . .
. . .
. . .
. . .
. . .
. . .
. . .
. . .
. . .
. . .
. SI Class Net Assets . . .
. . .
. . .
. . .
. . .
. . .
. . .
. . .
. . .
. . .
. . .
. . .
. . .
. . .
. . .
. . .
. . .
. . .
. . .
. . .
. . .
. . Shares Outstanding . .
. . .
. . .
. . .
. . .
. . .
. . .
. . .
. . .
. . .
. . .
. . .
. . .
. . .
. . .
. . .
. . .
. . .
. . .
. . Net Asset Value Per Share . .
. . .
. . .
. . .
. . .
. . .
. . .
. . .
. . .
. . .
. . .
. . .
. . .
. . .
. . .
. . .
. . .
. . . * ** *** **** ***** Investments, at cost .
. . .
. . .
. . .
. . .
. . .
. . .
. . .
. . .
. . .
. . .
. . .
. . .
. . .
. . .
. . .
. . .
. . . Affiliated investments, at cost .
. . .
. . .
. . .
. . .
. . .
. . .
. . .
. . .
. . .
. . .
. . .
. . .
. . .
. . .
. Repurchase agreements, at cost . . .
. . .
. . .
. . .
. . .
. . .
. . .
. . .
. . .
. . .
. . .
. . .
. . .
. . .
. Foreign cash, at cost . . .
. . .
. . .
. . .
. . .
. . .
. . .
. . .
. . .
. . .
. . .
. . .
. . .
. . .
. . .
. . .
. . .
. Swaps, at cost. . .
. . .
. . .
. . .
. . .
. . .
. . .
. . .
. . .
. . .
. . .
. . .
. . .
. . .
. . .
. . .
. . .
. . .
. . . See notes to financial statements. 78 Payden Mutual Funds .
Payden U.S. Government Fund Payden GNMA Fund Payden Core Bond Fund Payden Corporate Bond Fund Payden Strategic Income Fund Payden Absolute Return Bond Fund Payden Floating Rate Fund $129,771 13,048 — — — 225 $415,401 6,822 — — 1 411 $728,654 61,854 — — 106 2,795 $70,171 1,013 — — 15 — $161,164 5,912 — — 210 — $58,723 2,787 — — 6 165 $151,124 9,509 — — — — 315 151 1 — — — — 13 143,524 749 142 158 9 — — — 21 423,714 4,164 19,012 — 34 561 — — 55 817,235 729 100 — 32 25 — — 8 72,093 1,046 512 45 7 136 — — 14 169,046 232 2,031 — 4 51 — 1 18 64,018 809 12,463 — — — — — 25 173,930 17 — 8,331 2 — — 6 — — 144,057 732 — — 64 — 560 131,058 4 65 — — — 11 407 53 3 — — — 121 15,268 158 12 — — — 51 2,917 — 3 — — — — 7,182 2 — — — 10 17 — 1 44 8,428 $135,096 15 36 5 2 195 145,106 $278,608 158 84 5 5 147 132,086 $685,149 12 9 — 1 55 551 $71,542 51 19 1 1 63 15,694 $153,352 — 7 — 1 52 3,031 $60,987 48 22 — 1 63 7,318 $166,612 $138,217 (4) (3,559) $301,821 65 (30,203) $682,607 464 1,091 $70,036 29 817 $154,237 — (232) $61,369 89 (354) $169,262 95 (1,529) 442 — $135,096 6,925 — $278,608 987 — $685,149 646 14 $71,542 (668) 15 $153,352 (117) — $60,987 (1,216) — $166,612 $ 1,676 158 $ 10.63 $ 23,335 2,386 $ 9.78 $ 24,314 2,289 $ 10.62 — — — $ $ $ $133,420 12,547 $ 10.63 $255,273 26,086 $ 9.79 $660,835 62,115 $ 10.64 $71,542 6,520 $ 10.97 $108,789 10,927 $ 9.96 $42,121 4,245 $ 9.92 $ 42,478 4,296 $ 9.89 — — — — — — — — — — — — $ 37,766 3,794 $ 9.96 $18,830 1,896 $ 9.93 $124,005 12,531 $ 9.90 $129,289 13,048 — — — $408,497 6,822 — — — $724,964 64,840 — — — $69,529 1,013 — — — $161,894 5,912 — — — $58,829 2,787 — — — $152,340 9,509 — — — $ 6,797 684 9.94 $ 36 4 9.93 $ 129 13 9.90 See notes to financial statements. Annual Report 79 . Statements of Assets & Liabilities continued October 31, 2015 Numbers in 000s Payden High Income Fund ASSETS: Investments, at value * . . . .
. . .
. . .
. . .
. . .
. . .
. . .
. . .
. . .
. . .
. . .
. . .
. . .
. . .
. . .
. . .
. . .
. . . Affiliated investments, at value **.
. . .
. . .
. . .
. . .
. . .
. . .
. . .
. . .
. . .
. . .
. . .
. . .
. . .
. . .
. . .
. Foreign cash *** . . .
. . .
. . .
. . .
. . .
. . .
. . .
. . .
. . .
. . .
. . .
. . .
. . .
. . .
. . .
. . .
. . .
. . .
. . .
. . . Cash.
. . .
. . .
. . .
. . .
. . .
. . .
. . .
. . .
. . .
. . .
. . .
. . .
. . .
. . .
. . .
. . .
. . .
. . .
. . .
. . .
. . .
. . .
. . . Cash pledged for financial futures contracts .
. . .
. . .
. . .
. . .
. . .
. . .
. . .
. . .
. . .
. . .
. . .
. . .
. . . Receivable for: Interest and dividends .
. . .
. . .
. . .
. . .
. . .
. . .
. . .
. . .
. . .
. . .
. . .
. . .
. . .
. . .
. . .
. . .
. . .
. . Investments sold . .
. . .
. . .
. . .
. . .
. . .
. . .
. . .
. . .
. . .
. . .
. . .
. . .
. . .
. . .
. . .
. . .
. . .
. . .
. . Fund shares sold. .
. . .
. . .
. . .
. . .
. . .
. . .
. . .
. . .
. . .
. . .
. . .
. . .
. . .
. . .
. . .
. . .
. . .
. . .
. . . Futures .
. . .
. . .
. . .
. . .
. . .
. . .
. . .
. . .
. . .
. . .
. . .
. . .
. . .
. . .
. . .
. . .
. . .
. . .
. . .
. . .
. . .
. Forward currency contracts . . .
. . .
. . .
. . .
. . .
. . .
. . .
. . .
. . .
. . .
. . .
. . .
. . .
. . .
. . .
. . .
. . Variation margin on centrally cleared swaps . .
. . .
. . .
. . .
. . .
. . .
. . .
. . .
. . .
. . .
. . .
. . .
. . . Other assets .
. . .
. . .
. . .
. . .
. . .
. . .
. . .
. . .
. . .
. . .
. . .
. . .
. . .
. . .
. . .
. . .
. . .
. . .
. . .
. . .
. . . Total Assets .
. . .
. . .
. . .
. . .
. . .
. . .
. . .
. . .
. . .
. . .
. . .
. . .
. . .
. . .
. . .
. . .
. . .
. . .
. . . LIABILITIES: Payable for: Bank overdraft .
. . .
. . .
. . .
. . .
. . .
. . .
. . .
. . .
. . .
. . .
. . .
. . .
. . .
. . .
. . .
. . .
. . .
. . .
. . .
. . Forward currency contracts . .
. . .
. . .
. . .
. . .
. . .
. . .
. . .
. . .
. . .
. . .
. . .
. . .
. . .
. . .
. . .
. . . Investments purchased .
. . .
. . .
. . .
. . .
. . .
. . .
. . .
. . .
. . .
. . .
. . .
. . .
. . .
. . .
. . .
. . .
. . .
. . Fund shares redeemed . .
. . .
. . .
. . .
. . .
. . .
. . .
. . .
. . .
. . .
. . .
. . .
. . .
. . .
. . .
. . .
. . .
. . .
. Futures . . .
. . .
. . .
. . .
. . .
. . .
. . .
. . .
. . .
. . .
. . .
. . .
. . .
. . .
. . .
. . .
. . .
. . .
. . .
. . .
. . .
. . Swaps **** . .
. . .
. . .
. . .
. . .
. . .
. . .
. . .
. . .
. . .
. . .
. . .
. . .
. . .
. . .
. . .
. . .
. . .
. . .
. . .
. . . Variation margin payable on centrally cleared swaps .
. . .
. . .
. . .
. . .
. . .
. . .
. . .
. . .
. . .
. . . Distributions payable.
. . .
. . .
. . .
. . .
. . .
. . .
. . .
. . .
. . .
. . .
. . .
. . .
. . .
. . .
. . .
. . .
. . .
. . .
. . Accrued expenses: Investment advisory fees (Note 3) . .
. . .
. . .
. . .
. . .
. . .
. . .
. . .
. . .
. . .
. . .
. . .
. . .
. . .
. . .
. Administration fees (Note 3) . . .
. . .
. . .
. . .
. . .
. . .
. . .
. . .
. . .
. . .
. . .
. . .
. . .
. . .
. . .
. . .
. Distribution fees (Note 3) . . .
. . .
. . .
. . .
. . .
. . .
. . .
. . .
. . .
. . .
. . .
. . .
. . .
. . .
. . .
. . .
. . . Trustee fees and expenses .
. . .
. . .
. . .
. . .
. . .
. . .
. . .
. . .
. . .
. . .
. . .
. . .
. . .
. . .
. . .
. . .
. . . Other liabilities .
. . .
. . .
. . .
. . .
. . .
. . .
. . .
. . .
. . .
. . .
. . .
. . .
. . .
. . .
. . .
. . .
. . .
. . .
. . .
. . . Total Liabilities .
. . .
. . .
. . .
. . .
. . .
. . .
. . .
. . .
. . .
. . .
. . .
. . .
. . .
. . .
. . .
. . .
. . .
. . . NET ASSETS .
. . .
. . .
. . .
. . .
. . .
. . .
. . .
. . .
. . .
. . .
. . .
. . .
. . .
. . .
. . .
. . .
. . .
. . .
. NET ASSETS: Paid in capital . . .
. . .
. . .
. . .
. . .
. . .
. . .
. . .
. . .
. . .
. . .
. . .
. . .
. . .
. . .
. . .
. . .
. . .
. . .
. . .
. . Undistributed net investment income (loss) . .
. . .
. . .
. . .
. . .
. . .
. . .
. . .
. . .
. . .
. . .
. . .
. . .
. . Undistributed net realized gains (losses) from investments. .
. . .
. . .
. . .
. . .
. . .
. . .
. . .
. . .
. . . Net unrealized appreciation (depreciation) from: Investments .
. . .
. . .
. . .
. . .
. . .
. . .
. . .
. . .
. . .
. . .
. . .
. . .
. . .
. . .
. . .
. . .
. . .
. . .
. . .
. . .
. Translation of assets and liabilities in foreign currencies . . .
. . .
. . .
. . .
. . .
. . .
. . .
. . .
. . .
. . NET ASSETS . .
. . .
. . .
. . .
. . .
. . .
. . .
. . .
. . .
. . .
. . .
. . .
. . .
. . .
. . .
. . .
. . .
. . .
. . .
. . .
. NET ASSET VALUE — offering and redemption price per share in whole dollars Adviser Class Net Assets . . .
. . .
. . .
. . .
. . .
. . .
. . .
. . .
. . .
. . .
. . .
. . .
. . .
. . .
. . .
. . .
. . .
. . .
. . .
. . .
. . . Shares Outstanding .
. . .
. . .
. . .
. . .
. . .
. . .
. . .
. . .
. . .
. . .
. . .
. . .
. . .
. . .
. . .
. . .
. . .
. . .
. Net Asset Value Per Share . . .
. . .
. . .
. . .
. . .
. . .
. . .
. . .
. . .
. . .
. . .
. . .
. . .
. . .
. . .
. . .
. . . Investor Class Net Assets .
. . .
. . .
. . .
. . .
. . .
. . .
. . .
. . .
. . .
. . .
. . .
. . .
. . .
. . .
. . .
. . .
. . .
. . .
. . .
. . .
. . Shares Outstanding . .
. . .
. . .
. . .
. . .
. . .
. . .
. . .
. . .
. . .
. . .
. . .
. . .
. . .
. . .
. . .
. . .
. . .
. . . Net Asset Value Per Share .
. . .
. . .
. . .
. . .
. . .
. . .
. . .
. . .
. . .
. . .
. . .
. . .
. . .
. . .
. . .
. . .
. . SI Class Net Assets . .
. . .
. . .
. . .
. . .
. . .
. . .
. . .
. . .
. . .
. . .
. . .
. . .
. . .
. . .
. . .
. . .
. . .
. . .
. . .
. . .
. Shares Outstanding . . .
. . .
. . .
. . .
. . .
. . .
. . .
. . .
. . .
. . .
. . .
. . .
. . .
. . .
. . .
. . .
. . .
. . .
. . Net Asset Value Per Share . .
. . .
. . .
. . .
. . .
. . .
. . .
. . .
. . .
. . .
. . .
. . .
. . .
. . .
. . .
. . .
. . .
. * ** *** **** Investments, at cost . . .
. . .
. . .
. . .
. . .
. . .
. . .
. . .
. . .
. . .
. . .
. . .
. . .
. . .
. . .
. . .
. . Affiliated investments, at cost . .
. . .
. . .
. . .
. . .
. . .
. . .
. . .
. . .
. . .
. . .
. . .
. . .
. . .
. . Foreign cash, at cost . .
. . .
. . .
. . .
. . .
. . .
. . .
. . .
. . .
. . .
. . .
. . .
. . .
. . .
. . .
. . .
. . . Swaps, at cost .
. . .
. . .
. . .
. . .
. . .
. . .
. . .
. . .
. . .
. . .
. . .
. . .
. . .
. . .
. . .
. . .
. . .
. . . Payden California Municipal Income Fund Payden Global Low Duration Fund $556,120 56,858 — — 1,824 $46,281 — — — — $126,805 1,959 2 — — 9,086 802 503 14 347 — 52 625,606 483 — 243 — — — 5 47,012 495 73 2,227 3 103 35 10 131,712 15 379 610 201 — — 54 — — — 977 30 — — — 21 7 50 1,138 41 1 26 — — 179 77 2 5 268 1,790 $623,816 6 6 — — 34 1,074 $45,938 14 16 — 1 74 1,368 $130,344 $646,655 171 (20,665) $43,749 (4) 548 $132,813 — (931) (2,313) (32) $623,816 1,645 — $45,938 (1,591) 53 $130,344 $ 19,879 3,099 $ 6.42 — — — — — — $603,937 94,370 $ 6.40 $45,938 4,421 $ 10.39 $130,344 13,026 $ 10.01 — — — — — — — — — $557,871 57,241 — — $44,636 — — — $128,354 1,959 2 (20) See notes to financial statements. 80 Payden Mutual Funds .
Payden Global Fixed Income Fund Payden Emerging Markets Bond Fund Payden Emerging Markets Local Bond Fund Payden Emerging Markets Corporate Bond Fund Payden Equity Income Fund $68,895 12,113 28 10 48 $ 938,126 29,165 — 3,020 1,915 $119,017 6,911 1,025 — — $34,542 795 — 7 — $558,865 4,212 — 110 — 524 — 368 17 477 — 9 82,489 13,962 5,360 149 — 270 — 72 992,039 2,324 — 35 — 6 — 19 129,337 496 242 — — 5 — 15 36,102 1,038 — 431 — — — 36 564,692 — 395 1,698 15 8 — — — — 1,269 24,863 965 — — — — — 203 2,819 — — — — — — 30 4 — — — — — — — — 829 — — — — 8 10 — 1 61 2,196 $80,293 309 123 6 7 388 27,930 $ 964,109 37 15 — 1 123 3,198 $126,139 5 5 — — 41 85 $36,017 234 70 1 4 190 1,328 $563,364 $81,325 — 773 $1,031,548 2,370 (30,919) $171,851 — (19,373) $37,281 18 (557) $519,657 1,352 (1,928) (1,885) 80 $80,293 (37,882) (1,008) $ 964,109 (26,051) (288) $126,139 (700) (25) $36,017 44,283 — $563,364 $ $ $ $ — — — $ 29,481 2,251 13.10 $ 169 25 6.66 $ 16 2 9.63 $ 4,567 327 13.98 $80,293 9,051 $ 8.87 $ 416,408 31,843 $ 13.08 $125,970 18,911 $ 6.66 $ 1,401 146 $ 9.62 $281,163 20,120 $ 13.97 — — — $ 518,220 39,662 $ 13.07 — — — $34,600 3,594 $ 9.63 $277,634 19,866 $ 13.97 $69,696 13,232 28 — $ 976,008 29,165 — — $144,778 7,201 1,018 — $35,242 795 — — $514,582 4,212 — — See notes to financial statements. Annual Report 81 . Statements of Operations Year ended October 31, 2015 Numbers in 000s Payden Cash Reserves Money Market Fund INVESTMENT INCOME: Interest income (Note 2) . . . .
. . .
. . .
. . .
. . .
. . .
. . .
. . .
. . .
. . .
. . .
. . .
. . .
. . .
. . .
. . .
. . .
. . .
. Dividend income . . .
. . .
. . .
. . .
. . .
. . .
. . .
. . .
. . .
. . .
. . .
. . .
. . .
. . .
. . .
. . .
. . .
. . .
. . .
. . .
. . Dividend income from affiliated investment (Note 2) . .
. . .
. . .
. . .
. . .
. . .
. . .
. . .
. . .
. . .
. . .
. . Income from securities lending . .
. . .
. . .
. . .
. . .
. . .
. . .
. . .
. . .
. . .
. . .
. . .
. . .
. . .
. . .
. . .
. . .
. Investment Income . . .
. . .
. . .
. . .
. . .
. . .
. . .
. . .
. . .
. . .
. . .
. . .
. . .
. . .
. . .
. . .
. . .
. . .
. . .
. . . EXPENSES: Investment advisory fees (Note 3) .
. . .
. . .
. . .
. . .
. . .
. . .
. . .
. . .
. . .
. . .
. . .
. . .
. . .
. . .
. . .
. . . Administration fees (Note 3) .
. . .
. . .
. . .
. . .
. . .
. . .
. . .
. . .
. . .
. . .
. . .
. . .
. . .
. . .
. . .
. . .
. . .
. Shareholder servicing fees. . .
. . .
. . .
. . .
. . .
. . .
. . .
. . .
. . .
. . .
. . .
. . .
. . .
. . .
. . .
. . .
. . .
. . .
. . Distribution fees (Note 3) . .
. . .
. . .
. . .
. . .
. . .
. . .
. . .
. . .
. . .
. . .
. . .
. . .
. . .
. . .
. . .
. . .
. . .
. . Custodian fees . .
. . .
. . .
. . .
. . .
. . .
. . .
. . .
. . .
. . .
. . .
. . .
. . .
. . .
. . .
. . .
. . .
. . .
. . .
. . .
. . .
. . Transfer agent fees . .
. . .
. . .
. . .
. . .
. . .
. . .
. . .
. . .
. . .
. . .
. . .
. . .
. . .
. . .
. . .
. . .
. . .
. . .
. . .
. . Registration and filing fees . .
. . .
. . .
. . .
. . .
. . .
. . .
. . .
. . .
. . .
. . .
. . .
. . .
. . .
. . .
. . .
. . .
. . .
. Trustee fees and expenses . . .
. . .
. . .
. . .
. . .
. . .
. . .
. . .
. . .
. . .
. . .
. . .
. . .
. . .
. . .
. . .
. . .
. . .
. . Printing and mailing costs . .
. . .
. . .
. . .
. . .
. . .
. . .
. . .
. . .
. . .
. . .
. . .
. . .
. . .
. . .
. . .
. . .
. . .
. . Loan commitment fees . .
. . .
. . .
. . .
. . .
. . .
. . .
. . .
. . .
. . .
. . .
. . .
. . .
. . .
. . .
. . .
. . .
. . .
. . .
. . Legal fees . .
. . .
. . .
. . .
. . .
. . .
. . .
. . .
. . .
. . .
. . .
. . .
. . .
. . .
. . .
. . .
. . .
. . .
. . .
. . .
. . .
. . .
. . . Publication expense .
. . .
. . .
. . .
. . .
. . .
. . .
. . .
. . .
. . .
. . .
. . .
. . .
. . .
. . .
. . .
. . .
. . .
. . .
. . .
. . Pricing fees . .
. . .
. . .
. . .
. . .
. . .
. . .
. . .
. . .
. . .
. . .
. . .
. . .
. . .
. . .
. . .
. . .
. . .
. . .
. . .
. . .
. . .
. Fund accounting fees . . .
. . .
. . .
. . .
. . .
. . .
. . .
. . .
. . .
. . .
. . .
. . .
. . .
. . .
. . .
. . .
. . .
. . .
. . .
. . Insurance . .
. . .
. . .
. . .
. . .
. . .
. . .
. . .
. . .
. . .
. . .
. . .
. . .
. . .
. . .
. . .
. . .
. . .
. . .
. . .
. . .
. . .
. . . Audit fees .
. . .
. . .
. . .
. . .
. . .
. . .
. . .
. . .
. . .
. . .
. . .
. . .
. . .
. . .
. . .
. . .
. . .
. . .
. . .
. . .
. . .
. . . Other expenses.
. . .
. . .
. . .
. . .
. . .
. . .
. . .
. . .
. . .
. . .
. . .
. . .
. . .
. . .
. . .
. . .
. . .
. . .
. . .
. . .
. . . Gross Expenses.
. . .
. . .
. . .
. . .
. . .
. . .
. . .
. . .
. . .
. . .
. . .
. . .
. . .
. . .
. . .
. . .
. . .
. . .
. . .
. . .
. Expense subsidy (Note 3) . . .
. . .
. . .
. . .
. . .
. . .
. . .
. . .
. . .
. . .
. . .
. . .
. . .
. . .
. . .
. . .
. . .
. . .
. . Net Expenses . .
. . .
. . .
. . .
. . .
. . .
. . .
. . .
. . .
. . .
. . .
. . .
. . .
. . .
. . .
. . .
. . .
. . .
. . .
. . .
. . .
. Net Investment Income . . .
. . .
. . .
. . .
. . .
. . .
. . .
. . .
. . .
. . .
. . .
. . .
. . .
. . .
. . .
. . .
. . .
. . REALIZED AND UNREALIZED GAINS (LOSSES): Net realized gains (losses) from: Investments . .
. . .
. . .
. . .
. . .
. . .
. . .
. . .
. . .
. . .
. . .
. . .
. . .
. . .
. . .
. . .
. . .
. . .
. . .
. . .
. . .
. . Foreign currency transactions . .
. . .
. . .
. . .
. . .
. . .
. . .
. . .
. . .
. . .
. . .
. . .
. . .
. . .
. . .
. . .
. . .
. Futures contracts . . .
. . .
. . .
. . .
. . .
. . .
. . .
. . .
. . .
. . .
. . .
. . .
. . .
. . .
. . .
. . .
. . .
. . .
. . .
. . . Swap contracts .
. . .
. . .
. . .
. . .
. . .
. . .
. . .
. . .
. . .
. . .
. . .
. . .
. . .
. . .
. . .
. . .
. . .
. . .
. . .
. . .
. Change in net unrealized appreciation (depreciation) from: Investments . . .
. . .
. . .
. . .
. . .
. . .
. . .
. . .
. . .
. . .
. . .
. . .
. . .
. . .
. . .
. . .
. . .
. . .
. . .
. . .
. . .
. Translation of assets and liabilities in foreign currencies . . .
. . .
. . .
. . .
. . .
. . .
. . .
. . .
. . .
. . .
. Affiliated investments . . .
. . .
. . .
. . .
. . .
. . .
. . .
. . .
. . .
. . .
. . .
. . .
. . .
. . .
. . .
. . .
. . .
. . .
. . Futures contracts . .
. . .
. . .
. . .
. . .
. . .
. . .
. . .
. . .
. . .
. . .
. . .
. . .
. . .
. . .
. . .
. . .
. . .
. . .
. . .
. Swap contracts . . .
. . .
. . .
. . .
. . .
. . .
. . .
. . .
. . .
. . .
. . .
. . .
. . .
. . .
. . .
. . .
. . .
. . .
. . .
. . .
. . Net Realized and Unrealized Gains (Losses) . .
. . .
. . .
. . .
. . .
. . .
. . .
. . .
. . .
. . .
. . .
. . .
. . . CHANGE IN NET ASSETS RESULTING FROM OPERATIONS.
. . .
. . .
. . .
. . .
. . .
. . .
. . .
. . (1) Fund commenced operations on November 6, 2014. See notes to financial statements. 82 Payden Mutual Funds 401 — — — 401 $ 3,434 — 1 6 3,441 $13,997 19 1 11 14,028 1,095 586 187 — 52 42 52 37 21 6 13 10 39 45 17 35 2 2,239 (1,031) 1,208 2,233 2,478 1,327 585 — 79 98 47 89 47 16 29 27 47 98 47 35 — 5,049 (889) 4,160 9,868 6 — — — $ Payden Low Duration Fund 604 604 — — 39 44 69 42 24 — 12 16 4 50 27 31 — 1,566 (1,205) 361 40 $ Payden Limited Maturity Fund (1,424) 2,972 (424) — (2,550) 3,447 (1,018) 259 — — — — — 6 46 (2,274) (235) — — — (1,385) $ 848 (5,101) (70) — (204) (34) (5,271) $ 4,597 . Payden U.S. Government Fund Payden GNMA Fund Payden Core Bond Fund Payden Corporate Bond Fund Payden Strategic Income Fund Payden Absolute Return Bond Fund(1) Payden Floating Rate Fund $1,605 — 1 — 1,606 $ 5,863 — 1 — 5,864 $16,347 — 1,562 20 17,929 $ 2,634 — — 4 2,638 $3,532 97 — 4 3,633 $1,155 — — — 1,155 $ 6,715 — 1 — 6,716 354 189 8 2 21 31 38 12 7 2 4 5 11 18 7 35 — 744 (174) 570 1,036 778 432 388 57 44 61 48 29 17 5 9 13 24 34 16 38 — 1,993 (495) 1,498 4,366 1,771 949 184 55 53 61 43 62 35 11 20 18 28 71 29 37 4 3,431 — 3,431 14,498 239 102 51 — 18 18 23 7 4 1 2 3 13 12 3 37 — 533 (90) 443 2,195 674 184 33 15 19 43 33 11 11 2 4 2 32 17 4 36 — 1,120 (174) 946 2,687 225 68 — — 26 32 55 4 27 1 7 2 24 10 — 42 4 527 (239) 288 867 960 262 6 — 14 45 38 17 12 — 6 5 20 24 9 51 3 1,472 (284) 1,188 5,528 88 — 6 — 1,458 — (1,109) (35) 5,936 2,614 (1,822) (3,164) 771 81 84 (113) (725) 569 (75) — 106 97 (383) (57) (1,527) — — — 155 — — (56) — 193 $1,229 747 — — 266 28 1,355 $ 5,721 (7,466) (89) (2,608) 490 1,900 (4,209) $10,289 (1,479) 14 — (49) 69 (622) $ 1,573 (136) 41 — 62 — (264) $2,423 (106) — — (11) — (354) $ 513 622 — — — — (905) $ 4,623 See notes to financial statements. Annual Report 83 . Statements of Operations continued Year ended October 31, 2015 Numbers in 000s Payden High Income Fund INVESTMENT INCOME: Interest income (Note 2) . . . .
. . .
. . .
. . .
. . .
. . .
. . .
. . .
. . .
. . .
. . .
. . .
. . .
. . .
. . .
. . .
. . .
. . Dividend income . .
. . .
. . .
. . .
. . .
. . .
. . .
. . .
. . .
. . .
. . .
. . .
. . .
. . .
. . .
. . .
. . .
. . .
. . .
. . .
. Dividend income from affiliated investment (Note 2) . . .
. . .
. . .
. . .
. . .
. . .
. . .
. . .
. . .
. . .
. . Income from securities lending . .
. . .
. . .
. . .
. . .
. . .
. . .
. . .
. . .
. . .
. . .
. . .
. . .
. . .
. . .
. . .
. . Foreign tax withholdings . .
. . .
. . .
. . .
. . .
. . .
. . .
. . .
. . .
. . .
. . .
. . .
. . .
. . .
. . .
. . .
. . .
. . .
. Investment Income . . .
. . .
. . .
. . .
. . .
. . .
. . .
. . .
. . .
. . .
. . .
. . .
. . .
. . .
. . .
. . .
. . .
. . .
. . .
. EXPENSES: Investment advisory fees (Note 3) . . .
. . .
. . .
. . .
. . .
. . .
. . .
. . .
. . .
. . .
. . .
. . .
. . .
. . .
. . .
. . Administration fees (Note 3) . .
. . .
. . .
. . .
. . .
. . .
. . .
. . .
. . .
. . .
. . .
. . .
. . .
. . .
. . .
. . .
. . .
. Shareholder servicing fees. . .
. . .
. . .
. . .
. . .
. . .
. . .
. . .
. . .
. . .
. . .
. . .
. . .
. . .
. . .
. . .
. . .
. . . Distribution fees (Note 3) .
. . .
. . .
. . .
. . .
. . .
. . .
. . .
. . .
. . .
. . .
. . .
. . .
. . .
. . .
. . .
. . .
. . .
. Custodian fees . . .
. . .
. . .
. . .
. . .
. . .
. . .
. . .
. . .
. . .
. . .
. . .
. . .
. . .
. . .
. . .
. . .
. . .
. . .
. . .
. . Transfer agent fees . .
. . .
. . .
. . .
. . .
. . .
. . .
. . .
. . .
. . .
. . .
. . .
. . .
. . .
. . .
. . .
. . .
. . .
. . .
. . . Registration and filing fees .
. . .
. . .
. . .
. . .
. . .
. . .
. . .
. . .
. . .
. . .
. . .
. . .
. . .
. . .
. . .
. . .
. . . Trustee fees and expenses .
. . .
. . .
. . .
. . .
. . .
. . .
. . .
. . .
. . .
. . .
. . .
. . .
. . .
. . .
. . .
. . .
. . .
. . Printing and mailing costs. .
. . .
. . .
. . .
. . .
. . .
. . .
. . .
. . .
. . .
. . .
. . .
. . .
. . .
. . .
. . .
. . .
. . . Loan commitment fees .
. . .
. . .
. . .
. . .
. . .
. . .
. . .
. . .
. . .
. . .
. . .
. . .
. . .
. . .
. . .
. . .
. . .
. . .
. Legal fees . . .
. . .
. . .
. . .
. . .
. . .
. . .
. . .
. . .
. . .
. . .
. . .
. . .
. . .
. . .
. . .
. . .
. . .
. . .
. . .
. . .
. . . Publication expense .
. . .
. . .
. . .
. . .
. . .
. . .
. . .
. . .
. . .
. . .
. . .
. . .
. . .
. . .
. . .
. . .
. . .
. . .
. . . Pricing fees .
. . .
. . .
. . .
. . .
. . .
. . .
. . .
. . .
. . .
. . .
. . .
. . .
. . .
. . .
. . .
. . .
. . .
. . .
. . .
. . .
. . . Fund accounting fees .
. . .
. . .
. . .
. . .
. . .
. . .
. . .
. . .
. . .
. . .
. . .
. . .
. . .
. . .
. . .
. . .
. . .
. . .
. . Insurance . .
. . .
. . .
. . .
. . .
. . .
. . .
. . .
. . .
. . .
. . .
. . .
. . .
. . .
. . .
. . .
. . .
. . .
. . .
. . .
. . .
. . .
. Audit fees . . .
. . .
. . .
. . .
. . .
. . .
. . .
. . .
. . .
. . .
. . .
. . .
. . .
. . .
. . .
. . .
. . .
. . .
. . .
. . .
. . .
. . Other expenses. .
. . .
. . .
. . .
. . .
. . .
. . .
. . .
. . .
. . .
. . .
. . .
. . .
. . .
. . .
. . .
. . .
. . .
. . .
. . .
. . . Gross Expenses .
. . .
. . .
. . .
. . .
. . .
. . .
. . .
. . .
. . .
. . .
. . .
. . .
. . .
. . .
. . .
. . .
. . .
. . .
. . .
. Expense subsidy (Note 3) . . .
. . .
. . .
. . .
. . .
. . .
. . .
. . .
. . .
. . .
. . .
. . .
. . .
. . .
. . .
. . .
. . .
. . . Net Expenses .
. . .
. . .
. . .
. . .
. . .
. . .
. . .
. . .
. . .
. . .
. . .
. . .
. . .
. . .
. . .
. . .
. . .
. . .
. . .
. . . Net Investment Income .
. . .
. . .
. . .
. . .
. . .
. . .
. . .
. . .
. . .
. . .
. . .
. . .
. . .
. . .
. . .
. . .
. . REALIZED AND UNREALIZED GAINS (LOSSES): Net realized gains (losses) from: Investments . .
. . .
. . .
. . .
. . .
. . .
. . .
. . .
. . .
. . .
. . .
. . .
. . .
. . .
. . .
. . .
. . .
. . .
. . .
. . .
. . . Foreign currency transactions.
. . .
. . .
. . .
. . .
. . .
. . .
. . .
. . .
. . .
. . .
. . .
. . .
. . .
. . .
. . .
. . . Affiliated investments .
. . .
. . .
. . .
. . .
. . .
. . .
. . .
. . .
. . .
. . .
. . .
. . .
. . .
. . .
. . .
. . .
. . .
. . Futures contracts . .
. . .
. . .
. . .
. . .
. . .
. . .
. . .
. . .
. . .
. . .
. . .
. . .
. . .
. . .
. . .
. . .
. . .
. . .
. . Swap contracts . .
. . .
. . .
. . .
. . .
. . .
. . .
. . .
. . .
. . .
. . .
. . .
. . .
. . .
. . .
. . .
. . .
. . .
. . .
. . .
. Change in net unrealized appreciation (depreciation) from: Investments . . .
. . .
. . .
. . .
. . .
. . .
. . .
. . .
. . .
. . .
. . .
. . .
. . .
. . .
. . .
. . .
. . .
. . .
. . .
. . .
. . Translation of assets and liabilities in foreign currencies . .
. . .
. . .
. . .
. . .
. . .
. . .
. . .
. . .
. . . Affiliated investments .
. . .
. . .
. . .
. . .
. . .
. . .
. . .
. . .
. . .
. . .
. . .
. . .
. . .
. . .
. . .
. . .
. . .
. . Futures contracts . .
. . .
. . .
. . .
. . .
. . .
. . .
. . .
. . .
. . .
. . .
. . .
. . .
. . .
. . .
. . .
. . .
. . .
. . .
. . Swap contracts . .
. . .
. . .
. . .
. . .
. . .
. . .
. . .
. . .
. . .
. . .
. . .
. . .
. . .
. . .
. . .
. . .
. . .
. . .
. . .
. Net Realized and Unrealized Gains (Losses) . . .
. . .
. . .
. . .
. . .
. . .
. . .
. . .
. . .
. . .
. . .
. . . CHANGE IN NET ASSETS RESULTING FROM OPERATIONS.
. . .
. . .
. . .
. . .
. . .
. . .
. . . Payden California Municipal Income Fund Payden Global Low Duration Fund $ 38,512 581 567 186 — 39,846 $1,220 — — — — 1,220 $ 2,129 10 — 2 — 2,141 2,341 1,003 535 29 51 101 86 69 38 13 22 26 15 76 40 42 — 4,487 — 4,487 35,359 143 67 8 — 4 16 2 4 2 1 1 2 13 11 2 35 — 311 (65) 246 974 371 185 85 — 34 24 21 12 6 2 4 4 36 18 8 38 — 848 (167) 681 1,460 (21,790) 2,075 — (854) 23 549 — — — — (1,597) 1,756 — (255) 45 (20,392) (108) (734) (138) — (41,918) $ (6,559) (700) — — — — (151) $ 823 (941) (59) — (27) (6) (1,084) $ 376 See notes to financial statements. 84 Payden Mutual Funds .
Payden Global Fixed Income Fund Payden Emerging Markets Bond Fund Payden Emerging Markets Local Bond Fund Payden Emerging Markets Corporate Bond Fund Payden Equity Income Fund $1,014 — 501 1 — 1,516 $ 53,711 — 2 74 (21) 53,766 $ 9,147 — 177 — (46) 9,278 $ 2,066 — — 9 — 2,075 $ 32 17,951 1 12 — 17,996 186 93 64 — 30 19 24 6 5 1 2 2 17 12 2 38 2 503 (91) 412 1,104 4,218 1,406 776 65 91 105 37 94 67 17 30 27 20 103 45 42 11 7,154 (332) 6,822 46,944 893 223 2 1 127 33 54 15 9 3 6 7 19 21 9 42 — 1,464 (28) 1,436 7,842 311 58 — — 6 35 28 4 4 1 1 3 12 10 2 42 — 517 (185) 332 1,743 2,711 813 327 12 44 83 59 54 37 10 18 10 3 61 20 35 — 4,297 (321) 3,976 14,020 (546) 2,295 (337) (162) — (21,201) 3,216 — — — (28,008) (747) — — (53) (608) 50 — — — (1,460) 3 — (861) — (730) 107 (589) 14 — 52 $1,156 (50,606) (1,981) — — — (70,572) $(23,628) (6,947) (280) (298) — — (36,333) $(28,491) (1,708) (25) — — — (2,291) $ (548) 1,237 — — — — (1,081) $12,939 See notes to financial statements. Annual Report 85 . Statements of Changes in Net Assets For the years ended October 31st, Numbers in 000s Payden Cash Reserves Money Market Fund 2015 2014 Payden Limited Maturity Fund 2015 2014 INCREASE (DECREASE) IN NET ASSETS: FROM OPERATIONS: Net investment income . . . .
. . .
. . .
. . .
. . .
. . . Net realized gains (losses) on investments .
. . .
. . . Change in net unrealized appreciation/(depreciation) Change in Net Assets Resulting from Operations. . . . . . . . . . . . . . . . . . . . . FROM DISTRIBUTIONS TO SHAREHOLDERS: Net investment income: Adviser Class .
. . .
. . .
. . .
. . .
. . .
. . .
. . .
. . .
. . .
. . . Investor Class .
. . .
. . .
. . .
. . .
. . .
. . .
. . .
. . .
. . .
. . . Net realized gains from investments: Adviser Class .
. . .
. . .
. . .
. . .
. . .
. . .
. . .
. . .
. . .
. . . Investor Class .
. . .
. . .
. . .
. . .
. . .
. . .
. . .
. . .
. . .
. . . Return of capital: Investor Class .
. . .
. . .
. . .
. . .
. . .
. . .
. . .
. . .
. . .
. . . Change in Net Assets from Distributions to Shareholders FROM CAPITAL TRANSACTIONS: Proceeds from fund shares sold: Adviser Class .
. . .
. . .
. . .
. . .
. . .
. . .
. . .
. . . Investor Class .
. . .
. . .
. . .
. . .
. . .
. . .
. . .
. . . Reinvestment of distributions: Adviser Class .
. . .
. . .
. . .
. . .
. . .
. . .
. . .
. . . Investor Class .
. . .
. . .
. . .
. . .
. . .
. . .
. . .
. . . Cost of fund shares redeemed: Adviser Class .
. . .
. . .
. . .
. . .
. . .
. . .
. . .
. . . Investor Class .
. . .
. . .
. . .
. . .
. . .
. . .
. . .
. . . Change in Net Assets from Capital Transactions Total Change in Net Assets .
. . .
. . .
. . .
. . . . . . . . . . . . . . . . . . . . . . . . . . . . . . . . . . . . . . . . . . . . . . . . . . . . . . . . . . . . . . . . . . . . . . 40 6 — 46 52 — — 52 $ 2,233 1,124 (2,509) 848 $ 2,519 1,684 (1,649) 2,554 — (40) — (50) — (1,596) — (2,444) ................. ................. — — — — — — — — ................. ................. — (40) (2) (52) (1,266) (2,862) — (2,444) ....................... ....................... — 30,676,204 — 25,153,180 — 411,658 — 293,849 ....................... ....................... — 14 — 11 — 2,750 — 2,311 — (30,774,499) (98,281) (98,275) — (25,160,942) (7,751) (7,751) — (308,069) 106,339 104,325 — (235,881) 60,279 60,389 498,417 490,666 (3) 318,671 $ 422,996 $ (9) 258,282 $ 318,671 $ 19 . . . . . . . . . . . . . . . . . . . . . . . . . . . . . . . . . . . . . . . . . . . . . . . . . . . . . . . . . . . . . . . . . . . . . . . . . . . . . . . . . . . . . . . . . . . . $ $ 490,666 392,391 — $ $ . . . . . . . . . . . . . . . . . . . . . . . . . . . . . . . . . . . . . . . . . . . . . . . . . . . . . . . . . . . . . . . . . . . . . . . . . . . . . . . . . . . . . . . . . . . . . . . . . . . . . . . . . . . . . . . . . . . . . . . . . . . . . . . . . . . . . . . . . . — — — — — — — — — — — — — — — — — — — — — — — — . . . . . . . . . . . . . . . . . . . . . . . . . . . . . . . . . . . . . . . . . . . . . . . . . . . . . . . . . . . . . . . . . . . . . . . . . . . . . . . . . . . . . . . . . . . . . . . . . . . . . . . . . . . . . . . . . . . . . . . . . . . . . . . . . . . . . . . . . . 490,664 30,676,204 14 (30,774,499) (98,281) 392,383 498,415 25,153,180 11 (25,160,942) (7,751) 490,664 33,648 43,514 291 (32,561) 11,244 44,892 27,283 31,010 244 (24,889) 6,365 33,648 . . . . . . . . . . . . . . . . . . . . . . . . . . . . . . . . . . . . . . . . . . . . . . . . . . . . . . . . . . . . . . . . . . . . . . . . . . . . . . . . . . . . . . . . . . . . — — — — — — — — 159,806 126,143 18,796 6,880 215,081 165,689 7,050 7,496 See notes to financial statements. 86 Payden Mutual Funds $ ................. ................. NET ASSETS: Beginning of period . .
. . .
. . .
. . .
. . .
. . .
. . .
. . .
. . .
. . .
. . .
. . .
. . .
. . .
. . . End of period .
. . .
. . .
. . .
. . .
. . .
. . .
. . .
. . .
. . .
. . .
. . .
. . .
. . .
. . .
. . .
. . Accumulated net investment income/(loss) . .
. . .
. . .
. . .
. . .
. . .
. . .
. . .
. . .
. . . FUND SHARES OF BENEFICIAL INTEREST: Adviser Class: Outstanding shares at beginning of period .
. . .
. . Shares sold . .
. . .
. . .
. . .
. . .
. . .
. . .
. . .
. . .
. Shares issued in reinvestment of distributions . . .
. Shares redeemed . . .
. . .
. . .
. . .
. . .
. . .
. . .
. . Change in shares outstanding. .
. . .
. . .
. . .
. . .
. Outstanding shares at end of period . . .
. . .
. . .
. Investor Class: Outstanding shares at beginning of period . . .
. . . Shares sold .
. . .
. . .
. . .
. . .
. . .
. . .
. . .
. . .
. . Shares issued in reinvestment of distributions . .
. . Shares redeemed . .
. . .
. . .
. . .
. . .
. . .
. . .
. . . Change in shares outstanding.
. . .
. . .
. . .
. . .
. . Outstanding shares at end of period . .
. . .
. . .
. . LONG TERM INVESTMENT ACTIVITY: Purchase of investments (excluding government). . Sale of investments (excluding government) .
. . .
. Purchase of government securities. . .
. . .
. . .
. . . Sale of government securities .
. . .
. . .
. . .
. . .
. . $ . Payden Low Duration Fund 2015 2014 $ Payden U.S. Government Fund 2015 2014 $ 1,036 94 99 1,229 $ 971 (113) 1,077 1,935 Payden GNMA Fund 2015 $ 4,366 314 1,041 5,721 Payden Core Bond Fund 2014 $ 2015 2014 5,518 1,281 4,412 11,211 $ 14,498 3,564 (7,773) 10,289 $ 15,398 7,315 7,153 29,866 9,868 138 (5,409) 4,597 $ 10,917 2,372 (2,690) 10,599 — (9,704) — (10,925) (12) (1,845) (8) (1,855) (778) (9,730) (1,059) (12,947) (549) (16,315) (9) (17,322) (3,410) — — — — — — — — — — (150) (4,359) (3) (4,549) (207) (13,321) — (10,925) — (1,857) — (1,863) — (10,508) — (14,006) — (21,373) — (21,883) — 630,953 — 622,667 1,459 25,583 478 22,869 7,721 44,178 5,669 47,999 20,936 149,778 5,239 128,102 — 11,794 — 9,705 12 1,770 7 1,782 619 8,884 820 11,691 700 20,144 10 21,589 — (646,566) (3,819) (12,543) — (647,707) (15,335) (15,661) (173) (23,820) 4,831 4,203 (1,305) (24,839) (1,008) (936) (8,500) (74,856) (21,954) (26,741) (12,864) (147,214) (93,899) (96,694) (2,359) (92,147) 97,052 85,968 (117) (151,604) 3,219 11,202 833,205 $ 820,662 $ (98) 848,866 $ 833,205 $ (106) 130,893 $135,096 $ (4) 131,829 $130,893 $ (6) 305,349 $278,608 $ 65 402,043 $ 305,349 $ 185 599,181 $685,149 $ 464 587,979 $ 599,181 $ — — — — — — — — — — — — — 36 137 1 (16) 122 158 113 45 1 (123) (77) 36 2,402 781 62 (859) (16) 2,386 3,046 574 83 (1,301) (644) 2,402 505 1,939 65 (220) 1,784 2,289 30 485 1 (11) 475 505 82,101 62,468 1,169 (64,063) (426) 81,675 83,593 61,282 955 (63,729) (1,492) 82,101 12,221 2,393 166 (2,233) 326 12,547 12,241 2,144 167 (2,331) (20) 12,221 28,291 4,467 898 (7,570) (2,205) 26,086 37,149 4,847 1,181 (14,886) (8,858) 28,291 54,894 13,880 1,877 (8,536) 7,221 62,115 55,074 11,962 2,023 (14,165) (180) 54,894 259,402 376,572 14,091 25,829 528,216 425,179 17,300 4,426 276 1,051 38,152 40,012 762 765 34,051 32,526 944 1,371 65,256 88,326 237 8,162 59,886 146,534 295,999 172,322 48,561 33,463 275,291 326,836 28,588 72,178 See notes to financial statements. Annual Report 87 . Statements of Changes in Net Assets continued For the years ended October 31st, Numbers in 000s Payden Corporate Bond Fund Payden Strategic Income Fund 2015 2014(1) 2015 INCREASE (DECREASE) IN NET ASSETS: FROM OPERATIONS: Net investment income . . . .
. . .
. . .
. . .
. . .
. . .
. . .
. . Net realized gains (losses) on investments . .
. . .
. . .
. . .
. Change in net unrealized appreciation/(depreciation) . . .
. . Change in Net Assets Resulting from Operations. .
. . .
. FROM DISTRIBUTIONS TO SHAREHOLDERS: Net investment income: Adviser Class . . .
. . .
. . .
. . .
. . .
. . .
. . .
. . .
. . .
. . .
. Investor Class . . .
. . .
. . .
. . .
. . .
. . .
. . .
. . .
. . .
. . .
. SI Class . . .
. . .
. . .
. . .
. . .
. . .
. . .
. . .
. . .
. . .
. . .
. . Net realized gains from investments: Adviser Class . .
. . .
. . .
. . .
. . .
. . .
. . .
. . .
. . .
. . .
. . Investor Class . .
. . .
. . .
. . .
. . .
. . .
. . .
. . .
. . .
. . .
. . SI Class . .
. . .
. . .
. . .
. . .
. . .
. . .
. . .
. . .
. . .
. . .
. . . Return of capital: Adviser Class .
. . .
. . .
. . .
. . .
. . .
. . .
. . .
. . .
. . .
. . . Investor Class .
. . .
. . .
. . .
. . .
. . .
. . .
. . .
. . .
. . .
. . . Institutional Class .
. . .
. . .
. . .
. . .
. . .
. . .
. . .
. . .
. . . Change in Net Assets from Distributions to Shareholders FROM CAPITAL TRANSACTIONS: Proceeds from fund shares sold: Adviser Class .
. . .
. . .
. . .
. . .
. . .
. . .
. . .
. . .
. . .
. . . Investor Class .
. . .
. . .
. . .
. . .
. . .
. . .
. . .
. . .
. . .
. . . SI Class .
. . .
. . .
. . .
. . .
. . .
. . .
. . .
. . .
. . .
. . .
. . .
. Reinvestment of distributions: Adviser Class . . .
. . .
. . .
. . .
. . .
. . .
. . .
. . .
. . .
. . .
. Investor Class . . .
. . .
. . .
. . .
. . .
. . .
. . .
. . .
. . .
. . .
. SI Class . . .
. . .
. . .
. . .
. . .
. . .
. . .
. . .
. . .
. . .
. . .
. . Cost of fund shares redeemed: Adviser Class . .
. . .
. . .
. . .
. . .
. . .
. . .
. . .
. . .
. . .
. . Investor Class . .
. . .
. . .
. . .
. . .
. . .
. . .
. . .
. . .
. . .
. . SI Class . .
. . .
. . .
. . .
. . .
. . .
. . .
. . .
. . .
. . .
. . .
. . . Change in Net Assets from Capital Transactions .
. . .
. . Total Change in Net Assets . .
. . .
. . .
. . .
. . .
. . .
. NET ASSETS: Beginning of period . . .
. . .
. . .
. . .
. . .
. . .
. . .
. . .
. . . End of period .
. . .
. . .
. . .
. . .
. . .
. . .
. . .
. . .
. . .
. . . Accumulated net investment income/(loss) .
. . .
. . .
. . .
. . FUND SHARES OF BENEFICIAL INTEREST: Adviser Class: Outstanding shares at beginning of period . .
. . .
. . .
. . .
. Shares sold . . .
. . .
. . .
. . .
. . .
. . .
. . .
. . .
. . .
. . .
. . . Shares issued in reinvestment of distributions .
. . .
. . .
. . . Shares redeemed .
. . .
. . .
. . .
. . .
. . .
. . .
. . .
. . .
. . .
. Change in shares outstanding. . .
. . .
. . .
. . .
. . .
. . .
. . . Outstanding shares at end of period .
. . .
. . .
. . .
. . .
. . . Investor Class: Outstanding shares at beginning of period .
. . .
. . .
. . .
. . Shares sold . .
. . .
. . .
. . .
. . .
. . .
. . .
. . .
. . .
. . .
. . .
. Shares issued in reinvestment of distributions . . .
. . .
. . .
. Shares redeemed . . .
. . .
. . .
. . .
. . .
. . .
. . .
. . .
. . .
. . Change in shares outstanding. .
. . .
. . .
. . .
. . .
. . .
. . .
. Outstanding shares at end of period . . .
. . .
. . .
. . .
. . .
. SI Class: Outstanding shares at beginning of period . . .
. . .
. . .
. . . Shares sold .
. . .
. . .
. . .
. . .
. . .
. . .
. . .
. . .
. . .
. . .
. . Shares issued in reinvestment of distributions . .
. . .
. . .
. . Shares redeemed . .
. . .
. . .
. . .
. . .
. . .
. . .
. . .
. . .
. . . Change in shares outstanding.
. . .
. . .
. . .
. . .
. . .
. . .
. . Outstanding shares at end of period . .
. . .
. . .
. . .
. . .
. . LONG TERM INVESTMENT ACTIVITY: Purchase of investments (excluding government). .
. . .
. . . Sale of investments (excluding government) .
. . .
. . .
. . .
. Purchase of government securities. . .
. . .
. . .
. . .
. . .
. . . Sale of government securities .
. . .
. . .
. . .
. . .
. . .
. . .
. . 2014 . . . . $ 2,195 823 (1,445) 1,573 $ 2,332 1,704 1,232 5,268 ................. ................. ................. — (2,118) — — (2,423) — (114) (1,866) (754) (10) (485) (277) ................. ................. ................. — (1,780) — — (942) — (8) (124) (49) — — — . . . . . . . . — — — (3,898) — — — (3,365) (6) (98) (39) (3,058) — — — (772) ................. ................. ................. — 25,274 — — 17,816 — 4,719 72,935 10,695 3,029 62,830 32,542 ................. ................. ................. — 3,868 — — 3,340 — 128 2,033 833 10 465 273 . . . . . — (24,921) — 4,221 1,896 — (19,692) — 1,464 3,367 (952) (21,223) (6,248) 62,920 62,285 (102) (7,587) — 91,460 91,067 ................. ................. ................. 69,646 $ 71,542 $ 29 66,279 $ 69,646 $ — 91,067 $153,352 $ — — $91,067 $ 18 . . . . . . . . . . . . . . . . . . . . . . . . . . . . . . . . . . . . . . . . . . . . . . . . . . . . . . . . . . . . . . . . . . . . . . . . . . . . . . . . . . . . . . . . . . . . . . . . . . . . . . . . . . . . . . . . . . . . . . . . . . . . . . . . . . . . . . . . . . . . . . . . . . . . . . . . . . . . . . . . . . . . . . . . . . . . . . . . . . . . . . . . . . . . . . . . . . . . . . . . . . . . 2,687 (231) (33) 2,423 $ 735 264 (620) 379 . . . . . . . . . . . . . . . . . . . . . . . . . . . . . . . . . . . . . . . . . . . . . . . . . . . . . . . . . . . . . . . . . . . . . . . . . . . . . . . . . . . . . . . . . . . . . . . . . . . . . . — — — — — — — — — — — — 294 473 13 (96) 390 684 — 303 1 (10) 294 294 . . . . . . . . . . . . . . . . . . . . . . . . . . . . . . . . . . . . . . . . . . . . . . . . . . . . . . . . . . . . . . . . . . . . . . . . . . . . . . . . . . . . . . . . . . . . . . . . . . . . . . 6,125 2,283 350 (2,238) 395 6,520 5,996 1,577 301 (1,749) 129 6,125 5,546 7,305 204 (2,128) 5,381 10,927 — 6,255 46 (755) 5,546 5,546 . . . . . . . . . . . . . . . . . . . . . . . . . . . . . . . . . . . . . . . . . . . . . . . . . . . . . . . . . . . . . . . . . . . . . . . . . . . . . . . . . . . . . . . . . . . . . . . . . . . . . . — — — — — — — — — — — — 3,273 1,061 84 (624) 521 3,794 — 3,246 27 — 3,273 3,273 . . . . . . . . . . . . . . . . . . . . . . . . . . . . . . . . . . . . . . . . . . . . . . . . . . . . . . . . . . . . . . . . . . . . 79,672 73,694 — — 65,983 67,441 — — 86,658 36,290 5,476 2,368 83,086 10,189 5,320 104 (1) Fund commenced operations on May 8, 2014. (2) Fund commenced operations on November 6, 2014. (3) Fund commenced operations on November 11, 2013. See notes to financial statements. 88 Payden Mutual Funds $ . Payden Absolute Return Bond Fund 2015(2) $ 867 (237) (117) 513 Payden Floating Rate Fund 2015 2014(3) $ 5,528 (1,527) 622 4,623 $ Payden High Income Fund 2015 2014 3,980 565 (1,838) 2,707 $ 35,359 (20,546) (21,372) (6,559) $ 45,040 26,658 (26,714) 44,984 Payden California Municipal Income Fund 2015 2014 $ 974 549 (700) 823 $ 1,001 341 833 2,175 — (541) (354) (3) (1,645) (3,810) (1) (1,357) (2,596) (551) (35,146) — (225) (45,147) — — (974) — — (1,001) — — — — — (160) (408) — — — (140) (26,457) — (128) (23,951) — — (342) — — (246) — — — — (895) — — — (6,026) — — — (3,954) — — — (62,294) — — — (69,451) — — — (1,316) — — — (1,247) 46 42,664 19,135 659 19,388 6,951 40 86,086 142,964 51,663 123,488 — 982 114,159 — — 12,840 — — 11,205 — — 540 254 3 1,761 3,122 1 1,180 1,723 395 46,728 — 346 51,530 — — 1,012 — — 1,020 — (10) (839) (421) 61,369 60,987 (575) (24,795) (4,924) 1,590 187 — (40,404) (23,918) 167,672 166,425 (35,242) (232,997) — (45,965) (114,818) (2,118) (299,042) — (134,143) (158,610) — (14,150) — (298) (791) — (9,729) — 2,496 3,424 — $60,987 $ 89 166,425 $166,612 $ 95 — $166,425 $ 26 738,634 $ 623,816 $ 171 897,244 $ 738,634 $ 434 46,729 $ 45,938 $ (4) 43,305 $46,729 $ (4) — 5 — (1) 4 4 4 66 — (57) 9 13 — 4 — — 4 4 560 7,827 61 (5,349) 2,539 3,099 671 136 49 (296) (111) 560 — — — — — — — — — — — — — 4,275 54 (84) 4,245 4,245 4,673 1,949 177 (2,503) (377) 4,296 — 8,555 118 (4,000) 4,673 4,673 103,767 18,661 7,076 (35,134) (9,397) 94,370 122,531 15,878 7,244 (41,886) (18,764) 103,767 4,449 1,236 97 (1,361) (28) 4,421 4,217 1,079 99 (946) 232 4,449 — 1,913 25 (42) 1,896 1,896 12,008 700 313 (490) 523 12,531 — 14,209 172 (2,373) 12,008 12,008 — — — — — — — — — — — — — — — — — — — — — — — — 67,321 21,172 8,772 2,990 61,337 68,747 1,350 — 179,401 19,297 1,800 2,059 199,578 306,860 5,950 — 336,062 485,948 — — 19,466 21,103 — — 23,016 20,593 — — See notes to financial statements. Annual Report 89 . Statements of Changes in Net Assets continued For the years ended October 31st Numbers in 000s INCREASE (DECREASE) IN NET ASSETS: FROM OPERATIONS: Net investment income . . . .
. . .
. . .
. . .
. . .
. . .
. . .
. . Net realized gains (losses) on investments . .
. . .
. . .
. . .
. Change in net unrealized appreciation/(depreciation) . . .
. . Change in Net Assets Resulting from Operations. .
. . .
. FROM DISTRIBUTIONS TO SHAREHOLDERS: Net investment income: Adviser Class . . .
. . .
. . .
. . .
. . .
. . .
. . .
. . .
. . .
. . .
. Investor Class . . .
. . .
. . .
. . .
. . .
. . .
. . .
. . .
. . .
. . .
. SI Class . . .
. . .
. . .
. . .
. . .
. . .
. . .
. . .
. . .
. . .
. . .
. . Net realized gains from investments: Adviser Class . .
. . .
. . .
. . .
. . .
. . .
. . .
. . .
. . .
. . .
. . Investor Class . .
. . .
. . .
. . .
. . .
. . .
. . .
. . .
. . .
. . .
. . SI Class . .
. . .
. . .
. . .
. . .
. . .
. . .
. . .
. . .
. . .
. . .
. . . Return of capital: Adviser Class .
. . .
. . .
. . .
. . .
. . .
. . .
. . .
. . .
. . .
. . . Investor Class .
. . .
. . .
. . .
. . .
. . .
. . .
. . .
. . .
. . .
. . . SI Class .
. . .
. . .
. . .
. . .
. . .
. . .
. . .
. . .
. . .
. . .
. . .
. Change in Net Assets from Distributions to Shareholders FROM CAPITAL TRANSACTIONS: Proceeds from fund shares sold: Adviser Class . . .
. . .
. . .
. . .
. . .
. . .
. . .
. . .
. . .
. . .
. Investor Class . . .
. . .
. . .
. . .
. . .
. . .
. . .
. . .
. . .
. . .
. SI Class . . .
. . .
. . .
. . .
. . .
. . .
. . .
. . .
. . .
. . .
. . .
. . Reinvestment of distributions: Adviser Class . .
. . .
. . .
. . .
. . .
. . .
. . .
. . .
. . .
. . .
. . Investor Class . .
. . .
. . .
. . .
. . .
. . .
. . .
. . .
. . .
. . .
. . SI Class . .
. . .
. . .
. . .
. . .
. . .
. . .
. . .
. . .
. . .
. . .
. . . Cost of fund shares redeemed: Adviser Class .
. . .
. . .
. . .
. . .
. . .
. . .
. . .
. . .
. . .
. . . Investor Class .
. . .
. . .
. . .
. . .
. . .
. . .
. . .
. . .
. . .
. . . SI Class .
. . .
. . .
. . .
. . .
. . .
. . .
. . .
. . .
. . .
. . .
. . .
. Proceeds from redemption fees (Note 3): Investor Class . . .
. . .
. . .
. . .
. . .
. . .
. . .
. . .
. . .
. . .
. Change in Net Assets from Capital Transactions . . .
. . . Total Change in Net Assets .
. . .
. . .
. . .
. . .
. . .
. . NET ASSETS: Beginning of period . .
. . .
. . .
. . .
. . .
. . .
. . .
. . .
. . .
. End of period . . .
. . .
. . .
. . .
. . .
. . .
. . .
. . .
. . .
. . .
. Accumulated net investment income/(loss) . . .
. . .
. . .
. . . FUND SHARES OF BENEFICIAL INTEREST: Adviser Class: Outstanding shares at beginning of period .
. . .
. . .
. . .
. . Shares sold . .
. . .
. . .
. . .
. . .
. . .
. . .
. . .
. . .
. . .
. . .
. Shares issued in reinvestment of distributions . . .
. . .
. . .
. Shares redeemed . . .
. . .
. . .
. . .
. . .
. . .
. . .
. . .
. . .
. . Change in shares outstanding. .
. . .
. . .
. . .
. . .
. . .
. . .
. Outstanding shares at end of period . . .
. . .
. . .
. . .
. . .
. Investor Class: Outstanding shares at beginning of period . . .
. . .
. . .
. . . Shares sold .
. . .
. . .
. . .
. . .
. . .
. . .
. . .
. . .
. . .
. . .
. . Shares issued in reinvestment of distributions . .
. . .
. . .
. . Shares redeemed . .
. . .
. . .
. . .
. . .
. . .
. . .
. . .
. . .
. . . Change in shares outstanding.
. . .
. . .
. . .
. . .
. . .
. . .
. . Outstanding shares at end of period . .
. . .
. . .
. . .
. . .
. . SI Class: Outstanding shares at beginning of period . .
. . .
. . .
. . .
. Shares sold . . .
. . .
. . .
. . .
. . .
. . .
. . .
. . .
. . .
. . .
. . . Shares issued in reinvestment of distributions .
. . .
. . .
. . . Shares redeemed .
. . .
. . .
. . .
. . .
. . .
. . .
. . .
. . .
. . .
. Change in shares outstanding. . .
. . .
. . .
. . .
. . .
. . .
. . . Outstanding shares at end of period .
. . .
. . .
. . .
. . .
. . . LONG TERM INVESTMENT ACTIVITY: Purchase of investments (excluding government).
. . .
. . .
. Sale of investments (excluding government) . . .
. . .
. . .
. . Purchase of government securities. .
. . .
. . .
. . .
. . .
. . .
. Sale of government securities . . .
. . .
. . .
. . .
. . .
. . .
. . . Payden Global Low Duration Fund 2015 2014 . . . . . . . . . . . . . . . . . . . . . . . . . . . . . . . . . . . . . . . . . . . . . . . . . . . . . . . . . . . . . . . . . . . . $ 1,460 (51) (1,033) 376 1,606 1,001 (830) 1,777 $ 1,104 1,250 (1,198) 1,156 $ 1,085 2,079 (585) 2,579 ................. ................. ................. — (202) — — (1,577) — — (1,243) — — (925) — ................. ................. ................. — — — — — — — — — — — — . . . . — (1,293) — (1,495) — — — (1,577) — — — (1,243) — (133) — (1,058) ................. ................. ................. — 40,486 — — 54,242 — — 45,868 — — 16,570 — ................. ................. ................. — 1,465 — — 1,446 — — 1,181 — — 1,016 — ................. ................. ................. — (50,453) — — (28,969) — — (17,348) — — (8,349) — ................. ................. ................. — (8,502) (9,621) — 26,719 26,919 — 29,701 29,614 — 9,237 10,758 ................. ................. ................. 139,965 $130,344 $ — 113,046 $139,965 $ 29 50,679 $ 80,293 $ — 39,921 $50,679 $ — . . . . . . . . . . . . . . . . . . . . . . . . . . . . . . . . . . . . . . . . . . . . . . . . . . . . . . . . . . . . . . . . . . . . . . . . . . . . . . . . . . . . . . . . . . . . . . . . . . . . . . . . . . . . . . . . . . . . . . . . . . . . . . . . . . . . . . . . . . . . . . . . . . . . . . . . . . . . . . . . . . . . . . — — — — — — — — — — — — — — — — — — — — — — — — . . . . . . . . . . . . . . . . . . . . . . . . . . . . . . . . . . . . . . . . . . . . . . . . . . . . . . . . . . . . . . . . . . . . . . . . . . . . . . . . . . . . . . . . . . . . . . . . . . . . . . 13,857 4,025 145 (5,001) (831) 13,026 11,219 5,361 143 (2,866) 2,638 13,857 5,733 5,137 132 (1,951) 3,318 9,051 4,678 1,903 117 (965) 1,055 5,733 . . . . . . . . . . . . . . . . . . . . . . . . . . . . . . . . . . . . . . . . . . . . . . . . . . . . . . . . . . . . . . . . . . . . . . . . . . . . . . . . . . . . . . . . . . . . . . . . . . . . . . — — — — — — — — — — — — — — — — — — — — — — — — . . . . . . . . . . . . . . . . . . . . . . . . . . . . . . . . . . . . . . . . . . . . . . . . . . . . . . . . . . . . . . . . . . . . 41,834 61,908 1,789 3,745 96,918 67,993 2,970 231 55,119 26,073 — — 31,466 23,323 — — (1) Fund commenced operations on November 11, 2013. See notes to financial statements. 90 Payden Mutual Funds $ Payden Global Fixed Income Fund 2015 2014 .
Payden Emerging Markets Bond Fund 2015 2014 $ 46,944 (17,985) (52,587) (23,628) $ 45,137 (18,479) 33,478 60,136 (1,218) (20,184) (24,842) Payden Emerging Markets Local Bond Fund 2015 2014 $ Payden Emerging Markets Corporate Bond Fund 2015 2014(1) Payden Equity Income Fund 2015 2014 7,842 (28,808) (7,525) (28,491) $ 11,408 (18,705) (809) (8,106) $ 1,743 (558) (1,733) (548) $ 1,865 710 1,008 3,583 $ 14,020 (2,318) 1,237 12,939 $ 8,462 13,326 24,247 46,035 (728) (17,826) (19,754) — — — — — — (1) (63) (1,658) (1) (416) (1,430) (121) (7,963) (7,020) (73) (4,643) (912) — — — (64) (1,570) (1,452) — — — — — — — (27) (703) — — — (142) (8,590) (5,610) (37) (1,791) — — — — (46,244) (122) (2,994) (3,318) (47,828) (15) (7,658) — (7,673) (20) (11,282) — (11,302) — — — (2,452) — — — (1,847) — — — (29,446) — — — (7,456) 14,036 182,808 83,704 9,486 104,990 46,594 2 59,947 — 293 43,062 — 280 240 1,000 256 16,431 46,246 471 63,261 89,159 621 232,009 180,071 1,160 18,869 23,830 841 20,914 23,468 14 5,039 — 20 7,554 — 2 89 539 1 416 261 250 16,272 11,088 102 6,245 912 (5,410) (133,459) (3,604) (9,071) (215,070) (25,855) (166) (77,758) — (395) (104,808) — (479) (337) (5,718) (40) (16,046) (5,860) (762) (64,203) (2,364) (877) (206,778) (103) — 181,934 112,062 4 (43,699) (31,391) — (12,922) (49,086) — (54,274) (73,682) — (4,384) (7,384) — 41,665 43,401 — 113,172 96,665 — 212,202 250,781 852,047 $ 964,109 $ 2,370 883,438 $ 852,047 $ — 175,225 $126,139 $ — 248,907 $ 175,225 $ — 43,401 $36,017 $ 18 — $ 43,401 $ — 466,699 $563,364 $ 1,352 215,918 $ 466,699 2,036 1,526 1,044 86 (405) 725 2,251 1,448 676 61 (659) 78 1,526 47 — 2 (24) (22) 25 57 33 2 (45) (10) 47 21 28 — (47) (19) 2 — 25 — (4) 21 21 329 34 18 (54) (2) 327 338 47 8 (64) (9) 329 26,923 13,481 1,404 (9,965) 4,920 31,843 33,423 7,601 1,511 (15,612) (6,500) 26,923 20,626 7,873 683 (10,271) (1,715) 18,911 26,632 4,899 861 (11,766) (6,006) 20,626 147 24 9 (34) (1) 146 — 1,642 41 (1,536) 147 147 19,126 4,471 1,165 (4,642) 994 20,120 16,746 16,810 468 (14,898) 2,380 19,126 31,951 6,202 1,774 (265) 7,711 39,662 28,793 3,312 1,693 (1,847) 3,158 31,951 — — — — — — — — — — — — 4,005 103 54 (568) (411) 3,594 — 4,544 25 (564) 4,005 4,005 12,978 6,261 795 (168) 6,888 19,866 — 12,921 64 (7) 12,978 12,978 670,779 493,181 — — 601,459 641,390 — — 153,461 163,724 — — 193,904 237,826 — — 35,213 40,989 — — 79,904 39,219 — — 357,104 258,702 — — 371,706 157,866 — — See notes to financial statements. Annual Report 91 . Notes to Financial Statements October 31, 2015 1. Organization and Related Matters The Payden & Rygel Investment Group (the “Group” or “Paydenfunds”) is a no-load, open-end registered investment company organized as a Massachusetts business trust on January 22, 1992 and registered under the Investment Company Act of 1940 (the “1940 Act”), as amended. Each of its nineteen funds (each a “Fund,” collectively the “Funds”) is a series of the Group, and is authorized to issue unlimited shares at $0.001 par value. This report includes eighteen of the Funds.
The Payden/Kravitz Cash Balance Plan Fund is contained in a separate report. Each of the Funds, other than the Cash Reserves Money Market and High Income Funds, has been classified as non-diversified. Effective February 28, 2015, Institutional Class changed its name to the SI Class. 2. Significant Accounting Policies The following is a summary of significant accounting policies followed by the Funds. The Financial Accounting Standards Board (“FASB”) Accounting Standards Codification (“ASC”) is the exclusive reference of authoritative U.S.
generally accepted accounting principles (“GAAP”) recognized by the FASB to be applied by nongovernmental entities. Rules and interpretive releases of the Securities and Exchange Commission (“SEC”) under authority of federal laws are also sources of authoritative GAAP for SEC registrants. Each Fund’s financial statements are prepared in accordance with GAAP. The Funds are considered investment companies under FASB ASC 946, Financial Services - Investment Companies. The preparation of financial statements in conformity with GAAP requires management to make estimates and assumptions that affect the reported amounts of assets and liabilities and disclosure of contingent assets and liabilities at the date of the financial statements and the reported amounts of income and expenses during the reporting period.
Actual results could differ from those estimates. Securities Valuation Domestic and foreign fixed income securities and other assets for which market quotations are readily available (other than obligations with original maturities of sixty days or less) are valued on the basis of quotes obtained from brokers and dealers or pricing services. Such quotations take into account appropriate factors such as institutional-sized trading in similar groups of securities, yield, quality, coupon rate, maturity, type 92 Payden Mutual Funds of issue, trading characteristics and other data. Debt securities with original maturities of sixty days or less and securities in the Cash Reserves Money Market Fund are valued at amortized cost, which approximates fair value. Publicly traded equity securities, whether in the U.S.
or outside the U.S., for which market quotations are readily available, generally will be valued at the official closing price or the last sale price on the exchange or market where they are principally traded, or if there have been no sales during the day, at the last bid price. Securities traded only on the over-the-counter (“OTC”) market are valued at the latest bid price. Investments in investment companies are valued at their net asset values as reported by such companies. Options, futures, swaps and other similar instruments are valued at the official closing price, in the case of exchange traded derivatives, or on the basis of information provided by pricing services, quotes obtained from brokers and dealers, and market trades in the case of other securities. Fixed income or equity securities for which market quotations are not readily available are priced at their fair value as determined in good faith under procedures established pursuant to the Valuation and Liquidity Guidelines applicable to each of the Funds.
In considering fair value of a security, one or more factors are taken into consideration depending on the circumstances at the time, including for example: the cost of the security or the last reported sales price of the security as a starting point; changes in interest rates; changes in yield spreads of similarly rated or structured securities; fundamental analytical information relating to the security; the value of other similar securities traded on other markets or among dealers; the general financial condition of the issuer; recent developments affecting the issuer; information, including price quotations, from other financial institutions or analysts; or government actions or pronouncements and other significant events affecting the economy, the markets, the fundamental value of the issuer or of the issuer’s industry. Shares of open-end investment companies are valued at their respective net asset value. Fair value pricing adjustments may occur when (1) developments occur (a “significant event”) that will affect the value of a Fund’s holdings, and (2) the significant event occurs after the close of the markets on which the securities trade, but before the time when the net asset value is computed for a Fund. A significant event may relate to a single issuer or an entire market. . Risks Unforeseen events in the markets may at times result in an unusually high degree of volatility in the markets, which could adversely affect the Funds causing a decline in value. Investing in debt securities may include failure of an issuer to make timely interest or principal payments, or a decline or the perception of a decline in credit quality. In addition, the value of the debt security may decline due to general market conditions that are not specifically related to a particular company including industry earnings outlook, changes in interest or currency rates or perception of a specific industry. Investing in foreign securities may include certain risks and considerations not typically associated with investing in U.S. securities, such as fluctuating currency values and changing local and regional economic, political and social conditions, which may result in greater market volatility. In addition, certain foreign securities may not be as liquid as U.S. securities. An investment in the Payden Cash Reserves Money Market Fund is not insured or guaranteed by the Federal Deposit Insurance Corporation or any other government agency. Although the Fund seeks to preserve the value of your investment at $1.00 per share, it is possible to lose money by investing in the Fund. Investment Transactions and Related Income Investment transactions are accounted for on the date the security is purchased or sold (trade date) for financial reporting purposes.
Interest income is recognized on an accrual basis. Premiums and discounts are amortized or accreted over the expected life of the security using the effective interest method. Dividend income is recorded on the ex-dividend date. Realized gains or losses on investment transactions are determined on the identified cost basis. Bank Loans Floating-Rate Loan Interests (“Bank Loans”) in which the Fund invests generally pay interest at rates which are periodically predetermined by reference to a base lending rate plus a premium. These base lending rates are generally (i) the lending rate offered by one or more major European banks, such as the London Inter-Bank Offered Rate (“LIBOR”), (ii) the prime rate offered by one or more United States banks or (iii) the certificate of deposit rate.
Certain Bank Loans are subject to a LIBOR floor that establishes a minimum LIBOR rate. The interest rate shown on the Schedule of Investments reflects the rate in effect at October 31st. When a range of rates is disclosed, the Fund holds more than one position within the same tranche at varying rates. Foreign Currency Translation The accounting records of the Funds are maintained in U.S. dollars.
Each of the Funds (except Cash Reserves Money Market, U.S. Government, GNMA and California Municipal Income Funds) may purchase securities that are denominated in foreign currencies. Investment securities and other assets and liabilities denominated in a foreign currency are translated into U.S.
dollars at the current exchange rates. Purchases and sales of securities, income and expenses are translated into U.S. dollars at the exchange rates on the dates of the respective transactions. Each of these Funds does not isolate that portion of the results of operations resulting from changes in foreign exchange rates from the fluctuations arising from changes in security prices. Reported net realized foreign exchange gains or losses arise from purchases and sales and maturities of securities, purchases and sales of foreign currencies, currency gains or losses realized between the trade and settlement dates of securities transactions, and the differences between the amounts of income or expenses recorded on each of these Fund’s books and the U.S.
dollar equivalents of the amounts actually received or paid. Net unrealized appreciation/depreciation from translation of assets and liabilities denominated in foreign currency arise from changes in the value of assets and liabilities resulting from changes in the foreign exchange rates. Repurchase Agreements The Payden Cash Reserves Money Market Fund entered into repurchase agreements (agreements to purchase U.S. Treasury notes and bills, subject to the seller’s agreement to repurchase them at a specified time and price) with well-established registered securities dealers or banks.
Repurchase agreements are the equivalent of loans by the Fund. With respect to such agreements, it is the Fund’s policy to take possession of the underlying securities, except for tri-party agreements where an independent custodian takes possession. On a daily basis the Fund or the tri-party custodian mark-to-market such securities to ensure that the value, including accrued interest, is at least equal to the amount to be repaid to the Fund under the agreement.
If the seller defaults, and the fair value of the collateral declines, realization of the collateral by the Fund may be delayed or limited. Master Repurchase Agreements (“MRA”) permit the Fund, under certain circumstances, including an event of default (such as bankruptcy or insolvency), to offset payables and/or Annual Report 93 . Notes to Financial Statements continued receivables under the MRA with collateral held and/or posted to the counterparty and create one single net payment due to or from the Fund. However, bankruptcy or insolvency laws of a particular jurisdiction may impose restrictions on or prohibitions against such a right of offset in the event of the MRA counterparty’s bankruptcy or insolvency. Pursuant to the terms of the MRA, the Fund receives or posts securities as collateral with a market value in excess of the repurchase price to be paid or received by the Fund upon the maturity of the transaction. Upon a bankruptcy or insolvency of the MRA counterparty, the Fund is considered an unsecured creditor with respect to excess collateral and, as such, the return of excess collateral may be delayed. The Payden Cash Reserves Money Market Fund’s repurchase agreements by counterparty, which are subject to offset under a MRA, is included within the Fund’s Schedule of Investments. For financial statement purposes, the Fund does not offset financial assets and financial liabilities, that are subject to MRA on the Statement of Assets and Liabilities. Forward Currency Contracts Some Funds entered into forward contracts to protect against adverse currency movements or as speculative investments.
The forward currency contracts are adjusted by the daily exchange rate of the underlying currency and any gains or losses are recorded for financial statement purposes as unrealized gain or loss until the contact settlement date or an offsetting forward currency contract has been executed, at which time the Fund records a realized gain or loss equal to the difference between the value of the contract at the time it was opened and the value at the time it was closed. Risk may arise upon entering into these contracts from the potential inability of counterparties to meet the terms of their contracts and from unanticipated movements in the value of a foreign currency relative to the U.S. dollar. Futures Contracts Some Funds entered into futures transactions to enhance potential gain in circumstances where hedging is not involved. The purchase or sale of futures contracts and options on futures contracts provides for the future sale by one party and purchase by another party of a specified quantity of a financial instrument or foreign currency at a fixed price on a future date. Upon entering into such a contract, a Fund is required to deposit and maintain initial margin deposit of cash or securities as required by the exchange on which the contract is traded. 94 Payden Mutual Funds Pursuant to the contract, that Fund agrees to receive from or pay to the broker an amount equal to the daily fluctuations in the value of the contract.
Such receipts or payments are known as variation margin and are recorded as unrealized gains or losses by that Fund. When the contract is closed, that Fund records a realized gain or loss equal to the difference between the value of the contract at the time it was opened and the value at the time it was closed. The potential risk to the Funds is that the change in value of the underlying securities may not correlate to the change in value of the contracts. Stock index futures contracts are an agreement pursuant to which two parties agree to take or make delivery of an amount of cash equal to the difference between the value of the index at the close of the last trading day of the contract and the price at which the index contract was originally written.
Variation margin accounting procedures apply to these index futures contracts. Each Fund invests in these futures contracts to permit the Fund to meet its objectives at a lower cost than investing directly in equity securities, while permitting the equivalent of an investment in a portfolio of equity securities. The potential risk to a Fund is that the change in value of the underlying index may not correlate to the change in value of the contracts. Swap Contracts Some Funds may enter into swap agreements, in which a Fund and a counterparty agree either to make periodic net payments on a specified notional amount or a net payment upon termination.
Swap agreements are privately negotiated in the OTC market and may be entered into as a bilateral contract (“OTC swaps”) or centrally cleared (“centrally cleared swaps”). Swaps are marked-to-market daily and changes in value are recorded as unrealized appreciation (depreciation) and realized gain/(loss) is recorded at termination of the contract. Swap transactions involve, to varying degrees, elements of interest rate, credit and market risk in excess of the amounts recognized in the Statement of Assets and Liabilities. Such risks involve the possibility that there will be no liquid market for these agreements, that the counterparty to the agreements may default on its obligation to perform or disagree as to the meaning of the contractual terms in the agreements, and that there may be unfavorable changes in interest rates, credit spreads and/or market values associated with these transactions. A Fund may enter into credit default swaps to manage its exposure to the market or certain sectors of the market, to reduce its risk exposure to defaults of corporate and/or sovereign issuers or to create exposure to corporate and/or sovereign issuers to which it is not otherwise exposed (credit risk). A .
Fund may either buy or sell (write) credit default swaps on single-name issuers (corporate or sovereign), a combination or basket of single-name issuers or traded indexes. Credit default swaps on single-name issuers are agreements in which the protection buyer pays fixed periodic payments to the seller in consideration for a guarantee from the protection seller to make a specific payment should a negative credit event take place with respect to the referenced entity (e.g., bankruptcy, failure to pay, obligation accelerators, repudiation, moratorium or restructuring). Credit default swaps on traded indexes are agreements in which the buyer pays fixed periodic payments to the seller in consideration for a guarantee from the seller to make a specific payment should a write-down, principal or interest shortfall or default of all or individual underlying securities included in the index occur. As a buyer, if an underlying credit event occurs, the Fund will either (i) receive from the seller an amount equal to the notional amount of the swap and deliver the referenced security or underlying securities comprising the index, or (ii) receive a net settlement of cash equal to the notional amount of the swap less the recovery value of the security or underlying securities comprising the index. As a seller (writer), if an underlying credit event occurs, the Fund will either pay the buyer an amount equal to the notional amount of the swap and take delivery of the referenced security or underlying securities comprising the index or pay a net settlement of cash equal to the notional amount of the swap less the recovery value of the security or underlying securities comprising the index. A Fund may enter into total return swaps to obtain exposure to a security or market without owning such security or investing directly in that market or to transfer the risk/return of one market (e.g., fixed income) to another market (e.g., equity) (equity risk and/or interest rate risk).
Total return swaps are agreements in which there is an exchange of cash flows whereby one party commits to make payments based on the total return (coupons plus capital gains/losses) of an underlying instrument in exchange for fixed or floating rate interest payments. To the extent the total return of the instrument or index underlying the transaction exceeds or falls short of the offsetting interest rate obligation, the Fund will receive a payment from or make a payment to the counterparty. A Fund may enter into interest rate swaps to gain or reduce exposure to interest rates or to manage duration, the yield curve or interest rate risk by economically hedging the value of the fixed rate bonds which may decrease when interest rates rise (interest rate risk). Interest rate swaps are agreements in which one party pays a stream of interest payments, either fixed or floating rate, for another party’s stream of interest payments, either fixed or floating, on the same notional amount for a specified period of time.
In more complex swaps, the notional principal amount may decline (or amortize) over time. For financial reporting purposes, swap interest and amortization is classified as realized or unrealized gain or loss on swap contracts. Options Transactions Option techniques may be utilized by a Fund to hedge against changes in interest rates, foreign currency exchange rates or security prices in order to establish more definitely the effective return on securities or currencies held or intended to be acquired by the Fund, to reduce the volatility of the currency exposure associated with investment in non-U.S. securities, or as an efficient means of adjusting exposure to the bond, equity and currency markets. In addition, the Fund may enter into such transactions to enhance potential gain in circumstances where hedging is not involved.
When a Fund writes a covered call or put option, an amount equal to the premium received is reflected as an asset and equivalent liability. The amount of the liability is subsequently marked-to-market to reflect the current value of the option. If an option expires on its stipulated expiration date or if the Fund enters into a closing purchase transaction, a gain or loss is realized.
If a written call option is exercised, a gain or loss is realized for the sale of the underlying security and the proceeds from the sale are increased by the premium originally received. If a written put option is exercised, the cost of the security acquired is decreased by the premium originally received. As writer of an option, the Fund has no control over whether the underlying securities are subsequently sold (call) or purchased (put) and, as a result, bears the market risk of an unfavorable change in the price of the security underlying the written option. When the Fund purchases a call or put option, an amount equal to the premium paid is included in the Fund’s Statement of Assets and Liabilities as an investment, and is subsequently marked-to-market to reflect the current value of the option.
If an option expires on the stipulated expiration date or if a Fund enters into a closing sale transaction, a gain or loss is realized. If the Fund exercises a call option, the cost of the security acquired is increased by the premium paid for the call. If the Fund exercises a put option, a gain or loss is realized from the sale of the underlying security, and the proceeds from such sale are decreased by the premium originally paid.
Written and purchased options are non-income producing securities. Annual Report 95 . Notes to Financial Statements continued Derivative Financial Instruments The Funds engage in various portfolio investment strategies using derivative contracts both to increase the returns of the Fund and/or to economically hedge its exposure to certain risks such as credit risk, equity risk, interest rate risk and foreign currency exchange rate risk. These contracts may be transacted on an exchange or OTC. The following tables show the Funds’ exposure to different types of market risks as it relates to derivative investments in the Statements of Assets and Liabilities and the Statements of Operations. Statement of Assets and Liabilities Fair Values of Derivative Instruments as of October 31, 2015 (000s) Underlying Risk Derivative Derivative Assets ($) Liabilities ($) Limited Maturity Interest rate1 . . .
. . .
. . .
. . .
. . .
. . .
. . .
. . .
. . .
. . .
. Foreign currency2,3 . . .
. . .
. . .
. . .
. . .
. . .
. . .
. . .
. . . Total .
. . .
. . .
. . .
. . .
. . .
. . .
. . .
. . .
. . .
. . .
. . .
. 2 128 130 — (187) (187) Low Duration Credit 4 . . .
. . .
. . .
. . .
. . .
. . .
. . .
. . .
. . .
. . .
. . .
. . Interest rate1,5 . .
. . .
. . .
. . .
. . .
. . .
. . .
. . .
. . .
. . .
. Foreign currency2,3 . . .
. . .
. . .
. . .
. . .
. . .
. . .
. . .
. . . Total .
. . .
. . .
. . .
. . .
. . .
. . .
. . .
. . .
. . .
. . .
. . .
. — 52 173 225 (146) — (84) (230) U.S. Government Interest rate1,5 . .
. . .
. . .
. . .
. . .
. . .
. . .
. . .
. . .
. . .
. 1 (40) GNMA Interest rate1,5 . . .
. . .
. . .
. . .
. . .
. . .
. . .
. . .
. . .
. . . 27 — Core Bond Interest rate5 .
. . .
. . .
. . .
. . .
. . .
. . .
. . .
. . .
. . .
. . . Foreign currency2,3 .
. . .
. . .
. . .
. . .
. . .
. . .
. . .
. . .
. . Total . .
. . .
. . .
. . .
. . .
. . .
. . .
. . .
. . .
. . .
. . .
. . . 334 561 895 (52) (560) (612) Corporate Bond Interest rate5 .
. . .
. . .
. . .
. . .
. . .
. . .
. . .
. . .
. . .
. . . Foreign currency2,3 .
. . .
. . .
. . .
. . .
. . .
. . .
. . .
. . .
. . Total . .
. . .
. . .
. . .
. . .
. . .
. . .
. . .
. . .
. . .
. . .
. . . 33 25 58 (29) (11) (40) Strategic Income Interest rate5 .
. . .
. . .
. . .
. . .
. . .
. . .
. . .
. . .
. . .
. . . Foreign currency2,3 .
. . .
. . .
. . .
. . .
. . .
. . .
. . .
. . .
. . Total . .
. . .
. . .
. . .
. . .
. . .
. . .
. . .
. . .
. . .
. . .
. . . 72 136 208 (10) (121) (131) Derivative Derivative Assets ($) Liabilities ($) Underlying Risk Absolute Return Bond Interest rate5 .
. . .
. . .
. . .
. . .
. . .
. . .
. . .
. . .
. . .
. . . Foreign currency2,3 .
. . .
. . .
. . .
. . .
. . .
. . .
. . .
. . .
. . Equity1. .
. . .
. . .
. . .
. . .
. . .
. . .
. . .
. . .
. . .
. . .
. . .
. Total . . .
. . .
. . .
. . .
. . .
. . .
. . .
. . .
. . .
. . .
. . .
. . 15 51 12 78 (24) (51) — (75) High Income Interest rate5 . .
. . .
. . .
. . .
. . .
. . .
. . .
. . .
. . .
. . .
. . Foreign currency2,3 . .
. . .
. . .
. . .
. . .
. . .
. . .
. . .
. . .
. Total . . .
. . .
. . .
. . .
. . .
. . .
. . .
. . .
. . .
. . .
. . .
. . — 347 347 (179) (379) (558) Global Low Duration Credit4 . .
. . .
. . .
. . .
. . .
. . .
. . .
. . .
. . .
. . .
. . .
. . .
. Interest rate1,5 . . .
. . .
. . .
. . .
. . .
. . .
. . .
. . .
. . .
. . . Foreign currency2,3 .
. . .
. . .
. . .
. . .
. . .
. . .
. . .
. . .
. . Total . .
. . .
. . .
. . .
. . .
. . .
. . .
. . .
. . .
. . .
. . .
. . . — 9 103 112 (26) (40) (50) (116) Global Fixed Income Interest rate5 .
. . .
. . .
. . .
. . .
. . .
. . .
. . .
. . .
. . .
. . . Foreign currency2,3 .
. . .
. . .
. . .
. . .
. . .
. . .
. . .
. . .
. . Total . .
. . .
. . .
. . .
. . .
. . .
. . .
. . .
. . .
. . .
. . .
. . . 88 477 565 (53) (395) (448) Emerging Markets Bond Foreign currency2,3 .
. . .
. . .
. . .
. . .
. . .
. . .
. . .
. . .
. . 270 (1,269) Emerging Markets Local Bond Foreign currency2,3 . .
. . .
. . .
. . .
. . .
. . .
. . .
. . .
. . .
. 6 (203) Emerging Markets Corporate Bond Foreign currency2,3 . . .
. . .
. . .
. . .
. . .
. . .
. . .
. . .
. . . 5 (30) Statement of Assets and Liabilities location: 1 Includes options purchased at value as reported in the Schedule of Investments. 2 Payable for forward currency contracts. 3 Receivable for forward currency contracts. 4 Payable for swap contracts. 5 Includes cumulative appreciation/depreciation of futures contracts as reported in Schedule of Investments.
Only last day’s variation margin is reported within the Statement of Assets and Liabilities as Receivable/Payable for futures. The Effect of Derivative Instruments on the Statement of Operations For the Period Ended October 31, 2015 (000s) Amount of Realized Gain or (Loss) on Derivatives Recognized in Income Forward Currency Underlying risk Futures1 Contracts2 Options3 Swaps4 Total Limited Maturity Interest rate . . .
. . .
. . .
. . .
. . $ (424) — $ (32) — $ (456) Foreign exchange .
. . .
. . .
. . . — $2,972 — — 2,972 Total .
. . .
. . .
. . .
. . .
. . .
. . . (424) 2,972 (32) — 2,516 Low Duration Credit .
. . .
. . .
. . .
. . .
. . .
. . Interest rate . .
. . .
. . .
. . .
. . . Foreign exchange .
. . .
. . .
. . . Total .
. . .
. . .
. . .
. . .
. . .
. . . — — 3,447 3,447 — (473) — (473) $259 — — 259 259 (1,491) 3,447 2,215 U.S.
Government Interest rate . . .
. . .
. . .
. . .
. . 96 Payden Mutual Funds — (1,018) — (1,018) 6 — (37) — (31) . Amount of Realized Gain or (Loss) on Derivatives Recognized in Income Underlying risk Forward Currency Futures1 Contracts2 Options3 Swaps4 Total GNMA Interest rate . . . .
. . .
. . .
. . .
. $(1,109) — — $ (35) $(1,144) Core Bond Interest rate . .
. . .
. . .
. . .
. . . Foreign exchange .
. . .
. . .
. . . Total .
. . .
. . .
. . .
. . .
. . .
. . . (1,822) — (1,822) — $2,614 2,614 — — — Corporate Bond Credit .
. . .
. . .
. . .
. . .
. . .
. . Interest rate . .
. . .
. . .
. . .
. . . Foreign exchange .
. . .
. . .
. . . Total .
. . .
. . .
. . .
. . .
. . .
. . . — 84 — 84 — — 81 81 — — — — (113) — — (113) (113) 84 81 52 Strategic Income Interest rate .
. . .
. . .
. . .
. . .
. Foreign exchange . . .
. . .
. . .
. Total . . .
. . .
. . .
. . .
. . .
. . .
. (75) — (75) — 569 569 — — — — — — (75) 569 494 Absolute Return Bond Credit . . .
. . .
. . .
. . .
. . .
. . . Equity .
. . .
. . .
. . .
. . .
. . .
. . Interest rate . .
. . .
. . .
. . .
. . . Foreign exchange .
. . .
. . .
. . . Total .
. . .
. . .
. . .
. . .
. . .
. . . — — (383) — (383) — — — 97 97 — $ 85 (14) — 71 (57) — — — (57) (57) 85 (397) 97 (272) High Income Credit .
. . .
. . .
. . .
. . .
. . .
. . Equity . .
. . .
. . .
. . .
. . .
. . .
. Interest rate . . .
. . .
. . .
. . .
. . Foreign exchange . .
. . .
. . .
. . Total . .
. . .
. . .
. . .
. . .
. . .
. . — — (854) — (854) — — — 2,075 2,075 — (218) — — (218) 23 — — — 23 23 (218) (854) 2,075 1,026 (3,164) (4,986) — 2,614 (3,164) (2,372) 3 4 Net realized gains (losses) from written option contracts and purchased options, which are included in net realized gain on investments. Net realized gains (losses) from swap contracts. The Effect of Derivative Instruments on the Statement of Operations For the Period Ended October 31, 2015 (000s) Change in Unrealized Appreciation or (Depreciation) on Derivatives Recognized in Income Forward Currency Underlying risk Futures5 Contracts6 Options7 Swaps8 Total Limited Maturity Interest rate. .
. . .
. . .
. . .
. . .
. — — $ (40) — $ (40) Foreign exchange. . .
. . .
. . .
. . — $(235) — — (235) Total. .
. . .
. . .
. . .
. . .
. . .
. . . — (235) (40) — (275) Low Duration Credit .
. . .
. . .
. . .
. . .
. . .
. . . Interest rate.
. . .
. . .
. . .
. . .
. . Foreign exchange. .
. . .
. . .
. . . Total.
. . .
. . .
. . .
. . .
. . .
. . .
. — $(204) — (204) — — (70) (70) U.S. Government Interest rate. .
. . .
. . .
. . .
. . .
. (56) — (25) — (81) GNMA Interest rate. . .
. . .
. . .
. . .
. . . 266 — (115) 28 179 Core Bond Interest rate.
. . .
. . .
. . .
. . .
. . Foreign exchange. .
. . .
. . .
. . . Total.
. . .
. . .
. . .
. . .
. . .
. . .
. 490 — 490 — (89) (89) — — — Corporate Bond Credit . . .
. . .
. . .
. . .
. . .
. . .
. Interest rate. . .
. . .
. . .
. . .
. . . Foreign exchange.
. . .
. . .
. . .
. Total. . .
. . .
. . .
. . .
. . .
. . .
. . — (49) — (49) — — 14 14 — — — — 69 — — 69 69 (49) 14 34 Strategic Income Interest Rate . .
. . .
. . .
. . .
. . . Foreign exchange.
. . .
. . .
. . .
. Total. . .
. . .
. . .
. . .
. . .
. . .
. . 62 — 62 — 41 41 — — — — — — 62 41 103 — (11) (11) — — — (6) (3) (9) — — — (6) (14) (20) — $ (34) (317) — — — (317) (34) (34) (521) (70) (625) 1,900 $2,390 — (89) 1,900 2,301 Global Low Duration Credit . .
. . .
. . .
. . .
. . .
. . .
. Equity . . .
. . .
. . .
. . .
. . .
. . . Interest rate .
. . .
. . .
. . .
. . .
. Foreign exchange . . .
. . .
. . .
. Total . . .
. . .
. . .
. . .
. . .
. . .
. — — (255) — (255) — — — 1,756 1,756 — 1 (78) — (77) 45 — — — 45 45 1 (333) 1,756 1,469 Global Fixed Income Interest rate . . .
. . .
. . .
. . .
. . Foreign exchange . .
. . .
. . .
. . Total . .
. . .
. . .
. . .
. . .
. . .
. . (162) — (162) — 2,295 2,295 — — — — — — (162) 2,295 2,133 Emerging Markets Bond Foreign exchange . .
. . .
. . .
. . — 3,216 — — 3,216 Absolute Return Bond Equity . .
. . .
. . .
. . .
. . .
. . .
. . Interest rate. .
. . .
. . .
. . .
. . .
. Total. . .
. . .
. . .
. . .
. . .
. . .
. . Emerging Markets Local Bond Interest rate . .
. . .
. . .
. . .
. . . Foreign exchange .
. . .
. . .
. . . Total .
. . .
. . .
. . .
. . .
. . .
. . . — — — — (747) (747) — — — (53) — (53) (53) (747) (800) High Income Interest rate.
. . .
. . .
. . .
. . .
. . Foreign exchange. .
. . .
. . .
. . . Total.
. . .
. . .
. . .
. . .
. . .
. . .
. (138) — (138) — (108) (108) — — — — — — (138) (108) (246) Emerging Markets Corporate Bond Foreign exchange . . .
. . .
. . .
. — 50 — — 50 Equity Income Equity . . .
. . .
. . .
. . .
. . .
. . . Foreign exchange .
. . .
. . .
. . . Total .
. . .
. . .
. . .
. . .
. . .
. . . — 3 3 (214) — (214) Global Low Duration Credit .
. . .
. . .
. . .
. . .
. . .
. . . Interest rate.
. . .
. . .
. . .
. . .
. . Foreign exchange. .
. . .
. . .
. . . Total.
. . .
. . .
. . .
. . .
. . .
. . .
. — (27) — (27) — — (59) (59) — (139) — (139) (6) — — (6) (6) (166) (59) (231) Global Fixed Income Interest rate. . .
. . .
. . .
. . .
. . . Foreign exchange.
. . .
. . .
. . .
. Total. . .
. . .
. . .
. . .
. . .
. . .
. . 14 — 14 — 107 107 — — — — — — 14 107 121 1 2 (861) — (861) — (1,075) — 3 — (1,072) Net realized gains (losses) from futures contracts. Net realized gains (losses) from foreign currency transactions which could include other currency related gains and losses. Annual Report 97 . Notes to Financial Statements continued Change in Unrealized Appreciation or (Depreciation) on Derivatives Recognized in Income Forward Currency Underlying risk Futures5 Contracts6 Options7 Swaps8 Total Emerging Markets Bond Foreign exchange. . . .
. . .
. . .
. — $(1,981) — — $(1,981) Emerging Markets Local Bond Foreign exchange. . .
. . .
. . .
. . — (280) — — (280) Emerging Markets Corporate Bond Foreign exchange. .
. . .
. . .
. . . — (25) — — (25) 5 6 7 8 Change in net unrealized appreciation (depreciation) from futures contracts. Change in net unrealized appreciation (depreciation) from translation of assets and liabilities in foreign currencies which includes other currency related appreciation (depreciation). Change in net unrealized appreciation (depreciation) from written option contracts and purchased options which are included in change in unrealized appreciation (depreciation) on investments. Change in net unrealized appreciation (depreciation) from swap contracts. During the period ended October 31, 2015 the average notional amount of derivatives as a percent of average net assets were as follows: Foreign currency Limited Maturity.
. . .
. . .
. . .
. . .
. . .
. . Low Duration . .
. . .
. . .
. . .
. . .
. . .
. . . U.S.
Government. . .
. . .
. . .
. . .
. . .
. . . GNMA .
. . .
. . .
. . .
. . .
. . .
. . .
. . .
. . . Core Bond .
. . .
. . .
. . .
. . .
. . .
. . .
. . .
. Corporate Bond . . .
. . .
. . .
. . .
. . .
. . .
. Strategic Income . . .
. . .
. . .
. . .
. . .
. . . Absolute Return Bond.
. . .
. . .
. . .
. . .
. High Income . . .
. . .
. . .
. . .
. . .
. . .
. . . Global Low Duration.
. . .
. . .
. . .
. . .
. . Global Fixed Income . .
. . .
. . .
. . .
. . .
. Emerging Markets Bond . . .
. . .
. . .
. . . Emerging Markets Local Bond.
. . .
. . .
. Emerging Markets Corporate Bond . . .
. Equity Income. . .
. . .
. . .
. . .
. . .
. . .
. . 7% 3% 0% 0% 9% 3% 10% 9% 6% 10% 76% 8% 14% 2% 1% Credit Interest rate Equity 0% 1% 0% 0% 0% 2% 0% 2% 0% 1% 0% 0% 0% 0% 0% 35% 45% 30% 43% 11% 45% 8% 47% 39% 50% 76% 0% 116% 0% 0% 0% 0% 0% 0% 0% 0% 0% 0% 0% 0% 0% 0% 0% 0% 0% Counterparty Credit Risk A derivative contract may suffer a mark-to-market loss if the value of the contract decreases due to an unfavorable change in the market rates or values of the underlying instrument. Losses can also occur if the counterparty does not perform under the contract. A Fund’s risk of loss from counterparty credit risk on OTC derivatives is generally limited to the aggregate unrealized gain netted against any collateral held by a Fund.
For OTC options purchased, a Fund bears the risk of loss of the amount of the premiums paid plus the positive change in market values net of any collateral held by such Fund should the counterparty fail to perform under the contracts. Options written by the Fund does 98 Payden Mutual Funds not typically give rise to counterparty credit risk, as options written generally obligate the Fund, and not the counterparty to perform. With exchange traded purchased options and futures and centrally cleared swaps, there is decreased counterparty credit risk to a Fund since the exchange or clearinghouse guarantees against a possible default. The clearinghouse stands between the buyer and the seller of the contract; therefore, the credit risk is limited to failure of the clearinghouse.
While offset rights may exist under applicable law, a Fund does not have a contractual right of offset against a clearing broker or clearinghouse in the event of a default (including the bankruptcy or insolvency) of the clearing broker or clearinghouse. Additionally, credit risk exists in exchange traded futures and centrally cleared swaps with respect to initial and variation margin that is held in a clearing broker’s customer accounts. While clearing brokers are required to segregate customer margin from their own assets, in the event that a clearing broker becomes insolvent or goes into bankruptcy and at that time there is a shortfall in the aggregate amount of margin held by the clearing broker for all its clients, typically the shortfall would be allocated on a pro rata basis across all the clearing broker’s customers, potentially resulting in losses to a Fund. In order to better define its contractual rights and to secure rights that will help a Fund mitigate its counterparty risk, a Fund may enter into an International Swaps and Derivatives Association, Inc.
Master Agreement (“ISDA Master Agreement”) or similar agreement with its derivative contract counterparties. An ISDA Master Agreement is a bilateral agreement between a Fund and a counterparty that governs certain OTC derivatives and typically contains, among other things, collateral posting terms and netting provisions in the event of a default and/or termination event. Under an ISDA Master Agreement, the Fund may, under certain circumstances, offset with the counterparty certain derivative financial instruments’ payables and/or receivables with collateral held and/or posted and create one single net payment.
The provisions of the ISDA Master Agreement typically permit a single net payment in the event of default (close-out netting), including the bankruptcy or insolvency of the counterparty. However, bankruptcy or insolvency laws of a particular jurisdiction may impose restrictions on or prohibitions against the right of offset in bankruptcy, insolvency or other events. In addition, certain ISDA Master Agreements allow counterparties to OTC derivatives to terminate derivative contracts prior to maturity in the event the Fund’s net assets decline by a stated percentage or the Fund fails to meet the terms of its ISDA Master Agreements, which would cause the Fund to accelerate payment of any net liability owed to the counterparty. .
Collateral Requirements For derivatives traded under an ISDA Master Agreement, the collateral requirements are typically calculated by netting the mark to market amount for each transaction under such agreement and comparing that amount to the value of any collateral currently pledged by a Fund and the counterparty. Cash collateral that has been pledged to cover obligations of a Fund and cash collateral received from the counterparty, if any, is reported separately on the Statement of Assets and Liabilities as cash pledged as collateral and cash received as collateral, respectively. Non-cash collateral pledged by the Fund, if any, is noted in the Schedule of Investments. Generally, the amount of collateral due from or to a party has to exceed a minimum transfer amount threshold (e.g. $500,000) before a transfer is required, which is determined at the close of business of a Fund and additional required collateral is delivered to/ pledged by a Fund on the next business day.
Typically, a Fund and counterparties are not permitted to sell, re-pledge or use the collateral they receive. To the extent amounts due to a Fund from its counterparties are not fully collateralized, contractually or otherwise, the Fund bears the risk of loss from counterparty non-performance. A Fund attempts to mitigate counterparty risk by only entering into agreements with counterparties that it believes have the financial resources to honor their obligations and by monitoring the financial stability of those counterparties. For financial reporting purposes, the Funds do not offset derivative assets and derivative liabilities that are subject to netting arrangements in the Statements of Assets and Liabilities. At October 31, 2015, the Funds’ derivative assets and liabilities (by type) on a gross basis are as follows (000s): Assets Liabilities Limited Maturity Derivative Financial Instruments: Purchased Put Options1 .
. . .
. . .
. . .
. . .
. . .
. . .
. . .
. . .
. . $ Forward Currency Contracts .
. . .
. . .
. . .
. . .
. . .
. . .
. . .
. . Total derivative assets and liabilities in the Statements of Assets and Liabilities . .
. . .
. . .
. . .
. . .
. . .
. . .
. . .
. . .
. Derivatives not subject to a master netting agreement or similar agreement “(MNA”) . . .
. . .
. . .
. . .
. . .
. . .
. . .
. . .
. . Total derivative assets and liabilities subject to a MNA. .
. . .
. $ 2 128 $ — 187 130 187 (90) 40 $ Low Duration Derivative Financial Instruments: Futures Contracts . .
. . .
. . .
. . .
. . .
. . .
. . .
. . .
. . .
. . .
. . .
$ 3 Centrally Cleared Swaps . . .
. . .
. . .
. . .
. . .
. . .
. . .
. . .
. . . 150 11 Purchased Put Options1 .
. . .
. . .
. . .
. . .
. . .
. . .
. . .
. . .
. . Forward Currency Contracts . .
. . .
. . .
. . .
. . .
. . .
. . .
. . .
. 173 Total derivative assets and liabilities in the Statements of Assets and Liabilities . . .
. . .
. . .
. . .
. . .
. . .
. . .
. . .
. . .
. . .
. 337 Derivatives not subject to a MNA. . .
. . .
. . .
. . .
. . .
. . .
. . .
. (267) Total derivative assets and liabilities subject to a MNA. .
. . .
. $ 70 — $ 146 — 84 230 (146) $ 84 U.S. Government Derivative Financial Instruments: Purchased Put Options1 .
. . .
. . .
. . .
. . .
. . .
. . .
. . .
. . .
. . $ 1 Total derivative assets and liabilities in the Statements of Assets and Liabilities .
. . .
. . .
. . .
. . .
. . .
. . .
. . .
. . .
. . .
. . . 1 Derivatives not subject to a MNA.
. . .
. . .
. . .
. . .
. . .
. . .
. . . (1) Total derivative assets and liabilities subject to a MNA.
. . .
. . $ — — — — — GNMA Derivative Financial Instruments: Futures Contracts .
. . .
. . .
. . .
. . .
. . .
. . .
. . .
. . .
. . .
. . .
. $ 9 6 Purchased Put Options1 . .
. . .
. . .
. . .
. . .
. . .
. . .
. . .
. . .
. Total derivative assets and liabilities in the Statements of Assets and Liabilities . . .
. . .
. . .
. . .
. . .
. . .
. . .
. . .
. . . 15 Derivatives not subject to a MNA.
. . .
. . .
. . .
. . .
. . .
. . .
. . . (15) Total derivative assets and liabilities subject to a MNA.
. . .
. . $ — Core Bond Derivative Financial Instruments: Futures Contracts .
. . .
. . .
. . .
. . .
. . .
. . .
. . .
. . .
. . .
. . .
. $ 34 Forward Currency Contracts . .
. . .
. . .
. . .
. . .
. . .
. . .
. . .
. 561 Total derivative assets and liabilities in the Statements of Assets and Liabilities . . .
. . .
. . .
. . .
. . .
. . .
. . .
. . .
. . .
. . .
. 595 Derivatives not subject to a MNA. . .
. . .
. . .
. . .
. . .
. . .
. . .
. (63) Total derivative assets and liabilities subject to a MNA. . .
. . .
$ 532 Corporate Bond Derivative Financial Instruments: Futures Contracts . . .
. . .
. . .
. . .
. . .
. . .
. . .
. . .
. . .
. . .
. . $ 32 Forward Currency Contracts .
. . .
. . .
. . .
. . .
. . .
. . .
. . .
. . 25 Total derivative assets and liabilities in the Statements of Assets and Liabilities . .
. . .
. . .
. . .
. . .
. . .
. . .
. . .
. . .
. . .
. . 57 Derivatives not subject to a MNA. .
. . .
. . .
. . .
. . .
. . .
. . .
. . (32) Total derivative assets and liabilities subject to a MNA. .
. . .
. $ 25 — — — — — $ 65 560 625 (65) $ 560 $ 3 11 — 187 14 (3) $ 11 Annual Report 99 . Notes to Financial Statements continued Assets Liabilities Strategic Income Derivative Financial Instruments: Futures Contracts . . . .
. . .
. . .
. . .
. . .
. . .
. . .
. . .
. . .
. . .
. $ 7$ 12 Forward Currency Contracts . .
. . .
. . .
. . .
. . .
. . .
. . .
. . .
. 136 121 Total derivative assets and liabilities in the Statements of Assets and Liabilities . . .
. . .
. . .
. . .
. . .
. . .
. . .
. . .
. . .
. . .
. 143 133 Derivatives not subject to a MNA. . .
. . .
. . .
. . .
. . .
. . .
. . .
. (15) (12) Total derivative assets and liabilities subject to a MNA. . .
. . .
$ 128 $ 121 Absolute Return Bond Derivative Financial Instruments: Futures Contracts . . .
. . .
. . .
. . .
. . .
. . .
. . .
. . .
. . .
. . .
. . $ Purchased Put Options1 .
. . .
. . .
. . .
. . .
. . .
. . .
. . .
. . .
. . Forward Currency Contracts . .
. . .
. . .
. . .
. . .
. . .
. . .
. . .
. Total derivative assets and liabilities in the Statements of Assets and Liabilities . . .
. . .
. . .
. . .
. . .
. . .
. . .
. . .
. . .
. . .
. Derivatives not subject to a MNA. . .
. . .
. . .
. . .
. . .
. . .
. . .
. Total derivative assets and liabilities subject to a MNA. . .
. . .
$ High Income Derivative Financial Instruments: Centrally Cleared Swaps . . .
. . .
. . .
. . .
. . .
. . .
. . .
. . .
. . . Futures Contracts .
. . .
. . .
. . .
. . .
. . .
. . .
. . .
. . .
. . .
. . .
. $ Forward Currency Contracts . .
. . .
. . .
. . .
. . .
. . .
. . .
. . .
. Total derivative assets and liabilities in the Statements of Assets and Liabilities . . .
. . .
. . .
. . .
. . .
. . .
. . .
. . .
. . .
. . .
. Derivatives not subject to a MNA. . .
. . .
. . .
. . .
. . .
. . .
. . .
. Total derivative assets and liabilities subject to a MNA. . .
. . .
$ Global Low Duration Derivative Financial Instruments: Futures Contracts . . .
. . .
. . .
. . .
. . .
. . .
. . .
. . .
. . .
. . .
. . $ Centrally Cleared Swaps .
. . .
. . .
. . .
. . .
. . .
. . .
. . .
. . .
. . Purchased Put Options1 . .
. . .
. . .
. . .
. . .
. . .
. . .
. . .
. . .
. Forward Currency Contracts . . .
. . .
. . .
. . .
. . .
. . .
. . .
. . . Total derivative assets and liabilities in the Statements of Assets and Liabilities .
. . .
. . .
. . .
. . .
. . .
. . .
. . .
. . .
. . .
. . . Derivatives not subject to a MNA.
. . .
. . .
. . .
. . .
. . .
. . .
. . . Total derivative assets and liabilities subject to a MNA.
. . .
. . $ 4$ 14 51 3 — 51 69 (21) 48 $ 54 (3) 51 —$ 14 347 54 — 379 361 (32) 329 $ 433 (54) 379 3$ 35 5 103 1 26 — 50 146 (88) 58 $ 77 (27) 50 Emerging Market Local Bond Derivative Financial Instruments: Forward Currency Contracts .
. . .
. . .
. . .
. . .
. . .
. . .
. . .
. . $ Total derivative assets and liabilities in the Statements of Assets and Liabilities .
. . .
. . .
. . .
. . .
. . .
. . .
. . .
. . .
. . .
. . . Derivatives not subject to a MNA.
. . .
. . .
. . .
. . .
. . .
. . .
. . . Total derivative assets and liabilities subject to a MNA.
. . .
. . $ Emerging Market Corporate Bond Derivative Financial Instruments: Forward Currency Contracts .
. . .
. . .
. . .
. . .
. . .
. . .
. . .
. . $ Total derivative assets and liabilities in the Statements of Assets and Liabilities .
. . .
. . .
. . .
. . .
. . .
. . .
. . .
. . .
. . .
. . . Derivatives not subject to a MNA.
. . .
. . .
. . .
. . .
. . .
. . .
. . . Total derivative assets and liabilities subject to a MNA.
. . .
. . $ 1 Global Fixed Income Derivative Financial Instruments: Futures Contracts .
. . .
. . .
. . .
. . .
. . .
. . .
. . .
. . .
. . .
. . .
. $ 17 $ Forward Currency Contracts . .
. . .
. . .
. . .
. . .
. . .
. . .
. . .
. 477 Total derivative assets and liabilities in the Statements of Assets and Liabilities . . .
. . .
. . .
. . .
. . .
. . .
. . .
. . .
. . .
. . .
. 494 Derivatives not subject to a MNA. . .
. . .
. . .
. . .
. . .
. . .
. . .
. (100) Total derivative assets and liabilities subject to a MNA. . .
. . .
$ 394 $ 100 Payden Mutual Funds Assets Liabilities Emerging Market Bond Derivative Financial Instruments: Forward Currency Contracts . . .
. . .
. . .
. . .
. . .
. . .
. . .
. . .
$ 270 $ 1,269 Total derivative assets and liabilities in the Statements of Assets and Liabilities . . .
. . .
. . .
. . .
. . .
. . .
. . .
. . .
. . .
. . .
. 270 1,269 Derivatives not subject to a MNA. . .
. . .
. . .
. . .
. . .
. . .
. . .
. — — Total derivative assets and liabilities subject to a MNA. . .
. . .
$ 270 $ 1,269 8 395 403 (8) 395 6$ 203 6 — 6$ 203 — 203 5$ 30 5 — 5$ 30 — 30 Includes options purchased at value which is included in Investments at value and reported in the Schedule of Investments. . The following tables present the Funds’ derivative assets and liabilities by counterparty net of amounts available for offset under a MNA and net of the related collateral received by the Fund as of October 31, 2015 (000s): Limited Maturity Counterparty Barclays Bank PLC . . . .
. . .
. . .
. . .
. . .
. . .
. . .
. . .
. . .
. . .
. . .
. . .
. . BNP PARIBAS . .
. . .
. . .
. . .
. . .
. . .
. . .
. . .
. . .
. . .
. . .
. . .
. . .
. . .
. Total. . .
. . .
. . .
. . .
. . .
. . .
. . .
. . .
. . .
. . .
. . .
. . .
. . .
. . .
. . .
. . .
. . .
. . Counterparty HSBC Bank USA, N.A.. .
. . .
. . .
. . .
. . .
. . .
. . .
. . .
. . .
. . .
. . .
. . . Royal Bank of Canada .
. . .
. . .
. . .
. . .
. . .
. . .
. . .
. . .
. . .
. . .
. . .
. . Total. .
. . .
. . .
. . .
. . .
. . .
. . .
. . .
. . .
. . .
. . .
. . .
. . .
. . .
. . .
. . .
. . .
. . . Cash Derivative Assets Derivatives Non-Cash Subject to MNA by Available Collateral Collateral Net Amount of for Offset Received Received Derivative Assets1 Counterparty $ 15 25 $ 40 Derivative Liabilities Subject to MNA by Counterparty $176 11 $187 — — — Derivatives Available for Offset — — — — — — Non-Cash Collateral Pledged — — — — — — Cash Collateral Pledged — — — $ 15 25 $ 40 Net Amount of Derivative Liabilities2 $176 11 $187 Low Duration Counterparty BNP PARIBAS .
. . .
. . .
. . .
. . .
. . .
. . .
. . .
. . .
. . .
. . .
. . .
. . .
. . .
. . Counterparty HSBC Bank USA, N.A.. .
. . .
. . .
. . .
. . .
. . .
. . .
. . .
. . .
. . .
. . .
. . . Royal Bank of Canada .
. . .
. . .
. . .
. . .
. . .
. . .
. . .
. . .
. . .
. . .
. . .
. . Total. .
. . .
. . .
. . .
. . .
. . .
. . .
. . .
. . .
. . .
. . .
. . .
. . .
. . .
. . .
. . .
. . .
. . . Derivative Assets Subject to MNA by Counterparty $ 70 Derivative Liabilities Subject to MNA by Counterparty $ 72 12 $ 84 Derivatives Available for Offset — Derivatives Available for Offset — — — Non-Cash Collateral Pledged — Non-Cash Collateral Pledged — — — Cash Collateral Pledged — Cash Collateral Pledged — — — Net Amount of Derivative Liabilities2 $ 70 Net Amount of Derivative Liabilities2 $ 72 12 $ 84 Core Bond Counterparty BNP PARIBAS .
. . .
. . .
. . .
. . .
. . .
. . .
. . .
. . .
. . .
. . .
. . .
. . .
. . .
. . Credit Suisse First Boston International. .
. . .
. . .
. . .
. . .
. . .
. . . Total.
. . .
. . .
. . .
. . .
. . .
. . .
. . .
. . .
. . .
. . .
. . .
. . .
. . .
. . .
. . .
. . .
. . .
. Counterparty Barclays Bank PLC . . .
. . .
. . .
. . .
. . .
. . .
. . .
. . .
. . .
. . .
. . .
. . .
. . . BNP PARIBAS .
. . .
. . .
. . .
. . .
. . .
. . .
. . .
. . .
. . .
. . .
. . .
. . .
. . .
. . Credit Suisse First Boston International. .
. . .
. . .
. . .
. . .
. . .
. . . HSBC Bank USA, N.A..
. . .
. . .
. . .
. . .
. . .
. . .
. . .
. . .
. . .
. . .
. . .
. Total. . .
. . .
. . .
. . .
. . .
. . .
. . .
. . .
. . .
. . .
. . .
. . .
. . .
. . .
. . .
. . .
. . .
. . Derivative Assets Subject to MNA by Counterparty Derivatives Available for Offset3 Non-Cash Collateral Received Cash Collateral Received $180 352 $532 $(180) (14) $(194) — — — Derivative Liabilities Subject to MNA by Counterparty Derivatives Available for Offset3 Non-Cash Collateral Pledged Cash Collateral Pledged4 Net Amount of Derivative Liabilities2 $261 264 14 21 $560 — $(180) (14) — $(194) — — — — — $(261) — — (21) $(282) — $ 84 — — $ 84 — — — Net Amount of Derivative Assets1 — $338 $338 Annual Report 101 . Notes to Financial Statements continued Corporate Bond Counterparty Credit Suisse First Boston International. . . .
. . .
. . .
. . .
. . .
. . .
. Counterparty BNP PARIBAS . . .
. . .
. . .
. . .
. . .
. . .
. . .
. . .
. . .
. . .
. . .
. . .
. . .
. . . Credit Suisse First Boston International.
. . .
. . .
. . .
. . .
. . .
. . .
. Royal Bank of Canada . . .
. . .
. . .
. . .
. . .
. . .
. . .
. . .
. . .
. . .
. . .
. . . Total.
. . .
. . .
. . .
. . .
. . .
. . .
. . .
. . .
. . .
. . .
. . .
. . .
. . .
. . .
. . .
. . .
. . .
. Derivative Assets Subject to MNA by Counterparty Derivatives Available for Offset3 Non-Cash Collateral Received Cash Collateral Received Net Amount of Derivative Assets1 $ 25 $ (2) — — $23 Derivative Liabilities Subject to MNA by Counterparty Derivatives Available for Offset3 Non-Cash Collateral Pledged Cash Collateral Pledged Net Amount of Derivative Liabilities2 1 2 8 $ 11 — $ (2) — $ (2) — — — — — — — — $ 1 — 8 $ 9 Derivative Assets Subject to MNA by Counterparty Derivatives Available for Offset3 Non-Cash Collateral Received Cash Collateral Received Net Amount of Derivative Assets1 $ 45 83 $128 $(45) (5) $(50) — — — — — — — $78 $78 Derivative Liabilities Subject to MNA by Counterparty Derivatives Available for Offset3 Non-Cash Collateral Pledged Cash Collateral Pledged Net Amount of Derivative Liabilities2 $ 56 56 5 4 $121 — $(45) (5) — $(50) — — — — — — — — — — $56 11 — 4 $71 Derivative Assets Subject to MNA by Counterparty Derivatives Available for Offset3 Non-Cash Collateral Received Cash Collateral Received Net Amount of Derivative Assets1 $ 16 32 $ 48 $(16) (2) $(18) — — — — — — — $30 $30 $ Strategic Income Counterparty BNP PARIBAS . . .
. . .
. . .
. . .
. . .
. . .
. . .
. . .
. . .
. . .
. . .
. . .
. . .
. . . Credit Suisse First Boston International.
. . .
. . .
. . .
. . .
. . .
. . .
. Total. . .
. . .
. . .
. . .
. . .
. . .
. . .
. . .
. . .
. . .
. . .
. . .
. . .
. . .
. . .
. . .
. . .
. . Counterparty Barclays Bank PLC . .
. . .
. . .
. . .
. . .
. . .
. . .
. . .
. . .
. . .
. . .
. . .
. . .
. BNP PARIBAS . . .
. . .
. . .
. . .
. . .
. . .
. . .
. . .
. . .
. . .
. . .
. . .
. . .
. . . Credit Suisse First Boston International.
. . .
. . .
. . .
. . .
. . .
. . .
. HSBC Bank USA, N.A.. . .
. . .
. . .
. . .
. . .
. . .
. . .
. . .
. . .
. . .
. . .
. . Total. .
. . .
. . .
. . .
. . .
. . .
. . .
. . .
. . .
. . .
. . .
. . .
. . .
. . .
. . .
. . .
. . .
. . . Absolute Return Bond Counterparty BNP PARIBAS .
. . .
. . .
. . .
. . .
. . .
. . .
. . .
. . .
. . .
. . .
. . .
. . .
. . .
. . Credit Suisse First Boston International. .
. . .
. . .
. . .
. . .
. . .
. . . Total.
. . .
. . .
. . .
. . .
. . .
. . .
. . .
. . .
. . .
. . .
. . .
. . .
. . .
. . .
. . .
. . .
. . .
. 102 Payden Mutual Funds . Counterparty Barclays Bank PLC . . . .
. . .
. . .
. . .
. . .
. . .
. . .
. . .
. . .
. . .
. . .
. . .
. . BNP PARIBAS . .
. . .
. . .
. . .
. . .
. . .
. . .
. . .
. . .
. . .
. . .
. . .
. . .
. . .
. Credit Suisse First Boston International. . .
. . .
. . .
. . .
. . .
. . .
. . HSBC Bank USA, N.A.. .
. . .
. . .
. . .
. . .
. . .
. . .
. . .
. . .
. . .
. . .
. . . Total.
. . .
. . .
. . .
. . .
. . .
. . .
. . .
. . .
. . .
. . .
. . .
. . .
. . .
. . .
. . .
. . .
. . .
. Derivative Liabilities Subject to MNA by Counterparty Derivatives Available for Offset3 Non-Cash Collateral Pledged $ 23 24 2 2 $ 51 — $ (16) (2) — $ (18) — — — — — Derivative Assets Subject to MNA by Counterparty Derivatives Available for Offset3 Non-Cash Collateral Received $111 218 $329 $(111) (13) $(124) — — — Derivative Liabilities Subject to MNA by Counterparty Derivatives Available for Offset3 Non-Cash Collateral Pledged Cash Collateral Pledged4 $196 170 13 $379 — $(111) (13) $(124) — — — — $(196) (59) — $(255) Derivative Assets Subject to MNA by Counterparty Derivatives Available for Offset3 Non-Cash Collateral Received Cash Collateral Received Cash Collateral Pledged — — — — — Net Amount of Derivative Liabilities2 $ 23 8 — 2 $ 33 High Income Counterparty BNP PARIBAS . . .
. . .
. . .
. . .
. . .
. . .
. . .
. . .
. . .
. . .
. . .
. . .
. . .
. . . Credit Suisse First Boston International.
. . .
. . .
. . .
. . .
. . .
. . .
. Total. . .
. . .
. . .
. . .
. . .
. . .
. . .
. . .
. . .
. . .
. . .
. . .
. . .
. . .
. . .
. . .
. . .
. . Counterparty Barclays Bank PLC . .
. . .
. . .
. . .
. . .
. . .
. . .
. . .
. . .
. . .
. . .
. . .
. . .
. BNP PARIBAS . . .
. . .
. . .
. . .
. . .
. . .
. . .
. . .
. . .
. . .
. . .
. . .
. . .
. . . Credit Suisse First Boston International.
. . .
. . .
. . .
. . .
. . .
. . .
. Total. . .
. . .
. . .
. . .
. . .
. . .
. . .
. . .
. . .
. . .
. . .
. . .
. . .
. . .
. . .
. . .
. . .
. . Cash Collateral Received — — — Net Amount of Derivative Assets1 — $205 $205 Net Amount of Derivative Liabilities — — — — Global Low Duration Counterparty BNP PARIBAS . .
. . .
. . .
. . .
. . .
. . .
. . .
. . .
. . .
. . .
. . .
. . .
. . .
. . .
. Counterparty BNP PARIBAS . . .
. . .
. . .
. . .
. . .
. . .
. . .
. . .
. . .
. . .
. . .
. . .
. . .
. . . HSBC Bank USA, N.A..
. . .
. . .
. . .
. . .
. . .
. . .
. . .
. . .
. . .
. . .
. . .
. Royal Bank of Canada . . .
. . .
. . .
. . .
. . .
. . .
. . .
. . .
. . .
. . .
. . .
. . . Total.
. . .
. . .
. . .
. . .
. . .
. . .
. . .
. . .
. . .
. . .
. . .
. . .
. . .
. . .
. . .
. . .
. . .
. $ 58 Derivative Liabilities Subject to MNA by Counterparty $ 7 39 4 $ 50 $ (7) Derivatives Available for Offset3 $ (7) — — $ (7) — Non-Cash Collateral Pledged — — — — — Cash Collateral Pledged — — — — Net Amount of Derivative Assets1 $ 51 Net Amount of Derivative Liabilities2 — $ 39 4 $ 43 Annual Report 103 . Notes to Financial Statements continued Global Fixed Income Counterparty Barclays Bank PLC . . . .
. . .
. . .
. . .
. . .
. . .
. . .
. . .
. . .
. . .
. . .
. . .
. . BNP PARIBAS . .
. . .
. . .
. . .
. . .
. . .
. . .
. . .
. . .
. . .
. . .
. . .
. . .
. . .
. Credit Suisse First Boston International. . .
. . .
. . .
. . .
. . .
. . .
. . HSBC Bank USA, N.A.. .
. . .
. . .
. . .
. . .
. . .
. . .
. . .
. . .
. . .
. . .
. . . Royal Bank of Canada .
. . .
. . .
. . .
. . .
. . .
. . .
. . .
. . .
. . .
. . .
. . .
. . State Street Bank & Trust Co. .
. . .
. . .
. . .
. . .
. . .
. . .
. . .
. . .
. . .
. Total. . .
. . .
. . .
. . .
. . .
. . .
. . .
. . .
. . .
. . .
. . .
. . .
. . .
. . .
. . .
. . .
. . .
. . Counterparty Barclays Bank PLC . .
. . .
. . .
. . .
. . .
. . .
. . .
. . .
. . .
. . .
. . .
. . .
. . .
. BNP PARIBAS . . .
. . .
. . .
. . .
. . .
. . .
. . .
. . .
. . .
. . .
. . .
. . .
. . .
. . . Credit Suisse First Boston International.
. . .
. . .
. . .
. . .
. . .
. . .
. HSBC Bank USA, N.A.. . .
. . .
. . .
. . .
. . .
. . .
. . .
. . .
. . .
. . .
. . .
. . Royal Bank of Canada . .
. . .
. . .
. . .
. . .
. . .
. . .
. . .
. . .
. . .
. . .
. . .
. Total. . .
. . .
. . .
. . .
. . .
. . .
. . .
. . .
. . .
. . .
. . .
. . .
. . .
. . .
. . .
. . .
. . .
. . Derivative Assets Subject to MNA by Counterparty Derivatives Available for Offset3 Non-Cash Collateral Received 51 46 84 6 103 104 $ 394 $ (51) (46) (13) (6) (103) — $(219) — — — — — — — Derivative Liabilities Subject to MNA by Counterparty Derivatives Available for Offset3 Non-Cash Collateral Pledged 61 76 13 84 161 $ 395 $ (51) (46) (13) (6) (103) $(219) — — — — — — Derivative Assets Subject to MNA by Counterparty Derivatives Available for Offset3 Non-Cash Collateral Received $ 256 14 $ 270 $ (21) — $ (21) — — — Derivative Liabilities Subject to MNA by Counterparty Derivatives Available for Offset3 Non-Cash Collateral Pledged Cash Collateral Pledged4 Net Amount of Derivative Liabilities2 $ 942 21 306 $1,269 — $ (21) — $ (21) — — — — $ (942) — (260) $(1,202) — — $ 46 $ 46 $ $ Cash Collateral Received — — — — — — — Cash Collateral Pledged — — — — — — Net Amount of Derivative Assets1 — — $ 71 — — 104 $175 Net Amount of Derivative Liabilities2 $ 10 30 — 78 58 $176 Emerging Markets Bond Counterparty BNP PARIBAS . .
. . .
. . .
. . .
. . .
. . .
. . .
. . .
. . .
. . .
. . .
. . .
. . .
. . .
. Credit Suisse First Boston International. . .
. . .
. . .
. . .
. . .
. . .
. . Total. .
. . .
. . .
. . .
. . .
. . .
. . .
. . .
. . .
. . .
. . .
. . .
. . .
. . .
. . .
. . .
. . .
. . . Counterparty Barclays Bank PLC .
. . .
. . .
. . .
. . .
. . .
. . .
. . .
. . .
. . .
. . .
. . .
. . .
. . BNP PARIBAS . .
. . .
. . .
. . .
. . .
. . .
. . .
. . .
. . .
. . .
. . .
. . .
. . .
. . .
. HSBC Bank USA, N.A.. . .
. . .
. . .
. . .
. . .
. . .
. . .
. . .
. . .
. . .
. . .
. . Total. .
. . .
. . .
. . .
. . .
. . .
. . .
. . .
. . .
. . .
. . .
. . .
. . .
. . .
. . .
. . .
. . .
. . . 104 Payden Mutual Funds Cash Collateral Received — — — Net Amount of Derivative Assets1 $235 14 $249 .
Emerging Markets Local Bond Counterparty Derivative Assets Subject to MNA by Counterparty Derivatives Available for Offset3 Non-Cash Collateral Received Cash Collateral Received $ (6) — — Derivative Assets Subject to MNA by Counterparty Derivatives Available for Offset3 Non-Cash Collateral Received Cash Collateral Received Net Amount of Derivative Assets1 $142 8 53 $203 $ (6) — — $ (6) — — — — — — — — $136 8 53 $197 Derivative Assets Subject to MNA by Counterparty Derivatives Available for Offset3 Non-Cash Collateral Received Cash Collateral Received Net Amount of Derivative Assets1 $ (1) — — Derivative Liabilities Subject to MNA by Counterparty Derivatives Available for Offset3 Non-Cash Collateral Pledged Cash Collateral Pledged Net Amount of Derivative Liabilities2 $ 21 1 8 $ 30 — $ (1) — $ (1) — — — — — — — — $ 21 — 8 $ 29 Barclays Bank PLC . . . .
. . .
. . .
. . .
. . .
. . .
. . .
. . .
. . .
. . .
. . .
. . .
. . Counterparty $ Barclays Bank PLC . .
. . .
. . .
. . .
. . .
. . .
. . .
. . .
. . .
. . .
. . .
. . .
. . .
. BNP PARIBAS . . .
. . .
. . .
. . .
. . .
. . .
. . .
. . .
. . .
. . .
. . .
. . .
. . .
. . . HSBC Bank USA, N.A..
. . .
. . .
. . .
. . .
. . .
. . .
. . .
. . .
. . .
. . .
. . .
. Total. . .
. . .
. . .
. . .
. . .
. . .
. . .
. . .
. . .
. . .
. . .
. . .
. . .
. . .
. . .
. . .
. . .
. . 6 Net Amount of Derivative Assets — Emerging Markets Corporate Bond Counterparty BNP PARIBAS . .
. . .
. . .
. . .
. . .
. . .
. . .
. . .
. . .
. . .
. . .
. . .
. . .
. . .
. Counterparty $ Barclays Bank PLC . . .
. . .
. . .
. . .
. . .
. . .
. . .
. . .
. . .
. . .
. . .
. . .
. . . BNP PARIBAS .
. . .
. . .
. . .
. . .
. . .
. . .
. . .
. . .
. . .
. . .
. . .
. . .
. . .
. . HSBC Bank USA, N.A.. .
. . .
. . .
. . .
. . .
. . .
. . .
. . .
. . .
. . .
. . .
. . . Total.
. . .
. . .
. . .
. . .
. . .
. . .
. . .
. . .
. . .
. . .
. . .
. . .
. . .
. . .
. . .
. . .
. . .
. 1 2 3 4 5 $ 4 Net amount represents the net amount receivable from the counterparty in the event of default. Net amount represents the net amount payable from the counterparty in the event of default. The amount of derivatives for offset is limited to the amount of assets and/or liabilities that are subject to a MNA. Excess of collateral pledged to the individual counterparty may not be shown for financial reporting purposes. Credit Enhancements Certain obligations held in the Funds have credit enhancement or liquidity features that may, under certain circumstances, provide for repayment of principal and interest on the obligation upon demand date, interest rate reset date or final maturity. These enhancements may include: letters of credit, liquidity guarantees, security purchase agreements, and third party insurance (e.g. AGM, AMBAC and BAM). TBA Sale Commitments Some Funds entered into TBA sale commitments, within dollar roll agreements, to hedge their portfolio position or to sell mortgage backed securities they own under delayed delivery arrangements.
Proceeds from TBA sale commitments are not received until the contractual settlement date. During the time a TBA sale commitment is outstanding, equivalent deliverable securities, or an offsetting TBA purchase commitment deliverable on or before the sale commitment date, are held as “cover” for the transaction. Unsettled TBA sale commitments are valued at approximately the current value of the underlying securities. The contract is “marked-to-market” daily and the change in the value is recorded by the Fund as an unrealized gain or loss.
If the TBA sale commitment is closed through the acquisition of an offsetting purchase commitment, the Fund realizes a gain or loss from the sale of the securities based upon the unit price established at the date the Fund entered the commitment. Securities Lending Pursuant to a securities lending agreement with The Bank of New York Mellon, the Funds (except Cash Reserves Money Market) may lend securities to qualified institutions. It is each Annual Report 105 . Notes to Financial Statements continued Fund’s policy that at origination all loans are secured by collateral of at least 102% of the value of the U.S. securities loaned and 105% of the value of the foreign securities loaned. Collateral equivalent to at least 100% of the market value of securities on loan is maintained at all times. The collateral is maintained by the custodian. Cash collateral is reinvested in the Payden Cash Reserves Money Market Fund.
The Funds are entitled to receive all of the income on securities loaned, in addition to income earned as a result of the lending transaction. Although each security loaned is fully collateralized, each Fund bears the risk of delay in receiving additional collateral or in recovery of or loss of rights in the securities loaned should the borrower fail to return the securities in a timely manner. The Funds maintain the right to recall the securities on loan for voting purposes. The income earned by each Fund is disclosed in the Statement of Operations. Distributions to Shareholders Distributions to shareholders are recorded on the ex-dividend date.
Dividends from net investment income and net realized gains on foreign currency transactions are declared and paid monthly for all Funds except the Cash Reserves Money Market, Limited Maturity, Short Bond, U.S. Government, GNMA and California Municipal Income Funds, which are declared daily and paid monthly and Equity Income Fund, which is declared and paid quarterly. Net realized gains on investments, if any, are declared and distributed at least annually.
All distributions are paid in the form of additional shares unless cash payment is requested. Securities lending transactions are entered into by a Fund under Master Securities Lending Agreements (“MSLA”) which provide the right, in the event of default (including bankruptcy or insolvency), for the non-defaulting party to liquidate the collateral and calculate a net exposure to the defaulting party or request additional collateral. In the event that a borrower defaults, a Fund, as lender, would offset the market value of the collateral received against the market value of the securities loaned. The value of the collateral is typically greater than that of the market value of the securities loaned, leaving the lender with a net amount payable to the defaulting party.
However, bankruptcy or insolvency laws of a particular jurisdiction may impose restrictions on or prohibitions against such a right of offset in the event of a MSLA counterparty’s bankruptcy or insolvency. Under the MSLA, the borrower can resell or repledge the loaned securities, and a Fund can reinvest cash collateral, or, upon an event of default, resell or re-pledge the collateral. Federal Income Taxes It is the policy of each Fund to meet the requirements for qualification as a regulated investment company as defined in Subchapter M of the Internal Revenue Code (the “Code”), and to make distributions of net investment income and net realized gains sufficient to relieve it from all Federal income or excise taxes. As of and during the period ended October 31, 2015, the Funds did not record any liability for uncertain tax positions. Accordingly, no provision for Federal income or excise tax is necessary. The Fund’s securities lending agreements by counterparty, which are subject to offset under a MSLA, if applicable, is included within each Fund’s Schedule of Investments under the heading “Offsetting Assets and Liabilities”.
For financial reporting purposes, the Funds do not offset financial assets and financial liabilities that are subject to MSLA on the Statements of Assets and Liabilities. Beginning March 20, 2015 the Group began terminating securities lending. As of May 8, 2015 all securities on loan were returned to the Funds. 106 Payden Mutual Funds Distributions to shareholders are determined in accordance with income tax regulations, which may differ from GAAP. Each Fund files a tax return annually using tax accounting methods required under provisions of the Code, which may differ from GAAP, the basis on which these financial statements are prepared. The differences arise primarily from the treatment of foreign currency transactions and futures contracts and the deferral of certain losses under Federal income tax regulations. Accordingly, the amounts of net investment income and net realized gains or losses reported in these financial statements may differ from those reported in each Fund’s tax return. Return of capital distributions and net investment losses for tax purposes, if any, are reclassified to paid in capital. As of and during the period ended October 31, 2015, the Funds did not have any liabilities for any unrecognized tax positions. The Funds recognize interest and penalties, if any, related to unrecognized tax positions as income tax expense in the Statements of Operations.
During the period, the Funds did not incur any interest or penalties. Each of the tax years in the four-year period ended October 31, 2015 remains subject to examination by the Internal Revenue Service and state taxing authorities. . Affiliated Investments Each of the Paydenfunds (except the Cash Reserves Money Market and California Municipal Income Funds) invests in other Funds of the Group (an “Affiliated Fund”). The income Fund Investments in Cash Reserves Money Market Fund Limited Maturity . . .
. . .
. . .
. . .
. . .
. . .
. . .
. . .
. . .
. . .
. . .
. . .
. . Low Duration . .
. . .
. . .
. . .
. . .
. . .
. . .
. . .
. . .
. . .
. . .
. . .
. . .
. . . U.S.
Government . . .
. . .
. . .
. . .
. . .
. . .
. . .
. . .
. . .
. . .
. . .
. . .
. . GNMA . .
. . .
. . .
. . .
. . .
. . .
. . .
. . .
. . .
. . .
. . .
. . .
. . .
. . .
. . .
. . . Core Bond .
. . .
. . .
. . .
. . .
. . .
. . .
. . .
. . .
. . .
. . .
. . .
. . .
. . .
. . .
. Corporate Bond. . .
. . .
. . .
. . .
. . .
. . .
. . .
. . .
. . .
. . .
. . .
. . .
. . .
. Strategic Income. . .
. . .
. . .
. . .
. . .
. . .
. . .
. . .
. . .
. . .
. . .
. . .
. . . Absolute Return Bond .
. . .
. . .
. . .
. . .
. . .
. . .
. . .
. . .
. . .
. . .
. . Floating Rate. .
. . .
. . .
. . .
. . .
. . .
. . .
. . .
. . .
. . .
. . .
. . .
. . .
. . .
. High Income . . .
. . .
. . .
. . .
. . .
. . .
. . .
. . .
. . .
. . .
. . .
. . .
. . .
. . . Global Low Duration .
. . .
. . .
. . .
. . .
. . .
. . .
. . .
. . .
. . .
. . .
. . . Global Fixed Income.
. . .
. . .
. . .
. . .
. . .
. . .
. . .
. . .
. . .
. . .
. . .
. Emerging Markets Bond . . .
. . .
. . .
. . .
. . .
. . .
. . .
. . .
. . .
. . .
. Emerging Markets Local Bond . . .
. . .
. . .
. . .
. . .
. . .
. . .
. . .
. Emerging Markets Corporate Bond . . .
. . .
. . .
. . .
. . .
. . .
. . . Equity Income .
. . .
. . .
. . .
. . .
. . .
. . .
. . .
. . .
. . .
. . .
. . .
. . .
. . . Investments in High Income Fund — Investor Class Global Fixed Income.
. . .
. . .
. . .
. . .
. . .
. . .
. . .
. . .
. . .
. . .
. . .
. Investments in Floating Rate Fund — SI Class Core Bond . . .
. . .
. . .
. . .
. . .
. . .
. . .
. . .
. . .
. . .
. . .
. . .
. . .
. . .
. . High Income . .
. . .
. . .
. . .
. . .
. . .
. . .
. . .
. . .
. . .
. . .
. . .
. . .
. . .
. Global Fixed Income. . .
. . .
. . .
. . .
. . .
. . .
. . .
. . .
. . .
. . .
. . .
. . Investments in Emerging Markets Bond Fund — SI Class Global Fixed Income. .
. . .
. . .
. . .
. . .
. . .
. . .
. . .
. . .
. . .
. . .
. . . Investments in Emerging Markets Corporate Bond Fund — SI Class Core Bond .
. . .
. . .
. . .
. . .
. . .
. . .
. . .
. . .
. . .
. . .
. . .
. . .
. . .
. . .
. High Income . . .
. . .
. . .
. . .
. . .
. . .
. . .
. . .
. . .
. . .
. . .
. . .
. . .
. . . Emerging Markets Local Bond .
. . .
. . .
. . .
. . .
. . .
. . .
. . .
. . . Investments in Emerging Markets Local Bond Fund — Investor Class Core Bond .
. . .
. . .
. . .
. . .
. . .
. . .
. . .
. . .
. . .
. . .
. . .
. . .
. . .
. . .
. Global Fixed Income. . .
. . .
. . .
. . .
. . .
. . .
. . .
. . .
. . .
. . .
. . .
. . and both realized and the change in unrealized gains and losses earned by each Fund from the Affiliated Funds for the period is disclosed in the Statements of Operations. The table below details the transactions of each Fund in Affiliated Funds. Value October 31, 2014 $20,346,364 54,772,743 8,940,063 3,490,609 23,784,686 10,993,989 8,641,858 — 5,993,145 60,647,206 9,807,464 3,059,342 56,274,108 6,486,481 6,725,392 21,452,555 Purchases Sales Dividends $1,318,393,828 $1,332,353,628 $ 527 1,334,111,706 1,380,668,414 524 1,833,263,780 1,829,155,330 739 1,618,894,500 1,615,563,003 633 2,052,014,796 2,054,234,542 824 452,299,207 462,280,252 183 1,162,553,690 1,165,283,469 475 1,018,794,151 1,016,007,533 421 3,244,990,744 3,241,474,978 1,295 5,269,609,460 5,290,986,126 2,068 267,034,382 274,883,002 105 410,750,733 410,995,048 162 5,310,566,020 5,337,675,063 2,107 689,484,452 693,669,966 276 228,188,704 234,119,569 91 1,606,725,601 1,623,966,714 662 $ 4,613,834 Value October 31, 2015 $ 6,386,564 8,216,035 13,048,513 6,822,106 21,564,940 1,012,944 5,912,079 2,786,618 9,508,911 39,270,540 1,958,844 2,815,027 29,165,065 2,300,967 794,527 4,211,442 — — $231,995 $ 4,170,698 — 4,000,000 — — $479,485 166,866 — 31,198 $15,069,499 8,920,536 985,055 $ 4,468,516 — — $211,890 $ 4,142,092 $17,227,177 9,360,000 3,907,515 — — 1,000,000 — $733,480 — 398,520 — 176,875 $15,951,703 8,667,000 4,609,969 — $253,850 617,764 25,589 $ 4,302,987 — — $ 94,700 $ 4,965,000 $15,191,272 4,960,298 993,028 $ $ $ 5,478,879 767,004 Investments in Absolute Return Bond Fund — SI Class Core Bond .
. . .
. . .
. . .
. . .
. . .
. . .
. . .
. . .
. . .
. . .
. . .
. . .
. . .
. . .
. Custodian Credits The Funds have entered into an agreement with the custodian, whereby they earn custodian fee credits for temporary cash — — — $ $ 5,000,000 balances. These credits, which offset custodian fees that may be charged to the Funds, are based on 75% of the daily effective Annual Report 107 . Notes to Financial Statements continued federal funds rate and are disclosed, subject to rounding, in the Statements of Operations. by the Group are allocated among the Funds of the Group on the basis of relative net assets. Fund-specific expenses are charged to each Fund as incurred. Line of Credit The Paydenfunds (except Cash Reserves Money Market) have entered into a Credit Agreement with Bank of New York Mellon under which the bank has agreed to make loans to one or more of the Funds upon request by such Fund(s) and subject to the conditions of the Credit Agreement. The interest rate for any such loan will vary depending upon the type of borrowing chosen by the Fund. The aggregate of all such loans to the Funds may not exceed $75 million.
No Fund took a loan during the period, nor did any Fund have a loan outstanding at the end of the period. 3. Related Party Transactions Payden & Rygel (the “Adviser”) provides investment advisory services to the Funds. Under the terms of the investment advisory agreement, it is entitled to receive fees monthly, computed on the average daily net assets of each of the Funds separately at an annualized rate.
The rates for each Fund are shown in the table below. Other Income and realized and unrealized gain/loss are allocated to each class based on relative net assets. Shared expenses incurred Adviser Fees Investor Class Between $0–500 Million Cash Reserves Money Market . .
. . .
. . . Limited Maturity .
. . .
. . .
. . .
. . .
. . .
. . Low Duration . .
. . .
. . .
. . .
. . .
. . .
. . .
. U.S. Government . .
. . .
. . .
. . .
. . .
. . .
. GNMA . . .
. . .
. . .
. . .
. . .
. . .
. . .
. . .
. . Core Bond . .
. . .
. . .
. . .
. . .
. . .
. . .
. . .
. Corporate Bond . . .
. . .
. . .
. . .
. . .
. . .
. Strategic Income. . .
. . .
. . .
. . .
. . .
. . .
. Absolute Return Bond . . .
. . .
. . .
. . .
. Floating Rate . . .
. . .
. . .
. . .
. . .
. . .
. . . High Income.
. . .
. . .
. . .
. . .
. . .
. . .
. . . California Municipal Income .
. . .
. . .
. Global Low Duration. . .
. . .
. . .
. . .
. . . Global Fixed Income .
. . .
. . .
. . .
. . .
. . Emerging Markets Bond . .
. . .
. . .
. . .
. Emerging Markets Local Bond. . .
. . .
. Emerging Markets Corporate Bond . . . Equity Income .
. . .
. . .
. . .
. . .
. . .
. . .
. Between $0.5–1 Billion Between $1–2 Billion Over $2 Billion Expense Guarantee 0.15% 0.28% 0.28% 0.28% 0.27% 0.28% 0.35% 0.55% 0.50% 0.55% 0.35% 0.32% 0.30% 0.30% 0.45% 0.60% 0.80% 0.50% 0.15% 0.28% 0.28% 0.28% 0.27% 0.28% 0.35% 0.55% 0.50% 0.55% 0.35% 0.32% 0.30% 0.30% 0.45% 0.60% 0.80% 0.50% 0.15% 0.25% 0.25% 0.25% 0.27% 0.25% 0.35% 0.55% 0.50% 0.55% 0.35% 0.25% 0.30% 0.30% 0.45% 0.60% 0.80% 0.50% 0.15% 0.25% 0.25% 0.25% 0.27% 0.25% 0.35% 0.55% 0.50% 0.55% 0.35% 0.25% 0.25% 0.25% 0.45% 0.60% 0.80% 0.30% 0.50% 0.60% 0.60% 0.60% 0.50% 0.60% 1.00% n/a n/a n/a 0.75% 0.80% 0.70% 0.70% 1.25% 1.50% n/a 0.80% The Adviser agreed to guarantee that, for so long as it acts as investment adviser to the Funds, the expenses of the Funds, including advisory fees (exclusive of interest, 12b-1 fees, and taxes) will not exceed the percentages indicated above (“Expense Guarantee”) of that Fund’s average daily net assets on an annualized basis. The adviser also voluntarily agreed to temporarily limit certain Funds’ total expenses (“Voluntary Expense Limit”), including advisory fees, to the percentages indicated above of that Fund’s average daily net assets on an 108 Payden Mutual Funds Current Voluntary Expense Limit 0.25% 0.29% 0.47% 0.45% n/a n/a 0.65% 0.80% 0.70% 0.75% n/a 0.55% 0.55% 0.65% n/a 0.99% 0.95% n/a 3 Year Deferred Expense Subsidy FY 2013 FY 2014 FY 2015 $1,269,683 $1,525,458 393,598 682,077 237,852 701,944 174,255 180,662 1,238,187 360,087 — — 103,973 93,484 — 142,838 — — — 263,494 — — 51,157 65,834 101,433 177,907 106,512 87,672 293,712 342,910 — — — 221,119 152,607 187,200 $1,204,702 1,030,707 889,095 174,481 495,315 — 89,819 173,558 238,584 283,782 — 65,250 166,652 90,888 332,289 27,915 184,904 406,103 annualized basis through February 28, 2016 (exclusive of interest and taxes). Each Fund remains liable to the Adviser for expenses subsidized in any fiscal year up to a maximum of three years from the end of the period in which the expenses were subsidized as long as any reimbursement will not cause the annual expense ratio for the year in which it is made to exceed the amount of the . expense guarantee or voluntary expense limit (whichever is in effect at the time of reimbursement). solely to having a common investment advisor, common officers or common trustees. The deferred expense subsidies represent the cumulative amount of expenses subsidized for the Funds through the end of the period. Such amount is not considered a liability of each respective Fund, and, therefore, is not recorded as liabilities in the Statement of Assets and Liabilities, but will be recognized as net expense in the Statements of Operations as expense previously deferred in future periods, if expense limits permit. Indemnifications Under the Group’s organizational documents, its trustees and officers are indemnified by the Funds against certain liabilities arising out of the performance of their duties to the Funds. Additionally, in the normal course of business, the Funds enter into contracts with service providers that contain general indemnification clauses. A Fund’s maximum exposure under these agreements is unknown as this would involve future claims that may be made against the Fund that have not yet occurred. Currently the Funds expect this risk of loss to be remote. Treasury Plus, Inc., a wholly owned subsidiary of Payden & Rygel, serves as administrator to the Funds.
Under the terms of the administration agreement, Treasury Plus, Inc. receives fees monthly, computed on the average daily net assets of the Funds at an annualized rate of 0.15%. Under a distribution agreement with the Funds, the U.S. Government, GNMA, Core Bond, Strategic Income, Absolute Return Bond, Floating Rate, High Income, Emerging Markets Bond, Emerging Markets Local Bond, Emerging Markets Corporate Bond and Equity Income Funds adopted a plan pursuant to SEC rule 12b-1 by which Payden & Rygel Distributors receives fee monthly, computed on the average net assets of the Adviser class at an annualized rate of 0.25%. Payden & Rygel Distributors is not entitled to receive any fees from the Investor, or SI classes of the Funds. 4. Fair Value Measurement Various inputs are used in determining the value of each Fund’s investments and other financial instruments.
The inputs or methodology used for valuing securities are not necessarily an indication of the risk associated with investing in those securities. These inputs are summarized in the three broad levels: Level 1 — quoted prices in active markets for identical investments, Level 2 — other significant observable inputs (including quoted prices for similar securities, interest rates, prepayment speeds, credit risk, etc.), and Level 3 — significant unobservable inputs (including fund’s own assumptions in determining the fair value of investments). See Note 2 — Securities Valuation for a summary of the inputs used in valuing the Funds’ investments and other financial instruments. Certain officers and/or trustees of the Funds are affiliated with Payden & Rygel, Payden & Rygel Distributors and/or Treasury Plus, Inc.
Such officers and trustees receive no fees from the Funds for serving as officers and/or trustees of the Funds. The Funds may purchase securities from or sell securities to an affiliated fund or portfolio provided that the affiliation is due Investments in Securities Level 1-Quoted Prices Assets (000’s) Cash Reserves Money Market Repurchase Agreement. . .
. . .
. . .
. . .
. . .
. . .
. . .
. . . U.S.
Government . . .
. . .
. . .
. . .
. . .
. . .
. . .
. . .
. . .
. . U.S. Treasury .
. . .
. . .
. . .
. . .
. . .
. . .
. . .
. . .
. . .
. . .
. . Investment Company . .
. . .
. . .
. . .
. . .
. . .
. . .
. . .
. . — — — $3,888 Liabilities (000’s) — — — — Level 2-Other Significant Observable Inputs Assets (000’s) $140,000 223,521 25,000 — Level 3-Significant Unobservable Inputs Liabilities (000’s) — — — — Assets (000’s) Liabilities (000’s) — — — — — — — — Total (000’s) $140,000 223,521 25,000 3,888 Annual Report 109 . Notes to Financial Statements continued Investments in Securities Level 1-Quoted Prices Assets (000’s) Liabilities (000’s) Level 2-Other Significant Observable Inputs Assets (000’s) Level 3-Significant Unobservable Inputs Liabilities (000’s) Assets (000’s) Liabilities (000’s) Total (000’s) Limited Maturity Asset Backed . . . .
. . .
. . .
. . .
. . .
. . .
. . .
. . .
. . .
. . .
. . Bank Loans . .
. . .
. . .
. . .
. . .
. . .
. . .
. . .
. . .
. . .
. . .
. . . Commercial Paper .
. . .
. . .
. . .
. . .
. . .
. . .
. . .
. . .
. . . Corporate Bond.
. . .
. . .
. . .
. . .
. . .
. . .
. . .
. . .
. . .
. . . Foreign Government .
. . .
. . .
. . .
. . .
. . .
. . .
. . .
. . .
. Mortgage Backed . . .
. . .
. . .
. . .
. . .
. . .
. . .
. . .
. . .
. . Municipal . .
. . .
. . .
. . .
. . .
. . .
. . .
. . .
. . .
. . .
. . .
. . .
. U.S. Government . .
. . .
. . .
. . .
. . .
. . .
. . .
. . .
. . .
. . . Options Purchased .
. . .
. . .
. . .
. . .
. . .
. . .
. . .
. . .
. . . Investment Company .
. . .
. . .
. . .
. . .
. . .
. . .
. . .
. . . — — — — — — — — $ 2 6,387 — — — — — — — — — — $ 82,222 2,624 23,995 173,852 10,781 37,482 1,351 85,144 — — — — — — — — — — — — — — — — — — — — — — — — — — — — — — — — $ 82,222 2,624 23,995 173,852 10,781 37,482 1,351 85,144 2 6,387 Low Duration Asset Backed .
. . .
. . .
. . .
. . .
. . .
. . .
. . .
. . .
. . .
. . .
. . Bank Loans . .
. . .
. . .
. . .
. . .
. . .
. . .
. . .
. . .
. . .
. . .
. . . Commercial Paper .
. . .
. . .
. . .
. . .
. . .
. . .
. . .
. . .
. . . Corporate Bond.
. . .
. . .
. . .
. . .
. . .
. . .
. . .
. . .
. . .
. . . Foreign Government .
. . .
. . .
. . .
. . .
. . .
. . .
. . .
. . .
. Mortgage Backed . . .
. . .
. . .
. . .
. . .
. . .
. . .
. . .
. . .
. . Municipal . .
. . .
. . .
. . .
. . .
. . .
. . .
. . .
. . .
. . .
. . .
. . .
. U.S. Government . .
. . .
. . .
. . .
. . .
. . .
. . .
. . .
. . .
. . . Options Purchased .
. . .
. . .
. . .
. . .
. . .
. . .
. . .
. . .
. . . Investment Company .
. . .
. . .
. . .
. . .
. . .
. . .
. . .
. . . — — — — — — — — 11 8,216 — — — — — — — — — — 97,641 18,164 5,000 406,877 3,616 56,919 1,431 235,356 — — — — — — — — — — — — — — — — — — — — — — — — — — — — — — — — 97,641 18,164 5,000 406,877 3,616 56,919 1,431 235,356 11 8,216 U.S.
Government Asset Backed . . .
. . .
. . .
. . .
. . .
. . .
. . .
. . .
. . .
. . .
. . . Mortgage Backed .
. . .
. . .
. . .
. . .
. . .
. . .
. . .
. . .
. . .
. U.S. Government . .
. . .
. . .
. . .
. . .
. . .
. . .
. . .
. . .
. . . Options Purchased .
. . .
. . .
. . .
. . .
. . .
. . .
. . .
. . .
. . . Investment Company .
. . .
. . .
. . .
. . .
. . .
. . .
. . .
. . . — — — 1 13,048 — — — — — 2,118 104,949 22,703 — — — — — — — — — — — — — — — — — 2,118 104,949 22,703 1 13,048 GNMA Mortgage Backed .
. . .
. . .
. . .
. . .
. . .
. . .
. . .
. . .
. . .
. U.S. Government . .
. . .
. . .
. . .
. . .
. . .
. . .
. . .
. . .
. . . Options Purchased .
. . .
. . .
. . .
. . .
. . .
. . .
. . .
. . .
. . . Investment Company .
. . .
. . .
. . .
. . .
. . .
. . .
. . .
. . . — — 6 6,822 — — — — 400,537 14,858 — — — — — — — — — — — — — — 400,537 14,858 6 6,822 110 Payden Mutual Funds .
Investments in Securities Level 1-Quoted Prices Assets (000’s) Liabilities (000’s) Level 2-Other Significant Observable Inputs Assets (000’s) Level 3-Significant Unobservable Inputs Liabilities (000’s) Assets (000’s) Liabilities (000’s) Total (000’s) Core Bond Asset Backed . . . .
. . .
. . .
. . .
. . .
. . .
. . .
. . .
. . .
. . .
. . Corporate Bond. .
. . .
. . .
. . .
. . .
. . .
. . .
. . .
. . .
. . .
. . Foreign Government . .
. . .
. . .
. . .
. . .
. . .
. . .
. . .
. . . Mortgage Backed .
. . .
. . .
. . .
. . .
. . .
. . .
. . .
. . .
. . .
. Municipal . . .
. . .
. . .
. . .
. . .
. . .
. . .
. . .
. . .
. . .
. . .
. . . U.S.
Government . . .
. . .
. . .
. . .
. . .
. . .
. . .
. . .
. . .
. . Investment Company . .
. . .
. . .
. . .
. . .
. . .
. . .
. . .
. . — — — — — — $61,854 — — — — — — — $ 43,927 340,316 18,090 229,337 4,340 92,644 — — — — — — — — — — — — — — — — — — — — — — $ 43,927 340,316 18,090 229,337 4,340 92,644 61,854 Corporate Bond Corporate Bond. .
. . .
. . .
. . .
. . .
. . .
. . .
. . .
. . .
. . .
. . Mortgage Backed . .
. . .
. . .
. . .
. . .
. . .
. . .
. . .
. . .
. . . U.S.
Government . . .
. . .
. . .
. . .
. . .
. . .
. . .
. . .
. . .
. . Investment Company . .
. . .
. . .
. . .
. . .
. . .
. . .
. . .
. . — — — 1,013 — — — — 69,313 408 450 — — — — — — — — — — — — — 69,313 408 450 1,013 Strategic Income Asset Backed . .
. . .
. . .
. . .
. . .
. . .
. . .
. . .
. . .
. . .
. . .
. Bank Loans . . .
. . .
. . .
. . .
. . .
. . .
. . .
. . .
. . .
. . .
. . .
. . Corporate Bond. .
. . .
. . .
. . .
. . .
. . .
. . .
. . .
. . .
. . .
. . Foreign Government . .
. . .
. . .
. . .
. . .
. . .
. . .
. . .
. . . Mortgage Backed .
. . .
. . .
. . .
. . .
. . .
. . .
. . .
. . .
. . .
. Municipal . . .
. . .
. . .
. . .
. . .
. . .
. . .
. . .
. . .
. . .
. . .
. . . Preferred Stock .
. . .
. . .
. . .
. . .
. . .
. . .
. . .
. . .
. . .
. . . Real Estate Investment Trust .
. . .
. . .
. . .
. . .
. . .
. . U.S. Government .
. . .
. . .
. . .
. . .
. . .
. . .
. . .
. . .
. . .
. Investment Company . . .
. . .
. . .
. . .
. . .
. . .
. . .
. . .
. — — — — — — 1,160 1,311 — 5,912 — — — — — — — — — — 12,843 11,661 72,380 7,831 31,219 250 — — 22,509 — — — — — — — — — — — — — — — — — — — — — — — — — — — — — — — 12,843 11,661 72,380 7,831 31,219 250 1,160 1,311 22,509 5,912 Absolute Return Bond Asset Backed . . .
. . .
. . .
. . .
. . .
. . .
. . .
. . .
. . .
. . .
. . . Bank Loans .
. . .
. . .
. . .
. . .
. . .
. . .
. . .
. . .
. . .
. . .
. . .
. Corporate Bond. . .
. . .
. . .
. . .
. . .
. . .
. . .
. . .
. . .
. . .
. Foreign Government . . .
. . .
. . .
. . .
. . .
. . .
. . .
. . .
. . Mortgage Backed . .
. . .
. . .
. . .
. . .
. . .
. . .
. . .
. . .
. . . U.S.
Government . . .
. . .
. . .
. . .
. . .
. . .
. . .
. . .
. . .
. . Options Purchased . .
. . .
. . .
. . .
. . .
. . .
. . .
. . .
. . .
. . Investment Company . .
. . .
. . .
. . .
. . .
. . .
. . .
. . .
. . — — — — — — 14 2,787 — — — — — — — — 6,524 4,505 21,862 195 18,728 6,895 — — — — — — — — — — — — — — — — — — — — — — — — — — 6,524 4,505 21,862 195 18,728 6,895 14 2,787 Annual Report 111 . Notes to Financial Statements continued Investments in Securities Level 1-Quoted Prices Assets (000’s) Liabilities (000’s) Level 2-Other Significant Observable Inputs Assets (000’s) Level 3-Significant Unobservable Inputs Liabilities (000’s) Assets (000’s) Liabilities (000’s) Total (000’s) Floating Rate Asset Backed . . . .
. . .
. . .
. . .
. . .
. . .
. . .
. . .
. . .
. . .
. . Bank Loans . .
. . .
. . .
. . .
. . .
. . .
. . .
. . .
. . .
. . .
. . .
. . . Corporate Bond.
. . .
. . .
. . .
. . .
. . .
. . .
. . .
. . .
. . .
. . . Mortgage Backed .
. . .
. . .
. . .
. . .
. . .
. . .
. . .
. . .
. . .
. Investment Company . . .
. . .
. . .
. . .
. . .
. . .
. . .
. . .
. — — — — $ 9,509 — — — — — $ 9,988 126,885 12,261 1,990 — — — — — — — — — — — — — — — — $ 9,988 126,885 12,261 1,990 9,509 High Income Bank Loans . . .
. . .
. . .
. . .
. . .
. . .
. . .
. . .
. . .
. . .
. . .
. . Corporate Bonds . .
. . .
. . .
. . .
. . .
. . .
. . .
. . .
. . .
. . .
. Mortgage Backed . . .
. . .
. . .
. . .
. . .
. . .
. . .
. . .
. . .
. . Preferred Stock . .
. . .
. . .
. . .
. . .
. . .
. . .
. . .
. . .
. . .
. . Real Estate Investment Trusts . .
. . .
. . .
. . .
. . .
. . . Investment Company .
. . .
. . .
. . .
. . .
. . .
. . .
. . .
. . . — — — 8,281 5,596 56,858 — — — — — — 2,243 533,637 6,363 — — — — — — — — — — — — — — — — — — — — — 2,243 533,637 6,363 8,281 5,596 56,858 California Municipal Income Municipal .
. . .
. . .
. . .
. . .
. . .
. . .
. . .
. . .
. . .
. . .
. . .
. . Investment Company . .
. . .
. . .
. . .
. . .
. . .
. . .
. . .
. . — 1,520 — — 44,761 — — — — — — — 44,761 1,520 Global Low Duration Asset Backed . .
. . .
. . .
. . .
. . .
. . .
. . .
. . .
. . .
. . .
. . .
. Bank Loans . . .
. . .
. . .
. . .
. . .
. . .
. . .
. . .
. . .
. . .
. . .
. . Corporate Bond. .
. . .
. . .
. . .
. . .
. . .
. . .
. . .
. . .
. . .
. . Foreign Government . .
. . .
. . .
. . .
. . .
. . .
. . .
. . .
. . . Mortgage Backed .
. . .
. . .
. . .
. . .
. . .
. . .
. . .
. . .
. . .
. Municipal . . .
. . .
. . .
. . .
. . .
. . .
. . .
. . .
. . .
. . .
. . .
. . . U.S.
Government . . .
. . .
. . .
. . .
. . .
. . .
. . .
. . .
. . .
. . Options Purchased . .
. . .
. . .
. . .
. . .
. . .
. . .
. . .
. . .
. . Investment Company . .
. . .
. . .
. . .
. . .
. . .
. . .
. . .
. . — — — — — — — 5 1,959 — — — — — — — — — 14,413 2,247 67,900 5,361 6,977 252 29,650 — — — — — — — — — — — — — — — — — — — — — — — — — — — — — 14,413 2,247 67,900 5,361 6,977 252 29,650 5 1,959 Global Fixed Income Corporate Bond. .
. . .
. . .
. . .
. . .
. . .
. . .
. . .
. . .
. . .
. . Foreign Government . .
. . .
. . .
. . .
. . .
. . .
. . .
. . .
. . . Mortgage Backed .
. . .
. . .
. . .
. . .
. . .
. . .
. . .
. . .
. . .
. U.S. Government . .
. . .
. . .
. . .
. . .
. . .
. . .
. . .
. . .
. . . Investment Company .
. . .
. . .
. . .
. . .
. . .
. . .
. . .
. . . — — — — 12,113 — — — — — 30,501 30,387 496 7,511 — — — — — — — — — — — — — — — — 30,501 30,387 496 7,511 12,113 112 Payden Mutual Funds .
Investments in Securities Level 1-Quoted Prices Assets (000’s) Liabilities (000’s) Level 2-Other Significant Observable Inputs Assets (000’s) Level 3-Significant Unobservable Inputs Liabilities (000’s) Assets (000’s) Liabilities (000’s) Total (000’s) Emerging Markets Bond Corporate Bond. . . .
. . .
. . .
. . .
. . .
. . .
. . .
. . .
. . .
. . . Foreign Government .
. . .
. . .
. . .
. . .
. . .
. . .
. . .
. . .
. Investment Company . . .
. . .
. . .
. . .
. . .
. . .
. . .
. . .
. — — $ 29,165 — — — $293,147 644,979 — — — — — — — — — — $293,147 644,979 29,165 Emerging Markets Local Bond Corporate Bond. . .
. . .
. . .
. . .
. . .
. . .
. . .
. . .
. . .
. . .
. Foreign Government . . .
. . .
. . .
. . .
. . .
. . .
. . .
. . .
. . Investment Company . .
. . .
. . .
. . .
. . .
. . .
. . .
. . .
. . — — 6,911 — — — 20,570 98,447 — — — — — — — — — — 20,570 98,447 6,911 Emerging Markets Corporate Bond Corporate Bond. .
. . .
. . .
. . .
. . .
. . .
. . .
. . .
. . .
. . .
. . Foreign Government . .
. . .
. . .
. . .
. . .
. . .
. . .
. . .
. . . Investment Company .
. . .
. . .
. . .
. . .
. . .
. . .
. . .
. . . — — 795 — — — 32,279 2,263 — — — — — — — — — — 32,279 2,263 795 Equity Income Common Stock .
. . .
. . .
. . .
. . .
. . .
. . .
. . .
. . .
. . .
. . . Master Limited Partnership .
. . .
. . .
. . .
. . .
. . .
. . . Preferred Stock .
. . .
. . .
. . .
. . .
. . .
. . .
. . .
. . .
. . .
. . . Real Estate Investment Trust .
. . .
. . .
. . .
. . .
. . .
. . Investment Company . .
. . .
. . .
. . .
. . .
. . .
. . .
. . .
. . 472,382 14,639 26,598 45,246 4,212 — — — — — — — — — — — — — — — — — — — — — — — — — 472,382 14,639 26,598 45,246 4,212 Other Financial Instruments 1 Level 1-Quoted Prices Assets (000’s) Liabilities (000’s) Level 2-Other Significant Observable Inputs Assets (000’s) Level 3-Significant Unobservable Inputs Liabilities (000’s) Assets (000’s) Liabilities (000’s) Total (000’s) Limited Maturity Forward currency contracts . .
. . .
. . .
. . .
. . .
. . .
. . . — — $128 $(187) — — $ (59) Low Duration Forward currency contracts .
. . .
. . .
. . .
. . .
. . .
. . .
. Futures. . .
. . .
. . .
. . .
. . .
. . .
. . .
. . .
. . .
. . .
. . .
. . .
. . . Swaps .
. . .
. . .
. . .
. . .
. . .
. . .
. . .
. . .
. . .
. . .
. . .
. . .
. . . — $41 — — — — 173 — — (84) — (146) — — — — — — 89 41 (146) U.S Government Futures.
. . .
. . .
. . .
. . .
. . .
. . .
. . .
. . .
. . .
. . .
. . .
. . .
. . — (40) — — — — (40) GNMA Futures. .
. . .
. . .
. . .
. . .
. . .
. . .
. . .
. . .
. . .
. . .
. . .
. . .
. 21 — — — — — 21 Annual Report 113 . Notes to Financial Statements continued Other Financial Instruments 1 Level 1-Quoted Prices Assets (000’s) Liabilities (000’s) Level 2-Other Significant Observable Inputs Assets (000’s) Level 3-Significant Unobservable Inputs Liabilities (000’s) Assets (000’s) Liabilities (000’s) Total (000’s) Core Bond Forward currency contracts . . . .
. . .
. . .
. . .
. . .
. . .
. Futures. . .
. . .
. . .
. . .
. . .
. . .
. . .
. . .
. . .
. . .
. . .
. . .
. . . — $334 — $ (52) $561 — $ (560) — — — — — Corporate Bond Forward currency contracts .
. . .
. . .
. . .
. . .
. . .
. . .
. Futures. . .
. . .
. . .
. . .
. . .
. . .
. . .
. . .
. . .
. . .
. . .
. . .
. . . — 33 — (29) 25 — (11) — — — — — 14 4 Strategic Income Forward currency contracts .
. . .
. . .
. . .
. . .
. . .
. . .
. Futures. . .
. . .
. . .
. . .
. . .
. . .
. . .
. . .
. . .
. . .
. . .
. . .
. . . — 72 — (10) 136 — (121) — — — — — 15 62 Absolute Return Bond Forward currency contracts .
. . .
. . .
. . .
. . .
. . .
. . .
. Futures. . .
. . .
. . .
. . .
. . .
. . .
. . .
. . .
. . .
. . .
. . .
. . .
. . . — 13 — (24) 51 — (51) — — — — — — (11) High Income Forward currency contracts .
. . .
. . .
. . .
. . .
. . .
. . .
. Futures. . .
. . .
. . .
. . .
. . .
. . .
. . .
. . .
. . .
. . .
. . .
. . .
. . . — — — (179) 347 — (379) — — — — — (32) (179) Global Low Duration Forward currency contracts .
. . .
. . .
. . .
. . .
. . .
. . .
. Futures. . .
. . .
. . .
. . .
. . .
. . .
. . .
. . .
. . .
. . .
. . .
. . .
. . . Swaps .
. . .
. . .
. . .
. . .
. . .
. . .
. . .
. . .
. . .
. . .
. . .
. . .
. . . — 4 — — (40) — 103 — — (50) — (26) — — — — — — 53 (36) (26) Global Fixed Income Forward currency contracts .
. . .
. . .
. . .
. . .
. . .
. . .
. Futures. . .
. . .
. . .
. . .
. . .
. . .
. . .
. . .
. . .
. . .
. . .
. . .
. . . — 88 — (53) 477 — (395) — — — — — 82 35 Emerging Markets Bond Forward currency contracts .
. . .
. . .
. . .
. . .
. . .
. . .
. — — 270 (1,269) — — (999) Emerging Markets Local Bond Forward currency contracts . . .
. . .
. . .
. . .
. . .
. . .
. . — — 6 (203) — — (197) Emerging Markets Corporate Bond Forward currency contracts . .
. . .
. . .
. . .
. . .
. . .
. . . — — 5 (30) — — (25) 1 $ 1 282 Other financial instruments are swaps, futures contracts and forward currency contracts.
Futures contracts and forward currency contracts are valued at the unrealized appreciation/depreciation on the instrument and swaps are valued at market value. 114 Payden Mutual Funds . 5. Federal Tax Information (amounts in 000s) Increase/ (Decrease) Undistributed Net Investment Income Distributions from net investment income and net realized capital gains are determined in accordance with U.S. federal income tax regulations, which may differ from those amounts determined under GAAP. These book/tax differences are either temporary or permanent in nature.
To the extent these differences are permanent, they are charged or credited to undistributed net investment income, accumulated net realized gains or paid-in capital, as appropriate, in the period that the differences arise. Accordingly, the following permanent differences as of October 31, 2015, primarily attributable to foreign currency gains/losses and mortgage backed securities and swaps, were reclassified to the following accounts. These reclassifications had no effect on net assets or net asset value per share (amounts in thousands): Increase/ (Decrease) Undistributed Net Investment Income Cash Reserves Money Market .
. . Limited Maturity . .
. . .
. . .
. . .
. . Low Duration . .
. . .
. . .
. . .
. . .
. . U.S. Government .
. . .
. . .
. . .
. . . GNMA .
. . .
. . .
. . .
. . .
. . .
. . .
. . . Core Bond .
. . .
. . .
. . .
. . .
. . .
. . . Corporate Bond .
. . .
. . .
. . .
. . .
. . Strategic Income . .
. . .
. . .
. . .
. . . Absolute Return Bond .
. . .
. . .
. . Floating Rate. .
. . .
. . .
. . .
. . .
. . . High Income .
. . .
. . .
. . .
. . .
. . .
. Global Low Duration . . .
. . .
. . .
. $ 3 (665) (156) 823 6,022 2,830 (48) 29 117 (1) 75 $(1,287) Increase/ (Decrease) Net Realized Gains Global Fixed Income . . .
. . .
. . .
. Emerging Markets Bond . . .
. . .
. Emerging Markets Local Bond . . Emerging Markets Corporate Bond . .
. . .
. . .
. . .
. . .
. . .
. . .
. . .
. Equity Income. . .
. . .
. . .
. . .
. . .
. Increase/ (Decrease) Paid in Capital $ (3) 665 156 (823) (6,022) (2,830) 48 (29) (117) 1 (75) $ 1,287 — — — — — — — — — — — — Increase/ (Decrease) Net Realized Gains Increase/ (Decrease) Paid in Capital 139 1,670 (7,842) (139) (1,670) 25,430 — — $(17,588) (3) 400 3 (395) — (5) For Federal income tax purposes the following Funds had capital loss carryforwards at year end in the amount indicated below. The carryforwards are available to offset future capital gains, if any. The following Funds used capital loss carryforwards to reduce required capital gain distributions for the year ended October 31, 2015: Cash Reserves Money Market ($1), Limited Maturity ($1,544), Global Low Duration ($1,140) and Global Fixed Income ($384). Under the Regulated Investment Company Modernization Act of 2010, the Funds will be permitted to carry forward capital losses incurred in taxable years beginning after December 22, 2010 (“post-enactment”), for an unlimited period.
However, any losses incurred during those future taxable years will be required to be utilized prior to the losses incurred in preenactment taxable years. Additionally, post-enactment capital losses that are carried forward will retain their character as either short or long term capital losses rather than being considered all short term. At October 31, 2015 the following Funds had available for Federal income tax purposes unused capital losses as follows (000’s): Expires 2016 Limited Maturity . .
. . .
. . .
. . .
. . .
. . .
. . .
. . .
. . .
. . .
. . .
. . .
. . .
. U.S. Government . .
. . .
. . .
. . .
. . .
. . .
. . .
. . .
. . .
. . .
. . .
. . .
. . .
. GNMA. . .
. . .
. . .
. . .
. . .
. . .
. . .
. . .
. . .
. . .
. . .
. . .
. . .
. . .
. . .
. . .
. Strategic Income . . .
. . .
. . .
. . .
. . .
. . .
. . .
. . .
. . .
. . .
. . .
. . .
. . .
. Absolute Return Bond . . .
. . .
. . .
. . .
. . .
. . .
. . .
. . .
. . .
. . .
. . .
. Floating Rate . . .
. . .
. . .
. . .
. . .
. . .
. . .
. . .
. . .
. . .
. . .
. . .
. . .
. . .
. High Income . . .
. . .
. . .
. . .
. . .
. . .
. . .
. . .
. . .
. . .
. . .
. . .
. . .
. . .
. Global Low Duration. . .
. . .
. . .
. . .
. . .
. . .
. . .
. . .
. . .
. . .
. . .
. . . Emerging Markets Bond .
. . .
. . .
. . .
. . .
. . .
. . .
. . .
. . .
. . .
. . .
. Emerging Markets Local Bond . . .
. . .
. . .
. . .
. . .
. . .
. . .
. . .
. . . Emerging Markets Corporate Bond .
. . .
. . .
. . .
. . .
. . .
. . .
. . . Equity Income .
. . .
. . .
. . .
. . .
. . .
. . .
. . .
. . .
. . .
. . .
. . .
. . .
. . .
. . * Post-enactment carryforward losses. $1,248 — — — — — — — — — — — Expires 2017 $2,201 — — — — — — — — — — — Expires 2018 $287 — — — — — — 914 — — — — Expires 2019 $527 — — — — — — — — — — — Unlimited* — $ 3,615 32,377 198 370 1,525 20,856 — 29,161 18,439 565 1,922 Total $ 4,263 3,615 32,377 198 370 1,525 20,856 914 29,161 18,439 565 1,922 Annual Report 115 . Notes to Financial Statements continued The tax character of distributions paid during the fiscal years ended October 31st is as follows (000’s): Cash Reserves Money Market . . . .
. . .
. . .
. . .
. . .
. . .
. . .
. . .
. . .
. . Limited Maturity . .
. . .
. . .
. . .
. . .
. . .
. . .
. . .
. . .
. . .
. . .
. . .
. . .
. Low Duration . . .
. . .
. . .
. . .
. . .
. . .
. . .
. . .
. . .
. . .
. . .
. . .
. . .
. . . U.S.
Government . . .
. . .
. . .
. . .
. . .
. . .
. . .
. . .
. . .
. . .
. . .
. . .
. . . GNMA.
. . .
. . .
. . .
. . .
. . .
. . .
. . .
. . .
. . .
. . .
. . .
. . .
. . .
. . .
. . .
. Core Bond. . .
. . .
. . .
. . .
. . .
. . .
. . .
. . .
. . .
. . .
. . .
. . .
. . .
. . .
. . . Corporate Bond.
. . .
. . .
. . .
. . .
. . .
. . .
. . .
. . .
. . .
. . .
. . .
. . .
. . .
. Strategic Income . . .
. . .
. . .
. . .
. . .
. . .
. . .
. . .
. . .
. . .
. . .
. . .
. . .
. Absolute Return Bond . . .
. . .
. . .
. . .
. . .
. . .
. . .
. . .
. . .
. . .
. . .
. . Floating Rate . .
. . .
. . .
. . .
. . .
. . .
. . .
. . .
. . .
. . .
. . .
. . .
. . .
. . .
. High Income . . .
. . .
. . .
. . .
. . .
. . .
. . .
. . .
. . .
. . .
. . .
. . .
. . .
. . . California Municipal Income.
. . .
. . .
. . .
. . .
. . .
. . .
. . .
. . .
. . .
. . . Global Low Duration .
. . .
. . .
. . .
. . .
. . .
. . .
. . .
. . .
. . .
. . .
. . .
. . Global Fixed Income. .
. . .
. . .
. . .
. . .
. . .
. . .
. . .
. . .
. . .
. . .
. . .
. . Emerging Markets Bond . .
. . .
. . .
. . .
. . .
. . .
. . .
. . .
. . .
. . .
. . .
. . Emerging Markets Local Bond . .
. . .
. . .
. . .
. . .
. . .
. . .
. . .
. . .
. . . Emerging Markets Corporate Bond.
. . .
. . .
. . .
. . .
. . .
. . .
. . .
. . .
. Equity Income . . .
. . .
. . .
. . .
. . .
. . .
. . .
. . .
. . .
. . .
. . .
. . .
. . .
. . 2014 2015 Tax-Exempt Ordinary Long Term Return of Tax-Exempt Ordinary Long Term Return of Income Income Capital Gains Capital Income Income Capital Gains Capital — $ 50 — $ 2 — $ 40 — — — 2,444 — — — 1,596 — $1,266 — 10,925 — — — 9,749 $ 3,365 207 — 1,863 — — — 1,857 — — — 14,006 — — — 10,508 — — — 17,331 $ 4,552 — — 17,673 3,700 — — 2,423 942 — — 3,135 763 — — 772 — — — 2,777 138 143 — — — — — 895 — — — 3954 — — — 6,026 — — — 45,372 24,079 — — 37,945 24,349 — $1,001 — 246 — $974 25 317 — — 1,577 — — — 202 — 1,293 — 925 — 133 — 837 406 — — 38,308 3,086 6,434 — 46,244 — — — — — 11,302 — — — 7,673 — 1,847 — — — 2,430 22 — — 5,312 2,144 — — 17,584 11,862 — At October 31, 2015, net unrealized appreciation (depreciation) on investments for Federal income tax purposes is as follows (000’s): Cost of Investments Federal Income Tax Purposes Cash Reserves Money Market. .
. . .
. . .
. . .
. . .
. . .
. . .
. . .
. . .
. . .
. . .
. . .
. . .
. . .
. . Limited Maturity . .
. . .
. . .
. . .
. . .
. . .
. . .
. . .
. . .
. . .
. . .
. . .
. . .
. . .
. . .
. . .
. . .
. . .
. Low Duration . . .
. . .
. . .
. . .
. . .
. . .
. . .
. . .
. . .
. . .
. . .
. . .
. . .
. . .
. . .
. . .
. . .
. . .
. . . U.S.
Government . . .
. . .
. . .
. . .
. . .
. . .
. . .
. . .
. . .
. . .
. . .
. . .
. . .
. . .
. . .
. . .
. . .
. . . GNMA .
. . .
. . .
. . .
. . .
. . .
. . .
. . .
. . .
. . .
. . .
. . .
. . .
. . .
. . .
. . .
. . .
. . .
. . .
. . .
. . .
. . Core Bond . .
. . .
. . .
. . .
. . .
. . .
. . .
. . .
. . .
. . .
. . .
. . .
. . .
. . .
. . .
. . .
. . .
. . .
. . .
. . .
. Corporate Bond . . .
. . .
. . .
. . .
. . .
. . .
. . .
. . .
. . .
. . .
. . .
. . .
. . .
. . .
. . .
. . .
. . .
. . .
. Strategic Income . . .
. . .
. . .
. . .
. . .
. . .
. . .
. . .
. . .
. . .
. . .
. . .
. . .
. . .
. . .
. . .
. . .
. . . Absolute Return Bond .
. . .
. . .
. . .
. . .
. . .
. . .
. . .
. . .
. . .
. . .
. . .
. . .
. . .
. . .
. . .
. . . Floating Rate.
. . .
. . .
. . .
. . .
. . .
. . .
. . .
. . .
. . .
. . .
. . .
. . .
. . .
. . .
. . .
. . .
. . .
. . .
. . . High Income .
. . .
. . .
. . .
. . .
. . .
. . .
. . .
. . .
. . .
. . .
. . .
. . .
. . .
. . .
. . .
. . .
. . .
. . .
. . . California Municipal Income .
. . .
. . .
. . .
. . .
. . .
. . .
. . .
. . .
. . .
. . .
. . .
. . .
. . .
. . . Global Low Duration .
. . .
. . .
. . .
. . .
. . .
. . .
. . .
. . .
. . .
. . .
. . .
. . .
. . .
. . .
. . .
. . .
. Global Fixed Income. . .
. . .
. . .
. . .
. . .
. . .
. . .
. . .
. . .
. . .
. . .
. . .
. . .
. . .
. . .
. . .
. . . Emerging Markets Bond .
. . .
. . .
. . .
. . .
. . .
. . .
. . .
. . .
. . .
. . .
. . .
. . .
. . .
. . .
. . .
. Emerging Markets Local Bond . . .
. . .
. . .
. . .
. . .
. . .
. . .
. . .
. . .
. . .
. . .
. . .
. . .
. . Emerging Markets Corporate Bond . .
. . .
. . .
. . .
. . .
. . .
. . .
. . .
. . .
. . .
. . .
. . .
. . Equity Income . .
. . .
. . .
. . .
. . .
. . .
. . .
. . .
. . .
. . .
. . .
. . .
. . .
. . .
. . .
. . .
. . .
. . .
. . . 116 Payden Mutual Funds $ 392,409 427,401 839,194 142,321 413,123 789,220 70,542 167,752 61,616 161,854 615,112 44,636 130,315 82,962 1,007,624 153,052 36,046 518,800 Gross Unrealized Appreciation on Investments $ — 432 2,332 735 10,021 9,306 1,283 1,065 245 327 14,955 1,690 347 1,372 15,023 1,496 441 56,741 Gross Unrealized Depreciation on Investments Net Unrealized Appreciation (Depreciation) on Investments — $ (3,993) (8,295) (237) (921) (8,018) (641) (1,741) (351) (1,548) (17,089) (45) (1,898) (3,326) (55,356) (28,620) (1,150) (12,464) — $ (3,561) (5,963) 498 9,100 1,288 642 (676) (106) (1,221) (2,134) 1,645 (1,551) (1,954) (40,333) (27,124) (709) 44,277 .
At October 31, 2015, the components of accumulated earnings (deficit) for Federal income tax purposes are as follows (000’s): Undistributed Realized Long Term Capital Gains Undistributed Ordinary Income Cash Reserves Money Market. . . .
. . .
. Limited Maturity . . .
. . .
. . .
. . .
. . .
. . .
. Low Duration . . .
. . .
. . .
. . .
. . .
. . .
. . .
. U.S. Government . .
. . .
. . .
. . .
. . .
. . .
. . GNMA . .
. . .
. . .
. . .
. . .
. . .
. . .
. . .
. . .
. . Core Bond. .
. . .
. . .
. . .
. . .
. . .
. . .
. . .
. . . Corporate Bond.
. . .
. . .
. . .
. . .
. . .
. . .
. . Strategic Income. .
. . .
. . .
. . .
. . .
. . .
. . . Absolute Return Bond .
. . .
. . .
. . .
. . .
. Floating Rate. . .
. . .
. . .
. . .
. . .
. . .
. . .
. . High Income . .
. . .
. . .
. . .
. . .
. . .
. . .
. . . California Municipal Income .
. . .
. . .
. Global Low Duration . . .
. . .
. . .
. . .
. . . Global Fixed Income.
. . .
. . .
. . .
. . .
. . . Emerging Markets Bond .
. . .
. . .
. . .
. . Emerging Markets Local Bond . .
. . .
. Emerging Markets Corporate Bond . . Equity Income. .
. . .
. . .
. . .
. . .
. . .
. . .
. . $ 4 — — 2 128 934 355 — 88 96 172 17 — — 2,370 — 18 1,352 — — — — — $370 509 — — — — 548 — 927 — — — — 6. Exempt Interest Income Designation (unaudited) Exempt Interest Dividends ($000s) California Municipal Income .
. . .
. . .
. . .
. . .
. . .
. . Exempt Interest Dividends Per Share 974 Capital Loss Carryforwards — $ (4,263) — (3,615) (32,377) — — (198) (370) (1,525) (20,856) — (914) — (29,161) (18,439) (565) (1,922) Distributions Payable $ (2) (9) (99) (6) (64) — — — — — — (21) — — — — — — Net Unrealized Appreciation (Depreciation) — $ (3,561) (5,984) 498 9,100 1,238 642 (687) (100) (1,221) (2,155) 1,645 (1,555) (1,959) (40,648) (27,273) (717) 44,277 Total Distributions Earnings (Deficit) $ 2 (7,833) (6,083) (3,121) (23,213) 2,542 1,506 (885) (382) (2,650) (22,839) 2,189 (2,469) (1,032) (67,439) (45,712) (1,264) 43,707 7. Subsequent Events The Funds have evaluated subsequent events through the issuance of the financial statements and have determined that no other events have occurred that require disclosure. 0.23 Annual Report 117 .
Financial Highlights For the share outstanding for the periods ended October 31st 2015 Net asset value — beginning of period . . . .
. . .
. . .
. . .
. . .
. . .
. . .
. . .
$ 1.00 Income from investment activities: Net investment income . . .
. . .
. . .
. . .
. . .
. . .
. . .
. . .
. . .
. . .
. . .
. . 0.00(1) Net realized and unrealized gains (losses) . .
. . .
. . .
. . .
. . .
. . .
. . .
. . 0.00(1) Total from investment activities . .
. . .
. . .
. . .
. . .
. . .
. . .
. . .
. . .
. 0.00 Distributions to shareholders: From net investment income . . .
. . .
. . .
. . .
. . .
. . .
. . .
. . .
. . .
. . .
. 0.00(1) Return of capital. . .
. . .
. . .
. . .
. . .
. . .
. . .
. . .
. . .
. . .
. . .
. . .
. . .
. . — Total distributions to shareholders . .
. . .
. . .
. . .
. . .
. . .
. . .
. . .
. . 0.00 Net asset value — end of period . .
. . .
. . .
. . .
. . .
. . .
. . .
. . .
. . .
. . .
. $ 1.00 Total return . .
. . .
. . .
. . .
. . .
. . .
. . .
. . .
. . .
. . .
. . .
. . .
. . .
. . .
. Payden Cash Reserves Money Market Fund 2014 2013 2012 $ 1.00 $ 1.00 $ 1.00 $ 2011 1.00 0.00(1) 0.00(1) 0.00 $ 0.00(1) 0.00(1) 0.00 0.00(1) 0.00(1) 0.00 0.00(1) 0.00(1) 0.00 0.00(1) 0.00(1) 0.00 1.00 0.00(1) 0.00(1) 0.00 1.00 (0.00)(1) — 0.00 1.00 (0.00)(1) — 0.00 1.00 $ $ $ 0.01% 0.01% 0.02% 0.02% 0.03% Ratios/supplemental data: Net assets, end of period (000s) . . .
. . .
. . .
. . .
. . .
. . .
. . .
. . .
. . .
. . $ 392,391 Ratio of gross expense to average net assets.
. . .
. . .
. . .
. . .
. . .
. . .
. . 0.39% Ratio of net expense to average net assets . .
. . .
. . .
. . .
. . .
. . .
. . .
. . 0.09% Ratio of investment income less gross expenses to average net assets . . (0.29)% Ratio of net investment income to average net assets .
. . .
. . .
. . .
. . . 0.01% Portfolio turnover rate .
. . .
. . .
. . .
. . .
. . .
. . .
. . .
. . .
. . .
. . .
. . .
. . n/a $ 490,666 0.37% 0.08% (0.28)% 0.01% n/a $ 498,417 0.37% 0.10% (0.26)% 0.01% n/a $ 525,480 0.38% 0.15% (0.21)% 0.02% n/a $ 746,719 0.37% 0.14% (0.20)% 0.02% n/a The Fund commenced operations on December 17, 1997. 2015 Net asset value — beginning of period . .
. . .
. . .
. . .
. . .
. . .
. . .
. . .
. . $ 9.47 Income (loss) from investment activities: Net investment income .
. . .
. . .
. . .
. . .
. . .
. . .
. . .
. . .
. . .
. . .
. . .
. 0.06 Net realized and unrealized gains (losses) . . .
. . .
. . .
. . .
. . .
. . .
. . .
. (0.04) Total from investment activities . . .
. . .
. . .
. . .
. . .
. . .
. . .
. . .
. . . 0.02 Distributions to shareholders: From net investment income .
. . .
. . .
. . .
. . .
. . .
. . .
. . .
. . .
. . .
. . . (0.04) Return of capital.
. . .
. . .
. . .
. . .
. . .
. . .
. . .
. . .
. . .
. . .
. . .
. . .
. . .
. (0.03) Total distributions to shareholders . . .
. . .
. . .
. . .
. . .
. . .
. . .
. . .
. (0.07) Net asset value — end of period . . .
. . .
. . .
. . .
. . .
. . .
. . .
. . .
. . .
. . .
$ 9.42 Total return . . .
. . .
. . .
. . .
. . .
. . .
. . .
. . .
. . .
. . .
. . .
. . .
. . .
. . . Payden Limited Maturity Fund 2014 2013 2012 $ 9.47 $ 9.48 $ 9.39 $ 2011 9.45 0.07 (0.00)(1) 0.07 $ 0.05 (0.00)(1) 0.05 0.06 0.10 0.16 0.08 (0.05) 0.03 (0.07) — (0.07) 9.47 (0.04) (0.02) (0.06) 9.47 (0.07) — (0.07) 9.48 (0.09) — (0.09) 9.39 $ $ $ 0.20% 0.78% 0.56% 1.66% 0.27% Ratios/supplemental data: Net assets, end of period (000s) .
. . .
. . .
. . .
. . .
. . .
. . .
. . .
. . .
. . .
. $ 422,996 Ratio of gross expense to average net assets. .
. . .
. . .
. . .
. . .
. . .
. . .
. 0.57% Ratio of net expense to average net assets . . .
. . .
. . .
. . .
. . .
. . .
. . .
. 0.31% Ratio of investment income less gross expenses to average net assets . . 0.31% Ratio of net investment income to average net assets . .
. . .
. . .
. . .
. . 0.57% Portfolio turnover rate . .
. . .
. . .
. . .
. . .
. . .
. . .
. . .
. . .
. . .
. . .
. . .
. 39% $ 318,671 0.57% 0.35% 0.59% 0.81% 59% $ 258,282 0.55% 0.40% 0.44% 0.59% 124% $ 242,013 0.56% 0.50% 0.56% 0.62% 98% $ 216,493 0.57% 0.50% 0.72% 0.79% 75% The Fund commenced operations on April 29, 1994. (1) Amount is less than $0.005 See notes to financial statements. 118 Payden Mutual Funds . 2015 Net asset value — beginning of period . . . .
. . .
. . .
. . .
. . .
. . .
. . .
. . .
$ 10.15 Income (loss) from investment activities: Net investment income . . .
. . .
. . .
. . .
. . .
. . .
. . .
. . .
. . .
. . .
. . .
. . 0.11 Net realized and unrealized gains (losses) . .
. . .
. . .
. . .
. . .
. . .
. . .
. . (0.06) Total from investment activities . .
. . .
. . .
. . .
. . .
. . .
. . .
. . .
. . .
. 0.05 Distributions to shareholders: From net investment income . . .
. . .
. . .
. . .
. . .
. . .
. . .
. . .
. . .
. . .
. (0.11) From net realized gains. . .
. . .
. . .
. . .
. . .
. . .
. . .
. . .
. . .
. . .
. . .
. . . (0.04) Return of capital.
. . .
. . .
. . .
. . .
. . .
. . .
. . .
. . .
. . .
. . .
. . .
. . .
. . .
. (0.00)(1) Total distributions to shareholders . . .
. . .
. . .
. . .
. . .
. . .
. . .
. . .
. (0.15) Net asset value — end of period . . .
. . .
. . .
. . .
. . .
. . .
. . .
. . .
. . .
. . .
$ 10.05 Total return . . .
. . .
. . .
. . .
. . .
. . .
. . .
. . .
. . .
. . .
. . .
. . .
. . .
. . . Payden Low Duration Fund 2014 2013 2012 $ 10.15 $ 10.23 $ 10.01 $ 2011 10.23 0.12 (0.00)(1) 0.12 0.18 0.23 0.41 0.24 (0.20) 0.04 (0.12) $ 0.14 (0.07) 0.07 (0.13) — (0.02) (0.15) 10.15 (0.19) — — (0.19) 10.23 (0.24) (0.02) — (0.26) 10.01 — (0.12) 10.15 $ $ $ 0.50% 1.14% 0.68% 4.13% 0.46% Ratios/supplemental data: Net assets, end of period (000s) .
. . .
. . .
. . .
. . .
. . .
. . .
. . .
. . .
. . .
. $ 820,662 Ratio of gross expense to average net assets. .
. . .
. . .
. . .
. . .
. . .
. . .
. 0.57% Ratio of net expense to average net assets . . .
. . .
. . .
. . .
. . .
. . .
. . .
. 0.47% Ratio of investment income less gross expenses to average net assets . . 1.02% Ratio of net investment income to average net assets . .
. . .
. . .
. . .
. . 1.12% Portfolio turnover rate . .
. . .
. . .
. . .
. . .
. . .
. . .
. . .
. . .
. . .
. . .
. . .
. 31% $ 833,205 0.55% 0.48% 1.06% 1.13% 45% $ 848,866 0.55% 0.51% 1.22% 1.26% 90% $ 541,809 0.55% 0.54% 1.74% 1.75% 97% $ 462,491 0.56% 0.53% 2.34% 2.37% 74% The Fund commenced operations on December 31, 1993. 2015 Net asset value — beginning of period . . .
. . .
. . .
. . .
. . .
. . .
. . .
. . .
. $ 10.68 Income (loss) from investment activities: Net investment income . .
. . .
. . .
. . .
. . .
. . .
. . .
. . .
. . .
. . .
. . .
. . . 0.06(2) Net realized and unrealized gains (losses) .
. . .
. . .
. . .
. . .
. . .
. . .
. . . 0.02 Total from investment activities .
. . .
. . .
. . .
. . .
. . .
. . .
. . .
. . .
. . 0.08 Distributions to shareholders: From net investment income . .
. . .
. . .
. . .
. . .
. . .
. . .
. . .
. . .
. . .
. . (0.13) From net realized gains. .
. . .
. . .
. . .
. . .
. . .
. . .
. . .
. . .
. . .
. . .
. . .
. — Return of capital. . .
. . .
. . .
. . .
. . .
. . .
. . .
. . .
. . .
. . .
. . .
. . .
. . .
. . — Total distributions to shareholders . .
. . .
. . .
. . .
. . .
. . .
. . .
. . .
. . (0.13) Net asset value — end of period . .
. . .
. . .
. . .
. . .
. . .
. . .
. . .
. . .
. . .
. $ 10.63 Total return . .
. . .
. . .
. . .
. . .
. . .
. . .
. . .
. . .
. . .
. . .
. . .
. . .
. . .
. Ratios/supplemental data: Net assets, end of period (000s) . . .
. . .
. . .
. . .
. . .
. . .
. . .
. . .
. . .
. . $ Ratio of gross expense to average net assets.
. . .
. . .
. . .
. . .
. . .
. . .
. . Ratio of net expense to average net assets . .
. . .
. . .
. . .
. . .
. . .
. . .
. . Ratio of investment income less gross expenses to average net assets . . Ratio of net investment income to average net assets .
. . .
. . .
. . .
. . . Portfolio turnover rate .
. . .
. . .
. . .
. . .
. . .
. . .
. . .
. . .
. . .
. . .
. . .
. . Payden U.S. Government Fund - Adviser Class 2014 2013 2012 $ 10.67 $ 10.99 $ 11.12 0.05(2) 0.08 0.13 $ 0.76% 1,676 0.84% 0.70% 0.44% 0.59% 32% (0.12) — — (0.12) 10.68 0.07 (0.18) (0.11) $ 1.27% $ 385 0.84% 0.70% 0.35% 0.49% 27% (0.16) (0.05) (0.00)(1) (0.21) 10.67 1,205 0.84% 0.70% 0.42% 0.56% 43% 2011 11.30 0.08 0.16 0.24 $ (1.01)% $ $ 0.13 (0.06) 0.07 (0.16) (0.21) — (0.37) 10.99 (0.15) (0.10) — (0.25) 11.12 $ 2.16% $ 860 0.90% 0.86% 0.66% 0.70% 79% 0.65% $ 707 0.89% 0.85% 1.10% 1.14% 76% The Class commenced operations on November 2, 2009. (1) Amount is less than $0.005 (2) Based on average shares outstanding. See notes to financial statements. Annual Report 119 .
Financial Highlights continued For the share outstanding for the periods ended October 31st 2015 Net asset value — beginning of period . . . .
. . .
. . .
. . .
. . .
. . .
. . .
. . .
$ 10.68 Income (loss) from investment activities: Net investment income . . .
. . .
. . .
. . .
. . .
. . .
. . .
. . .
. . .
. . .
. . .
. . 0.09(1) Net realized and unrealized gains (losses) . .
. . .
. . .
. . .
. . .
. . .
. . .
. . 0.02 Total from investment activities . .
. . .
. . .
. . .
. . .
. . .
. . .
. . .
. . .
. 0.11 Distributions to shareholders: From net investment income . . .
. . .
. . .
. . .
. . .
. . .
. . .
. . .
. . .
. . .
. (0.16) From net realized gains. . .
. . .
. . .
. . .
. . .
. . .
. . .
. . .
. . .
. . .
. . .
. . . — Return of capital.
. . .
. . .
. . .
. . .
. . .
. . .
. . .
. . .
. . .
. . .
. . .
. . .
. . .
. — Total distributions to shareholders . . .
. . .
. . .
. . .
. . .
. . .
. . .
. . .
. (0.16) Net asset value — end of period . . .
. . .
. . .
. . .
. . .
. . .
. . .
. . .
. . .
. . .
$ 10.63 Total return . . .
. . .
. . .
. . .
. . .
. . .
. . .
. . .
. . .
. . .
. . .
. . .
. . .
. . . Payden U.S.
Government Fund - Investor Class 2014 2013 2012 $ 10.67 $ 10.98 $ 11.12 0.08(1) 0.08 0.16 $ (0.15) — — (0.15) 10.68 0.08 (0.15) (0.07) $ (0.19) (0.05) (0.00)(2) (0.24) 10.67 $ 2011 11.29 0.12 0.13 0.25 $ 0.15 (0.04) 0.11 (0.18) (0.21) — (0.39) 10.98 (0.18) (0.10) — (0.28) 11.12 1.01% 1.52% (0.67)% Ratios/supplemental data: Net assets, end of period (000s) . . .
. . .
. . .
. . .
. . .
. . .
. . .
. . .
. . .
. . $ 133,420 Ratio of gross expense to average net assets.
. . .
. . .
. . .
. . .
. . .
. . .
. . 0.59% Ratio of net expense to average net assets . .
. . .
. . .
. . .
. . .
. . .
. . .
. . 0.45% Ratio of investment income less gross expenses to average net assets . . 0.69% Ratio of net investment income to average net assets .
. . .
. . .
. . .
. . . 0.82% Portfolio turnover rate .
. . .
. . .
. . .
. . .
. . .
. . .
. . .
. . .
. . .
. . .
. . .
. . 32% $ 130,508 0.59% 0.45% 0.60% 0.74% 27% $ 130,624 0.58% 0.45% 0.66% 0.79% 43% $ 110,026 0.64% 0.61% 0.90% 0.93% 79% $ 2.32% (0.99)% $ 63,988 0.63% 0.60% 1.41% 1.44% 76% The Fund commenced operations on January 3, 1995. 2015 Net asset value — beginning of period . .
. . .
. . .
. . .
. . .
. . .
. . .
. . .
. . $ 9.94 Income (loss) from investment activities: Net investment income .
. . .
. . .
. . .
. . .
. . .
. . .
. . .
. . .
. . .
. . .
. . .
. 0.13 Net realized and unrealized gains (losses) . . .
. . .
. . .
. . .
. . .
. . .
. . .
. 0.05 Total from investment activities . . .
. . .
. . .
. . .
. . .
. . .
. . .
. . .
. . . 0.18 Distributions to shareholders: From net investment income .
. . .
. . .
. . .
. . .
. . .
. . .
. . .
. . .
. . .
. . . (0.34) From net realized gains.
. . .
. . .
. . .
. . .
. . .
. . .
. . .
. . .
. . .
. . .
. . .
. . — Total distributions to shareholders . .
. . .
. . .
. . .
. . .
. . .
. . .
. . .
. . (0.34) Net asset value — end of period . .
. . .
. . .
. . .
. . .
. . .
. . .
. . .
. . .
. . .
. $ 9.78 Total return . .
. . .
. . .
. . .
. . .
. . .
. . .
. . .
. . .
. . .
. . .
. . .
. . .
. . .
. Ratios/supplemental data: Net assets, end of period (000s) . . .
. . .
. . .
. . .
. . .
. . .
. . .
. . .
. . .
. . $ Ratio of gross expense to average net assets.
. . .
. . .
. . .
. . .
. . .
. . .
. . Ratio of net expense to average net assets . .
. . .
. . .
. . .
. . .
. . .
. . .
. . Ratio of investment income less gross expenses to average net assets . . Ratio of net investment income to average net assets .
. . .
. . .
. . .
. . . Portfolio turnover rate .
. . .
. . .
. . .
. . .
. . .
. . .
. . .
. . .
. . .
. . .
. . .
. . Payden GNMA Fund - Adviser Class 2014 2013 2012 $ 10.00 $ 10.80 $ 10.66 $ 0.03 (0.25) (0.22) 0.14 0.33 0.47 0.27 0.30 0.57 (0.39) — (0.39) 9.94 (0.34) (0.24) (0.58) 10.00 (0.33) — (0.33) 10.80 (0.42) (0.05) (0.47) 10.66 $ 3.43% $ 23,876 0.85% 0.75% 1.33% 1.44% 12% The Class commenced operations on November 2, 2009. (1) Based on average shares outstanding. (2) Amount is less than $0.005 See notes to financial statements. 120 Payden Mutual Funds 2011 10.56 0.11 0.22 0.33 1.80% 23,335 0.92% 0.75% 1.11% 1.29% 15% $ $ (1.96)% $ 30,450 0.93% 0.75% 1.13% 1.31% 19% $ 4.41% $ 81,860 0.88% 0.75% 1.24% 1.37% 27% 5.73% $ 52,700 0.86% 0.75% 1.92% 2.03% 23% . 2015 Net asset value — beginning of period . . . .
. . .
. . .
. . .
. . .
. . .
. . .
. . .
$ 9.95 Income (loss) from investment activities: Net investment income . . .
. . .
. . .
. . .
. . .
. . .
. . .
. . .
. . .
. . .
. . .
. . 0.14 Net realized and unrealized gains (losses) . .
. . .
. . .
. . .
. . .
. . .
. . .
. . 0.06 Total from investment activities . .
. . .
. . .
. . .
. . .
. . .
. . .
. . .
. . .
. 0.20 Distributions to shareholders: From net investment income . . .
. . .
. . .
. . .
. . .
. . .
. . .
. . .
. . .
. . .
. (0.36) From net realized gains. . .
. . .
. . .
. . .
. . .
. . .
. . .
. . .
. . .
. . .
. . .
. . . — Total distributions to shareholders .
. . .
. . .
. . .
. . .
. . .
. . .
. . .
. . . (0.36) Net asset value — end of period .
. . .
. . .
. . .
. . .
. . .
. . .
. . .
. . .
. . .
. . $ 9.79 Total return .
. . .
. . .
. . .
. . .
. . .
. . .
. . .
. . .
. . .
. . .
. . .
. . .
. . .
. . Payden GNMA Fund - Investor Class 2014 2013 2012 $ 10.00 $ 10.80 $ 10.67 $ 2011 10.56 0.15 0.22 0.37 $ 0.05 (0.24) (0.19) 0.17 0.32 0.49 0.26 0.35 0.61 (0.42) — (0.42) 9.95 (0.37) (0.24) (0.61) 10.00 (0.36) — (0.36) 10.80 (0.45) (0.05) (0.50) 10.67 $ $ $ 2.06% 3.79% (1.80)% 4.77% 5.99% Ratios/supplemental data: Net assets, end of period (000s) . .
. . .
. . .
. . .
. . .
. . .
. . .
. . .
. . .
. . .
$ 255,273 Ratio of gross expense to average net assets. . .
. . .
. . .
. . .
. . .
. . .
. . . 0.67% Ratio of net expense to average net assets .
. . .
. . .
. . .
. . .
. . .
. . .
. . . 0.50% Ratio of investment income less gross expenses to average net assets .
. 1.36% Ratio of net investment income to average net assets . . .
. . .
. . .
. . .
. 1.53% Portfolio turnover rate . . .
. . .
. . .
. . .
. . .
. . .
. . .
. . .
. . .
. . .
. . .
. . . 15% $ 281,473 0.61% 0.50% 1.58% 1.68% 12% $ 371,593 0.68% 0.50% 1.38% 1.56% 19% $ 886,109 0.63% 0.50% 1.50% 1.63% 27% $ 776,547 0.62% 0.50% 2.17% 2.29% 23% The Fund commenced operations on August 27, 1999. 2015 Net asset value — beginning of period .
. . .
. . .
. . .
. . .
. . .
. . .
. . .
. . .
$ 10.80 Income (loss) from investment activities: Net investment income . . .
. . .
. . .
. . .
. . .
. . .
. . .
. . .
. . .
. . .
. . .
. . 0.23(1) Net realized and unrealized gains (losses) . .
. . .
. . .
. . .
. . .
. . .
. . .
. . (0.07) Total from investment activities . .
. . .
. . .
. . .
. . .
. . .
. . .
. . .
. . .
. 0.16 Distributions to shareholders: From net investment income . . .
. . .
. . .
. . .
. . .
. . .
. . .
. . .
. . .
. . .
. (0.26) From net realized gains. . .
. . .
. . .
. . .
. . .
. . .
. . .
. . .
. . .
. . .
. . .
. . . (0.08) Total distributions to shareholders .
. . .
. . .
. . .
. . .
. . .
. . .
. . .
. . . (0.34) Net asset value — end of period .
. . .
. . .
. . .
. . .
. . .
. . .
. . .
. . .
. . .
. . $ 10.62 Total return .
. . .
. . .
. . .
. . .
. . .
. . .
. . .
. . .
. . .
. . .
. . .
. . .
. . .
. . Ratios/supplemental data: Net assets, end of period (000s) . .
. . .
. . .
. . .
. . .
. . .
. . .
. . .
. . .
. . .
$ Ratio of gross expense to average net assets. . .
. . .
. . .
. . .
. . .
. . .
. . . Ratio of net expense to average net assets .
. . .
. . .
. . .
. . .
. . .
. . .
. . . Ratio of investment income less gross expenses to average net assets .
. Ratio of net investment income to average net assets . . .
. . .
. . .
. . .
. Portfolio turnover rate . . .
. . .
. . .
. . .
. . .
. . .
. . .
. . .
. . .
. . .
. . .
. . . Payden Core Bond Fund - Adviser Class 2014 2013 2012 $ 10.65 $ 11.04 $ 10.52 0.26(1) 0.27 0.53 $ 1.49% 24,314 0.79% 0.79% 2.05% 2.05% 31% (0.29) (0.09) (0.38) 10.80 0.26(1) (0.31) (0.05) $ 5.06% $ 5,457 0.78% 0.78% 2.40% 2.40% 49% (0.33) (0.01) (0.34) 10.65 $ 0.91 — 0.91 $ 0.36 (0.13) 0.23 (0.39) — (0.39) 11.04 (0.37) — (0.37) 10.52 $ (0.54)% $ 2011 10.66 8.81% 321 $ 0.78% 0.78% 2.41% 2.41% 511%(2) 356 $ 0.77% 0.77% 3.00% 3.00% 464%(3) 2.30% 39,848 0.78% 0.78% 3.43% 3.43% 118% The Class commenced operations on November 2, 2009. (1) Based on average shares outstanding. (2) Includes U.S.
Treasury securities purchased and sold prior to their settlement date; excluding these transactions, portfolio turnover would have been 101%. (3) Includes U.S. Treasury securities purchased and sold prior to their settlement date; excluding these transactions, portfolio turnover would have been 105%. See notes to financial statements. Annual Report 121 . Financial Highlights continued For the share outstanding for the periods ended October 31st 2015 Net asset value — beginning of period . . . .
. . .
. . .
. . .
. . .
. . .
. . .
. . .
$ 10.82 Income (loss) from investment activities: Net investment income . . .
. . .
. . .
. . .
. . .
. . .
. . .
. . .
. . .
. . .
. . .
. . 0.25(1) Net realized and unrealized gains (losses) . .
. . .
. . .
. . .
. . .
. . .
. . .
. . (0.07) Total from investment activities . .
. . .
. . .
. . .
. . .
. . .
. . .
. . .
. . .
. 0.18 Distributions to shareholders: From net investment income . . .
. . .
. . .
. . .
. . .
. . .
. . .
. . .
. . .
. . .
. (0.28) From net realized gains. . .
. . .
. . .
. . .
. . .
. . .
. . .
. . .
. . .
. . .
. . .
. . . (0.08) Total distributions to shareholders .
. . .
. . .
. . .
. . .
. . .
. . .
. . .
. . . (0.36) Net asset value — end of period .
. . .
. . .
. . .
. . .
. . .
. . .
. . .
. . .
. . .
. . $ 10.64 Total return .
. . .
. . .
. . .
. . .
. . .
. . .
. . .
. . .
. . .
. . .
. . .
. . .
. . .
. . Payden Core Bond Fund - Investor Class 2014 2013 2012 $ 10.67 $ 11.06 $ 10.54 0.28(1) 0.28 0.56 $ (0.32) (0.09) (0.41) 10.82 1.73% $ 593,724 0.53% 0.53% 2.65% 2.65% 49% $ 5.34% Ratios/supplemental data: Net assets, end of period (000s) . .
. . .
. . .
. . .
. . .
. . .
. . .
. . .
. . .
. . .
$ 660,835 Ratio of gross expense to average net assets. . .
. . .
. . .
. . .
. . .
. . .
. . . 0.54% Ratio of net expense to average net assets .
. . .
. . .
. . .
. . .
. . .
. . .
. . . 0.54% Ratio of investment income less gross expenses to average net assets .
. 2.30% Ratio of net investment income to average net assets . . .
. . .
. . .
. . .
. 2.30% Portfolio turnover rate . . .
. . .
. . .
. . .
. . .
. . .
. . .
. . .
. . .
. . .
. . .
. . . 31% 0.29(1) (0.32) (0.03) (0.35) (0.01) (0.36) 10.67 $ 2011 10.68 0.33 0.60 0.93 $ (0.28)% 0.38 (0.13) 0.25 (0.41) — (0.41) 11.06 (0.39) — (0.39) 10.54 $ 9.06% 2.45% $ 587,658 $ 645,700 $ 580,774 0.52% 0.53% 0.53% 0.52% 0.53% 0.53% 2.66% 3.13% 3.64% 2.66% 3.13% 3.64% 511%(2) 464%(3) 118% The Fund commenced operations on December 31, 1993. 2015 Net asset value — beginning of period .
. . .
. . .
. . .
. . .
. . .
. . .
. . .
. . .
$ 11.37 Income (loss) from investment activities: Net investment income . . .
. . .
. . .
. . .
. . .
. . .
. . .
. . .
. . .
. . .
. . .
. . 0.35 Net realized and unrealized gains (losses) . .
. . .
. . .
. . .
. . .
. . .
. . .
. . (0.11) Total from investment activities . .
. . .
. . .
. . .
. . .
. . .
. . .
. . .
. . .
. 0.24 Distributions to shareholders: From net investment income . . .
. . .
. . .
. . .
. . .
. . .
. . .
. . .
. . .
. . .
. (0.34) From net realized gains. . .
. . .
. . .
. . .
. . .
. . .
. . .
. . .
. . .
. . .
. . .
. . . (0.30) Total distributions to shareholders .
. . .
. . .
. . .
. . .
. . .
. . .
. . .
. . . (0.64) Net asset value — end of period .
. . .
. . .
. . .
. . .
. . .
. . .
. . .
. . .
. . .
. . $ 10.97 Total return .
. . .
. . .
. . .
. . .
. . .
. . .
. . .
. . .
. . .
. . .
. . .
. . .
. . .
. . Ratios/supplemental data: Net assets, end of period (000s) . .
. . .
. . .
. . .
. . .
. . .
. . .
. . .
. . .
. . .
$ Ratio of gross expense to average net assets. . .
. . .
. . .
. . .
. . .
. . .
. . . Ratio of net expense to average net assets .
. . .
. . .
. . .
. . .
. . .
. . .
. . . Ratio of investment income less gross expenses to average net assets .
. Ratio of net investment income to average net assets . . .
. . .
. . .
. . .
. Portfolio turnover rate . . .
. . .
. . .
. . .
. . .
. . .
. . .
. . .
. . .
. . .
. . .
. . . Payden Corporate Bond Fund 2014 2013 2012 $ 11.05 $ 11.60 $ 11.33 2011 11.85 0.39 0.50 0.89 $ 2.26% 71,542 0.78% 0.65% 3.08% 3.21% 112% $ 0.38 (0.36) 0.02 0.45 0.75 1.20 0.51 (0.12) 0.39 (0.41) (0.16) (0.57) 11.37 (0.37) (0.20) (0.57) 11.05 (0.45) (0.48) (0.93) 11.60 (0.51) (0.40) (0.91) 11.33 $ 8.31% $ 69,646 0.79% 0.65% 3.42% 3.56% 104% $ 0.17% $ 66,279 $ 0.82% 0.65% 3.29% 3.46% 273%(4) $ 11.39% 43,259 $ 0.91% 0.65% 3.77% 4.03% 487%(5) 3.71% 38,559 0.96% 0.65% 4.21% 4.52% 87% The Fund commenced operations on March 12, 2009. (1) (2) (3) (4) (5) Based on average shares outstanding. Includes U.S.
Treasury securities purchased and sold prior to their settlement date; excluding these transactions, portfolio turnover would have been 101%. Includes U.S. Treasury securities purchased and sold prior to their settlement date; excluding these transactions, portfolio turnover would have been 105%. Includes U.S. Treasury securities purchased and sold prior to their settlement date; excluding these transactions, portfolio turnover would have been 123%. Includes U.S.
Treasury securities purchased and sold prior to their settlement date; excluding these transactions, portfolio turnover would have been 56%. See notes to financial statements. 122 Payden Mutual Funds . Payden Strategic Income Fund — Adviser Class 2015 2014 Net asset value — beginning of period . . . .
. . .
. . .
. . .
. . .
. . .
. . .
. . .
$ 9.98 $ 10.00 Income from investment activities: Net investment income . . .
. . .
. . .
. . .
. . .
. . .
. . .
. . .
. . .
. . .
. . .
. . 0.18 0.08 Net realized and unrealized gains (losses) . .
. . .
. . .
. . .
. . .
. . .
. . .
. . —(1) (0.01) Total from investment activities . .
. . .
. . .
. . .
. . .
. . .
. . .
. . .
. . .
. 0.18 0.07 Distributions to shareholders: From net investment income . . .
. . .
. . .
. . .
. . .
. . .
. . .
. . .
. . .
. . .
. (0.19) (0.09) From net realized gains. . .
. . .
. . .
. . .
. . .
. . .
. . .
. . .
. . .
. . .
. . .
. . . (0.02) — Return of capital.
. . .
. . .
. . .
. . .
. . .
. . .
. . .
. . .
. . .
. . .
. . .
. . .
. . .
. (0.01) — Total distributions to shareholders . . .
. . .
. . .
. . .
. . .
. . .
. . .
. . .
. (0.22) (0.09) Net asset value — end of period . . .
. . .
. . .
. . .
. . .
. . .
. . .
. . .
. . .
. . .
$ 9.94 $ 9.98 Total return . . .
. . .
. . .
. . .
. . .
. . .
. . .
. . .
. . .
. . .
. . .
. . .
. . .
. . . Ratios/supplemental data: Net assets, end of period (000s) .
. . .
. . .
. . .
. . .
. . .
. . .
. . .
. . .
. . .
. $ Ratio of gross expense to average net assets. .
. . .
. . .
. . .
. . .
. . .
. . .
. Ratio of net expense to average net assets . . .
. . .
. . .
. . .
. . .
. . .
. . .
. Ratio of investment income less gross expenses to average net assets . . Ratio of net investment income to average net assets . .
. . .
. . .
. . .
. . Portfolio turnover rate . .
. . .
. . .
. . .
. . .
. . .
. . .
. . .
. . .
. . .
. . .
. . .
. 1.83% 6,797 1.16% 1.05% 1.81% 1.92% 30% 0.73%(2) $ 2,932 1.40%(3) 1.05%(3) 1.89%(3) 2.19%(3) 17%(2) The Fund commenced operations on May 8, 2014. Payden Strategic Income Fund — Investor Class 2015 2014 Net asset value — beginning of period . . .
. . .
. . .
. . .
. . .
. . .
. . .
. . .
. $ 10.00 $ 10.00 Income from investment activities: Net investment income . .
. . .
. . .
. . .
. . .
. . .
. . .
. . .
. . .
. . .
. . .
. . . 0.22 0.09 Net realized and unrealized gains (losses) .
. . .
. . .
. . .
. . .
. . .
. . .
. . . (0.01) (0.00)(1) Total from investment activities .
. . .
. . .
. . .
. . .
. . .
. . .
. . .
. . .
. . 0.21 0.09 Distributions to shareholders: From net investment income . .
. . .
. . .
. . .
. . .
. . .
. . .
. . .
. . .
. . .
. . (0.22) (0.09) From net realized gains. .
. . .
. . .
. . .
. . .
. . .
. . .
. . .
. . .
. . .
. . .
. . .
. (0.02) — Return of capital. . .
. . .
. . .
. . .
. . .
. . .
. . .
. . .
. . .
. . .
. . .
. . .
. . .
. . (0.01) — Total distributions to shareholders . .
. . .
. . .
. . .
. . .
. . .
. . .
. . .
. . (0.25) (0.09) Net asset value — end of period . .
. . .
. . .
. . .
. . .
. . .
. . .
. . .
. . .
. . .
. $ 9.96 $ 10.00 Total return . .
. . .
. . .
. . .
. . .
. . .
. . .
. . .
. . .
. . .
. . .
. . .
. . .
. . .
. 2.08% Ratios/supplemental data: Net assets, end of period (000s) . . .
. . .
. . .
. . .
. . .
. . .
. . .
. . .
. . .
. . $ 108,789 Ratio of gross expense to average net assets.
. . .
. . .
. . .
. . .
. . .
. . .
. . 0.90% Ratio of net expense to average net assets . .
. . .
. . .
. . .
. . .
. . .
. . .
. . 0.80% Ratio of investment income less gross expenses to average net assets . . 2.06% Ratio of net investment income to average net assets .
. . .
. . .
. . .
. . . 2.17% Portfolio turnover rate .
. . .
. . .
. . .
. . .
. . .
. . .
. . .
. . .
. . .
. . .
. . .
. . 30% 0.94%(2) $ 55,453 1.20%(3) 0.80%(3) 1.79%(3) 2.19%(3) 17%(2) The Fund commenced operations on May 8, 2014. (1) Amount is less than $0.005 (2) Not annualized (3) Annualized See notes to financial statements. Annual Report 123 . Financial Highlights continued For the share outstanding for the periods ended October 31st Payden Strategic Income Fund — SI Class 2015 2014 Net asset value — beginning of period . . . .
. . .
. . .
. . .
. . .
. . .
. . .
. . .
$ 9.99 $ 10.00 Income from investment activities: Net investment income . . .
. . .
. . .
. . .
. . .
. . .
. . .
. . .
. . .
. . .
. . .
. . 0.23 0.09 Net realized and unrealized gains (losses) . .
. . .
. . .
. . .
. . .
. . .
. . .
. . 0.00 (0.00)(1) Total from investment activities . .
. . .
. . .
. . .
. . .
. . .
. . .
. . .
. . .
. 0.23 0.09 Distributions to shareholders: From net investment income . . .
. . .
. . .
. . .
. . .
. . .
. . .
. . .
. . .
. . .
. (0.23) (0.10) From net realized gains. . .
. . .
. . .
. . .
. . .
. . .
. . .
. . .
. . .
. . .
. . .
. . . (0.02) — Return of capital.
. . .
. . .
. . .
. . .
. . .
. . .
. . .
. . .
. . .
. . .
. . .
. . .
. . .
. (0.01) — Total distributions to shareholders . . .
. . .
. . .
. . .
. . .
. . .
. . .
. . .
. (0.26) (0.10) Net asset value — end of period . . .
. . .
. . .
. . .
. . .
. . .
. . .
. . .
. . .
. . .
$ 9.96 $ 9.99 Total return . . .
. . .
. . .
. . .
. . .
. . .
. . .
. . .
. . .
. . .
. . .
. . .
. . .
. . . Ratios/supplemental data: Net assets, end of period (000s) .
. . .
. . .
. . .
. . .
. . .
. . .
. . .
. . .
. . .
. $ Ratio of gross expense to average net assets. .
. . .
. . .
. . .
. . .
. . .
. . .
. Ratio of net expense to average net assets . . .
. . .
. . .
. . .
. . .
. . .
. . .
. Ratio of investment income less gross expenses to average net assets . . Ratio of net investment income to average net assets . .
. . .
. . .
. . .
. . Portfolio turnover rate . .
. . .
. . .
. . .
. . .
. . .
. . .
. . .
. . .
. . .
. . .
. . .
. 2.32% 37,766 0.90% 0.65% 2.06% 2.31% 30% 0.93%(2) $ 32,682 1.17%(3) 0.65%(3) 1.87%(3) 2.39%(3) 17%(2) The Fund commenced operations on May 8, 2014. Payden Absolute Return Bond Fund — Advisor Class 2015 Net asset value — beginning of period . . .
. . .
. . .
. . .
. . .
. . .
. . .
. . .
. $ 10.00 Income (loss) from investment activities: Net investment income . .
. . .
. . .
. . .
. . .
. . .
. . .
. . .
. . .
. . .
. . .
. . . 0.16(4) Net realized and unrealized losses .
. . .
. . .
. . .
. . .
. . .
. . .
. . .
. . .
. . . (0.07) Total from investment activities .
. . .
. . .
. . .
. . .
. . .
. . .
. . .
. . .
. . 0.09 Distributions to shareholders: From net investment income . .
. . .
. . .
. . .
. . .
. . .
. . .
. . .
. . .
. . .
. . (0.16) Net asset value — end of period . .
. . .
. . .
. . .
. . .
. . .
. . .
. . .
. . .
. . .
. $ 9.93 Total return . .
. . .
. . .
. . .
. . .
. . .
. . .
. . .
. . .
. . .
. . .
. . .
. . .
. . .
. Ratios/supplemental data: Net assets, end of period (000s) . . .
. . .
. . .
. . .
. . .
. . .
. . .
. . .
. . .
. . $ Ratio of gross expense to average net assets.
. . .
. . .
. . .
. . .
. . .
. . .
. . Ratio of net expense to average net assets . .
. . .
. . .
. . .
. . .
. . .
. . .
. . Ratio of investment income less gross expenses to average net assets . . Ratio of net investment income to average net assets .
. . .
. . .
. . .
. . . Portfolio turnover rate .
. . .
. . .
. . .
. . .
. . .
. . .
. . .
. . .
. . .
. . .
. . .
. . 0.86% 36 1.42%(3) 0.95%(3) 1.20%(3) 1.67%(3) 64%(2) The Fund commenced operations on November 6, 2014. (1) (2) (3) (4) Amount is less than $0.005 Not annualized Annualized Based on average shares outstanding. See notes to financial statements. 124 Payden Mutual Funds . Payden Absolute Return Bond Fund — Investor Class 2015 Net asset value — beginning of period . . . .
. . .
. . .
. . .
. . .
. . .
. . .
. . .
$ 10.00 Income (loss) from investment activities: Net investment income . . .
. . .
. . .
. . .
. . .
. . .
. . .
. . .
. . .
. . .
. . .
. . 0.17(1) Net realized and unrealized losses . .
. . .
. . .
. . .
. . .
. . .
. . .
. . .
. . .
. . (0.07) Total from investment activities . .
. . .
. . .
. . .
. . .
. . .
. . .
. . .
. . .
. 0.10 Distributions to shareholders: From net investment income . . .
. . .
. . .
. . .
. . .
. . .
. . .
. . .
. . .
. . .
. (0.18) Total distributions to shareholders . . .
. . .
. . .
. . .
. . .
. . .
. . .
. . .
. (0.18) Net asset value — end of period . . .
. . .
. . .
. . .
. . .
. . .
. . .
. . .
. . .
. . .
$ 9.92 Total return . . .
. . .
. . .
. . .
. . .
. . .
. . .
. . .
. . .
. . .
. . .
. . .
. . .
. . . Ratios/supplemental data: Net assets, end of period (000s) .
. . .
. . .
. . .
. . .
. . .
. . .
. . .
. . .
. . .
. $ Ratio of gross expense to average net assets. .
. . .
. . .
. . .
. . .
. . .
. . .
. Ratio of net expense to average net assets . . .
. . .
. . .
. . .
. . .
. . .
. . .
. Ratio of investment income less gross expenses to average net assets . . Ratio of net investment income to average net assets . .
. . .
. . .
. . .
. . Portfolio turnover rate . .
. . .
. . .
. . .
. . .
. . .
. . .
. . .
. . .
. . .
. . .
. . .
. 0.97% 42,121 1.17%(2) 0.70%(2) 1.45%(2) 1.92%(2) 64%(3) The Fund commenced operations on November 6, 2014. Payden Absolute Return Bond Fund — SI Class 2015 Net asset value — beginning of period . . .
. . .
. . .
. . .
. . .
. . .
. . .
. . .
. $ 10.00 Income (loss) from investment activities: Net investment income . .
. . .
. . .
. . .
. . .
. . .
. . .
. . .
. . .
. . .
. . .
. . . 0.19(1) Net realized and unrealized losses .
. . .
. . .
. . .
. . .
. . .
. . .
. . .
. . .
. . . (0.07) Total from investment activities .
. . .
. . .
. . .
. . .
. . .
. . .
. . .
. . .
. . 0.12 Distributions to shareholders: From net investment income . .
. . .
. . .
. . .
. . .
. . .
. . .
. . .
. . .
. . .
. . (0.19) Total distributions to shareholders . .
. . .
. . .
. . .
. . .
. . .
. . .
. . .
. . (0.19) Net asset value — end of period . .
. . .
. . .
. . .
. . .
. . .
. . .
. . .
. . .
. . .
. $ 9.93 Total return . .
. . .
. . .
. . .
. . .
. . .
. . .
. . .
. . .
. . .
. . .
. . .
. . .
. . .
. Ratios/supplemental data: Net assets, end of period (000s) . . .
. . .
. . .
. . .
. . .
. . .
. . .
. . .
. . .
. . $ Ratio of gross expense to average net assets.
. . .
. . .
. . .
. . .
. . .
. . .
. . Ratio of net expense to average net assets . .
. . .
. . .
. . .
. . .
. . .
. . .
. . Ratio of investment income less gross expenses to average net assets . . Ratio of net investment income to average net assets .
. . .
. . .
. . .
. . . Portfolio turnover rate .
. . .
. . .
. . .
. . .
. . .
. . .
. . .
. . .
. . .
. . .
. . .
. . 1.20% 18,830 1.17%(2) 0.55%(2) 1.32%(2) 1.94%(2) 64%(3) The Fund commenced operations on November 6, 2014. (1) Based on average shares outstanding. (2) Annualized (3) Not annualized See notes to financial statements. Annual Report 125 . Financial Highlights continued For the share outstanding for the periods ended October 31st Payden Floating Rate Fund — Adviser Class 2015 2014 Net asset value — beginning of period . . . .
. . .
. . .
. . .
. . .
. . .
. . .
. . .
$ 9.97 $ 10.00 Income from investment activities: Net investment income . . .
. . .
. . .
. . .
. . .
. . .
. . .
. . .
. . .
. . .
. . .
. . 0.27 0.24 Net realized and unrealized gains (losses) . .
. . .
. . .
. . .
. . .
. . .
. . .
. . (0.03) (0.03) Total from investment activities . .
. . .
. . .
. . .
. . .
. . .
. . .
. . .
. . .
. 0.24 0.21 Distributions to shareholders: From net investment income . . .
. . .
. . .
. . .
. . .
. . .
. . .
. . .
. . .
. . .
. (0.28) (0.24) From net realized gains. . .
. . .
. . .
. . .
. . .
. . .
. . .
. . .
. . .
. . .
. . .
. . . (0.03) — Total distributions to shareholders .
. . .
. . .
. . .
. . .
. . .
. . .
. . .
. . . (0.31) (0.24) Net asset value — end of period .
. . .
. . .
. . .
. . .
. . .
. . .
. . .
. . .
. . .
. . $ 9.90 $ 9.97 Total return .
. . .
. . .
. . .
. . .
. . .
. . .
. . .
. . .
. . .
. . .
. . .
. . .
. . .
. . Ratios/supplemental data: Net assets, end of period (000s) . .
. . .
. . .
. . .
. . .
. . .
. . .
. . .
. . .
. . .
$ Ratio of gross expense to average net assets. . .
. . .
. . .
. . .
. . .
. . .
. . . Ratio of net expense to average net assets .
. . .
. . .
. . .
. . .
. . .
. . .
. . . Ratio of investment income less gross expenses to average net assets .
. Ratio of net investment income to average net assets . . .
. . .
. . .
. . .
. Portfolio turnover rate . . .
. . .
. . .
. . .
. . .
. . .
. . .
. . .
. . .
. . .
. . .
. . . 2.48% 128 1.09% 1.00% 2.75% 2.84% 39% 2.15%(1) $ 40 1.14%(2) 0.99%(2) 2.77%(2) 2.92%(2) 18%(1) The Class commenced operations on November 11, 2013. Payden Floating Rate Fund — Investor Class 2015 2014 Net asset value — beginning of period .
. . .
. . .
. . .
. . .
. . .
. . .
. . .
. . .
$ 9.97 $ 10.00 Income from investment activities: Net investment income . . .
. . .
. . .
. . .
. . .
. . .
. . .
. . .
. . .
. . .
. . .
. . 0.32 0.27 Net realized and unrealized gains (losses) . .
. . .
. . .
. . .
. . .
. . .
. . .
. . (0.06) (0.03) Total from investment activities . .
. . .
. . .
. . .
. . .
. . .
. . .
. . .
. . .
. 0.26 0.24 Distributions to shareholders: From net investment income . . .
. . .
. . .
. . .
. . .
. . .
. . .
. . .
. . .
. . .
. (0.31) (0.27) From net realized gains. . .
. . .
. . .
. . .
. . .
. . .
. . .
. . .
. . .
. . .
. . .
. . . (0.03) — Total distributions to shareholders .
. . .
. . .
. . .
. . .
. . .
. . .
. . .
. . . (0.34) (0.27) Net asset value — end of period .
. . .
. . .
. . .
. . .
. . .
. . .
. . .
. . .
. . .
. . $ 9.89 $ 9.97 Total return .
. . .
. . .
. . .
. . .
. . .
. . .
. . .
. . .
. . .
. . .
. . .
. . .
. . .
. . Ratios/supplemental data: Net assets, end of period (000s) . .
. . .
. . .
. . .
. . .
. . .
. . .
. . .
. . .
. . .
$ Ratio of gross expense to average net assets. . .
. . .
. . .
. . .
. . .
. . .
. . . Ratio of net expense to average net assets .
. . .
. . .
. . .
. . .
. . .
. . .
. . . Ratio of investment income less gross expenses to average net assets .
. Ratio of net investment income to average net assets . . .
. . .
. . .
. . .
. Portfolio turnover rate . . .
. . .
. . .
. . .
. . .
. . .
. . .
. . .
. . .
. . .
. . .
. . . 2.64% 42,478 0.84% 0.75% 3.00% 3.09% 39% 2.39%(1) $ 46,586 0.90%(2) 0.75%(2) 3.03%(2) 3.17%(2) 18%(1) The Fund commenced operations on November 11, 2013. (1) Not annualized (2) Annualized See notes to financial statements. 126 Payden Mutual Funds .
Payden Floating Rate Fund — SI Class 2015 2014 Net asset value — beginning of period . . . .
. . .
. . .
. . .
. . .
. . .
. . .
. . .
$ 9.98 $ 10.00 Income from investment activities: Net investment income . . .
. . .
. . .
. . .
. . .
. . .
. . .
. . .
. . .
. . .
. . .
. . 0.32 0.28 Net realized and unrealized gains (losses) . .
. . .
. . .
. . .
. . .
. . .
. . .
. . (0.05) (0.02) Total from investment activities . .
. . .
. . .
. . .
. . .
. . .
. . .
. . .
. . .
. 0.27 0.26 Distributions to shareholders: From net investment income . . .
. . .
. . .
. . .
. . .
. . .
. . .
. . .
. . .
. . .
. (0.32) (0.28) From net realized gains. . .
. . .
. . .
. . .
. . .
. . .
. . .
. . .
. . .
. . .
. . .
. . . (0.03) — Total distributions to shareholders .
. . .
. . .
. . .
. . .
. . .
. . .
. . .
. . . (0.35) (0.28) Net asset value — end of period .
. . .
. . .
. . .
. . .
. . .
. . .
. . .
. . .
. . .
. . $ 9.90 $ 9.98 Total return .
. . .
. . .
. . .
. . .
. . .
. . .
. . .
. . .
. . .
. . .
. . .
. . .
. . .
. . 2.74% 2.59%(1) Ratios/supplemental data: Net assets, end of period (000s) . .
. . .
. . .
. . .
. . .
. . .
. . .
. . .
. . .
. . .
$ 124,006 Ratio of gross expense to average net assets. . .
. . .
. . .
. . .
. . .
. . .
. . . 0.84% Ratio of net expense to average net assets .
. . .
. . .
. . .
. . .
. . .
. . .
. . . 0.65% Ratio of investment income less gross expenses to average net assets .
. 3.01% Ratio of net investment income to average net assets . . .
. . .
. . .
. . .
. 3.20% Portfolio turnover rate . . .
. . .
. . .
. . .
. . .
. . .
. . .
. . .
. . .
. . .
. . .
. . . 39% $ 119,799 0.89%(2) 0.65%(2) 2.93%(2) 3.18%(2) 18%(1) The Fund commenced operations on November 11, 2013. 2015 Net asset value — beginning of period .
. . .
. . .
. . .
. . .
. . .
. . .
. . .
. . .
$ 7.08 Income (loss) from investment activities: Net investment income . . .
. . .
. . .
. . .
. . .
. . .
. . .
. . .
. . .
. . .
. . .
. . 0.31 Net realized and unrealized gains (losses) . .
. . .
. . .
. . .
. . .
. . .
. . .
. . (0.37) Total from investment activities . .
. . .
. . .
. . .
. . .
. . .
. . .
. . .
. . .
. (0.06) Distributions to shareholders: From net investment income . . .
. . .
. . .
. . .
. . .
. . .
. . .
. . .
. . .
. . .
. (0.34) From net realized gains. . .
. . .
. . .
. . .
. . .
. . .
. . .
. . .
. . .
. . .
. . .
. . . (0.26) Return of capital.
. . .
. . .
. . .
. . .
. . .
. . .
. . .
. . .
. . .
. . .
. . .
. . .
. . .
. — Total distributions to shareholders . . .
. . .
. . .
. . .
. . .
. . .
. . .
. . .
. (0.60) Net asset value — end of period . . .
. . .
. . .
. . .
. . .
. . .
. . .
. . .
. . .
. . .
$ 6.42 Total return . . .
. . .
. . .
. . .
. . .
. . .
. . .
. . .
. . .
. . .
. . .
. . .
. . .
. . . Ratios/supplemental data: Net assets, end of period (000s) .
. . .
. . .
. . .
. . .
. . .
. . .
. . .
. . .
. . .
. $ Ratio of gross expense to average net assets. .
. . .
. . .
. . .
. . .
. . .
. . .
. Ratio of net expense to average net assets . . .
. . .
. . .
. . .
. . .
. . .
. . .
. Ratio of investment income less gross expenses to average net assets . . Ratio of net investment income to average net assets . .
. . .
. . .
. . .
. . Portfolio turnover rate . .
. . .
. . .
. . .
. . .
. . .
. . .
. . .
. . .
. . .
. . .
. . .
. Payden High Income Fund - Adviser Class 2014 2013 2012 $ 7.28 $ 7.29 $ 7.05 2011 7.32 0.39 (0.01) 0.38 $ (0.76)% 19,879 0.92% 0.92% 4.98% 4.98% 32% $ 0.46 (0.06) 0.40 0.46 0.37 0.83 0.49 (0.24) 0.25 (0.38) (0.20) — (0.58) 7.08 (0.41) — — (0.41) 7.28 (0.48) (0.09) (0.02) (0.59) 7.29 (0.51) (0.01) — (0.52) 7.05 $ 5.45% $ 3,968 0.91% 0.91% 5.29% 5.29% 42% $ 5.56% $ 4,884 0.91% 0.91% 5.79% 5.79% 25% $ 12.38% $ 5,974 0.89% 0.89% 6.41% 6.41% 24% 3.51% $ 4,492 0.92% 0.92% 6.93% 6.93% 38% The Class commenced operations on November 2, 2009. (1) Not annualized (2) Annualized See notes to financial statements. Annual Report 127 . Financial Highlights continued For the share outstanding for the periods ended October 31st 2015 Net asset value — beginning of period . . . .
. . .
. . .
. . .
. . .
. . .
. . .
. . .
$ 7.08 Income (loss) from investment activities: Net investment income . . .
. . .
. . .
. . .
. . .
. . .
. . .
. . .
. . .
. . .
. . .
. . 0.36 Net realized and unrealized gains (losses) . .
. . .
. . .
. . .
. . .
. . .
. . .
. . (0.42) Total from investment activities . .
. . .
. . .
. . .
. . .
. . .
. . .
. . .
. . .
. (0.06) Distributions to shareholders: From net investment income . . .
. . .
. . .
. . .
. . .
. . .
. . .
. . .
. . .
. . .
. (0.36) From net realized gains. . .
. . .
. . .
. . .
. . .
. . .
. . .
. . .
. . .
. . .
. . .
. . . (0.26) Return of capital.
. . .
. . .
. . .
. . .
. . .
. . .
. . .
. . .
. . .
. . .
. . .
. . .
. . .
. — Total distributions to shareholders . . .
. . .
. . .
. . .
. . .
. . .
. . .
. . .
. (0.62) Proceeds from redemption fees . . .
. . .
. . .
. . .
. . .
. . .
. . .
. . .
. . .
. . .
. . — Net asset value — end of period . .
. . .
. . .
. . .
. . .
. . .
. . .
. . .
. . .
. . .
. $ 6.40 Total return . .
. . .
. . .
. . .
. . .
. . .
. . .
. . .
. . .
. . .
. . .
. . .
. . .
. . .
. Payden High Income Fund - Investor Class 2014 2013 2012 $ 7.28 $ 7.29 $ 7.05 $ 2011 7.31 0.40 (0.00)(1) 0.40 $ 0.44 (0.03) 0.41 0.48 0.37 0.85 0.52 (0.24) 0.28 (0.40) (0.20) — (0.60) — 7.08 (0.42) — — (0.42) — 7.28 (0.49) (0.09) (0.03) (0.61) — 7.29 (0.53) (0.01) — (0.54) 0.00(1) 7.05 $ $ $ (0.79)% 5.75% 5.82% 12.69% 3.89% Ratios/supplemental data: Net assets, end of period (000s) . . .
. . .
. . .
. . .
. . .
. . .
. . .
. . .
. . .
. . $ 603,937 Ratio of gross expense to average net assets.
. . .
. . .
. . .
. . .
. . .
. . .
. . 0.67% Ratio of net expense to average net assets . .
. . .
. . .
. . .
. . .
. . .
. . .
. . 0.67% Ratio of investment income less gross expenses to average net assets . . 5.29% Ratio of net investment income to average net assets .
. . .
. . .
. . .
. . . 5.29% Portfolio turnover rate .
. . .
. . .
. . .
. . .
. . .
. . .
. . .
. . .
. . .
. . .
. . .
. . 32% $ 734,666 0.66% 0.66% 5.54% 5.54% 42% $ 892,360 0.66% 0.66% 6.05% 6.05% 25% $1,123,179 0.64% 0.64% 6.70% 6.70% 24% $1,024,553 0.66% 0.66% 7.20% 7.20% 38% The Fund commenced operations on December 30, 1997. 2015 Net asset value — beginning of period . .
. . .
. . .
. . .
. . .
. . .
. . .
. . .
. . $ 10.50 Income (loss) from investment activities: Net investment income .
. . .
. . .
. . .
. . .
. . .
. . .
. . .
. . .
. . .
. . .
. . .
. 0.23 Net realized and unrealized gains (losses) . . .
. . .
. . .
. . .
. . .
. . .
. . .
. (0.03) Total from investment activities . . .
. . .
. . .
. . .
. . .
. . .
. . .
. . .
. . . 0.20 Distributions to shareholders: From net investment income .
. . .
. . .
. . .
. . .
. . .
. . .
. . .
. . .
. . .
. . . (0.23) From net realized gains.
. . .
. . .
. . .
. . .
. . .
. . .
. . .
. . .
. . .
. . .
. . .
. . (0.08) Total distributions to shareholders . .
. . .
. . .
. . .
. . .
. . .
. . .
. . .
. . (0.31) Net asset value — end of period . .
. . .
. . .
. . .
. . .
. . .
. . .
. . .
. . .
. . .
. $ 10.39 Total return . .
. . .
. . .
. . .
. . .
. . .
. . .
. . .
. . .
. . .
. . .
. . .
. . .
. . .
. Ratios/supplemental data: Net assets, end of period (000s) . . .
. . .
. . .
. . .
. . .
. . .
. . .
. . .
. . .
. . $ Ratio of gross expense to average net assets.
. . .
. . .
. . .
. . .
. . .
. . .
. . Ratio of net expense to average net assets . .
. . .
. . .
. . .
. . .
. . .
. . .
. . Ratio of investment income less gross expenses to average net assets . . Ratio of net investment income to average net assets .
. . .
. . .
. . .
. . . Portfolio turnover rate .
. . .
. . .
. . .
. . .
. . .
. . .
. . .
. . .
. . .
. . .
. . .
. . Payden California Municipal Income Fund 2014 2013 2012 $ 10.27 $ 10.63 $ 10.11 $ 0.25 (0.24) 0.01 0.26 0.52 0.78 0.28 (0.05) 0.23 (0.24) (0.06) (0.30) 10.50 (0.25) (0.12) (0.37) 10.27 (0.26) — (0.26) 10.63 (0.28) (0.20) (0.48) 10.11 $ 5.27% $ 46,729 0.70% 0.55% 2.18% 2.33% 48% The Fund commenced operations on December 17, 1998. (1) Amount is less than $0.005 See notes to financial statements. 128 Payden Mutual Funds 2011 10.36 0.24 0.29 0.53 1.87% 45,938 0.70% 0.55% 2.03% 2.17% 45% $ $ 0.02% $ 43,305 0.66% 0.55% 2.26% 2.37% 24% $ 7.73% $ 49,811 0.67% 0.56% 2.32% 2.43% 25% 2.41% $ 44,265 0.67% 0.55% 2.64% 2.76% 30% . 2015 Net asset value — beginning of period . . . .
. . .
. . .
. . .
. . .
. . .
. . .
. . .
$ 10.10 Income (loss) from investment activities: Net investment income . . .
. . .
. . .
. . .
. . .
. . .
. . .
. . .
. . .
. . .
. . .
. . 0.12 Net realized and unrealized gains (losses) . .
. . .
. . .
. . .
. . .
. . .
. . .
. . (0.09) Total from investment activities . .
. . .
. . .
. . .
. . .
. . .
. . .
. . .
. . .
. 0.03 Distributions to shareholders: From net investment income . . .
. . .
. . .
. . .
. . .
. . .
. . .
. . .
. . .
. . .
. (0.02) Return of capital. . .
. . .
. . .
. . .
. . .
. . .
. . .
. . .
. . .
. . .
. . .
. . .
. . .
. . (0.10) Total distributions to shareholders . .
. . .
. . .
. . .
. . .
. . .
. . .
. . .
. . (0.12) Net asset value — end of period . .
. . .
. . .
. . .
. . .
. . .
. . .
. . .
. . .
. . .
. $ 10.01 Total return . .
. . .
. . .
. . .
. . .
. . .
. . .
. . .
. . .
. . .
. . .
. . .
. . .
. . .
. Payden Global Low Duration Fund 2014 2013 2012 $ 10.08 $ 10.10 $ 9.88 $ 2011 10.16 0.12 0.02 0.14 $ 0.14 (0.02) 0.12 0.21 0.33 0.54 0.19 (0.20) (0.01) (0.12) — (0.12) 10.10 (0.13) (0.01) (0.14) 10.08 (0.32) — (0.32) 10.10 (0.27) — (0.27) 9.88 $ 0.32% 1.43% Ratios/supplemental data: Net assets, end of period (000s) . . .
. . .
. . .
. . .
. . .
. . .
. . .
. . .
. . .
. . $ 130,344 Ratio of gross expense to average net assets.
. . .
. . .
. . .
. . .
. . .
. . .
. . 0.69% Ratio of net expense to average net assets . .
. . .
. . .
. . .
. . .
. . .
. . .
. . 0.55% Ratio of investment income less gross expenses to average net assets . . 1.05% Ratio of net investment income to average net assets .
. . .
. . .
. . .
. . . 1.18% Portfolio turnover rate .
. . .
. . .
. . .
. . .
. . .
. . .
. . .
. . .
. . .
. . .
. . .
. . 35% $ 139,965 0.69% 0.55% 1.11% 1.25% 54% $ 113,046 0.71% 0.60% 1.29% 1.41% 84% $ 1.19% $ 5.59% $ 70,544 0.76% 0.71% 2.00% 2.05% 79% (0.10)% $ 73,021 0.70% 0.70% 2.04% 2.04% 142% The Fund commenced operations on September 18, 1996. 2015 Net asset value — beginning of period . .
. . .
. . .
. . .
. . .
. . .
. . .
. . .
. . $ 8.84 Income (loss) from investment activities: Net investment income .
. . .
. . .
. . .
. . .
. . .
. . .
. . .
. . .
. . .
. . .
. . .
. 0.15 Net realized and unrealized gains (losses) . . .
. . .
. . .
. . .
. . .
. . .
. . .
. 0.05 Total from investment activities . . .
. . .
. . .
. . .
. . .
. . .
. . .
. . .
. . . 0.20 Distributions to shareholders: From net investment income .
. . .
. . .
. . .
. . .
. . .
. . .
. . .
. . .
. . .
. . . (0.17) Return of capital.
. . .
. . .
. . .
. . .
. . .
. . .
. . .
. . .
. . .
. . .
. . .
. . .
. . .
. — Total distributions to shareholders . . .
. . .
. . .
. . .
. . .
. . .
. . .
. . .
. (0.17) Net asset value — end of period . . .
. . .
. . .
. . .
. . .
. . .
. . .
. . .
. . .
. . .
$ 8.87 Total return . . .
. . .
. . .
. . .
. . .
. . .
. . .
. . .
. . .
. . .
. . .
. . .
. . .
. . . Ratios/supplemental data: Net assets, end of period (000s) .
. . .
. . .
. . .
. . .
. . .
. . .
. . .
. . .
. . .
. $ Ratio of gross expense to average net assets. .
. . .
. . .
. . .
. . .
. . .
. . .
. Ratio of net expense to average net assets . . .
. . .
. . .
. . .
. . .
. . .
. . .
. Ratio of investment income less gross expenses to average net assets . . Ratio of net investment income to average net assets . .
. . .
. . .
. . .
. . Portfolio turnover rate . .
. . .
. . .
. . .
. . .
. . .
. . .
. . .
. . .
. . .
. . .
. . .
. Payden Global Fixed Income Fund 2014 2013 2012 $ 8.53 $ 8.70 $ 8.71 2011 9.02 0.21 0.31 0.52 $ 2.27% 80,293 0.81% 0.66% 1.63% 1.78% 44% $ 0.25 (0.19) 0.06 0.45 0.25 0.70 0.36 (0.30) 0.06 (0.18) (0.03) (0.21) 8.84 (0.08) (0.15) (0.23) 8.53 (0.71) — (0.71) 8.70 (0.37) — (0.37) 8.71 $ 6.20% $ 50,679 0.90% 0.70% 2.30% 2.50% 55% $ 0.69% $ 39,921 0.94% 0.71% 2.57% 2.81% 75% $ 8.54% $ 48,221 0.92% 0.72% 3.45% 3.65% 100% 0.71% $ 66,592 0.84% 0.70% 3.91% 4.05% 82% The Fund commenced operations on September 1, 1992. See notes to financial statements. Annual Report 129 . Financial Highlights continued For the share outstanding for the periods ended October 31st Payden Emerging Markets Bond Fund - Adviser Class 2014 2013 2012 $ 13.90 $ 15.45 $ 14.45 2015 14.14 Net asset value — beginning of period . . . .
. . .
. . .
. . .
. . .
. . .
. . .
. . .
$ 1 Income (loss) from investment activities: Net investment income . . .
. . .
. . .
. . .
. . .
. . .
. . .
. . .
. . .
. . .
. . .
. . 0.63 Net realized and unrealized gains (losses) . .
. . .
. . .
. . .
. . .
. . .
. . .
. . (1.04) Total from investment activities . .
. . .
. . .
. . .
. . .
. . .
. . .
. . .
. . .
. (0.41) Distributions to shareholders: From net investment income . . .
. . .
. . .
. . .
. . .
. . .
. . .
. . .
. . .
. . .
. (0.63) From net realized gains. . .
. . .
. . .
. . .
. . .
. . .
. . .
. . .
. . .
. . .
. . .
. . . — Return of capital.
. . .
. . .
. . .
. . .
. . .
. . .
. . .
. . .
. . .
. . .
. . .
. . .
. . .
. — Total distributions to shareholders . . .
. . .
. . .
. . .
. . .
. . .
. . .
. . .
. (0.63) 13.10 Net asset value — end of period . . .
. . .
. . .
. . .
. . .
. . .
. . .
. . .
. . .
. . .
$ 1 Total return . . .
. . .
. . .
. . .
. . .
. . .
. . .
. . .
. . .
. . .
. . .
. . .
. . .
. . . Ratios/supplemental data: Net assets, end of period (000s) .
. . .
. . .
. . .
. . .
. . .
. . .
. . .
. . .
. . .
. $ Ratio of gross expense to average net assets. .
. . .
. . .
. . .
. . .
. . .
. . .
. Ratio of net expense to average net assets . . .
. . .
. . .
. . .
. . .
. . .
. . .
. Ratio of investment income less gross expenses to average net assets . . Ratio of net investment income to average net assets . .
. . .
. . .
. . .
. . Portfolio turnover rate . .
. . .
. . .
. . .
. . .
. . .
. . .
. . .
. . .
. . .
. . .
. . .
. $ 2011 14.87 0.70 0.29 0.99 $ (2.94)% 29,481 1.01% 1.01% 4.73% 4.73% 54% 0.76 (1.27) (0.51) 0.78 1.33 2.11 0.78 (0.39) 0.39 (0.60) (0.05) (0.10) (0.75) 14.14 (0.79) (0.25) — (1.04) 13.90 (0.82) (0.29) — (1.11) 15.45 (0.80) (0.01) — (0.81) 14.45 $ 7.32% $ 21,754 1.03% 1.03% 5.03% 5.03% 73% $ (3.54)% $ 20,133 1.01% 1.01% 5.14% 5.14% 95% $ 15.49% $ 27,784 1.02% 1.02% 5.33% 5.33% 74% 2.77% $ 27,159 1.09% 1.09% 5.80% 5.80% 85% The Class commenced operations on November 2, 2009. 2015 14.11 Net asset value — beginning of period . . .
. . .
. . .
. . .
. . .
. . .
. . .
. . .
. $ 1 Income (loss) from investment activities: Net investment income . .
. . .
. . .
. . .
. . .
. . .
. . .
. . .
. . .
. . .
. . .
. . . 0.67 Net realized and unrealized gains (losses) .
. . .
. . .
. . .
. . .
. . .
. . .
. . . (1.04) Total from investment activities .
. . .
. . .
. . .
. . .
. . .
. . .
. . .
. . .
. . (0.37) Distributions to shareholders: From net investment income . .
. . .
. . .
. . .
. . .
. . .
. . .
. . .
. . .
. . .
. . (0.66) From net realized gains. .
. . .
. . .
. . .
. . .
. . .
. . .
. . .
. . .
. . .
. . .
. . .
. — Return of capital. . .
. . .
. . .
. . .
. . .
. . .
. . .
. . .
. . .
. . .
. . .
. . .
. . .
. . — Total distributions to shareholders . .
. . .
. . .
. . .
. . .
. . .
. . .
. . .
. . (0.66) Proceeds from redemption fees . .
. . .
. . .
. . .
. . .
. . .
. . .
. . .
. . .
. . .
. . . — Net asset value — end of period .
. . .
. . .
. . .
. . .
. . .
. . .
. . .
. . .
. . .
. . $ 13.08 Total return .
. . .
. . .
. . .
. . .
. . .
. . .
. . .
. . .
. . .
. . .
. . .
. . .
. . .
. . Payden Emerging Markets Bond Fund - Investor Class 2014 2013 2012 $ 13.88 $ 15.42 $ 14.42 $ 2011 14.85 0.75 0.26 1.01 $ 0.79 (1.26) (0.47) 0.82 1.33 2.15 0.86 (0.45) 0.41 (0.63) (0.05) (0.10) (0.78) — 14.11 (0.82) (0.25) — (1.07) — 13.88 (0.86) (0.29) — (1.15) — 15.42 (0.83) (0.01) — (0.84) 0.00(1) 14.42 $ $ $ (2.65)% 7.53% (3.25)% 15.80% 2.95% Ratios/supplemental data: Net assets, end of period (000s) . .
. . .
. . .
. . .
. . .
. . .
. . .
. . .
. . .
. . .
$ 416,408 Ratio of gross expense to average net assets. . .
. . .
. . .
. . .
. . .
. . .
. . . 0.76% Ratio of net expense to average net assets .
. . .
. . .
. . .
. . .
. . .
. . .
. . . 0.76% Ratio of investment income less gross expenses to average net assets .
. 4.98% Ratio of net investment income to average net assets . . .
. . .
. . .
. . .
. 4.98% Portfolio turnover rate . . .
. . .
. . .
. . .
. . .
. . .
. . .
. . .
. . .
. . .
. . .
. . . 54% $ 379,923 0.78% 0.78% 5.29% 5.29% 73% $ 463,873 0.76% 0.76% 5.39% 5.39% 95% $ 575,777 0.78% 0.78% 5.62% 5.62% 74% $ 620,106 0.85% 0.85% 6.07% 6.07% 85% The Fund commenced operations on December 17, 1998. (1) Amount is less than $0.005 See notes to financial statements. 130 Payden Mutual Funds .
Payden Emerging Markets Bond Fund - SI Class 2015 2014 2013 2012 Net asset value — beginning of period . . . .
. . .
. . .
. . .
. . .
. . .
. . .
. . .
$ 14.10 $ 13.87 $ 15.42 $ 14.47 Income from investment activities: Net investment income . . .
. . .
. . .
. . .
. . .
. . .
. . .
. . .
. . .
. . .
. . .
. . 0.68 0.74 0.81 0.44 Net realized and unrealized gains (losses) . .
. . .
. . .
. . .
. . .
. . .
. . .
. . (1.04) 0.28 (1.27) 0.99 Total from investment activities . .
. . .
. . .
. . .
. . .
. . .
. . .
. . .
. . .
. (0.36) 1.02 (0.46) 1.43 Distributions to shareholders: From net investment income . . .
. . .
. . .
. . .
. . .
. . .
. . .
. . .
. . .
. . .
. (0.67) (0.64) (0.84) (0.48) From net realized gains. . .
. . .
. . .
. . .
. . .
. . .
. . .
. . .
. . .
. . .
. . .
. . . — (0.05) (0.25) — Return of capital.
. . .
. . .
. . .
. . .
. . .
. . .
. . .
. . .
. . .
. . .
. . .
. . .
. . .
. — (0.10) — — Total distributions to shareholders . . .
. . .
. . .
. . .
. . .
. . .
. . .
. . .
. (0.67) (0.79) (1.09) (0.48) Net asset value — end of period . . .
. . .
. . .
. . .
. . .
. . .
. . .
. . .
. . .
. . .
$ 13.07 $ 14.10 $ 13.87 $ 15.42 (2.58)% 7.64% (3.23)% 10.04%(1) Ratios/supplemental data: Net assets, end of period (000s) . . .
. . .
. . .
. . .
. . .
. . .
. . .
. . .
. . .
. . $ 518,220 Ratio of gross expense to average net assets.
. . .
. . .
. . .
. . .
. . .
. . .
. . 0.76% Ratio of net expense to average net assets . .
. . .
. . .
. . .
. . .
. . .
. . .
. . 0.69% Ratio of investment income less gross expenses to average net assets . . 4.98% Ratio of net investment income to average net assets .
. . .
. . .
. . .
. . . 5.05% Portfolio turnover rate .
. . .
. . .
. . .
. . .
. . .
. . .
. . .
. . .
. . .
. . .
. . .
. . 54% Total return . .
. . .
. . .
. . .
. . .
. . .
. . .
. . .
. . .
. . .
. . .
. . .
. . .
. . .
. $ 450,550 0.77% 0.69% 5.28% 5.35% 73% $ 399,432 0.76% 0.69% 5.40% 5.47% 95% $ 449,295 0.76%(2) 0.69%(2) 5.30%(2) 5.37%(2) 74% The Class commenced operations on April 9, 2012. Payden Emerging Markets Local Bond Fund - Adviser Class 2015 2014 2013 2012 Net asset value — beginning of period . . .
. . .
. . .
. . .
. . .
. . .
. . .
. . .
. $ 8.47 $ 9.32 $ 10.24 $ 10.00 Income from investment activities: Net investment income . .
. . .
. . .
. . .
. . .
. . .
. . .
. . .
. . .
. . .
. . .
. . . 0.38 0.49 0.30 0.56 Net realized and unrealized gains (losses) .
. . .
. . .
. . .
. . .
. . .
. . .
. . . (1.82) (0.87) (0.74) 0.14 Total from investment activities .
. . .
. . .
. . .
. . .
. . .
. . .
. . .
. . .
. . (1.44) (0.38) (0.44) 0.70 Distributions to shareholders: From net investment income . .
. . .
. . .
. . .
. . .
. . .
. . .
. . .
. . .
. . .
. . — — (0.31) (0.37) Return of capital. .
. . .
. . .
. . .
. . .
. . .
. . .
. . .
. . .
. . .
. . .
. . .
. . .
. . . (0.37) (0.47) (0.17) (0.09) Total distributions to shareholders .
. . .
. . .
. . .
. . .
. . .
. . .
. . .
. . . (0.37) (0.47) (0.48) (0.46) Net asset value — end of period .
. . .
. . .
. . .
. . .
. . .
. . .
. . .
. . .
. . .
. . $ 6.66 $ 8.47 $ 9.32 $ 10.24 Total return .
. . .
. . .
. . .
. . .
. . .
. . .
. . .
. . .
. . .
. . .
. . .
. . .
. . .
. . Ratios/supplemental data: Net assets, end of period (000s) . .
. . .
. . .
. . .
. . .
. . .
. . .
. . .
. . .
. . .
$ Ratio of gross expense to average net assets. . .
. . .
. . .
. . .
. . .
. . .
. . . Ratio of net expense to average net assets .
. . .
. . .
. . .
. . .
. . .
. . .
. . . Ratio of investment income less gross expenses to average net assets .
. Ratio of net investment income to average net assets . . .
. . .
. . .
. . .
. Portfolio turnover rate . . .
. . .
. . .
. . .
. . .
. . .
. . .
. . .
. . .
. . .
. . .
. . . (17.26)% 169 1.23% 1.22% 5.01% 5.03% 106% (4.09)% $ 398 1.21% 1.21% 5.34% 5.34% 99% (4.45)% $ 530 1.16% 1.16% 5.07% 5.07% 114% 7.26%(1) $ 21 1.35%(2) 1.24%(2) 4.71%(2) 4.82%(2) 91%(1) The Fund commenced operations November 2, 2011. (1) Not annualized (2) Annualized See notes to financial statements. Annual Report 131 .
Financial Highlights continued For the share outstanding for the periods ended October 31st Payden Emerging Markets Local Bond Fund - Investor Class 2015 2014 2013 2012 Net asset value — beginning of period . . . .
. . .
. . .
. . .
. . .
. . .
. . .
. . .
$ 8.48 $ 9.33 $ 10.24 $ 10.00 Income from investment activities: Net investment income . . .
. . .
. . .
. . .
. . .
. . .
. . .
. . .
. . .
. . .
. . .
. . 0.40 0.51 0.52 0.49 Net realized and unrealized gains (losses) . .
. . .
. . .
. . .
. . .
. . .
. . .
. . (1.83) (0.86) (0.92) 0.24 Total from investment activities . .
. . .
. . .
. . .
. . .
. . .
. . .
. . .
. . .
. (1.43) (0.35) (0.40) 0.73 Distributions to shareholders: From net investment income . . .
. . .
. . .
. . .
. . .
. . .
. . .
. . .
. . .
. . .
. — — (0.32) (0.40) Return of capital. . .
. . .
. . .
. . .
. . .
. . .
. . .
. . .
. . .
. . .
. . .
. . .
. . .
. . (0.39) (0.50) (0.19) (0.09) Total distributions to shareholders . .
. . .
. . .
. . .
. . .
. . .
. . .
. . .
. . (0.39) (0.50) (0.51) (0.49) Net asset value — end of period . .
. . .
. . .
. . .
. . .
. . .
. . .
. . .
. . .
. . .
. $ 6.66 $ 8.48 $ 9.33 $ 10.24 (17.16)% (3.84)% (4.12)% 7.58%(1) Ratios/supplemental data: Net assets, end of period (000s) . .
. . .
. . .
. . .
. . .
. . .
. . .
. . .
. . .
. . .
$ 125,970 Ratio of gross expense to average net assets. . .
. . .
. . .
. . .
. . .
. . .
. . . 0.98% Ratio of net expense to average net assets .
. . .
. . .
. . .
. . .
. . .
. . .
. . . 0.97% Ratio of investment income less gross expenses to average net assets .
. 5.26% Ratio of net investment income to average net assets . . .
. . .
. . .
. . .
. 5.28% Portfolio turnover rate . . .
. . .
. . .
. . .
. . .
. . .
. . .
. . .
. . .
. . .
. . .
. . . 106% Total return .
. . .
. . .
. . .
. . .
. . .
. . .
. . .
. . .
. . .
. . .
. . .
. . .
. . .
. . $ 174,827 0.96% 0.96% 5.59% 5.59% 99% $ 248,377 0.91% 0.91% 5.27% 5.27% 114% $ 118,921 1.07%(2) 0.99%(2) 5.14%(2) 5.22%(2) 91%(1) The Fund commenced operations on November 2, 2011. Payden Emerging Markets Corporate Bond Fund — Adviser Class 2015 2014 Net asset value — beginning of period . .
. . .
. . .
. . .
. . .
. . .
. . .
. . .
. . $ 10.40 $ 10.00 Income from investment activities: Net investment income .
. . .
. . .
. . .
. . .
. . .
. . .
. . .
. . .
. . .
. . .
. . .
. 0.53 0.39 Net realized and unrealized gains (losses) . . .
. . .
. . .
. . .
. . .
. . .
. . .
. (0.72) 0.41 Total from investment activities . . .
. . .
. . .
. . .
. . .
. . .
. . .
. . .
. . . (0.19) 0.80 Distributions to shareholders: From net investment income .
. . .
. . .
. . .
. . .
. . .
. . .
. . .
. . .
. . .
. . . (0.40) (0.40) From net realized gains.
. . .
. . .
. . .
. . .
. . .
. . .
. . .
. . .
. . .
. . .
. . .
. . (0.18) — Total distributions to shareholders . .
. . .
. . .
. . .
. . .
. . .
. . .
. . .
. . (0.58) (0.40) Net asset value — end of period . .
. . .
. . .
. . .
. . .
. . .
. . .
. . .
. . .
. . .
. $ 9.63 $ 10.40 Total return . .
. . .
. . .
. . .
. . .
. . .
. . .
. . .
. . .
. . .
. . .
. . .
. . .
. . .
. Ratios/supplemental data: Net assets, end of period (000s) . . .
. . .
. . .
. . .
. . .
. . .
. . .
. . .
. . .
. . $ Ratio of gross expense to average net assets.
. . .
. . .
. . .
. . .
. . .
. . .
. . Ratio of net expense to average net assets . .
. . .
. . .
. . .
. . .
. . .
. . .
. . Ratio of investment income less gross expenses to average net assets . . Ratio of net investment income to average net assets .
. . .
. . .
. . .
. . . Portfolio turnover rate .
. . .
. . .
. . .
. . .
. . .
. . .
. . .
. . .
. . .
. . .
. . .
. . (1.94)% 15 1.58% 1.20% 3.71% 4.11% 93% 8.17%(1) $ 217 1.63%(2) 1.20%(2) 3.61%(2) 4.04%(2) 100%(1) The Fund commenced operations on November 11, 2013. (1) Not annualized (2) Annualized See notes to financial statements. 132 Payden Mutual Funds . Payden Emerging Markets Corporate Bond Fund — Investor Class 2015 2014 Net asset value — beginning of period . . . .
. . .
. . .
. . .
. . .
. . .
. . .
. . .
$ 10.39 $ 10.00 Income from investment activities: Net investment income . . .
. . .
. . .
. . .
. . .
. . .
. . .
. . .
. . .
. . .
. . .
. . 0.43 0.64 Net realized and unrealized gains (losses) . .
. . .
. . .
. . .
. . .
. . .
. . .
. . (0.59) 0.18 Total from investment activities . .
. . .
. . .
. . .
. . .
. . .
. . .
. . .
. . .
. (0.16) 0.82 Distributions to shareholders: From net investment income . . .
. . .
. . .
. . .
. . .
. . .
. . .
. . .
. . .
. . .
. (0.43) (0.43) From net realized gains. . .
. . .
. . .
. . .
. . .
. . .
. . .
. . .
. . .
. . .
. . .
. . . (0.18) — Total distributions to shareholders .
. . .
. . .
. . .
. . .
. . .
. . .
. . .
. . . (0.61) (0.43) Net asset value — end of period .
. . .
. . .
. . .
. . .
. . .
. . .
. . .
. . .
. . .
. . $ 9.62 $ 10.39 Total return .
. . .
. . .
. . .
. . .
. . .
. . .
. . .
. . .
. . .
. . .
. . .
. . .
. . .
. . Ratios/supplemental data: Net assets, end of period (000s) . .
. . .
. . .
. . .
. . .
. . .
. . .
. . .
. . .
. . .
$ Ratio of gross expense to average net assets. . .
. . .
. . .
. . .
. . .
. . .
. . . Ratio of net expense to average net assets .
. . .
. . .
. . .
. . .
. . .
. . .
. . . Ratio of investment income less gross expenses to average net assets .
. Ratio of net investment income to average net assets . . .
. . .
. . .
. . .
. Portfolio turnover rate . . .
. . .
. . .
. . .
. . .
. . .
. . .
. . .
. . .
. . .
. . .
. . . (1.55)% 1,401 1.33% 0.95% 4.00% 4.39% 93% 8.31%(1) $ 1,522 1.42%(2) 0.94%(2) 3.90%(2) 4.37%(2) 100%(1) The Fund commenced operations on November 11, 2013. Payden Emerging Markets Corporate Bond Fund — SI Class 2015 2014 Net asset value — beginning of period .
. . .
. . .
. . .
. . .
. . .
. . .
. . .
. . .
$ 10.40 $ 10.00 Income from investment activities: Net investment income . . .
. . .
. . .
. . .
. . .
. . .
. . .
. . .
. . .
. . .
. . .
. . 0.45 0.44 Net realized and unrealized gains (losses) . .
. . .
. . .
. . .
. . .
. . .
. . .
. . (0.60) 0.40 Total from investment activities . .
. . .
. . .
. . .
. . .
. . .
. . .
. . .
. . .
. (0.15) 0.84 Distributions to shareholders: From net investment income . . .
. . .
. . .
. . .
. . .
. . .
. . .
. . .
. . .
. . .
. (0.44) (0.44) From net realized gains. . .
. . .
. . .
. . .
. . .
. . .
. . .
. . .
. . .
. . .
. . .
. . . (0.18) — Total distributions to shareholders .
. . .
. . .
. . .
. . .
. . .
. . .
. . .
. . . (0.62) (0.44) Net asset value — end of period .
. . .
. . .
. . .
. . .
. . .
. . .
. . .
. . .
. . .
. . $ 9.63 $ 10.40 Total return .
. . .
. . .
. . .
. . .
. . .
. . .
. . .
. . .
. . .
. . .
. . .
. . .
. . .
. . Ratios/supplemental data: Net assets, end of period (000s) . .
. . .
. . .
. . .
. . .
. . .
. . .
. . .
. . .
. . .
$ Ratio of gross expense to average net assets. . .
. . .
. . .
. . .
. . .
. . .
. . . Ratio of net expense to average net assets .
. . .
. . .
. . .
. . .
. . .
. . .
. . . Ratio of investment income less gross expenses to average net assets .
. Ratio of net investment income to average net assets . . .
. . .
. . .
. . .
. Portfolio turnover rate . . .
. . .
. . .
. . .
. . .
. . .
. . .
. . .
. . .
. . .
. . .
. . . (1.47)% 34,600 1.33% 0.85% 4.01% 4.49% 93% 8.52%(1) $ 41,662 1.39%(2) 0.85%(2) 3.89%(2) 4.43%(2) 100%(1) The Fund commenced operations on November 11, 2013. (1) Not annualized (2) Annualized See notes to financial statements. Annual Report 133 .
Financial Highlights continued For the share outstanding for the periods ended October 31st Payden Equity Income Fund - Adviser Class 2015 2014 2013 2012 Net asset value — beginning of period . . . .
. . .
. . .
. . .
. . .
. . .
. . .
. . .
$ 14.40 $ 12.64 $ 11.12 $ 10.13 Income from investment activities: Net investment income . . .
. . .
. . .
. . .
. . .
. . .
. . .
. . .
. . .
. . .
. . .
. . 0.32 0.36 0.45 0.43 Net realized and unrealized gains . .
. . .
. . .
. . .
. . .
. . .
. . .
. . .
. . .
. . 0.05 1.72 1.54 1.02 Total from investment activities . .
. . .
. . .
. . .
. . .
. . .
. . .
. . .
. . .
. 0.37 2.08 1.99 1.45 Distributions to shareholders: From net investment income . . .
. . .
. . .
. . .
. . .
. . .
. . .
. . .
. . .
. . .
. (0.36) (0.21) (0.47) (0.46) From net realized gains. . .
. . .
. . .
. . .
. . .
. . .
. . .
. . .
. . .
. . .
. . .
. . . (0.43) (0.11) — — Total distributions to shareholders .
. . .
. . .
. . .
. . .
. . .
. . .
. . .
. . . (0.79) (0.32) (0.47) (0.46) Net asset value — end of period .
. . .
. . .
. . .
. . .
. . .
. . .
. . .
. . .
. . .
. . $ 13.98 $ 14.40 $ 12.64 $ 11.12 Total return .
. . .
. . .
. . .
. . .
. . .
. . .
. . .
. . .
. . .
. . .
. . .
. . .
. . .
. . Ratios/supplemental data: Net assets, end of period (000s) . .
. . .
. . .
. . .
. . .
. . .
. . .
. . .
. . .
. . .
$ Ratio of gross expense to average net assets. . .
. . .
. . .
. . .
. . .
. . .
. . . Ratio of net expense to average net assets .
. . .
. . .
. . .
. . .
. . .
. . .
. . . Ratio of investment income less gross expenses to average net assets .
. Ratio of net investment income to average net assets . . .
. . .
. . .
. . .
. Portfolio turnover rate . . .
. . .
. . .
. . .
. . .
. . .
. . .
. . .
. . .
. . .
. . .
. . . 2.66% 4,567 1.05% 1.05% 2.29% 2.27% 48% 16.66% $ 4,742 1.08% 1.05% 2.52% 2.55% 51% 18.20% $ 4,274 1.13% 1.05% 3.68% 3.76% 86% 14.46%(1) $ 3,468 1.18%(2) 1.06%(2) 4.32%(2) 4.44%(2) 182%(1) The Class commenced operations on December 1, 2011. 2015 Net asset value — beginning of period .
. . .
. . .
. . .
. . .
. . .
. . .
. . .
. . .
$ 14.39 Income from investment activities: Net investment income . . .
. . .
. . .
. . .
. . .
. . .
. . .
. . .
. . .
. . .
. . .
. . 0.35 Net realized and unrealized gains . .
. . .
. . .
. . .
. . .
. . .
. . .
. . .
. . .
. . 0.05 Total from investment activities . .
. . .
. . .
. . .
. . .
. . .
. . .
. . .
. . .
. 0.40 Distributions to shareholders: From net investment income . . .
. . .
. . .
. . .
. . .
. . .
. . .
. . .
. . .
. . .
. (0.39) From net realized gains. . .
. . .
. . .
. . .
. . .
. . .
. . .
. . .
. . .
. . .
. . .
. . . (0.43) Total distributions to shareholders .
. . .
. . .
. . .
. . .
. . .
. . .
. . .
. . . (0.82) Net asset value — end of period .
. . .
. . .
. . .
. . .
. . .
. . .
. . .
. . .
. . .
. . $ 13.97 Total return .
. . .
. . .
. . .
. . .
. . .
. . .
. . .
. . .
. . .
. . .
. . .
. . .
. . .
. . Payden Equity Income Fund - Investor Class 2014 2013 2012 $ 12.64 $ 11.12 $ 10.11 $ 0.38 1.72 2.10 $ 0.48 1.54 2.02 0.48 1.05 1.53 0.38 1.25 1.63 (0.24) (0.11) (0.35) 14.39 (0.50) — (0.50) 12.64 (0.52) — (0.52) 11.12 (0.43) — (0.43) 10.11 $ $ 2.90% 16.88% 18.51% Ratios/supplemental data: Net assets, end of period (000s) . .
. . .
. . .
. . .
. . .
. . .
. . .
. . .
. . .
. . .
$ 281,163 Ratio of gross expense to average net assets. . .
. . .
. . .
. . .
. . .
. . .
. . . 0.80% Ratio of net expense to average net assets .
. . .
. . .
. . .
. . .
. . .
. . .
. . . 0.80% Ratio of investment income less gross expenses to average net assets .
. 2.54% Ratio of net investment income to average net assets . . .
. . .
. . .
. . .
. 2.53% Portfolio turnover rate . . .
. . .
. . .
. . .
. . .
. . .
. . .
. . .
. . .
. . .
. . .
. . . 48% $ 275,222 0.83% 0.80% 2.74% 2.77% 51% $ 211,644 0.87% 0.80% 3.91% 3.99% 86% $ 168,572 0.93% 0.80% 4.48% 4.61% 182% $ 15.40% The Fund commenced operations on November 1, 1996. (1) Not annualized (2) Annualized See notes to financial statements. 134 Payden Mutual Funds 2011 8.91 18.46% $ 63,832 0.95% 0.80% 4.03% 4.18% 167% .
Payden Equity Income Fund — SI Class 2015 2014 Net asset value — beginning of period . . . .
. . .
. . .
. . .
. . .
. . .
. . .
. . .
$ 14.39 $ 13.92 Income from investment activities: Net investment income . . .
. . .
. . .
. . .
. . .
. . .
. . .
. . .
. . .
. . .
. . .
. . 0.38 0.09 Net realized and unrealized gains . .
. . .
. . .
. . .
. . .
. . .
. . .
. . .
. . .
. . 0.04 0.46 Total from investment activities . .
. . .
. . .
. . .
. . .
. . .
. . .
. . .
. . .
. 0.42 0.55 Distributions to shareholders: From net investment income . . .
. . .
. . .
. . .
. . .
. . .
. . .
. . .
. . .
. . .
. (0.41) (0.08) From net realized gains. . .
. . .
. . .
. . .
. . .
. . .
. . .
. . .
. . .
. . .
. . .
. . . (0.43) — Total distributions to shareholders .
. . .
. . .
. . .
. . .
. . .
. . .
. . .
. . . (0.84) (0.08) Net asset value — end of period .
. . .
. . .
. . .
. . .
. . .
. . .
. . .
. . .
. . .
. . $ 13.97 $ 14.39 3.04% 3.94%(1) Ratios/supplemental data: Net assets, end of period (000s) .
. . .
. . .
. . .
. . .
. . .
. . .
. . .
. . .
. . .
. $ 277,634 Ratio of gross expense to average net assets. .
. . .
. . .
. . .
. . .
. . .
. . .
. 0.79% Ratio of net expense to average net assets . . .
. . .
. . .
. . .
. . .
. . .
. . .
. 0.65% Ratio of investment income less gross expenses to average net assets . . 2.51% Ratio of net investment income to average net assets . .
. . .
. . .
. . .
. . 2.66% Portfolio turnover rate . .
. . .
. . .
. . .
. . .
. . .
. . .
. . .
. . .
. . .
. . .
. . .
. 48% Total return . . .
. . .
. . .
. . .
. . .
. . .
. . .
. . .
. . .
. . .
. . .
. . .
. . .
. . . $ 186,735 0.83%(2) 0.65%(2) 2.48%(2) 2.64%(2) 51%(1) The Class commenced operations on August 1, 2014. (1) Not annualized (2) Annualized See notes to financial statements. Annual Report 135 .
Report of Independent Registered Public Accounting Firm To the Shareholders and Board of Trustees of The Payden & Rygel Investment Group We have audited the accompanying statements of assets and liabilities, including the schedules of investments, of Payden Cash Reserves Money Market Fund, Payden Limited Maturity Fund, Payden Low Duration Fund, Payden U.S. Government Fund, Payden GNMA Fund, Payden Core Bond Fund, Payden Corporate Bond Fund, Payden Strategic Income Fund, Payden Absolute Return Bond Fund, Payden Floating Rate Fund, Payden High Income Fund, Payden California Municipal Income Fund, Payden Global Low Duration Fund, Payden Global Fixed Income Fund, Payden Emerging Markets Bond Fund, Payden Emerging Markets Local Bond Fund, Payden Emerging Markets Corporate Bond Fund, and Payden Equity Income Fund, eighteen of the funds comprising The Payden & Rygel Investment Group (the “Funds”), as of October 31, 2015, and the related statements of operations, statements of changes in net assets and the financial highlights for each of the periods presented. These financial statements and financial highlights are the responsibility of the Funds’ management. Our responsibility is to express an opinion on these financial statements and financial highlights based on our audits. We conducted our audits in accordance with the standards of the Public Company Accounting Oversight Board (United States). Those standards require that we plan and perform the audit to obtain reasonable assurance about whether the financial statements and financial highlights are free of material misstatement.
The Funds are not required to have, nor were we engaged to perform, audits of their internal control over financial reporting. Our audits included consideration of internal control over financial reporting as a basis for designing audit procedures that are appropriate in the circumstances, but not for the purpose of expressing an opinion on the effectiveness of the Funds’ internal control over financial reporting. Accordingly, we express no such opinion.
An audit also includes examining, on a test basis, evidence supporting the amounts and disclosures in the financial statements, assessing the accounting principles used and significant estimates made by management, as well as evaluating the overall financial statement presentation. Our procedures included confirmation of securities owned as of October 31, 2015, by correspondence with the custodian, brokers and agent banks; when replies were not received from brokers and agent banks, we performed other auditing procedures. We believe that our audits provide a reasonable basis for our opinion. In our opinion, such financial statements and financial highlights referred to above present fairly, in all material respects, the financial position of each of the funds referred to above constituting The Payden & Rygel Investment Group as of October 31, 2015, the results of their operations for the period then ended, and the changes in their net assets and the financial highlights for each of the periods presented, in conformity with accounting principles generally accepted in the United States of America. /s/ DELOITTE & TOUCHE LLP Chicago, Illinois December 21, 2015 136 Payden Mutual Funds .
Fund Expenses Understanding Your Fund’s Expenses Shareholders of mutual funds, incur two types of costs: transaction costs incurred from buying or selling fund shares and ongoing costs incurred from the funds daily operations. The table below is provided to highlight ongoing cost only. If transaction costs were included your cost would have been higher. Actual Expenses The table below is useful in estimating actual expenses paid during the six-month period ended October 31, 2015. It uses each Fund’s actual return and expense ratio for the period (184/365 days) to calculate the ongoing expenses paid by a shareholder with an initial investment of $1,000.
To estimate the actual expense that you paid over the period, divide your beginning account value by 1,000 and multiply the quotient by the number in the Expenses Paid During the Period column. Value May 1, 2015 Cash Reserves Money Market. . .
. . .
. . .
. . .
. . .
. . .
. . .
. . .
. . .
. . .
. . .
. . .
. . .
. . .
. . .
. . .
. . $1,000.00 Limited Maturity .
. . .
. . .
. . .
. . .
. . .
. . .
. . .
. . .
. . .
. . .
. . .
. . .
. . .
. . .
. . .
. . .
. . .
. . .
. . .
. . .
1,000.00 Low Duration . . .
. . .
. . .
. . .
. . .
. . .
. . .
. . .
. . .
. . .
. . .
. . .
. . .
. . .
. . .
. . .
. . .
. . .
. . .
. . .
. . .
. 1,000.00 U.S. Government Adviser Class .
. . .
. . .
. . .
. . .
. . .
. . .
. . .
. . .
. . .
. . .
. . .
. . .
. . .
. . .
. . .
. 1,000.00 U.S. Government Investor Class .
. . .
. . .
. . .
. . .
. . .
. . .
. . .
. . .
. . .
. . .
. . .
. . .
. . .
. . .
. . .
. 1,000.00 GNMA Adviser Class . .
. . .
. . .
. . .
. . .
. . .
. . .
. . .
. . .
. . .
. . .
. . .
. . .
. . .
. . .
. . .
. . .
. . .
. . .
. 1,000.00 GNMA Investor Class . .
. . .
. . .
. . .
. . .
. . .
. . .
. . .
. . .
. . .
. . .
. . .
. . .
. . .
. . .
. . .
. . .
. . .
. . .
1,000.00 Core Bond Adviser Class . . .
. . .
. . .
. . .
. . .
. . .
. . .
. . .
. . .
. . .
. . .
. . .
. . .
. . .
. . .
. . .
. . .
. . .
1,000.00 Core Bond Investor Class. . .
. . .
. . .
. . .
. . .
. . .
. . .
. . .
. . .
. . .
. . .
. . .
. . .
. . .
. . .
. . .
. . .
. . .
1,000.00 Corporate Bond. . .
. . .
. . .
. . .
. . .
. . .
. . .
. . .
. . .
. . .
. . .
. . .
. . .
. . .
. . .
. . .
. . .
. . .
. . .
. . .
. . .
1,000.00 Strategic Income Adviser Class . . .
. . .
. . .
. . .
. . .
. . .
. . .
. . .
. . .
. . .
. . .
. . .
. . .
. . .
. . .
. . .
1,000.00 Strategic Income Investor Class . . .
. . .
. . .
. . .
. . .
. . .
. . .
. . .
. . .
. . .
. . .
. . .
. . .
. . .
. . .
. . .
1,000.00 Strategic Income SI Class. . .
. . .
. . .
. . .
. . .
. . .
. . .
. . .
. . .
. . .
. . .
. . .
. . .
. . .
. . .
. . .
. . .
. . .
1,000.00 Absolute Return Bond Adviser Class. . .
. . .
. . .
. . .
. . .
. . .
. . .
. . .
. . .
. . .
. . .
. . .
. . .
. . .
. 1,000.00 Absolute Return Bond Investor Class . .
. . .
. . .
. . .
. . .
. . .
. . .
. . .
. . .
. . .
. . .
. . .
. . .
. . .
. 1,000.00 Absolute Return Bond SI Class . .
. . .
. . .
. . .
. . .
. . .
. . .
. . .
. . .
. . .
. . .
. . .
. . .
. . .
. . .
. . .
. 1,000.00 Floating Rate Adviser Class . .
. . .
. . .
. . .
. . .
. . .
. . .
. . .
. . .
. . .
. . .
. . .
. . .
. . .
. . .
. . .
. . .
. 1,000.00 Floating Rate Investor Class . .
. . .
. . .
. . .
. . .
. . .
. . .
. . .
. . .
. . .
. . .
. . .
. . .
. . .
. . .
. . .
. . .
. 1,000.00 Floating Rate SI Class. .
. . .
. . .
. . .
. . .
. . .
. . .
. . .
. . .
. . .
. . .
. . .
. . .
. . .
. . .
. . .
. . .
. . .
. . .
. 1,000.00 High Income Adviser Class. .
. . .
. . .
. . .
. . .
. . .
. . .
. . .
. . .
. . .
. . .
. . .
. . .
. . .
. . .
. . .
. . .
. . 1,000.00 High Income Investor Class .
. . .
. . .
. . .
. . .
. . .
. . .
. . .
. . .
. . .
. . .
. . .
. . .
. . .
. . .
. . .
. . .
. . 1,000.00 California Municipal Income .
. . .
. . .
. . .
. . .
. . .
. . .
. . .
. . .
. . .
. . .
. . .
. . .
. . .
. . .
. . .
. . .
. 1,000.00 Global Low Duration . .
. . .
. . .
. . .
. . .
. . .
. . .
. . .
. . .
. . .
. . .
. . .
. . .
. . .
. . .
. . .
. . .
. . .
. . .
. 1,000.00 Global Fixed Income. .
. . .
. . .
. . .
. . .
. . .
. . .
. . .
. . .
. . .
. . .
. . .
. . .
. . .
. . .
. . .
. . .
. . .
. . .
. . 1,000.00 Emerging Markets Bond Adviser Class.
. . .
. . .
. . .
. . .
. . .
. . .
. . .
. . .
. . .
. . .
. . .
. . .
. . .
. 1,000.00 Emerging Markets Bond Investor Class . .
. . .
. . .
. . .
. . .
. . .
. . .
. . .
. . .
. . .
. . .
. . .
. . .
. . 1,000.00 Emerging Markets Bond SI Class .
. . .
. . .
. . .
. . .
. . .
. . .
. . .
. . .
. . .
. . .
. . .
. . .
. . .
. . .
. . .
1,000.00 Emerging Markets Local Bond Adviser Class . . .
. . .
. . .
. . .
. . .
. . .
. . .
. . .
. . .
. . .
. . .
. . 1,000.00 Emerging Markets Local Bond Investor Class.
. . .
. . .
. . .
. . .
. . .
. . .
. . .
. . .
. . .
. . .
. . .
. 1,000.00 Emerging Markets Corporate Bond Adviser Class. .
. . .
. . .
. . .
. . .
. . .
. . .
. . .
. . .
. . .
. . 1,000.00 Emerging Markets Corporate Bond Investor Class .
. . .
. . .
. . .
. . .
. . .
. . .
. . .
. . .
. . .
. . 1,000.00 Emerging Markets Corporate Bond SI Class .
. . .
. . .
. . .
. . .
. . .
. . .
. . .
. . .
. . .
. . .
. . .
. . 1,000.00 Equity Income Adviser Class .
. . .
. . .
. . .
. . .
. . .
. . .
. . .
. . .
. . .
. . .
. . .
. . .
. . .
. . .
. . .
. . .
. 1,000.00 Equity Income Investor Class. .
. . .
. . .
. . .
. . .
. . .
. . .
. . .
. . .
. . .
. . .
. . .
. . .
. . .
. . .
. . .
. . .
1,000.00 Equity Income SI Class. . .
. . .
. . .
. . .
. . .
. . .
. . .
. . .
. . .
. . .
. . .
. . .
. . .
. . .
. . .
. . .
. . .
. . .
. . 1,000.00 Value October 31, 2015 $1,000.00 998.40 998.70 998.70 1,000.00 998.10 999.30 996.30 997.50 997.70 999.80 1,002.10 1,004.91 1,001.70 1,002.80 1,004.50 1,000.30 1,001.40 1,002.90 983.60 982.20 1,011.70 997.00 996.10 972.40 973.50 973.80 894.50 895.60 974.30 977.50 978.00 998.00 999.30 1,000.10 6-Month Return Expense Ratio 0.00% (0.16)% (0.13)% (0.13)% 0.00% (0.19)% (0.07)% (0.37)% (0.25)% (0.23)% (0.02)% 0.11% 0.29% 0.17% 0.28% 0.45% 0.03% 0.14% 0.29% (1.64)% (1.78)% 1.17% (0.30)% (0.39)% (2.76)% (2.65)% (2.62)% (10.55)% (10.44)% (2.57)% (2.25)% (2.20)% (0.20)% (0.07)% 0.01% Expenses Paid 0.10% $0.51 0.29% 1.46 0.47% 2.37 0.70% 3.53 0.45% 2.27 0.75% 3.78 0.50% 2.52 0.79% 3.97 0.54% 2.72 0.65% 3.26 1.05% 5.29 0.80% 4.04 0.65% 3.29 0.94% 4.74 0.69% 3.47 0.58% 2.94 1.00% 5.05 0.75% 3.78 0.65% 3.28 0.90% 4.49 0.65% 3.26 0.55% 2.79 0.55% 2.78 0.65% 3.27 1.01% 5.01 0.76% 3.76 0.69% 3.43 1.22% 5.82 0.97% 4.63 1.20% 5.96 0.95% 4.74 0.85% 4.24 1.06% 5.32 0.81% 4.07 0.65% 3.28 Annual Report 137 .
Fund Expenses continued Hypothetical Expenses The table below is provided so that you can compare a Fund’s ongoing expenses with those of another fund. It uses a hypothetical gross annual return of 5%, which is not the Fund’s actual return, and each Fund’s actual expense ratio (184/365 days) for the sixmonth period ended October 31, 2015 to calculate the ongoing expenses paid by a shareholder with an initial investment of $1,000. Value May 1, 2015 Cash Reserves Money Market. . .
. . .
. . .
. . .
. . .
. . .
. . .
. . .
. . .
. . .
. . .
. . .
. . .
. . .
. . .
. . .
. . $1,000.00 Limited Maturity .
. . .
. . .
. . .
. . .
. . .
. . .
. . .
. . .
. . .
. . .
. . .
. . .
. . .
. . .
. . .
. . .
. . .
. . .
. . .
. . .
1,000.00 Low Duration . . .
. . .
. . .
. . .
. . .
. . .
. . .
. . .
. . .
. . .
. . .
. . .
. . .
. . .
. . .
. . .
. . .
. . .
. . .
. . .
. . .
. 1,000.00 U.S. Government Adviser Class .
. . .
. . .
. . .
. . .
. . .
. . .
. . .
. . .
. . .
. . .
. . .
. . .
. . .
. . .
. . .
. 1,000.00 U.S. Government Investor Class .
. . .
. . .
. . .
. . .
. . .
. . .
. . .
. . .
. . .
. . .
. . .
. . .
. . .
. . .
. . .
. 1,000.00 GNMA Adviser Class . .
. . .
. . .
. . .
. . .
. . .
. . .
. . .
. . .
. . .
. . .
. . .
. . .
. . .
. . .
. . .
. . .
. . .
. . .
. 1,000.00 GNMA Investor Class . .
. . .
. . .
. . .
. . .
. . .
. . .
. . .
. . .
. . .
. . .
. . .
. . .
. . .
. . .
. . .
. . .
. . .
. . .
1,000.00 Core Bond Adviser Class . . .
. . .
. . .
. . .
. . .
. . .
. . .
. . .
. . .
. . .
. . .
. . .
. . .
. . .
. . .
. . .
. . .
. . .
1,000.00 Core Bond Investor Class. . .
. . .
. . .
. . .
. . .
. . .
. . .
. . .
. . .
. . .
. . .
. . .
. . .
. . .
. . .
. . .
. . .
. . .
1,000.00 Corporate Bond. . .
. . .
. . .
. . .
. . .
. . .
. . .
. . .
. . .
. . .
. . .
. . .
. . .
. . .
. . .
. . .
. . .
. . .
. . .
. . .
. . .
1,000.00 Strategic Income Adviser Class . . .
. . .
. . .
. . .
. . .
. . .
. . .
. . .
. . .
. . .
. . .
. . .
. . .
. . .
. . .
. . .
1,000.00 Strategic Income Investor Class . . .
. . .
. . .
. . .
. . .
. . .
. . .
. . .
. . .
. . .
. . .
. . .
. . .
. . .
. . .
. . .
1,000.00 Strategic Income SI Class. . .
. . .
. . .
. . .
. . .
. . .
. . .
. . .
. . .
. . .
. . .
. . .
. . .
. . .
. . .
. . .
. . .
. . .
1,000.00 Absolute Return Bond Adviser Class. . .
. . .
. . .
. . .
. . .
. . .
. . .
. . .
. . .
. . .
. . .
. . .
. . .
. . .
. 1,000.00 Absolute Return Bond Investor Class . .
. . .
. . .
. . .
. . .
. . .
. . .
. . .
. . .
. . .
. . .
. . .
. . .
. . .
. 1,000.00 Absolute Return Bond SI Class . .
. . .
. . .
. . .
. . .
. . .
. . .
. . .
. . .
. . .
. . .
. . .
. . .
. . .
. . .
. . .
. 1,000.00 Floating Rate Bond Adviser Class . .
. . .
. . .
. . .
. . .
. . .
. . .
. . .
. . .
. . .
. . .
. . .
. . .
. . .
. . .
. 1,000.00 Floating Rate Bond Investor Class . .
. . .
. . .
. . .
. . .
. . .
. . .
. . .
. . .
. . .
. . .
. . .
. . .
. . .
. . .
. 1,000.00 Floating Rate Bond SI Class . .
. . .
. . .
. . .
. . .
. . .
. . .
. . .
. . .
. . .
. . .
. . .
. . .
. . .
. . .
. . .
. . .
. 1,000.00 High Income Adviser Class. .
. . .
. . .
. . .
. . .
. . .
. . .
. . .
. . .
. . .
. . .
. . .
. . .
. . .
. . .
. . .
. . .
. . 1,000.00 High Income Investor Class .
. . .
. . .
. . .
. . .
. . .
. . .
. . .
. . .
. . .
. . .
. . .
. . .
. . .
. . .
. . .
. . .
. . 1,000.00 California Municipal Income .
. . .
. . .
. . .
. . .
. . .
. . .
. . .
. . .
. . .
. . .
. . .
. . .
. . .
. . .
. . .
. . .
. 1,000.00 Global Low Duration . .
. . .
. . .
. . .
. . .
. . .
. . .
. . .
. . .
. . .
. . .
. . .
. . .
. . .
. . .
. . .
. . .
. . .
. . .
. 1,000.00 Global Fixed Income. .
. . .
. . .
. . .
. . .
. . .
. . .
. . .
. . .
. . .
. . .
. . .
. . .
. . .
. . .
. . .
. . .
. . .
. . .
. . 1,000.00 Emerging Markets Bond Adviser Class.
. . .
. . .
. . .
. . .
. . .
. . .
. . .
. . .
. . .
. . .
. . .
. . .
. . .
. 1,000.00 Emerging Markets Bond Investor Class . .
. . .
. . .
. . .
. . .
. . .
. . .
. . .
. . .
. . .
. . .
. . .
. . .
. . 1,000.00 Emerging Markets Bond SI Class .
. . .
. . .
. . .
. . .
. . .
. . .
. . .
. . .
. . .
. . .
. . .
. . .
. . .
. . .
. . .
1,000.00 Emerging Markets Local Bond Adviser Class . . .
. . .
. . .
. . .
. . .
. . .
. . .
. . .
. . .
. . .
. . .
. . 1,000.00 Emerging Markets Local Bond Investor Class.
. . .
. . .
. . .
. . .
. . .
. . .
. . .
. . .
. . .
. . .
. . .
. 1,000.00 Emerging Markets Corporate Bond Adviser Class. .
. . .
. . .
. . .
. . .
. . .
. . .
. . .
. . .
. . .
. . 1,000.00 Emerging Markets Corporate Bond Investor Class .
. . .
. . .
. . .
. . .
. . .
. . .
. . .
. . .
. . .
. . 1,000.00 Emerging Markets Corporate Bond SI Class .
. . .
. . .
. . .
. . .
. . .
. . .
. . .
. . .
. . .
. . .
. . .
. . 1,000.00 Equity Income Adviser Class .
. . .
. . .
. . .
. . .
. . .
. . .
. . .
. . .
. . .
. . .
. . .
. . .
. . .
. . .
. . .
. . .
. 1,000.00 Equity Income Investor Class. .
. . .
. . .
. . .
. . .
. . .
. . .
. . .
. . .
. . .
. . .
. . .
. . .
. . .
. . .
. . .
. . .
1,000.00 Equity Income SI Class. . .
. . .
. . .
. . .
. . .
. . .
. . .
. . .
. . .
. . .
. . .
. . .
. . .
. . .
. . .
. . .
. . .
. . .
. . 1,000.00 138 Payden Mutual Funds Value October 31, 2015 $1,024.70 1,023.74 1,022.84 1,021.68 1,022.94 1,021.42 1,022.68 1,021.23 1,022.49 1,021.94 1,019.91 1,021.17 1,021.93 1,020.47 1,021.74 1,022.27 1,020.15 1,021.42 1,021.93 1,020.68 1,021.91 1,022.43 1,022.42 1,021.93 1,020.12 1,021.39 1,021.73 1,019.06 1,020.32 1,019.16 1,020.41 1,020.92 1,019.88 1,021.14 1,022.95 6-Month Return 2.47% 2.37% 2.28% 2.17% 2.29% 2.14% 2.27% 2.12% 2.25% 2.19% 1.99% 2.12% 2.19% 2.05% 2.17% 2.23% 2.02% 2.14% 2.19% 2.07% 2.19% 2.24% 2.24% 2.19% 2.01% 2.14% 2.17% 1.91% 2.03% 1.92% 2.04% 2.09% 1.99% 2.11% 2.19% Expense Ratio Expenses Paid 0.10% $0.52 0.29% 1.48 0.47% 2.40 0.70% 3.57 0.45% 2.29 0.75% 3.82 0.50% 2.55 0.79% 4.02 0.54% 2.75 0.65% 3.30 1.05% 5.34 0.80% 4.08 0.65% 3.31 0.94% 4.78 0.69% 3.50 0.58% 2.97 1.00% 5.10 0.75% 3.82 0.65% 3.31 0.90% 4.57 0.65% 3.33 0.55% 2.80 0.55% 2.82 0.65% 3.32 1.01% 5.14 0.76% 3.85 0.69% 3.52 1.22% 6.20 0.97% 4.94 1.20% 6.10 0.95% 4.84 0.85% 4.33 1.06% 5.38 0.81% 4.11 0.65% 3.32 .
Approval of Investment Advisory Agreement 1. Background Among its other duties, the Board of Trustees (the “Board” or the “Trustees”) of The Payden & Rygel Investment Group (the “P&R Trust”) is responsible for determining whether to initially approve, and subsequently annually renew, the investment management agreement (the “Agreement”) between Payden & Rygel (“Adviser”) and the Trust on behalf of each of the eighteen series covered by this Report (each a “Paydenfund” and collectively, the “Paydenfunds”). Under the Agreement, the Adviser is responsible for providing investment advisory services and overseeing the everyday operations and other service providers of the Paydenfunds. Section 15(c) of the Investment Company Act of 1940 (the “1940 Act”) requires that, after an initial period of up to two years, the Agreement for each Paydenfund will remain in effect only if the Board, including a majority of those Trustees who have no direct or indirect interest in the Agreement, and who are not “interested persons” of the Trust, as that term is defined in the 1940 Act (each an “Independent Trustee,” and collectively, “Independent Trustees”), annually renews that Agreement. Six of the Trust’s nine Trustees are deemed to be Independent Trustees for this purpose. On June 16, 2015, the Board of Trustees of the P&R Trust unanimously approved the Agreement between the Adviser and the P&R Trust with respect to seventeen of the Paydenfunds1 for an additional year through June 30, 2016.
The Board approved the Agreement following the recommendation of the Board’s Audit Committee (the “Committee”), which is composed of all of the P&R Trust’s Independent Trustees. In reaching these decisions, the Board took into account information furnished to it throughout the year at meetings of the Board and the Board’s committees, as well as extensive information prepared specifically in connection with the annual renewal process. Determinations by the Independent Trustees also took into account various factors that they believed, in light of the legal advice furnished to them by Paul Hastings LLP (“Paul Hastings”), their independent legal counsel, and their own business judgment, to be relevant. Earlier, on June 17, 2014, the Committee and the Board unanimously approved the Agreement between the Adviser and the P&R Trust with respect to the eighteenth Paydenfund, the Payden Absolute Return Bond Fund, for an initial two-year period.
In considering the approval of the Adviser for this Paydenfund, the Board and Committee considered the same factors discussed below with respect to the renewal of the Agreement for the other seventeen Paydenfunds, i.e., nature, extent and quality of services to be provided, advisory fee comparisons, total expense comparisons, cost and profitability, including economies of scale, and finally other benefits. However, no performance or other portfolio data was provided with respect to the Payden Absolute Return Bond Fund because it did not commence operations until November 6, 2014. 2. Overview of the Approval or Renewal Process In considering the annual renewal with respect to each of the seventeen Paydenfunds listed above in footnote 1, the Board followed its previously established process.
As part of this process, the Board delegates the initial responsibility for this process and related tasks to its Audit Committee (the “Committee”). These tasks include working with the Adviser and Paul Hastings (1) to develop Section 15(c)-related guidelines and specific requests with respect to the type of information to be provided to the Committee and the Board in connection with the proposed contract renewals, and (2) to evaluate the information provided in response to these guidelines and requests. [1] The Paydenfunds covered by this approval are the Payden Cash Reserves Money Market, Payden Limited Maturity, Payden Low Duration, Payden U.S. Government, Payden GNMA, Payden Core Bond, Payden Strategic Income, Payden Corporate Bond, Payden High Income, Payden Floating Rate, Payden California Municipal Income, Payden Global Low Duration, Payden Global Fixed Income, Payden Emerging Markets Bond, Payden Emerging Markets Local Bond, Payden Emerging Markets Corporate Bond and Payden Equity Income Funds. 139 .
Approval of Investment Advisory Agreement continued Consistent with its established process, the P&R Trust retained Lipper, Inc. (“Lipper”) to prepare a report on each Paydenfund to assist the Committee and the Board in its deliberations. Lipper is an independent provider of investment company data that is widely recognized as a leading source of independent data used by independent directors and trustees of investment companies during their advisory contract review processes. Lipper produced, among other information, performance and expense comparison data regarding each Paydenfund, including data relating to each Paydenfund’s advisory fee rates, total expense ratios, short-term and long-term investment performance, and portfolio turnover rates. Lipper also compared much of this data for each Paydenfund against a universe of investment companies and against a more selective peer group of mutual funds with similar investment objectives and strategies, each of which was selected by Lipper, and, in the case of the investment performance data, against one or more appropriate broad-based benchmark indices.
In each case, Lipper summarized the methodologies it employed to provide the data contained in its reports. In addition, Lipper represented to the Board that its reports were designed specifically to provide the Board with the fee, expense and performance information that is necessary to help the Board satisfy its duties under Section 15(c) of the 1940 Act. Lipper also represented that it, and not the Adviser, had identified the selected comparative peer groups and universes, and that it did so in a manner that was not intended to produce biased results for its clients. In advance of the Board meeting held on June 16, 2015, Paul Hastings requested on behalf of the Committee and the Board, and the Adviser provided, extensive information that was designed to assist the Committee and the Board in their consideration of whether to renew the Agreement for each Paydenfund.
In addition to the data provided by Lipper as described above, this information included, but was not limited to, the following: (1) the nature, extent and quality of services provided or to be provided by the Adviser to the Paydenfund; (2) the Paydenfund’s investment performance; (3) the costs of the services provided to the Paydenfund and the profits realized or potential profits to be realized (if any) by the Adviser and its affiliates from their relationship with the Paydenfund; (4) fees charged by other investment advisers; (5) the extent to which economies of scale have been realized or are anticipated to be realized as the Paydenfund grows; (6) whether the fee schedule set forth in the Agreement reflects any such economies of scale for the benefit of Fund investors; (7) comparisons of services and fee rates with any contracts entered into by the Adviser with other clients to whom the Adviser provides comparable services; and (8) any other benefits derived or anticipated to be derived by the Adviser or its affiliates from their relationship with the Paydenfund. As a general matter, the Board viewed these factors in their totality, with no single factor being the principal factor in determining whether to approve or renew the Agreement. In reaching its decisions regarding the renewal of the Agreement for each Paydenfund, the Board took into account the information described above, other information provided to the Board in connection with this process, and relevant information provided to the Board and to its Committees on an ongoing basis in connection with the Board’s general oversight duties with respect to the Paydenfunds. In addition, the Board received and considered information from Paul Hastings as to certain relevant guidelines that relate to the approval or renewal process under Section 15(c) of the 1940 Act.
While the Board considered the Agreement with respect to all Paydenfunds, the Board received and considered fund-specific information and made its approval or renewal determinations on a fund-by-fund basis. In deciding whether to renew the Agreement for each Paydenfund, each Trustee may have accorded different weight to different factors, and thus, each Trustee may have had a different basis for his or her ultimate decision to vote to renew the Agreement for each Paydenfund. At its meeting on June 16, 2015, the Board voted unanimously to renew the Agreement for each Paydenfund listed above.
Set forth below are certain general factors the Board considered for all of the Paydenfunds, followed by a summary of certain specific factors the Board considered for each particular Paydenfund. 3. Nature, Extent and Quality of Services The Board and Committee considered a number of factors related to the services provided by the Adviser, including the breadth and depth of the Adviser’s investment advisory process, the experience, expertise and quality of the Adviser’s investment professionals, the experience, leadership ability and integrity of the Adviser’s senior management, the long tenure of its key personnel, and the overall financial strength, stability and viability of the Adviser. They also considered the Adviser’s ability and commitment to attract and retain qualified personnel, and its commitment to maintain and enhance its investment advisory resources and information technology systems.
The Board and Committee further considered the Adviser’s strong commitment to compliance with applicable laws and 140 . regulations and the nature and extent of its compliance program and records. Finally, they took into account the administrative, distribution and shareholder services that the Adviser or its affiliates provided each Paydenfund under the Agreement and other agreements. Based on the foregoing, the Board and Committee concluded that the investment advisory and related services provided by the Adviser and its affiliates have benefited and should continue to benefit each Paydenfund and its shareholders. 4. Investment Results At its regular quarterly Board meetings during the past year, the Board reviewed the investment results of each Paydenfund compared to its respective peers and benchmark indices, paying specific attention to any Paydenfund whose performance did not measure up to the Adviser’s expectations and to the Adviser’s plan to deal with that situation.
In addition, as a part of the annual review of the Agreement, the Board and Committee specifically reviewed a report prepared by Lipper, which contained each Paydenfund’s performance for various time periods, i.e., 1-year, 3-years, 5-years and 10-years, as compared to the performance of (1) a group of comparable mutual funds (the “Peer Group”) selected by Lipper, and (2) each Paydenfund’s benchmark index. The Board and Committee concluded that overall the short-term and long-term results for each of the seventeen Paydenfunds have been satisfactory and that each of the seventeen Paydenfunds is performing competitively versus its Peer Group and benchmark index. Following the discussion of the performance of the seventeen Paydenfunds, the Board and Committee concluded that the Adviser’s continued management should benefit each Paydenfund and its shareholders. 5.
Advisory Fees and Total Expenses The Board and the Committee reviewed each Paydenfund’s net operating expense ratio and its various fee and expense components, and compared those fees and expenses to the fee and expense information for the Peer Group for each Paydenfund. They observed that the advisory fees and expenses for each Paydenfund continue to be competitive with the advisory fees and expenses of its Peer Group. The Board and Committee also reviewed information regarding the advisory fees paid by other registered investment companies, pension funds and other institutional clients of the Adviser with respect to similar investment mandates as each of the Paydenfunds. They noted that, although the fees paid by those clients generally were lower than those paid by each Paydenfund, the differences appropriately reflected the significant investment, operational and regulatory differences between advising mutual funds and separately managed institutional accounts. Overall, the Board and Committee concluded that each Paydenfund’s cost structure was fair and reasonable in relation to the services provided, and that each Paydenfund’s shareholders received reasonable value in return for the advisory fees and other amounts paid to the Adviser or its affiliates by the Paydenfund. 6.
Adviser Profitability and Indirect Benefits The Board and Committee reviewed information at the P&R Trust level regarding the Adviser’s cost of providing services to the Paydenfunds, as well as the resulting level of profits to the Adviser. They further reviewed the cost allocation methodology used to determine the Adviser’s profitability of providing services to the Paydenfunds, as well as possible economies of scale that might be achieved. Based on that review, the Board and Committee concluded that the profits earned by the Adviser were not excessive in view of the advisory, administrative and other services provided to the Paydenfunds.
Finally, the Board and Committee noted that the Adviser indirectly benefited from its advisory relationship with the Paydenfunds by its ability to invest more efficiently the assets of small, separately managed accounts in the Paydenfunds, and because the availability of the Paydenfunds enhanced the Adviser’s business reputation and name recognition. 7. Fund-by-Fund Factors The Board considered the following specific factors (among others) in connection with its determination to renew the Agreement with respect to each Paydenfund. If a Paydenfund is described in the following discussions as being in the “1st” quintile, it is in the best of five groups (that is, the group has the best performance or the lowest expenses, as the case may be).
References below to quintiles are based on data provided to the Board in the reports prepared by Lipper. The specific management fee, expense and performance factors outlined below are based on the Investor Class shares of each Paydenfund. Because the Investor Class generally has lower nonmanagement expenses than the Adviser Class of these Funds, the expenses and performance of the Adviser Class will differ from the expenses and performance shown for the Investor Class.
All time periods referenced below ended as of April 30, 2015. 141 . Approval of Investment Advisory Agreement continued Cash Reserves Money Market Fund • Adviser Fee: The Adviser’s annual contractual management fee rate for the Fund is 0.15%, placing it in the 2nd quintile of the group of comparable funds for adviser fees. • Total Expenses: The Fund’s total expenses were in the 1st quintile of the group of comparable funds selected by Lipper for expense comparison purposes. The Adviser has contractually agreed to waive its investment advisory fee or reimburse Fund expenses to the extent that Total Annual Fund Operating Expenses After Fee Waiver or Expense Reimbursement exceed 0.25%. This agreement has a one-year term ending February 28, 2016. It may or may not be renewed. • Performance: The Fund was in the 1st quintile of the group of comparable funds in the one-, five- and ten-year periods, and in the 2nd quintile for the 3-year period. Limited Maturity Fund • Adviser Fee: The Adviser’s annual contractual management fee rate for the Fund is 0.28%, placing it in the 4th quintile of the group of comparable funds for adviser fees. • Total Expenses: The Fund’s total expenses were in the 2nd quintile of the group of comparable funds.
The Adviser has contractually agreed to waive its investment advisory fee or reimburse Fund expenses to the extent that Total Annual Fund Operating Expenses After Fee Waiver or Expense Reimbursement exceed 0.29%. This agreement has a one-year term ending February 28, 2016. It may or may not be renewed. • Performance: The Fund was in the 1st quintile of the group of comparable funds for the one-year period, the 2nd quintile for the three-year period, the 3rd quintile for the five-year period, and the 5th quintile for the ten-year period. Low Duration Fund • Adviser Fee: The Adviser’s annual contractual management fee rate for the Fund is 0.28%, placing it in the 4th quintile of the group of comparable funds for adviser fees. • Total Expenses: The Fund’s total expenses were in the 2nd quintile of the group of comparable funds.
The Adviser has contractually agreed to waive its investment advisory fee or reimburse Fund expenses to the extent that Total Annual Fund Operating Expenses After Fee Waiver or Expense Reimbursement exceed 0.47%. This agreement has a one-year term ending February 28, 2016. It may or may not be renewed. • Performance: The Fund was in the 2nd quintile of the group of comparable funds for the one-, three- and ten-year periods, and the 3rd quintile for the five-year period. U.S.
Government Fund • Adviser Fee: The Adviser’s annual contractual management fee rate for the Fund is 0.28%, placing it in the 3rd quintile of the group of comparable funds for adviser fees.. • Total Expenses: The Fund’s total expenses were in the 1st quintile of the group of comparable funds. The Adviser has contractually agreed to waive its investment advisory fee or reimburse Fund expenses to the extent that Total Annual Fund Operating Expenses After Fee Waiver or Expense Reimbursement exceed 0.45%. This agreement has a one-year term ending February 28, 2016.
It may or may not be renewed. • Performance: The Fund was in the 1st quintile of the group of comparable funds for the one- and three-year periods, and the 2nd quintile for the five- and ten-year periods. 142 . GNMA Fund • Adviser Fee: The Adviser’s annual contractual management fee rate for the Fund is 0.27%, placing it in the 2nd quintile of the group of comparable funds for adviser fees.. • Total Expenses: The Fund’s total expenses were in the 1st quintile of the group of comparable funds. The Adviser has contractually agreed that for so long as it is the investment adviser to the Fund, the Total Annual Fund Operating Expenses will not exceed 0.50%. • Performance: The Fund was in the 1st quintile of the group of comparable funds for the one- and five-year periods, and the 2nd quintile for the three- and ten-year periods.. Core Bond Fund • Adviser Fee: The Adviser’s annual contractual management fee rate for the Fund is 0.28%, placing it in the 2nd quintile of the group of comparable funds for adviser fees. • Total Expenses: The Fund’s total expenses were in the 2nd quintile of the group of comparable funds. • Performance: The Fund was in the 1st quintile of the group of comparable funds for the one- and three-year periods, and the 2nd quintile for the five- and ten-year periods. Strategic Income Fund • Adviser Fee: The Adviser’s annual contractual management fee rate for the Fund is 0.55%, placing it in the 1st quintile of the group of comparable funds for adviser fees. • Total Expenses: The Fund’s total expenses were in the 1st quintile of the group of comparable funds. • Performance: The Fund was in the 2nd quintile of the group of comparable funds for the one-year period. The Fund began operations on May 8, 2014. Corporate Bond Fund • Adviser Fee: The Adviser’s annual contractual management fee rate for the Fund is 0.35%, placing it in the 2nd quintile of the Expense Group for adviser fees. • Total Expenses: The Fund’s total expenses were in the 3rd quintile of the Expense Group. The Adviser has contractually agreed to waive its investment advisory fee or reimburse Fund expenses to the extent that Total Annual Fund Operating Expenses After Fee Waiver or Expense Reimbursement exceed 0.67%.
This agreement has a one-year term ending February 28, 2016. It may or may not be renewed. • Performance: The Fund was in the 1st quintile of the Performance Group for the one- and 3-year periods, and the 2nd quintile for the for five-year period. The Fund began operations on March 12, 2009. High Income Fund • Adviser Fee: The Adviser’s annual contractual management fee rate for the Fund is 0.35%, placing it in the 2nd quintile of the group of comparable funds for adviser fees. •Total Expenses: The Fund’s total expenses were in the 2nd quintile of the group of comparable funds. • Performance: The Fund was in the 2nd quintile of the group of comparable funds for the one-year period, 4th quintile for the threeyear, 3rd quintile for the five-year period, and the 5th quintile for the ten-year period. 143 .
Approval of Investment Advisory Agreement continued Floating Rate Fund • Adviser Fee: The Adviser’s annual contractual management fee rate for the Fund is 0.55%, placing it in the 3rd quintile of the group of comparable funds for adviser fees. • Total Expenses: The Fund’s total expenses were in the 3rd quintile of the group of comparable funds. The Adviser has contractually agreed to waive its investment advisory fee or reimburse Fund expenses to the extent that Total Annual Fund Operating Expenses After Fee Waiver or Expense Reimbursement exceed 0.75%. This agreement has a one-year term ending February 28, 2016. It may or may not be renewed. • Performance: The Fund was in the 1st quintile of the group of comparable funds for the one-year period.
It began operations on November 11, 2013. California Municipal Income Fund • Adviser Fee: The Adviser’s annual contractual management fee rate for the Fund is 0.32%, placing it in the 3rd quintile of the Expense Group for adviser fees. • Total Expenses: The Fund’s total expenses were in the 4th quintile of the group of comparable funds. The Adviser has contractually agreed to waive its investment advisory fee or reimburse Fund expenses to the extent that Total Annual Fund Operating Expenses After Fee Waiver or Expense Reimbursement exceed 0.55%. This agreement has a one-year term ending February 28, 2016.
It may or may not be renewed. • Performance: The Fund was in the 3rd quintile of the group of comparable funds for the one-, five- and 10-year periods, and the 2nd quintile for the three-year period. Global Low Duration Fund • Adviser Fee: The Adviser’s annual contractual management fee rate for the Fund is 0.30%, placing it in the 3rd quintile of the group of comparable funds for adviser fees. • Total Expenses: The Fund’s total expenses were in the 1st quintile of the group of comparable funds. The Adviser has contractually agreed to waive its investment advisory fee or reimburse Fund expenses to the extent that Total Annual Fund Operating Expenses After Fee Waiver or Expense Reimbursement exceed 0.55%. This agreement has a one-year term ending February 28, 2016.
It may or may not be renewed. • Performance: The Fund was in the 2nd quintile of the group of comparable funds for the 1-year period, the 3rd quintile for the three-year period, the 4th quintile for the five-year period, and the 5th quintile for the and ten-year period. Global Fixed Income Fund • Adviser Fee: The Adviser’s annual contractual management fee rate for the Fund is 0.30%, placing it in the 1st quintile of the group of comparable funds for adviser fees. • Total Expenses: The Fund’s total expenses were in the 2nd quintile of the group of comparable funds. The Adviser has contractually agreed that for so long as it is the investment adviser to the Fund, the Total Annual Fund Operating Expenses will not exceed 0.85%. In addition, the Adviser has contractually agreed to waive its investment advisory fee or reimburse Fund expenses to the extent that Total Annual Fund Operating Expenses After Fee Waiver or Expense Reimbursement exceed 0.80%. This agreement has a one-year term ending February 28, 2016.
It may or may not be renewed. • Performance: The Fund was in the 1st quintile of the group of comparable funds for the one- and three-year periods, and the 2nd quintile for the Five- and ten-year periods. 144 . Emerging Markets Bond Fund • Adviser Fee: The Adviser’s annual contractual management fee rate for the Fund is 0.45%, placing it in the 1st quintile of the group of comparable funds for adviser fees. • Total Expenses: The Fund’s total expenses were in the 1st quintile of the group of comparable funds. • Performance: The Fund was in the 1st quintile of the group of comparable funds for the one-year period, and the 2nd quintile for the three-, five- and the ten-year periods. Emerging Markets Local Bond Fund • Adviser Fee: The Adviser’s annual contractual management fee rate for the Fund is 0.60%, placing it in the 3rd quintile of the group of comparable funds for adviser fees. • Total Expenses: The Fund’s total expenses were in the 2nd quintile of the group of comparable funds. • Performance: The Fund was in the 3rd quintile of the group of comparable funds for the one-year period, and the 4th quintile for the three-year period. The Fund began operations on November 2, 2011. Emerging Markets Corporate Bond Fund • Adviser Fee: The Adviser’s annual contractual management fee rate for the Fund is 0.80%, placing it in the 5th quintile of the group of comparable funds for adviser fees. • Total Expenses: The Fund’s total expenses were in the 3rd quintile of the group of comparable funds. The Adviser has contractually agreed to waive its investment advisory fee or reimburse Fund expenses to the extent that Total Annual Fund Operating Expenses After Fee Waiver or Expense Reimbursement exceed 0.95%. This agreement has a one-year term ending February 28, 2016.
It may or may not be renewed. • Performance: The Fund was in the 1st quintile of the group of comparable funds for the one-year period. It began operations on November 11, 2013. Equity Income Fund • Adviser Fee: The Adviser’s annual contractual management fee rate for the Fund is 0.50%, placing it in the 2nd quintile of the group of comparable funds for adviser fees. • Total Expenses: The Fund’s total expenses were in the 2nd quintile of the group of comparable funds. The Adviser has contractually agreed that for so long as it is the investment adviser to the Fund, the Total Annual Fund Operating Expenses will not exceed 0.80%. • Performance: The Fund was in the 1st quintile of the group of comparable funds for the one- and five-year periods, the 3rd quintile for the three-year period, and the 5th quintile for the ten-year period. 145 .
Trustees and Officers Position with Fund Year Elected W. D. Hilton, Jr. Independent Trustee 1993 President and CEO, Trust Service, Inc.; Executive Director, NGC Bodily Injury Trust; and Managing Trustee, Fuller-Austin Trust Thomas V. McKernan, Jr. Independent Trustee 1993 Chairman, Automobile Club of Southern California Rosemarie T.
Nassif Independent Trustee 2008 President Emerita, Holy Names University; Program Director, Conrad Hilton Foundation Andrew J. Policano Independent Trustee 2008 Dean Emeritus and Dean’s Leadership Circle, Professor, The Paul Merage School of Business, University of California, Irvine Dennis C. Poulsen Independent Trustee 1992 Chairman of the Advisory Board, Rose Hills Company Stender E.
Sweeney Independent Trustee 1992 Private Investor Joan A. Payden Interested Trustee 1992 President, CEO and Director, Payden & Rygel Michael E. Salvay Interested Trustee 2009 Managing Principal, Payden & Rygel Mary Beth Syal Interested Trustee 2000 Managing Principal and Director, Payden & Rygel Chairman and CEO 1992 President, CEO and Director, Payden & Rygel Vice President and CFO 2003 Managing Principal, CFO and Director, Payden & Rygel Yot Chattrabhuti Vice President 1997 Principal, Payden & Rygel Bradley F.
Hersh Vice President and Treasurer 1998 Principal and Treasurer, Payden & Rygel David L. Wagner Vice President and CCO 1996 Senior Vice President, Risk Management, Payden & Rygel Edward S. Garlock Secretary 1997 Managing Principal, General Counsel and Director, Payden & Rygel Name & Address Principal Occupation(s) Other Directorships Held 333 S.
Grand Avenue Los Angeles, CA 90071 Trustees (1) Officers (2) Joan A. Payden Brian W. Matthews Additional information about the Trustees can be found in the SAI. (1) Trustees do not have a set term of office, but serve until their resignation, death or removal. (2) Officers are elected by, and serve at the pleasure of, The Board of Trustees. 146 Payden Mutual Funds Director, Badger Meter, Inc.; Director, Rockwell Collins Director, Avis Budget Group, Inc. .
IMPORTANT INFORMATION: The information contained in this report is intended for shareholders of the Payden Mutual Funds only. It is not authorized for distribution to prospective investors unless accompanied or preceded by a current prospectus which provides further details. The performance numbers presented in this report are derived from historical market data. There is no guarantee of future performance nor are Fund shares guaranteed. Investment return and principal value of an investment in a Fund will fluctuate so that an investor’s shares, when redeemed, may be worth more or less than original cost. Fund shares are sold through Payden & Rygel Distributors, member FINRA. The Fund files its complete schedule of portfolio holdings with the Securities and Exchange Commission (SEC) for the first and third quarters of each fiscal year on Form N-Q.
Forms N-Q are available on the SEC’s web site at http://www.sec.gov or the Fund’s Forms N-Q may be reviewed and copied at the SEC’s Public Reference Room in Washington D.C. Information regarding the operation of the SEC’s Public Reference Room may be obtained by calling 1-800 SEC-0330. To view the Fund’s proxy voting guidelines and proxy voting record, visit the SEC’s web site at http://www.sec.gov. You may also call 800 5729336 to request a free copy of the proxy voting guidelines. .
» U.S. BOND FUNDS Payden Cash Reserves Money Market Fund (PBHXX) Payden Limited Maturity Fund (PYLMX) Payden Low Duration Fund (PYSBX) Payden U.S. Government Fund — Adviser Class (PYUWX) Payden U.S. Government Fund — Investor Class (PYUSX) Payden GNMA Fund — Adviser Class (PYGWX) Payden GNMA Fund — Investor Class (PYGNX) Payden Core Bond Fund — Adviser Class (PYCWX) Payden Core Bond Fund — Investor Class (PYCBX) Payden Corporate Bond Fund (PYACX) Payden Strategic Income — Adviser Class (PYSWX) Payden Strategic Income — Investor Class (PYSGX) Payden Strategic Income — SI Class (PYSIX) Payden Absolute Return Bond Fund — Adviser Class (PYAWX) Payden Absolute Return Bond Fund — Investor Class (PYARX) Payden Absolute Return Bond Fund — SI Class (PYAIX) Payden Floating Rate Fund — Adviser Class (PYFAX) Payden Floating Rate Fund — Investor Class (PYFRX) Payden Floating Rate Fund — SI (PYFIX) Payden High Income Fund — Adviser Class (PYHWX) Payden High Income Fund — Investor Class (PYHRX) » TAX EXEMPT BOND FUND Payden California Municipal Income Fund (PYCRX) » GLOBAL BOND FUNDS Payden Global Low Duration Fund (PYGSX) Payden Global Fixed Income Fund (PYGFX) Payden Emerging Markets Bond Fund — Adviser Class (PYEWX) Payden Emerging Markets Bond Fund — Investor Class (PYEMX) Payden Emerging Markets Bond Fund — SI Class (PYEIX) Payden Emerging Markets Local Bond Fund — Adviser Class (PYEAX) Payden Emerging Markets Local Bond Fund — Investor Class (PYELX) Payden Emerging Markets Corporate Bond Fund — Adviser Class (PYCAX) Payden Emerging Markets Corporate Bond Fund — Investor Class (PYCEX) Payden Emerging Markets Corporate Bond Fund — SI Class (PYCIX) » EQUITY FUND Payden Equity Income Fund — Adviser Class (PYVAX) Payden Equity Income Fund — Investor Class (PYVLX) Payden Equity Income Fund — SI Class (PYVSX) PAYDEN MUTUAL FUNDS 333 South Grand Avenue, Los Angeles, California 90071 800 5-PAYDEN 800 572-9336 payden.com .


