


Description
OBSERVATIONS ON THE
MUNI°BITES
MUNICIPAL BOND MARKET
JULY 2014
MARKET COLOR
»» Technical factors in the municipal market weakened slightly over the course of June as supply strengthened to $34 billion, bringing the yearto-date total issuance to about $150 billion, or 15% lower than last year. We continue to see net issuance near zero due to strong bond
redemptions in June and July.
»» Municipal credit dominated headlines as Puerto Rico proposed and signed the Puerto Rico Public Corporations Debt Enforcement and Recovery
Act, providing a clear path for certain public corporations to negotiate debt terms with bondholders or restructure debt with the approval of the
local court. In response, Moody’s issued multi-level credit downgrades to numerous Puerto Rico credits. The Commonwealth’s GO’s are now rated
B2.
»» The municipal market posted modest total return gains in June as the Barclays Municipal Bond Index returned 0.09% with year-to-date returns of
6.00%.
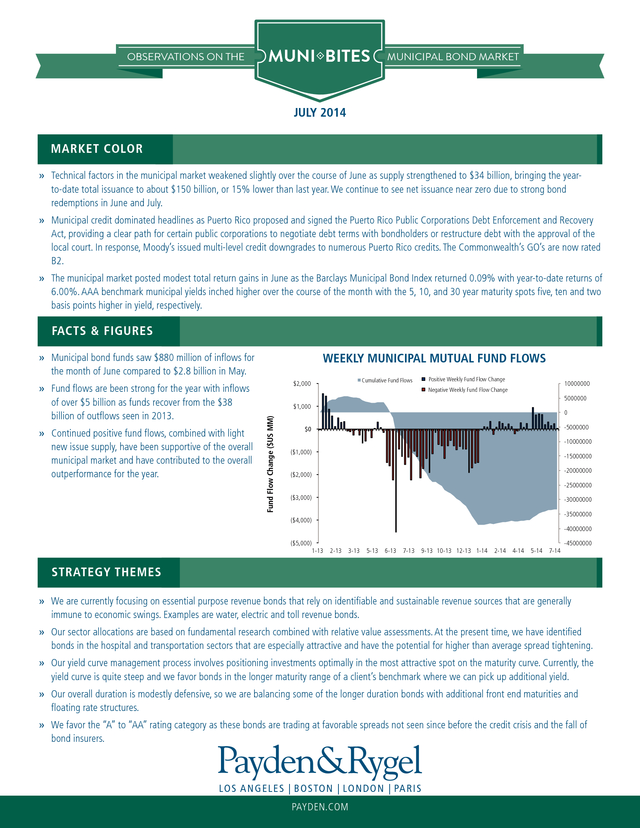
AAA benchmark municipal yields inched higher over the course of the month with the 5, 10, and 30 year maturity spots five, ten and two basis points higher in yield, respectively. FACTS & FIGURES Weekly Municipal Mutual Fund Flows WEEKLY MUNICIPAL MUTUAL FUND FLOWS »» Municipal bond funds saw $880 million of inflows for the month of June compared to $2.8 billion in May. »» Continued positive fund flows, combined with light new issue supply, have been supportive of the overall municipal market and have contributed to the overall outperformance for the year. $2,000 Cumulative Fund Flows Positive Weekly Fund Flow Change Negative Weekly Fund Flow Change 10000000 5000000 $1,000 Fund Flow Change ($US MM) »» Fund flows are been strong for the year with inflows of over $5 billion as funds recover from the $38 billion of outflows seen in 2013. $0 0 -5000000 -10000000 ($1,000) ($2,000) -15000000 -20000000 -25000000 ($3,000) ($4,000) -30000000 -35000000 -40000000 ($5,000) -45000000 1-13 2-13 3-13 5-13 6-13 7-13 9-13 10-13 12-13 1-14 2-14 4-14 5-14 7-14 STRATEGY THEMES »» We are currently focusing on essential purpose revenue bonds that rely on identifiable and sustainable revenue sources that are generally immune to economic swings. Examples are water, electric and toll revenue bonds. »» Our sector allocations are based on fundamental research combined with relative value assessments. At the present time, we have identified bonds in the hospital and transportation sectors that are especially attractive and have the potential for higher than average spread tightening. »» Our yield curve management process involves positioning investments optimally in the most attractive spot on the maturity curve.
Currently, the yield curve is quite steep and we favor bonds in the longer maturity range of a client’s benchmark where we can pick up additional yield. »» Our overall duration is modestly defensive, so we are balancing some of the longer duration bonds with additional front end maturities and floating rate structures. »» We favor the “A” to “AA” rating category as these bonds are trading at favorable spreads not seen since before the credit crisis and the fall of bond insurers. LOS ANGE LES | BOSTON | LONDON | PARIS PAYDEN.COM . OBSERVATIONS ON THE MUNI°BITES MUNICIPAL BOND MARKET JULY 2014 CHART OF THE MONTH HOLDERS OF MUNICIPAL BONDS IN $ TRILLIONS, 2013 DATA Insurance Companies 467.4 13% Other 126.7 3% Individuals 1,617.2 44% Banking Institutions 443.2 12% Mutual Funds 1,016.8 28% »» Individuals dominate the municipal market, representing well over half of all holders of municipal bonds as of 2013. »» Unique opportunities arise as many individual investors “follow the herd”. Disciplined investors can take advantage of market mispricing when most other investors are exhibiting similar behavior and avoiding underpriced (or seeking overpriced) securities. LOS ANGE LES | BOSTON | LONDON | PARIS PAYDEN.COM .


