


Description
PAYDEN GLOBAL FUNDS PUBLIC LIMITED COMPANY
(an umbrella fund with segregated liability between sub-funds)
INTERIM REPORT AND UNAUDITED CONDENSED FINANCIAL STATEMENTS
FOR THE PERIOD ENDED 30 JUNE 2015
. PAYDEN GLOBAL FUNDS PUBLIC LIMITED COMPANY
TABLE OF CONTENTS
PAGE
Directors and Other Information
2
Half – Yearly Management Report
4
Investment Manager's Report
5
Schedule of Investments
16
Condensed Profit and Loss Account
83
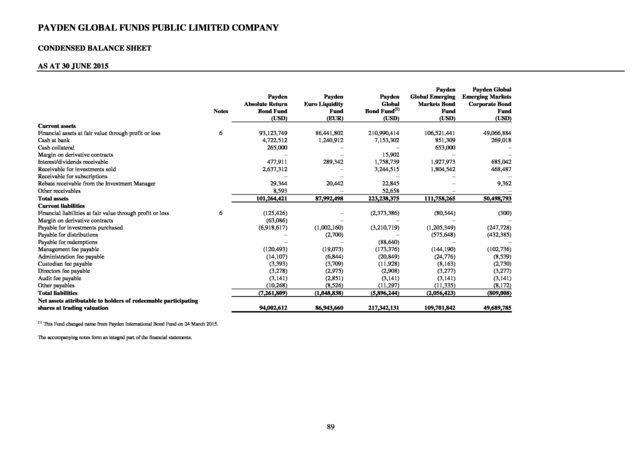
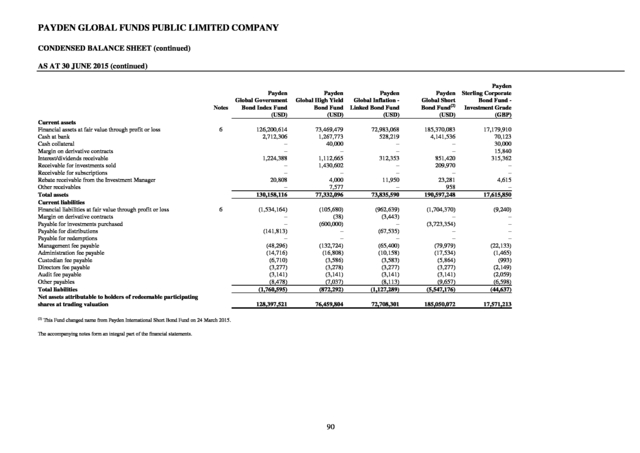
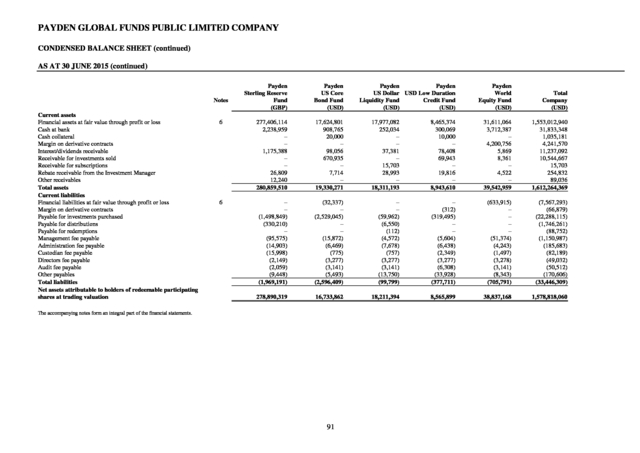
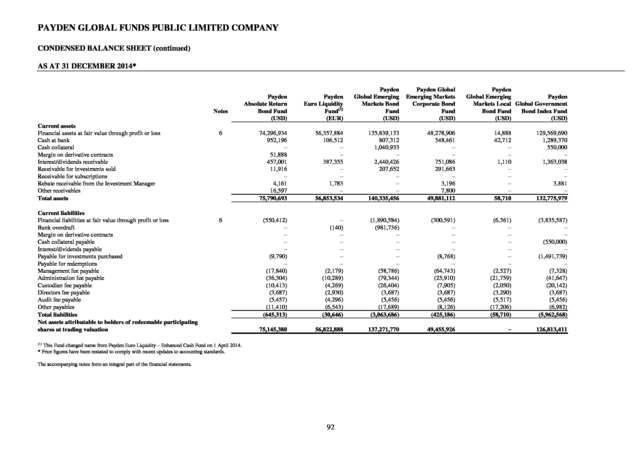
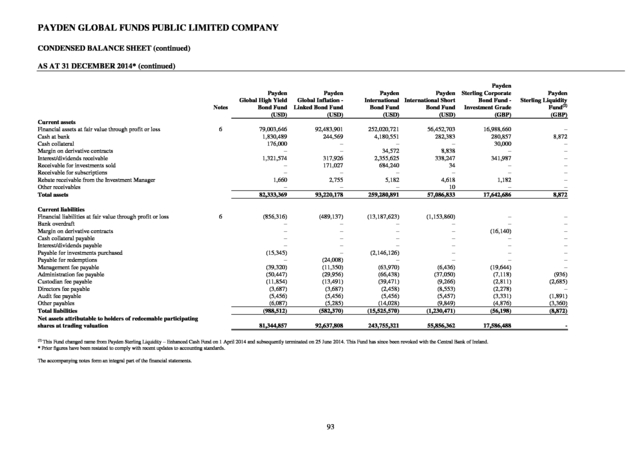
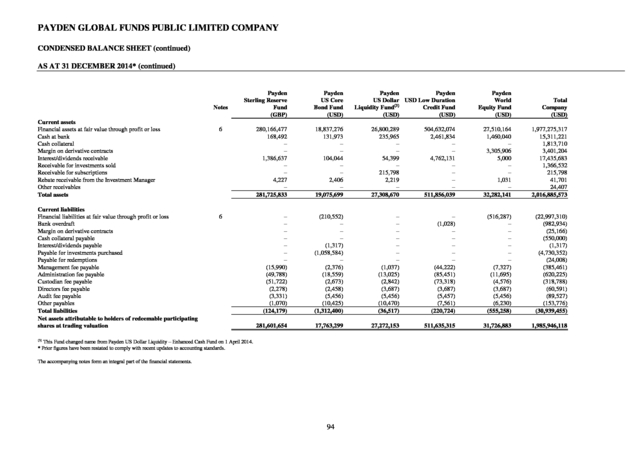
Condensed Balance Sheet
89
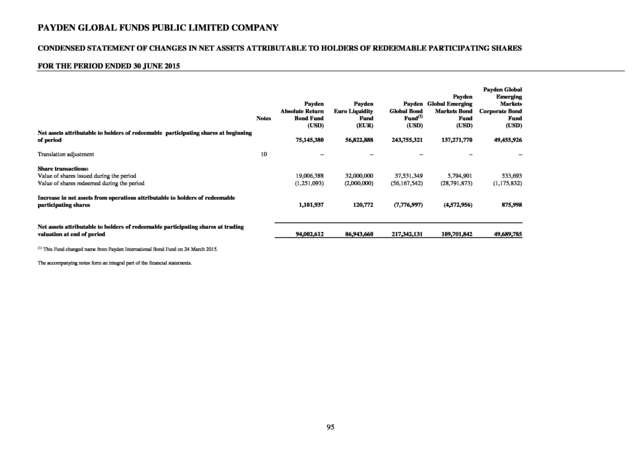
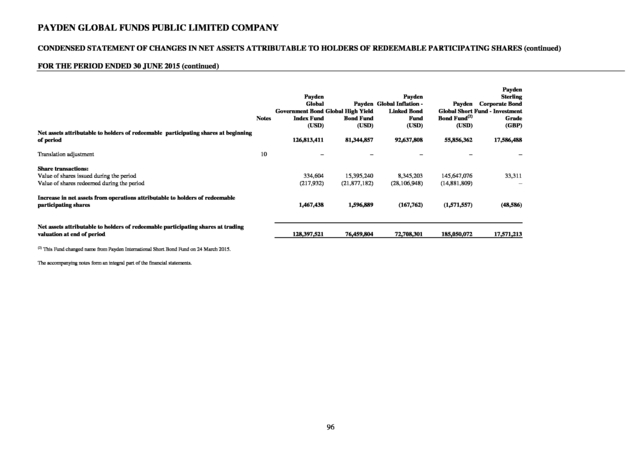
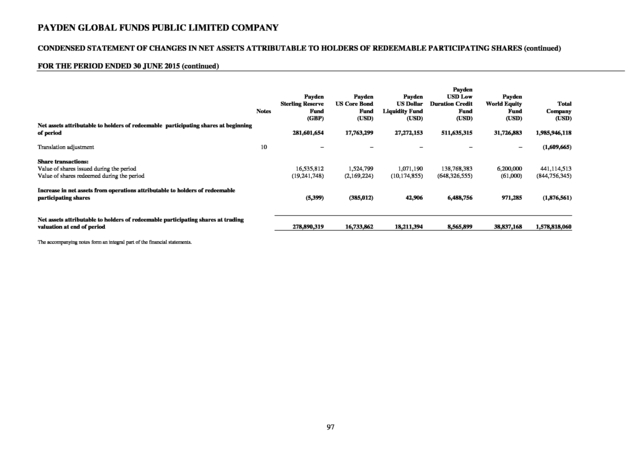
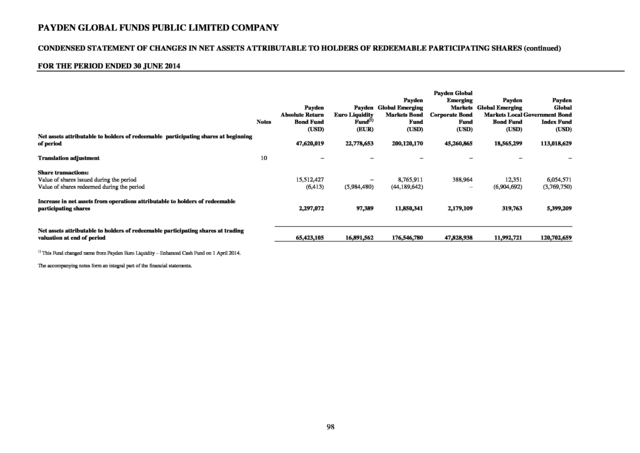
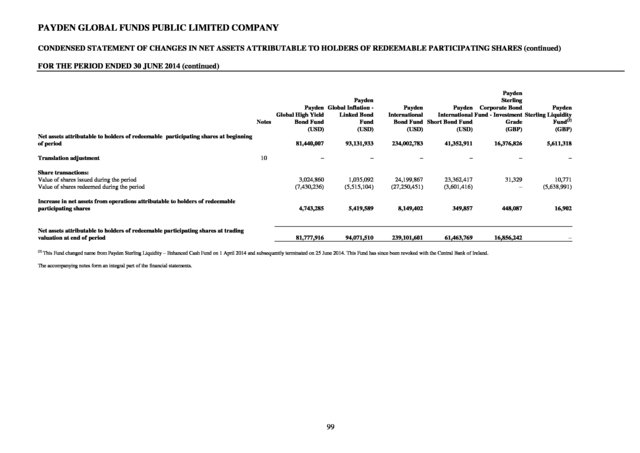
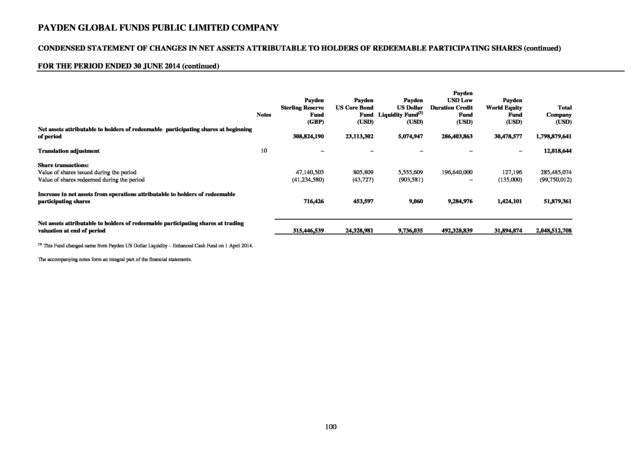
Condensed Statement of Changes in Net Assets Attributable to Holders of Redeemable Participating Shares
95
Notes to the Condensed Financial Statements
101
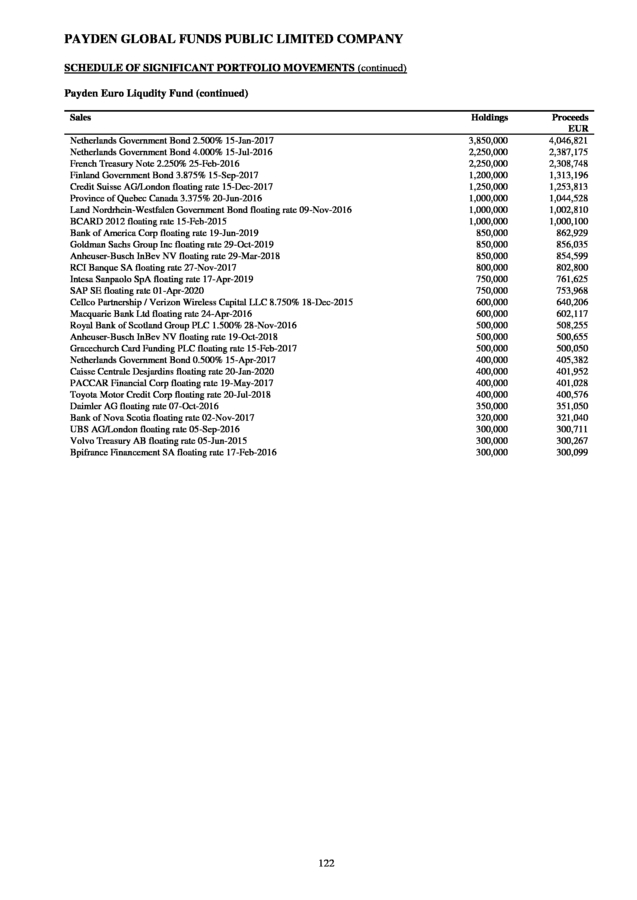
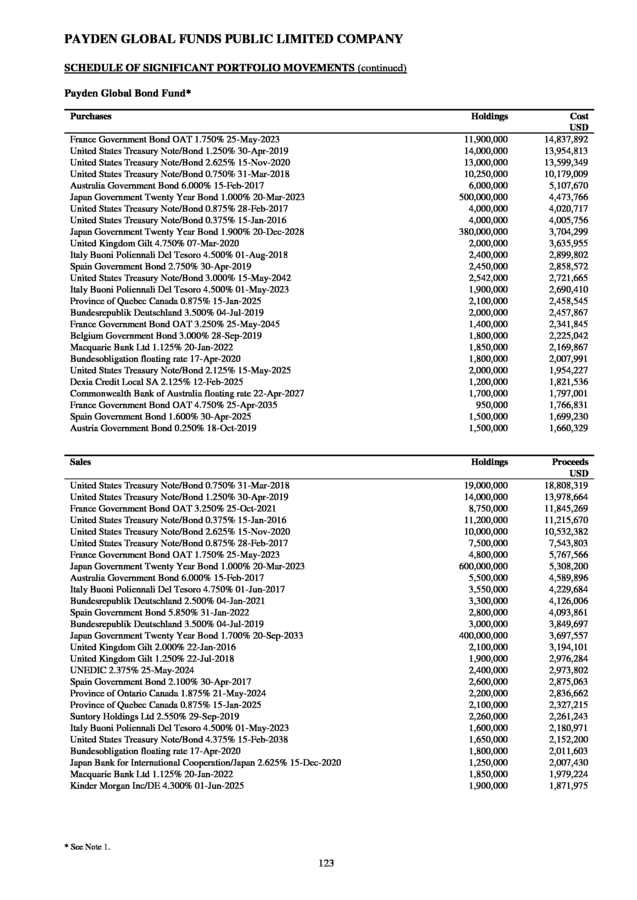
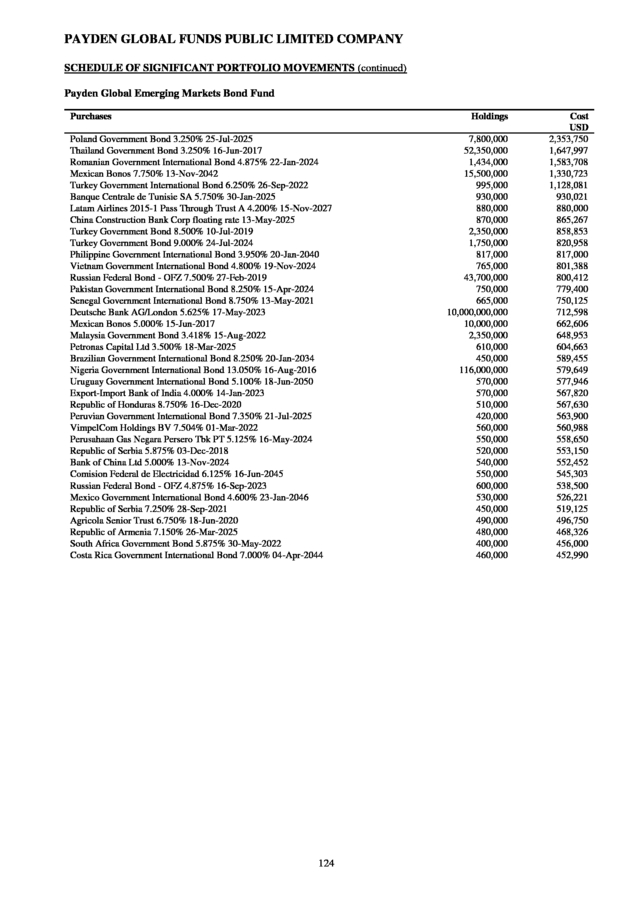
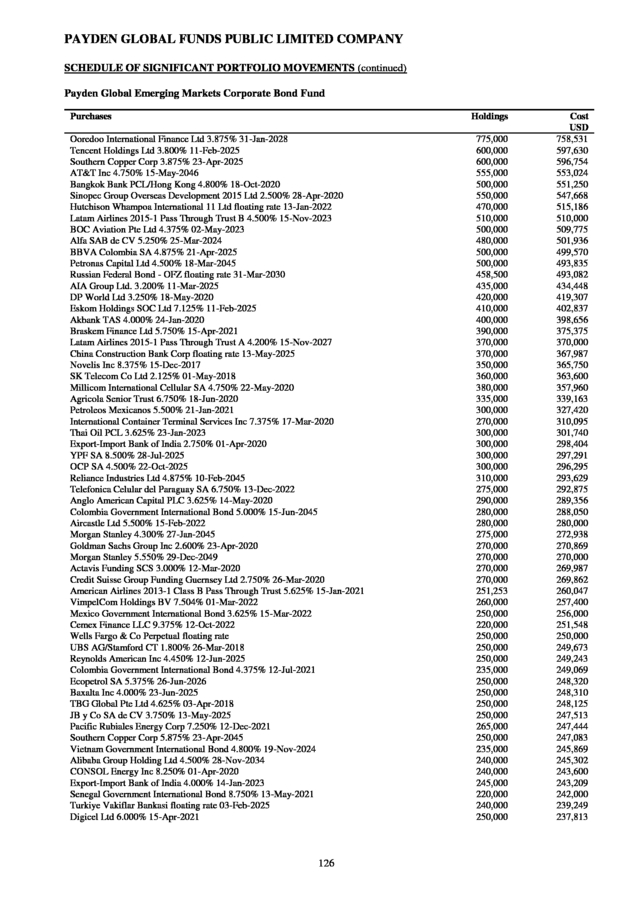
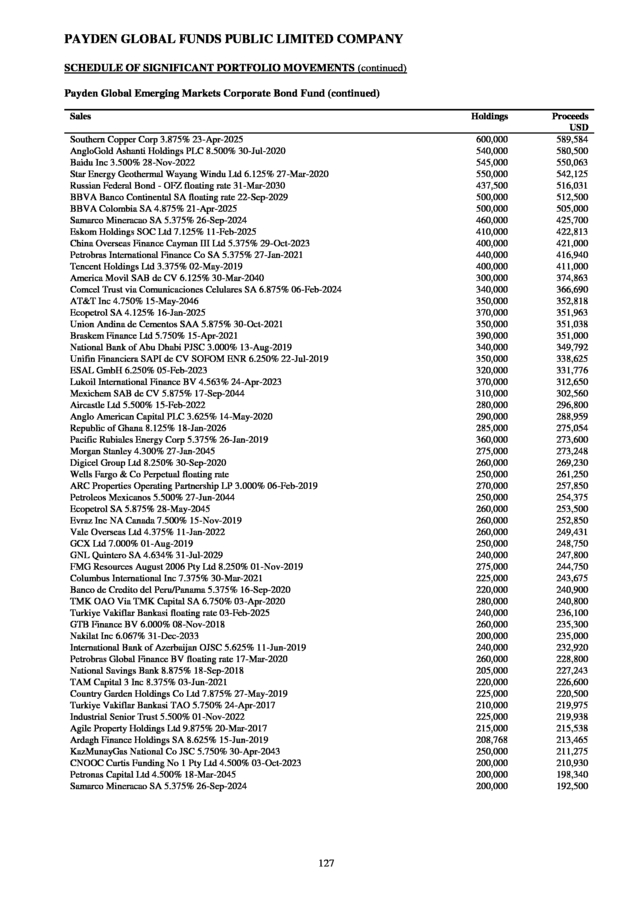
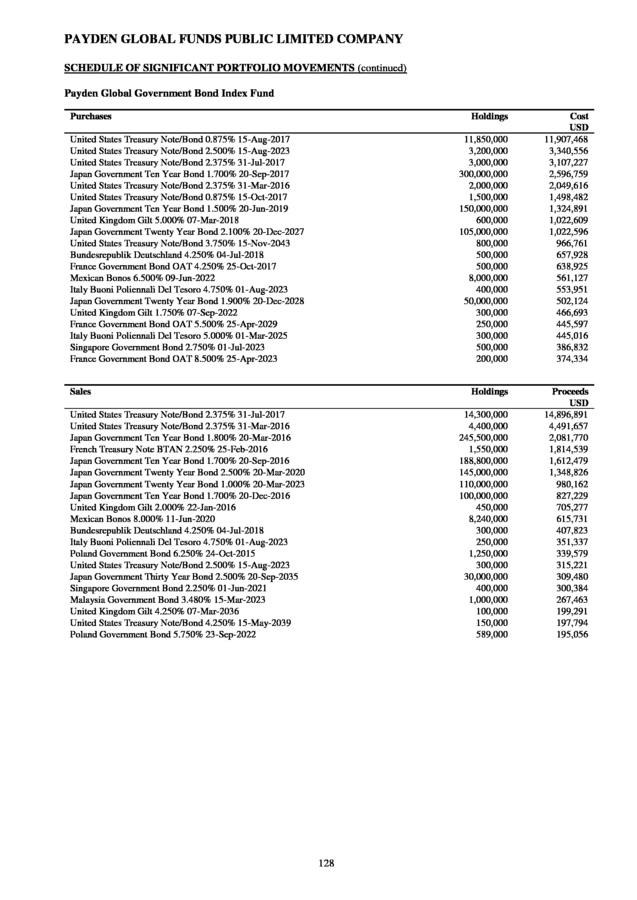
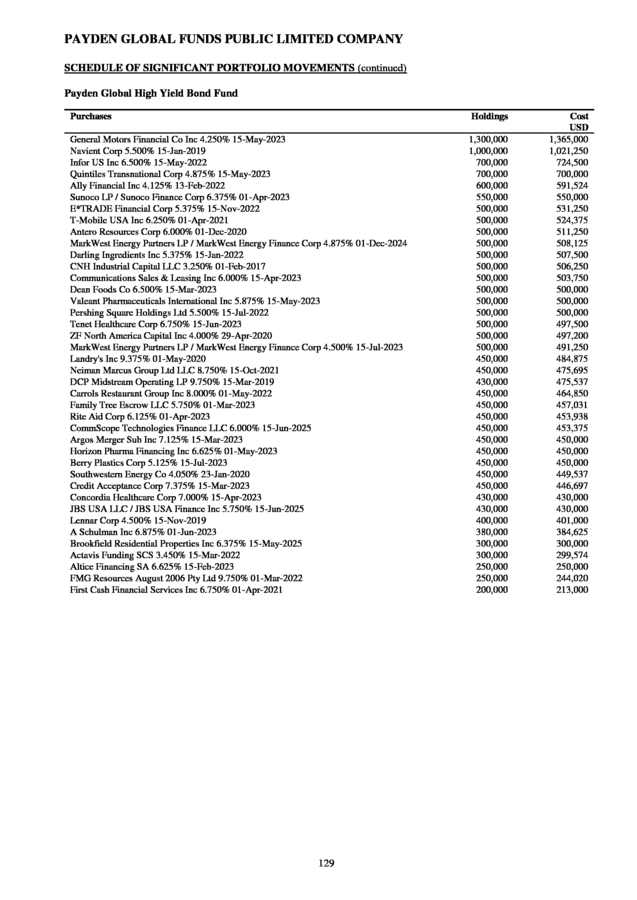
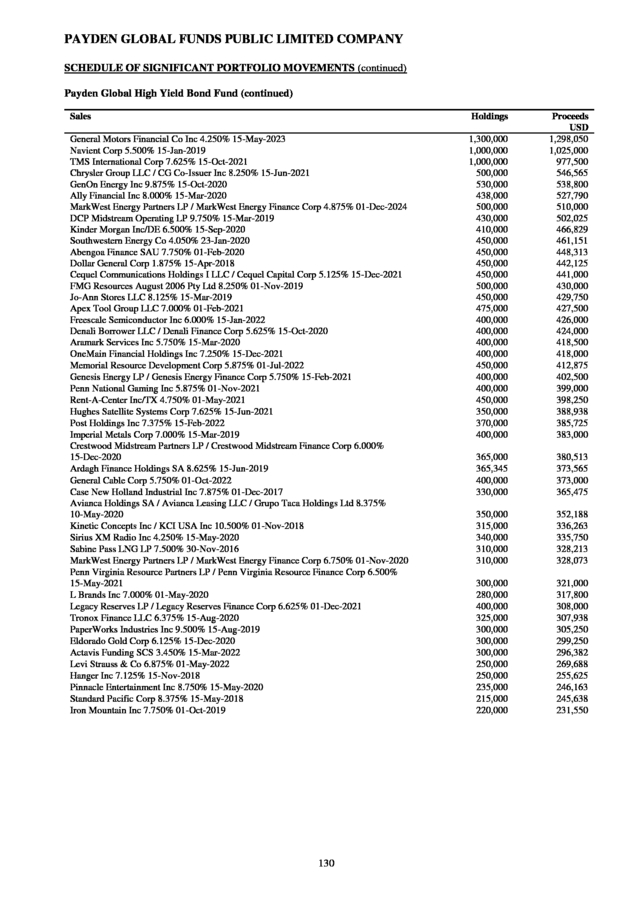
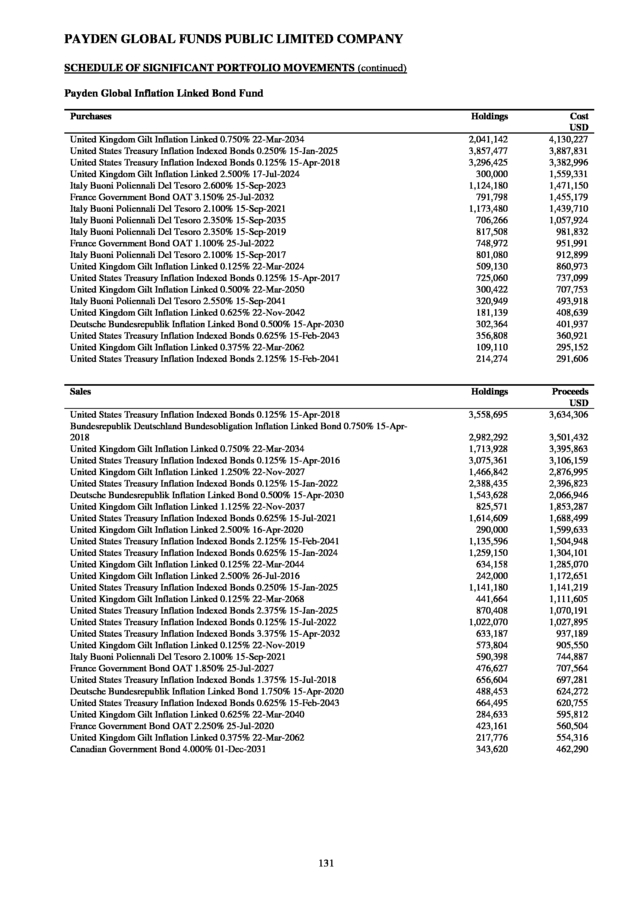
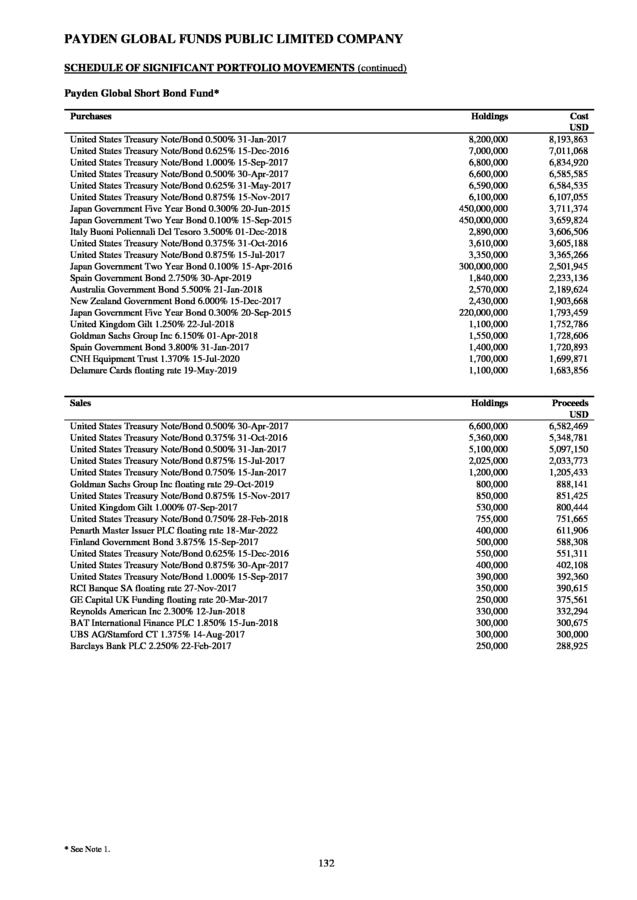
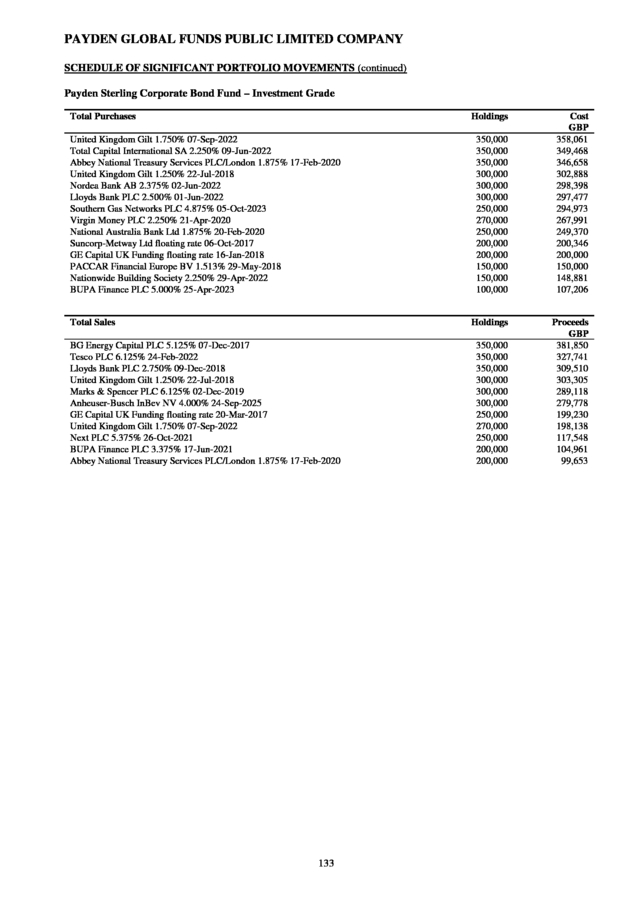
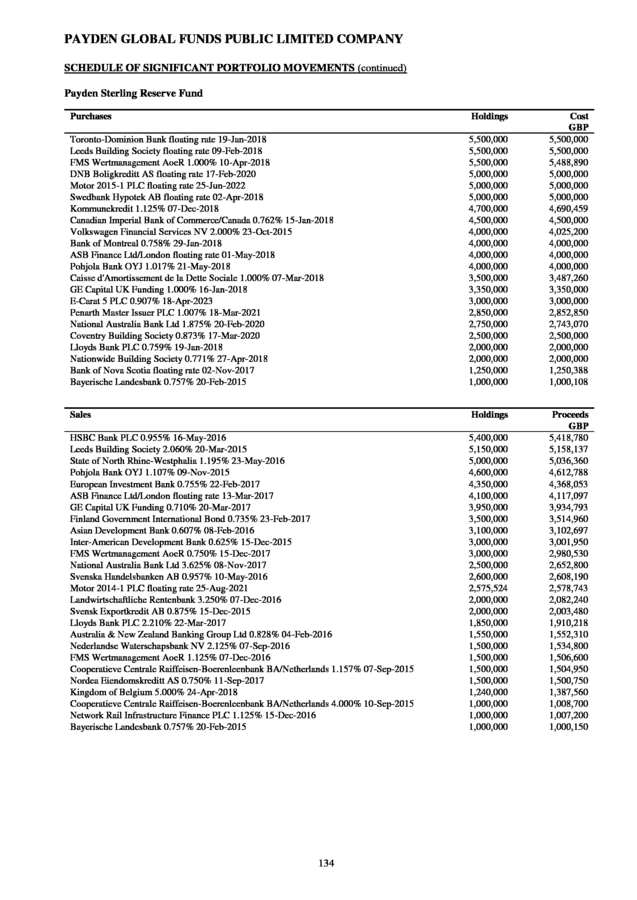
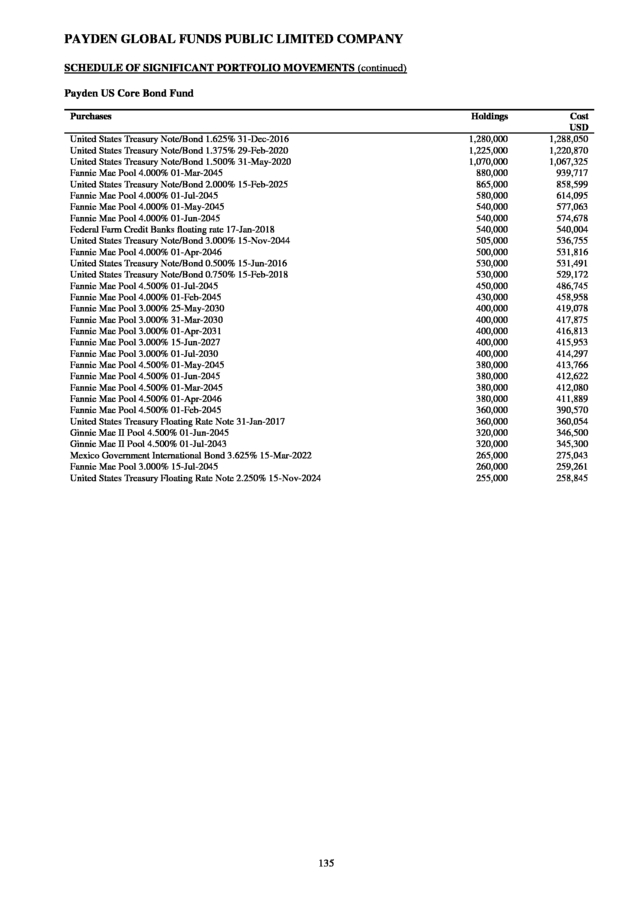
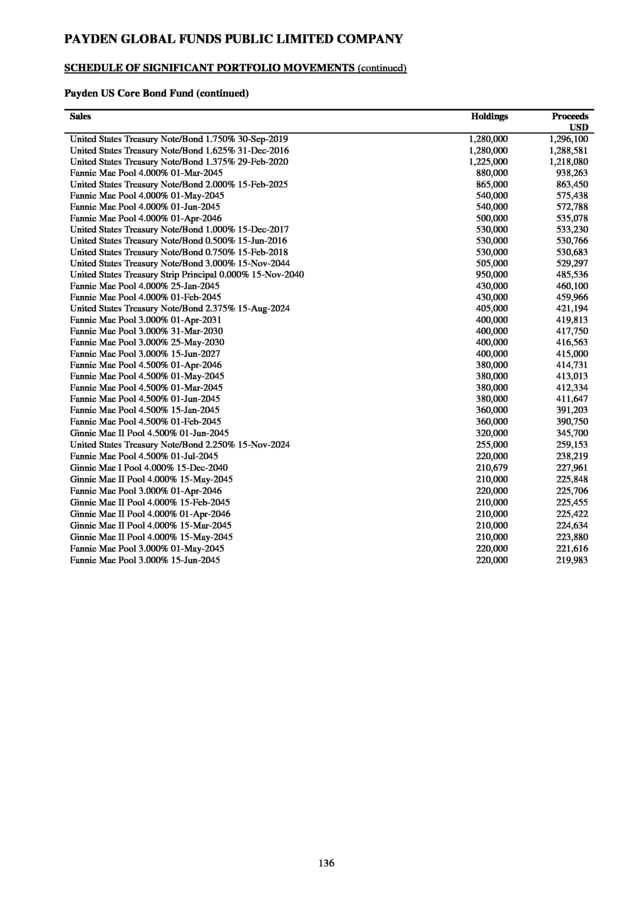
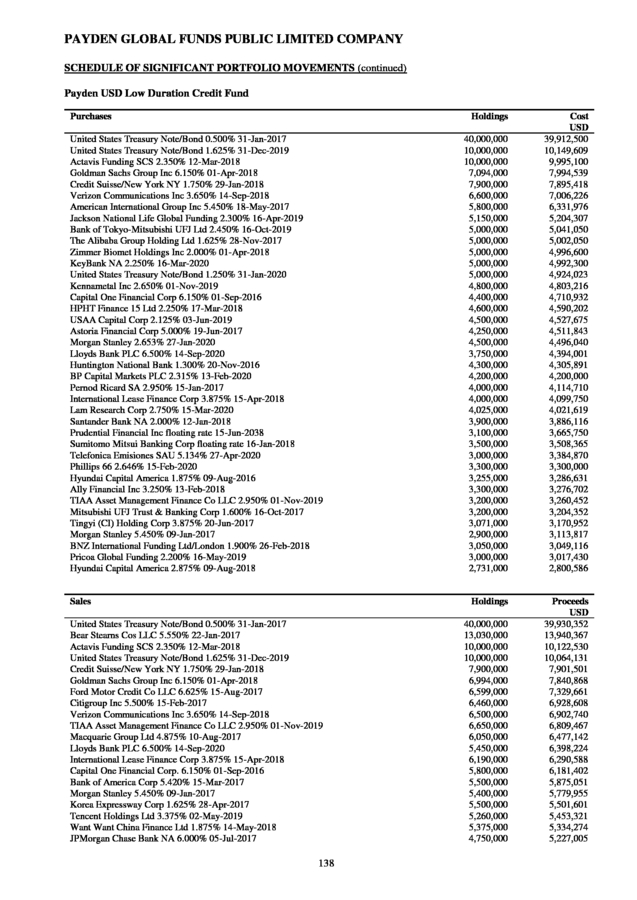
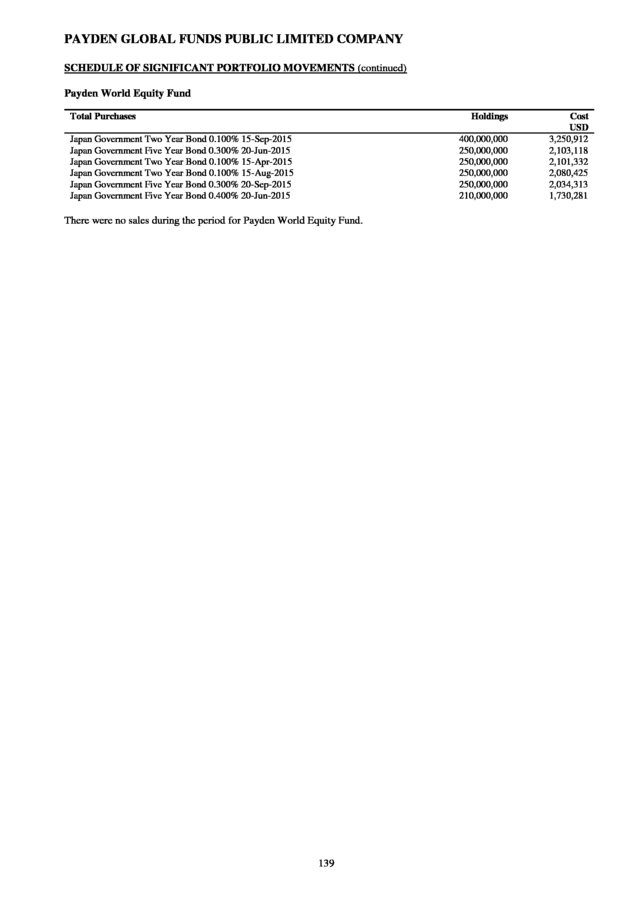
Schedule of Significant Portfolio Movements
119
1
. PAYDEN GLOBAL FUNDS PUBLIC LIMITED COMPANY
DIRECTORS AND OTHER INFORMATION
Registered Office
From 25 March 2015
2nd floor
Beaux Lane House
Mercer Street Lower
Dublin 2
Ireland
Until 24 March 2015
Arthur Cox Building
Earlsfort Centre
Earlsfort Terrace
Dublin 2
Ireland
Directors
Joan A. Payden (American)
Peter Blessing (Irish)*
Dermot S. L. Butler (Canadian)*
Robin Creswell (British)
Mike Kirby (Irish)*
Mark Morris (British)
James P.
Sarni (American) *Independent non-executive directors Sponsoring Broker From 25 March 2015 Maples and Calder 75 St Stephen’s Green Dublin 2 Ireland Secretary From 25 March 2015 MFD Secretaries Limited 2nd floor Beaux Lane House Mercer Street Lower Dublin 2 Ireland Until 24 March 2015 Arthur Cox Listing Services Limited Arthur Cox Building Earlsfort Centre Earlsfort Terrace Dublin 2 Ireland Until 24 March 2015 Bradwell Limited Arthur Cox Building Earlsfort Centre Earlsfort Terrace Dublin 2 Ireland Administrator and Registrar Brown Brothers Harriman Fund Administration Services (Ireland) Limited 30 Herbert Street Dublin 2 Ireland Assistant Secretary Edward Garlock 333 South Grand Avenue Los Angeles California 90071 USA Independent Auditors Deloitte & Touche Chartered Accountants and Statutory Audit Firm Deloitte & Touche House Earlsfort Terrace Dublin 2 Ireland Investment Manager, Distributor and UK Facilities Agent Payden & Rygel Global Limited 1 Bartholomew Lane London EC2N 2AX England Promoter and Sub-Investment Manager for all Funds Payden & Rygel 333 South Grand Avenue Los Angeles California 90071 USA Custodian Brown Brothers Harriman Trustee Services (Ireland) Limited 30 Herbert Street Dublin 2 Ireland 2 . PAYDEN GLOBAL FUNDS PUBLIC LIMITED COMPANY DIRECTORS AND OTHER INFORMATION (continued) Legal Advisors - Ireland From 25 March 2015 Maples and Calder 75 St Stephen’s Green Dublin 2 Ireland Legal Advisors - United States of America K&L Gates LLP 1800 Massachusetts Avenue N.W. Washington D.C. 20036-1800 USA Until 24 March 2015 Arthur Cox Arthur Cox Building Earlsfort Centre Earlsfort Terrace Dublin 2 Ireland Paying Agent and Information Agent in Germany* B. Metzler seel. Sohn & Co KGaA, Große Gallusstraße 18 60311 Frankfurt am Main Germany Paying Agent in Luxembourg The Bank of New York (Luxembourg) S.A Aerogolf Centre 1A Hoehenhof, L-1736 Senningerberg Luxembourg Centralising Correspondent in France CACEIS Bank France 1-3 Place Valhubert 75013, Paris France * The prospectus, the KIID, the articles, the annual and semi-annual reports, a list of changes in the composition of the portfolios as well as the issue and redemption prices are available free of charge pursuant to Sec.
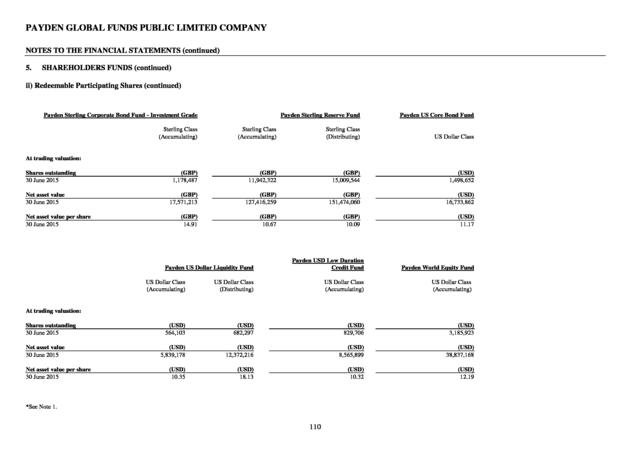
297(1) of the German Capital Investment Code from the office of the German information agent as set out above. For investors in Germany: No notification pursuant to Section 310 of the German Capital Investment Code (Kapitalanlagegesetzbuch) has been filed for the following sub-funds and the shares in these sub-funds may not be marketed to investors in the Federal Republic of Germany: Payden Absolute Return Bond Fund Payden Global Corporate Bond Fund1 Payden Global Emerging Markets Corporate Bond Fund Payden Global Government Bond Index Fund Payden Global Inflation-Linked Bond Fund Payden Global Short Bond Fund2 Payden Sterling Corporate Bond Fund - Investment Grade Payden Sterling Reserve Fund Payden US Core Bond Fund Payden US Dollar Liquidity Fund Payden USD Low Duration Credit Fund Payden World Equity Fund (1) This Fund changed name from Payden Global Corporate Bond Fund – Investment Grade on 24 March 2015. (2) This Fund changed name from Payden International Short Bond Fund on 24 March 2015. 3 . PAYDEN GLOBAL FUNDS PUBLIC LIMITED COMPANY HALF – YEARLY MANAGEMENT REPORT FOR THE PERIOD ENDED 30 JUNE 2015 Business review The results of the operations are set out on the Condensed Profit and Loss Account. Further information on risk management objectives and policies are detailed below. As at 30 June 2015, 31 December 2014 and 30 June 2014 the assets under management for Payden Global Funds public limited company’s (the ‘‘Company’’) sub-funds (individually referred as the ‘‘Fund’’ and collectively as the ‘‘Funds’’): Currency 30 June 2015 31 December 2014* 30 June 2014* 65,423,105 Payden Absolute Return Bond Fund USD 94,002,612 75,145,380 Payden Euro Liquidity Fund EUR 86,943,660 56,822,888 16,891,562 Payden Global Bond Fund(1) USD 217,342,131 243,755,321 239,101,601 Payden Global Emerging Markets Bond Fund USD 109,701,842 137,271,770 176,546,780 Payden Global Emerging Markets Corporate Bond Fund USD 49,689,785 49,455,926 47,828,938 Payden Global Emerging Markets Local Bond Fund2) USD – – 11,992,721 Payden Global Government Bond Index Fund USD 128,397,521 126,813,411 120,702,659 Payden Global High Yield Bond Fund USD 76,459,804 81,344,857 81,777,916 Payden Global Inflation - Linked Bond Fund USD 72,708,301 92,637,808 94,071,510 USD 185,050,072 55,856,362 61,463,769 GBP 17,571,213 17,586,488 16,856,242 Payden Global Short Bond Fund (3) Payden Sterling Corporate Bond Fund - Investment Grade (4) GBP – – – Payden Sterling Reserve Fund GBP 278,890,319 281,601,654 315,446,539 Payden US Core Bond Fund USD 16,733,862 17,763,299 24,328,981 Payden US Dollar Liquidity USD 18,211,394 27,272,153 9,736,035 Payden USD Low Duration Credit Fund USD 8,565,899 511,635,315 492,328,839 Payden World Equity Fund USD 38,837,168 31,726,883 31,894,874 Total Company USD 1,578,818,060 1,985,946,118 2,048,512,708 Payden Sterling Liquidity Fund (1) This Fund changed name from Payden International Bond Fund on 24 March 2015. (2) This Fund terminated on 12 December 2014 and was subsequently revoked by the Central Bank of Ireland. (3) This Fund changed name from Payden International Short Bond Fund on 24 March 2015. (4) This Fund terminated on 25 June 2014 and was subsequently revoked by the Central Bank of Ireland. * Prior figures have been restated to comply with recent updates to the accounting standards. See Note 2. Dividends The distributions for the period are set out in note 7 to the financial statements. Significant events during the period Significant events during the period are set out in note 12 to the financial statements. Subsequent events Subsequent events are set out in note 13 to the financial statements. Risk management objectives and policies The Company’s investment activities expose it to the various types of risk, which are associated with the financial instruments and markets in which it invests. Details of the risks inherent in investing in the Company are available in the Company Prospectus. Related parties Related parties of the Company are set out in note 9 to the financial statements. Responsibility statement The Board of Directors confirm that the condensed financial statements have been prepared in accordance with the Financial Reporting Council’s FRS 104 “Interim Financial Reporting” and the interim management report includes a fair review of the information required by the Transparency Directive (Directive 2004/109/EC) Regulations 2007 (the ‘‘Transparency Directive”). 4 .
PAYDEN GLOBAL FUNDS PUBLIC LIMITED COMPANY INVESTMENT MANAGER’S REPORT FOR THE PERIOD PERIOD ENDED 30 JUNE 2015 Strategy overview – H1 2015 Developed government bond markets came under pressure in the first six months of 2015, on improving economic data during the second half of the period and easing concerns over the outcome of Greece’s negotiations with the European Central Bank (ECB). US Treasuries were also undermined by heavy issuance levels in May and strong payrolls data in June, which convinced markets that the initially weak US Q1 GDP reading was in fact weather-related rather than a sign of a sustained loss of momentum in the US recovery. Nonetheless, US Treasuries outperformed other developed sovereign bond markets due to their relatively attractive yields, recording only a slightly negative outright return of -0.07% (BofA Merrill Lynch US Treasury & Agency Index) during H1 2015. UK Gilts underperformed US Treasuries, returning -1.43% following better than expected UK employment data and a more hawkish tone from the Bank of England’s Monetary Policy Committee. German Bunds returned -1.01% during the period, partly in response to regional inflation data, which served to ease concerns about deflation. Peripheral Euro-zone sovereign debt markets also registered negative returns despite the bond supportive impact of the ECB’s asset purchasing programme.
Spanish sovereign bonds lost 2.28% while Italian bonds declined 0.84%. Spanish government bond markets came under particular pressure during the second quarter, as the emergence of anti-austerity parties in local and regional Spanish elections fuelled fears of the rise of reform-unfriendly political parties in countries other than Greece. Investment grade credit spreads widened during the second half of H1 with US IG corporate bond markets returning -0.46% over the period, while high yield and emerging market sectors both outperformed core government bonds, making outright gains of 2.48% and 1.04% respectively. In equity markets, the MSCI Developed World Index returned 1.5% over the period, as improving global economic data and a surge in mergers and acquisitions activity offset some of the market weakness from profit-taking during the first quarter of 2015 and the market sell-off over the final week in June due to a sudden but short-lived spike in uncertainties related to Greek crisis. In the currency markets the US Dollar was generally higher against the major crosses excluding Sterling, which, like the US Dollar, was supported by strong domestic economic data. The Euro weakened in reaction to the ECB’s latest quantitative easing steps and persistent tensions between Greece and its creditors, while the Australian Dollar was undermined by weak commodity prices. 5 .
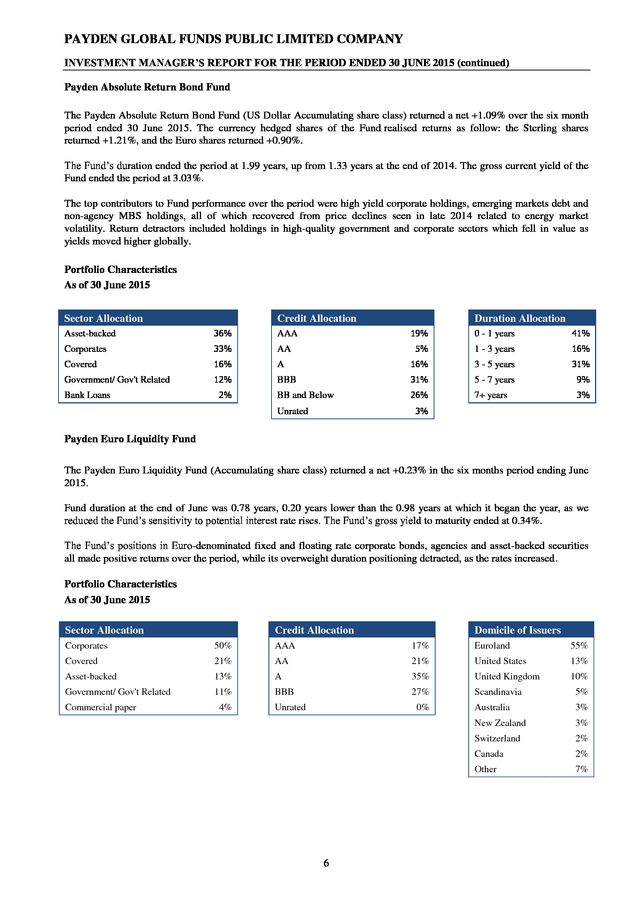
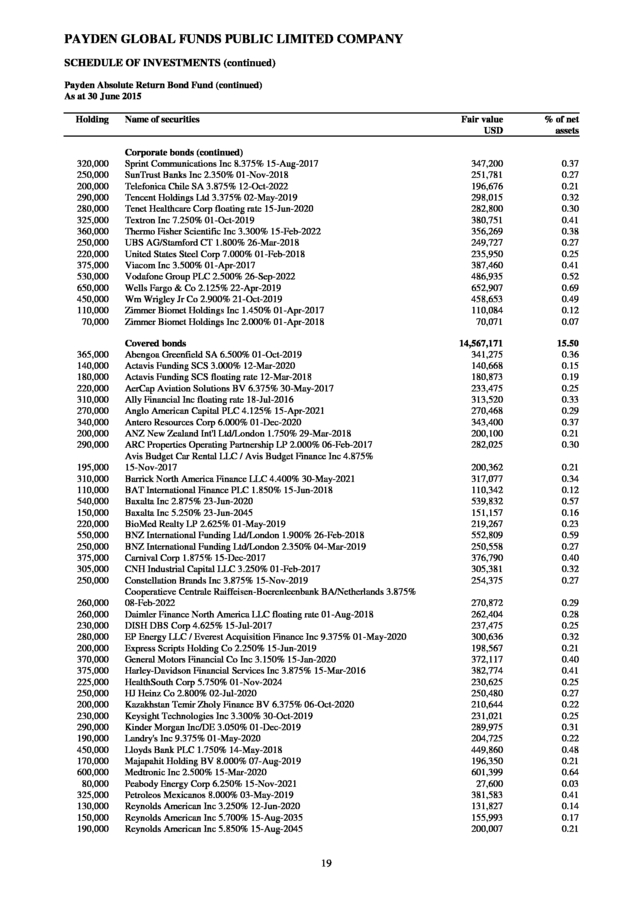
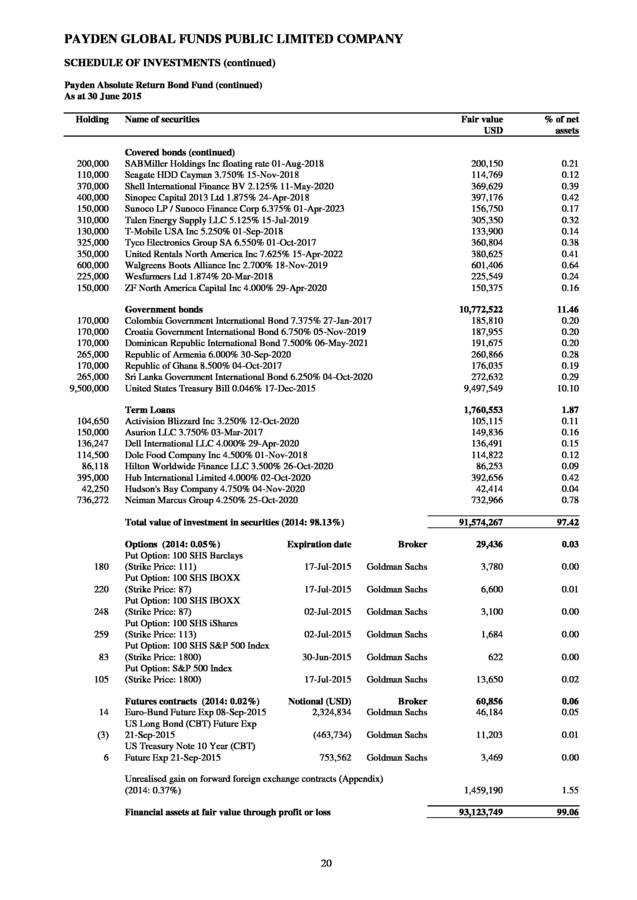
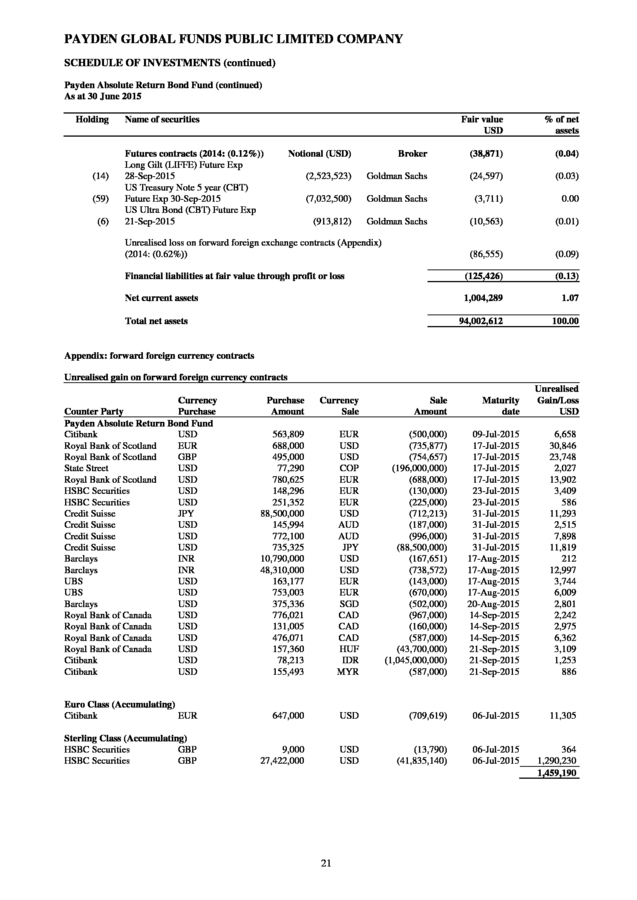
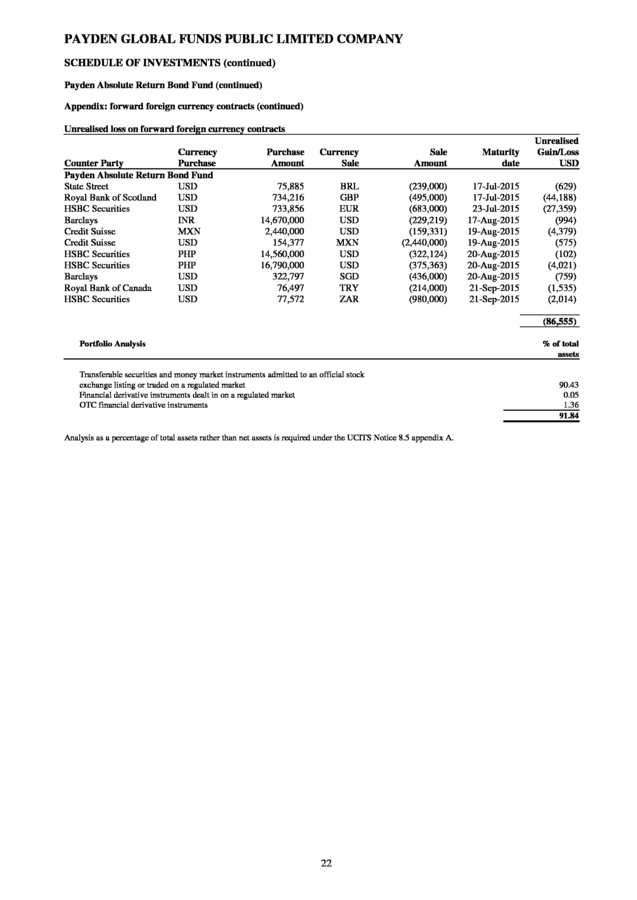
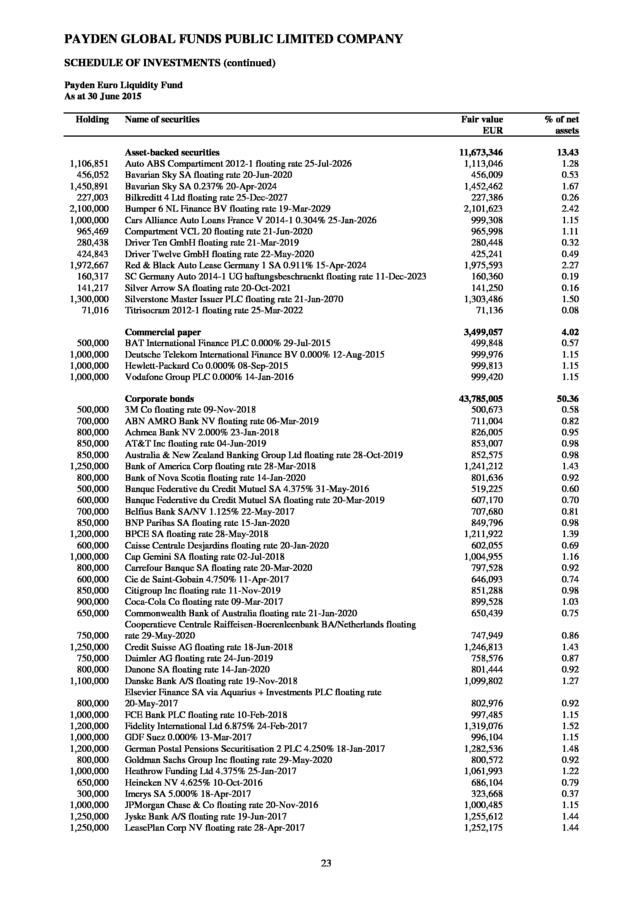
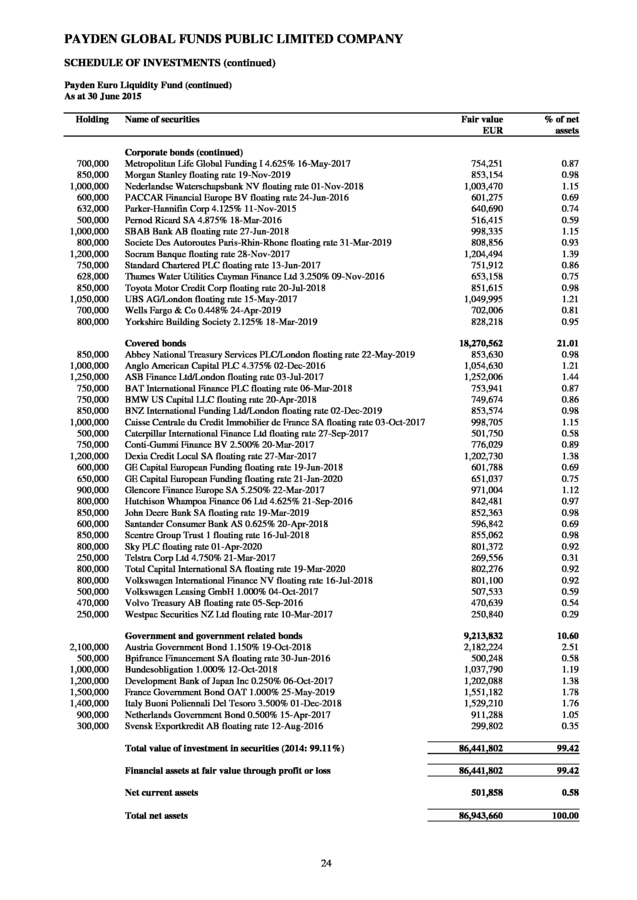
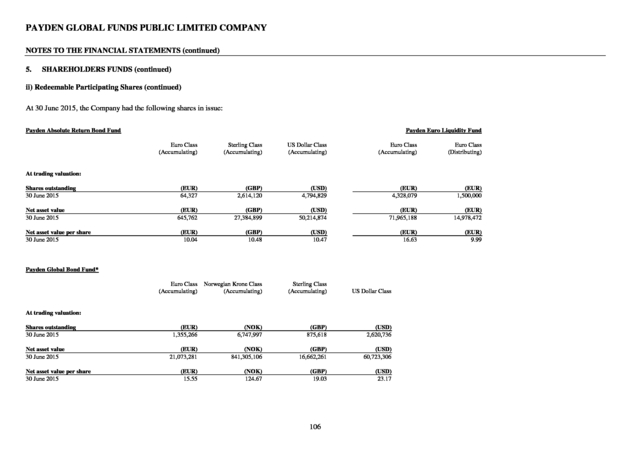
PAYDEN GLOBAL FUNDS PUBLIC LIMITED COMPANY INVESTMENT MANAGER’S REPORT FOR THE PERIOD ENDED 30 JUNE 2015 (continued) Payden Absolute Return Bond Fund The Payden Absolute Return Bond Fund (US Dollar Accumulating share class) returned a net +1.09% over the six month period ended 30 June 2015. The currency hedged shares of the Fund realised returns as follow: the Sterling shares returned +1.21%, and the Euro shares returned +0.90%. The Fund’s duration ended the period at 1.99 years, up from 1.33 years at the end of 2014. The gross current yield of the Fund ended the period at 3.03%. The top contributors to Fund performance over the period were high yield corporate holdings, emerging markets debt and non-agency MBS holdings, all of which recovered from price declines seen in late 2014 related to energy market volatility. Return detractors included holdings in high-quality government and corporate sectors which fell in value as yields moved higher globally. Portfolio Characteristics As of 30 June 2015 Sector Allocation Credit Allocation Asset-backed 36% AAA Corporates 33% AA Covered 16% A Government/ Gov't Related 12% BBB BB and Below Bank Loans 2% Duration Allocation 19% 0 - 1 years 41% 5% 1 - 3 years 16% 16% 3 - 5 years 31% 31% 5 - 7 years 9% 26% 7+ years 3% 3% Unrated Payden Euro Liquidity Fund The Payden Euro Liquidity Fund (Accumulating share class) returned a net +0.23% in the six months period ending June 2015. Fund duration at the end of June was 0.78 years, 0.20 years lower than the 0.98 years at which it began the year, as we reduced the Fund’s sensitivity to potential interest rate rises.
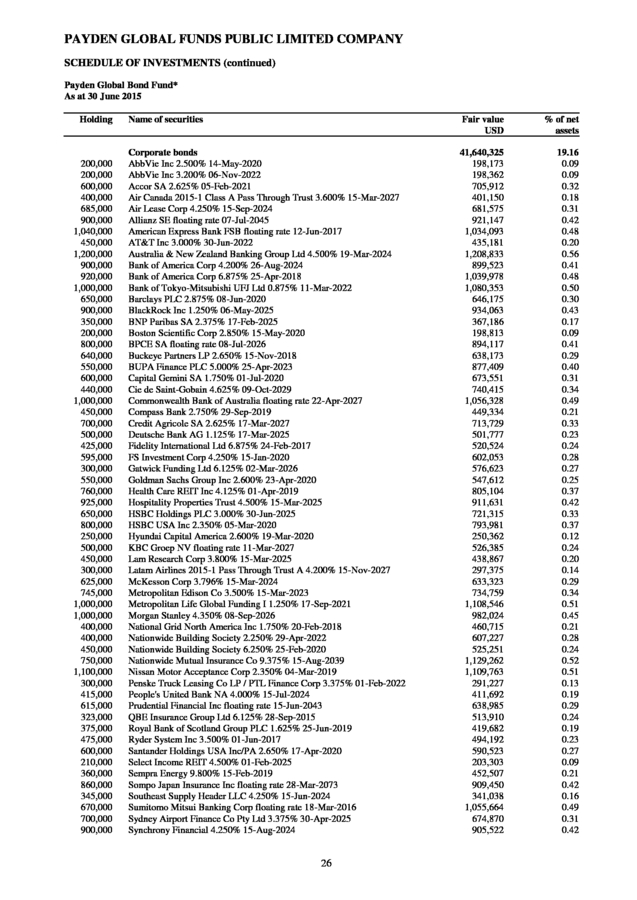
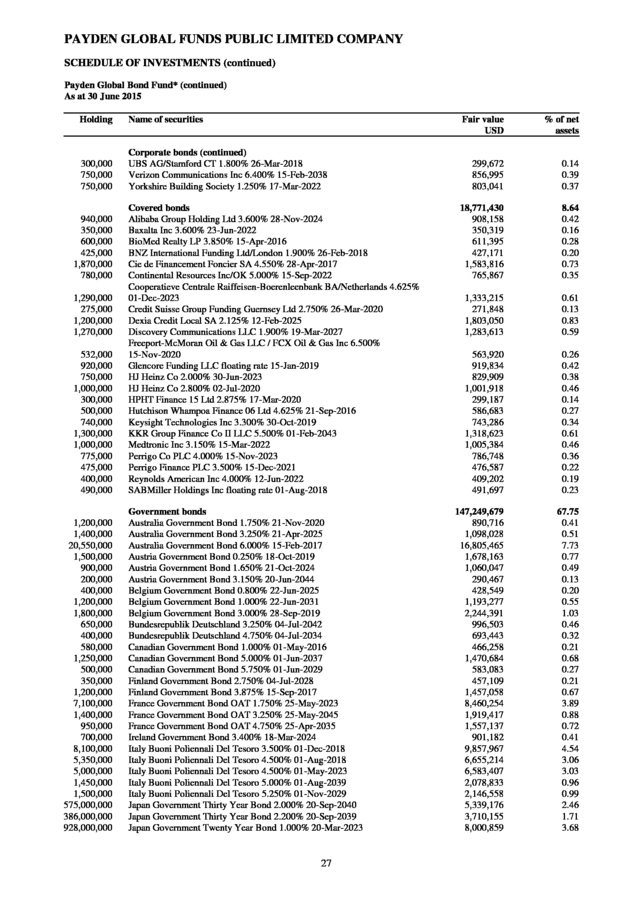
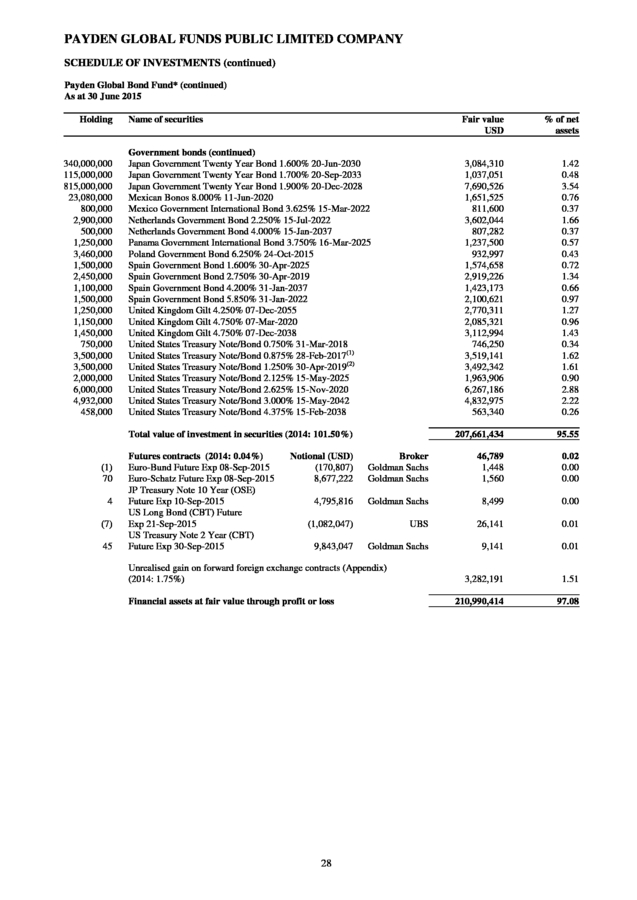
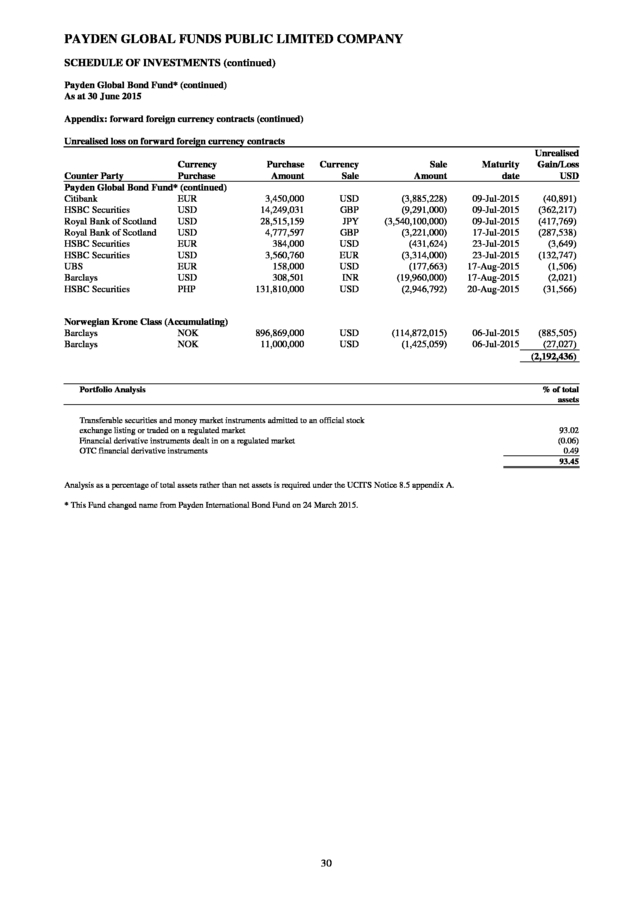
The Fund’s gross yield to maturity ended at 0.34%. The Fund’s positions in Euro-denominated fixed and floating rate corporate bonds, agencies and asset-backed securities all made positive returns over the period, while its overweight duration positioning detracted, as the rates increased. Portfolio Characteristics As of 30 June 2015 Sector Allocation Credit Allocation Domicile of Issuers Corporates 50% AAA 17% Euroland 55% Covered 21% AA 21% United States 13% Asset-backed 13% A 35% United Kingdom 10% Government/ Gov't Related 11% BBB 27% Scandinavia 5% Australia 3% New Zealand 3% Switzerland 2% Canada 2% Other 7% Commercial paper 4% Unrated 0% 6 . PAYDEN GLOBAL FUNDS PUBLIC LIMITED COMPANY INVESTMENT MANAGER’S REPORT FOR THE PERIOD ENDED 30 JUNE 2015 (continued) Payden Global Bond Fund* The Payden Global Bond Fund (US Dollar share class) returned a net -0.38% over the six month period ended 30 June 2015. The currency hedged shares of the Fund made returns as follow: the Sterling shares returned -0.18%, the Euro shares returned -0.53% and the Norwegian Kroner shares returned +0.08%. Fund duration started the period at 7.5 years and ended the half year at 7.0 years as we reduced the Fund’s sensitivity to potential interest rate rises. The Fund’s gross yield to maturity of the base currency share class ended the period at 1.89%. The primary favourable drivers of the Fund’s performance over the period were its currency positioning and exposure to investment grade corporate bonds. However, gains from these sources were offset by losses due to the Fund’s holdings in emerging markets bonds. Portfolio Characteristics As of 30 June 2015 Sector Allocation Credit Allocation Duration Allocation Governments 68% AAA 25% 0 - 1 years 3% Corporates 19% AA 15% 1 - 3 years 28% A 25% 3 - 5 years 17% BBB 35% 5 - 7 years 6% 7 - 10 years 19% 10+ years 27% Covered 9% *This Fund changed name from Payden International Bond Fund on 24 March 2015. 7 .
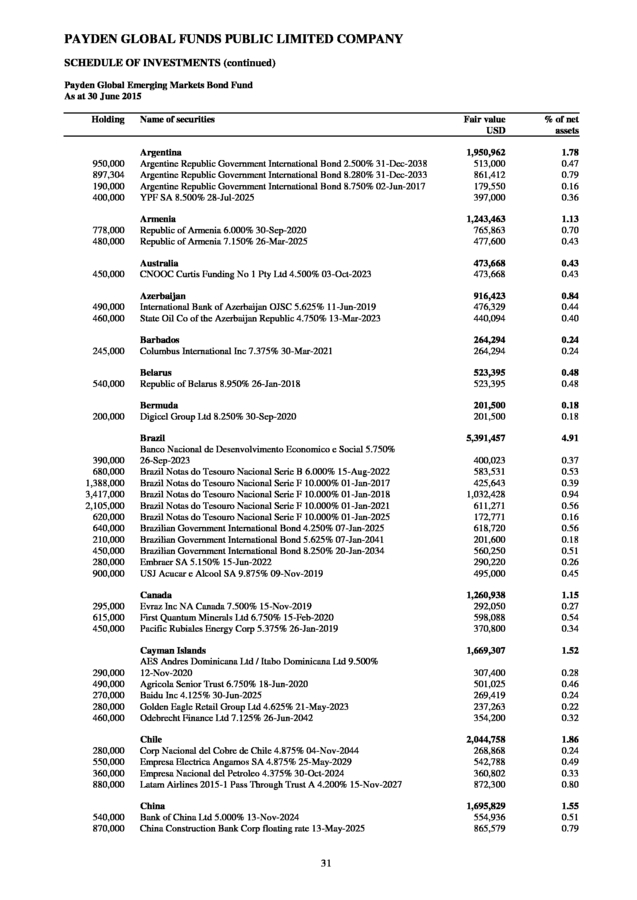
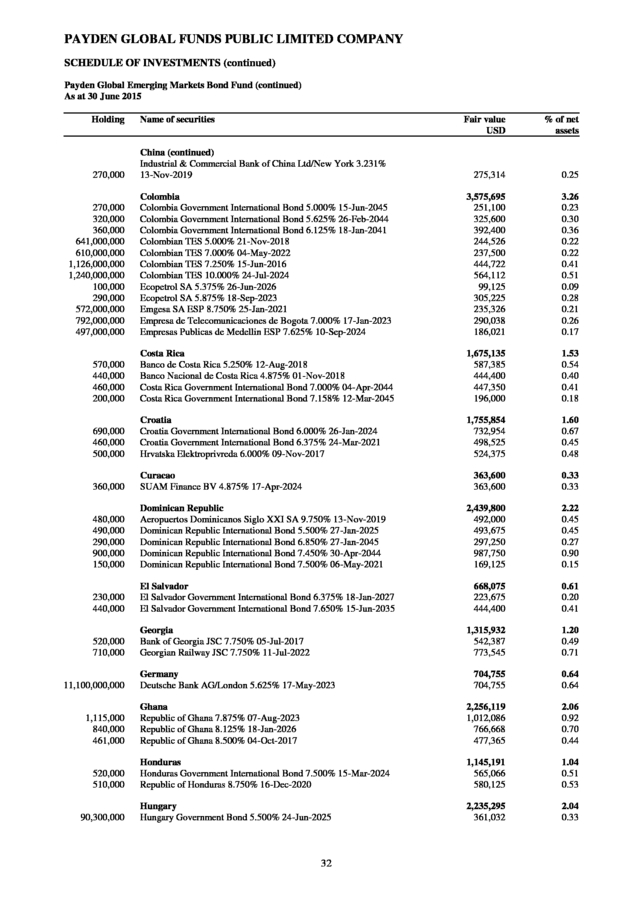
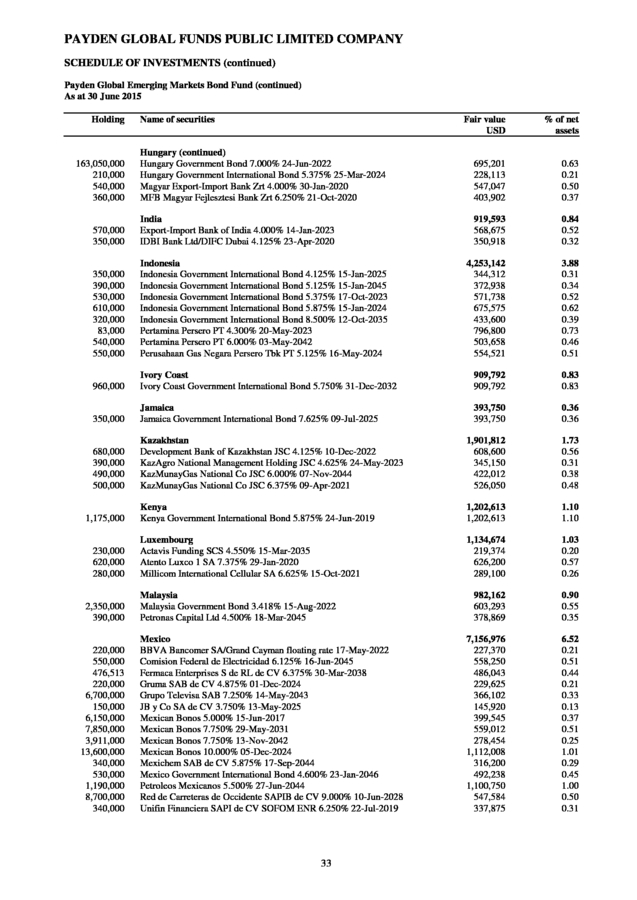
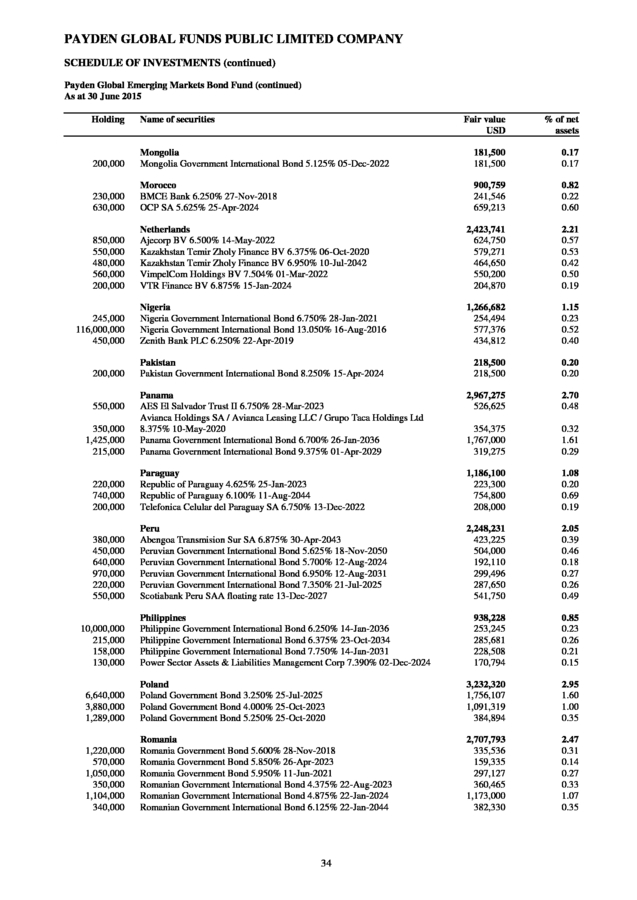
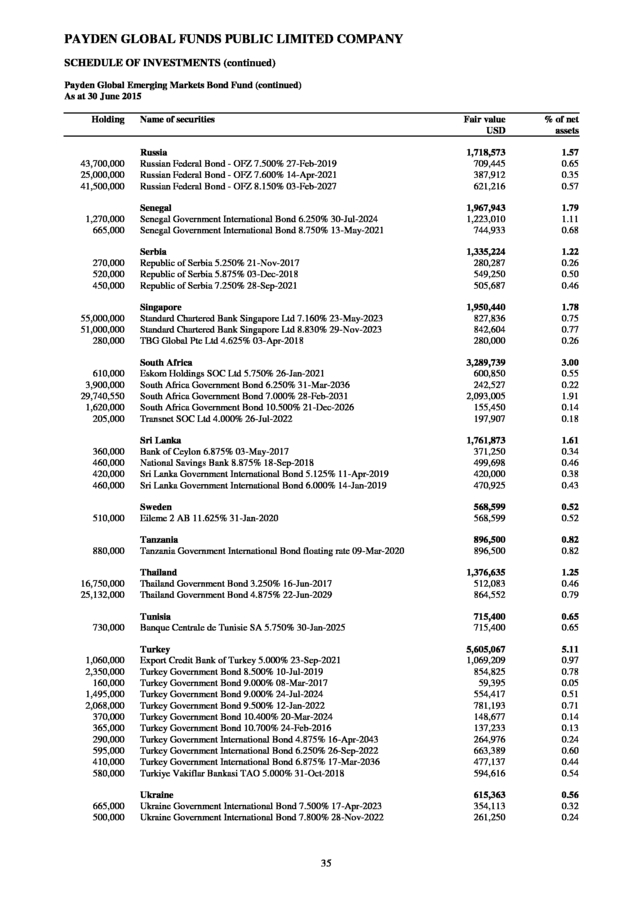
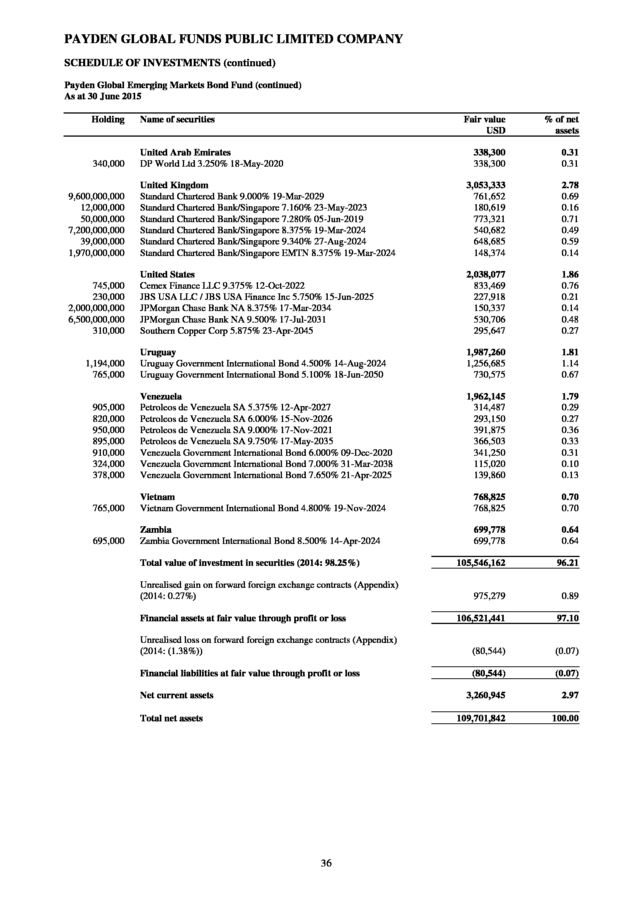
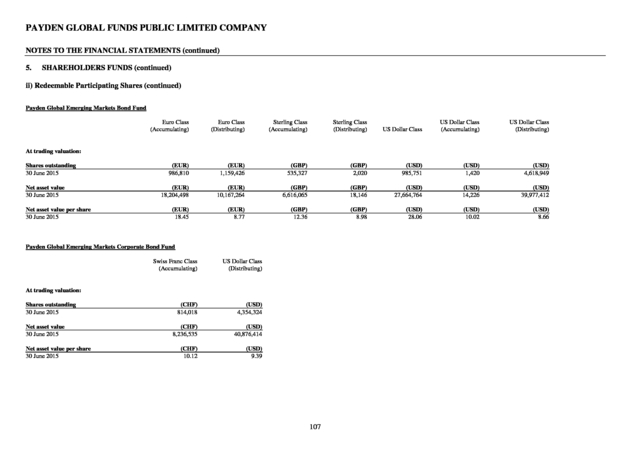
PAYDEN GLOBAL FUNDS PUBLIC LIMITED COMPANY INVESTMENT MANAGER’S REPORT FOR THE PERIOD ENDED 30 JUNE 2015 (continued) Payden Global Emerging Markets Bond Fund The Payden Global Emerging Markets Bond Fund (USD Accumulating share class) returned a net –0.24% over the six month period ended 30 June 2015. The currency hedged shares of the Fund returns were as follows: the Sterling shares returned -0.24% and the Euro shares returned -0.62%. Fund duration started the period at 6.63 years and ended the half year at 6.46 years as we reduced the Fund’s sensitivity to potential interest rate rises. The Fund’s gross yield to maturity of the base currency share class ended the period at 6.78%. The Fund’s performance reflected muted returns for the asset class during the period. The Fund benefitted from a lower allocation to local markets and a tilt to corporate bonds.
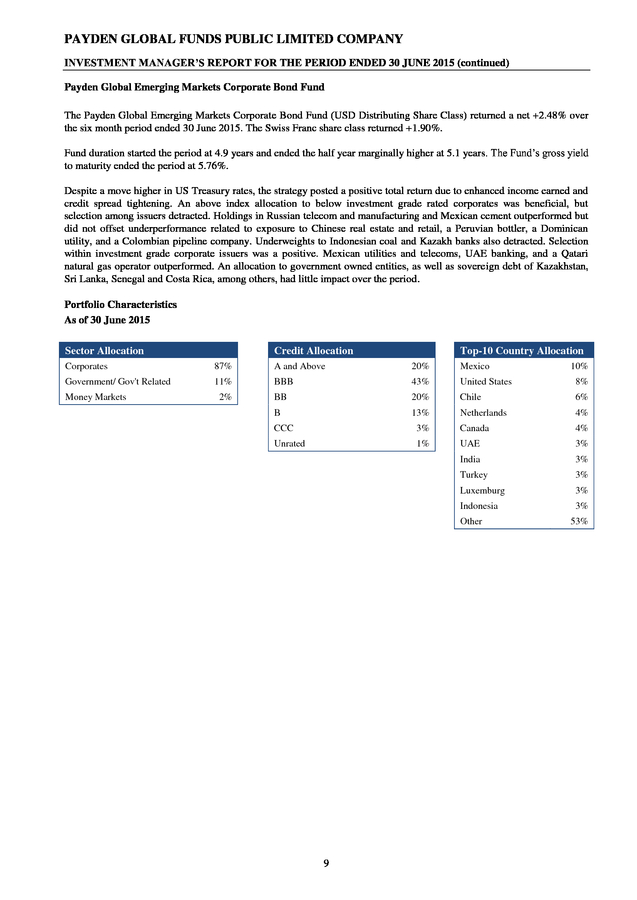
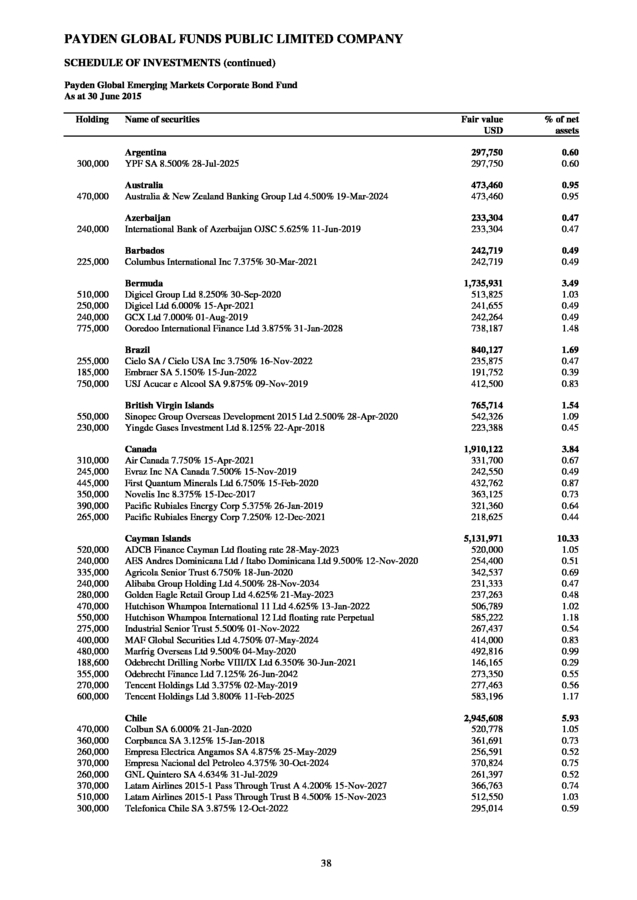
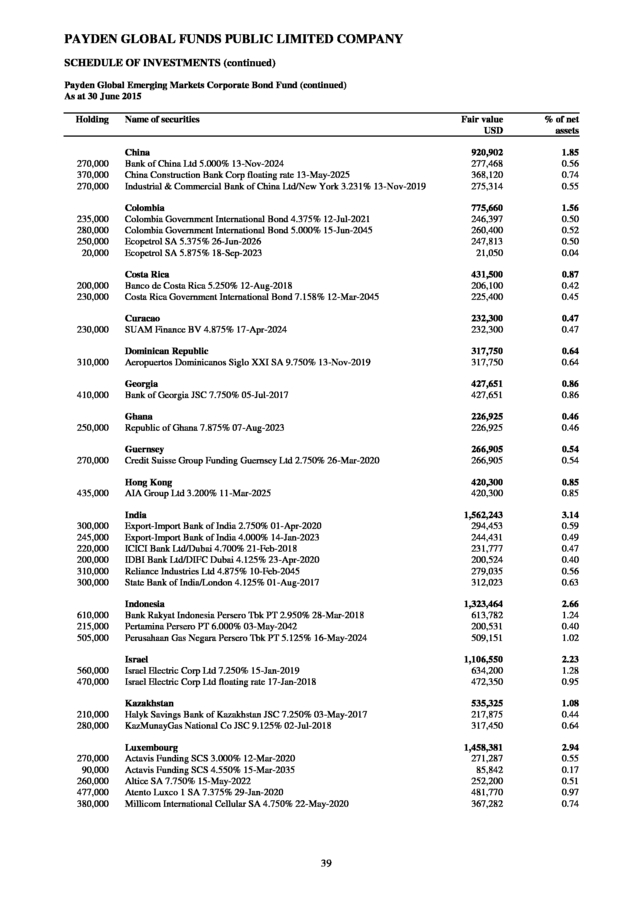
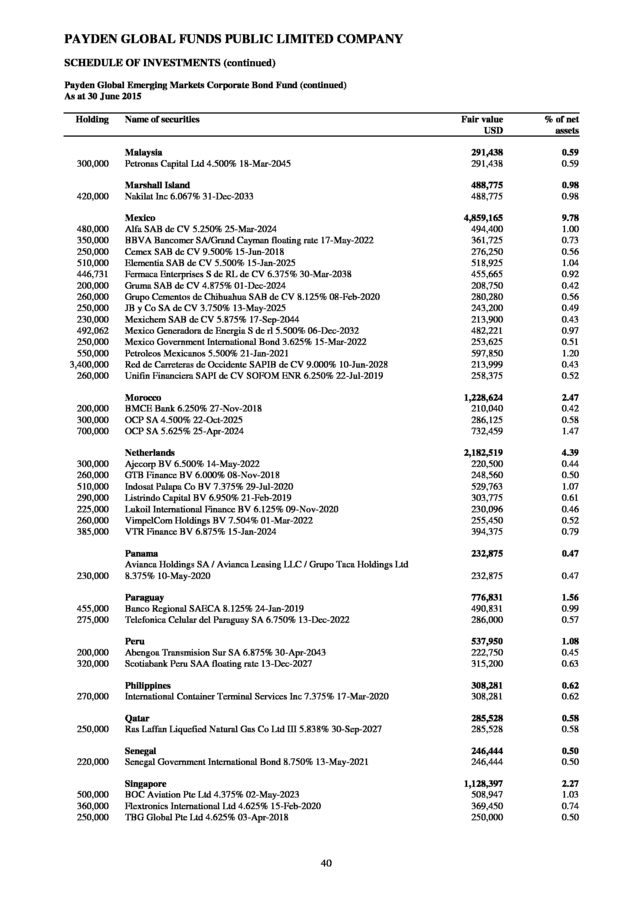
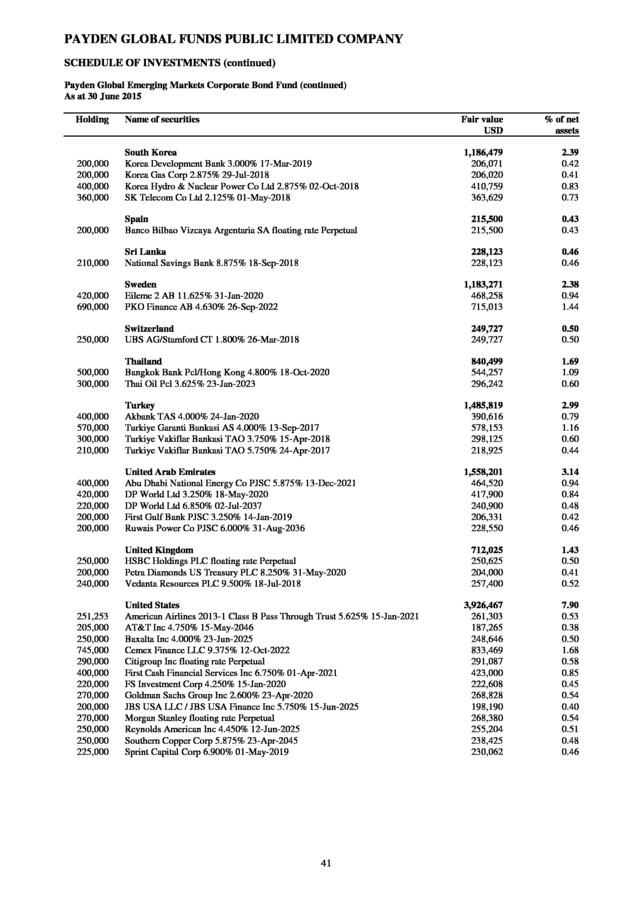
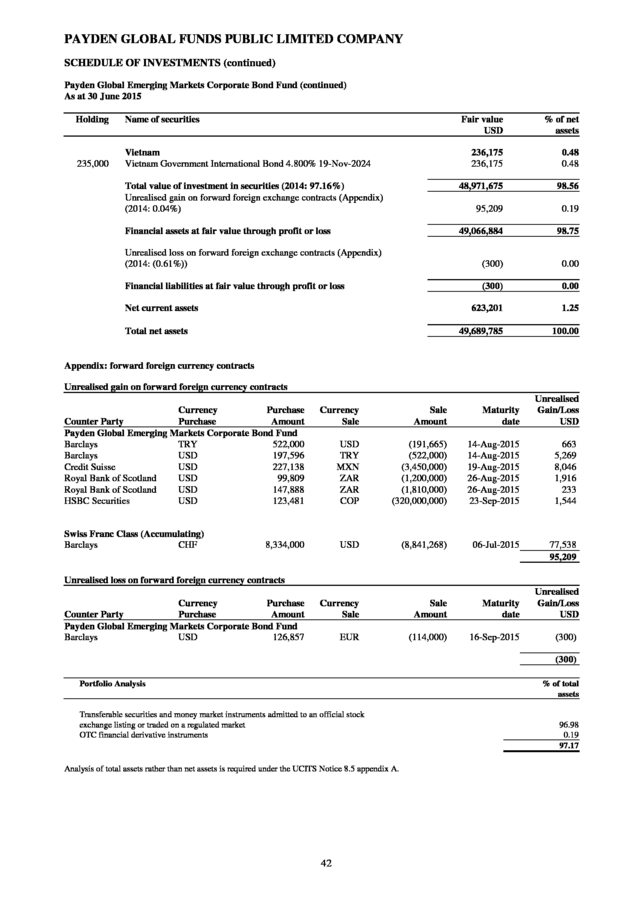
Specifically, an underweight exposure to Indonesian and Malaysian local markets benefitted returns, as did off-index allocations to Colombian, Peruvian and Mexican corporates. In sovereigns, positive contributions from Honduras and Argentina offset an underweight to recovering Russian bonds. Quasi-sovereign bonds detracted, in particular positions in long-dated securities of Mexico’s state-owned oil company, PEMEX. Portfolio Characteristics As of 30 June 2015 Sector Allocation Credit Allocation Top-10 Country Allocation Government/ Gov't Related 76% A and Above 13% Mexico 7% Corporates 21% BBB 47% Turkey 5% BB 17% Brazil 5% B 17% Indonesia 4% CCC 5% Colombia 3% Unrated 1% S.Africa 3% Poland 3% United Kingdom 3% Panama 3% Romania 3% Money Markets 3% Other 8 61% . PAYDEN GLOBAL FUNDS PUBLIC LIMITED COMPANY INVESTMENT MANAGER’S REPORT FOR THE PERIOD ENDED 30 JUNE 2015 (continued) Payden Global Emerging Markets Corporate Bond Fund The Payden Global Emerging Markets Corporate Bond Fund (USD Distributing Share Class) returned a net +2.48% over the six month period ended 30 June 2015. The Swiss Franc share class returned +1.90%. Fund duration started the period at 4.9 years and ended the half year marginally higher at 5.1 years. The Fund’s gross yield to maturity ended the period at 5.76%. Despite a move higher in US Treasury rates, the strategy posted a positive total return due to enhanced income earned and credit spread tightening. An above index allocation to below investment grade rated corporates was beneficial, but selection among issuers detracted.
Holdings in Russian telecom and manufacturing and Mexican cement outperformed but did not offset underperformance related to exposure to Chinese real estate and retail, a Peruvian bottler, a Dominican utility, and a Colombian pipeline company. Underweights to Indonesian coal and Kazakh banks also detracted. Selection within investment grade corporate issuers was a positive.
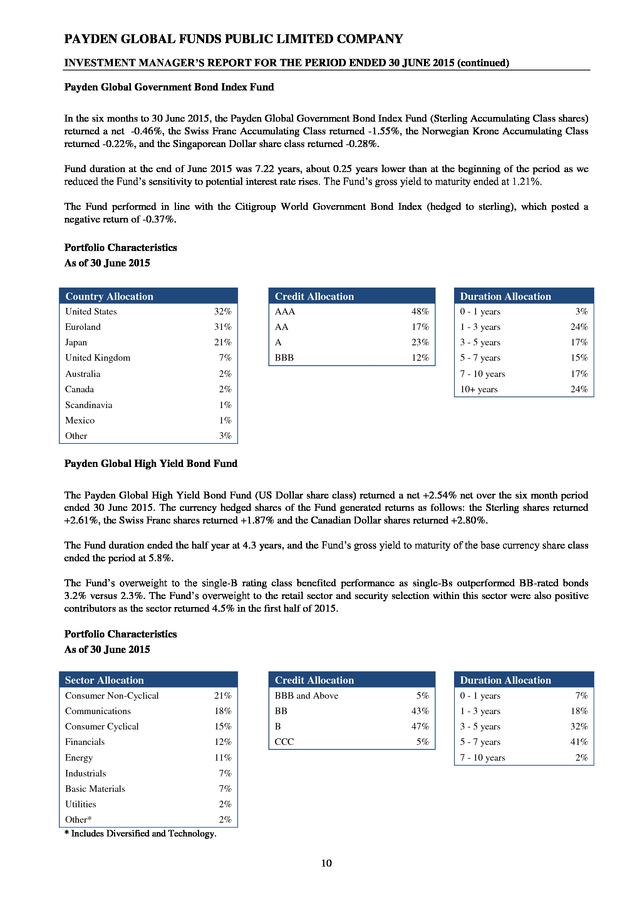
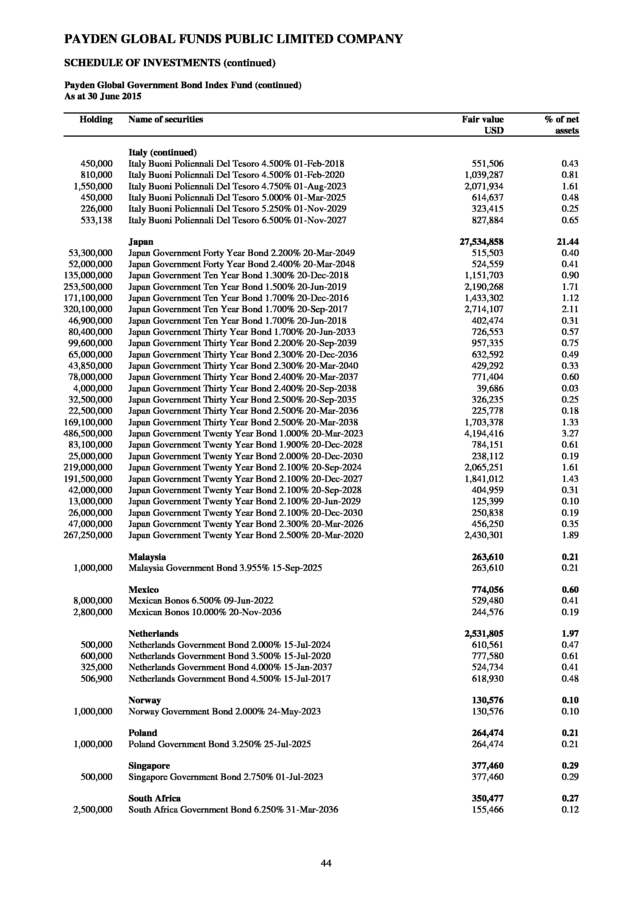
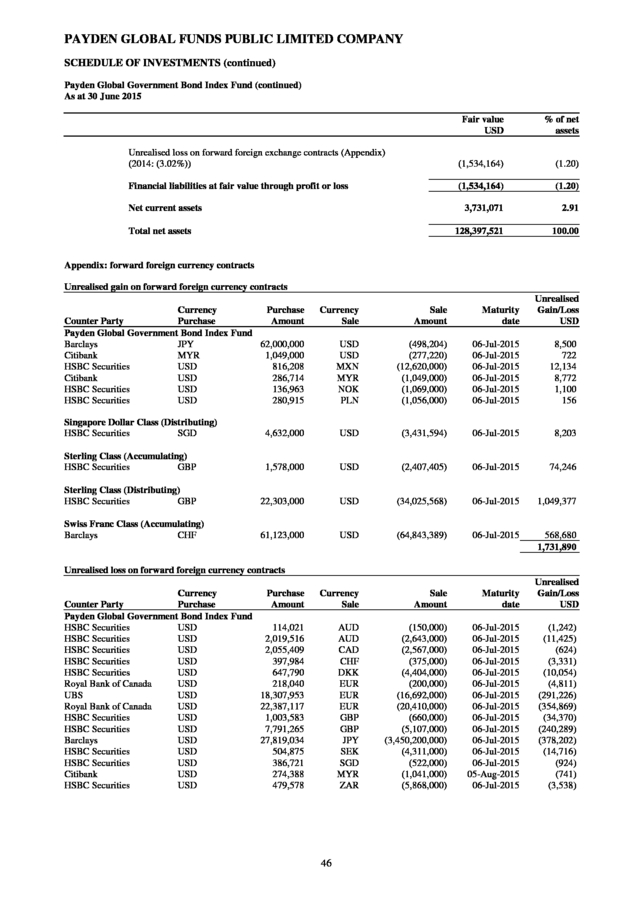
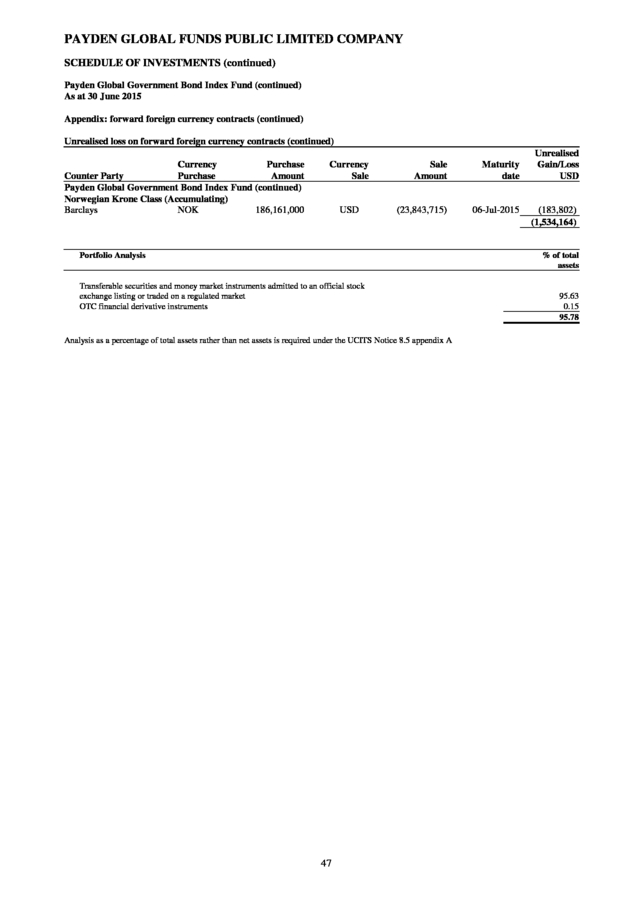
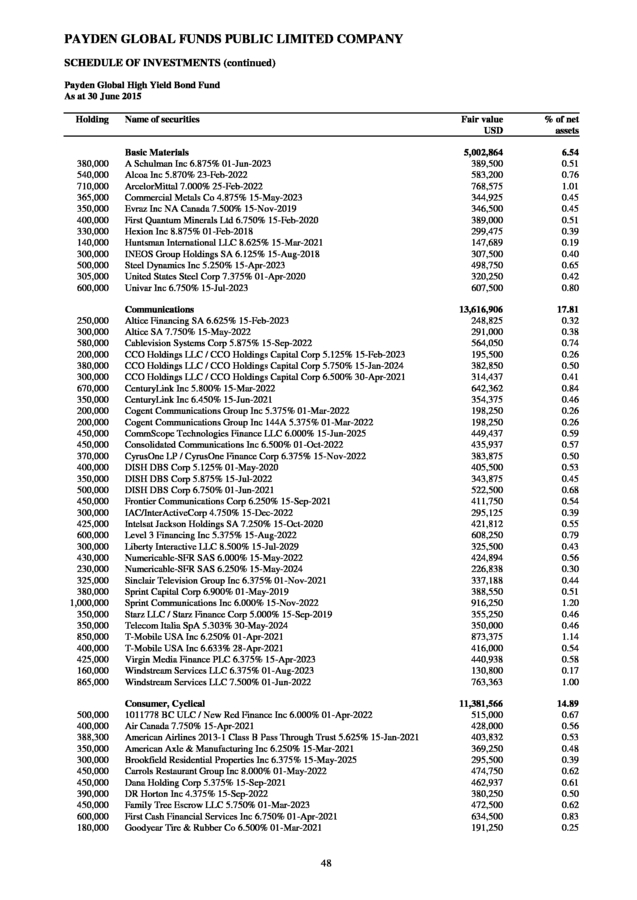
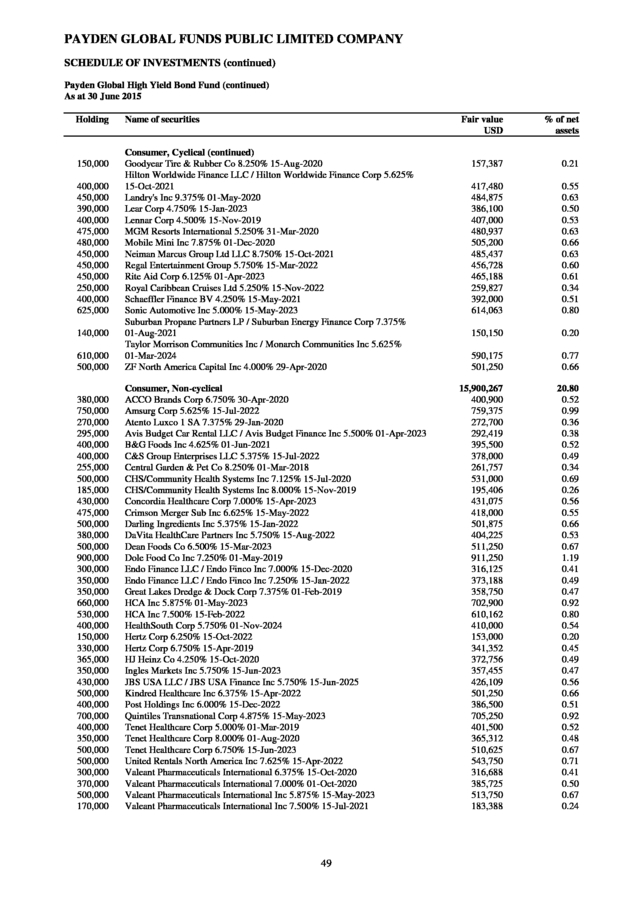
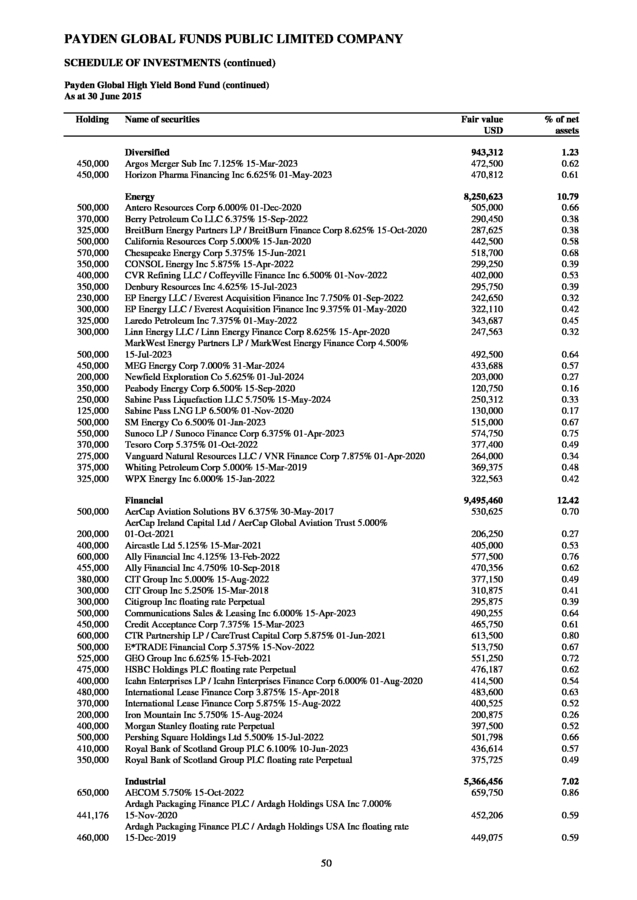
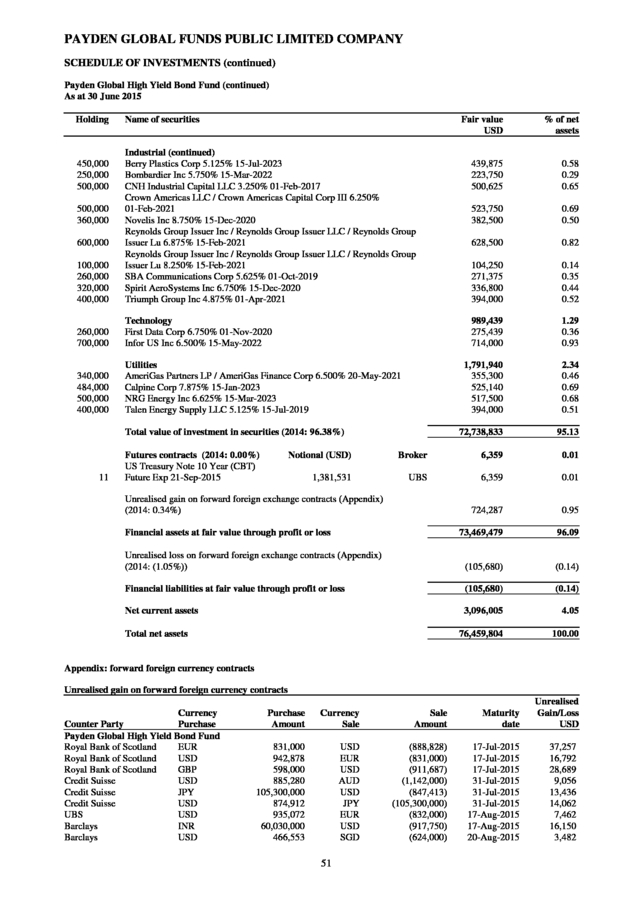
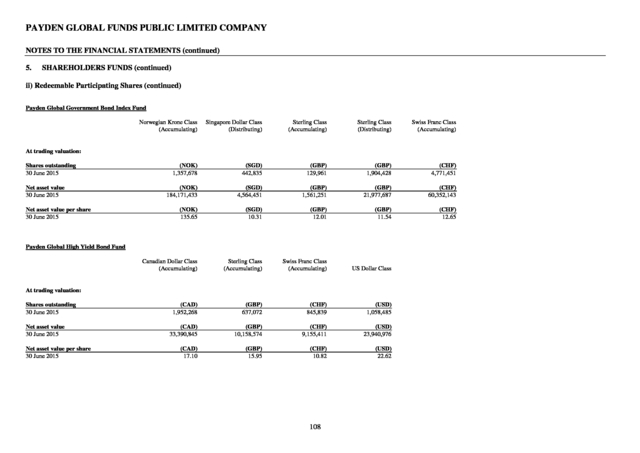
Mexican utilities and telecoms, UAE banking, and a Qatari natural gas operator outperformed. An allocation to government owned entities, as well as sovereign debt of Kazakhstan, Sri Lanka, Senegal and Costa Rica, among others, had little impact over the period. Portfolio Characteristics As of 30 June 2015 Sector Allocation Credit Allocation Top-10 Country Allocation Corporates 87% A and Above 20% Mexico Government/ Gov't Related 11% BBB 43% United States 8% BB 20% Chile 6% B 13% Money Markets 2% 10% Netherlands 4% CCC 3% Canada 4% Unrated 1% UAE 3% India 3% Turkey 3% Luxemburg 3% Indonesia 3% Other 9 53% . PAYDEN GLOBAL FUNDS PUBLIC LIMITED COMPANY INVESTMENT MANAGER’S REPORT FOR THE PERIOD ENDED 30 JUNE 2015 (continued) Payden Global Government Bond Index Fund In the six months to 30 June 2015, the Payden Global Government Bond Index Fund (Sterling Accumulating Class shares) returned a net -0.46%, the Swiss Franc Accumulating Class returned -1.55%, the Norwegian Krone Accumulating Class returned -0.22%, and the Singaporean Dollar share class returned -0.28%. Fund duration at the end of June 2015 was 7.22 years, about 0.25 years lower than at the beginning of the period as we reduced the Fund’s sensitivity to potential interest rate rises. The Fund’s gross yield to maturity ended at 1.21%. The Fund performed in line with the Citigroup World Government Bond Index (hedged to sterling), which posted a negative return of -0.37%. Portfolio Characteristics As of 30 June 2015 Country Allocation Credit Allocation Duration Allocation United States 32% AAA 48% 0 - 1 years 3% Euroland 31% AA 17% 1 - 3 years 24% Japan 21% A 23% 3 - 5 years 17% BBB 12% 5 - 7 years 15% United Kingdom 7% Australia 2% 7 - 10 years 17% Canada 2% 10+ years 24% Scandinavia 1% Mexico 1% Other 3% Payden Global High Yield Bond Fund The Payden Global High Yield Bond Fund (US Dollar share class) returned a net +2.54% net over the six month period ended 30 June 2015. The currency hedged shares of the Fund generated returns as follows: the Sterling shares returned +2.61%, the Swiss Franc shares returned +1.87% and the Canadian Dollar shares returned +2.80%. The Fund duration ended the half year at 4.3 years, and the Fund’s gross yield to maturity of the base currency share class ended the period at 5.8%. The Fund’s overweight to the single-B rating class benefited performance as single-Bs outperformed BB-rated bonds 3.2% versus 2.3%. The Fund’s overweight to the retail sector and security selection within this sector were also positive contributors as the sector returned 4.5% in the first half of 2015. Portfolio Characteristics As of 30 June 2015 Sector Allocation Credit Allocation Duration Allocation Consumer Non-Cyclical 21% BBB and Above 5% 0 - 1 years 7% Communications 18% BB 43% 1 - 3 years 18% Consumer Cyclical 15% B 47% 3 - 5 years 32% Financials 12% CCC 5% 5 - 7 years 41% Energy 11% 7 - 10 years 2% Industrials 7% Basic Materials 7% Utilities 2% Other* 2% * Includes Diversified and Technology. 10 .
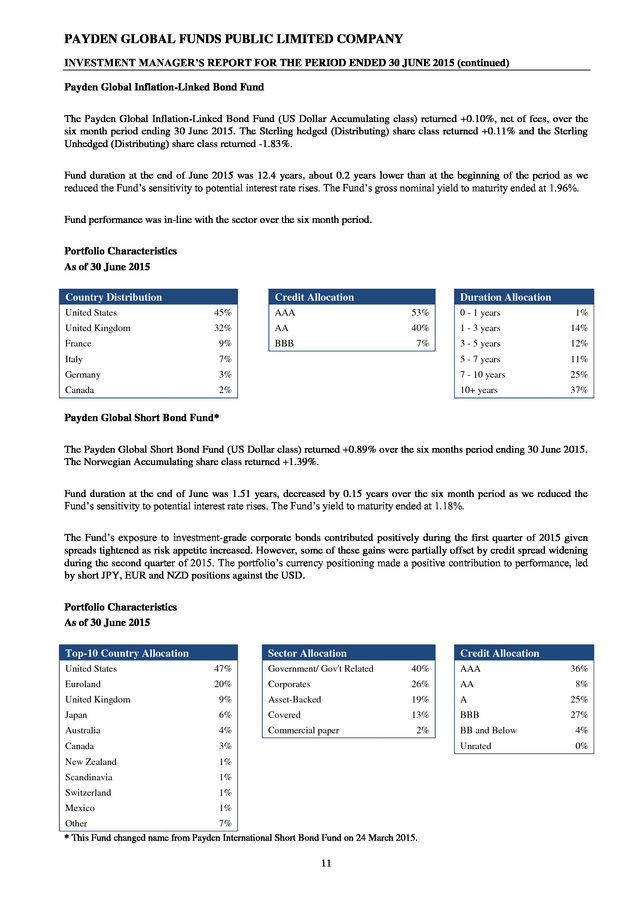
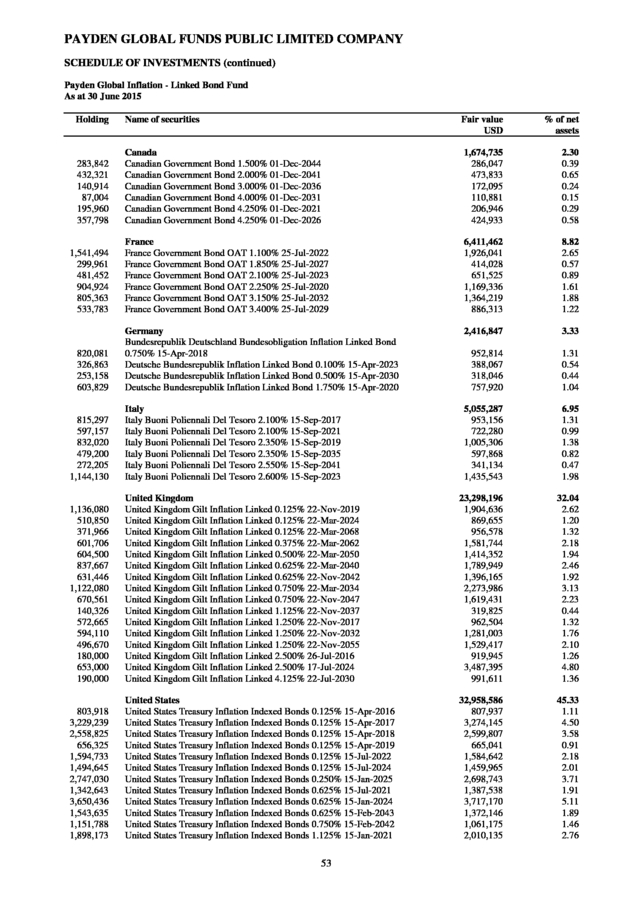
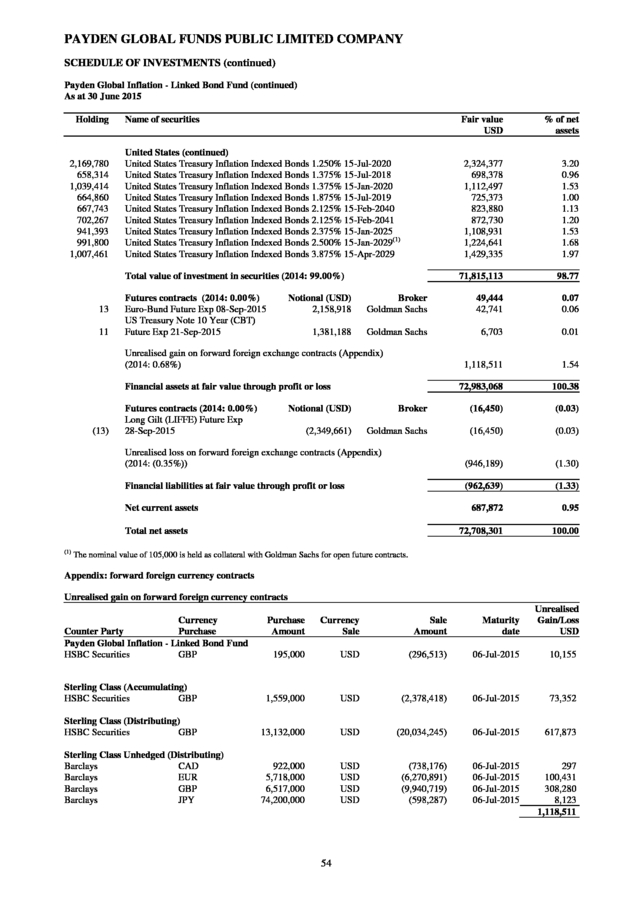
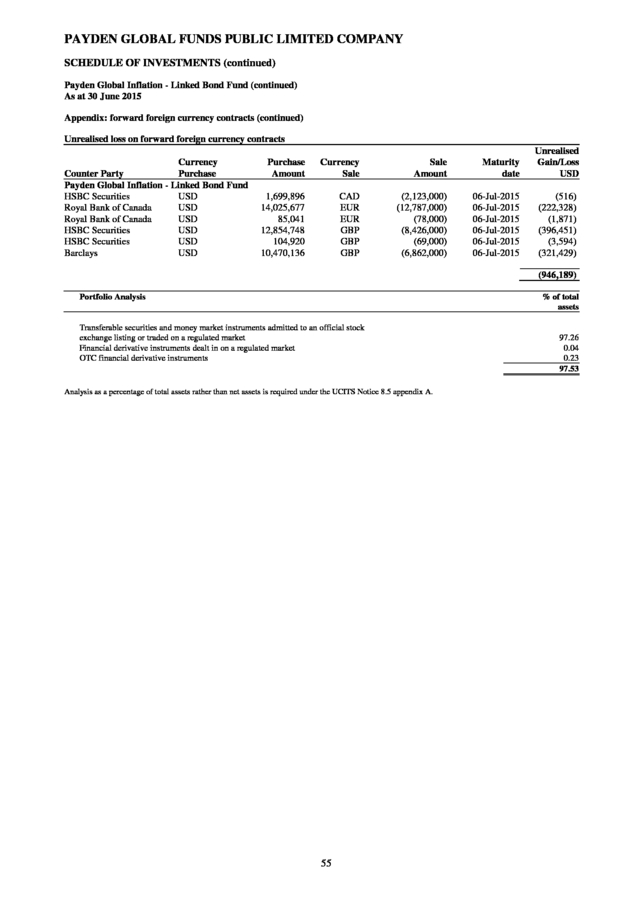
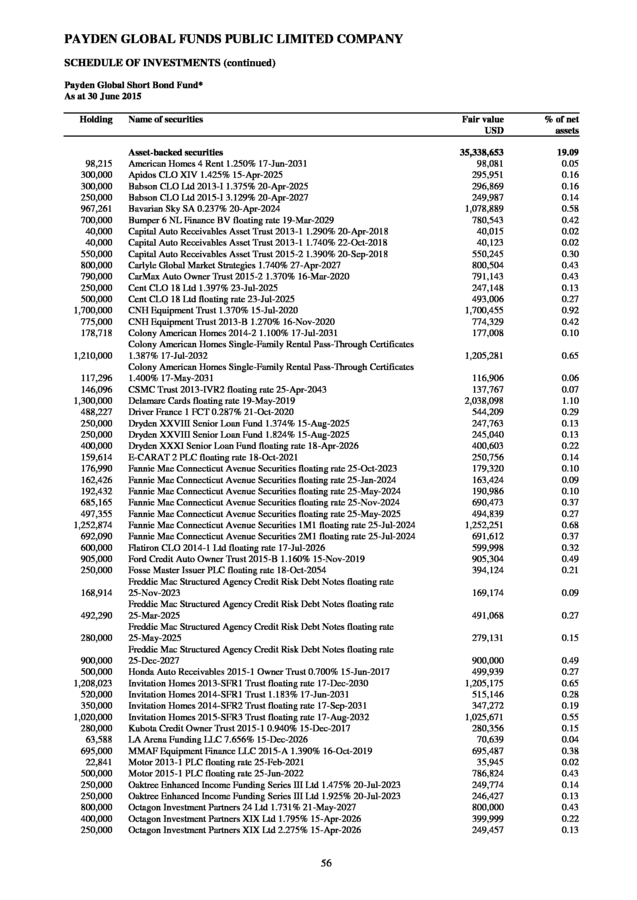
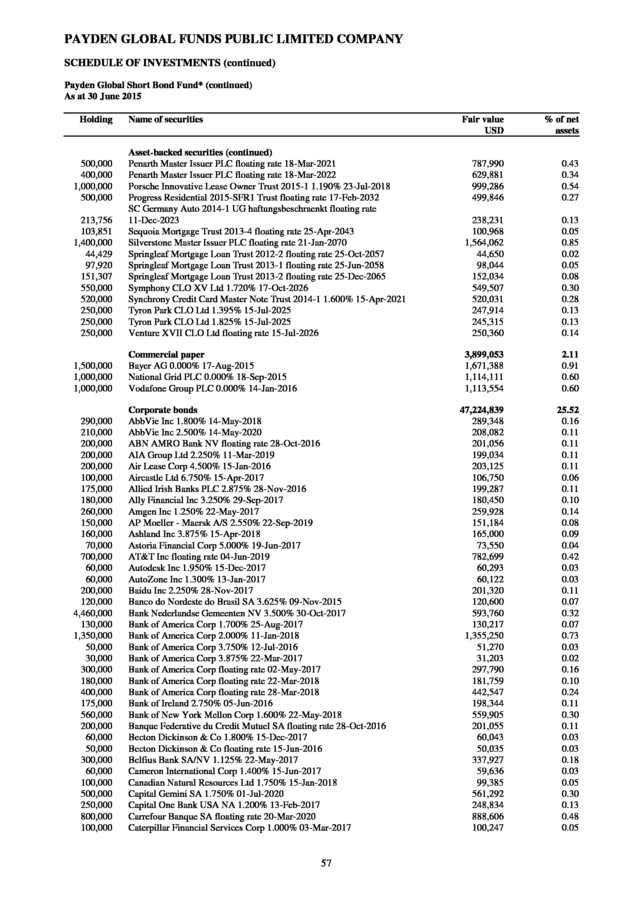
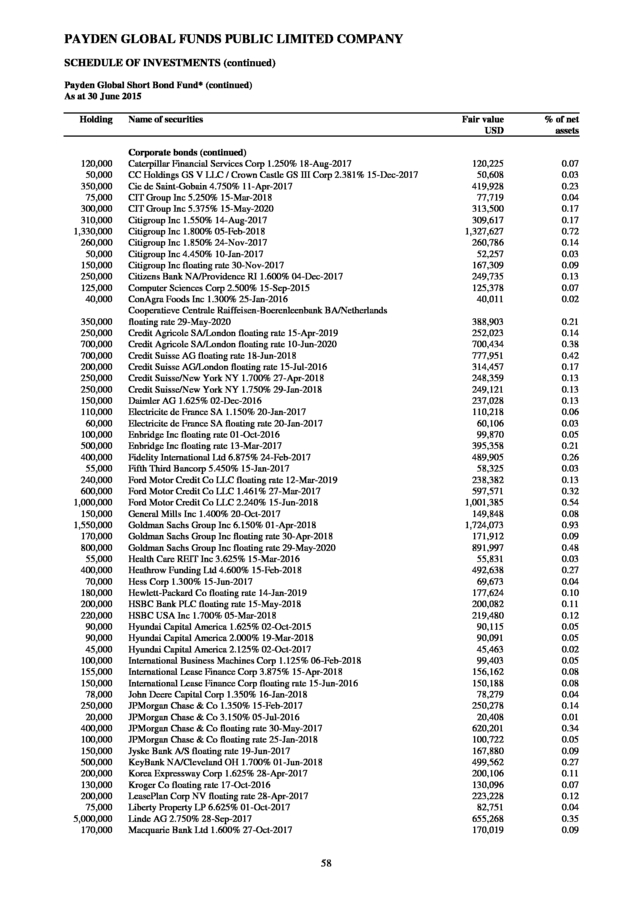
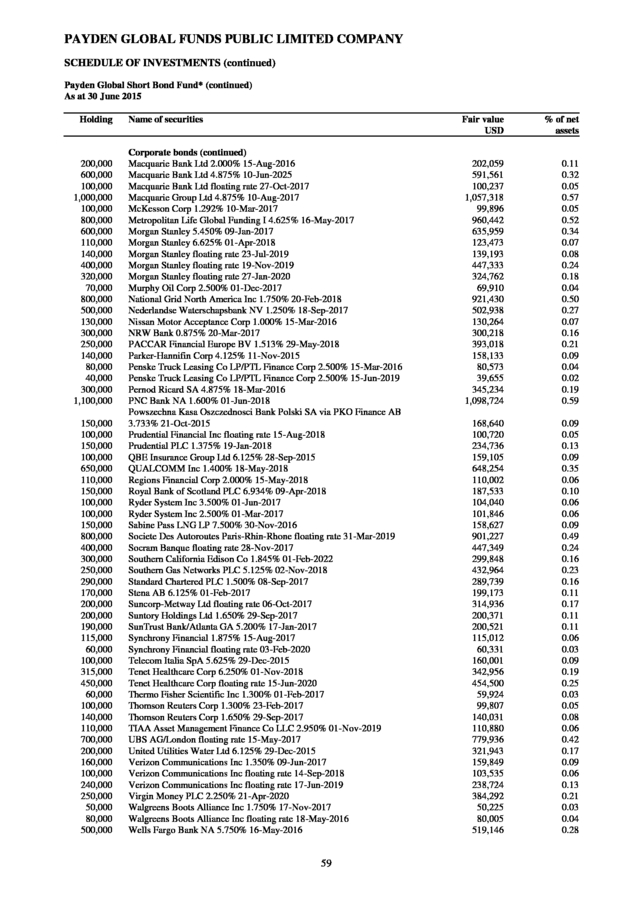
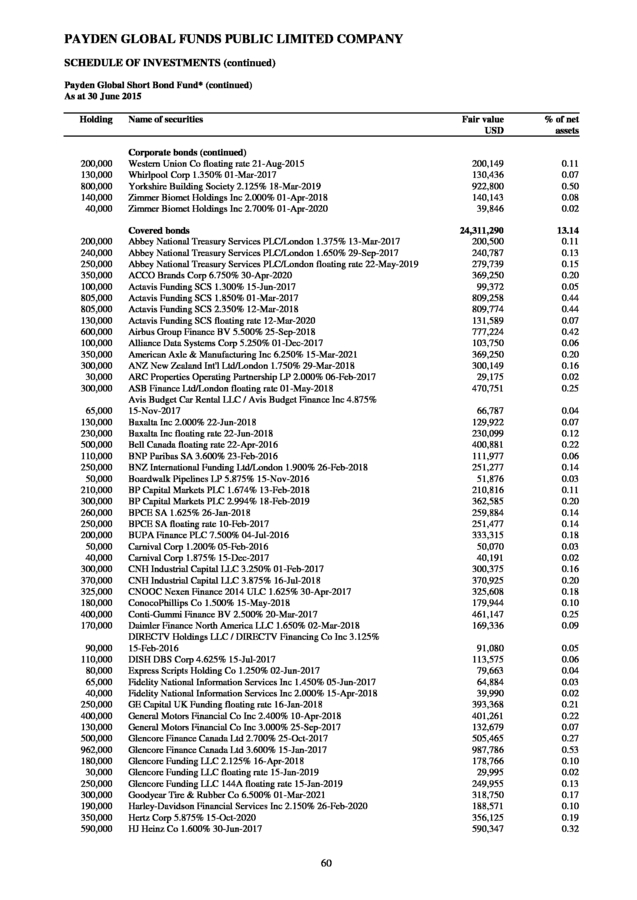
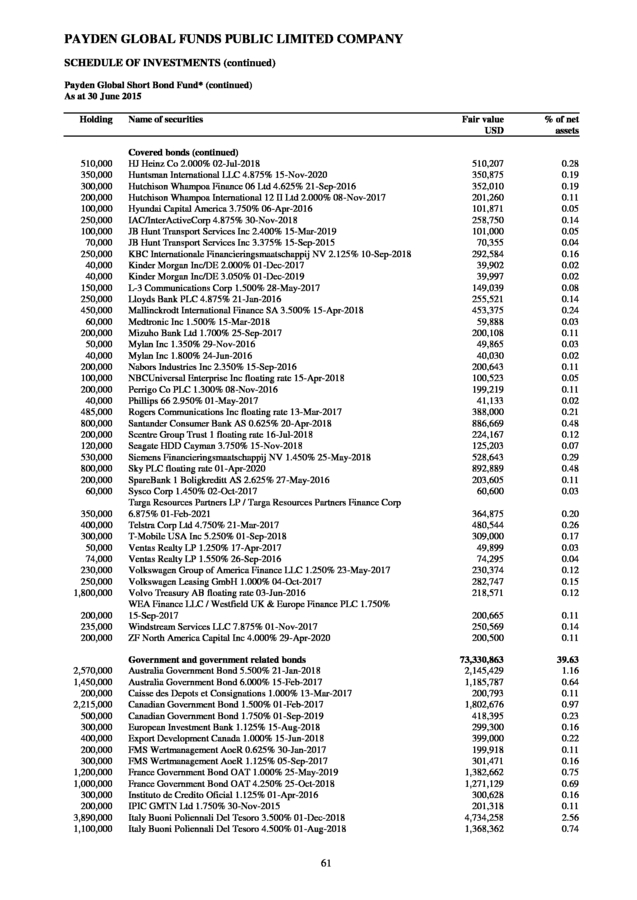
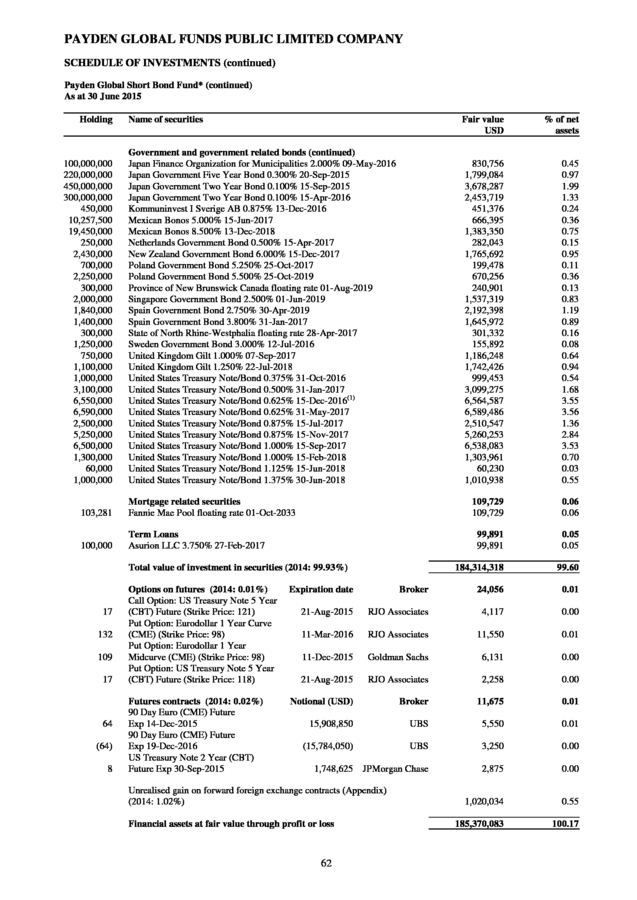
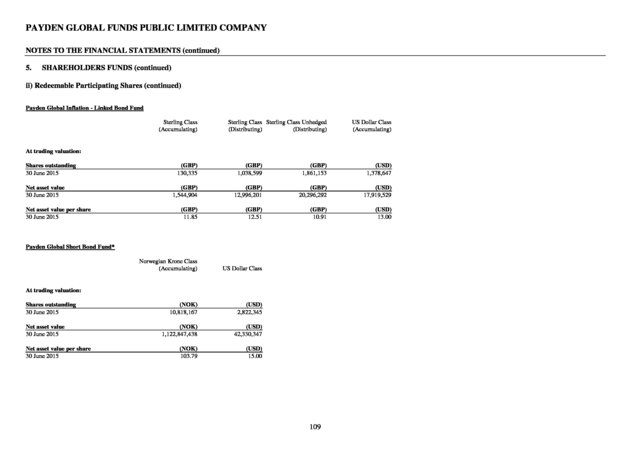
PAYDEN GLOBAL FUNDS PUBLIC LIMITED COMPANY INVESTMENT MANAGER’S REPORT FOR THE PERIOD ENDED 30 JUNE 2015 (continued) Payden Global Inflation-Linked Bond Fund The Payden Global Inflation-Linked Bond Fund (US Dollar Accumulating class) returned +0.10%, net of fees, over the six month period ending 30 June 2015. The Sterling hedged (Distributing) share class returned +0.11% and the Sterling Unhedged (Distributing) share class returned -1.83%. Fund duration at the end of June 2015 was 12.4 years, about 0.2 years lower than at the beginning of the period as we reduced the Fund’s sensitivity to potential interest rate rises. The Fund’s gross nominal yield to maturity ended at 1.96%. Fund performance was in-line with the sector over the six month period. Portfolio Characteristics As of 30 June 2015 Country Distribution Credit Allocation Duration Allocation United States 45% AAA 53% 0 - 1 years 1% United Kingdom 32% AA 40% 1 - 3 years 14% France 9% BBB 7% 3 - 5 years 12% Italy 7% 5 - 7 years 11% Germany 3% 7 - 10 years 25% Canada 2% 10+ years 37% Payden Global Short Bond Fund* The Payden Global Short Bond Fund (US Dollar class) returned +0.89% over the six months period ending 30 June 2015. The Norwegian Accumulating share class returned +1.39%. Fund duration at the end of June was 1.51 years, decreased by 0.15 years over the six month period as we reduced the Fund’s sensitivity to potential interest rate rises. The Fund’s yield to maturity ended at 1.18%. The Fund’s exposure to investment-grade corporate bonds contributed positively during the first quarter of 2015 given spreads tightened as risk appetite increased.
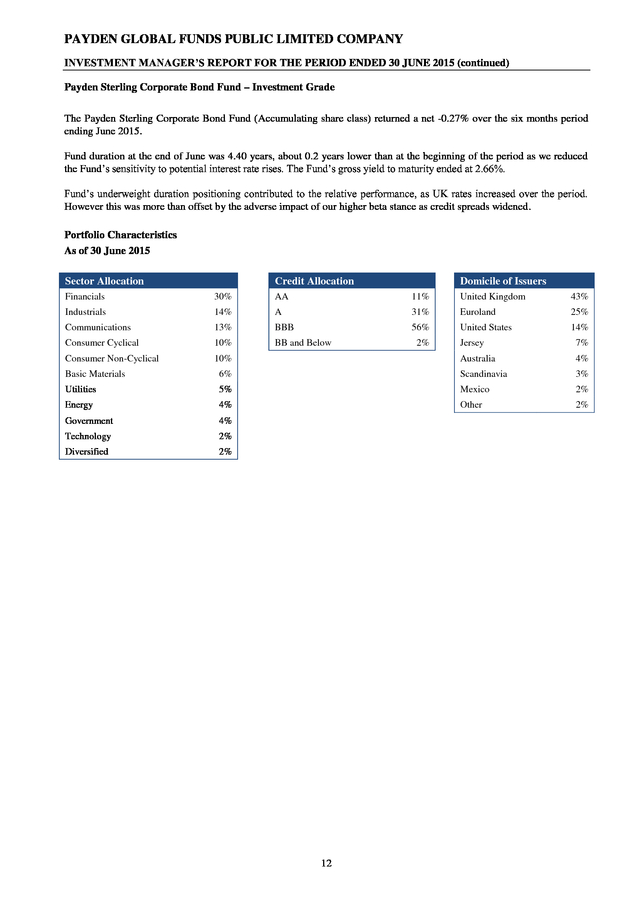
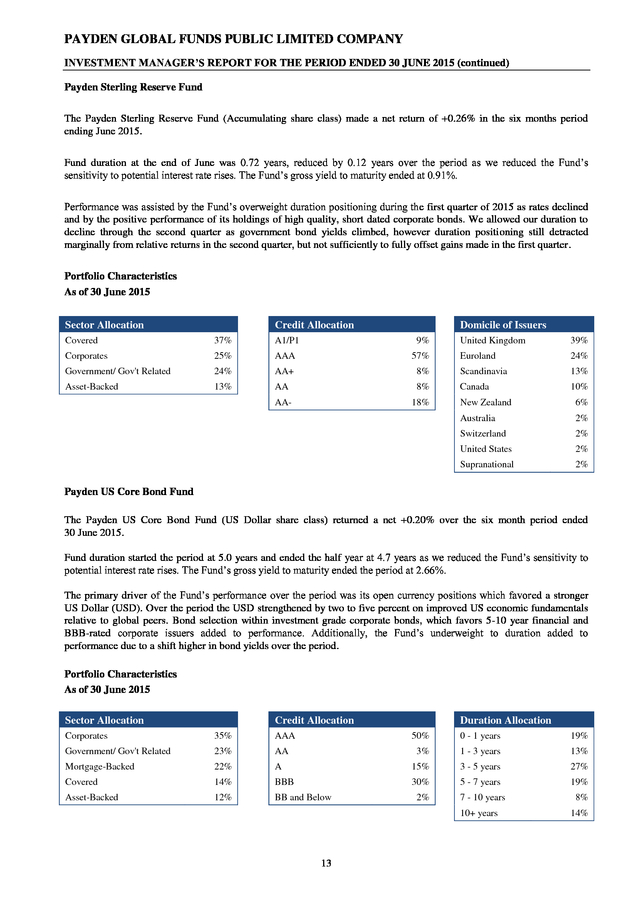
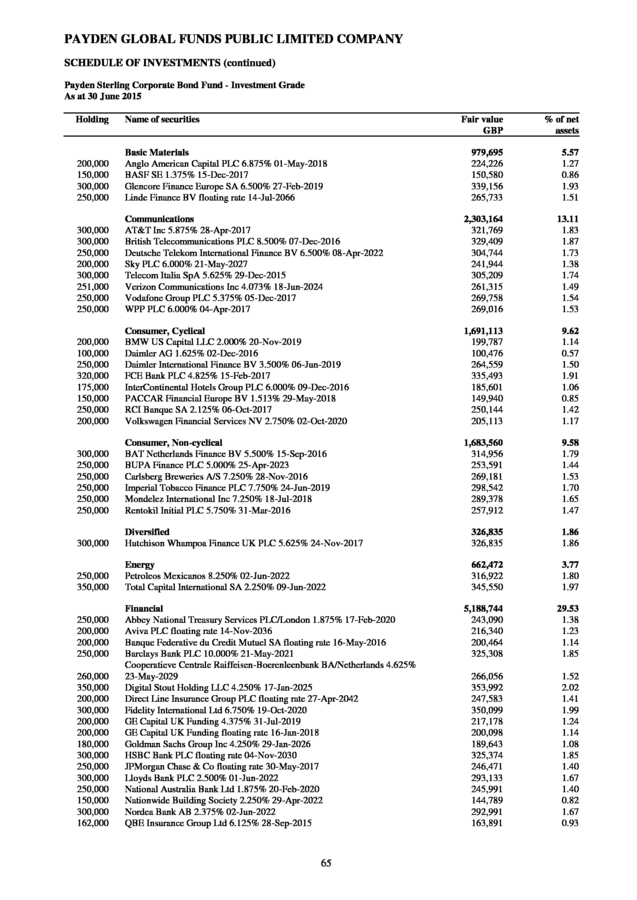
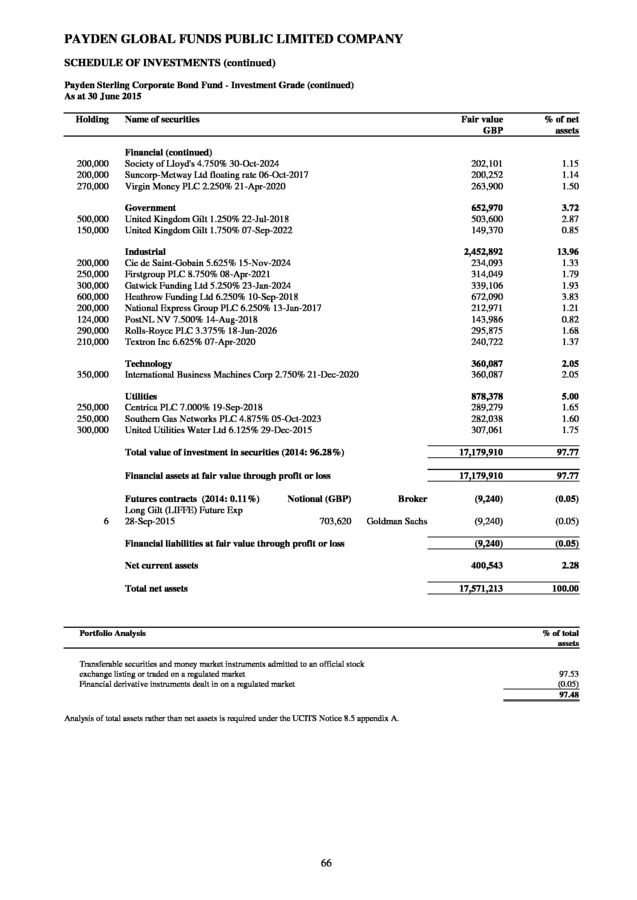
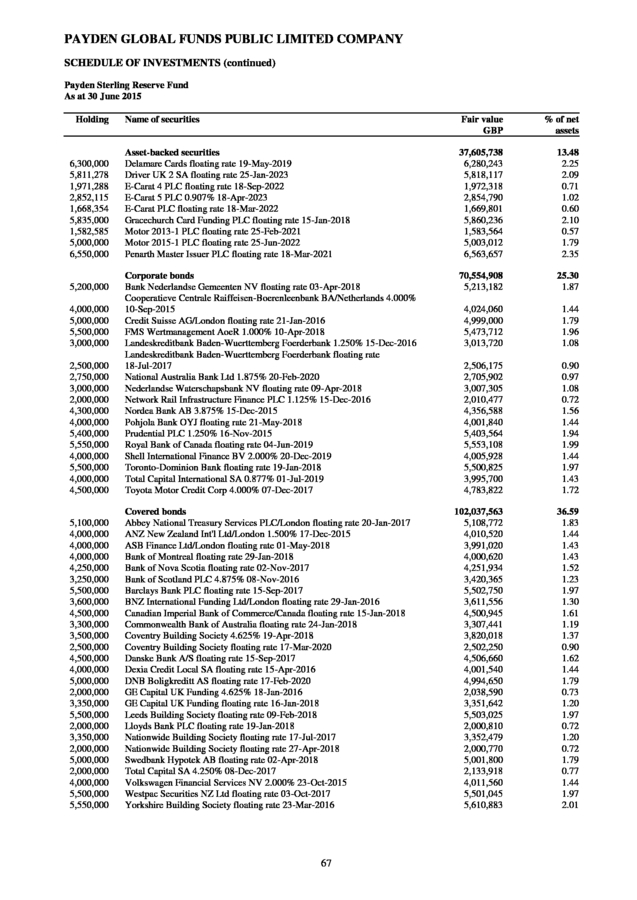
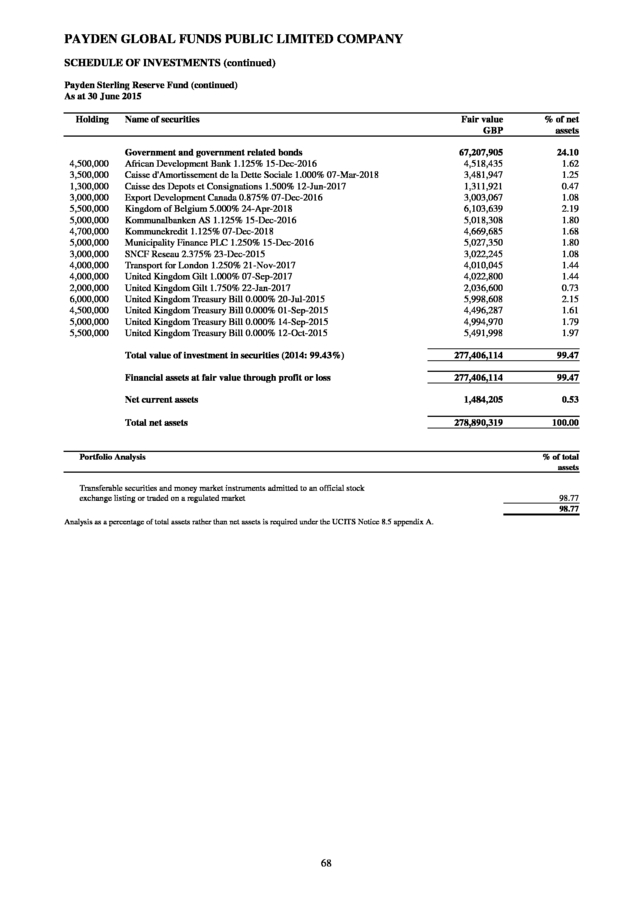
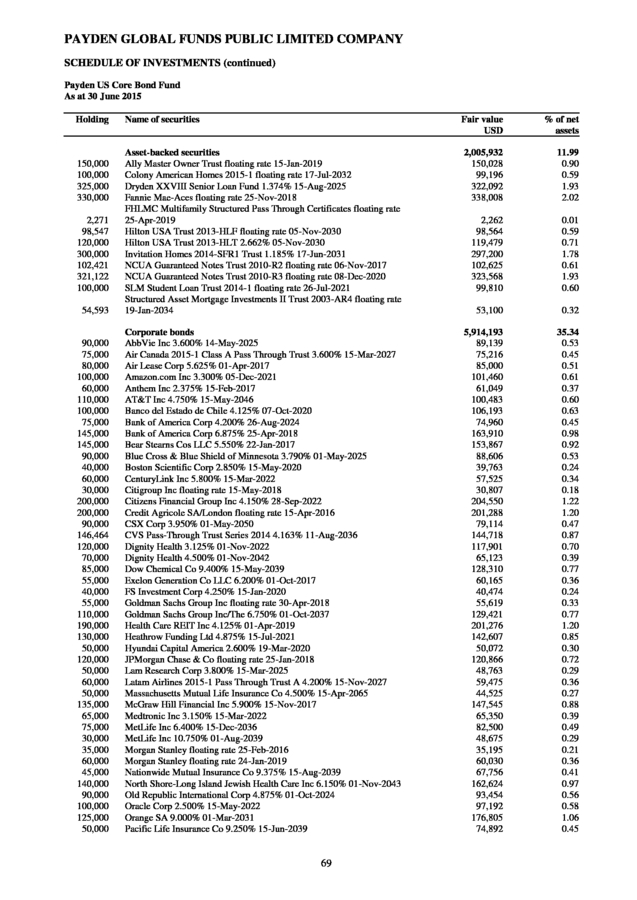
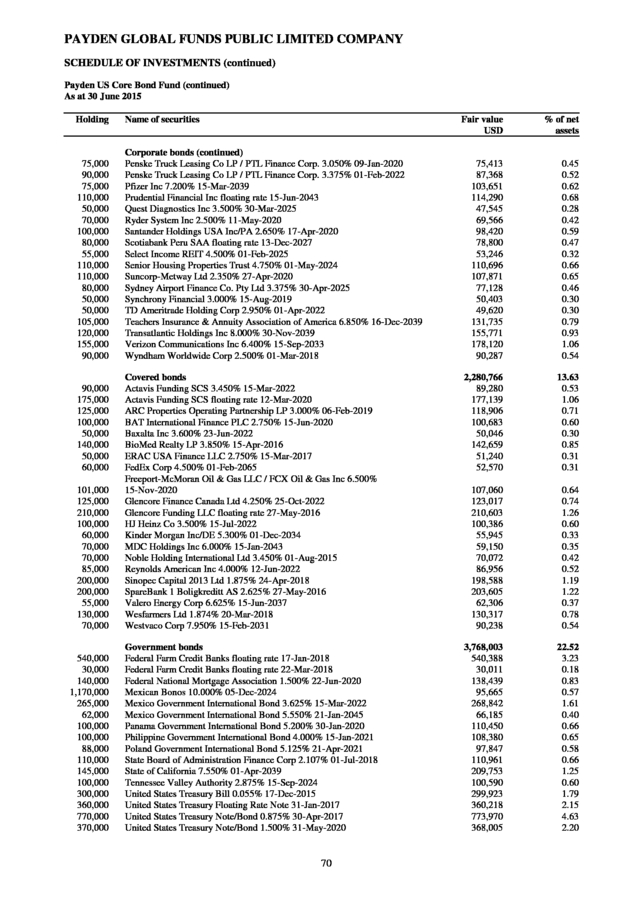
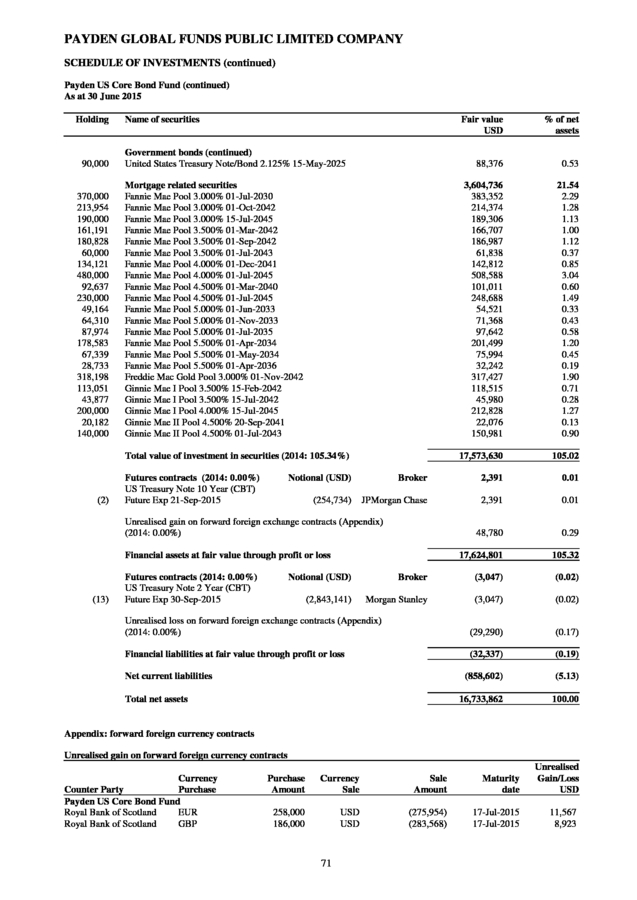
However, some of these gains were partially offset by credit spread widening during the second quarter of 2015. The portfolio’s currency positioning made a positive contribution to performance, led by short JPY, EUR and NZD positions against the USD. Portfolio Characteristics As of 30 June 2015 Top-10 Country Allocation Sector Allocation Credit Allocation United States 47% Government/ Gov't Related 40% AAA Euroland 20% Corporates 26% AA 36% 8% United Kingdom 9% Asset-Backed 19% A 25% Japan 6% Covered 13% BBB 27% Australia 4% Commercial paper Canada 3% New Zealand 1% Scandinavia 1% Switzerland 1% Mexico 1% 2% 11 4% Unrated Other 7% * This Fund changed name from Payden International Short Bond Fund on 24 March 2015. BB and Below 0% . PAYDEN GLOBAL FUNDS PUBLIC LIMITED COMPANY INVESTMENT MANAGER’S REPORT FOR THE PERIOD ENDED 30 JUNE 2015 (continued) Payden Sterling Corporate Bond Fund – Investment Grade The Payden Sterling Corporate Bond Fund (Accumulating share class) returned a net -0.27% over the six months period ending June 2015. Fund duration at the end of June was 4.40 years, about 0.2 years lower than at the beginning of the period as we reduced the Fund’s sensitivity to potential interest rate rises. The Fund’s gross yield to maturity ended at 2.66%. Fund’s underweight duration positioning contributed to the relative performance, as UK rates increased over the period. However this was more than offset by the adverse impact of our higher beta stance as credit spreads widened. Portfolio Characteristics As of 30 June 2015 Sector Allocation Credit Allocation Domicile of Issuers Financials 30% AA 11% United Kingdom 43% Industrials 14% A 31% Euroland 25% Communications 13% BBB 56% United States 14% Consumer Cyclical 10% BB and Below Consumer Non-Cyclical 10% 2% Jersey 7% Australia 4% Basic Materials 6% Scandinavia 3% Utilities 5% Mexico 2% Energy 4% Other 2% Government 4% Technology 2% Diversified 2% 12 . PAYDEN GLOBAL FUNDS PUBLIC LIMITED COMPANY INVESTMENT MANAGER’S REPORT FOR THE PERIOD ENDED 30 JUNE 2015 (continued) Payden Sterling Reserve Fund The Payden Sterling Reserve Fund (Accumulating share class) made a net return of +0.26% in the six months period ending June 2015. Fund duration at the end of June was 0.72 years, reduced by 0.12 years over the period as we reduced the Fund’s sensitivity to potential interest rate rises. The Fund’s gross yield to maturity ended at 0.91%. Performance was assisted by the Fund’s overweight duration positioning during the first quarter of 2015 as rates declined and by the positive performance of its holdings of high quality, short dated corporate bonds. We allowed our duration to decline through the second quarter as government bond yields climbed, however duration positioning still detracted marginally from relative returns in the second quarter, but not sufficiently to fully offset gains made in the first quarter. Portfolio Characteristics As of 30 June 2015 Sector Allocation Credit Allocation Domicile of Issuers Covered 37% A1/P1 9% Corporates 25% AAA 57% United Kingdom 39% Euroland 24% Government/ Gov't Related 24% AA+ 8% Scandinavia 13% Asset-Backed 13% AA 8% Canada 10% AA- 18% New Zealand 6% Australia 2% Switzerland 2% United States 2% Supranational 2% Payden US Core Bond Fund The Payden US Core Bond Fund (US Dollar share class) returned a net +0.20% over the six month period ended 30 June 2015. Fund duration started the period at 5.0 years and ended the half year at 4.7 years as we reduced the Fund’s sensitivity to potential interest rate rises. The Fund’s gross yield to maturity ended the period at 2.66%. The primary driver of the Fund’s performance over the period was its open currency positions which favored a stronger US Dollar (USD).
Over the period the USD strengthened by two to five percent on improved US economic fundamentals relative to global peers. Bond selection within investment grade corporate bonds, which favors 5-10 year financial and BBB-rated corporate issuers added to performance. Additionally, the Fund’s underweight to duration added to performance due to a shift higher in bond yields over the period. Portfolio Characteristics As of 30 June 2015 Sector Allocation Credit Allocation Corporates 35% AAA Government/ Gov't Related 23% AA Mortgage-Backed 22% A Covered 14% BBB Asset-Backed 12% BB and Below Duration Allocation 50% 0 - 1 years 19% 3% 1 - 3 years 13% 15% 3 - 5 years 27% 30% 5 - 7 years 19% 2% 7 - 10 years 10+ years 13 8% 14% .
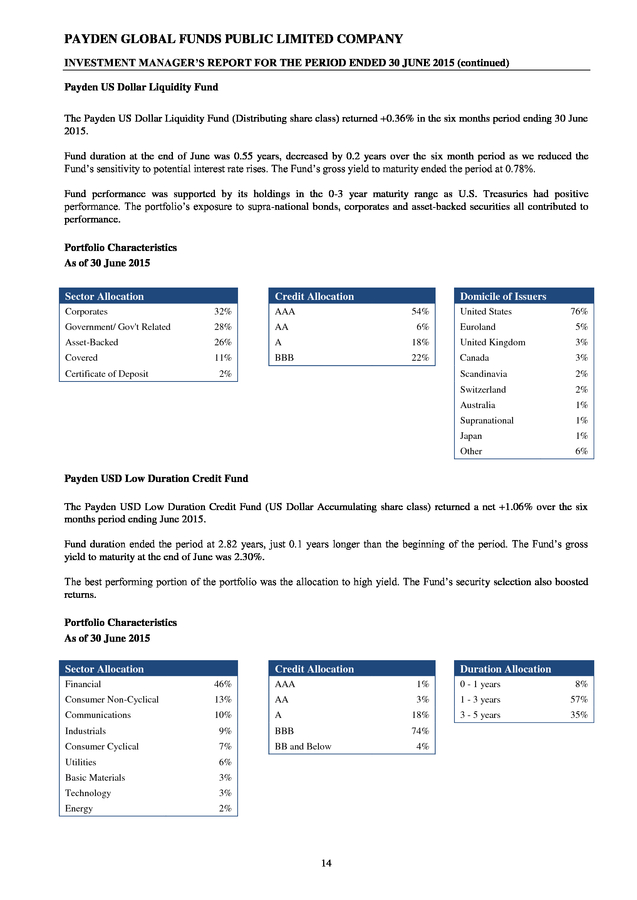
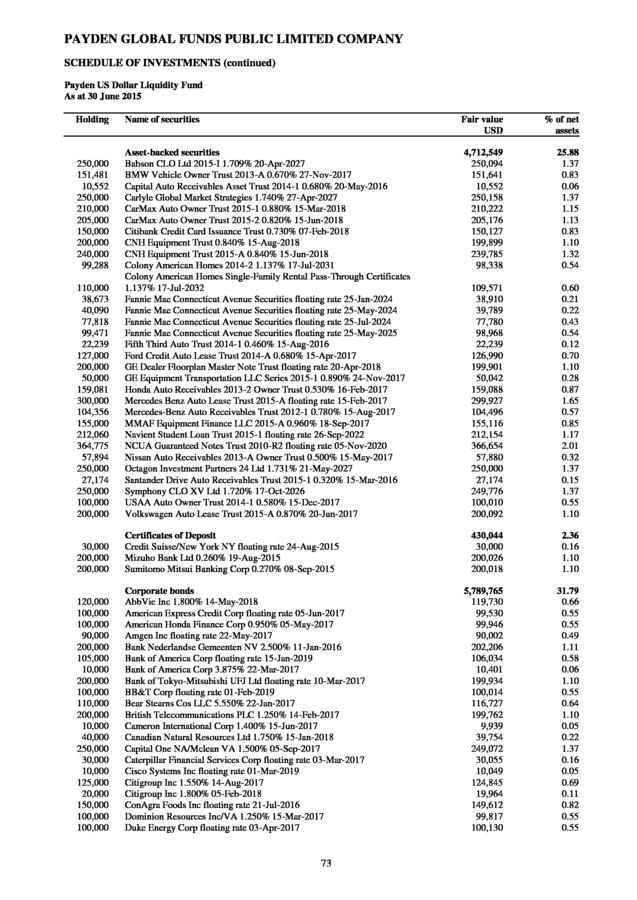
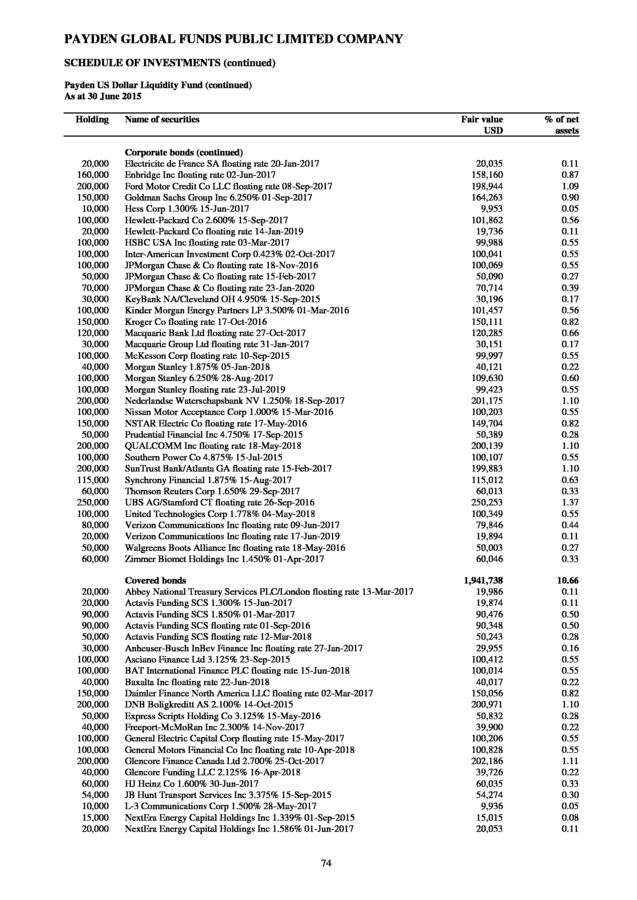
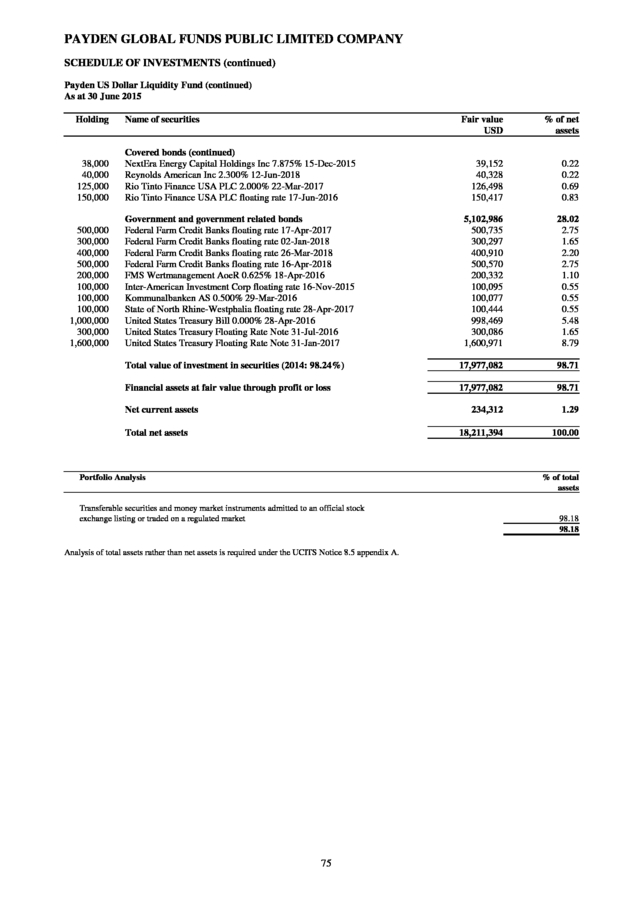
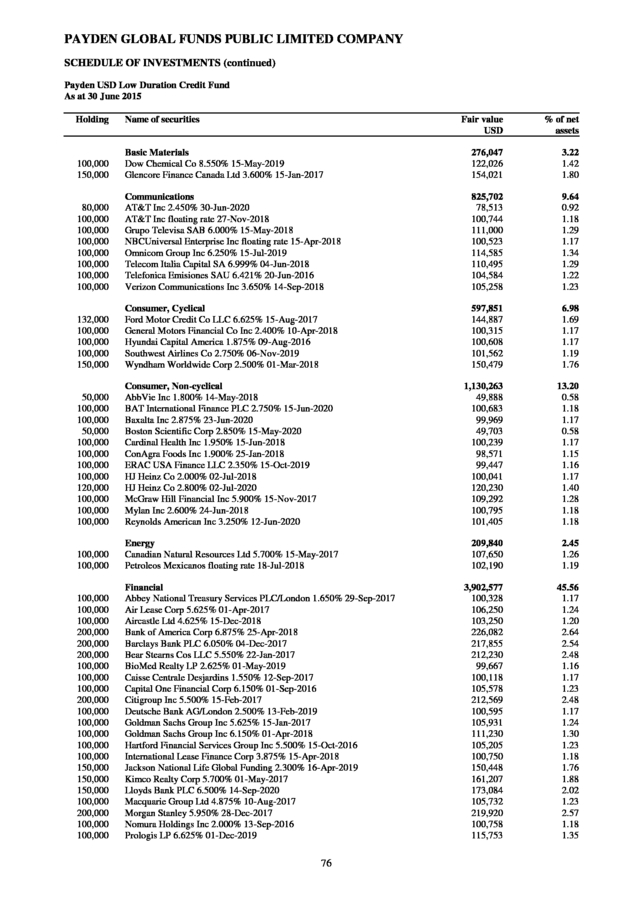
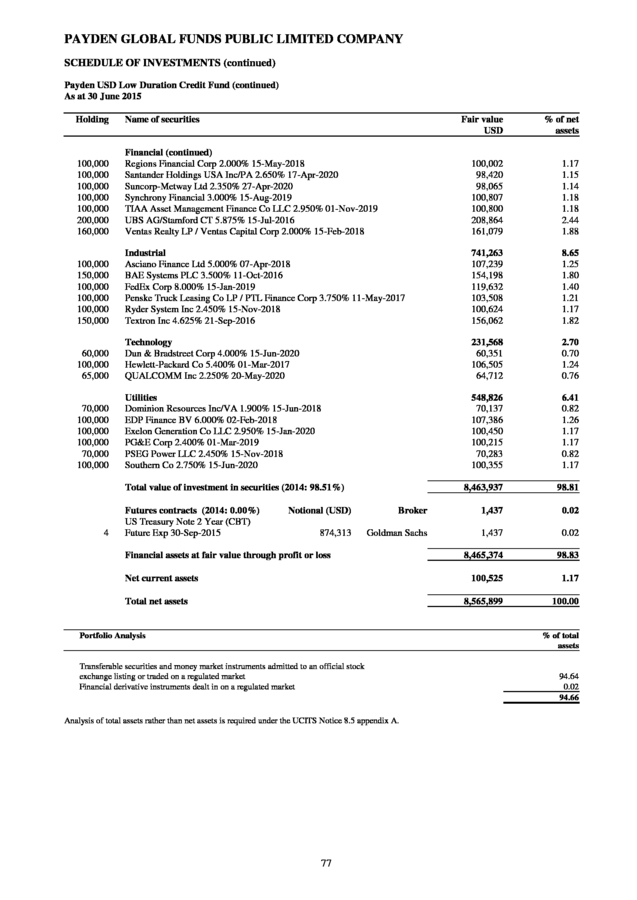
PAYDEN GLOBAL FUNDS PUBLIC LIMITED COMPANY INVESTMENT MANAGER’S REPORT FOR THE PERIOD ENDED 30 JUNE 2015 (continued) Payden US Dollar Liquidity Fund The Payden US Dollar Liquidity Fund (Distributing share class) returned +0.36% in the six months period ending 30 June 2015. Fund duration at the end of June was 0.55 years, decreased by 0.2 years over the six month period as we reduced the Fund’s sensitivity to potential interest rate rises. The Fund’s gross yield to maturity ended the period at 0.78%. Fund performance was supported by its holdings in the 0-3 year maturity range as U.S. Treasuries had positive performance. The portfolio’s exposure to supra-national bonds, corporates and asset-backed securities all contributed to performance. Portfolio Characteristics As of 30 June 2015 Sector Allocation Credit Allocation Domicile of Issuers Corporates 32% AAA Government/ Gov't Related 28% AA Euroland 5% Asset-Backed 26% A 18% United Kingdom 3% Covered 11% BBB 22% Canada 3% Scandinavia 2% Switzerland 2% Australia 1% Supranational 1% Japan 1% Other 6% Certificate of Deposit 54% 6% 2% United States 76% Payden USD Low Duration Credit Fund The Payden USD Low Duration Credit Fund (US Dollar Accumulating share class) returned a net +1.06% over the six months period ending June 2015. Fund duration ended the period at 2.82 years, just 0.1 years longer than the beginning of the period.
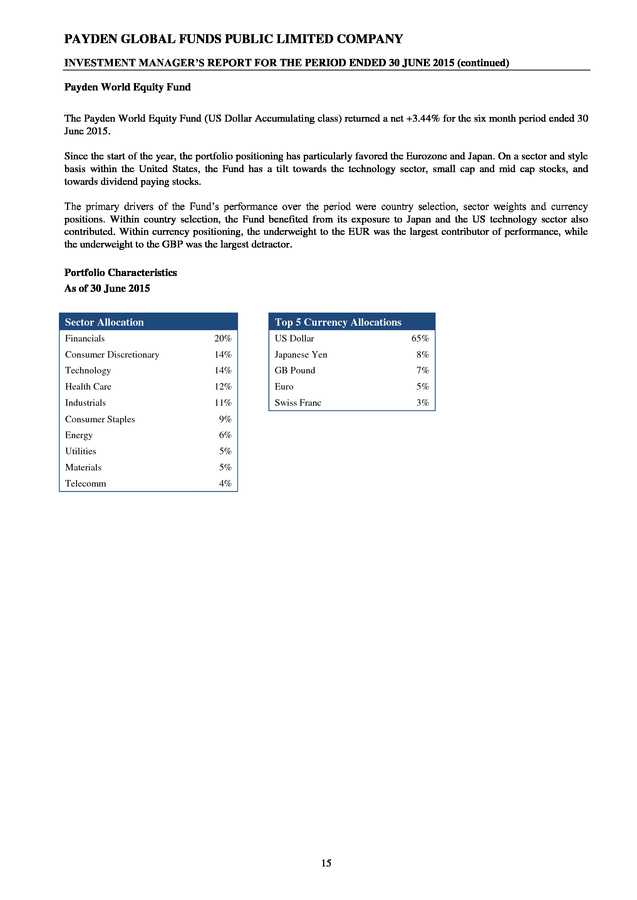
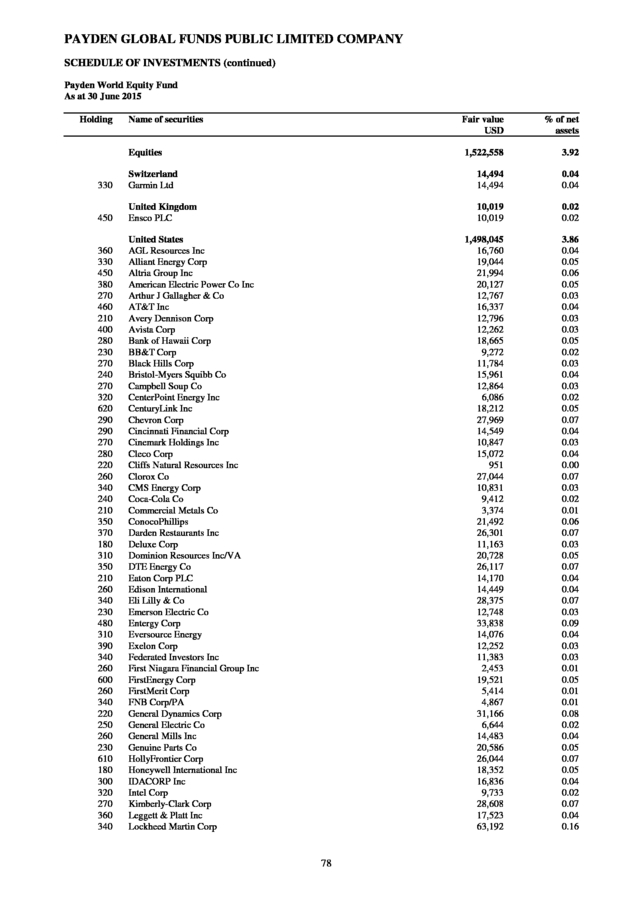
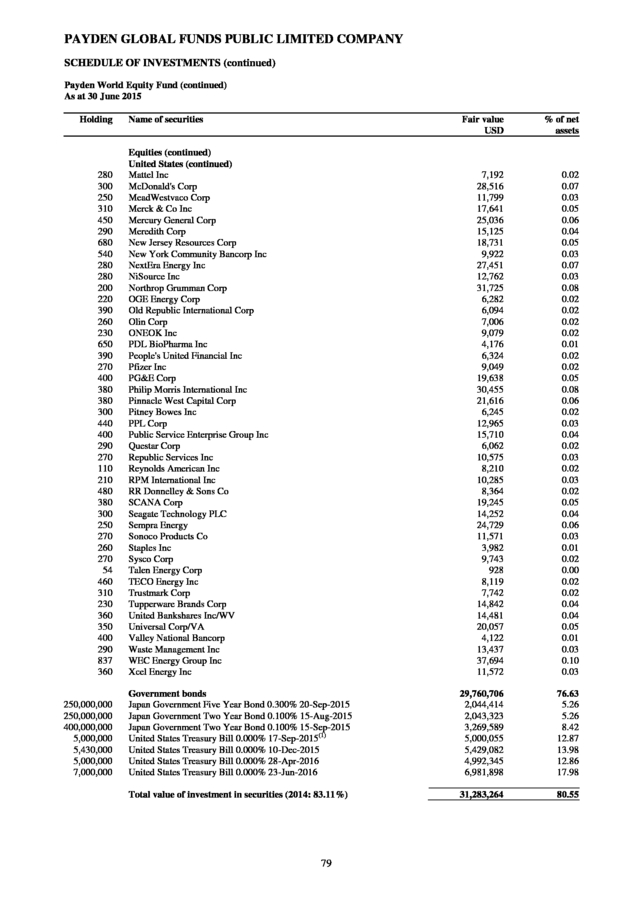
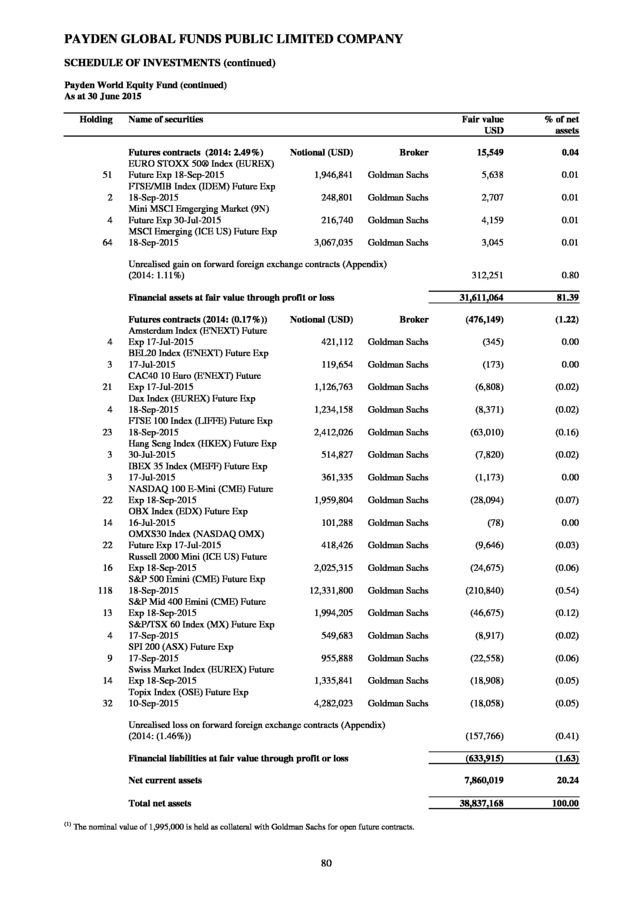
The Fund’s gross yield to maturity at the end of June was 2.30%. The best performing portion of the portfolio was the allocation to high yield. The Fund’s security selection also boosted returns. Portfolio Characteristics As of 30 June 2015 Sector Allocation Credit Allocation Duration Allocation Financial 46% AAA 1% Consumer Non-Cyclical 13% AA Communications 10% A 3% 74% 9% BBB Consumer Cyclical 7% BB and Below Utilities 6% Basic Materials 3% Technology 3% Energy 2% 14 8% 1 - 3 years 57% 18% Industrials 0 - 1 years 3 - 5 years 35% 4% . PAYDEN GLOBAL FUNDS PUBLIC LIMITED COMPANY INVESTMENT MANAGER’S REPORT FOR THE PERIOD ENDED 30 JUNE 2015 (continued) Payden World Equity Fund The Payden World Equity Fund (US Dollar Accumulating class) returned a net +3.44% for the six month period ended 30 June 2015. Since the start of the year, the portfolio positioning has particularly favored the Eurozone and Japan. On a sector and style basis within the United States, the Fund has a tilt towards the technology sector, small cap and mid cap stocks, and towards dividend paying stocks. The primary drivers of the Fund’s performance over the period were country selection, sector weights and currency positions. Within country selection, the Fund benefited from its exposure to Japan and the US technology sector also contributed. Within currency positioning, the underweight to the EUR was the largest contributor of performance, while the underweight to the GBP was the largest detractor. Portfolio Characteristics As of 30 June 2015 Sector Allocation Top 5 Currency Allocations Financials 20% US Dollar Consumer Discretionary 14% Japanese Yen 8% Technology 14% GB Pound 7% Health Care 12% Euro 5% Industrials 11% Swiss Franc 3% Consumer Staples 9% Energy 6% Utilities 5% Materials 5% Telecomm 65% 4% 15 .
PAYDEN GLOBAL FUNDS PUBLIC LIMITED COMPANY SCHEDULE OF INVESTMENTS Payden Absolute Return Bond Fund As at 30 June 2015 Holding 555,000 810,939 487,282 534,343 448,686 864,471 147,322 270,000 460,000 407,693 55,466 200,000 1,256,471 549,719 1,120,000 658,040 178,718 290,000 215,042 640,767 105,514 637,164 481,081 1,306,258 253,044 1,014,605 1,680,875 1,691,776 530,411 168,914 354,207 596,986 171,849 492,290 354,570 1,472,940 2,770,272 896,448 743,669 531,241 204,585 310,000 590,000 410,000 380,000 96,052 449,603 201,793 300,000 482,387 Name of securities Fair value USD % of net assets Asset-backed securities Ally Master Owner Trust floating rate 15-Apr-2018 Alternative Loan Trust 2005-54CB 5.125% 25-Nov-2035 Alternative Loan Trust 2006-34 6.250% 25-Nov-2046 Alternative Loan Trust 2006-36T2 6.250% 25-Dec-2036 Alternative Loan Trust 2006-J5 6.500% 25-Sep-2036 Alternative Loan Trust 2007-9T1 6.000% 25-May-2037 American Homes 4 Rent 1.250% 17-Jun-2031 American Residential Properties 2014-SFR1 Trust floating rate 17-Sep-2031 Apidos CLO XIV floating rate 15-Apr-2025 Banc of America Funding 2005-H Trust floating rate 20-Nov-2035 Bank of America Mortgage 2002-K Trust floating rate 20-Oct-2032 Barclays Dryrock Issuance Trust floating rate 16-Jul-2018 BCAP LLC Trust 2007-AA2 6.000% 25-Apr-2037 Bear Stearns ARM Trust 2007-4 floating rate 25-Jun-2047 Citibank Credit Card Issuance Trust 4.150% 07-Jul-2017 Citigroup Mortgage Loan Trust 2006-4 6.000% 25-Dec-2035 Colony American Homes 2014-2 1.137% 17-Jul-2031 Colony American Homes 2015-1 floating rate 17-Jul-2032 Colony American Homes Single-Family Rental Pass-Through Certificates 1.400% 17-May-2031 CSMC Mortgage-Backed Trust 2006-7 6.000% 25-Aug-2036 CSMC Trust 2013-IVR2 floating rate 25-Apr-2043 Fannie Mae Connecticut Avenue Securities floating rate 25-Oct-2023 Fannie Mae Connecticut Avenue Securities 1M1 floating rate 25-May-2024 Fannie Mae Connecticut Avenue Securities 1M2 floating rate 25-May-2024 Fannie Mae Connecticut Avenue Securities floating rate 25-Nov-2024 Fannie Mae Connecticut Avenue Securities floating rate 25-May-2025 Fannie Mae Connecticut Avenue Securities 1M1 floating rate 25-Jul-2024 Fannie Mae Connecticut Avenue Securities 2M1 floating rate 25-Jul-2024 First Horizon Alternative Mortgage Securities Trust 2006-FA2 6.000% 25May-2036 Freddie Mac Structured Agency Credit Risk Debt Notes floating rate 25-Nov-2023 Freddie Mac Structured Agency Credit Risk Debt Notes floating rate 25-Feb-2024 Freddie Mac Structured Agency Credit Risk Debt Notes floating rate 25-Aug-2024 Freddie Mac Structured Agency Credit Risk Debt Notes floating rate 25-Oct-2024 Freddie Mac Structured Agency Credit Risk Debt Notes floating rate 25-Mar-2025 Freddie Mac Structured Agency Credit Risk Debt Notes floating rate 25-Oct-2027 Government National Mortgage Association floating rate 20-Jun-2036 Government National Mortgage Association floating rate 20-Nov-2036 GreenPoint MTA Trust 2005-AR1 floating rate 25-Jun-2045 GSR Mortgage Loan Trust 2007-AR2 floating rate 25-May-2037 IndyMac INDX Mortgage Loan Trust 2005-AR13 floating rate 25-Aug-2035 Invitation Homes 2013-SFR1 Trust 1.400% 17-Dec-2030 Invitation Homes 2014-SFR1 Trust 1.185% 17-Jun-2031 Invitation Homes 2014-SFR2 Trust floating rate 17-Sep-2031 Invitation Homes 2015-SFR3 Trust 1.483% 25-Mar-2055 JP Morgan Chase Commercial Mortgage Securities Trust 2015-COSMO floating rate 15-Jan-2032 MMAF Equipment Finance LLC 2013-A 0.690% 09-May-2016 Morgan Stanley Mortgage Loan Trust 2004-7AR floating rate 25-Sep-2034 Nationstar Mortgage Loan Trust 3.750% 25-Dec-2052 New Residential Mortgage Loan Trust 3.750% 25-Apr-2052 New Residential Mortgage Loan Trust 2014-2 3.750% 25-May-2054 33,565,639 555,319 751,445 402,333 428,932 407,321 714,854 147,121 267,896 447,659 342,693 56,246 200,047 1,070,561 495,187 1,120,692 613,529 177,008 287,669 35.71 0.59 0.80 0.43 0.46 0.43 0.76 0.16 0.28 0.48 0.36 0.06 0.21 1.14 0.53 1.19 0.65 0.19 0.31 214,327 557,933 99,498 645,553 477,466 1,298,993 255,004 1,009,472 1,680,039 1,690,608 0.23 0.59 0.11 0.69 0.51 1.38 0.27 1.07 1.79 1.80 452,898 0.48 169,174 0.18 354,080 0.38 599,045 0.64 172,324 0.18 491,068 0.52 353,917 69,329 127,905 782,758 615,470 468,135 204,102 307,106 585,402 412,279 0.38 0.07 0.14 0.83 0.65 0.50 0.22 0.33 0.62 0.44 379,630 96,058 438,922 206,848 306,375 500,853 0.40 0.10 0.47 0.22 0.33 0.53 16 . PAYDEN GLOBAL FUNDS PUBLIC LIMITED COMPANY SCHEDULE OF INVESTMENTS (continued) Payden Absolute Return Bond Fund (continued) As at 30 June 2015 Holding 480,285 375,000 400,000 113,409 182,933 58,443 400,000 102,146 207,702 400,000 901,324 360,054 150,000 607,711 501,328 247,756 750,000 494,745 861,646 817,078 137,943 595,513 389,273 295,000 160,000 260,000 295,000 250,000 200,000 360,000 225,000 110,000 250,000 350,000 180,000 195,000 270,000 290,000 260,000 350,000 180,000 350,000 110,000 250,000 150,000 180,000 230,000 442,000 225,000 350,000 220,000 80,000 710,000 Name of securities Fair value USD Asset-backed securities (continued) New Residential Mortgage Loan Trust 2014-3 floating rate 25-Nov-2054 North End CLO Ltd 2013-1 floating rate 17-Jul-2025 Octagon Investment Partners XIV Ltd floating rate 15-Jan-2024 Provident Funding Mortgage Loan Trust 2005-2 floating rate 25-Oct-2035 RALI Series 2007-QS1 Trust 6.000% 25-Jan-2037 RASC Series 2003-KS9 Trust floating rate 25-Nov-2033 Santander Drive Auto Receivables Trust 2015-3 3.490% 17-May-2021 Sequoia Mortgage Trust 2013-1 floating rate 25-Feb-2043 Sequoia Mortgage Trust 2013-4 floating rate 25-Apr-2043 Springleaf Mortgage Loan Trust 2013-2 floating rate 25-Dec-2065 Structured Asset Mortgage Investments II Trust 2006-AR7 floating rate 25-Aug-2036 VOLT XXII LLC 3.500% 25-Feb-2055 VOLT XXV LLC 3.500% 26-Jun-2045 VOLT XXVI LLC 3.125% 25-Sep-2043 VOLT XXXIII LLC 3.500% 25-Mar-2055 VOLT XXXIV LLC 3.500% 25-Feb-2055 VOLT XXXV LLC 3.375% 26-Jun-2045 WaMu Mortgage Pass-Through Certificates Series 2005-AR11 Trust floating rate 25-Aug-2045 WaMu Mortgage Pass-Through Certificates Series 2006-AR10 Trust floating rate 25-Sep-2036 WaMu Mortgage Pass-Through Certificates Series 2006-AR8 Trust floating rate 25-Aug-2046 WaMu Mortgage Pass-Through Certificates Series 2007-HY7 Trust floating rate 25-Jul-2037 Wells Fargo Alternative Loan 2007-PA2 Trust 6.000% 25-Jun-2037 Wells Fargo Mortgage Backed Securities 2005-18 Trust 5.500% 25-Jan-2036 Corporate bonds 1011778 BC ULC / New Red Finance Inc 6.000% 01-Apr-2022 AbbVie Inc 2.500% 14-May-2020 ABN AMRO Bank NV floating rate 13-Sep-2022 AES Corp/VA floating rate 01-Jun-2019 AIA Group Ltd 2.250% 11-Mar-2019 Air Canada 8.750% 01-Apr-2020 Air Lease Corp 2.125% 15-Jan-2018 American Honda Finance Corp 1.000% 11-Aug-2015 American Honda Finance Corp 2.125% 10-Oct-2018 American Tower Corp 4.500% 15-Jan-2018 Amgen Inc 2.125% 01-May-2020 Amgen Inc 3.875% 15-Nov-2021 ArcelorMittal 5.250% 25-Feb-2017 Ardagh Packaging Finance PLC / Ardagh Holdings USA Inc floating rate 15-Dec-2019 Argos Merger Sub Inc 7.125% 15-Mar-2023 Arizona Public Service Co 2.200% 15-Jan-2020 AT&T Inc 2.450% 30-Jun-2020 AT&T Inc 3.400% 15-May-2025 AT&T Inc 4.500% 15-May-2035 AT&T Inc 4.750% 15-May-2046 AutoZone Inc 2.500% 15-Apr-2021 Banco Santander Brasil SA/Cayman Islands 4.250% 14-Jan-2016 Banco Santander Chile floating rate 11-Apr-2017 Bank of America Corp floating rate 15-Jan-2019 Bank of Montreal 2.375% 25-Jan-2019 Banque Federative du Credit Mutuel SA floating rate 28-Oct-2016 Barclays PLC 2.875% 08-Jun-2020 Baylor Scott & White Holdings 2.123% 15-Nov-2020 BBVA Banco Continental SA 2.250% 29-Jul-2016 Boston Scientific Corp 3.850% 15-May-2025 17 % of net assets 503,240 359,925 399,975 113,082 157,127 56,739 401,883 99,192 201,935 408,767 0.54 0.38 0.43 0.12 0.17 0.06 0.43 0.11 0.21 0.43 709,937 360,466 149,835 608,260 502,745 247,354 749,250 0.75 0.38 0.16 0.65 0.53 0.26 0.80 467,624 0.50 782,178 0.83 697,384 0.74 118,078 583,277 378,303 0.13 0.62 0.40 30,908,382 303,850 158,538 280,150 295,737 248,793 221,750 357,300 225,151 111,718 264,705 343,107 189,023 203,044 32.88 0.32 0.17 0.30 0.31 0.26 0.24 0.38 0.24 0.12 0.28 0.37 0.20 0.22 263,588 304,500 257,985 343,494 172,022 322,774 100,483 245,278 152,231 179,603 232,266 448,026 226,187 347,941 217,091 80,440 690,274 0.28 0.32 0.27 0.37 0.18 0.34 0.11 0.26 0.16 0.19 0.25 0.48 0.24 0.37 0.23 0.09 0.73 . PAYDEN GLOBAL FUNDS PUBLIC LIMITED COMPANY SCHEDULE OF INVESTMENTS (continued) Payden Absolute Return Bond Fund (continued) As at 30 June 2015 Holding 164,000 350,000 410,000 400,000 360,000 375,000 375,000 210,000 300,000 250,000 250,000 350,000 600,000 560,000 200,000 170,000 265,000 400,000 300,000 410,000 400,000 600,000 200,000 225,000 250,000 270,000 300,000 120,000 250,000 240,000 700,000 150,000 700,000 200,000 150,000 290,000 350,000 210,000 220,000 180,000 240,000 280,000 400,000 330,000 200,000 225,000 200,000 560,000 250,000 460,000 400,000 245,000 180,000 170,000 200,000 210,000 350,000 150,000 230,000 Name of securities Fair value USD Corporate bonds (continued) Bumble Bee Holdings Inc 9.000% 15-Dec-2017 Chevron Corp 1.961% 03-Mar-2020 Citigroup Inc 2.500% 29-Jul-2019 Comision Federal de Electricidad 4.875% 26-May-2021 Commonwealth Bank of Australia/New York NY 1.625% 12-Mar-2018 Communications Sales & Leasing Inc 6.000% 15-Apr-2023 ConAgra Foods Inc 1.300% 25-Jan-2016 Continental Airlines 2012-3 Class C Pass Thru Certificates 6.125% 29-Apr-2018 Corp Financiera de Desarrollo SA 3.250% 15-Jul-2019 Credit Agricole SA/London 2.750% 10-Jun-2020 Credit Agricole SA floating rate 03-Oct-2016 Credit Suisse/New York NY 1.700% 27-Apr-2018 CSX Corp 7.375% 01-Feb-2019 Dominion Resources Inc/VA 2.500% 01-Dec-2019 DP World Ltd 3.250% 18-May-2020 Dun & Bradstreet Corp 4.000% 15-Jun-2020 E*TRADE Financial Corp 5.375% 15-Nov-2022 Fifth Third Bank/Cincinnati OH 2.875% 01-Oct-2021 Ford Motor Credit Co LLC floating rate 12-Mar-2019 Frontier Communications Corp 6.250% 15-Sep-2021 General Electric Capital Corp floating rate 15-Nov-2067 Goldman Sachs Group Inc 2.550% 23-Oct-2019 HBOS PLC 6.750% 21-May-2018 Heineken NV 0.800% 01-Oct-2015 Hewlett-Packard Co 2.600% 15-Sep-2017 HSBC USA Inc 1.700% 05-Mar-2018 Humana Inc 2.625% 01-Oct-2019 Hyundai Capital America 2.000% 19-Mar-2018 Industrial & Commercial Bank of China Ltd/New York 3.231% 13-Nov-2019 ING Bank NV floating rate 21-Nov-2023 John Deere Capital Corp 2.250% 17-Apr-2019 Johnson Controls Inc 1.400% 02-Nov-2017 JPMorgan Chase & Co 2.250% 23-Jan-2020 Korea Hydro & Nuclear Power Co Ltd 2.875% 02-Oct-2018 Kraft Heinz Foods Co 5.000% 15-Jul-2035 Kraft Heinz Foods Co 5.200% 15-Jul-2045 Latam Airlines 2015-1 Pass Through Trust A 4.200% 15-Nov-2027 Macquarie Bank Ltd 6.625% 07-Apr-2021 Marsh & McLennan Cos Inc 2.550% 15-Oct-2018 McGraw Hill Financial Inc 5.900% 15-Nov-2017 Merck & Co Inc 1.850% 10-Feb-2020 Metropolitan Life Global Funding I 2.300% 10-Apr-2019 Mitsubishi UFJ Trust & Banking Corp 1.600% 16-Oct-2017 Moody's Corp 2.750% 15-Jul-2019 NetApp Inc 3.375% 15-Jun-2021 Nissan Motor Acceptance Corp 1.000% 15-Mar-2016 Numericable-SFR SAS 4.875% 15-May-2019 Oracle Corp 2.375% 15-Jan-2019 Penske Truck Leasing Co LP / PTL Finance Corp. 2.500% 15-Jun-2019 Pershing Square Holdings Ltd 5.500% 15-Jul-2022 PG&E Corp 2.400% 01-Mar-2019 Providence Health & Services Obligated Group floating rate 01-Oct-2016 Prudential Financial Inc floating rate 15-Jun-2038 Prudential Financial Inc floating rate 15-May-2045 QBE Insurance Group Ltd 2.400% 01-May-2018 QUALCOMM Inc 2.250% 20-May-2020 Sempra Energy 9.800% 15-Feb-2019 Sompo Japan Insurance Inc floating rate 28-Mar-2073 Southern Power Co 1.500% 01-Jun-2018 18 % of net assets 172,405 347,361 410,996 420,000 361,263 367,691 375,104 0.18 0.37 0.44 0.45 0.38 0.39 0.40 218,925 302,520 251,087 251,321 347,703 703,949 562,246 199,000 170,996 272,288 396,404 297,978 375,150 431,000 601,772 222,251 225,079 254,656 269,362 302,256 120,121 254,920 246,908 706,673 149,505 688,322 205,380 151,322 297,588 346,938 240,830 224,126 196,726 238,147 281,893 399,472 333,123 197,329 225,456 198,500 568,612 247,846 461,654 400,860 245,968 211,500 167,875 201,243 209,068 439,937 158,625 228,824 0.23 0.32 0.27 0.27 0.37 0.75 0.60 0.21 0.18 0.29 0.42 0.32 0.40 0.46 0.64 0.24 0.24 0.27 0.29 0.32 0.13 0.27 0.26 0.75 0.16 0.73 0.22 0.16 0.32 0.37 0.26 0.24 0.21 0.25 0.30 0.42 0.35 0.21 0.24 0.21 0.60 0.26 0.49 0.43 0.26 0.23 0.18 0.21 0.22 0.47 0.17 0.24 . PAYDEN GLOBAL FUNDS PUBLIC LIMITED COMPANY SCHEDULE OF INVESTMENTS (continued) Payden Absolute Return Bond Fund (continued) As at 30 June 2015 Holding Name of securities 320,000 250,000 200,000 290,000 280,000 325,000 360,000 250,000 220,000 375,000 530,000 650,000 450,000 110,000 70,000 Corporate bonds (continued) Sprint Communications Inc 8.375% 15-Aug-2017 SunTrust Banks Inc 2.350% 01-Nov-2018 Telefonica Chile SA 3.875% 12-Oct-2022 Tencent Holdings Ltd 3.375% 02-May-2019 Tenet Healthcare Corp floating rate 15-Jun-2020 Textron Inc 7.250% 01-Oct-2019 Thermo Fisher Scientific Inc 3.300% 15-Feb-2022 UBS AG/Stamford CT 1.800% 26-Mar-2018 United States Steel Corp 7.000% 01-Feb-2018 Viacom Inc 3.500% 01-Apr-2017 Vodafone Group PLC 2.500% 26-Sep-2022 Wells Fargo & Co 2.125% 22-Apr-2019 Wm Wrigley Jr Co 2.900% 21-Oct-2019 Zimmer Biomet Holdings Inc 1.450% 01-Apr-2017 Zimmer Biomet Holdings Inc 2.000% 01-Apr-2018 365,000 140,000 180,000 220,000 310,000 270,000 340,000 200,000 290,000 195,000 310,000 110,000 540,000 150,000 220,000 550,000 250,000 375,000 305,000 250,000 260,000 260,000 230,000 280,000 200,000 370,000 375,000 225,000 250,000 200,000 230,000 290,000 190,000 450,000 170,000 600,000 80,000 325,000 130,000 150,000 190,000 Fair value USD Covered bonds Abengoa Greenfield SA 6.500% 01-Oct-2019 Actavis Funding SCS 3.000% 12-Mar-2020 Actavis Funding SCS floating rate 12-Mar-2018 AerCap Aviation Solutions BV 6.375% 30-May-2017 Ally Financial Inc floating rate 18-Jul-2016 Anglo American Capital PLC 4.125% 15-Apr-2021 Antero Resources Corp 6.000% 01-Dec-2020 ANZ New Zealand Int'l Ltd/London 1.750% 29-Mar-2018 ARC Properties Operating Partnership LP 2.000% 06-Feb-2017 Avis Budget Car Rental LLC / Avis Budget Finance Inc 4.875% 15-Nov-2017 Barrick North America Finance LLC 4.400% 30-May-2021 BAT International Finance PLC 1.850% 15-Jun-2018 Baxalta Inc 2.875% 23-Jun-2020 Baxalta Inc 5.250% 23-Jun-2045 BioMed Realty LP 2.625% 01-May-2019 BNZ International Funding Ltd/London 1.900% 26-Feb-2018 BNZ International Funding Ltd/London 2.350% 04-Mar-2019 Carnival Corp 1.875% 15-Dec-2017 CNH Industrial Capital LLC 3.250% 01-Feb-2017 Constellation Brands Inc 3.875% 15-Nov-2019 Cooperatieve Centrale Raiffeisen-Boerenleenbank BA/Netherlands 3.875% 08-Feb-2022 Daimler Finance North America LLC floating rate 01-Aug-2018 DISH DBS Corp 4.625% 15-Jul-2017 EP Energy LLC / Everest Acquisition Finance Inc 9.375% 01-May-2020 Express Scripts Holding Co 2.250% 15-Jun-2019 General Motors Financial Co Inc 3.150% 15-Jan-2020 Harley-Davidson Financial Services Inc 3.875% 15-Mar-2016 HealthSouth Corp 5.750% 01-Nov-2024 HJ Heinz Co 2.800% 02-Jul-2020 Kazakhstan Temir Zholy Finance BV 6.375% 06-Oct-2020 Keysight Technologies Inc 3.300% 30-Oct-2019 Kinder Morgan Inc/DE 3.050% 01-Dec-2019 Landry's Inc 9.375% 01-May-2020 Lloyds Bank PLC 1.750% 14-May-2018 Majapahit Holding BV 8.000% 07-Aug-2019 Medtronic Inc 2.500% 15-Mar-2020 Peabody Energy Corp 6.250% 15-Nov-2021 Petroleos Mexicanos 8.000% 03-May-2019 Reynolds American Inc 3.250% 12-Jun-2020 Reynolds American Inc 5.700% 15-Aug-2035 Reynolds American Inc 5.850% 15-Aug-2045 19 % of net assets 347,200 251,781 196,676 298,015 282,800 380,751 356,269 249,727 235,950 387,460 486,935 652,907 458,653 110,084 70,071 0.37 0.27 0.21 0.32 0.30 0.41 0.38 0.27 0.25 0.41 0.52 0.69 0.49 0.12 0.07 14,567,171 341,275 140,668 180,873 233,475 313,520 270,468 343,400 200,100 282,025 15.50 0.36 0.15 0.19 0.25 0.33 0.29 0.37 0.21 0.30 200,362 317,077 110,342 539,832 151,157 219,267 552,809 250,558 376,790 305,381 254,375 0.21 0.34 0.12 0.57 0.16 0.23 0.59 0.27 0.40 0.32 0.27 270,872 262,404 237,475 300,636 198,567 372,117 382,774 230,625 250,480 210,644 231,021 289,975 204,725 449,860 196,350 601,399 27,600 381,583 131,827 155,993 200,007 0.29 0.28 0.25 0.32 0.21 0.40 0.41 0.25 0.27 0.22 0.25 0.31 0.22 0.48 0.21 0.64 0.03 0.41 0.14 0.17 0.21 . PAYDEN GLOBAL FUNDS PUBLIC LIMITED COMPANY SCHEDULE OF INVESTMENTS (continued) Payden Absolute Return Bond Fund (continued) As at 30 June 2015 Holding Name of securities 200,000 110,000 370,000 400,000 150,000 310,000 130,000 325,000 350,000 600,000 225,000 150,000 Covered bonds (continued) SABMiller Holdings Inc floating rate 01-Aug-2018 Seagate HDD Cayman 3.750% 15-Nov-2018 Shell International Finance BV 2.125% 11-May-2020 Sinopec Capital 2013 Ltd 1.875% 24-Apr-2018 Sunoco LP / Sunoco Finance Corp 6.375% 01-Apr-2023 Talen Energy Supply LLC 5.125% 15-Jul-2019 T-Mobile USA Inc 5.250% 01-Sep-2018 Tyco Electronics Group SA 6.550% 01-Oct-2017 United Rentals North America Inc 7.625% 15-Apr-2022 Walgreens Boots Alliance Inc 2.700% 18-Nov-2019 Wesfarmers Ltd 1.874% 20-Mar-2018 ZF North America Capital Inc 4.000% 29-Apr-2020 170,000 170,000 170,000 265,000 170,000 265,000 9,500,000 104,650 150,000 136,247 114,500 86,118 395,000 42,250 736,272 Fair value USD 200,150 114,769 369,629 397,176 156,750 305,350 133,900 360,804 380,625 601,406 225,549 150,375 180 220 248 259 83 105 14 (3) 6 1.87 0.11 0.16 0.15 0.12 0.09 0.42 0.04 0.78 91,574,267 Total value of investment in securities (2014: 98.13%) 11.46 0.20 0.20 0.20 0.28 0.19 0.29 10.10 1,760,553 105,115 149,836 136,491 114,822 86,253 392,656 42,414 732,966 Term Loans Activision Blizzard Inc 3.250% 12-Oct-2020 Asurion LLC 3.750% 03-Mar-2017 Dell International LLC 4.000% 29-Apr-2020 Dole Food Company Inc 4.500% 01-Nov-2018 Hilton Worldwide Finance LLC 3.500% 26-Oct-2020 Hub International Limited 4.000% 02-Oct-2020 Hudson's Bay Company 4.750% 04-Nov-2020 Neiman Marcus Group 4.250% 25-Oct-2020 0.21 0.12 0.39 0.42 0.17 0.32 0.14 0.38 0.41 0.64 0.24 0.16 10,772,522 185,810 187,955 191,675 260,866 176,035 272,632 9,497,549 Government bonds Colombia Government International Bond 7.375% 27-Jan-2017 Croatia Government International Bond 6.750% 05-Nov-2019 Dominican Republic International Bond 7.500% 06-May-2021 Republic of Armenia 6.000% 30-Sep-2020 Republic of Ghana 8.500% 04-Oct-2017 Sri Lanka Government International Bond 6.250% 04-Oct-2020 United States Treasury Bill 0.046% 17-Dec-2015 % of net assets 97.42 Options (2014: 0.05%) Put Option: 100 SHS Barclays (Strike Price: 111) Put Option: 100 SHS IBOXX (Strike Price: 87) Put Option: 100 SHS IBOXX (Strike Price: 87) Put Option: 100 SHS iShares (Strike Price: 113) Put Option: 100 SHS S&P 500 Index (Strike Price: 1800) Put Option: S&P 500 Index (Strike Price: 1800) Expiration date Broker 29,436 0.03 17-Jul-2015 Goldman Sachs 3,780 0.00 17-Jul-2015 Goldman Sachs 6,600 0.01 02-Jul-2015 Goldman Sachs 3,100 0.00 02-Jul-2015 Goldman Sachs 1,684 0.00 30-Jun-2015 Goldman Sachs 622 0.00 17-Jul-2015 Goldman Sachs 13,650 0.02 Futures contracts (2014: 0.02%) Euro-Bund Future Exp 08-Sep-2015 US Long Bond (CBT) Future Exp 21-Sep-2015 US Treasury Note 10 Year (CBT) Future Exp 21-Sep-2015 Notional (USD) 2,324,834 Broker Goldman Sachs 60,856 46,184 0.06 0.05 (463,734) Goldman Sachs 11,203 0.01 753,562 Goldman Sachs 3,469 0.00 1,459,190 1.55 93,123,749 99.06 Unrealised gain on forward foreign exchange contracts (Appendix) (2014: 0.37%) Financial assets at fair value through profit or loss 20 . PAYDEN GLOBAL FUNDS PUBLIC LIMITED COMPANY SCHEDULE OF INVESTMENTS (continued) Payden Absolute Return Bond Fund (continued) As at 30 June 2015 Holding Name of securities Fair value USD (6) Broker (38,871) (0.04) (2,523,523) Goldman Sachs (24,597) (0.03) (7,032,500) Goldman Sachs (3,711) 0.00 (913,812) Goldman Sachs (10,563) (0.01) (86,555) (0.09) (125,426) (0.13) Net current assets (59) Notional (USD) Financial liabilities at fair value through profit or loss (14) Futures contracts (2014: (0.12%)) Long Gilt (LIFFE) Future Exp 28-Sep-2015 US Treasury Note 5 year (CBT) Future Exp 30-Sep-2015 US Ultra Bond (CBT) Future Exp 21-Sep-2015 % of net assets 1,004,289 1.07 94,002,612 100.00 Unrealised loss on forward foreign exchange contracts (Appendix) (2014: (0.62%)) Total net assets Appendix: forward foreign currency contracts Unrealised gain on forward foreign currency contracts Purchase Amount Currency Sale Sale Amount Maturity date Unrealised Gain/Loss USD 563,809 688,000 495,000 77,290 780,625 148,296 251,352 88,500,000 145,994 772,100 735,325 10,790,000 48,310,000 163,177 753,003 375,336 776,021 131,005 476,071 157,360 78,213 155,493 EUR USD USD COP EUR EUR EUR USD AUD AUD JPY USD USD EUR EUR SGD CAD CAD CAD HUF IDR MYR (500,000) (735,877) (754,657) (196,000,000) (688,000) (130,000) (225,000) (712,213) (187,000) (996,000) (88,500,000) (167,651) (738,572) (143,000) (670,000) (502,000) (967,000) (160,000) (587,000) (43,700,000) (1,045,000,000) (587,000) 09-Jul-2015 17-Jul-2015 17-Jul-2015 17-Jul-2015 17-Jul-2015 23-Jul-2015 23-Jul-2015 31-Jul-2015 31-Jul-2015 31-Jul-2015 31-Jul-2015 17-Aug-2015 17-Aug-2015 17-Aug-2015 17-Aug-2015 20-Aug-2015 14-Sep-2015 14-Sep-2015 14-Sep-2015 21-Sep-2015 21-Sep-2015 21-Sep-2015 6,658 30,846 23,748 2,027 13,902 3,409 586 11,293 2,515 7,898 11,819 212 12,997 3,744 6,009 2,801 2,242 2,975 6,362 3,109 1,253 886 Euro Class (Accumulating) Citibank EUR 647,000 USD (709,619) 06-Jul-2015 11,305 Sterling Class (Accumulating) HSBC Securities GBP HSBC Securities GBP 9,000 27,422,000 USD USD (13,790) (41,835,140) 06-Jul-2015 06-Jul-2015 364 1,290,230 1,459,190 Currency Counter Party Purchase Payden Absolute Return Bond Fund Citibank USD Royal Bank of Scotland EUR Royal Bank of Scotland GBP State Street USD Royal Bank of Scotland USD HSBC Securities USD HSBC Securities USD Credit Suisse JPY Credit Suisse USD Credit Suisse USD Credit Suisse USD Barclays INR Barclays INR UBS USD UBS USD Barclays USD Royal Bank of Canada USD Royal Bank of Canada USD Royal Bank of Canada USD Royal Bank of Canada USD Citibank USD Citibank USD 21 . PAYDEN GLOBAL FUNDS PUBLIC LIMITED COMPANY SCHEDULE OF INVESTMENTS (continued) Payden Absolute Return Bond Fund (continued) Appendix: forward foreign currency contracts (continued) Unrealised loss on forward foreign currency contracts Currency Counter Party Purchase Payden Absolute Return Bond Fund State Street USD Royal Bank of Scotland USD HSBC Securities USD Barclays INR Credit Suisse MXN Credit Suisse USD HSBC Securities PHP HSBC Securities PHP Barclays USD Royal Bank of Canada USD HSBC Securities USD Purchase Amount Currency Sale Sale Amount Maturity date Unrealised Gain/Loss USD 75,885 734,216 733,856 14,670,000 2,440,000 154,377 14,560,000 16,790,000 322,797 76,497 77,572 BRL GBP EUR USD USD MXN USD USD SGD TRY ZAR (239,000) (495,000) (683,000) (229,219) (159,331) (2,440,000) (322,124) (375,363) (436,000) (214,000) (980,000) 17-Jul-2015 17-Jul-2015 23-Jul-2015 17-Aug-2015 19-Aug-2015 19-Aug-2015 20-Aug-2015 20-Aug-2015 20-Aug-2015 21-Sep-2015 21-Sep-2015 (629) (44,188) (27,359) (994) (4,379) (575) (102) (4,021) (759) (1,535) (2,014) (86,555) Portfolio Analysis % of total assets Transferable securities and money market instruments admitted to an official stock exchange listing or traded on a regulated market Financial derivative instruments dealt in on a regulated market OTC financial derivative instruments Analysis as a percentage of total assets rather than net assets is required under the UCITS Notice 8.5 appendix A. 22 90.43 0.05 1.36 91.84 . PAYDEN GLOBAL FUNDS PUBLIC LIMITED COMPANY SCHEDULE OF INVESTMENTS (continued) Payden Euro Liquidity Fund As at 30 June 2015 Holding Name of securities Fair value EUR % of net assets 1,106,851 456,052 1,450,891 227,003 2,100,000 1,000,000 965,469 280,438 424,843 1,972,667 160,317 141,217 1,300,000 71,016 Asset-backed securities Auto ABS Compartiment 2012-1 floating rate 25-Jul-2026 Bavarian Sky SA floating rate 20-Jun-2020 Bavarian Sky SA 0.237% 20-Apr-2024 Bilkreditt 4 Ltd floating rate 25-Dec-2027 Bumper 6 NL Finance BV floating rate 19-Mar-2029 Cars Alliance Auto Loans France V 2014-1 0.304% 25-Jan-2026 Compartment VCL 20 floating rate 21-Jun-2020 Driver Ten GmbH floating rate 21-Mar-2019 Driver Twelve GmbH floating rate 22-May-2020 Red & Black Auto Lease Germany 1 SA 0.911% 15-Apr-2024 SC Germany Auto 2014-1 UG haftungsbeschraenkt floating rate 11-Dec-2023 Silver Arrow SA floating rate 20-Oct-2021 Silverstone Master Issuer PLC floating rate 21-Jan-2070 Titrisocram 2012-1 floating rate 25-Mar-2022 11,673,346 1,113,046 456,009 1,452,462 227,386 2,101,623 999,308 965,998 280,448 425,241 1,975,593 160,360 141,250 1,303,486 71,136 13.43 1.28 0.53 1.67 0.26 2.42 1.15 1.11 0.32 0.49 2.27 0.19 0.16 1.50 0.08 500,000 1,000,000 1,000,000 1,000,000 Commercial paper BAT International Finance PLC 0.000% 29-Jul-2015 Deutsche Telekom International Finance BV 0.000% 12-Aug-2015 Hewlett-Packard Co 0.000% 08-Sep-2015 Vodafone Group PLC 0.000% 14-Jan-2016 3,499,057 499,848 999,976 999,813 999,420 4.02 0.57 1.15 1.15 1.15 43,785,005 500,673 711,004 826,005 853,007 852,575 1,241,212 801,636 519,225 607,170 707,680 849,796 1,211,922 602,055 1,004,955 797,528 646,093 851,288 899,528 650,439 50.36 0.58 0.82 0.95 0.98 0.98 1.43 0.92 0.60 0.70 0.81 0.98 1.39 0.69 1.16 0.92 0.74 0.98 1.03 0.75 747,949 1,246,813 758,576 801,444 1,099,802 0.86 1.43 0.87 0.92 1.27 802,976 997,485 1,319,076 996,104 1,282,536 800,572 1,061,993 686,104 323,668 1,000,485 1,255,612 1,252,175 0.92 1.15 1.52 1.15 1.48 0.92 1.22 0.79 0.37 1.15 1.44 1.44 500,000 700,000 800,000 850,000 850,000 1,250,000 800,000 500,000 600,000 700,000 850,000 1,200,000 600,000 1,000,000 800,000 600,000 850,000 900,000 650,000 750,000 1,250,000 750,000 800,000 1,100,000 800,000 1,000,000 1,200,000 1,000,000 1,200,000 800,000 1,000,000 650,000 300,000 1,000,000 1,250,000 1,250,000 Corporate bonds 3M Co floating rate 09-Nov-2018 ABN AMRO Bank NV floating rate 06-Mar-2019 Achmea Bank NV 2.000% 23-Jan-2018 AT&T Inc floating rate 04-Jun-2019 Australia & New Zealand Banking Group Ltd floating rate 28-Oct-2019 Bank of America Corp floating rate 28-Mar-2018 Bank of Nova Scotia floating rate 14-Jan-2020 Banque Federative du Credit Mutuel SA 4.375% 31-May-2016 Banque Federative du Credit Mutuel SA floating rate 20-Mar-2019 Belfius Bank SA/NV 1.125% 22-May-2017 BNP Paribas SA floating rate 15-Jan-2020 BPCE SA floating rate 28-May-2018 Caisse Centrale Desjardins floating rate 20-Jan-2020 Cap Gemini SA floating rate 02-Jul-2018 Carrefour Banque SA floating rate 20-Mar-2020 Cie de Saint-Gobain 4.750% 11-Apr-2017 Citigroup Inc floating rate 11-Nov-2019 Coca-Cola Co floating rate 09-Mar-2017 Commonwealth Bank of Australia floating rate 21-Jan-2020 Cooperatieve Centrale Raiffeisen-Boerenleenbank BA/Netherlands floating rate 29-May-2020 Credit Suisse AG floating rate 18-Jun-2018 Daimler AG floating rate 24-Jun-2019 Danone SA floating rate 14-Jan-2020 Danske Bank A/S floating rate 19-Nov-2018 Elsevier Finance SA via Aquarius + Investments PLC floating rate 20-May-2017 FCE Bank PLC floating rate 10-Feb-2018 Fidelity International Ltd 6.875% 24-Feb-2017 GDF Suez 0.000% 13-Mar-2017 German Postal Pensions Securitisation 2 PLC 4.250% 18-Jan-2017 Goldman Sachs Group Inc floating rate 29-May-2020 Heathrow Funding Ltd 4.375% 25-Jan-2017 Heineken NV 4.625% 10-Oct-2016 Imerys SA 5.000% 18-Apr-2017 JPMorgan Chase & Co floating rate 20-Nov-2016 Jyske Bank A/S floating rate 19-Jun-2017 LeasePlan Corp NV floating rate 28-Apr-2017 23 . PAYDEN GLOBAL FUNDS PUBLIC LIMITED COMPANY SCHEDULE OF INVESTMENTS (continued) Payden Euro Liquidity Fund (continued) As at 30 June 2015 Holding Name of securities Fair value EUR % of net assets 754,251 853,154 1,003,470 601,275 640,690 516,415 998,335 808,856 1,204,494 751,912 653,158 851,615 1,049,995 702,006 828,218 0.87 0.98 1.15 0.69 0.74 0.59 1.15 0.93 1.39 0.86 0.75 0.98 1.21 0.81 0.95 18,270,562 853,630 1,054,630 1,252,006 753,941 749,674 853,574 998,705 501,750 776,029 1,202,730 601,788 651,037 971,004 842,481 852,363 596,842 855,062 801,372 269,556 802,276 801,100 507,533 470,639 250,840 21.01 0.98 1.21 1.44 0.87 0.86 0.98 1.15 0.58 0.89 1.38 0.69 0.75 1.12 0.97 0.98 0.69 0.98 0.92 0.31 0.92 0.92 0.59 0.54 0.29 700,000 850,000 1,000,000 600,000 632,000 500,000 1,000,000 800,000 1,200,000 750,000 628,000 850,000 1,050,000 700,000 800,000 Corporate bonds (continued) Metropolitan Life Global Funding I 4.625% 16-May-2017 Morgan Stanley floating rate 19-Nov-2019 Nederlandse Waterschapsbank NV floating rate 01-Nov-2018 PACCAR Financial Europe BV floating rate 24-Jun-2016 Parker-Hannifin Corp 4.125% 11-Nov-2015 Pernod Ricard SA 4.875% 18-Mar-2016 SBAB Bank AB floating rate 27-Jun-2018 Societe Des Autoroutes Paris-Rhin-Rhone floating rate 31-Mar-2019 Socram Banque floating rate 28-Nov-2017 Standard Chartered PLC floating rate 13-Jun-2017 Thames Water Utilities Cayman Finance Ltd 3.250% 09-Nov-2016 Toyota Motor Credit Corp floating rate 20-Jul-2018 UBS AG/London floating rate 15-May-2017 Wells Fargo & Co 0.448% 24-Apr-2019 Yorkshire Building Society 2.125% 18-Mar-2019 850,000 1,000,000 1,250,000 750,000 750,000 850,000 1,000,000 500,000 750,000 1,200,000 600,000 650,000 900,000 800,000 850,000 600,000 850,000 800,000 250,000 800,000 800,000 500,000 470,000 250,000 Covered bonds Abbey National Treasury Services PLC/London floating rate 22-May-2019 Anglo American Capital PLC 4.375% 02-Dec-2016 ASB Finance Ltd/London floating rate 03-Jul-2017 BAT International Finance PLC floating rate 06-Mar-2018 BMW US Capital LLC floating rate 20-Apr-2018 BNZ International Funding Ltd/London floating rate 02-Dec-2019 Caisse Centrale du Credit Immobilier de France SA floating rate 03-Oct-2017 Caterpillar International Finance Ltd floating rate 27-Sep-2017 Conti-Gummi Finance BV 2.500% 20-Mar-2017 Dexia Credit Local SA floating rate 27-Mar-2017 GE Capital European Funding floating rate 19-Jun-2018 GE Capital European Funding floating rate 21-Jan-2020 Glencore Finance Europe SA 5.250% 22-Mar-2017 Hutchison Whampoa Finance 06 Ltd 4.625% 21-Sep-2016 John Deere Bank SA floating rate 19-Mar-2019 Santander Consumer Bank AS 0.625% 20-Apr-2018 Scentre Group Trust 1 floating rate 16-Jul-2018 Sky PLC floating rate 01-Apr-2020 Telstra Corp Ltd 4.750% 21-Mar-2017 Total Capital International SA floating rate 19-Mar-2020 Volkswagen International Finance NV floating rate 16-Jul-2018 Volkswagen Leasing GmbH 1.000% 04-Oct-2017 Volvo Treasury AB floating rate 05-Sep-2016 Westpac Securities NZ Ltd floating rate 10-Mar-2017 2,100,000 500,000 1,000,000 1,200,000 1,500,000 1,400,000 900,000 300,000 Government and government related bonds Austria Government Bond 1.150% 19-Oct-2018 Bpifrance Financement SA floating rate 30-Jun-2016 Bundesobligation 1.000% 12-Oct-2018 Development Bank of Japan Inc 0.250% 06-Oct-2017 France Government Bond OAT 1.000% 25-May-2019 Italy Buoni Poliennali Del Tesoro 3.500% 01-Dec-2018 Netherlands Government Bond 0.500% 15-Apr-2017 Svensk Exportkredit AB floating rate 12-Aug-2016 9,213,832 2,182,224 500,248 1,037,790 1,202,088 1,551,182 1,529,210 911,288 299,802 10.60 2.51 0.58 1.19 1.38 1.78 1.76 1.05 0.35 Total value of investment in securities (2014: 99.11%) 86,441,802 99.42 Financial assets at fair value through profit or loss 86,441,802 99.42 501,858 0.58 86,943,660 100.00 Net current assets Total net assets 24 . PAYDEN GLOBAL FUNDS PUBLIC LIMITED COMPANY SCHEDULE OF INVESTMENTS (continued) Payden Euro Liquidity Fund (continued) As at 30 June 2015 Portfolio Analysis % of total assets Transferable securities and money market instruments admitted to an official stock exchange listing or traded on a regulated market Analysis as a percentage of total assets rather than net assets is required under the UCITS Notice 8.5 appendix A. 25 98.24 98.24 . PAYDEN GLOBAL FUNDS PUBLIC LIMITED COMPANY SCHEDULE OF INVESTMENTS (continued) Payden Global Bond Fund* As at 30 June 2015 Holding 200,000 200,000 600,000 400,000 685,000 900,000 1,040,000 450,000 1,200,000 900,000 920,000 1,000,000 650,000 900,000 350,000 200,000 800,000 640,000 550,000 600,000 440,000 1,000,000 450,000 700,000 500,000 425,000 595,000 300,000 550,000 760,000 925,000 650,000 800,000 250,000 500,000 450,000 300,000 625,000 745,000 1,000,000 1,000,000 400,000 400,000 450,000 750,000 1,100,000 300,000 415,000 615,000 323,000 375,000 475,000 600,000 210,000 360,000 860,000 345,000 670,000 700,000 900,000 Name of securities Fair value USD % of net assets Corporate bonds AbbVie Inc 2.500% 14-May-2020 AbbVie Inc 3.200% 06-Nov-2022 Accor SA 2.625% 05-Feb-2021 Air Canada 2015-1 Class A Pass Through Trust 3.600% 15-Mar-2027 Air Lease Corp 4.250% 15-Sep-2024 Allianz SE floating rate 07-Jul-2045 American Express Bank FSB floating rate 12-Jun-2017 AT&T Inc 3.000% 30-Jun-2022 Australia & New Zealand Banking Group Ltd 4.500% 19-Mar-2024 Bank of America Corp 4.200% 26-Aug-2024 Bank of America Corp 6.875% 25-Apr-2018 Bank of Tokyo-Mitsubishi UFJ Ltd 0.875% 11-Mar-2022 Barclays PLC 2.875% 08-Jun-2020 BlackRock Inc 1.250% 06-May-2025 BNP Paribas SA 2.375% 17-Feb-2025 Boston Scientific Corp 2.850% 15-May-2020 BPCE SA floating rate 08-Jul-2026 Buckeye Partners LP 2.650% 15-Nov-2018 BUPA Finance PLC 5.000% 25-Apr-2023 Capital Gemini SA 1.750% 01-Jul-2020 Cie de Saint-Gobain 4.625% 09-Oct-2029 Commonwealth Bank of Australia floating rate 22-Apr-2027 Compass Bank 2.750% 29-Sep-2019 Credit Agricole SA 2.625% 17-Mar-2027 Deutsche Bank AG 1.125% 17-Mar-2025 Fidelity International Ltd 6.875% 24-Feb-2017 FS Investment Corp 4.250% 15-Jan-2020 Gatwick Funding Ltd 6.125% 02-Mar-2026 Goldman Sachs Group Inc 2.600% 23-Apr-2020 Health Care REIT Inc 4.125% 01-Apr-2019 Hospitality Properties Trust 4.500% 15-Mar-2025 HSBC Holdings PLC 3.000% 30-Jun-2025 HSBC USA Inc 2.350% 05-Mar-2020 Hyundai Capital America 2.600% 19-Mar-2020 KBC Groep NV floating rate 11-Mar-2027 Lam Research Corp 3.800% 15-Mar-2025 Latam Airlines 2015-1 Pass Through Trust A 4.200% 15-Nov-2027 McKesson Corp 3.796% 15-Mar-2024 Metropolitan Edison Co 3.500% 15-Mar-2023 Metropolitan Life Global Funding I 1.250% 17-Sep-2021 Morgan Stanley 4.350% 08-Sep-2026 National Grid North America Inc 1.750% 20-Feb-2018 Nationwide Building Society 2.250% 29-Apr-2022 Nationwide Building Society 6.250% 25-Feb-2020 Nationwide Mutual Insurance Co 9.375% 15-Aug-2039 Nissan Motor Acceptance Corp 2.350% 04-Mar-2019 Penske Truck Leasing Co LP / PTL Finance Corp 3.375% 01-Feb-2022 People's United Bank NA 4.000% 15-Jul-2024 Prudential Financial Inc floating rate 15-Jun-2043 QBE Insurance Group Ltd 6.125% 28-Sep-2015 Royal Bank of Scotland Group PLC 1.625% 25-Jun-2019 Ryder System Inc 3.500% 01-Jun-2017 Santander Holdings USA Inc/PA 2.650% 17-Apr-2020 Select Income REIT 4.500% 01-Feb-2025 Sempra Energy 9.800% 15-Feb-2019 Sompo Japan Insurance Inc floating rate 28-Mar-2073 Southeast Supply Header LLC 4.250% 15-Jun-2024 Sumitomo Mitsui Banking Corp floating rate 18-Mar-2016 Sydney Airport Finance Co Pty Ltd 3.375% 30-Apr-2025 Synchrony Financial 4.250% 15-Aug-2024 41,640,325 198,173 198,362 705,912 401,150 681,575 921,147 1,034,093 435,181 1,208,833 899,523 1,039,978 1,080,353 646,175 934,063 367,186 198,813 894,117 638,173 877,409 673,551 740,415 1,056,328 449,334 713,729 501,777 520,524 602,053 576,623 547,612 805,104 911,631 721,315 793,981 250,362 526,385 438,867 297,375 633,323 734,759 1,108,546 982,024 460,715 607,227 525,251 1,129,262 1,109,763 291,227 411,692 638,985 513,910 419,682 494,192 590,523 203,303 452,507 909,450 341,038 1,055,664 674,870 905,522 19.16 0.09 0.09 0.32 0.18 0.31 0.42 0.48 0.20 0.56 0.41 0.48 0.50 0.30 0.43 0.17 0.09 0.41 0.29 0.40 0.31 0.34 0.49 0.21 0.33 0.23 0.24 0.28 0.27 0.25 0.37 0.42 0.33 0.37 0.12 0.24 0.20 0.14 0.29 0.34 0.51 0.45 0.21 0.28 0.24 0.52 0.51 0.13 0.19 0.29 0.24 0.19 0.23 0.27 0.09 0.21 0.42 0.16 0.49 0.31 0.42 26 . PAYDEN GLOBAL FUNDS PUBLIC LIMITED COMPANY SCHEDULE OF INVESTMENTS (continued) Payden Global Bond Fund* (continued) As at 30 June 2015 Holding Name of securities 300,000 750,000 750,000 Corporate bonds (continued) UBS AG/Stamford CT 1.800% 26-Mar-2018 Verizon Communications Inc 6.400% 15-Feb-2038 Yorkshire Building Society 1.250% 17-Mar-2022 940,000 350,000 600,000 425,000 1,870,000 780,000 1,290,000 275,000 1,200,000 1,270,000 532,000 920,000 750,000 1,000,000 300,000 500,000 740,000 1,300,000 1,000,000 775,000 475,000 400,000 490,000 1,200,000 1,400,000 20,550,000 1,500,000 900,000 200,000 400,000 1,200,000 1,800,000 650,000 400,000 580,000 1,250,000 500,000 350,000 1,200,000 7,100,000 1,400,000 950,000 700,000 8,100,000 5,350,000 5,000,000 1,450,000 1,500,000 575,000,000 386,000,000 928,000,000 Fair value USD Covered bonds Alibaba Group Holding Ltd 3.600% 28-Nov-2024 Baxalta Inc 3.600% 23-Jun-2022 BioMed Realty LP 3.850% 15-Apr-2016 BNZ International Funding Ltd/London 1.900% 26-Feb-2018 Cie de Financement Foncier SA 4.550% 28-Apr-2017 Continental Resources Inc/OK 5.000% 15-Sep-2022 Cooperatieve Centrale Raiffeisen-Boerenleenbank BA/Netherlands 4.625% 01-Dec-2023 Credit Suisse Group Funding Guernsey Ltd 2.750% 26-Mar-2020 Dexia Credit Local SA 2.125% 12-Feb-2025 Discovery Communications LLC 1.900% 19-Mar-2027 Freeport-McMoran Oil & Gas LLC / FCX Oil & Gas Inc 6.500% 15-Nov-2020 Glencore Funding LLC floating rate 15-Jan-2019 HJ Heinz Co 2.000% 30-Jun-2023 HJ Heinz Co 2.800% 02-Jul-2020 HPHT Finance 15 Ltd 2.875% 17-Mar-2020 Hutchison Whampoa Finance 06 Ltd 4.625% 21-Sep-2016 Keysight Technologies Inc 3.300% 30-Oct-2019 KKR Group Finance Co II LLC 5.500% 01-Feb-2043 Medtronic Inc 3.150% 15-Mar-2022 Perrigo Co PLC 4.000% 15-Nov-2023 Perrigo Finance PLC 3.500% 15-Dec-2021 Reynolds American Inc 4.000% 12-Jun-2022 SABMiller Holdings Inc floating rate 01-Aug-2018 Government bonds Australia Government Bond 1.750% 21-Nov-2020 Australia Government Bond 3.250% 21-Apr-2025 Australia Government Bond 6.000% 15-Feb-2017 Austria Government Bond 0.250% 18-Oct-2019 Austria Government Bond 1.650% 21-Oct-2024 Austria Government Bond 3.150% 20-Jun-2044 Belgium Government Bond 0.800% 22-Jun-2025 Belgium Government Bond 1.000% 22-Jun-2031 Belgium Government Bond 3.000% 28-Sep-2019 Bundesrepublik Deutschland 3.250% 04-Jul-2042 Bundesrepublik Deutschland 4.750% 04-Jul-2034 Canadian Government Bond 1.000% 01-May-2016 Canadian Government Bond 5.000% 01-Jun-2037 Canadian Government Bond 5.750% 01-Jun-2029 Finland Government Bond 2.750% 04-Jul-2028 Finland Government Bond 3.875% 15-Sep-2017 France Government Bond OAT 1.750% 25-May-2023 France Government Bond OAT 3.250% 25-May-2045 France Government Bond OAT 4.750% 25-Apr-2035 Ireland Government Bond 3.400% 18-Mar-2024 Italy Buoni Poliennali Del Tesoro 3.500% 01-Dec-2018 Italy Buoni Poliennali Del Tesoro 4.500% 01-Aug-2018 Italy Buoni Poliennali Del Tesoro 4.500% 01-May-2023 Italy Buoni Poliennali Del Tesoro 5.000% 01-Aug-2039 Italy Buoni Poliennali Del Tesoro 5.250% 01-Nov-2029 Japan Government Thirty Year Bond 2.000% 20-Sep-2040 Japan Government Thirty Year Bond 2.200% 20-Sep-2039 Japan Government Twenty Year Bond 1.000% 20-Mar-2023 27 % of net assets 299,672 856,995 803,041 0.14 0.39 0.37 18,771,430 908,158 350,319 611,395 427,171 1,583,816 765,867 8.64 0.42 0.16 0.28 0.20 0.73 0.35 1,333,215 271,848 1,803,050 1,283,613 0.61 0.13 0.83 0.59 563,920 919,834 829,909 1,001,918 299,187 586,683 743,286 1,318,623 1,005,384 786,748 476,587 409,202 491,697 0.26 0.42 0.38 0.46 0.14 0.27 0.34 0.61 0.46 0.36 0.22 0.19 0.23 147,249,679 890,716 1,098,028 16,805,465 1,678,163 1,060,047 290,467 428,549 1,193,277 2,244,391 996,503 693,443 466,258 1,470,684 583,083 457,109 1,457,058 8,460,254 1,919,417 1,557,137 901,182 9,857,967 6,655,214 6,583,407 2,078,833 2,146,558 5,339,176 3,710,155 8,000,859 67.75 0.41 0.51 7.73 0.77 0.49 0.13 0.20 0.55 1.03 0.46 0.32 0.21 0.68 0.27 0.21 0.67 3.89 0.88 0.72 0.41 4.54 3.06 3.03 0.96 0.99 2.46 1.71 3.68 . PAYDEN GLOBAL FUNDS PUBLIC LIMITED COMPANY SCHEDULE OF INVESTMENTS (continued) Payden Global Bond Fund* (continued) As at 30 June 2015 Holding 340,000,000 115,000,000 815,000,000 23,080,000 800,000 2,900,000 500,000 1,250,000 3,460,000 1,500,000 2,450,000 1,100,000 1,500,000 1,250,000 1,150,000 1,450,000 750,000 3,500,000 3,500,000 2,000,000 6,000,000 4,932,000 458,000 Name of securities Fair value USD 3,084,310 1,037,051 7,690,526 1,651,525 811,600 3,602,044 807,282 1,237,500 932,997 1,574,658 2,919,226 1,423,173 2,100,621 2,770,311 2,085,321 3,112,994 746,250 3,519,141 3,492,342 1,963,906 6,267,186 4,832,975 563,340 Total value of investment in securities (2014: 101.50%) (1) 70 4 (7) 45 Futures contracts (2014: 0.04%) Euro-Bund Future Exp 08-Sep-2015 Euro-Schatz Future Exp 08-Sep-2015 JP Treasury Note 10 Year (OSE) Future Exp 10-Sep-2015 US Long Bond (CBT) Future Exp 21-Sep-2015 US Treasury Note 2 Year (CBT) Future Exp 30-Sep-2015 1.42 0.48 3.54 0.76 0.37 1.66 0.37 0.57 0.43 0.72 1.34 0.66 0.97 1.27 0.96 1.43 0.34 1.62 1.61 0.90 2.88 2.22 0.26 207,661,434 Government bonds (continued) Japan Government Twenty Year Bond 1.600% 20-Jun-2030 Japan Government Twenty Year Bond 1.700% 20-Sep-2033 Japan Government Twenty Year Bond 1.900% 20-Dec-2028 Mexican Bonos 8.000% 11-Jun-2020 Mexico Government International Bond 3.625% 15-Mar-2022 Netherlands Government Bond 2.250% 15-Jul-2022 Netherlands Government Bond 4.000% 15-Jan-2037 Panama Government International Bond 3.750% 16-Mar-2025 Poland Government Bond 6.250% 24-Oct-2015 Spain Government Bond 1.600% 30-Apr-2025 Spain Government Bond 2.750% 30-Apr-2019 Spain Government Bond 4.200% 31-Jan-2037 Spain Government Bond 5.850% 31-Jan-2022 United Kingdom Gilt 4.250% 07-Dec-2055 United Kingdom Gilt 4.750% 07-Mar-2020 United Kingdom Gilt 4.750% 07-Dec-2038 United States Treasury Note/Bond 0.750% 31-Mar-2018 United States Treasury Note/Bond 0.875% 28-Feb-2017(1) United States Treasury Note/Bond 1.250% 30-Apr-2019(2) United States Treasury Note/Bond 2.125% 15-May-2025 United States Treasury Note/Bond 2.625% 15-Nov-2020 United States Treasury Note/Bond 3.000% 15-May-2042 United States Treasury Note/Bond 4.375% 15-Feb-2038 % of net assets 95.55 Notional (USD) (170,807) 8,677,222 Broker Goldman Sachs Goldman Sachs 46,789 1,448 1,560 0.02 0.00 0.00 4,795,816 Goldman Sachs 8,499 0.00 (1,082,047) UBS 26,141 0.01 9,843,047 Goldman Sachs 9,141 0.01 3,282,191 1.51 210,990,414 97.08 Unrealised gain on forward foreign exchange contracts (Appendix) (2014: 1.75%) Financial assets at fair value through profit or loss 28 . PAYDEN GLOBAL FUNDS PUBLIC LIMITED COMPANY SCHEDULE OF INVESTMENTS (continued) Payden Global Bond Fund* (continued) As at 30 June 2015 Holding (61) (151) (10) Name of securities Fair value USD Futures contracts (2014: (0.06%)) Long Gilt (LIFFE) Future Exp 28Sep-2015 US Treasury Note 10 Year (CBT) Future Exp 21-Sep-2015 US Treasury Note 5 year (CBT) Future Exp 30-Sep-2015 US Ultra Bond (CBT) Future Exp 21-Sep-2015 % of net assets Notional (USD) Broker (180,950) (0.08) (10,996,082) Goldman Sachs (106,441) (0.05) (19,010,467) JPMorgan Chase (41,486) (0.02) Wells Fargo (5,703) 0.00 2,030,133 Goldman Sachs (27,320) (0.01) Unrealised loss on forward foreign exchange contracts (Appendix) (2014: (5.19%) (2,192,436) (1.01) Financial liabilities at fair value through profit or loss 13 (1,186,875) (2,373,386) (1.09) 8,725,103 4.01 217,342,131 100.00 Net current assets Total net assets (1) (2) The nominal value of 140,000 is held as collateral with Goldman Sachs for open future contracts. The nominal value of 782,000 is held as collateral with Goldman Sachs for open future contracts. Appendix: forward foreign currency contracts Unrealised gain on forward foreign currency contracts Currency Counter Party Purchase Payden Global Bond Fund* Royal Bank of Scotland USD Royal Bank of Canada USD State Street USD State Street USD Citibank USD Royal Bank of Scotland EUR Royal Bank of Scotland USD Royal Bank of Scotland GBP Credit Suisse USD Credit Suisse JPY Credit Suisse USD UBS EUR UBS USD Barclays INR Credit Suisse USD Barclays USD Barclays USD Royal Bank of Canada USD Euro Class (Accumulating) Citibank EUR Norwegian Krone Class (Accumulating) Barclays USD Barclays USD Barclays USD Barclays USD Sterling Class (Accumulating) HSBC Securities GBP Purchase Amount Currency Sale Sale Amount Maturity date Unrealised Gain/Loss USD 19,424,919 4,201,529 40,781,633 787,591 43,855,280 4,476,000 5,078,604 3,221,000 4,446,553 560,700,000 4,658,718 142,000 4,724,813 230,460,000 1,751,926 2,947,356 987,962 4,458,711 AUD CAD EUR EUR EUR USD EUR USD AUD USD JPY USD EUR USD MXN SGD PLN CAD (24,997,000) (5,235,000) (36,169,000) (700,000) (38,892,000) (4,787,480) (4,476,000) (4,910,608) (5,736,000) (4,512,295) (560,700,000) (156,718) (4,204,000) (3,523,314) (26,610,000) (3,942,000) (3,652,000) (5,556,000) 09-Jul-2015 09-Jul-2015 09-Jul-2015 09-Jul-2015 09-Jul-2015 17-Jul-2015 17-Jul-2015 17-Jul-2015 31-Jul-2015 31-Jul-2015 31-Jul-2015 17-Aug-2015 17-Aug-2015 17-Aug-2015 19-Aug-2015 20-Aug-2015 26-Aug-2015 14-Sep-2015 219,976 8,749 478,498 7,581 517,906 200,679 90,444 154,527 45,485 71,546 74,877 1,600 37,703 62,003 62,061 21,997 18,412 12,883 21,354,000 USD (23,420,726) 06-Jul-2015 373,119 1,274,595 1,273,041 2,020,473 2,544,465 NOK NOK NOK NOK (10,000,000) (10,000,000) (15,739,000) (20,000,000) 06-Jul-2015 06-Jul-2015 06-Jul-2015 06-Jul-2015 3,657 2,102 20,143 2,588 16,868,000 USD (25,733,905) 06-Jul-2015 793,655 3,282,191 29 . PAYDEN GLOBAL FUNDS PUBLIC LIMITED COMPANY SCHEDULE OF INVESTMENTS (continued) Payden Global Bond Fund* (continued) As at 30 June 2015 Appendix: forward foreign currency contracts (continued) Unrealised loss on forward foreign currency contracts Currency Counter Party Purchase Payden Global Bond Fund* (continued) Citibank EUR HSBC Securities USD Royal Bank of Scotland USD Royal Bank of Scotland USD HSBC Securities EUR HSBC Securities USD UBS EUR Barclays USD HSBC Securities PHP Purchase Amount Currency Sale Sale Amount Maturity date Unrealised Gain/Loss USD 3,450,000 14,249,031 28,515,159 4,777,597 384,000 3,560,760 158,000 308,501 131,810,000 USD GBP JPY GBP USD EUR USD INR USD (3,885,228) (9,291,000) (3,540,100,000) (3,221,000) (431,624) (3,314,000) (177,663) (19,960,000) (2,946,792) 09-Jul-2015 09-Jul-2015 09-Jul-2015 17-Jul-2015 23-Jul-2015 23-Jul-2015 17-Aug-2015 17-Aug-2015 20-Aug-2015 (40,891) (362,217) (417,769) (287,538) (3,649) (132,747) (1,506) (2,021) (31,566) Norwegian Krone Class (Accumulating) Barclays NOK Barclays NOK 896,869,000 11,000,000 USD USD (114,872,015) (1,425,059) 06-Jul-2015 06-Jul-2015 (885,505) (27,027) (2,192,436) Portfolio Analysis % of total assets Transferable securities and money market instruments admitted to an official stock exchange listing or traded on a regulated market Financial derivative instruments dealt in on a regulated market OTC financial derivative instruments Analysis as a percentage of total assets rather than net assets is required under the UCITS Notice 8.5 appendix A. * This Fund changed name from Payden International Bond Fund on 24 March 2015. 30 93.02 (0.06) 0.49 93.45 . PAYDEN GLOBAL FUNDS PUBLIC LIMITED COMPANY SCHEDULE OF INVESTMENTS (continued) Payden Global Emerging Markets Bond Fund As at 30 June 2015 Holding Name of securities Fair value USD % of net assets 950,000 897,304 190,000 400,000 Argentina Argentine Republic Government International Bond 2.500% 31-Dec-2038 Argentine Republic Government International Bond 8.280% 31-Dec-2033 Argentine Republic Government International Bond 8.750% 02-Jun-2017 YPF SA 8.500% 28-Jul-2025 1,950,962 513,000 861,412 179,550 397,000 1.78 0.47 0.79 0.16 0.36 778,000 480,000 Armenia Republic of Armenia 6.000% 30-Sep-2020 Republic of Armenia 7.150% 26-Mar-2025 1,243,463 765,863 477,600 1.13 0.70 0.43 450,000 Australia CNOOC Curtis Funding No 1 Pty Ltd 4.500% 03-Oct-2023 473,668 473,668 0.43 0.43 490,000 460,000 Azerbaijan International Bank of Azerbaijan OJSC 5.625% 11-Jun-2019 State Oil Co of the Azerbaijan Republic 4.750% 13-Mar-2023 916,423 476,329 440,094 0.84 0.44 0.40 245,000 Barbados Columbus International Inc 7.375% 30-Mar-2021 264,294 264,294 0.24 0.24 540,000 Belarus Republic of Belarus 8.950% 26-Jan-2018 523,395 523,395 0.48 0.48 200,000 Bermuda Digicel Group Ltd 8.250% 30-Sep-2020 201,500 201,500 0.18 0.18 Brazil Banco Nacional de Desenvolvimento Economico e Social 5.750% 26-Sep-2023 Brazil Notas do Tesouro Nacional Serie B 6.000% 15-Aug-2022 Brazil Notas do Tesouro Nacional Serie F 10.000% 01-Jan-2017 Brazil Notas do Tesouro Nacional Serie F 10.000% 01-Jan-2018 Brazil Notas do Tesouro Nacional Serie F 10.000% 01-Jan-2021 Brazil Notas do Tesouro Nacional Serie F 10.000% 01-Jan-2025 Brazilian Government International Bond 4.250% 07-Jan-2025 Brazilian Government International Bond 5.625% 07-Jan-2041 Brazilian Government International Bond 8.250% 20-Jan-2034 Embraer SA 5.150% 15-Jun-2022 USJ Acucar e Alcool SA 9.875% 09-Nov-2019 5,391,457 4.91 400,023 583,531 425,643 1,032,428 611,271 172,771 618,720 201,600 560,250 290,220 495,000 0.37 0.53 0.39 0.94 0.56 0.16 0.56 0.18 0.51 0.26 0.45 295,000 615,000 450,000 Canada Evraz Inc NA Canada 7.500% 15-Nov-2019 First Quantum Minerals Ltd 6.750% 15-Feb-2020 Pacific Rubiales Energy Corp 5.375% 26-Jan-2019 1,260,938 292,050 598,088 370,800 1.15 0.27 0.54 0.34 1,669,307 1.52 290,000 490,000 270,000 280,000 460,000 Cayman Islands AES Andres Dominicana Ltd / Itabo Dominicana Ltd 9.500% 12-Nov-2020 Agricola Senior Trust 6.750% 18-Jun-2020 Baidu Inc 4.125% 30-Jun-2025 Golden Eagle Retail Group Ltd 4.625% 21-May-2023 Odebrecht Finance Ltd 7.125% 26-Jun-2042 307,400 501,025 269,419 237,263 354,200 0.28 0.46 0.24 0.22 0.32 280,000 550,000 360,000 880,000 Chile Corp Nacional del Cobre de Chile 4.875% 04-Nov-2044 Empresa Electrica Angamos SA 4.875% 25-May-2029 Empresa Nacional del Petroleo 4.375% 30-Oct-2024 Latam Airlines 2015-1 Pass Through Trust A 4.200% 15-Nov-2027 2,044,758 268,868 542,788 360,802 872,300 1.86 0.24 0.49 0.33 0.80 540,000 870,000 China Bank of China Ltd 5.000% 13-Nov-2024 China Construction Bank Corp floating rate 13-May-2025 1,695,829 554,936 865,579 1.55 0.51 0.79 390,000 680,000 1,388,000 3,417,000 2,105,000 620,000 640,000 210,000 450,000 280,000 900,000 31 . PAYDEN GLOBAL FUNDS PUBLIC LIMITED COMPANY SCHEDULE OF INVESTMENTS (continued) Payden Global Emerging Markets Bond Fund (continued) As at 30 June 2015 Holding Name of securities Fair value USD 270,000 China (continued) Industrial & Commercial Bank of China Ltd/New York 3.231% 13-Nov-2019 % of net assets 275,314 0.25 270,000 320,000 360,000 641,000,000 610,000,000 1,126,000,000 1,240,000,000 100,000 290,000 572,000,000 792,000,000 497,000,000 Colombia Colombia Government International Bond 5.000% 15-Jun-2045 Colombia Government International Bond 5.625% 26-Feb-2044 Colombia Government International Bond 6.125% 18-Jan-2041 Colombian TES 5.000% 21-Nov-2018 Colombian TES 7.000% 04-May-2022 Colombian TES 7.250% 15-Jun-2016 Colombian TES 10.000% 24-Jul-2024 Ecopetrol SA 5.375% 26-Jun-2026 Ecopetrol SA 5.875% 18-Sep-2023 Emgesa SA ESP 8.750% 25-Jan-2021 Empresa de Telecomunicaciones de Bogota 7.000% 17-Jan-2023 Empresas Publicas de Medellin ESP 7.625% 10-Sep-2024 3,575,695 251,100 325,600 392,400 244,526 237,500 444,722 564,112 99,125 305,225 235,326 290,038 186,021 3.26 0.23 0.30 0.36 0.22 0.22 0.41 0.51 0.09 0.28 0.21 0.26 0.17 570,000 440,000 460,000 200,000 Costa Rica Banco de Costa Rica 5.250% 12-Aug-2018 Banco Nacional de Costa Rica 4.875% 01-Nov-2018 Costa Rica Government International Bond 7.000% 04-Apr-2044 Costa Rica Government International Bond 7.158% 12-Mar-2045 1,675,135 587,385 444,400 447,350 196,000 1.53 0.54 0.40 0.41 0.18 690,000 460,000 500,000 Croatia Croatia Government International Bond 6.000% 26-Jan-2024 Croatia Government International Bond 6.375% 24-Mar-2021 Hrvatska Elektroprivreda 6.000% 09-Nov-2017 1,755,854 732,954 498,525 524,375 1.60 0.67 0.45 0.48 360,000 Curacao SUAM Finance BV 4.875% 17-Apr-2024 363,600 363,600 0.33 0.33 480,000 490,000 290,000 900,000 150,000 Dominican Republic Aeropuertos Dominicanos Siglo XXI SA 9.750% 13-Nov-2019 Dominican Republic International Bond 5.500% 27-Jan-2025 Dominican Republic International Bond 6.850% 27-Jan-2045 Dominican Republic International Bond 7.450% 30-Apr-2044 Dominican Republic International Bond 7.500% 06-May-2021 2,439,800 492,000 493,675 297,250 987,750 169,125 2.22 0.45 0.45 0.27 0.90 0.15 230,000 440,000 El Salvador El Salvador Government International Bond 6.375% 18-Jan-2027 El Salvador Government International Bond 7.650% 15-Jun-2035 668,075 223,675 444,400 0.61 0.20 0.41 520,000 710,000 Georgia Bank of Georgia JSC 7.750% 05-Jul-2017 Georgian Railway JSC 7.750% 11-Jul-2022 1,315,932 542,387 773,545 1.20 0.49 0.71 704,755 704,755 0.64 0.64 Ghana Republic of Ghana 7.875% 07-Aug-2023 Republic of Ghana 8.125% 18-Jan-2026 Republic of Ghana 8.500% 04-Oct-2017 2,256,119 1,012,086 766,668 477,365 2.06 0.92 0.70 0.44 Honduras Honduras Government International Bond 7.500% 15-Mar-2024 Republic of Honduras 8.750% 16-Dec-2020 1,145,191 565,066 580,125 1.04 0.51 0.53 Hungary Hungary Government Bond 5.500% 24-Jun-2025 2,235,295 361,032 2.04 0.33 11,100,000,000 1,115,000 840,000 461,000 520,000 510,000 90,300,000 Germany Deutsche Bank AG/London 5.625% 17-May-2023 32 . PAYDEN GLOBAL FUNDS PUBLIC LIMITED COMPANY SCHEDULE OF INVESTMENTS (continued) Payden Global Emerging Markets Bond Fund (continued) As at 30 June 2015 Holding Fair value USD % of net assets Hungary (continued) Hungary Government Bond 7.000% 24-Jun-2022 Hungary Government International Bond 5.375% 25-Mar-2024 Magyar Export-Import Bank Zrt 4.000% 30-Jan-2020 MFB Magyar Fejlesztesi Bank Zrt 6.250% 21-Oct-2020 695,201 228,113 547,047 403,902 0.63 0.21 0.50 0.37 570,000 350,000 India Export-Import Bank of India 4.000% 14-Jan-2023 IDBI Bank Ltd/DIFC Dubai 4.125% 23-Apr-2020 919,593 568,675 350,918 0.84 0.52 0.32 350,000 390,000 530,000 610,000 320,000 83,000 540,000 550,000 Indonesia Indonesia Government International Bond 4.125% 15-Jan-2025 Indonesia Government International Bond 5.125% 15-Jan-2045 Indonesia Government International Bond 5.375% 17-Oct-2023 Indonesia Government International Bond 5.875% 15-Jan-2024 Indonesia Government International Bond 8.500% 12-Oct-2035 Pertamina Persero PT 4.300% 20-May-2023 Pertamina Persero PT 6.000% 03-May-2042 Perusahaan Gas Negara Persero Tbk PT 5.125% 16-May-2024 4,253,142 344,312 372,938 571,738 675,575 433,600 796,800 503,658 554,521 3.88 0.31 0.34 0.52 0.62 0.39 0.73 0.46 0.51 960,000 Ivory Coast Ivory Coast Government International Bond 5.750% 31-Dec-2032 909,792 909,792 0.83 0.83 350,000 Jamaica Jamaica Government International Bond 7.625% 09-Jul-2025 393,750 393,750 0.36 0.36 680,000 390,000 490,000 500,000 Kazakhstan Development Bank of Kazakhstan JSC 4.125% 10-Dec-2022 KazAgro National Management Holding JSC 4.625% 24-May-2023 KazMunayGas National Co JSC 6.000% 07-Nov-2044 KazMunayGas National Co JSC 6.375% 09-Apr-2021 1,901,812 608,600 345,150 422,012 526,050 1.73 0.56 0.31 0.38 0.48 Kenya Kenya Government International Bond 5.875% 24-Jun-2019 1,202,613 1,202,613 1.10 1.10 Luxembourg Actavis Funding SCS 4.550% 15-Mar-2035 Atento Luxco 1 SA 7.375% 29-Jan-2020 Millicom International Cellular SA 6.625% 15-Oct-2021 1,134,674 219,374 626,200 289,100 1.03 0.20 0.57 0.26 982,162 603,293 378,869 0.90 0.55 0.35 7,156,976 227,370 558,250 486,043 229,625 366,102 145,920 399,545 559,012 278,454 1,112,008 316,200 492,238 1,100,750 547,584 337,875 6.52 0.21 0.51 0.44 0.21 0.33 0.13 0.37 0.51 0.25 1.01 0.29 0.45 1.00 0.50 0.31 163,050,000 210,000 540,000 360,000 1,175,000 230,000 620,000 280,000 2,350,000 390,000 220,000 550,000 476,513 220,000 6,700,000 150,000 6,150,000 7,850,000 3,911,000 13,600,000 340,000 530,000 1,190,000 8,700,000 340,000 Name of securities Malaysia Malaysia Government Bond 3.418% 15-Aug-2022 Petronas Capital Ltd 4.500% 18-Mar-2045 Mexico BBVA Bancomer SA/Grand Cayman floating rate 17-May-2022 Comision Federal de Electricidad 6.125% 16-Jun-2045 Fermaca Enterprises S de RL de CV 6.375% 30-Mar-2038 Gruma SAB de CV 4.875% 01-Dec-2024 Grupo Televisa SAB 7.250% 14-May-2043 JB y Co SA de CV 3.750% 13-May-2025 Mexican Bonos 5.000% 15-Jun-2017 Mexican Bonos 7.750% 29-May-2031 Mexican Bonos 7.750% 13-Nov-2042 Mexican Bonos 10.000% 05-Dec-2024 Mexichem SAB de CV 5.875% 17-Sep-2044 Mexico Government International Bond 4.600% 23-Jan-2046 Petroleos Mexicanos 5.500% 27-Jun-2044 Red de Carreteras de Occidente SAPIB de CV 9.000% 10-Jun-2028 Unifin Financiera SAPI de CV SOFOM ENR 6.250% 22-Jul-2019 33 . PAYDEN GLOBAL FUNDS PUBLIC LIMITED COMPANY SCHEDULE OF INVESTMENTS (continued) Payden Global Emerging Markets Bond Fund (continued) As at 30 June 2015 Holding Name of securities Fair value USD % of net assets 200,000 Mongolia Mongolia Government International Bond 5.125% 05-Dec-2022 181,500 181,500 0.17 0.17 230,000 630,000 Morocco BMCE Bank 6.250% 27-Nov-2018 OCP SA 5.625% 25-Apr-2024 900,759 241,546 659,213 0.82 0.22 0.60 850,000 550,000 480,000 560,000 200,000 Netherlands Ajecorp BV 6.500% 14-May-2022 Kazakhstan Temir Zholy Finance BV 6.375% 06-Oct-2020 Kazakhstan Temir Zholy Finance BV 6.950% 10-Jul-2042 VimpelCom Holdings BV 7.504% 01-Mar-2022 VTR Finance BV 6.875% 15-Jan-2024 2,423,741 624,750 579,271 464,650 550,200 204,870 2.21 0.57 0.53 0.42 0.50 0.19 245,000 116,000,000 450,000 Nigeria Nigeria Government International Bond 6.750% 28-Jan-2021 Nigeria Government International Bond 13.050% 16-Aug-2016 Zenith Bank PLC 6.250% 22-Apr-2019 1,266,682 254,494 577,376 434,812 1.15 0.23 0.52 0.40 200,000 Pakistan Pakistan Government International Bond 8.250% 15-Apr-2024 218,500 218,500 0.20 0.20 Panama AES El Salvador Trust II 6.750% 28-Mar-2023 Avianca Holdings SA / Avianca Leasing LLC / Grupo Taca Holdings Ltd 8.375% 10-May-2020 Panama Government International Bond 6.700% 26-Jan-2036 Panama Government International Bond 9.375% 01-Apr-2029 2,967,275 526,625 2.70 0.48 354,375 1,767,000 319,275 0.32 1.61 0.29 220,000 740,000 200,000 Paraguay Republic of Paraguay 4.625% 25-Jan-2023 Republic of Paraguay 6.100% 11-Aug-2044 Telefonica Celular del Paraguay SA 6.750% 13-Dec-2022 1,186,100 223,300 754,800 208,000 1.08 0.20 0.69 0.19 380,000 450,000 640,000 970,000 220,000 550,000 Peru Abengoa Transmision Sur SA 6.875% 30-Apr-2043 Peruvian Government International Bond 5.625% 18-Nov-2050 Peruvian Government International Bond 5.700% 12-Aug-2024 Peruvian Government International Bond 6.950% 12-Aug-2031 Peruvian Government International Bond 7.350% 21-Jul-2025 Scotiabank Peru SAA floating rate 13-Dec-2027 2,248,231 423,225 504,000 192,110 299,496 287,650 541,750 2.05 0.39 0.46 0.18 0.27 0.26 0.49 938,228 253,245 285,681 228,508 170,794 0.85 0.23 0.26 0.21 0.15 550,000 350,000 1,425,000 215,000 10,000,000 215,000 158,000 130,000 Philippines Philippine Government International Bond 6.250% 14-Jan-2036 Philippine Government International Bond 6.375% 23-Oct-2034 Philippine Government International Bond 7.750% 14-Jan-2031 Power Sector Assets & Liabilities Management Corp 7.390% 02-Dec-2024 6,640,000 3,880,000 1,289,000 Poland Poland Government Bond 3.250% 25-Jul-2025 Poland Government Bond 4.000% 25-Oct-2023 Poland Government Bond 5.250% 25-Oct-2020 3,232,320 1,756,107 1,091,319 384,894 2.95 1.60 1.00 0.35 1,220,000 570,000 1,050,000 350,000 1,104,000 340,000 Romania Romania Government Bond 5.600% 28-Nov-2018 Romania Government Bond 5.850% 26-Apr-2023 Romania Government Bond 5.950% 11-Jun-2021 Romanian Government International Bond 4.375% 22-Aug-2023 Romanian Government International Bond 4.875% 22-Jan-2024 Romanian Government International Bond 6.125% 22-Jan-2044 2,707,793 335,536 159,335 297,127 360,465 1,173,000 382,330 2.47 0.31 0.14 0.27 0.33 1.07 0.35 34 . PAYDEN GLOBAL FUNDS PUBLIC LIMITED COMPANY SCHEDULE OF INVESTMENTS (continued) Payden Global Emerging Markets Bond Fund (continued) As at 30 June 2015 Holding Name of securities Fair value USD % of net assets Russia Russian Federal Bond - OFZ 7.500% 27-Feb-2019 Russian Federal Bond - OFZ 7.600% 14-Apr-2021 Russian Federal Bond - OFZ 8.150% 03-Feb-2027 1,718,573 709,445 387,912 621,216 1.57 0.65 0.35 0.57 Senegal Senegal Government International Bond 6.250% 30-Jul-2024 Senegal Government International Bond 8.750% 13-May-2021 1,967,943 1,223,010 744,933 1.79 1.11 0.68 Serbia Republic of Serbia 5.250% 21-Nov-2017 Republic of Serbia 5.875% 03-Dec-2018 Republic of Serbia 7.250% 28-Sep-2021 1,335,224 280,287 549,250 505,687 1.22 0.26 0.50 0.46 55,000,000 51,000,000 280,000 Singapore Standard Chartered Bank Singapore Ltd 7.160% 23-May-2023 Standard Chartered Bank Singapore Ltd 8.830% 29-Nov-2023 TBG Global Pte Ltd 4.625% 03-Apr-2018 1,950,440 827,836 842,604 280,000 1.78 0.75 0.77 0.26 610,000 3,900,000 29,740,550 1,620,000 205,000 South Africa Eskom Holdings SOC Ltd 5.750% 26-Jan-2021 South Africa Government Bond 6.250% 31-Mar-2036 South Africa Government Bond 7.000% 28-Feb-2031 South Africa Government Bond 10.500% 21-Dec-2026 Transnet SOC Ltd 4.000% 26-Jul-2022 3,289,739 600,850 242,527 2,093,005 155,450 197,907 3.00 0.55 0.22 1.91 0.14 0.18 360,000 460,000 420,000 460,000 Sri Lanka Bank of Ceylon 6.875% 03-May-2017 National Savings Bank 8.875% 18-Sep-2018 Sri Lanka Government International Bond 5.125% 11-Apr-2019 Sri Lanka Government International Bond 6.000% 14-Jan-2019 1,761,873 371,250 499,698 420,000 470,925 1.61 0.34 0.46 0.38 0.43 510,000 Sweden Eileme 2 AB 11.625% 31-Jan-2020 568,599 568,599 0.52 0.52 880,000 Tanzania Tanzania Government International Bond floating rate 09-Mar-2020 896,500 896,500 0.82 0.82 1,376,635 512,083 864,552 1.25 0.46 0.79 715,400 715,400 0.65 0.65 5,605,067 1,069,209 854,825 59,395 554,417 781,193 148,677 137,233 264,976 663,389 477,137 594,616 5.11 0.97 0.78 0.05 0.51 0.71 0.14 0.13 0.24 0.60 0.44 0.54 615,363 354,113 261,250 0.56 0.32 0.24 43,700,000 25,000,000 41,500,000 1,270,000 665,000 270,000 520,000 450,000 16,750,000 25,132,000 730,000 1,060,000 2,350,000 160,000 1,495,000 2,068,000 370,000 365,000 290,000 595,000 410,000 580,000 665,000 500,000 Thailand Thailand Government Bond 3.250% 16-Jun-2017 Thailand Government Bond 4.875% 22-Jun-2029 Tunisia Banque Centrale de Tunisie SA 5.750% 30-Jan-2025 Turkey Export Credit Bank of Turkey 5.000% 23-Sep-2021 Turkey Government Bond 8.500% 10-Jul-2019 Turkey Government Bond 9.000% 08-Mar-2017 Turkey Government Bond 9.000% 24-Jul-2024 Turkey Government Bond 9.500% 12-Jan-2022 Turkey Government Bond 10.400% 20-Mar-2024 Turkey Government Bond 10.700% 24-Feb-2016 Turkey Government International Bond 4.875% 16-Apr-2043 Turkey Government International Bond 6.250% 26-Sep-2022 Turkey Government International Bond 6.875% 17-Mar-2036 Turkiye Vakiflar Bankasi TAO 5.000% 31-Oct-2018 Ukraine Ukraine Government International Bond 7.500% 17-Apr-2023 Ukraine Government International Bond 7.800% 28-Nov-2022 35 . PAYDEN GLOBAL FUNDS PUBLIC LIMITED COMPANY SCHEDULE OF INVESTMENTS (continued) Payden Global Emerging Markets Bond Fund (continued) As at 30 June 2015 Holding Name of securities 340,000 Fair value USD United Arab Emirates DP World Ltd 3.250% 18-May-2020 % of net assets 338,300 338,300 0.31 0.31 9,600,000,000 12,000,000 50,000,000 7,200,000,000 39,000,000 1,970,000,000 United Kingdom Standard Chartered Bank 9.000% 19-Mar-2029 Standard Chartered Bank/Singapore 7.160% 23-May-2023 Standard Chartered Bank/Singapore 7.280% 05-Jun-2019 Standard Chartered Bank/Singapore 8.375% 19-Mar-2024 Standard Chartered Bank/Singapore 9.340% 27-Aug-2024 Standard Chartered Bank/Singapore EMTN 8.375% 19-Mar-2024 3,053,333 761,652 180,619 773,321 540,682 648,685 148,374 2.78 0.69 0.16 0.71 0.49 0.59 0.14 745,000 230,000 2,000,000,000 6,500,000,000 310,000 United States Cemex Finance LLC 9.375% 12-Oct-2022 JBS USA LLC / JBS USA Finance Inc 5.750% 15-Jun-2025 JPMorgan Chase Bank NA 8.375% 17-Mar-2034 JPMorgan Chase Bank NA 9.500% 17-Jul-2031 Southern Copper Corp 5.875% 23-Apr-2045 2,038,077 833,469 227,918 150,337 530,706 295,647 1.86 0.76 0.21 0.14 0.48 0.27 Uruguay Uruguay Government International Bond 4.500% 14-Aug-2024 Uruguay Government International Bond 5.100% 18-Jun-2050 1,987,260 1,256,685 730,575 1.81 1.14 0.67 905,000 820,000 950,000 895,000 910,000 324,000 378,000 Venezuela Petroleos de Venezuela SA 5.375% 12-Apr-2027 Petroleos de Venezuela SA 6.000% 15-Nov-2026 Petroleos de Venezuela SA 9.000% 17-Nov-2021 Petroleos de Venezuela SA 9.750% 17-May-2035 Venezuela Government International Bond 6.000% 09-Dec-2020 Venezuela Government International Bond 7.000% 31-Mar-2038 Venezuela Government International Bond 7.650% 21-Apr-2025 1,962,145 314,487 293,150 391,875 366,503 341,250 115,020 139,860 1.79 0.29 0.27 0.36 0.33 0.31 0.10 0.13 765,000 Vietnam Vietnam Government International Bond 4.800% 19-Nov-2024 768,825 768,825 0.70 0.70 695,000 Zambia Zambia Government International Bond 8.500% 14-Apr-2024 699,778 699,778 0.64 0.64 105,546,162 96.21 975,279 0.89 106,521,441 97.10 Unrealised loss on forward foreign exchange contracts (Appendix) (2014: (1.38%)) (80,544) (0.07) Financial liabilities at fair value through profit or loss (80,544) (0.07) 3,260,945 2.97 109,701,842 100.00 1,194,000 765,000 Total value of investment in securities (2014: 98.25%) Unrealised gain on forward foreign exchange contracts (Appendix) (2014: 0.27%) Financial assets at fair value through profit or loss Net current assets Total net assets 36 . PAYDEN GLOBAL FUNDS PUBLIC LIMITED COMPANY SCHEDULE OF INVESTMENTS (continued) Payden Global Emerging Markets Bond Fund (continued) As at 30 June 2015 Appendix: forward foreign currency contracts Unrealised gain on forward foreign currency contracts Currency Purchase Counter Party Purchase Amount Payden Global Emerging Markets Bond Fund HSBC Securities USD 270,092 HSBC Securities USD 451,732 State Street USD 940,690 Barclays USD 1,493,865 Royal Bank of Scotland USD 273,715 Royal Bank of Scotland ZAR 3,350,000 Barclays EUR 310,000 Barclays JPY 11,400,000 Barclays JPY 106,900,000 Barclays JPY 102,600,000 UBS USD 570,379 HSBC Securities USD 584,604 Currency Sale Sale Amount Maturity date Unrealised Gain/Loss USD RUB RUB HUF SGD ZAR USD USD USD USD USD COP COP (14,350,000) (23,280,000) (257,800,000) (1,998,000) (3,350,000) (271,178) (345,519) (92,000) (863,502) (833,950) (1,475,000,000) (1,515,000,000) 27-Jul-2015 27-Jul-2015 14-Aug-2015 20-Aug-2015 26-Aug-2015 26-Aug-2015 16-Sep-2015 16-Sep-2015 16-Sep-2015 16-Sep-2015 23-Sep-2015 23-Sep-2015 14,831 37,621 30,436 11,149 431 2,106 261 1,259 11,000 5,376 8,328 7,310 Euro Class (Accumulating) Citibank EUR 18,525,000 USD (20,317,924) 06-Jul-2015 323,688 Euro Class (Distributing) Citibank EUR 11,685,000 USD (12,815,921) 06-Jul-2015 204,172 Sterling Class (Accumulating) HSBC Securities GBP 6,725,000 USD (10,259,694) 06-Jul-2015 316,417 Sterling Class (Distributing) HSBC Securities GBP 19,000 USD (28,987) 06-Jul-2015 894 975,279 Currency Sale Sale Amount Maturity date Unrealised Gain/Loss USD USD USD USD MXN USD USD ZAR RON USD EUR JPY USD (673,769) (1,129,199) (207,154) (8,540,000) (347,179) (1,387,212) (13,900,000) (2,122,000) (135,484) (5,367,000) (220,900,000) (2,100,304) 27-Jul-2015 03-Aug-2015 19-Aug-2015 19-Aug-2015 19-Aug-2015 20-Aug-2015 26-Aug-2015 01-Sep-2015 16-Sep-2015 16-Sep-2015 16-Sep-2015 29-Sep-2015 (4,396) (8,022) (2,668) (2,014) (9,333) (14,860) (6,922) (1,471) (518) (14,137) (9,061) (5,813) EUR (1,334,000) 06-Jul-2015 (1,329) (80,544) Unrealised loss on forward foreign currency contracts Currency Purchase Counter Party Purchase Amount Payden Global Emerging Markets Bond Fund HSBC Securities RUB 37,630,000 BNP Paribas CLP 719,300,000 Credit Suisse MXN 3,220,000 Credit Suisse USD 540,318 Barclays MXN 5,320,000 HSBC Securities PHP 62,050,000 BNP Paribas USD 1,127,003 HSBC Securities USD 525,964 Barclays EUR 121,000 Barclays USD 5,972,317 Barclays USD 1,798,025 HSBC Securities MYR 7,957,000 Euro Class (Distributing) Citibank USD 1,485,090 Portfolio Analysis % of total assets Transferable securities and money market instruments admitted to an official stock exchange listing or traded on a regulated market OTC financial derivative instruments Analysis as a percentage of total assets rather than net assets is required under the UCITS Notice 8.5 appendix A. 37 94.41 0.80 95.21 . PAYDEN GLOBAL FUNDS PUBLIC LIMITED COMPANY SCHEDULE OF INVESTMENTS (continued) Payden Global Emerging Markets Corporate Bond Fund As at 30 June 2015 Holding Name of securities Fair value USD % of net assets 300,000 Argentina YPF SA 8.500% 28-Jul-2025 297,750 297,750 0.60 0.60 470,000 Australia Australia & New Zealand Banking Group Ltd 4.500% 19-Mar-2024 473,460 473,460 0.95 0.95 240,000 Azerbaijan International Bank of Azerbaijan OJSC 5.625% 11-Jun-2019 233,304 233,304 0.47 0.47 225,000 Barbados Columbus International Inc 7.375% 30-Mar-2021 242,719 242,719 0.49 0.49 510,000 250,000 240,000 775,000 Bermuda Digicel Group Ltd 8.250% 30-Sep-2020 Digicel Ltd 6.000% 15-Apr-2021 GCX Ltd 7.000% 01-Aug-2019 Ooredoo International Finance Ltd 3.875% 31-Jan-2028 1,735,931 513,825 241,655 242,264 738,187 3.49 1.03 0.49 0.49 1.48 255,000 185,000 750,000 Brazil Cielo SA / Cielo USA Inc 3.750% 16-Nov-2022 Embraer SA 5.150% 15-Jun-2022 USJ Acucar e Alcool SA 9.875% 09-Nov-2019 840,127 235,875 191,752 412,500 1.69 0.47 0.39 0.83 550,000 230,000 British Virgin Islands Sinopec Group Overseas Development 2015 Ltd 2.500% 28-Apr-2020 Yingde Gases Investment Ltd 8.125% 22-Apr-2018 765,714 542,326 223,388 1.54 1.09 0.45 310,000 245,000 445,000 350,000 390,000 265,000 Canada Air Canada 7.750% 15-Apr-2021 Evraz Inc NA Canada 7.500% 15-Nov-2019 First Quantum Minerals Ltd 6.750% 15-Feb-2020 Novelis Inc 8.375% 15-Dec-2017 Pacific Rubiales Energy Corp 5.375% 26-Jan-2019 Pacific Rubiales Energy Corp 7.250% 12-Dec-2021 1,910,122 331,700 242,550 432,762 363,125 321,360 218,625 3.84 0.67 0.49 0.87 0.73 0.64 0.44 520,000 240,000 335,000 240,000 280,000 470,000 550,000 275,000 400,000 480,000 188,600 355,000 270,000 600,000 Cayman Islands ADCB Finance Cayman Ltd floating rate 28-May-2023 AES Andres Dominicana Ltd / Itabo Dominicana Ltd 9.500% 12-Nov-2020 Agricola Senior Trust 6.750% 18-Jun-2020 Alibaba Group Holding Ltd 4.500% 28-Nov-2034 Golden Eagle Retail Group Ltd 4.625% 21-May-2023 Hutchison Whampoa International 11 Ltd 4.625% 13-Jan-2022 Hutchison Whampoa International 12 Ltd floating rate Perpetual Industrial Senior Trust 5.500% 01-Nov-2022 MAF Global Securities Ltd 4.750% 07-May-2024 Marfrig Overseas Ltd 9.500% 04-May-2020 Odebrecht Drilling Norbe VIII/IX Ltd 6.350% 30-Jun-2021 Odebrecht Finance Ltd 7.125% 26-Jun-2042 Tencent Holdings Ltd 3.375% 02-May-2019 Tencent Holdings Ltd 3.800% 11-Feb-2025 5,131,971 520,000 254,400 342,537 231,333 237,263 506,789 585,222 267,437 414,000 492,816 146,165 273,350 277,463 583,196 10.33 1.05 0.51 0.69 0.47 0.48 1.02 1.18 0.54 0.83 0.99 0.29 0.55 0.56 1.17 470,000 360,000 260,000 370,000 260,000 370,000 510,000 300,000 Chile Colbun SA 6.000% 21-Jan-2020 Corpbanca SA 3.125% 15-Jan-2018 Empresa Electrica Angamos SA 4.875% 25-May-2029 Empresa Nacional del Petroleo 4.375% 30-Oct-2024 GNL Quintero SA 4.634% 31-Jul-2029 Latam Airlines 2015-1 Pass Through Trust A 4.200% 15-Nov-2027 Latam Airlines 2015-1 Pass Through Trust B 4.500% 15-Nov-2023 Telefonica Chile SA 3.875% 12-Oct-2022 2,945,608 520,778 361,691 256,591 370,824 261,397 366,763 512,550 295,014 5.93 1.05 0.73 0.52 0.75 0.52 0.74 1.03 0.59 38 . PAYDEN GLOBAL FUNDS PUBLIC LIMITED COMPANY SCHEDULE OF INVESTMENTS (continued) Payden Global Emerging Markets Corporate Bond Fund (continued) As at 30 June 2015 Holding Name of securities Fair value USD % of net assets 270,000 370,000 270,000 China Bank of China Ltd 5.000% 13-Nov-2024 China Construction Bank Corp floating rate 13-May-2025 Industrial & Commercial Bank of China Ltd/New York 3.231% 13-Nov-2019 920,902 277,468 368,120 275,314 1.85 0.56 0.74 0.55 235,000 280,000 250,000 20,000 Colombia Colombia Government International Bond 4.375% 12-Jul-2021 Colombia Government International Bond 5.000% 15-Jun-2045 Ecopetrol SA 5.375% 26-Jun-2026 Ecopetrol SA 5.875% 18-Sep-2023 775,660 246,397 260,400 247,813 21,050 1.56 0.50 0.52 0.50 0.04 200,000 230,000 Costa Rica Banco de Costa Rica 5.250% 12-Aug-2018 Costa Rica Government International Bond 7.158% 12-Mar-2045 431,500 206,100 225,400 0.87 0.42 0.45 230,000 Curacao SUAM Finance BV 4.875% 17-Apr-2024 232,300 232,300 0.47 0.47 310,000 Dominican Republic Aeropuertos Dominicanos Siglo XXI SA 9.750% 13-Nov-2019 317,750 317,750 0.64 0.64 410,000 Georgia Bank of Georgia JSC 7.750% 05-Jul-2017 427,651 427,651 0.86 0.86 250,000 Ghana Republic of Ghana 7.875% 07-Aug-2023 226,925 226,925 0.46 0.46 270,000 Guernsey Credit Suisse Group Funding Guernsey Ltd 2.750% 26-Mar-2020 266,905 266,905 0.54 0.54 435,000 Hong Kong AIA Group Ltd 3.200% 11-Mar-2025 420,300 420,300 0.85 0.85 300,000 245,000 220,000 200,000 310,000 300,000 India Export-Import Bank of India 2.750% 01-Apr-2020 Export-Import Bank of India 4.000% 14-Jan-2023 ICICI Bank Ltd/Dubai 4.700% 21-Feb-2018 IDBI Bank Ltd/DIFC Dubai 4.125% 23-Apr-2020 Reliance Industries Ltd 4.875% 10-Feb-2045 State Bank of India/London 4.125% 01-Aug-2017 1,562,243 294,453 244,431 231,777 200,524 279,035 312,023 3.14 0.59 0.49 0.47 0.40 0.56 0.63 610,000 215,000 505,000 Indonesia Bank Rakyat Indonesia Persero Tbk PT 2.950% 28-Mar-2018 Pertamina Persero PT 6.000% 03-May-2042 Perusahaan Gas Negara Persero Tbk PT 5.125% 16-May-2024 1,323,464 613,782 200,531 509,151 2.66 1.24 0.40 1.02 560,000 470,000 Israel Israel Electric Corp Ltd 7.250% 15-Jan-2019 Israel Electric Corp Ltd floating rate 17-Jan-2018 1,106,550 634,200 472,350 2.23 1.28 0.95 210,000 280,000 Kazakhstan Halyk Savings Bank of Kazakhstan JSC 7.250% 03-May-2017 KazMunayGas National Co JSC 9.125% 02-Jul-2018 535,325 217,875 317,450 1.08 0.44 0.64 270,000 90,000 260,000 477,000 380,000 Luxembourg Actavis Funding SCS 3.000% 12-Mar-2020 Actavis Funding SCS 4.550% 15-Mar-2035 Altice SA 7.750% 15-May-2022 Atento Luxco 1 SA 7.375% 29-Jan-2020 Millicom International Cellular SA 4.750% 22-May-2020 1,458,381 271,287 85,842 252,200 481,770 367,282 2.94 0.55 0.17 0.51 0.97 0.74 39 . PAYDEN GLOBAL FUNDS PUBLIC LIMITED COMPANY SCHEDULE OF INVESTMENTS (continued) Payden Global Emerging Markets Corporate Bond Fund (continued) As at 30 June 2015 Holding Name of securities Fair value USD % of net assets 300,000 Malaysia Petronas Capital Ltd 4.500% 18-Mar-2045 291,438 291,438 0.59 0.59 420,000 Marshall Island Nakilat Inc 6.067% 31-Dec-2033 488,775 488,775 0.98 0.98 Mexico Alfa SAB de CV 5.250% 25-Mar-2024 BBVA Bancomer SA/Grand Cayman floating rate 17-May-2022 Cemex SAB de CV 9.500% 15-Jun-2018 Elementia SAB de CV 5.500% 15-Jan-2025 Fermaca Enterprises S de RL de CV 6.375% 30-Mar-2038 Gruma SAB de CV 4.875% 01-Dec-2024 Grupo Cementos de Chihuahua SAB de CV 8.125% 08-Feb-2020 JB y Co SA de CV 3.750% 13-May-2025 Mexichem SAB de CV 5.875% 17-Sep-2044 Mexico Generadora de Energia S de rl 5.500% 06-Dec-2032 Mexico Government International Bond 3.625% 15-Mar-2022 Petroleos Mexicanos 5.500% 21-Jan-2021 Red de Carreteras de Occidente SAPIB de CV 9.000% 10-Jun-2028 Unifin Financiera SAPI de CV SOFOM ENR 6.250% 22-Jul-2019 4,859,165 494,400 361,725 276,250 518,925 455,665 208,750 280,280 243,200 213,900 482,221 253,625 597,850 213,999 258,375 9.78 1.00 0.73 0.56 1.04 0.92 0.42 0.56 0.49 0.43 0.97 0.51 1.20 0.43 0.52 200,000 300,000 700,000 Morocco BMCE Bank 6.250% 27-Nov-2018 OCP SA 4.500% 22-Oct-2025 OCP SA 5.625% 25-Apr-2024 1,228,624 210,040 286,125 732,459 2.47 0.42 0.58 1.47 300,000 260,000 510,000 290,000 225,000 260,000 385,000 Netherlands Ajecorp BV 6.500% 14-May-2022 GTB Finance BV 6.000% 08-Nov-2018 Indosat Palapa Co BV 7.375% 29-Jul-2020 Listrindo Capital BV 6.950% 21-Feb-2019 Lukoil International Finance BV 6.125% 09-Nov-2020 VimpelCom Holdings BV 7.504% 01-Mar-2022 VTR Finance BV 6.875% 15-Jan-2024 2,182,519 220,500 248,560 529,763 303,775 230,096 255,450 394,375 4.39 0.44 0.50 1.07 0.61 0.46 0.52 0.79 232,875 0.47 230,000 Panama Avianca Holdings SA / Avianca Leasing LLC / Grupo Taca Holdings Ltd 8.375% 10-May-2020 232,875 0.47 455,000 275,000 Paraguay Banco Regional SAECA 8.125% 24-Jan-2019 Telefonica Celular del Paraguay SA 6.750% 13-Dec-2022 776,831 490,831 286,000 1.56 0.99 0.57 200,000 320,000 Peru Abengoa Transmision Sur SA 6.875% 30-Apr-2043 Scotiabank Peru SAA floating rate 13-Dec-2027 537,950 222,750 315,200 1.08 0.45 0.63 270,000 Philippines International Container Terminal Services Inc 7.375% 17-Mar-2020 308,281 308,281 0.62 0.62 250,000 Qatar Ras Laffan Liquefied Natural Gas Co Ltd III 5.838% 30-Sep-2027 285,528 285,528 0.58 0.58 220,000 Senegal Senegal Government International Bond 8.750% 13-May-2021 246,444 246,444 0.50 0.50 500,000 360,000 250,000 Singapore BOC Aviation Pte Ltd 4.375% 02-May-2023 Flextronics International Ltd 4.625% 15-Feb-2020 TBG Global Pte Ltd 4.625% 03-Apr-2018 1,128,397 508,947 369,450 250,000 2.27 1.03 0.74 0.50 480,000 350,000 250,000 510,000 446,731 200,000 260,000 250,000 230,000 492,062 250,000 550,000 3,400,000 260,000 40 . PAYDEN GLOBAL FUNDS PUBLIC LIMITED COMPANY SCHEDULE OF INVESTMENTS (continued) Payden Global Emerging Markets Corporate Bond Fund (continued) As at 30 June 2015 Holding Name of securities Fair value USD % of net assets 200,000 200,000 400,000 360,000 South Korea Korea Development Bank 3.000% 17-Mar-2019 Korea Gas Corp 2.875% 29-Jul-2018 Korea Hydro & Nuclear Power Co Ltd 2.875% 02-Oct-2018 SK Telecom Co Ltd 2.125% 01-May-2018 1,186,479 206,071 206,020 410,759 363,629 2.39 0.42 0.41 0.83 0.73 200,000 Spain Banco Bilbao Vizcaya Argentaria SA floating rate Perpetual 215,500 215,500 0.43 0.43 210,000 Sri Lanka National Savings Bank 8.875% 18-Sep-2018 228,123 228,123 0.46 0.46 420,000 690,000 Sweden Eileme 2 AB 11.625% 31-Jan-2020 PKO Finance AB 4.630% 26-Sep-2022 1,183,271 468,258 715,013 2.38 0.94 1.44 250,000 Switzerland UBS AG/Stamford CT 1.800% 26-Mar-2018 249,727 249,727 0.50 0.50 500,000 300,000 Thailand Bangkok Bank Pcl/Hong Kong 4.800% 18-Oct-2020 Thai Oil Pcl 3.625% 23-Jan-2023 840,499 544,257 296,242 1.69 1.09 0.60 400,000 570,000 300,000 210,000 Turkey Akbank TAS 4.000% 24-Jan-2020 Turkiye Garanti Bankasi AS 4.000% 13-Sep-2017 Turkiye Vakiflar Bankasi TAO 3.750% 15-Apr-2018 Turkiye Vakiflar Bankasi TAO 5.750% 24-Apr-2017 1,485,819 390,616 578,153 298,125 218,925 2.99 0.79 1.16 0.60 0.44 400,000 420,000 220,000 200,000 200,000 United Arab Emirates Abu Dhabi National Energy Co PJSC 5.875% 13-Dec-2021 DP World Ltd 3.250% 18-May-2020 DP World Ltd 6.850% 02-Jul-2037 First Gulf Bank PJSC 3.250% 14-Jan-2019 Ruwais Power Co PJSC 6.000% 31-Aug-2036 1,558,201 464,520 417,900 240,900 206,331 228,550 3.14 0.94 0.84 0.48 0.42 0.46 250,000 200,000 240,000 United Kingdom HSBC Holdings PLC floating rate Perpetual Petra Diamonds US Treasury PLC 8.250% 31-May-2020 Vedanta Resources PLC 9.500% 18-Jul-2018 712,025 250,625 204,000 257,400 1.43 0.50 0.41 0.52 251,253 205,000 250,000 745,000 290,000 400,000 220,000 270,000 200,000 270,000 250,000 250,000 225,000 United States American Airlines 2013-1 Class B Pass Through Trust 5.625% 15-Jan-2021 AT&T Inc 4.750% 15-May-2046 Baxalta Inc 4.000% 23-Jun-2025 Cemex Finance LLC 9.375% 12-Oct-2022 Citigroup Inc floating rate Perpetual First Cash Financial Services Inc 6.750% 01-Apr-2021 FS Investment Corp 4.250% 15-Jan-2020 Goldman Sachs Group Inc 2.600% 23-Apr-2020 JBS USA LLC / JBS USA Finance Inc 5.750% 15-Jun-2025 Morgan Stanley floating rate Perpetual Reynolds American Inc 4.450% 12-Jun-2025 Southern Copper Corp 5.875% 23-Apr-2045 Sprint Capital Corp 6.900% 01-May-2019 3,926,467 261,303 187,265 248,646 833,469 291,087 423,000 222,608 268,828 198,190 268,380 255,204 238,425 230,062 7.90 0.53 0.38 0.50 1.68 0.58 0.85 0.45 0.54 0.40 0.54 0.51 0.48 0.46 41 . PAYDEN GLOBAL FUNDS PUBLIC LIMITED COMPANY SCHEDULE OF INVESTMENTS (continued) Payden Global Emerging Markets Corporate Bond Fund (continued) As at 30 June 2015 Holding Name of securities Fair value USD % of net assets 235,000 Vietnam Vietnam Government International Bond 4.800% 19-Nov-2024 236,175 236,175 0.48 0.48 Total value of investment in securities (2014: 97.16%) Unrealised gain on forward foreign exchange contracts (Appendix) (2014: 0.04%) 48,971,675 98.56 95,209 0.19 Financial assets at fair value through profit or loss 49,066,884 98.75 Unrealised loss on forward foreign exchange contracts (Appendix) (2014: (0.61%)) (300) 0.00 Financial liabilities at fair value through profit or loss (300) 0.00 623,201 1.25 49,689,785 100.00 Net current assets Total net assets Appendix: forward foreign currency contracts Unrealised gain on forward foreign currency contracts Currency Purchase Counter Party Purchase Amount Payden Global Emerging Markets Corporate Bond Fund Barclays TRY 522,000 Barclays USD 197,596 Credit Suisse USD 227,138 Royal Bank of Scotland USD 99,809 Royal Bank of Scotland USD 147,888 HSBC Securities USD 123,481 Swiss Franc Class (Accumulating) Barclays CHF Currency Sale Sale Amount Maturity date Unrealised Gain/Loss USD USD TRY MXN ZAR ZAR COP (191,665) (522,000) (3,450,000) (1,200,000) (1,810,000) (320,000,000) 14-Aug-2015 14-Aug-2015 19-Aug-2015 26-Aug-2015 26-Aug-2015 23-Sep-2015 663 5,269 8,046 1,916 233 1,544 USD (8,841,268) 06-Jul-2015 77,538 95,209 Currency Sale Sale Amount Maturity date Unrealised Gain/Loss USD EUR (114,000) 16-Sep-2015 (300) 8,334,000 Unrealised loss on forward foreign currency contracts Currency Purchase Counter Party Purchase Amount Payden Global Emerging Markets Corporate Bond Fund Barclays USD 126,857 (300) Portfolio Analysis % of total assets Transferable securities and money market instruments admitted to an official stock exchange listing or traded on a regulated market OTC financial derivative instruments Analysis of total assets rather than net assets is required under the UCITS Notice 8.5 appendix A. 42 96.98 0.19 97.17 . PAYDEN GLOBAL FUNDS PUBLIC LIMITED COMPANY SCHEDULE OF INVESTMENTS (continued) Payden Global Government Bond Index Fund As at 30 June 2015 Holding Name of securities Fair value USD % of net assets Australia Australia Government Bond 2.750% 21-Apr-2024 Australia Government Bond 3.250% 21-Oct-2018 Australia Government Bond 6.000% 15-Feb-2017 2,081,167 910,557 598,161 572,449 1.62 0.71 0.47 0.44 440,000 227,000 300,000 135,000 Austria Austria Government Bond 3.500% 15-Sep-2021 Austria Government Bond 4.150% 15-Mar-2037 Austria Government Bond 4.650% 15-Jan-2018 Austria Government Bond 6.250% 15-Jul-2027 1,556,918 581,273 366,789 374,843 234,013 1.21 0.45 0.29 0.29 0.18 250,000 300,000 450,000 330,000 416,000 Belgium Belgium Government Bond 3.250% 28-Sep-2016 Belgium Government Bond 4.000% 28-Mar-2019 Belgium Government Bond 4.250% 28-Sep-2021 Belgium Government Bond 5.000% 28-Mar-2035 Belgium Government Bond 5.500% 28-Mar-2028 2,525,788 290,412 383,131 615,955 557,517 678,773 1.97 0.23 0.30 0.48 0.43 0.53 400,000 300,000 900,000 250,000 100,000 210,000 Canada Canadian Government Bond 1.250% 01-Feb-2016 Canadian Government Bond 2.250% 01-Jun-2025 Canadian Government Bond 3.750% 01-Jun-2019 Canadian Government Bond 4.000% 01-Jun-2041 Canadian Government Bond 5.000% 01-Jun-2037 Canadian Government Bond 5.750% 01-Jun-2033 2,022,606 321,675 252,733 807,870 265,381 117,655 257,292 1.58 0.25 0.20 0.63 0.21 0.09 0.20 750,000 1,950,000 700,000 Denmark Denmark Government Bond 1.750% 15-Nov-2025 Denmark Government Bond 4.000% 15-Nov-2019 Denmark Government Bond 4.500% 15-Nov-2039 626,480 120,490 341,501 164,489 0.49 0.09 0.27 0.13 Finland Finland Government Bond 2.000% 15-Apr-2024 487,011 487,011 0.38 0.38 1,200,000 750,000 700,000 400,000 1,008,000 490,000 275,000 1,214,290 1,050,000 995,000 350,000 900,000 France France Government Bond OAT 3.750% 25-Apr-2021 France Government Bond OAT 4.000% 25-Oct-2038 France Government Bond OAT 4.000% 25-Apr-2055 France Government Bond OAT 4.250% 25-Oct-2017 France Government Bond OAT 4.250% 25-Apr-2019 France Government Bond OAT 5.500% 25-Apr-2029 France Government Bond OAT 6.000% 25-Oct-2025 France Government Bond OAT 8.500% 25-Apr-2023 9,185,087 1,335,333 746,567 443,954 1,490,349 1,355,241 1,648,294 572,808 1,592,541 7.15 1.04 0.58 0.35 1.16 1.05 1.28 0.45 1.24 960,000 550,000 1,162,000 690,000 160,000 100,000 1,355,000 Germany Bundesrepublik Deutschland 3.250% 04-Jan-2020 Bundesrepublik Deutschland 3.500% 04-Jul-2019 Bundesrepublik Deutschland 4.250% 04-Jul-2018 Bundesrepublik Deutschland 4.250% 04-Jul-2039 Bundesrepublik Deutschland 4.750% 04-Jul-2034 Bundesrepublik Deutschland 5.625% 04-Jan-2028 Bundesrepublik Deutschland 6.250% 04-Jan-2024 7,252,326 1,224,614 699,800 1,467,292 1,191,242 277,377 171,481 2,220,520 5.65 0.95 0.55 1.14 0.93 0.22 0.13 1.73 921,563 257,481 664,082 0.72 0.20 0.52 10,222,758 1,965,928 822,439 1,225,620 7.96 1.53 0.64 0.95 200,000 514,304 1,700,000 650,000 980,000 Ireland Ireland Government Bond 3.400% 18-Mar-2024 Ireland Government Bond 4.400% 18-Jun-2019 Italy Italy Buoni Poliennali Del Tesoro 3.750% 01-Aug-2016 Italy Buoni Poliennali Del Tesoro 4.000% 01-Sep-2020 Italy Buoni Poliennali Del Tesoro 4.000% 01-Feb-2037 43 . PAYDEN GLOBAL FUNDS PUBLIC LIMITED COMPANY SCHEDULE OF INVESTMENTS (continued) Payden Global Government Bond Index Fund (continued) As at 30 June 2015 Holding 450,000 810,000 1,550,000 450,000 226,000 533,138 53,300,000 52,000,000 135,000,000 253,500,000 171,100,000 320,100,000 46,900,000 80,400,000 99,600,000 65,000,000 43,850,000 78,000,000 4,000,000 32,500,000 22,500,000 169,100,000 486,500,000 83,100,000 25,000,000 219,000,000 191,500,000 42,000,000 13,000,000 26,000,000 47,000,000 267,250,000 Name of securities Fair value USD Italy (continued) Italy Buoni Poliennali Del Tesoro 4.500% 01-Feb-2018 Italy Buoni Poliennali Del Tesoro 4.500% 01-Feb-2020 Italy Buoni Poliennali Del Tesoro 4.750% 01-Aug-2023 Italy Buoni Poliennali Del Tesoro 5.000% 01-Mar-2025 Italy Buoni Poliennali Del Tesoro 5.250% 01-Nov-2029 Italy Buoni Poliennali Del Tesoro 6.500% 01-Nov-2027 Japan Japan Government Forty Year Bond 2.200% 20-Mar-2049 Japan Government Forty Year Bond 2.400% 20-Mar-2048 Japan Government Ten Year Bond 1.300% 20-Dec-2018 Japan Government Ten Year Bond 1.500% 20-Jun-2019 Japan Government Ten Year Bond 1.700% 20-Dec-2016 Japan Government Ten Year Bond 1.700% 20-Sep-2017 Japan Government Ten Year Bond 1.700% 20-Jun-2018 Japan Government Thirty Year Bond 1.700% 20-Jun-2033 Japan Government Thirty Year Bond 2.200% 20-Sep-2039 Japan Government Thirty Year Bond 2.300% 20-Dec-2036 Japan Government Thirty Year Bond 2.300% 20-Mar-2040 Japan Government Thirty Year Bond 2.400% 20-Mar-2037 Japan Government Thirty Year Bond 2.400% 20-Sep-2038 Japan Government Thirty Year Bond 2.500% 20-Sep-2035 Japan Government Thirty Year Bond 2.500% 20-Mar-2036 Japan Government Thirty Year Bond 2.500% 20-Mar-2038 Japan Government Twenty Year Bond 1.000% 20-Mar-2023 Japan Government Twenty Year Bond 1.900% 20-Dec-2028 Japan Government Twenty Year Bond 2.000% 20-Dec-2030 Japan Government Twenty Year Bond 2.100% 20-Sep-2024 Japan Government Twenty Year Bond 2.100% 20-Dec-2027 Japan Government Twenty Year Bond 2.100% 20-Sep-2028 Japan Government Twenty Year Bond 2.100% 20-Jun-2029 Japan Government Twenty Year Bond 2.100% 20-Dec-2030 Japan Government Twenty Year Bond 2.300% 20-Mar-2026 Japan Government Twenty Year Bond 2.500% 20-Mar-2020 % of net assets 551,506 1,039,287 2,071,934 614,637 323,415 827,884 0.43 0.81 1.61 0.48 0.25 0.65 27,534,858 515,503 524,559 1,151,703 2,190,268 1,433,302 2,714,107 402,474 726,553 957,335 632,592 429,292 771,404 39,686 326,235 225,778 1,703,378 4,194,416 784,151 238,112 2,065,251 1,841,012 404,959 125,399 250,838 456,250 2,430,301 21.44 0.40 0.41 0.90 1.71 1.12 2.11 0.31 0.57 0.75 0.49 0.33 0.60 0.03 0.25 0.18 1.33 3.27 0.61 0.19 1.61 1.43 0.31 0.10 0.19 0.35 1.89 1,000,000 Malaysia Malaysia Government Bond 3.955% 15-Sep-2025 263,610 263,610 0.21 0.21 8,000,000 2,800,000 Mexico Mexican Bonos 6.500% 09-Jun-2022 Mexican Bonos 10.000% 20-Nov-2036 774,056 529,480 244,576 0.60 0.41 0.19 2,531,805 610,561 777,580 524,734 618,930 1.97 0.47 0.61 0.41 0.48 500,000 600,000 325,000 506,900 Netherlands Netherlands Government Bond 2.000% 15-Jul-2024 Netherlands Government Bond 3.500% 15-Jul-2020 Netherlands Government Bond 4.000% 15-Jan-2037 Netherlands Government Bond 4.500% 15-Jul-2017 1,000,000 Norway Norway Government Bond 2.000% 24-May-2023 130,576 130,576 0.10 0.10 1,000,000 Poland Poland Government Bond 3.250% 25-Jul-2025 264,474 264,474 0.21 0.21 Singapore Singapore Government Bond 2.750% 01-Jul-2023 377,460 377,460 0.29 0.29 South Africa South Africa Government Bond 6.250% 31-Mar-2036 350,477 155,466 0.27 0.12 500,000 2,500,000 44 . PAYDEN GLOBAL FUNDS PUBLIC LIMITED COMPANY SCHEDULE OF INVESTMENTS (continued) Payden Global Government Bond Index Fund (continued) As at 30 June 2015 Holding 2,500,000 525,000 730,000 310,000 930,000 955,000 100,000 282,942 900,000 2,400,000 320,000 1,270,000 220,000 225,000 70,000 330,000 200,000 597,000 241,000 430,000 696,000 390,000 11,850,000 2,100,000 1,400,000 800,000 2,835,000 5,300,000 1,150,000 1,150,000 2,400,000 200,000 109,000 2,400,000 100,000 150,000 280,000 550,000 300,000 800,000 1,474,400 2,386,600 Name of securities Fair value USD % of net assets 195,011 0.15 5,101,692 645,831 982,499 444,252 1,145,013 1,300,607 153,454 430,036 3.97 0.50 0.77 0.35 0.89 1.01 0.12 0.33 Sweden Sweden Government Bond 2.500% 12-May-2025 Sweden Government Bond 5.000% 01-Dec-2020 484,823 123,846 360,977 0.38 0.10 0.28 Switzerland Switzerland Government Bond 3.000% 12-May-2019 392,158 392,158 0.31 0.31 8,772,613 1,988,940 380,835 393,949 138,459 690,829 443,250 1,269,114 491,855 923,164 1,216,647 835,571 6.83 1.55 0.29 0.31 0.11 0.54 0.34 0.99 0.38 0.72 0.95 0.65 United States United States Treasury Note/Bond 0.875% 15-Aug-2017 United States Treasury Note/Bond 0.875% 15-Oct-2017 United States Treasury Note/Bond 2.125% 30-Jun-2021 United States Treasury Note/Bond 2.250% 31-Jul-2018 United States Treasury Note/Bond 2.375% 31-Mar-2016 United States Treasury Note/Bond 2.500% 15-Aug-2023 United States Treasury Note/Bond 2.625% 15-Nov-2020 United States Treasury Note/Bond 3.125% 15-May-2019 United States Treasury Note/Bond 3.500% 15-May-2020 United States Treasury Note/Bond 3.625% 15-Aug-2019 United States Treasury Note/Bond 3.750% 15-Nov-2018 United States Treasury Note/Bond 3.750% 15-Nov-2043 United States Treasury Note/Bond 3.875% 15-May-2018 United States Treasury Note/Bond 4.250% 15-May-2039 United States Treasury Note/Bond 4.250% 15-Nov-2040 United States Treasury Note/Bond 4.375% 15-May-2040 United States Treasury Note/Bond 4.625% 15-Feb-2040 United States Treasury Note/Bond 4.750% 15-Feb-2041 United States Treasury Note/Bond 8.000% 15-Nov-2021 United States Treasury Note/Bond 8.125% 15-Aug-2021 40,608,418 11,893,513 2,104,923 1,417,500 829,313 2,880,405 5,414,697 1,201,211 1,227,266 2,610,375 217,735 118,401 2,700,000 108,281 181,055 338,887 677,316 382,617 1,042,187 2,012,671 3,250,065 31.63 9.26 1.64 1.10 0.65 2.24 4.22 0.94 0.96 2.03 0.17 0.09 2.10 0.09 0.14 0.26 0.53 0.30 0.81 1.57 2.53 Total value of investment in securities (2014: 100.57%) 124,468,724 96.94 1,731,890 1.35 126,200,614 98.29 South Africa (continued) South Africa Government Bond 6.750% 31-Mar-2021 Spain Spain Government Bond 4.100% 30-Jul-2018 Spain Government Bond 4.650% 30-Jul-2025 Spain Government Bond 4.900% 30-Jul-2040 Spain Government Bond 5.500% 30-Jul-2017 Spain Government Bond 5.500% 30-Apr-2021 Spain Government Bond 5.750% 30-Jul-2032 Spain Government Bond 6.000% 31-Jan-2029 United Kingdom United Kingdom Gilt 1.750% 07-Sep-2022 United Kingdom Gilt 3.750% 07-Sep-2019 United Kingdom Gilt 3.750% 07-Sep-2020 United Kingdom Gilt 4.250% 07-Mar-2036 United Kingdom Gilt 4.250% 07-Dec-2046 United Kingdom Gilt 4.250% 07-Dec-2055 United Kingdom Gilt 4.500% 07-Dec-2042 United Kingdom Gilt 4.750% 07-Dec-2030 United Kingdom Gilt 4.750% 07-Dec-2038 United Kingdom Gilt 5.000% 07-Mar-2018 United Kingdom Gilt 8.000% 07-Jun-2021 Unrealised gain on forward foreign exchange contracts (Appendix) (2014: 1.56%) Financial assets at fair value through profit or loss 45 . PAYDEN GLOBAL FUNDS PUBLIC LIMITED COMPANY SCHEDULE OF INVESTMENTS (continued) Payden Global Government Bond Index Fund (continued) As at 30 June 2015 Fair value USD % of net assets Unrealised loss on forward foreign exchange contracts (Appendix) (2014: (3.02%)) (1,534,164) (1.20) Financial liabilities at fair value through profit or loss (1,534,164) (1.20) 3,731,071 2.91 128,397,521 100.00 Net current assets Total net assets Appendix: forward foreign currency contracts Unrealised gain on forward foreign currency contracts Currency Purchase Counter Party Purchase Amount Payden Global Government Bond Index Fund Barclays JPY 62,000,000 Citibank MYR 1,049,000 HSBC Securities USD 816,208 Citibank USD 286,714 HSBC Securities USD 136,963 HSBC Securities USD 280,915 Currency Sale Sale Amount Maturity date Unrealised Gain/Loss USD USD USD MXN MYR NOK PLN (498,204) (277,220) (12,620,000) (1,049,000) (1,069,000) (1,056,000) 06-Jul-2015 06-Jul-2015 06-Jul-2015 06-Jul-2015 06-Jul-2015 06-Jul-2015 8,500 722 12,134 8,772 1,100 156 Singapore Dollar Class (Distributing) HSBC Securities SGD 4,632,000 USD (3,431,594) 06-Jul-2015 8,203 Sterling Class (Accumulating) HSBC Securities GBP 1,578,000 USD (2,407,405) 06-Jul-2015 74,246 Sterling Class (Distributing) HSBC Securities GBP 22,303,000 USD (34,025,568) 06-Jul-2015 1,049,377 Swiss Franc Class (Accumulating) Barclays CHF 61,123,000 USD (64,843,389) 06-Jul-2015 568,680 1,731,890 Currency Sale Sale Amount Maturity date Unrealised Gain/Loss USD AUD AUD CAD CHF DKK EUR EUR EUR GBP GBP JPY SEK SGD MYR ZAR (150,000) (2,643,000) (2,567,000) (375,000) (4,404,000) (200,000) (16,692,000) (20,410,000) (660,000) (5,107,000) (3,450,200,000) (4,311,000) (522,000) (1,041,000) (5,868,000) 06-Jul-2015 06-Jul-2015 06-Jul-2015 06-Jul-2015 06-Jul-2015 06-Jul-2015 06-Jul-2015 06-Jul-2015 06-Jul-2015 06-Jul-2015 06-Jul-2015 06-Jul-2015 06-Jul-2015 05-Aug-2015 06-Jul-2015 (1,242) (11,425) (624) (3,331) (10,054) (4,811) (291,226) (354,869) (34,370) (240,289) (378,202) (14,716) (924) (741) (3,538) Unrealised loss on forward foreign currency contracts Currency Purchase Counter Party Purchase Amount Payden Global Government Bond Index Fund HSBC Securities USD 114,021 HSBC Securities USD 2,019,516 HSBC Securities USD 2,055,409 HSBC Securities USD 397,984 HSBC Securities USD 647,790 Royal Bank of Canada USD 218,040 UBS USD 18,307,953 Royal Bank of Canada USD 22,387,117 HSBC Securities USD 1,003,583 HSBC Securities USD 7,791,265 Barclays USD 27,819,034 HSBC Securities USD 504,875 HSBC Securities USD 386,721 Citibank USD 274,388 HSBC Securities USD 479,578 46 . PAYDEN GLOBAL FUNDS PUBLIC LIMITED COMPANY SCHEDULE OF INVESTMENTS (continued) Payden Global Government Bond Index Fund (continued) As at 30 June 2015 Appendix: forward foreign currency contracts (continued) Unrealised loss on forward foreign currency contracts (continued) Currency Purchase Counter Party Purchase Amount Payden Global Government Bond Index Fund (continued) Norwegian Krone Class (Accumulating) Barclays NOK 186,161,000 Currency Sale USD Sale Amount Maturity date (23,843,715) 06-Jul-2015 Portfolio Analysis Unrealised Gain/Loss USD (183,802) (1,534,164) % of total assets Transferable securities and money market instruments admitted to an official stock exchange listing or traded on a regulated market OTC financial derivative instruments Analysis as a percentage of total assets rather than net assets is required under the UCITS Notice 8.5 appendix A 47 95.63 0.15 95.78 . PAYDEN GLOBAL FUNDS PUBLIC LIMITED COMPANY SCHEDULE OF INVESTMENTS (continued) Payden Global High Yield Bond Fund As at 30 June 2015 Holding Name of securities Fair value USD % of net assets 380,000 540,000 710,000 365,000 350,000 400,000 330,000 140,000 300,000 500,000 305,000 600,000 Basic Materials A Schulman Inc 6.875% 01-Jun-2023 Alcoa Inc 5.870% 23-Feb-2022 ArcelorMittal 7.000% 25-Feb-2022 Commercial Metals Co 4.875% 15-May-2023 Evraz Inc NA Canada 7.500% 15-Nov-2019 First Quantum Minerals Ltd 6.750% 15-Feb-2020 Hexion Inc 8.875% 01-Feb-2018 Huntsman International LLC 8.625% 15-Mar-2021 INEOS Group Holdings SA 6.125% 15-Aug-2018 Steel Dynamics Inc 5.250% 15-Apr-2023 United States Steel Corp 7.375% 01-Apr-2020 Univar Inc 6.750% 15-Jul-2023 5,002,864 389,500 583,200 768,575 344,925 346,500 389,000 299,475 147,689 307,500 498,750 320,250 607,500 6.54 0.51 0.76 1.01 0.45 0.45 0.51 0.39 0.19 0.40 0.65 0.42 0.80 Communications Altice Financing SA 6.625% 15-Feb-2023 Altice SA 7.750% 15-May-2022 Cablevision Systems Corp 5.875% 15-Sep-2022 CCO Holdings LLC / CCO Holdings Capital Corp 5.125% 15-Feb-2023 CCO Holdings LLC / CCO Holdings Capital Corp 5.750% 15-Jan-2024 CCO Holdings LLC / CCO Holdings Capital Corp 6.500% 30-Apr-2021 CenturyLink Inc 5.800% 15-Mar-2022 CenturyLink Inc 6.450% 15-Jun-2021 Cogent Communications Group Inc 5.375% 01-Mar-2022 Cogent Communications Group Inc 144A 5.375% 01-Mar-2022 CommScope Technologies Finance LLC 6.000% 15-Jun-2025 Consolidated Communications Inc 6.500% 01-Oct-2022 CyrusOne LP / CyrusOne Finance Corp 6.375% 15-Nov-2022 DISH DBS Corp 5.125% 01-May-2020 DISH DBS Corp 5.875% 15-Jul-2022 DISH DBS Corp 6.750% 01-Jun-2021 Frontier Communications Corp 6.250% 15-Sep-2021 IAC/InterActiveCorp 4.750% 15-Dec-2022 Intelsat Jackson Holdings SA 7.250% 15-Oct-2020 Level 3 Financing Inc 5.375% 15-Aug-2022 Liberty Interactive LLC 8.500% 15-Jul-2029 Numericable-SFR SAS 6.000% 15-May-2022 Numericable-SFR SAS 6.250% 15-May-2024 Sinclair Television Group Inc 6.375% 01-Nov-2021 Sprint Capital Corp 6.900% 01-May-2019 Sprint Communications Inc 6.000% 15-Nov-2022 Starz LLC / Starz Finance Corp 5.000% 15-Sep-2019 Telecom Italia SpA 5.303% 30-May-2024 T-Mobile USA Inc 6.250% 01-Apr-2021 T-Mobile USA Inc 6.633% 28-Apr-2021 Virgin Media Finance PLC 6.375% 15-Apr-2023 Windstream Services LLC 6.375% 01-Aug-2023 Windstream Services LLC 7.500% 01-Jun-2022 13,616,906 248,825 291,000 564,050 195,500 382,850 314,437 642,362 354,375 198,250 198,250 449,437 435,937 383,875 405,500 343,875 522,500 411,750 295,125 421,812 608,250 325,500 424,894 226,838 337,188 388,550 916,250 355,250 350,000 873,375 416,000 440,938 130,800 763,363 17.81 0.32 0.38 0.74 0.26 0.50 0.41 0.84 0.46 0.26 0.26 0.59 0.57 0.50 0.53 0.45 0.68 0.54 0.39 0.55 0.79 0.43 0.56 0.30 0.44 0.51 1.20 0.46 0.46 1.14 0.54 0.58 0.17 1.00 Consumer, Cyclical 1011778 BC ULC / New Red Finance Inc 6.000% 01-Apr-2022 Air Canada 7.750% 15-Apr-2021 American Airlines 2013-1 Class B Pass Through Trust 5.625% 15-Jan-2021 American Axle & Manufacturing Inc 6.250% 15-Mar-2021 Brookfield Residential Properties Inc 6.375% 15-May-2025 Carrols Restaurant Group Inc 8.000% 01-May-2022 Dana Holding Corp 5.375% 15-Sep-2021 DR Horton Inc 4.375% 15-Sep-2022 Family Tree Escrow LLC 5.750% 01-Mar-2023 First Cash Financial Services Inc 6.750% 01-Apr-2021 Goodyear Tire & Rubber Co 6.500% 01-Mar-2021 11,381,566 515,000 428,000 403,832 369,250 295,500 474,750 462,937 380,250 472,500 634,500 191,250 14.89 0.67 0.56 0.53 0.48 0.39 0.62 0.61 0.50 0.62 0.83 0.25 250,000 300,000 580,000 200,000 380,000 300,000 670,000 350,000 200,000 200,000 450,000 450,000 370,000 400,000 350,000 500,000 450,000 300,000 425,000 600,000 300,000 430,000 230,000 325,000 380,000 1,000,000 350,000 350,000 850,000 400,000 425,000 160,000 865,000 500,000 400,000 388,300 350,000 300,000 450,000 450,000 390,000 450,000 600,000 180,000 48 . PAYDEN GLOBAL FUNDS PUBLIC LIMITED COMPANY SCHEDULE OF INVESTMENTS (continued) Payden Global High Yield Bond Fund (continued) As at 30 June 2015 Holding Name of securities Fair value USD 610,000 500,000 Consumer, Cyclical (continued) Goodyear Tire & Rubber Co 8.250% 15-Aug-2020 Hilton Worldwide Finance LLC / Hilton Worldwide Finance Corp 5.625% 15-Oct-2021 Landry's Inc 9.375% 01-May-2020 Lear Corp 4.750% 15-Jan-2023 Lennar Corp 4.500% 15-Nov-2019 MGM Resorts International 5.250% 31-Mar-2020 Mobile Mini Inc 7.875% 01-Dec-2020 Neiman Marcus Group Ltd LLC 8.750% 15-Oct-2021 Regal Entertainment Group 5.750% 15-Mar-2022 Rite Aid Corp 6.125% 01-Apr-2023 Royal Caribbean Cruises Ltd 5.250% 15-Nov-2022 Schaeffler Finance BV 4.250% 15-May-2021 Sonic Automotive Inc 5.000% 15-May-2023 Suburban Propane Partners LP / Suburban Energy Finance Corp 7.375% 01-Aug-2021 Taylor Morrison Communities Inc / Monarch Communities Inc 5.625% 01-Mar-2024 ZF North America Capital Inc 4.000% 29-Apr-2020 380,000 750,000 270,000 295,000 400,000 400,000 255,000 500,000 185,000 430,000 475,000 500,000 380,000 500,000 900,000 300,000 350,000 350,000 660,000 530,000 400,000 150,000 330,000 365,000 350,000 430,000 500,000 400,000 700,000 400,000 350,000 500,000 500,000 300,000 370,000 500,000 170,000 Consumer, Non-cyclical ACCO Brands Corp 6.750% 30-Apr-2020 Amsurg Corp 5.625% 15-Jul-2022 Atento Luxco 1 SA 7.375% 29-Jan-2020 Avis Budget Car Rental LLC / Avis Budget Finance Inc 5.500% 01-Apr-2023 B&G Foods Inc 4.625% 01-Jun-2021 C&S Group Enterprises LLC 5.375% 15-Jul-2022 Central Garden & Pet Co 8.250% 01-Mar-2018 CHS/Community Health Systems Inc 7.125% 15-Jul-2020 CHS/Community Health Systems Inc 8.000% 15-Nov-2019 Concordia Healthcare Corp 7.000% 15-Apr-2023 Crimson Merger Sub Inc 6.625% 15-May-2022 Darling Ingredients Inc 5.375% 15-Jan-2022 DaVita HealthCare Partners Inc 5.750% 15-Aug-2022 Dean Foods Co 6.500% 15-Mar-2023 Dole Food Co Inc 7.250% 01-May-2019 Endo Finance LLC / Endo Finco Inc 7.000% 15-Dec-2020 Endo Finance LLC / Endo Finco Inc 7.250% 15-Jan-2022 Great Lakes Dredge & Dock Corp 7.375% 01-Feb-2019 HCA Inc 5.875% 01-May-2023 HCA Inc 7.500% 15-Feb-2022 HealthSouth Corp 5.750% 01-Nov-2024 Hertz Corp 6.250% 15-Oct-2022 Hertz Corp 6.750% 15-Apr-2019 HJ Heinz Co 4.250% 15-Oct-2020 Ingles Markets Inc 5.750% 15-Jun-2023 JBS USA LLC / JBS USA Finance Inc 5.750% 15-Jun-2025 Kindred Healthcare Inc 6.375% 15-Apr-2022 Post Holdings Inc 6.000% 15-Dec-2022 Quintiles Transnational Corp 4.875% 15-May-2023 Tenet Healthcare Corp 5.000% 01-Mar-2019 Tenet Healthcare Corp 8.000% 01-Aug-2020 Tenet Healthcare Corp 6.750% 15-Jun-2023 United Rentals North America Inc 7.625% 15-Apr-2022 Valeant Pharmaceuticals International 6.375% 15-Oct-2020 Valeant Pharmaceuticals International 7.000% 01-Oct-2020 Valeant Pharmaceuticals International Inc 5.875% 15-May-2023 Valeant Pharmaceuticals International Inc 7.500% 15-Jul-2021 150,000 400,000 450,000 390,000 400,000 475,000 480,000 450,000 450,000 450,000 250,000 400,000 625,000 140,000 49 % of net assets 157,387 0.21 417,480 484,875 386,100 407,000 480,937 505,200 485,437 456,728 465,188 259,827 392,000 614,063 0.55 0.63 0.50 0.53 0.63 0.66 0.63 0.60 0.61 0.34 0.51 0.80 150,150 0.20 590,175 501,250 0.77 0.66 15,900,267 400,900 759,375 272,700 292,419 395,500 378,000 261,757 531,000 195,406 431,075 418,000 501,875 404,225 511,250 911,250 316,125 373,188 358,750 702,900 610,162 410,000 153,000 341,352 372,756 357,455 426,109 501,250 386,500 705,250 401,500 365,312 510,625 543,750 316,688 385,725 513,750 183,388 20.80 0.52 0.99 0.36 0.38 0.52 0.49 0.34 0.69 0.26 0.56 0.55 0.66 0.53 0.67 1.19 0.41 0.49 0.47 0.92 0.80 0.54 0.20 0.45 0.49 0.47 0.56 0.66 0.51 0.92 0.52 0.48 0.67 0.71 0.41 0.50 0.67 0.24 . PAYDEN GLOBAL FUNDS PUBLIC LIMITED COMPANY SCHEDULE OF INVESTMENTS (continued) Payden Global High Yield Bond Fund (continued) As at 30 June 2015 Holding Name of securities 450,000 450,000 Diversified Argos Merger Sub Inc 7.125% 15-Mar-2023 Horizon Pharma Financing Inc 6.625% 01-May-2023 500,000 370,000 325,000 500,000 570,000 350,000 400,000 350,000 230,000 300,000 325,000 300,000 500,000 450,000 200,000 350,000 250,000 125,000 500,000 550,000 370,000 275,000 375,000 325,000 500,000 200,000 400,000 600,000 455,000 380,000 300,000 300,000 500,000 450,000 600,000 500,000 525,000 475,000 400,000 480,000 370,000 200,000 400,000 500,000 410,000 350,000 650,000 441,176 460,000 Fair value USD % of net assets 943,312 472,500 470,812 1.23 0.62 0.61 Energy Antero Resources Corp 6.000% 01-Dec-2020 Berry Petroleum Co LLC 6.375% 15-Sep-2022 BreitBurn Energy Partners LP / BreitBurn Finance Corp 8.625% 15-Oct-2020 California Resources Corp 5.000% 15-Jan-2020 Chesapeake Energy Corp 5.375% 15-Jun-2021 CONSOL Energy Inc 5.875% 15-Apr-2022 CVR Refining LLC / Coffeyville Finance Inc 6.500% 01-Nov-2022 Denbury Resources Inc 4.625% 15-Jul-2023 EP Energy LLC / Everest Acquisition Finance Inc 7.750% 01-Sep-2022 EP Energy LLC / Everest Acquisition Finance Inc 9.375% 01-May-2020 Laredo Petroleum Inc 7.375% 01-May-2022 Linn Energy LLC / Linn Energy Finance Corp 8.625% 15-Apr-2020 MarkWest Energy Partners LP / MarkWest Energy Finance Corp 4.500% 15-Jul-2023 MEG Energy Corp 7.000% 31-Mar-2024 Newfield Exploration Co 5.625% 01-Jul-2024 Peabody Energy Corp 6.500% 15-Sep-2020 Sabine Pass Liquefaction LLC 5.750% 15-May-2024 Sabine Pass LNG LP 6.500% 01-Nov-2020 SM Energy Co 6.500% 01-Jan-2023 Sunoco LP / Sunoco Finance Corp 6.375% 01-Apr-2023 Tesoro Corp 5.375% 01-Oct-2022 Vanguard Natural Resources LLC / VNR Finance Corp 7.875% 01-Apr-2020 Whiting Petroleum Corp 5.000% 15-Mar-2019 WPX Energy Inc 6.000% 15-Jan-2022 8,250,623 505,000 290,450 287,625 442,500 518,700 299,250 402,000 295,750 242,650 322,110 343,687 247,563 10.79 0.66 0.38 0.38 0.58 0.68 0.39 0.53 0.39 0.32 0.42 0.45 0.32 492,500 433,688 203,000 120,750 250,312 130,000 515,000 574,750 377,400 264,000 369,375 322,563 0.64 0.57 0.27 0.16 0.33 0.17 0.67 0.75 0.49 0.34 0.48 0.42 Financial AerCap Aviation Solutions BV 6.375% 30-May-2017 AerCap Ireland Capital Ltd / AerCap Global Aviation Trust 5.000% 01-Oct-2021 Aircastle Ltd 5.125% 15-Mar-2021 Ally Financial Inc 4.125% 13-Feb-2022 Ally Financial Inc 4.750% 10-Sep-2018 CIT Group Inc 5.000% 15-Aug-2022 CIT Group Inc 5.250% 15-Mar-2018 Citigroup Inc floating rate Perpetual Communications Sales & Leasing Inc 6.000% 15-Apr-2023 Credit Acceptance Corp 7.375% 15-Mar-2023 CTR Partnership LP / CareTrust Capital Corp 5.875% 01-Jun-2021 E*TRADE Financial Corp 5.375% 15-Nov-2022 GEO Group Inc 6.625% 15-Feb-2021 HSBC Holdings PLC floating rate Perpetual Icahn Enterprises LP / Icahn Enterprises Finance Corp 6.000% 01-Aug-2020 International Lease Finance Corp 3.875% 15-Apr-2018 International Lease Finance Corp 5.875% 15-Aug-2022 Iron Mountain Inc 5.750% 15-Aug-2024 Morgan Stanley floating rate Perpetual Pershing Square Holdings Ltd 5.500% 15-Jul-2022 Royal Bank of Scotland Group PLC 6.100% 10-Jun-2023 Royal Bank of Scotland Group PLC floating rate Perpetual 9,495,460 530,625 12.42 0.70 206,250 405,000 577,500 470,356 377,150 310,875 295,875 490,255 465,750 613,500 513,750 551,250 476,187 414,500 483,600 400,525 200,875 397,500 501,798 436,614 375,725 0.27 0.53 0.76 0.62 0.49 0.41 0.39 0.64 0.61 0.80 0.67 0.72 0.62 0.54 0.63 0.52 0.26 0.52 0.66 0.57 0.49 Industrial AECOM 5.750% 15-Oct-2022 Ardagh Packaging Finance PLC / Ardagh Holdings USA Inc 7.000% 15-Nov-2020 Ardagh Packaging Finance PLC / Ardagh Holdings USA Inc floating rate 15-Dec-2019 5,366,456 659,750 7.02 0.86 452,206 0.59 449,075 0.59 50 . PAYDEN GLOBAL FUNDS PUBLIC LIMITED COMPANY SCHEDULE OF INVESTMENTS (continued) Payden Global High Yield Bond Fund (continued) As at 30 June 2015 Holding Name of securities Fair value USD 340,000 484,000 500,000 400,000 Utilities AmeriGas Partners LP / AmeriGas Finance Corp 6.500% 20-May-2021 Calpine Corp 7.875% 15-Jan-2023 NRG Energy Inc 6.625% 15-Mar-2023 Talen Energy Supply LLC 5.125% 15-Jul-2019 Total value of investment in securities (2014: 96.38%) 0.69 0.50 628,500 0.82 104,250 271,375 336,800 394,000 0.14 0.35 0.44 0.52 1.29 0.36 0.93 2.34 0.46 0.69 0.68 0.51 95.13 Notional (USD) Broker 6,359 0.01 1,381,531 UBS 6,359 0.01 724,287 0.95 73,469,479 96.09 Unrealised loss on forward foreign exchange contracts (Appendix) (2014: (1.05%)) (105,680) (0.14) Financial liabilities at fair value through profit or loss (105,680) (0.14) Net current assets 11 Futures contracts (2014: 0.00%) US Treasury Note 10 Year (CBT) Future Exp 21-Sep-2015 523,750 382,500 72,738,833 Technology First Data Corp 6.750% 01-Nov-2020 Infor US Inc 6.500% 15-May-2022 600,000 0.58 0.29 0.65 1,791,940 355,300 525,140 517,500 394,000 260,000 700,000 500,000 360,000 439,875 223,750 500,625 989,439 275,439 714,000 100,000 260,000 320,000 400,000 Industrial (continued) Berry Plastics Corp 5.125% 15-Jul-2023 Bombardier Inc 5.750% 15-Mar-2022 CNH Industrial Capital LLC 3.250% 01-Feb-2017 Crown Americas LLC / Crown Americas Capital Corp III 6.250% 01-Feb-2021 Novelis Inc 8.750% 15-Dec-2020 Reynolds Group Issuer Inc / Reynolds Group Issuer LLC / Reynolds Group Issuer Lu 6.875% 15-Feb-2021 Reynolds Group Issuer Inc / Reynolds Group Issuer LLC / Reynolds Group Issuer Lu 8.250% 15-Feb-2021 SBA Communications Corp 5.625% 01-Oct-2019 Spirit AeroSystems Inc 6.750% 15-Dec-2020 Triumph Group Inc 4.875% 01-Apr-2021 450,000 250,000 500,000 % of net assets 3,096,005 4.05 76,459,804 100.00 Unrealised gain on forward foreign exchange contracts (Appendix) (2014: 0.34%) Financial assets at fair value through profit or loss Total net assets Appendix: forward foreign currency contracts Unrealised gain on forward foreign currency contracts Currency Counter Party Purchase Payden Global High Yield Bond Fund Royal Bank of Scotland EUR Royal Bank of Scotland USD Royal Bank of Scotland GBP Credit Suisse USD Credit Suisse JPY Credit Suisse USD UBS USD Barclays INR Barclays USD Purchase Amount Currency Sale Sale Amount Maturity date Unrealised Gain/Loss USD 831,000 942,878 598,000 885,280 105,300,000 874,912 935,072 60,030,000 466,553 USD EUR USD AUD USD JPY EUR USD SGD (888,828) (831,000) (911,687) (1,142,000) (847,413) (105,300,000) (832,000) (917,750) (624,000) 17-Jul-2015 17-Jul-2015 17-Jul-2015 31-Jul-2015 31-Jul-2015 31-Jul-2015 17-Aug-2015 17-Aug-2015 20-Aug-2015 37,257 16,792 28,689 9,056 13,436 14,062 7,462 16,150 3,482 51 . PAYDEN GLOBAL FUNDS PUBLIC LIMITED COMPANY SCHEDULE OF INVESTMENTS (continued) Payden Global High Yield Bond Fund (continued) As at 30 June 2015 Appendix: forward foreign currency contracts (continued) Unrealised gain on forward foreign currency contracts (continued) Currency Purchase Counter Party Purchase Amount Payden Global High Yield Bond Fund (continued) Royal Bank of Canada USD 887,569 Currency Sale Sale Amount Maturity date Unrealised Gain/Loss USD CAD (1,106,000) 14-Sep-2015 2,565 Canadian Dollar Class (Accumulating) Barclays CAD 33,849,000 USD (27,106,914) 06-Jul-2015 4,364 Sterling Class (Accumulating) HSBC Securities GBP 10,297,000 USD (15,709,155) 06-Jul-2015 484,483 9,296,000 USD (9,861,822) 06-Jul-2015 86,489 724,287 Purchase Amount Currency Sale Sale Amount Maturity date Unrealised Gain/Loss USD 886,992 157,000 887,504 169,000 163,000 177,129 20,880,000 179,000 GBP USD EUR USD USD INR USD USD (598,000) (179,096) (826,000) (131,941) (185,999) (11,400,000) (466,801) (146,562) 17-Jul-2015 23-Jul-2015 23-Jul-2015 31-Jul-2015 17-Aug-2015 17-Aug-2015 20-Aug-2015 14-Sep-2015 (53,383) (4,117) (33,087) (2,273) (4,268) (224) (5,000) (3,328) Swiss Franc Class (Accumulating) Barclays CHF Unrealised loss on forward foreign currency contracts Currency Counter Party Purchase Payden Global High Yield Bond Fund Royal Bank of Scotland USD HSBC Securities EUR HSBC Securities USD Credit Suisse AUD UBS EUR Barclays USD HSBC Securities PHP Royal Bank of Canada CAD (105,680) Portfolio Analysis % of total assets Transferable securities and money market instruments admitted to an official stock exchange listing or traded on a regulated market Financial derivative instruments dealt in on a regulated market OTC financial derivative instruments Analysis as a percentage of total assets rather than net assets is required under the UCITS Notice 8.5 appendix A. 52 94.06 0.01 0.80 94.87 . PAYDEN GLOBAL FUNDS PUBLIC LIMITED COMPANY SCHEDULE OF INVESTMENTS (continued) Payden Global Inflation - Linked Bond Fund As at 30 June 2015 Holding Name of securities Fair value USD % of net assets 283,842 432,321 140,914 87,004 195,960 357,798 Canada Canadian Government Bond 1.500% 01-Dec-2044 Canadian Government Bond 2.000% 01-Dec-2041 Canadian Government Bond 3.000% 01-Dec-2036 Canadian Government Bond 4.000% 01-Dec-2031 Canadian Government Bond 4.250% 01-Dec-2021 Canadian Government Bond 4.250% 01-Dec-2026 1,674,735 286,047 473,833 172,095 110,881 206,946 424,933 2.30 0.39 0.65 0.24 0.15 0.29 0.58 France France Government Bond OAT 1.100% 25-Jul-2022 France Government Bond OAT 1.850% 25-Jul-2027 France Government Bond OAT 2.100% 25-Jul-2023 France Government Bond OAT 2.250% 25-Jul-2020 France Government Bond OAT 3.150% 25-Jul-2032 France Government Bond OAT 3.400% 25-Jul-2029 6,411,462 1,926,041 414,028 651,525 1,169,336 1,364,219 886,313 8.82 2.65 0.57 0.89 1.61 1.88 1.22 Germany Bundesrepublik Deutschland Bundesobligation Inflation Linked Bond 0.750% 15-Apr-2018 Deutsche Bundesrepublik Inflation Linked Bond 0.100% 15-Apr-2023 Deutsche Bundesrepublik Inflation Linked Bond 0.500% 15-Apr-2030 Deutsche Bundesrepublik Inflation Linked Bond 1.750% 15-Apr-2020 2,416,847 3.33 952,814 388,067 318,046 757,920 1.31 0.54 0.44 1.04 815,297 597,157 832,020 479,200 272,205 1,144,130 Italy Italy Buoni Poliennali Del Tesoro 2.100% 15-Sep-2017 Italy Buoni Poliennali Del Tesoro 2.100% 15-Sep-2021 Italy Buoni Poliennali Del Tesoro 2.350% 15-Sep-2019 Italy Buoni Poliennali Del Tesoro 2.350% 15-Sep-2035 Italy Buoni Poliennali Del Tesoro 2.550% 15-Sep-2041 Italy Buoni Poliennali Del Tesoro 2.600% 15-Sep-2023 5,055,287 953,156 722,280 1,005,306 597,868 341,134 1,435,543 6.95 1.31 0.99 1.38 0.82 0.47 1.98 1,136,080 510,850 371,966 601,706 604,500 837,667 631,446 1,122,080 670,561 140,326 572,665 594,110 496,670 180,000 653,000 190,000 United Kingdom United Kingdom Gilt Inflation Linked 0.125% 22-Nov-2019 United Kingdom Gilt Inflation Linked 0.125% 22-Mar-2024 United Kingdom Gilt Inflation Linked 0.125% 22-Mar-2068 United Kingdom Gilt Inflation Linked 0.375% 22-Mar-2062 United Kingdom Gilt Inflation Linked 0.500% 22-Mar-2050 United Kingdom Gilt Inflation Linked 0.625% 22-Mar-2040 United Kingdom Gilt Inflation Linked 0.625% 22-Nov-2042 United Kingdom Gilt Inflation Linked 0.750% 22-Mar-2034 United Kingdom Gilt Inflation Linked 0.750% 22-Nov-2047 United Kingdom Gilt Inflation Linked 1.125% 22-Nov-2037 United Kingdom Gilt Inflation Linked 1.250% 22-Nov-2017 United Kingdom Gilt Inflation Linked 1.250% 22-Nov-2032 United Kingdom Gilt Inflation Linked 1.250% 22-Nov-2055 United Kingdom Gilt Inflation Linked 2.500% 26-Jul-2016 United Kingdom Gilt Inflation Linked 2.500% 17-Jul-2024 United Kingdom Gilt Inflation Linked 4.125% 22-Jul-2030 23,298,196 1,904,636 869,655 956,578 1,581,744 1,414,352 1,789,949 1,396,165 2,273,986 1,619,431 319,825 962,504 1,281,003 1,529,417 919,945 3,487,395 991,611 32.04 2.62 1.20 1.32 2.18 1.94 2.46 1.92 3.13 2.23 0.44 1.32 1.76 2.10 1.26 4.80 1.36 803,918 3,229,239 2,558,825 656,325 1,594,733 1,494,645 2,747,030 1,342,643 3,650,436 1,543,635 1,151,788 1,898,173 United States United States Treasury Inflation Indexed Bonds 0.125% 15-Apr-2016 United States Treasury Inflation Indexed Bonds 0.125% 15-Apr-2017 United States Treasury Inflation Indexed Bonds 0.125% 15-Apr-2018 United States Treasury Inflation Indexed Bonds 0.125% 15-Apr-2019 United States Treasury Inflation Indexed Bonds 0.125% 15-Jul-2022 United States Treasury Inflation Indexed Bonds 0.125% 15-Jul-2024 United States Treasury Inflation Indexed Bonds 0.250% 15-Jan-2025 United States Treasury Inflation Indexed Bonds 0.625% 15-Jul-2021 United States Treasury Inflation Indexed Bonds 0.625% 15-Jan-2024 United States Treasury Inflation Indexed Bonds 0.625% 15-Feb-2043 United States Treasury Inflation Indexed Bonds 0.750% 15-Feb-2042 United States Treasury Inflation Indexed Bonds 1.125% 15-Jan-2021 32,958,586 807,937 3,274,145 2,599,807 665,041 1,584,642 1,459,965 2,698,743 1,387,538 3,717,170 1,372,146 1,061,175 2,010,135 45.33 1.11 4.50 3.58 0.91 2.18 2.01 3.71 1.91 5.11 1.89 1.46 2.76 1,541,494 299,961 481,452 904,924 805,363 533,783 820,081 326,863 253,158 603,829 53 . PAYDEN GLOBAL FUNDS PUBLIC LIMITED COMPANY SCHEDULE OF INVESTMENTS (continued) Payden Global Inflation - Linked Bond Fund (continued) As at 30 June 2015 Holding 2,169,780 658,314 1,039,414 664,860 667,743 702,267 941,393 991,800 1,007,461 Name of securities Fair value USD 2,324,377 698,378 1,112,497 725,373 823,880 872,730 1,108,931 1,224,641 1,429,335 Total value of investment in securities (2014: 99.00%) 13 11 Futures contracts (2014: 0.00%) Euro-Bund Future Exp 08-Sep-2015 US Treasury Note 10 Year (CBT) Future Exp 21-Sep-2015 3.20 0.96 1.53 1.00 1.13 1.20 1.53 1.68 1.97 71,815,113 United States (continued) United States Treasury Inflation Indexed Bonds 1.250% 15-Jul-2020 United States Treasury Inflation Indexed Bonds 1.375% 15-Jul-2018 United States Treasury Inflation Indexed Bonds 1.375% 15-Jan-2020 United States Treasury Inflation Indexed Bonds 1.875% 15-Jul-2019 United States Treasury Inflation Indexed Bonds 2.125% 15-Feb-2040 United States Treasury Inflation Indexed Bonds 2.125% 15-Feb-2041 United States Treasury Inflation Indexed Bonds 2.375% 15-Jan-2025 United States Treasury Inflation Indexed Bonds 2.500% 15-Jan-2029(1) United States Treasury Inflation Indexed Bonds 3.875% 15-Apr-2029 % of net assets 98.77 Notional (USD) 2,158,918 Broker Goldman Sachs 49,444 42,741 0.07 0.06 1,381,188 Goldman Sachs 6,703 0.01 1,118,511 1.54 72,983,068 100.38 Unrealised gain on forward foreign exchange contracts (Appendix) (2014: 0.68%) Financial assets at fair value through profit or loss Notional (USD) Broker (16,450) (0.03) (2,349,661) Goldman Sachs (16,450) (0.03) Unrealised loss on forward foreign exchange contracts (Appendix) (2014: (0.35%)) (946,189) (1.30) Financial liabilities at fair value through profit or loss (13) Futures contracts (2014: 0.00%) Long Gilt (LIFFE) Future Exp 28-Sep-2015 (962,639) (1.33) 687,872 0.95 72,708,301 100.00 Net current assets Total net assets (1) The nominal value of 105,000 is held as collateral with Goldman Sachs for open future contracts. Appendix: forward foreign currency contracts Unrealised gain on forward foreign currency contracts Purchase Amount Currency Sale Sale Amount Maturity date Unrealised Gain/Loss USD 195,000 USD (296,513) 06-Jul-2015 10,155 Sterling Class (Accumulating) HSBC Securities GBP 1,559,000 USD (2,378,418) 06-Jul-2015 73,352 Sterling Class (Distributing) HSBC Securities GBP 13,132,000 USD (20,034,245) 06-Jul-2015 617,873 Sterling Class Unhedged (Distributing) Barclays CAD Barclays EUR Barclays GBP Barclays JPY 922,000 5,718,000 6,517,000 74,200,000 USD USD USD USD (738,176) (6,270,891) (9,940,719) (598,287) 06-Jul-2015 06-Jul-2015 06-Jul-2015 06-Jul-2015 297 100,431 308,280 8,123 1,118,511 Currency Counter Party Purchase Payden Global Inflation - Linked Bond Fund HSBC Securities GBP 54 . PAYDEN GLOBAL FUNDS PUBLIC LIMITED COMPANY SCHEDULE OF INVESTMENTS (continued) Payden Global Inflation - Linked Bond Fund (continued) As at 30 June 2015 Appendix: forward foreign currency contracts (continued) Unrealised loss on forward foreign currency contracts Currency Counter Party Purchase Payden Global Inflation - Linked Bond Fund HSBC Securities USD Royal Bank of Canada USD Royal Bank of Canada USD HSBC Securities USD HSBC Securities USD Barclays USD Purchase Amount Currency Sale Sale Amount Maturity date Unrealised Gain/Loss USD 1,699,896 14,025,677 85,041 12,854,748 104,920 10,470,136 CAD EUR EUR GBP GBP GBP (2,123,000) (12,787,000) (78,000) (8,426,000) (69,000) (6,862,000) 06-Jul-2015 06-Jul-2015 06-Jul-2015 06-Jul-2015 06-Jul-2015 06-Jul-2015 (516) (222,328) (1,871) (396,451) (3,594) (321,429) (946,189) Portfolio Analysis % of total assets Transferable securities and money market instruments admitted to an official stock exchange listing or traded on a regulated market Financial derivative instruments dealt in on a regulated market OTC financial derivative instruments Analysis as a percentage of total assets rather than net assets is required under the UCITS Notice 8.5 appendix A. 55 97.26 0.04 0.23 97.53 . PAYDEN GLOBAL FUNDS PUBLIC LIMITED COMPANY SCHEDULE OF INVESTMENTS (continued) Payden Global Short Bond Fund* As at 30 June 2015 Holding 98,215 300,000 300,000 250,000 967,261 700,000 40,000 40,000 550,000 800,000 790,000 250,000 500,000 1,700,000 775,000 178,718 1,210,000 117,296 146,096 1,300,000 488,227 250,000 250,000 400,000 159,614 176,990 162,426 192,432 685,165 497,355 1,252,874 692,090 600,000 905,000 250,000 168,914 492,290 280,000 900,000 500,000 1,208,023 520,000 350,000 1,020,000 280,000 63,588 695,000 22,841 500,000 250,000 250,000 800,000 400,000 250,000 Name of securities Fair value USD % of net assets Asset-backed securities American Homes 4 Rent 1.250% 17-Jun-2031 Apidos CLO XIV 1.425% 15-Apr-2025 Babson CLO Ltd 2013-I 1.375% 20-Apr-2025 Babson CLO Ltd 2015-I 3.129% 20-Apr-2027 Bavarian Sky SA 0.237% 20-Apr-2024 Bumper 6 NL Finance BV floating rate 19-Mar-2029 Capital Auto Receivables Asset Trust 2013-1 1.290% 20-Apr-2018 Capital Auto Receivables Asset Trust 2013-1 1.740% 22-Oct-2018 Capital Auto Receivables Asset Trust 2015-2 1.390% 20-Sep-2018 Carlyle Global Market Strategies 1.740% 27-Apr-2027 CarMax Auto Owner Trust 2015-2 1.370% 16-Mar-2020 Cent CLO 18 Ltd 1.397% 23-Jul-2025 Cent CLO 18 Ltd floating rate 23-Jul-2025 CNH Equipment Trust 1.370% 15-Jul-2020 CNH Equipment Trust 2013-B 1.270% 16-Nov-2020 Colony American Homes 2014-2 1.100% 17-Jul-2031 Colony American Homes Single-Family Rental Pass-Through Certificates 1.387% 17-Jul-2032 Colony American Homes Single-Family Rental Pass-Through Certificates 1.400% 17-May-2031 CSMC Trust 2013-IVR2 floating rate 25-Apr-2043 Delamare Cards floating rate 19-May-2019 Driver France 1 FCT 0.287% 21-Oct-2020 Dryden XXVIII Senior Loan Fund 1.374% 15-Aug-2025 Dryden XXVIII Senior Loan Fund 1.824% 15-Aug-2025 Dryden XXXI Senior Loan Fund floating rate 18-Apr-2026 E-CARAT 2 PLC floating rate 18-Oct-2021 Fannie Mae Connecticut Avenue Securities floating rate 25-Oct-2023 Fannie Mae Connecticut Avenue Securities floating rate 25-Jan-2024 Fannie Mae Connecticut Avenue Securities floating rate 25-May-2024 Fannie Mae Connecticut Avenue Securities floating rate 25-Nov-2024 Fannie Mae Connecticut Avenue Securities floating rate 25-May-2025 Fannie Mae Connecticut Avenue Securities 1M1 floating rate 25-Jul-2024 Fannie Mae Connecticut Avenue Securities 2M1 floating rate 25-Jul-2024 Flatiron CLO 2014-1 Ltd floating rate 17-Jul-2026 Ford Credit Auto Owner Trust 2015-B 1.160% 15-Nov-2019 Fosse Master Issuer PLC floating rate 18-Oct-2054 Freddie Mac Structured Agency Credit Risk Debt Notes floating rate 25-Nov-2023 Freddie Mac Structured Agency Credit Risk Debt Notes floating rate 25-Mar-2025 Freddie Mac Structured Agency Credit Risk Debt Notes floating rate 25-May-2025 Freddie Mac Structured Agency Credit Risk Debt Notes floating rate 25-Dec-2027 Honda Auto Receivables 2015-1 Owner Trust 0.700% 15-Jun-2017 Invitation Homes 2013-SFR1 Trust floating rate 17-Dec-2030 Invitation Homes 2014-SFR1 Trust 1.183% 17-Jun-2031 Invitation Homes 2014-SFR2 Trust floating rate 17-Sep-2031 Invitation Homes 2015-SFR3 Trust floating rate 17-Aug-2032 Kubota Credit Owner Trust 2015-1 0.940% 15-Dec-2017 LA Arena Funding LLC 7.656% 15-Dec-2026 MMAF Equipment Finance LLC 2015-A 1.390% 16-Oct-2019 Motor 2013-1 PLC floating rate 25-Feb-2021 Motor 2015-1 PLC floating rate 25-Jun-2022 Oaktree Enhanced Income Funding Series III Ltd 1.475% 20-Jul-2023 Oaktree Enhanced Income Funding Series III Ltd 1.925% 20-Jul-2023 Octagon Investment Partners 24 Ltd 1.731% 21-May-2027 Octagon Investment Partners XIX Ltd 1.795% 15-Apr-2026 Octagon Investment Partners XIX Ltd 2.275% 15-Apr-2026 35,338,653 98,081 295,951 296,869 249,987 1,078,889 780,543 40,015 40,123 550,245 800,504 791,143 247,148 493,006 1,700,455 774,329 177,008 19.09 0.05 0.16 0.16 0.14 0.58 0.42 0.02 0.02 0.30 0.43 0.43 0.13 0.27 0.92 0.42 0.10 1,205,281 0.65 116,906 137,767 2,038,098 544,209 247,763 245,040 400,603 250,756 179,320 163,424 190,986 690,473 494,839 1,252,251 691,612 599,998 905,304 394,124 0.06 0.07 1.10 0.29 0.13 0.13 0.22 0.14 0.10 0.09 0.10 0.37 0.27 0.68 0.37 0.32 0.49 0.21 169,174 0.09 491,068 0.27 279,131 0.15 900,000 499,939 1,205,175 515,146 347,272 1,025,671 280,356 70,639 695,487 35,945 786,824 249,774 246,427 800,000 399,999 249,457 0.49 0.27 0.65 0.28 0.19 0.55 0.15 0.04 0.38 0.02 0.43 0.14 0.13 0.43 0.22 0.13 56 . PAYDEN GLOBAL FUNDS PUBLIC LIMITED COMPANY SCHEDULE OF INVESTMENTS (continued) Payden Global Short Bond Fund* (continued) As at 30 June 2015 Holding Name of securities Fair value USD % of net assets 787,990 629,881 999,286 499,846 0.43 0.34 0.54 0.27 213,756 103,851 1,400,000 44,429 97,920 151,307 550,000 520,000 250,000 250,000 250,000 Asset-backed securities (continued) Penarth Master Issuer PLC floating rate 18-Mar-2021 Penarth Master Issuer PLC floating rate 18-Mar-2022 Porsche Innovative Lease Owner Trust 2015-1 1.190% 23-Jul-2018 Progress Residential 2015-SFR1 Trust floating rate 17-Feb-2032 SC Germany Auto 2014-1 UG haftungsbeschraenkt floating rate 11-Dec-2023 Sequoia Mortgage Trust 2013-4 floating rate 25-Apr-2043 Silverstone Master Issuer PLC floating rate 21-Jan-2070 Springleaf Mortgage Loan Trust 2012-2 floating rate 25-Oct-2057 Springleaf Mortgage Loan Trust 2013-1 floating rate 25-Jun-2058 Springleaf Mortgage Loan Trust 2013-2 floating rate 25-Dec-2065 Symphony CLO XV Ltd 1.720% 17-Oct-2026 Synchrony Credit Card Master Note Trust 2014-1 1.600% 15-Apr-2021 Tyron Park CLO Ltd 1.395% 15-Jul-2025 Tyron Park CLO Ltd 1.825% 15-Jul-2025 Venture XVII CLO Ltd floating rate 15-Jul-2026 238,231 100,968 1,564,062 44,650 98,044 152,034 549,507 520,031 247,914 245,315 250,360 0.13 0.05 0.85 0.02 0.05 0.08 0.30 0.28 0.13 0.13 0.14 1,500,000 1,000,000 1,000,000 Commercial paper Bayer AG 0.000% 17-Aug-2015 National Grid PLC 0.000% 18-Sep-2015 Vodafone Group PLC 0.000% 14-Jan-2016 3,899,053 1,671,388 1,114,111 1,113,554 2.11 0.91 0.60 0.60 290,000 210,000 200,000 200,000 200,000 100,000 175,000 180,000 260,000 150,000 160,000 70,000 700,000 60,000 60,000 200,000 120,000 4,460,000 130,000 1,350,000 50,000 30,000 300,000 180,000 400,000 175,000 560,000 200,000 60,000 50,000 300,000 60,000 100,000 500,000 250,000 800,000 100,000 Corporate bonds AbbVie Inc 1.800% 14-May-2018 AbbVie Inc 2.500% 14-May-2020 ABN AMRO Bank NV floating rate 28-Oct-2016 AIA Group Ltd 2.250% 11-Mar-2019 Air Lease Corp 4.500% 15-Jan-2016 Aircastle Ltd 6.750% 15-Apr-2017 Allied Irish Banks PLC 2.875% 28-Nov-2016 Ally Financial Inc 3.250% 29-Sep-2017 Amgen Inc 1.250% 22-May-2017 AP Moeller - Maersk A/S 2.550% 22-Sep-2019 Ashland Inc 3.875% 15-Apr-2018 Astoria Financial Corp 5.000% 19-Jun-2017 AT&T Inc floating rate 04-Jun-2019 Autodesk Inc 1.950% 15-Dec-2017 AutoZone Inc 1.300% 13-Jan-2017 Baidu Inc 2.250% 28-Nov-2017 Banco do Nordeste do Brasil SA 3.625% 09-Nov-2015 Bank Nederlandse Gemeenten NV 3.500% 30-Oct-2017 Bank of America Corp 1.700% 25-Aug-2017 Bank of America Corp 2.000% 11-Jan-2018 Bank of America Corp 3.750% 12-Jul-2016 Bank of America Corp 3.875% 22-Mar-2017 Bank of America Corp floating rate 02-May-2017 Bank of America Corp floating rate 22-Mar-2018 Bank of America Corp floating rate 28-Mar-2018 Bank of Ireland 2.750% 05-Jun-2016 Bank of New York Mellon Corp 1.600% 22-May-2018 Banque Federative du Credit Mutuel SA floating rate 28-Oct-2016 Becton Dickinson & Co 1.800% 15-Dec-2017 Becton Dickinson & Co floating rate 15-Jun-2016 Belfius Bank SA/NV 1.125% 22-May-2017 Cameron International Corp 1.400% 15-Jun-2017 Canadian Natural Resources Ltd 1.750% 15-Jan-2018 Capital Gemini SA 1.750% 01-Jul-2020 Capital One Bank USA NA 1.200% 13-Feb-2017 Carrefour Banque SA floating rate 20-Mar-2020 Caterpillar Financial Services Corp 1.000% 03-Mar-2017 47,224,839 289,348 208,082 201,056 199,034 203,125 106,750 199,287 180,450 259,928 151,184 165,000 73,550 782,699 60,293 60,122 201,320 120,600 593,760 130,217 1,355,250 51,270 31,203 297,790 181,759 442,547 198,344 559,905 201,055 60,043 50,035 337,927 59,636 99,385 561,292 248,834 888,606 100,247 25.52 0.16 0.11 0.11 0.11 0.11 0.06 0.11 0.10 0.14 0.08 0.09 0.04 0.42 0.03 0.03 0.11 0.07 0.32 0.07 0.73 0.03 0.02 0.16 0.10 0.24 0.11 0.30 0.11 0.03 0.03 0.18 0.03 0.05 0.30 0.13 0.48 0.05 500,000 400,000 1,000,000 500,000 57 . PAYDEN GLOBAL FUNDS PUBLIC LIMITED COMPANY SCHEDULE OF INVESTMENTS (continued) Payden Global Short Bond Fund* (continued) As at 30 June 2015 Holding 120,000 50,000 350,000 75,000 300,000 310,000 1,330,000 260,000 50,000 150,000 250,000 125,000 40,000 350,000 250,000 700,000 700,000 200,000 250,000 250,000 150,000 110,000 60,000 100,000 500,000 400,000 55,000 240,000 600,000 1,000,000 150,000 1,550,000 170,000 800,000 55,000 400,000 70,000 180,000 200,000 220,000 90,000 90,000 45,000 100,000 155,000 150,000 78,000 250,000 20,000 400,000 100,000 150,000 500,000 200,000 130,000 200,000 75,000 5,000,000 170,000 Name of securities Fair value USD Corporate bonds (continued) Caterpillar Financial Services Corp 1.250% 18-Aug-2017 CC Holdings GS V LLC / Crown Castle GS III Corp 2.381% 15-Dec-2017 Cie de Saint-Gobain 4.750% 11-Apr-2017 CIT Group Inc 5.250% 15-Mar-2018 CIT Group Inc 5.375% 15-May-2020 Citigroup Inc 1.550% 14-Aug-2017 Citigroup Inc 1.800% 05-Feb-2018 Citigroup Inc 1.850% 24-Nov-2017 Citigroup Inc 4.450% 10-Jan-2017 Citigroup Inc floating rate 30-Nov-2017 Citizens Bank NA/Providence RI 1.600% 04-Dec-2017 Computer Sciences Corp 2.500% 15-Sep-2015 ConAgra Foods Inc 1.300% 25-Jan-2016 Cooperatieve Centrale Raiffeisen-Boerenleenbank BA/Netherlands floating rate 29-May-2020 Credit Agricole SA/London floating rate 15-Apr-2019 Credit Agricole SA/London floating rate 10-Jun-2020 Credit Suisse AG floating rate 18-Jun-2018 Credit Suisse AG/London floating rate 15-Jul-2016 Credit Suisse/New York NY 1.700% 27-Apr-2018 Credit Suisse/New York NY 1.750% 29-Jan-2018 Daimler AG 1.625% 02-Dec-2016 Electricite de France SA 1.150% 20-Jan-2017 Electricite de France SA floating rate 20-Jan-2017 Enbridge Inc floating rate 01-Oct-2016 Enbridge Inc floating rate 13-Mar-2017 Fidelity International Ltd 6.875% 24-Feb-2017 Fifth Third Bancorp 5.450% 15-Jan-2017 Ford Motor Credit Co LLC floating rate 12-Mar-2019 Ford Motor Credit Co LLC 1.461% 27-Mar-2017 Ford Motor Credit Co LLC 2.240% 15-Jun-2018 General Mills Inc 1.400% 20-Oct-2017 Goldman Sachs Group Inc 6.150% 01-Apr-2018 Goldman Sachs Group Inc floating rate 30-Apr-2018 Goldman Sachs Group Inc floating rate 29-May-2020 Health Care REIT Inc 3.625% 15-Mar-2016 Heathrow Funding Ltd 4.600% 15-Feb-2018 Hess Corp 1.300% 15-Jun-2017 Hewlett-Packard Co floating rate 14-Jan-2019 HSBC Bank PLC floating rate 15-May-2018 HSBC USA Inc 1.700% 05-Mar-2018 Hyundai Capital America 1.625% 02-Oct-2015 Hyundai Capital America 2.000% 19-Mar-2018 Hyundai Capital America 2.125% 02-Oct-2017 International Business Machines Corp 1.125% 06-Feb-2018 International Lease Finance Corp 3.875% 15-Apr-2018 International Lease Finance Corp floating rate 15-Jun-2016 John Deere Capital Corp 1.350% 16-Jan-2018 JPMorgan Chase & Co 1.350% 15-Feb-2017 JPMorgan Chase & Co 3.150% 05-Jul-2016 JPMorgan Chase & Co floating rate 30-May-2017 JPMorgan Chase & Co floating rate 25-Jan-2018 Jyske Bank A/S floating rate 19-Jun-2017 KeyBank NA/Cleveland OH 1.700% 01-Jun-2018 Korea Expressway Corp 1.625% 28-Apr-2017 Kroger Co floating rate 17-Oct-2016 LeasePlan Corp NV floating rate 28-Apr-2017 Liberty Property LP 6.625% 01-Oct-2017 Linde AG 2.750% 28-Sep-2017 Macquarie Bank Ltd 1.600% 27-Oct-2017 58 % of net assets 120,225 50,608 419,928 77,719 313,500 309,617 1,327,627 260,786 52,257 167,309 249,735 125,378 40,011 0.07 0.03 0.23 0.04 0.17 0.17 0.72 0.14 0.03 0.09 0.13 0.07 0.02 388,903 252,023 700,434 777,951 314,457 248,359 249,121 237,028 110,218 60,106 99,870 395,358 489,905 58,325 238,382 597,571 1,001,385 149,848 1,724,073 171,912 891,997 55,831 492,638 69,673 177,624 200,082 219,480 90,115 90,091 45,463 99,403 156,162 150,188 78,279 250,278 20,408 620,201 100,722 167,880 499,562 200,106 130,096 223,228 82,751 655,268 170,019 0.21 0.14 0.38 0.42 0.17 0.13 0.13 0.13 0.06 0.03 0.05 0.21 0.26 0.03 0.13 0.32 0.54 0.08 0.93 0.09 0.48 0.03 0.27 0.04 0.10 0.11 0.12 0.05 0.05 0.02 0.05 0.08 0.08 0.04 0.14 0.01 0.34 0.05 0.09 0.27 0.11 0.07 0.12 0.04 0.35 0.09 . PAYDEN GLOBAL FUNDS PUBLIC LIMITED COMPANY SCHEDULE OF INVESTMENTS (continued) Payden Global Short Bond Fund* (continued) As at 30 June 2015 Holding 200,000 600,000 100,000 1,000,000 100,000 800,000 600,000 110,000 140,000 400,000 320,000 70,000 800,000 500,000 130,000 300,000 250,000 140,000 80,000 40,000 300,000 1,100,000 150,000 100,000 150,000 100,000 650,000 110,000 150,000 100,000 100,000 150,000 800,000 400,000 300,000 250,000 290,000 170,000 200,000 200,000 190,000 115,000 60,000 100,000 315,000 450,000 60,000 100,000 140,000 110,000 700,000 200,000 160,000 100,000 240,000 250,000 50,000 80,000 500,000 Name of securities Fair value USD Corporate bonds (continued) Macquarie Bank Ltd 2.000% 15-Aug-2016 Macquarie Bank Ltd 4.875% 10-Jun-2025 Macquarie Bank Ltd floating rate 27-Oct-2017 Macquarie Group Ltd 4.875% 10-Aug-2017 McKesson Corp 1.292% 10-Mar-2017 Metropolitan Life Global Funding I 4.625% 16-May-2017 Morgan Stanley 5.450% 09-Jan-2017 Morgan Stanley 6.625% 01-Apr-2018 Morgan Stanley floating rate 23-Jul-2019 Morgan Stanley floating rate 19-Nov-2019 Morgan Stanley floating rate 27-Jan-2020 Murphy Oil Corp 2.500% 01-Dec-2017 National Grid North America Inc 1.750% 20-Feb-2018 Nederlandse Waterschapsbank NV 1.250% 18-Sep-2017 Nissan Motor Acceptance Corp 1.000% 15-Mar-2016 NRW Bank 0.875% 20-Mar-2017 PACCAR Financial Europe BV 1.513% 29-May-2018 Parker-Hannifin Corp 4.125% 11-Nov-2015 Penske Truck Leasing Co LP/PTL Finance Corp 2.500% 15-Mar-2016 Penske Truck Leasing Co LP/PTL Finance Corp 2.500% 15-Jun-2019 Pernod Ricard SA 4.875% 18-Mar-2016 PNC Bank NA 1.600% 01-Jun-2018 Powszechna Kasa Oszczednosci Bank Polski SA via PKO Finance AB 3.733% 21-Oct-2015 Prudential Financial Inc floating rate 15-Aug-2018 Prudential PLC 1.375% 19-Jan-2018 QBE Insurance Group Ltd 6.125% 28-Sep-2015 QUALCOMM Inc 1.400% 18-May-2018 Regions Financial Corp 2.000% 15-May-2018 Royal Bank of Scotland PLC 6.934% 09-Apr-2018 Ryder System Inc 3.500% 01-Jun-2017 Ryder System Inc 2.500% 01-Mar-2017 Sabine Pass LNG LP 7.500% 30-Nov-2016 Societe Des Autoroutes Paris-Rhin-Rhone floating rate 31-Mar-2019 Socram Banque floating rate 28-Nov-2017 Southern California Edison Co 1.845% 01-Feb-2022 Southern Gas Networks PLC 5.125% 02-Nov-2018 Standard Chartered PLC 1.500% 08-Sep-2017 Stena AB 6.125% 01-Feb-2017 Suncorp-Metway Ltd floating rate 06-Oct-2017 Suntory Holdings Ltd 1.650% 29-Sep-2017 SunTrust Bank/Atlanta GA 5.200% 17-Jan-2017 Synchrony Financial 1.875% 15-Aug-2017 Synchrony Financial floating rate 03-Feb-2020 Telecom Italia SpA 5.625% 29-Dec-2015 Tenet Healthcare Corp 6.250% 01-Nov-2018 Tenet Healthcare Corp floating rate 15-Jun-2020 Thermo Fisher Scientific Inc 1.300% 01-Feb-2017 Thomson Reuters Corp 1.300% 23-Feb-2017 Thomson Reuters Corp 1.650% 29-Sep-2017 TIAA Asset Management Finance Co LLC 2.950% 01-Nov-2019 UBS AG/London floating rate 15-May-2017 United Utilities Water Ltd 6.125% 29-Dec-2015 Verizon Communications Inc 1.350% 09-Jun-2017 Verizon Communications Inc floating rate 14-Sep-2018 Verizon Communications Inc floating rate 17-Jun-2019 Virgin Money PLC 2.250% 21-Apr-2020 Walgreens Boots Alliance Inc 1.750% 17-Nov-2017 Walgreens Boots Alliance Inc floating rate 18-May-2016 Wells Fargo Bank NA 5.750% 16-May-2016 59 % of net assets 202,059 591,561 100,237 1,057,318 99,896 960,442 635,959 123,473 139,193 447,333 324,762 69,910 921,430 502,938 130,264 300,218 393,018 158,133 80,573 39,655 345,234 1,098,724 0.11 0.32 0.05 0.57 0.05 0.52 0.34 0.07 0.08 0.24 0.18 0.04 0.50 0.27 0.07 0.16 0.21 0.09 0.04 0.02 0.19 0.59 168,640 100,720 234,736 159,105 648,254 110,002 187,533 104,040 101,846 158,627 901,227 447,349 299,848 432,964 289,739 199,173 314,936 200,371 200,521 115,012 60,331 160,001 342,956 454,500 59,924 99,807 140,031 110,880 779,936 321,943 159,849 103,535 238,724 384,292 50,225 80,005 519,146 0.09 0.05 0.13 0.09 0.35 0.06 0.10 0.06 0.06 0.09 0.49 0.24 0.16 0.23 0.16 0.11 0.17 0.11 0.11 0.06 0.03 0.09 0.19 0.25 0.03 0.05 0.08 0.06 0.42 0.17 0.09 0.06 0.13 0.21 0.03 0.04 0.28 . PAYDEN GLOBAL FUNDS PUBLIC LIMITED COMPANY SCHEDULE OF INVESTMENTS (continued) Payden Global Short Bond Fund* (continued) As at 30 June 2015 Holding Name of securities 200,000 130,000 800,000 140,000 40,000 Corporate bonds (continued) Western Union Co floating rate 21-Aug-2015 Whirlpool Corp 1.350% 01-Mar-2017 Yorkshire Building Society 2.125% 18-Mar-2019 Zimmer Biomet Holdings Inc 2.000% 01-Apr-2018 Zimmer Biomet Holdings Inc 2.700% 01-Apr-2020 200,000 240,000 250,000 350,000 100,000 805,000 805,000 130,000 600,000 100,000 350,000 300,000 30,000 300,000 65,000 130,000 230,000 500,000 110,000 250,000 50,000 210,000 300,000 260,000 250,000 200,000 50,000 40,000 300,000 370,000 325,000 180,000 400,000 170,000 90,000 110,000 80,000 65,000 40,000 250,000 400,000 130,000 500,000 962,000 180,000 30,000 250,000 300,000 190,000 350,000 590,000 Fair value USD Covered bonds Abbey National Treasury Services PLC/London 1.375% 13-Mar-2017 Abbey National Treasury Services PLC/London 1.650% 29-Sep-2017 Abbey National Treasury Services PLC/London floating rate 22-May-2019 ACCO Brands Corp 6.750% 30-Apr-2020 Actavis Funding SCS 1.300% 15-Jun-2017 Actavis Funding SCS 1.850% 01-Mar-2017 Actavis Funding SCS 2.350% 12-Mar-2018 Actavis Funding SCS floating rate 12-Mar-2020 Airbus Group Finance BV 5.500% 25-Sep-2018 Alliance Data Systems Corp 5.250% 01-Dec-2017 American Axle & Manufacturing Inc 6.250% 15-Mar-2021 ANZ New Zealand Int'l Ltd/London 1.750% 29-Mar-2018 ARC Properties Operating Partnership LP 2.000% 06-Feb-2017 ASB Finance Ltd/London floating rate 01-May-2018 Avis Budget Car Rental LLC / Avis Budget Finance Inc 4.875% 15-Nov-2017 Baxalta Inc 2.000% 22-Jun-2018 Baxalta Inc floating rate 22-Jun-2018 Bell Canada floating rate 22-Apr-2016 BNP Paribas SA 3.600% 23-Feb-2016 BNZ International Funding Ltd/London 1.900% 26-Feb-2018 Boardwalk Pipelines LP 5.875% 15-Nov-2016 BP Capital Markets PLC 1.674% 13-Feb-2018 BP Capital Markets PLC 2.994% 18-Feb-2019 BPCE SA 1.625% 26-Jan-2018 BPCE SA floating rate 10-Feb-2017 BUPA Finance PLC 7.500% 04-Jul-2016 Carnival Corp 1.200% 05-Feb-2016 Carnival Corp 1.875% 15-Dec-2017 CNH Industrial Capital LLC 3.250% 01-Feb-2017 CNH Industrial Capital LLC 3.875% 16-Jul-2018 CNOOC Nexen Finance 2014 ULC 1.625% 30-Apr-2017 ConocoPhillips Co 1.500% 15-May-2018 Conti-Gummi Finance BV 2.500% 20-Mar-2017 Daimler Finance North America LLC 1.650% 02-Mar-2018 DIRECTV Holdings LLC / DIRECTV Financing Co Inc 3.125% 15-Feb-2016 DISH DBS Corp 4.625% 15-Jul-2017 Express Scripts Holding Co 1.250% 02-Jun-2017 Fidelity National Information Services Inc 1.450% 05-Jun-2017 Fidelity National Information Services Inc 2.000% 15-Apr-2018 GE Capital UK Funding floating rate 16-Jan-2018 General Motors Financial Co Inc 2.400% 10-Apr-2018 General Motors Financial Co Inc 3.000% 25-Sep-2017 Glencore Finance Canada Ltd 2.700% 25-Oct-2017 Glencore Finance Canada Ltd 3.600% 15-Jan-2017 Glencore Funding LLC 2.125% 16-Apr-2018 Glencore Funding LLC floating rate 15-Jan-2019 Glencore Funding LLC 144A floating rate 15-Jan-2019 Goodyear Tire & Rubber Co 6.500% 01-Mar-2021 Harley-Davidson Financial Services Inc 2.150% 26-Feb-2020 Hertz Corp 5.875% 15-Oct-2020 HJ Heinz Co 1.600% 30-Jun-2017 60 % of net assets 200,149 130,436 922,800 140,143 39,846 0.11 0.07 0.50 0.08 0.02 24,311,290 200,500 240,787 279,739 369,250 99,372 809,258 809,774 131,589 777,224 103,750 369,250 300,149 29,175 470,751 13.14 0.11 0.13 0.15 0.20 0.05 0.44 0.44 0.07 0.42 0.06 0.20 0.16 0.02 0.25 66,787 129,922 230,099 400,881 111,977 251,277 51,876 210,816 362,585 259,884 251,477 333,315 50,070 40,191 300,375 370,925 325,608 179,944 461,147 169,336 0.04 0.07 0.12 0.22 0.06 0.14 0.03 0.11 0.20 0.14 0.14 0.18 0.03 0.02 0.16 0.20 0.18 0.10 0.25 0.09 91,080 113,575 79,663 64,884 39,990 393,368 401,261 132,679 505,465 987,786 178,766 29,995 249,955 318,750 188,571 356,125 590,347 0.05 0.06 0.04 0.03 0.02 0.21 0.22 0.07 0.27 0.53 0.10 0.02 0.13 0.17 0.10 0.19 0.32 . PAYDEN GLOBAL FUNDS PUBLIC LIMITED COMPANY SCHEDULE OF INVESTMENTS (continued) Payden Global Short Bond Fund* (continued) As at 30 June 2015 Holding 510,000 350,000 300,000 200,000 100,000 250,000 100,000 70,000 250,000 40,000 40,000 150,000 250,000 450,000 60,000 200,000 50,000 40,000 200,000 100,000 200,000 40,000 485,000 800,000 200,000 120,000 530,000 800,000 200,000 60,000 350,000 400,000 300,000 50,000 74,000 230,000 250,000 1,800,000 200,000 235,000 200,000 2,570,000 1,450,000 200,000 2,215,000 500,000 300,000 400,000 200,000 300,000 1,200,000 1,000,000 300,000 200,000 3,890,000 1,100,000 Name of securities Fair value USD Covered bonds (continued) HJ Heinz Co 2.000% 02-Jul-2018 Huntsman International LLC 4.875% 15-Nov-2020 Hutchison Whampoa Finance 06 Ltd 4.625% 21-Sep-2016 Hutchison Whampoa International 12 II Ltd 2.000% 08-Nov-2017 Hyundai Capital America 3.750% 06-Apr-2016 IAC/InterActiveCorp 4.875% 30-Nov-2018 JB Hunt Transport Services Inc 2.400% 15-Mar-2019 JB Hunt Transport Services Inc 3.375% 15-Sep-2015 KBC Internationale Financieringsmaatschappij NV 2.125% 10-Sep-2018 Kinder Morgan Inc/DE 2.000% 01-Dec-2017 Kinder Morgan Inc/DE 3.050% 01-Dec-2019 L-3 Communications Corp 1.500% 28-May-2017 Lloyds Bank PLC 4.875% 21-Jan-2016 Mallinckrodt International Finance SA 3.500% 15-Apr-2018 Medtronic Inc 1.500% 15-Mar-2018 Mizuho Bank Ltd 1.700% 25-Sep-2017 Mylan Inc 1.350% 29-Nov-2016 Mylan Inc 1.800% 24-Jun-2016 Nabors Industries Inc 2.350% 15-Sep-2016 NBCUniversal Enterprise Inc floating rate 15-Apr-2018 Perrigo Co PLC 1.300% 08-Nov-2016 Phillips 66 2.950% 01-May-2017 Rogers Communications Inc floating rate 13-Mar-2017 Santander Consumer Bank AS 0.625% 20-Apr-2018 Scentre Group Trust 1 floating rate 16-Jul-2018 Seagate HDD Cayman 3.750% 15-Nov-2018 Siemens Financieringsmaatschappij NV 1.450% 25-May-2018 Sky PLC floating rate 01-Apr-2020 SpareBank 1 Boligkreditt AS 2.625% 27-May-2016 Sysco Corp 1.450% 02-Oct-2017 Targa Resources Partners LP / Targa Resources Partners Finance Corp 6.875% 01-Feb-2021 Telstra Corp Ltd 4.750% 21-Mar-2017 T-Mobile USA Inc 5.250% 01-Sep-2018 Ventas Realty LP 1.250% 17-Apr-2017 Ventas Realty LP 1.550% 26-Sep-2016 Volkswagen Group of America Finance LLC 1.250% 23-May-2017 Volkswagen Leasing GmbH 1.000% 04-Oct-2017 Volvo Treasury AB floating rate 03-Jun-2016 WEA Finance LLC / Westfield UK & Europe Finance PLC 1.750% 15-Sep-2017 Windstream Services LLC 7.875% 01-Nov-2017 ZF North America Capital Inc 4.000% 29-Apr-2020 Government and government related bonds Australia Government Bond 5.500% 21-Jan-2018 Australia Government Bond 6.000% 15-Feb-2017 Caisse des Depots et Consignations 1.000% 13-Mar-2017 Canadian Government Bond 1.500% 01-Feb-2017 Canadian Government Bond 1.750% 01-Sep-2019 European Investment Bank 1.125% 15-Aug-2018 Export Development Canada 1.000% 15-Jun-2018 FMS Wertmanagement AoeR 0.625% 30-Jan-2017 FMS Wertmanagement AoeR 1.125% 05-Sep-2017 France Government Bond OAT 1.000% 25-May-2019 France Government Bond OAT 4.250% 25-Oct-2018 Instituto de Credito Oficial 1.125% 01-Apr-2016 IPIC GMTN Ltd 1.750% 30-Nov-2015 Italy Buoni Poliennali Del Tesoro 3.500% 01-Dec-2018 Italy Buoni Poliennali Del Tesoro 4.500% 01-Aug-2018 61 % of net assets 510,207 350,875 352,010 201,260 101,871 258,750 101,000 70,355 292,584 39,902 39,997 149,039 255,521 453,375 59,888 200,108 49,865 40,030 200,643 100,523 199,219 41,133 388,000 886,669 224,167 125,203 528,643 892,889 203,605 60,600 0.28 0.19 0.19 0.11 0.05 0.14 0.05 0.04 0.16 0.02 0.02 0.08 0.14 0.24 0.03 0.11 0.03 0.02 0.11 0.05 0.11 0.02 0.21 0.48 0.12 0.07 0.29 0.48 0.11 0.03 364,875 480,544 309,000 49,899 74,295 230,374 282,747 218,571 0.20 0.26 0.17 0.03 0.04 0.12 0.15 0.12 200,665 250,569 200,500 0.11 0.14 0.11 73,330,863 2,145,429 1,185,787 200,793 1,802,676 418,395 299,300 399,000 199,918 301,471 1,382,662 1,271,129 300,628 201,318 4,734,258 1,368,362 39.63 1.16 0.64 0.11 0.97 0.23 0.16 0.22 0.11 0.16 0.75 0.69 0.16 0.11 2.56 0.74 . PAYDEN GLOBAL FUNDS PUBLIC LIMITED COMPANY SCHEDULE OF INVESTMENTS (continued) Payden Global Short Bond Fund* (continued) As at 30 June 2015 Holding 100,000,000 220,000,000 450,000,000 300,000,000 450,000 10,257,500 19,450,000 250,000 2,430,000 700,000 2,250,000 300,000 2,000,000 1,840,000 1,400,000 300,000 1,250,000 750,000 1,100,000 1,000,000 3,100,000 6,550,000 6,590,000 2,500,000 5,250,000 6,500,000 1,300,000 60,000 1,000,000 Name of securities Fair value USD 830,756 1,799,084 3,678,287 2,453,719 451,376 666,395 1,383,350 282,043 1,765,692 199,478 670,256 240,901 1,537,319 2,192,398 1,645,972 301,332 155,892 1,186,248 1,742,426 999,453 3,099,275 6,564,587 6,589,486 2,510,547 5,260,253 6,538,083 1,303,961 60,230 1,010,938 100,000 Term Loans Asurion LLC 3.750% 27-Feb-2017 Total value of investment in securities (2014: 99.93%) 17 132 109 17 64 (64) 8 0.05 0.05 184,314,318 Mortgage related securities Fannie Mae Pool floating rate 01-Oct-2033 0.06 0.06 99,891 99,891 103,281 0.45 0.97 1.99 1.33 0.24 0.36 0.75 0.15 0.95 0.11 0.36 0.13 0.83 1.19 0.89 0.16 0.08 0.64 0.94 0.54 1.68 3.55 3.56 1.36 2.84 3.53 0.70 0.03 0.55 109,729 109,729 Government and government related bonds (continued) Japan Finance Organization for Municipalities 2.000% 09-May-2016 Japan Government Five Year Bond 0.300% 20-Sep-2015 Japan Government Two Year Bond 0.100% 15-Sep-2015 Japan Government Two Year Bond 0.100% 15-Apr-2016 Kommuninvest I Sverige AB 0.875% 13-Dec-2016 Mexican Bonos 5.000% 15-Jun-2017 Mexican Bonos 8.500% 13-Dec-2018 Netherlands Government Bond 0.500% 15-Apr-2017 New Zealand Government Bond 6.000% 15-Dec-2017 Poland Government Bond 5.250% 25-Oct-2017 Poland Government Bond 5.500% 25-Oct-2019 Province of New Brunswick Canada floating rate 01-Aug-2019 Singapore Government Bond 2.500% 01-Jun-2019 Spain Government Bond 2.750% 30-Apr-2019 Spain Government Bond 3.800% 31-Jan-2017 State of North Rhine-Westphalia floating rate 28-Apr-2017 Sweden Government Bond 3.000% 12-Jul-2016 United Kingdom Gilt 1.000% 07-Sep-2017 United Kingdom Gilt 1.250% 22-Jul-2018 United States Treasury Note/Bond 0.375% 31-Oct-2016 United States Treasury Note/Bond 0.500% 31-Jan-2017 United States Treasury Note/Bond 0.625% 15-Dec-2016(1) United States Treasury Note/Bond 0.625% 31-May-2017 United States Treasury Note/Bond 0.875% 15-Jul-2017 United States Treasury Note/Bond 0.875% 15-Nov-2017 United States Treasury Note/Bond 1.000% 15-Sep-2017 United States Treasury Note/Bond 1.000% 15-Feb-2018 United States Treasury Note/Bond 1.125% 15-Jun-2018 United States Treasury Note/Bond 1.375% 30-Jun-2018 % of net assets 99.60 Options on futures (2014: 0.01%) Call Option: US Treasury Note 5 Year (CBT) Future (Strike Price: 121) Put Option: Eurodollar 1 Year Curve (CME) (Strike Price: 98) Put Option: Eurodollar 1 Year Midcurve (CME) (Strike Price: 98) Put Option: US Treasury Note 5 Year (CBT) Future (Strike Price: 118) Expiration date Broker 24,056 0.01 21-Aug-2015 RJO Associates 4,117 0.00 11-Mar-2016 RJO Associates 11,550 0.01 11-Dec-2015 Goldman Sachs 6,131 0.00 21-Aug-2015 RJO Associates 2,258 0.00 Futures contracts (2014: 0.02%) 90 Day Euro (CME) Future Exp 14-Dec-2015 90 Day Euro (CME) Future Exp 19-Dec-2016 US Treasury Note 2 Year (CBT) Future Exp 30-Sep-2015 Notional (USD) Broker 11,675 0.01 15,908,850 UBS 5,550 0.01 (15,784,050) UBS 3,250 0.00 1,748,625 JPMorgan Chase 2,875 0.00 1,020,034 0.55 185,370,083 100.17 Unrealised gain on forward foreign exchange contracts (Appendix) (2014: 1.02%) Financial assets at fair value through profit or loss 62 . PAYDEN GLOBAL FUNDS PUBLIC LIMITED COMPANY SCHEDULE OF INVESTMENTS (continued) Payden Global Short Bond Fund* (continued) As at 30 June 2015 Holding Name of securities Fair value USD Notional (USD) Broker (602) 0.00 (1,311,234) Goldman Sachs (602) 0.00 Unrealised loss on forward foreign exchange contracts (Appendix) (2014: (2.03%)) (1,703,768) (0.92) Financial liabilities at fair value through profit or loss (11) Futures contracts (2014: (0.04%)) US Treasury Note 5 year (CBT) Future Exp 30-Sep-2015 % of net assets (1,704,370) (0.92) 1,384,359 0.75 185,050,072 100.00 Net current assets Total net assets (1) The nominal value of 823,000 is held as collateral with Barclays for open forward currency contracts. The nominal value of 80,000 is held as collateral with Goldman Sachs for open future contracts. Appendix: forward foreign currency contracts Unrealised gain on forward foreign currency contracts Currency Counter Party Purchase Payden Global Short Bond Fund* Royal Bank of Scotland USD Royal Bank of Canada USD State Street USD State Street USD State Street USD Citibank USD Citibank USD Citibank USD Citibank USD Citibank USD HSBC Securities USD Barclays JPY Royal Bank of Canada USD Royal Bank of Scotland EUR Royal Bank of Scotland USD Royal Bank of Scotland GBP HSBC Securities USD HSBC Securities USD HSBC Securities USD Credit Suisse USD Credit Suisse USD Credit Suisse JPY Credit Suisse USD Credit Suisse USD Credit Suisse USD Credit Suisse USD UBS USD UBS USD UBS USD Barclays INR Barclays INR Barclays INR Barclays INR Barclays INR Credit Suisse USD Credit Suisse USD Barclays USD Barclays USD Barclays USD Purchase Amount Currency Sale Sale Amount Maturity date Unrealised Gain/Loss USD 3,437,846 3,668,613 14,875,503 2,250,898 559,011 13,860,668 2,683,571 795,489 792,095 3,311,294 1,721,763 700,000 1,904,738 752,000 853,242 541,000 135,875 172,462 229,289 1,502,340 236,558 187,200,000 803,456 148,271 180,812 122,757 1,020,488 236,796 229,361 13,600,000 15,570,000 61,550,000 10,330,000 10,900,000 1,283,165 868,245 521,881 233,506 920,871 AUD CAD EUR EUR EUR EUR EUR EUR EUR EUR GBP USD NZD USD EUR USD EUR EUR EUR AUD AUD USD JPY JPY JPY JPY EUR EUR EUR USD USD USD USD USD MXN MXN SGD SGD PLN (4,424,000) (4,571,000) (13,193,000) (2,000,000) (499,000) (12,292,000) (2,380,000) (703,000) (700,000) (2,913,000) (1,089,000) (5,716) (2,670,000) (804,331) (752,000) (824,787) (121,000) (153,000) (201,000) (1,938,000) (303,000) (1,506,513) (96,700,000) (17,700,000) (21,900,000) (14,900,000) (908,000) (210,000) (201,000) (209,958) (241,920) (940,988) (159,524) (168,002) (19,490,000) (13,550,000) (698,000) (314,000) (3,404,000) 09-Jul-2015 09-Jul-2015 09-Jul-2015 09-Jul-2015 09-Jul-2015 09-Jul-2015 09-Jul-2015 09-Jul-2015 09-Jul-2015 09-Jul-2015 09-Jul-2015 09-Jul-2015 09-Jul-2015 17-Jul-2015 17-Jul-2015 17-Jul-2015 23-Jul-2015 23-Jul-2015 23-Jul-2015 31-Jul-2015 31-Jul-2015 31-Jul-2015 31-Jul-2015 31-Jul-2015 31-Jul-2015 31-Jul-2015 17-Aug-2015 17-Aug-2015 17-Aug-2015 17-Aug-2015 17-Aug-2015 17-Aug-2015 17-Aug-2015 17-Aug-2015 19-Aug-2015 19-Aug-2015 20-Aug-2015 20-Aug-2015 26-Aug-2015 38,932 7,639 174,537 22,297 2,975 163,687 31,536 12,136 12,084 65,337 9,176 5 100,125 33,716 15,195 25,954 1,018 1,941 5,271 15,368 4,074 23,887 12,914 3,570 1,775 947 8,143 2,664 5,263 1,621 306 16,559 1,182 1,571 45,455 7,753 3,895 486 17,162 63 . PAYDEN GLOBAL FUNDS PUBLIC LIMITED COMPANY SCHEDULE OF INVESTMENTS (continued) Payden Global Short Bond Fund* (continued) As at 30 June 2015 Appendix: forward foreign currency contracts (continued) Unrealised gain on forward foreign currency contracts (continued) Currency Counter Party Purchase Payden Global Short Bond Fund* (continued) Royal Bank of Canada USD Royal Bank of Canada USD Norwegian Krone Class (Accumulating) Barclays NOK Purchase Amount Currency Sale Sale Amount Maturity date Unrealised Gain/Loss USD 1,524,757 191,594 CAD CAD (1,900,000) (234,000) 14-Sep-2015 14-Sep-2015 4,406 4,351 75,000,000 USD (9,418,916) 06-Jul-2015 113,121 1,020,034 Purchase Amount Currency Sale Sale Amount Maturity date Unrealised Gain/Loss USD 5,000 1,898,292 77,000 10,000 9,355,192 1,396,611 5,665,711 1,208,157 1,794,367 1,256,329 73,000 6,000 379,543 802,446 814,441 150,004 188,676 290,163 117,824 128,023 1,100,000 23,340,000 10,440,000 1,530,814 USD EUR USD USD GBP GBP JPY JPY JPY NOK USD USD SEK GBP EUR EUR EUR JPY EUR EUR USD USD USD SGD (4,037) (1,707,000) (86,619) (15,734) (6,100,000) (900,000) (703,500,000) (150,000,000) (220,000,000) (10,020,000) (50,117) (731) (3,151,000) (541,000) (758,000) (135,000) (173,000) (36,000,000) (106,000) (116,000) (69,888) (521,797) (232,517) (2,070,000) 09-Jul-2015 09-Jul-2015 09-Jul-2015 09-Jul-2015 09-Jul-2015 09-Jul-2015 09-Jul-2015 09-Jul-2015 09-Jul-2015 09-Jul-2015 09-Jul-2015 09-Jul-2015 09-Jul-2015 17-Jul-2015 23-Jul-2015 23-Jul-2015 23-Jul-2015 31-Jul-2015 17-Aug-2015 17-Aug-2015 19-Aug-2015 20-Aug-2015 20-Aug-2015 28-Aug-2015 (32) (3,819) (818) (8) (237,813) (18,750) (83,933) (17,780) (3,674) (17,066) (777) (8) (258) (48,295) (30,363) (456) (4,136) (4,144) (357) (1,307) (33) (5,589) (1,616) (5,152) 748,742,000 50,000,000 10,000,000 134,000,000 11,605,000 13,000,000 50,000,000 20,000,000 10,500,000 USD USD USD USD USD USD USD USD USD (95,899,738) (6,406,265) (1,274,595) (17,300,413) (1,498,735) (1,654,953) (6,477,540) (2,544,465) (1,335,761) 06-Jul-2015 06-Jul-2015 06-Jul-2015 06-Jul-2015 06-Jul-2015 06-Jul-2015 06-Jul-2015 06-Jul-2015 06-Jul-2015 (739,255) (51,574) (3,657) (269,840) (23,812) (2,733) (122,849) (2,588) (1,276) (1,703,768) Unrealised loss on forward foreign currency contracts Currency Counter Party Purchase Payden Global Short Bond Fund* Royal Bank of Canada CAD State Street USD Citibank EUR HSBC Securities GBP HSBC Securities USD HSBC Securities USD Barclays USD Barclays USD Barclays USD Royal Bank of Canada USD Royal Bank of Canada NZD Royal Bank of Scotland SEK Royal Bank of Scotland USD Royal Bank of Scotland USD HSBC Securities USD HSBC Securities USD HSBC Securities USD Credit Suisse USD UBS USD UBS USD Credit Suisse MXN HSBC Securities PHP HSBC Securities PHP Chase Manhattan Bank USD Norwegian Krone Class (Accumulating) Barclays NOK Barclays NOK Barclays NOK Barclays NOK Barclays NOK Barclays NOK Barclays NOK Barclays NOK Barclays NOK Portfolio Analysis % of total assets Transferable securities and money market instruments admitted to an official stock exchange listing or traded on a regulated market Financial derivative instruments dealt in on a regulated market OTC financial derivative instruments Analysis as a percentage of total assets rather than net assets is required under the UCITS Notice 8.5 appendix A. * This Fund changed name from Payden International Short Bond Fund on 24 March 2015. 64 96.70 0.02 (0.36) 96.36 . PAYDEN GLOBAL FUNDS PUBLIC LIMITED COMPANY SCHEDULE OF INVESTMENTS (continued) Payden Sterling Corporate Bond Fund - Investment Grade As at 30 June 2015 Holding Name of securities Fair value GBP % of net assets 200,000 150,000 300,000 250,000 Basic Materials Anglo American Capital PLC 6.875% 01-May-2018 BASF SE 1.375% 15-Dec-2017 Glencore Finance Europe SA 6.500% 27-Feb-2019 Linde Finance BV floating rate 14-Jul-2066 979,695 224,226 150,580 339,156 265,733 5.57 1.27 0.86 1.93 1.51 300,000 300,000 250,000 200,000 300,000 251,000 250,000 250,000 Communications AT&T Inc 5.875% 28-Apr-2017 British Telecommunications PLC 8.500% 07-Dec-2016 Deutsche Telekom International Finance BV 6.500% 08-Apr-2022 Sky PLC 6.000% 21-May-2027 Telecom Italia SpA 5.625% 29-Dec-2015 Verizon Communications Inc 4.073% 18-Jun-2024 Vodafone Group PLC 5.375% 05-Dec-2017 WPP PLC 6.000% 04-Apr-2017 2,303,164 321,769 329,409 304,744 241,944 305,209 261,315 269,758 269,016 13.11 1.83 1.87 1.73 1.38 1.74 1.49 1.54 1.53 200,000 100,000 250,000 320,000 175,000 150,000 250,000 200,000 Consumer, Cyclical BMW US Capital LLC 2.000% 20-Nov-2019 Daimler AG 1.625% 02-Dec-2016 Daimler International Finance BV 3.500% 06-Jun-2019 FCE Bank PLC 4.825% 15-Feb-2017 InterContinental Hotels Group PLC 6.000% 09-Dec-2016 PACCAR Financial Europe BV 1.513% 29-May-2018 RCI Banque SA 2.125% 06-Oct-2017 Volkswagen Financial Services NV 2.750% 02-Oct-2020 1,691,113 199,787 100,476 264,559 335,493 185,601 149,940 250,144 205,113 9.62 1.14 0.57 1.50 1.91 1.06 0.85 1.42 1.17 300,000 250,000 250,000 250,000 250,000 250,000 Consumer, Non-cyclical BAT Netherlands Finance BV 5.500% 15-Sep-2016 BUPA Finance PLC 5.000% 25-Apr-2023 Carlsberg Breweries A/S 7.250% 28-Nov-2016 Imperial Tobacco Finance PLC 7.750% 24-Jun-2019 Mondelez International Inc 7.250% 18-Jul-2018 Rentokil Initial PLC 5.750% 31-Mar-2016 1,683,560 314,956 253,591 269,181 298,542 289,378 257,912 9.58 1.79 1.44 1.53 1.70 1.65 1.47 300,000 Diversified Hutchison Whampoa Finance UK PLC 5.625% 24-Nov-2017 326,835 326,835 1.86 1.86 250,000 350,000 Energy Petroleos Mexicanos 8.250% 02-Jun-2022 Total Capital International SA 2.250% 09-Jun-2022 662,472 316,922 345,550 3.77 1.80 1.97 5,188,744 243,090 216,340 200,464 325,308 29.53 1.38 1.23 1.14 1.85 266,056 353,992 247,583 350,099 217,178 200,098 189,643 325,374 246,471 293,133 245,991 144,789 292,991 163,891 1.52 2.02 1.41 1.99 1.24 1.14 1.08 1.85 1.40 1.67 1.40 0.82 1.67 0.93 250,000 200,000 200,000 250,000 260,000 350,000 200,000 300,000 200,000 200,000 180,000 300,000 250,000 300,000 250,000 150,000 300,000 162,000 Financial Abbey National Treasury Services PLC/London 1.875% 17-Feb-2020 Aviva PLC floating rate 14-Nov-2036 Banque Federative du Credit Mutuel SA floating rate 16-May-2016 Barclays Bank PLC 10.000% 21-May-2021 Cooperatieve Centrale Raiffeisen-Boerenleenbank BA/Netherlands 4.625% 23-May-2029 Digital Stout Holding LLC 4.250% 17-Jan-2025 Direct Line Insurance Group PLC floating rate 27-Apr-2042 Fidelity International Ltd 6.750% 19-Oct-2020 GE Capital UK Funding 4.375% 31-Jul-2019 GE Capital UK Funding floating rate 16-Jan-2018 Goldman Sachs Group Inc 4.250% 29-Jan-2026 HSBC Bank PLC floating rate 04-Nov-2030 JPMorgan Chase & Co floating rate 30-May-2017 Lloyds Bank PLC 2.500% 01-Jun-2022 National Australia Bank Ltd 1.875% 20-Feb-2020 Nationwide Building Society 2.250% 29-Apr-2022 Nordea Bank AB 2.375% 02-Jun-2022 QBE Insurance Group Ltd 6.125% 28-Sep-2015 65 . PAYDEN GLOBAL FUNDS PUBLIC LIMITED COMPANY SCHEDULE OF INVESTMENTS (continued) Payden Sterling Corporate Bond Fund - Investment Grade (continued) As at 30 June 2015 Holding Name of securities Fair value GBP % of net assets 200,000 200,000 270,000 Financial (continued) Society of Lloyd's 4.750% 30-Oct-2024 Suncorp-Metway Ltd floating rate 06-Oct-2017 Virgin Money PLC 2.250% 21-Apr-2020 202,101 200,252 263,900 1.15 1.14 1.50 500,000 150,000 Government United Kingdom Gilt 1.250% 22-Jul-2018 United Kingdom Gilt 1.750% 07-Sep-2022 652,970 503,600 149,370 3.72 2.87 0.85 200,000 250,000 300,000 600,000 200,000 124,000 290,000 210,000 Industrial Cie de Saint-Gobain 5.625% 15-Nov-2024 Firstgroup PLC 8.750% 08-Apr-2021 Gatwick Funding Ltd 5.250% 23-Jan-2024 Heathrow Funding Ltd 6.250% 10-Sep-2018 National Express Group PLC 6.250% 13-Jan-2017 PostNL NV 7.500% 14-Aug-2018 Rolls-Royce PLC 3.375% 18-Jun-2026 Textron Inc 6.625% 07-Apr-2020 2,452,892 234,093 314,049 339,106 672,090 212,971 143,986 295,875 240,722 13.96 1.33 1.79 1.93 3.83 1.21 0.82 1.68 1.37 350,000 Technology International Business Machines Corp 2.750% 21-Dec-2020 360,087 360,087 2.05 2.05 250,000 250,000 300,000 Utilities Centrica PLC 7.000% 19-Sep-2018 Southern Gas Networks PLC 4.875% 05-Oct-2023 United Utilities Water Ltd 6.125% 29-Dec-2015 878,378 289,279 282,038 307,061 5.00 1.65 1.60 1.75 Total value of investment in securities (2014: 96.28%) 17,179,910 97.77 Financial assets at fair value through profit or loss 17,179,910 97.77 6 Futures contracts (2014: 0.11%) Long Gilt (LIFFE) Future Exp 28-Sep-2015 Notional (GBP) Broker (9,240) (0.05) 703,620 Goldman Sachs (9,240) (0.05) (9,240) (0.05) 400,543 2.28 17,571,213 100.00 Financial liabilities at fair value through profit or loss Net current assets Total net assets Portfolio Analysis % of total assets Transferable securities and money market instruments admitted to an official stock exchange listing or traded on a regulated market Financial derivative instruments dealt in on a regulated market Analysis of total assets rather than net assets is required under the UCITS Notice 8.5 appendix A. 66 97.53 (0.05) 97.48 . PAYDEN GLOBAL FUNDS PUBLIC LIMITED COMPANY SCHEDULE OF INVESTMENTS (continued) Payden Sterling Reserve Fund As at 30 June 2015 Holding Name of securities Fair value GBP % of net assets Asset-backed securities Delamare Cards floating rate 19-May-2019 Driver UK 2 SA floating rate 25-Jan-2023 E-Carat 4 PLC floating rate 18-Sep-2022 E-Carat 5 PLC 0.907% 18-Apr-2023 E-Carat PLC floating rate 18-Mar-2022 Gracechurch Card Funding PLC floating rate 15-Jan-2018 Motor 2013-1 PLC floating rate 25-Feb-2021 Motor 2015-1 PLC floating rate 25-Jun-2022 Penarth Master Issuer PLC floating rate 18-Mar-2021 37,605,738 6,280,243 5,818,117 1,972,318 2,854,790 1,669,801 5,860,236 1,583,564 5,003,012 6,563,657 13.48 2.25 2.09 0.71 1.02 0.60 2.10 0.57 1.79 2.35 70,554,908 5,213,182 25.30 1.87 4,024,060 4,999,000 5,473,712 3,013,720 1.44 1.79 1.96 1.08 2,500,000 2,750,000 3,000,000 2,000,000 4,300,000 4,000,000 5,400,000 5,550,000 4,000,000 5,500,000 4,000,000 4,500,000 Corporate bonds Bank Nederlandse Gemeenten NV floating rate 03-Apr-2018 Cooperatieve Centrale Raiffeisen-Boerenleenbank BA/Netherlands 4.000% 10-Sep-2015 Credit Suisse AG/London floating rate 21-Jan-2016 FMS Wertmanagement AoeR 1.000% 10-Apr-2018 Landeskreditbank Baden-Wuerttemberg Foerderbank 1.250% 15-Dec-2016 Landeskreditbank Baden-Wuerttemberg Foerderbank floating rate 18-Jul-2017 National Australia Bank Ltd 1.875% 20-Feb-2020 Nederlandse Waterschapsbank NV floating rate 09-Apr-2018 Network Rail Infrastructure Finance PLC 1.125% 15-Dec-2016 Nordea Bank AB 3.875% 15-Dec-2015 Pohjola Bank OYJ floating rate 21-May-2018 Prudential PLC 1.250% 16-Nov-2015 Royal Bank of Canada floating rate 04-Jun-2019 Shell International Finance BV 2.000% 20-Dec-2019 Toronto-Dominion Bank floating rate 19-Jan-2018 Total Capital International SA 0.877% 01-Jul-2019 Toyota Motor Credit Corp 4.000% 07-Dec-2017 2,506,175 2,705,902 3,007,305 2,010,477 4,356,588 4,001,840 5,403,564 5,553,108 4,005,928 5,500,825 3,995,700 4,783,822 0.90 0.97 1.08 0.72 1.56 1.44 1.94 1.99 1.44 1.97 1.43 1.72 5,100,000 4,000,000 4,000,000 4,000,000 4,250,000 3,250,000 5,500,000 3,600,000 4,500,000 3,300,000 3,500,000 2,500,000 4,500,000 4,000,000 5,000,000 2,000,000 3,350,000 5,500,000 2,000,000 3,350,000 2,000,000 5,000,000 2,000,000 4,000,000 5,500,000 5,550,000 Covered bonds Abbey National Treasury Services PLC/London floating rate 20-Jan-2017 ANZ New Zealand Int'l Ltd/London 1.500% 17-Dec-2015 ASB Finance Ltd/London floating rate 01-May-2018 Bank of Montreal floating rate 29-Jan-2018 Bank of Nova Scotia floating rate 02-Nov-2017 Bank of Scotland PLC 4.875% 08-Nov-2016 Barclays Bank PLC floating rate 15-Sep-2017 BNZ International Funding Ltd/London floating rate 29-Jan-2016 Canadian Imperial Bank of Commerce/Canada floating rate 15-Jan-2018 Commonwealth Bank of Australia floating rate 24-Jan-2018 Coventry Building Society 4.625% 19-Apr-2018 Coventry Building Society floating rate 17-Mar-2020 Danske Bank A/S floating rate 15-Sep-2017 Dexia Credit Local SA floating rate 15-Apr-2016 DNB Boligkreditt AS floating rate 17-Feb-2020 GE Capital UK Funding 4.625% 18-Jan-2016 GE Capital UK Funding floating rate 16-Jan-2018 Leeds Building Society floating rate 09-Feb-2018 Lloyds Bank PLC floating rate 19-Jan-2018 Nationwide Building Society floating rate 17-Jul-2017 Nationwide Building Society floating rate 27-Apr-2018 Swedbank Hypotek AB floating rate 02-Apr-2018 Total Capital SA 4.250% 08-Dec-2017 Volkswagen Financial Services NV 2.000% 23-Oct-2015 Westpac Securities NZ Ltd floating rate 03-Oct-2017 Yorkshire Building Society floating rate 23-Mar-2016 102,037,563 5,108,772 4,010,520 3,991,020 4,000,620 4,251,934 3,420,365 5,502,750 3,611,556 4,500,945 3,307,441 3,820,018 2,502,250 4,506,660 4,001,540 4,994,650 2,038,590 3,351,642 5,503,025 2,000,810 3,352,479 2,000,770 5,001,800 2,133,918 4,011,560 5,501,045 5,610,883 36.59 1.83 1.44 1.43 1.43 1.52 1.23 1.97 1.30 1.61 1.19 1.37 0.90 1.62 1.44 1.79 0.73 1.20 1.97 0.72 1.20 0.72 1.79 0.77 1.44 1.97 2.01 6,300,000 5,811,278 1,971,288 2,852,115 1,668,354 5,835,000 1,582,585 5,000,000 6,550,000 5,200,000 4,000,000 5,000,000 5,500,000 3,000,000 67 . PAYDEN GLOBAL FUNDS PUBLIC LIMITED COMPANY SCHEDULE OF INVESTMENTS (continued) Payden Sterling Reserve Fund (continued) As at 30 June 2015 Holding Fair value GBP % of net assets Government and government related bonds African Development Bank 1.125% 15-Dec-2016 Caisse d'Amortissement de la Dette Sociale 1.000% 07-Mar-2018 Caisse des Depots et Consignations 1.500% 12-Jun-2017 Export Development Canada 0.875% 07-Dec-2016 Kingdom of Belgium 5.000% 24-Apr-2018 Kommunalbanken AS 1.125% 15-Dec-2016 Kommunekredit 1.125% 07-Dec-2018 Municipality Finance PLC 1.250% 15-Dec-2016 SNCF Reseau 2.375% 23-Dec-2015 Transport for London 1.250% 21-Nov-2017 United Kingdom Gilt 1.000% 07-Sep-2017 United Kingdom Gilt 1.750% 22-Jan-2017 United Kingdom Treasury Bill 0.000% 20-Jul-2015 United Kingdom Treasury Bill 0.000% 01-Sep-2015 United Kingdom Treasury Bill 0.000% 14-Sep-2015 United Kingdom Treasury Bill 0.000% 12-Oct-2015 67,207,905 4,518,435 3,481,947 1,311,921 3,003,067 6,103,639 5,018,308 4,669,685 5,027,350 3,022,245 4,010,045 4,022,800 2,036,600 5,998,608 4,496,287 4,994,970 5,491,998 24.10 1.62 1.25 0.47 1.08 2.19 1.80 1.68 1.80 1.08 1.44 1.44 0.73 2.15 1.61 1.79 1.97 Total value of investment in securities (2014: 99.43%) 277,406,114 99.47 Financial assets at fair value through profit or loss 4,500,000 3,500,000 1,300,000 3,000,000 5,500,000 5,000,000 4,700,000 5,000,000 3,000,000 4,000,000 4,000,000 2,000,000 6,000,000 4,500,000 5,000,000 5,500,000 Name of securities 277,406,114 99.47 1,484,205 0.53 278,890,319 100.00 Net current assets Total net assets Portfolio Analysis % of total assets Transferable securities and money market instruments admitted to an official stock exchange listing or traded on a regulated market Analysis as a percentage of total assets rather than net assets is required under the UCITS Notice 8.5 appendix A. 68 98.77 98.77 . PAYDEN GLOBAL FUNDS PUBLIC LIMITED COMPANY SCHEDULE OF INVESTMENTS (continued) Payden US Core Bond Fund As at 30 June 2015 Holding Name of securities Fair value USD % of net assets 2,005,932 150,028 99,196 322,092 338,008 11.99 0.90 0.59 1.93 2.02 2,262 98,564 119,479 297,200 102,625 323,568 99,810 0.01 0.59 0.71 1.78 0.61 1.93 0.60 54,593 Asset-backed securities Ally Master Owner Trust floating rate 15-Jan-2019 Colony American Homes 2015-1 floating rate 17-Jul-2032 Dryden XXVIII Senior Loan Fund 1.374% 15-Aug-2025 Fannie Mae-Aces floating rate 25-Nov-2018 FHLMC Multifamily Structured Pass Through Certificates floating rate 25-Apr-2019 Hilton USA Trust 2013-HLF floating rate 05-Nov-2030 Hilton USA Trust 2013-HLT 2.662% 05-Nov-2030 Invitation Homes 2014-SFR1 Trust 1.185% 17-Jun-2031 NCUA Guaranteed Notes Trust 2010-R2 floating rate 06-Nov-2017 NCUA Guaranteed Notes Trust 2010-R3 floating rate 08-Dec-2020 SLM Student Loan Trust 2014-1 floating rate 26-Jul-2021 Structured Asset Mortgage Investments II Trust 2003-AR4 floating rate 19-Jan-2034 53,100 0.32 90,000 75,000 80,000 100,000 60,000 110,000 100,000 75,000 145,000 145,000 90,000 40,000 60,000 30,000 200,000 200,000 90,000 146,464 120,000 70,000 85,000 55,000 40,000 55,000 110,000 190,000 130,000 50,000 120,000 50,000 60,000 50,000 135,000 65,000 75,000 30,000 35,000 60,000 45,000 140,000 90,000 100,000 125,000 50,000 Corporate bonds AbbVie Inc 3.600% 14-May-2025 Air Canada 2015-1 Class A Pass Through Trust 3.600% 15-Mar-2027 Air Lease Corp 5.625% 01-Apr-2017 Amazon.com Inc 3.300% 05-Dec-2021 Anthem Inc 2.375% 15-Feb-2017 AT&T Inc 4.750% 15-May-2046 Banco del Estado de Chile 4.125% 07-Oct-2020 Bank of America Corp 4.200% 26-Aug-2024 Bank of America Corp 6.875% 25-Apr-2018 Bear Stearns Cos LLC 5.550% 22-Jan-2017 Blue Cross & Blue Shield of Minnesota 3.790% 01-May-2025 Boston Scientific Corp 2.850% 15-May-2020 CenturyLink Inc 5.800% 15-Mar-2022 Citigroup Inc floating rate 15-May-2018 Citizens Financial Group Inc 4.150% 28-Sep-2022 Credit Agricole SA/London floating rate 15-Apr-2016 CSX Corp 3.950% 01-May-2050 CVS Pass-Through Trust Series 2014 4.163% 11-Aug-2036 Dignity Health 3.125% 01-Nov-2022 Dignity Health 4.500% 01-Nov-2042 Dow Chemical Co 9.400% 15-May-2039 Exelon Generation Co LLC 6.200% 01-Oct-2017 FS Investment Corp 4.250% 15-Jan-2020 Goldman Sachs Group Inc floating rate 30-Apr-2018 Goldman Sachs Group Inc/The 6.750% 01-Oct-2037 Health Care REIT Inc 4.125% 01-Apr-2019 Heathrow Funding Ltd 4.875% 15-Jul-2021 Hyundai Capital America 2.600% 19-Mar-2020 JPMorgan Chase & Co floating rate 25-Jan-2018 Lam Research Corp 3.800% 15-Mar-2025 Latam Airlines 2015-1 Pass Through Trust A 4.200% 15-Nov-2027 Massachusetts Mutual Life Insurance Co 4.500% 15-Apr-2065 McGraw Hill Financial Inc 5.900% 15-Nov-2017 Medtronic Inc 3.150% 15-Mar-2022 MetLife Inc 6.400% 15-Dec-2036 MetLife Inc 10.750% 01-Aug-2039 Morgan Stanley floating rate 25-Feb-2016 Morgan Stanley floating rate 24-Jan-2019 Nationwide Mutual Insurance Co 9.375% 15-Aug-2039 North Shore-Long Island Jewish Health Care Inc 6.150% 01-Nov-2043 Old Republic International Corp 4.875% 01-Oct-2024 Oracle Corp 2.500% 15-May-2022 Orange SA 9.000% 01-Mar-2031 Pacific Life Insurance Co 9.250% 15-Jun-2039 5,914,193 89,139 75,216 85,000 101,460 61,049 100,483 106,193 74,960 163,910 153,867 88,606 39,763 57,525 30,807 204,550 201,288 79,114 144,718 117,901 65,123 128,310 60,165 40,474 55,619 129,421 201,276 142,607 50,072 120,866 48,763 59,475 44,525 147,545 65,350 82,500 48,675 35,195 60,030 67,756 162,624 93,454 97,192 176,805 74,892 35.34 0.53 0.45 0.51 0.61 0.37 0.60 0.63 0.45 0.98 0.92 0.53 0.24 0.34 0.18 1.22 1.20 0.47 0.87 0.70 0.39 0.77 0.36 0.24 0.33 0.77 1.20 0.85 0.30 0.72 0.29 0.36 0.27 0.88 0.39 0.49 0.29 0.21 0.36 0.41 0.97 0.56 0.58 1.06 0.45 150,000 100,000 325,000 330,000 2,271 98,547 120,000 300,000 102,421 321,122 100,000 69 . PAYDEN GLOBAL FUNDS PUBLIC LIMITED COMPANY SCHEDULE OF INVESTMENTS (continued) Payden US Core Bond Fund (continued) As at 30 June 2015 Holding Name of securities Fair value USD % of net assets 75,000 90,000 75,000 110,000 50,000 70,000 100,000 80,000 55,000 110,000 110,000 80,000 50,000 50,000 105,000 120,000 155,000 90,000 Corporate bonds (continued) Penske Truck Leasing Co LP / PTL Finance Corp. 3.050% 09-Jan-2020 Penske Truck Leasing Co LP / PTL Finance Corp. 3.375% 01-Feb-2022 Pfizer Inc 7.200% 15-Mar-2039 Prudential Financial Inc floating rate 15-Jun-2043 Quest Diagnostics Inc 3.500% 30-Mar-2025 Ryder System Inc 2.500% 11-May-2020 Santander Holdings USA Inc/PA 2.650% 17-Apr-2020 Scotiabank Peru SAA floating rate 13-Dec-2027 Select Income REIT 4.500% 01-Feb-2025 Senior Housing Properties Trust 4.750% 01-May-2024 Suncorp-Metway Ltd 2.350% 27-Apr-2020 Sydney Airport Finance Co. Pty Ltd 3.375% 30-Apr-2025 Synchrony Financial 3.000% 15-Aug-2019 TD Ameritrade Holding Corp 2.950% 01-Apr-2022 Teachers Insurance & Annuity Association of America 6.850% 16-Dec-2039 Transatlantic Holdings Inc 8.000% 30-Nov-2039 Verizon Communications Inc 6.400% 15-Sep-2033 Wyndham Worldwide Corp 2.500% 01-Mar-2018 75,413 87,368 103,651 114,290 47,545 69,566 98,420 78,800 53,246 110,696 107,871 77,128 50,403 49,620 131,735 155,771 178,120 90,287 0.45 0.52 0.62 0.68 0.28 0.42 0.59 0.47 0.32 0.66 0.65 0.46 0.30 0.30 0.79 0.93 1.06 0.54 2,280,766 89,280 177,139 118,906 100,683 50,046 142,659 51,240 52,570 13.63 0.53 1.06 0.71 0.60 0.30 0.85 0.31 0.31 101,000 125,000 210,000 100,000 60,000 70,000 70,000 85,000 200,000 200,000 55,000 130,000 70,000 Covered bonds Actavis Funding SCS 3.450% 15-Mar-2022 Actavis Funding SCS floating rate 12-Mar-2020 ARC Properties Operating Partnership LP 3.000% 06-Feb-2019 BAT International Finance PLC 2.750% 15-Jun-2020 Baxalta Inc 3.600% 23-Jun-2022 BioMed Realty LP 3.850% 15-Apr-2016 ERAC USA Finance LLC 2.750% 15-Mar-2017 FedEx Corp 4.500% 01-Feb-2065 Freeport-McMoran Oil & Gas LLC / FCX Oil & Gas Inc 6.500% 15-Nov-2020 Glencore Finance Canada Ltd 4.250% 25-Oct-2022 Glencore Funding LLC floating rate 27-May-2016 HJ Heinz Co 3.500% 15-Jul-2022 Kinder Morgan Inc/DE 5.300% 01-Dec-2034 MDC Holdings Inc 6.000% 15-Jan-2043 Noble Holding International Ltd 3.450% 01-Aug-2015 Reynolds American Inc 4.000% 12-Jun-2022 Sinopec Capital 2013 Ltd 1.875% 24-Apr-2018 SpareBank 1 Boligkreditt AS 2.625% 27-May-2016 Valero Energy Corp 6.625% 15-Jun-2037 Wesfarmers Ltd 1.874% 20-Mar-2018 Westvaco Corp 7.950% 15-Feb-2031 107,060 123,017 210,603 100,386 55,945 59,150 70,072 86,956 198,588 203,605 62,306 130,317 90,238 0.64 0.74 1.26 0.60 0.33 0.35 0.42 0.52 1.19 1.22 0.37 0.78 0.54 540,000 30,000 140,000 1,170,000 265,000 62,000 100,000 100,000 88,000 110,000 145,000 100,000 300,000 360,000 770,000 370,000 Government bonds Federal Farm Credit Banks floating rate 17-Jan-2018 Federal Farm Credit Banks floating rate 22-Mar-2018 Federal National Mortgage Association 1.500% 22-Jun-2020 Mexican Bonos 10.000% 05-Dec-2024 Mexico Government International Bond 3.625% 15-Mar-2022 Mexico Government International Bond 5.550% 21-Jan-2045 Panama Government International Bond 5.200% 30-Jan-2020 Philippine Government International Bond 4.000% 15-Jan-2021 Poland Government International Bond 5.125% 21-Apr-2021 State Board of Administration Finance Corp 2.107% 01-Jul-2018 State of California 7.550% 01-Apr-2039 Tennessee Valley Authority 2.875% 15-Sep-2024 United States Treasury Bill 0.055% 17-Dec-2015 United States Treasury Floating Rate Note 31-Jan-2017 United States Treasury Note/Bond 0.875% 30-Apr-2017 United States Treasury Note/Bond 1.500% 31-May-2020 3,768,003 540,388 30,011 138,439 95,665 268,842 66,185 110,450 108,380 97,847 110,961 209,753 100,590 299,923 360,218 773,970 368,005 22.52 3.23 0.18 0.83 0.57 1.61 0.40 0.66 0.65 0.58 0.66 1.25 0.60 1.79 2.15 4.63 2.20 90,000 175,000 125,000 100,000 50,000 140,000 50,000 60,000 70 .
PAYDEN GLOBAL FUNDS PUBLIC LIMITED COMPANY SCHEDULE OF INVESTMENTS (continued) Payden US Core Bond Fund (continued) As at 30 June 2015 Holding 90,000 370,000 213,954 190,000 161,191 180,828 60,000 134,121 480,000 92,637 230,000 49,164 64,310 87,974 178,583 67,339 28,733 318,198 113,051 43,877 200,000 20,182 140,000 Name of securities Fair value USD 88,376 Total value of investment in securities (2014: 105.34%) (2) Futures contracts (2014: 0.00%) US Treasury Note 10 Year (CBT) Future Exp 21-Sep-2015 21.54 2.29 1.28 1.13 1.00 1.12 0.37 0.85 3.04 0.60 1.49 0.33 0.43 0.58 1.20 0.45 0.19 1.90 0.71 0.28 1.27 0.13 0.90 17,573,630 Mortgage related securities Fannie Mae Pool 3.000% 01-Jul-2030 Fannie Mae Pool 3.000% 01-Oct-2042 Fannie Mae Pool 3.000% 15-Jul-2045 Fannie Mae Pool 3.500% 01-Mar-2042 Fannie Mae Pool 3.500% 01-Sep-2042 Fannie Mae Pool 3.500% 01-Jul-2043 Fannie Mae Pool 4.000% 01-Dec-2041 Fannie Mae Pool 4.000% 01-Jul-2045 Fannie Mae Pool 4.500% 01-Mar-2040 Fannie Mae Pool 4.500% 01-Jul-2045 Fannie Mae Pool 5.000% 01-Jun-2033 Fannie Mae Pool 5.000% 01-Nov-2033 Fannie Mae Pool 5.000% 01-Jul-2035 Fannie Mae Pool 5.500% 01-Apr-2034 Fannie Mae Pool 5.500% 01-May-2034 Fannie Mae Pool 5.500% 01-Apr-2036 Freddie Mac Gold Pool 3.000% 01-Nov-2042 Ginnie Mae I Pool 3.500% 15-Feb-2042 Ginnie Mae I Pool 3.500% 15-Jul-2042 Ginnie Mae I Pool 4.000% 15-Jul-2045 Ginnie Mae II Pool 4.500% 20-Sep-2041 Ginnie Mae II Pool 4.500% 01-Jul-2043 0.53 3,604,736 383,352 214,374 189,306 166,707 186,987 61,838 142,812 508,588 101,011 248,688 54,521 71,368 97,642 201,499 75,994 32,242 317,427 118,515 45,980 212,828 22,076 150,981 Government bonds (continued) United States Treasury Note/Bond 2.125% 15-May-2025 % of net assets 105.02 Notional (USD) Broker 2,391 0.01 (254,734) JPMorgan Chase 2,391 0.01 48,780 0.29 17,624,801 105.32 Unrealised gain on forward foreign exchange contracts (Appendix) (2014: 0.00%) Financial assets at fair value through profit or loss Notional (USD) Broker (3,047) (0.02) (2,843,141) Morgan Stanley (3,047) (0.02) Unrealised loss on forward foreign exchange contracts (Appendix) (2014: 0.00%) (29,290) (0.17) Financial liabilities at fair value through profit or loss (13) Futures contracts (2014: 0.00%) US Treasury Note 2 Year (CBT) Future Exp 30-Sep-2015 (32,337) (0.19) (858,602) (5.13) 16,733,862 100.00 Net current liabilities Total net assets Appendix: forward foreign currency contracts Unrealised gain on forward foreign currency contracts Currency Counter Party Purchase Payden US Core Bond Fund Royal Bank of Scotland EUR Royal Bank of Scotland GBP Purchase Amount Currency Sale Sale Amount Maturity date Unrealised Gain/Loss USD 258,000 186,000 USD USD (275,954) (283,568) 17-Jul-2015 17-Jul-2015 11,567 8,923 71 . PAYDEN GLOBAL FUNDS PUBLIC LIMITED COMPANY SCHEDULE OF INVESTMENTS (continued) Payden US Core Bond Fund (continued) As at 30 June 2015 Appendix: forward foreign currency contracts (continued) Unrealised gain on forward foreign currency contracts (continued) Currency Counter Party Purchase Payden US Core Bond Fund (continued) Royal Bank of Scotland USD Credit Suisse JPY Credit Suisse USD Credit Suisse USD Barclays INR UBS USD Credit Suisse USD Barclays USD Royal Bank of Canada USD Purchase Amount Currency Sale Sale Amount Maturity date Unrealised Gain/Loss USD 292,735 33,200,000 273,646 275,851 14,710,000 275,352 102,706 136,826 274,456 EUR USD AUD JPY USD EUR MXN SGD CAD (258,000) (267,181) (353,000) (33,200,000) (224,889) (245,000) (1,560,000) (183,000) (342,000) 17-Jul-2015 31-Jul-2015 31-Jul-2015 31-Jul-2015 17-Aug-2015 17-Aug-2015 19-Aug-2015 20-Aug-2015 14-Sep-2015 5,213 4,237 2,799 4,434 3,958 2,197 3,638 1,021 793 48,780 Unrealised loss on forward foreign currency contracts Currency Counter Party Purchase Payden US Core Bond Fund Royal Bank of Scotland USD HSBC Securities EUR HSBC Securities USD Credit Suisse AUD UBS EUR Barclays USD HSBC Securities PHP Royal Bank of Canada CAD Purchase Amount Currency Sale Sale Amount Maturity date Unrealised Gain/Loss USD 275,887 31,000 229,934 33,000 25,000 21,908 6,130,000 38,000 GBP USD EUR USD USD INR USD USD (186,000) (35,363) (214,000) (25,764) (28,528) (1,410,000) (137,044) (31,114) 17-Jul-2015 23-Jul-2015 23-Jul-2015 31-Jul-2015 17-Aug-2015 17-Aug-2015 20-Aug-2015 14-Sep-2015 (16,604) (813) (8,572) (444) (654) (28) (1,468) (707) (29,290) Portfolio Analysis % of total assets Transferable securities and money market instruments admitted to an official stock exchange listing or traded on a regulated market Financial derivative instruments dealt in on a regulated market OTC financial derivative instruments Analysis of total assets rather than net assets is required under the UCITS Notice 8.5 appendix A. 72 90.91 0.00 0.10 91.01 . PAYDEN GLOBAL FUNDS PUBLIC LIMITED COMPANY SCHEDULE OF INVESTMENTS (continued) Payden US Dollar Liquidity Fund As at 30 June 2015 Holding Name of securities Fair value USD % of net assets 4,712,549 250,094 151,641 10,552 250,158 210,222 205,176 150,127 199,899 239,785 98,338 25.88 1.37 0.83 0.06 1.37 1.15 1.13 0.83 1.10 1.32 0.54 110,000 38,673 40,090 77,818 99,471 22,239 127,000 200,000 50,000 159,081 300,000 104,356 155,000 212,060 364,775 57,894 250,000 27,174 250,000 100,000 200,000 Asset-backed securities Babson CLO Ltd 2015-I 1.709% 20-Apr-2027 BMW Vehicle Owner Trust 2013-A 0.670% 27-Nov-2017 Capital Auto Receivables Asset Trust 2014-1 0.680% 20-May-2016 Carlyle Global Market Strategies 1.740% 27-Apr-2027 CarMax Auto Owner Trust 2015-1 0.880% 15-Mar-2018 CarMax Auto Owner Trust 2015-2 0.820% 15-Jun-2018 Citibank Credit Card Issuance Trust 0.730% 07-Feb-2018 CNH Equipment Trust 0.840% 15-Aug-2018 CNH Equipment Trust 2015-A 0.840% 15-Jun-2018 Colony American Homes 2014-2 1.137% 17-Jul-2031 Colony American Homes Single-Family Rental Pass-Through Certificates 1.137% 17-Jul-2032 Fannie Mae Connecticut Avenue Securities floating rate 25-Jan-2024 Fannie Mae Connecticut Avenue Securities floating rate 25-May-2024 Fannie Mae Connecticut Avenue Securities floating rate 25-Jul-2024 Fannie Mae Connecticut Avenue Securities floating rate 25-May-2025 Fifth Third Auto Trust 2014-1 0.460% 15-Aug-2016 Ford Credit Auto Lease Trust 2014-A 0.680% 15-Apr-2017 GE Dealer Floorplan Master Note Trust floating rate 20-Apr-2018 GE Equipment Transportation LLC Series 2015-1 0.890% 24-Nov-2017 Honda Auto Receivables 2013-2 Owner Trust 0.530% 16-Feb-2017 Mercedes Benz Auto Lease Trust 2015-A floating rate 15-Feb-2017 Mercedes-Benz Auto Receivables Trust 2012-1 0.780% 15-Aug-2017 MMAF Equipment Finance LLC 2015-A 0.960% 18-Sep-2017 Navient Student Loan Trust 2015-1 floating rate 26-Sep-2022 NCUA Guaranteed Notes Trust 2010-R2 floating rate 05-Nov-2020 Nissan Auto Receivables 2013-A Owner Trust 0.500% 15-May-2017 Octagon Investment Partners 24 Ltd 1.731% 21-May-2027 Santander Drive Auto Receivables Trust 2015-1 0.320% 15-Mar-2016 Symphony CLO XV Ltd 1.720% 17-Oct-2026 USAA Auto Owner Trust 2014-1 0.580% 15-Dec-2017 Volkswagen Auto Lease Trust 2015-A 0.870% 20-Jun-2017 109,571 38,910 39,789 77,780 98,968 22,239 126,990 199,901 50,042 159,088 299,927 104,496 155,116 212,154 366,654 57,880 250,000 27,174 249,776 100,010 200,092 0.60 0.21 0.22 0.43 0.54 0.12 0.70 1.10 0.28 0.87 1.65 0.57 0.85 1.17 2.01 0.32 1.37 0.15 1.37 0.55 1.10 30,000 200,000 200,000 Certificates of Deposit Credit Suisse/New York NY floating rate 24-Aug-2015 Mizuho Bank Ltd 0.260% 19-Aug-2015 Sumitomo Mitsui Banking Corp 0.270% 08-Sep-2015 430,044 30,000 200,026 200,018 2.36 0.16 1.10 1.10 120,000 100,000 100,000 90,000 200,000 105,000 10,000 200,000 100,000 110,000 200,000 10,000 40,000 250,000 30,000 10,000 125,000 20,000 150,000 100,000 100,000 Corporate bonds AbbVie Inc 1.800% 14-May-2018 American Express Credit Corp floating rate 05-Jun-2017 American Honda Finance Corp 0.950% 05-May-2017 Amgen Inc floating rate 22-May-2017 Bank Nederlandse Gemeenten NV 2.500% 11-Jan-2016 Bank of America Corp floating rate 15-Jan-2019 Bank of America Corp 3.875% 22-Mar-2017 Bank of Tokyo-Mitsubishi UFJ Ltd floating rate 10-Mar-2017 BB&T Corp floating rate 01-Feb-2019 Bear Stearns Cos LLC 5.550% 22-Jan-2017 British Telecommunications PLC 1.250% 14-Feb-2017 Cameron International Corp 1.400% 15-Jun-2017 Canadian Natural Resources Ltd 1.750% 15-Jan-2018 Capital One NA/Mclean VA 1.500% 05-Sep-2017 Caterpillar Financial Services Corp floating rate 03-Mar-2017 Cisco Systems Inc floating rate 01-Mar-2019 Citigroup Inc 1.550% 14-Aug-2017 Citigroup Inc 1.800% 05-Feb-2018 ConAgra Foods Inc floating rate 21-Jul-2016 Dominion Resources Inc/VA 1.250% 15-Mar-2017 Duke Energy Corp floating rate 03-Apr-2017 5,789,765 119,730 99,530 99,946 90,002 202,206 106,034 10,401 199,934 100,014 116,727 199,762 9,939 39,754 249,072 30,055 10,049 124,845 19,964 149,612 99,817 100,130 31.79 0.66 0.55 0.55 0.49 1.11 0.58 0.06 1.10 0.55 0.64 1.10 0.05 0.22 1.37 0.16 0.05 0.69 0.11 0.82 0.55 0.55 250,000 151,481 10,552 250,000 210,000 205,000 150,000 200,000 240,000 99,288 73 . PAYDEN GLOBAL FUNDS PUBLIC LIMITED COMPANY SCHEDULE OF INVESTMENTS (continued) Payden US Dollar Liquidity Fund (continued) As at 30 June 2015 Holding Name of securities Fair value USD 20,000 160,000 200,000 150,000 10,000 100,000 20,000 100,000 100,000 100,000 50,000 70,000 30,000 100,000 150,000 120,000 30,000 100,000 40,000 100,000 100,000 200,000 100,000 150,000 50,000 200,000 100,000 200,000 115,000 60,000 250,000 100,000 80,000 20,000 50,000 60,000 Corporate bonds (continued) Electricite de France SA floating rate 20-Jan-2017 Enbridge Inc floating rate 02-Jun-2017 Ford Motor Credit Co LLC floating rate 08-Sep-2017 Goldman Sachs Group Inc 6.250% 01-Sep-2017 Hess Corp 1.300% 15-Jun-2017 Hewlett-Packard Co 2.600% 15-Sep-2017 Hewlett-Packard Co floating rate 14-Jan-2019 HSBC USA Inc floating rate 03-Mar-2017 Inter-American Investment Corp 0.423% 02-Oct-2017 JPMorgan Chase & Co floating rate 18-Nov-2016 JPMorgan Chase & Co floating rate 15-Feb-2017 JPMorgan Chase & Co floating rate 23-Jan-2020 KeyBank NA/Cleveland OH 4.950% 15-Sep-2015 Kinder Morgan Energy Partners LP 3.500% 01-Mar-2016 Kroger Co floating rate 17-Oct-2016 Macquarie Bank Ltd floating rate 27-Oct-2017 Macquarie Group Ltd floating rate 31-Jan-2017 McKesson Corp floating rate 10-Sep-2015 Morgan Stanley 1.875% 05-Jan-2018 Morgan Stanley 6.250% 28-Aug-2017 Morgan Stanley floating rate 23-Jul-2019 Nederlandse Waterschapsbank NV 1.250% 18-Sep-2017 Nissan Motor Acceptance Corp 1.000% 15-Mar-2016 NSTAR Electric Co floating rate 17-May-2016 Prudential Financial Inc 4.750% 17-Sep-2015 QUALCOMM Inc floating rate 18-May-2018 Southern Power Co 4.875% 15-Jul-2015 SunTrust Bank/Atlanta GA floating rate 15-Feb-2017 Synchrony Financial 1.875% 15-Aug-2017 Thomson Reuters Corp 1.650% 29-Sep-2017 UBS AG/Stamford CT floating rate 26-Sep-2016 United Technologies Corp 1.778% 04-May-2018 Verizon Communications Inc floating rate 09-Jun-2017 Verizon Communications Inc floating rate 17-Jun-2019 Walgreens Boots Alliance Inc floating rate 18-May-2016 Zimmer Biomet Holdings Inc 1.450% 01-Apr-2017 20,000 20,000 90,000 90,000 50,000 30,000 100,000 100,000 40,000 150,000 200,000 50,000 40,000 100,000 100,000 200,000 40,000 60,000 54,000 10,000 15,000 20,000 Covered bonds Abbey National Treasury Services PLC/London floating rate 13-Mar-2017 Actavis Funding SCS 1.300% 15-Jun-2017 Actavis Funding SCS 1.850% 01-Mar-2017 Actavis Funding SCS floating rate 01-Sep-2016 Actavis Funding SCS floating rate 12-Mar-2018 Anheuser-Busch InBev Finance Inc floating rate 27-Jan-2017 Asciano Finance Ltd 3.125% 23-Sep-2015 BAT International Finance PLC floating rate 15-Jun-2018 Baxalta Inc floating rate 22-Jun-2018 Daimler Finance North America LLC floating rate 02-Mar-2017 DNB Boligkreditt AS 2.100% 14-Oct-2015 Express Scripts Holding Co 3.125% 15-May-2016 Freeport-McMoRan Inc 2.300% 14-Nov-2017 General Electric Capital Corp floating rate 15-May-2017 General Motors Financial Co Inc floating rate 10-Apr-2018 Glencore Finance Canada Ltd 2.700% 25-Oct-2017 Glencore Funding LLC 2.125% 16-Apr-2018 HJ Heinz Co 1.600% 30-Jun-2017 JB Hunt Transport Services Inc 3.375% 15-Sep-2015 L-3 Communications Corp 1.500% 28-May-2017 NextEra Energy Capital Holdings Inc 1.339% 01-Sep-2015 NextEra Energy Capital Holdings Inc 1.586% 01-Jun-2017 74 % of net assets 20,035 158,160 198,944 164,263 9,953 101,862 19,736 99,988 100,041 100,069 50,090 70,714 30,196 101,457 150,111 120,285 30,151 99,997 40,121 109,630 99,423 201,175 100,203 149,704 50,389 200,139 100,107 199,883 115,012 60,013 250,253 100,349 79,846 19,894 50,003 60,046 0.11 0.87 1.09 0.90 0.05 0.56 0.11 0.55 0.55 0.55 0.27 0.39 0.17 0.56 0.82 0.66 0.17 0.55 0.22 0.60 0.55 1.10 0.55 0.82 0.28 1.10 0.55 1.10 0.63 0.33 1.37 0.55 0.44 0.11 0.27 0.33 1,941,738 19,986 19,874 90,476 90,348 50,243 29,955 100,412 100,014 40,017 150,056 200,971 50,832 39,900 100,206 100,828 202,186 39,726 60,035 54,274 9,936 15,015 20,053 10.66 0.11 0.11 0.50 0.50 0.28 0.16 0.55 0.55 0.22 0.82 1.10 0.28 0.22 0.55 0.55 1.11 0.22 0.33 0.30 0.05 0.08 0.11 . PAYDEN GLOBAL FUNDS PUBLIC LIMITED COMPANY SCHEDULE OF INVESTMENTS (continued) Payden US Dollar Liquidity Fund (continued) As at 30 June 2015 Holding Name of securities Fair value USD % of net assets 38,000 40,000 125,000 150,000 Covered bonds (continued) NextEra Energy Capital Holdings Inc 7.875% 15-Dec-2015 Reynolds American Inc 2.300% 12-Jun-2018 Rio Tinto Finance USA PLC 2.000% 22-Mar-2017 Rio Tinto Finance USA PLC floating rate 17-Jun-2016 39,152 40,328 126,498 150,417 0.22 0.22 0.69 0.83 500,000 300,000 400,000 500,000 200,000 100,000 100,000 100,000 1,000,000 300,000 1,600,000 Government and government related bonds Federal Farm Credit Banks floating rate 17-Apr-2017 Federal Farm Credit Banks floating rate 02-Jan-2018 Federal Farm Credit Banks floating rate 26-Mar-2018 Federal Farm Credit Banks floating rate 16-Apr-2018 FMS Wertmanagement AoeR 0.625% 18-Apr-2016 Inter-American Investment Corp floating rate 16-Nov-2015 Kommunalbanken AS 0.500% 29-Mar-2016 State of North Rhine-Westphalia floating rate 28-Apr-2017 United States Treasury Bill 0.000% 28-Apr-2016 United States Treasury Floating Rate Note 31-Jul-2016 United States Treasury Floating Rate Note 31-Jan-2017 5,102,986 500,735 300,297 400,910 500,570 200,332 100,095 100,077 100,444 998,469 300,086 1,600,971 28.02 2.75 1.65 2.20 2.75 1.10 0.55 0.55 0.55 5.48 1.65 8.79 Total value of investment in securities (2014: 98.24%) 17,977,082 98.71 Financial assets at fair value through profit or loss 17,977,082 98.71 234,312 1.29 18,211,394 100.00 Net current assets Total net assets Portfolio Analysis % of total assets Transferable securities and money market instruments admitted to an official stock exchange listing or traded on a regulated market Analysis of total assets rather than net assets is required under the UCITS Notice 8.5 appendix A. 75 98.18 98.18 . PAYDEN GLOBAL FUNDS PUBLIC LIMITED COMPANY SCHEDULE OF INVESTMENTS (continued) Payden USD Low Duration Credit Fund As at 30 June 2015 Holding Name of securities Fair value USD % of net assets 100,000 150,000 Basic Materials Dow Chemical Co 8.550% 15-May-2019 Glencore Finance Canada Ltd 3.600% 15-Jan-2017 276,047 122,026 154,021 3.22 1.42 1.80 80,000 100,000 100,000 100,000 100,000 100,000 100,000 100,000 Communications AT&T Inc 2.450% 30-Jun-2020 AT&T Inc floating rate 27-Nov-2018 Grupo Televisa SAB 6.000% 15-May-2018 NBCUniversal Enterprise Inc floating rate 15-Apr-2018 Omnicom Group Inc 6.250% 15-Jul-2019 Telecom Italia Capital SA 6.999% 04-Jun-2018 Telefonica Emisiones SAU 6.421% 20-Jun-2016 Verizon Communications Inc 3.650% 14-Sep-2018 825,702 78,513 100,744 111,000 100,523 114,585 110,495 104,584 105,258 9.64 0.92 1.18 1.29 1.17 1.34 1.29 1.22 1.23 132,000 100,000 100,000 100,000 150,000 Consumer, Cyclical Ford Motor Credit Co LLC 6.625% 15-Aug-2017 General Motors Financial Co Inc 2.400% 10-Apr-2018 Hyundai Capital America 1.875% 09-Aug-2016 Southwest Airlines Co 2.750% 06-Nov-2019 Wyndham Worldwide Corp 2.500% 01-Mar-2018 597,851 144,887 100,315 100,608 101,562 150,479 6.98 1.69 1.17 1.17 1.19 1.76 50,000 100,000 100,000 50,000 100,000 100,000 100,000 100,000 120,000 100,000 100,000 100,000 Consumer, Non-cyclical AbbVie Inc 1.800% 14-May-2018 BAT International Finance PLC 2.750% 15-Jun-2020 Baxalta Inc 2.875% 23-Jun-2020 Boston Scientific Corp 2.850% 15-May-2020 Cardinal Health Inc 1.950% 15-Jun-2018 ConAgra Foods Inc 1.900% 25-Jan-2018 ERAC USA Finance LLC 2.350% 15-Oct-2019 HJ Heinz Co 2.000% 02-Jul-2018 HJ Heinz Co 2.800% 02-Jul-2020 McGraw Hill Financial Inc 5.900% 15-Nov-2017 Mylan Inc 2.600% 24-Jun-2018 Reynolds American Inc 3.250% 12-Jun-2020 1,130,263 49,888 100,683 99,969 49,703 100,239 98,571 99,447 100,041 120,230 109,292 100,795 101,405 13.20 0.58 1.18 1.17 0.58 1.17 1.15 1.16 1.17 1.40 1.28 1.18 1.18 100,000 100,000 Energy Canadian Natural Resources Ltd 5.700% 15-May-2017 Petroleos Mexicanos floating rate 18-Jul-2018 209,840 107,650 102,190 2.45 1.26 1.19 100,000 100,000 100,000 200,000 200,000 200,000 100,000 100,000 100,000 200,000 100,000 100,000 100,000 100,000 100,000 150,000 150,000 150,000 100,000 200,000 100,000 100,000 Financial Abbey National Treasury Services PLC/London 1.650% 29-Sep-2017 Air Lease Corp 5.625% 01-Apr-2017 Aircastle Ltd 4.625% 15-Dec-2018 Bank of America Corp 6.875% 25-Apr-2018 Barclays Bank PLC 6.050% 04-Dec-2017 Bear Stearns Cos LLC 5.550% 22-Jan-2017 BioMed Realty LP 2.625% 01-May-2019 Caisse Centrale Desjardins 1.550% 12-Sep-2017 Capital One Financial Corp 6.150% 01-Sep-2016 Citigroup Inc 5.500% 15-Feb-2017 Deutsche Bank AG/London 2.500% 13-Feb-2019 Goldman Sachs Group Inc 5.625% 15-Jan-2017 Goldman Sachs Group Inc 6.150% 01-Apr-2018 Hartford Financial Services Group Inc 5.500% 15-Oct-2016 International Lease Finance Corp 3.875% 15-Apr-2018 Jackson National Life Global Funding 2.300% 16-Apr-2019 Kimco Realty Corp 5.700% 01-May-2017 Lloyds Bank PLC 6.500% 14-Sep-2020 Macquarie Group Ltd 4.875% 10-Aug-2017 Morgan Stanley 5.950% 28-Dec-2017 Nomura Holdings Inc 2.000% 13-Sep-2016 Prologis LP 6.625% 01-Dec-2019 3,902,577 100,328 106,250 103,250 226,082 217,855 212,230 99,667 100,118 105,578 212,569 100,595 105,931 111,230 105,205 100,750 150,448 161,207 173,084 105,732 219,920 100,758 115,753 45.56 1.17 1.24 1.20 2.64 2.54 2.48 1.16 1.17 1.23 2.48 1.17 1.24 1.30 1.23 1.18 1.76 1.88 2.02 1.23 2.57 1.18 1.35 76 . PAYDEN GLOBAL FUNDS PUBLIC LIMITED COMPANY SCHEDULE OF INVESTMENTS (continued) Payden USD Low Duration Credit Fund (continued) As at 30 June 2015 Holding Name of securities Fair value USD % of net assets 100,000 100,000 100,000 100,000 100,000 200,000 160,000 Financial (continued) Regions Financial Corp 2.000% 15-May-2018 Santander Holdings USA Inc/PA 2.650% 17-Apr-2020 Suncorp-Metway Ltd 2.350% 27-Apr-2020 Synchrony Financial 3.000% 15-Aug-2019 TIAA Asset Management Finance Co LLC 2.950% 01-Nov-2019 UBS AG/Stamford CT 5.875% 15-Jul-2016 Ventas Realty LP / Ventas Capital Corp 2.000% 15-Feb-2018 100,002 98,420 98,065 100,807 100,800 208,864 161,079 1.17 1.15 1.14 1.18 1.18 2.44 1.88 100,000 150,000 100,000 100,000 100,000 150,000 Industrial Asciano Finance Ltd 5.000% 07-Apr-2018 BAE Systems PLC 3.500% 11-Oct-2016 FedEx Corp 8.000% 15-Jan-2019 Penske Truck Leasing Co LP / PTL Finance Corp 3.750% 11-May-2017 Ryder System Inc 2.450% 15-Nov-2018 Textron Inc 4.625% 21-Sep-2016 741,263 107,239 154,198 119,632 103,508 100,624 156,062 8.65 1.25 1.80 1.40 1.21 1.17 1.82 60,000 100,000 65,000 Technology Dun & Bradstreet Corp 4.000% 15-Jun-2020 Hewlett-Packard Co 5.400% 01-Mar-2017 QUALCOMM Inc 2.250% 20-May-2020 231,568 60,351 106,505 64,712 2.70 0.70 1.24 0.76 70,000 100,000 100,000 100,000 70,000 100,000 Utilities Dominion Resources Inc/VA 1.900% 15-Jun-2018 EDP Finance BV 6.000% 02-Feb-2018 Exelon Generation Co LLC 2.950% 15-Jan-2020 PG&E Corp 2.400% 01-Mar-2019 PSEG Power LLC 2.450% 15-Nov-2018 Southern Co 2.750% 15-Jun-2020 548,826 70,137 107,386 100,450 100,215 70,283 100,355 6.41 0.82 1.26 1.17 1.17 0.82 1.17 8,463,937 98.81 Total value of investment in securities (2014: 98.51%) 4 Futures contracts (2014: 0.00%) US Treasury Note 2 Year (CBT) Future Exp 30-Sep-2015 Notional (USD) Broker 1,437 0.02 874,313 Goldman Sachs 1,437 0.02 8,465,374 98.83 100,525 1.17 8,565,899 100.00 Financial assets at fair value through profit or loss Net current assets Total net assets Portfolio Analysis % of total assets Transferable securities and money market instruments admitted to an official stock exchange listing or traded on a regulated market Financial derivative instruments dealt in on a regulated market Analysis of total assets rather than net assets is required under the UCITS Notice 8.5 appendix A. 77 94.64 0.02 94.66 . PAYDEN GLOBAL FUNDS PUBLIC LIMITED COMPANY SCHEDULE OF INVESTMENTS (continued) Payden World Equity Fund As at 30 June 2015 Holding Name of securities Fair value USD % of net assets Equities 1,522,558 3.92 330 Switzerland Garmin Ltd 14,494 14,494 0.04 0.04 450 United Kingdom Ensco PLC 10,019 10,019 0.02 0.02 360 330 450 380 270 460 210 400 280 230 270 240 270 320 620 290 290 270 280 220 260 340 240 210 350 370 180 310 350 210 260 340 230 480 310 390 340 260 600 260 340 220 250 260 230 610 180 300 320 270 360 340 United States AGL Resources Inc Alliant Energy Corp Altria Group Inc American Electric Power Co Inc Arthur J Gallagher & Co AT&T Inc Avery Dennison Corp Avista Corp Bank of Hawaii Corp BB&T Corp Black Hills Corp Bristol-Myers Squibb Co Campbell Soup Co CenterPoint Energy Inc CenturyLink Inc Chevron Corp Cincinnati Financial Corp Cinemark Holdings Inc Cleco Corp Cliffs Natural Resources Inc Clorox Co CMS Energy Corp Coca-Cola Co Commercial Metals Co ConocoPhillips Darden Restaurants Inc Deluxe Corp Dominion Resources Inc/VA DTE Energy Co Eaton Corp PLC Edison International Eli Lilly & Co Emerson Electric Co Entergy Corp Eversource Energy Exelon Corp Federated Investors Inc First Niagara Financial Group Inc FirstEnergy Corp FirstMerit Corp FNB Corp/PA General Dynamics Corp General Electric Co General Mills Inc Genuine Parts Co HollyFrontier Corp Honeywell International Inc IDACORP Inc Intel Corp Kimberly-Clark Corp Leggett & Platt Inc Lockheed Martin Corp 1,498,045 16,760 19,044 21,994 20,127 12,767 16,337 12,796 12,262 18,665 9,272 11,784 15,961 12,864 6,086 18,212 27,969 14,549 10,847 15,072 951 27,044 10,831 9,412 3,374 21,492 26,301 11,163 20,728 26,117 14,170 14,449 28,375 12,748 33,838 14,076 12,252 11,383 2,453 19,521 5,414 4,867 31,166 6,644 14,483 20,586 26,044 18,352 16,836 9,733 28,608 17,523 63,192 3.86 0.04 0.05 0.06 0.05 0.03 0.04 0.03 0.03 0.05 0.02 0.03 0.04 0.03 0.02 0.05 0.07 0.04 0.03 0.04 0.00 0.07 0.03 0.02 0.01 0.06 0.07 0.03 0.05 0.07 0.04 0.04 0.07 0.03 0.09 0.04 0.03 0.03 0.01 0.05 0.01 0.01 0.08 0.02 0.04 0.05 0.07 0.05 0.04 0.02 0.07 0.04 0.16 78 . PAYDEN GLOBAL FUNDS PUBLIC LIMITED COMPANY SCHEDULE OF INVESTMENTS (continued) Payden World Equity Fund (continued) As at 30 June 2015 Holding 280 300 250 310 450 290 680 540 280 280 200 220 390 260 230 650 390 270 400 380 380 300 440 400 290 270 110 210 480 380 300 250 270 260 270 54 460 310 230 360 350 400 290 837 360 250,000,000 250,000,000 400,000,000 5,000,000 5,430,000 5,000,000 7,000,000 Name of securities Fair value USD % of net assets 7,192 28,516 11,799 17,641 25,036 15,125 18,731 9,922 27,451 12,762 31,725 6,282 6,094 7,006 9,079 4,176 6,324 9,049 19,638 30,455 21,616 6,245 12,965 15,710 6,062 10,575 8,210 10,285 8,364 19,245 14,252 24,729 11,571 3,982 9,743 928 8,119 7,742 14,842 14,481 20,057 4,122 13,437 37,694 11,572 0.02 0.07 0.03 0.05 0.06 0.04 0.05 0.03 0.07 0.03 0.08 0.02 0.02 0.02 0.02 0.01 0.02 0.02 0.05 0.08 0.06 0.02 0.03 0.04 0.02 0.03 0.02 0.03 0.02 0.05 0.04 0.06 0.03 0.01 0.02 0.00 0.02 0.02 0.04 0.04 0.05 0.01 0.03 0.10 0.03 Government bonds Japan Government Five Year Bond 0.300% 20-Sep-2015 Japan Government Two Year Bond 0.100% 15-Aug-2015 Japan Government Two Year Bond 0.100% 15-Sep-2015 United States Treasury Bill 0.000% 17-Sep-2015(1) United States Treasury Bill 0.000% 10-Dec-2015 United States Treasury Bill 0.000% 28-Apr-2016 United States Treasury Bill 0.000% 23-Jun-2016 29,760,706 2,044,414 2,043,323 3,269,589 5,000,055 5,429,082 4,992,345 6,981,898 76.63 5.26 5.26 8.42 12.87 13.98 12.86 17.98 Total value of investment in securities (2014: 83.11%) 31,283,264 80.55 Equities (continued) United States (continued) Mattel Inc McDonald's Corp MeadWestvaco Corp Merck & Co Inc Mercury General Corp Meredith Corp New Jersey Resources Corp New York Community Bancorp Inc NextEra Energy Inc NiSource Inc Northrop Grumman Corp OGE Energy Corp Old Republic International Corp Olin Corp ONEOK Inc PDL BioPharma Inc People's United Financial Inc Pfizer Inc PG&E Corp Philip Morris International Inc Pinnacle West Capital Corp Pitney Bowes Inc PPL Corp Public Service Enterprise Group Inc Questar Corp Republic Services Inc Reynolds American Inc RPM International Inc RR Donnelley & Sons Co SCANA Corp Seagate Technology PLC Sempra Energy Sonoco Products Co Staples Inc Sysco Corp Talen Energy Corp TECO Energy Inc Trustmark Corp Tupperware Brands Corp United Bankshares Inc/WV Universal Corp/VA Valley National Bancorp Waste Management Inc WEC Energy Group Inc Xcel Energy Inc 79 . PAYDEN GLOBAL FUNDS PUBLIC LIMITED COMPANY SCHEDULE OF INVESTMENTS (continued) Payden World Equity Fund (continued) As at 30 June 2015 Holding 51 2 4 64 Name of securities Futures contracts (2014: 2.49%) EURO STOXX 50® Index (EUREX) Future Exp 18-Sep-2015 FTSE/MIB Index (IDEM) Future Exp 18-Sep-2015 Mini MSCI Emgerging Market (9N) Future Exp 30-Jul-2015 MSCI Emerging (ICE US) Future Exp 18-Sep-2015 Fair value USD Notional (USD) Broker 15,549 0.04 1,946,841 Goldman Sachs 5,638 0.01 248,801 Goldman Sachs 2,707 0.01 216,740 Goldman Sachs 4,159 0.01 3,067,035 Goldman Sachs 3,045 0.01 312,251 0.80 31,611,064 81.39 Unrealised gain on forward foreign exchange contracts (Appendix) (2014: 1.11%) Financial assets at fair value through profit or loss 4 23 3 3 22 14 22 16 118 13 4 9 14 32 (476,149) (1.22) 421,112 Goldman Sachs (345) 0.00 119,654 Goldman Sachs (173) 0.00 1,126,763 Goldman Sachs (6,808) (0.02) 1,234,158 Goldman Sachs (8,371) (0.02) 2,412,026 Goldman Sachs (63,010) (0.16) 514,827 Goldman Sachs (7,820) (0.02) 361,335 Goldman Sachs (1,173) 0.00 1,959,804 Goldman Sachs (28,094) (0.07) 101,288 Goldman Sachs (78) 0.00 418,426 Goldman Sachs (9,646) (0.03) 2,025,315 Goldman Sachs (24,675) (0.06) 12,331,800 Goldman Sachs (210,840) (0.54) 1,994,205 Goldman Sachs (46,675) (0.12) 549,683 Goldman Sachs (8,917) (0.02) 955,888 Goldman Sachs (22,558) (0.06) 1,335,841 Goldman Sachs (18,908) (0.05) 4,282,023 Goldman Sachs (18,058) (0.05) (157,766) (0.41) (633,915) (1.63) Net current assets 21 Broker Financial liabilities at fair value through profit or loss 3 Notional (USD) Unrealised loss on forward foreign exchange contracts (Appendix) (2014: (1.46%)) 4 Futures contracts (2014: (0.17%)) Amsterdam Index (E'NEXT) Future Exp 17-Jul-2015 BEL20 Index (E'NEXT) Future Exp 17-Jul-2015 CAC40 10 Euro (E'NEXT) Future Exp 17-Jul-2015 Dax Index (EUREX) Future Exp 18-Sep-2015 FTSE 100 Index (LIFFE) Future Exp 18-Sep-2015 Hang Seng Index (HKEX) Future Exp 30-Jul-2015 IBEX 35 Index (MEFF) Future Exp 17-Jul-2015 NASDAQ 100 E-Mini (CME) Future Exp 18-Sep-2015 OBX Index (EDX) Future Exp 16-Jul-2015 OMXS30 Index (NASDAQ OMX) Future Exp 17-Jul-2015 Russell 2000 Mini (ICE US) Future Exp 18-Sep-2015 S&P 500 Emini (CME) Future Exp 18-Sep-2015 S&P Mid 400 Emini (CME) Future Exp 18-Sep-2015 S&P/TSX 60 Index (MX) Future Exp 17-Sep-2015 SPI 200 (ASX) Future Exp 17-Sep-2015 Swiss Market Index (EUREX) Future Exp 18-Sep-2015 Topix Index (OSE) Future Exp 10-Sep-2015 % of net assets 7,860,019 20.24 38,837,168 100.00 Total net assets (1) The nominal value of 1,995,000 is held as collateral with Goldman Sachs for open future contracts. 80 . PAYDEN GLOBAL FUNDS PUBLIC LIMITED COMPANY SCHEDULE OF INVESTMENTS (continued) Payden World Equity Fund (continued) As at 30 June 2015 Appendix: forward foreign currency contracts Unrealised gain on forward foreign currency contracts Currency Purchase Counter Party Payden World Equity Fund Royal Bank of Scotland EUR Royal Bank of Scotland USD Royal Bank of Scotland GBP HSBC Securities USD Credit Suisse USD Credit Suisse USD Credit Suisse JPY Credit Suisse USD UBS USD UBS USD Barclays INR Barclays INR Barclays USD Barclays USD Royal Bank of Scotland CHF Royal Bank of Scotland USD Chase Manhattan Bank DKK Royal Bank of Canada EUR Royal Bank of Canada USD HSBC Securities GBP HSBC Securities USD Royal Bank of Scotland JPY Royal Bank of Scotland USD Chase Manhattan Bank SEK Royal Bank of Canada USD Royal Bank of Canada USD Purchase Amount Currency Sale Sale Amount Maturity date Unrealised Gain/Loss USD 945,000 1,072,225 680,000 116,355 1,006,211 163,951 120,200,000 998,712 1,013,744 176,871 43,030,000 7,190,000 508,423 80,176 1,055,000 55,684 1,206,000 3,213,000 231,531 1,578,000 134,487 59,722,000 4,845,874 2,987,000 1,013,562 141,649 USD EUR USD EUR AUD AUD USD JPY EUR EUR USD USD SGD SGD USD CHF USD USD EUR USD GBP USD JPY USD CAD CAD (1,010,762) (945,000) (1,036,701) (102,000) (1,298,000) (210,000) (967,323) (120,200,000) (902,000) (155,000) (657,850) (111,715) (680,000) (107,000) (1,123,392) (51,000) (179,031) (3,544,517) (203,000) (2,441,213) (85,000) (486,561) (587,979,000) (357,579) (1,263,000) (173,000) 17-Jul-2015 17-Jul-2015 17-Jul-2015 23-Jul-2015 31-Jul-2015 31-Jul-2015 31-Jul-2015 31-Jul-2015 17-Aug-2015 17-Aug-2015 17-Aug-2015 17-Aug-2015 20-Aug-2015 20-Aug-2015 28-Aug-2015 28-Aug-2015 28-Aug-2015 28-Aug-2015 28-Aug-2015 28-Aug-2015 28-Aug-2015 28-Aug-2015 28-Aug-2015 28-Aug-2015 14-Sep-2015 14-Sep-2015 42,369 19,095 32,623 2,675 10,293 2,824 15,338 16,052 8,089 4,058 11,577 141 3,794 772 8,031 989 1,402 38,285 5,166 39,474 863 1,831 37,521 2,843 2,929 3,217 312,251 Unrealised loss on forward foreign currency contracts Currency Purchase Counter Party Payden World Equity Fund Royal Bank of Scotland USD HSBC Securities EUR HSBC Securities USD UBS EUR HSBC Securities PHP HSBC Securities PHP Royal Bank of Scotland AUD BNP Paribas AUD Royal Bank of Canada CAD Royal Bank of Canada CAD BNP Paribas CHF Chase Manhattan Bank DKK Royal Bank of Canada EUR HSBC Securities GBP Credit Suisse HKD Credit Suisse HKD Chase Manhattan Bank NOK Chase Manhattan Bank NOK Chase Manhattan Bank SEK Chase Manhattan Bank SGD Chase Manhattan Bank SGD Purchase Amount Currency Sale Sale Amount Maturity date Unrealised Gain/Loss USD 1,008,620 40,000 675,835 20,000 3,820,000 22,730,000 1,019,000 189,000 1,393,000 252,000 186,000 232,000 555,000 278,000 3,217,000 649,000 641,000 133,000 527,000 237,000 46,000 GBP USD EUR USD USD USD USD USD USD USD USD USD USD USD USD USD USD USD USD USD USD (680,000) (44,961) (629,000) (22,489) (84,804) (508,160) (794,321) (147,550) (1,130,086) (206,511) (202,685) (35,521) (633,760) (441,424) (414,979) (83,710) (83,812) (17,109) (65,032) (177,184) (34,512) 17-Jul-2015 23-Jul-2015 23-Jul-2015 17-Aug-2015 20-Aug-2015 20-Aug-2015 28-Aug-2015 28-Aug-2015 28-Aug-2015 28-Aug-2015 28-Aug-2015 28-Aug-2015 28-Aug-2015 28-Aug-2015 28-Aug-2015 28-Aug-2015 28-Aug-2015 28-Aug-2015 28-Aug-2015 28-Aug-2015 28-Aug-2015 (60,703) (380) (25,196) (191) (318) (5,443) (13,615) (2,748) (15,182) (4,820) (3,211) (811) (14,882) (4,395) (47) (1) (2,448) (227) (1,442) (1,327) (379) (157,766) 81 . PAYDEN GLOBAL FUNDS PUBLIC LIMITED COMPANY SCHEDULE OF INVESTMENTS (continued) Payden World Equity Fund (continued) As at 30 June 2015 Portfolio Analysis % of total assets Transferable securities and money market instruments admitted to an official stock exchange listing or traded on a regulated market Financial derivative instruments dealt in on a regulated market OTC financial derivative instruments Analysis as a percentage of total assets rather than net assets is required under the UCITS Notice 8.5 appendix A 82 79.11 (1.16) 0.39 78.34 . PAYDEN GLOBAL FUNDS PUBLIC LIMITED COMPANY CONDENSED PROFIT AND LOSS ACCOUNT FOR THE PERIOD ENDED 30 JUNE 2015 0.04 0.01 Notes Bank interest income Dividend income Income on debt securities Other income Net gains / (losses) on financial assets and liabilities at fair value through profit or loss Total investment income / (loss) Custodian fees Administration fees Investment manager fees Directors’ fees Interest on swaps Investment interest expense Other expenses Rebate due from the Investment Manager Operating expenses Net income / (loss) Finance costs Distributions to holders of redeemable participating shares 7 Profit / (loss) before tax for the financial period Withholding taxes on dividends & other investment income Increase / (Decrease) in net assets from operations attributable to holders of redeemable participating shares (1) Payden Absolute Return Bond Fund (USD) 319 – 1,069,849 3,124 299,227 1,372,519 (7,175) (44,300) (233,218) (2,206) (345) (158) (38,777) 56,835 (269,344) 1,103,175 0.02 Payden Euro Liquidity Fund (EUR) – – 137,681 – 37,163 174,844 (12,513) (22,760) (34,927) (2,295) – – (15,957) 31,872 (56,580) 118,264 0.03 Payden Global Bond Fund(1) (USD) 353 – 3,428,179 26 (10,760,426) (7,331,868) (31,635) (59,431) (356,251) (3,066) – – (40,884) 57,718 (433,549) (7,765,417) Payden Payden Global Global Emerging Emerging Markets Markets Bond Corporate Fund Bond Fund (USD) (USD) 459 233 – – 3,794,995 1,284,642 – – (6,814,374) 683,367 (3,018,920) 1,968,242 (25,015) (7,282) (70,094) (20,476) (302,519) (203,281) (2,206) (2,206) (36,961) – – – (25,810) (14,815) – 29,897 (462,605) (218,163) (3,481,525) 1,750,079 0.05 – – 1,103,175 (1,238) (2,700) (2,700) 115,564 5,208 – – (7,765,417) (11,580) (1,097,620) (1,097,620) (4,579,145) 6,189 (867,857) (867,857) 882,222 (6,224) 1,101,937 120,772 (7,776,997) (4,572,956) 875,998 This Fund changed name from Payden International Bond Fund on 24 March 2015. All gains and losses have been recognised in the Profit and Loss Account and arise from continuing operations. The accompanying notes form an integral part of the financial statements. 83 . PAYDEN GLOBAL FUNDS PUBLIC LIMITED COMPANY CONDENSED PROFIT AND LOSS ACCOUNT (continued) FOR THE PERIOD ENDED 30 JUNE 2015 (continued) Payden Payden Sterling Corporate Global Short Bond Fund Bond Fund(2) Investment Grade (USD) (GBP) 88 64 – – 842,543 332,132 2,660 – (2,252,775) (329,512) (1,407,484) 2,684 (10,585) (3,026) (46,059) (4,679) (133,789) (44,086) – (1,595) – – – – (24,901) (10,000) 53,112 12,199 (162,222) (51,187) (1,569,706) (48,503) 0.11 Payden Payden Payden Global Government Global High Yield Global Inflation Notes Bond Index Fund Bond Fund Linked Bond Fund (USD) (USD) (USD) 106 594 76 – – – 1,100,155 2,562,530 251,465 – – 51 779,412 (635,438) (124,413) 1,879,673 1,927,686 127,179 (17,700) (7,798) (9,608) (43,776) (45,878) (31,262) (96,135) (256,460) (138,438) (2,206) (2,206) (2,206) – – – – – – (16,567) (22,331) (14,574) 48,030 15,574 31,133 (128,354) (319,099) (164,955) 1,751,319 1,608,587 (37,776) 0.07 Bank interest income Dividend income Income on debt securities Other income Net gains / (losses) on financial assets and liabilities at fair value through profit or loss Total investment income / (loss) Custodian fees Administration fees Investment manager fees Directors’ fees Interest on swaps Investment interest expense Other expenses Rebate due from the Investment Manager Operating expenses Net income / (loss) Finance costs Distributions to holders of redeemable participating shares 7 Profit / (loss) before tax for the financial period Withholding taxes on dividends & other investment income Increase / (Decrease) in net assets from operations attributable to holders of redeemable participating shares (2) 0.08 0.09 0.10 (281,771) (281,771) 1,469,548 (2,110) – – 1,608,587 (11,698) (129,986) (129,986) (167,762) – – – (1,569,706) (1,851) – – (48,503) (83) 1,467,438 1,596,889 (167,762) (1,571,557) (48,586) This Fund changed name from Payden International Short Bond Fund on 24 March 2015. All gains and losses have been recognised in the Profit and Loss Account and arise from continuing operations. The accompanying notes form an integral part of the financial statements. 84 . PAYDEN GLOBAL FUNDS PUBLIC LIMITED COMPANY CONDENSED PROFIT AND LOSS ACCOUNT (continued) FOR THE PERIOD ENDED 30 JUNE 2015 (continued) 0.13 Notes Bank interest income Dividend income Income on debt securities Other income Net gains / (losses) on financial assets and liabilities at fair value through profit or loss Total investment income Custodian fees Administration fees Investment manager fees Directors’ fees Interest on swaps Investment interest expense Other expenses Rebate due from the Investment Manager Operating expenses Net income Finance costs Distributions to holders of redeemable participating shares 7 Profit / (loss) before tax for the financial period Withholding taxes on dividends & other investment income Increase / (Decrease) in net assets from operations attributable to holders of redeemable participating shares Payden Sterling Reserve Fund (GBP) 586 – 1,458,295 – (503,849) 955,032 (46,790) (43,763) (190,604) (1,596) – – (15,947) 53,614 (245,086) 709,946 0.14 Payden US Core Bond Fund (USD) 52 – 238,803 4 (159,139) 79,720 (1,788) (17,944) (31,368) (3,435) (2,455) – (18,038) 23,089 (51,939) 27,781 0.15 Payden Payden US Dollar USD Low Duration Liquidity Fund Credit Fund (USD) (USD) 54 828 – – 58,914 3,208,940 4 3 29,117 3,714,758 88,089 6,924,529 (1,454) (11,106) (29,367) (46,051) (9,467) (326,149) (2,206) (2,206) – – – – (15,903) (45,967) 43,249 20,052 (15,148) (411,427) 72,941 6,513,102 0.16 0.17 Payden World Equity Fund (USD) 171 27,795 7,873 18 1,073,974 1,109,831 (3,295) (12,289) (98,977) (2,206) – – (24,775) 11,075 (130,467) 979,364 0.18 Total Company (USD) 4,324 27,795 20,730,972 5,890 (15,395,195) 5,373,786 (224,320) (566,148) (2,582,675) (33,779) (39,761) (158) (360,691) 525,626 (3,281,906) 2,091,880 (717,823) (717,823) (7,877) 2,478 (412,415) (412,415) (384,634) (378) (30,062) (30,062) 42,879 27 – – 6,513,102 (24,346) – – 979,364 (8,079) (3,916,615) (3,916,615) (1,824,735) (51,826) (5,399) (385,012) 42,906 6,488,756 971,285 (1,876,561) All gains and losses have been recognised in the Profit and Loss Account and arise from continuing operations. The accompanying notes form an integral part of the financial statements. 85 . PAYDEN GLOBAL FUNDS PUBLIC LIMITED COMPANY CONDENSED PROFIT AND LOSS ACCOUNT (continued) FOR THE PERIOD ENDED 30 JUNE 2014* 0.03 0.01 Notes Bank interest income Dividend income Income on debt securities Interest on swaps Other income Net gains/(losses) on financial assets and liabilities at fair value through profit or loss Total investment income/(loss) Custodian fees Administration fees Investment manager fees Directors’ fees Interest on swaps Other expenses Rebate due from the Investment Manager Operating expenses Net income/(loss) Finance costs Distributions to holders of redeemable participating shares Payden Absolute Return Bond Fund (USD) 39 – 679,433 – 23,559 1,816,983 2,520,014 (1,471) (11,241) (150,829) (3,088) (750) (86,415) 41,393 (212,401) 0.02 Payden Euro Liquidity Fund(1) (EUR) 12 – 58,608 – 4,735 56,714 120,069 (2,129) (16,035) (9,434) (3,136) – (35,657) 46,239 (20,152) Payden Payden Global Global Emerging Emerging Markets Markets Bond Corporate Fund Bond Fund (USD) (USD) – 77 10 10 5,874,364 1,123,738 – – 206,607 24,642 7,903,609 2,025,327 13,984,590 3,173,794 (61,478) (4,581) (107,490) (3,705) (468,176) (189,050) (4,183) (4,183) – (9,084) (234,690) (53,889) 71,616 45,417 (804,401) (219,075) 0.04 0.05 Payden Global Emerging Payden Global Markets Local Government Bond Bond Fund Index Fund (USD) (USD) 56 122 – 6 434,689 1,129,291 55 – 1,520,036 93,898 (1,561,250) 4,643,143 393,586 5,866,460 (23,442) (35,338) (31,114) (59,927) (52,111) (87,650) (4,183) (4,183) – – (42,391) (44,139) 85,651 113,101 (67,590) (118,136) 0.06 2,307,613 7 Profit/(loss) before tax for the financial year Withholding taxes on dividends & other investment income Increase/(Decrease) in net assets from operations attributable to holders of redeemable participating shares 99,917 13,180,189 2,954,719 325,996 5,748,324 – – 2,307,613 (10,541) (362) (362) 99,555 (2,166) (1,209,704) (1,209,704) 11,970,485 (120,144) (759,727) (759,727) 2,194,992 (15,883) – – 325,996 (6,233) (336,689) (336,689) 5,411,635 (12,426) 2,297,072 97,389 11,850,341 2,179,109 319,763 5,399,209 This Fund changed name from Payden Euro Liquidity – Enhanced Cash Fund on 1 April 2014. * Prior figures have been restated to comply with recent updates to accounting standards. (1) All gains and losses have been recognised in the Profit and Loss Account and arise from continuing operations. The accompanying notes form an integral part of the financial statements. 86 . PAYDEN GLOBAL FUNDS PUBLIC LIMITED COMPANY CONDENSED PROFIT AND LOSS ACCOUNT (continued) FOR THE PERIOD ENDED 30 JUNE 2014* (continued) Payden Payden Payden Sterling Corporate International International Short Bond Fund Bond Fund Bond Fund Investment Grade (USD) (USD) (GBP) 176 59 30 – 788 – 3,372,912 567,283 333,977 – – – 99,453 13,666 289,172 5,134,724 (135,903) (124,901) 8,607,265 445,893 498,278 (82,864) (16,334) (9,929) (100,334) (28,324) 1,426 (351,871) (74,213) (41,458) (4,224) (6,367) (2,535) (6,806) – – (48,544) (54,312) (22,592) 174,263 88,104 26,115 (420,380) (91,446) (48,973) 0.11 Payden Payden Global High Yield Global Inflation Bond Fund Linked Bond Fund (USD) (USD) 111 46 10 6 2,413,875 1,533,772 – – 30,921 200,673 2,601,802 4,114,499 5,046,719 5,848,996 (21,382) (23,012) (40,228) (48,232) (236,410) (147,898) (3,033) (4,183) – – (52,292) (43,683) 52,429 89,999 (300,916) (177,009) 0.07 Notes Bank interest income Dividend income Income on debt securities Interest on swaps Other income Net gains/(losses) on financial assets and liabilities at fair value through profit or loss Total investment income/(loss) Custodian fees Administration fees Investment manager fees Directors’ fees Interest on swaps Other expenses Rebate due from the Investment Manager Operating expenses Net income/(loss) Finance costs Distributions to holders of redeemable participating shares 0.08 0.09 0.1 0.12 Payden Sterling Liquidity Fund(2) (GBP) 11 – 26,240 – 115 5,755 32,121 (718) (1,748) (2,713) (2,471) – (7,048) 10,325 (4,373) 4,745,803 7 Profit/(loss) before tax for the financial year Withholding taxes on dividends & other investment income Increase/(Decrease) in net assets from operations attributable to holders of redeemable participating shares 5,671,987 8,186,885 354,447 449,305 27,748 – – 4,745,803 (2,518) (252,398) (252,398) 5,419,589 – – – 8,186,885 (37,483) – – 354,447 (4,590) – – 449,305 (1,218) (10,771) (10,771) 16,977 (75) 4,743,285 5,419,589 8,149,402 349,857 448,087 16,902 This Fund changed name from Payden Sterling Liquidity – Enhanced Cash Fund on 1 April 2014 and subsequently terminated on 25 June 2014. This Fund has since been revoked with the Central Bank of Ireland. * Prior figures have been restated to comply with recent updates to accounting standards. (2) All gains and losses have been recognised in the Profit and Loss Account and arise from continuing operations. The accompanying notes form an integral part of the financial statements. 87 . PAYDEN GLOBAL FUNDS PUBLIC LIMITED COMPANY CONDENSED PROFIT AND LOSS ACCOUNT (continued) FOR THE PERIOD ENDED 30 JUNE 2014* (continued) Payden US Dollar Liquidity Fund(3) (USD) 4 – 9,532 – 1,293 4,359 15,188 (1,915) (11,283) (2,637) (4,323) – (40,562) 55,160 (5,560) Payden USD Low Duration Credit Fund (USD) 426 – 3,864,684 – 63,981 5,969,147 9,898,238 (58,625) (74,974) (441,030) (3,570) – (13,804) – (592,003) 0.16 0.13 Notes Bank interest income Dividend income Income on debt securities Interest on swaps Other income Net gains/(losses) on financial assets and liabilities at fair value through profit or loss Total investment income/(loss) Custodian fees Administration fees Investment manager fees Directors’ fees Interest on swaps Other expenses Rebate due from/(to) the Investment Manager Operating expenses Net income/(loss) Finance costs Distributions to holders of redeemable participating shares Payden Sterling Reserve Fund (GBP) 520 – 1,564,179 – 9,340 80,975 1,655,014 (57,961) (32,396) (213,917) (2,601) – (43,203) 66,346 (283,732) 0.14 Payden US Core Bond Fund (USD) 19 6 347,483 – 2,767 712,654 1,062,929 (10,664) (25,564) (41,398) (3,187) (12,992) (47,943) 58,033 (83,715) 0.15 0.17 Payden World Equity Fund (USD) 58 14,072 13,828 – 2,077 1,516,709 1,546,744 (8,424) (26,001) (90,785) (2,778) – (43,135) 52,654 (118,469) 0.18 Total Company (USD) 1,193 14,908 21,364,884 55 2,283,573 34,745,803 58,410,416 (349,530) (568,417) (2,334,058) (51,485) (29,632) (805,799) 927,820 (3,211,101) 1,371,282 7 Profit/(loss) before tax for the financial year Withholding taxes on dividends & other investment income Increase/(Decrease) in net assets from operations attributable to holders of redeemable participating shares 979,214 9,628 9,306,235 1,428,275 55,199,315 (641,623) (641,623) 729,659 (13,233) (524,950) (524,950) 454,264 (667) (547) (547) 9,081 (21) – – 9,306,235 (21,259) – – 1,428,275 (4,174) (3,084,015) (3,084,015) 52,115,300 (235,939) 716,426 453,597 9,060 9,284,976 1,424,101 51,879,361 This Fund changed name from Payden US Dollar Liquidity – Enhanced Cash Fund on 1 April 2014. * Prior figures have been restated to comply with recent updates to accounting standards. (3) All gains and losses have been recognised in the Profit and Loss Account and arise from continuing operations. The accompanying notes form an integral part of the financial statements. 88 . PAYDEN GLOBAL FUNDS PUBLIC LIMITED COMPANY CONDENSED BALANCE SHEET AS AT 30 JUNE 2015 Payden Global Bond Fund(1) (USD) Payden Global Emerging Markets Bond Fund (USD) Payden Global Emerging Markets Corporate Bond Fund (USD) 0.04 0.01 Notes Current assets Financial assets at fair value through profit or loss Cash at bank Cash collateral Margin on derivative contracts Interest/dividends receivable Receivable for investments sold Receivable for subscriptions Rebate receivable from the Investment Manager Other receivables Total assets Current liabilities Financial liabilities at fair value through profit or loss Margin on derivative contracts Payable for investments purchased Payable for distributions Payable for redemptions Management fee payable Administration fee payable Custodian fee payable Directors fee payable Audit fee payable Other payables Total liabilities Net assets attributable to holders of redeemable participating shares at trading valuation (1) Payden Absolute Return Bond Fund (USD) 0.02 Payden Euro Liquidity Fund (EUR) 0.03 0.05 6 93,123,749 4,722,512 265,000 – 477,911 2,637,312 – 29,344 8,593 101,264,421 86,441,802 1,240,912 – – 289,342 – – 20,442 – 87,992,498 210,990,414 7,153,302 – 15,902 1,758,739 3,244,515 – 22,845 52,658 223,238,375 106,521,441 851,309 653,000 – 1,927,973 1,804,542 – – – 111,758,265 49,066,884 269,018 – – 685,042 468,487 – 9,362 – 50,498,793 6 (125,426) (63,086) (6,918,617) – – (120,493) (14,107) (3,393) (3,278) (3,141) (10,268) (7,261,809) – – (1,002,160) (2,700) – (19,073) (6,844) (3,709) (2,975) (2,851) (8,526) (1,048,838) (2,373,386) – (3,210,719) – (88,640) (173,376) (20,849) (11,928) (2,908) (3,141) (11,297) (5,896,244) (80,544) – (1,205,349) (575,648) – (144,190) (24,776) (8,163) (3,277) (3,141) (11,335) (2,056,423) (300) – (247,728) (432,385) – (102,736) (8,539) (2,730) (3,277) (3,141) (8,172) (809,008) 94,002,612 86,943,660 217,342,131 109,701,842 49,689,785 This Fund changed name from Payden International Bond Fund on 24 March 2015. The accompanying notes form an integral part of the financial statements. 89 . PAYDEN GLOBAL FUNDS PUBLIC LIMITED COMPANY CONDENSED BALANCE SHEET (continued) AS AT 30 JUNE 2015 (continued) Payden Global Short Bond Fund(2) (USD) Payden Sterling Corporate Bond Fund Investment Grade (GBP) 0.11 Payden Global Government Bond Index Fund (USD) 0.07 Notes Current assets Financial assets at fair value through profit or loss Cash at bank Cash collateral Margin on derivative contracts Interest/dividends receivable Receivable for investments sold Receivable for subscriptions Rebate receivable from the Investment Manager Other receivables Total assets Current liabilities Financial liabilities at fair value through profit or loss Margin on derivative contracts Payable for investments purchased Payable for distributions Payable for redemptions Management fee payable Administration fee payable Custodian fee payable Directors fee payable Audit fee payable Other payables Total liabilities Net assets attributable to holders of redeemable participating shares at trading valuation (2) Payden Global High Yield Bond Fund (USD) Payden Global Inflation Linked Bond Fund (USD) 0.08 0.09 0.10 6 126,200,614 2,712,306 – – 1,224,388 – – 20,808 – 130,158,116 73,469,479 1,267,773 40,000 – 1,112,665 1,430,602 – 4,000 7,577 77,332,096 72,983,068 528,219 – – 312,353 – – 11,950 – 73,835,590 185,370,083 4,141,536 – – 851,420 209,970 – 23,281 958 190,597,248 17,179,910 70,123 30,000 15,840 315,362 – – 4,615 – 17,615,850 6 (1,534,164) – – (141,813) – (48,296) (14,716) (6,710) (3,277) (3,141) (8,478) (1,760,595) (105,680) (38) (600,000) – – (132,724) (16,808) (3,586) (3,278) (3,141) (7,037) (872,292) (962,639) (3,443) – (67,535) – (65,400) (10,158) (3,583) (3,277) (3,141) (8,113) (1,127,289) (1,704,370) – (3,723,354) – – (79,979) (17,534) (5,864) (3,277) (3,141) (9,657) (5,547,176) (9,240) – – – – (22,133) (1,465) (993) (2,149) (2,059) (6,598) (44,637) 128,397,521 76,459,804 72,708,301 185,050,072 17,571,213 This Fund changed name from Payden International Short Bond Fund on 24 March 2015. The accompanying notes form an integral part of the financial statements. 90 . PAYDEN GLOBAL FUNDS PUBLIC LIMITED COMPANY CONDENSED BALANCE SHEET (continued) AS AT 30 JUNE 2015 (continued) 0.13 Notes Current assets Financial assets at fair value through profit or loss Cash at bank Cash collateral Margin on derivative contracts Interest/dividends receivable Receivable for investments sold Receivable for subscriptions Rebate receivable from the Investment Manager Other receivables Total assets Current liabilities Financial liabilities at fair value through profit or loss Margin on derivative contracts Payable for investments purchased Payable for distributions Payable for redemptions Management fee payable Administration fee payable Custodian fee payable Directors fee payable Audit fee payable Other payables Total liabilities Net assets attributable to holders of redeemable participating shares at trading valuation Payden Sterling Reserve Fund (GBP) 0.14 Payden US Core Bond Fund (USD) 0.15 Payden Payden US Dollar USD Low Duration Liquidity Fund Credit Fund (USD) (USD) 0.16 0.17 Payden World Equity Fund (USD) 0.18 Total Company (USD) 6 277,406,114 2,238,959 – – 1,175,388 – – 26,809 12,240 280,859,510 17,624,801 908,765 20,000 – 98,056 670,935 – 7,714 – 19,330,271 17,977,082 252,034 – – 37,381 – 15,703 28,993 – 18,311,193 8,465,374 300,069 10,000 – 78,408 69,943 – 19,816 – 8,943,610 31,611,064 3,712,387 – 4,200,756 5,869 8,361 – 4,522 – 39,542,959 1,553,012,940 31,833,348 1,035,181 4,241,570 11,237,092 10,544,667 15,703 254,832 89,036 1,612,264,369 6 – – (1,498,849) (330,210) – (95,575) (14,903) (15,998) (2,149) (2,059) (9,448) (1,969,191) (32,337) – (2,529,045) – – (15,872) (6,469) (775) (3,277) (3,141) (5,493) (2,596,409) – – (59,962) (6,550) (112) (4,572) (7,678) (757) (3,277) (3,141) (13,750) (99,799) – (312) (319,495) – – (5,604) (6,438) (2,349) (3,277) (6,308) (33,928) (377,711) (633,915) – – – – (51,374) (4,243) (1,497) (3,278) (3,141) (8,343) (705,791) (7,567,293) (66,879) (22,288,115) (1,746,261) (88,752) (1,150,987) (185,683) (82,189) (49,032) (50,512) (170,606) (33,446,309) 278,890,319 16,733,862 18,211,394 8,565,899 38,837,168 1,578,818,060 The accompanying notes form an integral part of the financial statements. 91 . PAYDEN GLOBAL FUNDS PUBLIC LIMITED COMPANY CONDENSED BALANCE SHEET (continued) AS AT 31 DECEMBER 2014* Payden Euro Liquidity Fund(1) (EUR) Payden Global Emerging Markets Bond Fund (USD) Payden Global Emerging Markets Corporate Bond Fund (USD) 0.03 0.01 Notes Current assets Financial assets at fair value through profit or loss Cash at bank Cash collateral Margin on derivative contracts Interest/dividends receivable Receivable for investments sold Receivable for subscriptions Rebate receivable from the Investment Manager Other receivables Total assets Current liabilities Financial liabilities at fair value through profit or loss Bank overdraft Margin on derivative contracts Cash collateral payable Interest/dividends payable Payable for investments purchased Payable for redemptions Management fee payable Administration fee payable Custodian fee payable Directors fee payable Audit fee payable Other payables Total liabilities Net assets attributable to holders of redeemable participating shares at trading valuation Payden Absolute Return Bond Fund (USD) 0.02 0.04 0.05 Payden Global Emerging Payden Markets Local Global Government Bond Fund Bond Index Fund (USD) (USD) 0.06 6 74,296,934 952,196 – 51,888 457,001 11,916 – 4,161 16,597 75,790,693 56,357,884 106,512 – – 387,355 – – 1,783 – 56,853,534 135,839,133 807,312 1,040,933 – 2,440,426 207,652 – – – 140,335,456 48,278,906 548,461 – – 751,086 291,663 – 3,196 7,800 49,881,112 14,888 42,712 – – 1,110 – – – – 58,710 129,569,690 1,289,370 550,000 – 1,363,038 – – 3,881 – 132,775,979 6 (550,412) – – – – (9,790) – (17,840) (36,304) (10,413) (3,687) (5,457) (11,410) (645,313) – (140) – – – – – (2,179) (10,289) (4,269) (2,930) (4,296) (6,543) (30,646) (1,890,584) (981,736) – – – – – (58,786) (79,344) (26,404) (3,687) (5,456) (17,689) (3,063,686) (300,591) – – – – (8,768) – (64,743) (25,910) (7,905) (3,687) (5,456) (8,126) (425,186) (6,361) – – – – – – (2,527) (21,759) (2,050) (3,290) (5,517) (17,206) (58,710) (3,835,587) – – (550,000) – (1,491,739) – (7,328) (41,647) (20,142) (3,687) (5,456) (6,982) (5,962,568) 75,145,380 56,822,888 137,271,770 49,455,926 – 126,813,411 This Fund changed name from Payden Euro Liquidity – Enhanced Cash Fund on 1 April 2014. * Prior figures have been restated to comply with recent updates to accounting standards. (1) The accompanying notes form an integral part of the financial statements. 92 . PAYDEN GLOBAL FUNDS PUBLIC LIMITED COMPANY CONDENSED BALANCE SHEET (continued) AS AT 31 DECEMBER 2014* (continued) Payden Sterling Corporate Bond Fund Investment Grade (GBP) 0.11 Payden Global High Yield Bond Fund (USD) Payden Global Inflation Linked Bond Fund (USD) 6 79,003,646 1,830,489 176,000 – 1,321,574 – – 1,660 – 82,333,369 92,483,901 244,569 – – 317,926 171,027 – 2,755 – 93,220,178 252,020,721 4,180,551 – 34,572 2,355,625 684,240 – 5,182 – 259,280,891 56,452,703 282,383 – 8,838 338,247 34 – 4,618 10 57,086,833 16,988,660 280,857 30,000 – 341,987 – – 1,182 – 17,642,686 – 8,872 – – – – – – – 8,872 6 (856,316) – – – – (15,345) – (39,320) (50,447) (11,854) (3,687) (5,456) (6,087) (988,512) (489,137) – – – – – (24,008) (11,350) (29,956) (13,491) (3,687) (5,456) (5,285) (582,370) (13,187,623) – – – – (2,146,126) – (63,970) (66,438) (39,471) (2,458) (5,456) (14,028) (15,525,570) (1,153,860) – – – – – – (6,436) (37,050) (9,266) (8,553) (5,457) (9,849) (1,230,471) – – (16,140) – – – – (19,644) (7,118) (2,811) (2,278) (3,331) (4,876) (56,198) – – – – – – – – (936) (2,685) – (1,891) (3,360) (8,872) 81,344,857 92,637,808 243,755,321 55,856,362 17,586,488 - 0.07 Notes Current assets Financial assets at fair value through profit or loss Cash at bank Cash collateral Margin on derivative contracts Interest/dividends receivable Receivable for investments sold Receivable for subscriptions Rebate receivable from the Investment Manager Other receivables Total assets Current liabilities Financial liabilities at fair value through profit or loss Bank overdraft Margin on derivative contracts Cash collateral payable Interest/dividends payable Payable for investments purchased Payable for redemptions Management fee payable Administration fee payable Custodian fee payable Directors fee payable Audit fee payable Other payables Total liabilities Net assets attributable to holders of redeemable participating shares at trading valuation 0.08 0.09 Payden Payden International International Short Bond Fund Bond Fund (USD) (USD) 0.10 This Fund changed name from Payden Sterling Liquidity – Enhanced Cash Fund on 1 April 2014 and subsequently terminated on 25 June 2014. This Fund has since been revoked with the Central Bank of Ireland. * Prior figures have been restated to comply with recent updates to accounting standards. (2) The accompanying notes form an integral part of the financial statements. 93 0.12 Payden Sterling Liquidity Fund(2) (GBP) . PAYDEN GLOBAL FUNDS PUBLIC LIMITED COMPANY CONDENSED BALANCE SHEET (continued) AS AT 31 DECEMBER 2014* (continued) 0.13 Notes Current assets Financial assets at fair value through profit or loss Cash at bank Cash collateral Margin on derivative contracts Interest/dividends receivable Receivable for investments sold Receivable for subscriptions Rebate receivable from the Investment Manager Other receivables Total assets Current liabilities Financial liabilities at fair value through profit or loss Bank overdraft Margin on derivative contracts Cash collateral payable Interest/dividends payable Payable for investments purchased Payable for redemptions Management fee payable Administration fee payable Custodian fee payable Directors fee payable Audit fee payable Other payables Total liabilities Net assets attributable to holders of redeemable participating shares at trading valuation Payden Sterling Reserve Fund (GBP) 0.14 Payden US Core Bond Fund (USD) 0.15 Payden Payden US Dollar USD Low Duration Liquidity Fund(3) Credit Fund (USD) (USD) 0.16 0.17 Payden World Equity Fund (USD) 0.18 Total Company (USD) 6 280,166,477 168,492 – – 1,386,637 – – 4,227 – 281,725,833 18,837,276 131,973 – – 104,044 – – 2,406 – 19,075,699 26,800,289 235,965 – – 54,399 – 215,798 2,219 – 27,308,670 504,632,074 2,461,834 – – 4,762,131 – – – – 511,856,039 27,510,164 1,460,040 – 3,305,906 5,000 – – 1,031 – 32,282,141 1,977,275,317 15,311,221 1,813,710 3,401,204 17,435,683 1,366,532 215,798 41,701 24,407 2,016,885,573 6 – – – – – – – (15,990) (49,788) (51,722) (2,278) (3,331) (1,070) (124,179) (210,552) – – – (1,317) (1,058,584) – (2,376) (18,559) (2,673) (2,458) (5,456) (10,425) (1,312,400) – – – – – – – (1,037) (13,025) (2,842) (3,687) (5,456) (10,470) (36,517) – (1,028) – – – – – (44,222) (85,451) (73,318) (3,687) (5,457) (7,561) (220,724) (516,287) – – – – – – (7,327) (11,695) (4,576) (3,687) (5,456) (6,230) (555,258) (22,997,310) (982,934) (25,166) (550,000) (1,317) (4,730,352) (24,008) (385,461) (620,225) (318,788) (60,591) (89,527) (153,776) (30,939,455) 281,601,654 17,763,299 27,272,153 511,635,315 31,726,883 1,985,946,118 This Fund changed name from Payden US Dollar Liquidity – Enhanced Cash Fund on 1 April 2014. * Prior figures have been restated to comply with recent updates to accounting standards. (3) The accompanying notes form an integral part of the financial statements. 94 . PAYDEN GLOBAL FUNDS PUBLIC LIMITED COMPANY CONDENSED STATEMENT OF CHANGES IN NET ASSETS ATTRIBUTABLE TO HOLDERS OF REDEEMABLE PARTICIPATING SHARES FOR THE PERIOD ENDED 30 JUNE 2015 Payden Global Emerging Markets Corporate Bond Fund (USD) 0.05 Payden Payden Global Emerging Global Bond Markets Bond Fund(1) Fund (USD) (USD) 0.04 0.01 Notes Net assets attributable to holders of redeemable participating shares at beginning of period Translation adjustment Share transactions: Value of shares issued during the period Value of shares redeemed during the period Increase in net assets from operations attributable to holders of redeemable participating shares Net assets attributable to holders of redeemable participating shares at trading valuation at end of period (1) Payden Absolute Return Bond Fund (USD) 0.02 Payden Euro Liquidity Fund (EUR) 0.03 75,145,380 10 56,822,888 243,755,321 137,271,770 49,455,926 – – – – – 19,006,388 (1,251,093) 32,000,000 (2,000,000) 37,531,349 (56,167,542) 5,794,901 (28,791,873) 533,693 (1,175,832) 1,101,937 120,772 (7,776,997) (4,572,956) 875,998 94,002,612 86,943,660 217,342,131 109,701,842 49,689,785 This Fund changed name from Payden International Bond Fund on 24 March 2015. The accompanying notes form an integral part of the financial statements. 95 . PAYDEN GLOBAL FUNDS PUBLIC LIMITED COMPANY CONDENSED STATEMENT OF CHANGES IN NET ASSETS ATTRIBUTABLE TO HOLDERS OF REDEEMABLE PARTICIPATING SHARES (continued) FOR THE PERIOD ENDED 30 JUNE 2015 (continued) Payden Sterling Payden Corporate Bond Global Short Fund - Investment Bond Fund(2) Grade (USD) (GBP) 0.11 Payden Payden Global Payden Global Inflation Government Bond Global High Yield Linked Bond Notes Index Fund Bond Fund Fund (USD) (USD) (USD) 0.07 0.09 0.08 Net assets attributable to holders of redeemable participating shares at beginning of period 0.10 126,813,411 81,344,857 92,637,808 55,856,362 17,586,488 – – – – – Share transactions: Value of shares issued during the period Value of shares redeemed during the period 334,604 (217,932) 15,395,240 (21,877,182) 8,345,203 (28,106,948) 145,647,076 (14,881,809) 33,311 – Increase in net assets from operations attributable to holders of redeemable participating shares 1,467,438 1,596,889 (167,762) (1,571,557) (48,586) 128,397,521 76,459,804 72,708,301 185,050,072 17,571,213 Translation adjustment Net assets attributable to holders of redeemable participating shares at trading valuation at end of period (2) 10 This Fund changed name from Payden International Short Bond Fund on 24 March 2015. The accompanying notes form an integral part of the financial statements. 96 . PAYDEN GLOBAL FUNDS PUBLIC LIMITED COMPANY CONDENSED STATEMENT OF CHANGES IN NET ASSETS ATTRIBUTABLE TO HOLDERS OF REDEEMABLE PARTICIPATING SHARES (continued) FOR THE PERIOD ENDED 30 JUNE 2015 (continued) Payden US Dollar Liquidity Fund (USD) Payden USD Low Duration Credit Fund (USD) 0.16 0.13 Notes Net assets attributable to holders of redeemable participating shares at beginning of period Translation adjustment Share transactions: Value of shares issued during the period Value of shares redeemed during the period Increase in net assets from operations attributable to holders of redeemable participating shares Net assets attributable to holders of redeemable participating shares at trading valuation at end of period Payden Sterling Reserve Fund (GBP) Payden US Core Bond Fund (USD) 0.14 0.15 0.17 Payden World Equity Fund (USD) 0.18 Total Company (USD) 281,601,654 10 17,763,299 27,272,153 511,635,315 31,726,883 1,985,946,118 – – – – – (1,609,665) 16,535,812 (19,241,748) 1,524,799 (2,169,224) 1,071,190 (10,174,855) 138,768,383 (648,326,555) 6,200,000 (61,000) 441,114,513 (844,756,345) (5,399) (385,012) 42,906 6,488,756 971,285 (1,876,561) 278,890,319 16,733,862 18,211,394 8,565,899 38,837,168 1,578,818,060 The accompanying notes form an integral part of the financial statements. 97 . PAYDEN GLOBAL FUNDS PUBLIC LIMITED COMPANY CONDENSED STATEMENT OF CHANGES IN NET ASSETS ATTRIBUTABLE TO HOLDERS OF REDEEMABLE PARTICIPATING SHARES (continued) FOR THE PERIOD ENDED 30 JUNE 2014 Payden Global Emerging Payden Payden Markets Global Emerging Global Corporate Bond Markets Local Government Bond Fund Bond Fund Index Fund (USD) (USD) (USD) 0.04 Payden Payden Global Emerging Euro Liquidity Markets Bond Fund(1) Fund (EUR) (USD) 0.02 0.01 Notes Net assets attributable to holders of redeemable participating shares at beginning of period Translation adjustment Share transactions: Value of shares issued during the period Value of shares redeemed during the period Increase in net assets from operations attributable to holders of redeemable participating shares Net assets attributable to holders of redeemable participating shares at trading valuation at end of period 1) Payden Absolute Return Bond Fund (USD) 0.01 0.05 0.06 47,620,019 10 22,778,653 200,120,170 45,260,865 18,565,299 113,018,629 – – – – – – 15,512,427 (6,413) – (5,984,480) 8,765,911 (44,189,642) 388,964 – 12,351 (6,904,692) 6,054,571 (3,769,750) 2,297,072 97,389 11,850,341 2,179,109 319,763 5,399,209 65,423,105 16,891,562 176,546,780 47,828,938 11,992,721 120,702,659 This Fund changed name from Payden Euro Liquidity – Enhanced Cash Fund on 1 April 2014. The accompanying notes form an integral part of the financial statements. 98 . PAYDEN GLOBAL FUNDS PUBLIC LIMITED COMPANY CONDENSED STATEMENT OF CHANGES IN NET ASSETS ATTRIBUTABLE TO HOLDERS OF REDEEMABLE PARTICIPATING SHARES (continued) FOR THE PERIOD ENDED 30 JUNE 2014 (continued) Payden Sterling Payden Corporate Bond Payden International Fund - Investment Sterling Liquidity Short Bond Fund Grade Fund(2) (USD) (GBP) (GBP) 0.11 Payden Global High Yield Notes Bond Fund (USD) Payden Global Inflation Linked Bond Fund (USD) 81,440,007 93,131,933 234,002,783 41,352,911 16,376,826 5,611,318 – – – – – – 3,024,860 (7,430,236) 1,035,092 (5,515,104) 24,199,867 (27,250,451) 23,362,417 (3,601,416) 31,329 – 10,771 (5,638,991) 4,743,285 5,419,589 8,149,402 349,857 448,087 16,902 81,777,916 94,071,510 239,101,601 61,463,769 16,856,242 – 0.08 0.07 Net assets attributable to holders of redeemable participating shares at beginning of period Translation adjustment Share transactions: Value of shares issued during the period Value of shares redeemed during the period Increase in net assets from operations attributable to holders of redeemable participating shares Net assets attributable to holders of redeemable participating shares at trading valuation at end of period (2) 10 0.09 Payden International Bond Fund (USD) 0.1 0.12 This Fund changed name from Payden Sterling Liquidity – Enhanced Cash Fund on 1 April 2014 and subsequently terminated on 25 June 2014. This Fund has since been revoked with the Central Bank of Ireland. The accompanying notes form an integral part of the financial statements. 99 . PAYDEN GLOBAL FUNDS PUBLIC LIMITED COMPANY CONDENSED STATEMENT OF CHANGES IN NET ASSETS ATTRIBUTABLE TO HOLDERS OF REDEEMABLE PARTICIPATING SHARES (continued) FOR THE PERIOD ENDED 30 JUNE 2014 (continued) 0.16 0.13 Notes Net assets attributable to holders of redeemable participating shares at beginning of period Translation adjustment Share transactions: Value of shares issued during the period Value of shares redeemed during the period Increase in net assets from operations attributable to holders of redeemable participating shares Net assets attributable to holders of redeemable participating shares at trading valuation at end of period (3) Payden Sterling Reserve Fund (GBP) 0.14 Payden Payden US Core Bond US Dollar Fund Liquidity Fund(3) (USD) (USD) 0.15 Payden USD Low Duration Credit Fund (USD) 0.17 Payden World Equity Fund (USD) 0.18 Total Company (USD) 308,824,190 10 23,113,302 5,074,947 286,403,863 30,478,577 1,798,879,641 – – – – – 12,018,644 47,140,503 (41,234,580) 805,809 (43,727) 5,555,609 (903,581) 196,640,000 – 127,196 (135,000) 285,485,074 (99,750,012) 716,426 453,597 9,060 9,284,976 1,424,101 51,879,361 315,446,539 24,328,981 9,736,035 492,328,839 31,894,874 2,048,512,708 This Fund changed name from Payden US Dollar Liquidity – Enhanced Cash Fund on 1 April 2014. The accompanying notes form an integral part of the financial statements. 100 . PAYDEN GLOBAL FUNDS PUBLIC LIMITED COMPANY NOTES TO THE FINANCIAL STATEMENTS 1. ESTABLISHMENT Payden Global Funds public limited company (the “Company”) is an umbrella fund with segregated liability between its sub-funds and was incorporated as an investment company on 1 July 1999 under the laws of Ireland as Payden & Rygel Global Funds public limited company. The Company changed its name on 14 October 2005. The Company is an investment company with variable capital.
The shares of the Company are admitted to the Official List and to trading on the Main Securities Market of the Irish Stock Exchange (“ISE”) and is authorised in Ireland by the Central Bank of Ireland (the “Central Bank”) as an undertaking for collective investment in transferable securities pursuant to the European Communities (Undertakings for Collective Investment in Transferable Securities) Regulations 2011, as amended (the “Regulations”). During the period ended 30 June 2015, the Company had fifteen sub-funds (individually referred as the “Fund” and collectively as the “Funds”) in which shares were funded as follows: Payden Absolute Return Fund Payden Euro Liquidity Fund Payden Global Bond Fund(1) Payden Global Emerging Markets Bond Fund Payden Global Emerging Markets Corporate Bond Fund Payden Global Government Bond Index Fund Payden Global High Yield Bond Fund Payden Global Inflation-Linked Bond Fund Payden Global Short Bond Fund(2) Payden Sterling Corporate Bond Fund – Investment Grade Payden Sterling Reserve Fund Payden US Core Bond Fund Payden US Dollar Liquidity Fund Payden USD Low Duration Credit Fund Payden World Equity Fund (1) (2) This Fund changed name from Payden International Bond Fund on 24 March 2015. This Fund changed name from Payden International Short Bond Fund on 24 March 2015. The Payden Global Emerging Markets Local Bond Fund and the Payden Sterling Liquidity Fund terminated on 12 December 2014 and 25 June 2014 respectively and have since been revoked with the Central Bank. There is one unfunded Fund approved by the Central Bank in the Company namely Payden Global Corporate Bond Fund. The valuation date for the Funds was 30 June 2015, as this was the last dealing day of the Company in the financial period ended 30 June 2015. 2. SIGNIFICANT ACCOUNTING POLICIES The following is a summary of the significant accounting policies adopted by the Company: i) Basis of preparation and accounting convention The financial statements presented are unaudited condensed financial statements for the six month period ended 30 June 2015. The financial statements have been prepared in accordance with accounting standards generally accepted in Ireland, as issued by the Financial Reporting Council and published by the Insitute of Chartered Accountants in Ireland, Irish Statute comprising the Companies Act 2014 and the Regulations, the UCITS Regulations and the listing rules of the ISE. The financial statements are prepared under the historical cost convention as modified by the revaluation of financial assets and financial liabilities held at fair value through profit or loss. FRS 102 The financial reporting standard applicable in the UK and Republic of Ireland (“FRS 102”) is effective for accounting periods beginning on or after 1 January 2015 and replaces the accounting standards under which the financial statements of the Company were previously prepared.
These unaudited condensed financial statements have been prepared in accordance with the new standard for interim statements, FRS 104, and should be read in conjunction with the audited financial statements for the year ended 31 December 2014. FRS 104 Interim financial reporting (“FRS 104”) is effective for interim reporting periods commencing on or after 1 January 2015. These financial statements are the first financial statements to comply with FRS 104.
The transition to FRS 104 has resulted in a number of changes in accounting policies and certain reclassifications have been made to previously reported amounts to conform with current period presentation. These reclassification have had no impact on reported shareholder dealing net assets. 101 . PAYDEN GLOBAL FUNDS PUBLIC LIMITED COMPANY NOTES TO THE FINANCIAL STATEMENTS (continued) 2. SIGNIFICANT ACCOUNTING POLICIES (continued) i) Basis of preparation and accounting convention (continued) The information required to be included in the Statement of Total Recognised Gains and Losses and a Reconciliation of Movements in Shareholders Funds, is, in the opinion of the Directors contained in the Condensed Profit and Loss account and the Condensed Statement of Changes in Net Assets Attributable to Holders of Redeemable Participating Shares on pages 83 and 95, respectively. The Company has availed of the exemption available to investment funds under FRS 102 not to prepare a cash flow statement. The aggregated financial statements for the Company are denominated in US Dollar (“USD”). ii) Financial assets at fair value through profit or loss This category has two sub-categories: financial assets and liabilities held for trading, and those designated by management at fair value through profit or loss at inception. In accordance with FRS 102: “Financial Instruments: Recognition and Measurement”, all of the Company’s investments are classified as held for trading. Financial assets and liabilities held for trading are securities that were either acquired for generating a profit from short-term fluctuations in price or dealer margins, or are included in a portfolio where a pattern of short-term trading exists.
Derivatives, unless designated as effective hedging instruments, are categorised as held for trading. While positions within the portfolio will often be held with a view to long term capital gains, the Company also undertakes short term trading and, accordingly, for the purpose of FRS 102, the Directors have classified the Company’s portfolio as financial assets and liabilities held for trading. Regular-way purchases and sales of investments are recognised on trade date – the date on which the Company commits to purchase or sell the assets. Investments are initially recognised at fair value, and transaction costs for all financial assets carried at fair value through profit or loss are expensed as incurred.
Investments are subsequently re-measured at fair value at period-end. Investments are derecognised when the rights to receive cash flows from the investments have expired or the Company has transferred substantially all risks and rewards of ownership. Gains and losses arising from changes in the fair value of the “financial assets and liabilities at fair value through profit or loss” category are included in the Profit and Loss Account in the period in which they arise. The fair value of financial instruments traded in active markets (such as publicly traded derivatives, trading securities and units or shares in collective investment schemes) is based on quoted market prices at the balance sheet date.
When the Company holds derivatives with offsetting market risks it uses mid-market prices as a basis for establishing fair values for the offsetting risk positions. In order to determine the net asset value of the Company for subscriptions and redemptions, investments have been valued using mid-market price in accordance with the prospectus. The quoted market price used for financial assets and liabilities held by the Company is the current mid-market price, in accordance with IFRS 9: “Financial Instruments”.
For the audited financial statements for the year ended 31 December 2014, securities which were quoted, listed or traded on an exchange were valued for financial reporting purposes at the current bid or ask price, respectively, at the valuation point. Financial assets and liabilities at fair value through profit or loss for the year ended 31 December 2014 have been restated to reflect the changes from bid to mid price. Transaction costs for purchases and sales of equities are included in the net gains/(losses) on financial assets and liabilities at fair value through profit or loss in the Profit and Loss Account for each Fund. iii) Future contracts Initial margin deposits are made upon entering into future contracts and are generally made in cash at bank.
Future contracts are valued based upon their quoted daily settlement prices. Changes in the value of open future contracts are recognised as unrealised gains or losses on future contracts until the contracts are expired at which time realised gains and losses are recognised. Unrealised gains or losses on future contracts are included in financial assets/liabilities at fair value through profit or loss on the Balance Sheet. The initial margin receivable or payable at the reporting date is reported as an asset or liability, as applicable on the Balance Sheet.
Realised and unrealised gains or losses on future contracts are included within the net gains/(losses) on financial assets and liabilities at fair value through profit or loss in the Profit and Loss Account. Transaction costs for purchases and sales of futures are included in the net gains/(losses) on financial assets and liabilities at fair value through profit or loss in the Profit and Loss Account for each Fund. iv) Forward foreign currency contracts Forward foreign currency contracts are used primarily to protect the Company from adverse currency and interest rate movements. Contracts outstanding at the period-end are valued at their market value. The resulting gain or loss is included in net gains/(losses) on financial assets and liabilities at fair value through profit or loss in the Profit and Loss Account. 102 .
PAYDEN GLOBAL FUNDS PUBLIC LIMITED COMPANY NOTES TO THE FINANCIAL STATEMENTS (continued) 2. SIGNIFICANT ACCOUNTING POLICIES (continued) v) Options The unrealised gain or loss on open option positions is calculated and recorded as the fair value of the option less the premium paid on that option. The fair value of the options which are dealt in on a securities market are the settlement price as determined by the market. Unrealised gains or losses on open option positions are included in financial assets and liabilities at fair value through profit and loss in the Balance Sheet. The premium on purchased put options exercised is subtracted from the proceeds of the sale of the underlying security or foreign currency in determining the realised gain or loss.
The premium on purchased call options exercised is added to the cost of the securities or foreign currency purchased. Premiums paid from the purchase of options, which expire unexercised, are treated as realised losses. vi) Swaps Credit default, interest rate swaps and inflation swaps are recognised at fair value on the date on which the derivative contract is entered into and are subsequently remeasured at their fair value. The swaps are valued by the counterparty daily and verified at least weekly by a competent person appointed by the Directors (such as the Investment Manager) approved for such purpose by the Custodian and who is independent of the counterparty on the basis of their marked-to-market price. All derivatives are carried as assets when fair value is positive and as liabilities when fair value is negative. vii) Interest income and expenses Bank interest and income on debt securities are included in the Profit and Loss Account on an effective yield basis.
Income and/or expenses on debt securities are included in income on debt securities in the Profit and Loss Account and may have a negative balance. Expenses and withholding taxes are accounted for on an accrual basis. viii) Dividend policy Distributions to holders of redeemable participating shares are classified as finance costs in the Profit and Loss Account. All net investment and net realised capital gains are retained by the Company and are reflected in the net asset value of the Funds.
In the event that the Company has paid or decided to pay any dividend on behalf of a Fund, such dividend will be paid in compliance with ISE regulations and in accordance with the articles of association, i.e. out of the profits available for distribution. The distributions for the year are set out in Note 7 to the financial statements. ix) Foreign currencies Assets and liabilities denominated in foreign currencies are translated into the functional currency at the exchange rates ruling at the period end.
Transactions denominated in currencies other than the functional currency are translated into the functional currency at the exchange rates ruling at the dates of the transactions. All gains and losses arising on foreign currency translations are included in the Profit and Loss Account. A notional foreign exchange adjustment is included in the Statement of Changes in Net Assets Attributable to Holders of Redeemable Participating Shares.
The following exchange rates at the period end have been used to translate assets and liabilities in other currencies to USD: 30 June 2015 Currency Description Argentine Peso Australian Dollar Brazilian Real British Pound Canadian Dollar Chilean Peso Colombian Peso Costa Rican Colon Danish Krone Euro Ghanaian Cedi Hong Kong Dollar Hungarian Forint Indian Rupee Indonesian Rupiah Israeli Shekel Japanese Yen Korean Won ARS AUD BRL GBP CAD CLP COP CRC DKK EUR GHS HKD HUF INR IDR ILS JPY KRW 31 December 2014 1.3011 3.1064 0.6358 1.2485 2,599.6000 6.6953 0.8975 7.7526 282.9564 63.6800 13,332.5000 122.3650 1,115.4500 8.4645 1.2220 2.6582 0.6413 1.1583 606.9000 2,376.5000 539.4200 6.1538 0.8264 3.2176 7.7549 260.9397 63.1225 12,385.0000 3.9041 119.8950 1,099.1500 103 30 June 2015 Currency Description Malaysian Ringgit Mexican Peso New Zealand Dollar Nigerian Naira Norwegian Krone Peruvian Neuvo Sol Philippine Peso Polish Zloty Romanian Leu Russian Ruble Singapore Dollar South African Rand Swedish Krona Swiss Franc Thai Baht Turkish Lira Uruguayan Peso Zambian Kwacha MYR MXN NZD NGN NOK PEN PHP PLN RON RUB SGD ZAR SEK CHF THB TRY UYU ZMK 31 December 2014 3.7730 15.6907 1.4786 198.9000 7.8675 3.1776 45.0900 3.7609 4.0190 55.7149 1.3465 12.1378 8.2975 0.9346 33.7755 2.6790 - 3.4965 14.7398 1.2830 182.5100 7.4975 2.9765 44.7400 3.5520 3.7054 60.0000 1.3251 11.5688 7.8283 0.9937 32.9000 2.3378 24.3150 6,386.0000 . PAYDEN GLOBAL FUNDS PUBLIC LIMITED COMPANY NOTES TO THE FINANCIAL STATEMENTS (continued) 2. SIGNIFICANT ACCOUNTING POLICIES (continued) ix) Foreign currencies (continued) In respect of the aggregation of Funds’ financial statements, the following exchange rates against the USD were used in the preparation of the accounts: 30 June 2015 30 June 2014 Closing rate Average rate Closing rate Average rate Euro EUR 0.8975 0.8968 0.7304 0.7651 Sterling Pound GBP 0.6358 0.6565 0.5848 0.6223 x) Redeemable participating shares Redeemable participating shares are redeemable at the shareholder’s option and are classified as financial liabilities. The dividend, if any, on these redeemable participating shares is recognised in the Profit and Loss Account as finance costs. The shares can be redeemed at any time for cash equal to a proportionate share of the relevant Fund’s net asset value.
A share is carried at the redemption amount that is payable at the Balance Sheet date if the shareholder exercised its right to put the share back to the Fund. The fair value of the financial liability for the shares is the redemption amount per share, calculated as the net asset value per share less any associated duties and charges and any redemption dividend which is payable on the shares redeemed. 3. EFFICIENT PORTFOLIO MANAGEMENT The Investment Manager may invest in financial derivative instruments for investment purposes as specified in the Company’s prospectus. In addition, each Fund may utilise techniques and instruments for efficient portfolio management purposes or to protect against foreign exchange rate risks, subject to the conditions and within the limits laid down by the Central Bank.
Such techniques and instruments include, but are not limited to, futures, options, swaps, warrants, stock lending arrangements, repurchase/reverse repurchase agreements, forward foreign currency contracts and when issued and/or delayed delivery securities. Efficient portfolio management transactions relating to the assets of a Fund may be entered into with one of the following aims: a reduction of risk, a reduction of cost with no increase or a minimal increase in risk or generation of additional capital or income with no, or an acceptably low level of risk (relative to the expected return). The Company currently invests in futures, options, swaps and forward foreign currency contracts in order to hedge currency and market exposure as well as increase capital and income returns. Forward foreign currency contracts are used to hedge against anticipated future changes in exchange rates which otherwise might either adversely affect the value of the Company’s portfolio securities or adversely affect the price of securities which the Company intends to purchase at a later date. Forward foreign currency contracts are also used to take small active currency positions, where guidelines permit.
The counterparties of the forward foreign currency contracts are shown in the Schedule of Investments. During the period ended 30 June 2015 and year ended 31 December 2014, the Company has not used any stock lending arrangements. 4. TRANSACTION COSTS Transaction costs are costs incurred in connection with the purchase and sale of financial assets or liablities at fair value through profit or loss. They include such fees as commissions paid to agents, brokers or dealers. Transaction costs on equities, collective investment schemes, options and futures are included in the net gains/(losses) on financial assets and liabilities at fair value through profit or loss in the Condensed Profit and Loss Account for each Fund. Transaction costs on bonds are included in the purchase and sale price of the investment as per standard fixed income market practice.
They cannot be practically or reliabley gathered as they are embedded in the cost of investment and cannot be separately verified or disclosed. Similarly, transaction costs on the purchase and sale of forward foreign exchange contracts and swaps are included in the purchase and sale prices of the investment and cannot be separately verified or disclosed. 104 . PAYDEN GLOBAL FUNDS PUBLIC LIMITED COMPANY NOTES TO THE FINANCIAL STATEMENTS (continued) 4. TRANSACTION COSTS (continued) The custody transaction costs for the period ended 30 June 2015 and 30 June 2014 are disclosed in the Condensed Profit and Loss Account under the heading ‘Custodian fees’. 5. SHAREHOLDERS FUNDS i) Authorised Shares The authorised share capital of the Company is 500 billion shares of no par value initially designated as unclassified shares. The unclassified shares are available for issue as participating shares. The capital of the Company is equal to the net asset value of the Company. Six subscriber shares are in issue (issued for the purposes of the incorporation of the Company), one of which is held by Payden & Rygel and the remainder of which are each held by a Managing Partner of Payden & Rygel for the benefit of Payden & Rygel.
Each subscriber share gives the holder the right to vote and to one vote in relation to any matters relating to the Company which are submitted to shareholders for a vote by poll. ii) Redeemable Participating Shares Redeemable participating shares carry the right to a proportionate share in the net assets of the Funds and the holders of the shares are entitled to one vote for every share held in relation to any matters relating to the Company which are submitted to shareholders for a vote by poll. The issued redeemable participating share capital is at all times equal to the net asset value of the Company. The net asset value per share is determined by dividing the value of the net assets of each Fund for each share class by the total number of shares in issue in the relevant Fund for that share class that time. 105 . PAYDEN GLOBAL FUNDS PUBLIC LIMITED COMPANY NOTES TO THE FINANCIAL STATEMENTS (continued) 5. SHAREHOLDERS FUNDS (continued) ii) Redeemable Participating Shares (continued) At 30 June 2015, the Company had the following shares in issue: Payden Absolute Return Bond Fund Payden Euro Liquidity Fund Euro Class (Accumulating) Sterling Class (Accumulating) US Dollar Class (Accumulating) Euro Class (Accumulating) Euro Class (Distributing) (EUR) 64,327 (GBP) 2,614,120 (USD) 4,794,829 (EUR) 4,328,079 (EUR) 1,500,000 (EUR) 645,762 (GBP) 27,384,899 (USD) 50,214,874 (EUR) 71,965,188 (EUR) 14,978,472 (EUR) 10.04 (GBP) 10.48 (USD) 10.47 (EUR) 16.63 (EUR) 9.99 Euro Class (Accumulating) Norwegian Krone Class (Accumulating) Sterling Class (Accumulating) US Dollar Class (EUR) 1,355,266 (NOK) 6,747,997 (GBP) 875,618 (USD) 2,620,736 (EUR) 21,073,281 (NOK) 841,305,106 (GBP) 16,662,261 (USD) 60,723,306 (EUR) 15.55 (NOK) 124.67 (GBP) 19.03 (USD) 23.17 At trading valuation: Shares outstanding 30 June 2015 Net asset value 30 June 2015 Net asset value per share 30 June 2015 Payden Global Bond Fund* At trading valuation: Shares outstanding 30 June 2015 Net asset value 30 June 2015 Net asset value per share 30 June 2015 106 . PAYDEN GLOBAL FUNDS PUBLIC LIMITED COMPANY NOTES TO THE FINANCIAL STATEMENTS (continued) 5. SHAREHOLDERS FUNDS (continued) ii) Redeemable Participating Shares (continued) Payden Global Emerging Markets Bond Fund Euro Class (Accumulating) Euro Class (Distributing) Sterling Class (Accumulating) Sterling Class (Distributing) US Dollar Class US Dollar Class (Accumulating) US Dollar Class (Distributing) (EUR) 986,810 (EUR) 1,159,426 (GBP) 535,327 (GBP) 2,020 (USD) 985,751 (USD) 1,420 (USD) 4,618,949 (EUR) 18,204,498 (EUR) 10,167,264 (GBP) 6,616,065 (GBP) 18,146 (USD) 27,664,764 (USD) 14,226 (USD) 39,977,412 (EUR) 18.45 (EUR) 8.77 (GBP) 12.36 (GBP) 8.98 (USD) 28.06 (USD) 10.02 (USD) 8.66 At trading valuation: Shares outstanding 30 June 2015 Net asset value 30 June 2015 Net asset value per share 30 June 2015 Payden Global Emerging Markets Corporate Bond Fund Swiss Franc Class (Accumulating) US Dollar Class (Distributing) (CHF) 814,018 (USD) 4,354,324 (CHF) 8,236,535 (USD) 40,876,414 (CHF) 10.12 (USD) 9.39 At trading valuation: Shares outstanding 30 June 2015 Net asset value 30 June 2015 Net asset value per share 30 June 2015 107 . PAYDEN GLOBAL FUNDS PUBLIC LIMITED COMPANY NOTES TO THE FINANCIAL STATEMENTS (continued) 5. SHAREHOLDERS FUNDS (continued) ii) Redeemable Participating Shares (continued) Payden Global Government Bond Index Fund Norwegian Krone Class (Accumulating) Singapore Dollar Class (Distributing) Sterling Class (Accumulating) Sterling Class (Distributing) Swiss Franc Class (Accumulating) (NOK) 1,357,678 (SGD) 442,835 (GBP) 129,961 (GBP) 1,904,428 (CHF) 4,771,451 (NOK) 184,171,433 (SGD) 4,564,451 (GBP) 1,561,251 (GBP) 21,977,687 (CHF) 60,352,143 (NOK) 135.65 (SGD) 10.31 (GBP) 12.01 (GBP) 11.54 (CHF) 12.65 Canadian Dollar Class (Accumulating) Sterling Class (Accumulating) Swiss Franc Class (Accumulating) US Dollar Class (CAD) 1,952,268 (GBP) 637,072 (CHF) 845,839 (USD) 1,058,485 (CAD) 33,390,845 (GBP) 10,158,574 (CHF) 9,155,411 (USD) 23,940,976 (CAD) 17.10 (GBP) 15.95 (CHF) 10.82 (USD) 22.62 At trading valuation: Shares outstanding 30 June 2015 Net asset value 30 June 2015 Net asset value per share 30 June 2015 Payden Global High Yield Bond Fund At trading valuation: Shares outstanding 30 June 2015 Net asset value 30 June 2015 Net asset value per share 30 June 2015 108 . PAYDEN GLOBAL FUNDS PUBLIC LIMITED COMPANY NOTES TO THE FINANCIAL STATEMENTS (continued) 5. SHAREHOLDERS FUNDS (continued) ii) Redeemable Participating Shares (continued) Payden Global Inflation - Linked Bond Fund Sterling Class (Accumulating) Sterling Class Sterling Class Unhedged (Distributing) (Distributing) US Dollar Class (Accumulating) At trading valuation: Shares outstanding 30 June 2015 Net asset value per share 30 June 2015 (GBP) 1,038,599 (GBP) 1,861,153 (USD) 1,378,647 (GBP) 1,544,904 (GBP) 12,996,201 (GBP) 20,296,292 (USD) 17,919,529 (GBP) 11.85 (GBP) 12.51 (GBP) 10.91 (USD) 13.00 Norwegian Krone Class (Accumulating) Net asset value 30 June 2015 (GBP) 130,335 US Dollar Class (NOK) 10,818,167 (USD) 2,822,345 (NOK) 1,122,847,438 (USD) 42,330,347 (NOK) 103.79 (USD) 15.00 Payden Global Short Bond Fund* At trading valuation: Shares outstanding 30 June 2015 Net asset value 30 June 2015 Net asset value per share 30 June 2015 109 . PAYDEN GLOBAL FUNDS PUBLIC LIMITED COMPANY NOTES TO THE FINANCIAL STATEMENTS (continued) 5. SHAREHOLDERS FUNDS (continued) ii) Redeemable Participating Shares (continued) Payden Sterling Corporate Bond Fund - Investment Grade Payden Sterling Reserve Fund Payden US Core Bond Fund Sterling Class (Accumulating) Sterling Class (Accumulating) Sterling Class (Distributing) US Dollar Class (GBP) 1,178,487 (GBP) 11,942,322 (GBP) 15,009,544 (USD) 1,498,652 (GBP) 17,571,213 (GBP) 127,416,259 (GBP) 151,474,060 (USD) 16,733,862 (GBP) 14.91 (GBP) 10.67 (GBP) 10.09 (USD) 11.17 At trading valuation: Shares outstanding 30 June 2015 Net asset value 30 June 2015 Net asset value per share 30 June 2015 Payden US Dollar Liquidity Fund Payden USD Low Duration Credit Fund Payden World Equity Fund US Dollar Class (Accumulating) US Dollar Class (Distributing) US Dollar Class (Accumulating) US Dollar Class (Accumulating) (USD) 564,103 (USD) 682,297 (USD) 829,706 (USD) 3,185,923 (USD) 5,839,178 (USD) 12,372,216 (USD) 8,565,899 (USD) 38,837,168 (USD) 10.35 (USD) 18.13 (USD) 10.32 (USD) 12.19 At trading valuation: Shares outstanding 30 June 2015 Net asset value 30 June 2015 Net asset value per share 30 June 2015 *See Note 1. 110 . PAYDEN GLOBAL FUNDS PUBLIC LIMITED COMPANY NOTES TO THE FINANCIAL STATEMENTS (continued) 6. FAIR VALUE ESTIMATION The Company has classified fair value measurements using a fair value hierarchy. The fair value hierarchy has the following levels: i) Level A: The best evidence of fair value is a quoted price for an identical asset in an active market. Quoted in an active market in this context means quoted prices are readily and regularly available and those prices represent actual and regularly occurring market transactions on an arm’s length basis. ii) Level B: When quoted prices are unavailable, the price of a recent transaction for an identical asset provides evidence of fair value as long as there has been a significant change in economic circumstances or a significant lapse of time since the transaction took place.
If the entity can demonstrate that the last transaction price is not a good estimate of fair value (e.g. because it reflects the amount that an entity would receive or pay in a forced transaction, involuntary liquidation or distress sale), that price is adjusted. iii) Level C: If the market for the asset is not active and recent transactions of an identical asset on their own are not a good estimate of fair value, an entity estimates the fair value by using a valuation technique. The objective of using a valuation technique is to estimate what the transaction price would have been on the measurement date in an arm’s length exchange motivated by normal business considerations. The tables below provide an analysis within the fair value hierarchy of the Funds’ financial assets and liabilities measured at fair value as at 30 June 2015 and as at 31 December 2014: Payden Absolute Return Bond Fund As at 30 June 2015 Transferable securities - Bonds Unrealised gain on Forward foreign currency contracts Unrealised gain on Futures contracts Unrealised gain on Options Level A 90,315,682 – 60,856 – 90,376,538 Level B – – – – – Level C 1,258,585 1,459,190 – 29,436 2,747,211 Total (USD) 91,574,267 1,459,190 60,856 29,436 93,123,749 Unrealised loss on Forward foreign currency contracts Unrealised loss on Futures contracts – (38,871) (38,871) – – – (86,555) – (86,555) (86,555) (38,871) (125,426) As at 31 December 2014 Transferable securities - Bonds Unrealised gain on Forward foreign currency contracts Unrealised gain on Futures contracts Unrealised gain on Options Level A 72,231,138 – 10,150 – 72,241,288 Level B – – – – – Level C 1,507,599 278,843 – 39,420 1,825,862 Total (USD) 73,738,737 278,843 10,150 39,420 74,067,150 Unrealised loss on Forward foreign currency contracts Unrealised loss on Futures contracts – (87,875) (87,875) – – – (462,537) – (462,537) (462,537) (87,875) (550,412) As at 30 June 2015 Transferable securities - Bonds Level A 86,441,802 86,441,802 Level B – – Level C – – Total (EUR) 86,441,802 86,441,802 As at 31 December 2014 Transferable securities - Bonds Level A 56,317,026 56,317,026 Level B – – Level C – – Total (EUR) 56,317,026 56,317,026 Payden Euro Liquidity Fund 111 .
PAYDEN GLOBAL FUNDS PUBLIC LIMITED COMPANY NOTES TO THE FINANCIAL STATEMENTS (continued) 6. FAIR VALUE ESTIMATION (continued) Payden Global Bond Fund* As at 30 June 2015 Transferable securities - Bonds Unrealised gain on Forward foreign currency contracts Unrealised gain on Futures contracts Level A 207,661,434 – 46,789 207,708,223 Level B – – – – Level C – 3,282,191 – 3,282,191 Total (USD) 207,661,434 3,282,191 46,789 210,990,414 Unrealised loss on Forward foreign currency contracts Unrealised loss on Futures contracts – (180,950) (180,950) – – – (2,192,436) – (2,192,436) (2,192,436) (180,950) (2,373,386) As at 31 December 2014 Transferable securities - Bonds Unrealised gain on Forward foreign currency contracts Unrealised gain on Futures contracts Level A 247,419,554 – 96,084 247,515,638 Level B – – – – Level C – 4,268,182 – 4,268,182 Total (USD) 247,419,554 4,268,182 96,084 251,783,820 Unrealised loss on Forward foreign currency contracts Unrealised loss on Futures contracts Unrealised loss on Swaps – (147,695) – (147,695) – – – – (12,647,432) – (392,496) (13,039,928) (12,647,432) (147,695) (392,496) (13,187,623) As at 30 June 2015 Transferable securities - Bonds Unrealised gain on Forward foreign currency contracts Level A 104,841,407 – 104,841,407 Level B – – – Level C 704,755 975,279 1,680,034 Total (USD) 105,546,162 975,279 106,521,441 Unrealised loss on Forward foreign currency contracts – – – – (80,544) (80,544) (80,544) (80,544) As at 31 December 2014 Transferable securities - Bonds Unrealised gain on Forward foreign currency contracts Level A 133,740,791 – 133,740,791 Level B – – – Level C 1,123,841 370,220 1,494,061 Total (USD) 134,864,632 370,220 135,234,852 Unrealised loss on Forward foreign currency contracts – – – – (1,890,584) (1,890,584) (1,890,584) (1,890,584) As at 30 June 2015 Transferable securities - Bonds Unrealised gain on Forward foreign currency contracts Level A 48,971,675 – 48,971,675 Level B – – – Level C – 95,209 95,209 Total (USD) 48,971,675 95,209 49,066,884 Unrealised loss on Forward foreign currency contracts – – – – (300) (300) (300) (300) As at 31 December 2014 Transferable securities - Bonds Unrealised gain on Forward foreign currency contracts Level A 48,053,005 – 48,053,005 Level B – – – Level C – 18,433 18,433 Total (USD) 48,053,005 18,433 48,071,438 Unrealised loss on Forward foreign currency contracts – – – – (300,591) (300,591) (300,591) (300,591) Payden Global Emerging Markets Bond Fund Payden Global Emerging Markets Corporate Bond Fund 112 . PAYDEN GLOBAL FUNDS PUBLIC LIMITED COMPANY NOTES TO THE FINANCIAL STATEMENTS (continued) 6. FAIR VALUE ESTIMATION (continued) Payden Global Emerging Markets Local Bond Fund* As at 31 December 2014 Unrealised gain on Forward foreign currency contracts Level A – – Level B – – Level C 14,888 14,888 Total (USD) 14,888 14,888 Unrealised loss on Forward foreign currency contracts – – – – (6,361) (6,361) (6,361) (6,361) As at 30 June 2015 Transferable securities - Bonds Unrealised gain on Forward foreign currency contracts Level A 124,468,724 – 124,468,724 Level B – – – Level C – 1,731,890 1,731,890 Total (USD) 124,468,724 1,731,890 126,200,614 Unrealised loss on Forward foreign currency contracts – – – – (1,534,164) (1,534,164) (1,534,164) (1,534,164) As at 31 December 2014 Transferable securities - Bonds Unrealised gain on Forward foreign currency contracts Level A 127,535,937 – 127,535,937 Level B – – – Level C – 1,979,587 1,979,587 Total (USD) 127,535,937 1,979,587 129,515,524 Unrealised loss on Forward foreign currency contracts – – – – (3,835,587) (3,835,587) (3,835,587) (3,835,587) As at 30 June 2015 Transferable securities - Bonds Unrealised gain on Forward foreign currency contracts Unrealised gain on Futures contracts Level A 72,738,833 – 6,359 72,745,192 Level B – – – – Level C – 724,287 – 724,287 Total (USD) 72,738,833 724,287 6,359 73,469,479 Unrealised loss on Forward foreign currency contracts – – – – (105,680) (105,680) (105,680) (105,680) As at 31 December 2014 Transferable securities - Bonds Unrealised gain on Forward foreign currency contracts Level A 78,399,495 – 78,399,495 Level B – – – Level C – 278,291 278,291 Total (USD) 78,399,495 278,291 78,677,786 Unrealised loss on Forward foreign currency contracts – – – – (856,316) (856,316) (856,316) (856,316) As at 30 June 2015 Transferable securities - Bonds Unrealised gain on Forward foreign currency contracts Unrealised gain on Futures contracts Level A 71,815,113 – 49,444 71,864,557 Level B – – – – Level C – 1,118,511 – 1,118,511 Total (USD) 71,815,113 1,118,511 49,444 72,983,068 Unrealised loss on Forward foreign currency contracts Unrealised loss on Futures contracts – (16,450) (16,450) – – – (946,189) – (946,189) (946,189) (16,450) (962,639) Payden Global Government Bond Index Fund Payden Global High Yield Bond Fund Payden Global Inflation - Linked Bond Fund 113 . PAYDEN GLOBAL FUNDS PUBLIC LIMITED COMPANY NOTES TO THE FINANCIAL STATEMENTS (continued) 6. FAIR VALUE ESTIMATION (continued) Payden Global Inflation - Linked Bond Fund (continued) As at 31 December 2014 Transferable securities - Bonds Unrealised gain on Forward foreign currency contracts Level A 91,714,632 – 91,714,632 Level B – – – Level C – 628,455 628,455 Total (USD) 91,714,632 628,455 92,343,087 Unrealised loss on Forward foreign currency contracts Unrealised loss on Swaps – – – – – – (320,924) (168,213) (489,137) (320,924) (168,213) (489,137) As at 30 June 2015 Transferable securities - Bonds Unrealised gain on Forward foreign currency contracts Unrealised gain on Futures contracts Unrealised gain on Options Level A 182,239,263 – 11,675 – 182,250,938 Level B – – – – – Level C 2,075,055 1,020,034 – 24,056 3,119,145 Total (USD) 184,314,318 1,020,034 11,675 24,056 185,370,083 Unrealised loss on Forward foreign currency contracts Unrealised loss on Futures contracts – (602) (602) – – – (1,703,768) – (1,703,768) (1,703,768) (602) (1,704,370) As at 31 December 2014 Transferable securities - Bonds Unrealised gain on Forward foreign currency contracts Unrealised gain on Futures contracts Unrealised gain on Options Level A 53,770,870 – 11,913 – 53,782,783 Level B – – – – – Level C 2,044,087 570,623 – 4,609 2,619,319 Total (USD) 55,814,957 570,623 11,913 4,609 56,402,102 Unrealised loss on Forward foreign currency contracts Unrealised loss on Futures contracts – (21,144) (21,144) – – – (1,132,716) – (1,132,716) (1,132,716) (21,144) (1,153,860) Level A 17,179,910 17,179,910 Level B – – Level C – – Total (GBP) 17,179,910 17,179,910 Unrealised loss on Futures contracts (9,240) (9,240) – – – – (9,240) (9,240) As at 31 December 2014 Transferable securities - Bonds Unrealised gain on Futures contracts Level A 16,931,210 19,680 16,950,890 Level B – – – Level C – – – Total (GBP) 16,931,210 19,680 16,950,890 As at 30 June 2015 Transferable securities - Bonds Level A 277,406,114 277,406,114 Level B – – Level C – – Total (GBP) 277,406,114 277,406,114 As at 31 December 2014 Transferable securities - Bonds Level A 280,004,228 280,004,228 Level B – – Level C – – Total (GBP) 280,004,228 280,004,228 Payden Global Short Bond Fund* Payden Sterling Corporate Bond Fund - Investment Grade As at 30 June 2015 Transferable securities - Bonds Payden Sterling Reserve Fund 114 . PAYDEN GLOBAL FUNDS PUBLIC LIMITED COMPANY NOTES TO THE FINANCIAL STATEMENTS (continued) 6. FAIR VALUE ESTIMATION (continued) Payden US Core Bond Fund As at 30 June 2015 Transferable securities - Bonds Unrealised gain on Forward foreign currency contracts Unrealised gain on Futures contracts Level A 17,251,538 – 2,391 17,253,929 Level B – – – – Level C 322,092 48,780 – 370,872 Total (USD) 17,573,630 48,780 2,391 17,624,801 Unrealised loss on Forward foreign currency contracts Unrealised loss on Futures contracts – (3,047) (3,047) – – – (29,290) – (29,290) (29,290) (3,047) (32,337) As at 31 December 2014 Transferable securities - Bonds Unrealised gain on Forward foreign currency contracts Level A 18,394,786 – 18,394,786 Level B – – – Level C 316,689 101,916 418,605 Total (USD) 18,711,475 101,916 18,813,391 Unrealised loss on Forward foreign currency contracts Unrealised loss on Swaps – – – – – – (71,806) (138,746) (210,552) (71,806) (138,746) (210,552) As at 30 June 2015 Transferable securities - Bonds Level A 17,977,082 17,977,082 Level B – – Level C – – Total (USD) 17,977,082 17,977,082 As at 31 December 2014 Transferable securities - Bonds Level A 26,793,408 26,793,408 Level B – – Level C – – Total (USD) 26,793,408 26,793,408 Level A 8,463,937 1,437 8,465,374 Level B – – – Level C – – – Total (USD) 8,463,937 1,437 8,465,374 Level A 504,027,377 504,027,377 Level B – – Level C – – Total (USD) 504,027,377 504,027,377 As at 30 June 2015 Transferable securities - Bonds Transferable securities - Equities Unrealised gain on Forward foreign currency contracts Unrealised gain on Futures contracts Level A 29,760,706 1,522,558 – 15,549 31,298,813 Level B – – – – – Level C – – 312,251 – 312,251 Total (USD) 29,760,706 1,522,558 312,251 15,549 31,611,064 Unrealised loss on Forward foreign currency contracts Unrealised loss on Futures contracts – (476,149) (476,149) – – – (157,766) – (157,766) (157,766) (476,149) (633,915) Payden US Dollar Liquidity Fund Payden USD Low Duration Credit Fund As at 30 June 2015 Transferable securities - Bonds Unrealised gain on Futures contracts As at 31 December 2014 Transferable securities - Bonds Payden World Equity Fund 115 . PAYDEN GLOBAL FUNDS PUBLIC LIMITED COMPANY NOTES TO THE FINANCIAL STATEMENTS (continued) 6. FAIR VALUE ESTIMATION (continued) Payden World Equity Fund (continued) As at 31 December 2014 Transferable securities - Bonds Transferable securities - Equities Unrealised gain on Forward foreign currency contracts Unrealised gain on Futures contracts Level A 24,734,792 1,632,569 – 788,650 27,156,011 Level B – – – – – Level C – – 352,910 – 352,910 Total (USD) 24,734,792 1,632,569 352,910 788,650 27,508,921 Unrealised loss on Forward foreign currency contracts Unrealised loss on Futures contracts – (53,913) (53,913) – – – (462,374) – (462,374) (462,374) (53,913) (516,287) * See Note 1 7. DISTRIBUTIONS TO HOLDERS OF REDEEMABLE PARTICIPATING SHARES The Company currently pays a dividend monthly in respect of the Payden Euro Liquidity Fund - Euro Class (Distributing), Payden Global Emerging Markets Bond Fund – Sterling Class (Distributing) and Payden US Dollar Liquidity Fund – US Dollar Class (Distributing). The Company also currently pays a dividend quarterly in respect of the Payden Global Emerging Markets Bond Fund – US Dollar Class (Distributing), Payden Global Emerging Markets Corporate Bond Fund – US Dollar Class (Distributing), Payden Global Government Bond Index Fund – Singapore Dollar Class (Distributing) and Sterling Class (Distributing), Payden Global Inflation - Linked Bond Fund – Sterling Class (Distributing) and Sterling Class Unhedged (Distributing) and Payden Sterling Reserve Fund – Sterling Class (Distributing). The Company also pays a dividend annually in respect of the Payden US Core Bond Fund – US Dollar Class. However, the Directors may at their discretion alter the frequency with which a dividend is paid. In the event that a dividend is to be paid, shareholders in the Fund may, at their discretion, receive cash if they elect to do so.
The Company reserves the right to pay dividends or make other distributions in the future in respect of any of the other Funds. In the event that the Company decides to pay any dividend on behalf of a Fund, such dividend will be paid in accordance with the rules of the ISE and in accordance with the articles of association, i.e., out of profits available for distribution. The dividend is paid out of net investment income and the net amount of all realised and unrealised capital gains (less realised and unrealised losses).
Distributions recorded in the accounts include equalisation. 116 . PAYDEN GLOBAL FUNDS PUBLIC LIMITED COMPANY NOTES TO THE FINANCIAL STATEMENTS (continued) 7. DISTRIBUTIONS TO HOLDERS OF REDEEMABLE PARTICIPATING SHARES (continued) The distributions paid during the period are as follows: Fund Currency 30 June 2015 30 June 2014 Payden Euro Liquidity Fund Euro Class (Distributing) EUR 2,700 362 US Dollar Class (Distributing) USD 1,096,840 1,157,089 Sterling Class (Distributing) GBP 512 31,401 USD 867,857 759,727 Sterling Class (Distributing) GBP 168,099 192,917 Singapore Dollar Class (Distributing) SGD 34,712 37,989 Sterling Class (Distributing) GBP 32,010 51,782 Sterling Class Unhedged (Distributing) GBP 53,326 98,849 GBP – 10,771 GBP 717,823 641,623 USD 412,415 524,950 USD 30,062 547 Payden Global Emerging Markets Bond Fund Payden Global Emerging Markets Corporate Bond Fund US Dollar Class (Distributing) Payden Global Government Bond Index Fund Payden Global Inflation – Linked Bond Fund Payden Sterling Liquidity Fund* Sterling Class (Distributing) Payden Sterling Reserve Fund Sterling Class (Distributing) Payden US Core Bond Fund US Dollar Class Payden US Dollar Liquidity Fund US Dollar Class (Distributing) * See Note 1. 8. SOFT COMMISSION ARRANGEMENTS There were no soft commission arrangements affecting the Company during the period ended 30 June 2015 (30 June 2014: Nil). 9. RELATED PARTIES The Investment Manager, Administrator and Distributor are related parties under FRS 104 “Related Party Transactions”. The Directors are related parties of the Company.
Joan A. Payden, James P. Sarni and Robin Creswell are Managing Principals of Payden & Rygel.
Mark Morris is a Principal of Payden & Rygel. Joan A. Payden, Robin Creswell, James P. Sarni and Mark Morris have waived their right to receive a fee for their services as Directors. In compliance with UCITS Regulations, the Directors confirm that for the period ended 30 June 2015, all transactions carried out with connected parties were on an arm’s length basis and in the best interest of shareholders. 117 .
PAYDEN GLOBAL FUNDS PUBLIC LIMITED COMPANY NOTES TO THE FINANCIAL STATEMENTS (continued) 10. FUNCTIONAL & PRESENTATION CURRENCY Items included in the Company’s financial statements are measured using the currency of the primary economic environment in which each Fund operates (the “functional currency”). In accordance with FRS 102 ‘‘The effect of Changes in Foreign Exchange Rates’’ the functional currency of each Fund has been re-evaluated by the Directors. The functional currency of Payden Absolute Return Bond Fund, Payden Global Emerging Markets Bond Fund, Payden Global Emerging Markets Corporate Bond Fund, Payden Global Emerging Markets Local Bond Fund*, Payden Global Government Bond Index Fund, Payden Global High Yield Bond Fund, Payden Global Inflation – Linked Bond Fund, Payden Global Bond Fund*, Payden Global Short Bond Fund*, Payden US Core Bond Fund, Payden US Dollar Liquidity Fund, Payden USD Low Duration Credit Fund and Payden World Equity Fund is US Dollar (“USD”). The functional currency of Payden Sterling Corporate Bond Fund – Investment Grade, Payden Sterling Liquidity Fund* and Payden Sterling Reserve Fund is Sterling Pound (“GBP”). The functional currency of Payden Euro Liquidity Fund is Euro (“EUR”). The presentation currency is the same as the functional currency for the Funds. The presentation and functional currency of the Company is USD.
A currency adjustment arises from the re-translation of the opening net assets value at the period end exchange rates. This method of allocation has no effect on the value of net assets allocated to the individual Funds. * See Note 1. 11. SEGREGATED LIABILITY The Company avails itself of the segregated liability provisions of the investment funds, Companies and Miscellaneous Provisions Act, 2005.
As such, under Irish law the Company generally will not be liable as a whole to third parties and there generally will not be the potential for cross liability between the Funds. 12. SIGNIFICANT EVENTS DURING THE PERIOD A new prospectus was issued on 29 April 2015. The following Funds changed name during the period: - Payden International Bond Fund changed name to Payden Global Bond Fund on 24 March 2015. Payden International Short Bond Fund changed name to Payden Global Short Bond Fund on 24 March 2015. Payden Global Corporate Bond Fund – Investment Grade changed name to Payden Global Corporate Fund on 24 March 2015. A transfer in kind to a UBS account in Luxembourg of 100% of the net assets was processed on 30 March 2015 for the following sub-fund: - Payden USD Low Duration Credit Fund. On 25 March 2015, Maples and Calder replaced Arthur Cox as Legal Advisers, Sponsoring Broker and Secretary to Payden Global Funds Plc. On 25 March 2015, the Company’s registered office changed from Arthur Cox Building, Earlsfort Terrace, Dublin 2, Ireland to 2nd floor, Beaux Lane House, Mercer Street Lower, Dublin 2, Ireland. 13. SUBSEQUENT EVENTS There have been no significant events affecting the Company since the period end. 14. APPROVAL OF THE FINANCIAL STATEMENTS The financial statements were approved and authorised for issue by the Directors at the Board meeting held on 19 August 2015. 118 .
PAYDEN GLOBAL FUNDS PUBLIC LIMITED COMPANY SCHEDULE OF SIGNIFICANT PORTFOLIO MOVEMENTS The following Schedule of Significant Portfolio Movements reflects the aggregate purchases of a security exceeding one per cent of the total value of purchases and aggregate disposals greater than one per cent of the total sales for the period. At a minimum the largest 20 purchases and 20 sales must be given. Payden Absolute Return Bond Fund Purchases Holdings United States Treasury Note/Bond 1.625% 31-Dec-2019 Fannie Mae Connecticut Avenue Securities 1M1 floating rate 25-Jul-2024 Fannie Mae Connecticut Avenue Securities 2M1 floating rate 25-Jul-2024 BCAP LLC Trust 2007-AA2 6.000% 25-Apr-2037 Fannie Mae Connecticut Avenue Securities floating rate 25-May-2025 Fannie Mae Connecticut Avenue Securities floating rate 25-May-2024 Freddie Mac Structured Agency Credit Risk Debt Notes floating rate 25-Aug-2024 Structured Asset Mortgage Investments II Trust 2006-AR7 0.397% 25-Aug-2036 Boston Scientific Corp 3.850% 15-May-2025 John Deere Capital Corp 2.250% 17-Apr-2019 CSX Corp 7.375% 01-Feb-2019 JPMorgan Chase & Co 2.250% 23-Jan-2020 Wells Fargo & Co 2.125% 22-Apr-2019 Shell International Finance BV 3.250% 11-May-2025 Oracle Corp 2.375% 15-Jan-2019 BNZ International Funding Ltd/London 1.900% 26-Feb-2018 Baxalta, Inc 2.875% 23-Jun-2020 Fannie Mae Connecticut Avenue Securities floating rate 25-Oct-2023 VOLT XXXIII LLC 3.500% 25-Mar-2055 Freddie Mac Structured Agency Credit Risk Debt Notes floating rate 25-Jan-2025 Freddie Mac Structured Agency Credit Risk Debt Notes floating rate 25-Mar-2025 VOLT XXII LLC 3.500% 25-Feb-2055 Wm Wrigley Jr Co 2.900% 21-Oct-2019 Pershing Square Holdings Ltd 5.500% 15-Jul-2022 Lloyds Bank PLC 1.750% 14-May-2018 Bank of Montreal 2.375% 25-Jan-2019 3,950,000 1,325,645 1,230,382 1,256,471 1,020,000 803,282 738,372 916,531 710,000 700,000 600,000 700,000 650,000 580,000 560,000 550,000 540,000 520,706 520,000 500,000 500,000 480,000 450,000 460,000 450,000 442,000 119 Cost USD 4,011,312 1,325,189 1,229,902 1,086,847 1,020,000 797,360 745,295 726,351 709,006 705,978 704,256 688,653 652,169 578,231 574,722 549,841 539,827 524,693 519,476 500,000 500,000 479,494 464,202 460,000 448,871 446,287 . PAYDEN GLOBAL FUNDS PUBLIC LIMITED COMPANY SCHEDULE OF SIGNIFICANT PORTFOLIO MOVEMENTS (continued) Payden Absolute Return Bond Fund (continued) Sales Holdings United States Treasury Note/Bond 1.625% 31-Dec-2019 Ply Gem Industries Inc 4.000% 01-Feb-2021 Freddie Mac Structured Agency Credit Risk Debt Notes floating rate 25-Sep-2024 BB&T Corp 2.450% 15-Jan-2020 Ally Master Owner Trust floating rate 15-Sep-2018 Shell International Finance BV 3.250% 11-May-2025 Freddie Mac Structured Agency Credit Risk Debt Notes floating rate 25-Jan-2025 Freddie Mac Structured Agency Credit Risk Debt Notes floating rate 25-Feb-2024 Toronto-Dominion Bank 1.400% 30-Apr-2018 Reynolds Group Issuer Inc / Reynolds Group Issuer LLC / Reynolds Group Issuer Lu 9.875% 15-Aug-2019 Fannie Mae Connecticut Avenue Securities floating rate 25-May-2024 Fondo MIVIVIENDA SA 3.375% 02-Apr-2019 UniCredit Luxembourg Finance SA 6.000% 31-Oct-2017 SunTrust Banks Inc floating rate Perpetual HSBC Holdings PLC floating rate Perpetual Edison International 3.750% 15-Sep-2017 Fannie Mae Connecticut Avenue Securities M1 floating rate 25-Jan-2024 Omnicom Group Inc 4.450% 15-Aug-2020 Credit Suisse/New York NY 3.000% 29-Oct-2021 Collective Brands Inc 5.000% 11-Mar-2021 DIRECTV Holdings LLC / DIRECTV Financing Co Inc 4.600% 15-Feb-2021 Lam Research Corp 3.800% 15-Mar-2025 Volkswagen Group of America Finance LLC floating rate 20-Nov-2017 Manufacturers & Traders Trust Co 2.250% 25-Jul-2019 Eastman Chemical Co 2.700% 15-Jan-2020 Samarco Mineracao SA 5.375% 26-Sep-2024 AbbVie Inc 4.500% 14-May-2035 Freddie Mac Structured Agency Credit Risk Debt Notes floating rate 25-Oct-2027 Petrobras Global Finance BV floating rate 15-Jan-2019 Morgan Stanley 2.650% 27-Jan-2020 Morgan Stanley floating rate 24-Jan-2019 Fannie Mae Connecticut Avenue Securities 1M2 floating rate 25-Jul-2024 UBS AG/Stamford CT 1.375% 14-Aug-2017 Cleveland Clinic Foundation 4.858% 01-Jan-2114 OneMain Financial Holdings Inc 6.750% 15-Dec-2019 AbbVie Inc 4.700% 15-May-2045 American Express Credit Corp 1.550% 22-Sep-2017 Petroleos Mexicanos floating rate 18-Jul-2018 3,950,000 748,150 650,000 590,000 600,000 580,000 500,000 450,000 450,000 Proceeds USD 4,032,240 742,553 630,881 602,673 601,125 584,594 517,188 460,719 447,683 410,000 480,000 420,000 400,000 410,000 400,000 375,000 388,044 355,000 380,000 398,000 350,000 370,000 370,000 360,000 360,000 380,000 360,000 350,000 370,000 330,000 330,000 350,000 305,000 290,000 280,000 290,000 275,000 270,000 440,750 439,894 425,880 424,580 417,688 408,200 396,769 391,227 390,287 389,105 378,150 377,458 373,596 370,111 364,730 364,471 357,675 351,832 348,729 337,588 330,465 328,832 327,195 305,000 301,597 295,400 284,235 276,007 275,557 120 . PAYDEN GLOBAL FUNDS PUBLIC LIMITED COMPANY SCHEDULE OF SIGNIFICANT PORTFOLIO MOVEMENTS (continued) Payden Euro Liqudity Fund Purchases Holdings Netherlands Government Bond 4.000% 15-Jul-2016 French Treasury Note 2.250% 25-Feb-2016 Red & Black Auto Lease Germany 1 SA 0.911% 15-Apr-2024 Bumper 6 NL Finance BV floating rate 19-Mar-2029 France Government Bond OAT 1.000% 25-May-2019 Bavarian Sky SA 0.237% 20-Apr-2024 Silverstone Master Issuer PLC floating rate 21-Jan-2070 Toyota Motor Credit Corp floating rate 20-Jul-2018 Credit Suisse AG floating rate 18-Jun-2018 Bank of America Corp floating rate 28-Mar-2018 UBS AG/London floating rate 15-May-2017 Bundesobligation 1.000% 12-Oct-2018 Land Nordrhein-Westfalen Government Bond floating rate 09-Nov-2016 Cap Gemini SA floating rate 02-Jul-2018 SBAB Bank AB floating rate 27-Jun-2018 BCARD 2012 floating rate 15-Feb-2015 FCE Bank PLC floating rate 10-Feb-2018 Caisse Centrale Desjardins floating rate 20-Jan-2020 GDF Suez 0.000% 13-Mar-2017 Glencore Finance Europe SA 5.250% 22-Mar-2017 Compartment VCL 20 floating rate 21-Jun-2020 Coca-Cola Co floating rate 09-Mar-2017 BNP Paribas SA floating rate 15-Jan-2020 Yorkshire Building Society 2.125% 18-Mar-2019 Austria Government Bond 1.150% 19-Oct-2018 Societe Des Autoroutes Paris-Rhin-Rhone 0.735% 31-Mar-2019 Sky PLC floating rate 01-Apr-2020 Total Capital International SA floating rate 19-Mar-2020 Carrefour Banque SA floating rate 20-Mar-2020 Volkswagen International Finance NV floating rate 16-Jul-2018 Bank of Nova Scotia/The floating rate 14-Jan-2020 Danone SA floating rate 14-Jan-2020 Goldman Sachs Group, Inc floating rate 29-May-2020 Conti-Gummi Finance BV 2.500% 20-Mar-2017 Daimler AG floating rate 24-Jun-2019 Nederlandse Waterschapsbank NV floating rate 01-Nov-2018 SAP SE floating rate 01-Apr-2020 BMW US Capital LLC floating rate 20-Apr-2018 Cooperatieve Centrale Raiffeisen-Boerenleenbank BA/Netherlands floating rate 29-May-2020 Fidelity International Ltd 6.875% 24-Feb-2017 Cie de Saint-Gobain 4.750% 11-Apr-2017 GE Capital European Funding floating rate 21-Jan-2020 Commonwealth Bank of Australia floating rate 21-Jan-2020 Banque Federative du Credit Mutuel SA floating rate 20-Mar-2019 Auto ABS Compartiment 2012-1 floating rate 25-Jul-2026 Santander Consumer Bank AS 0.625% 20-Apr-2018 2,250,000 2,250,000 2,221,406 2,100,000 1,500,000 1,500,000 1,300,000 1,250,000 1,250,000 1,250,000 1,050,000 1,000,000 1,000,000 1,000,000 1,000,000 1,000,000 1,000,000 1,000,000 1,000,000 900,000 921,951 900,000 850,000 800,000 800,000 800,000 800,000 800,000 800,000 800,000 800,000 800,000 800,000 750,000 750,000 750,000 750,000 750,000 Cost EUR 2,388,420 2,308,793 2,225,216 2,107,320 1,554,210 1,500,000 1,301,110 1,250,425 1,250,000 1,245,013 1,050,000 1,037,040 1,002,250 1,002,160 1,000,620 1,000,500 1,000,375 1,000,000 997,155 974,565 922,504 900,000 850,000 840,067 832,824 807,968 804,084 802,800 801,651 800,180 800,000 800,000 800,000 778,125 757,035 751,770 750,000 750,000 750,000 600,000 600,000 650,000 650,000 600,000 600,000 600,000 749,625 664,712 657,732 650,000 650,000 610,590 603,240 599,364 121 . PAYDEN GLOBAL FUNDS PUBLIC LIMITED COMPANY SCHEDULE OF SIGNIFICANT PORTFOLIO MOVEMENTS (continued) Payden Euro Liqudity Fund (continued) Sales Holdings Netherlands Government Bond 2.500% 15-Jan-2017 Netherlands Government Bond 4.000% 15-Jul-2016 French Treasury Note 2.250% 25-Feb-2016 Finland Government Bond 3.875% 15-Sep-2017 Credit Suisse AG/London floating rate 15-Dec-2017 Province of Quebec Canada 3.375% 20-Jun-2016 Land Nordrhein-Westfalen Government Bond floating rate 09-Nov-2016 BCARD 2012 floating rate 15-Feb-2015 Bank of America Corp floating rate 19-Jun-2019 Goldman Sachs Group Inc floating rate 29-Oct-2019 Anheuser-Busch InBev NV floating rate 29-Mar-2018 RCI Banque SA floating rate 27-Nov-2017 Intesa Sanpaolo SpA floating rate 17-Apr-2019 SAP SE floating rate 01-Apr-2020 Cellco Partnership / Verizon Wireless Capital LLC 8.750% 18-Dec-2015 Macquarie Bank Ltd floating rate 24-Apr-2016 Royal Bank of Scotland Group PLC 1.500% 28-Nov-2016 Anheuser-Busch InBev NV floating rate 19-Oct-2018 Gracechurch Card Funding PLC floating rate 15-Feb-2017 Netherlands Government Bond 0.500% 15-Apr-2017 Caisse Centrale Desjardins floating rate 20-Jan-2020 PACCAR Financial Corp floating rate 19-May-2017 Toyota Motor Credit Corp floating rate 20-Jul-2018 Daimler AG floating rate 07-Oct-2016 Bank of Nova Scotia floating rate 02-Nov-2017 UBS AG/London floating rate 05-Sep-2016 Volvo Treasury AB floating rate 05-Jun-2015 Bpifrance Financement SA floating rate 17-Feb-2016 3,850,000 2,250,000 2,250,000 1,200,000 1,250,000 1,000,000 1,000,000 1,000,000 850,000 850,000 850,000 800,000 750,000 750,000 600,000 600,000 500,000 500,000 500,000 400,000 400,000 400,000 400,000 350,000 320,000 300,000 300,000 300,000 122 Proceeds EUR 4,046,821 2,387,175 2,308,748 1,313,196 1,253,813 1,044,528 1,002,810 1,000,100 862,929 856,035 854,599 802,800 761,625 753,968 640,206 602,117 508,255 500,655 500,050 405,382 401,952 401,028 400,576 351,050 321,040 300,711 300,267 300,099 . PAYDEN GLOBAL FUNDS PUBLIC LIMITED COMPANY SCHEDULE OF SIGNIFICANT PORTFOLIO MOVEMENTS (continued) Payden Global Bond Fund* Purchases Holdings France Government Bond OAT 1.750% 25-May-2023 United States Treasury Note/Bond 1.250% 30-Apr-2019 United States Treasury Note/Bond 2.625% 15-Nov-2020 United States Treasury Note/Bond 0.750% 31-Mar-2018 Australia Government Bond 6.000% 15-Feb-2017 Japan Government Twenty Year Bond 1.000% 20-Mar-2023 United States Treasury Note/Bond 0.875% 28-Feb-2017 United States Treasury Note/Bond 0.375% 15-Jan-2016 Japan Government Twenty Year Bond 1.900% 20-Dec-2028 United Kingdom Gilt 4.750% 07-Mar-2020 Italy Buoni Poliennali Del Tesoro 4.500% 01-Aug-2018 Spain Government Bond 2.750% 30-Apr-2019 United States Treasury Note/Bond 3.000% 15-May-2042 Italy Buoni Poliennali Del Tesoro 4.500% 01-May-2023 Province of Quebec Canada 0.875% 15-Jan-2025 Bundesrepublik Deutschland 3.500% 04-Jul-2019 France Government Bond OAT 3.250% 25-May-2045 Belgium Government Bond 3.000% 28-Sep-2019 Macquarie Bank Ltd 1.125% 20-Jan-2022 Bundesobligation floating rate 17-Apr-2020 United States Treasury Note/Bond 2.125% 15-May-2025 Dexia Credit Local SA 2.125% 12-Feb-2025 Commonwealth Bank of Australia floating rate 22-Apr-2027 France Government Bond OAT 4.750% 25-Apr-2035 Spain Government Bond 1.600% 30-Apr-2025 Austria Government Bond 0.250% 18-Oct-2019 11,900,000 14,000,000 13,000,000 10,250,000 6,000,000 500,000,000 4,000,000 4,000,000 380,000,000 2,000,000 2,400,000 2,450,000 2,542,000 1,900,000 2,100,000 2,000,000 1,400,000 1,800,000 1,850,000 1,800,000 2,000,000 1,200,000 1,700,000 950,000 1,500,000 1,500,000 Sales Holdings United States Treasury Note/Bond 0.750% 31-Mar-2018 United States Treasury Note/Bond 1.250% 30-Apr-2019 France Government Bond OAT 3.250% 25-Oct-2021 United States Treasury Note/Bond 0.375% 15-Jan-2016 United States Treasury Note/Bond 2.625% 15-Nov-2020 United States Treasury Note/Bond 0.875% 28-Feb-2017 France Government Bond OAT 1.750% 25-May-2023 Japan Government Twenty Year Bond 1.000% 20-Mar-2023 Australia Government Bond 6.000% 15-Feb-2017 Italy Buoni Poliennali Del Tesoro 4.750% 01-Jun-2017 Bundesrepublik Deutschland 2.500% 04-Jan-2021 Spain Government Bond 5.850% 31-Jan-2022 Bundesrepublik Deutschland 3.500% 04-Jul-2019 Japan Government Twenty Year Bond 1.700% 20-Sep-2033 United Kingdom Gilt 2.000% 22-Jan-2016 United Kingdom Gilt 1.250% 22-Jul-2018 UNEDIC 2.375% 25-May-2024 Spain Government Bond 2.100% 30-Apr-2017 Province of Ontario Canada 1.875% 21-May-2024 Province of Quebec Canada 0.875% 15-Jan-2025 Suntory Holdings Ltd 2.550% 29-Sep-2019 Italy Buoni Poliennali Del Tesoro 4.500% 01-May-2023 United States Treasury Note/Bond 4.375% 15-Feb-2038 Bundesobligation floating rate 17-Apr-2020 Japan Bank for International Cooperation/Japan 2.625% 15-Dec-2020 Macquarie Bank Ltd 1.125% 20-Jan-2022 Kinder Morgan Inc/DE 4.300% 01-Jun-2025 * See Note 1. 123 19,000,000 14,000,000 8,750,000 11,200,000 10,000,000 7,500,000 4,800,000 600,000,000 5,500,000 3,550,000 3,300,000 2,800,000 3,000,000 400,000,000 2,100,000 1,900,000 2,400,000 2,600,000 2,200,000 2,100,000 2,260,000 1,600,000 1,650,000 1,800,000 1,250,000 1,850,000 1,900,000 Cost USD 14,837,892 13,954,813 13,599,349 10,179,009 5,107,670 4,473,766 4,020,717 4,005,756 3,704,299 3,635,955 2,899,802 2,858,572 2,721,665 2,690,410 2,458,545 2,457,867 2,341,845 2,225,042 2,169,867 2,007,991 1,954,227 1,821,536 1,797,001 1,766,831 1,699,230 1,660,329 Proceeds USD 18,808,319 13,978,664 11,845,269 11,215,670 10,532,382 7,543,803 5,767,566 5,308,200 4,589,896 4,229,684 4,126,006 4,093,861 3,849,697 3,697,557 3,194,101 2,976,284 2,973,802 2,875,063 2,836,662 2,327,215 2,261,243 2,180,971 2,152,200 2,011,603 2,007,430 1,979,224 1,871,975 . PAYDEN GLOBAL FUNDS PUBLIC LIMITED COMPANY SCHEDULE OF SIGNIFICANT PORTFOLIO MOVEMENTS (continued) Payden Global Emerging Markets Bond Fund Purchases Holdings Poland Government Bond 3.250% 25-Jul-2025 Thailand Government Bond 3.250% 16-Jun-2017 Romanian Government International Bond 4.875% 22-Jan-2024 Mexican Bonos 7.750% 13-Nov-2042 Turkey Government International Bond 6.250% 26-Sep-2022 Banque Centrale de Tunisie SA 5.750% 30-Jan-2025 Latam Airlines 2015-1 Pass Through Trust A 4.200% 15-Nov-2027 China Construction Bank Corp floating rate 13-May-2025 Turkey Government Bond 8.500% 10-Jul-2019 Turkey Government Bond 9.000% 24-Jul-2024 Philippine Government International Bond 3.950% 20-Jan-2040 Vietnam Government International Bond 4.800% 19-Nov-2024 Russian Federal Bond - OFZ 7.500% 27-Feb-2019 Pakistan Government International Bond 8.250% 15-Apr-2024 Senegal Government International Bond 8.750% 13-May-2021 Deutsche Bank AG/London 5.625% 17-May-2023 Mexican Bonos 5.000% 15-Jun-2017 Malaysia Government Bond 3.418% 15-Aug-2022 Petronas Capital Ltd 3.500% 18-Mar-2025 Brazilian Government International Bond 8.250% 20-Jan-2034 Nigeria Government International Bond 13.050% 16-Aug-2016 Uruguay Government International Bond 5.100% 18-Jun-2050 Export-Import Bank of India 4.000% 14-Jan-2023 Republic of Honduras 8.750% 16-Dec-2020 Peruvian Government International Bond 7.350% 21-Jul-2025 VimpelCom Holdings BV 7.504% 01-Mar-2022 Perusahaan Gas Negara Persero Tbk PT 5.125% 16-May-2024 Republic of Serbia 5.875% 03-Dec-2018 Bank of China Ltd 5.000% 13-Nov-2024 Comision Federal de Electricidad 6.125% 16-Jun-2045 Russian Federal Bond - OFZ 4.875% 16-Sep-2023 Mexico Government International Bond 4.600% 23-Jan-2046 Republic of Serbia 7.250% 28-Sep-2021 Agricola Senior Trust 6.750% 18-Jun-2020 Republic of Armenia 7.150% 26-Mar-2025 South Africa Government Bond 5.875% 30-May-2022 Costa Rica Government International Bond 7.000% 04-Apr-2044 124 7,800,000 52,350,000 1,434,000 15,500,000 995,000 930,000 880,000 870,000 2,350,000 1,750,000 817,000 765,000 43,700,000 750,000 665,000 10,000,000,000 10,000,000 2,350,000 610,000 450,000 116,000,000 570,000 570,000 510,000 420,000 560,000 550,000 520,000 540,000 550,000 600,000 530,000 450,000 490,000 480,000 400,000 460,000 Cost USD 2,353,750 1,647,997 1,583,708 1,330,723 1,128,081 930,021 880,000 865,267 858,853 820,958 817,000 801,388 800,412 779,400 750,125 712,598 662,606 648,953 604,663 589,455 579,649 577,946 567,820 567,630 563,900 560,988 558,650 553,150 552,452 545,303 538,500 526,221 519,125 496,750 468,326 456,000 452,990 . PAYDEN GLOBAL FUNDS PUBLIC LIMITED COMPANY SCHEDULE OF SIGNIFICANT PORTFOLIO MOVEMENTS (continued) Payden Global Emerging Markets Bond Fund (continued) Sales Holdings Poland Government Bond 5.750% 25-Oct-2021 Ivory Coast Government International Bond 5.750% 31-Dec-2032 Pakistan Government International Bond 8.250% 15-Apr-2024 Pertamina Persero PT 6.000% 03-May-2042 Indonesia Government International Bond 5.375% 17-Oct-2023 Thailand Government Bond 3.250% 16-Jun-2017 Philippine Government International Bond 7.750% 14-Jan-2031 Deutsche Bank AG/London 5.625% 17-May-2023 Kenya Government International Bond 6.875% 24-Jun-2024 Petroleos Mexicanos 7.650% 24-Nov-2021 Uruguay Government International Bond 4.500% 14-Aug-2024 Mexican Bonos 7.750% 13-Nov-2042 Brazil Notas do Tesouro Nacional Serie F 10.000% 01-Jan-2017 JPMorgan Chase Bank NA 8.375% 17-Mar-2034 Philippine Government International Bond 3.950% 20-Jan-2040 Romanian Government International Bond 4.875% 22-Jan-2024 Jamaica Government International Bond 7.625% 09-Jul-2025 Sri Lanka Government International Bond 6.250% 04-Oct-2020 Petroleos Mexicanos 5.500% 27-Jun-2044 Hungary Government International Bond 4.125% 19-Feb-2018 Croatia Government International Bond 6.750% 05-Nov-2019 Dominican Republic International Bond 7.450% 30-Apr-2044 Star Energy Geothermal Wayang Windu Ltd 6.125% 27-Mar-2020 Republic of Armenia 6.000% 30-Sep-2020 Republic of Ghana 8.500% 04-Oct-2017 125 6,955,000 1,680,000 1,100,000 1,120,000 1,000,000 35,600,000 722,000 15,000,000,000 970,000 13,090,000 810,000 11,589,000 2,870,000 9,800,000,000 817,000 750,000 710,000 760,000 820,000 680,000 630,000 620,000 690,000 700,000 650,000 Proceeds USD 2,371,042 1,595,755 1,193,050 1,105,244 1,101,180 1,089,601 1,071,381 1,068,898 996,675 968,897 875,345 865,821 855,039 844,415 831,807 803,956 792,350 781,831 765,170 705,524 699,288 694,960 686,632 676,390 673,495 . PAYDEN GLOBAL FUNDS PUBLIC LIMITED COMPANY SCHEDULE OF SIGNIFICANT PORTFOLIO MOVEMENTS (continued) Payden Global Emerging Markets Corporate Bond Fund Purchases Holdings Ooredoo International Finance Ltd 3.875% 31-Jan-2028 Tencent Holdings Ltd 3.800% 11-Feb-2025 Southern Copper Corp 3.875% 23-Apr-2025 AT&T Inc 4.750% 15-May-2046 Bangkok Bank PCL/Hong Kong 4.800% 18-Oct-2020 Sinopec Group Overseas Development 2015 Ltd 2.500% 28-Apr-2020 Hutchison Whampoa International 11 Ltd floating rate 13-Jan-2022 Latam Airlines 2015-1 Pass Through Trust B 4.500% 15-Nov-2023 BOC Aviation Pte Ltd 4.375% 02-May-2023 Alfa SAB de CV 5.250% 25-Mar-2024 BBVA Colombia SA 4.875% 21-Apr-2025 Petronas Capital Ltd 4.500% 18-Mar-2045 Russian Federal Bond - OFZ floating rate 31-Mar-2030 AIA Group Ltd. 3.200% 11-Mar-2025 DP World Ltd 3.250% 18-May-2020 Eskom Holdings SOC Ltd 7.125% 11-Feb-2025 Akbank TAS 4.000% 24-Jan-2020 Braskem Finance Ltd 5.750% 15-Apr-2021 Latam Airlines 2015-1 Pass Through Trust A 4.200% 15-Nov-2027 China Construction Bank Corp floating rate 13-May-2025 Novelis Inc 8.375% 15-Dec-2017 SK Telecom Co Ltd 2.125% 01-May-2018 Millicom International Cellular SA 4.750% 22-May-2020 Agricola Senior Trust 6.750% 18-Jun-2020 Petroleos Mexicanos 5.500% 21-Jan-2021 International Container Terminal Services Inc 7.375% 17-Mar-2020 Thai Oil PCL 3.625% 23-Jan-2023 Export-Import Bank of India 2.750% 01-Apr-2020 YPF SA 8.500% 28-Jul-2025 OCP SA 4.500% 22-Oct-2025 Reliance Industries Ltd 4.875% 10-Feb-2045 Telefonica Celular del Paraguay SA 6.750% 13-Dec-2022 Anglo American Capital PLC 3.625% 14-May-2020 Colombia Government International Bond 5.000% 15-Jun-2045 Aircastle Ltd 5.500% 15-Feb-2022 Morgan Stanley 4.300% 27-Jan-2045 Goldman Sachs Group Inc 2.600% 23-Apr-2020 Morgan Stanley 5.550% 29-Dec-2049 Actavis Funding SCS 3.000% 12-Mar-2020 Credit Suisse Group Funding Guernsey Ltd 2.750% 26-Mar-2020 American Airlines 2013-1 Class B Pass Through Trust 5.625% 15-Jan-2021 VimpelCom Holdings BV 7.504% 01-Mar-2022 Mexico Government International Bond 3.625% 15-Mar-2022 Cemex Finance LLC 9.375% 12-Oct-2022 Wells Fargo & Co Perpetual floating rate UBS AG/Stamford CT 1.800% 26-Mar-2018 Reynolds American Inc 4.450% 12-Jun-2025 Colombia Government International Bond 4.375% 12-Jul-2021 Ecopetrol SA 5.375% 26-Jun-2026 Baxalta Inc 4.000% 23-Jun-2025 TBG Global Pte Ltd 4.625% 03-Apr-2018 JB y Co SA de CV 3.750% 13-May-2025 Pacific Rubiales Energy Corp 7.250% 12-Dec-2021 Southern Copper Corp 5.875% 23-Apr-2045 Vietnam Government International Bond 4.800% 19-Nov-2024 Alibaba Group Holding Ltd 4.500% 28-Nov-2034 CONSOL Energy Inc 8.250% 01-Apr-2020 Export-Import Bank of India 4.000% 14-Jan-2023 Senegal Government International Bond 8.750% 13-May-2021 Turkiye Vakiflar Bankasi floating rate 03-Feb-2025 Digicel Ltd 6.000% 15-Apr-2021 126 775,000 600,000 600,000 555,000 500,000 550,000 470,000 510,000 500,000 480,000 500,000 500,000 458,500 435,000 420,000 410,000 400,000 390,000 370,000 370,000 350,000 360,000 380,000 335,000 300,000 270,000 300,000 300,000 300,000 300,000 310,000 275,000 290,000 280,000 280,000 275,000 270,000 270,000 270,000 270,000 251,253 260,000 250,000 220,000 250,000 250,000 250,000 235,000 250,000 250,000 250,000 250,000 265,000 250,000 235,000 240,000 240,000 245,000 220,000 240,000 250,000 Cost USD 758,531 597,630 596,754 553,024 551,250 547,668 515,186 510,000 509,775 501,936 499,570 493,835 493,082 434,448 419,307 402,837 398,656 375,375 370,000 367,987 365,750 363,600 357,960 339,163 327,420 310,095 301,740 298,404 297,291 296,295 293,629 292,875 289,356 288,050 280,000 272,938 270,869 270,000 269,987 269,862 260,047 257,400 256,000 251,548 250,000 249,673 249,243 249,069 248,320 248,310 248,125 247,513 247,444 247,083 245,869 245,302 243,600 243,209 242,000 239,249 237,813 . PAYDEN GLOBAL FUNDS PUBLIC LIMITED COMPANY SCHEDULE OF SIGNIFICANT PORTFOLIO MOVEMENTS (continued) Payden Global Emerging Markets Corporate Bond Fund (continued) Sales Holdings Southern Copper Corp 3.875% 23-Apr-2025 AngloGold Ashanti Holdings PLC 8.500% 30-Jul-2020 Baidu Inc 3.500% 28-Nov-2022 Star Energy Geothermal Wayang Windu Ltd 6.125% 27-Mar-2020 Russian Federal Bond - OFZ floating rate 31-Mar-2030 BBVA Banco Continental SA floating rate 22-Sep-2029 BBVA Colombia SA 4.875% 21-Apr-2025 Samarco Mineracao SA 5.375% 26-Sep-2024 Eskom Holdings SOC Ltd 7.125% 11-Feb-2025 China Overseas Finance Cayman III Ltd 5.375% 29-Oct-2023 Petrobras International Finance Co SA 5.375% 27-Jan-2021 Tencent Holdings Ltd 3.375% 02-May-2019 America Movil SAB de CV 6.125% 30-Mar-2040 Comcel Trust via Comunicaciones Celulares SA 6.875% 06-Feb-2024 AT&T Inc 4.750% 15-May-2046 Ecopetrol SA 4.125% 16-Jan-2025 Union Andina de Cementos SAA 5.875% 30-Oct-2021 Braskem Finance Ltd 5.750% 15-Apr-2021 National Bank of Abu Dhabi PJSC 3.000% 13-Aug-2019 Unifin Financiera SAPI de CV SOFOM ENR 6.250% 22-Jul-2019 ESAL GmbH 6.250% 05-Feb-2023 Lukoil International Finance BV 4.563% 24-Apr-2023 Mexichem SAB de CV 5.875% 17-Sep-2044 Aircastle Ltd 5.500% 15-Feb-2022 Anglo American Capital PLC 3.625% 14-May-2020 Republic of Ghana 8.125% 18-Jan-2026 Pacific Rubiales Energy Corp 5.375% 26-Jan-2019 Morgan Stanley 4.300% 27-Jan-2045 Digicel Group Ltd 8.250% 30-Sep-2020 Wells Fargo & Co Perpetual floating rate ARC Properties Operating Partnership LP 3.000% 06-Feb-2019 Petroleos Mexicanos 5.500% 27-Jun-2044 Ecopetrol SA 5.875% 28-May-2045 Evraz Inc NA Canada 7.500% 15-Nov-2019 Vale Overseas Ltd 4.375% 11-Jan-2022 GCX Ltd 7.000% 01-Aug-2019 GNL Quintero SA 4.634% 31-Jul-2029 FMG Resources August 2006 Pty Ltd 8.250% 01-Nov-2019 Columbus International Inc 7.375% 30-Mar-2021 Banco de Credito del Peru/Panama 5.375% 16-Sep-2020 TMK OAO Via TMK Capital SA 6.750% 03-Apr-2020 Turkiye Vakiflar Bankasi floating rate 03-Feb-2025 GTB Finance BV 6.000% 08-Nov-2018 Nakilat Inc 6.067% 31-Dec-2033 International Bank of Azerbaijan OJSC 5.625% 11-Jun-2019 Petrobras Global Finance BV floating rate 17-Mar-2020 National Savings Bank 8.875% 18-Sep-2018 TAM Capital 3 Inc 8.375% 03-Jun-2021 Country Garden Holdings Co Ltd 7.875% 27-May-2019 Turkiye Vakiflar Bankasi TAO 5.750% 24-Apr-2017 Industrial Senior Trust 5.500% 01-Nov-2022 Agile Property Holdings Ltd 9.875% 20-Mar-2017 Ardagh Finance Holdings SA 8.625% 15-Jun-2019 KazMunayGas National Co JSC 5.750% 30-Apr-2043 CNOOC Curtis Funding No 1 Pty Ltd 4.500% 03-Oct-2023 Petronas Capital Ltd 4.500% 18-Mar-2045 Samarco Mineracao SA 5.375% 26-Sep-2024 127 600,000 540,000 545,000 550,000 437,500 500,000 500,000 460,000 410,000 400,000 440,000 400,000 300,000 340,000 350,000 370,000 350,000 390,000 340,000 350,000 320,000 370,000 310,000 280,000 290,000 285,000 360,000 275,000 260,000 250,000 270,000 250,000 260,000 260,000 260,000 250,000 240,000 275,000 225,000 220,000 280,000 240,000 260,000 200,000 240,000 260,000 205,000 220,000 225,000 210,000 225,000 215,000 208,768 250,000 200,000 200,000 200,000 Proceeds USD 589,584 580,500 550,063 542,125 516,031 512,500 505,000 425,700 422,813 421,000 416,940 411,000 374,863 366,690 352,818 351,963 351,038 351,000 349,792 338,625 331,776 312,650 302,560 296,800 288,959 275,054 273,600 273,248 269,230 261,250 257,850 254,375 253,500 252,850 249,431 248,750 247,800 244,750 243,675 240,900 240,800 236,100 235,300 235,000 232,920 228,800 227,243 226,600 220,500 219,975 219,938 215,538 213,465 211,275 210,930 198,340 192,500 . PAYDEN GLOBAL FUNDS PUBLIC LIMITED COMPANY SCHEDULE OF SIGNIFICANT PORTFOLIO MOVEMENTS (continued) Payden Global Government Bond Index Fund Purchases Holdings United States Treasury Note/Bond 0.875% 15-Aug-2017 United States Treasury Note/Bond 2.500% 15-Aug-2023 United States Treasury Note/Bond 2.375% 31-Jul-2017 Japan Government Ten Year Bond 1.700% 20-Sep-2017 United States Treasury Note/Bond 2.375% 31-Mar-2016 United States Treasury Note/Bond 0.875% 15-Oct-2017 Japan Government Ten Year Bond 1.500% 20-Jun-2019 United Kingdom Gilt 5.000% 07-Mar-2018 Japan Government Twenty Year Bond 2.100% 20-Dec-2027 United States Treasury Note/Bond 3.750% 15-Nov-2043 Bundesrepublik Deutschland 4.250% 04-Jul-2018 France Government Bond OAT 4.250% 25-Oct-2017 Mexican Bonos 6.500% 09-Jun-2022 Italy Buoni Poliennali Del Tesoro 4.750% 01-Aug-2023 Japan Government Twenty Year Bond 1.900% 20-Dec-2028 United Kingdom Gilt 1.750% 07-Sep-2022 France Government Bond OAT 5.500% 25-Apr-2029 Italy Buoni Poliennali Del Tesoro 5.000% 01-Mar-2025 Singapore Government Bond 2.750% 01-Jul-2023 France Government Bond OAT 8.500% 25-Apr-2023 11,850,000 3,200,000 3,000,000 300,000,000 2,000,000 1,500,000 150,000,000 600,000 105,000,000 800,000 500,000 500,000 8,000,000 400,000 50,000,000 300,000 250,000 300,000 500,000 200,000 Sales Holdings United States Treasury Note/Bond 2.375% 31-Jul-2017 United States Treasury Note/Bond 2.375% 31-Mar-2016 Japan Government Ten Year Bond 1.800% 20-Mar-2016 French Treasury Note BTAN 2.250% 25-Feb-2016 Japan Government Ten Year Bond 1.700% 20-Sep-2016 Japan Government Twenty Year Bond 2.500% 20-Mar-2020 Japan Government Twenty Year Bond 1.000% 20-Mar-2023 Japan Government Ten Year Bond 1.700% 20-Dec-2016 United Kingdom Gilt 2.000% 22-Jan-2016 Mexican Bonos 8.000% 11-Jun-2020 Bundesrepublik Deutschland 4.250% 04-Jul-2018 Italy Buoni Poliennali Del Tesoro 4.750% 01-Aug-2023 Poland Government Bond 6.250% 24-Oct-2015 United States Treasury Note/Bond 2.500% 15-Aug-2023 Japan Government Thirty Year Bond 2.500% 20-Sep-2035 Singapore Government Bond 2.250% 01-Jun-2021 Malaysia Government Bond 3.480% 15-Mar-2023 United Kingdom Gilt 4.250% 07-Mar-2036 United States Treasury Note/Bond 4.250% 15-May-2039 Poland Government Bond 5.750% 23-Sep-2022 14,300,000 4,400,000 245,500,000 1,550,000 188,800,000 145,000,000 110,000,000 100,000,000 450,000 8,240,000 300,000 250,000 1,250,000 300,000 30,000,000 400,000 1,000,000 100,000 150,000 589,000 128 Cost USD 11,907,468 3,340,556 3,107,227 2,596,759 2,049,616 1,498,482 1,324,891 1,022,609 1,022,596 966,761 657,928 638,925 561,127 553,951 502,124 466,693 445,597 445,016 386,832 374,334 Proceeds USD 14,896,891 4,491,657 2,081,770 1,814,539 1,612,479 1,348,826 980,162 827,229 705,277 615,731 407,823 351,337 339,579 315,221 309,480 300,384 267,463 199,291 197,794 195,056 . PAYDEN GLOBAL FUNDS PUBLIC LIMITED COMPANY SCHEDULE OF SIGNIFICANT PORTFOLIO MOVEMENTS (continued) Payden Global High Yield Bond Fund Purchases Holdings General Motors Financial Co Inc 4.250% 15-May-2023 Navient Corp 5.500% 15-Jan-2019 Infor US Inc 6.500% 15-May-2022 Quintiles Transnational Corp 4.875% 15-May-2023 Ally Financial Inc 4.125% 13-Feb-2022 Sunoco LP / Sunoco Finance Corp 6.375% 01-Apr-2023 E*TRADE Financial Corp 5.375% 15-Nov-2022 T-Mobile USA Inc 6.250% 01-Apr-2021 Antero Resources Corp 6.000% 01-Dec-2020 MarkWest Energy Partners LP / MarkWest Energy Finance Corp 4.875% 01-Dec-2024 Darling Ingredients Inc 5.375% 15-Jan-2022 CNH Industrial Capital LLC 3.250% 01-Feb-2017 Communications Sales & Leasing Inc 6.000% 15-Apr-2023 Dean Foods Co 6.500% 15-Mar-2023 Valeant Pharmaceuticals International Inc 5.875% 15-May-2023 Pershing Square Holdings Ltd 5.500% 15-Jul-2022 Tenet Healthcare Corp 6.750% 15-Jun-2023 ZF North America Capital Inc 4.000% 29-Apr-2020 MarkWest Energy Partners LP / MarkWest Energy Finance Corp 4.500% 15-Jul-2023 Landry's Inc 9.375% 01-May-2020 Neiman Marcus Group Ltd LLC 8.750% 15-Oct-2021 DCP Midstream Operating LP 9.750% 15-Mar-2019 Carrols Restaurant Group Inc 8.000% 01-May-2022 Family Tree Escrow LLC 5.750% 01-Mar-2023 Rite Aid Corp 6.125% 01-Apr-2023 CommScope Technologies Finance LLC 6.000% 15-Jun-2025 Argos Merger Sub Inc 7.125% 15-Mar-2023 Horizon Pharma Financing Inc 6.625% 01-May-2023 Berry Plastics Corp 5.125% 15-Jul-2023 Southwestern Energy Co 4.050% 23-Jan-2020 Credit Acceptance Corp 7.375% 15-Mar-2023 Concordia Healthcare Corp 7.000% 15-Apr-2023 JBS USA LLC / JBS USA Finance Inc 5.750% 15-Jun-2025 Lennar Corp 4.500% 15-Nov-2019 A Schulman Inc 6.875% 01-Jun-2023 Brookfield Residential Properties Inc 6.375% 15-May-2025 Actavis Funding SCS 3.450% 15-Mar-2022 Altice Financing SA 6.625% 15-Feb-2023 FMG Resources August 2006 Pty Ltd 9.750% 01-Mar-2022 First Cash Financial Services Inc 6.750% 01-Apr-2021 1,300,000 1,000,000 700,000 700,000 600,000 550,000 500,000 500,000 500,000 500,000 500,000 500,000 500,000 500,000 500,000 500,000 500,000 500,000 500,000 450,000 450,000 430,000 450,000 450,000 450,000 450,000 450,000 450,000 450,000 450,000 450,000 430,000 430,000 400,000 380,000 300,000 300,000 250,000 250,000 200,000 129 Cost USD 1,365,000 1,021,250 724,500 700,000 591,524 550,000 531,250 524,375 511,250 508,125 507,500 506,250 503,750 500,000 500,000 500,000 497,500 497,200 491,250 484,875 475,695 475,537 464,850 457,031 453,938 453,375 450,000 450,000 450,000 449,537 446,697 430,000 430,000 401,000 384,625 300,000 299,574 250,000 244,020 213,000 . PAYDEN GLOBAL FUNDS PUBLIC LIMITED COMPANY SCHEDULE OF SIGNIFICANT PORTFOLIO MOVEMENTS (continued) Payden Global High Yield Bond Fund (continued) Sales Holdings General Motors Financial Co Inc 4.250% 15-May-2023 Navient Corp 5.500% 15-Jan-2019 TMS International Corp 7.625% 15-Oct-2021 Chrysler Group LLC / CG Co-Issuer Inc 8.250% 15-Jun-2021 GenOn Energy Inc 9.875% 15-Oct-2020 Ally Financial Inc 8.000% 15-Mar-2020 MarkWest Energy Partners LP / MarkWest Energy Finance Corp 4.875% 01-Dec-2024 DCP Midstream Operating LP 9.750% 15-Mar-2019 Kinder Morgan Inc/DE 6.500% 15-Sep-2020 Southwestern Energy Co 4.050% 23-Jan-2020 Abengoa Finance SAU 7.750% 01-Feb-2020 Dollar General Corp 1.875% 15-Apr-2018 Cequel Communications Holdings I LLC / Cequel Capital Corp 5.125% 15-Dec-2021 FMG Resources August 2006 Pty Ltd 8.250% 01-Nov-2019 Jo-Ann Stores LLC 8.125% 15-Mar-2019 Apex Tool Group LLC 7.000% 01-Feb-2021 Freescale Semiconductor Inc 6.000% 15-Jan-2022 Denali Borrower LLC / Denali Finance Corp 5.625% 15-Oct-2020 Aramark Services Inc 5.750% 15-Mar-2020 OneMain Financial Holdings Inc 7.250% 15-Dec-2021 Memorial Resource Development Corp 5.875% 01-Jul-2022 Genesis Energy LP / Genesis Energy Finance Corp 5.750% 15-Feb-2021 Penn National Gaming Inc 5.875% 01-Nov-2021 Rent-A-Center Inc/TX 4.750% 01-May-2021 Hughes Satellite Systems Corp 7.625% 15-Jun-2021 Post Holdings Inc 7.375% 15-Feb-2022 Imperial Metals Corp 7.000% 15-Mar-2019 Crestwood Midstream Partners LP / Crestwood Midstream Finance Corp 6.000% 15-Dec-2020 Ardagh Finance Holdings SA 8.625% 15-Jun-2019 General Cable Corp 5.750% 01-Oct-2022 Case New Holland Industrial Inc 7.875% 01-Dec-2017 Avianca Holdings SA / Avianca Leasing LLC / Grupo Taca Holdings Ltd 8.375% 10-May-2020 Kinetic Concepts Inc / KCI USA Inc 10.500% 01-Nov-2018 Sirius XM Radio Inc 4.250% 15-May-2020 Sabine Pass LNG LP 7.500% 30-Nov-2016 MarkWest Energy Partners LP / MarkWest Energy Finance Corp 6.750% 01-Nov-2020 Penn Virginia Resource Partners LP / Penn Virginia Resource Finance Corp 6.500% 15-May-2021 L Brands Inc 7.000% 01-May-2020 Legacy Reserves LP / Legacy Reserves Finance Corp 6.625% 01-Dec-2021 Tronox Finance LLC 6.375% 15-Aug-2020 PaperWorks Industries Inc 9.500% 15-Aug-2019 Eldorado Gold Corp 6.125% 15-Dec-2020 Actavis Funding SCS 3.450% 15-Mar-2022 Levi Strauss & Co 6.875% 01-May-2022 Hanger Inc 7.125% 15-Nov-2018 Pinnacle Entertainment Inc 8.750% 15-May-2020 Standard Pacific Corp 8.375% 15-May-2018 Iron Mountain Inc 7.750% 01-Oct-2019 1,300,000 1,000,000 1,000,000 500,000 530,000 438,000 500,000 430,000 410,000 450,000 450,000 450,000 450,000 500,000 450,000 475,000 400,000 400,000 400,000 400,000 450,000 400,000 400,000 450,000 350,000 370,000 400,000 Proceeds USD 1,298,050 1,025,000 977,500 546,565 538,800 527,790 510,000 502,025 466,829 461,151 448,313 442,125 441,000 430,000 429,750 427,500 426,000 424,000 418,500 418,000 412,875 402,500 399,000 398,250 388,938 385,725 383,000 365,000 365,345 400,000 330,000 380,513 373,565 373,000 365,475 350,000 315,000 340,000 310,000 310,000 352,188 336,263 335,750 328,213 328,073 300,000 280,000 400,000 325,000 300,000 300,000 300,000 250,000 250,000 235,000 215,000 220,000 321,000 317,800 308,000 307,938 305,250 299,250 296,382 269,688 255,625 246,163 245,638 231,550 130 . PAYDEN GLOBAL FUNDS PUBLIC LIMITED COMPANY SCHEDULE OF SIGNIFICANT PORTFOLIO MOVEMENTS (continued) Payden Global Inflation Linked Bond Fund Purchases Holdings United Kingdom Gilt Inflation Linked 0.750% 22-Mar-2034 United States Treasury Inflation Indexed Bonds 0.250% 15-Jan-2025 United States Treasury Inflation Indexed Bonds 0.125% 15-Apr-2018 United Kingdom Gilt Inflation Linked 2.500% 17-Jul-2024 Italy Buoni Poliennali Del Tesoro 2.600% 15-Sep-2023 France Government Bond OAT 3.150% 25-Jul-2032 Italy Buoni Poliennali Del Tesoro 2.100% 15-Sep-2021 Italy Buoni Poliennali Del Tesoro 2.350% 15-Sep-2035 Italy Buoni Poliennali Del Tesoro 2.350% 15-Sep-2019 France Government Bond OAT 1.100% 25-Jul-2022 Italy Buoni Poliennali Del Tesoro 2.100% 15-Sep-2017 United Kingdom Gilt Inflation Linked 0.125% 22-Mar-2024 United States Treasury Inflation Indexed Bonds 0.125% 15-Apr-2017 United Kingdom Gilt Inflation Linked 0.500% 22-Mar-2050 Italy Buoni Poliennali Del Tesoro 2.550% 15-Sep-2041 United Kingdom Gilt Inflation Linked 0.625% 22-Nov-2042 Deutsche Bundesrepublik Inflation Linked Bond 0.500% 15-Apr-2030 United States Treasury Inflation Indexed Bonds 0.625% 15-Feb-2043 United Kingdom Gilt Inflation Linked 0.375% 22-Mar-2062 United States Treasury Inflation Indexed Bonds 2.125% 15-Feb-2041 2,041,142 3,857,477 3,296,425 300,000 1,124,180 791,798 1,173,480 706,266 817,508 748,972 801,080 509,130 725,060 300,422 320,949 181,139 302,364 356,808 109,110 214,274 Sales Holdings United States Treasury Inflation Indexed Bonds 0.125% 15-Apr-2018 Bundesrepublik Deutschland Bundesobligation Inflation Linked Bond 0.750% 15-Apr2018 United Kingdom Gilt Inflation Linked 0.750% 22-Mar-2034 United States Treasury Inflation Indexed Bonds 0.125% 15-Apr-2016 United Kingdom Gilt Inflation Linked 1.250% 22-Nov-2027 United States Treasury Inflation Indexed Bonds 0.125% 15-Jan-2022 Deutsche Bundesrepublik Inflation Linked Bond 0.500% 15-Apr-2030 United Kingdom Gilt Inflation Linked 1.125% 22-Nov-2037 United States Treasury Inflation Indexed Bonds 0.625% 15-Jul-2021 United Kingdom Gilt Inflation Linked 2.500% 16-Apr-2020 United States Treasury Inflation Indexed Bonds 2.125% 15-Feb-2041 United States Treasury Inflation Indexed Bonds 0.625% 15-Jan-2024 United Kingdom Gilt Inflation Linked 0.125% 22-Mar-2044 United Kingdom Gilt Inflation Linked 2.500% 26-Jul-2016 United States Treasury Inflation Indexed Bonds 0.250% 15-Jan-2025 United Kingdom Gilt Inflation Linked 0.125% 22-Mar-2068 United States Treasury Inflation Indexed Bonds 2.375% 15-Jan-2025 United States Treasury Inflation Indexed Bonds 0.125% 15-Jul-2022 United States Treasury Inflation Indexed Bonds 3.375% 15-Apr-2032 United Kingdom Gilt Inflation Linked 0.125% 22-Nov-2019 Italy Buoni Poliennali Del Tesoro 2.100% 15-Sep-2021 France Government Bond OAT 1.850% 25-Jul-2027 United States Treasury Inflation Indexed Bonds 1.375% 15-Jul-2018 Deutsche Bundesrepublik Inflation Linked Bond 1.750% 15-Apr-2020 United States Treasury Inflation Indexed Bonds 0.625% 15-Feb-2043 United Kingdom Gilt Inflation Linked 0.625% 22-Mar-2040 France Government Bond OAT 2.250% 25-Jul-2020 United Kingdom Gilt Inflation Linked 0.375% 22-Mar-2062 Canadian Government Bond 4.000% 01-Dec-2031 3,558,695 Proceeds USD 3,634,306 2,982,292 1,713,928 3,075,361 1,466,842 2,388,435 1,543,628 825,571 1,614,609 290,000 1,135,596 1,259,150 634,158 242,000 1,141,180 441,664 870,408 1,022,070 633,187 573,804 590,398 476,627 656,604 488,453 664,495 284,633 423,161 217,776 343,620 3,501,432 3,395,863 3,106,159 2,876,995 2,396,823 2,066,946 1,853,287 1,688,499 1,599,633 1,504,948 1,304,101 1,285,070 1,172,651 1,141,219 1,111,605 1,070,191 1,027,895 937,189 905,550 744,887 707,564 697,281 624,272 620,755 595,812 560,504 554,316 462,290 131 Cost USD 4,130,227 3,887,831 3,382,996 1,559,331 1,471,150 1,455,179 1,439,710 1,057,924 981,832 951,991 912,899 860,973 737,099 707,753 493,918 408,639 401,937 360,921 295,152 291,606 . PAYDEN GLOBAL FUNDS PUBLIC LIMITED COMPANY SCHEDULE OF SIGNIFICANT PORTFOLIO MOVEMENTS (continued) Payden Global Short Bond Fund* Purchases Holdings United States Treasury Note/Bond 0.500% 31-Jan-2017 United States Treasury Note/Bond 0.625% 15-Dec-2016 United States Treasury Note/Bond 1.000% 15-Sep-2017 United States Treasury Note/Bond 0.500% 30-Apr-2017 United States Treasury Note/Bond 0.625% 31-May-2017 United States Treasury Note/Bond 0.875% 15-Nov-2017 Japan Government Five Year Bond 0.300% 20-Jun-2015 Japan Government Two Year Bond 0.100% 15-Sep-2015 Italy Buoni Poliennali Del Tesoro 3.500% 01-Dec-2018 United States Treasury Note/Bond 0.375% 31-Oct-2016 United States Treasury Note/Bond 0.875% 15-Jul-2017 Japan Government Two Year Bond 0.100% 15-Apr-2016 Spain Government Bond 2.750% 30-Apr-2019 Australia Government Bond 5.500% 21-Jan-2018 New Zealand Government Bond 6.000% 15-Dec-2017 Japan Government Five Year Bond 0.300% 20-Sep-2015 United Kingdom Gilt 1.250% 22-Jul-2018 Goldman Sachs Group Inc 6.150% 01-Apr-2018 Spain Government Bond 3.800% 31-Jan-2017 CNH Equipment Trust 1.370% 15-Jul-2020 Delamare Cards floating rate 19-May-2019 8,200,000 7,000,000 6,800,000 6,600,000 6,590,000 6,100,000 450,000,000 450,000,000 2,890,000 3,610,000 3,350,000 300,000,000 1,840,000 2,570,000 2,430,000 220,000,000 1,100,000 1,550,000 1,400,000 1,700,000 1,100,000 Sales Holdings United States Treasury Note/Bond 0.500% 30-Apr-2017 United States Treasury Note/Bond 0.375% 31-Oct-2016 United States Treasury Note/Bond 0.500% 31-Jan-2017 United States Treasury Note/Bond 0.875% 15-Jul-2017 United States Treasury Note/Bond 0.750% 15-Jan-2017 Goldman Sachs Group Inc floating rate 29-Oct-2019 United States Treasury Note/Bond 0.875% 15-Nov-2017 United Kingdom Gilt 1.000% 07-Sep-2017 United States Treasury Note/Bond 0.750% 28-Feb-2018 Penarth Master Issuer PLC floating rate 18-Mar-2022 Finland Government Bond 3.875% 15-Sep-2017 United States Treasury Note/Bond 0.625% 15-Dec-2016 United States Treasury Note/Bond 0.875% 30-Apr-2017 United States Treasury Note/Bond 1.000% 15-Sep-2017 RCI Banque SA floating rate 27-Nov-2017 GE Capital UK Funding floating rate 20-Mar-2017 Reynolds American Inc 2.300% 12-Jun-2018 BAT International Finance PLC 1.850% 15-Jun-2018 UBS AG/Stamford CT 1.375% 14-Aug-2017 Barclays Bank PLC 2.250% 22-Feb-2017 6,600,000 5,360,000 5,100,000 2,025,000 1,200,000 800,000 850,000 530,000 755,000 400,000 500,000 550,000 400,000 390,000 350,000 250,000 330,000 300,000 300,000 250,000 * See Note 1. 132 Cost USD 8,193,863 7,011,068 6,834,920 6,585,585 6,584,535 6,107,055 3,711,374 3,659,824 3,606,506 3,605,188 3,365,266 2,501,945 2,233,136 2,189,624 1,903,668 1,793,459 1,752,786 1,728,606 1,720,893 1,699,871 1,683,856 Proceeds USD 6,582,469 5,348,781 5,097,150 2,033,773 1,205,433 888,141 851,425 800,444 751,665 611,906 588,308 551,311 402,108 392,360 390,615 375,561 332,294 300,675 300,000 288,925 . PAYDEN GLOBAL FUNDS PUBLIC LIMITED COMPANY SCHEDULE OF SIGNIFICANT PORTFOLIO MOVEMENTS (continued) Payden Sterling Corporate Bond Fund – Investment Grade Total Purchases Holdings United Kingdom Gilt 1.750% 07-Sep-2022 Total Capital International SA 2.250% 09-Jun-2022 Abbey National Treasury Services PLC/London 1.875% 17-Feb-2020 United Kingdom Gilt 1.250% 22-Jul-2018 Nordea Bank AB 2.375% 02-Jun-2022 Lloyds Bank PLC 2.500% 01-Jun-2022 Southern Gas Networks PLC 4.875% 05-Oct-2023 Virgin Money PLC 2.250% 21-Apr-2020 National Australia Bank Ltd 1.875% 20-Feb-2020 Suncorp-Metway Ltd floating rate 06-Oct-2017 GE Capital UK Funding floating rate 16-Jan-2018 PACCAR Financial Europe BV 1.513% 29-May-2018 Nationwide Building Society 2.250% 29-Apr-2022 BUPA Finance PLC 5.000% 25-Apr-2023 Total Sales 350,000 350,000 350,000 300,000 300,000 300,000 250,000 270,000 250,000 200,000 200,000 150,000 150,000 100,000 Holdings BG Energy Capital PLC 5.125% 07-Dec-2017 Tesco PLC 6.125% 24-Feb-2022 Lloyds Bank PLC 2.750% 09-Dec-2018 United Kingdom Gilt 1.250% 22-Jul-2018 Marks & Spencer PLC 6.125% 02-Dec-2019 Anheuser-Busch InBev NV 4.000% 24-Sep-2025 GE Capital UK Funding floating rate 20-Mar-2017 United Kingdom Gilt 1.750% 07-Sep-2022 Next PLC 5.375% 26-Oct-2021 BUPA Finance PLC 3.375% 17-Jun-2021 Abbey National Treasury Services PLC/London 1.875% 17-Feb-2020 133 350,000 350,000 350,000 300,000 300,000 300,000 250,000 270,000 250,000 200,000 200,000 Cost GBP 358,061 349,468 346,658 302,888 298,398 297,477 294,973 267,991 249,370 200,346 200,000 150,000 148,881 107,206 Proceeds GBP 381,850 327,741 309,510 303,305 289,118 279,778 199,230 198,138 117,548 104,961 99,653 . PAYDEN GLOBAL FUNDS PUBLIC LIMITED COMPANY SCHEDULE OF SIGNIFICANT PORTFOLIO MOVEMENTS (continued) Payden Sterling Reserve Fund Purchases Holdings Toronto-Dominion Bank floating rate 19-Jan-2018 Leeds Building Society floating rate 09-Feb-2018 FMS Wertmanagement AoeR 1.000% 10-Apr-2018 DNB Boligkreditt AS floating rate 17-Feb-2020 Motor 2015-1 PLC floating rate 25-Jun-2022 Swedbank Hypotek AB floating rate 02-Apr-2018 Kommunekredit 1.125% 07-Dec-2018 Canadian Imperial Bank of Commerce/Canada 0.762% 15-Jan-2018 Volkswagen Financial Services NV 2.000% 23-Oct-2015 Bank of Montreal 0.758% 29-Jan-2018 ASB Finance Ltd/London floating rate 01-May-2018 Pohjola Bank OYJ 1.017% 21-May-2018 Caisse d'Amortissement de la Dette Sociale 1.000% 07-Mar-2018 GE Capital UK Funding 1.000% 16-Jan-2018 E-Carat 5 PLC 0.907% 18-Apr-2023 Penarth Master Issuer PLC 1.007% 18-Mar-2021 National Australia Bank Ltd 1.875% 20-Feb-2020 Coventry Building Society 0.873% 17-Mar-2020 Lloyds Bank PLC 0.759% 19-Jan-2018 Nationwide Building Society 0.771% 27-Apr-2018 Bank of Nova Scotia floating rate 02-Nov-2017 Bayerische Landesbank 0.757% 20-Feb-2015 5,500,000 5,500,000 5,500,000 5,000,000 5,000,000 5,000,000 4,700,000 4,500,000 4,000,000 4,000,000 4,000,000 4,000,000 3,500,000 3,350,000 3,000,000 2,850,000 2,750,000 2,500,000 2,000,000 2,000,000 1,250,000 1,000,000 Sales Holdings HSBC Bank PLC 0.955% 16-May-2016 Leeds Building Society 2.060% 20-Mar-2015 State of North Rhine-Westphalia 1.195% 23-May-2016 Pohjola Bank OYJ 1.107% 09-Nov-2015 European Investment Bank 0.755% 22-Feb-2017 ASB Finance Ltd/London floating rate 13-Mar-2017 GE Capital UK Funding 0.710% 20-Mar-2017 Finland Government International Bond 0.735% 23-Feb-2017 Asian Development Bank 0.607% 08-Feb-2016 Inter-American Development Bank 0.625% 15-Dec-2015 FMS Wertmanagement AoeR 0.750% 15-Dec-2017 National Australia Bank Ltd 3.625% 08-Nov-2017 Svenska Handelsbanken AB 0.957% 10-May-2016 Motor 2014-1 PLC floating rate 25-Aug-2021 Landwirtschaftliche Rentenbank 3.250% 07-Dec-2016 Svensk Exportkredit AB 0.875% 15-Dec-2015 Lloyds Bank PLC 2.210% 22-Mar-2017 Australia & New Zealand Banking Group Ltd 0.828% 04-Feb-2016 Nederlandse Waterschapsbank NV 2.125% 07-Sep-2016 FMS Wertmanagement AoeR 1.125% 07-Dec-2016 Cooperatieve Centrale Raiffeisen-Boerenleenbank BA/Netherlands 1.157% 07-Sep-2015 Nordea Eiendomskreditt AS 0.750% 11-Sep-2017 Kingdom of Belgium 5.000% 24-Apr-2018 Cooperatieve Centrale Raiffeisen-Boerenleenbank BA/Netherlands 4.000% 10-Sep-2015 Network Rail Infrastructure Finance PLC 1.125% 15-Dec-2016 Bayerische Landesbank 0.757% 20-Feb-2015 5,400,000 5,150,000 5,000,000 4,600,000 4,350,000 4,100,000 3,950,000 3,500,000 3,100,000 3,000,000 3,000,000 2,500,000 2,600,000 2,575,524 2,000,000 2,000,000 1,850,000 1,550,000 1,500,000 1,500,000 1,500,000 1,500,000 1,240,000 1,000,000 1,000,000 1,000,000 134 Cost GBP 5,500,000 5,500,000 5,488,890 5,000,000 5,000,000 5,000,000 4,690,459 4,500,000 4,025,200 4,000,000 4,000,000 4,000,000 3,487,260 3,350,000 3,000,000 2,852,850 2,743,070 2,500,000 2,000,000 2,000,000 1,250,388 1,000,108 Proceeds GBP 5,418,780 5,158,137 5,036,360 4,612,788 4,368,053 4,117,097 3,934,793 3,514,960 3,102,697 3,001,950 2,980,530 2,652,800 2,608,190 2,578,743 2,082,240 2,003,480 1,910,218 1,552,310 1,534,800 1,506,600 1,504,950 1,500,750 1,387,560 1,008,700 1,007,200 1,000,150 . PAYDEN GLOBAL FUNDS PUBLIC LIMITED COMPANY SCHEDULE OF SIGNIFICANT PORTFOLIO MOVEMENTS (continued) Payden US Core Bond Fund Purchases Holdings United States Treasury Note/Bond 1.625% 31-Dec-2016 United States Treasury Note/Bond 1.375% 29-Feb-2020 United States Treasury Note/Bond 1.500% 31-May-2020 Fannie Mae Pool 4.000% 01-Mar-2045 United States Treasury Note/Bond 2.000% 15-Feb-2025 Fannie Mae Pool 4.000% 01-Jul-2045 Fannie Mae Pool 4.000% 01-May-2045 Fannie Mae Pool 4.000% 01-Jun-2045 Federal Farm Credit Banks floating rate 17-Jan-2018 United States Treasury Note/Bond 3.000% 15-Nov-2044 Fannie Mae Pool 4.000% 01-Apr-2046 United States Treasury Note/Bond 0.500% 15-Jun-2016 United States Treasury Note/Bond 0.750% 15-Feb-2018 Fannie Mae Pool 4.500% 01-Jul-2045 Fannie Mae Pool 4.000% 01-Feb-2045 Fannie Mae Pool 3.000% 25-May-2030 Fannie Mae Pool 3.000% 31-Mar-2030 Fannie Mae Pool 3.000% 01-Apr-2031 Fannie Mae Pool 3.000% 15-Jun-2027 Fannie Mae Pool 3.000% 01-Jul-2030 Fannie Mae Pool 4.500% 01-May-2045 Fannie Mae Pool 4.500% 01-Jun-2045 Fannie Mae Pool 4.500% 01-Mar-2045 Fannie Mae Pool 4.500% 01-Apr-2046 Fannie Mae Pool 4.500% 01-Feb-2045 United States Treasury Floating Rate Note 31-Jan-2017 Ginnie Mae II Pool 4.500% 01-Jun-2045 Ginnie Mae II Pool 4.500% 01-Jul-2043 Mexico Government International Bond 3.625% 15-Mar-2022 Fannie Mae Pool 3.000% 15-Jul-2045 United States Treasury Floating Rate Note 2.250% 15-Nov-2024 1,280,000 1,225,000 1,070,000 880,000 865,000 580,000 540,000 540,000 540,000 505,000 500,000 530,000 530,000 450,000 430,000 400,000 400,000 400,000 400,000 400,000 380,000 380,000 380,000 380,000 360,000 360,000 320,000 320,000 265,000 260,000 255,000 135 Cost USD 1,288,050 1,220,870 1,067,325 939,717 858,599 614,095 577,063 574,678 540,004 536,755 531,816 531,491 529,172 486,745 458,958 419,078 417,875 416,813 415,953 414,297 413,766 412,622 412,080 411,889 390,570 360,054 346,500 345,300 275,043 259,261 258,845 . PAYDEN GLOBAL FUNDS PUBLIC LIMITED COMPANY SCHEDULE OF SIGNIFICANT PORTFOLIO MOVEMENTS (continued) Payden US Core Bond Fund (continued) Sales Holdings United States Treasury Note/Bond 1.750% 30-Sep-2019 United States Treasury Note/Bond 1.625% 31-Dec-2016 United States Treasury Note/Bond 1.375% 29-Feb-2020 Fannie Mae Pool 4.000% 01-Mar-2045 United States Treasury Note/Bond 2.000% 15-Feb-2025 Fannie Mae Pool 4.000% 01-May-2045 Fannie Mae Pool 4.000% 01-Jun-2045 Fannie Mae Pool 4.000% 01-Apr-2046 United States Treasury Note/Bond 1.000% 15-Dec-2017 United States Treasury Note/Bond 0.500% 15-Jun-2016 United States Treasury Note/Bond 0.750% 15-Feb-2018 United States Treasury Note/Bond 3.000% 15-Nov-2044 United States Treasury Strip Principal 0.000% 15-Nov-2040 Fannie Mae Pool 4.000% 25-Jan-2045 Fannie Mae Pool 4.000% 01-Feb-2045 United States Treasury Note/Bond 2.375% 15-Aug-2024 Fannie Mae Pool 3.000% 01-Apr-2031 Fannie Mae Pool 3.000% 31-Mar-2030 Fannie Mae Pool 3.000% 25-May-2030 Fannie Mae Pool 3.000% 15-Jun-2027 Fannie Mae Pool 4.500% 01-Apr-2046 Fannie Mae Pool 4.500% 01-May-2045 Fannie Mae Pool 4.500% 01-Mar-2045 Fannie Mae Pool 4.500% 01-Jun-2045 Fannie Mae Pool 4.500% 15-Jan-2045 Fannie Mae Pool 4.500% 01-Feb-2045 Ginnie Mae II Pool 4.500% 01-Jun-2045 United States Treasury Note/Bond 2.250% 15-Nov-2024 Fannie Mae Pool 4.500% 01-Jul-2045 Ginnie Mae I Pool 4.000% 15-Dec-2040 Ginnie Mae II Pool 4.000% 15-May-2045 Fannie Mae Pool 3.000% 01-Apr-2046 Ginnie Mae II Pool 4.000% 15-Feb-2045 Ginnie Mae II Pool 4.000% 01-Apr-2046 Ginnie Mae II Pool 4.000% 15-Mar-2045 Ginnie Mae II Pool 4.000% 15-May-2045 Fannie Mae Pool 3.000% 01-May-2045 Fannie Mae Pool 3.000% 15-Jun-2045 1,280,000 1,280,000 1,225,000 880,000 865,000 540,000 540,000 500,000 530,000 530,000 530,000 505,000 950,000 430,000 430,000 405,000 400,000 400,000 400,000 400,000 380,000 380,000 380,000 380,000 360,000 360,000 320,000 255,000 220,000 210,679 210,000 220,000 210,000 210,000 210,000 210,000 220,000 220,000 136 Proceeds USD 1,296,100 1,288,581 1,218,080 938,263 863,450 575,438 572,788 535,078 533,230 530,766 530,683 529,297 485,536 460,100 459,966 421,194 419,813 417,750 416,563 415,000 414,731 413,013 412,334 411,647 391,203 390,750 345,700 259,153 238,219 227,961 225,848 225,706 225,455 225,422 224,634 223,880 221,616 219,983 . PAYDEN GLOBAL FUNDS PUBLIC LIMITED COMPANY SCHEDULE OF SIGNIFICANT PORTFOLIO MOVEMENTS (continued) Payden US Dollar Liquidity Fund Purchases Holdings United States Treasury Floating Rate Note 31-Jan-2017 United States Treasury Note/Bond 0.500% 30-Jun-2016 Federal Farm Credit Banks floating rate 16-Apr-2018 Federal Farm Credit Banks floating rate 26-Mar-2018 NCUA Guaranteed Notes Trust 2010-R2 floating rate 05-Nov-2020 United States Treasury Note/Bond 0.375% 15-Mar-2016 Mercedes Benz Auto Lease Trust 2015-A floating rate 15-Feb-2017 Federal Farm Credit Banks floating rate 02-Jan-2018 UBS AG/Stamford CT floating rate 26-Sep-2016 Carlyle Global Market Strategies 1.740% 27-Apr-2027 Babson CLO Ltd 2015-I 1.709% 20-Apr-2027 Octagon Investment Partners 24 Ltd 1.731% 21-May-2027 Symphony CLO XV Ltd 1.720% 17-Oct-2026 CNH Equipment Trust 2015-A 0.840% 15-Jun-2018 Navient Student Loan Trust 2015-1 floating rate 26-Sep-2022 CarMax Auto Owner Trust 2015-1 0.880% 15-Mar-2018 CarMax Auto Owner Trust 2015-2 0.820% 15-Jun-2018 DNB Boligkreditt AS 2.100% 14-Oct-2015 Nederlandse Waterschapsbank NV 1.250% 18-Sep-2017 QUALCOMM Inc floating rate 18-May-2018 Volkswagen Auto Lease Trust 2015-A 0.870% 20-Jun-2017 CNH Equipment Trust 0.840% 15-Aug-2018 MMAF Equipment Finance LLC 2015-A 0.960% 18-Sep-2017 Daimler Finance North America LLC floating rate 02-Mar-2017 Santander Drive Auto Receivables Trust 2015-1 0.320% 15-Mar-2016 AbbVie Inc 1.800% 14-May-2018 Colony American Homes Single-Family Rental Pass-Through Certificates 1.387% 17-Jul-2032 2,000,000 500,000 500,000 400,000 377,634 300,000 300,000 300,000 250,000 250,000 250,000 250,000 250,000 240,000 230,000 210,000 205,000 200,000 200,000 200,000 200,000 200,000 155,000 150,000 120,000 120,000 Cost USD 2,000,066 501,328 499,924 400,000 380,290 300,504 300,000 299,983 250,000 250,000 250,000 250,000 249,844 239,988 230,000 209,978 204,978 202,094 201,158 200,000 199,999 199,988 154,987 150,000 120,000 119,878 110,000 110,000 Sales Holdings United States Treasury Note/Bond 0.375% 31-Mar-2016 United States Treasury Note/Bond 0.250% 15-Aug-2015 United States Treasury Note/Bond 0.500% 30-Jun-2016 United States Treasury Note/Bond 0.375% 15-Mar-2016 United States Treasury Note/Bond 0.375% 31-Oct-2016 United States Treasury Note/Bond 0.250% 31-May-2015 United States Treasury Note/Bond 0.375% 15-Jan-2016 United States Treasury Note/Bond 0.375% 31-Jan-2016 United States Treasury Floating Rate Note 31-Oct-2016 Federal National Mortgage Association floating rate 16-Aug-2016 United States Treasury Floating Rate Note 30-Apr-2016 United States Treasury Floating Rate Note 31-Jan-2017 United States Treasury Floating Rate Note 31-Jul-2016 United States Treasury Note/Bond 0.875% 15-Nov-2017 United States Treasury Floating Rate Note 31-Jan-2016 US Bank NA/Cincinnati OH 0.439% 11-Sep-2017 Credit Suisse/New York NY floating rate 11-Mar-2016 Banque Federative du Credit Mutuel SA floating rate 20-Jan-2017 Nederlandse Waterschapsbank NV 0.750% 29-Mar-2016 International Finance Facility for Immunisation floating rate 05-Jul-2016 New York Life Global Funding floating rate 06-Sep-2016 Province of Ontario Canada 0.405% 01-Apr-2015 SLM Student Loan Trust 2014-1 floating rate 26-Jul-2021 PACCAR Financial Corp 1.100% 06-Jun-2017 1,500,000 1,500,000 1,200,000 1,200,000 900,000 800,000 775,000 700,000 700,000 500,000 500,000 400,000 400,000 300,000 275,000 250,000 250,000 200,000 200,000 200,000 200,000 190,000 175,000 165,000 Proceeds USD 1,502,402 1,500,938 1,202,906 1,201,669 898,793 800,531 776,076 701,012 699,804 500,277 500,064 400,092 400,022 299,063 274,966 249,830 249,818 201,294 200,640 200,214 200,050 190,048 174,754 164,728 137 . PAYDEN GLOBAL FUNDS PUBLIC LIMITED COMPANY SCHEDULE OF SIGNIFICANT PORTFOLIO MOVEMENTS (continued) Payden USD Low Duration Credit Fund Purchases Holdings United States Treasury Note/Bond 0.500% 31-Jan-2017 United States Treasury Note/Bond 1.625% 31-Dec-2019 Actavis Funding SCS 2.350% 12-Mar-2018 Goldman Sachs Group Inc 6.150% 01-Apr-2018 Credit Suisse/New York NY 1.750% 29-Jan-2018 Verizon Communications Inc 3.650% 14-Sep-2018 American International Group Inc 5.450% 18-May-2017 Jackson National Life Global Funding 2.300% 16-Apr-2019 Bank of Tokyo-Mitsubishi UFJ Ltd 2.450% 16-Oct-2019 The Alibaba Group Holding Ltd 1.625% 28-Nov-2017 Zimmer Biomet Holdings Inc 2.000% 01-Apr-2018 KeyBank NA 2.250% 16-Mar-2020 United States Treasury Note/Bond 1.250% 31-Jan-2020 Kennametal Inc 2.650% 01-Nov-2019 Capital One Financial Corp 6.150% 01-Sep-2016 HPHT Finance 15 Ltd 2.250% 17-Mar-2018 USAA Capital Corp 2.125% 03-Jun-2019 Astoria Financial Corp 5.000% 19-Jun-2017 Morgan Stanley 2.653% 27-Jan-2020 Lloyds Bank PLC 6.500% 14-Sep-2020 Huntington National Bank 1.300% 20-Nov-2016 BP Capital Markets PLC 2.315% 13-Feb-2020 Pernod Ricard SA 2.950% 15-Jan-2017 International Lease Finance Corp 3.875% 15-Apr-2018 Lam Research Corp 2.750% 15-Mar-2020 Santander Bank NA 2.000% 12-Jan-2018 Prudential Financial Inc floating rate 15-Jun-2038 Sumitomo Mitsui Banking Corp floating rate 16-Jan-2018 Telefonica Emisiones SAU 5.134% 27-Apr-2020 Phillips 66 2.646% 15-Feb-2020 Hyundai Capital America 1.875% 09-Aug-2016 Ally Financial Inc 3.250% 13-Feb-2018 TIAA Asset Management Finance Co LLC 2.950% 01-Nov-2019 Mitsubishi UFJ Trust & Banking Corp 1.600% 16-Oct-2017 Tingyi (CI) Holding Corp 3.875% 20-Jun-2017 Morgan Stanley 5.450% 09-Jan-2017 BNZ International Funding Ltd/London 1.900% 26-Feb-2018 Pricoa Global Funding 2.200% 16-May-2019 Hyundai Capital America 2.875% 09-Aug-2018 Sales 40,000,000 10,000,000 10,000,000 7,094,000 7,900,000 6,600,000 5,800,000 5,150,000 5,000,000 5,000,000 5,000,000 5,000,000 5,000,000 4,800,000 4,400,000 4,600,000 4,500,000 4,250,000 4,500,000 3,750,000 4,300,000 4,200,000 4,000,000 4,000,000 4,025,000 3,900,000 3,100,000 3,500,000 3,000,000 3,300,000 3,255,000 3,300,000 3,200,000 3,200,000 3,071,000 2,900,000 3,050,000 3,000,000 2,731,000 Holdings United States Treasury Note/Bond 0.500% 31-Jan-2017 Bear Stearns Cos LLC 5.550% 22-Jan-2017 Actavis Funding SCS 2.350% 12-Mar-2018 United States Treasury Note/Bond 1.625% 31-Dec-2019 Credit Suisse/New York NY 1.750% 29-Jan-2018 Goldman Sachs Group Inc 6.150% 01-Apr-2018 Ford Motor Credit Co LLC 6.625% 15-Aug-2017 Citigroup Inc 5.500% 15-Feb-2017 Verizon Communications Inc 3.650% 14-Sep-2018 TIAA Asset Management Finance Co LLC 2.950% 01-Nov-2019 Macquarie Group Ltd 4.875% 10-Aug-2017 Lloyds Bank PLC 6.500% 14-Sep-2020 International Lease Finance Corp 3.875% 15-Apr-2018 Capital One Financial Corp. 6.150% 01-Sep-2016 Bank of America Corp 5.420% 15-Mar-2017 Morgan Stanley 5.450% 09-Jan-2017 Korea Expressway Corp 1.625% 28-Apr-2017 Tencent Holdings Ltd 3.375% 02-May-2019 Want Want China Finance Ltd 1.875% 14-May-2018 JPMorgan Chase Bank NA 6.000% 05-Jul-2017 138 40,000,000 13,030,000 10,000,000 10,000,000 7,900,000 6,994,000 6,599,000 6,460,000 6,500,000 6,650,000 6,050,000 5,450,000 6,190,000 5,800,000 5,500,000 5,400,000 5,500,000 5,260,000 5,375,000 4,750,000 Cost USD 39,912,500 10,149,609 9,995,100 7,994,539 7,895,418 7,006,226 6,331,976 5,204,307 5,041,050 5,002,050 4,996,600 4,992,300 4,924,023 4,803,216 4,710,932 4,590,202 4,527,675 4,511,843 4,496,040 4,394,001 4,305,891 4,200,000 4,114,710 4,099,750 4,021,619 3,886,116 3,665,750 3,508,365 3,384,870 3,300,000 3,286,631 3,276,702 3,260,452 3,204,352 3,170,952 3,113,817 3,049,116 3,017,430 2,800,586 Proceeds USD 39,930,352 13,940,367 10,122,530 10,064,131 7,901,501 7,840,868 7,329,661 6,928,608 6,902,740 6,809,467 6,477,142 6,398,224 6,290,588 6,181,402 5,875,051 5,779,955 5,501,601 5,453,321 5,334,274 5,227,005 . PAYDEN GLOBAL FUNDS PUBLIC LIMITED COMPANY SCHEDULE OF SIGNIFICANT PORTFOLIO MOVEMENTS (continued) Payden World Equity Fund Total Purchases Holdings Japan Government Two Year Bond 0.100% 15-Sep-2015 Japan Government Five Year Bond 0.300% 20-Jun-2015 Japan Government Two Year Bond 0.100% 15-Apr-2015 Japan Government Two Year Bond 0.100% 15-Aug-2015 Japan Government Five Year Bond 0.300% 20-Sep-2015 Japan Government Five Year Bond 0.400% 20-Jun-2015 400,000,000 250,000,000 250,000,000 250,000,000 250,000,000 210,000,000 There were no sales during the period for Payden World Equity Fund. 139 Cost USD 3,250,912 2,103,118 2,101,332 2,080,425 2,034,313 1,730,281 .
Sarni (American) *Independent non-executive directors Sponsoring Broker From 25 March 2015 Maples and Calder 75 St Stephen’s Green Dublin 2 Ireland Secretary From 25 March 2015 MFD Secretaries Limited 2nd floor Beaux Lane House Mercer Street Lower Dublin 2 Ireland Until 24 March 2015 Arthur Cox Listing Services Limited Arthur Cox Building Earlsfort Centre Earlsfort Terrace Dublin 2 Ireland Until 24 March 2015 Bradwell Limited Arthur Cox Building Earlsfort Centre Earlsfort Terrace Dublin 2 Ireland Administrator and Registrar Brown Brothers Harriman Fund Administration Services (Ireland) Limited 30 Herbert Street Dublin 2 Ireland Assistant Secretary Edward Garlock 333 South Grand Avenue Los Angeles California 90071 USA Independent Auditors Deloitte & Touche Chartered Accountants and Statutory Audit Firm Deloitte & Touche House Earlsfort Terrace Dublin 2 Ireland Investment Manager, Distributor and UK Facilities Agent Payden & Rygel Global Limited 1 Bartholomew Lane London EC2N 2AX England Promoter and Sub-Investment Manager for all Funds Payden & Rygel 333 South Grand Avenue Los Angeles California 90071 USA Custodian Brown Brothers Harriman Trustee Services (Ireland) Limited 30 Herbert Street Dublin 2 Ireland 2 . PAYDEN GLOBAL FUNDS PUBLIC LIMITED COMPANY DIRECTORS AND OTHER INFORMATION (continued) Legal Advisors - Ireland From 25 March 2015 Maples and Calder 75 St Stephen’s Green Dublin 2 Ireland Legal Advisors - United States of America K&L Gates LLP 1800 Massachusetts Avenue N.W. Washington D.C. 20036-1800 USA Until 24 March 2015 Arthur Cox Arthur Cox Building Earlsfort Centre Earlsfort Terrace Dublin 2 Ireland Paying Agent and Information Agent in Germany* B. Metzler seel. Sohn & Co KGaA, Große Gallusstraße 18 60311 Frankfurt am Main Germany Paying Agent in Luxembourg The Bank of New York (Luxembourg) S.A Aerogolf Centre 1A Hoehenhof, L-1736 Senningerberg Luxembourg Centralising Correspondent in France CACEIS Bank France 1-3 Place Valhubert 75013, Paris France * The prospectus, the KIID, the articles, the annual and semi-annual reports, a list of changes in the composition of the portfolios as well as the issue and redemption prices are available free of charge pursuant to Sec.
297(1) of the German Capital Investment Code from the office of the German information agent as set out above. For investors in Germany: No notification pursuant to Section 310 of the German Capital Investment Code (Kapitalanlagegesetzbuch) has been filed for the following sub-funds and the shares in these sub-funds may not be marketed to investors in the Federal Republic of Germany: Payden Absolute Return Bond Fund Payden Global Corporate Bond Fund1 Payden Global Emerging Markets Corporate Bond Fund Payden Global Government Bond Index Fund Payden Global Inflation-Linked Bond Fund Payden Global Short Bond Fund2 Payden Sterling Corporate Bond Fund - Investment Grade Payden Sterling Reserve Fund Payden US Core Bond Fund Payden US Dollar Liquidity Fund Payden USD Low Duration Credit Fund Payden World Equity Fund (1) This Fund changed name from Payden Global Corporate Bond Fund – Investment Grade on 24 March 2015. (2) This Fund changed name from Payden International Short Bond Fund on 24 March 2015. 3 . PAYDEN GLOBAL FUNDS PUBLIC LIMITED COMPANY HALF – YEARLY MANAGEMENT REPORT FOR THE PERIOD ENDED 30 JUNE 2015 Business review The results of the operations are set out on the Condensed Profit and Loss Account. Further information on risk management objectives and policies are detailed below. As at 30 June 2015, 31 December 2014 and 30 June 2014 the assets under management for Payden Global Funds public limited company’s (the ‘‘Company’’) sub-funds (individually referred as the ‘‘Fund’’ and collectively as the ‘‘Funds’’): Currency 30 June 2015 31 December 2014* 30 June 2014* 65,423,105 Payden Absolute Return Bond Fund USD 94,002,612 75,145,380 Payden Euro Liquidity Fund EUR 86,943,660 56,822,888 16,891,562 Payden Global Bond Fund(1) USD 217,342,131 243,755,321 239,101,601 Payden Global Emerging Markets Bond Fund USD 109,701,842 137,271,770 176,546,780 Payden Global Emerging Markets Corporate Bond Fund USD 49,689,785 49,455,926 47,828,938 Payden Global Emerging Markets Local Bond Fund2) USD – – 11,992,721 Payden Global Government Bond Index Fund USD 128,397,521 126,813,411 120,702,659 Payden Global High Yield Bond Fund USD 76,459,804 81,344,857 81,777,916 Payden Global Inflation - Linked Bond Fund USD 72,708,301 92,637,808 94,071,510 USD 185,050,072 55,856,362 61,463,769 GBP 17,571,213 17,586,488 16,856,242 Payden Global Short Bond Fund (3) Payden Sterling Corporate Bond Fund - Investment Grade (4) GBP – – – Payden Sterling Reserve Fund GBP 278,890,319 281,601,654 315,446,539 Payden US Core Bond Fund USD 16,733,862 17,763,299 24,328,981 Payden US Dollar Liquidity USD 18,211,394 27,272,153 9,736,035 Payden USD Low Duration Credit Fund USD 8,565,899 511,635,315 492,328,839 Payden World Equity Fund USD 38,837,168 31,726,883 31,894,874 Total Company USD 1,578,818,060 1,985,946,118 2,048,512,708 Payden Sterling Liquidity Fund (1) This Fund changed name from Payden International Bond Fund on 24 March 2015. (2) This Fund terminated on 12 December 2014 and was subsequently revoked by the Central Bank of Ireland. (3) This Fund changed name from Payden International Short Bond Fund on 24 March 2015. (4) This Fund terminated on 25 June 2014 and was subsequently revoked by the Central Bank of Ireland. * Prior figures have been restated to comply with recent updates to the accounting standards. See Note 2. Dividends The distributions for the period are set out in note 7 to the financial statements. Significant events during the period Significant events during the period are set out in note 12 to the financial statements. Subsequent events Subsequent events are set out in note 13 to the financial statements. Risk management objectives and policies The Company’s investment activities expose it to the various types of risk, which are associated with the financial instruments and markets in which it invests. Details of the risks inherent in investing in the Company are available in the Company Prospectus. Related parties Related parties of the Company are set out in note 9 to the financial statements. Responsibility statement The Board of Directors confirm that the condensed financial statements have been prepared in accordance with the Financial Reporting Council’s FRS 104 “Interim Financial Reporting” and the interim management report includes a fair review of the information required by the Transparency Directive (Directive 2004/109/EC) Regulations 2007 (the ‘‘Transparency Directive”). 4 .
PAYDEN GLOBAL FUNDS PUBLIC LIMITED COMPANY INVESTMENT MANAGER’S REPORT FOR THE PERIOD PERIOD ENDED 30 JUNE 2015 Strategy overview – H1 2015 Developed government bond markets came under pressure in the first six months of 2015, on improving economic data during the second half of the period and easing concerns over the outcome of Greece’s negotiations with the European Central Bank (ECB). US Treasuries were also undermined by heavy issuance levels in May and strong payrolls data in June, which convinced markets that the initially weak US Q1 GDP reading was in fact weather-related rather than a sign of a sustained loss of momentum in the US recovery. Nonetheless, US Treasuries outperformed other developed sovereign bond markets due to their relatively attractive yields, recording only a slightly negative outright return of -0.07% (BofA Merrill Lynch US Treasury & Agency Index) during H1 2015. UK Gilts underperformed US Treasuries, returning -1.43% following better than expected UK employment data and a more hawkish tone from the Bank of England’s Monetary Policy Committee. German Bunds returned -1.01% during the period, partly in response to regional inflation data, which served to ease concerns about deflation. Peripheral Euro-zone sovereign debt markets also registered negative returns despite the bond supportive impact of the ECB’s asset purchasing programme.
Spanish sovereign bonds lost 2.28% while Italian bonds declined 0.84%. Spanish government bond markets came under particular pressure during the second quarter, as the emergence of anti-austerity parties in local and regional Spanish elections fuelled fears of the rise of reform-unfriendly political parties in countries other than Greece. Investment grade credit spreads widened during the second half of H1 with US IG corporate bond markets returning -0.46% over the period, while high yield and emerging market sectors both outperformed core government bonds, making outright gains of 2.48% and 1.04% respectively. In equity markets, the MSCI Developed World Index returned 1.5% over the period, as improving global economic data and a surge in mergers and acquisitions activity offset some of the market weakness from profit-taking during the first quarter of 2015 and the market sell-off over the final week in June due to a sudden but short-lived spike in uncertainties related to Greek crisis. In the currency markets the US Dollar was generally higher against the major crosses excluding Sterling, which, like the US Dollar, was supported by strong domestic economic data. The Euro weakened in reaction to the ECB’s latest quantitative easing steps and persistent tensions between Greece and its creditors, while the Australian Dollar was undermined by weak commodity prices. 5 .
PAYDEN GLOBAL FUNDS PUBLIC LIMITED COMPANY INVESTMENT MANAGER’S REPORT FOR THE PERIOD ENDED 30 JUNE 2015 (continued) Payden Absolute Return Bond Fund The Payden Absolute Return Bond Fund (US Dollar Accumulating share class) returned a net +1.09% over the six month period ended 30 June 2015. The currency hedged shares of the Fund realised returns as follow: the Sterling shares returned +1.21%, and the Euro shares returned +0.90%. The Fund’s duration ended the period at 1.99 years, up from 1.33 years at the end of 2014. The gross current yield of the Fund ended the period at 3.03%. The top contributors to Fund performance over the period were high yield corporate holdings, emerging markets debt and non-agency MBS holdings, all of which recovered from price declines seen in late 2014 related to energy market volatility. Return detractors included holdings in high-quality government and corporate sectors which fell in value as yields moved higher globally. Portfolio Characteristics As of 30 June 2015 Sector Allocation Credit Allocation Asset-backed 36% AAA Corporates 33% AA Covered 16% A Government/ Gov't Related 12% BBB BB and Below Bank Loans 2% Duration Allocation 19% 0 - 1 years 41% 5% 1 - 3 years 16% 16% 3 - 5 years 31% 31% 5 - 7 years 9% 26% 7+ years 3% 3% Unrated Payden Euro Liquidity Fund The Payden Euro Liquidity Fund (Accumulating share class) returned a net +0.23% in the six months period ending June 2015. Fund duration at the end of June was 0.78 years, 0.20 years lower than the 0.98 years at which it began the year, as we reduced the Fund’s sensitivity to potential interest rate rises.
The Fund’s gross yield to maturity ended at 0.34%. The Fund’s positions in Euro-denominated fixed and floating rate corporate bonds, agencies and asset-backed securities all made positive returns over the period, while its overweight duration positioning detracted, as the rates increased. Portfolio Characteristics As of 30 June 2015 Sector Allocation Credit Allocation Domicile of Issuers Corporates 50% AAA 17% Euroland 55% Covered 21% AA 21% United States 13% Asset-backed 13% A 35% United Kingdom 10% Government/ Gov't Related 11% BBB 27% Scandinavia 5% Australia 3% New Zealand 3% Switzerland 2% Canada 2% Other 7% Commercial paper 4% Unrated 0% 6 . PAYDEN GLOBAL FUNDS PUBLIC LIMITED COMPANY INVESTMENT MANAGER’S REPORT FOR THE PERIOD ENDED 30 JUNE 2015 (continued) Payden Global Bond Fund* The Payden Global Bond Fund (US Dollar share class) returned a net -0.38% over the six month period ended 30 June 2015. The currency hedged shares of the Fund made returns as follow: the Sterling shares returned -0.18%, the Euro shares returned -0.53% and the Norwegian Kroner shares returned +0.08%. Fund duration started the period at 7.5 years and ended the half year at 7.0 years as we reduced the Fund’s sensitivity to potential interest rate rises. The Fund’s gross yield to maturity of the base currency share class ended the period at 1.89%. The primary favourable drivers of the Fund’s performance over the period were its currency positioning and exposure to investment grade corporate bonds. However, gains from these sources were offset by losses due to the Fund’s holdings in emerging markets bonds. Portfolio Characteristics As of 30 June 2015 Sector Allocation Credit Allocation Duration Allocation Governments 68% AAA 25% 0 - 1 years 3% Corporates 19% AA 15% 1 - 3 years 28% A 25% 3 - 5 years 17% BBB 35% 5 - 7 years 6% 7 - 10 years 19% 10+ years 27% Covered 9% *This Fund changed name from Payden International Bond Fund on 24 March 2015. 7 .
PAYDEN GLOBAL FUNDS PUBLIC LIMITED COMPANY INVESTMENT MANAGER’S REPORT FOR THE PERIOD ENDED 30 JUNE 2015 (continued) Payden Global Emerging Markets Bond Fund The Payden Global Emerging Markets Bond Fund (USD Accumulating share class) returned a net –0.24% over the six month period ended 30 June 2015. The currency hedged shares of the Fund returns were as follows: the Sterling shares returned -0.24% and the Euro shares returned -0.62%. Fund duration started the period at 6.63 years and ended the half year at 6.46 years as we reduced the Fund’s sensitivity to potential interest rate rises. The Fund’s gross yield to maturity of the base currency share class ended the period at 6.78%. The Fund’s performance reflected muted returns for the asset class during the period. The Fund benefitted from a lower allocation to local markets and a tilt to corporate bonds.
Specifically, an underweight exposure to Indonesian and Malaysian local markets benefitted returns, as did off-index allocations to Colombian, Peruvian and Mexican corporates. In sovereigns, positive contributions from Honduras and Argentina offset an underweight to recovering Russian bonds. Quasi-sovereign bonds detracted, in particular positions in long-dated securities of Mexico’s state-owned oil company, PEMEX. Portfolio Characteristics As of 30 June 2015 Sector Allocation Credit Allocation Top-10 Country Allocation Government/ Gov't Related 76% A and Above 13% Mexico 7% Corporates 21% BBB 47% Turkey 5% BB 17% Brazil 5% B 17% Indonesia 4% CCC 5% Colombia 3% Unrated 1% S.Africa 3% Poland 3% United Kingdom 3% Panama 3% Romania 3% Money Markets 3% Other 8 61% . PAYDEN GLOBAL FUNDS PUBLIC LIMITED COMPANY INVESTMENT MANAGER’S REPORT FOR THE PERIOD ENDED 30 JUNE 2015 (continued) Payden Global Emerging Markets Corporate Bond Fund The Payden Global Emerging Markets Corporate Bond Fund (USD Distributing Share Class) returned a net +2.48% over the six month period ended 30 June 2015. The Swiss Franc share class returned +1.90%. Fund duration started the period at 4.9 years and ended the half year marginally higher at 5.1 years. The Fund’s gross yield to maturity ended the period at 5.76%. Despite a move higher in US Treasury rates, the strategy posted a positive total return due to enhanced income earned and credit spread tightening. An above index allocation to below investment grade rated corporates was beneficial, but selection among issuers detracted.
Holdings in Russian telecom and manufacturing and Mexican cement outperformed but did not offset underperformance related to exposure to Chinese real estate and retail, a Peruvian bottler, a Dominican utility, and a Colombian pipeline company. Underweights to Indonesian coal and Kazakh banks also detracted. Selection within investment grade corporate issuers was a positive.
Mexican utilities and telecoms, UAE banking, and a Qatari natural gas operator outperformed. An allocation to government owned entities, as well as sovereign debt of Kazakhstan, Sri Lanka, Senegal and Costa Rica, among others, had little impact over the period. Portfolio Characteristics As of 30 June 2015 Sector Allocation Credit Allocation Top-10 Country Allocation Corporates 87% A and Above 20% Mexico Government/ Gov't Related 11% BBB 43% United States 8% BB 20% Chile 6% B 13% Money Markets 2% 10% Netherlands 4% CCC 3% Canada 4% Unrated 1% UAE 3% India 3% Turkey 3% Luxemburg 3% Indonesia 3% Other 9 53% . PAYDEN GLOBAL FUNDS PUBLIC LIMITED COMPANY INVESTMENT MANAGER’S REPORT FOR THE PERIOD ENDED 30 JUNE 2015 (continued) Payden Global Government Bond Index Fund In the six months to 30 June 2015, the Payden Global Government Bond Index Fund (Sterling Accumulating Class shares) returned a net -0.46%, the Swiss Franc Accumulating Class returned -1.55%, the Norwegian Krone Accumulating Class returned -0.22%, and the Singaporean Dollar share class returned -0.28%. Fund duration at the end of June 2015 was 7.22 years, about 0.25 years lower than at the beginning of the period as we reduced the Fund’s sensitivity to potential interest rate rises. The Fund’s gross yield to maturity ended at 1.21%. The Fund performed in line with the Citigroup World Government Bond Index (hedged to sterling), which posted a negative return of -0.37%. Portfolio Characteristics As of 30 June 2015 Country Allocation Credit Allocation Duration Allocation United States 32% AAA 48% 0 - 1 years 3% Euroland 31% AA 17% 1 - 3 years 24% Japan 21% A 23% 3 - 5 years 17% BBB 12% 5 - 7 years 15% United Kingdom 7% Australia 2% 7 - 10 years 17% Canada 2% 10+ years 24% Scandinavia 1% Mexico 1% Other 3% Payden Global High Yield Bond Fund The Payden Global High Yield Bond Fund (US Dollar share class) returned a net +2.54% net over the six month period ended 30 June 2015. The currency hedged shares of the Fund generated returns as follows: the Sterling shares returned +2.61%, the Swiss Franc shares returned +1.87% and the Canadian Dollar shares returned +2.80%. The Fund duration ended the half year at 4.3 years, and the Fund’s gross yield to maturity of the base currency share class ended the period at 5.8%. The Fund’s overweight to the single-B rating class benefited performance as single-Bs outperformed BB-rated bonds 3.2% versus 2.3%. The Fund’s overweight to the retail sector and security selection within this sector were also positive contributors as the sector returned 4.5% in the first half of 2015. Portfolio Characteristics As of 30 June 2015 Sector Allocation Credit Allocation Duration Allocation Consumer Non-Cyclical 21% BBB and Above 5% 0 - 1 years 7% Communications 18% BB 43% 1 - 3 years 18% Consumer Cyclical 15% B 47% 3 - 5 years 32% Financials 12% CCC 5% 5 - 7 years 41% Energy 11% 7 - 10 years 2% Industrials 7% Basic Materials 7% Utilities 2% Other* 2% * Includes Diversified and Technology. 10 .
PAYDEN GLOBAL FUNDS PUBLIC LIMITED COMPANY INVESTMENT MANAGER’S REPORT FOR THE PERIOD ENDED 30 JUNE 2015 (continued) Payden Global Inflation-Linked Bond Fund The Payden Global Inflation-Linked Bond Fund (US Dollar Accumulating class) returned +0.10%, net of fees, over the six month period ending 30 June 2015. The Sterling hedged (Distributing) share class returned +0.11% and the Sterling Unhedged (Distributing) share class returned -1.83%. Fund duration at the end of June 2015 was 12.4 years, about 0.2 years lower than at the beginning of the period as we reduced the Fund’s sensitivity to potential interest rate rises. The Fund’s gross nominal yield to maturity ended at 1.96%. Fund performance was in-line with the sector over the six month period. Portfolio Characteristics As of 30 June 2015 Country Distribution Credit Allocation Duration Allocation United States 45% AAA 53% 0 - 1 years 1% United Kingdom 32% AA 40% 1 - 3 years 14% France 9% BBB 7% 3 - 5 years 12% Italy 7% 5 - 7 years 11% Germany 3% 7 - 10 years 25% Canada 2% 10+ years 37% Payden Global Short Bond Fund* The Payden Global Short Bond Fund (US Dollar class) returned +0.89% over the six months period ending 30 June 2015. The Norwegian Accumulating share class returned +1.39%. Fund duration at the end of June was 1.51 years, decreased by 0.15 years over the six month period as we reduced the Fund’s sensitivity to potential interest rate rises. The Fund’s yield to maturity ended at 1.18%. The Fund’s exposure to investment-grade corporate bonds contributed positively during the first quarter of 2015 given spreads tightened as risk appetite increased.
However, some of these gains were partially offset by credit spread widening during the second quarter of 2015. The portfolio’s currency positioning made a positive contribution to performance, led by short JPY, EUR and NZD positions against the USD. Portfolio Characteristics As of 30 June 2015 Top-10 Country Allocation Sector Allocation Credit Allocation United States 47% Government/ Gov't Related 40% AAA Euroland 20% Corporates 26% AA 36% 8% United Kingdom 9% Asset-Backed 19% A 25% Japan 6% Covered 13% BBB 27% Australia 4% Commercial paper Canada 3% New Zealand 1% Scandinavia 1% Switzerland 1% Mexico 1% 2% 11 4% Unrated Other 7% * This Fund changed name from Payden International Short Bond Fund on 24 March 2015. BB and Below 0% . PAYDEN GLOBAL FUNDS PUBLIC LIMITED COMPANY INVESTMENT MANAGER’S REPORT FOR THE PERIOD ENDED 30 JUNE 2015 (continued) Payden Sterling Corporate Bond Fund – Investment Grade The Payden Sterling Corporate Bond Fund (Accumulating share class) returned a net -0.27% over the six months period ending June 2015. Fund duration at the end of June was 4.40 years, about 0.2 years lower than at the beginning of the period as we reduced the Fund’s sensitivity to potential interest rate rises. The Fund’s gross yield to maturity ended at 2.66%. Fund’s underweight duration positioning contributed to the relative performance, as UK rates increased over the period. However this was more than offset by the adverse impact of our higher beta stance as credit spreads widened. Portfolio Characteristics As of 30 June 2015 Sector Allocation Credit Allocation Domicile of Issuers Financials 30% AA 11% United Kingdom 43% Industrials 14% A 31% Euroland 25% Communications 13% BBB 56% United States 14% Consumer Cyclical 10% BB and Below Consumer Non-Cyclical 10% 2% Jersey 7% Australia 4% Basic Materials 6% Scandinavia 3% Utilities 5% Mexico 2% Energy 4% Other 2% Government 4% Technology 2% Diversified 2% 12 . PAYDEN GLOBAL FUNDS PUBLIC LIMITED COMPANY INVESTMENT MANAGER’S REPORT FOR THE PERIOD ENDED 30 JUNE 2015 (continued) Payden Sterling Reserve Fund The Payden Sterling Reserve Fund (Accumulating share class) made a net return of +0.26% in the six months period ending June 2015. Fund duration at the end of June was 0.72 years, reduced by 0.12 years over the period as we reduced the Fund’s sensitivity to potential interest rate rises. The Fund’s gross yield to maturity ended at 0.91%. Performance was assisted by the Fund’s overweight duration positioning during the first quarter of 2015 as rates declined and by the positive performance of its holdings of high quality, short dated corporate bonds. We allowed our duration to decline through the second quarter as government bond yields climbed, however duration positioning still detracted marginally from relative returns in the second quarter, but not sufficiently to fully offset gains made in the first quarter. Portfolio Characteristics As of 30 June 2015 Sector Allocation Credit Allocation Domicile of Issuers Covered 37% A1/P1 9% Corporates 25% AAA 57% United Kingdom 39% Euroland 24% Government/ Gov't Related 24% AA+ 8% Scandinavia 13% Asset-Backed 13% AA 8% Canada 10% AA- 18% New Zealand 6% Australia 2% Switzerland 2% United States 2% Supranational 2% Payden US Core Bond Fund The Payden US Core Bond Fund (US Dollar share class) returned a net +0.20% over the six month period ended 30 June 2015. Fund duration started the period at 5.0 years and ended the half year at 4.7 years as we reduced the Fund’s sensitivity to potential interest rate rises. The Fund’s gross yield to maturity ended the period at 2.66%. The primary driver of the Fund’s performance over the period was its open currency positions which favored a stronger US Dollar (USD).
Over the period the USD strengthened by two to five percent on improved US economic fundamentals relative to global peers. Bond selection within investment grade corporate bonds, which favors 5-10 year financial and BBB-rated corporate issuers added to performance. Additionally, the Fund’s underweight to duration added to performance due to a shift higher in bond yields over the period. Portfolio Characteristics As of 30 June 2015 Sector Allocation Credit Allocation Corporates 35% AAA Government/ Gov't Related 23% AA Mortgage-Backed 22% A Covered 14% BBB Asset-Backed 12% BB and Below Duration Allocation 50% 0 - 1 years 19% 3% 1 - 3 years 13% 15% 3 - 5 years 27% 30% 5 - 7 years 19% 2% 7 - 10 years 10+ years 13 8% 14% .
PAYDEN GLOBAL FUNDS PUBLIC LIMITED COMPANY INVESTMENT MANAGER’S REPORT FOR THE PERIOD ENDED 30 JUNE 2015 (continued) Payden US Dollar Liquidity Fund The Payden US Dollar Liquidity Fund (Distributing share class) returned +0.36% in the six months period ending 30 June 2015. Fund duration at the end of June was 0.55 years, decreased by 0.2 years over the six month period as we reduced the Fund’s sensitivity to potential interest rate rises. The Fund’s gross yield to maturity ended the period at 0.78%. Fund performance was supported by its holdings in the 0-3 year maturity range as U.S. Treasuries had positive performance. The portfolio’s exposure to supra-national bonds, corporates and asset-backed securities all contributed to performance. Portfolio Characteristics As of 30 June 2015 Sector Allocation Credit Allocation Domicile of Issuers Corporates 32% AAA Government/ Gov't Related 28% AA Euroland 5% Asset-Backed 26% A 18% United Kingdom 3% Covered 11% BBB 22% Canada 3% Scandinavia 2% Switzerland 2% Australia 1% Supranational 1% Japan 1% Other 6% Certificate of Deposit 54% 6% 2% United States 76% Payden USD Low Duration Credit Fund The Payden USD Low Duration Credit Fund (US Dollar Accumulating share class) returned a net +1.06% over the six months period ending June 2015. Fund duration ended the period at 2.82 years, just 0.1 years longer than the beginning of the period.
The Fund’s gross yield to maturity at the end of June was 2.30%. The best performing portion of the portfolio was the allocation to high yield. The Fund’s security selection also boosted returns. Portfolio Characteristics As of 30 June 2015 Sector Allocation Credit Allocation Duration Allocation Financial 46% AAA 1% Consumer Non-Cyclical 13% AA Communications 10% A 3% 74% 9% BBB Consumer Cyclical 7% BB and Below Utilities 6% Basic Materials 3% Technology 3% Energy 2% 14 8% 1 - 3 years 57% 18% Industrials 0 - 1 years 3 - 5 years 35% 4% . PAYDEN GLOBAL FUNDS PUBLIC LIMITED COMPANY INVESTMENT MANAGER’S REPORT FOR THE PERIOD ENDED 30 JUNE 2015 (continued) Payden World Equity Fund The Payden World Equity Fund (US Dollar Accumulating class) returned a net +3.44% for the six month period ended 30 June 2015. Since the start of the year, the portfolio positioning has particularly favored the Eurozone and Japan. On a sector and style basis within the United States, the Fund has a tilt towards the technology sector, small cap and mid cap stocks, and towards dividend paying stocks. The primary drivers of the Fund’s performance over the period were country selection, sector weights and currency positions. Within country selection, the Fund benefited from its exposure to Japan and the US technology sector also contributed. Within currency positioning, the underweight to the EUR was the largest contributor of performance, while the underweight to the GBP was the largest detractor. Portfolio Characteristics As of 30 June 2015 Sector Allocation Top 5 Currency Allocations Financials 20% US Dollar Consumer Discretionary 14% Japanese Yen 8% Technology 14% GB Pound 7% Health Care 12% Euro 5% Industrials 11% Swiss Franc 3% Consumer Staples 9% Energy 6% Utilities 5% Materials 5% Telecomm 65% 4% 15 .
PAYDEN GLOBAL FUNDS PUBLIC LIMITED COMPANY SCHEDULE OF INVESTMENTS Payden Absolute Return Bond Fund As at 30 June 2015 Holding 555,000 810,939 487,282 534,343 448,686 864,471 147,322 270,000 460,000 407,693 55,466 200,000 1,256,471 549,719 1,120,000 658,040 178,718 290,000 215,042 640,767 105,514 637,164 481,081 1,306,258 253,044 1,014,605 1,680,875 1,691,776 530,411 168,914 354,207 596,986 171,849 492,290 354,570 1,472,940 2,770,272 896,448 743,669 531,241 204,585 310,000 590,000 410,000 380,000 96,052 449,603 201,793 300,000 482,387 Name of securities Fair value USD % of net assets Asset-backed securities Ally Master Owner Trust floating rate 15-Apr-2018 Alternative Loan Trust 2005-54CB 5.125% 25-Nov-2035 Alternative Loan Trust 2006-34 6.250% 25-Nov-2046 Alternative Loan Trust 2006-36T2 6.250% 25-Dec-2036 Alternative Loan Trust 2006-J5 6.500% 25-Sep-2036 Alternative Loan Trust 2007-9T1 6.000% 25-May-2037 American Homes 4 Rent 1.250% 17-Jun-2031 American Residential Properties 2014-SFR1 Trust floating rate 17-Sep-2031 Apidos CLO XIV floating rate 15-Apr-2025 Banc of America Funding 2005-H Trust floating rate 20-Nov-2035 Bank of America Mortgage 2002-K Trust floating rate 20-Oct-2032 Barclays Dryrock Issuance Trust floating rate 16-Jul-2018 BCAP LLC Trust 2007-AA2 6.000% 25-Apr-2037 Bear Stearns ARM Trust 2007-4 floating rate 25-Jun-2047 Citibank Credit Card Issuance Trust 4.150% 07-Jul-2017 Citigroup Mortgage Loan Trust 2006-4 6.000% 25-Dec-2035 Colony American Homes 2014-2 1.137% 17-Jul-2031 Colony American Homes 2015-1 floating rate 17-Jul-2032 Colony American Homes Single-Family Rental Pass-Through Certificates 1.400% 17-May-2031 CSMC Mortgage-Backed Trust 2006-7 6.000% 25-Aug-2036 CSMC Trust 2013-IVR2 floating rate 25-Apr-2043 Fannie Mae Connecticut Avenue Securities floating rate 25-Oct-2023 Fannie Mae Connecticut Avenue Securities 1M1 floating rate 25-May-2024 Fannie Mae Connecticut Avenue Securities 1M2 floating rate 25-May-2024 Fannie Mae Connecticut Avenue Securities floating rate 25-Nov-2024 Fannie Mae Connecticut Avenue Securities floating rate 25-May-2025 Fannie Mae Connecticut Avenue Securities 1M1 floating rate 25-Jul-2024 Fannie Mae Connecticut Avenue Securities 2M1 floating rate 25-Jul-2024 First Horizon Alternative Mortgage Securities Trust 2006-FA2 6.000% 25May-2036 Freddie Mac Structured Agency Credit Risk Debt Notes floating rate 25-Nov-2023 Freddie Mac Structured Agency Credit Risk Debt Notes floating rate 25-Feb-2024 Freddie Mac Structured Agency Credit Risk Debt Notes floating rate 25-Aug-2024 Freddie Mac Structured Agency Credit Risk Debt Notes floating rate 25-Oct-2024 Freddie Mac Structured Agency Credit Risk Debt Notes floating rate 25-Mar-2025 Freddie Mac Structured Agency Credit Risk Debt Notes floating rate 25-Oct-2027 Government National Mortgage Association floating rate 20-Jun-2036 Government National Mortgage Association floating rate 20-Nov-2036 GreenPoint MTA Trust 2005-AR1 floating rate 25-Jun-2045 GSR Mortgage Loan Trust 2007-AR2 floating rate 25-May-2037 IndyMac INDX Mortgage Loan Trust 2005-AR13 floating rate 25-Aug-2035 Invitation Homes 2013-SFR1 Trust 1.400% 17-Dec-2030 Invitation Homes 2014-SFR1 Trust 1.185% 17-Jun-2031 Invitation Homes 2014-SFR2 Trust floating rate 17-Sep-2031 Invitation Homes 2015-SFR3 Trust 1.483% 25-Mar-2055 JP Morgan Chase Commercial Mortgage Securities Trust 2015-COSMO floating rate 15-Jan-2032 MMAF Equipment Finance LLC 2013-A 0.690% 09-May-2016 Morgan Stanley Mortgage Loan Trust 2004-7AR floating rate 25-Sep-2034 Nationstar Mortgage Loan Trust 3.750% 25-Dec-2052 New Residential Mortgage Loan Trust 3.750% 25-Apr-2052 New Residential Mortgage Loan Trust 2014-2 3.750% 25-May-2054 33,565,639 555,319 751,445 402,333 428,932 407,321 714,854 147,121 267,896 447,659 342,693 56,246 200,047 1,070,561 495,187 1,120,692 613,529 177,008 287,669 35.71 0.59 0.80 0.43 0.46 0.43 0.76 0.16 0.28 0.48 0.36 0.06 0.21 1.14 0.53 1.19 0.65 0.19 0.31 214,327 557,933 99,498 645,553 477,466 1,298,993 255,004 1,009,472 1,680,039 1,690,608 0.23 0.59 0.11 0.69 0.51 1.38 0.27 1.07 1.79 1.80 452,898 0.48 169,174 0.18 354,080 0.38 599,045 0.64 172,324 0.18 491,068 0.52 353,917 69,329 127,905 782,758 615,470 468,135 204,102 307,106 585,402 412,279 0.38 0.07 0.14 0.83 0.65 0.50 0.22 0.33 0.62 0.44 379,630 96,058 438,922 206,848 306,375 500,853 0.40 0.10 0.47 0.22 0.33 0.53 16 . PAYDEN GLOBAL FUNDS PUBLIC LIMITED COMPANY SCHEDULE OF INVESTMENTS (continued) Payden Absolute Return Bond Fund (continued) As at 30 June 2015 Holding 480,285 375,000 400,000 113,409 182,933 58,443 400,000 102,146 207,702 400,000 901,324 360,054 150,000 607,711 501,328 247,756 750,000 494,745 861,646 817,078 137,943 595,513 389,273 295,000 160,000 260,000 295,000 250,000 200,000 360,000 225,000 110,000 250,000 350,000 180,000 195,000 270,000 290,000 260,000 350,000 180,000 350,000 110,000 250,000 150,000 180,000 230,000 442,000 225,000 350,000 220,000 80,000 710,000 Name of securities Fair value USD Asset-backed securities (continued) New Residential Mortgage Loan Trust 2014-3 floating rate 25-Nov-2054 North End CLO Ltd 2013-1 floating rate 17-Jul-2025 Octagon Investment Partners XIV Ltd floating rate 15-Jan-2024 Provident Funding Mortgage Loan Trust 2005-2 floating rate 25-Oct-2035 RALI Series 2007-QS1 Trust 6.000% 25-Jan-2037 RASC Series 2003-KS9 Trust floating rate 25-Nov-2033 Santander Drive Auto Receivables Trust 2015-3 3.490% 17-May-2021 Sequoia Mortgage Trust 2013-1 floating rate 25-Feb-2043 Sequoia Mortgage Trust 2013-4 floating rate 25-Apr-2043 Springleaf Mortgage Loan Trust 2013-2 floating rate 25-Dec-2065 Structured Asset Mortgage Investments II Trust 2006-AR7 floating rate 25-Aug-2036 VOLT XXII LLC 3.500% 25-Feb-2055 VOLT XXV LLC 3.500% 26-Jun-2045 VOLT XXVI LLC 3.125% 25-Sep-2043 VOLT XXXIII LLC 3.500% 25-Mar-2055 VOLT XXXIV LLC 3.500% 25-Feb-2055 VOLT XXXV LLC 3.375% 26-Jun-2045 WaMu Mortgage Pass-Through Certificates Series 2005-AR11 Trust floating rate 25-Aug-2045 WaMu Mortgage Pass-Through Certificates Series 2006-AR10 Trust floating rate 25-Sep-2036 WaMu Mortgage Pass-Through Certificates Series 2006-AR8 Trust floating rate 25-Aug-2046 WaMu Mortgage Pass-Through Certificates Series 2007-HY7 Trust floating rate 25-Jul-2037 Wells Fargo Alternative Loan 2007-PA2 Trust 6.000% 25-Jun-2037 Wells Fargo Mortgage Backed Securities 2005-18 Trust 5.500% 25-Jan-2036 Corporate bonds 1011778 BC ULC / New Red Finance Inc 6.000% 01-Apr-2022 AbbVie Inc 2.500% 14-May-2020 ABN AMRO Bank NV floating rate 13-Sep-2022 AES Corp/VA floating rate 01-Jun-2019 AIA Group Ltd 2.250% 11-Mar-2019 Air Canada 8.750% 01-Apr-2020 Air Lease Corp 2.125% 15-Jan-2018 American Honda Finance Corp 1.000% 11-Aug-2015 American Honda Finance Corp 2.125% 10-Oct-2018 American Tower Corp 4.500% 15-Jan-2018 Amgen Inc 2.125% 01-May-2020 Amgen Inc 3.875% 15-Nov-2021 ArcelorMittal 5.250% 25-Feb-2017 Ardagh Packaging Finance PLC / Ardagh Holdings USA Inc floating rate 15-Dec-2019 Argos Merger Sub Inc 7.125% 15-Mar-2023 Arizona Public Service Co 2.200% 15-Jan-2020 AT&T Inc 2.450% 30-Jun-2020 AT&T Inc 3.400% 15-May-2025 AT&T Inc 4.500% 15-May-2035 AT&T Inc 4.750% 15-May-2046 AutoZone Inc 2.500% 15-Apr-2021 Banco Santander Brasil SA/Cayman Islands 4.250% 14-Jan-2016 Banco Santander Chile floating rate 11-Apr-2017 Bank of America Corp floating rate 15-Jan-2019 Bank of Montreal 2.375% 25-Jan-2019 Banque Federative du Credit Mutuel SA floating rate 28-Oct-2016 Barclays PLC 2.875% 08-Jun-2020 Baylor Scott & White Holdings 2.123% 15-Nov-2020 BBVA Banco Continental SA 2.250% 29-Jul-2016 Boston Scientific Corp 3.850% 15-May-2025 17 % of net assets 503,240 359,925 399,975 113,082 157,127 56,739 401,883 99,192 201,935 408,767 0.54 0.38 0.43 0.12 0.17 0.06 0.43 0.11 0.21 0.43 709,937 360,466 149,835 608,260 502,745 247,354 749,250 0.75 0.38 0.16 0.65 0.53 0.26 0.80 467,624 0.50 782,178 0.83 697,384 0.74 118,078 583,277 378,303 0.13 0.62 0.40 30,908,382 303,850 158,538 280,150 295,737 248,793 221,750 357,300 225,151 111,718 264,705 343,107 189,023 203,044 32.88 0.32 0.17 0.30 0.31 0.26 0.24 0.38 0.24 0.12 0.28 0.37 0.20 0.22 263,588 304,500 257,985 343,494 172,022 322,774 100,483 245,278 152,231 179,603 232,266 448,026 226,187 347,941 217,091 80,440 690,274 0.28 0.32 0.27 0.37 0.18 0.34 0.11 0.26 0.16 0.19 0.25 0.48 0.24 0.37 0.23 0.09 0.73 . PAYDEN GLOBAL FUNDS PUBLIC LIMITED COMPANY SCHEDULE OF INVESTMENTS (continued) Payden Absolute Return Bond Fund (continued) As at 30 June 2015 Holding 164,000 350,000 410,000 400,000 360,000 375,000 375,000 210,000 300,000 250,000 250,000 350,000 600,000 560,000 200,000 170,000 265,000 400,000 300,000 410,000 400,000 600,000 200,000 225,000 250,000 270,000 300,000 120,000 250,000 240,000 700,000 150,000 700,000 200,000 150,000 290,000 350,000 210,000 220,000 180,000 240,000 280,000 400,000 330,000 200,000 225,000 200,000 560,000 250,000 460,000 400,000 245,000 180,000 170,000 200,000 210,000 350,000 150,000 230,000 Name of securities Fair value USD Corporate bonds (continued) Bumble Bee Holdings Inc 9.000% 15-Dec-2017 Chevron Corp 1.961% 03-Mar-2020 Citigroup Inc 2.500% 29-Jul-2019 Comision Federal de Electricidad 4.875% 26-May-2021 Commonwealth Bank of Australia/New York NY 1.625% 12-Mar-2018 Communications Sales & Leasing Inc 6.000% 15-Apr-2023 ConAgra Foods Inc 1.300% 25-Jan-2016 Continental Airlines 2012-3 Class C Pass Thru Certificates 6.125% 29-Apr-2018 Corp Financiera de Desarrollo SA 3.250% 15-Jul-2019 Credit Agricole SA/London 2.750% 10-Jun-2020 Credit Agricole SA floating rate 03-Oct-2016 Credit Suisse/New York NY 1.700% 27-Apr-2018 CSX Corp 7.375% 01-Feb-2019 Dominion Resources Inc/VA 2.500% 01-Dec-2019 DP World Ltd 3.250% 18-May-2020 Dun & Bradstreet Corp 4.000% 15-Jun-2020 E*TRADE Financial Corp 5.375% 15-Nov-2022 Fifth Third Bank/Cincinnati OH 2.875% 01-Oct-2021 Ford Motor Credit Co LLC floating rate 12-Mar-2019 Frontier Communications Corp 6.250% 15-Sep-2021 General Electric Capital Corp floating rate 15-Nov-2067 Goldman Sachs Group Inc 2.550% 23-Oct-2019 HBOS PLC 6.750% 21-May-2018 Heineken NV 0.800% 01-Oct-2015 Hewlett-Packard Co 2.600% 15-Sep-2017 HSBC USA Inc 1.700% 05-Mar-2018 Humana Inc 2.625% 01-Oct-2019 Hyundai Capital America 2.000% 19-Mar-2018 Industrial & Commercial Bank of China Ltd/New York 3.231% 13-Nov-2019 ING Bank NV floating rate 21-Nov-2023 John Deere Capital Corp 2.250% 17-Apr-2019 Johnson Controls Inc 1.400% 02-Nov-2017 JPMorgan Chase & Co 2.250% 23-Jan-2020 Korea Hydro & Nuclear Power Co Ltd 2.875% 02-Oct-2018 Kraft Heinz Foods Co 5.000% 15-Jul-2035 Kraft Heinz Foods Co 5.200% 15-Jul-2045 Latam Airlines 2015-1 Pass Through Trust A 4.200% 15-Nov-2027 Macquarie Bank Ltd 6.625% 07-Apr-2021 Marsh & McLennan Cos Inc 2.550% 15-Oct-2018 McGraw Hill Financial Inc 5.900% 15-Nov-2017 Merck & Co Inc 1.850% 10-Feb-2020 Metropolitan Life Global Funding I 2.300% 10-Apr-2019 Mitsubishi UFJ Trust & Banking Corp 1.600% 16-Oct-2017 Moody's Corp 2.750% 15-Jul-2019 NetApp Inc 3.375% 15-Jun-2021 Nissan Motor Acceptance Corp 1.000% 15-Mar-2016 Numericable-SFR SAS 4.875% 15-May-2019 Oracle Corp 2.375% 15-Jan-2019 Penske Truck Leasing Co LP / PTL Finance Corp. 2.500% 15-Jun-2019 Pershing Square Holdings Ltd 5.500% 15-Jul-2022 PG&E Corp 2.400% 01-Mar-2019 Providence Health & Services Obligated Group floating rate 01-Oct-2016 Prudential Financial Inc floating rate 15-Jun-2038 Prudential Financial Inc floating rate 15-May-2045 QBE Insurance Group Ltd 2.400% 01-May-2018 QUALCOMM Inc 2.250% 20-May-2020 Sempra Energy 9.800% 15-Feb-2019 Sompo Japan Insurance Inc floating rate 28-Mar-2073 Southern Power Co 1.500% 01-Jun-2018 18 % of net assets 172,405 347,361 410,996 420,000 361,263 367,691 375,104 0.18 0.37 0.44 0.45 0.38 0.39 0.40 218,925 302,520 251,087 251,321 347,703 703,949 562,246 199,000 170,996 272,288 396,404 297,978 375,150 431,000 601,772 222,251 225,079 254,656 269,362 302,256 120,121 254,920 246,908 706,673 149,505 688,322 205,380 151,322 297,588 346,938 240,830 224,126 196,726 238,147 281,893 399,472 333,123 197,329 225,456 198,500 568,612 247,846 461,654 400,860 245,968 211,500 167,875 201,243 209,068 439,937 158,625 228,824 0.23 0.32 0.27 0.27 0.37 0.75 0.60 0.21 0.18 0.29 0.42 0.32 0.40 0.46 0.64 0.24 0.24 0.27 0.29 0.32 0.13 0.27 0.26 0.75 0.16 0.73 0.22 0.16 0.32 0.37 0.26 0.24 0.21 0.25 0.30 0.42 0.35 0.21 0.24 0.21 0.60 0.26 0.49 0.43 0.26 0.23 0.18 0.21 0.22 0.47 0.17 0.24 . PAYDEN GLOBAL FUNDS PUBLIC LIMITED COMPANY SCHEDULE OF INVESTMENTS (continued) Payden Absolute Return Bond Fund (continued) As at 30 June 2015 Holding Name of securities 320,000 250,000 200,000 290,000 280,000 325,000 360,000 250,000 220,000 375,000 530,000 650,000 450,000 110,000 70,000 Corporate bonds (continued) Sprint Communications Inc 8.375% 15-Aug-2017 SunTrust Banks Inc 2.350% 01-Nov-2018 Telefonica Chile SA 3.875% 12-Oct-2022 Tencent Holdings Ltd 3.375% 02-May-2019 Tenet Healthcare Corp floating rate 15-Jun-2020 Textron Inc 7.250% 01-Oct-2019 Thermo Fisher Scientific Inc 3.300% 15-Feb-2022 UBS AG/Stamford CT 1.800% 26-Mar-2018 United States Steel Corp 7.000% 01-Feb-2018 Viacom Inc 3.500% 01-Apr-2017 Vodafone Group PLC 2.500% 26-Sep-2022 Wells Fargo & Co 2.125% 22-Apr-2019 Wm Wrigley Jr Co 2.900% 21-Oct-2019 Zimmer Biomet Holdings Inc 1.450% 01-Apr-2017 Zimmer Biomet Holdings Inc 2.000% 01-Apr-2018 365,000 140,000 180,000 220,000 310,000 270,000 340,000 200,000 290,000 195,000 310,000 110,000 540,000 150,000 220,000 550,000 250,000 375,000 305,000 250,000 260,000 260,000 230,000 280,000 200,000 370,000 375,000 225,000 250,000 200,000 230,000 290,000 190,000 450,000 170,000 600,000 80,000 325,000 130,000 150,000 190,000 Fair value USD Covered bonds Abengoa Greenfield SA 6.500% 01-Oct-2019 Actavis Funding SCS 3.000% 12-Mar-2020 Actavis Funding SCS floating rate 12-Mar-2018 AerCap Aviation Solutions BV 6.375% 30-May-2017 Ally Financial Inc floating rate 18-Jul-2016 Anglo American Capital PLC 4.125% 15-Apr-2021 Antero Resources Corp 6.000% 01-Dec-2020 ANZ New Zealand Int'l Ltd/London 1.750% 29-Mar-2018 ARC Properties Operating Partnership LP 2.000% 06-Feb-2017 Avis Budget Car Rental LLC / Avis Budget Finance Inc 4.875% 15-Nov-2017 Barrick North America Finance LLC 4.400% 30-May-2021 BAT International Finance PLC 1.850% 15-Jun-2018 Baxalta Inc 2.875% 23-Jun-2020 Baxalta Inc 5.250% 23-Jun-2045 BioMed Realty LP 2.625% 01-May-2019 BNZ International Funding Ltd/London 1.900% 26-Feb-2018 BNZ International Funding Ltd/London 2.350% 04-Mar-2019 Carnival Corp 1.875% 15-Dec-2017 CNH Industrial Capital LLC 3.250% 01-Feb-2017 Constellation Brands Inc 3.875% 15-Nov-2019 Cooperatieve Centrale Raiffeisen-Boerenleenbank BA/Netherlands 3.875% 08-Feb-2022 Daimler Finance North America LLC floating rate 01-Aug-2018 DISH DBS Corp 4.625% 15-Jul-2017 EP Energy LLC / Everest Acquisition Finance Inc 9.375% 01-May-2020 Express Scripts Holding Co 2.250% 15-Jun-2019 General Motors Financial Co Inc 3.150% 15-Jan-2020 Harley-Davidson Financial Services Inc 3.875% 15-Mar-2016 HealthSouth Corp 5.750% 01-Nov-2024 HJ Heinz Co 2.800% 02-Jul-2020 Kazakhstan Temir Zholy Finance BV 6.375% 06-Oct-2020 Keysight Technologies Inc 3.300% 30-Oct-2019 Kinder Morgan Inc/DE 3.050% 01-Dec-2019 Landry's Inc 9.375% 01-May-2020 Lloyds Bank PLC 1.750% 14-May-2018 Majapahit Holding BV 8.000% 07-Aug-2019 Medtronic Inc 2.500% 15-Mar-2020 Peabody Energy Corp 6.250% 15-Nov-2021 Petroleos Mexicanos 8.000% 03-May-2019 Reynolds American Inc 3.250% 12-Jun-2020 Reynolds American Inc 5.700% 15-Aug-2035 Reynolds American Inc 5.850% 15-Aug-2045 19 % of net assets 347,200 251,781 196,676 298,015 282,800 380,751 356,269 249,727 235,950 387,460 486,935 652,907 458,653 110,084 70,071 0.37 0.27 0.21 0.32 0.30 0.41 0.38 0.27 0.25 0.41 0.52 0.69 0.49 0.12 0.07 14,567,171 341,275 140,668 180,873 233,475 313,520 270,468 343,400 200,100 282,025 15.50 0.36 0.15 0.19 0.25 0.33 0.29 0.37 0.21 0.30 200,362 317,077 110,342 539,832 151,157 219,267 552,809 250,558 376,790 305,381 254,375 0.21 0.34 0.12 0.57 0.16 0.23 0.59 0.27 0.40 0.32 0.27 270,872 262,404 237,475 300,636 198,567 372,117 382,774 230,625 250,480 210,644 231,021 289,975 204,725 449,860 196,350 601,399 27,600 381,583 131,827 155,993 200,007 0.29 0.28 0.25 0.32 0.21 0.40 0.41 0.25 0.27 0.22 0.25 0.31 0.22 0.48 0.21 0.64 0.03 0.41 0.14 0.17 0.21 . PAYDEN GLOBAL FUNDS PUBLIC LIMITED COMPANY SCHEDULE OF INVESTMENTS (continued) Payden Absolute Return Bond Fund (continued) As at 30 June 2015 Holding Name of securities 200,000 110,000 370,000 400,000 150,000 310,000 130,000 325,000 350,000 600,000 225,000 150,000 Covered bonds (continued) SABMiller Holdings Inc floating rate 01-Aug-2018 Seagate HDD Cayman 3.750% 15-Nov-2018 Shell International Finance BV 2.125% 11-May-2020 Sinopec Capital 2013 Ltd 1.875% 24-Apr-2018 Sunoco LP / Sunoco Finance Corp 6.375% 01-Apr-2023 Talen Energy Supply LLC 5.125% 15-Jul-2019 T-Mobile USA Inc 5.250% 01-Sep-2018 Tyco Electronics Group SA 6.550% 01-Oct-2017 United Rentals North America Inc 7.625% 15-Apr-2022 Walgreens Boots Alliance Inc 2.700% 18-Nov-2019 Wesfarmers Ltd 1.874% 20-Mar-2018 ZF North America Capital Inc 4.000% 29-Apr-2020 170,000 170,000 170,000 265,000 170,000 265,000 9,500,000 104,650 150,000 136,247 114,500 86,118 395,000 42,250 736,272 Fair value USD 200,150 114,769 369,629 397,176 156,750 305,350 133,900 360,804 380,625 601,406 225,549 150,375 180 220 248 259 83 105 14 (3) 6 1.87 0.11 0.16 0.15 0.12 0.09 0.42 0.04 0.78 91,574,267 Total value of investment in securities (2014: 98.13%) 11.46 0.20 0.20 0.20 0.28 0.19 0.29 10.10 1,760,553 105,115 149,836 136,491 114,822 86,253 392,656 42,414 732,966 Term Loans Activision Blizzard Inc 3.250% 12-Oct-2020 Asurion LLC 3.750% 03-Mar-2017 Dell International LLC 4.000% 29-Apr-2020 Dole Food Company Inc 4.500% 01-Nov-2018 Hilton Worldwide Finance LLC 3.500% 26-Oct-2020 Hub International Limited 4.000% 02-Oct-2020 Hudson's Bay Company 4.750% 04-Nov-2020 Neiman Marcus Group 4.250% 25-Oct-2020 0.21 0.12 0.39 0.42 0.17 0.32 0.14 0.38 0.41 0.64 0.24 0.16 10,772,522 185,810 187,955 191,675 260,866 176,035 272,632 9,497,549 Government bonds Colombia Government International Bond 7.375% 27-Jan-2017 Croatia Government International Bond 6.750% 05-Nov-2019 Dominican Republic International Bond 7.500% 06-May-2021 Republic of Armenia 6.000% 30-Sep-2020 Republic of Ghana 8.500% 04-Oct-2017 Sri Lanka Government International Bond 6.250% 04-Oct-2020 United States Treasury Bill 0.046% 17-Dec-2015 % of net assets 97.42 Options (2014: 0.05%) Put Option: 100 SHS Barclays (Strike Price: 111) Put Option: 100 SHS IBOXX (Strike Price: 87) Put Option: 100 SHS IBOXX (Strike Price: 87) Put Option: 100 SHS iShares (Strike Price: 113) Put Option: 100 SHS S&P 500 Index (Strike Price: 1800) Put Option: S&P 500 Index (Strike Price: 1800) Expiration date Broker 29,436 0.03 17-Jul-2015 Goldman Sachs 3,780 0.00 17-Jul-2015 Goldman Sachs 6,600 0.01 02-Jul-2015 Goldman Sachs 3,100 0.00 02-Jul-2015 Goldman Sachs 1,684 0.00 30-Jun-2015 Goldman Sachs 622 0.00 17-Jul-2015 Goldman Sachs 13,650 0.02 Futures contracts (2014: 0.02%) Euro-Bund Future Exp 08-Sep-2015 US Long Bond (CBT) Future Exp 21-Sep-2015 US Treasury Note 10 Year (CBT) Future Exp 21-Sep-2015 Notional (USD) 2,324,834 Broker Goldman Sachs 60,856 46,184 0.06 0.05 (463,734) Goldman Sachs 11,203 0.01 753,562 Goldman Sachs 3,469 0.00 1,459,190 1.55 93,123,749 99.06 Unrealised gain on forward foreign exchange contracts (Appendix) (2014: 0.37%) Financial assets at fair value through profit or loss 20 . PAYDEN GLOBAL FUNDS PUBLIC LIMITED COMPANY SCHEDULE OF INVESTMENTS (continued) Payden Absolute Return Bond Fund (continued) As at 30 June 2015 Holding Name of securities Fair value USD (6) Broker (38,871) (0.04) (2,523,523) Goldman Sachs (24,597) (0.03) (7,032,500) Goldman Sachs (3,711) 0.00 (913,812) Goldman Sachs (10,563) (0.01) (86,555) (0.09) (125,426) (0.13) Net current assets (59) Notional (USD) Financial liabilities at fair value through profit or loss (14) Futures contracts (2014: (0.12%)) Long Gilt (LIFFE) Future Exp 28-Sep-2015 US Treasury Note 5 year (CBT) Future Exp 30-Sep-2015 US Ultra Bond (CBT) Future Exp 21-Sep-2015 % of net assets 1,004,289 1.07 94,002,612 100.00 Unrealised loss on forward foreign exchange contracts (Appendix) (2014: (0.62%)) Total net assets Appendix: forward foreign currency contracts Unrealised gain on forward foreign currency contracts Purchase Amount Currency Sale Sale Amount Maturity date Unrealised Gain/Loss USD 563,809 688,000 495,000 77,290 780,625 148,296 251,352 88,500,000 145,994 772,100 735,325 10,790,000 48,310,000 163,177 753,003 375,336 776,021 131,005 476,071 157,360 78,213 155,493 EUR USD USD COP EUR EUR EUR USD AUD AUD JPY USD USD EUR EUR SGD CAD CAD CAD HUF IDR MYR (500,000) (735,877) (754,657) (196,000,000) (688,000) (130,000) (225,000) (712,213) (187,000) (996,000) (88,500,000) (167,651) (738,572) (143,000) (670,000) (502,000) (967,000) (160,000) (587,000) (43,700,000) (1,045,000,000) (587,000) 09-Jul-2015 17-Jul-2015 17-Jul-2015 17-Jul-2015 17-Jul-2015 23-Jul-2015 23-Jul-2015 31-Jul-2015 31-Jul-2015 31-Jul-2015 31-Jul-2015 17-Aug-2015 17-Aug-2015 17-Aug-2015 17-Aug-2015 20-Aug-2015 14-Sep-2015 14-Sep-2015 14-Sep-2015 21-Sep-2015 21-Sep-2015 21-Sep-2015 6,658 30,846 23,748 2,027 13,902 3,409 586 11,293 2,515 7,898 11,819 212 12,997 3,744 6,009 2,801 2,242 2,975 6,362 3,109 1,253 886 Euro Class (Accumulating) Citibank EUR 647,000 USD (709,619) 06-Jul-2015 11,305 Sterling Class (Accumulating) HSBC Securities GBP HSBC Securities GBP 9,000 27,422,000 USD USD (13,790) (41,835,140) 06-Jul-2015 06-Jul-2015 364 1,290,230 1,459,190 Currency Counter Party Purchase Payden Absolute Return Bond Fund Citibank USD Royal Bank of Scotland EUR Royal Bank of Scotland GBP State Street USD Royal Bank of Scotland USD HSBC Securities USD HSBC Securities USD Credit Suisse JPY Credit Suisse USD Credit Suisse USD Credit Suisse USD Barclays INR Barclays INR UBS USD UBS USD Barclays USD Royal Bank of Canada USD Royal Bank of Canada USD Royal Bank of Canada USD Royal Bank of Canada USD Citibank USD Citibank USD 21 . PAYDEN GLOBAL FUNDS PUBLIC LIMITED COMPANY SCHEDULE OF INVESTMENTS (continued) Payden Absolute Return Bond Fund (continued) Appendix: forward foreign currency contracts (continued) Unrealised loss on forward foreign currency contracts Currency Counter Party Purchase Payden Absolute Return Bond Fund State Street USD Royal Bank of Scotland USD HSBC Securities USD Barclays INR Credit Suisse MXN Credit Suisse USD HSBC Securities PHP HSBC Securities PHP Barclays USD Royal Bank of Canada USD HSBC Securities USD Purchase Amount Currency Sale Sale Amount Maturity date Unrealised Gain/Loss USD 75,885 734,216 733,856 14,670,000 2,440,000 154,377 14,560,000 16,790,000 322,797 76,497 77,572 BRL GBP EUR USD USD MXN USD USD SGD TRY ZAR (239,000) (495,000) (683,000) (229,219) (159,331) (2,440,000) (322,124) (375,363) (436,000) (214,000) (980,000) 17-Jul-2015 17-Jul-2015 23-Jul-2015 17-Aug-2015 19-Aug-2015 19-Aug-2015 20-Aug-2015 20-Aug-2015 20-Aug-2015 21-Sep-2015 21-Sep-2015 (629) (44,188) (27,359) (994) (4,379) (575) (102) (4,021) (759) (1,535) (2,014) (86,555) Portfolio Analysis % of total assets Transferable securities and money market instruments admitted to an official stock exchange listing or traded on a regulated market Financial derivative instruments dealt in on a regulated market OTC financial derivative instruments Analysis as a percentage of total assets rather than net assets is required under the UCITS Notice 8.5 appendix A. 22 90.43 0.05 1.36 91.84 . PAYDEN GLOBAL FUNDS PUBLIC LIMITED COMPANY SCHEDULE OF INVESTMENTS (continued) Payden Euro Liquidity Fund As at 30 June 2015 Holding Name of securities Fair value EUR % of net assets 1,106,851 456,052 1,450,891 227,003 2,100,000 1,000,000 965,469 280,438 424,843 1,972,667 160,317 141,217 1,300,000 71,016 Asset-backed securities Auto ABS Compartiment 2012-1 floating rate 25-Jul-2026 Bavarian Sky SA floating rate 20-Jun-2020 Bavarian Sky SA 0.237% 20-Apr-2024 Bilkreditt 4 Ltd floating rate 25-Dec-2027 Bumper 6 NL Finance BV floating rate 19-Mar-2029 Cars Alliance Auto Loans France V 2014-1 0.304% 25-Jan-2026 Compartment VCL 20 floating rate 21-Jun-2020 Driver Ten GmbH floating rate 21-Mar-2019 Driver Twelve GmbH floating rate 22-May-2020 Red & Black Auto Lease Germany 1 SA 0.911% 15-Apr-2024 SC Germany Auto 2014-1 UG haftungsbeschraenkt floating rate 11-Dec-2023 Silver Arrow SA floating rate 20-Oct-2021 Silverstone Master Issuer PLC floating rate 21-Jan-2070 Titrisocram 2012-1 floating rate 25-Mar-2022 11,673,346 1,113,046 456,009 1,452,462 227,386 2,101,623 999,308 965,998 280,448 425,241 1,975,593 160,360 141,250 1,303,486 71,136 13.43 1.28 0.53 1.67 0.26 2.42 1.15 1.11 0.32 0.49 2.27 0.19 0.16 1.50 0.08 500,000 1,000,000 1,000,000 1,000,000 Commercial paper BAT International Finance PLC 0.000% 29-Jul-2015 Deutsche Telekom International Finance BV 0.000% 12-Aug-2015 Hewlett-Packard Co 0.000% 08-Sep-2015 Vodafone Group PLC 0.000% 14-Jan-2016 3,499,057 499,848 999,976 999,813 999,420 4.02 0.57 1.15 1.15 1.15 43,785,005 500,673 711,004 826,005 853,007 852,575 1,241,212 801,636 519,225 607,170 707,680 849,796 1,211,922 602,055 1,004,955 797,528 646,093 851,288 899,528 650,439 50.36 0.58 0.82 0.95 0.98 0.98 1.43 0.92 0.60 0.70 0.81 0.98 1.39 0.69 1.16 0.92 0.74 0.98 1.03 0.75 747,949 1,246,813 758,576 801,444 1,099,802 0.86 1.43 0.87 0.92 1.27 802,976 997,485 1,319,076 996,104 1,282,536 800,572 1,061,993 686,104 323,668 1,000,485 1,255,612 1,252,175 0.92 1.15 1.52 1.15 1.48 0.92 1.22 0.79 0.37 1.15 1.44 1.44 500,000 700,000 800,000 850,000 850,000 1,250,000 800,000 500,000 600,000 700,000 850,000 1,200,000 600,000 1,000,000 800,000 600,000 850,000 900,000 650,000 750,000 1,250,000 750,000 800,000 1,100,000 800,000 1,000,000 1,200,000 1,000,000 1,200,000 800,000 1,000,000 650,000 300,000 1,000,000 1,250,000 1,250,000 Corporate bonds 3M Co floating rate 09-Nov-2018 ABN AMRO Bank NV floating rate 06-Mar-2019 Achmea Bank NV 2.000% 23-Jan-2018 AT&T Inc floating rate 04-Jun-2019 Australia & New Zealand Banking Group Ltd floating rate 28-Oct-2019 Bank of America Corp floating rate 28-Mar-2018 Bank of Nova Scotia floating rate 14-Jan-2020 Banque Federative du Credit Mutuel SA 4.375% 31-May-2016 Banque Federative du Credit Mutuel SA floating rate 20-Mar-2019 Belfius Bank SA/NV 1.125% 22-May-2017 BNP Paribas SA floating rate 15-Jan-2020 BPCE SA floating rate 28-May-2018 Caisse Centrale Desjardins floating rate 20-Jan-2020 Cap Gemini SA floating rate 02-Jul-2018 Carrefour Banque SA floating rate 20-Mar-2020 Cie de Saint-Gobain 4.750% 11-Apr-2017 Citigroup Inc floating rate 11-Nov-2019 Coca-Cola Co floating rate 09-Mar-2017 Commonwealth Bank of Australia floating rate 21-Jan-2020 Cooperatieve Centrale Raiffeisen-Boerenleenbank BA/Netherlands floating rate 29-May-2020 Credit Suisse AG floating rate 18-Jun-2018 Daimler AG floating rate 24-Jun-2019 Danone SA floating rate 14-Jan-2020 Danske Bank A/S floating rate 19-Nov-2018 Elsevier Finance SA via Aquarius + Investments PLC floating rate 20-May-2017 FCE Bank PLC floating rate 10-Feb-2018 Fidelity International Ltd 6.875% 24-Feb-2017 GDF Suez 0.000% 13-Mar-2017 German Postal Pensions Securitisation 2 PLC 4.250% 18-Jan-2017 Goldman Sachs Group Inc floating rate 29-May-2020 Heathrow Funding Ltd 4.375% 25-Jan-2017 Heineken NV 4.625% 10-Oct-2016 Imerys SA 5.000% 18-Apr-2017 JPMorgan Chase & Co floating rate 20-Nov-2016 Jyske Bank A/S floating rate 19-Jun-2017 LeasePlan Corp NV floating rate 28-Apr-2017 23 . PAYDEN GLOBAL FUNDS PUBLIC LIMITED COMPANY SCHEDULE OF INVESTMENTS (continued) Payden Euro Liquidity Fund (continued) As at 30 June 2015 Holding Name of securities Fair value EUR % of net assets 754,251 853,154 1,003,470 601,275 640,690 516,415 998,335 808,856 1,204,494 751,912 653,158 851,615 1,049,995 702,006 828,218 0.87 0.98 1.15 0.69 0.74 0.59 1.15 0.93 1.39 0.86 0.75 0.98 1.21 0.81 0.95 18,270,562 853,630 1,054,630 1,252,006 753,941 749,674 853,574 998,705 501,750 776,029 1,202,730 601,788 651,037 971,004 842,481 852,363 596,842 855,062 801,372 269,556 802,276 801,100 507,533 470,639 250,840 21.01 0.98 1.21 1.44 0.87 0.86 0.98 1.15 0.58 0.89 1.38 0.69 0.75 1.12 0.97 0.98 0.69 0.98 0.92 0.31 0.92 0.92 0.59 0.54 0.29 700,000 850,000 1,000,000 600,000 632,000 500,000 1,000,000 800,000 1,200,000 750,000 628,000 850,000 1,050,000 700,000 800,000 Corporate bonds (continued) Metropolitan Life Global Funding I 4.625% 16-May-2017 Morgan Stanley floating rate 19-Nov-2019 Nederlandse Waterschapsbank NV floating rate 01-Nov-2018 PACCAR Financial Europe BV floating rate 24-Jun-2016 Parker-Hannifin Corp 4.125% 11-Nov-2015 Pernod Ricard SA 4.875% 18-Mar-2016 SBAB Bank AB floating rate 27-Jun-2018 Societe Des Autoroutes Paris-Rhin-Rhone floating rate 31-Mar-2019 Socram Banque floating rate 28-Nov-2017 Standard Chartered PLC floating rate 13-Jun-2017 Thames Water Utilities Cayman Finance Ltd 3.250% 09-Nov-2016 Toyota Motor Credit Corp floating rate 20-Jul-2018 UBS AG/London floating rate 15-May-2017 Wells Fargo & Co 0.448% 24-Apr-2019 Yorkshire Building Society 2.125% 18-Mar-2019 850,000 1,000,000 1,250,000 750,000 750,000 850,000 1,000,000 500,000 750,000 1,200,000 600,000 650,000 900,000 800,000 850,000 600,000 850,000 800,000 250,000 800,000 800,000 500,000 470,000 250,000 Covered bonds Abbey National Treasury Services PLC/London floating rate 22-May-2019 Anglo American Capital PLC 4.375% 02-Dec-2016 ASB Finance Ltd/London floating rate 03-Jul-2017 BAT International Finance PLC floating rate 06-Mar-2018 BMW US Capital LLC floating rate 20-Apr-2018 BNZ International Funding Ltd/London floating rate 02-Dec-2019 Caisse Centrale du Credit Immobilier de France SA floating rate 03-Oct-2017 Caterpillar International Finance Ltd floating rate 27-Sep-2017 Conti-Gummi Finance BV 2.500% 20-Mar-2017 Dexia Credit Local SA floating rate 27-Mar-2017 GE Capital European Funding floating rate 19-Jun-2018 GE Capital European Funding floating rate 21-Jan-2020 Glencore Finance Europe SA 5.250% 22-Mar-2017 Hutchison Whampoa Finance 06 Ltd 4.625% 21-Sep-2016 John Deere Bank SA floating rate 19-Mar-2019 Santander Consumer Bank AS 0.625% 20-Apr-2018 Scentre Group Trust 1 floating rate 16-Jul-2018 Sky PLC floating rate 01-Apr-2020 Telstra Corp Ltd 4.750% 21-Mar-2017 Total Capital International SA floating rate 19-Mar-2020 Volkswagen International Finance NV floating rate 16-Jul-2018 Volkswagen Leasing GmbH 1.000% 04-Oct-2017 Volvo Treasury AB floating rate 05-Sep-2016 Westpac Securities NZ Ltd floating rate 10-Mar-2017 2,100,000 500,000 1,000,000 1,200,000 1,500,000 1,400,000 900,000 300,000 Government and government related bonds Austria Government Bond 1.150% 19-Oct-2018 Bpifrance Financement SA floating rate 30-Jun-2016 Bundesobligation 1.000% 12-Oct-2018 Development Bank of Japan Inc 0.250% 06-Oct-2017 France Government Bond OAT 1.000% 25-May-2019 Italy Buoni Poliennali Del Tesoro 3.500% 01-Dec-2018 Netherlands Government Bond 0.500% 15-Apr-2017 Svensk Exportkredit AB floating rate 12-Aug-2016 9,213,832 2,182,224 500,248 1,037,790 1,202,088 1,551,182 1,529,210 911,288 299,802 10.60 2.51 0.58 1.19 1.38 1.78 1.76 1.05 0.35 Total value of investment in securities (2014: 99.11%) 86,441,802 99.42 Financial assets at fair value through profit or loss 86,441,802 99.42 501,858 0.58 86,943,660 100.00 Net current assets Total net assets 24 . PAYDEN GLOBAL FUNDS PUBLIC LIMITED COMPANY SCHEDULE OF INVESTMENTS (continued) Payden Euro Liquidity Fund (continued) As at 30 June 2015 Portfolio Analysis % of total assets Transferable securities and money market instruments admitted to an official stock exchange listing or traded on a regulated market Analysis as a percentage of total assets rather than net assets is required under the UCITS Notice 8.5 appendix A. 25 98.24 98.24 . PAYDEN GLOBAL FUNDS PUBLIC LIMITED COMPANY SCHEDULE OF INVESTMENTS (continued) Payden Global Bond Fund* As at 30 June 2015 Holding 200,000 200,000 600,000 400,000 685,000 900,000 1,040,000 450,000 1,200,000 900,000 920,000 1,000,000 650,000 900,000 350,000 200,000 800,000 640,000 550,000 600,000 440,000 1,000,000 450,000 700,000 500,000 425,000 595,000 300,000 550,000 760,000 925,000 650,000 800,000 250,000 500,000 450,000 300,000 625,000 745,000 1,000,000 1,000,000 400,000 400,000 450,000 750,000 1,100,000 300,000 415,000 615,000 323,000 375,000 475,000 600,000 210,000 360,000 860,000 345,000 670,000 700,000 900,000 Name of securities Fair value USD % of net assets Corporate bonds AbbVie Inc 2.500% 14-May-2020 AbbVie Inc 3.200% 06-Nov-2022 Accor SA 2.625% 05-Feb-2021 Air Canada 2015-1 Class A Pass Through Trust 3.600% 15-Mar-2027 Air Lease Corp 4.250% 15-Sep-2024 Allianz SE floating rate 07-Jul-2045 American Express Bank FSB floating rate 12-Jun-2017 AT&T Inc 3.000% 30-Jun-2022 Australia & New Zealand Banking Group Ltd 4.500% 19-Mar-2024 Bank of America Corp 4.200% 26-Aug-2024 Bank of America Corp 6.875% 25-Apr-2018 Bank of Tokyo-Mitsubishi UFJ Ltd 0.875% 11-Mar-2022 Barclays PLC 2.875% 08-Jun-2020 BlackRock Inc 1.250% 06-May-2025 BNP Paribas SA 2.375% 17-Feb-2025 Boston Scientific Corp 2.850% 15-May-2020 BPCE SA floating rate 08-Jul-2026 Buckeye Partners LP 2.650% 15-Nov-2018 BUPA Finance PLC 5.000% 25-Apr-2023 Capital Gemini SA 1.750% 01-Jul-2020 Cie de Saint-Gobain 4.625% 09-Oct-2029 Commonwealth Bank of Australia floating rate 22-Apr-2027 Compass Bank 2.750% 29-Sep-2019 Credit Agricole SA 2.625% 17-Mar-2027 Deutsche Bank AG 1.125% 17-Mar-2025 Fidelity International Ltd 6.875% 24-Feb-2017 FS Investment Corp 4.250% 15-Jan-2020 Gatwick Funding Ltd 6.125% 02-Mar-2026 Goldman Sachs Group Inc 2.600% 23-Apr-2020 Health Care REIT Inc 4.125% 01-Apr-2019 Hospitality Properties Trust 4.500% 15-Mar-2025 HSBC Holdings PLC 3.000% 30-Jun-2025 HSBC USA Inc 2.350% 05-Mar-2020 Hyundai Capital America 2.600% 19-Mar-2020 KBC Groep NV floating rate 11-Mar-2027 Lam Research Corp 3.800% 15-Mar-2025 Latam Airlines 2015-1 Pass Through Trust A 4.200% 15-Nov-2027 McKesson Corp 3.796% 15-Mar-2024 Metropolitan Edison Co 3.500% 15-Mar-2023 Metropolitan Life Global Funding I 1.250% 17-Sep-2021 Morgan Stanley 4.350% 08-Sep-2026 National Grid North America Inc 1.750% 20-Feb-2018 Nationwide Building Society 2.250% 29-Apr-2022 Nationwide Building Society 6.250% 25-Feb-2020 Nationwide Mutual Insurance Co 9.375% 15-Aug-2039 Nissan Motor Acceptance Corp 2.350% 04-Mar-2019 Penske Truck Leasing Co LP / PTL Finance Corp 3.375% 01-Feb-2022 People's United Bank NA 4.000% 15-Jul-2024 Prudential Financial Inc floating rate 15-Jun-2043 QBE Insurance Group Ltd 6.125% 28-Sep-2015 Royal Bank of Scotland Group PLC 1.625% 25-Jun-2019 Ryder System Inc 3.500% 01-Jun-2017 Santander Holdings USA Inc/PA 2.650% 17-Apr-2020 Select Income REIT 4.500% 01-Feb-2025 Sempra Energy 9.800% 15-Feb-2019 Sompo Japan Insurance Inc floating rate 28-Mar-2073 Southeast Supply Header LLC 4.250% 15-Jun-2024 Sumitomo Mitsui Banking Corp floating rate 18-Mar-2016 Sydney Airport Finance Co Pty Ltd 3.375% 30-Apr-2025 Synchrony Financial 4.250% 15-Aug-2024 41,640,325 198,173 198,362 705,912 401,150 681,575 921,147 1,034,093 435,181 1,208,833 899,523 1,039,978 1,080,353 646,175 934,063 367,186 198,813 894,117 638,173 877,409 673,551 740,415 1,056,328 449,334 713,729 501,777 520,524 602,053 576,623 547,612 805,104 911,631 721,315 793,981 250,362 526,385 438,867 297,375 633,323 734,759 1,108,546 982,024 460,715 607,227 525,251 1,129,262 1,109,763 291,227 411,692 638,985 513,910 419,682 494,192 590,523 203,303 452,507 909,450 341,038 1,055,664 674,870 905,522 19.16 0.09 0.09 0.32 0.18 0.31 0.42 0.48 0.20 0.56 0.41 0.48 0.50 0.30 0.43 0.17 0.09 0.41 0.29 0.40 0.31 0.34 0.49 0.21 0.33 0.23 0.24 0.28 0.27 0.25 0.37 0.42 0.33 0.37 0.12 0.24 0.20 0.14 0.29 0.34 0.51 0.45 0.21 0.28 0.24 0.52 0.51 0.13 0.19 0.29 0.24 0.19 0.23 0.27 0.09 0.21 0.42 0.16 0.49 0.31 0.42 26 . PAYDEN GLOBAL FUNDS PUBLIC LIMITED COMPANY SCHEDULE OF INVESTMENTS (continued) Payden Global Bond Fund* (continued) As at 30 June 2015 Holding Name of securities 300,000 750,000 750,000 Corporate bonds (continued) UBS AG/Stamford CT 1.800% 26-Mar-2018 Verizon Communications Inc 6.400% 15-Feb-2038 Yorkshire Building Society 1.250% 17-Mar-2022 940,000 350,000 600,000 425,000 1,870,000 780,000 1,290,000 275,000 1,200,000 1,270,000 532,000 920,000 750,000 1,000,000 300,000 500,000 740,000 1,300,000 1,000,000 775,000 475,000 400,000 490,000 1,200,000 1,400,000 20,550,000 1,500,000 900,000 200,000 400,000 1,200,000 1,800,000 650,000 400,000 580,000 1,250,000 500,000 350,000 1,200,000 7,100,000 1,400,000 950,000 700,000 8,100,000 5,350,000 5,000,000 1,450,000 1,500,000 575,000,000 386,000,000 928,000,000 Fair value USD Covered bonds Alibaba Group Holding Ltd 3.600% 28-Nov-2024 Baxalta Inc 3.600% 23-Jun-2022 BioMed Realty LP 3.850% 15-Apr-2016 BNZ International Funding Ltd/London 1.900% 26-Feb-2018 Cie de Financement Foncier SA 4.550% 28-Apr-2017 Continental Resources Inc/OK 5.000% 15-Sep-2022 Cooperatieve Centrale Raiffeisen-Boerenleenbank BA/Netherlands 4.625% 01-Dec-2023 Credit Suisse Group Funding Guernsey Ltd 2.750% 26-Mar-2020 Dexia Credit Local SA 2.125% 12-Feb-2025 Discovery Communications LLC 1.900% 19-Mar-2027 Freeport-McMoran Oil & Gas LLC / FCX Oil & Gas Inc 6.500% 15-Nov-2020 Glencore Funding LLC floating rate 15-Jan-2019 HJ Heinz Co 2.000% 30-Jun-2023 HJ Heinz Co 2.800% 02-Jul-2020 HPHT Finance 15 Ltd 2.875% 17-Mar-2020 Hutchison Whampoa Finance 06 Ltd 4.625% 21-Sep-2016 Keysight Technologies Inc 3.300% 30-Oct-2019 KKR Group Finance Co II LLC 5.500% 01-Feb-2043 Medtronic Inc 3.150% 15-Mar-2022 Perrigo Co PLC 4.000% 15-Nov-2023 Perrigo Finance PLC 3.500% 15-Dec-2021 Reynolds American Inc 4.000% 12-Jun-2022 SABMiller Holdings Inc floating rate 01-Aug-2018 Government bonds Australia Government Bond 1.750% 21-Nov-2020 Australia Government Bond 3.250% 21-Apr-2025 Australia Government Bond 6.000% 15-Feb-2017 Austria Government Bond 0.250% 18-Oct-2019 Austria Government Bond 1.650% 21-Oct-2024 Austria Government Bond 3.150% 20-Jun-2044 Belgium Government Bond 0.800% 22-Jun-2025 Belgium Government Bond 1.000% 22-Jun-2031 Belgium Government Bond 3.000% 28-Sep-2019 Bundesrepublik Deutschland 3.250% 04-Jul-2042 Bundesrepublik Deutschland 4.750% 04-Jul-2034 Canadian Government Bond 1.000% 01-May-2016 Canadian Government Bond 5.000% 01-Jun-2037 Canadian Government Bond 5.750% 01-Jun-2029 Finland Government Bond 2.750% 04-Jul-2028 Finland Government Bond 3.875% 15-Sep-2017 France Government Bond OAT 1.750% 25-May-2023 France Government Bond OAT 3.250% 25-May-2045 France Government Bond OAT 4.750% 25-Apr-2035 Ireland Government Bond 3.400% 18-Mar-2024 Italy Buoni Poliennali Del Tesoro 3.500% 01-Dec-2018 Italy Buoni Poliennali Del Tesoro 4.500% 01-Aug-2018 Italy Buoni Poliennali Del Tesoro 4.500% 01-May-2023 Italy Buoni Poliennali Del Tesoro 5.000% 01-Aug-2039 Italy Buoni Poliennali Del Tesoro 5.250% 01-Nov-2029 Japan Government Thirty Year Bond 2.000% 20-Sep-2040 Japan Government Thirty Year Bond 2.200% 20-Sep-2039 Japan Government Twenty Year Bond 1.000% 20-Mar-2023 27 % of net assets 299,672 856,995 803,041 0.14 0.39 0.37 18,771,430 908,158 350,319 611,395 427,171 1,583,816 765,867 8.64 0.42 0.16 0.28 0.20 0.73 0.35 1,333,215 271,848 1,803,050 1,283,613 0.61 0.13 0.83 0.59 563,920 919,834 829,909 1,001,918 299,187 586,683 743,286 1,318,623 1,005,384 786,748 476,587 409,202 491,697 0.26 0.42 0.38 0.46 0.14 0.27 0.34 0.61 0.46 0.36 0.22 0.19 0.23 147,249,679 890,716 1,098,028 16,805,465 1,678,163 1,060,047 290,467 428,549 1,193,277 2,244,391 996,503 693,443 466,258 1,470,684 583,083 457,109 1,457,058 8,460,254 1,919,417 1,557,137 901,182 9,857,967 6,655,214 6,583,407 2,078,833 2,146,558 5,339,176 3,710,155 8,000,859 67.75 0.41 0.51 7.73 0.77 0.49 0.13 0.20 0.55 1.03 0.46 0.32 0.21 0.68 0.27 0.21 0.67 3.89 0.88 0.72 0.41 4.54 3.06 3.03 0.96 0.99 2.46 1.71 3.68 . PAYDEN GLOBAL FUNDS PUBLIC LIMITED COMPANY SCHEDULE OF INVESTMENTS (continued) Payden Global Bond Fund* (continued) As at 30 June 2015 Holding 340,000,000 115,000,000 815,000,000 23,080,000 800,000 2,900,000 500,000 1,250,000 3,460,000 1,500,000 2,450,000 1,100,000 1,500,000 1,250,000 1,150,000 1,450,000 750,000 3,500,000 3,500,000 2,000,000 6,000,000 4,932,000 458,000 Name of securities Fair value USD 3,084,310 1,037,051 7,690,526 1,651,525 811,600 3,602,044 807,282 1,237,500 932,997 1,574,658 2,919,226 1,423,173 2,100,621 2,770,311 2,085,321 3,112,994 746,250 3,519,141 3,492,342 1,963,906 6,267,186 4,832,975 563,340 Total value of investment in securities (2014: 101.50%) (1) 70 4 (7) 45 Futures contracts (2014: 0.04%) Euro-Bund Future Exp 08-Sep-2015 Euro-Schatz Future Exp 08-Sep-2015 JP Treasury Note 10 Year (OSE) Future Exp 10-Sep-2015 US Long Bond (CBT) Future Exp 21-Sep-2015 US Treasury Note 2 Year (CBT) Future Exp 30-Sep-2015 1.42 0.48 3.54 0.76 0.37 1.66 0.37 0.57 0.43 0.72 1.34 0.66 0.97 1.27 0.96 1.43 0.34 1.62 1.61 0.90 2.88 2.22 0.26 207,661,434 Government bonds (continued) Japan Government Twenty Year Bond 1.600% 20-Jun-2030 Japan Government Twenty Year Bond 1.700% 20-Sep-2033 Japan Government Twenty Year Bond 1.900% 20-Dec-2028 Mexican Bonos 8.000% 11-Jun-2020 Mexico Government International Bond 3.625% 15-Mar-2022 Netherlands Government Bond 2.250% 15-Jul-2022 Netherlands Government Bond 4.000% 15-Jan-2037 Panama Government International Bond 3.750% 16-Mar-2025 Poland Government Bond 6.250% 24-Oct-2015 Spain Government Bond 1.600% 30-Apr-2025 Spain Government Bond 2.750% 30-Apr-2019 Spain Government Bond 4.200% 31-Jan-2037 Spain Government Bond 5.850% 31-Jan-2022 United Kingdom Gilt 4.250% 07-Dec-2055 United Kingdom Gilt 4.750% 07-Mar-2020 United Kingdom Gilt 4.750% 07-Dec-2038 United States Treasury Note/Bond 0.750% 31-Mar-2018 United States Treasury Note/Bond 0.875% 28-Feb-2017(1) United States Treasury Note/Bond 1.250% 30-Apr-2019(2) United States Treasury Note/Bond 2.125% 15-May-2025 United States Treasury Note/Bond 2.625% 15-Nov-2020 United States Treasury Note/Bond 3.000% 15-May-2042 United States Treasury Note/Bond 4.375% 15-Feb-2038 % of net assets 95.55 Notional (USD) (170,807) 8,677,222 Broker Goldman Sachs Goldman Sachs 46,789 1,448 1,560 0.02 0.00 0.00 4,795,816 Goldman Sachs 8,499 0.00 (1,082,047) UBS 26,141 0.01 9,843,047 Goldman Sachs 9,141 0.01 3,282,191 1.51 210,990,414 97.08 Unrealised gain on forward foreign exchange contracts (Appendix) (2014: 1.75%) Financial assets at fair value through profit or loss 28 . PAYDEN GLOBAL FUNDS PUBLIC LIMITED COMPANY SCHEDULE OF INVESTMENTS (continued) Payden Global Bond Fund* (continued) As at 30 June 2015 Holding (61) (151) (10) Name of securities Fair value USD Futures contracts (2014: (0.06%)) Long Gilt (LIFFE) Future Exp 28Sep-2015 US Treasury Note 10 Year (CBT) Future Exp 21-Sep-2015 US Treasury Note 5 year (CBT) Future Exp 30-Sep-2015 US Ultra Bond (CBT) Future Exp 21-Sep-2015 % of net assets Notional (USD) Broker (180,950) (0.08) (10,996,082) Goldman Sachs (106,441) (0.05) (19,010,467) JPMorgan Chase (41,486) (0.02) Wells Fargo (5,703) 0.00 2,030,133 Goldman Sachs (27,320) (0.01) Unrealised loss on forward foreign exchange contracts (Appendix) (2014: (5.19%) (2,192,436) (1.01) Financial liabilities at fair value through profit or loss 13 (1,186,875) (2,373,386) (1.09) 8,725,103 4.01 217,342,131 100.00 Net current assets Total net assets (1) (2) The nominal value of 140,000 is held as collateral with Goldman Sachs for open future contracts. The nominal value of 782,000 is held as collateral with Goldman Sachs for open future contracts. Appendix: forward foreign currency contracts Unrealised gain on forward foreign currency contracts Currency Counter Party Purchase Payden Global Bond Fund* Royal Bank of Scotland USD Royal Bank of Canada USD State Street USD State Street USD Citibank USD Royal Bank of Scotland EUR Royal Bank of Scotland USD Royal Bank of Scotland GBP Credit Suisse USD Credit Suisse JPY Credit Suisse USD UBS EUR UBS USD Barclays INR Credit Suisse USD Barclays USD Barclays USD Royal Bank of Canada USD Euro Class (Accumulating) Citibank EUR Norwegian Krone Class (Accumulating) Barclays USD Barclays USD Barclays USD Barclays USD Sterling Class (Accumulating) HSBC Securities GBP Purchase Amount Currency Sale Sale Amount Maturity date Unrealised Gain/Loss USD 19,424,919 4,201,529 40,781,633 787,591 43,855,280 4,476,000 5,078,604 3,221,000 4,446,553 560,700,000 4,658,718 142,000 4,724,813 230,460,000 1,751,926 2,947,356 987,962 4,458,711 AUD CAD EUR EUR EUR USD EUR USD AUD USD JPY USD EUR USD MXN SGD PLN CAD (24,997,000) (5,235,000) (36,169,000) (700,000) (38,892,000) (4,787,480) (4,476,000) (4,910,608) (5,736,000) (4,512,295) (560,700,000) (156,718) (4,204,000) (3,523,314) (26,610,000) (3,942,000) (3,652,000) (5,556,000) 09-Jul-2015 09-Jul-2015 09-Jul-2015 09-Jul-2015 09-Jul-2015 17-Jul-2015 17-Jul-2015 17-Jul-2015 31-Jul-2015 31-Jul-2015 31-Jul-2015 17-Aug-2015 17-Aug-2015 17-Aug-2015 19-Aug-2015 20-Aug-2015 26-Aug-2015 14-Sep-2015 219,976 8,749 478,498 7,581 517,906 200,679 90,444 154,527 45,485 71,546 74,877 1,600 37,703 62,003 62,061 21,997 18,412 12,883 21,354,000 USD (23,420,726) 06-Jul-2015 373,119 1,274,595 1,273,041 2,020,473 2,544,465 NOK NOK NOK NOK (10,000,000) (10,000,000) (15,739,000) (20,000,000) 06-Jul-2015 06-Jul-2015 06-Jul-2015 06-Jul-2015 3,657 2,102 20,143 2,588 16,868,000 USD (25,733,905) 06-Jul-2015 793,655 3,282,191 29 . PAYDEN GLOBAL FUNDS PUBLIC LIMITED COMPANY SCHEDULE OF INVESTMENTS (continued) Payden Global Bond Fund* (continued) As at 30 June 2015 Appendix: forward foreign currency contracts (continued) Unrealised loss on forward foreign currency contracts Currency Counter Party Purchase Payden Global Bond Fund* (continued) Citibank EUR HSBC Securities USD Royal Bank of Scotland USD Royal Bank of Scotland USD HSBC Securities EUR HSBC Securities USD UBS EUR Barclays USD HSBC Securities PHP Purchase Amount Currency Sale Sale Amount Maturity date Unrealised Gain/Loss USD 3,450,000 14,249,031 28,515,159 4,777,597 384,000 3,560,760 158,000 308,501 131,810,000 USD GBP JPY GBP USD EUR USD INR USD (3,885,228) (9,291,000) (3,540,100,000) (3,221,000) (431,624) (3,314,000) (177,663) (19,960,000) (2,946,792) 09-Jul-2015 09-Jul-2015 09-Jul-2015 17-Jul-2015 23-Jul-2015 23-Jul-2015 17-Aug-2015 17-Aug-2015 20-Aug-2015 (40,891) (362,217) (417,769) (287,538) (3,649) (132,747) (1,506) (2,021) (31,566) Norwegian Krone Class (Accumulating) Barclays NOK Barclays NOK 896,869,000 11,000,000 USD USD (114,872,015) (1,425,059) 06-Jul-2015 06-Jul-2015 (885,505) (27,027) (2,192,436) Portfolio Analysis % of total assets Transferable securities and money market instruments admitted to an official stock exchange listing or traded on a regulated market Financial derivative instruments dealt in on a regulated market OTC financial derivative instruments Analysis as a percentage of total assets rather than net assets is required under the UCITS Notice 8.5 appendix A. * This Fund changed name from Payden International Bond Fund on 24 March 2015. 30 93.02 (0.06) 0.49 93.45 . PAYDEN GLOBAL FUNDS PUBLIC LIMITED COMPANY SCHEDULE OF INVESTMENTS (continued) Payden Global Emerging Markets Bond Fund As at 30 June 2015 Holding Name of securities Fair value USD % of net assets 950,000 897,304 190,000 400,000 Argentina Argentine Republic Government International Bond 2.500% 31-Dec-2038 Argentine Republic Government International Bond 8.280% 31-Dec-2033 Argentine Republic Government International Bond 8.750% 02-Jun-2017 YPF SA 8.500% 28-Jul-2025 1,950,962 513,000 861,412 179,550 397,000 1.78 0.47 0.79 0.16 0.36 778,000 480,000 Armenia Republic of Armenia 6.000% 30-Sep-2020 Republic of Armenia 7.150% 26-Mar-2025 1,243,463 765,863 477,600 1.13 0.70 0.43 450,000 Australia CNOOC Curtis Funding No 1 Pty Ltd 4.500% 03-Oct-2023 473,668 473,668 0.43 0.43 490,000 460,000 Azerbaijan International Bank of Azerbaijan OJSC 5.625% 11-Jun-2019 State Oil Co of the Azerbaijan Republic 4.750% 13-Mar-2023 916,423 476,329 440,094 0.84 0.44 0.40 245,000 Barbados Columbus International Inc 7.375% 30-Mar-2021 264,294 264,294 0.24 0.24 540,000 Belarus Republic of Belarus 8.950% 26-Jan-2018 523,395 523,395 0.48 0.48 200,000 Bermuda Digicel Group Ltd 8.250% 30-Sep-2020 201,500 201,500 0.18 0.18 Brazil Banco Nacional de Desenvolvimento Economico e Social 5.750% 26-Sep-2023 Brazil Notas do Tesouro Nacional Serie B 6.000% 15-Aug-2022 Brazil Notas do Tesouro Nacional Serie F 10.000% 01-Jan-2017 Brazil Notas do Tesouro Nacional Serie F 10.000% 01-Jan-2018 Brazil Notas do Tesouro Nacional Serie F 10.000% 01-Jan-2021 Brazil Notas do Tesouro Nacional Serie F 10.000% 01-Jan-2025 Brazilian Government International Bond 4.250% 07-Jan-2025 Brazilian Government International Bond 5.625% 07-Jan-2041 Brazilian Government International Bond 8.250% 20-Jan-2034 Embraer SA 5.150% 15-Jun-2022 USJ Acucar e Alcool SA 9.875% 09-Nov-2019 5,391,457 4.91 400,023 583,531 425,643 1,032,428 611,271 172,771 618,720 201,600 560,250 290,220 495,000 0.37 0.53 0.39 0.94 0.56 0.16 0.56 0.18 0.51 0.26 0.45 295,000 615,000 450,000 Canada Evraz Inc NA Canada 7.500% 15-Nov-2019 First Quantum Minerals Ltd 6.750% 15-Feb-2020 Pacific Rubiales Energy Corp 5.375% 26-Jan-2019 1,260,938 292,050 598,088 370,800 1.15 0.27 0.54 0.34 1,669,307 1.52 290,000 490,000 270,000 280,000 460,000 Cayman Islands AES Andres Dominicana Ltd / Itabo Dominicana Ltd 9.500% 12-Nov-2020 Agricola Senior Trust 6.750% 18-Jun-2020 Baidu Inc 4.125% 30-Jun-2025 Golden Eagle Retail Group Ltd 4.625% 21-May-2023 Odebrecht Finance Ltd 7.125% 26-Jun-2042 307,400 501,025 269,419 237,263 354,200 0.28 0.46 0.24 0.22 0.32 280,000 550,000 360,000 880,000 Chile Corp Nacional del Cobre de Chile 4.875% 04-Nov-2044 Empresa Electrica Angamos SA 4.875% 25-May-2029 Empresa Nacional del Petroleo 4.375% 30-Oct-2024 Latam Airlines 2015-1 Pass Through Trust A 4.200% 15-Nov-2027 2,044,758 268,868 542,788 360,802 872,300 1.86 0.24 0.49 0.33 0.80 540,000 870,000 China Bank of China Ltd 5.000% 13-Nov-2024 China Construction Bank Corp floating rate 13-May-2025 1,695,829 554,936 865,579 1.55 0.51 0.79 390,000 680,000 1,388,000 3,417,000 2,105,000 620,000 640,000 210,000 450,000 280,000 900,000 31 . PAYDEN GLOBAL FUNDS PUBLIC LIMITED COMPANY SCHEDULE OF INVESTMENTS (continued) Payden Global Emerging Markets Bond Fund (continued) As at 30 June 2015 Holding Name of securities Fair value USD 270,000 China (continued) Industrial & Commercial Bank of China Ltd/New York 3.231% 13-Nov-2019 % of net assets 275,314 0.25 270,000 320,000 360,000 641,000,000 610,000,000 1,126,000,000 1,240,000,000 100,000 290,000 572,000,000 792,000,000 497,000,000 Colombia Colombia Government International Bond 5.000% 15-Jun-2045 Colombia Government International Bond 5.625% 26-Feb-2044 Colombia Government International Bond 6.125% 18-Jan-2041 Colombian TES 5.000% 21-Nov-2018 Colombian TES 7.000% 04-May-2022 Colombian TES 7.250% 15-Jun-2016 Colombian TES 10.000% 24-Jul-2024 Ecopetrol SA 5.375% 26-Jun-2026 Ecopetrol SA 5.875% 18-Sep-2023 Emgesa SA ESP 8.750% 25-Jan-2021 Empresa de Telecomunicaciones de Bogota 7.000% 17-Jan-2023 Empresas Publicas de Medellin ESP 7.625% 10-Sep-2024 3,575,695 251,100 325,600 392,400 244,526 237,500 444,722 564,112 99,125 305,225 235,326 290,038 186,021 3.26 0.23 0.30 0.36 0.22 0.22 0.41 0.51 0.09 0.28 0.21 0.26 0.17 570,000 440,000 460,000 200,000 Costa Rica Banco de Costa Rica 5.250% 12-Aug-2018 Banco Nacional de Costa Rica 4.875% 01-Nov-2018 Costa Rica Government International Bond 7.000% 04-Apr-2044 Costa Rica Government International Bond 7.158% 12-Mar-2045 1,675,135 587,385 444,400 447,350 196,000 1.53 0.54 0.40 0.41 0.18 690,000 460,000 500,000 Croatia Croatia Government International Bond 6.000% 26-Jan-2024 Croatia Government International Bond 6.375% 24-Mar-2021 Hrvatska Elektroprivreda 6.000% 09-Nov-2017 1,755,854 732,954 498,525 524,375 1.60 0.67 0.45 0.48 360,000 Curacao SUAM Finance BV 4.875% 17-Apr-2024 363,600 363,600 0.33 0.33 480,000 490,000 290,000 900,000 150,000 Dominican Republic Aeropuertos Dominicanos Siglo XXI SA 9.750% 13-Nov-2019 Dominican Republic International Bond 5.500% 27-Jan-2025 Dominican Republic International Bond 6.850% 27-Jan-2045 Dominican Republic International Bond 7.450% 30-Apr-2044 Dominican Republic International Bond 7.500% 06-May-2021 2,439,800 492,000 493,675 297,250 987,750 169,125 2.22 0.45 0.45 0.27 0.90 0.15 230,000 440,000 El Salvador El Salvador Government International Bond 6.375% 18-Jan-2027 El Salvador Government International Bond 7.650% 15-Jun-2035 668,075 223,675 444,400 0.61 0.20 0.41 520,000 710,000 Georgia Bank of Georgia JSC 7.750% 05-Jul-2017 Georgian Railway JSC 7.750% 11-Jul-2022 1,315,932 542,387 773,545 1.20 0.49 0.71 704,755 704,755 0.64 0.64 Ghana Republic of Ghana 7.875% 07-Aug-2023 Republic of Ghana 8.125% 18-Jan-2026 Republic of Ghana 8.500% 04-Oct-2017 2,256,119 1,012,086 766,668 477,365 2.06 0.92 0.70 0.44 Honduras Honduras Government International Bond 7.500% 15-Mar-2024 Republic of Honduras 8.750% 16-Dec-2020 1,145,191 565,066 580,125 1.04 0.51 0.53 Hungary Hungary Government Bond 5.500% 24-Jun-2025 2,235,295 361,032 2.04 0.33 11,100,000,000 1,115,000 840,000 461,000 520,000 510,000 90,300,000 Germany Deutsche Bank AG/London 5.625% 17-May-2023 32 . PAYDEN GLOBAL FUNDS PUBLIC LIMITED COMPANY SCHEDULE OF INVESTMENTS (continued) Payden Global Emerging Markets Bond Fund (continued) As at 30 June 2015 Holding Fair value USD % of net assets Hungary (continued) Hungary Government Bond 7.000% 24-Jun-2022 Hungary Government International Bond 5.375% 25-Mar-2024 Magyar Export-Import Bank Zrt 4.000% 30-Jan-2020 MFB Magyar Fejlesztesi Bank Zrt 6.250% 21-Oct-2020 695,201 228,113 547,047 403,902 0.63 0.21 0.50 0.37 570,000 350,000 India Export-Import Bank of India 4.000% 14-Jan-2023 IDBI Bank Ltd/DIFC Dubai 4.125% 23-Apr-2020 919,593 568,675 350,918 0.84 0.52 0.32 350,000 390,000 530,000 610,000 320,000 83,000 540,000 550,000 Indonesia Indonesia Government International Bond 4.125% 15-Jan-2025 Indonesia Government International Bond 5.125% 15-Jan-2045 Indonesia Government International Bond 5.375% 17-Oct-2023 Indonesia Government International Bond 5.875% 15-Jan-2024 Indonesia Government International Bond 8.500% 12-Oct-2035 Pertamina Persero PT 4.300% 20-May-2023 Pertamina Persero PT 6.000% 03-May-2042 Perusahaan Gas Negara Persero Tbk PT 5.125% 16-May-2024 4,253,142 344,312 372,938 571,738 675,575 433,600 796,800 503,658 554,521 3.88 0.31 0.34 0.52 0.62 0.39 0.73 0.46 0.51 960,000 Ivory Coast Ivory Coast Government International Bond 5.750% 31-Dec-2032 909,792 909,792 0.83 0.83 350,000 Jamaica Jamaica Government International Bond 7.625% 09-Jul-2025 393,750 393,750 0.36 0.36 680,000 390,000 490,000 500,000 Kazakhstan Development Bank of Kazakhstan JSC 4.125% 10-Dec-2022 KazAgro National Management Holding JSC 4.625% 24-May-2023 KazMunayGas National Co JSC 6.000% 07-Nov-2044 KazMunayGas National Co JSC 6.375% 09-Apr-2021 1,901,812 608,600 345,150 422,012 526,050 1.73 0.56 0.31 0.38 0.48 Kenya Kenya Government International Bond 5.875% 24-Jun-2019 1,202,613 1,202,613 1.10 1.10 Luxembourg Actavis Funding SCS 4.550% 15-Mar-2035 Atento Luxco 1 SA 7.375% 29-Jan-2020 Millicom International Cellular SA 6.625% 15-Oct-2021 1,134,674 219,374 626,200 289,100 1.03 0.20 0.57 0.26 982,162 603,293 378,869 0.90 0.55 0.35 7,156,976 227,370 558,250 486,043 229,625 366,102 145,920 399,545 559,012 278,454 1,112,008 316,200 492,238 1,100,750 547,584 337,875 6.52 0.21 0.51 0.44 0.21 0.33 0.13 0.37 0.51 0.25 1.01 0.29 0.45 1.00 0.50 0.31 163,050,000 210,000 540,000 360,000 1,175,000 230,000 620,000 280,000 2,350,000 390,000 220,000 550,000 476,513 220,000 6,700,000 150,000 6,150,000 7,850,000 3,911,000 13,600,000 340,000 530,000 1,190,000 8,700,000 340,000 Name of securities Malaysia Malaysia Government Bond 3.418% 15-Aug-2022 Petronas Capital Ltd 4.500% 18-Mar-2045 Mexico BBVA Bancomer SA/Grand Cayman floating rate 17-May-2022 Comision Federal de Electricidad 6.125% 16-Jun-2045 Fermaca Enterprises S de RL de CV 6.375% 30-Mar-2038 Gruma SAB de CV 4.875% 01-Dec-2024 Grupo Televisa SAB 7.250% 14-May-2043 JB y Co SA de CV 3.750% 13-May-2025 Mexican Bonos 5.000% 15-Jun-2017 Mexican Bonos 7.750% 29-May-2031 Mexican Bonos 7.750% 13-Nov-2042 Mexican Bonos 10.000% 05-Dec-2024 Mexichem SAB de CV 5.875% 17-Sep-2044 Mexico Government International Bond 4.600% 23-Jan-2046 Petroleos Mexicanos 5.500% 27-Jun-2044 Red de Carreteras de Occidente SAPIB de CV 9.000% 10-Jun-2028 Unifin Financiera SAPI de CV SOFOM ENR 6.250% 22-Jul-2019 33 . PAYDEN GLOBAL FUNDS PUBLIC LIMITED COMPANY SCHEDULE OF INVESTMENTS (continued) Payden Global Emerging Markets Bond Fund (continued) As at 30 June 2015 Holding Name of securities Fair value USD % of net assets 200,000 Mongolia Mongolia Government International Bond 5.125% 05-Dec-2022 181,500 181,500 0.17 0.17 230,000 630,000 Morocco BMCE Bank 6.250% 27-Nov-2018 OCP SA 5.625% 25-Apr-2024 900,759 241,546 659,213 0.82 0.22 0.60 850,000 550,000 480,000 560,000 200,000 Netherlands Ajecorp BV 6.500% 14-May-2022 Kazakhstan Temir Zholy Finance BV 6.375% 06-Oct-2020 Kazakhstan Temir Zholy Finance BV 6.950% 10-Jul-2042 VimpelCom Holdings BV 7.504% 01-Mar-2022 VTR Finance BV 6.875% 15-Jan-2024 2,423,741 624,750 579,271 464,650 550,200 204,870 2.21 0.57 0.53 0.42 0.50 0.19 245,000 116,000,000 450,000 Nigeria Nigeria Government International Bond 6.750% 28-Jan-2021 Nigeria Government International Bond 13.050% 16-Aug-2016 Zenith Bank PLC 6.250% 22-Apr-2019 1,266,682 254,494 577,376 434,812 1.15 0.23 0.52 0.40 200,000 Pakistan Pakistan Government International Bond 8.250% 15-Apr-2024 218,500 218,500 0.20 0.20 Panama AES El Salvador Trust II 6.750% 28-Mar-2023 Avianca Holdings SA / Avianca Leasing LLC / Grupo Taca Holdings Ltd 8.375% 10-May-2020 Panama Government International Bond 6.700% 26-Jan-2036 Panama Government International Bond 9.375% 01-Apr-2029 2,967,275 526,625 2.70 0.48 354,375 1,767,000 319,275 0.32 1.61 0.29 220,000 740,000 200,000 Paraguay Republic of Paraguay 4.625% 25-Jan-2023 Republic of Paraguay 6.100% 11-Aug-2044 Telefonica Celular del Paraguay SA 6.750% 13-Dec-2022 1,186,100 223,300 754,800 208,000 1.08 0.20 0.69 0.19 380,000 450,000 640,000 970,000 220,000 550,000 Peru Abengoa Transmision Sur SA 6.875% 30-Apr-2043 Peruvian Government International Bond 5.625% 18-Nov-2050 Peruvian Government International Bond 5.700% 12-Aug-2024 Peruvian Government International Bond 6.950% 12-Aug-2031 Peruvian Government International Bond 7.350% 21-Jul-2025 Scotiabank Peru SAA floating rate 13-Dec-2027 2,248,231 423,225 504,000 192,110 299,496 287,650 541,750 2.05 0.39 0.46 0.18 0.27 0.26 0.49 938,228 253,245 285,681 228,508 170,794 0.85 0.23 0.26 0.21 0.15 550,000 350,000 1,425,000 215,000 10,000,000 215,000 158,000 130,000 Philippines Philippine Government International Bond 6.250% 14-Jan-2036 Philippine Government International Bond 6.375% 23-Oct-2034 Philippine Government International Bond 7.750% 14-Jan-2031 Power Sector Assets & Liabilities Management Corp 7.390% 02-Dec-2024 6,640,000 3,880,000 1,289,000 Poland Poland Government Bond 3.250% 25-Jul-2025 Poland Government Bond 4.000% 25-Oct-2023 Poland Government Bond 5.250% 25-Oct-2020 3,232,320 1,756,107 1,091,319 384,894 2.95 1.60 1.00 0.35 1,220,000 570,000 1,050,000 350,000 1,104,000 340,000 Romania Romania Government Bond 5.600% 28-Nov-2018 Romania Government Bond 5.850% 26-Apr-2023 Romania Government Bond 5.950% 11-Jun-2021 Romanian Government International Bond 4.375% 22-Aug-2023 Romanian Government International Bond 4.875% 22-Jan-2024 Romanian Government International Bond 6.125% 22-Jan-2044 2,707,793 335,536 159,335 297,127 360,465 1,173,000 382,330 2.47 0.31 0.14 0.27 0.33 1.07 0.35 34 . PAYDEN GLOBAL FUNDS PUBLIC LIMITED COMPANY SCHEDULE OF INVESTMENTS (continued) Payden Global Emerging Markets Bond Fund (continued) As at 30 June 2015 Holding Name of securities Fair value USD % of net assets Russia Russian Federal Bond - OFZ 7.500% 27-Feb-2019 Russian Federal Bond - OFZ 7.600% 14-Apr-2021 Russian Federal Bond - OFZ 8.150% 03-Feb-2027 1,718,573 709,445 387,912 621,216 1.57 0.65 0.35 0.57 Senegal Senegal Government International Bond 6.250% 30-Jul-2024 Senegal Government International Bond 8.750% 13-May-2021 1,967,943 1,223,010 744,933 1.79 1.11 0.68 Serbia Republic of Serbia 5.250% 21-Nov-2017 Republic of Serbia 5.875% 03-Dec-2018 Republic of Serbia 7.250% 28-Sep-2021 1,335,224 280,287 549,250 505,687 1.22 0.26 0.50 0.46 55,000,000 51,000,000 280,000 Singapore Standard Chartered Bank Singapore Ltd 7.160% 23-May-2023 Standard Chartered Bank Singapore Ltd 8.830% 29-Nov-2023 TBG Global Pte Ltd 4.625% 03-Apr-2018 1,950,440 827,836 842,604 280,000 1.78 0.75 0.77 0.26 610,000 3,900,000 29,740,550 1,620,000 205,000 South Africa Eskom Holdings SOC Ltd 5.750% 26-Jan-2021 South Africa Government Bond 6.250% 31-Mar-2036 South Africa Government Bond 7.000% 28-Feb-2031 South Africa Government Bond 10.500% 21-Dec-2026 Transnet SOC Ltd 4.000% 26-Jul-2022 3,289,739 600,850 242,527 2,093,005 155,450 197,907 3.00 0.55 0.22 1.91 0.14 0.18 360,000 460,000 420,000 460,000 Sri Lanka Bank of Ceylon 6.875% 03-May-2017 National Savings Bank 8.875% 18-Sep-2018 Sri Lanka Government International Bond 5.125% 11-Apr-2019 Sri Lanka Government International Bond 6.000% 14-Jan-2019 1,761,873 371,250 499,698 420,000 470,925 1.61 0.34 0.46 0.38 0.43 510,000 Sweden Eileme 2 AB 11.625% 31-Jan-2020 568,599 568,599 0.52 0.52 880,000 Tanzania Tanzania Government International Bond floating rate 09-Mar-2020 896,500 896,500 0.82 0.82 1,376,635 512,083 864,552 1.25 0.46 0.79 715,400 715,400 0.65 0.65 5,605,067 1,069,209 854,825 59,395 554,417 781,193 148,677 137,233 264,976 663,389 477,137 594,616 5.11 0.97 0.78 0.05 0.51 0.71 0.14 0.13 0.24 0.60 0.44 0.54 615,363 354,113 261,250 0.56 0.32 0.24 43,700,000 25,000,000 41,500,000 1,270,000 665,000 270,000 520,000 450,000 16,750,000 25,132,000 730,000 1,060,000 2,350,000 160,000 1,495,000 2,068,000 370,000 365,000 290,000 595,000 410,000 580,000 665,000 500,000 Thailand Thailand Government Bond 3.250% 16-Jun-2017 Thailand Government Bond 4.875% 22-Jun-2029 Tunisia Banque Centrale de Tunisie SA 5.750% 30-Jan-2025 Turkey Export Credit Bank of Turkey 5.000% 23-Sep-2021 Turkey Government Bond 8.500% 10-Jul-2019 Turkey Government Bond 9.000% 08-Mar-2017 Turkey Government Bond 9.000% 24-Jul-2024 Turkey Government Bond 9.500% 12-Jan-2022 Turkey Government Bond 10.400% 20-Mar-2024 Turkey Government Bond 10.700% 24-Feb-2016 Turkey Government International Bond 4.875% 16-Apr-2043 Turkey Government International Bond 6.250% 26-Sep-2022 Turkey Government International Bond 6.875% 17-Mar-2036 Turkiye Vakiflar Bankasi TAO 5.000% 31-Oct-2018 Ukraine Ukraine Government International Bond 7.500% 17-Apr-2023 Ukraine Government International Bond 7.800% 28-Nov-2022 35 . PAYDEN GLOBAL FUNDS PUBLIC LIMITED COMPANY SCHEDULE OF INVESTMENTS (continued) Payden Global Emerging Markets Bond Fund (continued) As at 30 June 2015 Holding Name of securities 340,000 Fair value USD United Arab Emirates DP World Ltd 3.250% 18-May-2020 % of net assets 338,300 338,300 0.31 0.31 9,600,000,000 12,000,000 50,000,000 7,200,000,000 39,000,000 1,970,000,000 United Kingdom Standard Chartered Bank 9.000% 19-Mar-2029 Standard Chartered Bank/Singapore 7.160% 23-May-2023 Standard Chartered Bank/Singapore 7.280% 05-Jun-2019 Standard Chartered Bank/Singapore 8.375% 19-Mar-2024 Standard Chartered Bank/Singapore 9.340% 27-Aug-2024 Standard Chartered Bank/Singapore EMTN 8.375% 19-Mar-2024 3,053,333 761,652 180,619 773,321 540,682 648,685 148,374 2.78 0.69 0.16 0.71 0.49 0.59 0.14 745,000 230,000 2,000,000,000 6,500,000,000 310,000 United States Cemex Finance LLC 9.375% 12-Oct-2022 JBS USA LLC / JBS USA Finance Inc 5.750% 15-Jun-2025 JPMorgan Chase Bank NA 8.375% 17-Mar-2034 JPMorgan Chase Bank NA 9.500% 17-Jul-2031 Southern Copper Corp 5.875% 23-Apr-2045 2,038,077 833,469 227,918 150,337 530,706 295,647 1.86 0.76 0.21 0.14 0.48 0.27 Uruguay Uruguay Government International Bond 4.500% 14-Aug-2024 Uruguay Government International Bond 5.100% 18-Jun-2050 1,987,260 1,256,685 730,575 1.81 1.14 0.67 905,000 820,000 950,000 895,000 910,000 324,000 378,000 Venezuela Petroleos de Venezuela SA 5.375% 12-Apr-2027 Petroleos de Venezuela SA 6.000% 15-Nov-2026 Petroleos de Venezuela SA 9.000% 17-Nov-2021 Petroleos de Venezuela SA 9.750% 17-May-2035 Venezuela Government International Bond 6.000% 09-Dec-2020 Venezuela Government International Bond 7.000% 31-Mar-2038 Venezuela Government International Bond 7.650% 21-Apr-2025 1,962,145 314,487 293,150 391,875 366,503 341,250 115,020 139,860 1.79 0.29 0.27 0.36 0.33 0.31 0.10 0.13 765,000 Vietnam Vietnam Government International Bond 4.800% 19-Nov-2024 768,825 768,825 0.70 0.70 695,000 Zambia Zambia Government International Bond 8.500% 14-Apr-2024 699,778 699,778 0.64 0.64 105,546,162 96.21 975,279 0.89 106,521,441 97.10 Unrealised loss on forward foreign exchange contracts (Appendix) (2014: (1.38%)) (80,544) (0.07) Financial liabilities at fair value through profit or loss (80,544) (0.07) 3,260,945 2.97 109,701,842 100.00 1,194,000 765,000 Total value of investment in securities (2014: 98.25%) Unrealised gain on forward foreign exchange contracts (Appendix) (2014: 0.27%) Financial assets at fair value through profit or loss Net current assets Total net assets 36 . PAYDEN GLOBAL FUNDS PUBLIC LIMITED COMPANY SCHEDULE OF INVESTMENTS (continued) Payden Global Emerging Markets Bond Fund (continued) As at 30 June 2015 Appendix: forward foreign currency contracts Unrealised gain on forward foreign currency contracts Currency Purchase Counter Party Purchase Amount Payden Global Emerging Markets Bond Fund HSBC Securities USD 270,092 HSBC Securities USD 451,732 State Street USD 940,690 Barclays USD 1,493,865 Royal Bank of Scotland USD 273,715 Royal Bank of Scotland ZAR 3,350,000 Barclays EUR 310,000 Barclays JPY 11,400,000 Barclays JPY 106,900,000 Barclays JPY 102,600,000 UBS USD 570,379 HSBC Securities USD 584,604 Currency Sale Sale Amount Maturity date Unrealised Gain/Loss USD RUB RUB HUF SGD ZAR USD USD USD USD USD COP COP (14,350,000) (23,280,000) (257,800,000) (1,998,000) (3,350,000) (271,178) (345,519) (92,000) (863,502) (833,950) (1,475,000,000) (1,515,000,000) 27-Jul-2015 27-Jul-2015 14-Aug-2015 20-Aug-2015 26-Aug-2015 26-Aug-2015 16-Sep-2015 16-Sep-2015 16-Sep-2015 16-Sep-2015 23-Sep-2015 23-Sep-2015 14,831 37,621 30,436 11,149 431 2,106 261 1,259 11,000 5,376 8,328 7,310 Euro Class (Accumulating) Citibank EUR 18,525,000 USD (20,317,924) 06-Jul-2015 323,688 Euro Class (Distributing) Citibank EUR 11,685,000 USD (12,815,921) 06-Jul-2015 204,172 Sterling Class (Accumulating) HSBC Securities GBP 6,725,000 USD (10,259,694) 06-Jul-2015 316,417 Sterling Class (Distributing) HSBC Securities GBP 19,000 USD (28,987) 06-Jul-2015 894 975,279 Currency Sale Sale Amount Maturity date Unrealised Gain/Loss USD USD USD USD MXN USD USD ZAR RON USD EUR JPY USD (673,769) (1,129,199) (207,154) (8,540,000) (347,179) (1,387,212) (13,900,000) (2,122,000) (135,484) (5,367,000) (220,900,000) (2,100,304) 27-Jul-2015 03-Aug-2015 19-Aug-2015 19-Aug-2015 19-Aug-2015 20-Aug-2015 26-Aug-2015 01-Sep-2015 16-Sep-2015 16-Sep-2015 16-Sep-2015 29-Sep-2015 (4,396) (8,022) (2,668) (2,014) (9,333) (14,860) (6,922) (1,471) (518) (14,137) (9,061) (5,813) EUR (1,334,000) 06-Jul-2015 (1,329) (80,544) Unrealised loss on forward foreign currency contracts Currency Purchase Counter Party Purchase Amount Payden Global Emerging Markets Bond Fund HSBC Securities RUB 37,630,000 BNP Paribas CLP 719,300,000 Credit Suisse MXN 3,220,000 Credit Suisse USD 540,318 Barclays MXN 5,320,000 HSBC Securities PHP 62,050,000 BNP Paribas USD 1,127,003 HSBC Securities USD 525,964 Barclays EUR 121,000 Barclays USD 5,972,317 Barclays USD 1,798,025 HSBC Securities MYR 7,957,000 Euro Class (Distributing) Citibank USD 1,485,090 Portfolio Analysis % of total assets Transferable securities and money market instruments admitted to an official stock exchange listing or traded on a regulated market OTC financial derivative instruments Analysis as a percentage of total assets rather than net assets is required under the UCITS Notice 8.5 appendix A. 37 94.41 0.80 95.21 . PAYDEN GLOBAL FUNDS PUBLIC LIMITED COMPANY SCHEDULE OF INVESTMENTS (continued) Payden Global Emerging Markets Corporate Bond Fund As at 30 June 2015 Holding Name of securities Fair value USD % of net assets 300,000 Argentina YPF SA 8.500% 28-Jul-2025 297,750 297,750 0.60 0.60 470,000 Australia Australia & New Zealand Banking Group Ltd 4.500% 19-Mar-2024 473,460 473,460 0.95 0.95 240,000 Azerbaijan International Bank of Azerbaijan OJSC 5.625% 11-Jun-2019 233,304 233,304 0.47 0.47 225,000 Barbados Columbus International Inc 7.375% 30-Mar-2021 242,719 242,719 0.49 0.49 510,000 250,000 240,000 775,000 Bermuda Digicel Group Ltd 8.250% 30-Sep-2020 Digicel Ltd 6.000% 15-Apr-2021 GCX Ltd 7.000% 01-Aug-2019 Ooredoo International Finance Ltd 3.875% 31-Jan-2028 1,735,931 513,825 241,655 242,264 738,187 3.49 1.03 0.49 0.49 1.48 255,000 185,000 750,000 Brazil Cielo SA / Cielo USA Inc 3.750% 16-Nov-2022 Embraer SA 5.150% 15-Jun-2022 USJ Acucar e Alcool SA 9.875% 09-Nov-2019 840,127 235,875 191,752 412,500 1.69 0.47 0.39 0.83 550,000 230,000 British Virgin Islands Sinopec Group Overseas Development 2015 Ltd 2.500% 28-Apr-2020 Yingde Gases Investment Ltd 8.125% 22-Apr-2018 765,714 542,326 223,388 1.54 1.09 0.45 310,000 245,000 445,000 350,000 390,000 265,000 Canada Air Canada 7.750% 15-Apr-2021 Evraz Inc NA Canada 7.500% 15-Nov-2019 First Quantum Minerals Ltd 6.750% 15-Feb-2020 Novelis Inc 8.375% 15-Dec-2017 Pacific Rubiales Energy Corp 5.375% 26-Jan-2019 Pacific Rubiales Energy Corp 7.250% 12-Dec-2021 1,910,122 331,700 242,550 432,762 363,125 321,360 218,625 3.84 0.67 0.49 0.87 0.73 0.64 0.44 520,000 240,000 335,000 240,000 280,000 470,000 550,000 275,000 400,000 480,000 188,600 355,000 270,000 600,000 Cayman Islands ADCB Finance Cayman Ltd floating rate 28-May-2023 AES Andres Dominicana Ltd / Itabo Dominicana Ltd 9.500% 12-Nov-2020 Agricola Senior Trust 6.750% 18-Jun-2020 Alibaba Group Holding Ltd 4.500% 28-Nov-2034 Golden Eagle Retail Group Ltd 4.625% 21-May-2023 Hutchison Whampoa International 11 Ltd 4.625% 13-Jan-2022 Hutchison Whampoa International 12 Ltd floating rate Perpetual Industrial Senior Trust 5.500% 01-Nov-2022 MAF Global Securities Ltd 4.750% 07-May-2024 Marfrig Overseas Ltd 9.500% 04-May-2020 Odebrecht Drilling Norbe VIII/IX Ltd 6.350% 30-Jun-2021 Odebrecht Finance Ltd 7.125% 26-Jun-2042 Tencent Holdings Ltd 3.375% 02-May-2019 Tencent Holdings Ltd 3.800% 11-Feb-2025 5,131,971 520,000 254,400 342,537 231,333 237,263 506,789 585,222 267,437 414,000 492,816 146,165 273,350 277,463 583,196 10.33 1.05 0.51 0.69 0.47 0.48 1.02 1.18 0.54 0.83 0.99 0.29 0.55 0.56 1.17 470,000 360,000 260,000 370,000 260,000 370,000 510,000 300,000 Chile Colbun SA 6.000% 21-Jan-2020 Corpbanca SA 3.125% 15-Jan-2018 Empresa Electrica Angamos SA 4.875% 25-May-2029 Empresa Nacional del Petroleo 4.375% 30-Oct-2024 GNL Quintero SA 4.634% 31-Jul-2029 Latam Airlines 2015-1 Pass Through Trust A 4.200% 15-Nov-2027 Latam Airlines 2015-1 Pass Through Trust B 4.500% 15-Nov-2023 Telefonica Chile SA 3.875% 12-Oct-2022 2,945,608 520,778 361,691 256,591 370,824 261,397 366,763 512,550 295,014 5.93 1.05 0.73 0.52 0.75 0.52 0.74 1.03 0.59 38 . PAYDEN GLOBAL FUNDS PUBLIC LIMITED COMPANY SCHEDULE OF INVESTMENTS (continued) Payden Global Emerging Markets Corporate Bond Fund (continued) As at 30 June 2015 Holding Name of securities Fair value USD % of net assets 270,000 370,000 270,000 China Bank of China Ltd 5.000% 13-Nov-2024 China Construction Bank Corp floating rate 13-May-2025 Industrial & Commercial Bank of China Ltd/New York 3.231% 13-Nov-2019 920,902 277,468 368,120 275,314 1.85 0.56 0.74 0.55 235,000 280,000 250,000 20,000 Colombia Colombia Government International Bond 4.375% 12-Jul-2021 Colombia Government International Bond 5.000% 15-Jun-2045 Ecopetrol SA 5.375% 26-Jun-2026 Ecopetrol SA 5.875% 18-Sep-2023 775,660 246,397 260,400 247,813 21,050 1.56 0.50 0.52 0.50 0.04 200,000 230,000 Costa Rica Banco de Costa Rica 5.250% 12-Aug-2018 Costa Rica Government International Bond 7.158% 12-Mar-2045 431,500 206,100 225,400 0.87 0.42 0.45 230,000 Curacao SUAM Finance BV 4.875% 17-Apr-2024 232,300 232,300 0.47 0.47 310,000 Dominican Republic Aeropuertos Dominicanos Siglo XXI SA 9.750% 13-Nov-2019 317,750 317,750 0.64 0.64 410,000 Georgia Bank of Georgia JSC 7.750% 05-Jul-2017 427,651 427,651 0.86 0.86 250,000 Ghana Republic of Ghana 7.875% 07-Aug-2023 226,925 226,925 0.46 0.46 270,000 Guernsey Credit Suisse Group Funding Guernsey Ltd 2.750% 26-Mar-2020 266,905 266,905 0.54 0.54 435,000 Hong Kong AIA Group Ltd 3.200% 11-Mar-2025 420,300 420,300 0.85 0.85 300,000 245,000 220,000 200,000 310,000 300,000 India Export-Import Bank of India 2.750% 01-Apr-2020 Export-Import Bank of India 4.000% 14-Jan-2023 ICICI Bank Ltd/Dubai 4.700% 21-Feb-2018 IDBI Bank Ltd/DIFC Dubai 4.125% 23-Apr-2020 Reliance Industries Ltd 4.875% 10-Feb-2045 State Bank of India/London 4.125% 01-Aug-2017 1,562,243 294,453 244,431 231,777 200,524 279,035 312,023 3.14 0.59 0.49 0.47 0.40 0.56 0.63 610,000 215,000 505,000 Indonesia Bank Rakyat Indonesia Persero Tbk PT 2.950% 28-Mar-2018 Pertamina Persero PT 6.000% 03-May-2042 Perusahaan Gas Negara Persero Tbk PT 5.125% 16-May-2024 1,323,464 613,782 200,531 509,151 2.66 1.24 0.40 1.02 560,000 470,000 Israel Israel Electric Corp Ltd 7.250% 15-Jan-2019 Israel Electric Corp Ltd floating rate 17-Jan-2018 1,106,550 634,200 472,350 2.23 1.28 0.95 210,000 280,000 Kazakhstan Halyk Savings Bank of Kazakhstan JSC 7.250% 03-May-2017 KazMunayGas National Co JSC 9.125% 02-Jul-2018 535,325 217,875 317,450 1.08 0.44 0.64 270,000 90,000 260,000 477,000 380,000 Luxembourg Actavis Funding SCS 3.000% 12-Mar-2020 Actavis Funding SCS 4.550% 15-Mar-2035 Altice SA 7.750% 15-May-2022 Atento Luxco 1 SA 7.375% 29-Jan-2020 Millicom International Cellular SA 4.750% 22-May-2020 1,458,381 271,287 85,842 252,200 481,770 367,282 2.94 0.55 0.17 0.51 0.97 0.74 39 . PAYDEN GLOBAL FUNDS PUBLIC LIMITED COMPANY SCHEDULE OF INVESTMENTS (continued) Payden Global Emerging Markets Corporate Bond Fund (continued) As at 30 June 2015 Holding Name of securities Fair value USD % of net assets 300,000 Malaysia Petronas Capital Ltd 4.500% 18-Mar-2045 291,438 291,438 0.59 0.59 420,000 Marshall Island Nakilat Inc 6.067% 31-Dec-2033 488,775 488,775 0.98 0.98 Mexico Alfa SAB de CV 5.250% 25-Mar-2024 BBVA Bancomer SA/Grand Cayman floating rate 17-May-2022 Cemex SAB de CV 9.500% 15-Jun-2018 Elementia SAB de CV 5.500% 15-Jan-2025 Fermaca Enterprises S de RL de CV 6.375% 30-Mar-2038 Gruma SAB de CV 4.875% 01-Dec-2024 Grupo Cementos de Chihuahua SAB de CV 8.125% 08-Feb-2020 JB y Co SA de CV 3.750% 13-May-2025 Mexichem SAB de CV 5.875% 17-Sep-2044 Mexico Generadora de Energia S de rl 5.500% 06-Dec-2032 Mexico Government International Bond 3.625% 15-Mar-2022 Petroleos Mexicanos 5.500% 21-Jan-2021 Red de Carreteras de Occidente SAPIB de CV 9.000% 10-Jun-2028 Unifin Financiera SAPI de CV SOFOM ENR 6.250% 22-Jul-2019 4,859,165 494,400 361,725 276,250 518,925 455,665 208,750 280,280 243,200 213,900 482,221 253,625 597,850 213,999 258,375 9.78 1.00 0.73 0.56 1.04 0.92 0.42 0.56 0.49 0.43 0.97 0.51 1.20 0.43 0.52 200,000 300,000 700,000 Morocco BMCE Bank 6.250% 27-Nov-2018 OCP SA 4.500% 22-Oct-2025 OCP SA 5.625% 25-Apr-2024 1,228,624 210,040 286,125 732,459 2.47 0.42 0.58 1.47 300,000 260,000 510,000 290,000 225,000 260,000 385,000 Netherlands Ajecorp BV 6.500% 14-May-2022 GTB Finance BV 6.000% 08-Nov-2018 Indosat Palapa Co BV 7.375% 29-Jul-2020 Listrindo Capital BV 6.950% 21-Feb-2019 Lukoil International Finance BV 6.125% 09-Nov-2020 VimpelCom Holdings BV 7.504% 01-Mar-2022 VTR Finance BV 6.875% 15-Jan-2024 2,182,519 220,500 248,560 529,763 303,775 230,096 255,450 394,375 4.39 0.44 0.50 1.07 0.61 0.46 0.52 0.79 232,875 0.47 230,000 Panama Avianca Holdings SA / Avianca Leasing LLC / Grupo Taca Holdings Ltd 8.375% 10-May-2020 232,875 0.47 455,000 275,000 Paraguay Banco Regional SAECA 8.125% 24-Jan-2019 Telefonica Celular del Paraguay SA 6.750% 13-Dec-2022 776,831 490,831 286,000 1.56 0.99 0.57 200,000 320,000 Peru Abengoa Transmision Sur SA 6.875% 30-Apr-2043 Scotiabank Peru SAA floating rate 13-Dec-2027 537,950 222,750 315,200 1.08 0.45 0.63 270,000 Philippines International Container Terminal Services Inc 7.375% 17-Mar-2020 308,281 308,281 0.62 0.62 250,000 Qatar Ras Laffan Liquefied Natural Gas Co Ltd III 5.838% 30-Sep-2027 285,528 285,528 0.58 0.58 220,000 Senegal Senegal Government International Bond 8.750% 13-May-2021 246,444 246,444 0.50 0.50 500,000 360,000 250,000 Singapore BOC Aviation Pte Ltd 4.375% 02-May-2023 Flextronics International Ltd 4.625% 15-Feb-2020 TBG Global Pte Ltd 4.625% 03-Apr-2018 1,128,397 508,947 369,450 250,000 2.27 1.03 0.74 0.50 480,000 350,000 250,000 510,000 446,731 200,000 260,000 250,000 230,000 492,062 250,000 550,000 3,400,000 260,000 40 . PAYDEN GLOBAL FUNDS PUBLIC LIMITED COMPANY SCHEDULE OF INVESTMENTS (continued) Payden Global Emerging Markets Corporate Bond Fund (continued) As at 30 June 2015 Holding Name of securities Fair value USD % of net assets 200,000 200,000 400,000 360,000 South Korea Korea Development Bank 3.000% 17-Mar-2019 Korea Gas Corp 2.875% 29-Jul-2018 Korea Hydro & Nuclear Power Co Ltd 2.875% 02-Oct-2018 SK Telecom Co Ltd 2.125% 01-May-2018 1,186,479 206,071 206,020 410,759 363,629 2.39 0.42 0.41 0.83 0.73 200,000 Spain Banco Bilbao Vizcaya Argentaria SA floating rate Perpetual 215,500 215,500 0.43 0.43 210,000 Sri Lanka National Savings Bank 8.875% 18-Sep-2018 228,123 228,123 0.46 0.46 420,000 690,000 Sweden Eileme 2 AB 11.625% 31-Jan-2020 PKO Finance AB 4.630% 26-Sep-2022 1,183,271 468,258 715,013 2.38 0.94 1.44 250,000 Switzerland UBS AG/Stamford CT 1.800% 26-Mar-2018 249,727 249,727 0.50 0.50 500,000 300,000 Thailand Bangkok Bank Pcl/Hong Kong 4.800% 18-Oct-2020 Thai Oil Pcl 3.625% 23-Jan-2023 840,499 544,257 296,242 1.69 1.09 0.60 400,000 570,000 300,000 210,000 Turkey Akbank TAS 4.000% 24-Jan-2020 Turkiye Garanti Bankasi AS 4.000% 13-Sep-2017 Turkiye Vakiflar Bankasi TAO 3.750% 15-Apr-2018 Turkiye Vakiflar Bankasi TAO 5.750% 24-Apr-2017 1,485,819 390,616 578,153 298,125 218,925 2.99 0.79 1.16 0.60 0.44 400,000 420,000 220,000 200,000 200,000 United Arab Emirates Abu Dhabi National Energy Co PJSC 5.875% 13-Dec-2021 DP World Ltd 3.250% 18-May-2020 DP World Ltd 6.850% 02-Jul-2037 First Gulf Bank PJSC 3.250% 14-Jan-2019 Ruwais Power Co PJSC 6.000% 31-Aug-2036 1,558,201 464,520 417,900 240,900 206,331 228,550 3.14 0.94 0.84 0.48 0.42 0.46 250,000 200,000 240,000 United Kingdom HSBC Holdings PLC floating rate Perpetual Petra Diamonds US Treasury PLC 8.250% 31-May-2020 Vedanta Resources PLC 9.500% 18-Jul-2018 712,025 250,625 204,000 257,400 1.43 0.50 0.41 0.52 251,253 205,000 250,000 745,000 290,000 400,000 220,000 270,000 200,000 270,000 250,000 250,000 225,000 United States American Airlines 2013-1 Class B Pass Through Trust 5.625% 15-Jan-2021 AT&T Inc 4.750% 15-May-2046 Baxalta Inc 4.000% 23-Jun-2025 Cemex Finance LLC 9.375% 12-Oct-2022 Citigroup Inc floating rate Perpetual First Cash Financial Services Inc 6.750% 01-Apr-2021 FS Investment Corp 4.250% 15-Jan-2020 Goldman Sachs Group Inc 2.600% 23-Apr-2020 JBS USA LLC / JBS USA Finance Inc 5.750% 15-Jun-2025 Morgan Stanley floating rate Perpetual Reynolds American Inc 4.450% 12-Jun-2025 Southern Copper Corp 5.875% 23-Apr-2045 Sprint Capital Corp 6.900% 01-May-2019 3,926,467 261,303 187,265 248,646 833,469 291,087 423,000 222,608 268,828 198,190 268,380 255,204 238,425 230,062 7.90 0.53 0.38 0.50 1.68 0.58 0.85 0.45 0.54 0.40 0.54 0.51 0.48 0.46 41 . PAYDEN GLOBAL FUNDS PUBLIC LIMITED COMPANY SCHEDULE OF INVESTMENTS (continued) Payden Global Emerging Markets Corporate Bond Fund (continued) As at 30 June 2015 Holding Name of securities Fair value USD % of net assets 235,000 Vietnam Vietnam Government International Bond 4.800% 19-Nov-2024 236,175 236,175 0.48 0.48 Total value of investment in securities (2014: 97.16%) Unrealised gain on forward foreign exchange contracts (Appendix) (2014: 0.04%) 48,971,675 98.56 95,209 0.19 Financial assets at fair value through profit or loss 49,066,884 98.75 Unrealised loss on forward foreign exchange contracts (Appendix) (2014: (0.61%)) (300) 0.00 Financial liabilities at fair value through profit or loss (300) 0.00 623,201 1.25 49,689,785 100.00 Net current assets Total net assets Appendix: forward foreign currency contracts Unrealised gain on forward foreign currency contracts Currency Purchase Counter Party Purchase Amount Payden Global Emerging Markets Corporate Bond Fund Barclays TRY 522,000 Barclays USD 197,596 Credit Suisse USD 227,138 Royal Bank of Scotland USD 99,809 Royal Bank of Scotland USD 147,888 HSBC Securities USD 123,481 Swiss Franc Class (Accumulating) Barclays CHF Currency Sale Sale Amount Maturity date Unrealised Gain/Loss USD USD TRY MXN ZAR ZAR COP (191,665) (522,000) (3,450,000) (1,200,000) (1,810,000) (320,000,000) 14-Aug-2015 14-Aug-2015 19-Aug-2015 26-Aug-2015 26-Aug-2015 23-Sep-2015 663 5,269 8,046 1,916 233 1,544 USD (8,841,268) 06-Jul-2015 77,538 95,209 Currency Sale Sale Amount Maturity date Unrealised Gain/Loss USD EUR (114,000) 16-Sep-2015 (300) 8,334,000 Unrealised loss on forward foreign currency contracts Currency Purchase Counter Party Purchase Amount Payden Global Emerging Markets Corporate Bond Fund Barclays USD 126,857 (300) Portfolio Analysis % of total assets Transferable securities and money market instruments admitted to an official stock exchange listing or traded on a regulated market OTC financial derivative instruments Analysis of total assets rather than net assets is required under the UCITS Notice 8.5 appendix A. 42 96.98 0.19 97.17 . PAYDEN GLOBAL FUNDS PUBLIC LIMITED COMPANY SCHEDULE OF INVESTMENTS (continued) Payden Global Government Bond Index Fund As at 30 June 2015 Holding Name of securities Fair value USD % of net assets Australia Australia Government Bond 2.750% 21-Apr-2024 Australia Government Bond 3.250% 21-Oct-2018 Australia Government Bond 6.000% 15-Feb-2017 2,081,167 910,557 598,161 572,449 1.62 0.71 0.47 0.44 440,000 227,000 300,000 135,000 Austria Austria Government Bond 3.500% 15-Sep-2021 Austria Government Bond 4.150% 15-Mar-2037 Austria Government Bond 4.650% 15-Jan-2018 Austria Government Bond 6.250% 15-Jul-2027 1,556,918 581,273 366,789 374,843 234,013 1.21 0.45 0.29 0.29 0.18 250,000 300,000 450,000 330,000 416,000 Belgium Belgium Government Bond 3.250% 28-Sep-2016 Belgium Government Bond 4.000% 28-Mar-2019 Belgium Government Bond 4.250% 28-Sep-2021 Belgium Government Bond 5.000% 28-Mar-2035 Belgium Government Bond 5.500% 28-Mar-2028 2,525,788 290,412 383,131 615,955 557,517 678,773 1.97 0.23 0.30 0.48 0.43 0.53 400,000 300,000 900,000 250,000 100,000 210,000 Canada Canadian Government Bond 1.250% 01-Feb-2016 Canadian Government Bond 2.250% 01-Jun-2025 Canadian Government Bond 3.750% 01-Jun-2019 Canadian Government Bond 4.000% 01-Jun-2041 Canadian Government Bond 5.000% 01-Jun-2037 Canadian Government Bond 5.750% 01-Jun-2033 2,022,606 321,675 252,733 807,870 265,381 117,655 257,292 1.58 0.25 0.20 0.63 0.21 0.09 0.20 750,000 1,950,000 700,000 Denmark Denmark Government Bond 1.750% 15-Nov-2025 Denmark Government Bond 4.000% 15-Nov-2019 Denmark Government Bond 4.500% 15-Nov-2039 626,480 120,490 341,501 164,489 0.49 0.09 0.27 0.13 Finland Finland Government Bond 2.000% 15-Apr-2024 487,011 487,011 0.38 0.38 1,200,000 750,000 700,000 400,000 1,008,000 490,000 275,000 1,214,290 1,050,000 995,000 350,000 900,000 France France Government Bond OAT 3.750% 25-Apr-2021 France Government Bond OAT 4.000% 25-Oct-2038 France Government Bond OAT 4.000% 25-Apr-2055 France Government Bond OAT 4.250% 25-Oct-2017 France Government Bond OAT 4.250% 25-Apr-2019 France Government Bond OAT 5.500% 25-Apr-2029 France Government Bond OAT 6.000% 25-Oct-2025 France Government Bond OAT 8.500% 25-Apr-2023 9,185,087 1,335,333 746,567 443,954 1,490,349 1,355,241 1,648,294 572,808 1,592,541 7.15 1.04 0.58 0.35 1.16 1.05 1.28 0.45 1.24 960,000 550,000 1,162,000 690,000 160,000 100,000 1,355,000 Germany Bundesrepublik Deutschland 3.250% 04-Jan-2020 Bundesrepublik Deutschland 3.500% 04-Jul-2019 Bundesrepublik Deutschland 4.250% 04-Jul-2018 Bundesrepublik Deutschland 4.250% 04-Jul-2039 Bundesrepublik Deutschland 4.750% 04-Jul-2034 Bundesrepublik Deutschland 5.625% 04-Jan-2028 Bundesrepublik Deutschland 6.250% 04-Jan-2024 7,252,326 1,224,614 699,800 1,467,292 1,191,242 277,377 171,481 2,220,520 5.65 0.95 0.55 1.14 0.93 0.22 0.13 1.73 921,563 257,481 664,082 0.72 0.20 0.52 10,222,758 1,965,928 822,439 1,225,620 7.96 1.53 0.64 0.95 200,000 514,304 1,700,000 650,000 980,000 Ireland Ireland Government Bond 3.400% 18-Mar-2024 Ireland Government Bond 4.400% 18-Jun-2019 Italy Italy Buoni Poliennali Del Tesoro 3.750% 01-Aug-2016 Italy Buoni Poliennali Del Tesoro 4.000% 01-Sep-2020 Italy Buoni Poliennali Del Tesoro 4.000% 01-Feb-2037 43 . PAYDEN GLOBAL FUNDS PUBLIC LIMITED COMPANY SCHEDULE OF INVESTMENTS (continued) Payden Global Government Bond Index Fund (continued) As at 30 June 2015 Holding 450,000 810,000 1,550,000 450,000 226,000 533,138 53,300,000 52,000,000 135,000,000 253,500,000 171,100,000 320,100,000 46,900,000 80,400,000 99,600,000 65,000,000 43,850,000 78,000,000 4,000,000 32,500,000 22,500,000 169,100,000 486,500,000 83,100,000 25,000,000 219,000,000 191,500,000 42,000,000 13,000,000 26,000,000 47,000,000 267,250,000 Name of securities Fair value USD Italy (continued) Italy Buoni Poliennali Del Tesoro 4.500% 01-Feb-2018 Italy Buoni Poliennali Del Tesoro 4.500% 01-Feb-2020 Italy Buoni Poliennali Del Tesoro 4.750% 01-Aug-2023 Italy Buoni Poliennali Del Tesoro 5.000% 01-Mar-2025 Italy Buoni Poliennali Del Tesoro 5.250% 01-Nov-2029 Italy Buoni Poliennali Del Tesoro 6.500% 01-Nov-2027 Japan Japan Government Forty Year Bond 2.200% 20-Mar-2049 Japan Government Forty Year Bond 2.400% 20-Mar-2048 Japan Government Ten Year Bond 1.300% 20-Dec-2018 Japan Government Ten Year Bond 1.500% 20-Jun-2019 Japan Government Ten Year Bond 1.700% 20-Dec-2016 Japan Government Ten Year Bond 1.700% 20-Sep-2017 Japan Government Ten Year Bond 1.700% 20-Jun-2018 Japan Government Thirty Year Bond 1.700% 20-Jun-2033 Japan Government Thirty Year Bond 2.200% 20-Sep-2039 Japan Government Thirty Year Bond 2.300% 20-Dec-2036 Japan Government Thirty Year Bond 2.300% 20-Mar-2040 Japan Government Thirty Year Bond 2.400% 20-Mar-2037 Japan Government Thirty Year Bond 2.400% 20-Sep-2038 Japan Government Thirty Year Bond 2.500% 20-Sep-2035 Japan Government Thirty Year Bond 2.500% 20-Mar-2036 Japan Government Thirty Year Bond 2.500% 20-Mar-2038 Japan Government Twenty Year Bond 1.000% 20-Mar-2023 Japan Government Twenty Year Bond 1.900% 20-Dec-2028 Japan Government Twenty Year Bond 2.000% 20-Dec-2030 Japan Government Twenty Year Bond 2.100% 20-Sep-2024 Japan Government Twenty Year Bond 2.100% 20-Dec-2027 Japan Government Twenty Year Bond 2.100% 20-Sep-2028 Japan Government Twenty Year Bond 2.100% 20-Jun-2029 Japan Government Twenty Year Bond 2.100% 20-Dec-2030 Japan Government Twenty Year Bond 2.300% 20-Mar-2026 Japan Government Twenty Year Bond 2.500% 20-Mar-2020 % of net assets 551,506 1,039,287 2,071,934 614,637 323,415 827,884 0.43 0.81 1.61 0.48 0.25 0.65 27,534,858 515,503 524,559 1,151,703 2,190,268 1,433,302 2,714,107 402,474 726,553 957,335 632,592 429,292 771,404 39,686 326,235 225,778 1,703,378 4,194,416 784,151 238,112 2,065,251 1,841,012 404,959 125,399 250,838 456,250 2,430,301 21.44 0.40 0.41 0.90 1.71 1.12 2.11 0.31 0.57 0.75 0.49 0.33 0.60 0.03 0.25 0.18 1.33 3.27 0.61 0.19 1.61 1.43 0.31 0.10 0.19 0.35 1.89 1,000,000 Malaysia Malaysia Government Bond 3.955% 15-Sep-2025 263,610 263,610 0.21 0.21 8,000,000 2,800,000 Mexico Mexican Bonos 6.500% 09-Jun-2022 Mexican Bonos 10.000% 20-Nov-2036 774,056 529,480 244,576 0.60 0.41 0.19 2,531,805 610,561 777,580 524,734 618,930 1.97 0.47 0.61 0.41 0.48 500,000 600,000 325,000 506,900 Netherlands Netherlands Government Bond 2.000% 15-Jul-2024 Netherlands Government Bond 3.500% 15-Jul-2020 Netherlands Government Bond 4.000% 15-Jan-2037 Netherlands Government Bond 4.500% 15-Jul-2017 1,000,000 Norway Norway Government Bond 2.000% 24-May-2023 130,576 130,576 0.10 0.10 1,000,000 Poland Poland Government Bond 3.250% 25-Jul-2025 264,474 264,474 0.21 0.21 Singapore Singapore Government Bond 2.750% 01-Jul-2023 377,460 377,460 0.29 0.29 South Africa South Africa Government Bond 6.250% 31-Mar-2036 350,477 155,466 0.27 0.12 500,000 2,500,000 44 . PAYDEN GLOBAL FUNDS PUBLIC LIMITED COMPANY SCHEDULE OF INVESTMENTS (continued) Payden Global Government Bond Index Fund (continued) As at 30 June 2015 Holding 2,500,000 525,000 730,000 310,000 930,000 955,000 100,000 282,942 900,000 2,400,000 320,000 1,270,000 220,000 225,000 70,000 330,000 200,000 597,000 241,000 430,000 696,000 390,000 11,850,000 2,100,000 1,400,000 800,000 2,835,000 5,300,000 1,150,000 1,150,000 2,400,000 200,000 109,000 2,400,000 100,000 150,000 280,000 550,000 300,000 800,000 1,474,400 2,386,600 Name of securities Fair value USD % of net assets 195,011 0.15 5,101,692 645,831 982,499 444,252 1,145,013 1,300,607 153,454 430,036 3.97 0.50 0.77 0.35 0.89 1.01 0.12 0.33 Sweden Sweden Government Bond 2.500% 12-May-2025 Sweden Government Bond 5.000% 01-Dec-2020 484,823 123,846 360,977 0.38 0.10 0.28 Switzerland Switzerland Government Bond 3.000% 12-May-2019 392,158 392,158 0.31 0.31 8,772,613 1,988,940 380,835 393,949 138,459 690,829 443,250 1,269,114 491,855 923,164 1,216,647 835,571 6.83 1.55 0.29 0.31 0.11 0.54 0.34 0.99 0.38 0.72 0.95 0.65 United States United States Treasury Note/Bond 0.875% 15-Aug-2017 United States Treasury Note/Bond 0.875% 15-Oct-2017 United States Treasury Note/Bond 2.125% 30-Jun-2021 United States Treasury Note/Bond 2.250% 31-Jul-2018 United States Treasury Note/Bond 2.375% 31-Mar-2016 United States Treasury Note/Bond 2.500% 15-Aug-2023 United States Treasury Note/Bond 2.625% 15-Nov-2020 United States Treasury Note/Bond 3.125% 15-May-2019 United States Treasury Note/Bond 3.500% 15-May-2020 United States Treasury Note/Bond 3.625% 15-Aug-2019 United States Treasury Note/Bond 3.750% 15-Nov-2018 United States Treasury Note/Bond 3.750% 15-Nov-2043 United States Treasury Note/Bond 3.875% 15-May-2018 United States Treasury Note/Bond 4.250% 15-May-2039 United States Treasury Note/Bond 4.250% 15-Nov-2040 United States Treasury Note/Bond 4.375% 15-May-2040 United States Treasury Note/Bond 4.625% 15-Feb-2040 United States Treasury Note/Bond 4.750% 15-Feb-2041 United States Treasury Note/Bond 8.000% 15-Nov-2021 United States Treasury Note/Bond 8.125% 15-Aug-2021 40,608,418 11,893,513 2,104,923 1,417,500 829,313 2,880,405 5,414,697 1,201,211 1,227,266 2,610,375 217,735 118,401 2,700,000 108,281 181,055 338,887 677,316 382,617 1,042,187 2,012,671 3,250,065 31.63 9.26 1.64 1.10 0.65 2.24 4.22 0.94 0.96 2.03 0.17 0.09 2.10 0.09 0.14 0.26 0.53 0.30 0.81 1.57 2.53 Total value of investment in securities (2014: 100.57%) 124,468,724 96.94 1,731,890 1.35 126,200,614 98.29 South Africa (continued) South Africa Government Bond 6.750% 31-Mar-2021 Spain Spain Government Bond 4.100% 30-Jul-2018 Spain Government Bond 4.650% 30-Jul-2025 Spain Government Bond 4.900% 30-Jul-2040 Spain Government Bond 5.500% 30-Jul-2017 Spain Government Bond 5.500% 30-Apr-2021 Spain Government Bond 5.750% 30-Jul-2032 Spain Government Bond 6.000% 31-Jan-2029 United Kingdom United Kingdom Gilt 1.750% 07-Sep-2022 United Kingdom Gilt 3.750% 07-Sep-2019 United Kingdom Gilt 3.750% 07-Sep-2020 United Kingdom Gilt 4.250% 07-Mar-2036 United Kingdom Gilt 4.250% 07-Dec-2046 United Kingdom Gilt 4.250% 07-Dec-2055 United Kingdom Gilt 4.500% 07-Dec-2042 United Kingdom Gilt 4.750% 07-Dec-2030 United Kingdom Gilt 4.750% 07-Dec-2038 United Kingdom Gilt 5.000% 07-Mar-2018 United Kingdom Gilt 8.000% 07-Jun-2021 Unrealised gain on forward foreign exchange contracts (Appendix) (2014: 1.56%) Financial assets at fair value through profit or loss 45 . PAYDEN GLOBAL FUNDS PUBLIC LIMITED COMPANY SCHEDULE OF INVESTMENTS (continued) Payden Global Government Bond Index Fund (continued) As at 30 June 2015 Fair value USD % of net assets Unrealised loss on forward foreign exchange contracts (Appendix) (2014: (3.02%)) (1,534,164) (1.20) Financial liabilities at fair value through profit or loss (1,534,164) (1.20) 3,731,071 2.91 128,397,521 100.00 Net current assets Total net assets Appendix: forward foreign currency contracts Unrealised gain on forward foreign currency contracts Currency Purchase Counter Party Purchase Amount Payden Global Government Bond Index Fund Barclays JPY 62,000,000 Citibank MYR 1,049,000 HSBC Securities USD 816,208 Citibank USD 286,714 HSBC Securities USD 136,963 HSBC Securities USD 280,915 Currency Sale Sale Amount Maturity date Unrealised Gain/Loss USD USD USD MXN MYR NOK PLN (498,204) (277,220) (12,620,000) (1,049,000) (1,069,000) (1,056,000) 06-Jul-2015 06-Jul-2015 06-Jul-2015 06-Jul-2015 06-Jul-2015 06-Jul-2015 8,500 722 12,134 8,772 1,100 156 Singapore Dollar Class (Distributing) HSBC Securities SGD 4,632,000 USD (3,431,594) 06-Jul-2015 8,203 Sterling Class (Accumulating) HSBC Securities GBP 1,578,000 USD (2,407,405) 06-Jul-2015 74,246 Sterling Class (Distributing) HSBC Securities GBP 22,303,000 USD (34,025,568) 06-Jul-2015 1,049,377 Swiss Franc Class (Accumulating) Barclays CHF 61,123,000 USD (64,843,389) 06-Jul-2015 568,680 1,731,890 Currency Sale Sale Amount Maturity date Unrealised Gain/Loss USD AUD AUD CAD CHF DKK EUR EUR EUR GBP GBP JPY SEK SGD MYR ZAR (150,000) (2,643,000) (2,567,000) (375,000) (4,404,000) (200,000) (16,692,000) (20,410,000) (660,000) (5,107,000) (3,450,200,000) (4,311,000) (522,000) (1,041,000) (5,868,000) 06-Jul-2015 06-Jul-2015 06-Jul-2015 06-Jul-2015 06-Jul-2015 06-Jul-2015 06-Jul-2015 06-Jul-2015 06-Jul-2015 06-Jul-2015 06-Jul-2015 06-Jul-2015 06-Jul-2015 05-Aug-2015 06-Jul-2015 (1,242) (11,425) (624) (3,331) (10,054) (4,811) (291,226) (354,869) (34,370) (240,289) (378,202) (14,716) (924) (741) (3,538) Unrealised loss on forward foreign currency contracts Currency Purchase Counter Party Purchase Amount Payden Global Government Bond Index Fund HSBC Securities USD 114,021 HSBC Securities USD 2,019,516 HSBC Securities USD 2,055,409 HSBC Securities USD 397,984 HSBC Securities USD 647,790 Royal Bank of Canada USD 218,040 UBS USD 18,307,953 Royal Bank of Canada USD 22,387,117 HSBC Securities USD 1,003,583 HSBC Securities USD 7,791,265 Barclays USD 27,819,034 HSBC Securities USD 504,875 HSBC Securities USD 386,721 Citibank USD 274,388 HSBC Securities USD 479,578 46 . PAYDEN GLOBAL FUNDS PUBLIC LIMITED COMPANY SCHEDULE OF INVESTMENTS (continued) Payden Global Government Bond Index Fund (continued) As at 30 June 2015 Appendix: forward foreign currency contracts (continued) Unrealised loss on forward foreign currency contracts (continued) Currency Purchase Counter Party Purchase Amount Payden Global Government Bond Index Fund (continued) Norwegian Krone Class (Accumulating) Barclays NOK 186,161,000 Currency Sale USD Sale Amount Maturity date (23,843,715) 06-Jul-2015 Portfolio Analysis Unrealised Gain/Loss USD (183,802) (1,534,164) % of total assets Transferable securities and money market instruments admitted to an official stock exchange listing or traded on a regulated market OTC financial derivative instruments Analysis as a percentage of total assets rather than net assets is required under the UCITS Notice 8.5 appendix A 47 95.63 0.15 95.78 . PAYDEN GLOBAL FUNDS PUBLIC LIMITED COMPANY SCHEDULE OF INVESTMENTS (continued) Payden Global High Yield Bond Fund As at 30 June 2015 Holding Name of securities Fair value USD % of net assets 380,000 540,000 710,000 365,000 350,000 400,000 330,000 140,000 300,000 500,000 305,000 600,000 Basic Materials A Schulman Inc 6.875% 01-Jun-2023 Alcoa Inc 5.870% 23-Feb-2022 ArcelorMittal 7.000% 25-Feb-2022 Commercial Metals Co 4.875% 15-May-2023 Evraz Inc NA Canada 7.500% 15-Nov-2019 First Quantum Minerals Ltd 6.750% 15-Feb-2020 Hexion Inc 8.875% 01-Feb-2018 Huntsman International LLC 8.625% 15-Mar-2021 INEOS Group Holdings SA 6.125% 15-Aug-2018 Steel Dynamics Inc 5.250% 15-Apr-2023 United States Steel Corp 7.375% 01-Apr-2020 Univar Inc 6.750% 15-Jul-2023 5,002,864 389,500 583,200 768,575 344,925 346,500 389,000 299,475 147,689 307,500 498,750 320,250 607,500 6.54 0.51 0.76 1.01 0.45 0.45 0.51 0.39 0.19 0.40 0.65 0.42 0.80 Communications Altice Financing SA 6.625% 15-Feb-2023 Altice SA 7.750% 15-May-2022 Cablevision Systems Corp 5.875% 15-Sep-2022 CCO Holdings LLC / CCO Holdings Capital Corp 5.125% 15-Feb-2023 CCO Holdings LLC / CCO Holdings Capital Corp 5.750% 15-Jan-2024 CCO Holdings LLC / CCO Holdings Capital Corp 6.500% 30-Apr-2021 CenturyLink Inc 5.800% 15-Mar-2022 CenturyLink Inc 6.450% 15-Jun-2021 Cogent Communications Group Inc 5.375% 01-Mar-2022 Cogent Communications Group Inc 144A 5.375% 01-Mar-2022 CommScope Technologies Finance LLC 6.000% 15-Jun-2025 Consolidated Communications Inc 6.500% 01-Oct-2022 CyrusOne LP / CyrusOne Finance Corp 6.375% 15-Nov-2022 DISH DBS Corp 5.125% 01-May-2020 DISH DBS Corp 5.875% 15-Jul-2022 DISH DBS Corp 6.750% 01-Jun-2021 Frontier Communications Corp 6.250% 15-Sep-2021 IAC/InterActiveCorp 4.750% 15-Dec-2022 Intelsat Jackson Holdings SA 7.250% 15-Oct-2020 Level 3 Financing Inc 5.375% 15-Aug-2022 Liberty Interactive LLC 8.500% 15-Jul-2029 Numericable-SFR SAS 6.000% 15-May-2022 Numericable-SFR SAS 6.250% 15-May-2024 Sinclair Television Group Inc 6.375% 01-Nov-2021 Sprint Capital Corp 6.900% 01-May-2019 Sprint Communications Inc 6.000% 15-Nov-2022 Starz LLC / Starz Finance Corp 5.000% 15-Sep-2019 Telecom Italia SpA 5.303% 30-May-2024 T-Mobile USA Inc 6.250% 01-Apr-2021 T-Mobile USA Inc 6.633% 28-Apr-2021 Virgin Media Finance PLC 6.375% 15-Apr-2023 Windstream Services LLC 6.375% 01-Aug-2023 Windstream Services LLC 7.500% 01-Jun-2022 13,616,906 248,825 291,000 564,050 195,500 382,850 314,437 642,362 354,375 198,250 198,250 449,437 435,937 383,875 405,500 343,875 522,500 411,750 295,125 421,812 608,250 325,500 424,894 226,838 337,188 388,550 916,250 355,250 350,000 873,375 416,000 440,938 130,800 763,363 17.81 0.32 0.38 0.74 0.26 0.50 0.41 0.84 0.46 0.26 0.26 0.59 0.57 0.50 0.53 0.45 0.68 0.54 0.39 0.55 0.79 0.43 0.56 0.30 0.44 0.51 1.20 0.46 0.46 1.14 0.54 0.58 0.17 1.00 Consumer, Cyclical 1011778 BC ULC / New Red Finance Inc 6.000% 01-Apr-2022 Air Canada 7.750% 15-Apr-2021 American Airlines 2013-1 Class B Pass Through Trust 5.625% 15-Jan-2021 American Axle & Manufacturing Inc 6.250% 15-Mar-2021 Brookfield Residential Properties Inc 6.375% 15-May-2025 Carrols Restaurant Group Inc 8.000% 01-May-2022 Dana Holding Corp 5.375% 15-Sep-2021 DR Horton Inc 4.375% 15-Sep-2022 Family Tree Escrow LLC 5.750% 01-Mar-2023 First Cash Financial Services Inc 6.750% 01-Apr-2021 Goodyear Tire & Rubber Co 6.500% 01-Mar-2021 11,381,566 515,000 428,000 403,832 369,250 295,500 474,750 462,937 380,250 472,500 634,500 191,250 14.89 0.67 0.56 0.53 0.48 0.39 0.62 0.61 0.50 0.62 0.83 0.25 250,000 300,000 580,000 200,000 380,000 300,000 670,000 350,000 200,000 200,000 450,000 450,000 370,000 400,000 350,000 500,000 450,000 300,000 425,000 600,000 300,000 430,000 230,000 325,000 380,000 1,000,000 350,000 350,000 850,000 400,000 425,000 160,000 865,000 500,000 400,000 388,300 350,000 300,000 450,000 450,000 390,000 450,000 600,000 180,000 48 . PAYDEN GLOBAL FUNDS PUBLIC LIMITED COMPANY SCHEDULE OF INVESTMENTS (continued) Payden Global High Yield Bond Fund (continued) As at 30 June 2015 Holding Name of securities Fair value USD 610,000 500,000 Consumer, Cyclical (continued) Goodyear Tire & Rubber Co 8.250% 15-Aug-2020 Hilton Worldwide Finance LLC / Hilton Worldwide Finance Corp 5.625% 15-Oct-2021 Landry's Inc 9.375% 01-May-2020 Lear Corp 4.750% 15-Jan-2023 Lennar Corp 4.500% 15-Nov-2019 MGM Resorts International 5.250% 31-Mar-2020 Mobile Mini Inc 7.875% 01-Dec-2020 Neiman Marcus Group Ltd LLC 8.750% 15-Oct-2021 Regal Entertainment Group 5.750% 15-Mar-2022 Rite Aid Corp 6.125% 01-Apr-2023 Royal Caribbean Cruises Ltd 5.250% 15-Nov-2022 Schaeffler Finance BV 4.250% 15-May-2021 Sonic Automotive Inc 5.000% 15-May-2023 Suburban Propane Partners LP / Suburban Energy Finance Corp 7.375% 01-Aug-2021 Taylor Morrison Communities Inc / Monarch Communities Inc 5.625% 01-Mar-2024 ZF North America Capital Inc 4.000% 29-Apr-2020 380,000 750,000 270,000 295,000 400,000 400,000 255,000 500,000 185,000 430,000 475,000 500,000 380,000 500,000 900,000 300,000 350,000 350,000 660,000 530,000 400,000 150,000 330,000 365,000 350,000 430,000 500,000 400,000 700,000 400,000 350,000 500,000 500,000 300,000 370,000 500,000 170,000 Consumer, Non-cyclical ACCO Brands Corp 6.750% 30-Apr-2020 Amsurg Corp 5.625% 15-Jul-2022 Atento Luxco 1 SA 7.375% 29-Jan-2020 Avis Budget Car Rental LLC / Avis Budget Finance Inc 5.500% 01-Apr-2023 B&G Foods Inc 4.625% 01-Jun-2021 C&S Group Enterprises LLC 5.375% 15-Jul-2022 Central Garden & Pet Co 8.250% 01-Mar-2018 CHS/Community Health Systems Inc 7.125% 15-Jul-2020 CHS/Community Health Systems Inc 8.000% 15-Nov-2019 Concordia Healthcare Corp 7.000% 15-Apr-2023 Crimson Merger Sub Inc 6.625% 15-May-2022 Darling Ingredients Inc 5.375% 15-Jan-2022 DaVita HealthCare Partners Inc 5.750% 15-Aug-2022 Dean Foods Co 6.500% 15-Mar-2023 Dole Food Co Inc 7.250% 01-May-2019 Endo Finance LLC / Endo Finco Inc 7.000% 15-Dec-2020 Endo Finance LLC / Endo Finco Inc 7.250% 15-Jan-2022 Great Lakes Dredge & Dock Corp 7.375% 01-Feb-2019 HCA Inc 5.875% 01-May-2023 HCA Inc 7.500% 15-Feb-2022 HealthSouth Corp 5.750% 01-Nov-2024 Hertz Corp 6.250% 15-Oct-2022 Hertz Corp 6.750% 15-Apr-2019 HJ Heinz Co 4.250% 15-Oct-2020 Ingles Markets Inc 5.750% 15-Jun-2023 JBS USA LLC / JBS USA Finance Inc 5.750% 15-Jun-2025 Kindred Healthcare Inc 6.375% 15-Apr-2022 Post Holdings Inc 6.000% 15-Dec-2022 Quintiles Transnational Corp 4.875% 15-May-2023 Tenet Healthcare Corp 5.000% 01-Mar-2019 Tenet Healthcare Corp 8.000% 01-Aug-2020 Tenet Healthcare Corp 6.750% 15-Jun-2023 United Rentals North America Inc 7.625% 15-Apr-2022 Valeant Pharmaceuticals International 6.375% 15-Oct-2020 Valeant Pharmaceuticals International 7.000% 01-Oct-2020 Valeant Pharmaceuticals International Inc 5.875% 15-May-2023 Valeant Pharmaceuticals International Inc 7.500% 15-Jul-2021 150,000 400,000 450,000 390,000 400,000 475,000 480,000 450,000 450,000 450,000 250,000 400,000 625,000 140,000 49 % of net assets 157,387 0.21 417,480 484,875 386,100 407,000 480,937 505,200 485,437 456,728 465,188 259,827 392,000 614,063 0.55 0.63 0.50 0.53 0.63 0.66 0.63 0.60 0.61 0.34 0.51 0.80 150,150 0.20 590,175 501,250 0.77 0.66 15,900,267 400,900 759,375 272,700 292,419 395,500 378,000 261,757 531,000 195,406 431,075 418,000 501,875 404,225 511,250 911,250 316,125 373,188 358,750 702,900 610,162 410,000 153,000 341,352 372,756 357,455 426,109 501,250 386,500 705,250 401,500 365,312 510,625 543,750 316,688 385,725 513,750 183,388 20.80 0.52 0.99 0.36 0.38 0.52 0.49 0.34 0.69 0.26 0.56 0.55 0.66 0.53 0.67 1.19 0.41 0.49 0.47 0.92 0.80 0.54 0.20 0.45 0.49 0.47 0.56 0.66 0.51 0.92 0.52 0.48 0.67 0.71 0.41 0.50 0.67 0.24 . PAYDEN GLOBAL FUNDS PUBLIC LIMITED COMPANY SCHEDULE OF INVESTMENTS (continued) Payden Global High Yield Bond Fund (continued) As at 30 June 2015 Holding Name of securities 450,000 450,000 Diversified Argos Merger Sub Inc 7.125% 15-Mar-2023 Horizon Pharma Financing Inc 6.625% 01-May-2023 500,000 370,000 325,000 500,000 570,000 350,000 400,000 350,000 230,000 300,000 325,000 300,000 500,000 450,000 200,000 350,000 250,000 125,000 500,000 550,000 370,000 275,000 375,000 325,000 500,000 200,000 400,000 600,000 455,000 380,000 300,000 300,000 500,000 450,000 600,000 500,000 525,000 475,000 400,000 480,000 370,000 200,000 400,000 500,000 410,000 350,000 650,000 441,176 460,000 Fair value USD % of net assets 943,312 472,500 470,812 1.23 0.62 0.61 Energy Antero Resources Corp 6.000% 01-Dec-2020 Berry Petroleum Co LLC 6.375% 15-Sep-2022 BreitBurn Energy Partners LP / BreitBurn Finance Corp 8.625% 15-Oct-2020 California Resources Corp 5.000% 15-Jan-2020 Chesapeake Energy Corp 5.375% 15-Jun-2021 CONSOL Energy Inc 5.875% 15-Apr-2022 CVR Refining LLC / Coffeyville Finance Inc 6.500% 01-Nov-2022 Denbury Resources Inc 4.625% 15-Jul-2023 EP Energy LLC / Everest Acquisition Finance Inc 7.750% 01-Sep-2022 EP Energy LLC / Everest Acquisition Finance Inc 9.375% 01-May-2020 Laredo Petroleum Inc 7.375% 01-May-2022 Linn Energy LLC / Linn Energy Finance Corp 8.625% 15-Apr-2020 MarkWest Energy Partners LP / MarkWest Energy Finance Corp 4.500% 15-Jul-2023 MEG Energy Corp 7.000% 31-Mar-2024 Newfield Exploration Co 5.625% 01-Jul-2024 Peabody Energy Corp 6.500% 15-Sep-2020 Sabine Pass Liquefaction LLC 5.750% 15-May-2024 Sabine Pass LNG LP 6.500% 01-Nov-2020 SM Energy Co 6.500% 01-Jan-2023 Sunoco LP / Sunoco Finance Corp 6.375% 01-Apr-2023 Tesoro Corp 5.375% 01-Oct-2022 Vanguard Natural Resources LLC / VNR Finance Corp 7.875% 01-Apr-2020 Whiting Petroleum Corp 5.000% 15-Mar-2019 WPX Energy Inc 6.000% 15-Jan-2022 8,250,623 505,000 290,450 287,625 442,500 518,700 299,250 402,000 295,750 242,650 322,110 343,687 247,563 10.79 0.66 0.38 0.38 0.58 0.68 0.39 0.53 0.39 0.32 0.42 0.45 0.32 492,500 433,688 203,000 120,750 250,312 130,000 515,000 574,750 377,400 264,000 369,375 322,563 0.64 0.57 0.27 0.16 0.33 0.17 0.67 0.75 0.49 0.34 0.48 0.42 Financial AerCap Aviation Solutions BV 6.375% 30-May-2017 AerCap Ireland Capital Ltd / AerCap Global Aviation Trust 5.000% 01-Oct-2021 Aircastle Ltd 5.125% 15-Mar-2021 Ally Financial Inc 4.125% 13-Feb-2022 Ally Financial Inc 4.750% 10-Sep-2018 CIT Group Inc 5.000% 15-Aug-2022 CIT Group Inc 5.250% 15-Mar-2018 Citigroup Inc floating rate Perpetual Communications Sales & Leasing Inc 6.000% 15-Apr-2023 Credit Acceptance Corp 7.375% 15-Mar-2023 CTR Partnership LP / CareTrust Capital Corp 5.875% 01-Jun-2021 E*TRADE Financial Corp 5.375% 15-Nov-2022 GEO Group Inc 6.625% 15-Feb-2021 HSBC Holdings PLC floating rate Perpetual Icahn Enterprises LP / Icahn Enterprises Finance Corp 6.000% 01-Aug-2020 International Lease Finance Corp 3.875% 15-Apr-2018 International Lease Finance Corp 5.875% 15-Aug-2022 Iron Mountain Inc 5.750% 15-Aug-2024 Morgan Stanley floating rate Perpetual Pershing Square Holdings Ltd 5.500% 15-Jul-2022 Royal Bank of Scotland Group PLC 6.100% 10-Jun-2023 Royal Bank of Scotland Group PLC floating rate Perpetual 9,495,460 530,625 12.42 0.70 206,250 405,000 577,500 470,356 377,150 310,875 295,875 490,255 465,750 613,500 513,750 551,250 476,187 414,500 483,600 400,525 200,875 397,500 501,798 436,614 375,725 0.27 0.53 0.76 0.62 0.49 0.41 0.39 0.64 0.61 0.80 0.67 0.72 0.62 0.54 0.63 0.52 0.26 0.52 0.66 0.57 0.49 Industrial AECOM 5.750% 15-Oct-2022 Ardagh Packaging Finance PLC / Ardagh Holdings USA Inc 7.000% 15-Nov-2020 Ardagh Packaging Finance PLC / Ardagh Holdings USA Inc floating rate 15-Dec-2019 5,366,456 659,750 7.02 0.86 452,206 0.59 449,075 0.59 50 . PAYDEN GLOBAL FUNDS PUBLIC LIMITED COMPANY SCHEDULE OF INVESTMENTS (continued) Payden Global High Yield Bond Fund (continued) As at 30 June 2015 Holding Name of securities Fair value USD 340,000 484,000 500,000 400,000 Utilities AmeriGas Partners LP / AmeriGas Finance Corp 6.500% 20-May-2021 Calpine Corp 7.875% 15-Jan-2023 NRG Energy Inc 6.625% 15-Mar-2023 Talen Energy Supply LLC 5.125% 15-Jul-2019 Total value of investment in securities (2014: 96.38%) 0.69 0.50 628,500 0.82 104,250 271,375 336,800 394,000 0.14 0.35 0.44 0.52 1.29 0.36 0.93 2.34 0.46 0.69 0.68 0.51 95.13 Notional (USD) Broker 6,359 0.01 1,381,531 UBS 6,359 0.01 724,287 0.95 73,469,479 96.09 Unrealised loss on forward foreign exchange contracts (Appendix) (2014: (1.05%)) (105,680) (0.14) Financial liabilities at fair value through profit or loss (105,680) (0.14) Net current assets 11 Futures contracts (2014: 0.00%) US Treasury Note 10 Year (CBT) Future Exp 21-Sep-2015 523,750 382,500 72,738,833 Technology First Data Corp 6.750% 01-Nov-2020 Infor US Inc 6.500% 15-May-2022 600,000 0.58 0.29 0.65 1,791,940 355,300 525,140 517,500 394,000 260,000 700,000 500,000 360,000 439,875 223,750 500,625 989,439 275,439 714,000 100,000 260,000 320,000 400,000 Industrial (continued) Berry Plastics Corp 5.125% 15-Jul-2023 Bombardier Inc 5.750% 15-Mar-2022 CNH Industrial Capital LLC 3.250% 01-Feb-2017 Crown Americas LLC / Crown Americas Capital Corp III 6.250% 01-Feb-2021 Novelis Inc 8.750% 15-Dec-2020 Reynolds Group Issuer Inc / Reynolds Group Issuer LLC / Reynolds Group Issuer Lu 6.875% 15-Feb-2021 Reynolds Group Issuer Inc / Reynolds Group Issuer LLC / Reynolds Group Issuer Lu 8.250% 15-Feb-2021 SBA Communications Corp 5.625% 01-Oct-2019 Spirit AeroSystems Inc 6.750% 15-Dec-2020 Triumph Group Inc 4.875% 01-Apr-2021 450,000 250,000 500,000 % of net assets 3,096,005 4.05 76,459,804 100.00 Unrealised gain on forward foreign exchange contracts (Appendix) (2014: 0.34%) Financial assets at fair value through profit or loss Total net assets Appendix: forward foreign currency contracts Unrealised gain on forward foreign currency contracts Currency Counter Party Purchase Payden Global High Yield Bond Fund Royal Bank of Scotland EUR Royal Bank of Scotland USD Royal Bank of Scotland GBP Credit Suisse USD Credit Suisse JPY Credit Suisse USD UBS USD Barclays INR Barclays USD Purchase Amount Currency Sale Sale Amount Maturity date Unrealised Gain/Loss USD 831,000 942,878 598,000 885,280 105,300,000 874,912 935,072 60,030,000 466,553 USD EUR USD AUD USD JPY EUR USD SGD (888,828) (831,000) (911,687) (1,142,000) (847,413) (105,300,000) (832,000) (917,750) (624,000) 17-Jul-2015 17-Jul-2015 17-Jul-2015 31-Jul-2015 31-Jul-2015 31-Jul-2015 17-Aug-2015 17-Aug-2015 20-Aug-2015 37,257 16,792 28,689 9,056 13,436 14,062 7,462 16,150 3,482 51 . PAYDEN GLOBAL FUNDS PUBLIC LIMITED COMPANY SCHEDULE OF INVESTMENTS (continued) Payden Global High Yield Bond Fund (continued) As at 30 June 2015 Appendix: forward foreign currency contracts (continued) Unrealised gain on forward foreign currency contracts (continued) Currency Purchase Counter Party Purchase Amount Payden Global High Yield Bond Fund (continued) Royal Bank of Canada USD 887,569 Currency Sale Sale Amount Maturity date Unrealised Gain/Loss USD CAD (1,106,000) 14-Sep-2015 2,565 Canadian Dollar Class (Accumulating) Barclays CAD 33,849,000 USD (27,106,914) 06-Jul-2015 4,364 Sterling Class (Accumulating) HSBC Securities GBP 10,297,000 USD (15,709,155) 06-Jul-2015 484,483 9,296,000 USD (9,861,822) 06-Jul-2015 86,489 724,287 Purchase Amount Currency Sale Sale Amount Maturity date Unrealised Gain/Loss USD 886,992 157,000 887,504 169,000 163,000 177,129 20,880,000 179,000 GBP USD EUR USD USD INR USD USD (598,000) (179,096) (826,000) (131,941) (185,999) (11,400,000) (466,801) (146,562) 17-Jul-2015 23-Jul-2015 23-Jul-2015 31-Jul-2015 17-Aug-2015 17-Aug-2015 20-Aug-2015 14-Sep-2015 (53,383) (4,117) (33,087) (2,273) (4,268) (224) (5,000) (3,328) Swiss Franc Class (Accumulating) Barclays CHF Unrealised loss on forward foreign currency contracts Currency Counter Party Purchase Payden Global High Yield Bond Fund Royal Bank of Scotland USD HSBC Securities EUR HSBC Securities USD Credit Suisse AUD UBS EUR Barclays USD HSBC Securities PHP Royal Bank of Canada CAD (105,680) Portfolio Analysis % of total assets Transferable securities and money market instruments admitted to an official stock exchange listing or traded on a regulated market Financial derivative instruments dealt in on a regulated market OTC financial derivative instruments Analysis as a percentage of total assets rather than net assets is required under the UCITS Notice 8.5 appendix A. 52 94.06 0.01 0.80 94.87 . PAYDEN GLOBAL FUNDS PUBLIC LIMITED COMPANY SCHEDULE OF INVESTMENTS (continued) Payden Global Inflation - Linked Bond Fund As at 30 June 2015 Holding Name of securities Fair value USD % of net assets 283,842 432,321 140,914 87,004 195,960 357,798 Canada Canadian Government Bond 1.500% 01-Dec-2044 Canadian Government Bond 2.000% 01-Dec-2041 Canadian Government Bond 3.000% 01-Dec-2036 Canadian Government Bond 4.000% 01-Dec-2031 Canadian Government Bond 4.250% 01-Dec-2021 Canadian Government Bond 4.250% 01-Dec-2026 1,674,735 286,047 473,833 172,095 110,881 206,946 424,933 2.30 0.39 0.65 0.24 0.15 0.29 0.58 France France Government Bond OAT 1.100% 25-Jul-2022 France Government Bond OAT 1.850% 25-Jul-2027 France Government Bond OAT 2.100% 25-Jul-2023 France Government Bond OAT 2.250% 25-Jul-2020 France Government Bond OAT 3.150% 25-Jul-2032 France Government Bond OAT 3.400% 25-Jul-2029 6,411,462 1,926,041 414,028 651,525 1,169,336 1,364,219 886,313 8.82 2.65 0.57 0.89 1.61 1.88 1.22 Germany Bundesrepublik Deutschland Bundesobligation Inflation Linked Bond 0.750% 15-Apr-2018 Deutsche Bundesrepublik Inflation Linked Bond 0.100% 15-Apr-2023 Deutsche Bundesrepublik Inflation Linked Bond 0.500% 15-Apr-2030 Deutsche Bundesrepublik Inflation Linked Bond 1.750% 15-Apr-2020 2,416,847 3.33 952,814 388,067 318,046 757,920 1.31 0.54 0.44 1.04 815,297 597,157 832,020 479,200 272,205 1,144,130 Italy Italy Buoni Poliennali Del Tesoro 2.100% 15-Sep-2017 Italy Buoni Poliennali Del Tesoro 2.100% 15-Sep-2021 Italy Buoni Poliennali Del Tesoro 2.350% 15-Sep-2019 Italy Buoni Poliennali Del Tesoro 2.350% 15-Sep-2035 Italy Buoni Poliennali Del Tesoro 2.550% 15-Sep-2041 Italy Buoni Poliennali Del Tesoro 2.600% 15-Sep-2023 5,055,287 953,156 722,280 1,005,306 597,868 341,134 1,435,543 6.95 1.31 0.99 1.38 0.82 0.47 1.98 1,136,080 510,850 371,966 601,706 604,500 837,667 631,446 1,122,080 670,561 140,326 572,665 594,110 496,670 180,000 653,000 190,000 United Kingdom United Kingdom Gilt Inflation Linked 0.125% 22-Nov-2019 United Kingdom Gilt Inflation Linked 0.125% 22-Mar-2024 United Kingdom Gilt Inflation Linked 0.125% 22-Mar-2068 United Kingdom Gilt Inflation Linked 0.375% 22-Mar-2062 United Kingdom Gilt Inflation Linked 0.500% 22-Mar-2050 United Kingdom Gilt Inflation Linked 0.625% 22-Mar-2040 United Kingdom Gilt Inflation Linked 0.625% 22-Nov-2042 United Kingdom Gilt Inflation Linked 0.750% 22-Mar-2034 United Kingdom Gilt Inflation Linked 0.750% 22-Nov-2047 United Kingdom Gilt Inflation Linked 1.125% 22-Nov-2037 United Kingdom Gilt Inflation Linked 1.250% 22-Nov-2017 United Kingdom Gilt Inflation Linked 1.250% 22-Nov-2032 United Kingdom Gilt Inflation Linked 1.250% 22-Nov-2055 United Kingdom Gilt Inflation Linked 2.500% 26-Jul-2016 United Kingdom Gilt Inflation Linked 2.500% 17-Jul-2024 United Kingdom Gilt Inflation Linked 4.125% 22-Jul-2030 23,298,196 1,904,636 869,655 956,578 1,581,744 1,414,352 1,789,949 1,396,165 2,273,986 1,619,431 319,825 962,504 1,281,003 1,529,417 919,945 3,487,395 991,611 32.04 2.62 1.20 1.32 2.18 1.94 2.46 1.92 3.13 2.23 0.44 1.32 1.76 2.10 1.26 4.80 1.36 803,918 3,229,239 2,558,825 656,325 1,594,733 1,494,645 2,747,030 1,342,643 3,650,436 1,543,635 1,151,788 1,898,173 United States United States Treasury Inflation Indexed Bonds 0.125% 15-Apr-2016 United States Treasury Inflation Indexed Bonds 0.125% 15-Apr-2017 United States Treasury Inflation Indexed Bonds 0.125% 15-Apr-2018 United States Treasury Inflation Indexed Bonds 0.125% 15-Apr-2019 United States Treasury Inflation Indexed Bonds 0.125% 15-Jul-2022 United States Treasury Inflation Indexed Bonds 0.125% 15-Jul-2024 United States Treasury Inflation Indexed Bonds 0.250% 15-Jan-2025 United States Treasury Inflation Indexed Bonds 0.625% 15-Jul-2021 United States Treasury Inflation Indexed Bonds 0.625% 15-Jan-2024 United States Treasury Inflation Indexed Bonds 0.625% 15-Feb-2043 United States Treasury Inflation Indexed Bonds 0.750% 15-Feb-2042 United States Treasury Inflation Indexed Bonds 1.125% 15-Jan-2021 32,958,586 807,937 3,274,145 2,599,807 665,041 1,584,642 1,459,965 2,698,743 1,387,538 3,717,170 1,372,146 1,061,175 2,010,135 45.33 1.11 4.50 3.58 0.91 2.18 2.01 3.71 1.91 5.11 1.89 1.46 2.76 1,541,494 299,961 481,452 904,924 805,363 533,783 820,081 326,863 253,158 603,829 53 . PAYDEN GLOBAL FUNDS PUBLIC LIMITED COMPANY SCHEDULE OF INVESTMENTS (continued) Payden Global Inflation - Linked Bond Fund (continued) As at 30 June 2015 Holding 2,169,780 658,314 1,039,414 664,860 667,743 702,267 941,393 991,800 1,007,461 Name of securities Fair value USD 2,324,377 698,378 1,112,497 725,373 823,880 872,730 1,108,931 1,224,641 1,429,335 Total value of investment in securities (2014: 99.00%) 13 11 Futures contracts (2014: 0.00%) Euro-Bund Future Exp 08-Sep-2015 US Treasury Note 10 Year (CBT) Future Exp 21-Sep-2015 3.20 0.96 1.53 1.00 1.13 1.20 1.53 1.68 1.97 71,815,113 United States (continued) United States Treasury Inflation Indexed Bonds 1.250% 15-Jul-2020 United States Treasury Inflation Indexed Bonds 1.375% 15-Jul-2018 United States Treasury Inflation Indexed Bonds 1.375% 15-Jan-2020 United States Treasury Inflation Indexed Bonds 1.875% 15-Jul-2019 United States Treasury Inflation Indexed Bonds 2.125% 15-Feb-2040 United States Treasury Inflation Indexed Bonds 2.125% 15-Feb-2041 United States Treasury Inflation Indexed Bonds 2.375% 15-Jan-2025 United States Treasury Inflation Indexed Bonds 2.500% 15-Jan-2029(1) United States Treasury Inflation Indexed Bonds 3.875% 15-Apr-2029 % of net assets 98.77 Notional (USD) 2,158,918 Broker Goldman Sachs 49,444 42,741 0.07 0.06 1,381,188 Goldman Sachs 6,703 0.01 1,118,511 1.54 72,983,068 100.38 Unrealised gain on forward foreign exchange contracts (Appendix) (2014: 0.68%) Financial assets at fair value through profit or loss Notional (USD) Broker (16,450) (0.03) (2,349,661) Goldman Sachs (16,450) (0.03) Unrealised loss on forward foreign exchange contracts (Appendix) (2014: (0.35%)) (946,189) (1.30) Financial liabilities at fair value through profit or loss (13) Futures contracts (2014: 0.00%) Long Gilt (LIFFE) Future Exp 28-Sep-2015 (962,639) (1.33) 687,872 0.95 72,708,301 100.00 Net current assets Total net assets (1) The nominal value of 105,000 is held as collateral with Goldman Sachs for open future contracts. Appendix: forward foreign currency contracts Unrealised gain on forward foreign currency contracts Purchase Amount Currency Sale Sale Amount Maturity date Unrealised Gain/Loss USD 195,000 USD (296,513) 06-Jul-2015 10,155 Sterling Class (Accumulating) HSBC Securities GBP 1,559,000 USD (2,378,418) 06-Jul-2015 73,352 Sterling Class (Distributing) HSBC Securities GBP 13,132,000 USD (20,034,245) 06-Jul-2015 617,873 Sterling Class Unhedged (Distributing) Barclays CAD Barclays EUR Barclays GBP Barclays JPY 922,000 5,718,000 6,517,000 74,200,000 USD USD USD USD (738,176) (6,270,891) (9,940,719) (598,287) 06-Jul-2015 06-Jul-2015 06-Jul-2015 06-Jul-2015 297 100,431 308,280 8,123 1,118,511 Currency Counter Party Purchase Payden Global Inflation - Linked Bond Fund HSBC Securities GBP 54 . PAYDEN GLOBAL FUNDS PUBLIC LIMITED COMPANY SCHEDULE OF INVESTMENTS (continued) Payden Global Inflation - Linked Bond Fund (continued) As at 30 June 2015 Appendix: forward foreign currency contracts (continued) Unrealised loss on forward foreign currency contracts Currency Counter Party Purchase Payden Global Inflation - Linked Bond Fund HSBC Securities USD Royal Bank of Canada USD Royal Bank of Canada USD HSBC Securities USD HSBC Securities USD Barclays USD Purchase Amount Currency Sale Sale Amount Maturity date Unrealised Gain/Loss USD 1,699,896 14,025,677 85,041 12,854,748 104,920 10,470,136 CAD EUR EUR GBP GBP GBP (2,123,000) (12,787,000) (78,000) (8,426,000) (69,000) (6,862,000) 06-Jul-2015 06-Jul-2015 06-Jul-2015 06-Jul-2015 06-Jul-2015 06-Jul-2015 (516) (222,328) (1,871) (396,451) (3,594) (321,429) (946,189) Portfolio Analysis % of total assets Transferable securities and money market instruments admitted to an official stock exchange listing or traded on a regulated market Financial derivative instruments dealt in on a regulated market OTC financial derivative instruments Analysis as a percentage of total assets rather than net assets is required under the UCITS Notice 8.5 appendix A. 55 97.26 0.04 0.23 97.53 . PAYDEN GLOBAL FUNDS PUBLIC LIMITED COMPANY SCHEDULE OF INVESTMENTS (continued) Payden Global Short Bond Fund* As at 30 June 2015 Holding 98,215 300,000 300,000 250,000 967,261 700,000 40,000 40,000 550,000 800,000 790,000 250,000 500,000 1,700,000 775,000 178,718 1,210,000 117,296 146,096 1,300,000 488,227 250,000 250,000 400,000 159,614 176,990 162,426 192,432 685,165 497,355 1,252,874 692,090 600,000 905,000 250,000 168,914 492,290 280,000 900,000 500,000 1,208,023 520,000 350,000 1,020,000 280,000 63,588 695,000 22,841 500,000 250,000 250,000 800,000 400,000 250,000 Name of securities Fair value USD % of net assets Asset-backed securities American Homes 4 Rent 1.250% 17-Jun-2031 Apidos CLO XIV 1.425% 15-Apr-2025 Babson CLO Ltd 2013-I 1.375% 20-Apr-2025 Babson CLO Ltd 2015-I 3.129% 20-Apr-2027 Bavarian Sky SA 0.237% 20-Apr-2024 Bumper 6 NL Finance BV floating rate 19-Mar-2029 Capital Auto Receivables Asset Trust 2013-1 1.290% 20-Apr-2018 Capital Auto Receivables Asset Trust 2013-1 1.740% 22-Oct-2018 Capital Auto Receivables Asset Trust 2015-2 1.390% 20-Sep-2018 Carlyle Global Market Strategies 1.740% 27-Apr-2027 CarMax Auto Owner Trust 2015-2 1.370% 16-Mar-2020 Cent CLO 18 Ltd 1.397% 23-Jul-2025 Cent CLO 18 Ltd floating rate 23-Jul-2025 CNH Equipment Trust 1.370% 15-Jul-2020 CNH Equipment Trust 2013-B 1.270% 16-Nov-2020 Colony American Homes 2014-2 1.100% 17-Jul-2031 Colony American Homes Single-Family Rental Pass-Through Certificates 1.387% 17-Jul-2032 Colony American Homes Single-Family Rental Pass-Through Certificates 1.400% 17-May-2031 CSMC Trust 2013-IVR2 floating rate 25-Apr-2043 Delamare Cards floating rate 19-May-2019 Driver France 1 FCT 0.287% 21-Oct-2020 Dryden XXVIII Senior Loan Fund 1.374% 15-Aug-2025 Dryden XXVIII Senior Loan Fund 1.824% 15-Aug-2025 Dryden XXXI Senior Loan Fund floating rate 18-Apr-2026 E-CARAT 2 PLC floating rate 18-Oct-2021 Fannie Mae Connecticut Avenue Securities floating rate 25-Oct-2023 Fannie Mae Connecticut Avenue Securities floating rate 25-Jan-2024 Fannie Mae Connecticut Avenue Securities floating rate 25-May-2024 Fannie Mae Connecticut Avenue Securities floating rate 25-Nov-2024 Fannie Mae Connecticut Avenue Securities floating rate 25-May-2025 Fannie Mae Connecticut Avenue Securities 1M1 floating rate 25-Jul-2024 Fannie Mae Connecticut Avenue Securities 2M1 floating rate 25-Jul-2024 Flatiron CLO 2014-1 Ltd floating rate 17-Jul-2026 Ford Credit Auto Owner Trust 2015-B 1.160% 15-Nov-2019 Fosse Master Issuer PLC floating rate 18-Oct-2054 Freddie Mac Structured Agency Credit Risk Debt Notes floating rate 25-Nov-2023 Freddie Mac Structured Agency Credit Risk Debt Notes floating rate 25-Mar-2025 Freddie Mac Structured Agency Credit Risk Debt Notes floating rate 25-May-2025 Freddie Mac Structured Agency Credit Risk Debt Notes floating rate 25-Dec-2027 Honda Auto Receivables 2015-1 Owner Trust 0.700% 15-Jun-2017 Invitation Homes 2013-SFR1 Trust floating rate 17-Dec-2030 Invitation Homes 2014-SFR1 Trust 1.183% 17-Jun-2031 Invitation Homes 2014-SFR2 Trust floating rate 17-Sep-2031 Invitation Homes 2015-SFR3 Trust floating rate 17-Aug-2032 Kubota Credit Owner Trust 2015-1 0.940% 15-Dec-2017 LA Arena Funding LLC 7.656% 15-Dec-2026 MMAF Equipment Finance LLC 2015-A 1.390% 16-Oct-2019 Motor 2013-1 PLC floating rate 25-Feb-2021 Motor 2015-1 PLC floating rate 25-Jun-2022 Oaktree Enhanced Income Funding Series III Ltd 1.475% 20-Jul-2023 Oaktree Enhanced Income Funding Series III Ltd 1.925% 20-Jul-2023 Octagon Investment Partners 24 Ltd 1.731% 21-May-2027 Octagon Investment Partners XIX Ltd 1.795% 15-Apr-2026 Octagon Investment Partners XIX Ltd 2.275% 15-Apr-2026 35,338,653 98,081 295,951 296,869 249,987 1,078,889 780,543 40,015 40,123 550,245 800,504 791,143 247,148 493,006 1,700,455 774,329 177,008 19.09 0.05 0.16 0.16 0.14 0.58 0.42 0.02 0.02 0.30 0.43 0.43 0.13 0.27 0.92 0.42 0.10 1,205,281 0.65 116,906 137,767 2,038,098 544,209 247,763 245,040 400,603 250,756 179,320 163,424 190,986 690,473 494,839 1,252,251 691,612 599,998 905,304 394,124 0.06 0.07 1.10 0.29 0.13 0.13 0.22 0.14 0.10 0.09 0.10 0.37 0.27 0.68 0.37 0.32 0.49 0.21 169,174 0.09 491,068 0.27 279,131 0.15 900,000 499,939 1,205,175 515,146 347,272 1,025,671 280,356 70,639 695,487 35,945 786,824 249,774 246,427 800,000 399,999 249,457 0.49 0.27 0.65 0.28 0.19 0.55 0.15 0.04 0.38 0.02 0.43 0.14 0.13 0.43 0.22 0.13 56 . PAYDEN GLOBAL FUNDS PUBLIC LIMITED COMPANY SCHEDULE OF INVESTMENTS (continued) Payden Global Short Bond Fund* (continued) As at 30 June 2015 Holding Name of securities Fair value USD % of net assets 787,990 629,881 999,286 499,846 0.43 0.34 0.54 0.27 213,756 103,851 1,400,000 44,429 97,920 151,307 550,000 520,000 250,000 250,000 250,000 Asset-backed securities (continued) Penarth Master Issuer PLC floating rate 18-Mar-2021 Penarth Master Issuer PLC floating rate 18-Mar-2022 Porsche Innovative Lease Owner Trust 2015-1 1.190% 23-Jul-2018 Progress Residential 2015-SFR1 Trust floating rate 17-Feb-2032 SC Germany Auto 2014-1 UG haftungsbeschraenkt floating rate 11-Dec-2023 Sequoia Mortgage Trust 2013-4 floating rate 25-Apr-2043 Silverstone Master Issuer PLC floating rate 21-Jan-2070 Springleaf Mortgage Loan Trust 2012-2 floating rate 25-Oct-2057 Springleaf Mortgage Loan Trust 2013-1 floating rate 25-Jun-2058 Springleaf Mortgage Loan Trust 2013-2 floating rate 25-Dec-2065 Symphony CLO XV Ltd 1.720% 17-Oct-2026 Synchrony Credit Card Master Note Trust 2014-1 1.600% 15-Apr-2021 Tyron Park CLO Ltd 1.395% 15-Jul-2025 Tyron Park CLO Ltd 1.825% 15-Jul-2025 Venture XVII CLO Ltd floating rate 15-Jul-2026 238,231 100,968 1,564,062 44,650 98,044 152,034 549,507 520,031 247,914 245,315 250,360 0.13 0.05 0.85 0.02 0.05 0.08 0.30 0.28 0.13 0.13 0.14 1,500,000 1,000,000 1,000,000 Commercial paper Bayer AG 0.000% 17-Aug-2015 National Grid PLC 0.000% 18-Sep-2015 Vodafone Group PLC 0.000% 14-Jan-2016 3,899,053 1,671,388 1,114,111 1,113,554 2.11 0.91 0.60 0.60 290,000 210,000 200,000 200,000 200,000 100,000 175,000 180,000 260,000 150,000 160,000 70,000 700,000 60,000 60,000 200,000 120,000 4,460,000 130,000 1,350,000 50,000 30,000 300,000 180,000 400,000 175,000 560,000 200,000 60,000 50,000 300,000 60,000 100,000 500,000 250,000 800,000 100,000 Corporate bonds AbbVie Inc 1.800% 14-May-2018 AbbVie Inc 2.500% 14-May-2020 ABN AMRO Bank NV floating rate 28-Oct-2016 AIA Group Ltd 2.250% 11-Mar-2019 Air Lease Corp 4.500% 15-Jan-2016 Aircastle Ltd 6.750% 15-Apr-2017 Allied Irish Banks PLC 2.875% 28-Nov-2016 Ally Financial Inc 3.250% 29-Sep-2017 Amgen Inc 1.250% 22-May-2017 AP Moeller - Maersk A/S 2.550% 22-Sep-2019 Ashland Inc 3.875% 15-Apr-2018 Astoria Financial Corp 5.000% 19-Jun-2017 AT&T Inc floating rate 04-Jun-2019 Autodesk Inc 1.950% 15-Dec-2017 AutoZone Inc 1.300% 13-Jan-2017 Baidu Inc 2.250% 28-Nov-2017 Banco do Nordeste do Brasil SA 3.625% 09-Nov-2015 Bank Nederlandse Gemeenten NV 3.500% 30-Oct-2017 Bank of America Corp 1.700% 25-Aug-2017 Bank of America Corp 2.000% 11-Jan-2018 Bank of America Corp 3.750% 12-Jul-2016 Bank of America Corp 3.875% 22-Mar-2017 Bank of America Corp floating rate 02-May-2017 Bank of America Corp floating rate 22-Mar-2018 Bank of America Corp floating rate 28-Mar-2018 Bank of Ireland 2.750% 05-Jun-2016 Bank of New York Mellon Corp 1.600% 22-May-2018 Banque Federative du Credit Mutuel SA floating rate 28-Oct-2016 Becton Dickinson & Co 1.800% 15-Dec-2017 Becton Dickinson & Co floating rate 15-Jun-2016 Belfius Bank SA/NV 1.125% 22-May-2017 Cameron International Corp 1.400% 15-Jun-2017 Canadian Natural Resources Ltd 1.750% 15-Jan-2018 Capital Gemini SA 1.750% 01-Jul-2020 Capital One Bank USA NA 1.200% 13-Feb-2017 Carrefour Banque SA floating rate 20-Mar-2020 Caterpillar Financial Services Corp 1.000% 03-Mar-2017 47,224,839 289,348 208,082 201,056 199,034 203,125 106,750 199,287 180,450 259,928 151,184 165,000 73,550 782,699 60,293 60,122 201,320 120,600 593,760 130,217 1,355,250 51,270 31,203 297,790 181,759 442,547 198,344 559,905 201,055 60,043 50,035 337,927 59,636 99,385 561,292 248,834 888,606 100,247 25.52 0.16 0.11 0.11 0.11 0.11 0.06 0.11 0.10 0.14 0.08 0.09 0.04 0.42 0.03 0.03 0.11 0.07 0.32 0.07 0.73 0.03 0.02 0.16 0.10 0.24 0.11 0.30 0.11 0.03 0.03 0.18 0.03 0.05 0.30 0.13 0.48 0.05 500,000 400,000 1,000,000 500,000 57 . PAYDEN GLOBAL FUNDS PUBLIC LIMITED COMPANY SCHEDULE OF INVESTMENTS (continued) Payden Global Short Bond Fund* (continued) As at 30 June 2015 Holding 120,000 50,000 350,000 75,000 300,000 310,000 1,330,000 260,000 50,000 150,000 250,000 125,000 40,000 350,000 250,000 700,000 700,000 200,000 250,000 250,000 150,000 110,000 60,000 100,000 500,000 400,000 55,000 240,000 600,000 1,000,000 150,000 1,550,000 170,000 800,000 55,000 400,000 70,000 180,000 200,000 220,000 90,000 90,000 45,000 100,000 155,000 150,000 78,000 250,000 20,000 400,000 100,000 150,000 500,000 200,000 130,000 200,000 75,000 5,000,000 170,000 Name of securities Fair value USD Corporate bonds (continued) Caterpillar Financial Services Corp 1.250% 18-Aug-2017 CC Holdings GS V LLC / Crown Castle GS III Corp 2.381% 15-Dec-2017 Cie de Saint-Gobain 4.750% 11-Apr-2017 CIT Group Inc 5.250% 15-Mar-2018 CIT Group Inc 5.375% 15-May-2020 Citigroup Inc 1.550% 14-Aug-2017 Citigroup Inc 1.800% 05-Feb-2018 Citigroup Inc 1.850% 24-Nov-2017 Citigroup Inc 4.450% 10-Jan-2017 Citigroup Inc floating rate 30-Nov-2017 Citizens Bank NA/Providence RI 1.600% 04-Dec-2017 Computer Sciences Corp 2.500% 15-Sep-2015 ConAgra Foods Inc 1.300% 25-Jan-2016 Cooperatieve Centrale Raiffeisen-Boerenleenbank BA/Netherlands floating rate 29-May-2020 Credit Agricole SA/London floating rate 15-Apr-2019 Credit Agricole SA/London floating rate 10-Jun-2020 Credit Suisse AG floating rate 18-Jun-2018 Credit Suisse AG/London floating rate 15-Jul-2016 Credit Suisse/New York NY 1.700% 27-Apr-2018 Credit Suisse/New York NY 1.750% 29-Jan-2018 Daimler AG 1.625% 02-Dec-2016 Electricite de France SA 1.150% 20-Jan-2017 Electricite de France SA floating rate 20-Jan-2017 Enbridge Inc floating rate 01-Oct-2016 Enbridge Inc floating rate 13-Mar-2017 Fidelity International Ltd 6.875% 24-Feb-2017 Fifth Third Bancorp 5.450% 15-Jan-2017 Ford Motor Credit Co LLC floating rate 12-Mar-2019 Ford Motor Credit Co LLC 1.461% 27-Mar-2017 Ford Motor Credit Co LLC 2.240% 15-Jun-2018 General Mills Inc 1.400% 20-Oct-2017 Goldman Sachs Group Inc 6.150% 01-Apr-2018 Goldman Sachs Group Inc floating rate 30-Apr-2018 Goldman Sachs Group Inc floating rate 29-May-2020 Health Care REIT Inc 3.625% 15-Mar-2016 Heathrow Funding Ltd 4.600% 15-Feb-2018 Hess Corp 1.300% 15-Jun-2017 Hewlett-Packard Co floating rate 14-Jan-2019 HSBC Bank PLC floating rate 15-May-2018 HSBC USA Inc 1.700% 05-Mar-2018 Hyundai Capital America 1.625% 02-Oct-2015 Hyundai Capital America 2.000% 19-Mar-2018 Hyundai Capital America 2.125% 02-Oct-2017 International Business Machines Corp 1.125% 06-Feb-2018 International Lease Finance Corp 3.875% 15-Apr-2018 International Lease Finance Corp floating rate 15-Jun-2016 John Deere Capital Corp 1.350% 16-Jan-2018 JPMorgan Chase & Co 1.350% 15-Feb-2017 JPMorgan Chase & Co 3.150% 05-Jul-2016 JPMorgan Chase & Co floating rate 30-May-2017 JPMorgan Chase & Co floating rate 25-Jan-2018 Jyske Bank A/S floating rate 19-Jun-2017 KeyBank NA/Cleveland OH 1.700% 01-Jun-2018 Korea Expressway Corp 1.625% 28-Apr-2017 Kroger Co floating rate 17-Oct-2016 LeasePlan Corp NV floating rate 28-Apr-2017 Liberty Property LP 6.625% 01-Oct-2017 Linde AG 2.750% 28-Sep-2017 Macquarie Bank Ltd 1.600% 27-Oct-2017 58 % of net assets 120,225 50,608 419,928 77,719 313,500 309,617 1,327,627 260,786 52,257 167,309 249,735 125,378 40,011 0.07 0.03 0.23 0.04 0.17 0.17 0.72 0.14 0.03 0.09 0.13 0.07 0.02 388,903 252,023 700,434 777,951 314,457 248,359 249,121 237,028 110,218 60,106 99,870 395,358 489,905 58,325 238,382 597,571 1,001,385 149,848 1,724,073 171,912 891,997 55,831 492,638 69,673 177,624 200,082 219,480 90,115 90,091 45,463 99,403 156,162 150,188 78,279 250,278 20,408 620,201 100,722 167,880 499,562 200,106 130,096 223,228 82,751 655,268 170,019 0.21 0.14 0.38 0.42 0.17 0.13 0.13 0.13 0.06 0.03 0.05 0.21 0.26 0.03 0.13 0.32 0.54 0.08 0.93 0.09 0.48 0.03 0.27 0.04 0.10 0.11 0.12 0.05 0.05 0.02 0.05 0.08 0.08 0.04 0.14 0.01 0.34 0.05 0.09 0.27 0.11 0.07 0.12 0.04 0.35 0.09 . PAYDEN GLOBAL FUNDS PUBLIC LIMITED COMPANY SCHEDULE OF INVESTMENTS (continued) Payden Global Short Bond Fund* (continued) As at 30 June 2015 Holding 200,000 600,000 100,000 1,000,000 100,000 800,000 600,000 110,000 140,000 400,000 320,000 70,000 800,000 500,000 130,000 300,000 250,000 140,000 80,000 40,000 300,000 1,100,000 150,000 100,000 150,000 100,000 650,000 110,000 150,000 100,000 100,000 150,000 800,000 400,000 300,000 250,000 290,000 170,000 200,000 200,000 190,000 115,000 60,000 100,000 315,000 450,000 60,000 100,000 140,000 110,000 700,000 200,000 160,000 100,000 240,000 250,000 50,000 80,000 500,000 Name of securities Fair value USD Corporate bonds (continued) Macquarie Bank Ltd 2.000% 15-Aug-2016 Macquarie Bank Ltd 4.875% 10-Jun-2025 Macquarie Bank Ltd floating rate 27-Oct-2017 Macquarie Group Ltd 4.875% 10-Aug-2017 McKesson Corp 1.292% 10-Mar-2017 Metropolitan Life Global Funding I 4.625% 16-May-2017 Morgan Stanley 5.450% 09-Jan-2017 Morgan Stanley 6.625% 01-Apr-2018 Morgan Stanley floating rate 23-Jul-2019 Morgan Stanley floating rate 19-Nov-2019 Morgan Stanley floating rate 27-Jan-2020 Murphy Oil Corp 2.500% 01-Dec-2017 National Grid North America Inc 1.750% 20-Feb-2018 Nederlandse Waterschapsbank NV 1.250% 18-Sep-2017 Nissan Motor Acceptance Corp 1.000% 15-Mar-2016 NRW Bank 0.875% 20-Mar-2017 PACCAR Financial Europe BV 1.513% 29-May-2018 Parker-Hannifin Corp 4.125% 11-Nov-2015 Penske Truck Leasing Co LP/PTL Finance Corp 2.500% 15-Mar-2016 Penske Truck Leasing Co LP/PTL Finance Corp 2.500% 15-Jun-2019 Pernod Ricard SA 4.875% 18-Mar-2016 PNC Bank NA 1.600% 01-Jun-2018 Powszechna Kasa Oszczednosci Bank Polski SA via PKO Finance AB 3.733% 21-Oct-2015 Prudential Financial Inc floating rate 15-Aug-2018 Prudential PLC 1.375% 19-Jan-2018 QBE Insurance Group Ltd 6.125% 28-Sep-2015 QUALCOMM Inc 1.400% 18-May-2018 Regions Financial Corp 2.000% 15-May-2018 Royal Bank of Scotland PLC 6.934% 09-Apr-2018 Ryder System Inc 3.500% 01-Jun-2017 Ryder System Inc 2.500% 01-Mar-2017 Sabine Pass LNG LP 7.500% 30-Nov-2016 Societe Des Autoroutes Paris-Rhin-Rhone floating rate 31-Mar-2019 Socram Banque floating rate 28-Nov-2017 Southern California Edison Co 1.845% 01-Feb-2022 Southern Gas Networks PLC 5.125% 02-Nov-2018 Standard Chartered PLC 1.500% 08-Sep-2017 Stena AB 6.125% 01-Feb-2017 Suncorp-Metway Ltd floating rate 06-Oct-2017 Suntory Holdings Ltd 1.650% 29-Sep-2017 SunTrust Bank/Atlanta GA 5.200% 17-Jan-2017 Synchrony Financial 1.875% 15-Aug-2017 Synchrony Financial floating rate 03-Feb-2020 Telecom Italia SpA 5.625% 29-Dec-2015 Tenet Healthcare Corp 6.250% 01-Nov-2018 Tenet Healthcare Corp floating rate 15-Jun-2020 Thermo Fisher Scientific Inc 1.300% 01-Feb-2017 Thomson Reuters Corp 1.300% 23-Feb-2017 Thomson Reuters Corp 1.650% 29-Sep-2017 TIAA Asset Management Finance Co LLC 2.950% 01-Nov-2019 UBS AG/London floating rate 15-May-2017 United Utilities Water Ltd 6.125% 29-Dec-2015 Verizon Communications Inc 1.350% 09-Jun-2017 Verizon Communications Inc floating rate 14-Sep-2018 Verizon Communications Inc floating rate 17-Jun-2019 Virgin Money PLC 2.250% 21-Apr-2020 Walgreens Boots Alliance Inc 1.750% 17-Nov-2017 Walgreens Boots Alliance Inc floating rate 18-May-2016 Wells Fargo Bank NA 5.750% 16-May-2016 59 % of net assets 202,059 591,561 100,237 1,057,318 99,896 960,442 635,959 123,473 139,193 447,333 324,762 69,910 921,430 502,938 130,264 300,218 393,018 158,133 80,573 39,655 345,234 1,098,724 0.11 0.32 0.05 0.57 0.05 0.52 0.34 0.07 0.08 0.24 0.18 0.04 0.50 0.27 0.07 0.16 0.21 0.09 0.04 0.02 0.19 0.59 168,640 100,720 234,736 159,105 648,254 110,002 187,533 104,040 101,846 158,627 901,227 447,349 299,848 432,964 289,739 199,173 314,936 200,371 200,521 115,012 60,331 160,001 342,956 454,500 59,924 99,807 140,031 110,880 779,936 321,943 159,849 103,535 238,724 384,292 50,225 80,005 519,146 0.09 0.05 0.13 0.09 0.35 0.06 0.10 0.06 0.06 0.09 0.49 0.24 0.16 0.23 0.16 0.11 0.17 0.11 0.11 0.06 0.03 0.09 0.19 0.25 0.03 0.05 0.08 0.06 0.42 0.17 0.09 0.06 0.13 0.21 0.03 0.04 0.28 . PAYDEN GLOBAL FUNDS PUBLIC LIMITED COMPANY SCHEDULE OF INVESTMENTS (continued) Payden Global Short Bond Fund* (continued) As at 30 June 2015 Holding Name of securities 200,000 130,000 800,000 140,000 40,000 Corporate bonds (continued) Western Union Co floating rate 21-Aug-2015 Whirlpool Corp 1.350% 01-Mar-2017 Yorkshire Building Society 2.125% 18-Mar-2019 Zimmer Biomet Holdings Inc 2.000% 01-Apr-2018 Zimmer Biomet Holdings Inc 2.700% 01-Apr-2020 200,000 240,000 250,000 350,000 100,000 805,000 805,000 130,000 600,000 100,000 350,000 300,000 30,000 300,000 65,000 130,000 230,000 500,000 110,000 250,000 50,000 210,000 300,000 260,000 250,000 200,000 50,000 40,000 300,000 370,000 325,000 180,000 400,000 170,000 90,000 110,000 80,000 65,000 40,000 250,000 400,000 130,000 500,000 962,000 180,000 30,000 250,000 300,000 190,000 350,000 590,000 Fair value USD Covered bonds Abbey National Treasury Services PLC/London 1.375% 13-Mar-2017 Abbey National Treasury Services PLC/London 1.650% 29-Sep-2017 Abbey National Treasury Services PLC/London floating rate 22-May-2019 ACCO Brands Corp 6.750% 30-Apr-2020 Actavis Funding SCS 1.300% 15-Jun-2017 Actavis Funding SCS 1.850% 01-Mar-2017 Actavis Funding SCS 2.350% 12-Mar-2018 Actavis Funding SCS floating rate 12-Mar-2020 Airbus Group Finance BV 5.500% 25-Sep-2018 Alliance Data Systems Corp 5.250% 01-Dec-2017 American Axle & Manufacturing Inc 6.250% 15-Mar-2021 ANZ New Zealand Int'l Ltd/London 1.750% 29-Mar-2018 ARC Properties Operating Partnership LP 2.000% 06-Feb-2017 ASB Finance Ltd/London floating rate 01-May-2018 Avis Budget Car Rental LLC / Avis Budget Finance Inc 4.875% 15-Nov-2017 Baxalta Inc 2.000% 22-Jun-2018 Baxalta Inc floating rate 22-Jun-2018 Bell Canada floating rate 22-Apr-2016 BNP Paribas SA 3.600% 23-Feb-2016 BNZ International Funding Ltd/London 1.900% 26-Feb-2018 Boardwalk Pipelines LP 5.875% 15-Nov-2016 BP Capital Markets PLC 1.674% 13-Feb-2018 BP Capital Markets PLC 2.994% 18-Feb-2019 BPCE SA 1.625% 26-Jan-2018 BPCE SA floating rate 10-Feb-2017 BUPA Finance PLC 7.500% 04-Jul-2016 Carnival Corp 1.200% 05-Feb-2016 Carnival Corp 1.875% 15-Dec-2017 CNH Industrial Capital LLC 3.250% 01-Feb-2017 CNH Industrial Capital LLC 3.875% 16-Jul-2018 CNOOC Nexen Finance 2014 ULC 1.625% 30-Apr-2017 ConocoPhillips Co 1.500% 15-May-2018 Conti-Gummi Finance BV 2.500% 20-Mar-2017 Daimler Finance North America LLC 1.650% 02-Mar-2018 DIRECTV Holdings LLC / DIRECTV Financing Co Inc 3.125% 15-Feb-2016 DISH DBS Corp 4.625% 15-Jul-2017 Express Scripts Holding Co 1.250% 02-Jun-2017 Fidelity National Information Services Inc 1.450% 05-Jun-2017 Fidelity National Information Services Inc 2.000% 15-Apr-2018 GE Capital UK Funding floating rate 16-Jan-2018 General Motors Financial Co Inc 2.400% 10-Apr-2018 General Motors Financial Co Inc 3.000% 25-Sep-2017 Glencore Finance Canada Ltd 2.700% 25-Oct-2017 Glencore Finance Canada Ltd 3.600% 15-Jan-2017 Glencore Funding LLC 2.125% 16-Apr-2018 Glencore Funding LLC floating rate 15-Jan-2019 Glencore Funding LLC 144A floating rate 15-Jan-2019 Goodyear Tire & Rubber Co 6.500% 01-Mar-2021 Harley-Davidson Financial Services Inc 2.150% 26-Feb-2020 Hertz Corp 5.875% 15-Oct-2020 HJ Heinz Co 1.600% 30-Jun-2017 60 % of net assets 200,149 130,436 922,800 140,143 39,846 0.11 0.07 0.50 0.08 0.02 24,311,290 200,500 240,787 279,739 369,250 99,372 809,258 809,774 131,589 777,224 103,750 369,250 300,149 29,175 470,751 13.14 0.11 0.13 0.15 0.20 0.05 0.44 0.44 0.07 0.42 0.06 0.20 0.16 0.02 0.25 66,787 129,922 230,099 400,881 111,977 251,277 51,876 210,816 362,585 259,884 251,477 333,315 50,070 40,191 300,375 370,925 325,608 179,944 461,147 169,336 0.04 0.07 0.12 0.22 0.06 0.14 0.03 0.11 0.20 0.14 0.14 0.18 0.03 0.02 0.16 0.20 0.18 0.10 0.25 0.09 91,080 113,575 79,663 64,884 39,990 393,368 401,261 132,679 505,465 987,786 178,766 29,995 249,955 318,750 188,571 356,125 590,347 0.05 0.06 0.04 0.03 0.02 0.21 0.22 0.07 0.27 0.53 0.10 0.02 0.13 0.17 0.10 0.19 0.32 . PAYDEN GLOBAL FUNDS PUBLIC LIMITED COMPANY SCHEDULE OF INVESTMENTS (continued) Payden Global Short Bond Fund* (continued) As at 30 June 2015 Holding 510,000 350,000 300,000 200,000 100,000 250,000 100,000 70,000 250,000 40,000 40,000 150,000 250,000 450,000 60,000 200,000 50,000 40,000 200,000 100,000 200,000 40,000 485,000 800,000 200,000 120,000 530,000 800,000 200,000 60,000 350,000 400,000 300,000 50,000 74,000 230,000 250,000 1,800,000 200,000 235,000 200,000 2,570,000 1,450,000 200,000 2,215,000 500,000 300,000 400,000 200,000 300,000 1,200,000 1,000,000 300,000 200,000 3,890,000 1,100,000 Name of securities Fair value USD Covered bonds (continued) HJ Heinz Co 2.000% 02-Jul-2018 Huntsman International LLC 4.875% 15-Nov-2020 Hutchison Whampoa Finance 06 Ltd 4.625% 21-Sep-2016 Hutchison Whampoa International 12 II Ltd 2.000% 08-Nov-2017 Hyundai Capital America 3.750% 06-Apr-2016 IAC/InterActiveCorp 4.875% 30-Nov-2018 JB Hunt Transport Services Inc 2.400% 15-Mar-2019 JB Hunt Transport Services Inc 3.375% 15-Sep-2015 KBC Internationale Financieringsmaatschappij NV 2.125% 10-Sep-2018 Kinder Morgan Inc/DE 2.000% 01-Dec-2017 Kinder Morgan Inc/DE 3.050% 01-Dec-2019 L-3 Communications Corp 1.500% 28-May-2017 Lloyds Bank PLC 4.875% 21-Jan-2016 Mallinckrodt International Finance SA 3.500% 15-Apr-2018 Medtronic Inc 1.500% 15-Mar-2018 Mizuho Bank Ltd 1.700% 25-Sep-2017 Mylan Inc 1.350% 29-Nov-2016 Mylan Inc 1.800% 24-Jun-2016 Nabors Industries Inc 2.350% 15-Sep-2016 NBCUniversal Enterprise Inc floating rate 15-Apr-2018 Perrigo Co PLC 1.300% 08-Nov-2016 Phillips 66 2.950% 01-May-2017 Rogers Communications Inc floating rate 13-Mar-2017 Santander Consumer Bank AS 0.625% 20-Apr-2018 Scentre Group Trust 1 floating rate 16-Jul-2018 Seagate HDD Cayman 3.750% 15-Nov-2018 Siemens Financieringsmaatschappij NV 1.450% 25-May-2018 Sky PLC floating rate 01-Apr-2020 SpareBank 1 Boligkreditt AS 2.625% 27-May-2016 Sysco Corp 1.450% 02-Oct-2017 Targa Resources Partners LP / Targa Resources Partners Finance Corp 6.875% 01-Feb-2021 Telstra Corp Ltd 4.750% 21-Mar-2017 T-Mobile USA Inc 5.250% 01-Sep-2018 Ventas Realty LP 1.250% 17-Apr-2017 Ventas Realty LP 1.550% 26-Sep-2016 Volkswagen Group of America Finance LLC 1.250% 23-May-2017 Volkswagen Leasing GmbH 1.000% 04-Oct-2017 Volvo Treasury AB floating rate 03-Jun-2016 WEA Finance LLC / Westfield UK & Europe Finance PLC 1.750% 15-Sep-2017 Windstream Services LLC 7.875% 01-Nov-2017 ZF North America Capital Inc 4.000% 29-Apr-2020 Government and government related bonds Australia Government Bond 5.500% 21-Jan-2018 Australia Government Bond 6.000% 15-Feb-2017 Caisse des Depots et Consignations 1.000% 13-Mar-2017 Canadian Government Bond 1.500% 01-Feb-2017 Canadian Government Bond 1.750% 01-Sep-2019 European Investment Bank 1.125% 15-Aug-2018 Export Development Canada 1.000% 15-Jun-2018 FMS Wertmanagement AoeR 0.625% 30-Jan-2017 FMS Wertmanagement AoeR 1.125% 05-Sep-2017 France Government Bond OAT 1.000% 25-May-2019 France Government Bond OAT 4.250% 25-Oct-2018 Instituto de Credito Oficial 1.125% 01-Apr-2016 IPIC GMTN Ltd 1.750% 30-Nov-2015 Italy Buoni Poliennali Del Tesoro 3.500% 01-Dec-2018 Italy Buoni Poliennali Del Tesoro 4.500% 01-Aug-2018 61 % of net assets 510,207 350,875 352,010 201,260 101,871 258,750 101,000 70,355 292,584 39,902 39,997 149,039 255,521 453,375 59,888 200,108 49,865 40,030 200,643 100,523 199,219 41,133 388,000 886,669 224,167 125,203 528,643 892,889 203,605 60,600 0.28 0.19 0.19 0.11 0.05 0.14 0.05 0.04 0.16 0.02 0.02 0.08 0.14 0.24 0.03 0.11 0.03 0.02 0.11 0.05 0.11 0.02 0.21 0.48 0.12 0.07 0.29 0.48 0.11 0.03 364,875 480,544 309,000 49,899 74,295 230,374 282,747 218,571 0.20 0.26 0.17 0.03 0.04 0.12 0.15 0.12 200,665 250,569 200,500 0.11 0.14 0.11 73,330,863 2,145,429 1,185,787 200,793 1,802,676 418,395 299,300 399,000 199,918 301,471 1,382,662 1,271,129 300,628 201,318 4,734,258 1,368,362 39.63 1.16 0.64 0.11 0.97 0.23 0.16 0.22 0.11 0.16 0.75 0.69 0.16 0.11 2.56 0.74 . PAYDEN GLOBAL FUNDS PUBLIC LIMITED COMPANY SCHEDULE OF INVESTMENTS (continued) Payden Global Short Bond Fund* (continued) As at 30 June 2015 Holding 100,000,000 220,000,000 450,000,000 300,000,000 450,000 10,257,500 19,450,000 250,000 2,430,000 700,000 2,250,000 300,000 2,000,000 1,840,000 1,400,000 300,000 1,250,000 750,000 1,100,000 1,000,000 3,100,000 6,550,000 6,590,000 2,500,000 5,250,000 6,500,000 1,300,000 60,000 1,000,000 Name of securities Fair value USD 830,756 1,799,084 3,678,287 2,453,719 451,376 666,395 1,383,350 282,043 1,765,692 199,478 670,256 240,901 1,537,319 2,192,398 1,645,972 301,332 155,892 1,186,248 1,742,426 999,453 3,099,275 6,564,587 6,589,486 2,510,547 5,260,253 6,538,083 1,303,961 60,230 1,010,938 100,000 Term Loans Asurion LLC 3.750% 27-Feb-2017 Total value of investment in securities (2014: 99.93%) 17 132 109 17 64 (64) 8 0.05 0.05 184,314,318 Mortgage related securities Fannie Mae Pool floating rate 01-Oct-2033 0.06 0.06 99,891 99,891 103,281 0.45 0.97 1.99 1.33 0.24 0.36 0.75 0.15 0.95 0.11 0.36 0.13 0.83 1.19 0.89 0.16 0.08 0.64 0.94 0.54 1.68 3.55 3.56 1.36 2.84 3.53 0.70 0.03 0.55 109,729 109,729 Government and government related bonds (continued) Japan Finance Organization for Municipalities 2.000% 09-May-2016 Japan Government Five Year Bond 0.300% 20-Sep-2015 Japan Government Two Year Bond 0.100% 15-Sep-2015 Japan Government Two Year Bond 0.100% 15-Apr-2016 Kommuninvest I Sverige AB 0.875% 13-Dec-2016 Mexican Bonos 5.000% 15-Jun-2017 Mexican Bonos 8.500% 13-Dec-2018 Netherlands Government Bond 0.500% 15-Apr-2017 New Zealand Government Bond 6.000% 15-Dec-2017 Poland Government Bond 5.250% 25-Oct-2017 Poland Government Bond 5.500% 25-Oct-2019 Province of New Brunswick Canada floating rate 01-Aug-2019 Singapore Government Bond 2.500% 01-Jun-2019 Spain Government Bond 2.750% 30-Apr-2019 Spain Government Bond 3.800% 31-Jan-2017 State of North Rhine-Westphalia floating rate 28-Apr-2017 Sweden Government Bond 3.000% 12-Jul-2016 United Kingdom Gilt 1.000% 07-Sep-2017 United Kingdom Gilt 1.250% 22-Jul-2018 United States Treasury Note/Bond 0.375% 31-Oct-2016 United States Treasury Note/Bond 0.500% 31-Jan-2017 United States Treasury Note/Bond 0.625% 15-Dec-2016(1) United States Treasury Note/Bond 0.625% 31-May-2017 United States Treasury Note/Bond 0.875% 15-Jul-2017 United States Treasury Note/Bond 0.875% 15-Nov-2017 United States Treasury Note/Bond 1.000% 15-Sep-2017 United States Treasury Note/Bond 1.000% 15-Feb-2018 United States Treasury Note/Bond 1.125% 15-Jun-2018 United States Treasury Note/Bond 1.375% 30-Jun-2018 % of net assets 99.60 Options on futures (2014: 0.01%) Call Option: US Treasury Note 5 Year (CBT) Future (Strike Price: 121) Put Option: Eurodollar 1 Year Curve (CME) (Strike Price: 98) Put Option: Eurodollar 1 Year Midcurve (CME) (Strike Price: 98) Put Option: US Treasury Note 5 Year (CBT) Future (Strike Price: 118) Expiration date Broker 24,056 0.01 21-Aug-2015 RJO Associates 4,117 0.00 11-Mar-2016 RJO Associates 11,550 0.01 11-Dec-2015 Goldman Sachs 6,131 0.00 21-Aug-2015 RJO Associates 2,258 0.00 Futures contracts (2014: 0.02%) 90 Day Euro (CME) Future Exp 14-Dec-2015 90 Day Euro (CME) Future Exp 19-Dec-2016 US Treasury Note 2 Year (CBT) Future Exp 30-Sep-2015 Notional (USD) Broker 11,675 0.01 15,908,850 UBS 5,550 0.01 (15,784,050) UBS 3,250 0.00 1,748,625 JPMorgan Chase 2,875 0.00 1,020,034 0.55 185,370,083 100.17 Unrealised gain on forward foreign exchange contracts (Appendix) (2014: 1.02%) Financial assets at fair value through profit or loss 62 . PAYDEN GLOBAL FUNDS PUBLIC LIMITED COMPANY SCHEDULE OF INVESTMENTS (continued) Payden Global Short Bond Fund* (continued) As at 30 June 2015 Holding Name of securities Fair value USD Notional (USD) Broker (602) 0.00 (1,311,234) Goldman Sachs (602) 0.00 Unrealised loss on forward foreign exchange contracts (Appendix) (2014: (2.03%)) (1,703,768) (0.92) Financial liabilities at fair value through profit or loss (11) Futures contracts (2014: (0.04%)) US Treasury Note 5 year (CBT) Future Exp 30-Sep-2015 % of net assets (1,704,370) (0.92) 1,384,359 0.75 185,050,072 100.00 Net current assets Total net assets (1) The nominal value of 823,000 is held as collateral with Barclays for open forward currency contracts. The nominal value of 80,000 is held as collateral with Goldman Sachs for open future contracts. Appendix: forward foreign currency contracts Unrealised gain on forward foreign currency contracts Currency Counter Party Purchase Payden Global Short Bond Fund* Royal Bank of Scotland USD Royal Bank of Canada USD State Street USD State Street USD State Street USD Citibank USD Citibank USD Citibank USD Citibank USD Citibank USD HSBC Securities USD Barclays JPY Royal Bank of Canada USD Royal Bank of Scotland EUR Royal Bank of Scotland USD Royal Bank of Scotland GBP HSBC Securities USD HSBC Securities USD HSBC Securities USD Credit Suisse USD Credit Suisse USD Credit Suisse JPY Credit Suisse USD Credit Suisse USD Credit Suisse USD Credit Suisse USD UBS USD UBS USD UBS USD Barclays INR Barclays INR Barclays INR Barclays INR Barclays INR Credit Suisse USD Credit Suisse USD Barclays USD Barclays USD Barclays USD Purchase Amount Currency Sale Sale Amount Maturity date Unrealised Gain/Loss USD 3,437,846 3,668,613 14,875,503 2,250,898 559,011 13,860,668 2,683,571 795,489 792,095 3,311,294 1,721,763 700,000 1,904,738 752,000 853,242 541,000 135,875 172,462 229,289 1,502,340 236,558 187,200,000 803,456 148,271 180,812 122,757 1,020,488 236,796 229,361 13,600,000 15,570,000 61,550,000 10,330,000 10,900,000 1,283,165 868,245 521,881 233,506 920,871 AUD CAD EUR EUR EUR EUR EUR EUR EUR EUR GBP USD NZD USD EUR USD EUR EUR EUR AUD AUD USD JPY JPY JPY JPY EUR EUR EUR USD USD USD USD USD MXN MXN SGD SGD PLN (4,424,000) (4,571,000) (13,193,000) (2,000,000) (499,000) (12,292,000) (2,380,000) (703,000) (700,000) (2,913,000) (1,089,000) (5,716) (2,670,000) (804,331) (752,000) (824,787) (121,000) (153,000) (201,000) (1,938,000) (303,000) (1,506,513) (96,700,000) (17,700,000) (21,900,000) (14,900,000) (908,000) (210,000) (201,000) (209,958) (241,920) (940,988) (159,524) (168,002) (19,490,000) (13,550,000) (698,000) (314,000) (3,404,000) 09-Jul-2015 09-Jul-2015 09-Jul-2015 09-Jul-2015 09-Jul-2015 09-Jul-2015 09-Jul-2015 09-Jul-2015 09-Jul-2015 09-Jul-2015 09-Jul-2015 09-Jul-2015 09-Jul-2015 17-Jul-2015 17-Jul-2015 17-Jul-2015 23-Jul-2015 23-Jul-2015 23-Jul-2015 31-Jul-2015 31-Jul-2015 31-Jul-2015 31-Jul-2015 31-Jul-2015 31-Jul-2015 31-Jul-2015 17-Aug-2015 17-Aug-2015 17-Aug-2015 17-Aug-2015 17-Aug-2015 17-Aug-2015 17-Aug-2015 17-Aug-2015 19-Aug-2015 19-Aug-2015 20-Aug-2015 20-Aug-2015 26-Aug-2015 38,932 7,639 174,537 22,297 2,975 163,687 31,536 12,136 12,084 65,337 9,176 5 100,125 33,716 15,195 25,954 1,018 1,941 5,271 15,368 4,074 23,887 12,914 3,570 1,775 947 8,143 2,664 5,263 1,621 306 16,559 1,182 1,571 45,455 7,753 3,895 486 17,162 63 . PAYDEN GLOBAL FUNDS PUBLIC LIMITED COMPANY SCHEDULE OF INVESTMENTS (continued) Payden Global Short Bond Fund* (continued) As at 30 June 2015 Appendix: forward foreign currency contracts (continued) Unrealised gain on forward foreign currency contracts (continued) Currency Counter Party Purchase Payden Global Short Bond Fund* (continued) Royal Bank of Canada USD Royal Bank of Canada USD Norwegian Krone Class (Accumulating) Barclays NOK Purchase Amount Currency Sale Sale Amount Maturity date Unrealised Gain/Loss USD 1,524,757 191,594 CAD CAD (1,900,000) (234,000) 14-Sep-2015 14-Sep-2015 4,406 4,351 75,000,000 USD (9,418,916) 06-Jul-2015 113,121 1,020,034 Purchase Amount Currency Sale Sale Amount Maturity date Unrealised Gain/Loss USD 5,000 1,898,292 77,000 10,000 9,355,192 1,396,611 5,665,711 1,208,157 1,794,367 1,256,329 73,000 6,000 379,543 802,446 814,441 150,004 188,676 290,163 117,824 128,023 1,100,000 23,340,000 10,440,000 1,530,814 USD EUR USD USD GBP GBP JPY JPY JPY NOK USD USD SEK GBP EUR EUR EUR JPY EUR EUR USD USD USD SGD (4,037) (1,707,000) (86,619) (15,734) (6,100,000) (900,000) (703,500,000) (150,000,000) (220,000,000) (10,020,000) (50,117) (731) (3,151,000) (541,000) (758,000) (135,000) (173,000) (36,000,000) (106,000) (116,000) (69,888) (521,797) (232,517) (2,070,000) 09-Jul-2015 09-Jul-2015 09-Jul-2015 09-Jul-2015 09-Jul-2015 09-Jul-2015 09-Jul-2015 09-Jul-2015 09-Jul-2015 09-Jul-2015 09-Jul-2015 09-Jul-2015 09-Jul-2015 17-Jul-2015 23-Jul-2015 23-Jul-2015 23-Jul-2015 31-Jul-2015 17-Aug-2015 17-Aug-2015 19-Aug-2015 20-Aug-2015 20-Aug-2015 28-Aug-2015 (32) (3,819) (818) (8) (237,813) (18,750) (83,933) (17,780) (3,674) (17,066) (777) (8) (258) (48,295) (30,363) (456) (4,136) (4,144) (357) (1,307) (33) (5,589) (1,616) (5,152) 748,742,000 50,000,000 10,000,000 134,000,000 11,605,000 13,000,000 50,000,000 20,000,000 10,500,000 USD USD USD USD USD USD USD USD USD (95,899,738) (6,406,265) (1,274,595) (17,300,413) (1,498,735) (1,654,953) (6,477,540) (2,544,465) (1,335,761) 06-Jul-2015 06-Jul-2015 06-Jul-2015 06-Jul-2015 06-Jul-2015 06-Jul-2015 06-Jul-2015 06-Jul-2015 06-Jul-2015 (739,255) (51,574) (3,657) (269,840) (23,812) (2,733) (122,849) (2,588) (1,276) (1,703,768) Unrealised loss on forward foreign currency contracts Currency Counter Party Purchase Payden Global Short Bond Fund* Royal Bank of Canada CAD State Street USD Citibank EUR HSBC Securities GBP HSBC Securities USD HSBC Securities USD Barclays USD Barclays USD Barclays USD Royal Bank of Canada USD Royal Bank of Canada NZD Royal Bank of Scotland SEK Royal Bank of Scotland USD Royal Bank of Scotland USD HSBC Securities USD HSBC Securities USD HSBC Securities USD Credit Suisse USD UBS USD UBS USD Credit Suisse MXN HSBC Securities PHP HSBC Securities PHP Chase Manhattan Bank USD Norwegian Krone Class (Accumulating) Barclays NOK Barclays NOK Barclays NOK Barclays NOK Barclays NOK Barclays NOK Barclays NOK Barclays NOK Barclays NOK Portfolio Analysis % of total assets Transferable securities and money market instruments admitted to an official stock exchange listing or traded on a regulated market Financial derivative instruments dealt in on a regulated market OTC financial derivative instruments Analysis as a percentage of total assets rather than net assets is required under the UCITS Notice 8.5 appendix A. * This Fund changed name from Payden International Short Bond Fund on 24 March 2015. 64 96.70 0.02 (0.36) 96.36 . PAYDEN GLOBAL FUNDS PUBLIC LIMITED COMPANY SCHEDULE OF INVESTMENTS (continued) Payden Sterling Corporate Bond Fund - Investment Grade As at 30 June 2015 Holding Name of securities Fair value GBP % of net assets 200,000 150,000 300,000 250,000 Basic Materials Anglo American Capital PLC 6.875% 01-May-2018 BASF SE 1.375% 15-Dec-2017 Glencore Finance Europe SA 6.500% 27-Feb-2019 Linde Finance BV floating rate 14-Jul-2066 979,695 224,226 150,580 339,156 265,733 5.57 1.27 0.86 1.93 1.51 300,000 300,000 250,000 200,000 300,000 251,000 250,000 250,000 Communications AT&T Inc 5.875% 28-Apr-2017 British Telecommunications PLC 8.500% 07-Dec-2016 Deutsche Telekom International Finance BV 6.500% 08-Apr-2022 Sky PLC 6.000% 21-May-2027 Telecom Italia SpA 5.625% 29-Dec-2015 Verizon Communications Inc 4.073% 18-Jun-2024 Vodafone Group PLC 5.375% 05-Dec-2017 WPP PLC 6.000% 04-Apr-2017 2,303,164 321,769 329,409 304,744 241,944 305,209 261,315 269,758 269,016 13.11 1.83 1.87 1.73 1.38 1.74 1.49 1.54 1.53 200,000 100,000 250,000 320,000 175,000 150,000 250,000 200,000 Consumer, Cyclical BMW US Capital LLC 2.000% 20-Nov-2019 Daimler AG 1.625% 02-Dec-2016 Daimler International Finance BV 3.500% 06-Jun-2019 FCE Bank PLC 4.825% 15-Feb-2017 InterContinental Hotels Group PLC 6.000% 09-Dec-2016 PACCAR Financial Europe BV 1.513% 29-May-2018 RCI Banque SA 2.125% 06-Oct-2017 Volkswagen Financial Services NV 2.750% 02-Oct-2020 1,691,113 199,787 100,476 264,559 335,493 185,601 149,940 250,144 205,113 9.62 1.14 0.57 1.50 1.91 1.06 0.85 1.42 1.17 300,000 250,000 250,000 250,000 250,000 250,000 Consumer, Non-cyclical BAT Netherlands Finance BV 5.500% 15-Sep-2016 BUPA Finance PLC 5.000% 25-Apr-2023 Carlsberg Breweries A/S 7.250% 28-Nov-2016 Imperial Tobacco Finance PLC 7.750% 24-Jun-2019 Mondelez International Inc 7.250% 18-Jul-2018 Rentokil Initial PLC 5.750% 31-Mar-2016 1,683,560 314,956 253,591 269,181 298,542 289,378 257,912 9.58 1.79 1.44 1.53 1.70 1.65 1.47 300,000 Diversified Hutchison Whampoa Finance UK PLC 5.625% 24-Nov-2017 326,835 326,835 1.86 1.86 250,000 350,000 Energy Petroleos Mexicanos 8.250% 02-Jun-2022 Total Capital International SA 2.250% 09-Jun-2022 662,472 316,922 345,550 3.77 1.80 1.97 5,188,744 243,090 216,340 200,464 325,308 29.53 1.38 1.23 1.14 1.85 266,056 353,992 247,583 350,099 217,178 200,098 189,643 325,374 246,471 293,133 245,991 144,789 292,991 163,891 1.52 2.02 1.41 1.99 1.24 1.14 1.08 1.85 1.40 1.67 1.40 0.82 1.67 0.93 250,000 200,000 200,000 250,000 260,000 350,000 200,000 300,000 200,000 200,000 180,000 300,000 250,000 300,000 250,000 150,000 300,000 162,000 Financial Abbey National Treasury Services PLC/London 1.875% 17-Feb-2020 Aviva PLC floating rate 14-Nov-2036 Banque Federative du Credit Mutuel SA floating rate 16-May-2016 Barclays Bank PLC 10.000% 21-May-2021 Cooperatieve Centrale Raiffeisen-Boerenleenbank BA/Netherlands 4.625% 23-May-2029 Digital Stout Holding LLC 4.250% 17-Jan-2025 Direct Line Insurance Group PLC floating rate 27-Apr-2042 Fidelity International Ltd 6.750% 19-Oct-2020 GE Capital UK Funding 4.375% 31-Jul-2019 GE Capital UK Funding floating rate 16-Jan-2018 Goldman Sachs Group Inc 4.250% 29-Jan-2026 HSBC Bank PLC floating rate 04-Nov-2030 JPMorgan Chase & Co floating rate 30-May-2017 Lloyds Bank PLC 2.500% 01-Jun-2022 National Australia Bank Ltd 1.875% 20-Feb-2020 Nationwide Building Society 2.250% 29-Apr-2022 Nordea Bank AB 2.375% 02-Jun-2022 QBE Insurance Group Ltd 6.125% 28-Sep-2015 65 . PAYDEN GLOBAL FUNDS PUBLIC LIMITED COMPANY SCHEDULE OF INVESTMENTS (continued) Payden Sterling Corporate Bond Fund - Investment Grade (continued) As at 30 June 2015 Holding Name of securities Fair value GBP % of net assets 200,000 200,000 270,000 Financial (continued) Society of Lloyd's 4.750% 30-Oct-2024 Suncorp-Metway Ltd floating rate 06-Oct-2017 Virgin Money PLC 2.250% 21-Apr-2020 202,101 200,252 263,900 1.15 1.14 1.50 500,000 150,000 Government United Kingdom Gilt 1.250% 22-Jul-2018 United Kingdom Gilt 1.750% 07-Sep-2022 652,970 503,600 149,370 3.72 2.87 0.85 200,000 250,000 300,000 600,000 200,000 124,000 290,000 210,000 Industrial Cie de Saint-Gobain 5.625% 15-Nov-2024 Firstgroup PLC 8.750% 08-Apr-2021 Gatwick Funding Ltd 5.250% 23-Jan-2024 Heathrow Funding Ltd 6.250% 10-Sep-2018 National Express Group PLC 6.250% 13-Jan-2017 PostNL NV 7.500% 14-Aug-2018 Rolls-Royce PLC 3.375% 18-Jun-2026 Textron Inc 6.625% 07-Apr-2020 2,452,892 234,093 314,049 339,106 672,090 212,971 143,986 295,875 240,722 13.96 1.33 1.79 1.93 3.83 1.21 0.82 1.68 1.37 350,000 Technology International Business Machines Corp 2.750% 21-Dec-2020 360,087 360,087 2.05 2.05 250,000 250,000 300,000 Utilities Centrica PLC 7.000% 19-Sep-2018 Southern Gas Networks PLC 4.875% 05-Oct-2023 United Utilities Water Ltd 6.125% 29-Dec-2015 878,378 289,279 282,038 307,061 5.00 1.65 1.60 1.75 Total value of investment in securities (2014: 96.28%) 17,179,910 97.77 Financial assets at fair value through profit or loss 17,179,910 97.77 6 Futures contracts (2014: 0.11%) Long Gilt (LIFFE) Future Exp 28-Sep-2015 Notional (GBP) Broker (9,240) (0.05) 703,620 Goldman Sachs (9,240) (0.05) (9,240) (0.05) 400,543 2.28 17,571,213 100.00 Financial liabilities at fair value through profit or loss Net current assets Total net assets Portfolio Analysis % of total assets Transferable securities and money market instruments admitted to an official stock exchange listing or traded on a regulated market Financial derivative instruments dealt in on a regulated market Analysis of total assets rather than net assets is required under the UCITS Notice 8.5 appendix A. 66 97.53 (0.05) 97.48 . PAYDEN GLOBAL FUNDS PUBLIC LIMITED COMPANY SCHEDULE OF INVESTMENTS (continued) Payden Sterling Reserve Fund As at 30 June 2015 Holding Name of securities Fair value GBP % of net assets Asset-backed securities Delamare Cards floating rate 19-May-2019 Driver UK 2 SA floating rate 25-Jan-2023 E-Carat 4 PLC floating rate 18-Sep-2022 E-Carat 5 PLC 0.907% 18-Apr-2023 E-Carat PLC floating rate 18-Mar-2022 Gracechurch Card Funding PLC floating rate 15-Jan-2018 Motor 2013-1 PLC floating rate 25-Feb-2021 Motor 2015-1 PLC floating rate 25-Jun-2022 Penarth Master Issuer PLC floating rate 18-Mar-2021 37,605,738 6,280,243 5,818,117 1,972,318 2,854,790 1,669,801 5,860,236 1,583,564 5,003,012 6,563,657 13.48 2.25 2.09 0.71 1.02 0.60 2.10 0.57 1.79 2.35 70,554,908 5,213,182 25.30 1.87 4,024,060 4,999,000 5,473,712 3,013,720 1.44 1.79 1.96 1.08 2,500,000 2,750,000 3,000,000 2,000,000 4,300,000 4,000,000 5,400,000 5,550,000 4,000,000 5,500,000 4,000,000 4,500,000 Corporate bonds Bank Nederlandse Gemeenten NV floating rate 03-Apr-2018 Cooperatieve Centrale Raiffeisen-Boerenleenbank BA/Netherlands 4.000% 10-Sep-2015 Credit Suisse AG/London floating rate 21-Jan-2016 FMS Wertmanagement AoeR 1.000% 10-Apr-2018 Landeskreditbank Baden-Wuerttemberg Foerderbank 1.250% 15-Dec-2016 Landeskreditbank Baden-Wuerttemberg Foerderbank floating rate 18-Jul-2017 National Australia Bank Ltd 1.875% 20-Feb-2020 Nederlandse Waterschapsbank NV floating rate 09-Apr-2018 Network Rail Infrastructure Finance PLC 1.125% 15-Dec-2016 Nordea Bank AB 3.875% 15-Dec-2015 Pohjola Bank OYJ floating rate 21-May-2018 Prudential PLC 1.250% 16-Nov-2015 Royal Bank of Canada floating rate 04-Jun-2019 Shell International Finance BV 2.000% 20-Dec-2019 Toronto-Dominion Bank floating rate 19-Jan-2018 Total Capital International SA 0.877% 01-Jul-2019 Toyota Motor Credit Corp 4.000% 07-Dec-2017 2,506,175 2,705,902 3,007,305 2,010,477 4,356,588 4,001,840 5,403,564 5,553,108 4,005,928 5,500,825 3,995,700 4,783,822 0.90 0.97 1.08 0.72 1.56 1.44 1.94 1.99 1.44 1.97 1.43 1.72 5,100,000 4,000,000 4,000,000 4,000,000 4,250,000 3,250,000 5,500,000 3,600,000 4,500,000 3,300,000 3,500,000 2,500,000 4,500,000 4,000,000 5,000,000 2,000,000 3,350,000 5,500,000 2,000,000 3,350,000 2,000,000 5,000,000 2,000,000 4,000,000 5,500,000 5,550,000 Covered bonds Abbey National Treasury Services PLC/London floating rate 20-Jan-2017 ANZ New Zealand Int'l Ltd/London 1.500% 17-Dec-2015 ASB Finance Ltd/London floating rate 01-May-2018 Bank of Montreal floating rate 29-Jan-2018 Bank of Nova Scotia floating rate 02-Nov-2017 Bank of Scotland PLC 4.875% 08-Nov-2016 Barclays Bank PLC floating rate 15-Sep-2017 BNZ International Funding Ltd/London floating rate 29-Jan-2016 Canadian Imperial Bank of Commerce/Canada floating rate 15-Jan-2018 Commonwealth Bank of Australia floating rate 24-Jan-2018 Coventry Building Society 4.625% 19-Apr-2018 Coventry Building Society floating rate 17-Mar-2020 Danske Bank A/S floating rate 15-Sep-2017 Dexia Credit Local SA floating rate 15-Apr-2016 DNB Boligkreditt AS floating rate 17-Feb-2020 GE Capital UK Funding 4.625% 18-Jan-2016 GE Capital UK Funding floating rate 16-Jan-2018 Leeds Building Society floating rate 09-Feb-2018 Lloyds Bank PLC floating rate 19-Jan-2018 Nationwide Building Society floating rate 17-Jul-2017 Nationwide Building Society floating rate 27-Apr-2018 Swedbank Hypotek AB floating rate 02-Apr-2018 Total Capital SA 4.250% 08-Dec-2017 Volkswagen Financial Services NV 2.000% 23-Oct-2015 Westpac Securities NZ Ltd floating rate 03-Oct-2017 Yorkshire Building Society floating rate 23-Mar-2016 102,037,563 5,108,772 4,010,520 3,991,020 4,000,620 4,251,934 3,420,365 5,502,750 3,611,556 4,500,945 3,307,441 3,820,018 2,502,250 4,506,660 4,001,540 4,994,650 2,038,590 3,351,642 5,503,025 2,000,810 3,352,479 2,000,770 5,001,800 2,133,918 4,011,560 5,501,045 5,610,883 36.59 1.83 1.44 1.43 1.43 1.52 1.23 1.97 1.30 1.61 1.19 1.37 0.90 1.62 1.44 1.79 0.73 1.20 1.97 0.72 1.20 0.72 1.79 0.77 1.44 1.97 2.01 6,300,000 5,811,278 1,971,288 2,852,115 1,668,354 5,835,000 1,582,585 5,000,000 6,550,000 5,200,000 4,000,000 5,000,000 5,500,000 3,000,000 67 . PAYDEN GLOBAL FUNDS PUBLIC LIMITED COMPANY SCHEDULE OF INVESTMENTS (continued) Payden Sterling Reserve Fund (continued) As at 30 June 2015 Holding Fair value GBP % of net assets Government and government related bonds African Development Bank 1.125% 15-Dec-2016 Caisse d'Amortissement de la Dette Sociale 1.000% 07-Mar-2018 Caisse des Depots et Consignations 1.500% 12-Jun-2017 Export Development Canada 0.875% 07-Dec-2016 Kingdom of Belgium 5.000% 24-Apr-2018 Kommunalbanken AS 1.125% 15-Dec-2016 Kommunekredit 1.125% 07-Dec-2018 Municipality Finance PLC 1.250% 15-Dec-2016 SNCF Reseau 2.375% 23-Dec-2015 Transport for London 1.250% 21-Nov-2017 United Kingdom Gilt 1.000% 07-Sep-2017 United Kingdom Gilt 1.750% 22-Jan-2017 United Kingdom Treasury Bill 0.000% 20-Jul-2015 United Kingdom Treasury Bill 0.000% 01-Sep-2015 United Kingdom Treasury Bill 0.000% 14-Sep-2015 United Kingdom Treasury Bill 0.000% 12-Oct-2015 67,207,905 4,518,435 3,481,947 1,311,921 3,003,067 6,103,639 5,018,308 4,669,685 5,027,350 3,022,245 4,010,045 4,022,800 2,036,600 5,998,608 4,496,287 4,994,970 5,491,998 24.10 1.62 1.25 0.47 1.08 2.19 1.80 1.68 1.80 1.08 1.44 1.44 0.73 2.15 1.61 1.79 1.97 Total value of investment in securities (2014: 99.43%) 277,406,114 99.47 Financial assets at fair value through profit or loss 4,500,000 3,500,000 1,300,000 3,000,000 5,500,000 5,000,000 4,700,000 5,000,000 3,000,000 4,000,000 4,000,000 2,000,000 6,000,000 4,500,000 5,000,000 5,500,000 Name of securities 277,406,114 99.47 1,484,205 0.53 278,890,319 100.00 Net current assets Total net assets Portfolio Analysis % of total assets Transferable securities and money market instruments admitted to an official stock exchange listing or traded on a regulated market Analysis as a percentage of total assets rather than net assets is required under the UCITS Notice 8.5 appendix A. 68 98.77 98.77 . PAYDEN GLOBAL FUNDS PUBLIC LIMITED COMPANY SCHEDULE OF INVESTMENTS (continued) Payden US Core Bond Fund As at 30 June 2015 Holding Name of securities Fair value USD % of net assets 2,005,932 150,028 99,196 322,092 338,008 11.99 0.90 0.59 1.93 2.02 2,262 98,564 119,479 297,200 102,625 323,568 99,810 0.01 0.59 0.71 1.78 0.61 1.93 0.60 54,593 Asset-backed securities Ally Master Owner Trust floating rate 15-Jan-2019 Colony American Homes 2015-1 floating rate 17-Jul-2032 Dryden XXVIII Senior Loan Fund 1.374% 15-Aug-2025 Fannie Mae-Aces floating rate 25-Nov-2018 FHLMC Multifamily Structured Pass Through Certificates floating rate 25-Apr-2019 Hilton USA Trust 2013-HLF floating rate 05-Nov-2030 Hilton USA Trust 2013-HLT 2.662% 05-Nov-2030 Invitation Homes 2014-SFR1 Trust 1.185% 17-Jun-2031 NCUA Guaranteed Notes Trust 2010-R2 floating rate 06-Nov-2017 NCUA Guaranteed Notes Trust 2010-R3 floating rate 08-Dec-2020 SLM Student Loan Trust 2014-1 floating rate 26-Jul-2021 Structured Asset Mortgage Investments II Trust 2003-AR4 floating rate 19-Jan-2034 53,100 0.32 90,000 75,000 80,000 100,000 60,000 110,000 100,000 75,000 145,000 145,000 90,000 40,000 60,000 30,000 200,000 200,000 90,000 146,464 120,000 70,000 85,000 55,000 40,000 55,000 110,000 190,000 130,000 50,000 120,000 50,000 60,000 50,000 135,000 65,000 75,000 30,000 35,000 60,000 45,000 140,000 90,000 100,000 125,000 50,000 Corporate bonds AbbVie Inc 3.600% 14-May-2025 Air Canada 2015-1 Class A Pass Through Trust 3.600% 15-Mar-2027 Air Lease Corp 5.625% 01-Apr-2017 Amazon.com Inc 3.300% 05-Dec-2021 Anthem Inc 2.375% 15-Feb-2017 AT&T Inc 4.750% 15-May-2046 Banco del Estado de Chile 4.125% 07-Oct-2020 Bank of America Corp 4.200% 26-Aug-2024 Bank of America Corp 6.875% 25-Apr-2018 Bear Stearns Cos LLC 5.550% 22-Jan-2017 Blue Cross & Blue Shield of Minnesota 3.790% 01-May-2025 Boston Scientific Corp 2.850% 15-May-2020 CenturyLink Inc 5.800% 15-Mar-2022 Citigroup Inc floating rate 15-May-2018 Citizens Financial Group Inc 4.150% 28-Sep-2022 Credit Agricole SA/London floating rate 15-Apr-2016 CSX Corp 3.950% 01-May-2050 CVS Pass-Through Trust Series 2014 4.163% 11-Aug-2036 Dignity Health 3.125% 01-Nov-2022 Dignity Health 4.500% 01-Nov-2042 Dow Chemical Co 9.400% 15-May-2039 Exelon Generation Co LLC 6.200% 01-Oct-2017 FS Investment Corp 4.250% 15-Jan-2020 Goldman Sachs Group Inc floating rate 30-Apr-2018 Goldman Sachs Group Inc/The 6.750% 01-Oct-2037 Health Care REIT Inc 4.125% 01-Apr-2019 Heathrow Funding Ltd 4.875% 15-Jul-2021 Hyundai Capital America 2.600% 19-Mar-2020 JPMorgan Chase & Co floating rate 25-Jan-2018 Lam Research Corp 3.800% 15-Mar-2025 Latam Airlines 2015-1 Pass Through Trust A 4.200% 15-Nov-2027 Massachusetts Mutual Life Insurance Co 4.500% 15-Apr-2065 McGraw Hill Financial Inc 5.900% 15-Nov-2017 Medtronic Inc 3.150% 15-Mar-2022 MetLife Inc 6.400% 15-Dec-2036 MetLife Inc 10.750% 01-Aug-2039 Morgan Stanley floating rate 25-Feb-2016 Morgan Stanley floating rate 24-Jan-2019 Nationwide Mutual Insurance Co 9.375% 15-Aug-2039 North Shore-Long Island Jewish Health Care Inc 6.150% 01-Nov-2043 Old Republic International Corp 4.875% 01-Oct-2024 Oracle Corp 2.500% 15-May-2022 Orange SA 9.000% 01-Mar-2031 Pacific Life Insurance Co 9.250% 15-Jun-2039 5,914,193 89,139 75,216 85,000 101,460 61,049 100,483 106,193 74,960 163,910 153,867 88,606 39,763 57,525 30,807 204,550 201,288 79,114 144,718 117,901 65,123 128,310 60,165 40,474 55,619 129,421 201,276 142,607 50,072 120,866 48,763 59,475 44,525 147,545 65,350 82,500 48,675 35,195 60,030 67,756 162,624 93,454 97,192 176,805 74,892 35.34 0.53 0.45 0.51 0.61 0.37 0.60 0.63 0.45 0.98 0.92 0.53 0.24 0.34 0.18 1.22 1.20 0.47 0.87 0.70 0.39 0.77 0.36 0.24 0.33 0.77 1.20 0.85 0.30 0.72 0.29 0.36 0.27 0.88 0.39 0.49 0.29 0.21 0.36 0.41 0.97 0.56 0.58 1.06 0.45 150,000 100,000 325,000 330,000 2,271 98,547 120,000 300,000 102,421 321,122 100,000 69 . PAYDEN GLOBAL FUNDS PUBLIC LIMITED COMPANY SCHEDULE OF INVESTMENTS (continued) Payden US Core Bond Fund (continued) As at 30 June 2015 Holding Name of securities Fair value USD % of net assets 75,000 90,000 75,000 110,000 50,000 70,000 100,000 80,000 55,000 110,000 110,000 80,000 50,000 50,000 105,000 120,000 155,000 90,000 Corporate bonds (continued) Penske Truck Leasing Co LP / PTL Finance Corp. 3.050% 09-Jan-2020 Penske Truck Leasing Co LP / PTL Finance Corp. 3.375% 01-Feb-2022 Pfizer Inc 7.200% 15-Mar-2039 Prudential Financial Inc floating rate 15-Jun-2043 Quest Diagnostics Inc 3.500% 30-Mar-2025 Ryder System Inc 2.500% 11-May-2020 Santander Holdings USA Inc/PA 2.650% 17-Apr-2020 Scotiabank Peru SAA floating rate 13-Dec-2027 Select Income REIT 4.500% 01-Feb-2025 Senior Housing Properties Trust 4.750% 01-May-2024 Suncorp-Metway Ltd 2.350% 27-Apr-2020 Sydney Airport Finance Co. Pty Ltd 3.375% 30-Apr-2025 Synchrony Financial 3.000% 15-Aug-2019 TD Ameritrade Holding Corp 2.950% 01-Apr-2022 Teachers Insurance & Annuity Association of America 6.850% 16-Dec-2039 Transatlantic Holdings Inc 8.000% 30-Nov-2039 Verizon Communications Inc 6.400% 15-Sep-2033 Wyndham Worldwide Corp 2.500% 01-Mar-2018 75,413 87,368 103,651 114,290 47,545 69,566 98,420 78,800 53,246 110,696 107,871 77,128 50,403 49,620 131,735 155,771 178,120 90,287 0.45 0.52 0.62 0.68 0.28 0.42 0.59 0.47 0.32 0.66 0.65 0.46 0.30 0.30 0.79 0.93 1.06 0.54 2,280,766 89,280 177,139 118,906 100,683 50,046 142,659 51,240 52,570 13.63 0.53 1.06 0.71 0.60 0.30 0.85 0.31 0.31 101,000 125,000 210,000 100,000 60,000 70,000 70,000 85,000 200,000 200,000 55,000 130,000 70,000 Covered bonds Actavis Funding SCS 3.450% 15-Mar-2022 Actavis Funding SCS floating rate 12-Mar-2020 ARC Properties Operating Partnership LP 3.000% 06-Feb-2019 BAT International Finance PLC 2.750% 15-Jun-2020 Baxalta Inc 3.600% 23-Jun-2022 BioMed Realty LP 3.850% 15-Apr-2016 ERAC USA Finance LLC 2.750% 15-Mar-2017 FedEx Corp 4.500% 01-Feb-2065 Freeport-McMoran Oil & Gas LLC / FCX Oil & Gas Inc 6.500% 15-Nov-2020 Glencore Finance Canada Ltd 4.250% 25-Oct-2022 Glencore Funding LLC floating rate 27-May-2016 HJ Heinz Co 3.500% 15-Jul-2022 Kinder Morgan Inc/DE 5.300% 01-Dec-2034 MDC Holdings Inc 6.000% 15-Jan-2043 Noble Holding International Ltd 3.450% 01-Aug-2015 Reynolds American Inc 4.000% 12-Jun-2022 Sinopec Capital 2013 Ltd 1.875% 24-Apr-2018 SpareBank 1 Boligkreditt AS 2.625% 27-May-2016 Valero Energy Corp 6.625% 15-Jun-2037 Wesfarmers Ltd 1.874% 20-Mar-2018 Westvaco Corp 7.950% 15-Feb-2031 107,060 123,017 210,603 100,386 55,945 59,150 70,072 86,956 198,588 203,605 62,306 130,317 90,238 0.64 0.74 1.26 0.60 0.33 0.35 0.42 0.52 1.19 1.22 0.37 0.78 0.54 540,000 30,000 140,000 1,170,000 265,000 62,000 100,000 100,000 88,000 110,000 145,000 100,000 300,000 360,000 770,000 370,000 Government bonds Federal Farm Credit Banks floating rate 17-Jan-2018 Federal Farm Credit Banks floating rate 22-Mar-2018 Federal National Mortgage Association 1.500% 22-Jun-2020 Mexican Bonos 10.000% 05-Dec-2024 Mexico Government International Bond 3.625% 15-Mar-2022 Mexico Government International Bond 5.550% 21-Jan-2045 Panama Government International Bond 5.200% 30-Jan-2020 Philippine Government International Bond 4.000% 15-Jan-2021 Poland Government International Bond 5.125% 21-Apr-2021 State Board of Administration Finance Corp 2.107% 01-Jul-2018 State of California 7.550% 01-Apr-2039 Tennessee Valley Authority 2.875% 15-Sep-2024 United States Treasury Bill 0.055% 17-Dec-2015 United States Treasury Floating Rate Note 31-Jan-2017 United States Treasury Note/Bond 0.875% 30-Apr-2017 United States Treasury Note/Bond 1.500% 31-May-2020 3,768,003 540,388 30,011 138,439 95,665 268,842 66,185 110,450 108,380 97,847 110,961 209,753 100,590 299,923 360,218 773,970 368,005 22.52 3.23 0.18 0.83 0.57 1.61 0.40 0.66 0.65 0.58 0.66 1.25 0.60 1.79 2.15 4.63 2.20 90,000 175,000 125,000 100,000 50,000 140,000 50,000 60,000 70 .
PAYDEN GLOBAL FUNDS PUBLIC LIMITED COMPANY SCHEDULE OF INVESTMENTS (continued) Payden US Core Bond Fund (continued) As at 30 June 2015 Holding 90,000 370,000 213,954 190,000 161,191 180,828 60,000 134,121 480,000 92,637 230,000 49,164 64,310 87,974 178,583 67,339 28,733 318,198 113,051 43,877 200,000 20,182 140,000 Name of securities Fair value USD 88,376 Total value of investment in securities (2014: 105.34%) (2) Futures contracts (2014: 0.00%) US Treasury Note 10 Year (CBT) Future Exp 21-Sep-2015 21.54 2.29 1.28 1.13 1.00 1.12 0.37 0.85 3.04 0.60 1.49 0.33 0.43 0.58 1.20 0.45 0.19 1.90 0.71 0.28 1.27 0.13 0.90 17,573,630 Mortgage related securities Fannie Mae Pool 3.000% 01-Jul-2030 Fannie Mae Pool 3.000% 01-Oct-2042 Fannie Mae Pool 3.000% 15-Jul-2045 Fannie Mae Pool 3.500% 01-Mar-2042 Fannie Mae Pool 3.500% 01-Sep-2042 Fannie Mae Pool 3.500% 01-Jul-2043 Fannie Mae Pool 4.000% 01-Dec-2041 Fannie Mae Pool 4.000% 01-Jul-2045 Fannie Mae Pool 4.500% 01-Mar-2040 Fannie Mae Pool 4.500% 01-Jul-2045 Fannie Mae Pool 5.000% 01-Jun-2033 Fannie Mae Pool 5.000% 01-Nov-2033 Fannie Mae Pool 5.000% 01-Jul-2035 Fannie Mae Pool 5.500% 01-Apr-2034 Fannie Mae Pool 5.500% 01-May-2034 Fannie Mae Pool 5.500% 01-Apr-2036 Freddie Mac Gold Pool 3.000% 01-Nov-2042 Ginnie Mae I Pool 3.500% 15-Feb-2042 Ginnie Mae I Pool 3.500% 15-Jul-2042 Ginnie Mae I Pool 4.000% 15-Jul-2045 Ginnie Mae II Pool 4.500% 20-Sep-2041 Ginnie Mae II Pool 4.500% 01-Jul-2043 0.53 3,604,736 383,352 214,374 189,306 166,707 186,987 61,838 142,812 508,588 101,011 248,688 54,521 71,368 97,642 201,499 75,994 32,242 317,427 118,515 45,980 212,828 22,076 150,981 Government bonds (continued) United States Treasury Note/Bond 2.125% 15-May-2025 % of net assets 105.02 Notional (USD) Broker 2,391 0.01 (254,734) JPMorgan Chase 2,391 0.01 48,780 0.29 17,624,801 105.32 Unrealised gain on forward foreign exchange contracts (Appendix) (2014: 0.00%) Financial assets at fair value through profit or loss Notional (USD) Broker (3,047) (0.02) (2,843,141) Morgan Stanley (3,047) (0.02) Unrealised loss on forward foreign exchange contracts (Appendix) (2014: 0.00%) (29,290) (0.17) Financial liabilities at fair value through profit or loss (13) Futures contracts (2014: 0.00%) US Treasury Note 2 Year (CBT) Future Exp 30-Sep-2015 (32,337) (0.19) (858,602) (5.13) 16,733,862 100.00 Net current liabilities Total net assets Appendix: forward foreign currency contracts Unrealised gain on forward foreign currency contracts Currency Counter Party Purchase Payden US Core Bond Fund Royal Bank of Scotland EUR Royal Bank of Scotland GBP Purchase Amount Currency Sale Sale Amount Maturity date Unrealised Gain/Loss USD 258,000 186,000 USD USD (275,954) (283,568) 17-Jul-2015 17-Jul-2015 11,567 8,923 71 . PAYDEN GLOBAL FUNDS PUBLIC LIMITED COMPANY SCHEDULE OF INVESTMENTS (continued) Payden US Core Bond Fund (continued) As at 30 June 2015 Appendix: forward foreign currency contracts (continued) Unrealised gain on forward foreign currency contracts (continued) Currency Counter Party Purchase Payden US Core Bond Fund (continued) Royal Bank of Scotland USD Credit Suisse JPY Credit Suisse USD Credit Suisse USD Barclays INR UBS USD Credit Suisse USD Barclays USD Royal Bank of Canada USD Purchase Amount Currency Sale Sale Amount Maturity date Unrealised Gain/Loss USD 292,735 33,200,000 273,646 275,851 14,710,000 275,352 102,706 136,826 274,456 EUR USD AUD JPY USD EUR MXN SGD CAD (258,000) (267,181) (353,000) (33,200,000) (224,889) (245,000) (1,560,000) (183,000) (342,000) 17-Jul-2015 31-Jul-2015 31-Jul-2015 31-Jul-2015 17-Aug-2015 17-Aug-2015 19-Aug-2015 20-Aug-2015 14-Sep-2015 5,213 4,237 2,799 4,434 3,958 2,197 3,638 1,021 793 48,780 Unrealised loss on forward foreign currency contracts Currency Counter Party Purchase Payden US Core Bond Fund Royal Bank of Scotland USD HSBC Securities EUR HSBC Securities USD Credit Suisse AUD UBS EUR Barclays USD HSBC Securities PHP Royal Bank of Canada CAD Purchase Amount Currency Sale Sale Amount Maturity date Unrealised Gain/Loss USD 275,887 31,000 229,934 33,000 25,000 21,908 6,130,000 38,000 GBP USD EUR USD USD INR USD USD (186,000) (35,363) (214,000) (25,764) (28,528) (1,410,000) (137,044) (31,114) 17-Jul-2015 23-Jul-2015 23-Jul-2015 31-Jul-2015 17-Aug-2015 17-Aug-2015 20-Aug-2015 14-Sep-2015 (16,604) (813) (8,572) (444) (654) (28) (1,468) (707) (29,290) Portfolio Analysis % of total assets Transferable securities and money market instruments admitted to an official stock exchange listing or traded on a regulated market Financial derivative instruments dealt in on a regulated market OTC financial derivative instruments Analysis of total assets rather than net assets is required under the UCITS Notice 8.5 appendix A. 72 90.91 0.00 0.10 91.01 . PAYDEN GLOBAL FUNDS PUBLIC LIMITED COMPANY SCHEDULE OF INVESTMENTS (continued) Payden US Dollar Liquidity Fund As at 30 June 2015 Holding Name of securities Fair value USD % of net assets 4,712,549 250,094 151,641 10,552 250,158 210,222 205,176 150,127 199,899 239,785 98,338 25.88 1.37 0.83 0.06 1.37 1.15 1.13 0.83 1.10 1.32 0.54 110,000 38,673 40,090 77,818 99,471 22,239 127,000 200,000 50,000 159,081 300,000 104,356 155,000 212,060 364,775 57,894 250,000 27,174 250,000 100,000 200,000 Asset-backed securities Babson CLO Ltd 2015-I 1.709% 20-Apr-2027 BMW Vehicle Owner Trust 2013-A 0.670% 27-Nov-2017 Capital Auto Receivables Asset Trust 2014-1 0.680% 20-May-2016 Carlyle Global Market Strategies 1.740% 27-Apr-2027 CarMax Auto Owner Trust 2015-1 0.880% 15-Mar-2018 CarMax Auto Owner Trust 2015-2 0.820% 15-Jun-2018 Citibank Credit Card Issuance Trust 0.730% 07-Feb-2018 CNH Equipment Trust 0.840% 15-Aug-2018 CNH Equipment Trust 2015-A 0.840% 15-Jun-2018 Colony American Homes 2014-2 1.137% 17-Jul-2031 Colony American Homes Single-Family Rental Pass-Through Certificates 1.137% 17-Jul-2032 Fannie Mae Connecticut Avenue Securities floating rate 25-Jan-2024 Fannie Mae Connecticut Avenue Securities floating rate 25-May-2024 Fannie Mae Connecticut Avenue Securities floating rate 25-Jul-2024 Fannie Mae Connecticut Avenue Securities floating rate 25-May-2025 Fifth Third Auto Trust 2014-1 0.460% 15-Aug-2016 Ford Credit Auto Lease Trust 2014-A 0.680% 15-Apr-2017 GE Dealer Floorplan Master Note Trust floating rate 20-Apr-2018 GE Equipment Transportation LLC Series 2015-1 0.890% 24-Nov-2017 Honda Auto Receivables 2013-2 Owner Trust 0.530% 16-Feb-2017 Mercedes Benz Auto Lease Trust 2015-A floating rate 15-Feb-2017 Mercedes-Benz Auto Receivables Trust 2012-1 0.780% 15-Aug-2017 MMAF Equipment Finance LLC 2015-A 0.960% 18-Sep-2017 Navient Student Loan Trust 2015-1 floating rate 26-Sep-2022 NCUA Guaranteed Notes Trust 2010-R2 floating rate 05-Nov-2020 Nissan Auto Receivables 2013-A Owner Trust 0.500% 15-May-2017 Octagon Investment Partners 24 Ltd 1.731% 21-May-2027 Santander Drive Auto Receivables Trust 2015-1 0.320% 15-Mar-2016 Symphony CLO XV Ltd 1.720% 17-Oct-2026 USAA Auto Owner Trust 2014-1 0.580% 15-Dec-2017 Volkswagen Auto Lease Trust 2015-A 0.870% 20-Jun-2017 109,571 38,910 39,789 77,780 98,968 22,239 126,990 199,901 50,042 159,088 299,927 104,496 155,116 212,154 366,654 57,880 250,000 27,174 249,776 100,010 200,092 0.60 0.21 0.22 0.43 0.54 0.12 0.70 1.10 0.28 0.87 1.65 0.57 0.85 1.17 2.01 0.32 1.37 0.15 1.37 0.55 1.10 30,000 200,000 200,000 Certificates of Deposit Credit Suisse/New York NY floating rate 24-Aug-2015 Mizuho Bank Ltd 0.260% 19-Aug-2015 Sumitomo Mitsui Banking Corp 0.270% 08-Sep-2015 430,044 30,000 200,026 200,018 2.36 0.16 1.10 1.10 120,000 100,000 100,000 90,000 200,000 105,000 10,000 200,000 100,000 110,000 200,000 10,000 40,000 250,000 30,000 10,000 125,000 20,000 150,000 100,000 100,000 Corporate bonds AbbVie Inc 1.800% 14-May-2018 American Express Credit Corp floating rate 05-Jun-2017 American Honda Finance Corp 0.950% 05-May-2017 Amgen Inc floating rate 22-May-2017 Bank Nederlandse Gemeenten NV 2.500% 11-Jan-2016 Bank of America Corp floating rate 15-Jan-2019 Bank of America Corp 3.875% 22-Mar-2017 Bank of Tokyo-Mitsubishi UFJ Ltd floating rate 10-Mar-2017 BB&T Corp floating rate 01-Feb-2019 Bear Stearns Cos LLC 5.550% 22-Jan-2017 British Telecommunications PLC 1.250% 14-Feb-2017 Cameron International Corp 1.400% 15-Jun-2017 Canadian Natural Resources Ltd 1.750% 15-Jan-2018 Capital One NA/Mclean VA 1.500% 05-Sep-2017 Caterpillar Financial Services Corp floating rate 03-Mar-2017 Cisco Systems Inc floating rate 01-Mar-2019 Citigroup Inc 1.550% 14-Aug-2017 Citigroup Inc 1.800% 05-Feb-2018 ConAgra Foods Inc floating rate 21-Jul-2016 Dominion Resources Inc/VA 1.250% 15-Mar-2017 Duke Energy Corp floating rate 03-Apr-2017 5,789,765 119,730 99,530 99,946 90,002 202,206 106,034 10,401 199,934 100,014 116,727 199,762 9,939 39,754 249,072 30,055 10,049 124,845 19,964 149,612 99,817 100,130 31.79 0.66 0.55 0.55 0.49 1.11 0.58 0.06 1.10 0.55 0.64 1.10 0.05 0.22 1.37 0.16 0.05 0.69 0.11 0.82 0.55 0.55 250,000 151,481 10,552 250,000 210,000 205,000 150,000 200,000 240,000 99,288 73 . PAYDEN GLOBAL FUNDS PUBLIC LIMITED COMPANY SCHEDULE OF INVESTMENTS (continued) Payden US Dollar Liquidity Fund (continued) As at 30 June 2015 Holding Name of securities Fair value USD 20,000 160,000 200,000 150,000 10,000 100,000 20,000 100,000 100,000 100,000 50,000 70,000 30,000 100,000 150,000 120,000 30,000 100,000 40,000 100,000 100,000 200,000 100,000 150,000 50,000 200,000 100,000 200,000 115,000 60,000 250,000 100,000 80,000 20,000 50,000 60,000 Corporate bonds (continued) Electricite de France SA floating rate 20-Jan-2017 Enbridge Inc floating rate 02-Jun-2017 Ford Motor Credit Co LLC floating rate 08-Sep-2017 Goldman Sachs Group Inc 6.250% 01-Sep-2017 Hess Corp 1.300% 15-Jun-2017 Hewlett-Packard Co 2.600% 15-Sep-2017 Hewlett-Packard Co floating rate 14-Jan-2019 HSBC USA Inc floating rate 03-Mar-2017 Inter-American Investment Corp 0.423% 02-Oct-2017 JPMorgan Chase & Co floating rate 18-Nov-2016 JPMorgan Chase & Co floating rate 15-Feb-2017 JPMorgan Chase & Co floating rate 23-Jan-2020 KeyBank NA/Cleveland OH 4.950% 15-Sep-2015 Kinder Morgan Energy Partners LP 3.500% 01-Mar-2016 Kroger Co floating rate 17-Oct-2016 Macquarie Bank Ltd floating rate 27-Oct-2017 Macquarie Group Ltd floating rate 31-Jan-2017 McKesson Corp floating rate 10-Sep-2015 Morgan Stanley 1.875% 05-Jan-2018 Morgan Stanley 6.250% 28-Aug-2017 Morgan Stanley floating rate 23-Jul-2019 Nederlandse Waterschapsbank NV 1.250% 18-Sep-2017 Nissan Motor Acceptance Corp 1.000% 15-Mar-2016 NSTAR Electric Co floating rate 17-May-2016 Prudential Financial Inc 4.750% 17-Sep-2015 QUALCOMM Inc floating rate 18-May-2018 Southern Power Co 4.875% 15-Jul-2015 SunTrust Bank/Atlanta GA floating rate 15-Feb-2017 Synchrony Financial 1.875% 15-Aug-2017 Thomson Reuters Corp 1.650% 29-Sep-2017 UBS AG/Stamford CT floating rate 26-Sep-2016 United Technologies Corp 1.778% 04-May-2018 Verizon Communications Inc floating rate 09-Jun-2017 Verizon Communications Inc floating rate 17-Jun-2019 Walgreens Boots Alliance Inc floating rate 18-May-2016 Zimmer Biomet Holdings Inc 1.450% 01-Apr-2017 20,000 20,000 90,000 90,000 50,000 30,000 100,000 100,000 40,000 150,000 200,000 50,000 40,000 100,000 100,000 200,000 40,000 60,000 54,000 10,000 15,000 20,000 Covered bonds Abbey National Treasury Services PLC/London floating rate 13-Mar-2017 Actavis Funding SCS 1.300% 15-Jun-2017 Actavis Funding SCS 1.850% 01-Mar-2017 Actavis Funding SCS floating rate 01-Sep-2016 Actavis Funding SCS floating rate 12-Mar-2018 Anheuser-Busch InBev Finance Inc floating rate 27-Jan-2017 Asciano Finance Ltd 3.125% 23-Sep-2015 BAT International Finance PLC floating rate 15-Jun-2018 Baxalta Inc floating rate 22-Jun-2018 Daimler Finance North America LLC floating rate 02-Mar-2017 DNB Boligkreditt AS 2.100% 14-Oct-2015 Express Scripts Holding Co 3.125% 15-May-2016 Freeport-McMoRan Inc 2.300% 14-Nov-2017 General Electric Capital Corp floating rate 15-May-2017 General Motors Financial Co Inc floating rate 10-Apr-2018 Glencore Finance Canada Ltd 2.700% 25-Oct-2017 Glencore Funding LLC 2.125% 16-Apr-2018 HJ Heinz Co 1.600% 30-Jun-2017 JB Hunt Transport Services Inc 3.375% 15-Sep-2015 L-3 Communications Corp 1.500% 28-May-2017 NextEra Energy Capital Holdings Inc 1.339% 01-Sep-2015 NextEra Energy Capital Holdings Inc 1.586% 01-Jun-2017 74 % of net assets 20,035 158,160 198,944 164,263 9,953 101,862 19,736 99,988 100,041 100,069 50,090 70,714 30,196 101,457 150,111 120,285 30,151 99,997 40,121 109,630 99,423 201,175 100,203 149,704 50,389 200,139 100,107 199,883 115,012 60,013 250,253 100,349 79,846 19,894 50,003 60,046 0.11 0.87 1.09 0.90 0.05 0.56 0.11 0.55 0.55 0.55 0.27 0.39 0.17 0.56 0.82 0.66 0.17 0.55 0.22 0.60 0.55 1.10 0.55 0.82 0.28 1.10 0.55 1.10 0.63 0.33 1.37 0.55 0.44 0.11 0.27 0.33 1,941,738 19,986 19,874 90,476 90,348 50,243 29,955 100,412 100,014 40,017 150,056 200,971 50,832 39,900 100,206 100,828 202,186 39,726 60,035 54,274 9,936 15,015 20,053 10.66 0.11 0.11 0.50 0.50 0.28 0.16 0.55 0.55 0.22 0.82 1.10 0.28 0.22 0.55 0.55 1.11 0.22 0.33 0.30 0.05 0.08 0.11 . PAYDEN GLOBAL FUNDS PUBLIC LIMITED COMPANY SCHEDULE OF INVESTMENTS (continued) Payden US Dollar Liquidity Fund (continued) As at 30 June 2015 Holding Name of securities Fair value USD % of net assets 38,000 40,000 125,000 150,000 Covered bonds (continued) NextEra Energy Capital Holdings Inc 7.875% 15-Dec-2015 Reynolds American Inc 2.300% 12-Jun-2018 Rio Tinto Finance USA PLC 2.000% 22-Mar-2017 Rio Tinto Finance USA PLC floating rate 17-Jun-2016 39,152 40,328 126,498 150,417 0.22 0.22 0.69 0.83 500,000 300,000 400,000 500,000 200,000 100,000 100,000 100,000 1,000,000 300,000 1,600,000 Government and government related bonds Federal Farm Credit Banks floating rate 17-Apr-2017 Federal Farm Credit Banks floating rate 02-Jan-2018 Federal Farm Credit Banks floating rate 26-Mar-2018 Federal Farm Credit Banks floating rate 16-Apr-2018 FMS Wertmanagement AoeR 0.625% 18-Apr-2016 Inter-American Investment Corp floating rate 16-Nov-2015 Kommunalbanken AS 0.500% 29-Mar-2016 State of North Rhine-Westphalia floating rate 28-Apr-2017 United States Treasury Bill 0.000% 28-Apr-2016 United States Treasury Floating Rate Note 31-Jul-2016 United States Treasury Floating Rate Note 31-Jan-2017 5,102,986 500,735 300,297 400,910 500,570 200,332 100,095 100,077 100,444 998,469 300,086 1,600,971 28.02 2.75 1.65 2.20 2.75 1.10 0.55 0.55 0.55 5.48 1.65 8.79 Total value of investment in securities (2014: 98.24%) 17,977,082 98.71 Financial assets at fair value through profit or loss 17,977,082 98.71 234,312 1.29 18,211,394 100.00 Net current assets Total net assets Portfolio Analysis % of total assets Transferable securities and money market instruments admitted to an official stock exchange listing or traded on a regulated market Analysis of total assets rather than net assets is required under the UCITS Notice 8.5 appendix A. 75 98.18 98.18 . PAYDEN GLOBAL FUNDS PUBLIC LIMITED COMPANY SCHEDULE OF INVESTMENTS (continued) Payden USD Low Duration Credit Fund As at 30 June 2015 Holding Name of securities Fair value USD % of net assets 100,000 150,000 Basic Materials Dow Chemical Co 8.550% 15-May-2019 Glencore Finance Canada Ltd 3.600% 15-Jan-2017 276,047 122,026 154,021 3.22 1.42 1.80 80,000 100,000 100,000 100,000 100,000 100,000 100,000 100,000 Communications AT&T Inc 2.450% 30-Jun-2020 AT&T Inc floating rate 27-Nov-2018 Grupo Televisa SAB 6.000% 15-May-2018 NBCUniversal Enterprise Inc floating rate 15-Apr-2018 Omnicom Group Inc 6.250% 15-Jul-2019 Telecom Italia Capital SA 6.999% 04-Jun-2018 Telefonica Emisiones SAU 6.421% 20-Jun-2016 Verizon Communications Inc 3.650% 14-Sep-2018 825,702 78,513 100,744 111,000 100,523 114,585 110,495 104,584 105,258 9.64 0.92 1.18 1.29 1.17 1.34 1.29 1.22 1.23 132,000 100,000 100,000 100,000 150,000 Consumer, Cyclical Ford Motor Credit Co LLC 6.625% 15-Aug-2017 General Motors Financial Co Inc 2.400% 10-Apr-2018 Hyundai Capital America 1.875% 09-Aug-2016 Southwest Airlines Co 2.750% 06-Nov-2019 Wyndham Worldwide Corp 2.500% 01-Mar-2018 597,851 144,887 100,315 100,608 101,562 150,479 6.98 1.69 1.17 1.17 1.19 1.76 50,000 100,000 100,000 50,000 100,000 100,000 100,000 100,000 120,000 100,000 100,000 100,000 Consumer, Non-cyclical AbbVie Inc 1.800% 14-May-2018 BAT International Finance PLC 2.750% 15-Jun-2020 Baxalta Inc 2.875% 23-Jun-2020 Boston Scientific Corp 2.850% 15-May-2020 Cardinal Health Inc 1.950% 15-Jun-2018 ConAgra Foods Inc 1.900% 25-Jan-2018 ERAC USA Finance LLC 2.350% 15-Oct-2019 HJ Heinz Co 2.000% 02-Jul-2018 HJ Heinz Co 2.800% 02-Jul-2020 McGraw Hill Financial Inc 5.900% 15-Nov-2017 Mylan Inc 2.600% 24-Jun-2018 Reynolds American Inc 3.250% 12-Jun-2020 1,130,263 49,888 100,683 99,969 49,703 100,239 98,571 99,447 100,041 120,230 109,292 100,795 101,405 13.20 0.58 1.18 1.17 0.58 1.17 1.15 1.16 1.17 1.40 1.28 1.18 1.18 100,000 100,000 Energy Canadian Natural Resources Ltd 5.700% 15-May-2017 Petroleos Mexicanos floating rate 18-Jul-2018 209,840 107,650 102,190 2.45 1.26 1.19 100,000 100,000 100,000 200,000 200,000 200,000 100,000 100,000 100,000 200,000 100,000 100,000 100,000 100,000 100,000 150,000 150,000 150,000 100,000 200,000 100,000 100,000 Financial Abbey National Treasury Services PLC/London 1.650% 29-Sep-2017 Air Lease Corp 5.625% 01-Apr-2017 Aircastle Ltd 4.625% 15-Dec-2018 Bank of America Corp 6.875% 25-Apr-2018 Barclays Bank PLC 6.050% 04-Dec-2017 Bear Stearns Cos LLC 5.550% 22-Jan-2017 BioMed Realty LP 2.625% 01-May-2019 Caisse Centrale Desjardins 1.550% 12-Sep-2017 Capital One Financial Corp 6.150% 01-Sep-2016 Citigroup Inc 5.500% 15-Feb-2017 Deutsche Bank AG/London 2.500% 13-Feb-2019 Goldman Sachs Group Inc 5.625% 15-Jan-2017 Goldman Sachs Group Inc 6.150% 01-Apr-2018 Hartford Financial Services Group Inc 5.500% 15-Oct-2016 International Lease Finance Corp 3.875% 15-Apr-2018 Jackson National Life Global Funding 2.300% 16-Apr-2019 Kimco Realty Corp 5.700% 01-May-2017 Lloyds Bank PLC 6.500% 14-Sep-2020 Macquarie Group Ltd 4.875% 10-Aug-2017 Morgan Stanley 5.950% 28-Dec-2017 Nomura Holdings Inc 2.000% 13-Sep-2016 Prologis LP 6.625% 01-Dec-2019 3,902,577 100,328 106,250 103,250 226,082 217,855 212,230 99,667 100,118 105,578 212,569 100,595 105,931 111,230 105,205 100,750 150,448 161,207 173,084 105,732 219,920 100,758 115,753 45.56 1.17 1.24 1.20 2.64 2.54 2.48 1.16 1.17 1.23 2.48 1.17 1.24 1.30 1.23 1.18 1.76 1.88 2.02 1.23 2.57 1.18 1.35 76 . PAYDEN GLOBAL FUNDS PUBLIC LIMITED COMPANY SCHEDULE OF INVESTMENTS (continued) Payden USD Low Duration Credit Fund (continued) As at 30 June 2015 Holding Name of securities Fair value USD % of net assets 100,000 100,000 100,000 100,000 100,000 200,000 160,000 Financial (continued) Regions Financial Corp 2.000% 15-May-2018 Santander Holdings USA Inc/PA 2.650% 17-Apr-2020 Suncorp-Metway Ltd 2.350% 27-Apr-2020 Synchrony Financial 3.000% 15-Aug-2019 TIAA Asset Management Finance Co LLC 2.950% 01-Nov-2019 UBS AG/Stamford CT 5.875% 15-Jul-2016 Ventas Realty LP / Ventas Capital Corp 2.000% 15-Feb-2018 100,002 98,420 98,065 100,807 100,800 208,864 161,079 1.17 1.15 1.14 1.18 1.18 2.44 1.88 100,000 150,000 100,000 100,000 100,000 150,000 Industrial Asciano Finance Ltd 5.000% 07-Apr-2018 BAE Systems PLC 3.500% 11-Oct-2016 FedEx Corp 8.000% 15-Jan-2019 Penske Truck Leasing Co LP / PTL Finance Corp 3.750% 11-May-2017 Ryder System Inc 2.450% 15-Nov-2018 Textron Inc 4.625% 21-Sep-2016 741,263 107,239 154,198 119,632 103,508 100,624 156,062 8.65 1.25 1.80 1.40 1.21 1.17 1.82 60,000 100,000 65,000 Technology Dun & Bradstreet Corp 4.000% 15-Jun-2020 Hewlett-Packard Co 5.400% 01-Mar-2017 QUALCOMM Inc 2.250% 20-May-2020 231,568 60,351 106,505 64,712 2.70 0.70 1.24 0.76 70,000 100,000 100,000 100,000 70,000 100,000 Utilities Dominion Resources Inc/VA 1.900% 15-Jun-2018 EDP Finance BV 6.000% 02-Feb-2018 Exelon Generation Co LLC 2.950% 15-Jan-2020 PG&E Corp 2.400% 01-Mar-2019 PSEG Power LLC 2.450% 15-Nov-2018 Southern Co 2.750% 15-Jun-2020 548,826 70,137 107,386 100,450 100,215 70,283 100,355 6.41 0.82 1.26 1.17 1.17 0.82 1.17 8,463,937 98.81 Total value of investment in securities (2014: 98.51%) 4 Futures contracts (2014: 0.00%) US Treasury Note 2 Year (CBT) Future Exp 30-Sep-2015 Notional (USD) Broker 1,437 0.02 874,313 Goldman Sachs 1,437 0.02 8,465,374 98.83 100,525 1.17 8,565,899 100.00 Financial assets at fair value through profit or loss Net current assets Total net assets Portfolio Analysis % of total assets Transferable securities and money market instruments admitted to an official stock exchange listing or traded on a regulated market Financial derivative instruments dealt in on a regulated market Analysis of total assets rather than net assets is required under the UCITS Notice 8.5 appendix A. 77 94.64 0.02 94.66 . PAYDEN GLOBAL FUNDS PUBLIC LIMITED COMPANY SCHEDULE OF INVESTMENTS (continued) Payden World Equity Fund As at 30 June 2015 Holding Name of securities Fair value USD % of net assets Equities 1,522,558 3.92 330 Switzerland Garmin Ltd 14,494 14,494 0.04 0.04 450 United Kingdom Ensco PLC 10,019 10,019 0.02 0.02 360 330 450 380 270 460 210 400 280 230 270 240 270 320 620 290 290 270 280 220 260 340 240 210 350 370 180 310 350 210 260 340 230 480 310 390 340 260 600 260 340 220 250 260 230 610 180 300 320 270 360 340 United States AGL Resources Inc Alliant Energy Corp Altria Group Inc American Electric Power Co Inc Arthur J Gallagher & Co AT&T Inc Avery Dennison Corp Avista Corp Bank of Hawaii Corp BB&T Corp Black Hills Corp Bristol-Myers Squibb Co Campbell Soup Co CenterPoint Energy Inc CenturyLink Inc Chevron Corp Cincinnati Financial Corp Cinemark Holdings Inc Cleco Corp Cliffs Natural Resources Inc Clorox Co CMS Energy Corp Coca-Cola Co Commercial Metals Co ConocoPhillips Darden Restaurants Inc Deluxe Corp Dominion Resources Inc/VA DTE Energy Co Eaton Corp PLC Edison International Eli Lilly & Co Emerson Electric Co Entergy Corp Eversource Energy Exelon Corp Federated Investors Inc First Niagara Financial Group Inc FirstEnergy Corp FirstMerit Corp FNB Corp/PA General Dynamics Corp General Electric Co General Mills Inc Genuine Parts Co HollyFrontier Corp Honeywell International Inc IDACORP Inc Intel Corp Kimberly-Clark Corp Leggett & Platt Inc Lockheed Martin Corp 1,498,045 16,760 19,044 21,994 20,127 12,767 16,337 12,796 12,262 18,665 9,272 11,784 15,961 12,864 6,086 18,212 27,969 14,549 10,847 15,072 951 27,044 10,831 9,412 3,374 21,492 26,301 11,163 20,728 26,117 14,170 14,449 28,375 12,748 33,838 14,076 12,252 11,383 2,453 19,521 5,414 4,867 31,166 6,644 14,483 20,586 26,044 18,352 16,836 9,733 28,608 17,523 63,192 3.86 0.04 0.05 0.06 0.05 0.03 0.04 0.03 0.03 0.05 0.02 0.03 0.04 0.03 0.02 0.05 0.07 0.04 0.03 0.04 0.00 0.07 0.03 0.02 0.01 0.06 0.07 0.03 0.05 0.07 0.04 0.04 0.07 0.03 0.09 0.04 0.03 0.03 0.01 0.05 0.01 0.01 0.08 0.02 0.04 0.05 0.07 0.05 0.04 0.02 0.07 0.04 0.16 78 . PAYDEN GLOBAL FUNDS PUBLIC LIMITED COMPANY SCHEDULE OF INVESTMENTS (continued) Payden World Equity Fund (continued) As at 30 June 2015 Holding 280 300 250 310 450 290 680 540 280 280 200 220 390 260 230 650 390 270 400 380 380 300 440 400 290 270 110 210 480 380 300 250 270 260 270 54 460 310 230 360 350 400 290 837 360 250,000,000 250,000,000 400,000,000 5,000,000 5,430,000 5,000,000 7,000,000 Name of securities Fair value USD % of net assets 7,192 28,516 11,799 17,641 25,036 15,125 18,731 9,922 27,451 12,762 31,725 6,282 6,094 7,006 9,079 4,176 6,324 9,049 19,638 30,455 21,616 6,245 12,965 15,710 6,062 10,575 8,210 10,285 8,364 19,245 14,252 24,729 11,571 3,982 9,743 928 8,119 7,742 14,842 14,481 20,057 4,122 13,437 37,694 11,572 0.02 0.07 0.03 0.05 0.06 0.04 0.05 0.03 0.07 0.03 0.08 0.02 0.02 0.02 0.02 0.01 0.02 0.02 0.05 0.08 0.06 0.02 0.03 0.04 0.02 0.03 0.02 0.03 0.02 0.05 0.04 0.06 0.03 0.01 0.02 0.00 0.02 0.02 0.04 0.04 0.05 0.01 0.03 0.10 0.03 Government bonds Japan Government Five Year Bond 0.300% 20-Sep-2015 Japan Government Two Year Bond 0.100% 15-Aug-2015 Japan Government Two Year Bond 0.100% 15-Sep-2015 United States Treasury Bill 0.000% 17-Sep-2015(1) United States Treasury Bill 0.000% 10-Dec-2015 United States Treasury Bill 0.000% 28-Apr-2016 United States Treasury Bill 0.000% 23-Jun-2016 29,760,706 2,044,414 2,043,323 3,269,589 5,000,055 5,429,082 4,992,345 6,981,898 76.63 5.26 5.26 8.42 12.87 13.98 12.86 17.98 Total value of investment in securities (2014: 83.11%) 31,283,264 80.55 Equities (continued) United States (continued) Mattel Inc McDonald's Corp MeadWestvaco Corp Merck & Co Inc Mercury General Corp Meredith Corp New Jersey Resources Corp New York Community Bancorp Inc NextEra Energy Inc NiSource Inc Northrop Grumman Corp OGE Energy Corp Old Republic International Corp Olin Corp ONEOK Inc PDL BioPharma Inc People's United Financial Inc Pfizer Inc PG&E Corp Philip Morris International Inc Pinnacle West Capital Corp Pitney Bowes Inc PPL Corp Public Service Enterprise Group Inc Questar Corp Republic Services Inc Reynolds American Inc RPM International Inc RR Donnelley & Sons Co SCANA Corp Seagate Technology PLC Sempra Energy Sonoco Products Co Staples Inc Sysco Corp Talen Energy Corp TECO Energy Inc Trustmark Corp Tupperware Brands Corp United Bankshares Inc/WV Universal Corp/VA Valley National Bancorp Waste Management Inc WEC Energy Group Inc Xcel Energy Inc 79 . PAYDEN GLOBAL FUNDS PUBLIC LIMITED COMPANY SCHEDULE OF INVESTMENTS (continued) Payden World Equity Fund (continued) As at 30 June 2015 Holding 51 2 4 64 Name of securities Futures contracts (2014: 2.49%) EURO STOXX 50® Index (EUREX) Future Exp 18-Sep-2015 FTSE/MIB Index (IDEM) Future Exp 18-Sep-2015 Mini MSCI Emgerging Market (9N) Future Exp 30-Jul-2015 MSCI Emerging (ICE US) Future Exp 18-Sep-2015 Fair value USD Notional (USD) Broker 15,549 0.04 1,946,841 Goldman Sachs 5,638 0.01 248,801 Goldman Sachs 2,707 0.01 216,740 Goldman Sachs 4,159 0.01 3,067,035 Goldman Sachs 3,045 0.01 312,251 0.80 31,611,064 81.39 Unrealised gain on forward foreign exchange contracts (Appendix) (2014: 1.11%) Financial assets at fair value through profit or loss 4 23 3 3 22 14 22 16 118 13 4 9 14 32 (476,149) (1.22) 421,112 Goldman Sachs (345) 0.00 119,654 Goldman Sachs (173) 0.00 1,126,763 Goldman Sachs (6,808) (0.02) 1,234,158 Goldman Sachs (8,371) (0.02) 2,412,026 Goldman Sachs (63,010) (0.16) 514,827 Goldman Sachs (7,820) (0.02) 361,335 Goldman Sachs (1,173) 0.00 1,959,804 Goldman Sachs (28,094) (0.07) 101,288 Goldman Sachs (78) 0.00 418,426 Goldman Sachs (9,646) (0.03) 2,025,315 Goldman Sachs (24,675) (0.06) 12,331,800 Goldman Sachs (210,840) (0.54) 1,994,205 Goldman Sachs (46,675) (0.12) 549,683 Goldman Sachs (8,917) (0.02) 955,888 Goldman Sachs (22,558) (0.06) 1,335,841 Goldman Sachs (18,908) (0.05) 4,282,023 Goldman Sachs (18,058) (0.05) (157,766) (0.41) (633,915) (1.63) Net current assets 21 Broker Financial liabilities at fair value through profit or loss 3 Notional (USD) Unrealised loss on forward foreign exchange contracts (Appendix) (2014: (1.46%)) 4 Futures contracts (2014: (0.17%)) Amsterdam Index (E'NEXT) Future Exp 17-Jul-2015 BEL20 Index (E'NEXT) Future Exp 17-Jul-2015 CAC40 10 Euro (E'NEXT) Future Exp 17-Jul-2015 Dax Index (EUREX) Future Exp 18-Sep-2015 FTSE 100 Index (LIFFE) Future Exp 18-Sep-2015 Hang Seng Index (HKEX) Future Exp 30-Jul-2015 IBEX 35 Index (MEFF) Future Exp 17-Jul-2015 NASDAQ 100 E-Mini (CME) Future Exp 18-Sep-2015 OBX Index (EDX) Future Exp 16-Jul-2015 OMXS30 Index (NASDAQ OMX) Future Exp 17-Jul-2015 Russell 2000 Mini (ICE US) Future Exp 18-Sep-2015 S&P 500 Emini (CME) Future Exp 18-Sep-2015 S&P Mid 400 Emini (CME) Future Exp 18-Sep-2015 S&P/TSX 60 Index (MX) Future Exp 17-Sep-2015 SPI 200 (ASX) Future Exp 17-Sep-2015 Swiss Market Index (EUREX) Future Exp 18-Sep-2015 Topix Index (OSE) Future Exp 10-Sep-2015 % of net assets 7,860,019 20.24 38,837,168 100.00 Total net assets (1) The nominal value of 1,995,000 is held as collateral with Goldman Sachs for open future contracts. 80 . PAYDEN GLOBAL FUNDS PUBLIC LIMITED COMPANY SCHEDULE OF INVESTMENTS (continued) Payden World Equity Fund (continued) As at 30 June 2015 Appendix: forward foreign currency contracts Unrealised gain on forward foreign currency contracts Currency Purchase Counter Party Payden World Equity Fund Royal Bank of Scotland EUR Royal Bank of Scotland USD Royal Bank of Scotland GBP HSBC Securities USD Credit Suisse USD Credit Suisse USD Credit Suisse JPY Credit Suisse USD UBS USD UBS USD Barclays INR Barclays INR Barclays USD Barclays USD Royal Bank of Scotland CHF Royal Bank of Scotland USD Chase Manhattan Bank DKK Royal Bank of Canada EUR Royal Bank of Canada USD HSBC Securities GBP HSBC Securities USD Royal Bank of Scotland JPY Royal Bank of Scotland USD Chase Manhattan Bank SEK Royal Bank of Canada USD Royal Bank of Canada USD Purchase Amount Currency Sale Sale Amount Maturity date Unrealised Gain/Loss USD 945,000 1,072,225 680,000 116,355 1,006,211 163,951 120,200,000 998,712 1,013,744 176,871 43,030,000 7,190,000 508,423 80,176 1,055,000 55,684 1,206,000 3,213,000 231,531 1,578,000 134,487 59,722,000 4,845,874 2,987,000 1,013,562 141,649 USD EUR USD EUR AUD AUD USD JPY EUR EUR USD USD SGD SGD USD CHF USD USD EUR USD GBP USD JPY USD CAD CAD (1,010,762) (945,000) (1,036,701) (102,000) (1,298,000) (210,000) (967,323) (120,200,000) (902,000) (155,000) (657,850) (111,715) (680,000) (107,000) (1,123,392) (51,000) (179,031) (3,544,517) (203,000) (2,441,213) (85,000) (486,561) (587,979,000) (357,579) (1,263,000) (173,000) 17-Jul-2015 17-Jul-2015 17-Jul-2015 23-Jul-2015 31-Jul-2015 31-Jul-2015 31-Jul-2015 31-Jul-2015 17-Aug-2015 17-Aug-2015 17-Aug-2015 17-Aug-2015 20-Aug-2015 20-Aug-2015 28-Aug-2015 28-Aug-2015 28-Aug-2015 28-Aug-2015 28-Aug-2015 28-Aug-2015 28-Aug-2015 28-Aug-2015 28-Aug-2015 28-Aug-2015 14-Sep-2015 14-Sep-2015 42,369 19,095 32,623 2,675 10,293 2,824 15,338 16,052 8,089 4,058 11,577 141 3,794 772 8,031 989 1,402 38,285 5,166 39,474 863 1,831 37,521 2,843 2,929 3,217 312,251 Unrealised loss on forward foreign currency contracts Currency Purchase Counter Party Payden World Equity Fund Royal Bank of Scotland USD HSBC Securities EUR HSBC Securities USD UBS EUR HSBC Securities PHP HSBC Securities PHP Royal Bank of Scotland AUD BNP Paribas AUD Royal Bank of Canada CAD Royal Bank of Canada CAD BNP Paribas CHF Chase Manhattan Bank DKK Royal Bank of Canada EUR HSBC Securities GBP Credit Suisse HKD Credit Suisse HKD Chase Manhattan Bank NOK Chase Manhattan Bank NOK Chase Manhattan Bank SEK Chase Manhattan Bank SGD Chase Manhattan Bank SGD Purchase Amount Currency Sale Sale Amount Maturity date Unrealised Gain/Loss USD 1,008,620 40,000 675,835 20,000 3,820,000 22,730,000 1,019,000 189,000 1,393,000 252,000 186,000 232,000 555,000 278,000 3,217,000 649,000 641,000 133,000 527,000 237,000 46,000 GBP USD EUR USD USD USD USD USD USD USD USD USD USD USD USD USD USD USD USD USD USD (680,000) (44,961) (629,000) (22,489) (84,804) (508,160) (794,321) (147,550) (1,130,086) (206,511) (202,685) (35,521) (633,760) (441,424) (414,979) (83,710) (83,812) (17,109) (65,032) (177,184) (34,512) 17-Jul-2015 23-Jul-2015 23-Jul-2015 17-Aug-2015 20-Aug-2015 20-Aug-2015 28-Aug-2015 28-Aug-2015 28-Aug-2015 28-Aug-2015 28-Aug-2015 28-Aug-2015 28-Aug-2015 28-Aug-2015 28-Aug-2015 28-Aug-2015 28-Aug-2015 28-Aug-2015 28-Aug-2015 28-Aug-2015 28-Aug-2015 (60,703) (380) (25,196) (191) (318) (5,443) (13,615) (2,748) (15,182) (4,820) (3,211) (811) (14,882) (4,395) (47) (1) (2,448) (227) (1,442) (1,327) (379) (157,766) 81 . PAYDEN GLOBAL FUNDS PUBLIC LIMITED COMPANY SCHEDULE OF INVESTMENTS (continued) Payden World Equity Fund (continued) As at 30 June 2015 Portfolio Analysis % of total assets Transferable securities and money market instruments admitted to an official stock exchange listing or traded on a regulated market Financial derivative instruments dealt in on a regulated market OTC financial derivative instruments Analysis as a percentage of total assets rather than net assets is required under the UCITS Notice 8.5 appendix A 82 79.11 (1.16) 0.39 78.34 . PAYDEN GLOBAL FUNDS PUBLIC LIMITED COMPANY CONDENSED PROFIT AND LOSS ACCOUNT FOR THE PERIOD ENDED 30 JUNE 2015 0.04 0.01 Notes Bank interest income Dividend income Income on debt securities Other income Net gains / (losses) on financial assets and liabilities at fair value through profit or loss Total investment income / (loss) Custodian fees Administration fees Investment manager fees Directors’ fees Interest on swaps Investment interest expense Other expenses Rebate due from the Investment Manager Operating expenses Net income / (loss) Finance costs Distributions to holders of redeemable participating shares 7 Profit / (loss) before tax for the financial period Withholding taxes on dividends & other investment income Increase / (Decrease) in net assets from operations attributable to holders of redeemable participating shares (1) Payden Absolute Return Bond Fund (USD) 319 – 1,069,849 3,124 299,227 1,372,519 (7,175) (44,300) (233,218) (2,206) (345) (158) (38,777) 56,835 (269,344) 1,103,175 0.02 Payden Euro Liquidity Fund (EUR) – – 137,681 – 37,163 174,844 (12,513) (22,760) (34,927) (2,295) – – (15,957) 31,872 (56,580) 118,264 0.03 Payden Global Bond Fund(1) (USD) 353 – 3,428,179 26 (10,760,426) (7,331,868) (31,635) (59,431) (356,251) (3,066) – – (40,884) 57,718 (433,549) (7,765,417) Payden Payden Global Global Emerging Emerging Markets Markets Bond Corporate Fund Bond Fund (USD) (USD) 459 233 – – 3,794,995 1,284,642 – – (6,814,374) 683,367 (3,018,920) 1,968,242 (25,015) (7,282) (70,094) (20,476) (302,519) (203,281) (2,206) (2,206) (36,961) – – – (25,810) (14,815) – 29,897 (462,605) (218,163) (3,481,525) 1,750,079 0.05 – – 1,103,175 (1,238) (2,700) (2,700) 115,564 5,208 – – (7,765,417) (11,580) (1,097,620) (1,097,620) (4,579,145) 6,189 (867,857) (867,857) 882,222 (6,224) 1,101,937 120,772 (7,776,997) (4,572,956) 875,998 This Fund changed name from Payden International Bond Fund on 24 March 2015. All gains and losses have been recognised in the Profit and Loss Account and arise from continuing operations. The accompanying notes form an integral part of the financial statements. 83 . PAYDEN GLOBAL FUNDS PUBLIC LIMITED COMPANY CONDENSED PROFIT AND LOSS ACCOUNT (continued) FOR THE PERIOD ENDED 30 JUNE 2015 (continued) Payden Payden Sterling Corporate Global Short Bond Fund Bond Fund(2) Investment Grade (USD) (GBP) 88 64 – – 842,543 332,132 2,660 – (2,252,775) (329,512) (1,407,484) 2,684 (10,585) (3,026) (46,059) (4,679) (133,789) (44,086) – (1,595) – – – – (24,901) (10,000) 53,112 12,199 (162,222) (51,187) (1,569,706) (48,503) 0.11 Payden Payden Payden Global Government Global High Yield Global Inflation Notes Bond Index Fund Bond Fund Linked Bond Fund (USD) (USD) (USD) 106 594 76 – – – 1,100,155 2,562,530 251,465 – – 51 779,412 (635,438) (124,413) 1,879,673 1,927,686 127,179 (17,700) (7,798) (9,608) (43,776) (45,878) (31,262) (96,135) (256,460) (138,438) (2,206) (2,206) (2,206) – – – – – – (16,567) (22,331) (14,574) 48,030 15,574 31,133 (128,354) (319,099) (164,955) 1,751,319 1,608,587 (37,776) 0.07 Bank interest income Dividend income Income on debt securities Other income Net gains / (losses) on financial assets and liabilities at fair value through profit or loss Total investment income / (loss) Custodian fees Administration fees Investment manager fees Directors’ fees Interest on swaps Investment interest expense Other expenses Rebate due from the Investment Manager Operating expenses Net income / (loss) Finance costs Distributions to holders of redeemable participating shares 7 Profit / (loss) before tax for the financial period Withholding taxes on dividends & other investment income Increase / (Decrease) in net assets from operations attributable to holders of redeemable participating shares (2) 0.08 0.09 0.10 (281,771) (281,771) 1,469,548 (2,110) – – 1,608,587 (11,698) (129,986) (129,986) (167,762) – – – (1,569,706) (1,851) – – (48,503) (83) 1,467,438 1,596,889 (167,762) (1,571,557) (48,586) This Fund changed name from Payden International Short Bond Fund on 24 March 2015. All gains and losses have been recognised in the Profit and Loss Account and arise from continuing operations. The accompanying notes form an integral part of the financial statements. 84 . PAYDEN GLOBAL FUNDS PUBLIC LIMITED COMPANY CONDENSED PROFIT AND LOSS ACCOUNT (continued) FOR THE PERIOD ENDED 30 JUNE 2015 (continued) 0.13 Notes Bank interest income Dividend income Income on debt securities Other income Net gains / (losses) on financial assets and liabilities at fair value through profit or loss Total investment income Custodian fees Administration fees Investment manager fees Directors’ fees Interest on swaps Investment interest expense Other expenses Rebate due from the Investment Manager Operating expenses Net income Finance costs Distributions to holders of redeemable participating shares 7 Profit / (loss) before tax for the financial period Withholding taxes on dividends & other investment income Increase / (Decrease) in net assets from operations attributable to holders of redeemable participating shares Payden Sterling Reserve Fund (GBP) 586 – 1,458,295 – (503,849) 955,032 (46,790) (43,763) (190,604) (1,596) – – (15,947) 53,614 (245,086) 709,946 0.14 Payden US Core Bond Fund (USD) 52 – 238,803 4 (159,139) 79,720 (1,788) (17,944) (31,368) (3,435) (2,455) – (18,038) 23,089 (51,939) 27,781 0.15 Payden Payden US Dollar USD Low Duration Liquidity Fund Credit Fund (USD) (USD) 54 828 – – 58,914 3,208,940 4 3 29,117 3,714,758 88,089 6,924,529 (1,454) (11,106) (29,367) (46,051) (9,467) (326,149) (2,206) (2,206) – – – – (15,903) (45,967) 43,249 20,052 (15,148) (411,427) 72,941 6,513,102 0.16 0.17 Payden World Equity Fund (USD) 171 27,795 7,873 18 1,073,974 1,109,831 (3,295) (12,289) (98,977) (2,206) – – (24,775) 11,075 (130,467) 979,364 0.18 Total Company (USD) 4,324 27,795 20,730,972 5,890 (15,395,195) 5,373,786 (224,320) (566,148) (2,582,675) (33,779) (39,761) (158) (360,691) 525,626 (3,281,906) 2,091,880 (717,823) (717,823) (7,877) 2,478 (412,415) (412,415) (384,634) (378) (30,062) (30,062) 42,879 27 – – 6,513,102 (24,346) – – 979,364 (8,079) (3,916,615) (3,916,615) (1,824,735) (51,826) (5,399) (385,012) 42,906 6,488,756 971,285 (1,876,561) All gains and losses have been recognised in the Profit and Loss Account and arise from continuing operations. The accompanying notes form an integral part of the financial statements. 85 . PAYDEN GLOBAL FUNDS PUBLIC LIMITED COMPANY CONDENSED PROFIT AND LOSS ACCOUNT (continued) FOR THE PERIOD ENDED 30 JUNE 2014* 0.03 0.01 Notes Bank interest income Dividend income Income on debt securities Interest on swaps Other income Net gains/(losses) on financial assets and liabilities at fair value through profit or loss Total investment income/(loss) Custodian fees Administration fees Investment manager fees Directors’ fees Interest on swaps Other expenses Rebate due from the Investment Manager Operating expenses Net income/(loss) Finance costs Distributions to holders of redeemable participating shares Payden Absolute Return Bond Fund (USD) 39 – 679,433 – 23,559 1,816,983 2,520,014 (1,471) (11,241) (150,829) (3,088) (750) (86,415) 41,393 (212,401) 0.02 Payden Euro Liquidity Fund(1) (EUR) 12 – 58,608 – 4,735 56,714 120,069 (2,129) (16,035) (9,434) (3,136) – (35,657) 46,239 (20,152) Payden Payden Global Global Emerging Emerging Markets Markets Bond Corporate Fund Bond Fund (USD) (USD) – 77 10 10 5,874,364 1,123,738 – – 206,607 24,642 7,903,609 2,025,327 13,984,590 3,173,794 (61,478) (4,581) (107,490) (3,705) (468,176) (189,050) (4,183) (4,183) – (9,084) (234,690) (53,889) 71,616 45,417 (804,401) (219,075) 0.04 0.05 Payden Global Emerging Payden Global Markets Local Government Bond Bond Fund Index Fund (USD) (USD) 56 122 – 6 434,689 1,129,291 55 – 1,520,036 93,898 (1,561,250) 4,643,143 393,586 5,866,460 (23,442) (35,338) (31,114) (59,927) (52,111) (87,650) (4,183) (4,183) – – (42,391) (44,139) 85,651 113,101 (67,590) (118,136) 0.06 2,307,613 7 Profit/(loss) before tax for the financial year Withholding taxes on dividends & other investment income Increase/(Decrease) in net assets from operations attributable to holders of redeemable participating shares 99,917 13,180,189 2,954,719 325,996 5,748,324 – – 2,307,613 (10,541) (362) (362) 99,555 (2,166) (1,209,704) (1,209,704) 11,970,485 (120,144) (759,727) (759,727) 2,194,992 (15,883) – – 325,996 (6,233) (336,689) (336,689) 5,411,635 (12,426) 2,297,072 97,389 11,850,341 2,179,109 319,763 5,399,209 This Fund changed name from Payden Euro Liquidity – Enhanced Cash Fund on 1 April 2014. * Prior figures have been restated to comply with recent updates to accounting standards. (1) All gains and losses have been recognised in the Profit and Loss Account and arise from continuing operations. The accompanying notes form an integral part of the financial statements. 86 . PAYDEN GLOBAL FUNDS PUBLIC LIMITED COMPANY CONDENSED PROFIT AND LOSS ACCOUNT (continued) FOR THE PERIOD ENDED 30 JUNE 2014* (continued) Payden Payden Payden Sterling Corporate International International Short Bond Fund Bond Fund Bond Fund Investment Grade (USD) (USD) (GBP) 176 59 30 – 788 – 3,372,912 567,283 333,977 – – – 99,453 13,666 289,172 5,134,724 (135,903) (124,901) 8,607,265 445,893 498,278 (82,864) (16,334) (9,929) (100,334) (28,324) 1,426 (351,871) (74,213) (41,458) (4,224) (6,367) (2,535) (6,806) – – (48,544) (54,312) (22,592) 174,263 88,104 26,115 (420,380) (91,446) (48,973) 0.11 Payden Payden Global High Yield Global Inflation Bond Fund Linked Bond Fund (USD) (USD) 111 46 10 6 2,413,875 1,533,772 – – 30,921 200,673 2,601,802 4,114,499 5,046,719 5,848,996 (21,382) (23,012) (40,228) (48,232) (236,410) (147,898) (3,033) (4,183) – – (52,292) (43,683) 52,429 89,999 (300,916) (177,009) 0.07 Notes Bank interest income Dividend income Income on debt securities Interest on swaps Other income Net gains/(losses) on financial assets and liabilities at fair value through profit or loss Total investment income/(loss) Custodian fees Administration fees Investment manager fees Directors’ fees Interest on swaps Other expenses Rebate due from the Investment Manager Operating expenses Net income/(loss) Finance costs Distributions to holders of redeemable participating shares 0.08 0.09 0.1 0.12 Payden Sterling Liquidity Fund(2) (GBP) 11 – 26,240 – 115 5,755 32,121 (718) (1,748) (2,713) (2,471) – (7,048) 10,325 (4,373) 4,745,803 7 Profit/(loss) before tax for the financial year Withholding taxes on dividends & other investment income Increase/(Decrease) in net assets from operations attributable to holders of redeemable participating shares 5,671,987 8,186,885 354,447 449,305 27,748 – – 4,745,803 (2,518) (252,398) (252,398) 5,419,589 – – – 8,186,885 (37,483) – – 354,447 (4,590) – – 449,305 (1,218) (10,771) (10,771) 16,977 (75) 4,743,285 5,419,589 8,149,402 349,857 448,087 16,902 This Fund changed name from Payden Sterling Liquidity – Enhanced Cash Fund on 1 April 2014 and subsequently terminated on 25 June 2014. This Fund has since been revoked with the Central Bank of Ireland. * Prior figures have been restated to comply with recent updates to accounting standards. (2) All gains and losses have been recognised in the Profit and Loss Account and arise from continuing operations. The accompanying notes form an integral part of the financial statements. 87 . PAYDEN GLOBAL FUNDS PUBLIC LIMITED COMPANY CONDENSED PROFIT AND LOSS ACCOUNT (continued) FOR THE PERIOD ENDED 30 JUNE 2014* (continued) Payden US Dollar Liquidity Fund(3) (USD) 4 – 9,532 – 1,293 4,359 15,188 (1,915) (11,283) (2,637) (4,323) – (40,562) 55,160 (5,560) Payden USD Low Duration Credit Fund (USD) 426 – 3,864,684 – 63,981 5,969,147 9,898,238 (58,625) (74,974) (441,030) (3,570) – (13,804) – (592,003) 0.16 0.13 Notes Bank interest income Dividend income Income on debt securities Interest on swaps Other income Net gains/(losses) on financial assets and liabilities at fair value through profit or loss Total investment income/(loss) Custodian fees Administration fees Investment manager fees Directors’ fees Interest on swaps Other expenses Rebate due from/(to) the Investment Manager Operating expenses Net income/(loss) Finance costs Distributions to holders of redeemable participating shares Payden Sterling Reserve Fund (GBP) 520 – 1,564,179 – 9,340 80,975 1,655,014 (57,961) (32,396) (213,917) (2,601) – (43,203) 66,346 (283,732) 0.14 Payden US Core Bond Fund (USD) 19 6 347,483 – 2,767 712,654 1,062,929 (10,664) (25,564) (41,398) (3,187) (12,992) (47,943) 58,033 (83,715) 0.15 0.17 Payden World Equity Fund (USD) 58 14,072 13,828 – 2,077 1,516,709 1,546,744 (8,424) (26,001) (90,785) (2,778) – (43,135) 52,654 (118,469) 0.18 Total Company (USD) 1,193 14,908 21,364,884 55 2,283,573 34,745,803 58,410,416 (349,530) (568,417) (2,334,058) (51,485) (29,632) (805,799) 927,820 (3,211,101) 1,371,282 7 Profit/(loss) before tax for the financial year Withholding taxes on dividends & other investment income Increase/(Decrease) in net assets from operations attributable to holders of redeemable participating shares 979,214 9,628 9,306,235 1,428,275 55,199,315 (641,623) (641,623) 729,659 (13,233) (524,950) (524,950) 454,264 (667) (547) (547) 9,081 (21) – – 9,306,235 (21,259) – – 1,428,275 (4,174) (3,084,015) (3,084,015) 52,115,300 (235,939) 716,426 453,597 9,060 9,284,976 1,424,101 51,879,361 This Fund changed name from Payden US Dollar Liquidity – Enhanced Cash Fund on 1 April 2014. * Prior figures have been restated to comply with recent updates to accounting standards. (3) All gains and losses have been recognised in the Profit and Loss Account and arise from continuing operations. The accompanying notes form an integral part of the financial statements. 88 . PAYDEN GLOBAL FUNDS PUBLIC LIMITED COMPANY CONDENSED BALANCE SHEET AS AT 30 JUNE 2015 Payden Global Bond Fund(1) (USD) Payden Global Emerging Markets Bond Fund (USD) Payden Global Emerging Markets Corporate Bond Fund (USD) 0.04 0.01 Notes Current assets Financial assets at fair value through profit or loss Cash at bank Cash collateral Margin on derivative contracts Interest/dividends receivable Receivable for investments sold Receivable for subscriptions Rebate receivable from the Investment Manager Other receivables Total assets Current liabilities Financial liabilities at fair value through profit or loss Margin on derivative contracts Payable for investments purchased Payable for distributions Payable for redemptions Management fee payable Administration fee payable Custodian fee payable Directors fee payable Audit fee payable Other payables Total liabilities Net assets attributable to holders of redeemable participating shares at trading valuation (1) Payden Absolute Return Bond Fund (USD) 0.02 Payden Euro Liquidity Fund (EUR) 0.03 0.05 6 93,123,749 4,722,512 265,000 – 477,911 2,637,312 – 29,344 8,593 101,264,421 86,441,802 1,240,912 – – 289,342 – – 20,442 – 87,992,498 210,990,414 7,153,302 – 15,902 1,758,739 3,244,515 – 22,845 52,658 223,238,375 106,521,441 851,309 653,000 – 1,927,973 1,804,542 – – – 111,758,265 49,066,884 269,018 – – 685,042 468,487 – 9,362 – 50,498,793 6 (125,426) (63,086) (6,918,617) – – (120,493) (14,107) (3,393) (3,278) (3,141) (10,268) (7,261,809) – – (1,002,160) (2,700) – (19,073) (6,844) (3,709) (2,975) (2,851) (8,526) (1,048,838) (2,373,386) – (3,210,719) – (88,640) (173,376) (20,849) (11,928) (2,908) (3,141) (11,297) (5,896,244) (80,544) – (1,205,349) (575,648) – (144,190) (24,776) (8,163) (3,277) (3,141) (11,335) (2,056,423) (300) – (247,728) (432,385) – (102,736) (8,539) (2,730) (3,277) (3,141) (8,172) (809,008) 94,002,612 86,943,660 217,342,131 109,701,842 49,689,785 This Fund changed name from Payden International Bond Fund on 24 March 2015. The accompanying notes form an integral part of the financial statements. 89 . PAYDEN GLOBAL FUNDS PUBLIC LIMITED COMPANY CONDENSED BALANCE SHEET (continued) AS AT 30 JUNE 2015 (continued) Payden Global Short Bond Fund(2) (USD) Payden Sterling Corporate Bond Fund Investment Grade (GBP) 0.11 Payden Global Government Bond Index Fund (USD) 0.07 Notes Current assets Financial assets at fair value through profit or loss Cash at bank Cash collateral Margin on derivative contracts Interest/dividends receivable Receivable for investments sold Receivable for subscriptions Rebate receivable from the Investment Manager Other receivables Total assets Current liabilities Financial liabilities at fair value through profit or loss Margin on derivative contracts Payable for investments purchased Payable for distributions Payable for redemptions Management fee payable Administration fee payable Custodian fee payable Directors fee payable Audit fee payable Other payables Total liabilities Net assets attributable to holders of redeemable participating shares at trading valuation (2) Payden Global High Yield Bond Fund (USD) Payden Global Inflation Linked Bond Fund (USD) 0.08 0.09 0.10 6 126,200,614 2,712,306 – – 1,224,388 – – 20,808 – 130,158,116 73,469,479 1,267,773 40,000 – 1,112,665 1,430,602 – 4,000 7,577 77,332,096 72,983,068 528,219 – – 312,353 – – 11,950 – 73,835,590 185,370,083 4,141,536 – – 851,420 209,970 – 23,281 958 190,597,248 17,179,910 70,123 30,000 15,840 315,362 – – 4,615 – 17,615,850 6 (1,534,164) – – (141,813) – (48,296) (14,716) (6,710) (3,277) (3,141) (8,478) (1,760,595) (105,680) (38) (600,000) – – (132,724) (16,808) (3,586) (3,278) (3,141) (7,037) (872,292) (962,639) (3,443) – (67,535) – (65,400) (10,158) (3,583) (3,277) (3,141) (8,113) (1,127,289) (1,704,370) – (3,723,354) – – (79,979) (17,534) (5,864) (3,277) (3,141) (9,657) (5,547,176) (9,240) – – – – (22,133) (1,465) (993) (2,149) (2,059) (6,598) (44,637) 128,397,521 76,459,804 72,708,301 185,050,072 17,571,213 This Fund changed name from Payden International Short Bond Fund on 24 March 2015. The accompanying notes form an integral part of the financial statements. 90 . PAYDEN GLOBAL FUNDS PUBLIC LIMITED COMPANY CONDENSED BALANCE SHEET (continued) AS AT 30 JUNE 2015 (continued) 0.13 Notes Current assets Financial assets at fair value through profit or loss Cash at bank Cash collateral Margin on derivative contracts Interest/dividends receivable Receivable for investments sold Receivable for subscriptions Rebate receivable from the Investment Manager Other receivables Total assets Current liabilities Financial liabilities at fair value through profit or loss Margin on derivative contracts Payable for investments purchased Payable for distributions Payable for redemptions Management fee payable Administration fee payable Custodian fee payable Directors fee payable Audit fee payable Other payables Total liabilities Net assets attributable to holders of redeemable participating shares at trading valuation Payden Sterling Reserve Fund (GBP) 0.14 Payden US Core Bond Fund (USD) 0.15 Payden Payden US Dollar USD Low Duration Liquidity Fund Credit Fund (USD) (USD) 0.16 0.17 Payden World Equity Fund (USD) 0.18 Total Company (USD) 6 277,406,114 2,238,959 – – 1,175,388 – – 26,809 12,240 280,859,510 17,624,801 908,765 20,000 – 98,056 670,935 – 7,714 – 19,330,271 17,977,082 252,034 – – 37,381 – 15,703 28,993 – 18,311,193 8,465,374 300,069 10,000 – 78,408 69,943 – 19,816 – 8,943,610 31,611,064 3,712,387 – 4,200,756 5,869 8,361 – 4,522 – 39,542,959 1,553,012,940 31,833,348 1,035,181 4,241,570 11,237,092 10,544,667 15,703 254,832 89,036 1,612,264,369 6 – – (1,498,849) (330,210) – (95,575) (14,903) (15,998) (2,149) (2,059) (9,448) (1,969,191) (32,337) – (2,529,045) – – (15,872) (6,469) (775) (3,277) (3,141) (5,493) (2,596,409) – – (59,962) (6,550) (112) (4,572) (7,678) (757) (3,277) (3,141) (13,750) (99,799) – (312) (319,495) – – (5,604) (6,438) (2,349) (3,277) (6,308) (33,928) (377,711) (633,915) – – – – (51,374) (4,243) (1,497) (3,278) (3,141) (8,343) (705,791) (7,567,293) (66,879) (22,288,115) (1,746,261) (88,752) (1,150,987) (185,683) (82,189) (49,032) (50,512) (170,606) (33,446,309) 278,890,319 16,733,862 18,211,394 8,565,899 38,837,168 1,578,818,060 The accompanying notes form an integral part of the financial statements. 91 . PAYDEN GLOBAL FUNDS PUBLIC LIMITED COMPANY CONDENSED BALANCE SHEET (continued) AS AT 31 DECEMBER 2014* Payden Euro Liquidity Fund(1) (EUR) Payden Global Emerging Markets Bond Fund (USD) Payden Global Emerging Markets Corporate Bond Fund (USD) 0.03 0.01 Notes Current assets Financial assets at fair value through profit or loss Cash at bank Cash collateral Margin on derivative contracts Interest/dividends receivable Receivable for investments sold Receivable for subscriptions Rebate receivable from the Investment Manager Other receivables Total assets Current liabilities Financial liabilities at fair value through profit or loss Bank overdraft Margin on derivative contracts Cash collateral payable Interest/dividends payable Payable for investments purchased Payable for redemptions Management fee payable Administration fee payable Custodian fee payable Directors fee payable Audit fee payable Other payables Total liabilities Net assets attributable to holders of redeemable participating shares at trading valuation Payden Absolute Return Bond Fund (USD) 0.02 0.04 0.05 Payden Global Emerging Payden Markets Local Global Government Bond Fund Bond Index Fund (USD) (USD) 0.06 6 74,296,934 952,196 – 51,888 457,001 11,916 – 4,161 16,597 75,790,693 56,357,884 106,512 – – 387,355 – – 1,783 – 56,853,534 135,839,133 807,312 1,040,933 – 2,440,426 207,652 – – – 140,335,456 48,278,906 548,461 – – 751,086 291,663 – 3,196 7,800 49,881,112 14,888 42,712 – – 1,110 – – – – 58,710 129,569,690 1,289,370 550,000 – 1,363,038 – – 3,881 – 132,775,979 6 (550,412) – – – – (9,790) – (17,840) (36,304) (10,413) (3,687) (5,457) (11,410) (645,313) – (140) – – – – – (2,179) (10,289) (4,269) (2,930) (4,296) (6,543) (30,646) (1,890,584) (981,736) – – – – – (58,786) (79,344) (26,404) (3,687) (5,456) (17,689) (3,063,686) (300,591) – – – – (8,768) – (64,743) (25,910) (7,905) (3,687) (5,456) (8,126) (425,186) (6,361) – – – – – – (2,527) (21,759) (2,050) (3,290) (5,517) (17,206) (58,710) (3,835,587) – – (550,000) – (1,491,739) – (7,328) (41,647) (20,142) (3,687) (5,456) (6,982) (5,962,568) 75,145,380 56,822,888 137,271,770 49,455,926 – 126,813,411 This Fund changed name from Payden Euro Liquidity – Enhanced Cash Fund on 1 April 2014. * Prior figures have been restated to comply with recent updates to accounting standards. (1) The accompanying notes form an integral part of the financial statements. 92 . PAYDEN GLOBAL FUNDS PUBLIC LIMITED COMPANY CONDENSED BALANCE SHEET (continued) AS AT 31 DECEMBER 2014* (continued) Payden Sterling Corporate Bond Fund Investment Grade (GBP) 0.11 Payden Global High Yield Bond Fund (USD) Payden Global Inflation Linked Bond Fund (USD) 6 79,003,646 1,830,489 176,000 – 1,321,574 – – 1,660 – 82,333,369 92,483,901 244,569 – – 317,926 171,027 – 2,755 – 93,220,178 252,020,721 4,180,551 – 34,572 2,355,625 684,240 – 5,182 – 259,280,891 56,452,703 282,383 – 8,838 338,247 34 – 4,618 10 57,086,833 16,988,660 280,857 30,000 – 341,987 – – 1,182 – 17,642,686 – 8,872 – – – – – – – 8,872 6 (856,316) – – – – (15,345) – (39,320) (50,447) (11,854) (3,687) (5,456) (6,087) (988,512) (489,137) – – – – – (24,008) (11,350) (29,956) (13,491) (3,687) (5,456) (5,285) (582,370) (13,187,623) – – – – (2,146,126) – (63,970) (66,438) (39,471) (2,458) (5,456) (14,028) (15,525,570) (1,153,860) – – – – – – (6,436) (37,050) (9,266) (8,553) (5,457) (9,849) (1,230,471) – – (16,140) – – – – (19,644) (7,118) (2,811) (2,278) (3,331) (4,876) (56,198) – – – – – – – – (936) (2,685) – (1,891) (3,360) (8,872) 81,344,857 92,637,808 243,755,321 55,856,362 17,586,488 - 0.07 Notes Current assets Financial assets at fair value through profit or loss Cash at bank Cash collateral Margin on derivative contracts Interest/dividends receivable Receivable for investments sold Receivable for subscriptions Rebate receivable from the Investment Manager Other receivables Total assets Current liabilities Financial liabilities at fair value through profit or loss Bank overdraft Margin on derivative contracts Cash collateral payable Interest/dividends payable Payable for investments purchased Payable for redemptions Management fee payable Administration fee payable Custodian fee payable Directors fee payable Audit fee payable Other payables Total liabilities Net assets attributable to holders of redeemable participating shares at trading valuation 0.08 0.09 Payden Payden International International Short Bond Fund Bond Fund (USD) (USD) 0.10 This Fund changed name from Payden Sterling Liquidity – Enhanced Cash Fund on 1 April 2014 and subsequently terminated on 25 June 2014. This Fund has since been revoked with the Central Bank of Ireland. * Prior figures have been restated to comply with recent updates to accounting standards. (2) The accompanying notes form an integral part of the financial statements. 93 0.12 Payden Sterling Liquidity Fund(2) (GBP) . PAYDEN GLOBAL FUNDS PUBLIC LIMITED COMPANY CONDENSED BALANCE SHEET (continued) AS AT 31 DECEMBER 2014* (continued) 0.13 Notes Current assets Financial assets at fair value through profit or loss Cash at bank Cash collateral Margin on derivative contracts Interest/dividends receivable Receivable for investments sold Receivable for subscriptions Rebate receivable from the Investment Manager Other receivables Total assets Current liabilities Financial liabilities at fair value through profit or loss Bank overdraft Margin on derivative contracts Cash collateral payable Interest/dividends payable Payable for investments purchased Payable for redemptions Management fee payable Administration fee payable Custodian fee payable Directors fee payable Audit fee payable Other payables Total liabilities Net assets attributable to holders of redeemable participating shares at trading valuation Payden Sterling Reserve Fund (GBP) 0.14 Payden US Core Bond Fund (USD) 0.15 Payden Payden US Dollar USD Low Duration Liquidity Fund(3) Credit Fund (USD) (USD) 0.16 0.17 Payden World Equity Fund (USD) 0.18 Total Company (USD) 6 280,166,477 168,492 – – 1,386,637 – – 4,227 – 281,725,833 18,837,276 131,973 – – 104,044 – – 2,406 – 19,075,699 26,800,289 235,965 – – 54,399 – 215,798 2,219 – 27,308,670 504,632,074 2,461,834 – – 4,762,131 – – – – 511,856,039 27,510,164 1,460,040 – 3,305,906 5,000 – – 1,031 – 32,282,141 1,977,275,317 15,311,221 1,813,710 3,401,204 17,435,683 1,366,532 215,798 41,701 24,407 2,016,885,573 6 – – – – – – – (15,990) (49,788) (51,722) (2,278) (3,331) (1,070) (124,179) (210,552) – – – (1,317) (1,058,584) – (2,376) (18,559) (2,673) (2,458) (5,456) (10,425) (1,312,400) – – – – – – – (1,037) (13,025) (2,842) (3,687) (5,456) (10,470) (36,517) – (1,028) – – – – – (44,222) (85,451) (73,318) (3,687) (5,457) (7,561) (220,724) (516,287) – – – – – – (7,327) (11,695) (4,576) (3,687) (5,456) (6,230) (555,258) (22,997,310) (982,934) (25,166) (550,000) (1,317) (4,730,352) (24,008) (385,461) (620,225) (318,788) (60,591) (89,527) (153,776) (30,939,455) 281,601,654 17,763,299 27,272,153 511,635,315 31,726,883 1,985,946,118 This Fund changed name from Payden US Dollar Liquidity – Enhanced Cash Fund on 1 April 2014. * Prior figures have been restated to comply with recent updates to accounting standards. (3) The accompanying notes form an integral part of the financial statements. 94 . PAYDEN GLOBAL FUNDS PUBLIC LIMITED COMPANY CONDENSED STATEMENT OF CHANGES IN NET ASSETS ATTRIBUTABLE TO HOLDERS OF REDEEMABLE PARTICIPATING SHARES FOR THE PERIOD ENDED 30 JUNE 2015 Payden Global Emerging Markets Corporate Bond Fund (USD) 0.05 Payden Payden Global Emerging Global Bond Markets Bond Fund(1) Fund (USD) (USD) 0.04 0.01 Notes Net assets attributable to holders of redeemable participating shares at beginning of period Translation adjustment Share transactions: Value of shares issued during the period Value of shares redeemed during the period Increase in net assets from operations attributable to holders of redeemable participating shares Net assets attributable to holders of redeemable participating shares at trading valuation at end of period (1) Payden Absolute Return Bond Fund (USD) 0.02 Payden Euro Liquidity Fund (EUR) 0.03 75,145,380 10 56,822,888 243,755,321 137,271,770 49,455,926 – – – – – 19,006,388 (1,251,093) 32,000,000 (2,000,000) 37,531,349 (56,167,542) 5,794,901 (28,791,873) 533,693 (1,175,832) 1,101,937 120,772 (7,776,997) (4,572,956) 875,998 94,002,612 86,943,660 217,342,131 109,701,842 49,689,785 This Fund changed name from Payden International Bond Fund on 24 March 2015. The accompanying notes form an integral part of the financial statements. 95 . PAYDEN GLOBAL FUNDS PUBLIC LIMITED COMPANY CONDENSED STATEMENT OF CHANGES IN NET ASSETS ATTRIBUTABLE TO HOLDERS OF REDEEMABLE PARTICIPATING SHARES (continued) FOR THE PERIOD ENDED 30 JUNE 2015 (continued) Payden Sterling Payden Corporate Bond Global Short Fund - Investment Bond Fund(2) Grade (USD) (GBP) 0.11 Payden Payden Global Payden Global Inflation Government Bond Global High Yield Linked Bond Notes Index Fund Bond Fund Fund (USD) (USD) (USD) 0.07 0.09 0.08 Net assets attributable to holders of redeemable participating shares at beginning of period 0.10 126,813,411 81,344,857 92,637,808 55,856,362 17,586,488 – – – – – Share transactions: Value of shares issued during the period Value of shares redeemed during the period 334,604 (217,932) 15,395,240 (21,877,182) 8,345,203 (28,106,948) 145,647,076 (14,881,809) 33,311 – Increase in net assets from operations attributable to holders of redeemable participating shares 1,467,438 1,596,889 (167,762) (1,571,557) (48,586) 128,397,521 76,459,804 72,708,301 185,050,072 17,571,213 Translation adjustment Net assets attributable to holders of redeemable participating shares at trading valuation at end of period (2) 10 This Fund changed name from Payden International Short Bond Fund on 24 March 2015. The accompanying notes form an integral part of the financial statements. 96 . PAYDEN GLOBAL FUNDS PUBLIC LIMITED COMPANY CONDENSED STATEMENT OF CHANGES IN NET ASSETS ATTRIBUTABLE TO HOLDERS OF REDEEMABLE PARTICIPATING SHARES (continued) FOR THE PERIOD ENDED 30 JUNE 2015 (continued) Payden US Dollar Liquidity Fund (USD) Payden USD Low Duration Credit Fund (USD) 0.16 0.13 Notes Net assets attributable to holders of redeemable participating shares at beginning of period Translation adjustment Share transactions: Value of shares issued during the period Value of shares redeemed during the period Increase in net assets from operations attributable to holders of redeemable participating shares Net assets attributable to holders of redeemable participating shares at trading valuation at end of period Payden Sterling Reserve Fund (GBP) Payden US Core Bond Fund (USD) 0.14 0.15 0.17 Payden World Equity Fund (USD) 0.18 Total Company (USD) 281,601,654 10 17,763,299 27,272,153 511,635,315 31,726,883 1,985,946,118 – – – – – (1,609,665) 16,535,812 (19,241,748) 1,524,799 (2,169,224) 1,071,190 (10,174,855) 138,768,383 (648,326,555) 6,200,000 (61,000) 441,114,513 (844,756,345) (5,399) (385,012) 42,906 6,488,756 971,285 (1,876,561) 278,890,319 16,733,862 18,211,394 8,565,899 38,837,168 1,578,818,060 The accompanying notes form an integral part of the financial statements. 97 . PAYDEN GLOBAL FUNDS PUBLIC LIMITED COMPANY CONDENSED STATEMENT OF CHANGES IN NET ASSETS ATTRIBUTABLE TO HOLDERS OF REDEEMABLE PARTICIPATING SHARES (continued) FOR THE PERIOD ENDED 30 JUNE 2014 Payden Global Emerging Payden Payden Markets Global Emerging Global Corporate Bond Markets Local Government Bond Fund Bond Fund Index Fund (USD) (USD) (USD) 0.04 Payden Payden Global Emerging Euro Liquidity Markets Bond Fund(1) Fund (EUR) (USD) 0.02 0.01 Notes Net assets attributable to holders of redeemable participating shares at beginning of period Translation adjustment Share transactions: Value of shares issued during the period Value of shares redeemed during the period Increase in net assets from operations attributable to holders of redeemable participating shares Net assets attributable to holders of redeemable participating shares at trading valuation at end of period 1) Payden Absolute Return Bond Fund (USD) 0.01 0.05 0.06 47,620,019 10 22,778,653 200,120,170 45,260,865 18,565,299 113,018,629 – – – – – – 15,512,427 (6,413) – (5,984,480) 8,765,911 (44,189,642) 388,964 – 12,351 (6,904,692) 6,054,571 (3,769,750) 2,297,072 97,389 11,850,341 2,179,109 319,763 5,399,209 65,423,105 16,891,562 176,546,780 47,828,938 11,992,721 120,702,659 This Fund changed name from Payden Euro Liquidity – Enhanced Cash Fund on 1 April 2014. The accompanying notes form an integral part of the financial statements. 98 . PAYDEN GLOBAL FUNDS PUBLIC LIMITED COMPANY CONDENSED STATEMENT OF CHANGES IN NET ASSETS ATTRIBUTABLE TO HOLDERS OF REDEEMABLE PARTICIPATING SHARES (continued) FOR THE PERIOD ENDED 30 JUNE 2014 (continued) Payden Sterling Payden Corporate Bond Payden International Fund - Investment Sterling Liquidity Short Bond Fund Grade Fund(2) (USD) (GBP) (GBP) 0.11 Payden Global High Yield Notes Bond Fund (USD) Payden Global Inflation Linked Bond Fund (USD) 81,440,007 93,131,933 234,002,783 41,352,911 16,376,826 5,611,318 – – – – – – 3,024,860 (7,430,236) 1,035,092 (5,515,104) 24,199,867 (27,250,451) 23,362,417 (3,601,416) 31,329 – 10,771 (5,638,991) 4,743,285 5,419,589 8,149,402 349,857 448,087 16,902 81,777,916 94,071,510 239,101,601 61,463,769 16,856,242 – 0.08 0.07 Net assets attributable to holders of redeemable participating shares at beginning of period Translation adjustment Share transactions: Value of shares issued during the period Value of shares redeemed during the period Increase in net assets from operations attributable to holders of redeemable participating shares Net assets attributable to holders of redeemable participating shares at trading valuation at end of period (2) 10 0.09 Payden International Bond Fund (USD) 0.1 0.12 This Fund changed name from Payden Sterling Liquidity – Enhanced Cash Fund on 1 April 2014 and subsequently terminated on 25 June 2014. This Fund has since been revoked with the Central Bank of Ireland. The accompanying notes form an integral part of the financial statements. 99 . PAYDEN GLOBAL FUNDS PUBLIC LIMITED COMPANY CONDENSED STATEMENT OF CHANGES IN NET ASSETS ATTRIBUTABLE TO HOLDERS OF REDEEMABLE PARTICIPATING SHARES (continued) FOR THE PERIOD ENDED 30 JUNE 2014 (continued) 0.16 0.13 Notes Net assets attributable to holders of redeemable participating shares at beginning of period Translation adjustment Share transactions: Value of shares issued during the period Value of shares redeemed during the period Increase in net assets from operations attributable to holders of redeemable participating shares Net assets attributable to holders of redeemable participating shares at trading valuation at end of period (3) Payden Sterling Reserve Fund (GBP) 0.14 Payden Payden US Core Bond US Dollar Fund Liquidity Fund(3) (USD) (USD) 0.15 Payden USD Low Duration Credit Fund (USD) 0.17 Payden World Equity Fund (USD) 0.18 Total Company (USD) 308,824,190 10 23,113,302 5,074,947 286,403,863 30,478,577 1,798,879,641 – – – – – 12,018,644 47,140,503 (41,234,580) 805,809 (43,727) 5,555,609 (903,581) 196,640,000 – 127,196 (135,000) 285,485,074 (99,750,012) 716,426 453,597 9,060 9,284,976 1,424,101 51,879,361 315,446,539 24,328,981 9,736,035 492,328,839 31,894,874 2,048,512,708 This Fund changed name from Payden US Dollar Liquidity – Enhanced Cash Fund on 1 April 2014. The accompanying notes form an integral part of the financial statements. 100 . PAYDEN GLOBAL FUNDS PUBLIC LIMITED COMPANY NOTES TO THE FINANCIAL STATEMENTS 1. ESTABLISHMENT Payden Global Funds public limited company (the “Company”) is an umbrella fund with segregated liability between its sub-funds and was incorporated as an investment company on 1 July 1999 under the laws of Ireland as Payden & Rygel Global Funds public limited company. The Company changed its name on 14 October 2005. The Company is an investment company with variable capital.
The shares of the Company are admitted to the Official List and to trading on the Main Securities Market of the Irish Stock Exchange (“ISE”) and is authorised in Ireland by the Central Bank of Ireland (the “Central Bank”) as an undertaking for collective investment in transferable securities pursuant to the European Communities (Undertakings for Collective Investment in Transferable Securities) Regulations 2011, as amended (the “Regulations”). During the period ended 30 June 2015, the Company had fifteen sub-funds (individually referred as the “Fund” and collectively as the “Funds”) in which shares were funded as follows: Payden Absolute Return Fund Payden Euro Liquidity Fund Payden Global Bond Fund(1) Payden Global Emerging Markets Bond Fund Payden Global Emerging Markets Corporate Bond Fund Payden Global Government Bond Index Fund Payden Global High Yield Bond Fund Payden Global Inflation-Linked Bond Fund Payden Global Short Bond Fund(2) Payden Sterling Corporate Bond Fund – Investment Grade Payden Sterling Reserve Fund Payden US Core Bond Fund Payden US Dollar Liquidity Fund Payden USD Low Duration Credit Fund Payden World Equity Fund (1) (2) This Fund changed name from Payden International Bond Fund on 24 March 2015. This Fund changed name from Payden International Short Bond Fund on 24 March 2015. The Payden Global Emerging Markets Local Bond Fund and the Payden Sterling Liquidity Fund terminated on 12 December 2014 and 25 June 2014 respectively and have since been revoked with the Central Bank. There is one unfunded Fund approved by the Central Bank in the Company namely Payden Global Corporate Bond Fund. The valuation date for the Funds was 30 June 2015, as this was the last dealing day of the Company in the financial period ended 30 June 2015. 2. SIGNIFICANT ACCOUNTING POLICIES The following is a summary of the significant accounting policies adopted by the Company: i) Basis of preparation and accounting convention The financial statements presented are unaudited condensed financial statements for the six month period ended 30 June 2015. The financial statements have been prepared in accordance with accounting standards generally accepted in Ireland, as issued by the Financial Reporting Council and published by the Insitute of Chartered Accountants in Ireland, Irish Statute comprising the Companies Act 2014 and the Regulations, the UCITS Regulations and the listing rules of the ISE. The financial statements are prepared under the historical cost convention as modified by the revaluation of financial assets and financial liabilities held at fair value through profit or loss. FRS 102 The financial reporting standard applicable in the UK and Republic of Ireland (“FRS 102”) is effective for accounting periods beginning on or after 1 January 2015 and replaces the accounting standards under which the financial statements of the Company were previously prepared.
These unaudited condensed financial statements have been prepared in accordance with the new standard for interim statements, FRS 104, and should be read in conjunction with the audited financial statements for the year ended 31 December 2014. FRS 104 Interim financial reporting (“FRS 104”) is effective for interim reporting periods commencing on or after 1 January 2015. These financial statements are the first financial statements to comply with FRS 104.
The transition to FRS 104 has resulted in a number of changes in accounting policies and certain reclassifications have been made to previously reported amounts to conform with current period presentation. These reclassification have had no impact on reported shareholder dealing net assets. 101 . PAYDEN GLOBAL FUNDS PUBLIC LIMITED COMPANY NOTES TO THE FINANCIAL STATEMENTS (continued) 2. SIGNIFICANT ACCOUNTING POLICIES (continued) i) Basis of preparation and accounting convention (continued) The information required to be included in the Statement of Total Recognised Gains and Losses and a Reconciliation of Movements in Shareholders Funds, is, in the opinion of the Directors contained in the Condensed Profit and Loss account and the Condensed Statement of Changes in Net Assets Attributable to Holders of Redeemable Participating Shares on pages 83 and 95, respectively. The Company has availed of the exemption available to investment funds under FRS 102 not to prepare a cash flow statement. The aggregated financial statements for the Company are denominated in US Dollar (“USD”). ii) Financial assets at fair value through profit or loss This category has two sub-categories: financial assets and liabilities held for trading, and those designated by management at fair value through profit or loss at inception. In accordance with FRS 102: “Financial Instruments: Recognition and Measurement”, all of the Company’s investments are classified as held for trading. Financial assets and liabilities held for trading are securities that were either acquired for generating a profit from short-term fluctuations in price or dealer margins, or are included in a portfolio where a pattern of short-term trading exists.
Derivatives, unless designated as effective hedging instruments, are categorised as held for trading. While positions within the portfolio will often be held with a view to long term capital gains, the Company also undertakes short term trading and, accordingly, for the purpose of FRS 102, the Directors have classified the Company’s portfolio as financial assets and liabilities held for trading. Regular-way purchases and sales of investments are recognised on trade date – the date on which the Company commits to purchase or sell the assets. Investments are initially recognised at fair value, and transaction costs for all financial assets carried at fair value through profit or loss are expensed as incurred.
Investments are subsequently re-measured at fair value at period-end. Investments are derecognised when the rights to receive cash flows from the investments have expired or the Company has transferred substantially all risks and rewards of ownership. Gains and losses arising from changes in the fair value of the “financial assets and liabilities at fair value through profit or loss” category are included in the Profit and Loss Account in the period in which they arise. The fair value of financial instruments traded in active markets (such as publicly traded derivatives, trading securities and units or shares in collective investment schemes) is based on quoted market prices at the balance sheet date.
When the Company holds derivatives with offsetting market risks it uses mid-market prices as a basis for establishing fair values for the offsetting risk positions. In order to determine the net asset value of the Company for subscriptions and redemptions, investments have been valued using mid-market price in accordance with the prospectus. The quoted market price used for financial assets and liabilities held by the Company is the current mid-market price, in accordance with IFRS 9: “Financial Instruments”.
For the audited financial statements for the year ended 31 December 2014, securities which were quoted, listed or traded on an exchange were valued for financial reporting purposes at the current bid or ask price, respectively, at the valuation point. Financial assets and liabilities at fair value through profit or loss for the year ended 31 December 2014 have been restated to reflect the changes from bid to mid price. Transaction costs for purchases and sales of equities are included in the net gains/(losses) on financial assets and liabilities at fair value through profit or loss in the Profit and Loss Account for each Fund. iii) Future contracts Initial margin deposits are made upon entering into future contracts and are generally made in cash at bank.
Future contracts are valued based upon their quoted daily settlement prices. Changes in the value of open future contracts are recognised as unrealised gains or losses on future contracts until the contracts are expired at which time realised gains and losses are recognised. Unrealised gains or losses on future contracts are included in financial assets/liabilities at fair value through profit or loss on the Balance Sheet. The initial margin receivable or payable at the reporting date is reported as an asset or liability, as applicable on the Balance Sheet.
Realised and unrealised gains or losses on future contracts are included within the net gains/(losses) on financial assets and liabilities at fair value through profit or loss in the Profit and Loss Account. Transaction costs for purchases and sales of futures are included in the net gains/(losses) on financial assets and liabilities at fair value through profit or loss in the Profit and Loss Account for each Fund. iv) Forward foreign currency contracts Forward foreign currency contracts are used primarily to protect the Company from adverse currency and interest rate movements. Contracts outstanding at the period-end are valued at their market value. The resulting gain or loss is included in net gains/(losses) on financial assets and liabilities at fair value through profit or loss in the Profit and Loss Account. 102 .
PAYDEN GLOBAL FUNDS PUBLIC LIMITED COMPANY NOTES TO THE FINANCIAL STATEMENTS (continued) 2. SIGNIFICANT ACCOUNTING POLICIES (continued) v) Options The unrealised gain or loss on open option positions is calculated and recorded as the fair value of the option less the premium paid on that option. The fair value of the options which are dealt in on a securities market are the settlement price as determined by the market. Unrealised gains or losses on open option positions are included in financial assets and liabilities at fair value through profit and loss in the Balance Sheet. The premium on purchased put options exercised is subtracted from the proceeds of the sale of the underlying security or foreign currency in determining the realised gain or loss.
The premium on purchased call options exercised is added to the cost of the securities or foreign currency purchased. Premiums paid from the purchase of options, which expire unexercised, are treated as realised losses. vi) Swaps Credit default, interest rate swaps and inflation swaps are recognised at fair value on the date on which the derivative contract is entered into and are subsequently remeasured at their fair value. The swaps are valued by the counterparty daily and verified at least weekly by a competent person appointed by the Directors (such as the Investment Manager) approved for such purpose by the Custodian and who is independent of the counterparty on the basis of their marked-to-market price. All derivatives are carried as assets when fair value is positive and as liabilities when fair value is negative. vii) Interest income and expenses Bank interest and income on debt securities are included in the Profit and Loss Account on an effective yield basis.
Income and/or expenses on debt securities are included in income on debt securities in the Profit and Loss Account and may have a negative balance. Expenses and withholding taxes are accounted for on an accrual basis. viii) Dividend policy Distributions to holders of redeemable participating shares are classified as finance costs in the Profit and Loss Account. All net investment and net realised capital gains are retained by the Company and are reflected in the net asset value of the Funds.
In the event that the Company has paid or decided to pay any dividend on behalf of a Fund, such dividend will be paid in compliance with ISE regulations and in accordance with the articles of association, i.e. out of the profits available for distribution. The distributions for the year are set out in Note 7 to the financial statements. ix) Foreign currencies Assets and liabilities denominated in foreign currencies are translated into the functional currency at the exchange rates ruling at the period end.
Transactions denominated in currencies other than the functional currency are translated into the functional currency at the exchange rates ruling at the dates of the transactions. All gains and losses arising on foreign currency translations are included in the Profit and Loss Account. A notional foreign exchange adjustment is included in the Statement of Changes in Net Assets Attributable to Holders of Redeemable Participating Shares.
The following exchange rates at the period end have been used to translate assets and liabilities in other currencies to USD: 30 June 2015 Currency Description Argentine Peso Australian Dollar Brazilian Real British Pound Canadian Dollar Chilean Peso Colombian Peso Costa Rican Colon Danish Krone Euro Ghanaian Cedi Hong Kong Dollar Hungarian Forint Indian Rupee Indonesian Rupiah Israeli Shekel Japanese Yen Korean Won ARS AUD BRL GBP CAD CLP COP CRC DKK EUR GHS HKD HUF INR IDR ILS JPY KRW 31 December 2014 1.3011 3.1064 0.6358 1.2485 2,599.6000 6.6953 0.8975 7.7526 282.9564 63.6800 13,332.5000 122.3650 1,115.4500 8.4645 1.2220 2.6582 0.6413 1.1583 606.9000 2,376.5000 539.4200 6.1538 0.8264 3.2176 7.7549 260.9397 63.1225 12,385.0000 3.9041 119.8950 1,099.1500 103 30 June 2015 Currency Description Malaysian Ringgit Mexican Peso New Zealand Dollar Nigerian Naira Norwegian Krone Peruvian Neuvo Sol Philippine Peso Polish Zloty Romanian Leu Russian Ruble Singapore Dollar South African Rand Swedish Krona Swiss Franc Thai Baht Turkish Lira Uruguayan Peso Zambian Kwacha MYR MXN NZD NGN NOK PEN PHP PLN RON RUB SGD ZAR SEK CHF THB TRY UYU ZMK 31 December 2014 3.7730 15.6907 1.4786 198.9000 7.8675 3.1776 45.0900 3.7609 4.0190 55.7149 1.3465 12.1378 8.2975 0.9346 33.7755 2.6790 - 3.4965 14.7398 1.2830 182.5100 7.4975 2.9765 44.7400 3.5520 3.7054 60.0000 1.3251 11.5688 7.8283 0.9937 32.9000 2.3378 24.3150 6,386.0000 . PAYDEN GLOBAL FUNDS PUBLIC LIMITED COMPANY NOTES TO THE FINANCIAL STATEMENTS (continued) 2. SIGNIFICANT ACCOUNTING POLICIES (continued) ix) Foreign currencies (continued) In respect of the aggregation of Funds’ financial statements, the following exchange rates against the USD were used in the preparation of the accounts: 30 June 2015 30 June 2014 Closing rate Average rate Closing rate Average rate Euro EUR 0.8975 0.8968 0.7304 0.7651 Sterling Pound GBP 0.6358 0.6565 0.5848 0.6223 x) Redeemable participating shares Redeemable participating shares are redeemable at the shareholder’s option and are classified as financial liabilities. The dividend, if any, on these redeemable participating shares is recognised in the Profit and Loss Account as finance costs. The shares can be redeemed at any time for cash equal to a proportionate share of the relevant Fund’s net asset value.
A share is carried at the redemption amount that is payable at the Balance Sheet date if the shareholder exercised its right to put the share back to the Fund. The fair value of the financial liability for the shares is the redemption amount per share, calculated as the net asset value per share less any associated duties and charges and any redemption dividend which is payable on the shares redeemed. 3. EFFICIENT PORTFOLIO MANAGEMENT The Investment Manager may invest in financial derivative instruments for investment purposes as specified in the Company’s prospectus. In addition, each Fund may utilise techniques and instruments for efficient portfolio management purposes or to protect against foreign exchange rate risks, subject to the conditions and within the limits laid down by the Central Bank.
Such techniques and instruments include, but are not limited to, futures, options, swaps, warrants, stock lending arrangements, repurchase/reverse repurchase agreements, forward foreign currency contracts and when issued and/or delayed delivery securities. Efficient portfolio management transactions relating to the assets of a Fund may be entered into with one of the following aims: a reduction of risk, a reduction of cost with no increase or a minimal increase in risk or generation of additional capital or income with no, or an acceptably low level of risk (relative to the expected return). The Company currently invests in futures, options, swaps and forward foreign currency contracts in order to hedge currency and market exposure as well as increase capital and income returns. Forward foreign currency contracts are used to hedge against anticipated future changes in exchange rates which otherwise might either adversely affect the value of the Company’s portfolio securities or adversely affect the price of securities which the Company intends to purchase at a later date. Forward foreign currency contracts are also used to take small active currency positions, where guidelines permit.
The counterparties of the forward foreign currency contracts are shown in the Schedule of Investments. During the period ended 30 June 2015 and year ended 31 December 2014, the Company has not used any stock lending arrangements. 4. TRANSACTION COSTS Transaction costs are costs incurred in connection with the purchase and sale of financial assets or liablities at fair value through profit or loss. They include such fees as commissions paid to agents, brokers or dealers. Transaction costs on equities, collective investment schemes, options and futures are included in the net gains/(losses) on financial assets and liabilities at fair value through profit or loss in the Condensed Profit and Loss Account for each Fund. Transaction costs on bonds are included in the purchase and sale price of the investment as per standard fixed income market practice.
They cannot be practically or reliabley gathered as they are embedded in the cost of investment and cannot be separately verified or disclosed. Similarly, transaction costs on the purchase and sale of forward foreign exchange contracts and swaps are included in the purchase and sale prices of the investment and cannot be separately verified or disclosed. 104 . PAYDEN GLOBAL FUNDS PUBLIC LIMITED COMPANY NOTES TO THE FINANCIAL STATEMENTS (continued) 4. TRANSACTION COSTS (continued) The custody transaction costs for the period ended 30 June 2015 and 30 June 2014 are disclosed in the Condensed Profit and Loss Account under the heading ‘Custodian fees’. 5. SHAREHOLDERS FUNDS i) Authorised Shares The authorised share capital of the Company is 500 billion shares of no par value initially designated as unclassified shares. The unclassified shares are available for issue as participating shares. The capital of the Company is equal to the net asset value of the Company. Six subscriber shares are in issue (issued for the purposes of the incorporation of the Company), one of which is held by Payden & Rygel and the remainder of which are each held by a Managing Partner of Payden & Rygel for the benefit of Payden & Rygel.
Each subscriber share gives the holder the right to vote and to one vote in relation to any matters relating to the Company which are submitted to shareholders for a vote by poll. ii) Redeemable Participating Shares Redeemable participating shares carry the right to a proportionate share in the net assets of the Funds and the holders of the shares are entitled to one vote for every share held in relation to any matters relating to the Company which are submitted to shareholders for a vote by poll. The issued redeemable participating share capital is at all times equal to the net asset value of the Company. The net asset value per share is determined by dividing the value of the net assets of each Fund for each share class by the total number of shares in issue in the relevant Fund for that share class that time. 105 . PAYDEN GLOBAL FUNDS PUBLIC LIMITED COMPANY NOTES TO THE FINANCIAL STATEMENTS (continued) 5. SHAREHOLDERS FUNDS (continued) ii) Redeemable Participating Shares (continued) At 30 June 2015, the Company had the following shares in issue: Payden Absolute Return Bond Fund Payden Euro Liquidity Fund Euro Class (Accumulating) Sterling Class (Accumulating) US Dollar Class (Accumulating) Euro Class (Accumulating) Euro Class (Distributing) (EUR) 64,327 (GBP) 2,614,120 (USD) 4,794,829 (EUR) 4,328,079 (EUR) 1,500,000 (EUR) 645,762 (GBP) 27,384,899 (USD) 50,214,874 (EUR) 71,965,188 (EUR) 14,978,472 (EUR) 10.04 (GBP) 10.48 (USD) 10.47 (EUR) 16.63 (EUR) 9.99 Euro Class (Accumulating) Norwegian Krone Class (Accumulating) Sterling Class (Accumulating) US Dollar Class (EUR) 1,355,266 (NOK) 6,747,997 (GBP) 875,618 (USD) 2,620,736 (EUR) 21,073,281 (NOK) 841,305,106 (GBP) 16,662,261 (USD) 60,723,306 (EUR) 15.55 (NOK) 124.67 (GBP) 19.03 (USD) 23.17 At trading valuation: Shares outstanding 30 June 2015 Net asset value 30 June 2015 Net asset value per share 30 June 2015 Payden Global Bond Fund* At trading valuation: Shares outstanding 30 June 2015 Net asset value 30 June 2015 Net asset value per share 30 June 2015 106 . PAYDEN GLOBAL FUNDS PUBLIC LIMITED COMPANY NOTES TO THE FINANCIAL STATEMENTS (continued) 5. SHAREHOLDERS FUNDS (continued) ii) Redeemable Participating Shares (continued) Payden Global Emerging Markets Bond Fund Euro Class (Accumulating) Euro Class (Distributing) Sterling Class (Accumulating) Sterling Class (Distributing) US Dollar Class US Dollar Class (Accumulating) US Dollar Class (Distributing) (EUR) 986,810 (EUR) 1,159,426 (GBP) 535,327 (GBP) 2,020 (USD) 985,751 (USD) 1,420 (USD) 4,618,949 (EUR) 18,204,498 (EUR) 10,167,264 (GBP) 6,616,065 (GBP) 18,146 (USD) 27,664,764 (USD) 14,226 (USD) 39,977,412 (EUR) 18.45 (EUR) 8.77 (GBP) 12.36 (GBP) 8.98 (USD) 28.06 (USD) 10.02 (USD) 8.66 At trading valuation: Shares outstanding 30 June 2015 Net asset value 30 June 2015 Net asset value per share 30 June 2015 Payden Global Emerging Markets Corporate Bond Fund Swiss Franc Class (Accumulating) US Dollar Class (Distributing) (CHF) 814,018 (USD) 4,354,324 (CHF) 8,236,535 (USD) 40,876,414 (CHF) 10.12 (USD) 9.39 At trading valuation: Shares outstanding 30 June 2015 Net asset value 30 June 2015 Net asset value per share 30 June 2015 107 . PAYDEN GLOBAL FUNDS PUBLIC LIMITED COMPANY NOTES TO THE FINANCIAL STATEMENTS (continued) 5. SHAREHOLDERS FUNDS (continued) ii) Redeemable Participating Shares (continued) Payden Global Government Bond Index Fund Norwegian Krone Class (Accumulating) Singapore Dollar Class (Distributing) Sterling Class (Accumulating) Sterling Class (Distributing) Swiss Franc Class (Accumulating) (NOK) 1,357,678 (SGD) 442,835 (GBP) 129,961 (GBP) 1,904,428 (CHF) 4,771,451 (NOK) 184,171,433 (SGD) 4,564,451 (GBP) 1,561,251 (GBP) 21,977,687 (CHF) 60,352,143 (NOK) 135.65 (SGD) 10.31 (GBP) 12.01 (GBP) 11.54 (CHF) 12.65 Canadian Dollar Class (Accumulating) Sterling Class (Accumulating) Swiss Franc Class (Accumulating) US Dollar Class (CAD) 1,952,268 (GBP) 637,072 (CHF) 845,839 (USD) 1,058,485 (CAD) 33,390,845 (GBP) 10,158,574 (CHF) 9,155,411 (USD) 23,940,976 (CAD) 17.10 (GBP) 15.95 (CHF) 10.82 (USD) 22.62 At trading valuation: Shares outstanding 30 June 2015 Net asset value 30 June 2015 Net asset value per share 30 June 2015 Payden Global High Yield Bond Fund At trading valuation: Shares outstanding 30 June 2015 Net asset value 30 June 2015 Net asset value per share 30 June 2015 108 . PAYDEN GLOBAL FUNDS PUBLIC LIMITED COMPANY NOTES TO THE FINANCIAL STATEMENTS (continued) 5. SHAREHOLDERS FUNDS (continued) ii) Redeemable Participating Shares (continued) Payden Global Inflation - Linked Bond Fund Sterling Class (Accumulating) Sterling Class Sterling Class Unhedged (Distributing) (Distributing) US Dollar Class (Accumulating) At trading valuation: Shares outstanding 30 June 2015 Net asset value per share 30 June 2015 (GBP) 1,038,599 (GBP) 1,861,153 (USD) 1,378,647 (GBP) 1,544,904 (GBP) 12,996,201 (GBP) 20,296,292 (USD) 17,919,529 (GBP) 11.85 (GBP) 12.51 (GBP) 10.91 (USD) 13.00 Norwegian Krone Class (Accumulating) Net asset value 30 June 2015 (GBP) 130,335 US Dollar Class (NOK) 10,818,167 (USD) 2,822,345 (NOK) 1,122,847,438 (USD) 42,330,347 (NOK) 103.79 (USD) 15.00 Payden Global Short Bond Fund* At trading valuation: Shares outstanding 30 June 2015 Net asset value 30 June 2015 Net asset value per share 30 June 2015 109 . PAYDEN GLOBAL FUNDS PUBLIC LIMITED COMPANY NOTES TO THE FINANCIAL STATEMENTS (continued) 5. SHAREHOLDERS FUNDS (continued) ii) Redeemable Participating Shares (continued) Payden Sterling Corporate Bond Fund - Investment Grade Payden Sterling Reserve Fund Payden US Core Bond Fund Sterling Class (Accumulating) Sterling Class (Accumulating) Sterling Class (Distributing) US Dollar Class (GBP) 1,178,487 (GBP) 11,942,322 (GBP) 15,009,544 (USD) 1,498,652 (GBP) 17,571,213 (GBP) 127,416,259 (GBP) 151,474,060 (USD) 16,733,862 (GBP) 14.91 (GBP) 10.67 (GBP) 10.09 (USD) 11.17 At trading valuation: Shares outstanding 30 June 2015 Net asset value 30 June 2015 Net asset value per share 30 June 2015 Payden US Dollar Liquidity Fund Payden USD Low Duration Credit Fund Payden World Equity Fund US Dollar Class (Accumulating) US Dollar Class (Distributing) US Dollar Class (Accumulating) US Dollar Class (Accumulating) (USD) 564,103 (USD) 682,297 (USD) 829,706 (USD) 3,185,923 (USD) 5,839,178 (USD) 12,372,216 (USD) 8,565,899 (USD) 38,837,168 (USD) 10.35 (USD) 18.13 (USD) 10.32 (USD) 12.19 At trading valuation: Shares outstanding 30 June 2015 Net asset value 30 June 2015 Net asset value per share 30 June 2015 *See Note 1. 110 . PAYDEN GLOBAL FUNDS PUBLIC LIMITED COMPANY NOTES TO THE FINANCIAL STATEMENTS (continued) 6. FAIR VALUE ESTIMATION The Company has classified fair value measurements using a fair value hierarchy. The fair value hierarchy has the following levels: i) Level A: The best evidence of fair value is a quoted price for an identical asset in an active market. Quoted in an active market in this context means quoted prices are readily and regularly available and those prices represent actual and regularly occurring market transactions on an arm’s length basis. ii) Level B: When quoted prices are unavailable, the price of a recent transaction for an identical asset provides evidence of fair value as long as there has been a significant change in economic circumstances or a significant lapse of time since the transaction took place.
If the entity can demonstrate that the last transaction price is not a good estimate of fair value (e.g. because it reflects the amount that an entity would receive or pay in a forced transaction, involuntary liquidation or distress sale), that price is adjusted. iii) Level C: If the market for the asset is not active and recent transactions of an identical asset on their own are not a good estimate of fair value, an entity estimates the fair value by using a valuation technique. The objective of using a valuation technique is to estimate what the transaction price would have been on the measurement date in an arm’s length exchange motivated by normal business considerations. The tables below provide an analysis within the fair value hierarchy of the Funds’ financial assets and liabilities measured at fair value as at 30 June 2015 and as at 31 December 2014: Payden Absolute Return Bond Fund As at 30 June 2015 Transferable securities - Bonds Unrealised gain on Forward foreign currency contracts Unrealised gain on Futures contracts Unrealised gain on Options Level A 90,315,682 – 60,856 – 90,376,538 Level B – – – – – Level C 1,258,585 1,459,190 – 29,436 2,747,211 Total (USD) 91,574,267 1,459,190 60,856 29,436 93,123,749 Unrealised loss on Forward foreign currency contracts Unrealised loss on Futures contracts – (38,871) (38,871) – – – (86,555) – (86,555) (86,555) (38,871) (125,426) As at 31 December 2014 Transferable securities - Bonds Unrealised gain on Forward foreign currency contracts Unrealised gain on Futures contracts Unrealised gain on Options Level A 72,231,138 – 10,150 – 72,241,288 Level B – – – – – Level C 1,507,599 278,843 – 39,420 1,825,862 Total (USD) 73,738,737 278,843 10,150 39,420 74,067,150 Unrealised loss on Forward foreign currency contracts Unrealised loss on Futures contracts – (87,875) (87,875) – – – (462,537) – (462,537) (462,537) (87,875) (550,412) As at 30 June 2015 Transferable securities - Bonds Level A 86,441,802 86,441,802 Level B – – Level C – – Total (EUR) 86,441,802 86,441,802 As at 31 December 2014 Transferable securities - Bonds Level A 56,317,026 56,317,026 Level B – – Level C – – Total (EUR) 56,317,026 56,317,026 Payden Euro Liquidity Fund 111 .
PAYDEN GLOBAL FUNDS PUBLIC LIMITED COMPANY NOTES TO THE FINANCIAL STATEMENTS (continued) 6. FAIR VALUE ESTIMATION (continued) Payden Global Bond Fund* As at 30 June 2015 Transferable securities - Bonds Unrealised gain on Forward foreign currency contracts Unrealised gain on Futures contracts Level A 207,661,434 – 46,789 207,708,223 Level B – – – – Level C – 3,282,191 – 3,282,191 Total (USD) 207,661,434 3,282,191 46,789 210,990,414 Unrealised loss on Forward foreign currency contracts Unrealised loss on Futures contracts – (180,950) (180,950) – – – (2,192,436) – (2,192,436) (2,192,436) (180,950) (2,373,386) As at 31 December 2014 Transferable securities - Bonds Unrealised gain on Forward foreign currency contracts Unrealised gain on Futures contracts Level A 247,419,554 – 96,084 247,515,638 Level B – – – – Level C – 4,268,182 – 4,268,182 Total (USD) 247,419,554 4,268,182 96,084 251,783,820 Unrealised loss on Forward foreign currency contracts Unrealised loss on Futures contracts Unrealised loss on Swaps – (147,695) – (147,695) – – – – (12,647,432) – (392,496) (13,039,928) (12,647,432) (147,695) (392,496) (13,187,623) As at 30 June 2015 Transferable securities - Bonds Unrealised gain on Forward foreign currency contracts Level A 104,841,407 – 104,841,407 Level B – – – Level C 704,755 975,279 1,680,034 Total (USD) 105,546,162 975,279 106,521,441 Unrealised loss on Forward foreign currency contracts – – – – (80,544) (80,544) (80,544) (80,544) As at 31 December 2014 Transferable securities - Bonds Unrealised gain on Forward foreign currency contracts Level A 133,740,791 – 133,740,791 Level B – – – Level C 1,123,841 370,220 1,494,061 Total (USD) 134,864,632 370,220 135,234,852 Unrealised loss on Forward foreign currency contracts – – – – (1,890,584) (1,890,584) (1,890,584) (1,890,584) As at 30 June 2015 Transferable securities - Bonds Unrealised gain on Forward foreign currency contracts Level A 48,971,675 – 48,971,675 Level B – – – Level C – 95,209 95,209 Total (USD) 48,971,675 95,209 49,066,884 Unrealised loss on Forward foreign currency contracts – – – – (300) (300) (300) (300) As at 31 December 2014 Transferable securities - Bonds Unrealised gain on Forward foreign currency contracts Level A 48,053,005 – 48,053,005 Level B – – – Level C – 18,433 18,433 Total (USD) 48,053,005 18,433 48,071,438 Unrealised loss on Forward foreign currency contracts – – – – (300,591) (300,591) (300,591) (300,591) Payden Global Emerging Markets Bond Fund Payden Global Emerging Markets Corporate Bond Fund 112 . PAYDEN GLOBAL FUNDS PUBLIC LIMITED COMPANY NOTES TO THE FINANCIAL STATEMENTS (continued) 6. FAIR VALUE ESTIMATION (continued) Payden Global Emerging Markets Local Bond Fund* As at 31 December 2014 Unrealised gain on Forward foreign currency contracts Level A – – Level B – – Level C 14,888 14,888 Total (USD) 14,888 14,888 Unrealised loss on Forward foreign currency contracts – – – – (6,361) (6,361) (6,361) (6,361) As at 30 June 2015 Transferable securities - Bonds Unrealised gain on Forward foreign currency contracts Level A 124,468,724 – 124,468,724 Level B – – – Level C – 1,731,890 1,731,890 Total (USD) 124,468,724 1,731,890 126,200,614 Unrealised loss on Forward foreign currency contracts – – – – (1,534,164) (1,534,164) (1,534,164) (1,534,164) As at 31 December 2014 Transferable securities - Bonds Unrealised gain on Forward foreign currency contracts Level A 127,535,937 – 127,535,937 Level B – – – Level C – 1,979,587 1,979,587 Total (USD) 127,535,937 1,979,587 129,515,524 Unrealised loss on Forward foreign currency contracts – – – – (3,835,587) (3,835,587) (3,835,587) (3,835,587) As at 30 June 2015 Transferable securities - Bonds Unrealised gain on Forward foreign currency contracts Unrealised gain on Futures contracts Level A 72,738,833 – 6,359 72,745,192 Level B – – – – Level C – 724,287 – 724,287 Total (USD) 72,738,833 724,287 6,359 73,469,479 Unrealised loss on Forward foreign currency contracts – – – – (105,680) (105,680) (105,680) (105,680) As at 31 December 2014 Transferable securities - Bonds Unrealised gain on Forward foreign currency contracts Level A 78,399,495 – 78,399,495 Level B – – – Level C – 278,291 278,291 Total (USD) 78,399,495 278,291 78,677,786 Unrealised loss on Forward foreign currency contracts – – – – (856,316) (856,316) (856,316) (856,316) As at 30 June 2015 Transferable securities - Bonds Unrealised gain on Forward foreign currency contracts Unrealised gain on Futures contracts Level A 71,815,113 – 49,444 71,864,557 Level B – – – – Level C – 1,118,511 – 1,118,511 Total (USD) 71,815,113 1,118,511 49,444 72,983,068 Unrealised loss on Forward foreign currency contracts Unrealised loss on Futures contracts – (16,450) (16,450) – – – (946,189) – (946,189) (946,189) (16,450) (962,639) Payden Global Government Bond Index Fund Payden Global High Yield Bond Fund Payden Global Inflation - Linked Bond Fund 113 . PAYDEN GLOBAL FUNDS PUBLIC LIMITED COMPANY NOTES TO THE FINANCIAL STATEMENTS (continued) 6. FAIR VALUE ESTIMATION (continued) Payden Global Inflation - Linked Bond Fund (continued) As at 31 December 2014 Transferable securities - Bonds Unrealised gain on Forward foreign currency contracts Level A 91,714,632 – 91,714,632 Level B – – – Level C – 628,455 628,455 Total (USD) 91,714,632 628,455 92,343,087 Unrealised loss on Forward foreign currency contracts Unrealised loss on Swaps – – – – – – (320,924) (168,213) (489,137) (320,924) (168,213) (489,137) As at 30 June 2015 Transferable securities - Bonds Unrealised gain on Forward foreign currency contracts Unrealised gain on Futures contracts Unrealised gain on Options Level A 182,239,263 – 11,675 – 182,250,938 Level B – – – – – Level C 2,075,055 1,020,034 – 24,056 3,119,145 Total (USD) 184,314,318 1,020,034 11,675 24,056 185,370,083 Unrealised loss on Forward foreign currency contracts Unrealised loss on Futures contracts – (602) (602) – – – (1,703,768) – (1,703,768) (1,703,768) (602) (1,704,370) As at 31 December 2014 Transferable securities - Bonds Unrealised gain on Forward foreign currency contracts Unrealised gain on Futures contracts Unrealised gain on Options Level A 53,770,870 – 11,913 – 53,782,783 Level B – – – – – Level C 2,044,087 570,623 – 4,609 2,619,319 Total (USD) 55,814,957 570,623 11,913 4,609 56,402,102 Unrealised loss on Forward foreign currency contracts Unrealised loss on Futures contracts – (21,144) (21,144) – – – (1,132,716) – (1,132,716) (1,132,716) (21,144) (1,153,860) Level A 17,179,910 17,179,910 Level B – – Level C – – Total (GBP) 17,179,910 17,179,910 Unrealised loss on Futures contracts (9,240) (9,240) – – – – (9,240) (9,240) As at 31 December 2014 Transferable securities - Bonds Unrealised gain on Futures contracts Level A 16,931,210 19,680 16,950,890 Level B – – – Level C – – – Total (GBP) 16,931,210 19,680 16,950,890 As at 30 June 2015 Transferable securities - Bonds Level A 277,406,114 277,406,114 Level B – – Level C – – Total (GBP) 277,406,114 277,406,114 As at 31 December 2014 Transferable securities - Bonds Level A 280,004,228 280,004,228 Level B – – Level C – – Total (GBP) 280,004,228 280,004,228 Payden Global Short Bond Fund* Payden Sterling Corporate Bond Fund - Investment Grade As at 30 June 2015 Transferable securities - Bonds Payden Sterling Reserve Fund 114 . PAYDEN GLOBAL FUNDS PUBLIC LIMITED COMPANY NOTES TO THE FINANCIAL STATEMENTS (continued) 6. FAIR VALUE ESTIMATION (continued) Payden US Core Bond Fund As at 30 June 2015 Transferable securities - Bonds Unrealised gain on Forward foreign currency contracts Unrealised gain on Futures contracts Level A 17,251,538 – 2,391 17,253,929 Level B – – – – Level C 322,092 48,780 – 370,872 Total (USD) 17,573,630 48,780 2,391 17,624,801 Unrealised loss on Forward foreign currency contracts Unrealised loss on Futures contracts – (3,047) (3,047) – – – (29,290) – (29,290) (29,290) (3,047) (32,337) As at 31 December 2014 Transferable securities - Bonds Unrealised gain on Forward foreign currency contracts Level A 18,394,786 – 18,394,786 Level B – – – Level C 316,689 101,916 418,605 Total (USD) 18,711,475 101,916 18,813,391 Unrealised loss on Forward foreign currency contracts Unrealised loss on Swaps – – – – – – (71,806) (138,746) (210,552) (71,806) (138,746) (210,552) As at 30 June 2015 Transferable securities - Bonds Level A 17,977,082 17,977,082 Level B – – Level C – – Total (USD) 17,977,082 17,977,082 As at 31 December 2014 Transferable securities - Bonds Level A 26,793,408 26,793,408 Level B – – Level C – – Total (USD) 26,793,408 26,793,408 Level A 8,463,937 1,437 8,465,374 Level B – – – Level C – – – Total (USD) 8,463,937 1,437 8,465,374 Level A 504,027,377 504,027,377 Level B – – Level C – – Total (USD) 504,027,377 504,027,377 As at 30 June 2015 Transferable securities - Bonds Transferable securities - Equities Unrealised gain on Forward foreign currency contracts Unrealised gain on Futures contracts Level A 29,760,706 1,522,558 – 15,549 31,298,813 Level B – – – – – Level C – – 312,251 – 312,251 Total (USD) 29,760,706 1,522,558 312,251 15,549 31,611,064 Unrealised loss on Forward foreign currency contracts Unrealised loss on Futures contracts – (476,149) (476,149) – – – (157,766) – (157,766) (157,766) (476,149) (633,915) Payden US Dollar Liquidity Fund Payden USD Low Duration Credit Fund As at 30 June 2015 Transferable securities - Bonds Unrealised gain on Futures contracts As at 31 December 2014 Transferable securities - Bonds Payden World Equity Fund 115 . PAYDEN GLOBAL FUNDS PUBLIC LIMITED COMPANY NOTES TO THE FINANCIAL STATEMENTS (continued) 6. FAIR VALUE ESTIMATION (continued) Payden World Equity Fund (continued) As at 31 December 2014 Transferable securities - Bonds Transferable securities - Equities Unrealised gain on Forward foreign currency contracts Unrealised gain on Futures contracts Level A 24,734,792 1,632,569 – 788,650 27,156,011 Level B – – – – – Level C – – 352,910 – 352,910 Total (USD) 24,734,792 1,632,569 352,910 788,650 27,508,921 Unrealised loss on Forward foreign currency contracts Unrealised loss on Futures contracts – (53,913) (53,913) – – – (462,374) – (462,374) (462,374) (53,913) (516,287) * See Note 1 7. DISTRIBUTIONS TO HOLDERS OF REDEEMABLE PARTICIPATING SHARES The Company currently pays a dividend monthly in respect of the Payden Euro Liquidity Fund - Euro Class (Distributing), Payden Global Emerging Markets Bond Fund – Sterling Class (Distributing) and Payden US Dollar Liquidity Fund – US Dollar Class (Distributing). The Company also currently pays a dividend quarterly in respect of the Payden Global Emerging Markets Bond Fund – US Dollar Class (Distributing), Payden Global Emerging Markets Corporate Bond Fund – US Dollar Class (Distributing), Payden Global Government Bond Index Fund – Singapore Dollar Class (Distributing) and Sterling Class (Distributing), Payden Global Inflation - Linked Bond Fund – Sterling Class (Distributing) and Sterling Class Unhedged (Distributing) and Payden Sterling Reserve Fund – Sterling Class (Distributing). The Company also pays a dividend annually in respect of the Payden US Core Bond Fund – US Dollar Class. However, the Directors may at their discretion alter the frequency with which a dividend is paid. In the event that a dividend is to be paid, shareholders in the Fund may, at their discretion, receive cash if they elect to do so.
The Company reserves the right to pay dividends or make other distributions in the future in respect of any of the other Funds. In the event that the Company decides to pay any dividend on behalf of a Fund, such dividend will be paid in accordance with the rules of the ISE and in accordance with the articles of association, i.e., out of profits available for distribution. The dividend is paid out of net investment income and the net amount of all realised and unrealised capital gains (less realised and unrealised losses).
Distributions recorded in the accounts include equalisation. 116 . PAYDEN GLOBAL FUNDS PUBLIC LIMITED COMPANY NOTES TO THE FINANCIAL STATEMENTS (continued) 7. DISTRIBUTIONS TO HOLDERS OF REDEEMABLE PARTICIPATING SHARES (continued) The distributions paid during the period are as follows: Fund Currency 30 June 2015 30 June 2014 Payden Euro Liquidity Fund Euro Class (Distributing) EUR 2,700 362 US Dollar Class (Distributing) USD 1,096,840 1,157,089 Sterling Class (Distributing) GBP 512 31,401 USD 867,857 759,727 Sterling Class (Distributing) GBP 168,099 192,917 Singapore Dollar Class (Distributing) SGD 34,712 37,989 Sterling Class (Distributing) GBP 32,010 51,782 Sterling Class Unhedged (Distributing) GBP 53,326 98,849 GBP – 10,771 GBP 717,823 641,623 USD 412,415 524,950 USD 30,062 547 Payden Global Emerging Markets Bond Fund Payden Global Emerging Markets Corporate Bond Fund US Dollar Class (Distributing) Payden Global Government Bond Index Fund Payden Global Inflation – Linked Bond Fund Payden Sterling Liquidity Fund* Sterling Class (Distributing) Payden Sterling Reserve Fund Sterling Class (Distributing) Payden US Core Bond Fund US Dollar Class Payden US Dollar Liquidity Fund US Dollar Class (Distributing) * See Note 1. 8. SOFT COMMISSION ARRANGEMENTS There were no soft commission arrangements affecting the Company during the period ended 30 June 2015 (30 June 2014: Nil). 9. RELATED PARTIES The Investment Manager, Administrator and Distributor are related parties under FRS 104 “Related Party Transactions”. The Directors are related parties of the Company.
Joan A. Payden, James P. Sarni and Robin Creswell are Managing Principals of Payden & Rygel.
Mark Morris is a Principal of Payden & Rygel. Joan A. Payden, Robin Creswell, James P. Sarni and Mark Morris have waived their right to receive a fee for their services as Directors. In compliance with UCITS Regulations, the Directors confirm that for the period ended 30 June 2015, all transactions carried out with connected parties were on an arm’s length basis and in the best interest of shareholders. 117 .
PAYDEN GLOBAL FUNDS PUBLIC LIMITED COMPANY NOTES TO THE FINANCIAL STATEMENTS (continued) 10. FUNCTIONAL & PRESENTATION CURRENCY Items included in the Company’s financial statements are measured using the currency of the primary economic environment in which each Fund operates (the “functional currency”). In accordance with FRS 102 ‘‘The effect of Changes in Foreign Exchange Rates’’ the functional currency of each Fund has been re-evaluated by the Directors. The functional currency of Payden Absolute Return Bond Fund, Payden Global Emerging Markets Bond Fund, Payden Global Emerging Markets Corporate Bond Fund, Payden Global Emerging Markets Local Bond Fund*, Payden Global Government Bond Index Fund, Payden Global High Yield Bond Fund, Payden Global Inflation – Linked Bond Fund, Payden Global Bond Fund*, Payden Global Short Bond Fund*, Payden US Core Bond Fund, Payden US Dollar Liquidity Fund, Payden USD Low Duration Credit Fund and Payden World Equity Fund is US Dollar (“USD”). The functional currency of Payden Sterling Corporate Bond Fund – Investment Grade, Payden Sterling Liquidity Fund* and Payden Sterling Reserve Fund is Sterling Pound (“GBP”). The functional currency of Payden Euro Liquidity Fund is Euro (“EUR”). The presentation currency is the same as the functional currency for the Funds. The presentation and functional currency of the Company is USD.
A currency adjustment arises from the re-translation of the opening net assets value at the period end exchange rates. This method of allocation has no effect on the value of net assets allocated to the individual Funds. * See Note 1. 11. SEGREGATED LIABILITY The Company avails itself of the segregated liability provisions of the investment funds, Companies and Miscellaneous Provisions Act, 2005.
As such, under Irish law the Company generally will not be liable as a whole to third parties and there generally will not be the potential for cross liability between the Funds. 12. SIGNIFICANT EVENTS DURING THE PERIOD A new prospectus was issued on 29 April 2015. The following Funds changed name during the period: - Payden International Bond Fund changed name to Payden Global Bond Fund on 24 March 2015. Payden International Short Bond Fund changed name to Payden Global Short Bond Fund on 24 March 2015. Payden Global Corporate Bond Fund – Investment Grade changed name to Payden Global Corporate Fund on 24 March 2015. A transfer in kind to a UBS account in Luxembourg of 100% of the net assets was processed on 30 March 2015 for the following sub-fund: - Payden USD Low Duration Credit Fund. On 25 March 2015, Maples and Calder replaced Arthur Cox as Legal Advisers, Sponsoring Broker and Secretary to Payden Global Funds Plc. On 25 March 2015, the Company’s registered office changed from Arthur Cox Building, Earlsfort Terrace, Dublin 2, Ireland to 2nd floor, Beaux Lane House, Mercer Street Lower, Dublin 2, Ireland. 13. SUBSEQUENT EVENTS There have been no significant events affecting the Company since the period end. 14. APPROVAL OF THE FINANCIAL STATEMENTS The financial statements were approved and authorised for issue by the Directors at the Board meeting held on 19 August 2015. 118 .
PAYDEN GLOBAL FUNDS PUBLIC LIMITED COMPANY SCHEDULE OF SIGNIFICANT PORTFOLIO MOVEMENTS The following Schedule of Significant Portfolio Movements reflects the aggregate purchases of a security exceeding one per cent of the total value of purchases and aggregate disposals greater than one per cent of the total sales for the period. At a minimum the largest 20 purchases and 20 sales must be given. Payden Absolute Return Bond Fund Purchases Holdings United States Treasury Note/Bond 1.625% 31-Dec-2019 Fannie Mae Connecticut Avenue Securities 1M1 floating rate 25-Jul-2024 Fannie Mae Connecticut Avenue Securities 2M1 floating rate 25-Jul-2024 BCAP LLC Trust 2007-AA2 6.000% 25-Apr-2037 Fannie Mae Connecticut Avenue Securities floating rate 25-May-2025 Fannie Mae Connecticut Avenue Securities floating rate 25-May-2024 Freddie Mac Structured Agency Credit Risk Debt Notes floating rate 25-Aug-2024 Structured Asset Mortgage Investments II Trust 2006-AR7 0.397% 25-Aug-2036 Boston Scientific Corp 3.850% 15-May-2025 John Deere Capital Corp 2.250% 17-Apr-2019 CSX Corp 7.375% 01-Feb-2019 JPMorgan Chase & Co 2.250% 23-Jan-2020 Wells Fargo & Co 2.125% 22-Apr-2019 Shell International Finance BV 3.250% 11-May-2025 Oracle Corp 2.375% 15-Jan-2019 BNZ International Funding Ltd/London 1.900% 26-Feb-2018 Baxalta, Inc 2.875% 23-Jun-2020 Fannie Mae Connecticut Avenue Securities floating rate 25-Oct-2023 VOLT XXXIII LLC 3.500% 25-Mar-2055 Freddie Mac Structured Agency Credit Risk Debt Notes floating rate 25-Jan-2025 Freddie Mac Structured Agency Credit Risk Debt Notes floating rate 25-Mar-2025 VOLT XXII LLC 3.500% 25-Feb-2055 Wm Wrigley Jr Co 2.900% 21-Oct-2019 Pershing Square Holdings Ltd 5.500% 15-Jul-2022 Lloyds Bank PLC 1.750% 14-May-2018 Bank of Montreal 2.375% 25-Jan-2019 3,950,000 1,325,645 1,230,382 1,256,471 1,020,000 803,282 738,372 916,531 710,000 700,000 600,000 700,000 650,000 580,000 560,000 550,000 540,000 520,706 520,000 500,000 500,000 480,000 450,000 460,000 450,000 442,000 119 Cost USD 4,011,312 1,325,189 1,229,902 1,086,847 1,020,000 797,360 745,295 726,351 709,006 705,978 704,256 688,653 652,169 578,231 574,722 549,841 539,827 524,693 519,476 500,000 500,000 479,494 464,202 460,000 448,871 446,287 . PAYDEN GLOBAL FUNDS PUBLIC LIMITED COMPANY SCHEDULE OF SIGNIFICANT PORTFOLIO MOVEMENTS (continued) Payden Absolute Return Bond Fund (continued) Sales Holdings United States Treasury Note/Bond 1.625% 31-Dec-2019 Ply Gem Industries Inc 4.000% 01-Feb-2021 Freddie Mac Structured Agency Credit Risk Debt Notes floating rate 25-Sep-2024 BB&T Corp 2.450% 15-Jan-2020 Ally Master Owner Trust floating rate 15-Sep-2018 Shell International Finance BV 3.250% 11-May-2025 Freddie Mac Structured Agency Credit Risk Debt Notes floating rate 25-Jan-2025 Freddie Mac Structured Agency Credit Risk Debt Notes floating rate 25-Feb-2024 Toronto-Dominion Bank 1.400% 30-Apr-2018 Reynolds Group Issuer Inc / Reynolds Group Issuer LLC / Reynolds Group Issuer Lu 9.875% 15-Aug-2019 Fannie Mae Connecticut Avenue Securities floating rate 25-May-2024 Fondo MIVIVIENDA SA 3.375% 02-Apr-2019 UniCredit Luxembourg Finance SA 6.000% 31-Oct-2017 SunTrust Banks Inc floating rate Perpetual HSBC Holdings PLC floating rate Perpetual Edison International 3.750% 15-Sep-2017 Fannie Mae Connecticut Avenue Securities M1 floating rate 25-Jan-2024 Omnicom Group Inc 4.450% 15-Aug-2020 Credit Suisse/New York NY 3.000% 29-Oct-2021 Collective Brands Inc 5.000% 11-Mar-2021 DIRECTV Holdings LLC / DIRECTV Financing Co Inc 4.600% 15-Feb-2021 Lam Research Corp 3.800% 15-Mar-2025 Volkswagen Group of America Finance LLC floating rate 20-Nov-2017 Manufacturers & Traders Trust Co 2.250% 25-Jul-2019 Eastman Chemical Co 2.700% 15-Jan-2020 Samarco Mineracao SA 5.375% 26-Sep-2024 AbbVie Inc 4.500% 14-May-2035 Freddie Mac Structured Agency Credit Risk Debt Notes floating rate 25-Oct-2027 Petrobras Global Finance BV floating rate 15-Jan-2019 Morgan Stanley 2.650% 27-Jan-2020 Morgan Stanley floating rate 24-Jan-2019 Fannie Mae Connecticut Avenue Securities 1M2 floating rate 25-Jul-2024 UBS AG/Stamford CT 1.375% 14-Aug-2017 Cleveland Clinic Foundation 4.858% 01-Jan-2114 OneMain Financial Holdings Inc 6.750% 15-Dec-2019 AbbVie Inc 4.700% 15-May-2045 American Express Credit Corp 1.550% 22-Sep-2017 Petroleos Mexicanos floating rate 18-Jul-2018 3,950,000 748,150 650,000 590,000 600,000 580,000 500,000 450,000 450,000 Proceeds USD 4,032,240 742,553 630,881 602,673 601,125 584,594 517,188 460,719 447,683 410,000 480,000 420,000 400,000 410,000 400,000 375,000 388,044 355,000 380,000 398,000 350,000 370,000 370,000 360,000 360,000 380,000 360,000 350,000 370,000 330,000 330,000 350,000 305,000 290,000 280,000 290,000 275,000 270,000 440,750 439,894 425,880 424,580 417,688 408,200 396,769 391,227 390,287 389,105 378,150 377,458 373,596 370,111 364,730 364,471 357,675 351,832 348,729 337,588 330,465 328,832 327,195 305,000 301,597 295,400 284,235 276,007 275,557 120 . PAYDEN GLOBAL FUNDS PUBLIC LIMITED COMPANY SCHEDULE OF SIGNIFICANT PORTFOLIO MOVEMENTS (continued) Payden Euro Liqudity Fund Purchases Holdings Netherlands Government Bond 4.000% 15-Jul-2016 French Treasury Note 2.250% 25-Feb-2016 Red & Black Auto Lease Germany 1 SA 0.911% 15-Apr-2024 Bumper 6 NL Finance BV floating rate 19-Mar-2029 France Government Bond OAT 1.000% 25-May-2019 Bavarian Sky SA 0.237% 20-Apr-2024 Silverstone Master Issuer PLC floating rate 21-Jan-2070 Toyota Motor Credit Corp floating rate 20-Jul-2018 Credit Suisse AG floating rate 18-Jun-2018 Bank of America Corp floating rate 28-Mar-2018 UBS AG/London floating rate 15-May-2017 Bundesobligation 1.000% 12-Oct-2018 Land Nordrhein-Westfalen Government Bond floating rate 09-Nov-2016 Cap Gemini SA floating rate 02-Jul-2018 SBAB Bank AB floating rate 27-Jun-2018 BCARD 2012 floating rate 15-Feb-2015 FCE Bank PLC floating rate 10-Feb-2018 Caisse Centrale Desjardins floating rate 20-Jan-2020 GDF Suez 0.000% 13-Mar-2017 Glencore Finance Europe SA 5.250% 22-Mar-2017 Compartment VCL 20 floating rate 21-Jun-2020 Coca-Cola Co floating rate 09-Mar-2017 BNP Paribas SA floating rate 15-Jan-2020 Yorkshire Building Society 2.125% 18-Mar-2019 Austria Government Bond 1.150% 19-Oct-2018 Societe Des Autoroutes Paris-Rhin-Rhone 0.735% 31-Mar-2019 Sky PLC floating rate 01-Apr-2020 Total Capital International SA floating rate 19-Mar-2020 Carrefour Banque SA floating rate 20-Mar-2020 Volkswagen International Finance NV floating rate 16-Jul-2018 Bank of Nova Scotia/The floating rate 14-Jan-2020 Danone SA floating rate 14-Jan-2020 Goldman Sachs Group, Inc floating rate 29-May-2020 Conti-Gummi Finance BV 2.500% 20-Mar-2017 Daimler AG floating rate 24-Jun-2019 Nederlandse Waterschapsbank NV floating rate 01-Nov-2018 SAP SE floating rate 01-Apr-2020 BMW US Capital LLC floating rate 20-Apr-2018 Cooperatieve Centrale Raiffeisen-Boerenleenbank BA/Netherlands floating rate 29-May-2020 Fidelity International Ltd 6.875% 24-Feb-2017 Cie de Saint-Gobain 4.750% 11-Apr-2017 GE Capital European Funding floating rate 21-Jan-2020 Commonwealth Bank of Australia floating rate 21-Jan-2020 Banque Federative du Credit Mutuel SA floating rate 20-Mar-2019 Auto ABS Compartiment 2012-1 floating rate 25-Jul-2026 Santander Consumer Bank AS 0.625% 20-Apr-2018 2,250,000 2,250,000 2,221,406 2,100,000 1,500,000 1,500,000 1,300,000 1,250,000 1,250,000 1,250,000 1,050,000 1,000,000 1,000,000 1,000,000 1,000,000 1,000,000 1,000,000 1,000,000 1,000,000 900,000 921,951 900,000 850,000 800,000 800,000 800,000 800,000 800,000 800,000 800,000 800,000 800,000 800,000 750,000 750,000 750,000 750,000 750,000 Cost EUR 2,388,420 2,308,793 2,225,216 2,107,320 1,554,210 1,500,000 1,301,110 1,250,425 1,250,000 1,245,013 1,050,000 1,037,040 1,002,250 1,002,160 1,000,620 1,000,500 1,000,375 1,000,000 997,155 974,565 922,504 900,000 850,000 840,067 832,824 807,968 804,084 802,800 801,651 800,180 800,000 800,000 800,000 778,125 757,035 751,770 750,000 750,000 750,000 600,000 600,000 650,000 650,000 600,000 600,000 600,000 749,625 664,712 657,732 650,000 650,000 610,590 603,240 599,364 121 . PAYDEN GLOBAL FUNDS PUBLIC LIMITED COMPANY SCHEDULE OF SIGNIFICANT PORTFOLIO MOVEMENTS (continued) Payden Euro Liqudity Fund (continued) Sales Holdings Netherlands Government Bond 2.500% 15-Jan-2017 Netherlands Government Bond 4.000% 15-Jul-2016 French Treasury Note 2.250% 25-Feb-2016 Finland Government Bond 3.875% 15-Sep-2017 Credit Suisse AG/London floating rate 15-Dec-2017 Province of Quebec Canada 3.375% 20-Jun-2016 Land Nordrhein-Westfalen Government Bond floating rate 09-Nov-2016 BCARD 2012 floating rate 15-Feb-2015 Bank of America Corp floating rate 19-Jun-2019 Goldman Sachs Group Inc floating rate 29-Oct-2019 Anheuser-Busch InBev NV floating rate 29-Mar-2018 RCI Banque SA floating rate 27-Nov-2017 Intesa Sanpaolo SpA floating rate 17-Apr-2019 SAP SE floating rate 01-Apr-2020 Cellco Partnership / Verizon Wireless Capital LLC 8.750% 18-Dec-2015 Macquarie Bank Ltd floating rate 24-Apr-2016 Royal Bank of Scotland Group PLC 1.500% 28-Nov-2016 Anheuser-Busch InBev NV floating rate 19-Oct-2018 Gracechurch Card Funding PLC floating rate 15-Feb-2017 Netherlands Government Bond 0.500% 15-Apr-2017 Caisse Centrale Desjardins floating rate 20-Jan-2020 PACCAR Financial Corp floating rate 19-May-2017 Toyota Motor Credit Corp floating rate 20-Jul-2018 Daimler AG floating rate 07-Oct-2016 Bank of Nova Scotia floating rate 02-Nov-2017 UBS AG/London floating rate 05-Sep-2016 Volvo Treasury AB floating rate 05-Jun-2015 Bpifrance Financement SA floating rate 17-Feb-2016 3,850,000 2,250,000 2,250,000 1,200,000 1,250,000 1,000,000 1,000,000 1,000,000 850,000 850,000 850,000 800,000 750,000 750,000 600,000 600,000 500,000 500,000 500,000 400,000 400,000 400,000 400,000 350,000 320,000 300,000 300,000 300,000 122 Proceeds EUR 4,046,821 2,387,175 2,308,748 1,313,196 1,253,813 1,044,528 1,002,810 1,000,100 862,929 856,035 854,599 802,800 761,625 753,968 640,206 602,117 508,255 500,655 500,050 405,382 401,952 401,028 400,576 351,050 321,040 300,711 300,267 300,099 . PAYDEN GLOBAL FUNDS PUBLIC LIMITED COMPANY SCHEDULE OF SIGNIFICANT PORTFOLIO MOVEMENTS (continued) Payden Global Bond Fund* Purchases Holdings France Government Bond OAT 1.750% 25-May-2023 United States Treasury Note/Bond 1.250% 30-Apr-2019 United States Treasury Note/Bond 2.625% 15-Nov-2020 United States Treasury Note/Bond 0.750% 31-Mar-2018 Australia Government Bond 6.000% 15-Feb-2017 Japan Government Twenty Year Bond 1.000% 20-Mar-2023 United States Treasury Note/Bond 0.875% 28-Feb-2017 United States Treasury Note/Bond 0.375% 15-Jan-2016 Japan Government Twenty Year Bond 1.900% 20-Dec-2028 United Kingdom Gilt 4.750% 07-Mar-2020 Italy Buoni Poliennali Del Tesoro 4.500% 01-Aug-2018 Spain Government Bond 2.750% 30-Apr-2019 United States Treasury Note/Bond 3.000% 15-May-2042 Italy Buoni Poliennali Del Tesoro 4.500% 01-May-2023 Province of Quebec Canada 0.875% 15-Jan-2025 Bundesrepublik Deutschland 3.500% 04-Jul-2019 France Government Bond OAT 3.250% 25-May-2045 Belgium Government Bond 3.000% 28-Sep-2019 Macquarie Bank Ltd 1.125% 20-Jan-2022 Bundesobligation floating rate 17-Apr-2020 United States Treasury Note/Bond 2.125% 15-May-2025 Dexia Credit Local SA 2.125% 12-Feb-2025 Commonwealth Bank of Australia floating rate 22-Apr-2027 France Government Bond OAT 4.750% 25-Apr-2035 Spain Government Bond 1.600% 30-Apr-2025 Austria Government Bond 0.250% 18-Oct-2019 11,900,000 14,000,000 13,000,000 10,250,000 6,000,000 500,000,000 4,000,000 4,000,000 380,000,000 2,000,000 2,400,000 2,450,000 2,542,000 1,900,000 2,100,000 2,000,000 1,400,000 1,800,000 1,850,000 1,800,000 2,000,000 1,200,000 1,700,000 950,000 1,500,000 1,500,000 Sales Holdings United States Treasury Note/Bond 0.750% 31-Mar-2018 United States Treasury Note/Bond 1.250% 30-Apr-2019 France Government Bond OAT 3.250% 25-Oct-2021 United States Treasury Note/Bond 0.375% 15-Jan-2016 United States Treasury Note/Bond 2.625% 15-Nov-2020 United States Treasury Note/Bond 0.875% 28-Feb-2017 France Government Bond OAT 1.750% 25-May-2023 Japan Government Twenty Year Bond 1.000% 20-Mar-2023 Australia Government Bond 6.000% 15-Feb-2017 Italy Buoni Poliennali Del Tesoro 4.750% 01-Jun-2017 Bundesrepublik Deutschland 2.500% 04-Jan-2021 Spain Government Bond 5.850% 31-Jan-2022 Bundesrepublik Deutschland 3.500% 04-Jul-2019 Japan Government Twenty Year Bond 1.700% 20-Sep-2033 United Kingdom Gilt 2.000% 22-Jan-2016 United Kingdom Gilt 1.250% 22-Jul-2018 UNEDIC 2.375% 25-May-2024 Spain Government Bond 2.100% 30-Apr-2017 Province of Ontario Canada 1.875% 21-May-2024 Province of Quebec Canada 0.875% 15-Jan-2025 Suntory Holdings Ltd 2.550% 29-Sep-2019 Italy Buoni Poliennali Del Tesoro 4.500% 01-May-2023 United States Treasury Note/Bond 4.375% 15-Feb-2038 Bundesobligation floating rate 17-Apr-2020 Japan Bank for International Cooperation/Japan 2.625% 15-Dec-2020 Macquarie Bank Ltd 1.125% 20-Jan-2022 Kinder Morgan Inc/DE 4.300% 01-Jun-2025 * See Note 1. 123 19,000,000 14,000,000 8,750,000 11,200,000 10,000,000 7,500,000 4,800,000 600,000,000 5,500,000 3,550,000 3,300,000 2,800,000 3,000,000 400,000,000 2,100,000 1,900,000 2,400,000 2,600,000 2,200,000 2,100,000 2,260,000 1,600,000 1,650,000 1,800,000 1,250,000 1,850,000 1,900,000 Cost USD 14,837,892 13,954,813 13,599,349 10,179,009 5,107,670 4,473,766 4,020,717 4,005,756 3,704,299 3,635,955 2,899,802 2,858,572 2,721,665 2,690,410 2,458,545 2,457,867 2,341,845 2,225,042 2,169,867 2,007,991 1,954,227 1,821,536 1,797,001 1,766,831 1,699,230 1,660,329 Proceeds USD 18,808,319 13,978,664 11,845,269 11,215,670 10,532,382 7,543,803 5,767,566 5,308,200 4,589,896 4,229,684 4,126,006 4,093,861 3,849,697 3,697,557 3,194,101 2,976,284 2,973,802 2,875,063 2,836,662 2,327,215 2,261,243 2,180,971 2,152,200 2,011,603 2,007,430 1,979,224 1,871,975 . PAYDEN GLOBAL FUNDS PUBLIC LIMITED COMPANY SCHEDULE OF SIGNIFICANT PORTFOLIO MOVEMENTS (continued) Payden Global Emerging Markets Bond Fund Purchases Holdings Poland Government Bond 3.250% 25-Jul-2025 Thailand Government Bond 3.250% 16-Jun-2017 Romanian Government International Bond 4.875% 22-Jan-2024 Mexican Bonos 7.750% 13-Nov-2042 Turkey Government International Bond 6.250% 26-Sep-2022 Banque Centrale de Tunisie SA 5.750% 30-Jan-2025 Latam Airlines 2015-1 Pass Through Trust A 4.200% 15-Nov-2027 China Construction Bank Corp floating rate 13-May-2025 Turkey Government Bond 8.500% 10-Jul-2019 Turkey Government Bond 9.000% 24-Jul-2024 Philippine Government International Bond 3.950% 20-Jan-2040 Vietnam Government International Bond 4.800% 19-Nov-2024 Russian Federal Bond - OFZ 7.500% 27-Feb-2019 Pakistan Government International Bond 8.250% 15-Apr-2024 Senegal Government International Bond 8.750% 13-May-2021 Deutsche Bank AG/London 5.625% 17-May-2023 Mexican Bonos 5.000% 15-Jun-2017 Malaysia Government Bond 3.418% 15-Aug-2022 Petronas Capital Ltd 3.500% 18-Mar-2025 Brazilian Government International Bond 8.250% 20-Jan-2034 Nigeria Government International Bond 13.050% 16-Aug-2016 Uruguay Government International Bond 5.100% 18-Jun-2050 Export-Import Bank of India 4.000% 14-Jan-2023 Republic of Honduras 8.750% 16-Dec-2020 Peruvian Government International Bond 7.350% 21-Jul-2025 VimpelCom Holdings BV 7.504% 01-Mar-2022 Perusahaan Gas Negara Persero Tbk PT 5.125% 16-May-2024 Republic of Serbia 5.875% 03-Dec-2018 Bank of China Ltd 5.000% 13-Nov-2024 Comision Federal de Electricidad 6.125% 16-Jun-2045 Russian Federal Bond - OFZ 4.875% 16-Sep-2023 Mexico Government International Bond 4.600% 23-Jan-2046 Republic of Serbia 7.250% 28-Sep-2021 Agricola Senior Trust 6.750% 18-Jun-2020 Republic of Armenia 7.150% 26-Mar-2025 South Africa Government Bond 5.875% 30-May-2022 Costa Rica Government International Bond 7.000% 04-Apr-2044 124 7,800,000 52,350,000 1,434,000 15,500,000 995,000 930,000 880,000 870,000 2,350,000 1,750,000 817,000 765,000 43,700,000 750,000 665,000 10,000,000,000 10,000,000 2,350,000 610,000 450,000 116,000,000 570,000 570,000 510,000 420,000 560,000 550,000 520,000 540,000 550,000 600,000 530,000 450,000 490,000 480,000 400,000 460,000 Cost USD 2,353,750 1,647,997 1,583,708 1,330,723 1,128,081 930,021 880,000 865,267 858,853 820,958 817,000 801,388 800,412 779,400 750,125 712,598 662,606 648,953 604,663 589,455 579,649 577,946 567,820 567,630 563,900 560,988 558,650 553,150 552,452 545,303 538,500 526,221 519,125 496,750 468,326 456,000 452,990 . PAYDEN GLOBAL FUNDS PUBLIC LIMITED COMPANY SCHEDULE OF SIGNIFICANT PORTFOLIO MOVEMENTS (continued) Payden Global Emerging Markets Bond Fund (continued) Sales Holdings Poland Government Bond 5.750% 25-Oct-2021 Ivory Coast Government International Bond 5.750% 31-Dec-2032 Pakistan Government International Bond 8.250% 15-Apr-2024 Pertamina Persero PT 6.000% 03-May-2042 Indonesia Government International Bond 5.375% 17-Oct-2023 Thailand Government Bond 3.250% 16-Jun-2017 Philippine Government International Bond 7.750% 14-Jan-2031 Deutsche Bank AG/London 5.625% 17-May-2023 Kenya Government International Bond 6.875% 24-Jun-2024 Petroleos Mexicanos 7.650% 24-Nov-2021 Uruguay Government International Bond 4.500% 14-Aug-2024 Mexican Bonos 7.750% 13-Nov-2042 Brazil Notas do Tesouro Nacional Serie F 10.000% 01-Jan-2017 JPMorgan Chase Bank NA 8.375% 17-Mar-2034 Philippine Government International Bond 3.950% 20-Jan-2040 Romanian Government International Bond 4.875% 22-Jan-2024 Jamaica Government International Bond 7.625% 09-Jul-2025 Sri Lanka Government International Bond 6.250% 04-Oct-2020 Petroleos Mexicanos 5.500% 27-Jun-2044 Hungary Government International Bond 4.125% 19-Feb-2018 Croatia Government International Bond 6.750% 05-Nov-2019 Dominican Republic International Bond 7.450% 30-Apr-2044 Star Energy Geothermal Wayang Windu Ltd 6.125% 27-Mar-2020 Republic of Armenia 6.000% 30-Sep-2020 Republic of Ghana 8.500% 04-Oct-2017 125 6,955,000 1,680,000 1,100,000 1,120,000 1,000,000 35,600,000 722,000 15,000,000,000 970,000 13,090,000 810,000 11,589,000 2,870,000 9,800,000,000 817,000 750,000 710,000 760,000 820,000 680,000 630,000 620,000 690,000 700,000 650,000 Proceeds USD 2,371,042 1,595,755 1,193,050 1,105,244 1,101,180 1,089,601 1,071,381 1,068,898 996,675 968,897 875,345 865,821 855,039 844,415 831,807 803,956 792,350 781,831 765,170 705,524 699,288 694,960 686,632 676,390 673,495 . PAYDEN GLOBAL FUNDS PUBLIC LIMITED COMPANY SCHEDULE OF SIGNIFICANT PORTFOLIO MOVEMENTS (continued) Payden Global Emerging Markets Corporate Bond Fund Purchases Holdings Ooredoo International Finance Ltd 3.875% 31-Jan-2028 Tencent Holdings Ltd 3.800% 11-Feb-2025 Southern Copper Corp 3.875% 23-Apr-2025 AT&T Inc 4.750% 15-May-2046 Bangkok Bank PCL/Hong Kong 4.800% 18-Oct-2020 Sinopec Group Overseas Development 2015 Ltd 2.500% 28-Apr-2020 Hutchison Whampoa International 11 Ltd floating rate 13-Jan-2022 Latam Airlines 2015-1 Pass Through Trust B 4.500% 15-Nov-2023 BOC Aviation Pte Ltd 4.375% 02-May-2023 Alfa SAB de CV 5.250% 25-Mar-2024 BBVA Colombia SA 4.875% 21-Apr-2025 Petronas Capital Ltd 4.500% 18-Mar-2045 Russian Federal Bond - OFZ floating rate 31-Mar-2030 AIA Group Ltd. 3.200% 11-Mar-2025 DP World Ltd 3.250% 18-May-2020 Eskom Holdings SOC Ltd 7.125% 11-Feb-2025 Akbank TAS 4.000% 24-Jan-2020 Braskem Finance Ltd 5.750% 15-Apr-2021 Latam Airlines 2015-1 Pass Through Trust A 4.200% 15-Nov-2027 China Construction Bank Corp floating rate 13-May-2025 Novelis Inc 8.375% 15-Dec-2017 SK Telecom Co Ltd 2.125% 01-May-2018 Millicom International Cellular SA 4.750% 22-May-2020 Agricola Senior Trust 6.750% 18-Jun-2020 Petroleos Mexicanos 5.500% 21-Jan-2021 International Container Terminal Services Inc 7.375% 17-Mar-2020 Thai Oil PCL 3.625% 23-Jan-2023 Export-Import Bank of India 2.750% 01-Apr-2020 YPF SA 8.500% 28-Jul-2025 OCP SA 4.500% 22-Oct-2025 Reliance Industries Ltd 4.875% 10-Feb-2045 Telefonica Celular del Paraguay SA 6.750% 13-Dec-2022 Anglo American Capital PLC 3.625% 14-May-2020 Colombia Government International Bond 5.000% 15-Jun-2045 Aircastle Ltd 5.500% 15-Feb-2022 Morgan Stanley 4.300% 27-Jan-2045 Goldman Sachs Group Inc 2.600% 23-Apr-2020 Morgan Stanley 5.550% 29-Dec-2049 Actavis Funding SCS 3.000% 12-Mar-2020 Credit Suisse Group Funding Guernsey Ltd 2.750% 26-Mar-2020 American Airlines 2013-1 Class B Pass Through Trust 5.625% 15-Jan-2021 VimpelCom Holdings BV 7.504% 01-Mar-2022 Mexico Government International Bond 3.625% 15-Mar-2022 Cemex Finance LLC 9.375% 12-Oct-2022 Wells Fargo & Co Perpetual floating rate UBS AG/Stamford CT 1.800% 26-Mar-2018 Reynolds American Inc 4.450% 12-Jun-2025 Colombia Government International Bond 4.375% 12-Jul-2021 Ecopetrol SA 5.375% 26-Jun-2026 Baxalta Inc 4.000% 23-Jun-2025 TBG Global Pte Ltd 4.625% 03-Apr-2018 JB y Co SA de CV 3.750% 13-May-2025 Pacific Rubiales Energy Corp 7.250% 12-Dec-2021 Southern Copper Corp 5.875% 23-Apr-2045 Vietnam Government International Bond 4.800% 19-Nov-2024 Alibaba Group Holding Ltd 4.500% 28-Nov-2034 CONSOL Energy Inc 8.250% 01-Apr-2020 Export-Import Bank of India 4.000% 14-Jan-2023 Senegal Government International Bond 8.750% 13-May-2021 Turkiye Vakiflar Bankasi floating rate 03-Feb-2025 Digicel Ltd 6.000% 15-Apr-2021 126 775,000 600,000 600,000 555,000 500,000 550,000 470,000 510,000 500,000 480,000 500,000 500,000 458,500 435,000 420,000 410,000 400,000 390,000 370,000 370,000 350,000 360,000 380,000 335,000 300,000 270,000 300,000 300,000 300,000 300,000 310,000 275,000 290,000 280,000 280,000 275,000 270,000 270,000 270,000 270,000 251,253 260,000 250,000 220,000 250,000 250,000 250,000 235,000 250,000 250,000 250,000 250,000 265,000 250,000 235,000 240,000 240,000 245,000 220,000 240,000 250,000 Cost USD 758,531 597,630 596,754 553,024 551,250 547,668 515,186 510,000 509,775 501,936 499,570 493,835 493,082 434,448 419,307 402,837 398,656 375,375 370,000 367,987 365,750 363,600 357,960 339,163 327,420 310,095 301,740 298,404 297,291 296,295 293,629 292,875 289,356 288,050 280,000 272,938 270,869 270,000 269,987 269,862 260,047 257,400 256,000 251,548 250,000 249,673 249,243 249,069 248,320 248,310 248,125 247,513 247,444 247,083 245,869 245,302 243,600 243,209 242,000 239,249 237,813 . PAYDEN GLOBAL FUNDS PUBLIC LIMITED COMPANY SCHEDULE OF SIGNIFICANT PORTFOLIO MOVEMENTS (continued) Payden Global Emerging Markets Corporate Bond Fund (continued) Sales Holdings Southern Copper Corp 3.875% 23-Apr-2025 AngloGold Ashanti Holdings PLC 8.500% 30-Jul-2020 Baidu Inc 3.500% 28-Nov-2022 Star Energy Geothermal Wayang Windu Ltd 6.125% 27-Mar-2020 Russian Federal Bond - OFZ floating rate 31-Mar-2030 BBVA Banco Continental SA floating rate 22-Sep-2029 BBVA Colombia SA 4.875% 21-Apr-2025 Samarco Mineracao SA 5.375% 26-Sep-2024 Eskom Holdings SOC Ltd 7.125% 11-Feb-2025 China Overseas Finance Cayman III Ltd 5.375% 29-Oct-2023 Petrobras International Finance Co SA 5.375% 27-Jan-2021 Tencent Holdings Ltd 3.375% 02-May-2019 America Movil SAB de CV 6.125% 30-Mar-2040 Comcel Trust via Comunicaciones Celulares SA 6.875% 06-Feb-2024 AT&T Inc 4.750% 15-May-2046 Ecopetrol SA 4.125% 16-Jan-2025 Union Andina de Cementos SAA 5.875% 30-Oct-2021 Braskem Finance Ltd 5.750% 15-Apr-2021 National Bank of Abu Dhabi PJSC 3.000% 13-Aug-2019 Unifin Financiera SAPI de CV SOFOM ENR 6.250% 22-Jul-2019 ESAL GmbH 6.250% 05-Feb-2023 Lukoil International Finance BV 4.563% 24-Apr-2023 Mexichem SAB de CV 5.875% 17-Sep-2044 Aircastle Ltd 5.500% 15-Feb-2022 Anglo American Capital PLC 3.625% 14-May-2020 Republic of Ghana 8.125% 18-Jan-2026 Pacific Rubiales Energy Corp 5.375% 26-Jan-2019 Morgan Stanley 4.300% 27-Jan-2045 Digicel Group Ltd 8.250% 30-Sep-2020 Wells Fargo & Co Perpetual floating rate ARC Properties Operating Partnership LP 3.000% 06-Feb-2019 Petroleos Mexicanos 5.500% 27-Jun-2044 Ecopetrol SA 5.875% 28-May-2045 Evraz Inc NA Canada 7.500% 15-Nov-2019 Vale Overseas Ltd 4.375% 11-Jan-2022 GCX Ltd 7.000% 01-Aug-2019 GNL Quintero SA 4.634% 31-Jul-2029 FMG Resources August 2006 Pty Ltd 8.250% 01-Nov-2019 Columbus International Inc 7.375% 30-Mar-2021 Banco de Credito del Peru/Panama 5.375% 16-Sep-2020 TMK OAO Via TMK Capital SA 6.750% 03-Apr-2020 Turkiye Vakiflar Bankasi floating rate 03-Feb-2025 GTB Finance BV 6.000% 08-Nov-2018 Nakilat Inc 6.067% 31-Dec-2033 International Bank of Azerbaijan OJSC 5.625% 11-Jun-2019 Petrobras Global Finance BV floating rate 17-Mar-2020 National Savings Bank 8.875% 18-Sep-2018 TAM Capital 3 Inc 8.375% 03-Jun-2021 Country Garden Holdings Co Ltd 7.875% 27-May-2019 Turkiye Vakiflar Bankasi TAO 5.750% 24-Apr-2017 Industrial Senior Trust 5.500% 01-Nov-2022 Agile Property Holdings Ltd 9.875% 20-Mar-2017 Ardagh Finance Holdings SA 8.625% 15-Jun-2019 KazMunayGas National Co JSC 5.750% 30-Apr-2043 CNOOC Curtis Funding No 1 Pty Ltd 4.500% 03-Oct-2023 Petronas Capital Ltd 4.500% 18-Mar-2045 Samarco Mineracao SA 5.375% 26-Sep-2024 127 600,000 540,000 545,000 550,000 437,500 500,000 500,000 460,000 410,000 400,000 440,000 400,000 300,000 340,000 350,000 370,000 350,000 390,000 340,000 350,000 320,000 370,000 310,000 280,000 290,000 285,000 360,000 275,000 260,000 250,000 270,000 250,000 260,000 260,000 260,000 250,000 240,000 275,000 225,000 220,000 280,000 240,000 260,000 200,000 240,000 260,000 205,000 220,000 225,000 210,000 225,000 215,000 208,768 250,000 200,000 200,000 200,000 Proceeds USD 589,584 580,500 550,063 542,125 516,031 512,500 505,000 425,700 422,813 421,000 416,940 411,000 374,863 366,690 352,818 351,963 351,038 351,000 349,792 338,625 331,776 312,650 302,560 296,800 288,959 275,054 273,600 273,248 269,230 261,250 257,850 254,375 253,500 252,850 249,431 248,750 247,800 244,750 243,675 240,900 240,800 236,100 235,300 235,000 232,920 228,800 227,243 226,600 220,500 219,975 219,938 215,538 213,465 211,275 210,930 198,340 192,500 . PAYDEN GLOBAL FUNDS PUBLIC LIMITED COMPANY SCHEDULE OF SIGNIFICANT PORTFOLIO MOVEMENTS (continued) Payden Global Government Bond Index Fund Purchases Holdings United States Treasury Note/Bond 0.875% 15-Aug-2017 United States Treasury Note/Bond 2.500% 15-Aug-2023 United States Treasury Note/Bond 2.375% 31-Jul-2017 Japan Government Ten Year Bond 1.700% 20-Sep-2017 United States Treasury Note/Bond 2.375% 31-Mar-2016 United States Treasury Note/Bond 0.875% 15-Oct-2017 Japan Government Ten Year Bond 1.500% 20-Jun-2019 United Kingdom Gilt 5.000% 07-Mar-2018 Japan Government Twenty Year Bond 2.100% 20-Dec-2027 United States Treasury Note/Bond 3.750% 15-Nov-2043 Bundesrepublik Deutschland 4.250% 04-Jul-2018 France Government Bond OAT 4.250% 25-Oct-2017 Mexican Bonos 6.500% 09-Jun-2022 Italy Buoni Poliennali Del Tesoro 4.750% 01-Aug-2023 Japan Government Twenty Year Bond 1.900% 20-Dec-2028 United Kingdom Gilt 1.750% 07-Sep-2022 France Government Bond OAT 5.500% 25-Apr-2029 Italy Buoni Poliennali Del Tesoro 5.000% 01-Mar-2025 Singapore Government Bond 2.750% 01-Jul-2023 France Government Bond OAT 8.500% 25-Apr-2023 11,850,000 3,200,000 3,000,000 300,000,000 2,000,000 1,500,000 150,000,000 600,000 105,000,000 800,000 500,000 500,000 8,000,000 400,000 50,000,000 300,000 250,000 300,000 500,000 200,000 Sales Holdings United States Treasury Note/Bond 2.375% 31-Jul-2017 United States Treasury Note/Bond 2.375% 31-Mar-2016 Japan Government Ten Year Bond 1.800% 20-Mar-2016 French Treasury Note BTAN 2.250% 25-Feb-2016 Japan Government Ten Year Bond 1.700% 20-Sep-2016 Japan Government Twenty Year Bond 2.500% 20-Mar-2020 Japan Government Twenty Year Bond 1.000% 20-Mar-2023 Japan Government Ten Year Bond 1.700% 20-Dec-2016 United Kingdom Gilt 2.000% 22-Jan-2016 Mexican Bonos 8.000% 11-Jun-2020 Bundesrepublik Deutschland 4.250% 04-Jul-2018 Italy Buoni Poliennali Del Tesoro 4.750% 01-Aug-2023 Poland Government Bond 6.250% 24-Oct-2015 United States Treasury Note/Bond 2.500% 15-Aug-2023 Japan Government Thirty Year Bond 2.500% 20-Sep-2035 Singapore Government Bond 2.250% 01-Jun-2021 Malaysia Government Bond 3.480% 15-Mar-2023 United Kingdom Gilt 4.250% 07-Mar-2036 United States Treasury Note/Bond 4.250% 15-May-2039 Poland Government Bond 5.750% 23-Sep-2022 14,300,000 4,400,000 245,500,000 1,550,000 188,800,000 145,000,000 110,000,000 100,000,000 450,000 8,240,000 300,000 250,000 1,250,000 300,000 30,000,000 400,000 1,000,000 100,000 150,000 589,000 128 Cost USD 11,907,468 3,340,556 3,107,227 2,596,759 2,049,616 1,498,482 1,324,891 1,022,609 1,022,596 966,761 657,928 638,925 561,127 553,951 502,124 466,693 445,597 445,016 386,832 374,334 Proceeds USD 14,896,891 4,491,657 2,081,770 1,814,539 1,612,479 1,348,826 980,162 827,229 705,277 615,731 407,823 351,337 339,579 315,221 309,480 300,384 267,463 199,291 197,794 195,056 . PAYDEN GLOBAL FUNDS PUBLIC LIMITED COMPANY SCHEDULE OF SIGNIFICANT PORTFOLIO MOVEMENTS (continued) Payden Global High Yield Bond Fund Purchases Holdings General Motors Financial Co Inc 4.250% 15-May-2023 Navient Corp 5.500% 15-Jan-2019 Infor US Inc 6.500% 15-May-2022 Quintiles Transnational Corp 4.875% 15-May-2023 Ally Financial Inc 4.125% 13-Feb-2022 Sunoco LP / Sunoco Finance Corp 6.375% 01-Apr-2023 E*TRADE Financial Corp 5.375% 15-Nov-2022 T-Mobile USA Inc 6.250% 01-Apr-2021 Antero Resources Corp 6.000% 01-Dec-2020 MarkWest Energy Partners LP / MarkWest Energy Finance Corp 4.875% 01-Dec-2024 Darling Ingredients Inc 5.375% 15-Jan-2022 CNH Industrial Capital LLC 3.250% 01-Feb-2017 Communications Sales & Leasing Inc 6.000% 15-Apr-2023 Dean Foods Co 6.500% 15-Mar-2023 Valeant Pharmaceuticals International Inc 5.875% 15-May-2023 Pershing Square Holdings Ltd 5.500% 15-Jul-2022 Tenet Healthcare Corp 6.750% 15-Jun-2023 ZF North America Capital Inc 4.000% 29-Apr-2020 MarkWest Energy Partners LP / MarkWest Energy Finance Corp 4.500% 15-Jul-2023 Landry's Inc 9.375% 01-May-2020 Neiman Marcus Group Ltd LLC 8.750% 15-Oct-2021 DCP Midstream Operating LP 9.750% 15-Mar-2019 Carrols Restaurant Group Inc 8.000% 01-May-2022 Family Tree Escrow LLC 5.750% 01-Mar-2023 Rite Aid Corp 6.125% 01-Apr-2023 CommScope Technologies Finance LLC 6.000% 15-Jun-2025 Argos Merger Sub Inc 7.125% 15-Mar-2023 Horizon Pharma Financing Inc 6.625% 01-May-2023 Berry Plastics Corp 5.125% 15-Jul-2023 Southwestern Energy Co 4.050% 23-Jan-2020 Credit Acceptance Corp 7.375% 15-Mar-2023 Concordia Healthcare Corp 7.000% 15-Apr-2023 JBS USA LLC / JBS USA Finance Inc 5.750% 15-Jun-2025 Lennar Corp 4.500% 15-Nov-2019 A Schulman Inc 6.875% 01-Jun-2023 Brookfield Residential Properties Inc 6.375% 15-May-2025 Actavis Funding SCS 3.450% 15-Mar-2022 Altice Financing SA 6.625% 15-Feb-2023 FMG Resources August 2006 Pty Ltd 9.750% 01-Mar-2022 First Cash Financial Services Inc 6.750% 01-Apr-2021 1,300,000 1,000,000 700,000 700,000 600,000 550,000 500,000 500,000 500,000 500,000 500,000 500,000 500,000 500,000 500,000 500,000 500,000 500,000 500,000 450,000 450,000 430,000 450,000 450,000 450,000 450,000 450,000 450,000 450,000 450,000 450,000 430,000 430,000 400,000 380,000 300,000 300,000 250,000 250,000 200,000 129 Cost USD 1,365,000 1,021,250 724,500 700,000 591,524 550,000 531,250 524,375 511,250 508,125 507,500 506,250 503,750 500,000 500,000 500,000 497,500 497,200 491,250 484,875 475,695 475,537 464,850 457,031 453,938 453,375 450,000 450,000 450,000 449,537 446,697 430,000 430,000 401,000 384,625 300,000 299,574 250,000 244,020 213,000 . PAYDEN GLOBAL FUNDS PUBLIC LIMITED COMPANY SCHEDULE OF SIGNIFICANT PORTFOLIO MOVEMENTS (continued) Payden Global High Yield Bond Fund (continued) Sales Holdings General Motors Financial Co Inc 4.250% 15-May-2023 Navient Corp 5.500% 15-Jan-2019 TMS International Corp 7.625% 15-Oct-2021 Chrysler Group LLC / CG Co-Issuer Inc 8.250% 15-Jun-2021 GenOn Energy Inc 9.875% 15-Oct-2020 Ally Financial Inc 8.000% 15-Mar-2020 MarkWest Energy Partners LP / MarkWest Energy Finance Corp 4.875% 01-Dec-2024 DCP Midstream Operating LP 9.750% 15-Mar-2019 Kinder Morgan Inc/DE 6.500% 15-Sep-2020 Southwestern Energy Co 4.050% 23-Jan-2020 Abengoa Finance SAU 7.750% 01-Feb-2020 Dollar General Corp 1.875% 15-Apr-2018 Cequel Communications Holdings I LLC / Cequel Capital Corp 5.125% 15-Dec-2021 FMG Resources August 2006 Pty Ltd 8.250% 01-Nov-2019 Jo-Ann Stores LLC 8.125% 15-Mar-2019 Apex Tool Group LLC 7.000% 01-Feb-2021 Freescale Semiconductor Inc 6.000% 15-Jan-2022 Denali Borrower LLC / Denali Finance Corp 5.625% 15-Oct-2020 Aramark Services Inc 5.750% 15-Mar-2020 OneMain Financial Holdings Inc 7.250% 15-Dec-2021 Memorial Resource Development Corp 5.875% 01-Jul-2022 Genesis Energy LP / Genesis Energy Finance Corp 5.750% 15-Feb-2021 Penn National Gaming Inc 5.875% 01-Nov-2021 Rent-A-Center Inc/TX 4.750% 01-May-2021 Hughes Satellite Systems Corp 7.625% 15-Jun-2021 Post Holdings Inc 7.375% 15-Feb-2022 Imperial Metals Corp 7.000% 15-Mar-2019 Crestwood Midstream Partners LP / Crestwood Midstream Finance Corp 6.000% 15-Dec-2020 Ardagh Finance Holdings SA 8.625% 15-Jun-2019 General Cable Corp 5.750% 01-Oct-2022 Case New Holland Industrial Inc 7.875% 01-Dec-2017 Avianca Holdings SA / Avianca Leasing LLC / Grupo Taca Holdings Ltd 8.375% 10-May-2020 Kinetic Concepts Inc / KCI USA Inc 10.500% 01-Nov-2018 Sirius XM Radio Inc 4.250% 15-May-2020 Sabine Pass LNG LP 7.500% 30-Nov-2016 MarkWest Energy Partners LP / MarkWest Energy Finance Corp 6.750% 01-Nov-2020 Penn Virginia Resource Partners LP / Penn Virginia Resource Finance Corp 6.500% 15-May-2021 L Brands Inc 7.000% 01-May-2020 Legacy Reserves LP / Legacy Reserves Finance Corp 6.625% 01-Dec-2021 Tronox Finance LLC 6.375% 15-Aug-2020 PaperWorks Industries Inc 9.500% 15-Aug-2019 Eldorado Gold Corp 6.125% 15-Dec-2020 Actavis Funding SCS 3.450% 15-Mar-2022 Levi Strauss & Co 6.875% 01-May-2022 Hanger Inc 7.125% 15-Nov-2018 Pinnacle Entertainment Inc 8.750% 15-May-2020 Standard Pacific Corp 8.375% 15-May-2018 Iron Mountain Inc 7.750% 01-Oct-2019 1,300,000 1,000,000 1,000,000 500,000 530,000 438,000 500,000 430,000 410,000 450,000 450,000 450,000 450,000 500,000 450,000 475,000 400,000 400,000 400,000 400,000 450,000 400,000 400,000 450,000 350,000 370,000 400,000 Proceeds USD 1,298,050 1,025,000 977,500 546,565 538,800 527,790 510,000 502,025 466,829 461,151 448,313 442,125 441,000 430,000 429,750 427,500 426,000 424,000 418,500 418,000 412,875 402,500 399,000 398,250 388,938 385,725 383,000 365,000 365,345 400,000 330,000 380,513 373,565 373,000 365,475 350,000 315,000 340,000 310,000 310,000 352,188 336,263 335,750 328,213 328,073 300,000 280,000 400,000 325,000 300,000 300,000 300,000 250,000 250,000 235,000 215,000 220,000 321,000 317,800 308,000 307,938 305,250 299,250 296,382 269,688 255,625 246,163 245,638 231,550 130 . PAYDEN GLOBAL FUNDS PUBLIC LIMITED COMPANY SCHEDULE OF SIGNIFICANT PORTFOLIO MOVEMENTS (continued) Payden Global Inflation Linked Bond Fund Purchases Holdings United Kingdom Gilt Inflation Linked 0.750% 22-Mar-2034 United States Treasury Inflation Indexed Bonds 0.250% 15-Jan-2025 United States Treasury Inflation Indexed Bonds 0.125% 15-Apr-2018 United Kingdom Gilt Inflation Linked 2.500% 17-Jul-2024 Italy Buoni Poliennali Del Tesoro 2.600% 15-Sep-2023 France Government Bond OAT 3.150% 25-Jul-2032 Italy Buoni Poliennali Del Tesoro 2.100% 15-Sep-2021 Italy Buoni Poliennali Del Tesoro 2.350% 15-Sep-2035 Italy Buoni Poliennali Del Tesoro 2.350% 15-Sep-2019 France Government Bond OAT 1.100% 25-Jul-2022 Italy Buoni Poliennali Del Tesoro 2.100% 15-Sep-2017 United Kingdom Gilt Inflation Linked 0.125% 22-Mar-2024 United States Treasury Inflation Indexed Bonds 0.125% 15-Apr-2017 United Kingdom Gilt Inflation Linked 0.500% 22-Mar-2050 Italy Buoni Poliennali Del Tesoro 2.550% 15-Sep-2041 United Kingdom Gilt Inflation Linked 0.625% 22-Nov-2042 Deutsche Bundesrepublik Inflation Linked Bond 0.500% 15-Apr-2030 United States Treasury Inflation Indexed Bonds 0.625% 15-Feb-2043 United Kingdom Gilt Inflation Linked 0.375% 22-Mar-2062 United States Treasury Inflation Indexed Bonds 2.125% 15-Feb-2041 2,041,142 3,857,477 3,296,425 300,000 1,124,180 791,798 1,173,480 706,266 817,508 748,972 801,080 509,130 725,060 300,422 320,949 181,139 302,364 356,808 109,110 214,274 Sales Holdings United States Treasury Inflation Indexed Bonds 0.125% 15-Apr-2018 Bundesrepublik Deutschland Bundesobligation Inflation Linked Bond 0.750% 15-Apr2018 United Kingdom Gilt Inflation Linked 0.750% 22-Mar-2034 United States Treasury Inflation Indexed Bonds 0.125% 15-Apr-2016 United Kingdom Gilt Inflation Linked 1.250% 22-Nov-2027 United States Treasury Inflation Indexed Bonds 0.125% 15-Jan-2022 Deutsche Bundesrepublik Inflation Linked Bond 0.500% 15-Apr-2030 United Kingdom Gilt Inflation Linked 1.125% 22-Nov-2037 United States Treasury Inflation Indexed Bonds 0.625% 15-Jul-2021 United Kingdom Gilt Inflation Linked 2.500% 16-Apr-2020 United States Treasury Inflation Indexed Bonds 2.125% 15-Feb-2041 United States Treasury Inflation Indexed Bonds 0.625% 15-Jan-2024 United Kingdom Gilt Inflation Linked 0.125% 22-Mar-2044 United Kingdom Gilt Inflation Linked 2.500% 26-Jul-2016 United States Treasury Inflation Indexed Bonds 0.250% 15-Jan-2025 United Kingdom Gilt Inflation Linked 0.125% 22-Mar-2068 United States Treasury Inflation Indexed Bonds 2.375% 15-Jan-2025 United States Treasury Inflation Indexed Bonds 0.125% 15-Jul-2022 United States Treasury Inflation Indexed Bonds 3.375% 15-Apr-2032 United Kingdom Gilt Inflation Linked 0.125% 22-Nov-2019 Italy Buoni Poliennali Del Tesoro 2.100% 15-Sep-2021 France Government Bond OAT 1.850% 25-Jul-2027 United States Treasury Inflation Indexed Bonds 1.375% 15-Jul-2018 Deutsche Bundesrepublik Inflation Linked Bond 1.750% 15-Apr-2020 United States Treasury Inflation Indexed Bonds 0.625% 15-Feb-2043 United Kingdom Gilt Inflation Linked 0.625% 22-Mar-2040 France Government Bond OAT 2.250% 25-Jul-2020 United Kingdom Gilt Inflation Linked 0.375% 22-Mar-2062 Canadian Government Bond 4.000% 01-Dec-2031 3,558,695 Proceeds USD 3,634,306 2,982,292 1,713,928 3,075,361 1,466,842 2,388,435 1,543,628 825,571 1,614,609 290,000 1,135,596 1,259,150 634,158 242,000 1,141,180 441,664 870,408 1,022,070 633,187 573,804 590,398 476,627 656,604 488,453 664,495 284,633 423,161 217,776 343,620 3,501,432 3,395,863 3,106,159 2,876,995 2,396,823 2,066,946 1,853,287 1,688,499 1,599,633 1,504,948 1,304,101 1,285,070 1,172,651 1,141,219 1,111,605 1,070,191 1,027,895 937,189 905,550 744,887 707,564 697,281 624,272 620,755 595,812 560,504 554,316 462,290 131 Cost USD 4,130,227 3,887,831 3,382,996 1,559,331 1,471,150 1,455,179 1,439,710 1,057,924 981,832 951,991 912,899 860,973 737,099 707,753 493,918 408,639 401,937 360,921 295,152 291,606 . PAYDEN GLOBAL FUNDS PUBLIC LIMITED COMPANY SCHEDULE OF SIGNIFICANT PORTFOLIO MOVEMENTS (continued) Payden Global Short Bond Fund* Purchases Holdings United States Treasury Note/Bond 0.500% 31-Jan-2017 United States Treasury Note/Bond 0.625% 15-Dec-2016 United States Treasury Note/Bond 1.000% 15-Sep-2017 United States Treasury Note/Bond 0.500% 30-Apr-2017 United States Treasury Note/Bond 0.625% 31-May-2017 United States Treasury Note/Bond 0.875% 15-Nov-2017 Japan Government Five Year Bond 0.300% 20-Jun-2015 Japan Government Two Year Bond 0.100% 15-Sep-2015 Italy Buoni Poliennali Del Tesoro 3.500% 01-Dec-2018 United States Treasury Note/Bond 0.375% 31-Oct-2016 United States Treasury Note/Bond 0.875% 15-Jul-2017 Japan Government Two Year Bond 0.100% 15-Apr-2016 Spain Government Bond 2.750% 30-Apr-2019 Australia Government Bond 5.500% 21-Jan-2018 New Zealand Government Bond 6.000% 15-Dec-2017 Japan Government Five Year Bond 0.300% 20-Sep-2015 United Kingdom Gilt 1.250% 22-Jul-2018 Goldman Sachs Group Inc 6.150% 01-Apr-2018 Spain Government Bond 3.800% 31-Jan-2017 CNH Equipment Trust 1.370% 15-Jul-2020 Delamare Cards floating rate 19-May-2019 8,200,000 7,000,000 6,800,000 6,600,000 6,590,000 6,100,000 450,000,000 450,000,000 2,890,000 3,610,000 3,350,000 300,000,000 1,840,000 2,570,000 2,430,000 220,000,000 1,100,000 1,550,000 1,400,000 1,700,000 1,100,000 Sales Holdings United States Treasury Note/Bond 0.500% 30-Apr-2017 United States Treasury Note/Bond 0.375% 31-Oct-2016 United States Treasury Note/Bond 0.500% 31-Jan-2017 United States Treasury Note/Bond 0.875% 15-Jul-2017 United States Treasury Note/Bond 0.750% 15-Jan-2017 Goldman Sachs Group Inc floating rate 29-Oct-2019 United States Treasury Note/Bond 0.875% 15-Nov-2017 United Kingdom Gilt 1.000% 07-Sep-2017 United States Treasury Note/Bond 0.750% 28-Feb-2018 Penarth Master Issuer PLC floating rate 18-Mar-2022 Finland Government Bond 3.875% 15-Sep-2017 United States Treasury Note/Bond 0.625% 15-Dec-2016 United States Treasury Note/Bond 0.875% 30-Apr-2017 United States Treasury Note/Bond 1.000% 15-Sep-2017 RCI Banque SA floating rate 27-Nov-2017 GE Capital UK Funding floating rate 20-Mar-2017 Reynolds American Inc 2.300% 12-Jun-2018 BAT International Finance PLC 1.850% 15-Jun-2018 UBS AG/Stamford CT 1.375% 14-Aug-2017 Barclays Bank PLC 2.250% 22-Feb-2017 6,600,000 5,360,000 5,100,000 2,025,000 1,200,000 800,000 850,000 530,000 755,000 400,000 500,000 550,000 400,000 390,000 350,000 250,000 330,000 300,000 300,000 250,000 * See Note 1. 132 Cost USD 8,193,863 7,011,068 6,834,920 6,585,585 6,584,535 6,107,055 3,711,374 3,659,824 3,606,506 3,605,188 3,365,266 2,501,945 2,233,136 2,189,624 1,903,668 1,793,459 1,752,786 1,728,606 1,720,893 1,699,871 1,683,856 Proceeds USD 6,582,469 5,348,781 5,097,150 2,033,773 1,205,433 888,141 851,425 800,444 751,665 611,906 588,308 551,311 402,108 392,360 390,615 375,561 332,294 300,675 300,000 288,925 . PAYDEN GLOBAL FUNDS PUBLIC LIMITED COMPANY SCHEDULE OF SIGNIFICANT PORTFOLIO MOVEMENTS (continued) Payden Sterling Corporate Bond Fund – Investment Grade Total Purchases Holdings United Kingdom Gilt 1.750% 07-Sep-2022 Total Capital International SA 2.250% 09-Jun-2022 Abbey National Treasury Services PLC/London 1.875% 17-Feb-2020 United Kingdom Gilt 1.250% 22-Jul-2018 Nordea Bank AB 2.375% 02-Jun-2022 Lloyds Bank PLC 2.500% 01-Jun-2022 Southern Gas Networks PLC 4.875% 05-Oct-2023 Virgin Money PLC 2.250% 21-Apr-2020 National Australia Bank Ltd 1.875% 20-Feb-2020 Suncorp-Metway Ltd floating rate 06-Oct-2017 GE Capital UK Funding floating rate 16-Jan-2018 PACCAR Financial Europe BV 1.513% 29-May-2018 Nationwide Building Society 2.250% 29-Apr-2022 BUPA Finance PLC 5.000% 25-Apr-2023 Total Sales 350,000 350,000 350,000 300,000 300,000 300,000 250,000 270,000 250,000 200,000 200,000 150,000 150,000 100,000 Holdings BG Energy Capital PLC 5.125% 07-Dec-2017 Tesco PLC 6.125% 24-Feb-2022 Lloyds Bank PLC 2.750% 09-Dec-2018 United Kingdom Gilt 1.250% 22-Jul-2018 Marks & Spencer PLC 6.125% 02-Dec-2019 Anheuser-Busch InBev NV 4.000% 24-Sep-2025 GE Capital UK Funding floating rate 20-Mar-2017 United Kingdom Gilt 1.750% 07-Sep-2022 Next PLC 5.375% 26-Oct-2021 BUPA Finance PLC 3.375% 17-Jun-2021 Abbey National Treasury Services PLC/London 1.875% 17-Feb-2020 133 350,000 350,000 350,000 300,000 300,000 300,000 250,000 270,000 250,000 200,000 200,000 Cost GBP 358,061 349,468 346,658 302,888 298,398 297,477 294,973 267,991 249,370 200,346 200,000 150,000 148,881 107,206 Proceeds GBP 381,850 327,741 309,510 303,305 289,118 279,778 199,230 198,138 117,548 104,961 99,653 . PAYDEN GLOBAL FUNDS PUBLIC LIMITED COMPANY SCHEDULE OF SIGNIFICANT PORTFOLIO MOVEMENTS (continued) Payden Sterling Reserve Fund Purchases Holdings Toronto-Dominion Bank floating rate 19-Jan-2018 Leeds Building Society floating rate 09-Feb-2018 FMS Wertmanagement AoeR 1.000% 10-Apr-2018 DNB Boligkreditt AS floating rate 17-Feb-2020 Motor 2015-1 PLC floating rate 25-Jun-2022 Swedbank Hypotek AB floating rate 02-Apr-2018 Kommunekredit 1.125% 07-Dec-2018 Canadian Imperial Bank of Commerce/Canada 0.762% 15-Jan-2018 Volkswagen Financial Services NV 2.000% 23-Oct-2015 Bank of Montreal 0.758% 29-Jan-2018 ASB Finance Ltd/London floating rate 01-May-2018 Pohjola Bank OYJ 1.017% 21-May-2018 Caisse d'Amortissement de la Dette Sociale 1.000% 07-Mar-2018 GE Capital UK Funding 1.000% 16-Jan-2018 E-Carat 5 PLC 0.907% 18-Apr-2023 Penarth Master Issuer PLC 1.007% 18-Mar-2021 National Australia Bank Ltd 1.875% 20-Feb-2020 Coventry Building Society 0.873% 17-Mar-2020 Lloyds Bank PLC 0.759% 19-Jan-2018 Nationwide Building Society 0.771% 27-Apr-2018 Bank of Nova Scotia floating rate 02-Nov-2017 Bayerische Landesbank 0.757% 20-Feb-2015 5,500,000 5,500,000 5,500,000 5,000,000 5,000,000 5,000,000 4,700,000 4,500,000 4,000,000 4,000,000 4,000,000 4,000,000 3,500,000 3,350,000 3,000,000 2,850,000 2,750,000 2,500,000 2,000,000 2,000,000 1,250,000 1,000,000 Sales Holdings HSBC Bank PLC 0.955% 16-May-2016 Leeds Building Society 2.060% 20-Mar-2015 State of North Rhine-Westphalia 1.195% 23-May-2016 Pohjola Bank OYJ 1.107% 09-Nov-2015 European Investment Bank 0.755% 22-Feb-2017 ASB Finance Ltd/London floating rate 13-Mar-2017 GE Capital UK Funding 0.710% 20-Mar-2017 Finland Government International Bond 0.735% 23-Feb-2017 Asian Development Bank 0.607% 08-Feb-2016 Inter-American Development Bank 0.625% 15-Dec-2015 FMS Wertmanagement AoeR 0.750% 15-Dec-2017 National Australia Bank Ltd 3.625% 08-Nov-2017 Svenska Handelsbanken AB 0.957% 10-May-2016 Motor 2014-1 PLC floating rate 25-Aug-2021 Landwirtschaftliche Rentenbank 3.250% 07-Dec-2016 Svensk Exportkredit AB 0.875% 15-Dec-2015 Lloyds Bank PLC 2.210% 22-Mar-2017 Australia & New Zealand Banking Group Ltd 0.828% 04-Feb-2016 Nederlandse Waterschapsbank NV 2.125% 07-Sep-2016 FMS Wertmanagement AoeR 1.125% 07-Dec-2016 Cooperatieve Centrale Raiffeisen-Boerenleenbank BA/Netherlands 1.157% 07-Sep-2015 Nordea Eiendomskreditt AS 0.750% 11-Sep-2017 Kingdom of Belgium 5.000% 24-Apr-2018 Cooperatieve Centrale Raiffeisen-Boerenleenbank BA/Netherlands 4.000% 10-Sep-2015 Network Rail Infrastructure Finance PLC 1.125% 15-Dec-2016 Bayerische Landesbank 0.757% 20-Feb-2015 5,400,000 5,150,000 5,000,000 4,600,000 4,350,000 4,100,000 3,950,000 3,500,000 3,100,000 3,000,000 3,000,000 2,500,000 2,600,000 2,575,524 2,000,000 2,000,000 1,850,000 1,550,000 1,500,000 1,500,000 1,500,000 1,500,000 1,240,000 1,000,000 1,000,000 1,000,000 134 Cost GBP 5,500,000 5,500,000 5,488,890 5,000,000 5,000,000 5,000,000 4,690,459 4,500,000 4,025,200 4,000,000 4,000,000 4,000,000 3,487,260 3,350,000 3,000,000 2,852,850 2,743,070 2,500,000 2,000,000 2,000,000 1,250,388 1,000,108 Proceeds GBP 5,418,780 5,158,137 5,036,360 4,612,788 4,368,053 4,117,097 3,934,793 3,514,960 3,102,697 3,001,950 2,980,530 2,652,800 2,608,190 2,578,743 2,082,240 2,003,480 1,910,218 1,552,310 1,534,800 1,506,600 1,504,950 1,500,750 1,387,560 1,008,700 1,007,200 1,000,150 . PAYDEN GLOBAL FUNDS PUBLIC LIMITED COMPANY SCHEDULE OF SIGNIFICANT PORTFOLIO MOVEMENTS (continued) Payden US Core Bond Fund Purchases Holdings United States Treasury Note/Bond 1.625% 31-Dec-2016 United States Treasury Note/Bond 1.375% 29-Feb-2020 United States Treasury Note/Bond 1.500% 31-May-2020 Fannie Mae Pool 4.000% 01-Mar-2045 United States Treasury Note/Bond 2.000% 15-Feb-2025 Fannie Mae Pool 4.000% 01-Jul-2045 Fannie Mae Pool 4.000% 01-May-2045 Fannie Mae Pool 4.000% 01-Jun-2045 Federal Farm Credit Banks floating rate 17-Jan-2018 United States Treasury Note/Bond 3.000% 15-Nov-2044 Fannie Mae Pool 4.000% 01-Apr-2046 United States Treasury Note/Bond 0.500% 15-Jun-2016 United States Treasury Note/Bond 0.750% 15-Feb-2018 Fannie Mae Pool 4.500% 01-Jul-2045 Fannie Mae Pool 4.000% 01-Feb-2045 Fannie Mae Pool 3.000% 25-May-2030 Fannie Mae Pool 3.000% 31-Mar-2030 Fannie Mae Pool 3.000% 01-Apr-2031 Fannie Mae Pool 3.000% 15-Jun-2027 Fannie Mae Pool 3.000% 01-Jul-2030 Fannie Mae Pool 4.500% 01-May-2045 Fannie Mae Pool 4.500% 01-Jun-2045 Fannie Mae Pool 4.500% 01-Mar-2045 Fannie Mae Pool 4.500% 01-Apr-2046 Fannie Mae Pool 4.500% 01-Feb-2045 United States Treasury Floating Rate Note 31-Jan-2017 Ginnie Mae II Pool 4.500% 01-Jun-2045 Ginnie Mae II Pool 4.500% 01-Jul-2043 Mexico Government International Bond 3.625% 15-Mar-2022 Fannie Mae Pool 3.000% 15-Jul-2045 United States Treasury Floating Rate Note 2.250% 15-Nov-2024 1,280,000 1,225,000 1,070,000 880,000 865,000 580,000 540,000 540,000 540,000 505,000 500,000 530,000 530,000 450,000 430,000 400,000 400,000 400,000 400,000 400,000 380,000 380,000 380,000 380,000 360,000 360,000 320,000 320,000 265,000 260,000 255,000 135 Cost USD 1,288,050 1,220,870 1,067,325 939,717 858,599 614,095 577,063 574,678 540,004 536,755 531,816 531,491 529,172 486,745 458,958 419,078 417,875 416,813 415,953 414,297 413,766 412,622 412,080 411,889 390,570 360,054 346,500 345,300 275,043 259,261 258,845 . PAYDEN GLOBAL FUNDS PUBLIC LIMITED COMPANY SCHEDULE OF SIGNIFICANT PORTFOLIO MOVEMENTS (continued) Payden US Core Bond Fund (continued) Sales Holdings United States Treasury Note/Bond 1.750% 30-Sep-2019 United States Treasury Note/Bond 1.625% 31-Dec-2016 United States Treasury Note/Bond 1.375% 29-Feb-2020 Fannie Mae Pool 4.000% 01-Mar-2045 United States Treasury Note/Bond 2.000% 15-Feb-2025 Fannie Mae Pool 4.000% 01-May-2045 Fannie Mae Pool 4.000% 01-Jun-2045 Fannie Mae Pool 4.000% 01-Apr-2046 United States Treasury Note/Bond 1.000% 15-Dec-2017 United States Treasury Note/Bond 0.500% 15-Jun-2016 United States Treasury Note/Bond 0.750% 15-Feb-2018 United States Treasury Note/Bond 3.000% 15-Nov-2044 United States Treasury Strip Principal 0.000% 15-Nov-2040 Fannie Mae Pool 4.000% 25-Jan-2045 Fannie Mae Pool 4.000% 01-Feb-2045 United States Treasury Note/Bond 2.375% 15-Aug-2024 Fannie Mae Pool 3.000% 01-Apr-2031 Fannie Mae Pool 3.000% 31-Mar-2030 Fannie Mae Pool 3.000% 25-May-2030 Fannie Mae Pool 3.000% 15-Jun-2027 Fannie Mae Pool 4.500% 01-Apr-2046 Fannie Mae Pool 4.500% 01-May-2045 Fannie Mae Pool 4.500% 01-Mar-2045 Fannie Mae Pool 4.500% 01-Jun-2045 Fannie Mae Pool 4.500% 15-Jan-2045 Fannie Mae Pool 4.500% 01-Feb-2045 Ginnie Mae II Pool 4.500% 01-Jun-2045 United States Treasury Note/Bond 2.250% 15-Nov-2024 Fannie Mae Pool 4.500% 01-Jul-2045 Ginnie Mae I Pool 4.000% 15-Dec-2040 Ginnie Mae II Pool 4.000% 15-May-2045 Fannie Mae Pool 3.000% 01-Apr-2046 Ginnie Mae II Pool 4.000% 15-Feb-2045 Ginnie Mae II Pool 4.000% 01-Apr-2046 Ginnie Mae II Pool 4.000% 15-Mar-2045 Ginnie Mae II Pool 4.000% 15-May-2045 Fannie Mae Pool 3.000% 01-May-2045 Fannie Mae Pool 3.000% 15-Jun-2045 1,280,000 1,280,000 1,225,000 880,000 865,000 540,000 540,000 500,000 530,000 530,000 530,000 505,000 950,000 430,000 430,000 405,000 400,000 400,000 400,000 400,000 380,000 380,000 380,000 380,000 360,000 360,000 320,000 255,000 220,000 210,679 210,000 220,000 210,000 210,000 210,000 210,000 220,000 220,000 136 Proceeds USD 1,296,100 1,288,581 1,218,080 938,263 863,450 575,438 572,788 535,078 533,230 530,766 530,683 529,297 485,536 460,100 459,966 421,194 419,813 417,750 416,563 415,000 414,731 413,013 412,334 411,647 391,203 390,750 345,700 259,153 238,219 227,961 225,848 225,706 225,455 225,422 224,634 223,880 221,616 219,983 . PAYDEN GLOBAL FUNDS PUBLIC LIMITED COMPANY SCHEDULE OF SIGNIFICANT PORTFOLIO MOVEMENTS (continued) Payden US Dollar Liquidity Fund Purchases Holdings United States Treasury Floating Rate Note 31-Jan-2017 United States Treasury Note/Bond 0.500% 30-Jun-2016 Federal Farm Credit Banks floating rate 16-Apr-2018 Federal Farm Credit Banks floating rate 26-Mar-2018 NCUA Guaranteed Notes Trust 2010-R2 floating rate 05-Nov-2020 United States Treasury Note/Bond 0.375% 15-Mar-2016 Mercedes Benz Auto Lease Trust 2015-A floating rate 15-Feb-2017 Federal Farm Credit Banks floating rate 02-Jan-2018 UBS AG/Stamford CT floating rate 26-Sep-2016 Carlyle Global Market Strategies 1.740% 27-Apr-2027 Babson CLO Ltd 2015-I 1.709% 20-Apr-2027 Octagon Investment Partners 24 Ltd 1.731% 21-May-2027 Symphony CLO XV Ltd 1.720% 17-Oct-2026 CNH Equipment Trust 2015-A 0.840% 15-Jun-2018 Navient Student Loan Trust 2015-1 floating rate 26-Sep-2022 CarMax Auto Owner Trust 2015-1 0.880% 15-Mar-2018 CarMax Auto Owner Trust 2015-2 0.820% 15-Jun-2018 DNB Boligkreditt AS 2.100% 14-Oct-2015 Nederlandse Waterschapsbank NV 1.250% 18-Sep-2017 QUALCOMM Inc floating rate 18-May-2018 Volkswagen Auto Lease Trust 2015-A 0.870% 20-Jun-2017 CNH Equipment Trust 0.840% 15-Aug-2018 MMAF Equipment Finance LLC 2015-A 0.960% 18-Sep-2017 Daimler Finance North America LLC floating rate 02-Mar-2017 Santander Drive Auto Receivables Trust 2015-1 0.320% 15-Mar-2016 AbbVie Inc 1.800% 14-May-2018 Colony American Homes Single-Family Rental Pass-Through Certificates 1.387% 17-Jul-2032 2,000,000 500,000 500,000 400,000 377,634 300,000 300,000 300,000 250,000 250,000 250,000 250,000 250,000 240,000 230,000 210,000 205,000 200,000 200,000 200,000 200,000 200,000 155,000 150,000 120,000 120,000 Cost USD 2,000,066 501,328 499,924 400,000 380,290 300,504 300,000 299,983 250,000 250,000 250,000 250,000 249,844 239,988 230,000 209,978 204,978 202,094 201,158 200,000 199,999 199,988 154,987 150,000 120,000 119,878 110,000 110,000 Sales Holdings United States Treasury Note/Bond 0.375% 31-Mar-2016 United States Treasury Note/Bond 0.250% 15-Aug-2015 United States Treasury Note/Bond 0.500% 30-Jun-2016 United States Treasury Note/Bond 0.375% 15-Mar-2016 United States Treasury Note/Bond 0.375% 31-Oct-2016 United States Treasury Note/Bond 0.250% 31-May-2015 United States Treasury Note/Bond 0.375% 15-Jan-2016 United States Treasury Note/Bond 0.375% 31-Jan-2016 United States Treasury Floating Rate Note 31-Oct-2016 Federal National Mortgage Association floating rate 16-Aug-2016 United States Treasury Floating Rate Note 30-Apr-2016 United States Treasury Floating Rate Note 31-Jan-2017 United States Treasury Floating Rate Note 31-Jul-2016 United States Treasury Note/Bond 0.875% 15-Nov-2017 United States Treasury Floating Rate Note 31-Jan-2016 US Bank NA/Cincinnati OH 0.439% 11-Sep-2017 Credit Suisse/New York NY floating rate 11-Mar-2016 Banque Federative du Credit Mutuel SA floating rate 20-Jan-2017 Nederlandse Waterschapsbank NV 0.750% 29-Mar-2016 International Finance Facility for Immunisation floating rate 05-Jul-2016 New York Life Global Funding floating rate 06-Sep-2016 Province of Ontario Canada 0.405% 01-Apr-2015 SLM Student Loan Trust 2014-1 floating rate 26-Jul-2021 PACCAR Financial Corp 1.100% 06-Jun-2017 1,500,000 1,500,000 1,200,000 1,200,000 900,000 800,000 775,000 700,000 700,000 500,000 500,000 400,000 400,000 300,000 275,000 250,000 250,000 200,000 200,000 200,000 200,000 190,000 175,000 165,000 Proceeds USD 1,502,402 1,500,938 1,202,906 1,201,669 898,793 800,531 776,076 701,012 699,804 500,277 500,064 400,092 400,022 299,063 274,966 249,830 249,818 201,294 200,640 200,214 200,050 190,048 174,754 164,728 137 . PAYDEN GLOBAL FUNDS PUBLIC LIMITED COMPANY SCHEDULE OF SIGNIFICANT PORTFOLIO MOVEMENTS (continued) Payden USD Low Duration Credit Fund Purchases Holdings United States Treasury Note/Bond 0.500% 31-Jan-2017 United States Treasury Note/Bond 1.625% 31-Dec-2019 Actavis Funding SCS 2.350% 12-Mar-2018 Goldman Sachs Group Inc 6.150% 01-Apr-2018 Credit Suisse/New York NY 1.750% 29-Jan-2018 Verizon Communications Inc 3.650% 14-Sep-2018 American International Group Inc 5.450% 18-May-2017 Jackson National Life Global Funding 2.300% 16-Apr-2019 Bank of Tokyo-Mitsubishi UFJ Ltd 2.450% 16-Oct-2019 The Alibaba Group Holding Ltd 1.625% 28-Nov-2017 Zimmer Biomet Holdings Inc 2.000% 01-Apr-2018 KeyBank NA 2.250% 16-Mar-2020 United States Treasury Note/Bond 1.250% 31-Jan-2020 Kennametal Inc 2.650% 01-Nov-2019 Capital One Financial Corp 6.150% 01-Sep-2016 HPHT Finance 15 Ltd 2.250% 17-Mar-2018 USAA Capital Corp 2.125% 03-Jun-2019 Astoria Financial Corp 5.000% 19-Jun-2017 Morgan Stanley 2.653% 27-Jan-2020 Lloyds Bank PLC 6.500% 14-Sep-2020 Huntington National Bank 1.300% 20-Nov-2016 BP Capital Markets PLC 2.315% 13-Feb-2020 Pernod Ricard SA 2.950% 15-Jan-2017 International Lease Finance Corp 3.875% 15-Apr-2018 Lam Research Corp 2.750% 15-Mar-2020 Santander Bank NA 2.000% 12-Jan-2018 Prudential Financial Inc floating rate 15-Jun-2038 Sumitomo Mitsui Banking Corp floating rate 16-Jan-2018 Telefonica Emisiones SAU 5.134% 27-Apr-2020 Phillips 66 2.646% 15-Feb-2020 Hyundai Capital America 1.875% 09-Aug-2016 Ally Financial Inc 3.250% 13-Feb-2018 TIAA Asset Management Finance Co LLC 2.950% 01-Nov-2019 Mitsubishi UFJ Trust & Banking Corp 1.600% 16-Oct-2017 Tingyi (CI) Holding Corp 3.875% 20-Jun-2017 Morgan Stanley 5.450% 09-Jan-2017 BNZ International Funding Ltd/London 1.900% 26-Feb-2018 Pricoa Global Funding 2.200% 16-May-2019 Hyundai Capital America 2.875% 09-Aug-2018 Sales 40,000,000 10,000,000 10,000,000 7,094,000 7,900,000 6,600,000 5,800,000 5,150,000 5,000,000 5,000,000 5,000,000 5,000,000 5,000,000 4,800,000 4,400,000 4,600,000 4,500,000 4,250,000 4,500,000 3,750,000 4,300,000 4,200,000 4,000,000 4,000,000 4,025,000 3,900,000 3,100,000 3,500,000 3,000,000 3,300,000 3,255,000 3,300,000 3,200,000 3,200,000 3,071,000 2,900,000 3,050,000 3,000,000 2,731,000 Holdings United States Treasury Note/Bond 0.500% 31-Jan-2017 Bear Stearns Cos LLC 5.550% 22-Jan-2017 Actavis Funding SCS 2.350% 12-Mar-2018 United States Treasury Note/Bond 1.625% 31-Dec-2019 Credit Suisse/New York NY 1.750% 29-Jan-2018 Goldman Sachs Group Inc 6.150% 01-Apr-2018 Ford Motor Credit Co LLC 6.625% 15-Aug-2017 Citigroup Inc 5.500% 15-Feb-2017 Verizon Communications Inc 3.650% 14-Sep-2018 TIAA Asset Management Finance Co LLC 2.950% 01-Nov-2019 Macquarie Group Ltd 4.875% 10-Aug-2017 Lloyds Bank PLC 6.500% 14-Sep-2020 International Lease Finance Corp 3.875% 15-Apr-2018 Capital One Financial Corp. 6.150% 01-Sep-2016 Bank of America Corp 5.420% 15-Mar-2017 Morgan Stanley 5.450% 09-Jan-2017 Korea Expressway Corp 1.625% 28-Apr-2017 Tencent Holdings Ltd 3.375% 02-May-2019 Want Want China Finance Ltd 1.875% 14-May-2018 JPMorgan Chase Bank NA 6.000% 05-Jul-2017 138 40,000,000 13,030,000 10,000,000 10,000,000 7,900,000 6,994,000 6,599,000 6,460,000 6,500,000 6,650,000 6,050,000 5,450,000 6,190,000 5,800,000 5,500,000 5,400,000 5,500,000 5,260,000 5,375,000 4,750,000 Cost USD 39,912,500 10,149,609 9,995,100 7,994,539 7,895,418 7,006,226 6,331,976 5,204,307 5,041,050 5,002,050 4,996,600 4,992,300 4,924,023 4,803,216 4,710,932 4,590,202 4,527,675 4,511,843 4,496,040 4,394,001 4,305,891 4,200,000 4,114,710 4,099,750 4,021,619 3,886,116 3,665,750 3,508,365 3,384,870 3,300,000 3,286,631 3,276,702 3,260,452 3,204,352 3,170,952 3,113,817 3,049,116 3,017,430 2,800,586 Proceeds USD 39,930,352 13,940,367 10,122,530 10,064,131 7,901,501 7,840,868 7,329,661 6,928,608 6,902,740 6,809,467 6,477,142 6,398,224 6,290,588 6,181,402 5,875,051 5,779,955 5,501,601 5,453,321 5,334,274 5,227,005 . PAYDEN GLOBAL FUNDS PUBLIC LIMITED COMPANY SCHEDULE OF SIGNIFICANT PORTFOLIO MOVEMENTS (continued) Payden World Equity Fund Total Purchases Holdings Japan Government Two Year Bond 0.100% 15-Sep-2015 Japan Government Five Year Bond 0.300% 20-Jun-2015 Japan Government Two Year Bond 0.100% 15-Apr-2015 Japan Government Two Year Bond 0.100% 15-Aug-2015 Japan Government Five Year Bond 0.300% 20-Sep-2015 Japan Government Five Year Bond 0.400% 20-Jun-2015 400,000,000 250,000,000 250,000,000 250,000,000 250,000,000 210,000,000 There were no sales during the period for Payden World Equity Fund. 139 Cost USD 3,250,912 2,103,118 2,101,332 2,080,425 2,034,313 1,730,281 .


