


Description
P A R N A S S U S F U N D S®
QUARTERLY REPORT â–ª SEPTEMBER 30, 2015
PARNASSUS FUNDS
Parnassus Fund
SM
Investor Shares
Institutional Shares
PARNX
PFPRX
Parnassus Core Equity Fund
SM
Investor Shares
Institutional Shares
PRBLX
PRILX
Parnassus Endeavor Fund
SM
Investor Shares
Institutional Shares
PARWX
PFPWX
Parnassus Mid Cap Fund
SM
Investor Shares
Institutional Shares
PARMX
PFPMX
Parnassus Asia Fund
SM
Investor Shares
Institutional Shares
PAFSX
PFPSX
Parnassus Fixed Income Fund
SM
Investor Shares
Institutional Shares
PRFIX
PFPLX
.
. Table of Contents
Letter from Parnassus Investments .............. 4
Fund Performance and Commentary
Parnassus Fund.............................................. 6
Parnassus Core Equity Fund......................... 9
Parnassus Endeavor Fund.............................12
Parnassus Mid Cap Fund ..............................14
Parnassus Asia Fund......................................17
Parnassus Fixed Income Fund ......................20
Responsible Investing Notes ........................22
Portfolios of Investments
Parnassus Fund..............................................24
Parnassus Core Equity Fund.........................25
Parnassus Endeavor Fund.............................26
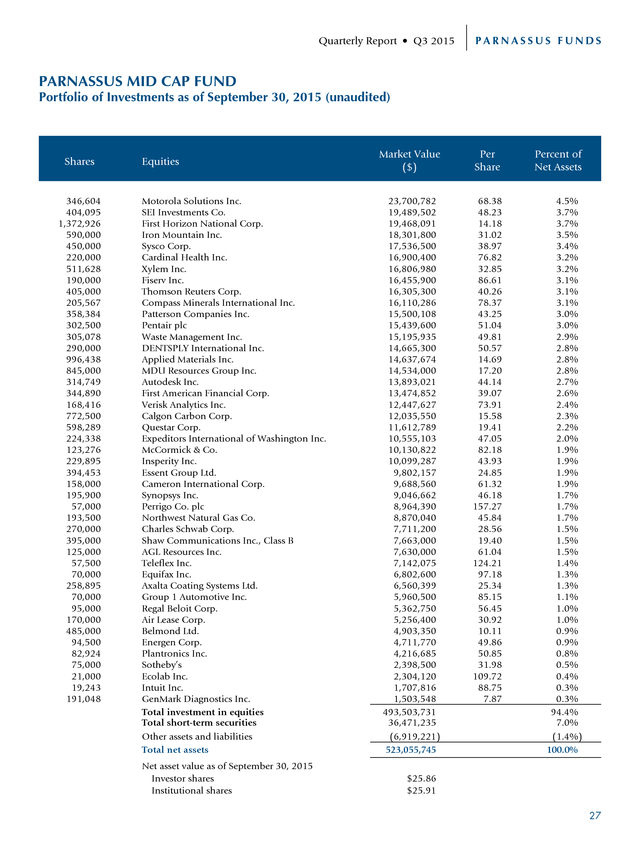
Parnassus Mid Cap Fund ..............................27
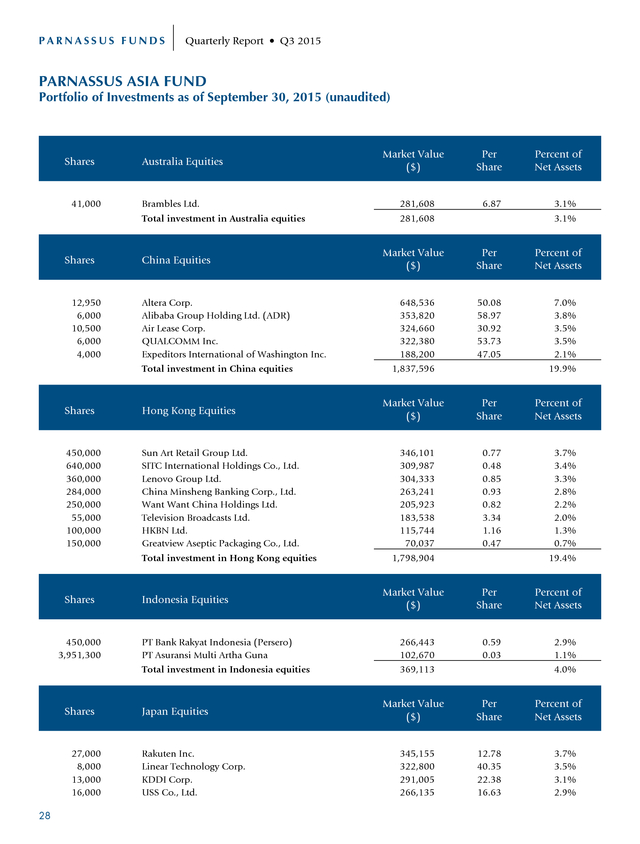
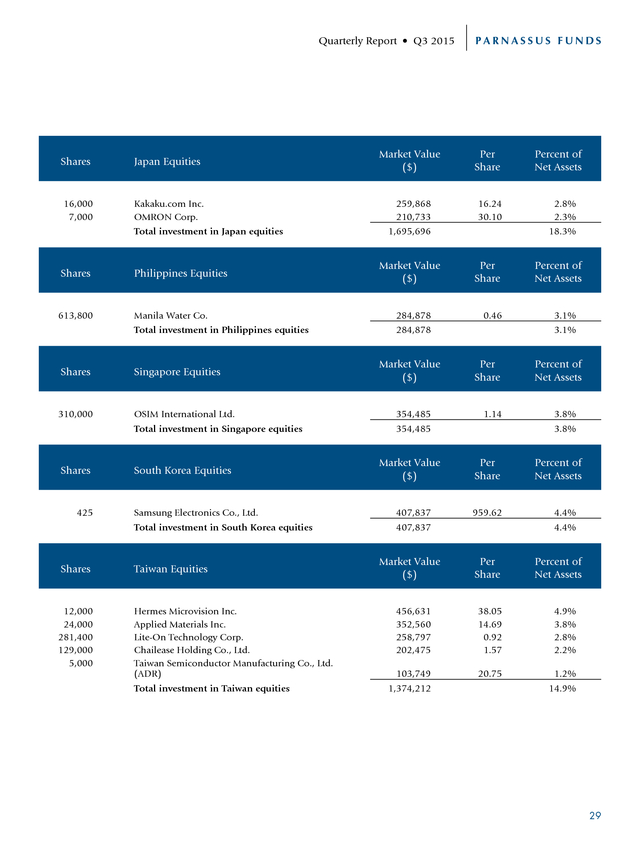
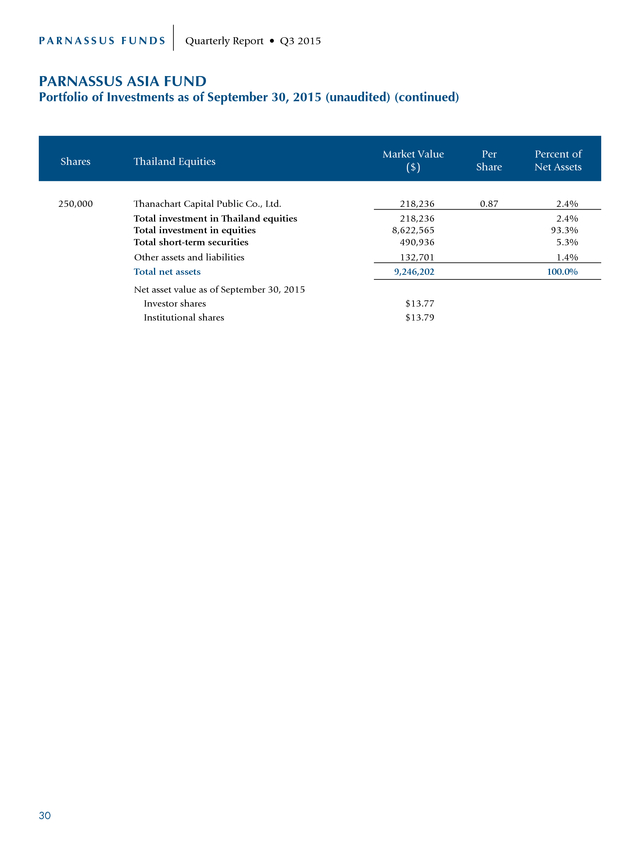
Parnassus Asia Fund......................................28
Parnassus Fixed Income Fund ......................31
.
PARNASSUS FUNDS Quarterly Report • Q3 2015 November 2, 2015 Dear Shareholder: As this report is being written, there has been a lot of volatility in the markets. One day, there will be bad economic news, so the market heads much lower. The next day, there will be good news, so the market will head much higher. I know this is confusing to a lot of investors, but at Parnassus, we try to take advantage of these sharp moves up and down to provide good returns for our shareholders.
When the markets are down, we look at it as an opportunity to buy stocks at bargain prices. When the market is up, we will either sell or hold; usually we hold. We try to keep a long-term focus on our investments. To do this, you have to have the right temperament.
You can’t feel too bad when the market is down, and you can’t get too excited when the market is up. This has worked well for us over the years, so our funds have excellent long-term track records. For example, the Parnassus Mid Cap Fund-Investor Shares have earned 8.73% per year over the last ten years compared to 7.87% per year for the Russell MidCap Index and 6.50% per year for the Lipper Mid-Cap Core Average. This makes it #8 out of the 222 midcap core funds followed by Lipper for the ten years.
(It placed #101 of 416 funds, #251 of 368 funds and #61 of 322 funds for the one-, three- and five-year periods, respectively.) The Parnassus Fund-Investor Shares have earned 9.98% per year over the last ten years compared to 6.79% for the S&P 500 Index and 5.91% for the average multi-cap core fund followed by Lipper, making it #4 of 360 funds. (It placed #27 of 744 funds, #36 of 650 funds and #19 of 571 funds for the one-, three- and five-year periods, respectively.) Both the Parnassus Core Equity Fund-Investor Shares and the Parnassus Endeavor Fund-Investor Shares finished #1 in their respective categories for the ten-year period. The Parnassus Core Equity Fund-Investor Shares returned an average of 9.55% per year over the ten-year period, compared to 6.79% for the S&P 500 Index and 5.81% for the average equity income fund followed by Lipper, making it the leading fund in its category.
(It placed #28 of 502 funds, #2 of 385 funds and #5 of 299 funds for the one-, three- and five-year periods, respectively.) Finally, the Parnassus Endeavor Fund-Investor Shares earned an average of 11.20% per year over the ten-year period, compared to 6.79% for the S&P 500 and 5.91% for the average multi-cap core fund followed by Lipper, which made it #1 in its category. (It placed #33 of 744 funds, #38 of 650 funds and #16 of 571 funds, for the one-, three- and five-year periods, respectively.) We have been able to achieve this excellent performance by focusing on the long-term, and not being distracted by the day-today movements in the market. New Staff Members Angela Du joined Parnassus in August as a senior research analyst, after successfully completing the Parnassus intern program. Prior to Parnassus, Angela worked as an investment banking analyst at Goldman Sachs and as a private equity associate at TPG Capital. Angela graduated with distinction from Stanford University, where she studied management science and engineering, and was inducted into Phi Beta Kappa and Tau Beta Pi.
She recently received her MBA from the Wharton School of Business at the University of Pennsylvania. 4 . Quarterly Report • Q3 2015 PARNASSUS FUNDS Turner Miller joined Parnassus in September as a Sales Associate. Turner comes to us from LPL Financial where he spent eight years in a variety of roles in their San Diego headquarters, including product management, client service and business management. Turner received his bachelor’s degree in Financial Services from San Diego State University. Thank you for your investment in the Parnassus Funds. Yours truly, Jerome L. Dodson President 5 .
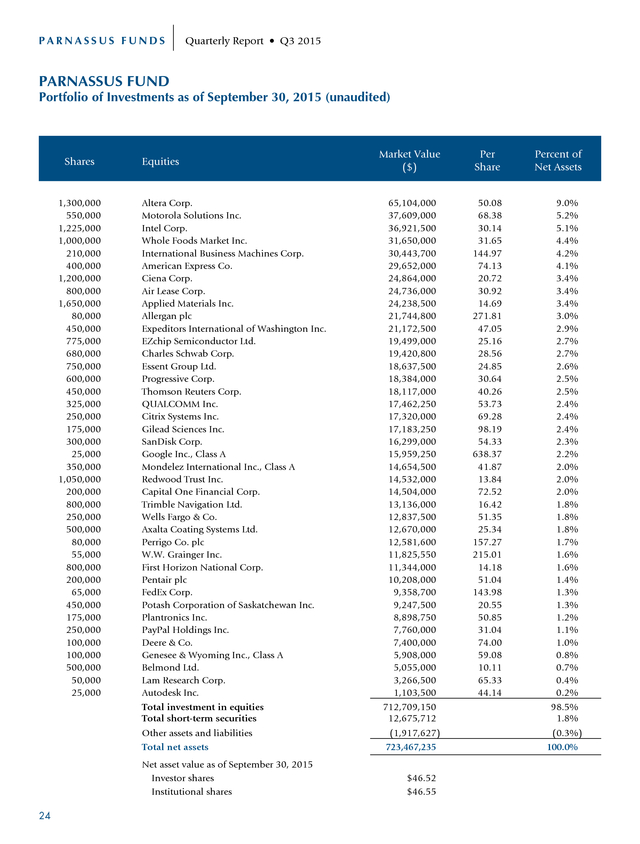
PARNASSUS FUNDS Quarterly Report • Q3 2015 PARNASSUS FUND Ticker: Investor Shares - PARNX Ticker: Institutional Shares - PFPRX As of September 30, 2015, the net asset value per share (“NAV”) of the Parnassus Fund-Investor Shares was $46.52, resulting in a loss of 6.32% for the third quarter. This compares to a loss of 6.43% for the S&P 500 Index (“S&P 500”) and a loss of 8.03% for the Lipper Multi-Cap Core Average, which represents the average return of the multi-cap core funds followed by Lipper (“Lipper average”). For the year-to-date, the Fund is down 3.27%, compared to a loss of 5.27% for the S&P 500 and a loss of 6.34% for the Lipper average. While it’s never pleasant to lose money, we take some satisfaction that we lost less than both of our benchmarks. Parnassus Fund Average Annual Total Returns (%) One Year Three Years Five Years Ten Years Gross Expense Ratio Net Expense Ratio Parnassus Fund Investor Shares 4.44 15.61 14.76 9.98 0.84 0.84 Parnassus Fund Institutional Shares 4.51 15.63 14.77 9.99 0.77 0.77 S&P 500 Index -0.61 12.39 13.32 6.79 NA NA Lipper Multi-Cap Core Average -2.16 11.81 11.48 5.91 NA NA for periods ended September 30, 2015 The average annual total return for the Parnassus Fund-Institutional Shares from commencement (April 30, 2015) was -5.85%.
Performance shown prior to the inception of the Institutional Shares reflects the performance of the Parnassus Fund-Investor Shares and includes expenses that are not applicable to and are higher than those of the Institutional Shares. The performance of the Institutional Shares differs from that shown for the Investor Shares to the extent that the classes do not have the same expenses. Performance data quoted represent past performance and are no guarantee of future returns.
Current performance may be lower or higher than the performance data quoted. Current performance information to the most recent month-end is available on the Parnassus website (www.parnassus.com). Investment return and principal value will fluctuate, so an investor’s shares, when redeemed, may be worth more or less than their original principal cost. Returns shown in the table do not reflect the deduction of taxes a shareholder may pay on fund distributions or redemption of shares.
The S&P 500 is an unmanaged index of common stocks, and it is not possible to invest directly in an index. Index figures do not take any expenses, fees or taxes into account, but mutual fund returns do. Before investing, an investor should carefully consider the investment objectives, risks, charges and expenses of the Fund and should carefully read the prospectus or summary prospectus, To the left is a table comparing the Parnassus Fund with the S&P 500 and the Lipper average over the past one-, three-, five- and ten-year periods. You will notice that the Fund is well ahead of both benchmarks for every time period. We’re especially proud of the ten-year period, where we’ve earned 9.98% per year compared to 6.79% for the S&P 500 and 5.91% for the Lipper average, making the Parnassus Fund the fourth best-performing fund of the 360 multi-cap core funds followed by Lipper for the ten-year period. (It placed #27 of 744 funds, #36 of 650 funds and #19 of 571 funds for the one-, three- and five-year periods, respectively.) Company Analysis The market moved sharply lower in the third quarter, and unfortunately, most of our stocks participated in that downward movement.
Our four worst-performing companies this quarter each sliced 29¢ or more off the NAV. Thankfully, we had three companies that each contributed 40¢ or more to the NAV, which offset some of the losses. Applied Materials, the largest maker of equipment used to produce semiconductors, sliced 42¢ off the NAV, as its stock sank 23.6% from $19.22 to $14.69. Intel, one of the company’s biggest customers, announced a delay in moving from 14 nanometer chips to 10 nanometer chips, and this meant that Intel would defer new orders for equipment.
Adding to the Intel situation were concerns about a global economic slowdown – especially in China – that would mean a lot less business for Applied. which contains this and other information. The prospectus or summary prospectus can be obtained on the Parnassus website or by calling (800) 999-3505. As described in the Fund’s current prospectus dated May 1, 2015, Parnassus Investments has contractually agreed to limit total operating expenses to 0.77% of net assets for the Parnassus Fund-Institutional Shares. This agreement will not be terminated prior to May 1, 2016, and may be continued indefinitely by the Adviser on a year-to-year basis. 6 Whole Foods, the world’s largest retailer of natural foods, cut 40¢ off the value of each fund share, as its stock fell 19.8% from $39.44 to $31.65.
The company’s growth has slowed, and there was also some bad publicity, when New York City officials found that Whole Foods had overstated the . Quarterly Report • Q3 2015 weight of some freshly-packaged food, resulting in overcharges to customers. (The company immediately fixed the problem.) The stock is trading at its lowest valuation since 2009, so it’s on the bargain table. We expect it will move higher, as the company introduces initiatives to accelerate growth. Shares of Trimble Navigation sank 30%, from $23.46 to $16.42, slicing 34¢ off the value of each Parnassus Fund share. Trimble makes GPS positioning and precision measurement products that increase the efficiency of construction workers, farmers and truck drivers. The stock dropped after the company reported disappointing sales, as farmers coping with low crop prices aren’t investing in new technology, while its construction segment is struggling with declining demand from oil and gas customers.
A steep drop in new construction projects in China made things worse. The downturn has been deeper than we expected, but the cycle will eventually turn, and when it does, Trimble should benefit from increasing adoption of products that save customers time and money. Meanwhile, investors are overlooking an attractive recurring revenue stream from Trimble’s subscription-based engineering software, and strong growth from its trucking division.
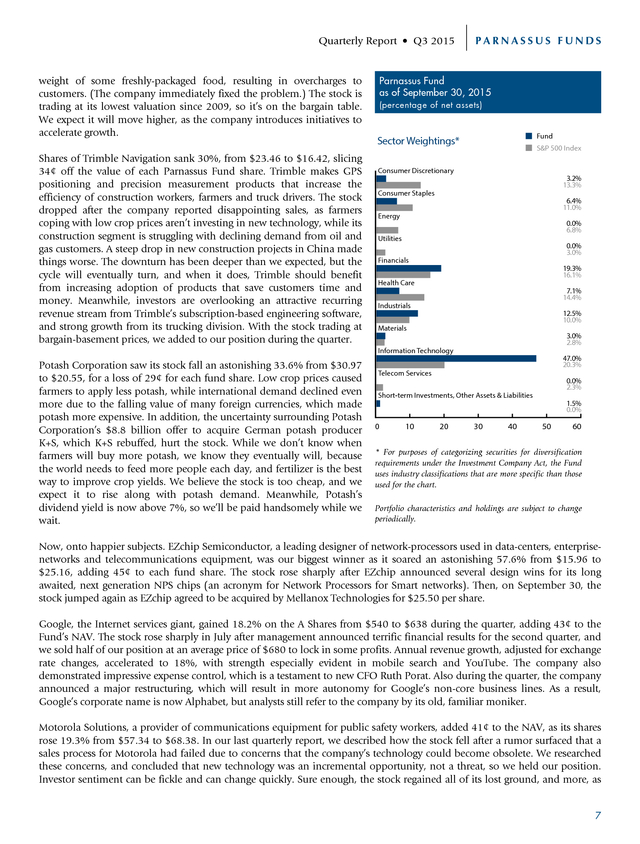
With the stock trading at bargain-basement prices, we added to our position during the quarter. PARNASSUS FUNDS Parnassus Fund as of September 30, 2015 (percentage of net assets) Fund Sector Weightings* S&P 500 Index Consumer Discretionary 3.2% 13.3% Consumer Staples 6.4% 11.0% Energy 0.0% 6.8% Utilities 0.0% 3.0% Financials 19.3% 16.1% Health Care 7.1% 14.4% Industrials 12.5% 10.0% Materials 3.0% 2.8% Information Technology Potash Corporation saw its stock fall an astonishing 33.6% from $30.97 to $20.55, for a loss of 29¢ for each fund share. Low crop prices caused farmers to apply less potash, while international demand declined even more due to the falling value of many foreign currencies, which made potash more expensive. In addition, the uncertainty surrounding Potash Corporation’s $8.8 billion offer to acquire German potash producer K+S, which K+S rebuffed, hurt the stock.
While we don’t know when farmers will buy more potash, we know they eventually will, because the world needs to feed more people each day, and fertilizer is the best way to improve crop yields. We believe the stock is too cheap, and we expect it to rise along with potash demand. Meanwhile, Potash’s dividend yield is now above 7%, so we’ll be paid handsomely while we wait. 47.0% 20.3% Telecom Services 0.0% 2.3% Short-term Investments, Other Assets & Liabilities 1.5% 0.0% 0 10 20 30 40 50 60 * For purposes of categorizing securities for diversification requirements under the Investment Company Act, the Fund uses industry classifications that are more specific than those used for the chart. Portfolio characteristics and holdings are subject to change periodically. Now, onto happier subjects.
EZchip Semiconductor, a leading designer of network-processors used in data-centers, enterprisenetworks and telecommunications equipment, was our biggest winner as it soared an astonishing 57.6% from $15.96 to $25.16, adding 45¢ to each fund share. The stock rose sharply after EZchip announced several design wins for its long awaited, next generation NPS chips (an acronym for Network Processors for Smart networks). Then, on September 30, the stock jumped again as EZchip agreed to be acquired by Mellanox Technologies for $25.50 per share. Google, the Internet services giant, gained 18.2% on the A Shares from $540 to $638 during the quarter, adding 43¢ to the Fund’s NAV.
The stock rose sharply in July after management announced terrific financial results for the second quarter, and we sold half of our position at an average price of $680 to lock in some profits. Annual revenue growth, adjusted for exchange rate changes, accelerated to 18%, with strength especially evident in mobile search and YouTube. The company also demonstrated impressive expense control, which is a testament to new CFO Ruth Porat.
Also during the quarter, the company announced a major restructuring, which will result in more autonomy for Google’s non-core business lines. As a result, Google’s corporate name is now Alphabet, but analysts still refer to the company by its old, familiar moniker. Motorola Solutions, a provider of communications equipment for public safety workers, added 41¢ to the NAV, as its shares rose 19.3% from $57.34 to $68.38. In our last quarterly report, we described how the stock fell after a rumor surfaced that a sales process for Motorola had failed due to concerns that the company’s technology could become obsolete.
We researched these concerns, and concluded that new technology was an incremental opportunity, not a threat, so we held our position. Investor sentiment can be fickle and can change quickly. Sure enough, the stock regained all of its lost ground, and more, as 7 . PARNASSUS FUNDS Quarterly Report • Q3 2015 investor sentiment improved after Motorola reported another quarter of earnings that exceeded expectations. In addition, Motorola took advantage of its depressed valuation by repurchasing $2 billion worth of its shares. We continue to believe the future is bright for the company, and we’re holding onto our position. Outlook and Strategy (Note: This section applies to both the Parnassus Fund and the Parnassus Endeavor Fund.) The S&P 500’s impressive streak of ten consecutive quarters with positive returns has ended. It was a great run, but unfortunately stocks don’t go up in a straight line forever.
The U.S. economy has been one of the world’s best performing this year, but investors have become concerned that other countries are not faring as well, and could drag the U.S. down. In August, the People’s Bank of China devalued its currency, the yuan, by 2%.
While 2% may not seem like much to get excited about, it marked a change in policy from the gradual appreciation in the yuan that China had allowed since 2004. China’s economy weakened during the quarter, and devaluing the yuan was likely an attempt to spur exports. As the world’s second largest economy, China’s deceleration has dragged other countries down with it, hurting export demand for American companies. Declining foreign currencies have made a bad situation worse, because foreign revenue is now worth less when converted into U.S.
dollars. For years, China’s strong growth created an insatiable appetite for all types of commodities. Energy companies drilled more wells, miners expanded their production and farmers invested in new equipment to meet the burgeoning demand from China. Now that demand has slowed, the excess supply has caused commodity prices to drop sharply. In mid-September, the Federal Reserve decided not to raise its benchmark federal funds rate, because it was concerned that recent global economic and financial developments could restrain the U.S.
economy. Shortly after the quarter ended, its fears were confirmed, as the economy created 142,000 jobs in September, well below expectations of 201,000. While the U.S. economy is dealing with stiff international headwinds, it’s still growing.
In fact, the strong U.S. dollar and low commodity prices are actually tailwinds for the U.S. consumer, as their hard-earned dollars will go further because gas and imported goods have become less expensive.
Since consumer spending represents 70% of the economy, this should have a positive impact. We aren’t market-timers, and we don’t know if the next move for the market will be up or down, so we can’t pick the bottom. However, we’ve been successful at taking advantage of sell-offs and investing in great businesses trading at bargain prices. As the saying goes, our goal is to buy low and sell high. It sounds easy, but many investors are emotionally affected by a sell-off, which leads to panic-selling, pushing stock prices down further.
We hope to profit by buying and holding when prices are low. We didn’t sell any of our losers this quarter. Instead, in some situations, we invested more. We’re proud to note that two of the Parnassus Fund’s biggest winners this quarter, EZchip Semiconductor and Motorola Solutions, are both examples of stocks that declined earlier this year as investors overreacted to bad news or rumors, then bounced back to regain all of their lost ground, and more.
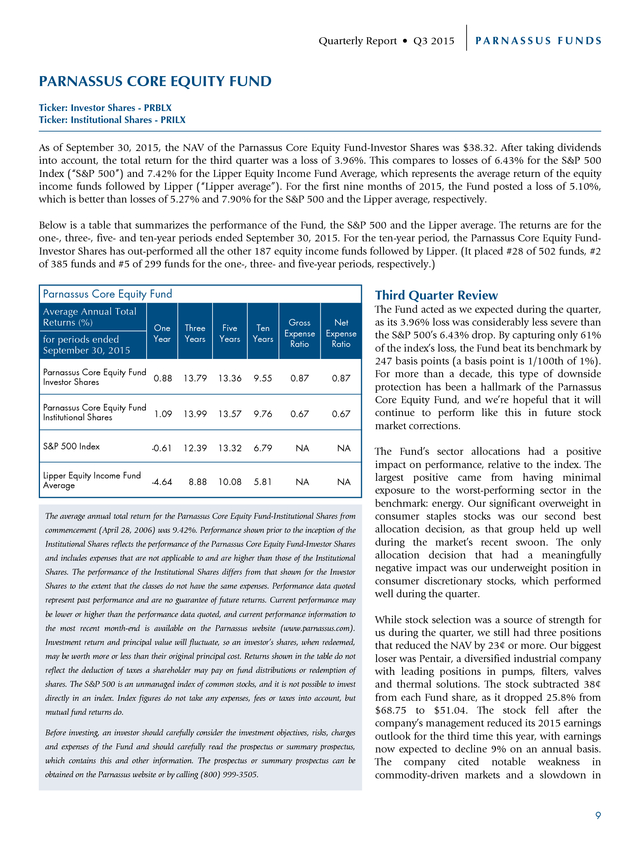
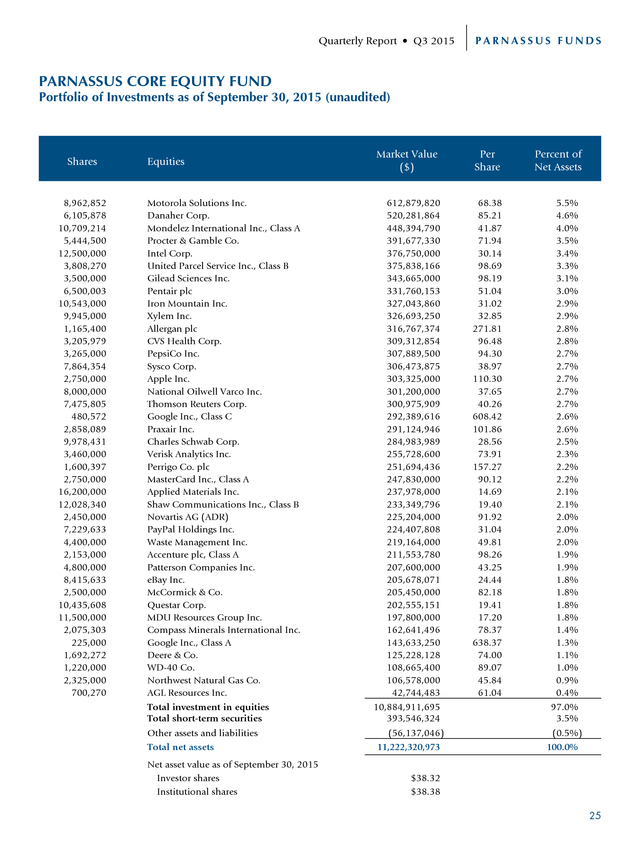
Our patience paid off in both cases, and we believe will pay off again with this quarter’s losers as well. Yours truly, Jerome L. Dodson Lead Portfolio Manager 8 Ian Sexsmith Portfolio Manager . Quarterly Report • Q3 2015 PARNASSUS FUNDS PARNASSUS CORE EQUITY FUND Ticker: Investor Shares - PRBLX Ticker: Institutional Shares - PRILX As of September 30, 2015, the NAV of the Parnassus Core Equity Fund-Investor Shares was $38.32. After taking dividends into account, the total return for the third quarter was a loss of 3.96%. This compares to losses of 6.43% for the S&P 500 Index (“S&P 500”) and 7.42% for the Lipper Equity Income Fund Average, which represents the average return of the equity income funds followed by Lipper (“Lipper average”). For the first nine months of 2015, the Fund posted a loss of 5.10%, which is better than losses of 5.27% and 7.90% for the S&P 500 and the Lipper average, respectively. Below is a table that summarizes the performance of the Fund, the S&P 500 and the Lipper average.
The returns are for the one-, three-, five- and ten-year periods ended September 30, 2015. For the ten-year period, the Parnassus Core Equity FundInvestor Shares has out-performed all the other 187 equity income funds followed by Lipper. (It placed #28 of 502 funds, #2 of 385 funds and #5 of 299 funds for the one-, three- and five-year periods, respectively.) Parnassus Core Equity Fund Average Annual Total Returns (%) Third Quarter Review One Year Three Years Five Years Ten Years Gross Expense Ratio Parnassus Core Equity Fund 0.88 Investor Shares 13.79 13.36 9.55 0.87 0.87 Parnassus Core Equity Fund 1.09 Institutional Shares 13.99 13.57 9.76 0.67 0.67 S&P 500 Index -0.61 12.39 13.32 6.79 NA NA Lipper Equity Income Fund Average -4.64 8.88 10.08 5.81 NA NA for periods ended September 30, 2015 Net Expense Ratio The average annual total return for the Parnassus Core Equity Fund-Institutional Shares from commencement (April 28, 2006) was 9.42%.
Performance shown prior to the inception of the Institutional Shares reflects the performance of the Parnassus Core Equity Fund-Investor Shares and includes expenses that are not applicable to and are higher than those of the Institutional Shares. The performance of the Institutional Shares differs from that shown for the Investor Shares to the extent that the classes do not have the same expenses. Performance data quoted represent past performance and are no guarantee of future returns.
Current performance may be lower or higher than the performance data quoted, and current performance information to the most recent month-end is available on the Parnassus website (www.parnassus.com). Investment return and principal value will fluctuate, so an investor’s shares, when redeemed, may be worth more or less than their original principal cost. Returns shown in the table do not reflect the deduction of taxes a shareholder may pay on fund distributions or redemption of shares. The S&P 500 is an unmanaged index of common stocks, and it is not possible to invest directly in an index.
Index figures do not take any expenses, fees or taxes into account, but mutual fund returns do. Before investing, an investor should carefully consider the investment objectives, risks, charges and expenses of the Fund and should carefully read the prospectus or summary prospectus, which contains this and other information. The prospectus or summary prospectus can be obtained on the Parnassus website or by calling (800) 999-3505. The Fund acted as we expected during the quarter, as its 3.96% loss was considerably less severe than the S&P 500’s 6.43% drop. By capturing only 61% of the index’s loss, the Fund beat its benchmark by 247 basis points (a basis point is 1/100th of 1%). For more than a decade, this type of downside protection has been a hallmark of the Parnassus Core Equity Fund, and we’re hopeful that it will continue to perform like this in future stock market corrections. The Fund’s sector allocations had a positive impact on performance, relative to the index.
The largest positive came from having minimal exposure to the worst-performing sector in the benchmark: energy. Our significant overweight in consumer staples stocks was our second best allocation decision, as that group held up well during the market’s recent swoon. The only allocation decision that had a meaningfully negative impact was our underweight position in consumer discretionary stocks, which performed well during the quarter. While stock selection was a source of strength for us during the quarter, we still had three positions that reduced the NAV by 23¢ or more.
Our biggest loser was Pentair, a diversified industrial company with leading positions in pumps, filters, valves and thermal solutions. The stock subtracted 38¢ from each Fund share, as it dropped 25.8% from $68.75 to $51.04. The stock fell after the company’s management reduced its 2015 earnings outlook for the third time this year, with earnings now expected to decline 9% on an annual basis. The company cited notable weakness in commodity-driven markets and a slowdown in 9 .
PARNASSUS FUNDS Quarterly Report • Q3 2015 China. Despite this dour near-term outlook, we’re holding onto the shares. We think that the company is taking prudent cost-reduction measures to weather the current downturn. Furthermore, when demand for Pentair’s products eventually rebounds, we expect the company’s earnings and stock price to increase substantially. National Oilwell Varco (NOV), which sells equipment and technology to help companies drill wells safely in complex geological formations, trimmed 26¢ off the Fund’s NAV, as its stock dropped 22.0% from $48.28 to $37.65.
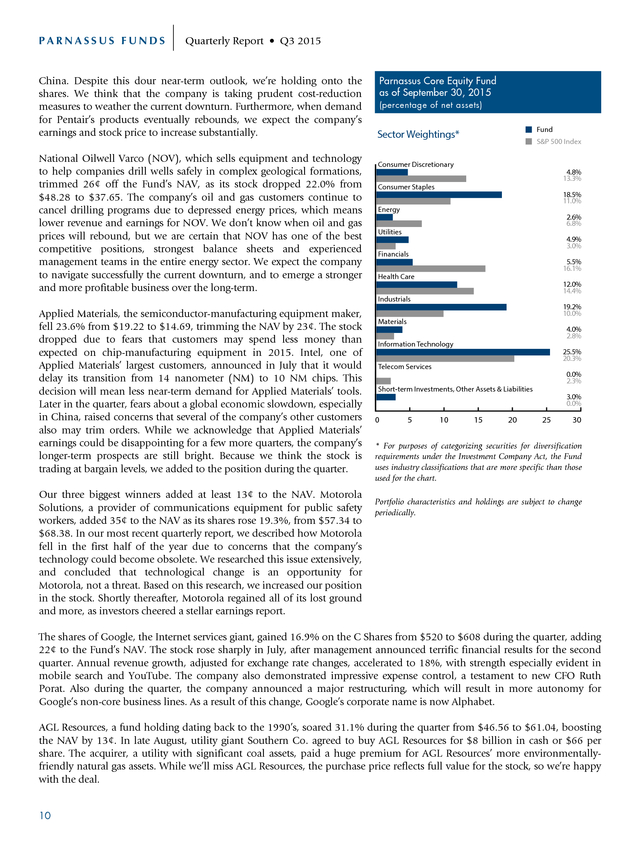
The company’s oil and gas customers continue to cancel drilling programs due to depressed energy prices, which means lower revenue and earnings for NOV. We don’t know when oil and gas prices will rebound, but we are certain that NOV has one of the best competitive positions, strongest balance sheets and experienced management teams in the entire energy sector. We expect the company to navigate successfully the current downturn, and to emerge a stronger and more profitable business over the long-term. Parnassus Core Equity Fund as of September 30, 2015 (percentage of net assets) Fund Sector Weightings* S&P 500 Index Consumer Discretionary 4.8% 13.3% Consumer Staples 18.5% 11.0% Energy 2.6% 6.8% Utilities 4.9% 3.0% Financials 5.5% 16.1% Health Care 12.0% 14.4% Industrials Applied Materials, the semiconductor-manufacturing equipment maker, fell 23.6% from $19.22 to $14.69, trimming the NAV by 23¢.
The stock dropped due to fears that customers may spend less money than expected on chip-manufacturing equipment in 2015. Intel, one of Applied Materials’ largest customers, announced in July that it would delay its transition from 14 nanometer (NM) to 10 NM chips. This decision will mean less near-term demand for Applied Materials’ tools. Later in the quarter, fears about a global economic slowdown, especially in China, raised concerns that several of the company’s other customers also may trim orders.
While we acknowledge that Applied Materials’ earnings could be disappointing for a few more quarters, the company’s longer-term prospects are still bright. Because we think the stock is trading at bargain levels, we added to the position during the quarter. Our three biggest winners added at least 13¢ to the NAV. Motorola Solutions, a provider of communications equipment for public safety workers, added 35¢ to the NAV as its shares rose 19.3%, from $57.34 to $68.38.
In our most recent quarterly report, we described how Motorola fell in the first half of the year due to concerns that the company’s technology could become obsolete. We researched this issue extensively, and concluded that technological change is an opportunity for Motorola, not a threat. Based on this research, we increased our position in the stock.
Shortly thereafter, Motorola regained all of its lost ground and more, as investors cheered a stellar earnings report. 19.2% 10.0% Materials 4.0% 2.8% Information Technology 25.5% 20.3% Telecom Services 0.0% 2.3% Short-term Investments, Other Assets & Liabilities 3.0% 0.0% 0 5 10 15 20 25 30 * For purposes of categorizing securities for diversification requirements under the Investment Company Act, the Fund uses industry classifications that are more specific than those used for the chart. Portfolio characteristics and holdings are subject to change periodically. The shares of Google, the Internet services giant, gained 16.9% on the C Shares from $520 to $608 during the quarter, adding 22¢ to the Fund’s NAV. The stock rose sharply in July, after management announced terrific financial results for the second quarter. Annual revenue growth, adjusted for exchange rate changes, accelerated to 18%, with strength especially evident in mobile search and YouTube.
The company also demonstrated impressive expense control, a testament to new CFO Ruth Porat. Also during the quarter, the company announced a major restructuring, which will result in more autonomy for Google’s non-core business lines. As a result of this change, Google’s corporate name is now Alphabet. AGL Resources, a fund holding dating back to the 1990’s, soared 31.1% during the quarter from $46.56 to $61.04, boosting the NAV by 13¢.
In late August, utility giant Southern Co. agreed to buy AGL Resources for $8 billion in cash or $66 per share. The acquirer, a utility with significant coal assets, paid a huge premium for AGL Resources’ more environmentallyfriendly natural gas assets.
While we’ll miss AGL Resources, the purchase price reflects full value for the stock, so we’re happy with the deal. 10 . Quarterly Report • Q3 2015 PARNASSUS FUNDS Outlook and Strategy This past quarter witnessed the worst stock market performance since the summer of 2011. The two main culprits seem to have been evidence of a slowdown in China and the Federal Reserve’s decision to forgo an increase in interest rates. Low rates are normally good for stocks, but in this case the Fed’s inaction was a bearish signal to the market, since it supported the idea that the global economy is slowing. September saw marked weakness in biotechnology and pharmaceutical stocks, as politicians and journalists expressed concerns about egregious price hikes for certain therapies. Thankfully, we reduced our exposure to drug-related stocks during the second quarter as part of a risk management exercise.
This move proved timely, and helped the Fund avoid a more severe loss. While the overall portfolio composition didn’t change much during the quarter, we do have two new holdings. The first is PayPal, which the Fund received as the result of a spin-out from its former parent company, eBay. We think the newly independent PayPal has terrific growth prospects, as the company works hard to become more relevant to merchants and consumers.
We also think that eBay will benefit from the spin-out, since management now can focus all of its attention on improving its online marketplace, and not be distracted by the payments business. The second new addition to the Fund is Intel, the well-known maker of semiconductors. We bought Intel in July after it had dropped 20% on a year-to-date basis. This weakness resulted in an attractive price-to-earnings (PE) multiple of 13x and a generous 3.3% dividend yield.
While Intel is best known for chips designed for personal computers, we’re more interested in its data center group (DCG) business, which now represents over 50% of earnings. The proliferation of data-hungry applications offered by Google, Facebook, Uber, Alibaba and others has placed unprecedented demands on data centers. Intel’s DCG chips enable data centers to satisfy these demands in a fast and energy-efficient manner. Over the long-term, we expect Intel’s DCG earnings growth to more than offset any softness related to its mature PC business. While we were buying Intel, we were selling one of its competitors, Qualcomm.
This latter stock was a long-term investment that didn’t live up to our expectations, despite the company’s enviable competitive position and strong secular tailwinds. We sold Qualcomm because we think the company’s best days are probably behind them. So far, the Intel-for-Qualcomm swap has been a good move, as Intel is up modestly from our average cost, and Qualcomm has gone down since we sold it. At quarter-end, the Fund had very little exposure compared to the S&P 500 to three highly cyclical sectors: financials, consumer discretionary and energy.
On a combined basis, the portfolio had less than 15% invested in these sectors, compared to 37% for the benchmark. Since these sectors tend to perform poorly in bear markets, these underweights contribute to an overall defensive posture for the Fund. Somewhat mitigating this defensiveness is the portfolio’s 19% exposure to the cyclical industrials sector, which only represents 10% of the index.
Overall, we would expect the Fund to hold up relatively well, if the weakness in the third quarter continues for the rest of 2015. And because our companies have great business prospects and reasonable valuations, we believe the fund is positioned to outperform its index if the market takes off again. Thank you for your confidence in us and your investment in the Parnassus Core Equity Fund. Todd C. Ahlsten Lead Portfolio Manager Benjamin E.
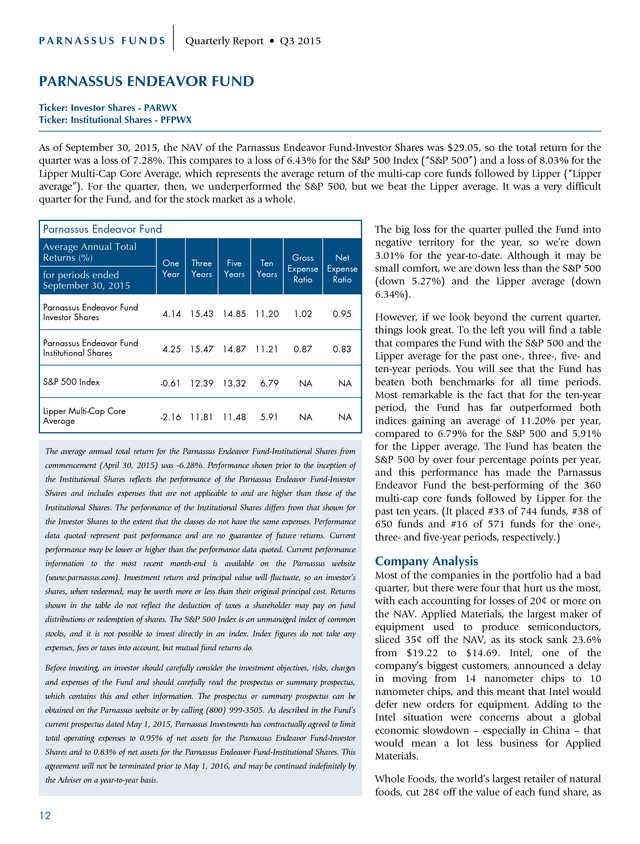
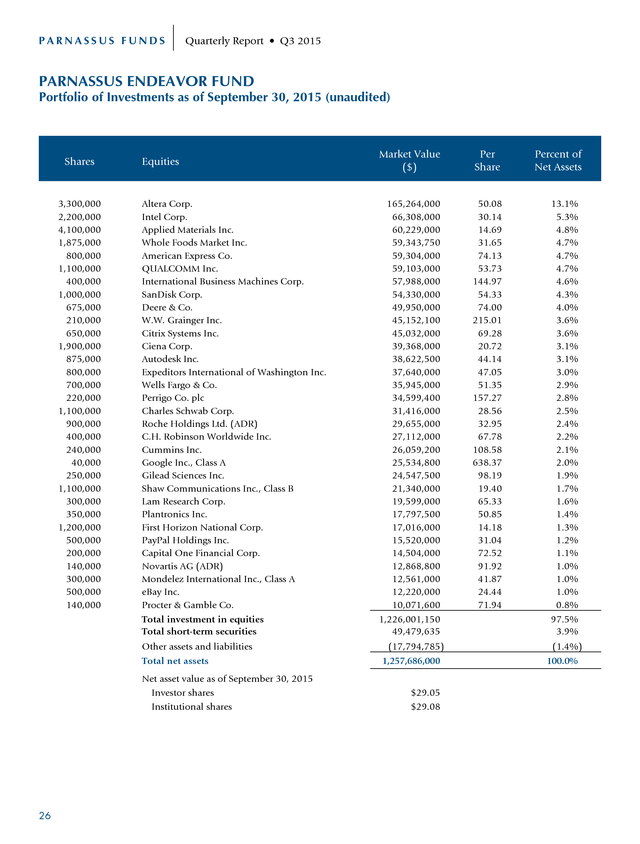
Allen Portfolio Manager 11 . PARNASSUS FUNDS Quarterly Report • Q3 2015 PARNASSUS ENDEAVOR FUND Ticker: Investor Shares - PARWX Ticker: Institutional Shares - PFPWX As of September 30, 2015, the NAV of the Parnassus Endeavor Fund-Investor Shares was $29.05, so the total return for the quarter was a loss of 7.28%. This compares to a loss of 6.43% for the S&P 500 Index (“S&P 500”) and a loss of 8.03% for the Lipper Multi-Cap Core Average, which represents the average return of the multi-cap core funds followed by Lipper (“Lipper average”). For the quarter, then, we underperformed the S&P 500, but we beat the Lipper average. It was a very difficult quarter for the Fund, and for the stock market as a whole. Parnassus Endeavor Fund Average Annual Total Returns (%) Gross Net Expense Expense Ratio Ratio One Year Three Years Five Years Ten Years Parnassus Endeavor Fund Investor Shares 4.14 15.43 14.85 11.20 1.02 0.95 Parnassus Endeavor Fund Institutional Shares 4.25 15.47 14.87 11.21 0.87 0.83 S&P 500 Index -0.61 12.39 13.32 6.79 NA NA Lipper Multi-Cap Core Average -2.16 11.81 11.48 5.91 NA NA for periods ended September 30, 2015 The average annual total return for the Parnassus Endeavor Fund-Institutional Shares from commencement (April 30, 2015) was -6.28%.
Performance shown prior to the inception of the Institutional Shares reflects the performance of the Parnassus Endeavor Fund-Investor Shares and includes expenses that are not applicable to and are higher than those of the Institutional Shares. The performance of the Institutional Shares differs from that shown for the Investor Shares to the extent that the classes do not have the same expenses. Performance data quoted represent past performance and are no guarantee of future returns.
Current The big loss for the quarter pulled the Fund into negative territory for the year, so we’re down 3.01% for the year-to-date. Although it may be small comfort, we are down less than the S&P 500 (down 5.27%) and the Lipper average (down 6.34%). However, if we look beyond the current quarter, things look great. To the left you will find a table that compares the Fund with the S&P 500 and the Lipper average for the past one-, three-, five- and ten-year periods.
You will see that the Fund has beaten both benchmarks for all time periods. Most remarkable is the fact that for the ten-year period, the Fund has far outperformed both indices gaining an average of 11.20% per year, compared to 6.79% for the S&P 500 and 5.91% for the Lipper average. The Fund has beaten the S&P 500 by over four percentage points per year, and this performance has made the Parnassus Endeavor Fund the best-performing of the 360 multi-cap core funds followed by Lipper for the past ten years. (It placed #33 of 744 funds, #38 of 650 funds and #16 of 571 funds for the one-, three- and five-year periods, respectively.) performance may be lower or higher than the performance data quoted.
Current performance information to the most recent month-end is available on the Parnassus website Company Analysis (www.parnassus.com). Investment return and principal value will fluctuate, so an investor’s Most of the companies in the portfolio had a bad quarter, but there were four that hurt us the most, with each accounting for losses of 20¢ or more on the NAV. Applied Materials, the largest maker of equipment used to produce semiconductors, sliced 35¢ off the NAV, as its stock sank 23.6% from $19.22 to $14.69.
Intel, one of the company’s biggest customers, announced a delay in moving from 14 nanometer chips to 10 nanometer chips, and this meant that Intel would defer new orders for equipment. Adding to the Intel situation were concerns about a global economic slowdown – especially in China – that would mean a lot less business for Applied Materials. shares, when redeemed, may be worth more or less than their original principal cost. Returns shown in the table do not reflect the deduction of taxes a shareholder may pay on fund distributions or redemption of shares.
The S&P 500 Index is an unmanaged index of common stocks, and it is not possible to invest directly in an index. Index figures do not take any expenses, fees or taxes into account, but mutual fund returns do. Before investing, an investor should carefully consider the investment objectives, risks, charges and expenses of the Fund and should carefully read the prospectus or summary prospectus, which contains this and other information. The prospectus or summary prospectus can be obtained on the Parnassus website or by calling (800) 999-3505.
As described in the Fund’s current prospectus dated May 1, 2015, Parnassus Investments has contractually agreed to limit total operating expenses to 0.95% of net assets for the Parnassus Endeavor Fund-Investor Shares and to 0.83% of net assets for the Parnassus Endeavor Fund-Institutional Shares. This agreement will not be terminated prior to May 1, 2016, and may be continued indefinitely by the Adviser on a year-to-year basis. 12 Whole Foods, the world’s largest retailer of natural foods, cut 28¢ off the value of each fund share, as . Quarterly Report • Q3 2015 its stock fell 19.8% from $39.44 to $31.65. The company’s growth has slowed, and there was also some bad publicity, when New York City officials found that Whole Foods had overstated the weight of some freshly-packaged food, resulting in an overcharge to customers. (The company immediately fixed the problem.) The stock is trading at its lowest valuation since 2009, so it’s on the bargain table. We expect the stock will move higher, as the company continues to open new stores. Tractor-maker Deere & Co.
sliced 24¢ off the NAV, as its stock declined 23.8% from $97.05 to $74. The stock dropped after management announced weaker than expected full-year guidance in late August, citing weak farm-equipment demand and excess inventory. Despite the recent weakness, we continue to believe that Deere is a resilient, high-quality business, and the stock will recover in the longer term. Qualcomm, a major designer and producer of smartphone chips, knocked 20¢ off the value of each fund share, as its stock dropped 14.2% from $62.63 to $53.73.
The stock dropped after investors became pessimistic about the company’s position compared to lowerpriced Chinese competitors. There was also concern about the percentage of the business concentrated in Apple and Samsung. Historically, Qualcomm has been able to recover from competitive pressures by innovating and introducing better chipsets. We think the company should be able to do this again.
The early feedback on its latest product, the Snapdragon 820, has been positive, and Samsung has recently improved its outlook for September production based on that product. Qualcomm has also announced a major restructuring and is evaluating splitting its chip business from its licensing unit. There was only one stock that contributed more than 20¢ to the NAV during the quarter. Google, the Internet services giant, added 22¢ to each fund share, as its stock rose 18.2% on the A Shares from $540 to $638.
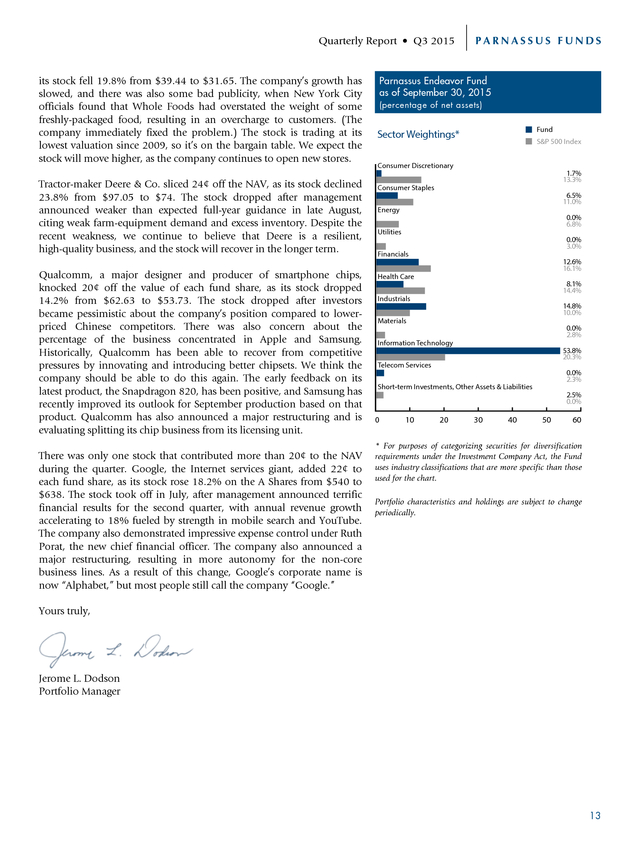
The stock took off in July, after management announced terrific financial results for the second quarter, with annual revenue growth accelerating to 18% fueled by strength in mobile search and YouTube. The company also demonstrated impressive expense control under Ruth Porat, the new chief financial officer. The company also announced a major restructuring, resulting in more autonomy for the non-core business lines. As a result of this change, Google’s corporate name is now “Alphabet,” but most people still call the company “Google.” PARNASSUS FUNDS Parnassus Endeavor Fund as of September 30, 2015 (percentage of net assets) Fund Sector Weightings* S&P 500 Index Consumer Discretionary 1.7% 13.3% Consumer Staples 6.5% 11.0% Energy 0.0% 6.8% Utilities 0.0% 3.0% Financials 12.6% 16.1% Health Care 8.1% 14.4% Industrials 14.8% 10.0% Materials 0.0% 2.8% Information Technology 53.8% 20.3% Telecom Services 0.0% 2.3% Short-term Investments, Other Assets & Liabilities 2.5% 0.0% 0 10 20 30 40 50 60 * For purposes of categorizing securities for diversification requirements under the Investment Company Act, the Fund uses industry classifications that are more specific than those used for the chart. Portfolio characteristics and holdings are subject to change periodically. Yours truly, Jerome L.
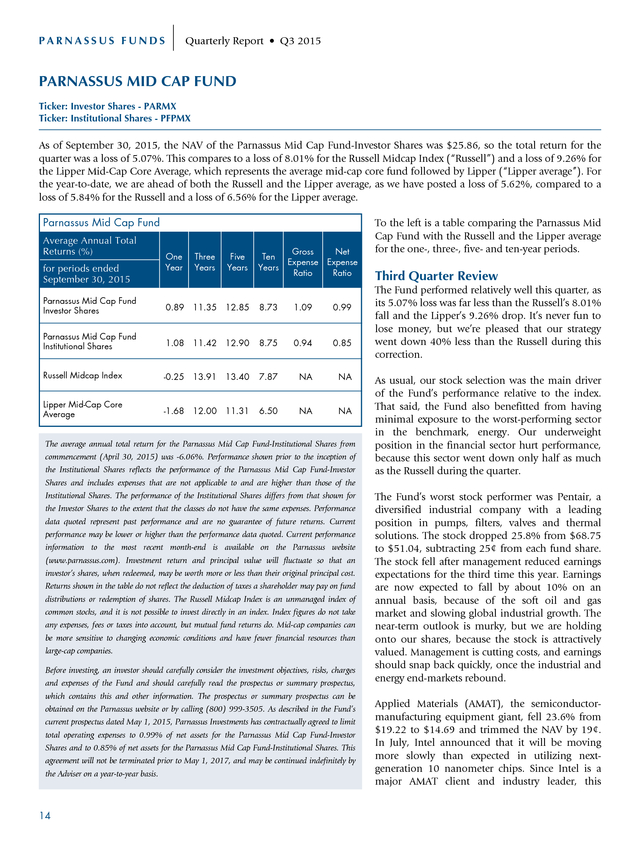
Dodson Portfolio Manager 13 . PARNASSUS FUNDS Quarterly Report • Q3 2015 PARNASSUS MID CAP FUND Ticker: Investor Shares - PARMX Ticker: Institutional Shares - PFPMX As of September 30, 2015, the NAV of the Parnassus Mid Cap Fund-Investor Shares was $25.86, so the total return for the quarter was a loss of 5.07%. This compares to a loss of 8.01% for the Russell Midcap Index (“Russell”) and a loss of 9.26% for the Lipper Mid-Cap Core Average, which represents the average mid-cap core fund followed by Lipper (“Lipper average”). For the year-to-date, we are ahead of both the Russell and the Lipper average, as we have posted a loss of 5.62%, compared to a loss of 5.84% for the Russell and a loss of 6.56% for the Lipper average. Parnassus Mid Cap Fund Average Annual Total Returns (%) for periods ended September 30, 2015 One Year Three Years Five Years Ten Years Gross Net Expense Expense Ratio Ratio Parnassus Mid Cap Fund Investor Shares 0.89 11.35 12.85 8.73 1.09 0.99 Parnassus Mid Cap Fund Institutional Shares 1.08 11.42 12.90 8.75 0.94 0.85 Russell Midcap Index -0.25 13.91 13.40 7.87 NA NA Lipper Mid-Cap Core Average -1.68 12.00 11.31 6.50 NA NA The average annual total return for the Parnassus Mid Cap Fund-Institutional Shares from commencement (April 30, 2015) was -6.06%. Performance shown prior to the inception of the Institutional Shares reflects the performance of the Parnassus Mid Cap Fund-Investor Shares and includes expenses that are not applicable to and are higher than those of the Institutional Shares.
The performance of the Institutional Shares differs from that shown for the Investor Shares to the extent that the classes do not have the same expenses. Performance data quoted represent past performance and are no guarantee of future returns. Current performance may be lower or higher than the performance data quoted.
Current performance information to the most recent month-end is available on the Parnassus website (www.parnassus.com). Investment return and principal value will fluctuate so that an investor’s shares, when redeemed, may be worth more or less than their original principal cost. Returns shown in the table do not reflect the deduction of taxes a shareholder may pay on fund distributions or redemption of shares. The Russell Midcap Index is an unmanaged index of common stocks, and it is not possible to invest directly in an index.
Index figures do not take any expenses, fees or taxes into account, but mutual fund returns do. Mid-cap companies can be more sensitive to changing economic conditions and have fewer financial resources than large-cap companies. Before investing, an investor should carefully consider the investment objectives, risks, charges and expenses of the Fund and should carefully read the prospectus or summary prospectus, which contains this and other information. The prospectus or summary prospectus can be obtained on the Parnassus website or by calling (800) 999-3505.
As described in the Fund’s current prospectus dated May 1, 2015, Parnassus Investments has contractually agreed to limit total operating expenses to 0.99% of net assets for the Parnassus Mid Cap Fund-Investor Shares and to 0.85% of net assets for the Parnassus Mid Cap Fund-Institutional Shares. This agreement will not be terminated prior to May 1, 2017, and may be continued indefinitely by the Adviser on a year-to-year basis. 14 To the left is a table comparing the Parnassus Mid Cap Fund with the Russell and the Lipper average for the one-, three-, five- and ten-year periods. Third Quarter Review The Fund performed relatively well this quarter, as its 5.07% loss was far less than the Russell’s 8.01% fall and the Lipper’s 9.26% drop. It’s never fun to lose money, but we’re pleased that our strategy went down 40% less than the Russell during this correction. As usual, our stock selection was the main driver of the Fund’s performance relative to the index. That said, the Fund also benefitted from having minimal exposure to the worst-performing sector in the benchmark, energy.
Our underweight position in the financial sector hurt performance, because this sector went down only half as much as the Russell during the quarter. The Fund’s worst stock performer was Pentair, a diversified industrial company with a leading position in pumps, filters, valves and thermal solutions. The stock dropped 25.8% from $68.75 to $51.04, subtracting 25¢ from each fund share. The stock fell after management reduced earnings expectations for the third time this year. Earnings are now expected to fall by about 10% on an annual basis, because of the soft oil and gas market and slowing global industrial growth.
The near-term outlook is murky, but we are holding onto our shares, because the stock is attractively valued. Management is cutting costs, and earnings should snap back quickly, once the industrial and energy end-markets rebound. Applied Materials (AMAT), the semiconductormanufacturing equipment giant, fell 23.6% from $19.22 to $14.69 and trimmed the NAV by 19¢. In July, Intel announced that it will be moving more slowly than expected in utilizing nextgeneration 10 nanometer chips. Since Intel is a major AMAT client and industry leader, this .
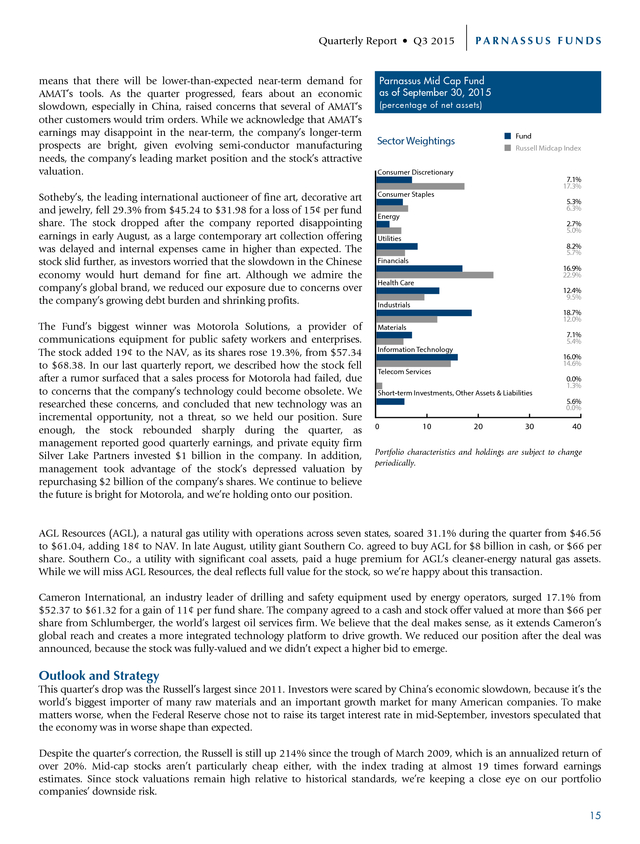
Quarterly Report • Q3 2015 means that there will be lower-than-expected near-term demand for AMAT’s tools. As the quarter progressed, fears about an economic slowdown, especially in China, raised concerns that several of AMAT’s other customers would trim orders. While we acknowledge that AMAT’s earnings may disappoint in the near-term, the company’s longer-term prospects are bright, given evolving semi-conductor manufacturing needs, the company’s leading market position and the stock’s attractive valuation. PARNASSUS FUNDS Parnassus Mid Cap Fund as of September 30, 2015 (percentage of net assets) Fund Sector Weightings Russell Midcap Index Consumer Discretionary 7.1% 17.3% Sotheby’s, the leading international auctioneer of fine art, decorative art and jewelry, fell 29.3% from $45.24 to $31.98 for a loss of 15¢ per fund share. The stock dropped after the company reported disappointing earnings in early August, as a large contemporary art collection offering was delayed and internal expenses came in higher than expected.
The stock slid further, as investors worried that the slowdown in the Chinese economy would hurt demand for fine art. Although we admire the company’s global brand, we reduced our exposure due to concerns over the company’s growing debt burden and shrinking profits. Consumer Staples The Fund’s biggest winner was Motorola Solutions, a provider of communications equipment for public safety workers and enterprises. The stock added 19¢ to the NAV, as its shares rose 19.3%, from $57.34 to $68.38. In our last quarterly report, we described how the stock fell after a rumor surfaced that a sales process for Motorola had failed, due to concerns that the company’s technology could become obsolete.
We researched these concerns, and concluded that new technology was an incremental opportunity, not a threat, so we held our position. Sure enough, the stock rebounded sharply during the quarter, as management reported good quarterly earnings, and private equity firm Silver Lake Partners invested $1 billion in the company. In addition, management took advantage of the stock’s depressed valuation by repurchasing $2 billion of the company’s shares.
We continue to believe the future is bright for Motorola, and we’re holding onto our position. Materials 5.3% 6.3% Energy 2.7% 5.0% Utilities 8.2% 5.7% Financials 16.9% 22.9% Health Care 12.4% 9.5% Industrials 18.7% 12.0% 7.1% 5.4% Information Technology 16.0% 14.6% Telecom Services 0.0% 1.3% Short-term Investments, Other Assets & Liabilities 5.6% 0.0% 0 10 20 30 40 Portfolio characteristics and holdings are subject to change periodically. AGL Resources (AGL), a natural gas utility with operations across seven states, soared 31.1% during the quarter from $46.56 to $61.04, adding 18¢ to NAV. In late August, utility giant Southern Co. agreed to buy AGL for $8 billion in cash, or $66 per share.
Southern Co., a utility with significant coal assets, paid a huge premium for AGL’s cleaner-energy natural gas assets. While we will miss AGL Resources, the deal reflects full value for the stock, so we’re happy about this transaction. Cameron International, an industry leader of drilling and safety equipment used by energy operators, surged 17.1% from $52.37 to $61.32 for a gain of 11¢ per fund share. The company agreed to a cash and stock offer valued at more than $66 per share from Schlumberger, the world’s largest oil services firm. We believe that the deal makes sense, as it extends Cameron’s global reach and creates a more integrated technology platform to drive growth.
We reduced our position after the deal was announced, because the stock was fully-valued and we didn’t expect a higher bid to emerge. Outlook and Strategy This quarter’s drop was the Russell’s largest since 2011. Investors were scared by China’s economic slowdown, because it’s the world’s biggest importer of many raw materials and an important growth market for many American companies. To make matters worse, when the Federal Reserve chose not to raise its target interest rate in mid-September, investors speculated that the economy was in worse shape than expected. Despite the quarter’s correction, the Russell is still up 214% since the trough of March 2009, which is an annualized return of over 20%.
Mid-cap stocks aren’t particularly cheap either, with the index trading at almost 19 times forward earnings estimates. Since stock valuations remain high relative to historical standards, we’re keeping a close eye on our portfolio companies’ downside risk. 15 . PARNASSUS FUNDS Quarterly Report • Q3 2015 During the market turmoil, we added capital to a few existing portfolio companies and bought a new stock, Axalta Coatings Systems. The company is one of the world’s leading manufacturers of industrial coatings used in automobiles, trucks and industrial applications. The stock recently fell to an attractive price, because investors were concerned about currency headwinds and a potential slowdown in global auto production. They might be right in the near-term, but the longer-term earnings trajectory is intact, driven by global growth, share gains and cost cutting.
Downside risk is also limited, because Axalta has a sturdy competitive moat, which comes from customers’ high switching costs, strong buying power for raw materials and a premium brand. We also like the company’s light capital requirements and robust free cash flow generation. We’re limiting the Fund’s exposure in sectors that would be most negatively impacted if the economy slows. Relative to the index, we have fewer consumer and financial stocks.
Our largest concentration of stocks, as of the quarter-end, was in the industrial sector. As we’ve highlighted in some of our previous reports, a number of our holdings in this sector are less cyclical business service companies with significant recurring revenues and cash flows, which will enable them to weather weak economic periods. We continue to own a collection of businesses that we expect to outperform the market over the long-run by participating strongly in bull markets, providing excellent protection in bear markets and avoiding permanent capital losses in all market conditions. Thank you for your investment in the Parnassus Mid Cap Fund. Yours truly, Matthew D. Gershuny Lead Portfolio Manager 16 Lori A.
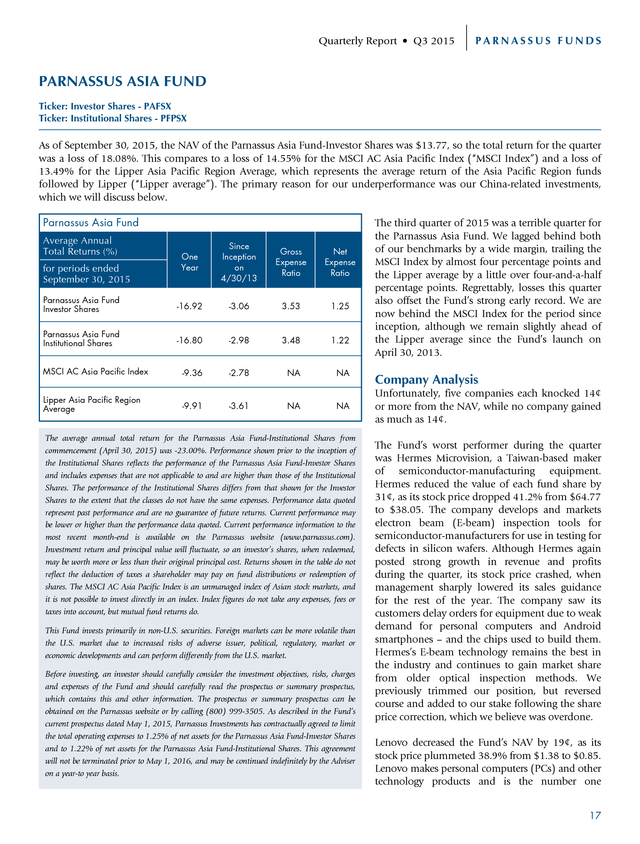
Keith Portfolio Manager . Quarterly Report • Q3 2015 PARNASSUS FUNDS PARNASSUS ASIA FUND Ticker: Investor Shares - PAFSX Ticker: Institutional Shares - PFPSX As of September 30, 2015, the NAV of the Parnassus Asia Fund-Investor Shares was $13.77, so the total return for the quarter was a loss of 18.08%. This compares to a loss of 14.55% for the MSCI AC Asia Pacific Index (“MSCI Index”) and a loss of 13.49% for the Lipper Asia Pacific Region Average, which represents the average return of the Asia Pacific Region funds followed by Lipper (“Lipper average”). The primary reason for our underperformance was our China-related investments, which we will discuss below. Parnassus Asia Fund Average Annual Total Returns (%) One Year Since Inception on 4/30/13 Gross Expense Ratio Net Expense Ratio Parnassus Asia Fund Investor Shares -16.92 -3.06 3.53 1.25 Parnassus Asia Fund Institutional Shares -16.80 -2.98 3.48 1.22 MSCI AC Asia Pacific Index -9.36 -2.78 NA NA Lipper Asia Pacific Region Average -9.91 -3.61 NA NA for periods ended September 30, 2015 The average annual total return for the Parnassus Asia Fund-Institutional Shares from commencement (April 30, 2015) was -23.00%. Performance shown prior to the inception of the Institutional Shares reflects the performance of the Parnassus Asia Fund-Investor Shares and includes expenses that are not applicable to and are higher than those of the Institutional Shares.
The performance of the Institutional Shares differs from that shown for the Investor Shares to the extent that the classes do not have the same expenses. Performance data quoted represent past performance and are no guarantee of future returns. Current performance may be lower or higher than the performance data quoted.
Current performance information to the most recent month-end is available on the Parnassus website (www.parnassus.com). Investment return and principal value will fluctuate, so an investor’s shares, when redeemed, may be worth more or less than their original principal cost. Returns shown in the table do not reflect the deduction of taxes a shareholder may pay on fund distributions or redemption of shares. The MSCI AC Asia Pacific Index is an unmanaged index of Asian stock markets, and it is not possible to invest directly in an index.
Index figures do not take any expenses, fees or taxes into account, but mutual fund returns do. This Fund invests primarily in non-U.S. securities. Foreign markets can be more volatile than the U.S.
market due to increased risks of adverse issuer, political, regulatory, market or economic developments and can perform differently from the U.S. market. Before investing, an investor should carefully consider the investment objectives, risks, charges and expenses of the Fund and should carefully read the prospectus or summary prospectus, which contains this and other information. The prospectus or summary prospectus can be obtained on the Parnassus website or by calling (800) 999-3505.
As described in the Fund’s current prospectus dated May 1, 2015, Parnassus Investments has contractually agreed to limit the total operating expenses to 1.25% of net assets for the Parnassus Asia Fund-Investor Shares and to 1.22% of net assets for the Parnassus Asia Fund-Institutional Shares. This agreement will not be terminated prior to May 1, 2016, and may be continued indefinitely by the Adviser on a year-to year basis. The third quarter of 2015 was a terrible quarter for the Parnassus Asia Fund. We lagged behind both of our benchmarks by a wide margin, trailing the MSCI Index by almost four percentage points and the Lipper average by a little over four-and-a-half percentage points.
Regrettably, losses this quarter also offset the Fund’s strong early record. We are now behind the MSCI Index for the period since inception, although we remain slightly ahead of the Lipper average since the Fund’s launch on April 30, 2013. Company Analysis Unfortunately, five companies each knocked 14¢ or more from the NAV, while no company gained as much as 14¢. The Fund’s worst performer during the quarter was Hermes Microvision, a Taiwan-based maker of semiconductor-manufacturing equipment. Hermes reduced the value of each fund share by 31¢, as its stock price dropped 41.2% from $64.77 to $38.05. The company develops and markets electron beam (E-beam) inspection tools for semiconductor-manufacturers for use in testing for defects in silicon wafers.
Although Hermes again posted strong growth in revenue and profits during the quarter, its stock price crashed, when management sharply lowered its sales guidance for the rest of the year. The company saw its customers delay orders for equipment due to weak demand for personal computers and Android smartphones – and the chips used to build them. Hermes’s E-beam technology remains the best in the industry and continues to gain market share from older optical inspection methods. We previously trimmed our position, but reversed course and added to our stake following the share price correction, which we believe was overdone. Lenovo decreased the Fund’s NAV by 19¢, as its stock price plummeted 38.9% from $1.38 to $0.85. Lenovo makes personal computers (PCs) and other technology products and is the number one 17 .
PARNASSUS FUNDS Quarterly Report • Q3 2015 brand in China and the largest PC manufacturer in the world. Global PC shipments declined 11% as resellers destocked, and end customers postponed purchases before the launch of Microsoft Windows 10. The company also incurred losses in its smartphone division due to intensified competition in China and macroeconomic weakness in Latin America. To address the company’s sagging profitability, management announced a restructuring program that would streamline its mobile phone portfolio and make the company more cost-competitive.
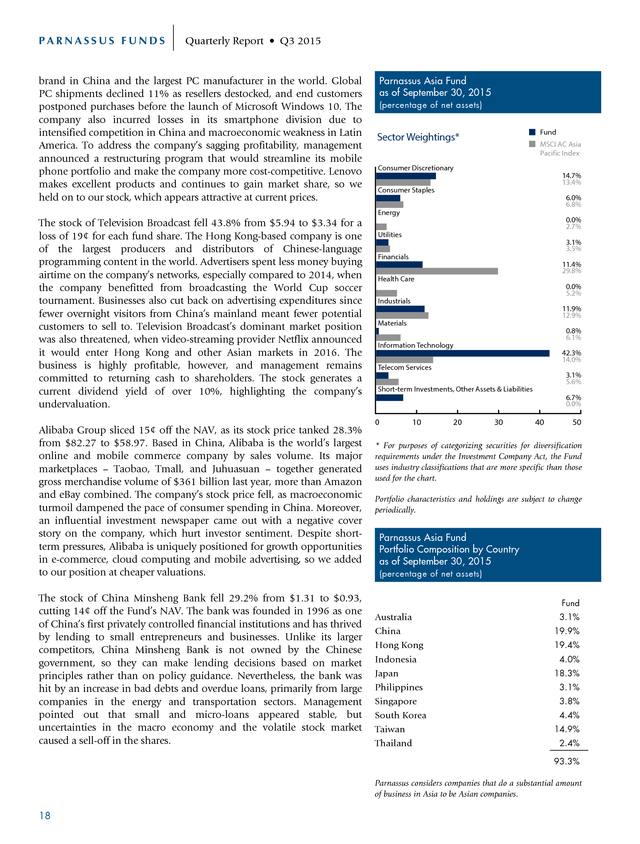
Lenovo makes excellent products and continues to gain market share, so we held on to our stock, which appears attractive at current prices. Parnassus Asia Fund as of September 30, 2015 (percentage of net assets) Fund Sector Weightings* MSCI AC Asia Pacific Index Consumer Discretionary 14.7% 13.4% Consumer Staples 6.0% 6.8% Energy The stock of Television Broadcast fell 43.8% from $5.94 to $3.34 for a loss of 19¢ for each fund share. The Hong Kong-based company is one of the largest producers and distributors of Chinese-language programming content in the world. Advertisers spent less money buying airtime on the company’s networks, especially compared to 2014, when the company benefitted from broadcasting the World Cup soccer tournament.
Businesses also cut back on advertising expenditures since fewer overnight visitors from China’s mainland meant fewer potential customers to sell to. Television Broadcast’s dominant market position was also threatened, when video-streaming provider Netflix announced it would enter Hong Kong and other Asian markets in 2016. The business is highly profitable, however, and management remains committed to returning cash to shareholders.
The stock generates a current dividend yield of over 10%, highlighting the company’s undervaluation. Alibaba Group sliced 15¢ off the NAV, as its stock price tanked 28.3% from $82.27 to $58.97. Based in China, Alibaba is the world’s largest online and mobile commerce company by sales volume. Its major marketplaces – Taobao, Tmall, and Juhuasuan – together generated gross merchandise volume of $361 billion last year, more than Amazon and eBay combined.
The company’s stock price fell, as macroeconomic turmoil dampened the pace of consumer spending in China. Moreover, an influential investment newspaper came out with a negative cover story on the company, which hurt investor sentiment. Despite shortterm pressures, Alibaba is uniquely positioned for growth opportunities in e-commerce, cloud computing and mobile advertising, so we added to our position at cheaper valuations. The stock of China Minsheng Bank fell 29.2% from $1.31 to $0.93, cutting 14¢ off the Fund’s NAV.
The bank was founded in 1996 as one of China’s first privately controlled financial institutions and has thrived by lending to small entrepreneurs and businesses. Unlike its larger competitors, China Minsheng Bank is not owned by the Chinese government, so they can make lending decisions based on market principles rather than on policy guidance. Nevertheless, the bank was hit by an increase in bad debts and overdue loans, primarily from large companies in the energy and transportation sectors.
Management pointed out that small and micro-loans appeared stable, but uncertainties in the macro economy and the volatile stock market caused a sell-off in the shares. 0.0% 2.7% Utilities 3.1% 3.5% Financials 11.4% 29.8% Health Care 0.0% 5.2% Industrials 11.9% 12.9% Materials 0.8% 6.1% Information Technology 42.3% 14.0% Telecom Services 3.1% 5.6% Short-term Investments, Other Assets & Liabilities 6.7% 0.0% 0 10 20 30 40 50 * For purposes of categorizing securities for diversification requirements under the Investment Company Act, the Fund uses industry classifications that are more specific than those used for the chart. Portfolio characteristics and holdings are subject to change periodically. Parnassus Asia Fund Portfolio Composition by Country as of September 30, 2015 (percentage of net assets) Fund Australia China Hong Kong Indonesia Japan Philippines Singapore South Korea Taiwan Thailand 3.1% 19.9% 19.4% 4.0% 18.3% 3.1% 3.8% 4.4% 14.9% 2.4% 93.3% Parnassus considers companies that do a substantial amount of business in Asia to be Asian companies. 18 . Quarterly Report • Q3 2015 PARNASSUS FUNDS Outlook and Strategy The economic crisis in China was the main force driving the Fund’s underperformance this quarter. While China’s growth has been steadily declining for years, new data showing contraction in everything from factory production to consumer activity triggered fears that the economy was headed for a hard landing. The market’s reaction was swift and brutal. Mainland Chinese stock markets, which rose spectacularly through the first half of the year, collapsed over 40% from the peak on the Shanghai Stock Exchange Composite index, and sank 50% from the peak on the technology-heavy Shenzhen index. China’s central government tried to rescue the markets from meltdown but bungled the response.
It barred major investors from selling shares, and suspended trading in hundreds of companies representing nearly half of the listed stocks on both exchanges. In August, the People’s Bank of China devalued the nation’s currency without explanation, and then was forced to spend a record $100 billion in foreign reserves in a single month to halt further yuan depreciation. The intervention backfired, since they fueled suspicions that China’s underlying economy was faring worse than originally believed. Ultimately, China’s woes pushed the markets and currencies of many other Asian countries long reliant on Chinese demand into a tailspin.
Of the 13 Asian markets we track, every single one ended the quarter in negative territory, with 11 recording losses in the double-digits. In our previous shareholder letter, we flagged the risk associated with China’s stock market bubble, but the precautions we took didn’t go far enough. We had no investments in Chinese stocks listed on the local Shanghai and Shenzhen exchanges, the stock markets that were bid up to unsustainable levels. Instead, we participated in China’s growth through companies listed in Hong Kong or the U.S., which have higher standards of transparency and corporate governance.
We also targeted companies that operated in China’s service economy rather than the manufacturing one, since spending by the Chinese consumer is at a low level and should expand over the decades ahead. Unfortunately, investors dump stocks indiscriminately in times of panic, and our China-related investments were hard hit in the downward spiral. The market’s volatility this quarter has prompted a lot of soul-searching in terms of how we invest abroad. We know that emerging markets can offer superior returns for the patient investor, but the path to get there is often very bumpy.
We remain committed to investing in high-quality companies that are temporarily undervalued, but we need to be even more disciplined in terms of the price at which we buy or sell our stocks, to reflect the risks inherent in international investing. We are sorely disappointed in the performance of the Fund this quarter and will work hard to do better going forward. One silver lining, however, is that there are more bargains in the portfolio and more in the marketplace today. Many stocks across the region are trading at levels not seen since the depths of the 2008 global financial crisis.
While no one can predict whether the market has truly bottomed, for long-term shareholders, it could be an exciting time to invest. Yours truly, Jerome L. Dodson Lead Portfolio Manager Billy J. Hwan Portfolio Manager 19 .
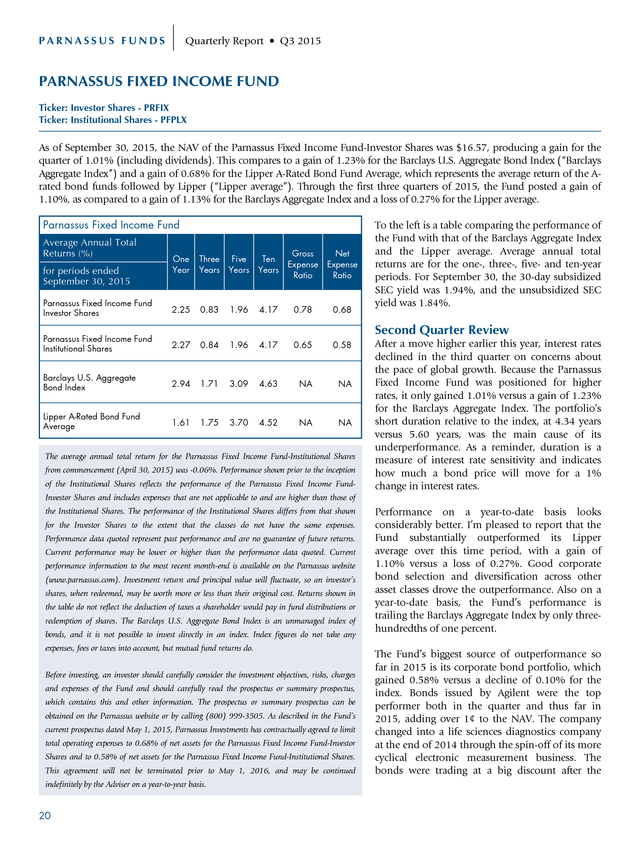
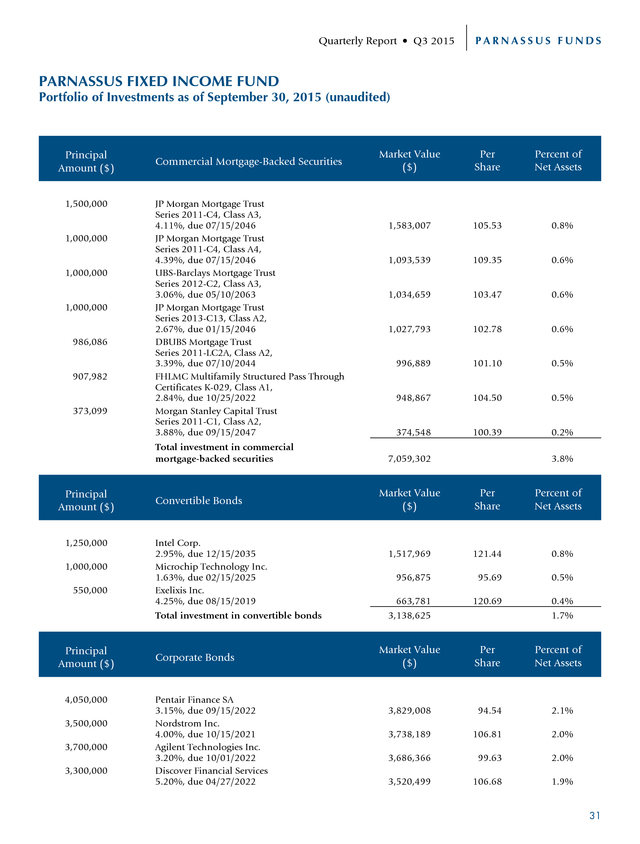
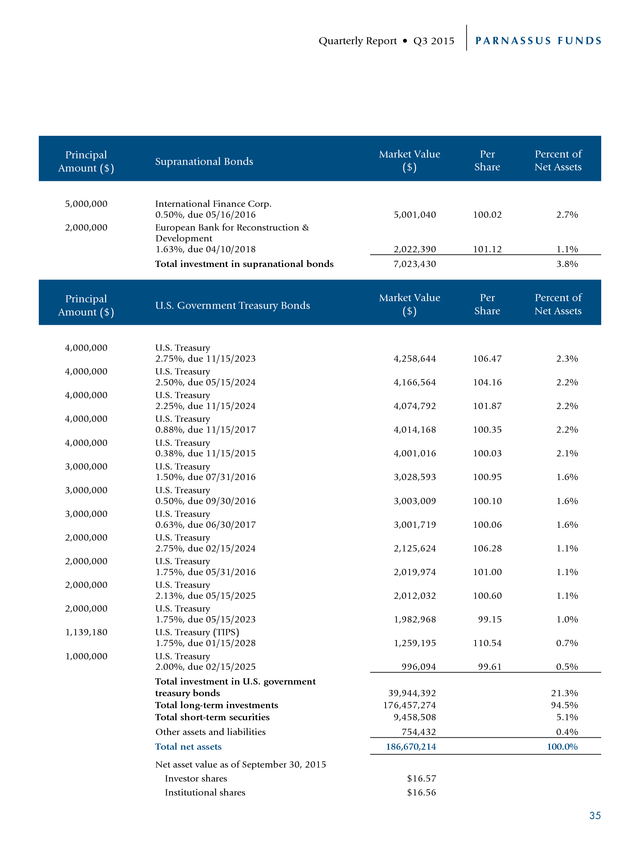
PARNASSUS FUNDS Quarterly Report • Q3 2015 PARNASSUS FIXED INCOME FUND Ticker: Investor Shares - PRFIX Ticker: Institutional Shares - PFPLX As of September 30, 2015, the NAV of the Parnassus Fixed Income Fund-Investor Shares was $16.57, producing a gain for the quarter of 1.01% (including dividends). This compares to a gain of 1.23% for the Barclays U.S. Aggregate Bond Index (“Barclays Aggregate Index”) and a gain of 0.68% for the Lipper A-Rated Bond Fund Average, which represents the average return of the Arated bond funds followed by Lipper (“Lipper average”). Through the first three quarters of 2015, the Fund posted a gain of 1.10%, as compared to a gain of 1.13% for the Barclays Aggregate Index and a loss of 0.27% for the Lipper average. Parnassus Fixed Income Fund Average Annual Total Returns (%) Gross Net Expense Expense Ratio Ratio One Year Three Years Five Years Ten Years Parnassus Fixed Income Fund Investor Shares 2.25 0.83 1.96 4.17 0.78 0.68 Parnassus Fixed Income Fund Institutional Shares 2.27 0.84 1.96 4.17 0.65 0.58 Barclays U.S.
Aggregate Bond Index 2.94 1.71 3.09 4.63 NA NA Lipper A-Rated Bond Fund Average 1.61 1.75 3.70 4.52 NA NA for periods ended September 30, 2015 To the left is a table comparing the performance of the Fund with that of the Barclays Aggregate Index and the Lipper average. Average annual total returns are for the one-, three-, five- and ten-year periods. For September 30, the 30-day subsidized SEC yield was 1.94%, and the unsubsidized SEC yield was 1.84%. Second Quarter Review The average annual total return for the Parnassus Fixed Income Fund-Institutional Shares from commencement (April 30, 2015) was -0.06%.
Performance shown prior to the inception of the Institutional Shares reflects the performance of the Parnassus Fixed Income Fund- After a move higher earlier this year, interest rates declined in the third quarter on concerns about the pace of global growth. Because the Parnassus Fixed Income Fund was positioned for higher rates, it only gained 1.01% versus a gain of 1.23% for the Barclays Aggregate Index. The portfolio’s short duration relative to the index, at 4.34 years versus 5.60 years, was the main cause of its underperformance.
As a reminder, duration is a measure of interest rate sensitivity and indicates how much a bond price will move for a 1% change in interest rates. Investor Shares and includes expenses that are not applicable to and are higher than those of the Institutional Shares. The performance of the Institutional Shares differs from that shown for the Investor Shares to the extent that the classes do not have the same expenses. Performance data quoted represent past performance and are no guarantee of future returns. Current performance may be lower or higher than the performance data quoted. Current performance information to the most recent month-end is available on the Parnassus website (www.parnassus.com).
Investment return and principal value will fluctuate, so an investor’s shares, when redeemed, may be worth more or less than their original cost. Returns shown in the table do not reflect the deduction of taxes a shareholder would pay in fund distributions or redemption of shares. The Barclays U.S.
Aggregate Bond Index is an unmanaged index of bonds, and it is not possible to invest directly in an index. Index figures do not take any expenses, fees or taxes into account, but mutual fund returns do. Before investing, an investor should carefully consider the investment objectives, risks, charges and expenses of the Fund and should carefully read the prospectus or summary prospectus, which contains this and other information. The prospectus or summary prospectus can be obtained on the Parnassus website or by calling (800) 999-3505.
As described in the Fund’s current prospectus dated May 1, 2015, Parnassus Investments has contractually agreed to limit total operating expenses to 0.68% of net assets for the Parnassus Fixed Income Fund-Investor Shares and to 0.58% of net assets for the Parnassus Fixed Income Fund-Institutional Shares. This agreement will not be terminated prior to May 1, 2016, and may be continued indefinitely by the Adviser on a year-to-year basis. 20 Performance on a year-to-date basis looks considerably better. I’m pleased to report that the Fund substantially outperformed its Lipper average over this time period, with a gain of 1.10% versus a loss of 0.27%. Good corporate bond selection and diversification across other asset classes drove the outperformance.
Also on a year-to-date basis, the Fund’s performance is trailing the Barclays Aggregate Index by only threehundredths of one percent. The Fund’s biggest source of outperformance so far in 2015 is its corporate bond portfolio, which gained 0.58% versus a decline of 0.10% for the index. Bonds issued by Agilent were the top performer both in the quarter and thus far in 2015, adding over 1¢ to the NAV. The company changed into a life sciences diagnostics company at the end of 2014 through the spin-off of its more cyclical electronic measurement business.
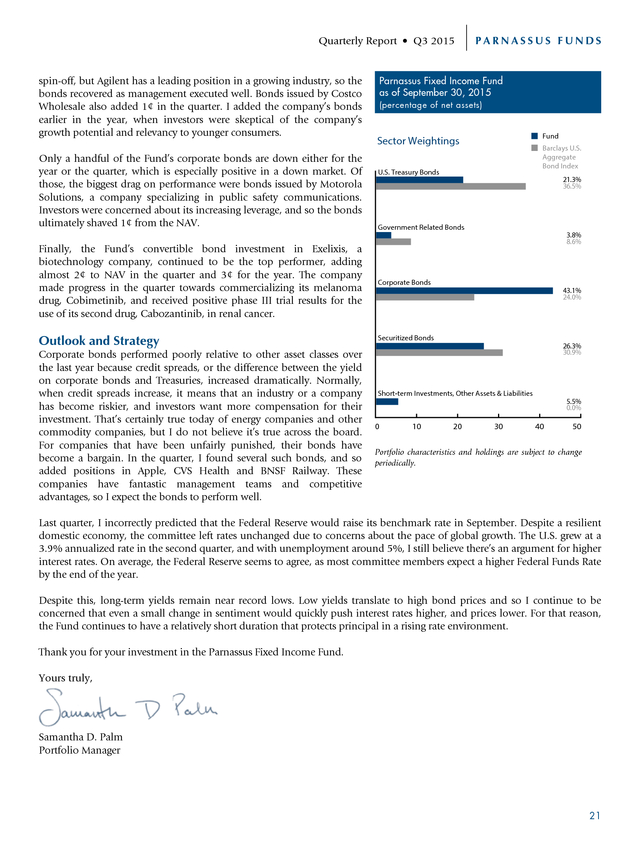
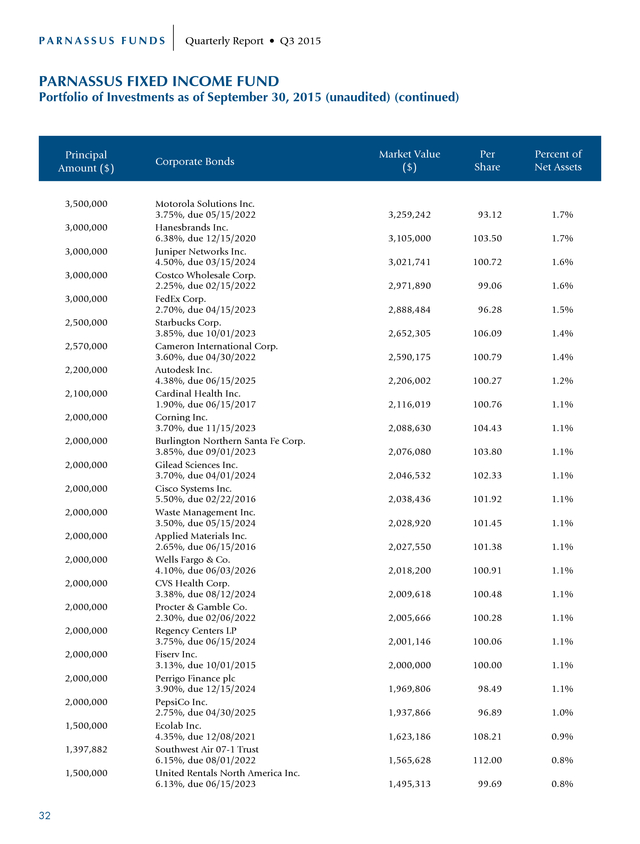
The bonds were trading at a big discount after the . Quarterly Report • Q3 2015 spin-off, but Agilent has a leading position in a growing industry, so the bonds recovered as management executed well. Bonds issued by Costco Wholesale also added 1¢ in the quarter. I added the company’s bonds earlier in the year, when investors were skeptical of the company’s growth potential and relevancy to younger consumers. Only a handful of the Fund’s corporate bonds are down either for the year or the quarter, which is especially positive in a down market. Of those, the biggest drag on performance were bonds issued by Motorola Solutions, a company specializing in public safety communications. Investors were concerned about its increasing leverage, and so the bonds ultimately shaved 1¢ from the NAV. PARNASSUS FUNDS Parnassus Fixed Income Fund as of September 30, 2015 (percentage of net assets) Fund Sector Weightings Barclays U.S. Aggregate Bond Index U.S.
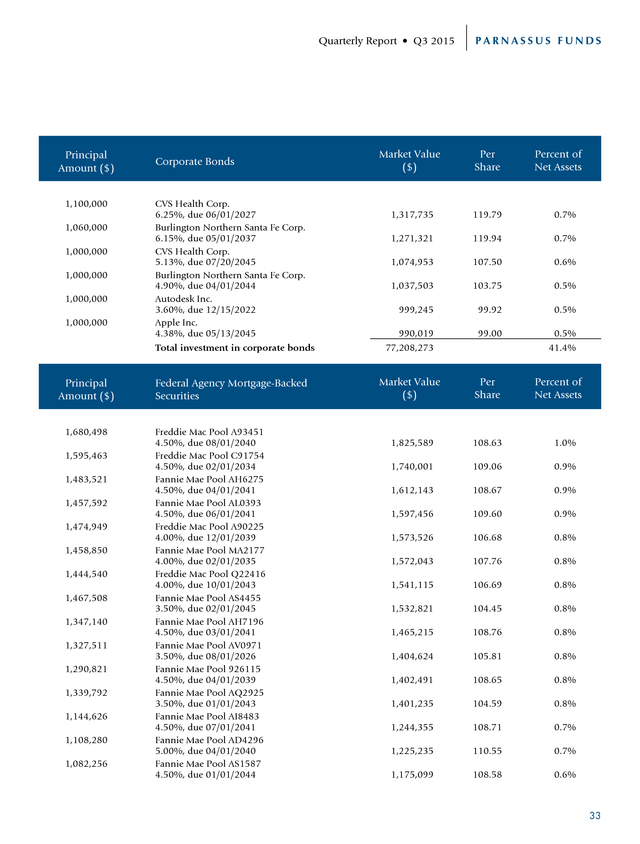
Treasury Bonds 21.3% 36.5% Government Related Bonds 3.8% 8.6% Finally, the Fund’s convertible bond investment in Exelixis, a biotechnology company, continued to be the top performer, adding almost 2¢ to NAV in the quarter and 3¢ for the year. The company made progress in the quarter towards commercializing its melanoma drug, Cobimetinib, and received positive phase III trial results for the use of its second drug, Cabozantinib, in renal cancer. Corporate Bonds Outlook and Strategy Securitized Bonds Corporate bonds performed poorly relative to other asset classes over the last year because credit spreads, or the difference between the yield on corporate bonds and Treasuries, increased dramatically. Normally, when credit spreads increase, it means that an industry or a company has become riskier, and investors want more compensation for their investment.
That’s certainly true today of energy companies and other commodity companies, but I do not believe it’s true across the board. For companies that have been unfairly punished, their bonds have become a bargain. In the quarter, I found several such bonds, and so added positions in Apple, CVS Health and BNSF Railway. These companies have fantastic management teams and competitive advantages, so I expect the bonds to perform well. 43.1% 24.0% 26.3% 30.9% Short-term Investments, Other Assets & Liabilities 5.5% 0.0% 0 10 20 30 40 50 Portfolio characteristics and holdings are subject to change periodically. Last quarter, I incorrectly predicted that the Federal Reserve would raise its benchmark rate in September.
Despite a resilient domestic economy, the committee left rates unchanged due to concerns about the pace of global growth. The U.S. grew at a 3.9% annualized rate in the second quarter, and with unemployment around 5%, I still believe there’s an argument for higher interest rates.
On average, the Federal Reserve seems to agree, as most committee members expect a higher Federal Funds Rate by the end of the year. Despite this, long-term yields remain near record lows. Low yields translate to high bond prices and so I continue to be concerned that even a small change in sentiment would quickly push interest rates higher, and prices lower. For that reason, the Fund continues to have a relatively short duration that protects principal in a rising rate environment. Thank you for your investment in the Parnassus Fixed Income Fund. Yours truly, Samantha D.
Palm Portfolio Manager 21 . PARNASSUS FUNDS Quarterly Report • Q3 2015 Responsible Investing Notes By: Milton Moskowitz Netflix, which streams movies, videos and TV programs to 65 million subscribers and now has a market cap of more than $50 billion, stunned the business world when it announced that it was granting new mothers paid leave of up to one year. While there was some question of whether all its hourly employees would be eligible for this benefit, it was spectacular enough to stimulate a flurry of activity on this front. Among the companies cited for their recent initiative in this area were Goldman Sachs, Hilton Worldwide, Yahoo, Apple, Microsoft and Facebook. At Microsoft, new parents now enjoy 20 weeks of paid leave.
New mothers at Facebook get four months plus $4,000 in baby cash. Google offers an 18-week paid leave for new mothers, seven weeks for new fathers. Second to Netflix is the former Parnassus portfolio company Adobe, which introduced a 26-week paid leave. It was a long time coming.
The United States is the only country in the advanced industrial world where the government does not mandate paid maternity leave. I first learned about this void in 1986 when I inaugurated the Working Mother list of the Best Companies for Working Mothers. I quickly discovered that there was hardly any company that specifically offered maternity leave.
It was available through short-term disability insurance – 6 weeks for a standard procedure, 8 weeks for a Caesarian – and it often was only partial pay. In other words, giving birth to a child is treated the same way as a broken arm. Working Mother’s 30th anniversary issue was published at the end of September, crammed with mini-profiles of work/family programs in place at 100 companies, from management consultant A.T. Kearney to insurance provider Zurich North America. It represents quite a transformation from the meager landscape of 1986, when we could find only 30 companies worthy of recognition.
It took us until 1992 to reach 100. As usual, the Working Mother 100 is peppered with Parnassus portfolio companies, ten this year including Accenture, American Express, Capital One, Cardinal Health, First Horizon, IBM, Intel, MasterCard, Novartis and Procter & Gamble. These companies differ from the rest of corporate America, make no mistake about that. In a table in its current issue, Working Mother editors contrast some differences. Only 17% of all U.S.
companies offer paid paternity leave, compared to 90% of the Working Mother roster; only 21% of all firms have on-site fitness centers compared to 88%; only 17% offer adoption assistance against 93%; only 3% have concierge services compared to 46% for the Working Mother 100. Procter & Gamble, a holding of our Parnassus Core Equity Fund, is unique in having five women on its 13-person board of directors. It’s not every day that a magazine like Fortune invents a new list, but it happened in September when it debuted its first ever Change the World list recognizing 50 companies for making “significant progress in addressing major social problems as part of their core business strategy.” Explaining why it has gone down this route, the editor of Fortune, Alan Murray said: “It is based on our belief that capitalism should not be just tolerated but celebrated for its power to do good. At a time when governments are flailing, its powers are needed more than ever.” Eleven companies from our portfolios – Google, Cisco Systems, Novartis, MasterCard, Alibaba, IBM, CVS Health, Whole Foods Market, Intel, Ecolab and Waste Management – make the first installment of this list.
There are some surprises. Toyota is in third place for its contribution to clean air by introducing the world’s first mass-market hybrid, the Prius. Walmart captures fourth place for leaning on suppliers to eliminate waste and build sustainability into their operations. Walmart now gets 26% of its electricity from renewable sources. However, the company that gets the most attention in this latest Fortune roundup is Whole Foods Market, ranked 30th on the list for “raising the bar for every American grocer.” There is an eight-page profile of founder John Mackey, who is on a crusade to get Americans to eat healthier foods.
Attacks on Whole Foods go viral, says Mackey, “because people are eager to believe bad things about Whole Foods so it doesn’t disrupt their mental model” of business as selfish and greedy. In 2006, Mackey reduced his salary to $1 a year. No one at Whole Foods is allowed to make more than 19 times the average pay in the company. 22 . Quarterly Report • Q3 2015 PARNASSUS FUNDS No sooner was the Fortune issue off press than news broke that Whole Foods, which has 91,000 employees in more than 400 stores, announced that it was laying off 1,500 workers as a cost-cutting move. The company said it would be careful to do this in a respectful manner. Team members would continue to be paid for eight weeks while they decided on their next move. They will get generous severance pay, based on tenure, and they will be given the opportunity to apply for open jobs in other parts of the company. More than 100 new stores are currently in development. Jagdeep Singh Bachher, chief investment officer of the University of California regents, reported that over the last few months, the university has sold all of its remaining holdings in coal mining and oil-sands-focused companies.
The move was prompted by concerns about climate change. Bachher explained: “In our view, institutions that ignore societal values in their investment strategy imperil their bottom line – today and for years to come.” Mondelez, whose brands include Cadbury and Oreos, said that in five years healthy snacks will comprise half of its food revenues (up from one-third today)…PepsiCo began sweetening its diet drinks with saccharin in 1963. In 1983, it switched to aspartame.
Now it’s replacing the aspartame in Diet Pepsi with other chemicals, sucralose and acesulfame…Allergan, the Dublin-based pharmaceutical company, launched a campaign called “ActuallySheCan,” a program to educate and motivate millennial women to achieve their full potential, socially and professionally. Milton Moskowitz is the co-author of the Fortune magazine survey “The 100 Best Companies to Work For” and the co-originator of the annual Working Mother magazine survey, “The 100 Best Companies for Working Mothers.” Mr. Moskowitz serves as a consultant to Parnassus Investments in evaluating companies for workplace issues and responsible investing. Neither Fortune magazine nor Working Mother magazine has any role in the management of the Parnassus Funds, and there is no affiliation between Parnassus Investments and either publication. 23 .
PARNASSUS FUNDS Quarterly Report • Q3 2015 PARNASSUS FUND Portfolio of Investments as of September 30, 2015 (unaudited) 1,300,000 550,000 1,225,000 1,000,000 210,000 400,000 1,200,000 800,000 1,650,000 80,000 450,000 775,000 680,000 750,000 600,000 450,000 325,000 250,000 175,000 300,000 25,000 350,000 1,050,000 200,000 800,000 250,000 500,000 80,000 55,000 800,000 200,000 65,000 450,000 175,000 250,000 100,000 100,000 500,000 50,000 25,000 Market Value ($) Per Share Altera Corp. Motorola Solutions Inc. Intel Corp. Whole Foods Market Inc. International Business Machines Corp. American Express Co. Ciena Corp. Air Lease Corp. Applied Materials Inc. Allergan plc Expeditors International of Washington Inc. EZchip Semiconductor Ltd. Charles Schwab Corp. Essent Group Ltd. Progressive Corp. Thomson Reuters Corp. QUALCOMM Inc. Citrix Systems Inc. Gilead Sciences Inc. SanDisk Corp. Google Inc., Class A Mondelez International Inc., Class A Redwood Trust Inc. Capital One Financial Corp. Trimble Navigation Ltd. Wells Fargo & Co. Axalta Coating Systems Ltd. Perrigo Co. plc W.W. Grainger Inc. First Horizon National Corp. Pentair plc FedEx Corp. Potash Corporation of Saskatchewan Inc. Plantronics Inc. PayPal Holdings Inc. Deere & Co. Genesee & Wyoming Inc., Class A Belmond Ltd. Lam Research Corp. Autodesk Inc. Total investment in equities Total short-term securities 65,104,000 37,609,000 36,921,500 31,650,000 30,443,700 29,652,000 24,864,000 24,736,000 24,238,500 21,744,800 21,172,500 19,499,000 19,420,800 18,637,500 18,384,000 18,117,000 17,462,250 17,320,000 17,183,250 16,299,000 15,959,250 14,654,500 14,532,000 14,504,000 13,136,000 12,837,500 12,670,000 12,581,600 11,825,550 11,344,000 10,208,000 9,358,700 9,247,500 8,898,750 7,760,000 7,400,000 5,908,000 5,055,000 3,266,500 1,103,500 712,709,150 12,675,712 50.08 68.38 30.14 31.65 144.97 74.13 20.72 30.92 14.69 271.81 47.05 25.16 28.56 24.85 30.64 40.26 53.73 69.28 98.19 54.33 638.37 41.87 13.84 72.52 16.42 51.35 25.34 157.27 215.01 14.18 51.04 143.98 20.55 50.85 31.04 74.00 59.08 10.11 65.33 44.14 Other assets and liabilities Total net assets Shares (1,917,627) 723,467,235 Equities Net asset value as of September 30, 2015 Investor shares Institutional shares 24 $46.52 $46.55 Percent of Net Assets 9.0% 5.2% 5.1% 4.4% 4.2% 4.1% 3.4% 3.4% 3.4% 3.0% 2.9% 2.7% 2.7% 2.6% 2.5% 2.5% 2.4% 2.4% 2.4% 2.3% 2.2% 2.0% 2.0% 2.0% 1.8% 1.8% 1.8% 1.7% 1.6% 1.6% 1.4% 1.3% 1.3% 1.2% 1.1% 1.0% 0.8% 0.7% 0.4% 0.2% 98.5% 1.8% (0.3%) 100.0% . Quarterly Report • Q3 2015 PARNASSUS FUNDS PARNASSUS CORE EQUITY FUND Portfolio of Investments as of September 30, 2015 (unaudited) Shares 8,962,852 6,105,878 10,709,214 5,444,500 12,500,000 3,808,270 3,500,000 6,500,003 10,543,000 9,945,000 1,165,400 3,205,979 3,265,000 7,864,354 2,750,000 8,000,000 7,475,805 480,572 2,858,089 9,978,431 3,460,000 1,600,397 2,750,000 16,200,000 12,028,340 2,450,000 7,229,633 4,400,000 2,153,000 4,800,000 8,415,633 2,500,000 10,435,608 11,500,000 2,075,303 225,000 1,692,272 1,220,000 2,325,000 700,270 Equities Market Value ($) Per Share Motorola Solutions Inc. Danaher Corp. Mondelez International Inc., Class A Procter & Gamble Co. Intel Corp. United Parcel Service Inc., Class B Gilead Sciences Inc. Pentair plc Iron Mountain Inc. Xylem Inc. Allergan plc CVS Health Corp. PepsiCo Inc. Sysco Corp. Apple Inc. National Oilwell Varco Inc. Thomson Reuters Corp. Google Inc., Class C Praxair Inc. Charles Schwab Corp. Verisk Analytics Inc. Perrigo Co. plc MasterCard Inc., Class A Applied Materials Inc. Shaw Communications Inc., Class B Novartis AG (ADR) PayPal Holdings Inc. Waste Management Inc. Accenture plc, Class A Patterson Companies Inc. eBay Inc. McCormick & Co. Questar Corp. MDU Resources Group Inc. Compass Minerals International Inc. Google Inc., Class A Deere & Co. WD-40 Co. Northwest Natural Gas Co. AGL Resources Inc. Total investment in equities Total short-term securities 612,879,820 520,281,864 448,394,790 391,677,330 376,750,000 375,838,166 343,665,000 331,760,153 327,043,860 326,693,250 316,767,374 309,312,854 307,889,500 306,473,875 303,325,000 301,200,000 300,975,909 292,389,616 291,124,946 284,983,989 255,728,600 251,694,436 247,830,000 237,978,000 233,349,796 225,204,000 224,407,808 219,164,000 211,553,780 207,600,000 205,678,071 205,450,000 202,555,151 197,800,000 162,641,496 143,633,250 125,228,128 108,665,400 106,578,000 42,744,483 10,884,911,695 393,546,324 68.38 85.21 41.87 71.94 30.14 98.69 98.19 51.04 31.02 32.85 271.81 96.48 94.30 38.97 110.30 37.65 40.26 608.42 101.86 28.56 73.91 157.27 90.12 14.69 19.40 91.92 31.04 49.81 98.26 43.25 24.44 82.18 19.41 17.20 78.37 638.37 74.00 89.07 45.84 61.04 Other assets and liabilities Total net assets Net asset value as of September 30, 2015 Investor shares Institutional shares (56,137,046) 11,222,320,973 Percent of Net Assets 5.5% 4.6% 4.0% 3.5% 3.4% 3.3% 3.1% 3.0% 2.9% 2.9% 2.8% 2.8% 2.7% 2.7% 2.7% 2.7% 2.7% 2.6% 2.6% 2.5% 2.3% 2.2% 2.2% 2.1% 2.1% 2.0% 2.0% 2.0% 1.9% 1.9% 1.8% 1.8% 1.8% 1.8% 1.4% 1.3% 1.1% 1.0% 0.9% 0.4% 97.0% 3.5% (0.5%) 100.0% $38.32 $38.38 25 . PARNASSUS FUNDS Quarterly Report • Q3 2015 PARNASSUS ENDEAVOR FUND Portfolio of Investments as of September 30, 2015 (unaudited) Shares 3,300,000 2,200,000 4,100,000 1,875,000 800,000 1,100,000 400,000 1,000,000 675,000 210,000 650,000 1,900,000 875,000 800,000 700,000 220,000 1,100,000 900,000 400,000 240,000 40,000 250,000 1,100,000 300,000 350,000 1,200,000 500,000 200,000 140,000 300,000 500,000 140,000 Equities Altera Corp. Intel Corp. Applied Materials Inc. Whole Foods Market Inc. American Express Co. QUALCOMM Inc. International Business Machines Corp. SanDisk Corp. Deere & Co. W.W. Grainger Inc. Citrix Systems Inc. Ciena Corp. Autodesk Inc. Expeditors International of Washington Inc. Wells Fargo & Co. Perrigo Co. plc Charles Schwab Corp. Roche Holdings Ltd. (ADR) C.H.
Robinson Worldwide Inc. Cummins Inc. Google Inc., Class A Gilead Sciences Inc. Shaw Communications Inc., Class B Lam Research Corp. Plantronics Inc. First Horizon National Corp. PayPal Holdings Inc. Capital One Financial Corp. Novartis AG (ADR) Mondelez International Inc., Class A eBay Inc. Procter & Gamble Co. Total investment in equities Total short-term securities Other assets and liabilities Total net assets Net asset value as of September 30, 2015 Investor shares Institutional shares 26 Market Value ($) Per Share 165,264,000 66,308,000 60,229,000 59,343,750 59,304,000 59,103,000 57,988,000 54,330,000 49,950,000 45,152,100 45,032,000 39,368,000 38,622,500 37,640,000 35,945,000 34,599,400 31,416,000 29,655,000 27,112,000 26,059,200 25,534,800 24,547,500 21,340,000 19,599,000 17,797,500 17,016,000 15,520,000 14,504,000 12,868,800 12,561,000 12,220,000 10,071,600 50.08 30.14 14.69 31.65 74.13 53.73 144.97 54.33 74.00 215.01 69.28 20.72 44.14 47.05 51.35 157.27 28.56 32.95 67.78 108.58 638.37 98.19 19.40 65.33 50.85 14.18 31.04 72.52 91.92 41.87 24.44 71.94 1,226,001,150 49,479,635 (17,794,785) 1,257,686,000 $29.05 $29.08 Percent of Net Assets 13.1% 5.3% 4.8% 4.7% 4.7% 4.7% 4.6% 4.3% 4.0% 3.6% 3.6% 3.1% 3.1% 3.0% 2.9% 2.8% 2.5% 2.4% 2.2% 2.1% 2.0% 1.9% 1.7% 1.6% 1.4% 1.3% 1.2% 1.1% 1.0% 1.0% 1.0% 0.8% 97.5% 3.9% (1.4%) 100.0% . Quarterly Report • Q3 2015 PARNASSUS FUNDS PARNASSUS MID CAP FUND Portfolio of Investments as of September 30, 2015 (unaudited) Shares 346,604 404,095 1,372,926 590,000 450,000 220,000 511,628 190,000 405,000 205,567 358,384 302,500 305,078 290,000 996,438 845,000 314,749 344,890 168,416 772,500 598,289 224,338 123,276 229,895 394,453 158,000 195,900 57,000 193,500 270,000 395,000 125,000 57,500 70,000 258,895 70,000 95,000 170,000 485,000 94,500 82,924 75,000 21,000 19,243 191,048 Equities Motorola Solutions Inc. SEI Investments Co. First Horizon National Corp. Iron Mountain Inc. Sysco Corp. Cardinal Health Inc. Xylem Inc. Fiserv Inc. Thomson Reuters Corp. Compass Minerals International Inc. Patterson Companies Inc. Pentair plc Waste Management Inc. DENTSPLY International Inc. Applied Materials Inc. MDU Resources Group Inc. Autodesk Inc. First American Financial Corp. Verisk Analytics Inc. Calgon Carbon Corp. Questar Corp. Expeditors International of Washington Inc. McCormick & Co. Insperity Inc. Essent Group Ltd. Cameron International Corp. Synopsys Inc. Perrigo Co. plc Northwest Natural Gas Co. Charles Schwab Corp. Shaw Communications Inc., Class B AGL Resources Inc. Teleflex Inc. Equifax Inc. Axalta Coating Systems Ltd. Group 1 Automotive Inc. Regal Beloit Corp. Air Lease Corp. Belmond Ltd. Energen Corp. Plantronics Inc. Sotheby’s Ecolab Inc. Intuit Inc. GenMark Diagnostics Inc. Total investment in equities Total short-term securities Other assets and liabilities Total net assets Net asset value as of September 30, 2015 Investor shares Institutional shares Market Value ($) Per Share Percent of Net Assets 23,700,782 19,489,502 19,468,091 18,301,800 17,536,500 16,900,400 16,806,980 16,455,900 16,305,300 16,110,286 15,500,108 15,439,600 15,195,935 14,665,300 14,637,674 14,534,000 13,893,021 13,474,852 12,447,627 12,035,550 11,612,789 10,555,103 10,130,822 10,099,287 9,802,157 9,688,560 9,046,662 8,964,390 8,870,040 7,711,200 7,663,000 7,630,000 7,142,075 6,802,600 6,560,399 5,960,500 5,362,750 5,256,400 4,903,350 4,711,770 4,216,685 2,398,500 2,304,120 1,707,816 1,503,548 493,503,731 36,471,235 (6,919,221) 523,055,745 68.38 48.23 14.18 31.02 38.97 76.82 32.85 86.61 40.26 78.37 43.25 51.04 49.81 50.57 14.69 17.20 44.14 39.07 73.91 15.58 19.41 47.05 82.18 43.93 24.85 61.32 46.18 157.27 45.84 28.56 19.40 61.04 124.21 97.18 25.34 85.15 56.45 30.92 10.11 49.86 50.85 31.98 109.72 88.75 7.87 4.5% 3.7% 3.7% 3.5% 3.4% 3.2% 3.2% 3.1% 3.1% 3.1% 3.0% 3.0% 2.9% 2.8% 2.8% 2.8% 2.7% 2.6% 2.4% 2.3% 2.2% 2.0% 1.9% 1.9% 1.9% 1.9% 1.7% 1.7% 1.7% 1.5% 1.5% 1.5% 1.4% 1.3% 1.3% 1.1% 1.0% 1.0% 0.9% 0.9% 0.8% 0.5% 0.4% 0.3% 0.3% 94.4% 7.0% (1.4%) 100.0% $25.86 $25.91 27 . PARNASSUS FUNDS Quarterly Report • Q3 2015 PARNASSUS ASIA FUND Portfolio of Investments as of September 30, 2015 (unaudited) Shares 41,000 Shares 12,950 6,000 10,500 6,000 4,000 Australia Equities Brambles Ltd. Total investment in Australia equities China Equities Altera Corp. Alibaba Group Holding Ltd. (ADR) Air Lease Corp. QUALCOMM Inc. Expeditors International of Washington Inc. Total investment in China equities Shares Hong Kong Equities 450,000 640,000 360,000 284,000 250,000 55,000 100,000 150,000 Sun Art Retail Group Ltd. SITC International Holdings Co., Ltd. Lenovo Group Ltd. China Minsheng Banking Corp., Ltd. Want Want China Holdings Ltd. Television Broadcasts Ltd. HKBN Ltd. Greatview Aseptic Packaging Co., Ltd. Total investment in Hong Kong equities Shares 450,000 3,951,300 Indonesia Equities Market Value ($) 281,608 281,608 Market Value ($) 648,536 353,820 324,660 322,380 188,200 27,000 8,000 13,000 16,000 28 6.87 Per Share 50.08 58.97 30.92 53.73 47.05 1,837,596 Market Value ($) 346,101 309,987 304,333 263,241 205,923 183,538 115,744 70,037 Market Value ($) PT Bank Rakyat Indonesia (Persero) PT Asuransi Multi Artha Guna 266,443 102,670 Per Share 0.77 0.48 0.85 0.93 0.82 3.34 1.16 0.47 Rakuten Inc. Linear Technology Corp. KDDI Corp. USS Co., Ltd. Market Value ($) 345,155 322,800 291,005 266,135 3.1% 3.1% Percent of Net Assets 7.0% 3.8% 3.5% 3.5% 2.1% Percent of Net Assets 3.7% 3.4% 3.3% 2.8% 2.2% 2.0% 1.3% 0.7% 19.4% Per Share 369,113 Japan Equities Percent of Net Assets 19.9% 1,798,904 Total investment in Indonesia equities Shares Per Share 0.59 0.03 Percent of Net Assets 2.9% 1.1% 4.0% Per Share 12.78 40.35 22.38 16.63 Percent of Net Assets 3.7% 3.5% 3.1% 2.9% . Quarterly Report • Q3 2015 Shares Japan Equities 16,000 7,000 Kakaku.com Inc. OMRON Corp. Total investment in Japan equities Shares Philippines Equities 613,800 Manila Water Co. Total investment in Philippines equities Shares Singapore Equities 310,000 OSIM International Ltd. Total investment in Singapore equities Shares South Korea Equities 425 Samsung Electronics Co., Ltd. Total investment in South Korea equities Shares Taiwan Equities 12,000 24,000 281,400 129,000 5,000 Hermes Microvision Inc. Applied Materials Inc. Lite-On Technology Corp. Chailease Holding Co., Ltd. Taiwan Semiconductor Manufacturing Co., Ltd. (ADR) Total investment in Taiwan equities Market Value ($) 259,868 210,733 PARNASSUS FUNDS Per Share 16.24 30.10 1,695,696 Market Value ($) 284,878 284,878 Market Value ($) 354,485 354,485 Market Value ($) 407,837 407,837 Market Value ($) Percent of Net Assets 2.8% 2.3% 18.3% Per Share 0.46 Per Share 1.14 Per Share 959.62 Per Share Percent of Net Assets 3.1% 3.1% Percent of Net Assets 3.8% 3.8% Percent of Net Assets 4.4% 4.4% Percent of Net Assets 456,631 352,560 258,797 202,475 38.05 14.69 0.92 1.57 4.9% 3.8% 2.8% 2.2% 103,749 20.75 1.2% 1,374,212 14.9% 29 . PARNASSUS FUNDS Quarterly Report • Q3 2015 PARNASSUS ASIA FUND Portfolio of Investments as of September 30, 2015 (unaudited) (continued) Shares Thailand Equities 250,000 Thanachart Capital Public Co., Ltd. Total investment in Thailand equities Total investment in equities Total short-term securities Other assets and liabilities Total net assets Net asset value as of September 30, 2015 Investor shares Institutional shares 30 Market Value ($) Per Share 218,236 218,236 8,622,565 490,936 0.87 Percent of Net Assets 2.4% 2.4% 93.3% 5.3% 132,701 1.4% 9,246,202 100.0% $13.77 $13.79 . Quarterly Report • Q3 2015 PARNASSUS FUNDS PARNASSUS FIXED INCOME FUND Portfolio of Investments as of September 30, 2015 (unaudited) Principal Amount ($) 1,500,000 1,000,000 1,000,000 1,000,000 986,086 907,982 373,099 Commercial Mortgage-Backed Securities JP Morgan Mortgage Trust Series 2011-C4, Class A3, 4.11%, due 07/15/2046 JP Morgan Mortgage Trust Series 2011-C4, Class A4, 4.39%, due 07/15/2046 UBS-Barclays Mortgage Trust Series 2012-C2, Class A3, 3.06%, due 05/10/2063 JP Morgan Mortgage Trust Series 2013-C13, Class A2, 2.67%, due 01/15/2046 DBUBS Mortgage Trust Series 2011-LC2A, Class A2, 3.39%, due 07/10/2044 FHLMC Multifamily Structured Pass Through Certificates K-029, Class A1, 2.84%, due 10/25/2022 Morgan Stanley Capital Trust Series 2011-C1, Class A2, 3.88%, due 09/15/2047 Total investment in commercial mortgage-backed securities Principal Amount ($) 1,250,000 1,000,000 550,000 Convertible Bonds Intel Corp. 2.95%, due 12/15/2035 Microchip Technology Inc. 1.63%, due 02/15/2025 Exelixis Inc. 4.25%, due 08/15/2019 Total investment in convertible bonds Principal Amount ($) 4,050,000 3,500,000 3,700,000 3,300,000 Corporate Bonds Pentair Finance SA 3.15%, due 09/15/2022 Nordstrom Inc. 4.00%, due 10/15/2021 Agilent Technologies Inc. 3.20%, due 10/01/2022 Discover Financial Services 5.20%, due 04/27/2022 Market Value ($) Per Share 1,583,007 105.53 0.8% 1,093,539 109.35 0.6% 1,034,659 103.47 0.6% 1,027,793 102.78 0.6% 996,889 101.10 0.5% 948,867 104.50 0.5% 374,548 100.39 0.2% 7,059,302 Percent of Net Assets 3.8% Market Value ($) Per Share 1,517,969 121.44 0.8% 956,875 95.69 0.5% 663,781 120.69 3,138,625 Percent of Net Assets 0.4% 1.7% Market Value ($) Per Share Percent of Net Assets 3,829,008 94.54 2.1% 3,738,189 106.81 2.0% 3,686,366 99.63 2.0% 3,520,499 106.68 1.9% 31 . PARNASSUS FUNDS Quarterly Report • Q3 2015 PARNASSUS FIXED INCOME FUND Portfolio of Investments as of September 30, 2015 (unaudited) (continued) Principal Amount ($) 3,500,000 3,000,000 3,000,000 3,000,000 3,000,000 2,500,000 2,570,000 2,200,000 2,100,000 2,000,000 2,000,000 2,000,000 2,000,000 2,000,000 2,000,000 2,000,000 2,000,000 2,000,000 2,000,000 2,000,000 2,000,000 2,000,000 1,500,000 1,397,882 1,500,000 32 Corporate Bonds Motorola Solutions Inc. 3.75%, due 05/15/2022 Hanesbrands Inc. 6.38%, due 12/15/2020 Juniper Networks Inc. 4.50%, due 03/15/2024 Costco Wholesale Corp. 2.25%, due 02/15/2022 FedEx Corp. 2.70%, due 04/15/2023 Starbucks Corp. 3.85%, due 10/01/2023 Cameron International Corp. 3.60%, due 04/30/2022 Autodesk Inc. 4.38%, due 06/15/2025 Cardinal Health Inc. 1.90%, due 06/15/2017 Corning Inc. 3.70%, due 11/15/2023 Burlington Northern Santa Fe Corp. 3.85%, due 09/01/2023 Gilead Sciences Inc. 3.70%, due 04/01/2024 Cisco Systems Inc. 5.50%, due 02/22/2016 Waste Management Inc. 3.50%, due 05/15/2024 Applied Materials Inc. 2.65%, due 06/15/2016 Wells Fargo & Co. 4.10%, due 06/03/2026 CVS Health Corp. 3.38%, due 08/12/2024 Procter & Gamble Co. 2.30%, due 02/06/2022 Regency Centers LP 3.75%, due 06/15/2024 Fiserv Inc. 3.13%, due 10/01/2015 Perrigo Finance plc 3.90%, due 12/15/2024 PepsiCo Inc. 2.75%, due 04/30/2025 Ecolab Inc. 4.35%, due 12/08/2021 Southwest Air 07-1 Trust 6.15%, due 08/01/2022 United Rentals North America Inc. 6.13%, due 06/15/2023 Market Value ($) Per Share Percent of Net Assets 3,259,242 93.12 1.7% 3,105,000 103.50 1.7% 3,021,741 100.72 1.6% 2,971,890 99.06 1.6% 2,888,484 96.28 1.5% 2,652,305 106.09 1.4% 2,590,175 100.79 1.4% 2,206,002 100.27 1.2% 2,116,019 100.76 1.1% 2,088,630 104.43 1.1% 2,076,080 103.80 1.1% 2,046,532 102.33 1.1% 2,038,436 101.92 1.1% 2,028,920 101.45 1.1% 2,027,550 101.38 1.1% 2,018,200 100.91 1.1% 2,009,618 100.48 1.1% 2,005,666 100.28 1.1% 2,001,146 100.06 1.1% 2,000,000 100.00 1.1% 1,969,806 98.49 1.1% 1,937,866 96.89 1.0% 1,623,186 108.21 0.9% 1,565,628 112.00 0.8% 1,495,313 99.69 0.8% . Quarterly Report • Q3 2015 Principal Amount ($) 1,100,000 1,060,000 1,000,000 1,000,000 1,000,000 1,000,000 Corporate Bonds CVS Health Corp. 6.25%, due 06/01/2027 Burlington Northern Santa Fe Corp. 6.15%, due 05/01/2037 CVS Health Corp. 5.13%, due 07/20/2045 Burlington Northern Santa Fe Corp. 4.90%, due 04/01/2044 Autodesk Inc. 3.60%, due 12/15/2022 Apple Inc. 4.38%, due 05/13/2045 Total investment in corporate bonds Principal Amount ($) 1,680,498 1,595,463 1,483,521 1,457,592 1,474,949 1,458,850 1,444,540 1,467,508 1,347,140 1,327,511 1,290,821 1,339,792 1,144,626 1,108,280 1,082,256 Federal Agency Mortgage-Backed Securities Freddie Mac Pool A93451 4.50%, due 08/01/2040 Freddie Mac Pool C91754 4.50%, due 02/01/2034 Fannie Mae Pool AH6275 4.50%, due 04/01/2041 Fannie Mae Pool AL0393 4.50%, due 06/01/2041 Freddie Mac Pool A90225 4.00%, due 12/01/2039 Fannie Mae Pool MA2177 4.00%, due 02/01/2035 Freddie Mac Pool Q22416 4.00%, due 10/01/2043 Fannie Mae Pool AS4455 3.50%, due 02/01/2045 Fannie Mae Pool AH7196 4.50%, due 03/01/2041 Fannie Mae Pool AV0971 3.50%, due 08/01/2026 Fannie Mae Pool 926115 4.50%, due 04/01/2039 Fannie Mae Pool AQ2925 3.50%, due 01/01/2043 Fannie Mae Pool AI8483 4.50%, due 07/01/2041 Fannie Mae Pool AD4296 5.00%, due 04/01/2040 Fannie Mae Pool AS1587 4.50%, due 01/01/2044 PARNASSUS FUNDS Market Value ($) Per Share 1,317,735 119.79 0.7% 1,271,321 119.94 0.7% 1,074,953 107.50 0.6% 1,037,503 103.75 0.5% 999,245 99.92 0.5% 990,019 99.00 0.5% 77,208,273 Percent of Net Assets 41.4% Market Value ($) Per Share Percent of Net Assets 1,825,589 108.63 1.0% 1,740,001 109.06 0.9% 1,612,143 108.67 0.9% 1,597,456 109.60 0.9% 1,573,526 106.68 0.8% 1,572,043 107.76 0.8% 1,541,115 106.69 0.8% 1,532,821 104.45 0.8% 1,465,215 108.76 0.8% 1,404,624 105.81 0.8% 1,402,491 108.65 0.8% 1,401,235 104.59 0.8% 1,244,355 108.71 0.7% 1,225,235 110.55 0.7% 1,175,099 108.58 0.6% 33 . PARNASSUS FUNDS Quarterly Report • Q3 2015 PARNASSUS FIXED INCOME FUND Portfolio of Investments as of September 30, 2015 (unaudited) (continued) Principal Amount ($) 1,078,683 974,574 907,917 895,771 894,353 892,901 860,878 871,403 845,451 834,675 859,630 821,575 811,049 759,164 758,860 731,410 705,721 692,435 704,387 697,639 627,199 625,905 617,113 Federal Agency Mortgage-Backed Securities Freddie Mac Pool V60523 3.00%, due 04/01/2029 Freddie Mac Pool C91764 3.50%, due 05/01/2034 Fannie Mae Pool AS0576 5.00%, due 09/01/2043 Fannie Mae Pool AS1130 4.50%, due 11/01/2043 Fannie Mae Pool AK3103 4.00%, due 02/01/2042 Fannie Mae Pool AX1326 3.50%, due 09/01/2029 Freddie Mac Pool C91762 4.50%, due 04/01/2034 Ginnie Mae II Pool MA2522 4.00%, due 01/20/2045 Fannie Mae Pool AL0215 4.50%, due 04/01/2041 Fannie Mae Pool 931065 4.50%, due 05/01/2039 Fannie Mae Pool MA1607 3.00%, due 10/01/2033 Fannie Mae Pool MA0695 4.00%, due 04/01/2031 Freddie Mac Pool G30672 3.50%, due 07/01/2033 Freddie Mac Pool G05514 5.00%, due 06/01/2039 Freddie Mac Pool G14809 3.00%, due 07/01/2028 Freddie Mac Pool G07426 4.00%, due 06/01/2043 Fannie Mae Pool AJ4994 4.50%, due 11/01/2041 Fannie Mae Pool MA0844 4.50%, due 08/01/2031 Freddie Mac Pool E02746 3.50%, due 11/01/2025 Fannie Mae Pool AD5108 3.50%, due 12/01/2025 Fannie Mae Pool AH0973 4.00%, due 12/01/2025 Freddie Mac Pool G14820 3.50%, due 12/01/2026 Fannie Mae Pool 931739 4.00%, due 08/01/2024 Total investment in federal agency mortgage-backed securities 34 Market Value ($) Per Share 1,127,383 104.51 0.6% 1,029,306 105.62 0.6% 1,000,010 110.14 0.5% 972,375 108.55 0.5% 960,054 107.35 0.5% 943,489 105.67 0.5% 938,526 109.02 0.5% 928,457 106.55 0.5% 919,404 108.75 0.5% 912,654 109.34 0.5% 893,159 103.90 0.5% 885,472 107.78 0.5% 858,354 105.83 0.5% 839,609 110.60 0.4% 791,433 104.29 0.4% 780,178 106.67 0.4% 767,571 108.76 0.4% 758,327 109.52 0.4% 744,824 105.74 0.4% 738,342 105.83 0.4% 668,843 106.64 0.3% 661,871 105.75 0.3% 650,663 105.44 0.3% 42,083,252 Percent of Net Assets 22.5% . Quarterly Report • Q3 2015 Principal Amount ($) 5,000,000 2,000,000 Supranational Bonds International Finance Corp. 0.50%, due 05/16/2016 European Bank for Reconstruction & Development 1.63%, due 04/10/2018 Total investment in supranational bonds Principal Amount ($) 4,000,000 4,000,000 4,000,000 4,000,000 4,000,000 3,000,000 3,000,000 3,000,000 2,000,000 2,000,000 2,000,000 2,000,000 1,139,180 1,000,000 U.S. Government Treasury Bonds U.S. Treasury 2.75%, due 11/15/2023 U.S. Treasury 2.50%, due 05/15/2024 U.S.
Treasury 2.25%, due 11/15/2024 U.S. Treasury 0.88%, due 11/15/2017 U.S. Treasury 0.38%, due 11/15/2015 U.S.
Treasury 1.50%, due 07/31/2016 U.S. Treasury 0.50%, due 09/30/2016 U.S. Treasury 0.63%, due 06/30/2017 U.S.
Treasury 2.75%, due 02/15/2024 U.S. Treasury 1.75%, due 05/31/2016 U.S. Treasury 2.13%, due 05/15/2025 U.S.
Treasury 1.75%, due 05/15/2023 U.S. Treasury (TIPS) 1.75%, due 01/15/2028 U.S. Treasury 2.00%, due 02/15/2025 Total investment in U.S.
government treasury bonds Total long-term investments Total short-term securities Other assets and liabilities Total net assets Net asset value as of September 30, 2015 Investor shares Institutional shares Market Value ($) PARNASSUS FUNDS Per Share 5,001,040 100.02 2,022,390 101.12 7,023,430 Market Value ($) Percent of Net Assets 2.7% 1.1% 3.8% Per Share Percent of Net Assets 4,258,644 106.47 2.3% 4,166,564 104.16 2.2% 4,074,792 101.87 2.2% 4,014,168 100.35 2.2% 4,001,016 100.03 2.1% 3,028,593 100.95 1.6% 3,003,009 100.10 1.6% 3,001,719 100.06 1.6% 2,125,624 106.28 1.1% 2,019,974 101.00 1.1% 2,012,032 100.60 1.1% 1,982,968 99.15 1.0% 1,259,195 110.54 0.7% 996,094 99.61 0.5% 39,944,392 176,457,274 9,458,508 21.3% 94.5% 5.1% 754,432 0.4% 186,670,214 100.0% $16.57 $16.56 35 . Go Paperless with E-Delivery Sign up for electronic delivery of prospectuses, shareholder reports and account statements at www.parnassus.com/gopaperless If you do not hold your account directly with Parnassus, please contact the firm that holds your account to inquire about electronic delivery. PARNASSUS FUNDS 1 Market Street, Suite 1600 San Francisco, CA 94105 (800) 999-3505 www.parnassus.com This report must be preceded or accompanied by a current prospectus. Investment Adviser Parnassus Investments 1 Market Street, Suite 1600 San Francisco, CA 94105 Independent Registered Public Accounting Firm Deloitte and Touche LLP 555 Mission Street San Francisco, CA 94105 Legal Counsel Foley and Lardner LLP 777 E. Wisconsin Ave. Milwaukee, WI 53202 Distributor Parnassus Funds Distributor 1 Market Street, Suite 1600 San Francisco, CA 94105 .
PARNASSUS FUNDS Quarterly Report • Q3 2015 November 2, 2015 Dear Shareholder: As this report is being written, there has been a lot of volatility in the markets. One day, there will be bad economic news, so the market heads much lower. The next day, there will be good news, so the market will head much higher. I know this is confusing to a lot of investors, but at Parnassus, we try to take advantage of these sharp moves up and down to provide good returns for our shareholders.
When the markets are down, we look at it as an opportunity to buy stocks at bargain prices. When the market is up, we will either sell or hold; usually we hold. We try to keep a long-term focus on our investments. To do this, you have to have the right temperament.
You can’t feel too bad when the market is down, and you can’t get too excited when the market is up. This has worked well for us over the years, so our funds have excellent long-term track records. For example, the Parnassus Mid Cap Fund-Investor Shares have earned 8.73% per year over the last ten years compared to 7.87% per year for the Russell MidCap Index and 6.50% per year for the Lipper Mid-Cap Core Average. This makes it #8 out of the 222 midcap core funds followed by Lipper for the ten years.
(It placed #101 of 416 funds, #251 of 368 funds and #61 of 322 funds for the one-, three- and five-year periods, respectively.) The Parnassus Fund-Investor Shares have earned 9.98% per year over the last ten years compared to 6.79% for the S&P 500 Index and 5.91% for the average multi-cap core fund followed by Lipper, making it #4 of 360 funds. (It placed #27 of 744 funds, #36 of 650 funds and #19 of 571 funds for the one-, three- and five-year periods, respectively.) Both the Parnassus Core Equity Fund-Investor Shares and the Parnassus Endeavor Fund-Investor Shares finished #1 in their respective categories for the ten-year period. The Parnassus Core Equity Fund-Investor Shares returned an average of 9.55% per year over the ten-year period, compared to 6.79% for the S&P 500 Index and 5.81% for the average equity income fund followed by Lipper, making it the leading fund in its category.
(It placed #28 of 502 funds, #2 of 385 funds and #5 of 299 funds for the one-, three- and five-year periods, respectively.) Finally, the Parnassus Endeavor Fund-Investor Shares earned an average of 11.20% per year over the ten-year period, compared to 6.79% for the S&P 500 and 5.91% for the average multi-cap core fund followed by Lipper, which made it #1 in its category. (It placed #33 of 744 funds, #38 of 650 funds and #16 of 571 funds, for the one-, three- and five-year periods, respectively.) We have been able to achieve this excellent performance by focusing on the long-term, and not being distracted by the day-today movements in the market. New Staff Members Angela Du joined Parnassus in August as a senior research analyst, after successfully completing the Parnassus intern program. Prior to Parnassus, Angela worked as an investment banking analyst at Goldman Sachs and as a private equity associate at TPG Capital. Angela graduated with distinction from Stanford University, where she studied management science and engineering, and was inducted into Phi Beta Kappa and Tau Beta Pi.
She recently received her MBA from the Wharton School of Business at the University of Pennsylvania. 4 . Quarterly Report • Q3 2015 PARNASSUS FUNDS Turner Miller joined Parnassus in September as a Sales Associate. Turner comes to us from LPL Financial where he spent eight years in a variety of roles in their San Diego headquarters, including product management, client service and business management. Turner received his bachelor’s degree in Financial Services from San Diego State University. Thank you for your investment in the Parnassus Funds. Yours truly, Jerome L. Dodson President 5 .
PARNASSUS FUNDS Quarterly Report • Q3 2015 PARNASSUS FUND Ticker: Investor Shares - PARNX Ticker: Institutional Shares - PFPRX As of September 30, 2015, the net asset value per share (“NAV”) of the Parnassus Fund-Investor Shares was $46.52, resulting in a loss of 6.32% for the third quarter. This compares to a loss of 6.43% for the S&P 500 Index (“S&P 500”) and a loss of 8.03% for the Lipper Multi-Cap Core Average, which represents the average return of the multi-cap core funds followed by Lipper (“Lipper average”). For the year-to-date, the Fund is down 3.27%, compared to a loss of 5.27% for the S&P 500 and a loss of 6.34% for the Lipper average. While it’s never pleasant to lose money, we take some satisfaction that we lost less than both of our benchmarks. Parnassus Fund Average Annual Total Returns (%) One Year Three Years Five Years Ten Years Gross Expense Ratio Net Expense Ratio Parnassus Fund Investor Shares 4.44 15.61 14.76 9.98 0.84 0.84 Parnassus Fund Institutional Shares 4.51 15.63 14.77 9.99 0.77 0.77 S&P 500 Index -0.61 12.39 13.32 6.79 NA NA Lipper Multi-Cap Core Average -2.16 11.81 11.48 5.91 NA NA for periods ended September 30, 2015 The average annual total return for the Parnassus Fund-Institutional Shares from commencement (April 30, 2015) was -5.85%.
Performance shown prior to the inception of the Institutional Shares reflects the performance of the Parnassus Fund-Investor Shares and includes expenses that are not applicable to and are higher than those of the Institutional Shares. The performance of the Institutional Shares differs from that shown for the Investor Shares to the extent that the classes do not have the same expenses. Performance data quoted represent past performance and are no guarantee of future returns.
Current performance may be lower or higher than the performance data quoted. Current performance information to the most recent month-end is available on the Parnassus website (www.parnassus.com). Investment return and principal value will fluctuate, so an investor’s shares, when redeemed, may be worth more or less than their original principal cost. Returns shown in the table do not reflect the deduction of taxes a shareholder may pay on fund distributions or redemption of shares.
The S&P 500 is an unmanaged index of common stocks, and it is not possible to invest directly in an index. Index figures do not take any expenses, fees or taxes into account, but mutual fund returns do. Before investing, an investor should carefully consider the investment objectives, risks, charges and expenses of the Fund and should carefully read the prospectus or summary prospectus, To the left is a table comparing the Parnassus Fund with the S&P 500 and the Lipper average over the past one-, three-, five- and ten-year periods. You will notice that the Fund is well ahead of both benchmarks for every time period. We’re especially proud of the ten-year period, where we’ve earned 9.98% per year compared to 6.79% for the S&P 500 and 5.91% for the Lipper average, making the Parnassus Fund the fourth best-performing fund of the 360 multi-cap core funds followed by Lipper for the ten-year period. (It placed #27 of 744 funds, #36 of 650 funds and #19 of 571 funds for the one-, three- and five-year periods, respectively.) Company Analysis The market moved sharply lower in the third quarter, and unfortunately, most of our stocks participated in that downward movement.
Our four worst-performing companies this quarter each sliced 29¢ or more off the NAV. Thankfully, we had three companies that each contributed 40¢ or more to the NAV, which offset some of the losses. Applied Materials, the largest maker of equipment used to produce semiconductors, sliced 42¢ off the NAV, as its stock sank 23.6% from $19.22 to $14.69. Intel, one of the company’s biggest customers, announced a delay in moving from 14 nanometer chips to 10 nanometer chips, and this meant that Intel would defer new orders for equipment.
Adding to the Intel situation were concerns about a global economic slowdown – especially in China – that would mean a lot less business for Applied. which contains this and other information. The prospectus or summary prospectus can be obtained on the Parnassus website or by calling (800) 999-3505. As described in the Fund’s current prospectus dated May 1, 2015, Parnassus Investments has contractually agreed to limit total operating expenses to 0.77% of net assets for the Parnassus Fund-Institutional Shares. This agreement will not be terminated prior to May 1, 2016, and may be continued indefinitely by the Adviser on a year-to-year basis. 6 Whole Foods, the world’s largest retailer of natural foods, cut 40¢ off the value of each fund share, as its stock fell 19.8% from $39.44 to $31.65.
The company’s growth has slowed, and there was also some bad publicity, when New York City officials found that Whole Foods had overstated the . Quarterly Report • Q3 2015 weight of some freshly-packaged food, resulting in overcharges to customers. (The company immediately fixed the problem.) The stock is trading at its lowest valuation since 2009, so it’s on the bargain table. We expect it will move higher, as the company introduces initiatives to accelerate growth. Shares of Trimble Navigation sank 30%, from $23.46 to $16.42, slicing 34¢ off the value of each Parnassus Fund share. Trimble makes GPS positioning and precision measurement products that increase the efficiency of construction workers, farmers and truck drivers. The stock dropped after the company reported disappointing sales, as farmers coping with low crop prices aren’t investing in new technology, while its construction segment is struggling with declining demand from oil and gas customers.
A steep drop in new construction projects in China made things worse. The downturn has been deeper than we expected, but the cycle will eventually turn, and when it does, Trimble should benefit from increasing adoption of products that save customers time and money. Meanwhile, investors are overlooking an attractive recurring revenue stream from Trimble’s subscription-based engineering software, and strong growth from its trucking division.
With the stock trading at bargain-basement prices, we added to our position during the quarter. PARNASSUS FUNDS Parnassus Fund as of September 30, 2015 (percentage of net assets) Fund Sector Weightings* S&P 500 Index Consumer Discretionary 3.2% 13.3% Consumer Staples 6.4% 11.0% Energy 0.0% 6.8% Utilities 0.0% 3.0% Financials 19.3% 16.1% Health Care 7.1% 14.4% Industrials 12.5% 10.0% Materials 3.0% 2.8% Information Technology Potash Corporation saw its stock fall an astonishing 33.6% from $30.97 to $20.55, for a loss of 29¢ for each fund share. Low crop prices caused farmers to apply less potash, while international demand declined even more due to the falling value of many foreign currencies, which made potash more expensive. In addition, the uncertainty surrounding Potash Corporation’s $8.8 billion offer to acquire German potash producer K+S, which K+S rebuffed, hurt the stock.
While we don’t know when farmers will buy more potash, we know they eventually will, because the world needs to feed more people each day, and fertilizer is the best way to improve crop yields. We believe the stock is too cheap, and we expect it to rise along with potash demand. Meanwhile, Potash’s dividend yield is now above 7%, so we’ll be paid handsomely while we wait. 47.0% 20.3% Telecom Services 0.0% 2.3% Short-term Investments, Other Assets & Liabilities 1.5% 0.0% 0 10 20 30 40 50 60 * For purposes of categorizing securities for diversification requirements under the Investment Company Act, the Fund uses industry classifications that are more specific than those used for the chart. Portfolio characteristics and holdings are subject to change periodically. Now, onto happier subjects.
EZchip Semiconductor, a leading designer of network-processors used in data-centers, enterprisenetworks and telecommunications equipment, was our biggest winner as it soared an astonishing 57.6% from $15.96 to $25.16, adding 45¢ to each fund share. The stock rose sharply after EZchip announced several design wins for its long awaited, next generation NPS chips (an acronym for Network Processors for Smart networks). Then, on September 30, the stock jumped again as EZchip agreed to be acquired by Mellanox Technologies for $25.50 per share. Google, the Internet services giant, gained 18.2% on the A Shares from $540 to $638 during the quarter, adding 43¢ to the Fund’s NAV.
The stock rose sharply in July after management announced terrific financial results for the second quarter, and we sold half of our position at an average price of $680 to lock in some profits. Annual revenue growth, adjusted for exchange rate changes, accelerated to 18%, with strength especially evident in mobile search and YouTube. The company also demonstrated impressive expense control, which is a testament to new CFO Ruth Porat.
Also during the quarter, the company announced a major restructuring, which will result in more autonomy for Google’s non-core business lines. As a result, Google’s corporate name is now Alphabet, but analysts still refer to the company by its old, familiar moniker. Motorola Solutions, a provider of communications equipment for public safety workers, added 41¢ to the NAV, as its shares rose 19.3% from $57.34 to $68.38. In our last quarterly report, we described how the stock fell after a rumor surfaced that a sales process for Motorola had failed due to concerns that the company’s technology could become obsolete.
We researched these concerns, and concluded that new technology was an incremental opportunity, not a threat, so we held our position. Investor sentiment can be fickle and can change quickly. Sure enough, the stock regained all of its lost ground, and more, as 7 . PARNASSUS FUNDS Quarterly Report • Q3 2015 investor sentiment improved after Motorola reported another quarter of earnings that exceeded expectations. In addition, Motorola took advantage of its depressed valuation by repurchasing $2 billion worth of its shares. We continue to believe the future is bright for the company, and we’re holding onto our position. Outlook and Strategy (Note: This section applies to both the Parnassus Fund and the Parnassus Endeavor Fund.) The S&P 500’s impressive streak of ten consecutive quarters with positive returns has ended. It was a great run, but unfortunately stocks don’t go up in a straight line forever.
The U.S. economy has been one of the world’s best performing this year, but investors have become concerned that other countries are not faring as well, and could drag the U.S. down. In August, the People’s Bank of China devalued its currency, the yuan, by 2%.
While 2% may not seem like much to get excited about, it marked a change in policy from the gradual appreciation in the yuan that China had allowed since 2004. China’s economy weakened during the quarter, and devaluing the yuan was likely an attempt to spur exports. As the world’s second largest economy, China’s deceleration has dragged other countries down with it, hurting export demand for American companies. Declining foreign currencies have made a bad situation worse, because foreign revenue is now worth less when converted into U.S.
dollars. For years, China’s strong growth created an insatiable appetite for all types of commodities. Energy companies drilled more wells, miners expanded their production and farmers invested in new equipment to meet the burgeoning demand from China. Now that demand has slowed, the excess supply has caused commodity prices to drop sharply. In mid-September, the Federal Reserve decided not to raise its benchmark federal funds rate, because it was concerned that recent global economic and financial developments could restrain the U.S.
economy. Shortly after the quarter ended, its fears were confirmed, as the economy created 142,000 jobs in September, well below expectations of 201,000. While the U.S. economy is dealing with stiff international headwinds, it’s still growing.
In fact, the strong U.S. dollar and low commodity prices are actually tailwinds for the U.S. consumer, as their hard-earned dollars will go further because gas and imported goods have become less expensive.
Since consumer spending represents 70% of the economy, this should have a positive impact. We aren’t market-timers, and we don’t know if the next move for the market will be up or down, so we can’t pick the bottom. However, we’ve been successful at taking advantage of sell-offs and investing in great businesses trading at bargain prices. As the saying goes, our goal is to buy low and sell high. It sounds easy, but many investors are emotionally affected by a sell-off, which leads to panic-selling, pushing stock prices down further.
We hope to profit by buying and holding when prices are low. We didn’t sell any of our losers this quarter. Instead, in some situations, we invested more. We’re proud to note that two of the Parnassus Fund’s biggest winners this quarter, EZchip Semiconductor and Motorola Solutions, are both examples of stocks that declined earlier this year as investors overreacted to bad news or rumors, then bounced back to regain all of their lost ground, and more.
Our patience paid off in both cases, and we believe will pay off again with this quarter’s losers as well. Yours truly, Jerome L. Dodson Lead Portfolio Manager 8 Ian Sexsmith Portfolio Manager . Quarterly Report • Q3 2015 PARNASSUS FUNDS PARNASSUS CORE EQUITY FUND Ticker: Investor Shares - PRBLX Ticker: Institutional Shares - PRILX As of September 30, 2015, the NAV of the Parnassus Core Equity Fund-Investor Shares was $38.32. After taking dividends into account, the total return for the third quarter was a loss of 3.96%. This compares to losses of 6.43% for the S&P 500 Index (“S&P 500”) and 7.42% for the Lipper Equity Income Fund Average, which represents the average return of the equity income funds followed by Lipper (“Lipper average”). For the first nine months of 2015, the Fund posted a loss of 5.10%, which is better than losses of 5.27% and 7.90% for the S&P 500 and the Lipper average, respectively. Below is a table that summarizes the performance of the Fund, the S&P 500 and the Lipper average.
The returns are for the one-, three-, five- and ten-year periods ended September 30, 2015. For the ten-year period, the Parnassus Core Equity FundInvestor Shares has out-performed all the other 187 equity income funds followed by Lipper. (It placed #28 of 502 funds, #2 of 385 funds and #5 of 299 funds for the one-, three- and five-year periods, respectively.) Parnassus Core Equity Fund Average Annual Total Returns (%) Third Quarter Review One Year Three Years Five Years Ten Years Gross Expense Ratio Parnassus Core Equity Fund 0.88 Investor Shares 13.79 13.36 9.55 0.87 0.87 Parnassus Core Equity Fund 1.09 Institutional Shares 13.99 13.57 9.76 0.67 0.67 S&P 500 Index -0.61 12.39 13.32 6.79 NA NA Lipper Equity Income Fund Average -4.64 8.88 10.08 5.81 NA NA for periods ended September 30, 2015 Net Expense Ratio The average annual total return for the Parnassus Core Equity Fund-Institutional Shares from commencement (April 28, 2006) was 9.42%.
Performance shown prior to the inception of the Institutional Shares reflects the performance of the Parnassus Core Equity Fund-Investor Shares and includes expenses that are not applicable to and are higher than those of the Institutional Shares. The performance of the Institutional Shares differs from that shown for the Investor Shares to the extent that the classes do not have the same expenses. Performance data quoted represent past performance and are no guarantee of future returns.
Current performance may be lower or higher than the performance data quoted, and current performance information to the most recent month-end is available on the Parnassus website (www.parnassus.com). Investment return and principal value will fluctuate, so an investor’s shares, when redeemed, may be worth more or less than their original principal cost. Returns shown in the table do not reflect the deduction of taxes a shareholder may pay on fund distributions or redemption of shares. The S&P 500 is an unmanaged index of common stocks, and it is not possible to invest directly in an index.
Index figures do not take any expenses, fees or taxes into account, but mutual fund returns do. Before investing, an investor should carefully consider the investment objectives, risks, charges and expenses of the Fund and should carefully read the prospectus or summary prospectus, which contains this and other information. The prospectus or summary prospectus can be obtained on the Parnassus website or by calling (800) 999-3505. The Fund acted as we expected during the quarter, as its 3.96% loss was considerably less severe than the S&P 500’s 6.43% drop. By capturing only 61% of the index’s loss, the Fund beat its benchmark by 247 basis points (a basis point is 1/100th of 1%). For more than a decade, this type of downside protection has been a hallmark of the Parnassus Core Equity Fund, and we’re hopeful that it will continue to perform like this in future stock market corrections. The Fund’s sector allocations had a positive impact on performance, relative to the index.
The largest positive came from having minimal exposure to the worst-performing sector in the benchmark: energy. Our significant overweight in consumer staples stocks was our second best allocation decision, as that group held up well during the market’s recent swoon. The only allocation decision that had a meaningfully negative impact was our underweight position in consumer discretionary stocks, which performed well during the quarter. While stock selection was a source of strength for us during the quarter, we still had three positions that reduced the NAV by 23¢ or more.
Our biggest loser was Pentair, a diversified industrial company with leading positions in pumps, filters, valves and thermal solutions. The stock subtracted 38¢ from each Fund share, as it dropped 25.8% from $68.75 to $51.04. The stock fell after the company’s management reduced its 2015 earnings outlook for the third time this year, with earnings now expected to decline 9% on an annual basis. The company cited notable weakness in commodity-driven markets and a slowdown in 9 .
PARNASSUS FUNDS Quarterly Report • Q3 2015 China. Despite this dour near-term outlook, we’re holding onto the shares. We think that the company is taking prudent cost-reduction measures to weather the current downturn. Furthermore, when demand for Pentair’s products eventually rebounds, we expect the company’s earnings and stock price to increase substantially. National Oilwell Varco (NOV), which sells equipment and technology to help companies drill wells safely in complex geological formations, trimmed 26¢ off the Fund’s NAV, as its stock dropped 22.0% from $48.28 to $37.65.
The company’s oil and gas customers continue to cancel drilling programs due to depressed energy prices, which means lower revenue and earnings for NOV. We don’t know when oil and gas prices will rebound, but we are certain that NOV has one of the best competitive positions, strongest balance sheets and experienced management teams in the entire energy sector. We expect the company to navigate successfully the current downturn, and to emerge a stronger and more profitable business over the long-term. Parnassus Core Equity Fund as of September 30, 2015 (percentage of net assets) Fund Sector Weightings* S&P 500 Index Consumer Discretionary 4.8% 13.3% Consumer Staples 18.5% 11.0% Energy 2.6% 6.8% Utilities 4.9% 3.0% Financials 5.5% 16.1% Health Care 12.0% 14.4% Industrials Applied Materials, the semiconductor-manufacturing equipment maker, fell 23.6% from $19.22 to $14.69, trimming the NAV by 23¢.
The stock dropped due to fears that customers may spend less money than expected on chip-manufacturing equipment in 2015. Intel, one of Applied Materials’ largest customers, announced in July that it would delay its transition from 14 nanometer (NM) to 10 NM chips. This decision will mean less near-term demand for Applied Materials’ tools. Later in the quarter, fears about a global economic slowdown, especially in China, raised concerns that several of the company’s other customers also may trim orders.
While we acknowledge that Applied Materials’ earnings could be disappointing for a few more quarters, the company’s longer-term prospects are still bright. Because we think the stock is trading at bargain levels, we added to the position during the quarter. Our three biggest winners added at least 13¢ to the NAV. Motorola Solutions, a provider of communications equipment for public safety workers, added 35¢ to the NAV as its shares rose 19.3%, from $57.34 to $68.38.
In our most recent quarterly report, we described how Motorola fell in the first half of the year due to concerns that the company’s technology could become obsolete. We researched this issue extensively, and concluded that technological change is an opportunity for Motorola, not a threat. Based on this research, we increased our position in the stock.
Shortly thereafter, Motorola regained all of its lost ground and more, as investors cheered a stellar earnings report. 19.2% 10.0% Materials 4.0% 2.8% Information Technology 25.5% 20.3% Telecom Services 0.0% 2.3% Short-term Investments, Other Assets & Liabilities 3.0% 0.0% 0 5 10 15 20 25 30 * For purposes of categorizing securities for diversification requirements under the Investment Company Act, the Fund uses industry classifications that are more specific than those used for the chart. Portfolio characteristics and holdings are subject to change periodically. The shares of Google, the Internet services giant, gained 16.9% on the C Shares from $520 to $608 during the quarter, adding 22¢ to the Fund’s NAV. The stock rose sharply in July, after management announced terrific financial results for the second quarter. Annual revenue growth, adjusted for exchange rate changes, accelerated to 18%, with strength especially evident in mobile search and YouTube.
The company also demonstrated impressive expense control, a testament to new CFO Ruth Porat. Also during the quarter, the company announced a major restructuring, which will result in more autonomy for Google’s non-core business lines. As a result of this change, Google’s corporate name is now Alphabet. AGL Resources, a fund holding dating back to the 1990’s, soared 31.1% during the quarter from $46.56 to $61.04, boosting the NAV by 13¢.
In late August, utility giant Southern Co. agreed to buy AGL Resources for $8 billion in cash or $66 per share. The acquirer, a utility with significant coal assets, paid a huge premium for AGL Resources’ more environmentallyfriendly natural gas assets.
While we’ll miss AGL Resources, the purchase price reflects full value for the stock, so we’re happy with the deal. 10 . Quarterly Report • Q3 2015 PARNASSUS FUNDS Outlook and Strategy This past quarter witnessed the worst stock market performance since the summer of 2011. The two main culprits seem to have been evidence of a slowdown in China and the Federal Reserve’s decision to forgo an increase in interest rates. Low rates are normally good for stocks, but in this case the Fed’s inaction was a bearish signal to the market, since it supported the idea that the global economy is slowing. September saw marked weakness in biotechnology and pharmaceutical stocks, as politicians and journalists expressed concerns about egregious price hikes for certain therapies. Thankfully, we reduced our exposure to drug-related stocks during the second quarter as part of a risk management exercise.
This move proved timely, and helped the Fund avoid a more severe loss. While the overall portfolio composition didn’t change much during the quarter, we do have two new holdings. The first is PayPal, which the Fund received as the result of a spin-out from its former parent company, eBay. We think the newly independent PayPal has terrific growth prospects, as the company works hard to become more relevant to merchants and consumers.
We also think that eBay will benefit from the spin-out, since management now can focus all of its attention on improving its online marketplace, and not be distracted by the payments business. The second new addition to the Fund is Intel, the well-known maker of semiconductors. We bought Intel in July after it had dropped 20% on a year-to-date basis. This weakness resulted in an attractive price-to-earnings (PE) multiple of 13x and a generous 3.3% dividend yield.
While Intel is best known for chips designed for personal computers, we’re more interested in its data center group (DCG) business, which now represents over 50% of earnings. The proliferation of data-hungry applications offered by Google, Facebook, Uber, Alibaba and others has placed unprecedented demands on data centers. Intel’s DCG chips enable data centers to satisfy these demands in a fast and energy-efficient manner. Over the long-term, we expect Intel’s DCG earnings growth to more than offset any softness related to its mature PC business. While we were buying Intel, we were selling one of its competitors, Qualcomm.
This latter stock was a long-term investment that didn’t live up to our expectations, despite the company’s enviable competitive position and strong secular tailwinds. We sold Qualcomm because we think the company’s best days are probably behind them. So far, the Intel-for-Qualcomm swap has been a good move, as Intel is up modestly from our average cost, and Qualcomm has gone down since we sold it. At quarter-end, the Fund had very little exposure compared to the S&P 500 to three highly cyclical sectors: financials, consumer discretionary and energy.
On a combined basis, the portfolio had less than 15% invested in these sectors, compared to 37% for the benchmark. Since these sectors tend to perform poorly in bear markets, these underweights contribute to an overall defensive posture for the Fund. Somewhat mitigating this defensiveness is the portfolio’s 19% exposure to the cyclical industrials sector, which only represents 10% of the index.
Overall, we would expect the Fund to hold up relatively well, if the weakness in the third quarter continues for the rest of 2015. And because our companies have great business prospects and reasonable valuations, we believe the fund is positioned to outperform its index if the market takes off again. Thank you for your confidence in us and your investment in the Parnassus Core Equity Fund. Todd C. Ahlsten Lead Portfolio Manager Benjamin E.
Allen Portfolio Manager 11 . PARNASSUS FUNDS Quarterly Report • Q3 2015 PARNASSUS ENDEAVOR FUND Ticker: Investor Shares - PARWX Ticker: Institutional Shares - PFPWX As of September 30, 2015, the NAV of the Parnassus Endeavor Fund-Investor Shares was $29.05, so the total return for the quarter was a loss of 7.28%. This compares to a loss of 6.43% for the S&P 500 Index (“S&P 500”) and a loss of 8.03% for the Lipper Multi-Cap Core Average, which represents the average return of the multi-cap core funds followed by Lipper (“Lipper average”). For the quarter, then, we underperformed the S&P 500, but we beat the Lipper average. It was a very difficult quarter for the Fund, and for the stock market as a whole. Parnassus Endeavor Fund Average Annual Total Returns (%) Gross Net Expense Expense Ratio Ratio One Year Three Years Five Years Ten Years Parnassus Endeavor Fund Investor Shares 4.14 15.43 14.85 11.20 1.02 0.95 Parnassus Endeavor Fund Institutional Shares 4.25 15.47 14.87 11.21 0.87 0.83 S&P 500 Index -0.61 12.39 13.32 6.79 NA NA Lipper Multi-Cap Core Average -2.16 11.81 11.48 5.91 NA NA for periods ended September 30, 2015 The average annual total return for the Parnassus Endeavor Fund-Institutional Shares from commencement (April 30, 2015) was -6.28%.
Performance shown prior to the inception of the Institutional Shares reflects the performance of the Parnassus Endeavor Fund-Investor Shares and includes expenses that are not applicable to and are higher than those of the Institutional Shares. The performance of the Institutional Shares differs from that shown for the Investor Shares to the extent that the classes do not have the same expenses. Performance data quoted represent past performance and are no guarantee of future returns.
Current The big loss for the quarter pulled the Fund into negative territory for the year, so we’re down 3.01% for the year-to-date. Although it may be small comfort, we are down less than the S&P 500 (down 5.27%) and the Lipper average (down 6.34%). However, if we look beyond the current quarter, things look great. To the left you will find a table that compares the Fund with the S&P 500 and the Lipper average for the past one-, three-, five- and ten-year periods.
You will see that the Fund has beaten both benchmarks for all time periods. Most remarkable is the fact that for the ten-year period, the Fund has far outperformed both indices gaining an average of 11.20% per year, compared to 6.79% for the S&P 500 and 5.91% for the Lipper average. The Fund has beaten the S&P 500 by over four percentage points per year, and this performance has made the Parnassus Endeavor Fund the best-performing of the 360 multi-cap core funds followed by Lipper for the past ten years. (It placed #33 of 744 funds, #38 of 650 funds and #16 of 571 funds for the one-, three- and five-year periods, respectively.) performance may be lower or higher than the performance data quoted.
Current performance information to the most recent month-end is available on the Parnassus website Company Analysis (www.parnassus.com). Investment return and principal value will fluctuate, so an investor’s Most of the companies in the portfolio had a bad quarter, but there were four that hurt us the most, with each accounting for losses of 20¢ or more on the NAV. Applied Materials, the largest maker of equipment used to produce semiconductors, sliced 35¢ off the NAV, as its stock sank 23.6% from $19.22 to $14.69.
Intel, one of the company’s biggest customers, announced a delay in moving from 14 nanometer chips to 10 nanometer chips, and this meant that Intel would defer new orders for equipment. Adding to the Intel situation were concerns about a global economic slowdown – especially in China – that would mean a lot less business for Applied Materials. shares, when redeemed, may be worth more or less than their original principal cost. Returns shown in the table do not reflect the deduction of taxes a shareholder may pay on fund distributions or redemption of shares.
The S&P 500 Index is an unmanaged index of common stocks, and it is not possible to invest directly in an index. Index figures do not take any expenses, fees or taxes into account, but mutual fund returns do. Before investing, an investor should carefully consider the investment objectives, risks, charges and expenses of the Fund and should carefully read the prospectus or summary prospectus, which contains this and other information. The prospectus or summary prospectus can be obtained on the Parnassus website or by calling (800) 999-3505.
As described in the Fund’s current prospectus dated May 1, 2015, Parnassus Investments has contractually agreed to limit total operating expenses to 0.95% of net assets for the Parnassus Endeavor Fund-Investor Shares and to 0.83% of net assets for the Parnassus Endeavor Fund-Institutional Shares. This agreement will not be terminated prior to May 1, 2016, and may be continued indefinitely by the Adviser on a year-to-year basis. 12 Whole Foods, the world’s largest retailer of natural foods, cut 28¢ off the value of each fund share, as . Quarterly Report • Q3 2015 its stock fell 19.8% from $39.44 to $31.65. The company’s growth has slowed, and there was also some bad publicity, when New York City officials found that Whole Foods had overstated the weight of some freshly-packaged food, resulting in an overcharge to customers. (The company immediately fixed the problem.) The stock is trading at its lowest valuation since 2009, so it’s on the bargain table. We expect the stock will move higher, as the company continues to open new stores. Tractor-maker Deere & Co.
sliced 24¢ off the NAV, as its stock declined 23.8% from $97.05 to $74. The stock dropped after management announced weaker than expected full-year guidance in late August, citing weak farm-equipment demand and excess inventory. Despite the recent weakness, we continue to believe that Deere is a resilient, high-quality business, and the stock will recover in the longer term. Qualcomm, a major designer and producer of smartphone chips, knocked 20¢ off the value of each fund share, as its stock dropped 14.2% from $62.63 to $53.73.
The stock dropped after investors became pessimistic about the company’s position compared to lowerpriced Chinese competitors. There was also concern about the percentage of the business concentrated in Apple and Samsung. Historically, Qualcomm has been able to recover from competitive pressures by innovating and introducing better chipsets. We think the company should be able to do this again.
The early feedback on its latest product, the Snapdragon 820, has been positive, and Samsung has recently improved its outlook for September production based on that product. Qualcomm has also announced a major restructuring and is evaluating splitting its chip business from its licensing unit. There was only one stock that contributed more than 20¢ to the NAV during the quarter. Google, the Internet services giant, added 22¢ to each fund share, as its stock rose 18.2% on the A Shares from $540 to $638.
The stock took off in July, after management announced terrific financial results for the second quarter, with annual revenue growth accelerating to 18% fueled by strength in mobile search and YouTube. The company also demonstrated impressive expense control under Ruth Porat, the new chief financial officer. The company also announced a major restructuring, resulting in more autonomy for the non-core business lines. As a result of this change, Google’s corporate name is now “Alphabet,” but most people still call the company “Google.” PARNASSUS FUNDS Parnassus Endeavor Fund as of September 30, 2015 (percentage of net assets) Fund Sector Weightings* S&P 500 Index Consumer Discretionary 1.7% 13.3% Consumer Staples 6.5% 11.0% Energy 0.0% 6.8% Utilities 0.0% 3.0% Financials 12.6% 16.1% Health Care 8.1% 14.4% Industrials 14.8% 10.0% Materials 0.0% 2.8% Information Technology 53.8% 20.3% Telecom Services 0.0% 2.3% Short-term Investments, Other Assets & Liabilities 2.5% 0.0% 0 10 20 30 40 50 60 * For purposes of categorizing securities for diversification requirements under the Investment Company Act, the Fund uses industry classifications that are more specific than those used for the chart. Portfolio characteristics and holdings are subject to change periodically. Yours truly, Jerome L.
Dodson Portfolio Manager 13 . PARNASSUS FUNDS Quarterly Report • Q3 2015 PARNASSUS MID CAP FUND Ticker: Investor Shares - PARMX Ticker: Institutional Shares - PFPMX As of September 30, 2015, the NAV of the Parnassus Mid Cap Fund-Investor Shares was $25.86, so the total return for the quarter was a loss of 5.07%. This compares to a loss of 8.01% for the Russell Midcap Index (“Russell”) and a loss of 9.26% for the Lipper Mid-Cap Core Average, which represents the average mid-cap core fund followed by Lipper (“Lipper average”). For the year-to-date, we are ahead of both the Russell and the Lipper average, as we have posted a loss of 5.62%, compared to a loss of 5.84% for the Russell and a loss of 6.56% for the Lipper average. Parnassus Mid Cap Fund Average Annual Total Returns (%) for periods ended September 30, 2015 One Year Three Years Five Years Ten Years Gross Net Expense Expense Ratio Ratio Parnassus Mid Cap Fund Investor Shares 0.89 11.35 12.85 8.73 1.09 0.99 Parnassus Mid Cap Fund Institutional Shares 1.08 11.42 12.90 8.75 0.94 0.85 Russell Midcap Index -0.25 13.91 13.40 7.87 NA NA Lipper Mid-Cap Core Average -1.68 12.00 11.31 6.50 NA NA The average annual total return for the Parnassus Mid Cap Fund-Institutional Shares from commencement (April 30, 2015) was -6.06%. Performance shown prior to the inception of the Institutional Shares reflects the performance of the Parnassus Mid Cap Fund-Investor Shares and includes expenses that are not applicable to and are higher than those of the Institutional Shares.
The performance of the Institutional Shares differs from that shown for the Investor Shares to the extent that the classes do not have the same expenses. Performance data quoted represent past performance and are no guarantee of future returns. Current performance may be lower or higher than the performance data quoted.
Current performance information to the most recent month-end is available on the Parnassus website (www.parnassus.com). Investment return and principal value will fluctuate so that an investor’s shares, when redeemed, may be worth more or less than their original principal cost. Returns shown in the table do not reflect the deduction of taxes a shareholder may pay on fund distributions or redemption of shares. The Russell Midcap Index is an unmanaged index of common stocks, and it is not possible to invest directly in an index.
Index figures do not take any expenses, fees or taxes into account, but mutual fund returns do. Mid-cap companies can be more sensitive to changing economic conditions and have fewer financial resources than large-cap companies. Before investing, an investor should carefully consider the investment objectives, risks, charges and expenses of the Fund and should carefully read the prospectus or summary prospectus, which contains this and other information. The prospectus or summary prospectus can be obtained on the Parnassus website or by calling (800) 999-3505.
As described in the Fund’s current prospectus dated May 1, 2015, Parnassus Investments has contractually agreed to limit total operating expenses to 0.99% of net assets for the Parnassus Mid Cap Fund-Investor Shares and to 0.85% of net assets for the Parnassus Mid Cap Fund-Institutional Shares. This agreement will not be terminated prior to May 1, 2017, and may be continued indefinitely by the Adviser on a year-to-year basis. 14 To the left is a table comparing the Parnassus Mid Cap Fund with the Russell and the Lipper average for the one-, three-, five- and ten-year periods. Third Quarter Review The Fund performed relatively well this quarter, as its 5.07% loss was far less than the Russell’s 8.01% fall and the Lipper’s 9.26% drop. It’s never fun to lose money, but we’re pleased that our strategy went down 40% less than the Russell during this correction. As usual, our stock selection was the main driver of the Fund’s performance relative to the index. That said, the Fund also benefitted from having minimal exposure to the worst-performing sector in the benchmark, energy.
Our underweight position in the financial sector hurt performance, because this sector went down only half as much as the Russell during the quarter. The Fund’s worst stock performer was Pentair, a diversified industrial company with a leading position in pumps, filters, valves and thermal solutions. The stock dropped 25.8% from $68.75 to $51.04, subtracting 25¢ from each fund share. The stock fell after management reduced earnings expectations for the third time this year. Earnings are now expected to fall by about 10% on an annual basis, because of the soft oil and gas market and slowing global industrial growth.
The near-term outlook is murky, but we are holding onto our shares, because the stock is attractively valued. Management is cutting costs, and earnings should snap back quickly, once the industrial and energy end-markets rebound. Applied Materials (AMAT), the semiconductormanufacturing equipment giant, fell 23.6% from $19.22 to $14.69 and trimmed the NAV by 19¢. In July, Intel announced that it will be moving more slowly than expected in utilizing nextgeneration 10 nanometer chips. Since Intel is a major AMAT client and industry leader, this .
Quarterly Report • Q3 2015 means that there will be lower-than-expected near-term demand for AMAT’s tools. As the quarter progressed, fears about an economic slowdown, especially in China, raised concerns that several of AMAT’s other customers would trim orders. While we acknowledge that AMAT’s earnings may disappoint in the near-term, the company’s longer-term prospects are bright, given evolving semi-conductor manufacturing needs, the company’s leading market position and the stock’s attractive valuation. PARNASSUS FUNDS Parnassus Mid Cap Fund as of September 30, 2015 (percentage of net assets) Fund Sector Weightings Russell Midcap Index Consumer Discretionary 7.1% 17.3% Sotheby’s, the leading international auctioneer of fine art, decorative art and jewelry, fell 29.3% from $45.24 to $31.98 for a loss of 15¢ per fund share. The stock dropped after the company reported disappointing earnings in early August, as a large contemporary art collection offering was delayed and internal expenses came in higher than expected.
The stock slid further, as investors worried that the slowdown in the Chinese economy would hurt demand for fine art. Although we admire the company’s global brand, we reduced our exposure due to concerns over the company’s growing debt burden and shrinking profits. Consumer Staples The Fund’s biggest winner was Motorola Solutions, a provider of communications equipment for public safety workers and enterprises. The stock added 19¢ to the NAV, as its shares rose 19.3%, from $57.34 to $68.38. In our last quarterly report, we described how the stock fell after a rumor surfaced that a sales process for Motorola had failed, due to concerns that the company’s technology could become obsolete.
We researched these concerns, and concluded that new technology was an incremental opportunity, not a threat, so we held our position. Sure enough, the stock rebounded sharply during the quarter, as management reported good quarterly earnings, and private equity firm Silver Lake Partners invested $1 billion in the company. In addition, management took advantage of the stock’s depressed valuation by repurchasing $2 billion of the company’s shares.
We continue to believe the future is bright for Motorola, and we’re holding onto our position. Materials 5.3% 6.3% Energy 2.7% 5.0% Utilities 8.2% 5.7% Financials 16.9% 22.9% Health Care 12.4% 9.5% Industrials 18.7% 12.0% 7.1% 5.4% Information Technology 16.0% 14.6% Telecom Services 0.0% 1.3% Short-term Investments, Other Assets & Liabilities 5.6% 0.0% 0 10 20 30 40 Portfolio characteristics and holdings are subject to change periodically. AGL Resources (AGL), a natural gas utility with operations across seven states, soared 31.1% during the quarter from $46.56 to $61.04, adding 18¢ to NAV. In late August, utility giant Southern Co. agreed to buy AGL for $8 billion in cash, or $66 per share.
Southern Co., a utility with significant coal assets, paid a huge premium for AGL’s cleaner-energy natural gas assets. While we will miss AGL Resources, the deal reflects full value for the stock, so we’re happy about this transaction. Cameron International, an industry leader of drilling and safety equipment used by energy operators, surged 17.1% from $52.37 to $61.32 for a gain of 11¢ per fund share. The company agreed to a cash and stock offer valued at more than $66 per share from Schlumberger, the world’s largest oil services firm. We believe that the deal makes sense, as it extends Cameron’s global reach and creates a more integrated technology platform to drive growth.
We reduced our position after the deal was announced, because the stock was fully-valued and we didn’t expect a higher bid to emerge. Outlook and Strategy This quarter’s drop was the Russell’s largest since 2011. Investors were scared by China’s economic slowdown, because it’s the world’s biggest importer of many raw materials and an important growth market for many American companies. To make matters worse, when the Federal Reserve chose not to raise its target interest rate in mid-September, investors speculated that the economy was in worse shape than expected. Despite the quarter’s correction, the Russell is still up 214% since the trough of March 2009, which is an annualized return of over 20%.
Mid-cap stocks aren’t particularly cheap either, with the index trading at almost 19 times forward earnings estimates. Since stock valuations remain high relative to historical standards, we’re keeping a close eye on our portfolio companies’ downside risk. 15 . PARNASSUS FUNDS Quarterly Report • Q3 2015 During the market turmoil, we added capital to a few existing portfolio companies and bought a new stock, Axalta Coatings Systems. The company is one of the world’s leading manufacturers of industrial coatings used in automobiles, trucks and industrial applications. The stock recently fell to an attractive price, because investors were concerned about currency headwinds and a potential slowdown in global auto production. They might be right in the near-term, but the longer-term earnings trajectory is intact, driven by global growth, share gains and cost cutting.
Downside risk is also limited, because Axalta has a sturdy competitive moat, which comes from customers’ high switching costs, strong buying power for raw materials and a premium brand. We also like the company’s light capital requirements and robust free cash flow generation. We’re limiting the Fund’s exposure in sectors that would be most negatively impacted if the economy slows. Relative to the index, we have fewer consumer and financial stocks.
Our largest concentration of stocks, as of the quarter-end, was in the industrial sector. As we’ve highlighted in some of our previous reports, a number of our holdings in this sector are less cyclical business service companies with significant recurring revenues and cash flows, which will enable them to weather weak economic periods. We continue to own a collection of businesses that we expect to outperform the market over the long-run by participating strongly in bull markets, providing excellent protection in bear markets and avoiding permanent capital losses in all market conditions. Thank you for your investment in the Parnassus Mid Cap Fund. Yours truly, Matthew D. Gershuny Lead Portfolio Manager 16 Lori A.
Keith Portfolio Manager . Quarterly Report • Q3 2015 PARNASSUS FUNDS PARNASSUS ASIA FUND Ticker: Investor Shares - PAFSX Ticker: Institutional Shares - PFPSX As of September 30, 2015, the NAV of the Parnassus Asia Fund-Investor Shares was $13.77, so the total return for the quarter was a loss of 18.08%. This compares to a loss of 14.55% for the MSCI AC Asia Pacific Index (“MSCI Index”) and a loss of 13.49% for the Lipper Asia Pacific Region Average, which represents the average return of the Asia Pacific Region funds followed by Lipper (“Lipper average”). The primary reason for our underperformance was our China-related investments, which we will discuss below. Parnassus Asia Fund Average Annual Total Returns (%) One Year Since Inception on 4/30/13 Gross Expense Ratio Net Expense Ratio Parnassus Asia Fund Investor Shares -16.92 -3.06 3.53 1.25 Parnassus Asia Fund Institutional Shares -16.80 -2.98 3.48 1.22 MSCI AC Asia Pacific Index -9.36 -2.78 NA NA Lipper Asia Pacific Region Average -9.91 -3.61 NA NA for periods ended September 30, 2015 The average annual total return for the Parnassus Asia Fund-Institutional Shares from commencement (April 30, 2015) was -23.00%. Performance shown prior to the inception of the Institutional Shares reflects the performance of the Parnassus Asia Fund-Investor Shares and includes expenses that are not applicable to and are higher than those of the Institutional Shares.
The performance of the Institutional Shares differs from that shown for the Investor Shares to the extent that the classes do not have the same expenses. Performance data quoted represent past performance and are no guarantee of future returns. Current performance may be lower or higher than the performance data quoted.
Current performance information to the most recent month-end is available on the Parnassus website (www.parnassus.com). Investment return and principal value will fluctuate, so an investor’s shares, when redeemed, may be worth more or less than their original principal cost. Returns shown in the table do not reflect the deduction of taxes a shareholder may pay on fund distributions or redemption of shares. The MSCI AC Asia Pacific Index is an unmanaged index of Asian stock markets, and it is not possible to invest directly in an index.
Index figures do not take any expenses, fees or taxes into account, but mutual fund returns do. This Fund invests primarily in non-U.S. securities. Foreign markets can be more volatile than the U.S.
market due to increased risks of adverse issuer, political, regulatory, market or economic developments and can perform differently from the U.S. market. Before investing, an investor should carefully consider the investment objectives, risks, charges and expenses of the Fund and should carefully read the prospectus or summary prospectus, which contains this and other information. The prospectus or summary prospectus can be obtained on the Parnassus website or by calling (800) 999-3505.
As described in the Fund’s current prospectus dated May 1, 2015, Parnassus Investments has contractually agreed to limit the total operating expenses to 1.25% of net assets for the Parnassus Asia Fund-Investor Shares and to 1.22% of net assets for the Parnassus Asia Fund-Institutional Shares. This agreement will not be terminated prior to May 1, 2016, and may be continued indefinitely by the Adviser on a year-to year basis. The third quarter of 2015 was a terrible quarter for the Parnassus Asia Fund. We lagged behind both of our benchmarks by a wide margin, trailing the MSCI Index by almost four percentage points and the Lipper average by a little over four-and-a-half percentage points.
Regrettably, losses this quarter also offset the Fund’s strong early record. We are now behind the MSCI Index for the period since inception, although we remain slightly ahead of the Lipper average since the Fund’s launch on April 30, 2013. Company Analysis Unfortunately, five companies each knocked 14¢ or more from the NAV, while no company gained as much as 14¢. The Fund’s worst performer during the quarter was Hermes Microvision, a Taiwan-based maker of semiconductor-manufacturing equipment. Hermes reduced the value of each fund share by 31¢, as its stock price dropped 41.2% from $64.77 to $38.05. The company develops and markets electron beam (E-beam) inspection tools for semiconductor-manufacturers for use in testing for defects in silicon wafers.
Although Hermes again posted strong growth in revenue and profits during the quarter, its stock price crashed, when management sharply lowered its sales guidance for the rest of the year. The company saw its customers delay orders for equipment due to weak demand for personal computers and Android smartphones – and the chips used to build them. Hermes’s E-beam technology remains the best in the industry and continues to gain market share from older optical inspection methods. We previously trimmed our position, but reversed course and added to our stake following the share price correction, which we believe was overdone. Lenovo decreased the Fund’s NAV by 19¢, as its stock price plummeted 38.9% from $1.38 to $0.85. Lenovo makes personal computers (PCs) and other technology products and is the number one 17 .
PARNASSUS FUNDS Quarterly Report • Q3 2015 brand in China and the largest PC manufacturer in the world. Global PC shipments declined 11% as resellers destocked, and end customers postponed purchases before the launch of Microsoft Windows 10. The company also incurred losses in its smartphone division due to intensified competition in China and macroeconomic weakness in Latin America. To address the company’s sagging profitability, management announced a restructuring program that would streamline its mobile phone portfolio and make the company more cost-competitive.
Lenovo makes excellent products and continues to gain market share, so we held on to our stock, which appears attractive at current prices. Parnassus Asia Fund as of September 30, 2015 (percentage of net assets) Fund Sector Weightings* MSCI AC Asia Pacific Index Consumer Discretionary 14.7% 13.4% Consumer Staples 6.0% 6.8% Energy The stock of Television Broadcast fell 43.8% from $5.94 to $3.34 for a loss of 19¢ for each fund share. The Hong Kong-based company is one of the largest producers and distributors of Chinese-language programming content in the world. Advertisers spent less money buying airtime on the company’s networks, especially compared to 2014, when the company benefitted from broadcasting the World Cup soccer tournament.
Businesses also cut back on advertising expenditures since fewer overnight visitors from China’s mainland meant fewer potential customers to sell to. Television Broadcast’s dominant market position was also threatened, when video-streaming provider Netflix announced it would enter Hong Kong and other Asian markets in 2016. The business is highly profitable, however, and management remains committed to returning cash to shareholders.
The stock generates a current dividend yield of over 10%, highlighting the company’s undervaluation. Alibaba Group sliced 15¢ off the NAV, as its stock price tanked 28.3% from $82.27 to $58.97. Based in China, Alibaba is the world’s largest online and mobile commerce company by sales volume. Its major marketplaces – Taobao, Tmall, and Juhuasuan – together generated gross merchandise volume of $361 billion last year, more than Amazon and eBay combined.
The company’s stock price fell, as macroeconomic turmoil dampened the pace of consumer spending in China. Moreover, an influential investment newspaper came out with a negative cover story on the company, which hurt investor sentiment. Despite shortterm pressures, Alibaba is uniquely positioned for growth opportunities in e-commerce, cloud computing and mobile advertising, so we added to our position at cheaper valuations. The stock of China Minsheng Bank fell 29.2% from $1.31 to $0.93, cutting 14¢ off the Fund’s NAV.
The bank was founded in 1996 as one of China’s first privately controlled financial institutions and has thrived by lending to small entrepreneurs and businesses. Unlike its larger competitors, China Minsheng Bank is not owned by the Chinese government, so they can make lending decisions based on market principles rather than on policy guidance. Nevertheless, the bank was hit by an increase in bad debts and overdue loans, primarily from large companies in the energy and transportation sectors.
Management pointed out that small and micro-loans appeared stable, but uncertainties in the macro economy and the volatile stock market caused a sell-off in the shares. 0.0% 2.7% Utilities 3.1% 3.5% Financials 11.4% 29.8% Health Care 0.0% 5.2% Industrials 11.9% 12.9% Materials 0.8% 6.1% Information Technology 42.3% 14.0% Telecom Services 3.1% 5.6% Short-term Investments, Other Assets & Liabilities 6.7% 0.0% 0 10 20 30 40 50 * For purposes of categorizing securities for diversification requirements under the Investment Company Act, the Fund uses industry classifications that are more specific than those used for the chart. Portfolio characteristics and holdings are subject to change periodically. Parnassus Asia Fund Portfolio Composition by Country as of September 30, 2015 (percentage of net assets) Fund Australia China Hong Kong Indonesia Japan Philippines Singapore South Korea Taiwan Thailand 3.1% 19.9% 19.4% 4.0% 18.3% 3.1% 3.8% 4.4% 14.9% 2.4% 93.3% Parnassus considers companies that do a substantial amount of business in Asia to be Asian companies. 18 . Quarterly Report • Q3 2015 PARNASSUS FUNDS Outlook and Strategy The economic crisis in China was the main force driving the Fund’s underperformance this quarter. While China’s growth has been steadily declining for years, new data showing contraction in everything from factory production to consumer activity triggered fears that the economy was headed for a hard landing. The market’s reaction was swift and brutal. Mainland Chinese stock markets, which rose spectacularly through the first half of the year, collapsed over 40% from the peak on the Shanghai Stock Exchange Composite index, and sank 50% from the peak on the technology-heavy Shenzhen index. China’s central government tried to rescue the markets from meltdown but bungled the response.
It barred major investors from selling shares, and suspended trading in hundreds of companies representing nearly half of the listed stocks on both exchanges. In August, the People’s Bank of China devalued the nation’s currency without explanation, and then was forced to spend a record $100 billion in foreign reserves in a single month to halt further yuan depreciation. The intervention backfired, since they fueled suspicions that China’s underlying economy was faring worse than originally believed. Ultimately, China’s woes pushed the markets and currencies of many other Asian countries long reliant on Chinese demand into a tailspin.
Of the 13 Asian markets we track, every single one ended the quarter in negative territory, with 11 recording losses in the double-digits. In our previous shareholder letter, we flagged the risk associated with China’s stock market bubble, but the precautions we took didn’t go far enough. We had no investments in Chinese stocks listed on the local Shanghai and Shenzhen exchanges, the stock markets that were bid up to unsustainable levels. Instead, we participated in China’s growth through companies listed in Hong Kong or the U.S., which have higher standards of transparency and corporate governance.
We also targeted companies that operated in China’s service economy rather than the manufacturing one, since spending by the Chinese consumer is at a low level and should expand over the decades ahead. Unfortunately, investors dump stocks indiscriminately in times of panic, and our China-related investments were hard hit in the downward spiral. The market’s volatility this quarter has prompted a lot of soul-searching in terms of how we invest abroad. We know that emerging markets can offer superior returns for the patient investor, but the path to get there is often very bumpy.
We remain committed to investing in high-quality companies that are temporarily undervalued, but we need to be even more disciplined in terms of the price at which we buy or sell our stocks, to reflect the risks inherent in international investing. We are sorely disappointed in the performance of the Fund this quarter and will work hard to do better going forward. One silver lining, however, is that there are more bargains in the portfolio and more in the marketplace today. Many stocks across the region are trading at levels not seen since the depths of the 2008 global financial crisis.
While no one can predict whether the market has truly bottomed, for long-term shareholders, it could be an exciting time to invest. Yours truly, Jerome L. Dodson Lead Portfolio Manager Billy J. Hwan Portfolio Manager 19 .
PARNASSUS FUNDS Quarterly Report • Q3 2015 PARNASSUS FIXED INCOME FUND Ticker: Investor Shares - PRFIX Ticker: Institutional Shares - PFPLX As of September 30, 2015, the NAV of the Parnassus Fixed Income Fund-Investor Shares was $16.57, producing a gain for the quarter of 1.01% (including dividends). This compares to a gain of 1.23% for the Barclays U.S. Aggregate Bond Index (“Barclays Aggregate Index”) and a gain of 0.68% for the Lipper A-Rated Bond Fund Average, which represents the average return of the Arated bond funds followed by Lipper (“Lipper average”). Through the first three quarters of 2015, the Fund posted a gain of 1.10%, as compared to a gain of 1.13% for the Barclays Aggregate Index and a loss of 0.27% for the Lipper average. Parnassus Fixed Income Fund Average Annual Total Returns (%) Gross Net Expense Expense Ratio Ratio One Year Three Years Five Years Ten Years Parnassus Fixed Income Fund Investor Shares 2.25 0.83 1.96 4.17 0.78 0.68 Parnassus Fixed Income Fund Institutional Shares 2.27 0.84 1.96 4.17 0.65 0.58 Barclays U.S.
Aggregate Bond Index 2.94 1.71 3.09 4.63 NA NA Lipper A-Rated Bond Fund Average 1.61 1.75 3.70 4.52 NA NA for periods ended September 30, 2015 To the left is a table comparing the performance of the Fund with that of the Barclays Aggregate Index and the Lipper average. Average annual total returns are for the one-, three-, five- and ten-year periods. For September 30, the 30-day subsidized SEC yield was 1.94%, and the unsubsidized SEC yield was 1.84%. Second Quarter Review The average annual total return for the Parnassus Fixed Income Fund-Institutional Shares from commencement (April 30, 2015) was -0.06%.
Performance shown prior to the inception of the Institutional Shares reflects the performance of the Parnassus Fixed Income Fund- After a move higher earlier this year, interest rates declined in the third quarter on concerns about the pace of global growth. Because the Parnassus Fixed Income Fund was positioned for higher rates, it only gained 1.01% versus a gain of 1.23% for the Barclays Aggregate Index. The portfolio’s short duration relative to the index, at 4.34 years versus 5.60 years, was the main cause of its underperformance.
As a reminder, duration is a measure of interest rate sensitivity and indicates how much a bond price will move for a 1% change in interest rates. Investor Shares and includes expenses that are not applicable to and are higher than those of the Institutional Shares. The performance of the Institutional Shares differs from that shown for the Investor Shares to the extent that the classes do not have the same expenses. Performance data quoted represent past performance and are no guarantee of future returns. Current performance may be lower or higher than the performance data quoted. Current performance information to the most recent month-end is available on the Parnassus website (www.parnassus.com).
Investment return and principal value will fluctuate, so an investor’s shares, when redeemed, may be worth more or less than their original cost. Returns shown in the table do not reflect the deduction of taxes a shareholder would pay in fund distributions or redemption of shares. The Barclays U.S.
Aggregate Bond Index is an unmanaged index of bonds, and it is not possible to invest directly in an index. Index figures do not take any expenses, fees or taxes into account, but mutual fund returns do. Before investing, an investor should carefully consider the investment objectives, risks, charges and expenses of the Fund and should carefully read the prospectus or summary prospectus, which contains this and other information. The prospectus or summary prospectus can be obtained on the Parnassus website or by calling (800) 999-3505.
As described in the Fund’s current prospectus dated May 1, 2015, Parnassus Investments has contractually agreed to limit total operating expenses to 0.68% of net assets for the Parnassus Fixed Income Fund-Investor Shares and to 0.58% of net assets for the Parnassus Fixed Income Fund-Institutional Shares. This agreement will not be terminated prior to May 1, 2016, and may be continued indefinitely by the Adviser on a year-to-year basis. 20 Performance on a year-to-date basis looks considerably better. I’m pleased to report that the Fund substantially outperformed its Lipper average over this time period, with a gain of 1.10% versus a loss of 0.27%. Good corporate bond selection and diversification across other asset classes drove the outperformance.
Also on a year-to-date basis, the Fund’s performance is trailing the Barclays Aggregate Index by only threehundredths of one percent. The Fund’s biggest source of outperformance so far in 2015 is its corporate bond portfolio, which gained 0.58% versus a decline of 0.10% for the index. Bonds issued by Agilent were the top performer both in the quarter and thus far in 2015, adding over 1¢ to the NAV. The company changed into a life sciences diagnostics company at the end of 2014 through the spin-off of its more cyclical electronic measurement business.
The bonds were trading at a big discount after the . Quarterly Report • Q3 2015 spin-off, but Agilent has a leading position in a growing industry, so the bonds recovered as management executed well. Bonds issued by Costco Wholesale also added 1¢ in the quarter. I added the company’s bonds earlier in the year, when investors were skeptical of the company’s growth potential and relevancy to younger consumers. Only a handful of the Fund’s corporate bonds are down either for the year or the quarter, which is especially positive in a down market. Of those, the biggest drag on performance were bonds issued by Motorola Solutions, a company specializing in public safety communications. Investors were concerned about its increasing leverage, and so the bonds ultimately shaved 1¢ from the NAV. PARNASSUS FUNDS Parnassus Fixed Income Fund as of September 30, 2015 (percentage of net assets) Fund Sector Weightings Barclays U.S. Aggregate Bond Index U.S.
Treasury Bonds 21.3% 36.5% Government Related Bonds 3.8% 8.6% Finally, the Fund’s convertible bond investment in Exelixis, a biotechnology company, continued to be the top performer, adding almost 2¢ to NAV in the quarter and 3¢ for the year. The company made progress in the quarter towards commercializing its melanoma drug, Cobimetinib, and received positive phase III trial results for the use of its second drug, Cabozantinib, in renal cancer. Corporate Bonds Outlook and Strategy Securitized Bonds Corporate bonds performed poorly relative to other asset classes over the last year because credit spreads, or the difference between the yield on corporate bonds and Treasuries, increased dramatically. Normally, when credit spreads increase, it means that an industry or a company has become riskier, and investors want more compensation for their investment.
That’s certainly true today of energy companies and other commodity companies, but I do not believe it’s true across the board. For companies that have been unfairly punished, their bonds have become a bargain. In the quarter, I found several such bonds, and so added positions in Apple, CVS Health and BNSF Railway. These companies have fantastic management teams and competitive advantages, so I expect the bonds to perform well. 43.1% 24.0% 26.3% 30.9% Short-term Investments, Other Assets & Liabilities 5.5% 0.0% 0 10 20 30 40 50 Portfolio characteristics and holdings are subject to change periodically. Last quarter, I incorrectly predicted that the Federal Reserve would raise its benchmark rate in September.
Despite a resilient domestic economy, the committee left rates unchanged due to concerns about the pace of global growth. The U.S. grew at a 3.9% annualized rate in the second quarter, and with unemployment around 5%, I still believe there’s an argument for higher interest rates.
On average, the Federal Reserve seems to agree, as most committee members expect a higher Federal Funds Rate by the end of the year. Despite this, long-term yields remain near record lows. Low yields translate to high bond prices and so I continue to be concerned that even a small change in sentiment would quickly push interest rates higher, and prices lower. For that reason, the Fund continues to have a relatively short duration that protects principal in a rising rate environment. Thank you for your investment in the Parnassus Fixed Income Fund. Yours truly, Samantha D.
Palm Portfolio Manager 21 . PARNASSUS FUNDS Quarterly Report • Q3 2015 Responsible Investing Notes By: Milton Moskowitz Netflix, which streams movies, videos and TV programs to 65 million subscribers and now has a market cap of more than $50 billion, stunned the business world when it announced that it was granting new mothers paid leave of up to one year. While there was some question of whether all its hourly employees would be eligible for this benefit, it was spectacular enough to stimulate a flurry of activity on this front. Among the companies cited for their recent initiative in this area were Goldman Sachs, Hilton Worldwide, Yahoo, Apple, Microsoft and Facebook. At Microsoft, new parents now enjoy 20 weeks of paid leave.
New mothers at Facebook get four months plus $4,000 in baby cash. Google offers an 18-week paid leave for new mothers, seven weeks for new fathers. Second to Netflix is the former Parnassus portfolio company Adobe, which introduced a 26-week paid leave. It was a long time coming.
The United States is the only country in the advanced industrial world where the government does not mandate paid maternity leave. I first learned about this void in 1986 when I inaugurated the Working Mother list of the Best Companies for Working Mothers. I quickly discovered that there was hardly any company that specifically offered maternity leave.
It was available through short-term disability insurance – 6 weeks for a standard procedure, 8 weeks for a Caesarian – and it often was only partial pay. In other words, giving birth to a child is treated the same way as a broken arm. Working Mother’s 30th anniversary issue was published at the end of September, crammed with mini-profiles of work/family programs in place at 100 companies, from management consultant A.T. Kearney to insurance provider Zurich North America. It represents quite a transformation from the meager landscape of 1986, when we could find only 30 companies worthy of recognition.
It took us until 1992 to reach 100. As usual, the Working Mother 100 is peppered with Parnassus portfolio companies, ten this year including Accenture, American Express, Capital One, Cardinal Health, First Horizon, IBM, Intel, MasterCard, Novartis and Procter & Gamble. These companies differ from the rest of corporate America, make no mistake about that. In a table in its current issue, Working Mother editors contrast some differences. Only 17% of all U.S.
companies offer paid paternity leave, compared to 90% of the Working Mother roster; only 21% of all firms have on-site fitness centers compared to 88%; only 17% offer adoption assistance against 93%; only 3% have concierge services compared to 46% for the Working Mother 100. Procter & Gamble, a holding of our Parnassus Core Equity Fund, is unique in having five women on its 13-person board of directors. It’s not every day that a magazine like Fortune invents a new list, but it happened in September when it debuted its first ever Change the World list recognizing 50 companies for making “significant progress in addressing major social problems as part of their core business strategy.” Explaining why it has gone down this route, the editor of Fortune, Alan Murray said: “It is based on our belief that capitalism should not be just tolerated but celebrated for its power to do good. At a time when governments are flailing, its powers are needed more than ever.” Eleven companies from our portfolios – Google, Cisco Systems, Novartis, MasterCard, Alibaba, IBM, CVS Health, Whole Foods Market, Intel, Ecolab and Waste Management – make the first installment of this list.
There are some surprises. Toyota is in third place for its contribution to clean air by introducing the world’s first mass-market hybrid, the Prius. Walmart captures fourth place for leaning on suppliers to eliminate waste and build sustainability into their operations. Walmart now gets 26% of its electricity from renewable sources. However, the company that gets the most attention in this latest Fortune roundup is Whole Foods Market, ranked 30th on the list for “raising the bar for every American grocer.” There is an eight-page profile of founder John Mackey, who is on a crusade to get Americans to eat healthier foods.
Attacks on Whole Foods go viral, says Mackey, “because people are eager to believe bad things about Whole Foods so it doesn’t disrupt their mental model” of business as selfish and greedy. In 2006, Mackey reduced his salary to $1 a year. No one at Whole Foods is allowed to make more than 19 times the average pay in the company. 22 . Quarterly Report • Q3 2015 PARNASSUS FUNDS No sooner was the Fortune issue off press than news broke that Whole Foods, which has 91,000 employees in more than 400 stores, announced that it was laying off 1,500 workers as a cost-cutting move. The company said it would be careful to do this in a respectful manner. Team members would continue to be paid for eight weeks while they decided on their next move. They will get generous severance pay, based on tenure, and they will be given the opportunity to apply for open jobs in other parts of the company. More than 100 new stores are currently in development. Jagdeep Singh Bachher, chief investment officer of the University of California regents, reported that over the last few months, the university has sold all of its remaining holdings in coal mining and oil-sands-focused companies.
The move was prompted by concerns about climate change. Bachher explained: “In our view, institutions that ignore societal values in their investment strategy imperil their bottom line – today and for years to come.” Mondelez, whose brands include Cadbury and Oreos, said that in five years healthy snacks will comprise half of its food revenues (up from one-third today)…PepsiCo began sweetening its diet drinks with saccharin in 1963. In 1983, it switched to aspartame.
Now it’s replacing the aspartame in Diet Pepsi with other chemicals, sucralose and acesulfame…Allergan, the Dublin-based pharmaceutical company, launched a campaign called “ActuallySheCan,” a program to educate and motivate millennial women to achieve their full potential, socially and professionally. Milton Moskowitz is the co-author of the Fortune magazine survey “The 100 Best Companies to Work For” and the co-originator of the annual Working Mother magazine survey, “The 100 Best Companies for Working Mothers.” Mr. Moskowitz serves as a consultant to Parnassus Investments in evaluating companies for workplace issues and responsible investing. Neither Fortune magazine nor Working Mother magazine has any role in the management of the Parnassus Funds, and there is no affiliation between Parnassus Investments and either publication. 23 .
PARNASSUS FUNDS Quarterly Report • Q3 2015 PARNASSUS FUND Portfolio of Investments as of September 30, 2015 (unaudited) 1,300,000 550,000 1,225,000 1,000,000 210,000 400,000 1,200,000 800,000 1,650,000 80,000 450,000 775,000 680,000 750,000 600,000 450,000 325,000 250,000 175,000 300,000 25,000 350,000 1,050,000 200,000 800,000 250,000 500,000 80,000 55,000 800,000 200,000 65,000 450,000 175,000 250,000 100,000 100,000 500,000 50,000 25,000 Market Value ($) Per Share Altera Corp. Motorola Solutions Inc. Intel Corp. Whole Foods Market Inc. International Business Machines Corp. American Express Co. Ciena Corp. Air Lease Corp. Applied Materials Inc. Allergan plc Expeditors International of Washington Inc. EZchip Semiconductor Ltd. Charles Schwab Corp. Essent Group Ltd. Progressive Corp. Thomson Reuters Corp. QUALCOMM Inc. Citrix Systems Inc. Gilead Sciences Inc. SanDisk Corp. Google Inc., Class A Mondelez International Inc., Class A Redwood Trust Inc. Capital One Financial Corp. Trimble Navigation Ltd. Wells Fargo & Co. Axalta Coating Systems Ltd. Perrigo Co. plc W.W. Grainger Inc. First Horizon National Corp. Pentair plc FedEx Corp. Potash Corporation of Saskatchewan Inc. Plantronics Inc. PayPal Holdings Inc. Deere & Co. Genesee & Wyoming Inc., Class A Belmond Ltd. Lam Research Corp. Autodesk Inc. Total investment in equities Total short-term securities 65,104,000 37,609,000 36,921,500 31,650,000 30,443,700 29,652,000 24,864,000 24,736,000 24,238,500 21,744,800 21,172,500 19,499,000 19,420,800 18,637,500 18,384,000 18,117,000 17,462,250 17,320,000 17,183,250 16,299,000 15,959,250 14,654,500 14,532,000 14,504,000 13,136,000 12,837,500 12,670,000 12,581,600 11,825,550 11,344,000 10,208,000 9,358,700 9,247,500 8,898,750 7,760,000 7,400,000 5,908,000 5,055,000 3,266,500 1,103,500 712,709,150 12,675,712 50.08 68.38 30.14 31.65 144.97 74.13 20.72 30.92 14.69 271.81 47.05 25.16 28.56 24.85 30.64 40.26 53.73 69.28 98.19 54.33 638.37 41.87 13.84 72.52 16.42 51.35 25.34 157.27 215.01 14.18 51.04 143.98 20.55 50.85 31.04 74.00 59.08 10.11 65.33 44.14 Other assets and liabilities Total net assets Shares (1,917,627) 723,467,235 Equities Net asset value as of September 30, 2015 Investor shares Institutional shares 24 $46.52 $46.55 Percent of Net Assets 9.0% 5.2% 5.1% 4.4% 4.2% 4.1% 3.4% 3.4% 3.4% 3.0% 2.9% 2.7% 2.7% 2.6% 2.5% 2.5% 2.4% 2.4% 2.4% 2.3% 2.2% 2.0% 2.0% 2.0% 1.8% 1.8% 1.8% 1.7% 1.6% 1.6% 1.4% 1.3% 1.3% 1.2% 1.1% 1.0% 0.8% 0.7% 0.4% 0.2% 98.5% 1.8% (0.3%) 100.0% . Quarterly Report • Q3 2015 PARNASSUS FUNDS PARNASSUS CORE EQUITY FUND Portfolio of Investments as of September 30, 2015 (unaudited) Shares 8,962,852 6,105,878 10,709,214 5,444,500 12,500,000 3,808,270 3,500,000 6,500,003 10,543,000 9,945,000 1,165,400 3,205,979 3,265,000 7,864,354 2,750,000 8,000,000 7,475,805 480,572 2,858,089 9,978,431 3,460,000 1,600,397 2,750,000 16,200,000 12,028,340 2,450,000 7,229,633 4,400,000 2,153,000 4,800,000 8,415,633 2,500,000 10,435,608 11,500,000 2,075,303 225,000 1,692,272 1,220,000 2,325,000 700,270 Equities Market Value ($) Per Share Motorola Solutions Inc. Danaher Corp. Mondelez International Inc., Class A Procter & Gamble Co. Intel Corp. United Parcel Service Inc., Class B Gilead Sciences Inc. Pentair plc Iron Mountain Inc. Xylem Inc. Allergan plc CVS Health Corp. PepsiCo Inc. Sysco Corp. Apple Inc. National Oilwell Varco Inc. Thomson Reuters Corp. Google Inc., Class C Praxair Inc. Charles Schwab Corp. Verisk Analytics Inc. Perrigo Co. plc MasterCard Inc., Class A Applied Materials Inc. Shaw Communications Inc., Class B Novartis AG (ADR) PayPal Holdings Inc. Waste Management Inc. Accenture plc, Class A Patterson Companies Inc. eBay Inc. McCormick & Co. Questar Corp. MDU Resources Group Inc. Compass Minerals International Inc. Google Inc., Class A Deere & Co. WD-40 Co. Northwest Natural Gas Co. AGL Resources Inc. Total investment in equities Total short-term securities 612,879,820 520,281,864 448,394,790 391,677,330 376,750,000 375,838,166 343,665,000 331,760,153 327,043,860 326,693,250 316,767,374 309,312,854 307,889,500 306,473,875 303,325,000 301,200,000 300,975,909 292,389,616 291,124,946 284,983,989 255,728,600 251,694,436 247,830,000 237,978,000 233,349,796 225,204,000 224,407,808 219,164,000 211,553,780 207,600,000 205,678,071 205,450,000 202,555,151 197,800,000 162,641,496 143,633,250 125,228,128 108,665,400 106,578,000 42,744,483 10,884,911,695 393,546,324 68.38 85.21 41.87 71.94 30.14 98.69 98.19 51.04 31.02 32.85 271.81 96.48 94.30 38.97 110.30 37.65 40.26 608.42 101.86 28.56 73.91 157.27 90.12 14.69 19.40 91.92 31.04 49.81 98.26 43.25 24.44 82.18 19.41 17.20 78.37 638.37 74.00 89.07 45.84 61.04 Other assets and liabilities Total net assets Net asset value as of September 30, 2015 Investor shares Institutional shares (56,137,046) 11,222,320,973 Percent of Net Assets 5.5% 4.6% 4.0% 3.5% 3.4% 3.3% 3.1% 3.0% 2.9% 2.9% 2.8% 2.8% 2.7% 2.7% 2.7% 2.7% 2.7% 2.6% 2.6% 2.5% 2.3% 2.2% 2.2% 2.1% 2.1% 2.0% 2.0% 2.0% 1.9% 1.9% 1.8% 1.8% 1.8% 1.8% 1.4% 1.3% 1.1% 1.0% 0.9% 0.4% 97.0% 3.5% (0.5%) 100.0% $38.32 $38.38 25 . PARNASSUS FUNDS Quarterly Report • Q3 2015 PARNASSUS ENDEAVOR FUND Portfolio of Investments as of September 30, 2015 (unaudited) Shares 3,300,000 2,200,000 4,100,000 1,875,000 800,000 1,100,000 400,000 1,000,000 675,000 210,000 650,000 1,900,000 875,000 800,000 700,000 220,000 1,100,000 900,000 400,000 240,000 40,000 250,000 1,100,000 300,000 350,000 1,200,000 500,000 200,000 140,000 300,000 500,000 140,000 Equities Altera Corp. Intel Corp. Applied Materials Inc. Whole Foods Market Inc. American Express Co. QUALCOMM Inc. International Business Machines Corp. SanDisk Corp. Deere & Co. W.W. Grainger Inc. Citrix Systems Inc. Ciena Corp. Autodesk Inc. Expeditors International of Washington Inc. Wells Fargo & Co. Perrigo Co. plc Charles Schwab Corp. Roche Holdings Ltd. (ADR) C.H.
Robinson Worldwide Inc. Cummins Inc. Google Inc., Class A Gilead Sciences Inc. Shaw Communications Inc., Class B Lam Research Corp. Plantronics Inc. First Horizon National Corp. PayPal Holdings Inc. Capital One Financial Corp. Novartis AG (ADR) Mondelez International Inc., Class A eBay Inc. Procter & Gamble Co. Total investment in equities Total short-term securities Other assets and liabilities Total net assets Net asset value as of September 30, 2015 Investor shares Institutional shares 26 Market Value ($) Per Share 165,264,000 66,308,000 60,229,000 59,343,750 59,304,000 59,103,000 57,988,000 54,330,000 49,950,000 45,152,100 45,032,000 39,368,000 38,622,500 37,640,000 35,945,000 34,599,400 31,416,000 29,655,000 27,112,000 26,059,200 25,534,800 24,547,500 21,340,000 19,599,000 17,797,500 17,016,000 15,520,000 14,504,000 12,868,800 12,561,000 12,220,000 10,071,600 50.08 30.14 14.69 31.65 74.13 53.73 144.97 54.33 74.00 215.01 69.28 20.72 44.14 47.05 51.35 157.27 28.56 32.95 67.78 108.58 638.37 98.19 19.40 65.33 50.85 14.18 31.04 72.52 91.92 41.87 24.44 71.94 1,226,001,150 49,479,635 (17,794,785) 1,257,686,000 $29.05 $29.08 Percent of Net Assets 13.1% 5.3% 4.8% 4.7% 4.7% 4.7% 4.6% 4.3% 4.0% 3.6% 3.6% 3.1% 3.1% 3.0% 2.9% 2.8% 2.5% 2.4% 2.2% 2.1% 2.0% 1.9% 1.7% 1.6% 1.4% 1.3% 1.2% 1.1% 1.0% 1.0% 1.0% 0.8% 97.5% 3.9% (1.4%) 100.0% . Quarterly Report • Q3 2015 PARNASSUS FUNDS PARNASSUS MID CAP FUND Portfolio of Investments as of September 30, 2015 (unaudited) Shares 346,604 404,095 1,372,926 590,000 450,000 220,000 511,628 190,000 405,000 205,567 358,384 302,500 305,078 290,000 996,438 845,000 314,749 344,890 168,416 772,500 598,289 224,338 123,276 229,895 394,453 158,000 195,900 57,000 193,500 270,000 395,000 125,000 57,500 70,000 258,895 70,000 95,000 170,000 485,000 94,500 82,924 75,000 21,000 19,243 191,048 Equities Motorola Solutions Inc. SEI Investments Co. First Horizon National Corp. Iron Mountain Inc. Sysco Corp. Cardinal Health Inc. Xylem Inc. Fiserv Inc. Thomson Reuters Corp. Compass Minerals International Inc. Patterson Companies Inc. Pentair plc Waste Management Inc. DENTSPLY International Inc. Applied Materials Inc. MDU Resources Group Inc. Autodesk Inc. First American Financial Corp. Verisk Analytics Inc. Calgon Carbon Corp. Questar Corp. Expeditors International of Washington Inc. McCormick & Co. Insperity Inc. Essent Group Ltd. Cameron International Corp. Synopsys Inc. Perrigo Co. plc Northwest Natural Gas Co. Charles Schwab Corp. Shaw Communications Inc., Class B AGL Resources Inc. Teleflex Inc. Equifax Inc. Axalta Coating Systems Ltd. Group 1 Automotive Inc. Regal Beloit Corp. Air Lease Corp. Belmond Ltd. Energen Corp. Plantronics Inc. Sotheby’s Ecolab Inc. Intuit Inc. GenMark Diagnostics Inc. Total investment in equities Total short-term securities Other assets and liabilities Total net assets Net asset value as of September 30, 2015 Investor shares Institutional shares Market Value ($) Per Share Percent of Net Assets 23,700,782 19,489,502 19,468,091 18,301,800 17,536,500 16,900,400 16,806,980 16,455,900 16,305,300 16,110,286 15,500,108 15,439,600 15,195,935 14,665,300 14,637,674 14,534,000 13,893,021 13,474,852 12,447,627 12,035,550 11,612,789 10,555,103 10,130,822 10,099,287 9,802,157 9,688,560 9,046,662 8,964,390 8,870,040 7,711,200 7,663,000 7,630,000 7,142,075 6,802,600 6,560,399 5,960,500 5,362,750 5,256,400 4,903,350 4,711,770 4,216,685 2,398,500 2,304,120 1,707,816 1,503,548 493,503,731 36,471,235 (6,919,221) 523,055,745 68.38 48.23 14.18 31.02 38.97 76.82 32.85 86.61 40.26 78.37 43.25 51.04 49.81 50.57 14.69 17.20 44.14 39.07 73.91 15.58 19.41 47.05 82.18 43.93 24.85 61.32 46.18 157.27 45.84 28.56 19.40 61.04 124.21 97.18 25.34 85.15 56.45 30.92 10.11 49.86 50.85 31.98 109.72 88.75 7.87 4.5% 3.7% 3.7% 3.5% 3.4% 3.2% 3.2% 3.1% 3.1% 3.1% 3.0% 3.0% 2.9% 2.8% 2.8% 2.8% 2.7% 2.6% 2.4% 2.3% 2.2% 2.0% 1.9% 1.9% 1.9% 1.9% 1.7% 1.7% 1.7% 1.5% 1.5% 1.5% 1.4% 1.3% 1.3% 1.1% 1.0% 1.0% 0.9% 0.9% 0.8% 0.5% 0.4% 0.3% 0.3% 94.4% 7.0% (1.4%) 100.0% $25.86 $25.91 27 . PARNASSUS FUNDS Quarterly Report • Q3 2015 PARNASSUS ASIA FUND Portfolio of Investments as of September 30, 2015 (unaudited) Shares 41,000 Shares 12,950 6,000 10,500 6,000 4,000 Australia Equities Brambles Ltd. Total investment in Australia equities China Equities Altera Corp. Alibaba Group Holding Ltd. (ADR) Air Lease Corp. QUALCOMM Inc. Expeditors International of Washington Inc. Total investment in China equities Shares Hong Kong Equities 450,000 640,000 360,000 284,000 250,000 55,000 100,000 150,000 Sun Art Retail Group Ltd. SITC International Holdings Co., Ltd. Lenovo Group Ltd. China Minsheng Banking Corp., Ltd. Want Want China Holdings Ltd. Television Broadcasts Ltd. HKBN Ltd. Greatview Aseptic Packaging Co., Ltd. Total investment in Hong Kong equities Shares 450,000 3,951,300 Indonesia Equities Market Value ($) 281,608 281,608 Market Value ($) 648,536 353,820 324,660 322,380 188,200 27,000 8,000 13,000 16,000 28 6.87 Per Share 50.08 58.97 30.92 53.73 47.05 1,837,596 Market Value ($) 346,101 309,987 304,333 263,241 205,923 183,538 115,744 70,037 Market Value ($) PT Bank Rakyat Indonesia (Persero) PT Asuransi Multi Artha Guna 266,443 102,670 Per Share 0.77 0.48 0.85 0.93 0.82 3.34 1.16 0.47 Rakuten Inc. Linear Technology Corp. KDDI Corp. USS Co., Ltd. Market Value ($) 345,155 322,800 291,005 266,135 3.1% 3.1% Percent of Net Assets 7.0% 3.8% 3.5% 3.5% 2.1% Percent of Net Assets 3.7% 3.4% 3.3% 2.8% 2.2% 2.0% 1.3% 0.7% 19.4% Per Share 369,113 Japan Equities Percent of Net Assets 19.9% 1,798,904 Total investment in Indonesia equities Shares Per Share 0.59 0.03 Percent of Net Assets 2.9% 1.1% 4.0% Per Share 12.78 40.35 22.38 16.63 Percent of Net Assets 3.7% 3.5% 3.1% 2.9% . Quarterly Report • Q3 2015 Shares Japan Equities 16,000 7,000 Kakaku.com Inc. OMRON Corp. Total investment in Japan equities Shares Philippines Equities 613,800 Manila Water Co. Total investment in Philippines equities Shares Singapore Equities 310,000 OSIM International Ltd. Total investment in Singapore equities Shares South Korea Equities 425 Samsung Electronics Co., Ltd. Total investment in South Korea equities Shares Taiwan Equities 12,000 24,000 281,400 129,000 5,000 Hermes Microvision Inc. Applied Materials Inc. Lite-On Technology Corp. Chailease Holding Co., Ltd. Taiwan Semiconductor Manufacturing Co., Ltd. (ADR) Total investment in Taiwan equities Market Value ($) 259,868 210,733 PARNASSUS FUNDS Per Share 16.24 30.10 1,695,696 Market Value ($) 284,878 284,878 Market Value ($) 354,485 354,485 Market Value ($) 407,837 407,837 Market Value ($) Percent of Net Assets 2.8% 2.3% 18.3% Per Share 0.46 Per Share 1.14 Per Share 959.62 Per Share Percent of Net Assets 3.1% 3.1% Percent of Net Assets 3.8% 3.8% Percent of Net Assets 4.4% 4.4% Percent of Net Assets 456,631 352,560 258,797 202,475 38.05 14.69 0.92 1.57 4.9% 3.8% 2.8% 2.2% 103,749 20.75 1.2% 1,374,212 14.9% 29 . PARNASSUS FUNDS Quarterly Report • Q3 2015 PARNASSUS ASIA FUND Portfolio of Investments as of September 30, 2015 (unaudited) (continued) Shares Thailand Equities 250,000 Thanachart Capital Public Co., Ltd. Total investment in Thailand equities Total investment in equities Total short-term securities Other assets and liabilities Total net assets Net asset value as of September 30, 2015 Investor shares Institutional shares 30 Market Value ($) Per Share 218,236 218,236 8,622,565 490,936 0.87 Percent of Net Assets 2.4% 2.4% 93.3% 5.3% 132,701 1.4% 9,246,202 100.0% $13.77 $13.79 . Quarterly Report • Q3 2015 PARNASSUS FUNDS PARNASSUS FIXED INCOME FUND Portfolio of Investments as of September 30, 2015 (unaudited) Principal Amount ($) 1,500,000 1,000,000 1,000,000 1,000,000 986,086 907,982 373,099 Commercial Mortgage-Backed Securities JP Morgan Mortgage Trust Series 2011-C4, Class A3, 4.11%, due 07/15/2046 JP Morgan Mortgage Trust Series 2011-C4, Class A4, 4.39%, due 07/15/2046 UBS-Barclays Mortgage Trust Series 2012-C2, Class A3, 3.06%, due 05/10/2063 JP Morgan Mortgage Trust Series 2013-C13, Class A2, 2.67%, due 01/15/2046 DBUBS Mortgage Trust Series 2011-LC2A, Class A2, 3.39%, due 07/10/2044 FHLMC Multifamily Structured Pass Through Certificates K-029, Class A1, 2.84%, due 10/25/2022 Morgan Stanley Capital Trust Series 2011-C1, Class A2, 3.88%, due 09/15/2047 Total investment in commercial mortgage-backed securities Principal Amount ($) 1,250,000 1,000,000 550,000 Convertible Bonds Intel Corp. 2.95%, due 12/15/2035 Microchip Technology Inc. 1.63%, due 02/15/2025 Exelixis Inc. 4.25%, due 08/15/2019 Total investment in convertible bonds Principal Amount ($) 4,050,000 3,500,000 3,700,000 3,300,000 Corporate Bonds Pentair Finance SA 3.15%, due 09/15/2022 Nordstrom Inc. 4.00%, due 10/15/2021 Agilent Technologies Inc. 3.20%, due 10/01/2022 Discover Financial Services 5.20%, due 04/27/2022 Market Value ($) Per Share 1,583,007 105.53 0.8% 1,093,539 109.35 0.6% 1,034,659 103.47 0.6% 1,027,793 102.78 0.6% 996,889 101.10 0.5% 948,867 104.50 0.5% 374,548 100.39 0.2% 7,059,302 Percent of Net Assets 3.8% Market Value ($) Per Share 1,517,969 121.44 0.8% 956,875 95.69 0.5% 663,781 120.69 3,138,625 Percent of Net Assets 0.4% 1.7% Market Value ($) Per Share Percent of Net Assets 3,829,008 94.54 2.1% 3,738,189 106.81 2.0% 3,686,366 99.63 2.0% 3,520,499 106.68 1.9% 31 . PARNASSUS FUNDS Quarterly Report • Q3 2015 PARNASSUS FIXED INCOME FUND Portfolio of Investments as of September 30, 2015 (unaudited) (continued) Principal Amount ($) 3,500,000 3,000,000 3,000,000 3,000,000 3,000,000 2,500,000 2,570,000 2,200,000 2,100,000 2,000,000 2,000,000 2,000,000 2,000,000 2,000,000 2,000,000 2,000,000 2,000,000 2,000,000 2,000,000 2,000,000 2,000,000 2,000,000 1,500,000 1,397,882 1,500,000 32 Corporate Bonds Motorola Solutions Inc. 3.75%, due 05/15/2022 Hanesbrands Inc. 6.38%, due 12/15/2020 Juniper Networks Inc. 4.50%, due 03/15/2024 Costco Wholesale Corp. 2.25%, due 02/15/2022 FedEx Corp. 2.70%, due 04/15/2023 Starbucks Corp. 3.85%, due 10/01/2023 Cameron International Corp. 3.60%, due 04/30/2022 Autodesk Inc. 4.38%, due 06/15/2025 Cardinal Health Inc. 1.90%, due 06/15/2017 Corning Inc. 3.70%, due 11/15/2023 Burlington Northern Santa Fe Corp. 3.85%, due 09/01/2023 Gilead Sciences Inc. 3.70%, due 04/01/2024 Cisco Systems Inc. 5.50%, due 02/22/2016 Waste Management Inc. 3.50%, due 05/15/2024 Applied Materials Inc. 2.65%, due 06/15/2016 Wells Fargo & Co. 4.10%, due 06/03/2026 CVS Health Corp. 3.38%, due 08/12/2024 Procter & Gamble Co. 2.30%, due 02/06/2022 Regency Centers LP 3.75%, due 06/15/2024 Fiserv Inc. 3.13%, due 10/01/2015 Perrigo Finance plc 3.90%, due 12/15/2024 PepsiCo Inc. 2.75%, due 04/30/2025 Ecolab Inc. 4.35%, due 12/08/2021 Southwest Air 07-1 Trust 6.15%, due 08/01/2022 United Rentals North America Inc. 6.13%, due 06/15/2023 Market Value ($) Per Share Percent of Net Assets 3,259,242 93.12 1.7% 3,105,000 103.50 1.7% 3,021,741 100.72 1.6% 2,971,890 99.06 1.6% 2,888,484 96.28 1.5% 2,652,305 106.09 1.4% 2,590,175 100.79 1.4% 2,206,002 100.27 1.2% 2,116,019 100.76 1.1% 2,088,630 104.43 1.1% 2,076,080 103.80 1.1% 2,046,532 102.33 1.1% 2,038,436 101.92 1.1% 2,028,920 101.45 1.1% 2,027,550 101.38 1.1% 2,018,200 100.91 1.1% 2,009,618 100.48 1.1% 2,005,666 100.28 1.1% 2,001,146 100.06 1.1% 2,000,000 100.00 1.1% 1,969,806 98.49 1.1% 1,937,866 96.89 1.0% 1,623,186 108.21 0.9% 1,565,628 112.00 0.8% 1,495,313 99.69 0.8% . Quarterly Report • Q3 2015 Principal Amount ($) 1,100,000 1,060,000 1,000,000 1,000,000 1,000,000 1,000,000 Corporate Bonds CVS Health Corp. 6.25%, due 06/01/2027 Burlington Northern Santa Fe Corp. 6.15%, due 05/01/2037 CVS Health Corp. 5.13%, due 07/20/2045 Burlington Northern Santa Fe Corp. 4.90%, due 04/01/2044 Autodesk Inc. 3.60%, due 12/15/2022 Apple Inc. 4.38%, due 05/13/2045 Total investment in corporate bonds Principal Amount ($) 1,680,498 1,595,463 1,483,521 1,457,592 1,474,949 1,458,850 1,444,540 1,467,508 1,347,140 1,327,511 1,290,821 1,339,792 1,144,626 1,108,280 1,082,256 Federal Agency Mortgage-Backed Securities Freddie Mac Pool A93451 4.50%, due 08/01/2040 Freddie Mac Pool C91754 4.50%, due 02/01/2034 Fannie Mae Pool AH6275 4.50%, due 04/01/2041 Fannie Mae Pool AL0393 4.50%, due 06/01/2041 Freddie Mac Pool A90225 4.00%, due 12/01/2039 Fannie Mae Pool MA2177 4.00%, due 02/01/2035 Freddie Mac Pool Q22416 4.00%, due 10/01/2043 Fannie Mae Pool AS4455 3.50%, due 02/01/2045 Fannie Mae Pool AH7196 4.50%, due 03/01/2041 Fannie Mae Pool AV0971 3.50%, due 08/01/2026 Fannie Mae Pool 926115 4.50%, due 04/01/2039 Fannie Mae Pool AQ2925 3.50%, due 01/01/2043 Fannie Mae Pool AI8483 4.50%, due 07/01/2041 Fannie Mae Pool AD4296 5.00%, due 04/01/2040 Fannie Mae Pool AS1587 4.50%, due 01/01/2044 PARNASSUS FUNDS Market Value ($) Per Share 1,317,735 119.79 0.7% 1,271,321 119.94 0.7% 1,074,953 107.50 0.6% 1,037,503 103.75 0.5% 999,245 99.92 0.5% 990,019 99.00 0.5% 77,208,273 Percent of Net Assets 41.4% Market Value ($) Per Share Percent of Net Assets 1,825,589 108.63 1.0% 1,740,001 109.06 0.9% 1,612,143 108.67 0.9% 1,597,456 109.60 0.9% 1,573,526 106.68 0.8% 1,572,043 107.76 0.8% 1,541,115 106.69 0.8% 1,532,821 104.45 0.8% 1,465,215 108.76 0.8% 1,404,624 105.81 0.8% 1,402,491 108.65 0.8% 1,401,235 104.59 0.8% 1,244,355 108.71 0.7% 1,225,235 110.55 0.7% 1,175,099 108.58 0.6% 33 . PARNASSUS FUNDS Quarterly Report • Q3 2015 PARNASSUS FIXED INCOME FUND Portfolio of Investments as of September 30, 2015 (unaudited) (continued) Principal Amount ($) 1,078,683 974,574 907,917 895,771 894,353 892,901 860,878 871,403 845,451 834,675 859,630 821,575 811,049 759,164 758,860 731,410 705,721 692,435 704,387 697,639 627,199 625,905 617,113 Federal Agency Mortgage-Backed Securities Freddie Mac Pool V60523 3.00%, due 04/01/2029 Freddie Mac Pool C91764 3.50%, due 05/01/2034 Fannie Mae Pool AS0576 5.00%, due 09/01/2043 Fannie Mae Pool AS1130 4.50%, due 11/01/2043 Fannie Mae Pool AK3103 4.00%, due 02/01/2042 Fannie Mae Pool AX1326 3.50%, due 09/01/2029 Freddie Mac Pool C91762 4.50%, due 04/01/2034 Ginnie Mae II Pool MA2522 4.00%, due 01/20/2045 Fannie Mae Pool AL0215 4.50%, due 04/01/2041 Fannie Mae Pool 931065 4.50%, due 05/01/2039 Fannie Mae Pool MA1607 3.00%, due 10/01/2033 Fannie Mae Pool MA0695 4.00%, due 04/01/2031 Freddie Mac Pool G30672 3.50%, due 07/01/2033 Freddie Mac Pool G05514 5.00%, due 06/01/2039 Freddie Mac Pool G14809 3.00%, due 07/01/2028 Freddie Mac Pool G07426 4.00%, due 06/01/2043 Fannie Mae Pool AJ4994 4.50%, due 11/01/2041 Fannie Mae Pool MA0844 4.50%, due 08/01/2031 Freddie Mac Pool E02746 3.50%, due 11/01/2025 Fannie Mae Pool AD5108 3.50%, due 12/01/2025 Fannie Mae Pool AH0973 4.00%, due 12/01/2025 Freddie Mac Pool G14820 3.50%, due 12/01/2026 Fannie Mae Pool 931739 4.00%, due 08/01/2024 Total investment in federal agency mortgage-backed securities 34 Market Value ($) Per Share 1,127,383 104.51 0.6% 1,029,306 105.62 0.6% 1,000,010 110.14 0.5% 972,375 108.55 0.5% 960,054 107.35 0.5% 943,489 105.67 0.5% 938,526 109.02 0.5% 928,457 106.55 0.5% 919,404 108.75 0.5% 912,654 109.34 0.5% 893,159 103.90 0.5% 885,472 107.78 0.5% 858,354 105.83 0.5% 839,609 110.60 0.4% 791,433 104.29 0.4% 780,178 106.67 0.4% 767,571 108.76 0.4% 758,327 109.52 0.4% 744,824 105.74 0.4% 738,342 105.83 0.4% 668,843 106.64 0.3% 661,871 105.75 0.3% 650,663 105.44 0.3% 42,083,252 Percent of Net Assets 22.5% . Quarterly Report • Q3 2015 Principal Amount ($) 5,000,000 2,000,000 Supranational Bonds International Finance Corp. 0.50%, due 05/16/2016 European Bank for Reconstruction & Development 1.63%, due 04/10/2018 Total investment in supranational bonds Principal Amount ($) 4,000,000 4,000,000 4,000,000 4,000,000 4,000,000 3,000,000 3,000,000 3,000,000 2,000,000 2,000,000 2,000,000 2,000,000 1,139,180 1,000,000 U.S. Government Treasury Bonds U.S. Treasury 2.75%, due 11/15/2023 U.S. Treasury 2.50%, due 05/15/2024 U.S.
Treasury 2.25%, due 11/15/2024 U.S. Treasury 0.88%, due 11/15/2017 U.S. Treasury 0.38%, due 11/15/2015 U.S.
Treasury 1.50%, due 07/31/2016 U.S. Treasury 0.50%, due 09/30/2016 U.S. Treasury 0.63%, due 06/30/2017 U.S.
Treasury 2.75%, due 02/15/2024 U.S. Treasury 1.75%, due 05/31/2016 U.S. Treasury 2.13%, due 05/15/2025 U.S.
Treasury 1.75%, due 05/15/2023 U.S. Treasury (TIPS) 1.75%, due 01/15/2028 U.S. Treasury 2.00%, due 02/15/2025 Total investment in U.S.
government treasury bonds Total long-term investments Total short-term securities Other assets and liabilities Total net assets Net asset value as of September 30, 2015 Investor shares Institutional shares Market Value ($) PARNASSUS FUNDS Per Share 5,001,040 100.02 2,022,390 101.12 7,023,430 Market Value ($) Percent of Net Assets 2.7% 1.1% 3.8% Per Share Percent of Net Assets 4,258,644 106.47 2.3% 4,166,564 104.16 2.2% 4,074,792 101.87 2.2% 4,014,168 100.35 2.2% 4,001,016 100.03 2.1% 3,028,593 100.95 1.6% 3,003,009 100.10 1.6% 3,001,719 100.06 1.6% 2,125,624 106.28 1.1% 2,019,974 101.00 1.1% 2,012,032 100.60 1.1% 1,982,968 99.15 1.0% 1,259,195 110.54 0.7% 996,094 99.61 0.5% 39,944,392 176,457,274 9,458,508 21.3% 94.5% 5.1% 754,432 0.4% 186,670,214 100.0% $16.57 $16.56 35 . Go Paperless with E-Delivery Sign up for electronic delivery of prospectuses, shareholder reports and account statements at www.parnassus.com/gopaperless If you do not hold your account directly with Parnassus, please contact the firm that holds your account to inquire about electronic delivery. PARNASSUS FUNDS 1 Market Street, Suite 1600 San Francisco, CA 94105 (800) 999-3505 www.parnassus.com This report must be preceded or accompanied by a current prospectus. Investment Adviser Parnassus Investments 1 Market Street, Suite 1600 San Francisco, CA 94105 Independent Registered Public Accounting Firm Deloitte and Touche LLP 555 Mission Street San Francisco, CA 94105 Legal Counsel Foley and Lardner LLP 777 E. Wisconsin Ave. Milwaukee, WI 53202 Distributor Parnassus Funds Distributor 1 Market Street, Suite 1600 San Francisco, CA 94105 .


