


Description
P A R N A S S U S F U N D S®
ANNUAL REPORT â–ª DECEMBER 31, 2014
PARNASSUS FUNDS
PARNX
Parnassus Fund
SM
Parnassus Core Equity Fund – Investor Shares
PRBLX
Parnassus Core Equity Fund – Institutional Shares
PRILX
Parnassus Endeavor Fund
PARWX
Parnassus Mid Cap Fund
PARMX
SM
SM
SM
PARSX
Parnassus Small Cap Fund
SM
PAFSX
Parnassus Asia Fund
SM
Parnassus Fixed Income Fund
SM
PRFIX
.
. Table of Contents
Letter from Parnassus Investments .............. 4
Fund Performance and Commentary
Parnassus Fund.............................................. 6
Parnassus Core Equity Fund.........................10
Parnassus Endeavor Fund.............................13
Parnassus Mid Cap Fund ..............................16
Parnassus Small Cap Fund ...........................20
Parnassus Asia Fund......................................23
Parnassus Fixed Income Fund ......................27
Responsible Investing Notes ........................30
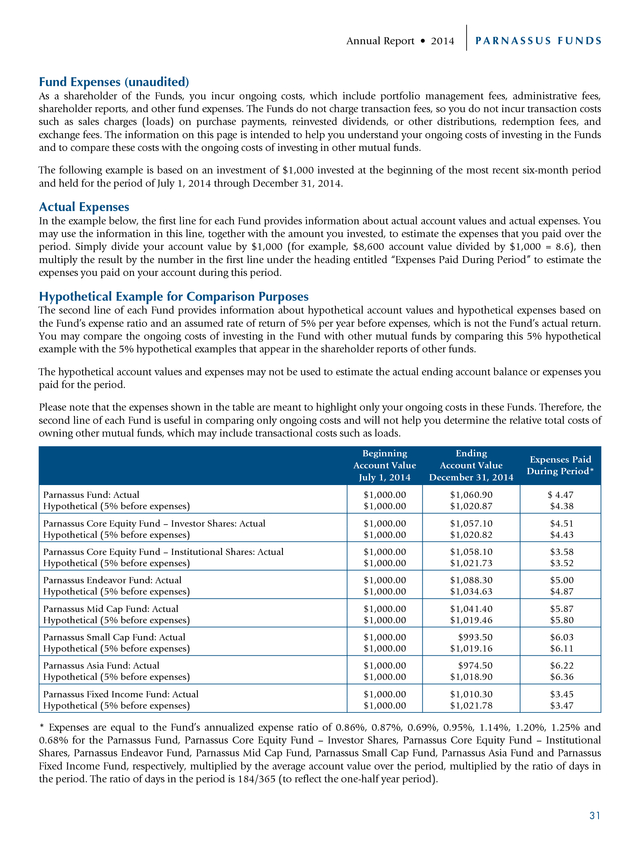
Fund Expenses...............................................31
Report of Independent Registered Public
Accounting Firm............................................32
Portfolios of Investments
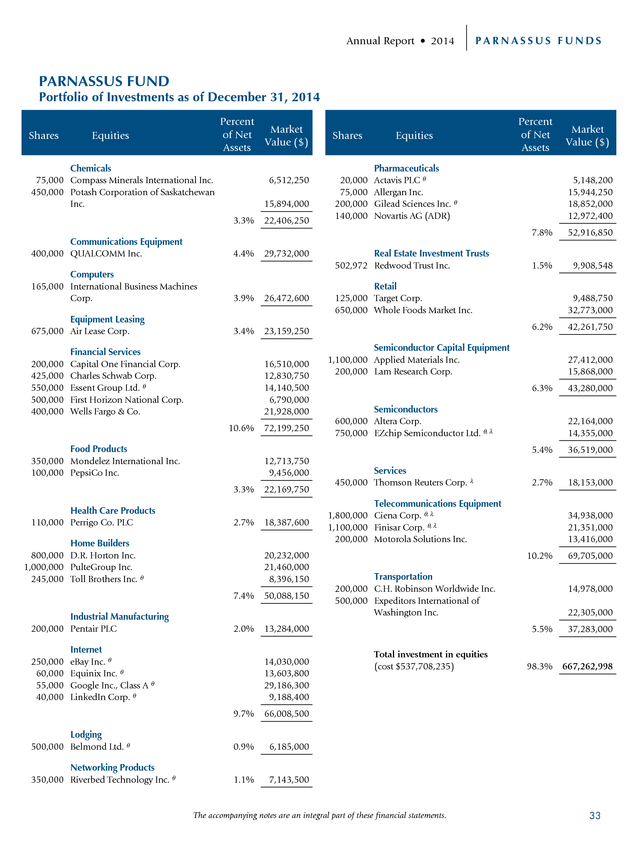
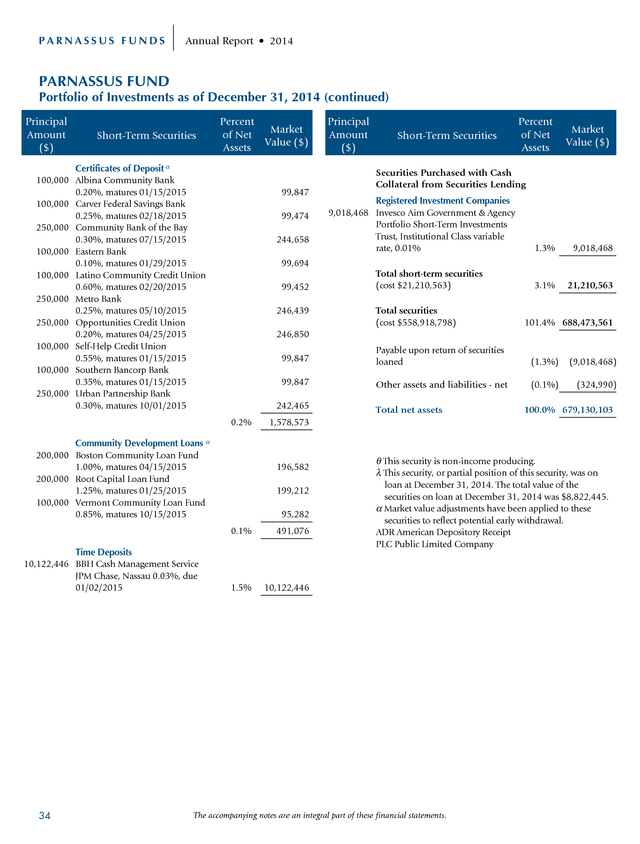
Parnassus Fund..............................................33
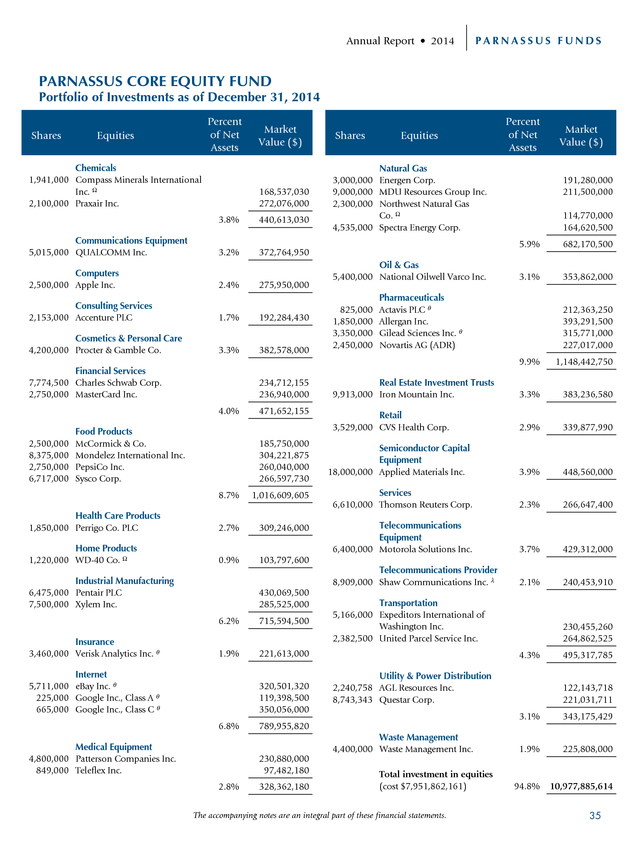
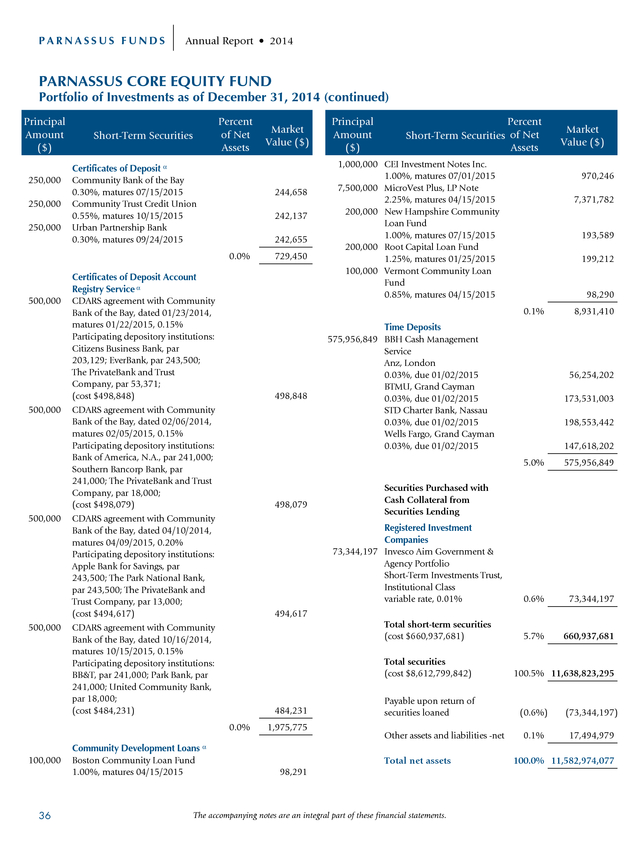
Parnassus Core Equity Fund.........................35
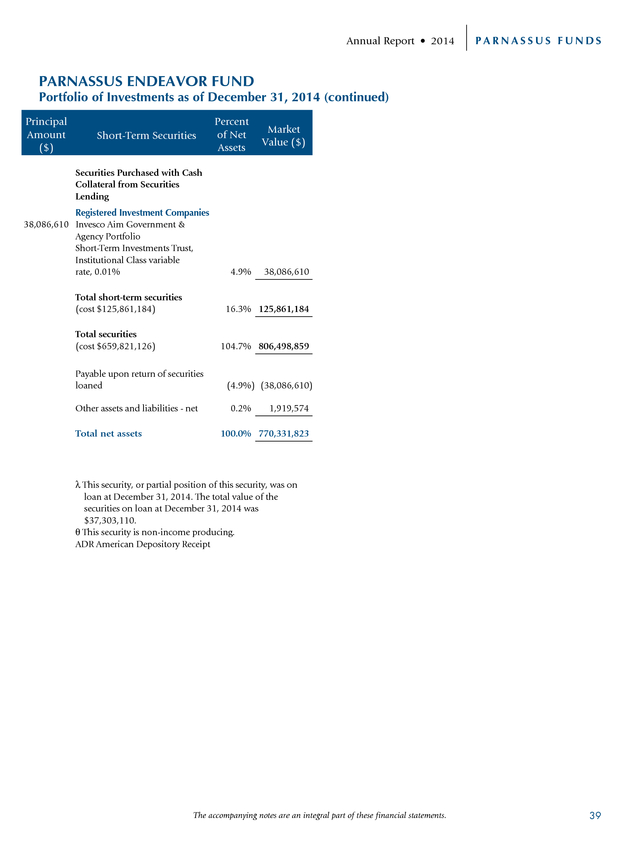
Parnassus Endeavor Fund.............................38
Parnassus Mid Cap Fund ..............................40
Parnassus Small Cap Fund ...........................42
Parnassus Asia Fund......................................44
Parnassus Fixed Income Fund ......................45
Financial Statements .....................................48
Notes to Financial Statements......................55
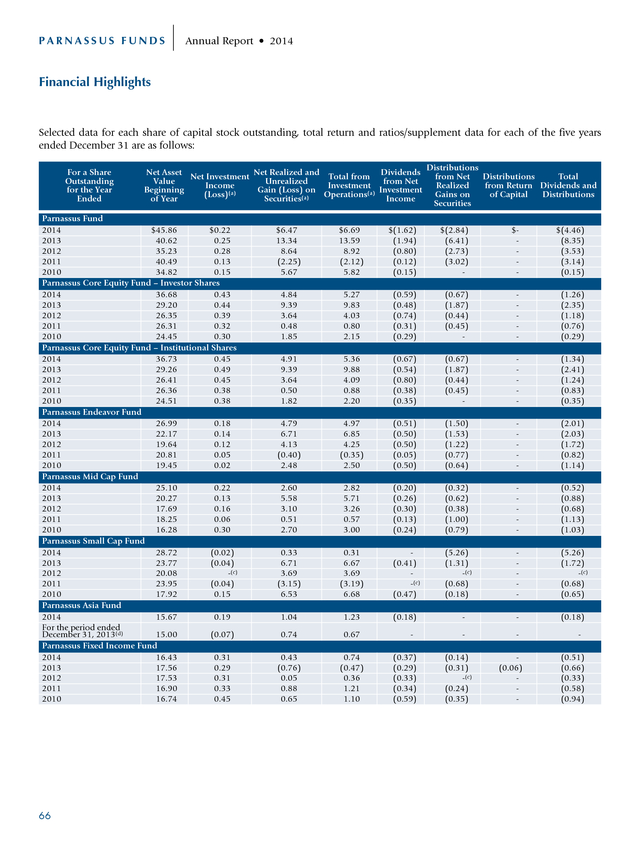
Financial Highlights......................................66
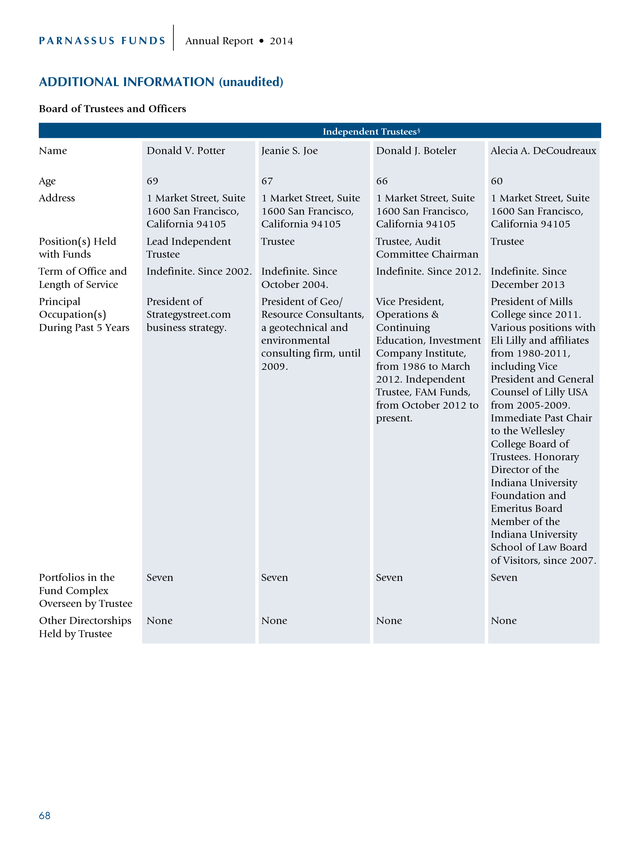
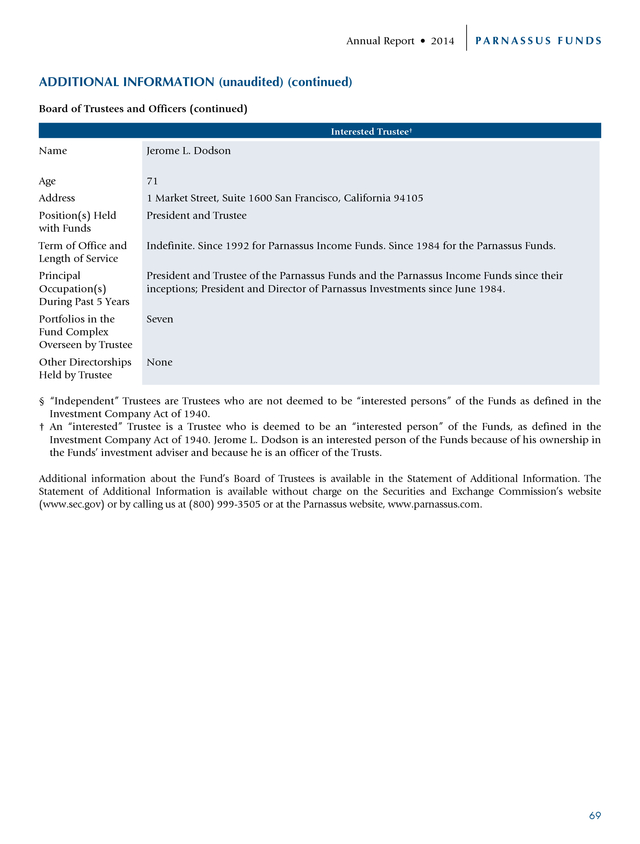
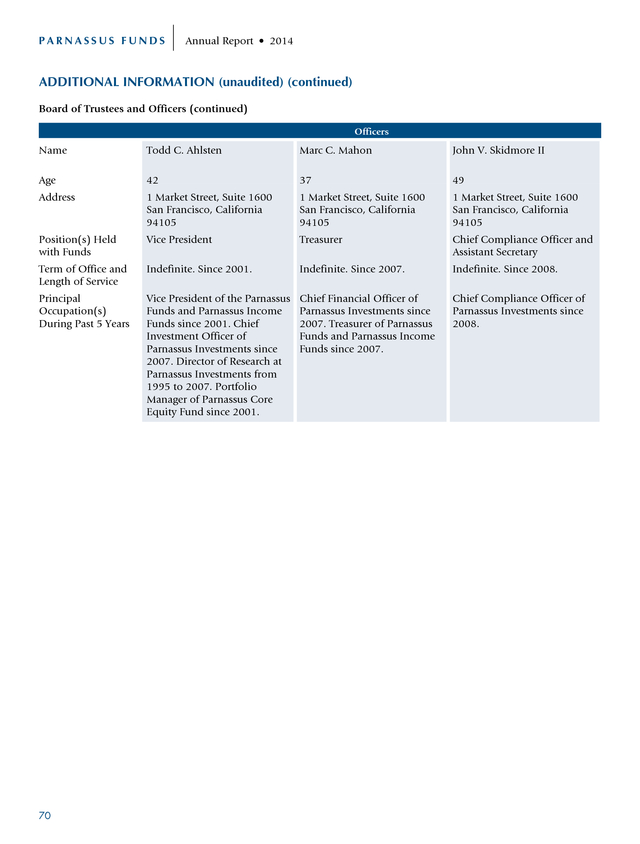
Additional Information ................................68
. PARNASSUS FUNDS
Annual Report • 2014
February 3, 2015
Dear Shareholder:
2014 was a great year for the economy and the stock market. GDP grew at an annual rate of 5.0% in the third quarter and
almost three million new jobs were created last year, which works out to an average of about 246,000 a month. This drove
the unemployment rate down to 5.6% from 6.7% at the beginning of the year.
The stock market went up 13.68%, as measured by the S&P 500 Index. Although it was a good year for stocks, it was not a
good year for stock-pickers.
According to Bloomberg, only 10% of the actively-managed equity mutual funds available in the United States were able to beat the S&P 500*. According to Lipper, the average diversified U.S. stock mutual fund gained only 7.60% in 2014. By comparison, the Parnassus Funds had a great year with four of our six equity funds beating their benchmarks.
In other words, 67% of our funds beat their respective indices, while only 10% of the other funds accomplished that feat. Although the Parnassus Mid Cap Fund did not beat its index, it did beat its Lipper peer group, so 83% of our funds were ahead of mutual funds with similar strategies. Our best-performing fund was the Parnassus Endeavor Fund (formerly the Parnassus Workplace Fund); it was up 18.51% for the year. This made it the fourth-best performer of the 770 multi-cap core funds followed by Lipper, and it was the third-best performer of 388 multi-cap core funds since the Fund was established on April 29, 2005.
(For the three- and five-year periods respectively, the Fund was #24 of 685 funds and #73 of 581 funds.) Second was the Parnassus Fund, which gained 14.68%, and a close third was the Parnassus Core Equity Fund-Investor Shares, which gained 14.48%. If you own shares in any of these three funds, you should be very happy. The fourth fund of note was the Parnassus Asia Fund, which returned 7.84% for the year. This may not sound like a lot, when you compare it to the 13.68% earned by the S&P 500, but when you compare it to the 0.39% return of the MSCI AC Asia Pacific Index, it sounds very good.
While the composite Asian markets were basically flat for the year in dollar terms, the Parnassus Asia Fund was up 7.84%. Enclosed you will find the annual reports for all our funds. We think you’ll find they will make very interesting reading. Company News The dynamic duo of Todd Ahlsten and Ben Allen, who manage our Parnassus Core Equity Fund, have just been named as one of the five finalists for Morningstar’s Domestic-Stock Fund Manager of the Year.
We congratulate them for this well-deserved recognition. Our senior research analyst Robert Klaber has just been named to the Forbes’ magazine list of 30 under 30 rising stars in finance. We offer our congratulations to 29-year old Robby. Parnassus Survey In the last three reports, I mentioned that I knew all of our shareholders by name 30 years ago, when I started the Parnassus Fund. In those days, we had only a few million dollars in assets, so communication was easy.
Although there’s no way I can know each of you by name now, I would like to know more about you and why you chose the Parnassus Funds. You can help me to gain a better understanding of our shareholders by completing a survey that should take you no more than five * 4 According to Bloomberg, as of December 31, 2014, 960 of 9,979 actively managed U.S. equity mutual funds had one-year annual returns that exceeded the 13.68% one-year annual return of the S&P 500 Index. .
Annual Report • 2014 PARNASSUS FUNDS minutes. Your answers will be completely anonymous and your privacy will be respected. To participate in the survey, please go to www.parnassus.com/survey. I thank all of you for investing with us. Yours truly, Jerome L. Dodson President Performance data quoted represent past performance and are no guarantee of future returns.
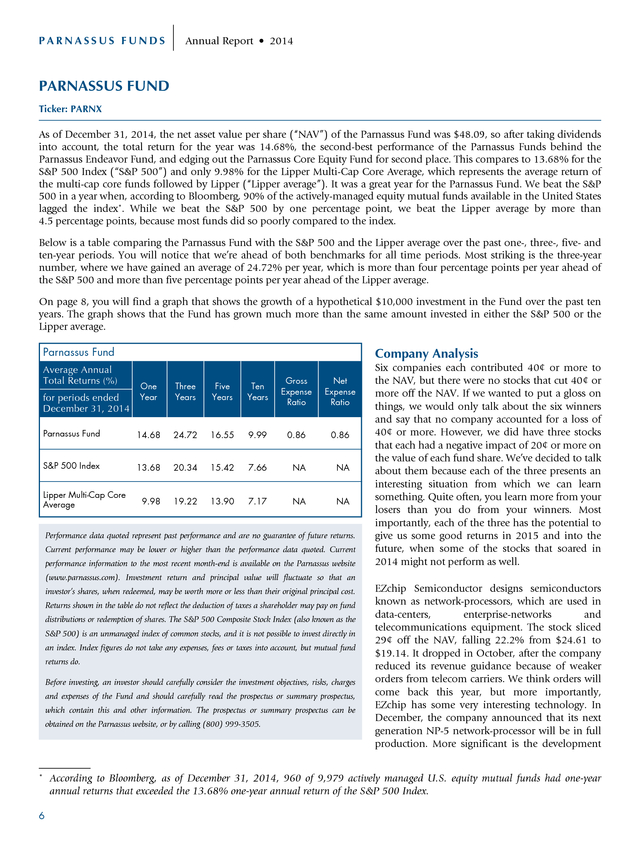
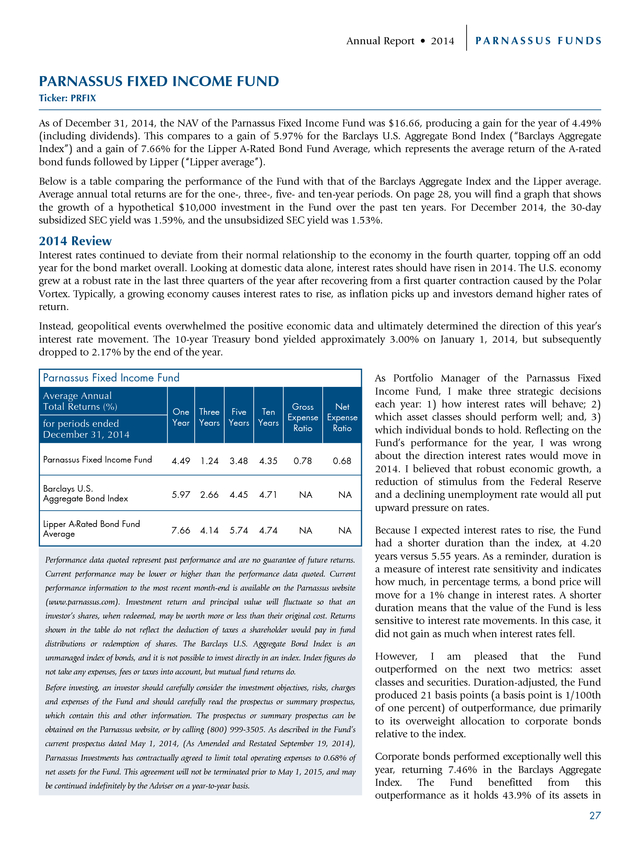
Current performance may be lower or higher than the performance data quoted. Please see the following pages for more detailed information regarding each Fund’s performance, including information regarding the Fund’s Lipper rankings, and the risks associated with investing in the Funds. 5 . PARNASSUS FUNDS Annual Report • 2014 PARNASSUS FUND Ticker: PARNX As of December 31, 2014, the net asset value per share (“NAV”) of the Parnassus Fund was $48.09, so after taking dividends into account, the total return for the year was 14.68%, the second-best performance of the Parnassus Funds behind the Parnassus Endeavor Fund, and edging out the Parnassus Core Equity Fund for second place. This compares to 13.68% for the S&P 500 Index (“S&P 500”) and only 9.98% for the Lipper Multi-Cap Core Average, which represents the average return of the multi-cap core funds followed by Lipper (“Lipper average”). It was a great year for the Parnassus Fund. We beat the S&P 500 in a year when, according to Bloomberg, 90% of the actively-managed equity mutual funds available in the United States lagged the index*.
While we beat the S&P 500 by one percentage point, we beat the Lipper average by more than 4.5 percentage points, because most funds did so poorly compared to the index. Below is a table comparing the Parnassus Fund with the S&P 500 and the Lipper average over the past one-, three-, five- and ten-year periods. You will notice that we’re ahead of both benchmarks for all time periods. Most striking is the three-year number, where we have gained an average of 24.72% per year, which is more than four percentage points per year ahead of the S&P 500 and more than five percentage points per year ahead of the Lipper average. On page 8, you will find a graph that shows the growth of a hypothetical $10,000 investment in the Fund over the past ten years.
The graph shows that the Fund has grown much more than the same amount invested in either the S&P 500 or the Lipper average. Parnassus Fund Average Annual Total Returns (%) Company Analysis One Year Three Years Five Years Ten Years Gross Expense Ratio Parnassus Fund 14.68 24.72 16.55 9.99 0.86 0.86 S&P 500 Index 13.68 20.34 15.42 7.66 NA NA 9.98 19.22 13.90 7.17 NA NA for periods ended December 31, 2014 Lipper Multi-Cap Core Average Net Expense Ratio Performance data quoted represent past performance and are no guarantee of future returns. Current performance may be lower or higher than the performance data quoted. Current performance information to the most recent month-end is available on the Parnassus website Six companies each contributed 40¢ or more to the NAV, but there were no stocks that cut 40¢ or more off the NAV. If we wanted to put a gloss on things, we would only talk about the six winners and say that no company accounted for a loss of 40¢ or more.
However, we did have three stocks that each had a negative impact of 20¢ or more on the value of each fund share. We’ve decided to talk about them because each of the three presents an interesting situation from which we can learn something. Quite often, you learn more from your losers than you do from your winners.
Most importantly, each of the three has the potential to give us some good returns in 2015 and into the future, when some of the stocks that soared in 2014 might not perform as well. (www.parnassus.com). Investment return and principal value will fluctuate so that an investor’s shares, when redeemed, may be worth more or less than their original principal cost. Returns shown in the table do not reflect the deduction of taxes a shareholder may pay on fund distributions or redemption of shares. The S&P 500 Composite Stock Index (also known as the S&P 500) is an unmanaged index of common stocks, and it is not possible to invest directly in an index.
Index figures do not take any expenses, fees or taxes into account, but mutual fund returns do. Before investing, an investor should carefully consider the investment objectives, risks, charges and expenses of the Fund and should carefully read the prospectus or summary prospectus, which contain this and other information. The prospectus or summary prospectus can be obtained on the Parnassus website, or by calling (800) 999-3505. * 6 EZchip Semiconductor designs semiconductors known as network-processors, which are used in data-centers, enterprise-networks and telecommunications equipment. The stock sliced 29¢ off the NAV, falling 22.2% from $24.61 to $19.14.
It dropped in October, after the company reduced its revenue guidance because of weaker orders from telecom carriers. We think orders will come back this year, but more importantly, EZchip has some very interesting technology. In December, the company announced that its next generation NP-5 network-processor will be in full production.
More significant is the development According to Bloomberg, as of December 31, 2014, 960 of 9,979 actively managed U.S. equity mutual funds had one-year annual returns that exceeded the 13.68% one-year annual return of the S&P 500 Index. . Annual Report • 2014 PARNASSUS FUNDS of the new NPS chip, which has more flexibility and could find a big market with all the data-center operators that want to design their own systems. International Business Machines (IBM) dropped 14.5% from $187.57 to $160.44 for a loss of 24¢ for each fund share. The stock rose in early 2014, after the company announced its decision to divest its lower-margin server business, and it raised the dividend. The stock reversed its earlier gains in the fall, as demand for its software and consulting services declined. We originally became interested in this stock when we saw that Warren Buffett had a big position in his Berkshire-Hathaway portfolio.
IBM’s performance shows that even great stock-pickers can be wrong – at least during certain periods. We’re holding onto the stock, because we think it’s undervalued and there’s not much downside risk. We think the restructuring initiatives and the investment in new software and services will eventually move the stock higher. Ciena, maker of optical equipment for telecommunications, cut 22¢ off the value of each fund share, as its stock dropped from $23.93 to $19.41.
The stock dropped 22.8% to $16.72 in the third quarter, when it announced that as part of negotiations for a major contract with AT&T, it was offering a big discount that would depress margins in the fourth quarter, but the margins would come back later. Stock market investors are notoriously short-sighted, so Ciena moved lower and we added to our position. The stock came back in the fourth quarter, climbing 16.1% to $19.41 by the end of the year.
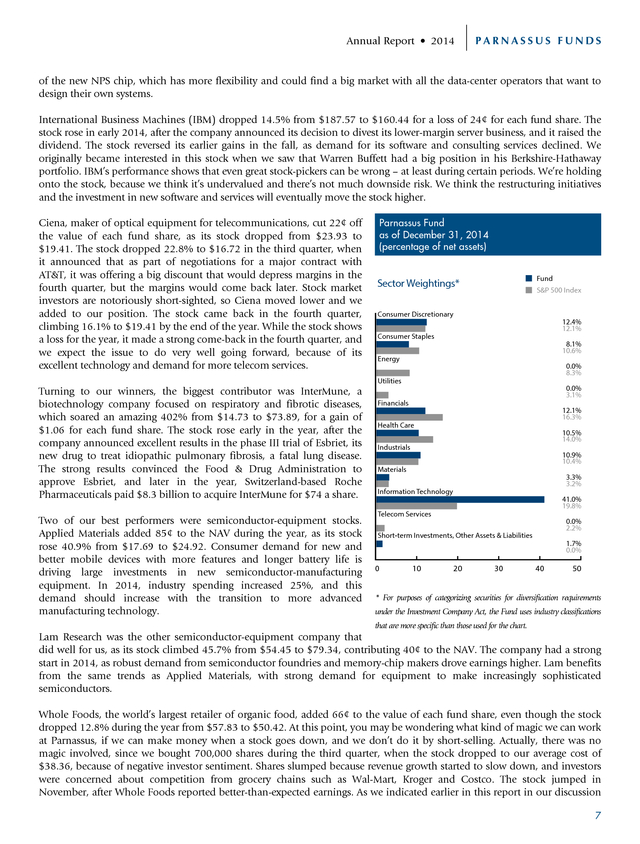
While the stock shows a loss for the year, it made a strong come-back in the fourth quarter, and we expect the issue to do very well going forward, because of its excellent technology and demand for more telecom services. Parnassus Fund as of December 31, 2014 (percentage of net assets) Fund Sector Weightings* S&P 500 Index Consumer Discretionary 12.4% 12.1% Consumer Staples 8.1% 10.6% Energy 0.0% 8.3% Utilities Turning to our winners, the biggest contributor was InterMune, a biotechnology company focused on respiratory and fibrotic diseases, which soared an amazing 402% from $14.73 to $73.89, for a gain of $1.06 for each fund share. The stock rose early in the year, after the company announced excellent results in the phase III trial of Esbriet, its new drug to treat idiopathic pulmonary fibrosis, a fatal lung disease. The strong results convinced the Food & Drug Administration to approve Esbriet, and later in the year, Switzerland-based Roche Pharmaceuticals paid $8.3 billion to acquire InterMune for $74 a share. Two of our best performers were semiconductor-equipment stocks. Applied Materials added 85¢ to the NAV during the year, as its stock rose 40.9% from $17.69 to $24.92. Consumer demand for new and better mobile devices with more features and longer battery life is driving large investments in new semiconductor-manufacturing equipment.
In 2014, industry spending increased 25%, and this demand should increase with the transition to more advanced manufacturing technology. 0.0% 3.1% Financials 12.1% 16.3% Health Care 10.5% 14.0% Industrials 10.9% 10.4% Materials 3.3% 3.2% Information Technology 41.0% 19.8% Telecom Services 0.0% 2.2% Short-term Investments, Other Assets & Liabilities 1.7% 0.0% 0 10 20 30 40 50 * For purposes of categorizing securities for diversification requirements under the Investment Company Act, the Fund uses industry classifications that are more specific than those used for the chart. Lam Research was the other semiconductor-equipment company that did well for us, as its stock climbed 45.7% from $54.45 to $79.34, contributing 40¢ to the NAV. The company had a strong start in 2014, as robust demand from semiconductor foundries and memory-chip makers drove earnings higher. Lam benefits from the same trends as Applied Materials, with strong demand for equipment to make increasingly sophisticated semiconductors. Whole Foods, the world’s largest retailer of organic food, added 66¢ to the value of each fund share, even though the stock dropped 12.8% during the year from $57.83 to $50.42.
At this point, you may be wondering what kind of magic we can work at Parnassus, if we can make money when a stock goes down, and we don’t do it by short-selling. Actually, there was no magic involved, since we bought 700,000 shares during the third quarter, when the stock dropped to our average cost of $38.36, because of negative investor sentiment. Shares slumped because revenue growth started to slow down, and investors were concerned about competition from grocery chains such as Wal-Mart, Kroger and Costco.
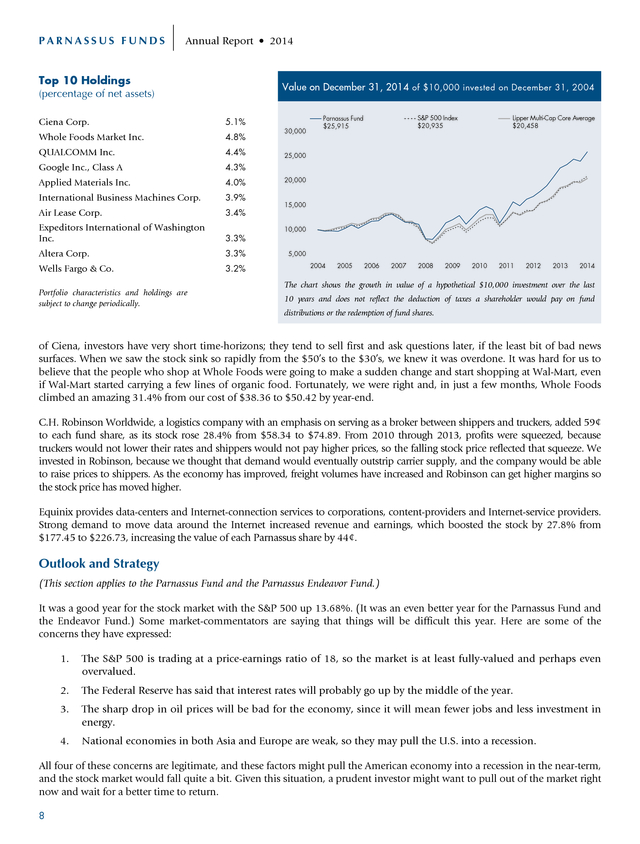
The stock jumped in November, after Whole Foods reported better-than-expected earnings. As we indicated earlier in this report in our discussion 7 . PARNASSUS FUNDS Annual Report • 2014 Top 10 Holdings (percentage of net assets) Ciena Corp. Value on December 31, 2014 of $10,000 invested on December 31, 2004 5.1% Whole Foods Market Inc. 4.8% QUALCOMM Inc. 4.4% Google Inc., Class A 4.0% International Business Machines Corp. 3.9% Air Lease Corp. 3.4% Expeditors International of Washington Inc. 3.3% Wells Fargo & Co. 3.2% Lipper Multi-Cap Core Average $20,458 3.3% Altera Corp. S&P 500 Index $20,935 Parnassus Fund $25,915 4.3% Applied Materials Inc. 30,000 Portfolio characteristics and holdings are subject to change periodically. 25,000 20,000 15,000 10,000 5,000 2004 2005 2006 2007 2008 2009 2010 2011 2012 2013 2014 The chart shows the growth in value of a hypothetical $10,000 investment over the last 10 years and does not reflect the deduction of taxes a shareholder would pay on fund distributions or the redemption of fund shares. of Ciena, investors have very short time-horizons; they tend to sell first and ask questions later, if the least bit of bad news surfaces. When we saw the stock sink so rapidly from the $50’s to the $30’s, we knew it was overdone. It was hard for us to believe that the people who shop at Whole Foods were going to make a sudden change and start shopping at Wal-Mart, even if Wal-Mart started carrying a few lines of organic food. Fortunately, we were right and, in just a few months, Whole Foods climbed an amazing 31.4% from our cost of $38.36 to $50.42 by year-end. C.H.
Robinson Worldwide, a logistics company with an emphasis on serving as a broker between shippers and truckers, added 59¢ to each fund share, as its stock rose 28.4% from $58.34 to $74.89. From 2010 through 2013, profits were squeezed, because truckers would not lower their rates and shippers would not pay higher prices, so the falling stock price reflected that squeeze. We invested in Robinson, because we thought that demand would eventually outstrip carrier supply, and the company would be able to raise prices to shippers.
As the economy has improved, freight volumes have increased and Robinson can get higher margins so the stock price has moved higher. Equinix provides data-centers and Internet-connection services to corporations, content-providers and Internet-service providers. Strong demand to move data around the Internet increased revenue and earnings, which boosted the stock by 27.8% from $177.45 to $226.73, increasing the value of each Parnassus share by 44¢. Outlook and Strategy (This section applies to the Parnassus Fund and the Parnassus Endeavor Fund.) It was a good year for the stock market with the S&P 500 up 13.68%. (It was an even better year for the Parnassus Fund and the Endeavor Fund.) Some market-commentators are saying that things will be difficult this year. Here are some of the concerns they have expressed: 1. The S&P 500 is trading at a price-earnings ratio of 18, so the market is at least fully-valued and perhaps even overvalued. 2. The Federal Reserve has said that interest rates will probably go up by the middle of the year. 3. The sharp drop in oil prices will be bad for the economy, since it will mean fewer jobs and less investment in energy. 4. National economies in both Asia and Europe are weak, so they may pull the U.S.
into a recession. All four of these concerns are legitimate, and these factors might pull the American economy into a recession in the near-term, and the stock market would fall quite a bit. Given this situation, a prudent investor might want to pull out of the market right now and wait for a better time to return. 8 . Annual Report • 2014 PARNASSUS FUNDS Although we acknowledge the validity of the four points, our view is somewhat different. First, while we agree that the market is fully-valued, that doesn’t mean that it will automatically go down. It can stay fully-valued for years without moving sharply lower. In fact, the market can become less than fully-valued without dropping at all, if companies grow their earnings.
(If the “E” in the P/E ratio goes up, that means the ratio goes down and the market becomes less than fully-valued or even undervalued.) In the current environment, businesses should be able to grow their earnings. Second, there is no doubt that the Federal Reserve will increase interest rates sometime this year, but this doesn’t mean that stocks will go down. If the Fed increases interest rates, that means the economy is getting better, and the stock market should go higher. Right now, it seems that the U.S.
economy is on the mend and is getting stronger by the day. Most encouraging is the increase in jobs, which has been running over 200,000 per month for a long time. A sharp spike in interest rates would probably move the market lower, but a gradual increase probably would not.
It’s unlikely that Janet Yellen would engineer a big hike in rates. Third, the sharp drop in oil prices is good for the economy. While it’s true that lower oil prices mean less investment and fewer jobs in the oil industry, most of the other industries should benefit. Operating costs for businesses will be lower, and people will have more money to spend on things other than gasoline.
Other parts of the economy will grow to make up for declines in the oil patch. Fourth, we’re concerned about the slowdown in Europe and Asia – especially Europe, since the Asian economies are more dynamic and will start growing again on their own. In the short-term, there’s not a lot of hope for Europe, but at some point, their economies will improve. The euro is now down to $1.18, so that should help their export industries.
Also, Mario Draghi, head of the European Central Bank, has finally started to pump a lot of money into the system, so that should help Europe the same way the Fed’s quantitative easing helped us. Finally, even though the market as a whole is fully-valued and may not go up much in 2015, our funds can still do well. It’s harder to find bargains now, but they do exist. For example, in this report, we talked about how Whole Foods and Target dropped down to very low levels, because of temporary conditions or over misunderstandings.
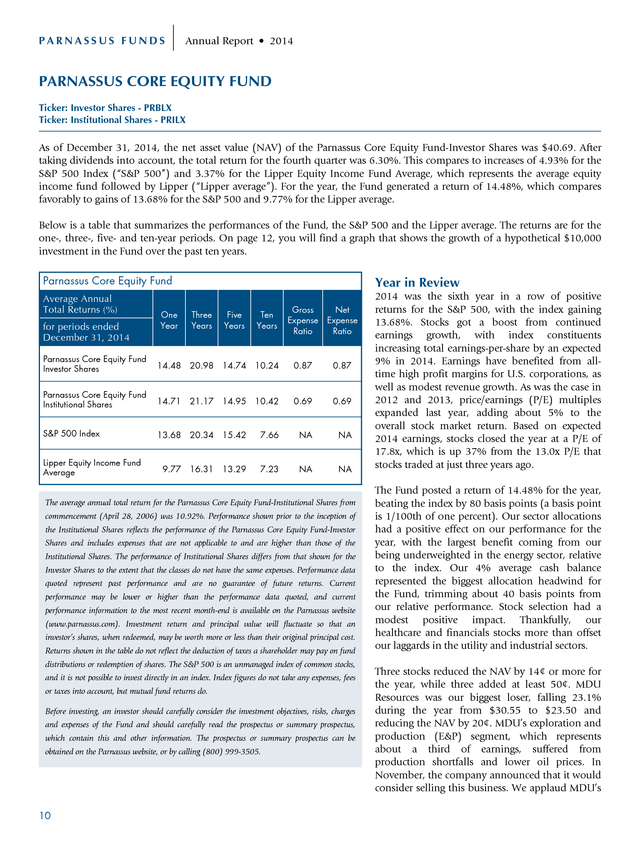
There may be more opportunities like these, and we’ll work hard to find them. Yours truly, Jerome L. Dodson Lead Portfolio Manager Ian Sexsmith Portfolio Manager 9 . PARNASSUS FUNDS Annual Report • 2014 PARNASSUS CORE EQUITY FUND Ticker: Investor Shares - PRBLX Ticker: Institutional Shares - PRILX As of December 31, 2014, the net asset value (NAV) of the Parnassus Core Equity Fund-Investor Shares was $40.69. After taking dividends into account, the total return for the fourth quarter was 6.30%. This compares to increases of 4.93% for the S&P 500 Index (“S&P 500”) and 3.37% for the Lipper Equity Income Fund Average, which represents the average equity income fund followed by Lipper (“Lipper average”). For the year, the Fund generated a return of 14.48%, which compares favorably to gains of 13.68% for the S&P 500 and 9.77% for the Lipper average. Below is a table that summarizes the performances of the Fund, the S&P 500 and the Lipper average.
The returns are for the one-, three-, five- and ten-year periods. On page 12, you will find a graph that shows the growth of a hypothetical $10,000 investment in the Fund over the past ten years. Parnassus Core Equity Fund Average Annual Total Returns (%) Year in Review Gross Net Expense Expense Ratio Ratio One Year Three Years Five Years Ten Years Parnassus Core Equity Fund Investor Shares 14.48 20.98 14.74 10.24 0.87 0.87 Parnassus Core Equity Fund Institutional Shares 14.71 21.17 14.95 10.42 0.69 0.69 S&P 500 Index 13.68 20.34 15.42 7.66 NA NA 9.77 16.31 13.29 7.23 NA NA for periods ended December 31, 2014 Lipper Equity Income Fund Average The average annual total return for the Parnassus Core Equity Fund-Institutional Shares from commencement (April 28, 2006) was 10.92%. Performance shown prior to the inception of the Institutional Shares reflects the performance of the Parnassus Core Equity Fund-Investor Shares and includes expenses that are not applicable to and are higher than those of the Institutional Shares.
The performance of Institutional Shares differs from that shown for the Investor Shares to the extent that the classes do not have the same expenses. Performance data quoted represent past performance and are no guarantee of future returns. Current performance may be lower or higher than the performance data quoted, and current performance information to the most recent month-end is available on the Parnassus website (www.parnassus.com).
Investment return and principal value will fluctuate so that an investor’s shares, when redeemed, may be worth more or less than their original principal cost. Returns shown in the table do not reflect the deduction of taxes a shareholder may pay on fund distributions or redemption of shares. The S&P 500 is an unmanaged index of common stocks, and it is not possible to invest directly in an index. Index figures do not take any expenses, fees or taxes into account, but mutual fund returns do. Before investing, an investor should carefully consider the investment objectives, risks, charges and expenses of the Fund and should carefully read the prospectus or summary prospectus, which contain this and other information.
The prospectus or summary prospectus can be obtained on the Parnassus website, or by calling (800) 999-3505. 10 2014 was the sixth year in a row of positive returns for the S&P 500, with the index gaining 13.68%. Stocks got a boost from continued earnings growth, with index constituents increasing total earnings-per-share by an expected 9% in 2014. Earnings have benefited from alltime high profit margins for U.S.
corporations, as well as modest revenue growth. As was the case in 2012 and 2013, price/earnings (P/E) multiples expanded last year, adding about 5% to the overall stock market return. Based on expected 2014 earnings, stocks closed the year at a P/E of 17.8x, which is up 37% from the 13.0x P/E that stocks traded at just three years ago. The Fund posted a return of 14.48% for the year, beating the index by 80 basis points (a basis point is 1/100th of one percent).
Our sector allocations had a positive effect on our performance for the year, with the largest benefit coming from our being underweighted in the energy sector, relative to the index. Our 4% average cash balance represented the biggest allocation headwind for the Fund, trimming about 40 basis points from our relative performance. Stock selection had a modest positive impact.
Thankfully, our healthcare and financials stocks more than offset our laggards in the utility and industrial sectors. Three stocks reduced the NAV by 14¢ or more for the year, while three added at least 50¢. MDU Resources was our biggest loser, falling 23.1% during the year from $30.55 to $23.50 and reducing the NAV by 20¢. MDU’s exploration and production (E&P) segment, which represents about a third of earnings, suffered from production shortfalls and lower oil prices.
In November, the company announced that it would consider selling this business. We applaud MDU’s . Annual Report • 2014 PARNASSUS FUNDS strategy to evaluate a divestiture, because its E&P segment is capital intensive and has generated low and volatile returns. We still like MDU’s remaining businesses, which are unique assets with good growth potential. One project we’re especially excited about is a $200 million wind farm investment recently proposed by MDU’s utility division. National Oilwell Varco (NOV), a leading provider of oil and gas services, fell 17.6% during 2014 to $65.53 from $79.53 and reduced the NAV by 18¢. The stock fell as the price of a barrel of oil plunged 46.0% during 2014 from $99 to $53.
This precipitous drop means that E&P companies will have less money to drill wells in 2015. Despite this short-term move down in oil prices, we are still bullish about NOV’s long-term outlook. We expect the capital intensity of the E&P industry (i.e., the dollars required to drill new wells) to increase long-term, which benefits equipment-providers like NOV.
Furthermore, we think the company has the best suite of products and services to help companies drill wells safely in complex geological formations. Pentair, a company that sells pumps, valves, filters and other waterrelated products, declined 14.5% during the year to $66.42 from $77.67, trimming the NAV by 14¢. Since 19% of Pentair’s sales are linked to oil and gas, the stock slid as investors feared that lower oil prices would reduce the company’s earnings next year. We think that investors have overreacted, because only 5% of Pentair’s sales are related to upstream energy (i.e., at the well site).
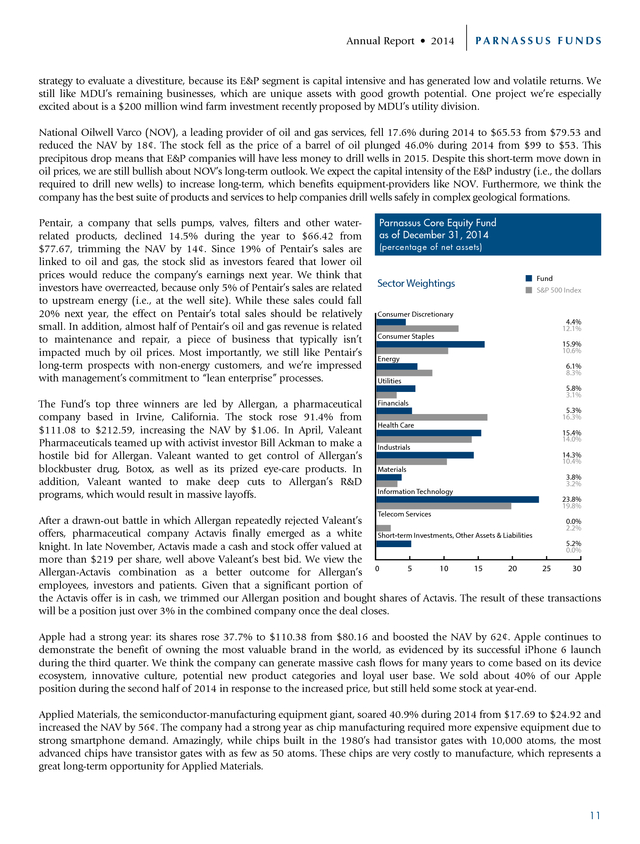
While these sales could fall 20% next year, the effect on Pentair’s total sales should be relatively small. In addition, almost half of Pentair’s oil and gas revenue is related to maintenance and repair, a piece of business that typically isn’t impacted much by oil prices. Most importantly, we still like Pentair’s long-term prospects with non-energy customers, and we’re impressed with management’s commitment to “lean enterprise” processes. Parnassus Core Equity Fund as of December 31, 2014 (percentage of net assets) Sector Weightings Fund S&P 500 Index Consumer Discretionary 4.4% 12.1% Consumer Staples 15.9% 10.6% Energy 6.1% 8.3% Utilities 5.8% 3.1% The Fund’s top three winners are led by Allergan, a pharmaceutical company based in Irvine, California.
The stock rose 91.4% from $111.08 to $212.59, increasing the NAV by $1.06. In April, Valeant Pharmaceuticals teamed up with activist investor Bill Ackman to make a hostile bid for Allergan. Valeant wanted to get control of Allergan’s blockbuster drug, Botox, as well as its prized eye-care products.
In addition, Valeant wanted to make deep cuts to Allergan’s R&D programs, which would result in massive layoffs. Financials 5.3% 16.3% Health Care 15.4% 14.0% Industrials 14.3% 10.4% Materials 3.8% 3.2% Information Technology 23.8% 19.8% Telecom Services After a drawn-out battle in which Allergan repeatedly rejected Valeant’s 0.0% 2.2% offers, pharmaceutical company Actavis finally emerged as a white Short-term Investments, Other Assets & Liabilities 5.2% knight. In late November, Actavis made a cash and stock offer valued at 0.0% more than $219 per share, well above Valeant’s best bid. We view the 5 10 15 20 25 30 Allergan-Actavis combination as a better outcome for Allergan’s 0 employees, investors and patients.
Given that a significant portion of the Actavis offer is in cash, we trimmed our Allergan position and bought shares of Actavis. The result of these transactions will be a position just over 3% in the combined company once the deal closes. Apple had a strong year: its shares rose 37.7% to $110.38 from $80.16 and boosted the NAV by 62¢. Apple continues to demonstrate the benefit of owning the most valuable brand in the world, as evidenced by its successful iPhone 6 launch during the third quarter.
We think the company can generate massive cash flows for many years to come based on its device ecosystem, innovative culture, potential new product categories and loyal user base. We sold about 40% of our Apple position during the second half of 2014 in response to the increased price, but still held some stock at year-end. Applied Materials, the semiconductor-manufacturing equipment giant, soared 40.9% during 2014 from $17.69 to $24.92 and increased the NAV by 56¢. The company had a strong year as chip manufacturing required more expensive equipment due to strong smartphone demand.
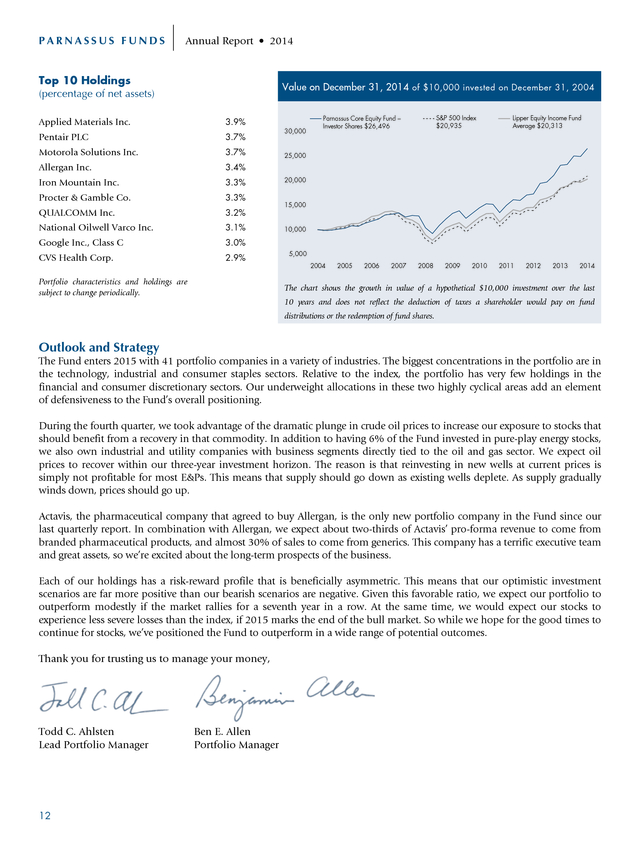
Amazingly, while chips built in the 1980’s had transistor gates with 10,000 atoms, the most advanced chips have transistor gates with as few as 50 atoms. These chips are very costly to manufacture, which represents a great long-term opportunity for Applied Materials. 11 . PARNASSUS FUNDS Annual Report • 2014 Top 10 Holdings (percentage of net assets) Applied Materials Inc. Value on December 31, 2014 of $10,000 invested on December 31, 2004 3.9% Pentair PLC 3.7% Motorola Solutions Inc. 3.7% Allergan Inc. 3.3% Procter & Gamble Co. 3.3% QUALCOMM Inc. 3.2% National Oilwell Varco Inc. 3.1% Google Inc., Class C 2.9% Lipper Equity Income Fund Average $20,313 3.0% CVS Health Corp. S&P 500 Index $20,935 Parnassus Core Equity Fund – Investor Shares $26,496 3.4% Iron Mountain Inc. 30,000 Portfolio characteristics and holdings are subject to change periodically. 25,000 20,000 15,000 10,000 5,000 2004 2005 2006 2007 2008 2009 2010 2011 2012 2013 2014 The chart shows the growth in value of a hypothetical $10,000 investment over the last 10 years and does not reflect the deduction of taxes a shareholder would pay on fund distributions or the redemption of fund shares. Outlook and Strategy The Fund enters 2015 with 41 portfolio companies in a variety of industries. The biggest concentrations in the portfolio are in the technology, industrial and consumer staples sectors. Relative to the index, the portfolio has very few holdings in the financial and consumer discretionary sectors. Our underweight allocations in these two highly cyclical areas add an element of defensiveness to the Fund’s overall positioning. During the fourth quarter, we took advantage of the dramatic plunge in crude oil prices to increase our exposure to stocks that should benefit from a recovery in that commodity.
In addition to having 6% of the Fund invested in pure-play energy stocks, we also own industrial and utility companies with business segments directly tied to the oil and gas sector. We expect oil prices to recover within our three-year investment horizon. The reason is that reinvesting in new wells at current prices is simply not profitable for most E&Ps.
This means that supply should go down as existing wells deplete. As supply gradually winds down, prices should go up. Actavis, the pharmaceutical company that agreed to buy Allergan, is the only new portfolio company in the Fund since our last quarterly report. In combination with Allergan, we expect about two-thirds of Actavis’ pro-forma revenue to come from branded pharmaceutical products, and almost 30% of sales to come from generics.
This company has a terrific executive team and great assets, so we’re excited about the long-term prospects of the business. Each of our holdings has a risk-reward profile that is beneficially asymmetric. This means that our optimistic investment scenarios are far more positive than our bearish scenarios are negative. Given this favorable ratio, we expect our portfolio to outperform modestly if the market rallies for a seventh year in a row.
At the same time, we would expect our stocks to experience less severe losses than the index, if 2015 marks the end of the bull market. So while we hope for the good times to continue for stocks, we’ve positioned the Fund to outperform in a wide range of potential outcomes. Thank you for trusting us to manage your money, Todd C. Ahlsten Lead Portfolio Manager 12 Ben E.
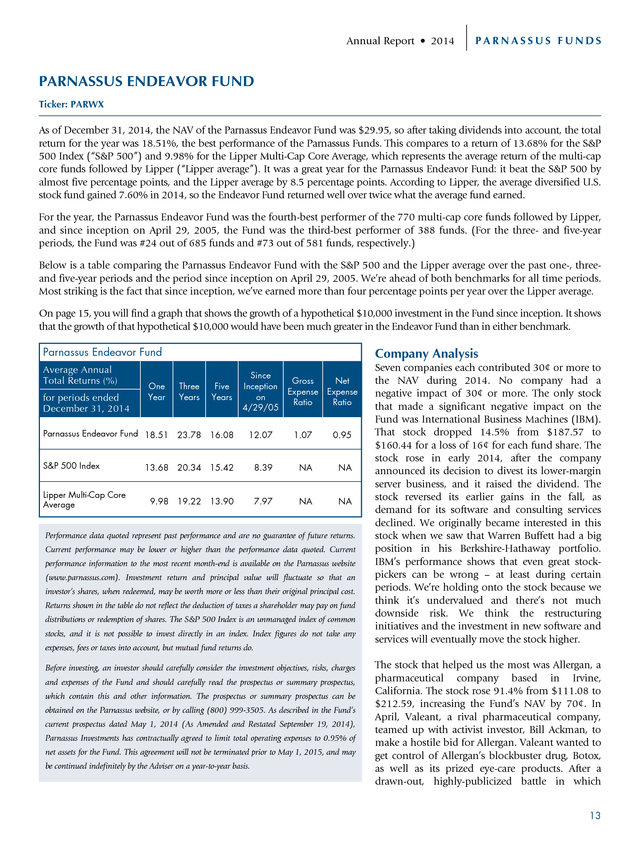
Allen Portfolio Manager . Annual Report • 2014 PARNASSUS FUNDS PARNASSUS ENDEAVOR FUND Ticker: PARWX As of December 31, 2014, the NAV of the Parnassus Endeavor Fund was $29.95, so after taking dividends into account, the total return for the year was 18.51%, the best performance of the Parnassus Funds. This compares to a return of 13.68% for the S&P 500 Index (“S&P 500”) and 9.98% for the Lipper Multi-Cap Core Average, which represents the average return of the multi-cap core funds followed by Lipper (“Lipper average”). It was a great year for the Parnassus Endeavor Fund: it beat the S&P 500 by almost five percentage points, and the Lipper average by 8.5 percentage points. According to Lipper, the average diversified U.S. stock fund gained 7.60% in 2014, so the Endeavor Fund returned well over twice what the average fund earned. For the year, the Parnassus Endeavor Fund was the fourth-best performer of the 770 multi-cap core funds followed by Lipper, and since inception on April 29, 2005, the Fund was the third-best performer of 388 funds.
(For the three- and five-year periods, the Fund was #24 out of 685 funds and #73 out of 581 funds, respectively.) Below is a table comparing the Parnassus Endeavor Fund with the S&P 500 and the Lipper average over the past one-, threeand five-year periods and the period since inception on April 29, 2005. We’re ahead of both benchmarks for all time periods. Most striking is the fact that since inception, we’ve earned more than four percentage points per year over the Lipper average. On page 15, you will find a graph that shows the growth of a hypothetical $10,000 investment in the Fund since inception. It shows that the growth of that hypothetical $10,000 would have been much greater in the Endeavor Fund than in either benchmark. Parnassus Endeavor Fund Average Annual Total Returns (%) Company Analysis Three Years Five Years Since Inception on 4/29/05 Parnassus Endeavor Fund 18.51 23.78 16.08 12.07 1.07 0.95 S&P 500 Index 13.68 20.34 15.42 8.39 NA NA 9.98 19.22 13.90 7.97 NA NA for periods ended December 31, 2014 Lipper Multi-Cap Core Average One Year Gross Net Expense Expense Ratio Ratio Performance data quoted represent past performance and are no guarantee of future returns. Current performance may be lower or higher than the performance data quoted.
Current performance information to the most recent month-end is available on the Parnassus website (www.parnassus.com). Investment return and principal value will fluctuate so that an investor’s shares, when redeemed, may be worth more or less than their original principal cost. Returns shown in the table do not reflect the deduction of taxes a shareholder may pay on fund distributions or redemption of shares. The S&P 500 Index is an unmanaged index of common stocks, and it is not possible to invest directly in an index.
Index figures do not take any expenses, fees or taxes into account, but mutual fund returns do. Before investing, an investor should carefully consider the investment objectives, risks, charges and expenses of the Fund and should carefully read the prospectus or summary prospectus, which contain this and other information. The prospectus or summary prospectus can be obtained on the Parnassus website, or by calling (800) 999-3505. As described in the Fund’s current prospectus dated May 1, 2014 (As Amended and Restated September 19, 2014), Parnassus Investments has contractually agreed to limit total operating expenses to 0.95% of net assets for the Fund.
This agreement will not be terminated prior to May 1, 2015, and may be continued indefinitely by the Adviser on a year-to-year basis. Seven companies each contributed 30¢ or more to the NAV during 2014. No company had a negative impact of 30¢ or more. The only stock that made a significant negative impact on the Fund was International Business Machines (IBM). That stock dropped 14.5% from $187.57 to $160.44 for a loss of 16¢ for each fund share.
The stock rose in early 2014, after the company announced its decision to divest its lower-margin server business, and it raised the dividend. The stock reversed its earlier gains in the fall, as demand for its software and consulting services declined. We originally became interested in this stock when we saw that Warren Buffett had a big position in his Berkshire-Hathaway portfolio. IBM’s performance shows that even great stockpickers can be wrong – at least during certain periods.
We’re holding onto the stock because we think it’s undervalued and there’s not much downside risk. We think the restructuring initiatives and the investment in new software and services will eventually move the stock higher. The stock that helped us the most was Allergan, a pharmaceutical company based in Irvine, California. The stock rose 91.4% from $111.08 to $212.59, increasing the Fund’s NAV by 70¢.
In April, Valeant, a rival pharmaceutical company, teamed up with activist investor, Bill Ackman, to make a hostile bid for Allergan. Valeant wanted to get control of Allergan’s blockbuster drug, Botox, as well as its prized eye-care products. After a drawn-out, highly-publicized battle in which 13 .
PARNASSUS FUNDS Annual Report • 2014 Allergan repeatedly rejected Valeant’s offers, Actavis, another pharmaceutical company, emerged as a white knight, making a cash and stock-offer valued at more than $219 per share. We view the Allergan-Actavis combination as a better outcome for Allergan and its employees. Whole Foods, the world’s largest retailer of organic foods, added 48¢ to the value of each fund share, even though the stock dropped 12.8% during the year from $57.83 to $50.42. At this point, you may be wondering what kind of magic we can work at Parnassus, if we can make money when a stock goes down, and we don’t do it by short-selling. Actually, there was no magic involved: we bought 700,000 shares during the third quarter, when the stock dropped to our average cost of $38.36, because of Parnassus Endeavor Fund as of December 31, 2014 negative investor sentiment.
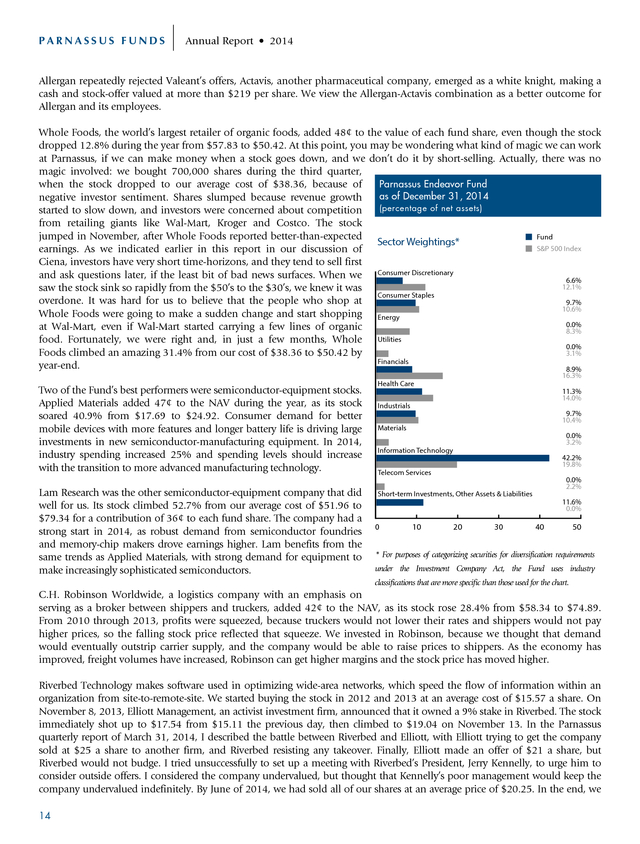
Shares slumped because revenue growth (percentage of net assets) started to slow down, and investors were concerned about competition from retailing giants like Wal-Mart, Kroger and Costco. The stock jumped in November, after Whole Foods reported better-than-expected Fund Sector Weightings* S&P 500 Index earnings. As we indicated earlier in this report in our discussion of Ciena, investors have very short time-horizons, and they tend to sell first and ask questions later, if the least bit of bad news surfaces.
When we Consumer Discretionary 6.6% 12.1% saw the stock sink so rapidly from the $50’s to the $30’s, we knew it was Consumer Staples overdone. It was hard for us to believe that the people who shop at 9.7% 10.6% Whole Foods were going to make a sudden change and start shopping Energy 0.0% at Wal-Mart, even if Wal-Mart started carrying a few lines of organic 8.3% food. Fortunately, we were right and, in just a few months, Whole Utilities 0.0% Foods climbed an amazing 31.4% from our cost of $38.36 to $50.42 by 3.1% Financials year-end. 8.9% 16.3% Two of the Fund’s best performers were semiconductor-equipment stocks. Applied Materials added 47¢ to the NAV during the year, as its stock soared 40.9% from $17.69 to $24.92.
Consumer demand for better mobile devices with more features and longer battery life is driving large investments in new semiconductor-manufacturing equipment. In 2014, industry spending increased 25% and spending levels should increase with the transition to more advanced manufacturing technology. Lam Research was the other semiconductor-equipment company that did well for us. Its stock climbed 52.7% from our average cost of $51.96 to $79.34 for a contribution of 36¢ to each fund share.
The company had a strong start in 2014, as robust demand from semiconductor foundries and memory-chip makers drove earnings higher. Lam benefits from the same trends as Applied Materials, with strong demand for equipment to make increasingly sophisticated semiconductors. Health Care 11.3% 14.0% Industrials 9.7% 10.4% Materials 0.0% 3.2% Information Technology 42.2% 19.8% Telecom Services 0.0% 2.2% Short-term Investments, Other Assets & Liabilities 11.6% 0.0% 0 10 20 30 40 50 * For purposes of categorizing securities for diversification requirements under the Investment Company Act, the Fund uses industry classifications that are more specific than those used for the chart. C.H. Robinson Worldwide, a logistics company with an emphasis on serving as a broker between shippers and truckers, added 42¢ to the NAV, as its stock rose 28.4% from $58.34 to $74.89. From 2010 through 2013, profits were squeezed, because truckers would not lower their rates and shippers would not pay higher prices, so the falling stock price reflected that squeeze.
We invested in Robinson, because we thought that demand would eventually outstrip carrier supply, and the company would be able to raise prices to shippers. As the economy has improved, freight volumes have increased, Robinson can get higher margins and the stock price has moved higher. Riverbed Technology makes software used in optimizing wide-area networks, which speed the flow of information within an organization from site-to-remote-site. We started buying the stock in 2012 and 2013 at an average cost of $15.57 a share.
On November 8, 2013, Elliott Management, an activist investment firm, announced that it owned a 9% stake in Riverbed. The stock immediately shot up to $17.54 from $15.11 the previous day, then climbed to $19.04 on November 13. In the Parnassus quarterly report of March 31, 2014, I described the battle between Riverbed and Elliott, with Elliott trying to get the company sold at $25 a share to another firm, and Riverbed resisting any takeover.
Finally, Elliott made an offer of $21 a share, but Riverbed would not budge. I tried unsuccessfully to set up a meeting with Riverbed’s President, Jerry Kennelly, to urge him to consider outside offers. I considered the company undervalued, but thought that Kennelly’s poor management would keep the company undervalued indefinitely.
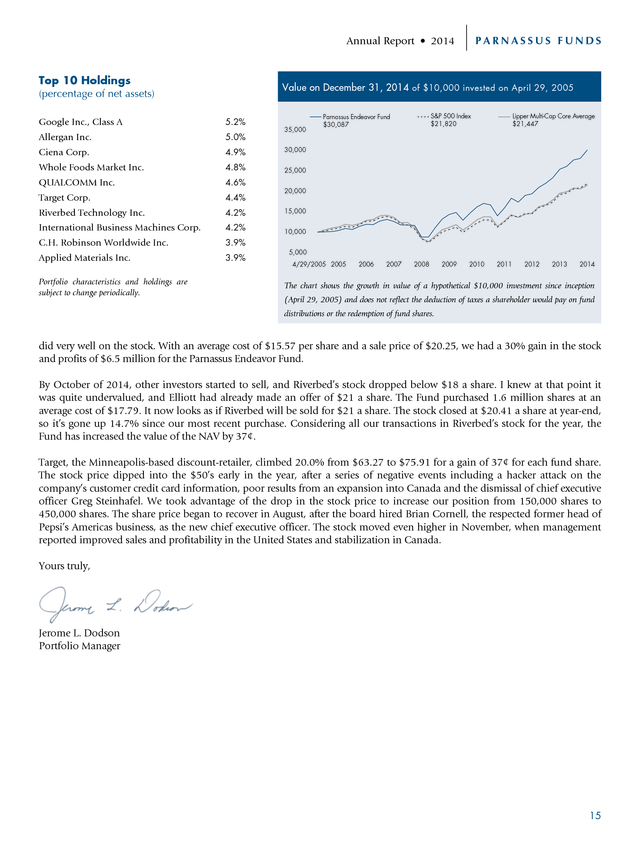
By June of 2014, we had sold all of our shares at an average price of $20.25. In the end, we 14 . PARNASSUS FUNDS Annual Report • 2014 Top 10 Holdings (percentage of net assets) Value on December 31, 2014 of $10,000 invested on April 29, 2005 Google Inc., Class A 5.2% Allergan Inc. 5.0% Ciena Corp. 4.9% Whole Foods Market Inc. 4.8% 4.6% Target Corp. 4.4% Riverbed Technology Inc. 4.2% 15,000 International Business Machines Corp. 4.2% 10,000 C.H. Robinson Worldwide Inc. 3.9% Applied Materials Inc. 3.9% Lipper Multi-Cap Core Average $21,447 25,000 QUALCOMM Inc. S&P 500 Index $21,820 Parnassus Endeavor Fund $30,087 30,000 Portfolio characteristics and holdings are subject to change periodically. 35,000 20,000 5,000 4/29/2005 2005 2006 2007 2008 2009 2010 2011 2012 2013 2014 The chart shows the growth in value of a hypothetical $10,000 investment since inception (April 29, 2005) and does not reflect the deduction of taxes a shareholder would pay on fund distributions or the redemption of fund shares. did very well on the stock. With an average cost of $15.57 per share and a sale price of $20.25, we had a 30% gain in the stock and profits of $6.5 million for the Parnassus Endeavor Fund. By October of 2014, other investors started to sell, and Riverbed’s stock dropped below $18 a share. I knew at that point it was quite undervalued, and Elliott had already made an offer of $21 a share.
The Fund purchased 1.6 million shares at an average cost of $17.79. It now looks as if Riverbed will be sold for $21 a share. The stock closed at $20.41 a share at year-end, so it’s gone up 14.7% since our most recent purchase.
Considering all our transactions in Riverbed’s stock for the year, the Fund has increased the value of the NAV by 37¢. Target, the Minneapolis-based discount-retailer, climbed 20.0% from $63.27 to $75.91 for a gain of 37¢ for each fund share. The stock price dipped into the $50’s early in the year, after a series of negative events including a hacker attack on the company’s customer credit card information, poor results from an expansion into Canada and the dismissal of chief executive officer Greg Steinhafel. We took advantage of the drop in the stock price to increase our position from 150,000 shares to 450,000 shares. The share price began to recover in August, after the board hired Brian Cornell, the respected former head of Pepsi’s Americas business, as the new chief executive officer.
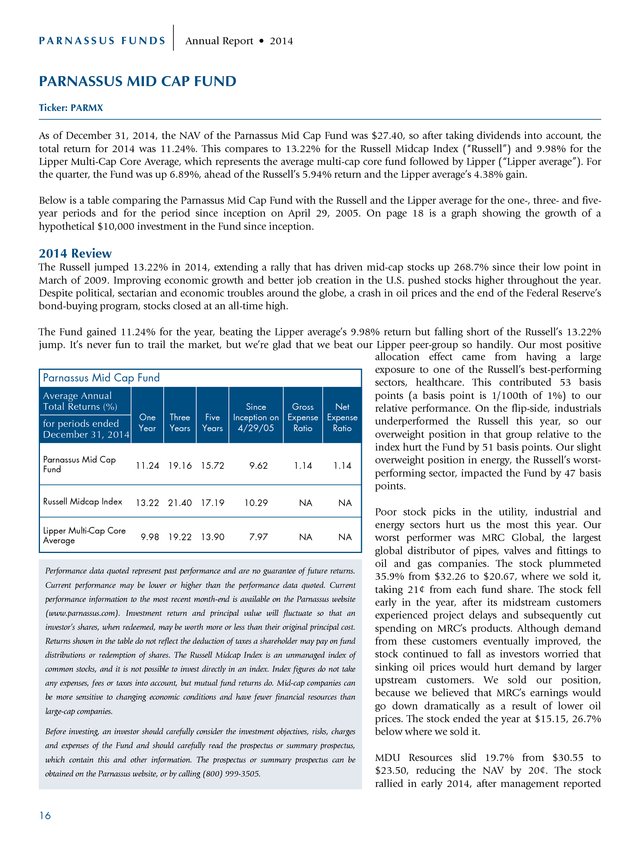
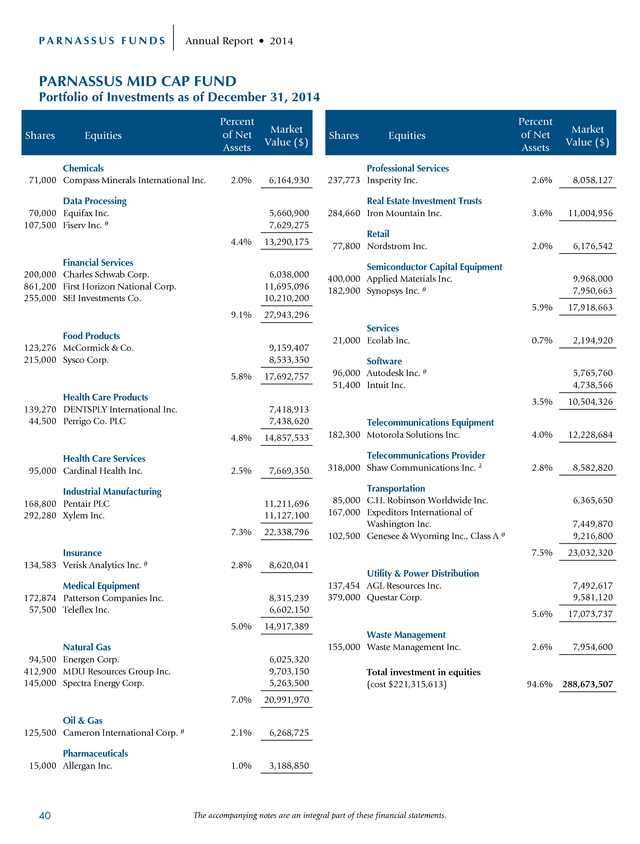
The stock moved even higher in November, when management reported improved sales and profitability in the United States and stabilization in Canada. Yours truly, Jerome L. Dodson Portfolio Manager 15 . PARNASSUS FUNDS Annual Report • 2014 PARNASSUS MID CAP FUND Ticker: PARMX As of December 31, 2014, the NAV of the Parnassus Mid Cap Fund was $27.40, so after taking dividends into account, the total return for 2014 was 11.24%. This compares to 13.22% for the Russell Midcap Index (“Russell”) and 9.98% for the Lipper Multi-Cap Core Average, which represents the average multi-cap core fund followed by Lipper (“Lipper average”). For the quarter, the Fund was up 6.89%, ahead of the Russell’s 5.94% return and the Lipper average’s 4.38% gain. Below is a table comparing the Parnassus Mid Cap Fund with the Russell and the Lipper average for the one-, three- and fiveyear periods and for the period since inception on April 29, 2005. On page 18 is a graph showing the growth of a hypothetical $10,000 investment in the Fund since inception. 2014 Review The Russell jumped 13.22% in 2014, extending a rally that has driven mid-cap stocks up 268.7% since their low point in March of 2009.
Improving economic growth and better job creation in the U.S. pushed stocks higher throughout the year. Despite political, sectarian and economic troubles around the globe, a crash in oil prices and the end of the Federal Reserve’s bond-buying program, stocks closed at an all-time high. The Fund gained 11.24% for the year, beating the Lipper average’s 9.98% return but falling short of the Russell’s 13.22% jump. It’s never fun to trail the market, but we’re glad that we beat our Lipper peer-group so handily.
Our most positive allocation effect came from having a large exposure to one of the Russell’s best-performing Parnassus Mid Cap Fund sectors, healthcare. This contributed 53 basis Average Annual points (a basis point is 1/100th of 1%) to our Total Returns (%) Since Gross Net relative performance. On the flip-side, industrials One Three Five Inception on Expense Expense underperformed the Russell this year, so our for periods ended Year Years Years 4/29/05 Ratio Ratio December 31, 2014 overweight position in that group relative to the index hurt the Fund by 51 basis points.
Our slight Parnassus Mid Cap overweight position in energy, the Russell’s worst11.24 19.16 15.72 9.62 1.14 1.14 Fund performing sector, impacted the Fund by 47 basis points. Russell Midcap Index Lipper Multi-Cap Core Average 13.22 21.40 17.19 10.29 NA NA 9.98 19.22 13.90 7.97 NA NA Performance data quoted represent past performance and are no guarantee of future returns. Current performance may be lower or higher than the performance data quoted. Current performance information to the most recent month-end is available on the Parnassus website (www.parnassus.com). Investment return and principal value will fluctuate so that an investor’s shares, when redeemed, may be worth more or less than their original principal cost. Returns shown in the table do not reflect the deduction of taxes a shareholder may pay on fund distributions or redemption of shares.
The Russell Midcap Index is an unmanaged index of common stocks, and it is not possible to invest directly in an index. Index figures do not take any expenses, fees or taxes into account, but mutual fund returns do. Mid-cap companies can be more sensitive to changing economic conditions and have fewer financial resources than large-cap companies. Before investing, an investor should carefully consider the investment objectives, risks, charges Poor stock picks in the utility, industrial and energy sectors hurt us the most this year.
Our worst performer was MRC Global, the largest global distributor of pipes, valves and fittings to oil and gas companies. The stock plummeted 35.9% from $32.26 to $20.67, where we sold it, taking 21¢ from each fund share. The stock fell early in the year, after its midstream customers experienced project delays and subsequently cut spending on MRC’s products.
Although demand from these customers eventually improved, the stock continued to fall as investors worried that sinking oil prices would hurt demand by larger upstream customers. We sold our position, because we believed that MRC’s earnings would go down dramatically as a result of lower oil prices. The stock ended the year at $15.15, 26.7% below where we sold it. and expenses of the Fund and should carefully read the prospectus or summary prospectus, which contain this and other information.
The prospectus or summary prospectus can be obtained on the Parnassus website, or by calling (800) 999-3505. 16 MDU Resources slid 19.7% from $30.55 to $23.50, reducing the NAV by 20¢. The stock rallied in early 2014, after management reported . PARNASSUS FUNDS Annual Report • 2014 solid results in its construction and utility segments. However, the shares fell in the summer, after the company’s exploration and production (E&P) segment, fell short of expectations. Investor confidence eroded further in late 2014 as oil prices collapsed by 45%, from $99 to $53 per barrel, to a five-year low. MDU is currently exploring the divestiture of its capital intensive E&P business.
While the timing is not great with oil prices so cheap, we believe that the company is taking the right steps to create shareholder value. We also expect its construction and utilities segments to grow well over the long-term, because of a substantial project backlog and a growing utility customer base. Pentair, a diversified industrial company that sells pumps, filters, valves and water-related infrastructure products, dropped 14.5% from $77.67 to $66.42 for a loss of 12¢ per fund share. The stock fell in early 2014, after the company reported lower sales due to sluggish demand from energy and mining customers.
The shares fell further toward year-end, because about 20% of Pentair’s sales are from oil and gas customers, and investors worried that lower oil prices would hurt Pentair’s earnings. We believe investors overreacted, since only about 5% of its oil and gas exposure is tied to developing new wells, and a meaningful portion of its oil and gas revenue relates to selling maintenance and repair parts, a segment that is less impacted by low oil prices. We took advantage of the stock weakness to add to our position, since we believe that the company has good growth prospects, particularly in its industrial, residential and commercial segments, and plenty of marginexpansion opportunities. We had quite a few stocks with big gains this year, and our three largest contributors added at least 30¢ each to the NAV.
The Fund’s biggest winner was Allergan, a pharmaceutical company based in Irvine, California. The stock climbed an amazing 91.4% from $111.08 to $212.59, increasing the NAV by 55¢. In April, Valeant, a rival pharmaceutical company, teamed up with activist investor Bill Ackman to make a hostile bid for Allergan.
Valeant sought control of Allergan’s blockbuster drug, Botox, as well as its prized eye-care products. In December, after a lengthy battle in which Allergan repeatedly rejected Valeant’s offers, pharmaceutical company Actavis emerged as a white knight, offering $219 per share for Allergan. We began selling our position in late December, since we do not expect a higher offer to emerge. Iron Mountain, the nation’s largest document storage company, climbed 27.4% from $30.35 to $38.66, adding 38¢ to the NAV.
In early 2014, the stock was essentially flat, as strong international sales growth was offset by tepid storage demand in the U.S. The big event of the year was the announcement that the IRS had approved Iron Mountain to become a REIT. The stock surged on the news, since REITs receive favorable tax treatment in exchange for agreeing to distribute at least 90% of taxable income to investors.
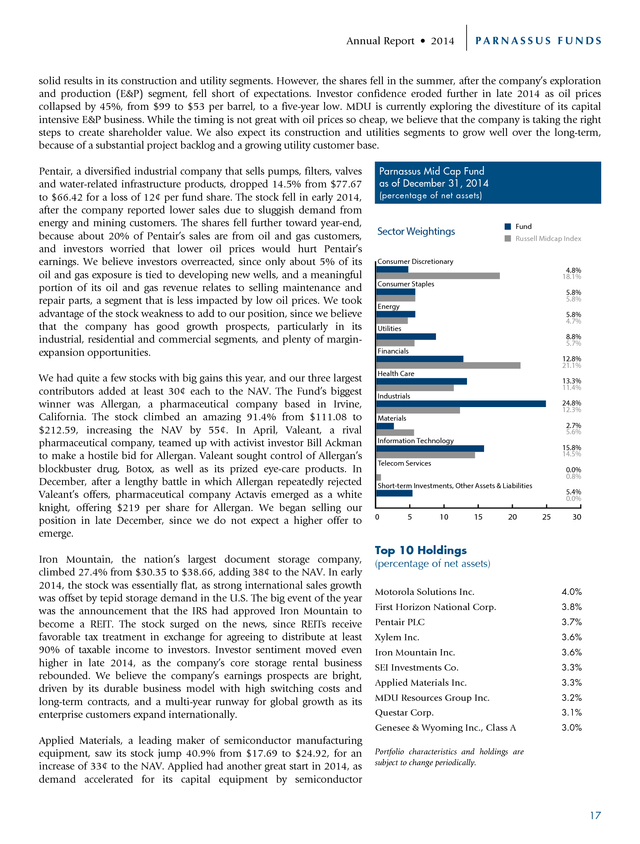
Investor sentiment moved even higher in late 2014, as the company’s core storage rental business rebounded. We believe the company’s earnings prospects are bright, driven by its durable business model with high switching costs and long-term contracts, and a multi-year runway for global growth as its enterprise customers expand internationally. Parnassus Mid Cap Fund as of December 31, 2014 (percentage of net assets) Fund Sector Weightings Russell Midcap Index Consumer Discretionary 4.8% 18.1% Consumer Staples 5.8% 5.8% Energy 5.8% 4.7% Utilities 8.8% 5.7% Financials 12.8% 21.1% Health Care 13.3% 11.4% Industrials 24.8% 12.3% Materials 2.7% 5.6% Information Technology 15.8% 14.5% Telecom Services 0.0% 0.8% Short-term Investments, Other Assets & Liabilities 0 5 10 15 20 5.4% 0.0% 25 30 Top 10 Holdings (percentage of net assets) 4.0% First Horizon National Corp. 3.8% Pentair PLC 3.7% Xylem Inc. 3.6% Iron Mountain Inc. 3.6% SEI Investments Co. 3.3% Applied Materials Inc. 3.3% MDU Resources Group Inc. 3.2% Questar Corp. 3.1% Genesee & Wyoming Inc., Class A Applied Materials, a leading maker of semiconductor manufacturing equipment, saw its stock jump 40.9% from $17.69 to $24.92, for an increase of 33¢ to the NAV. Applied had another great start in 2014, as demand accelerated for its capital equipment by semiconductor Motorola Solutions Inc. 3.0% Portfolio characteristics and holdings are subject to change periodically. 17 .
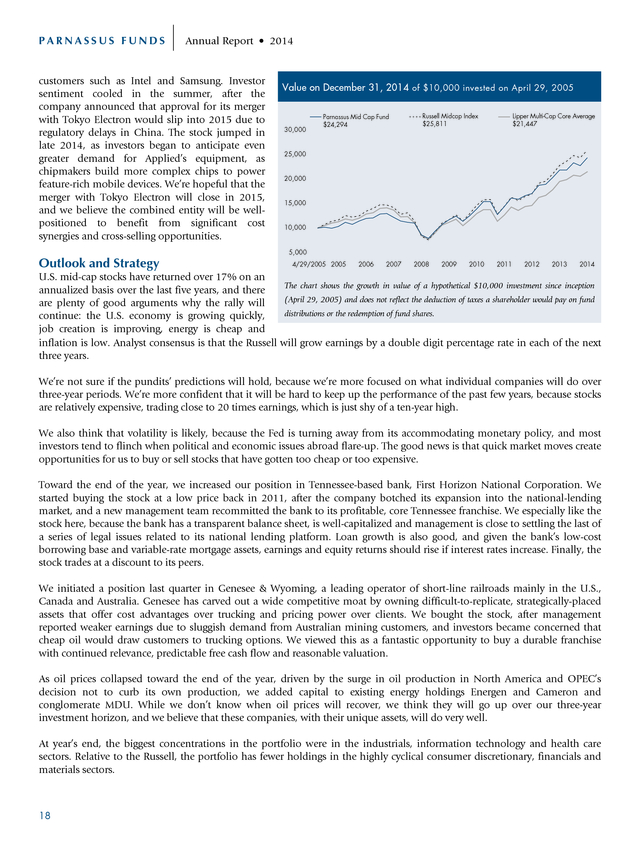
PARNASSUS FUNDS Annual Report • 2014 customers such as Intel and Samsung. Investor sentiment cooled in the summer, after the company announced that approval for its merger with Tokyo Electron would slip into 2015 due to regulatory delays in China. The stock jumped in late 2014, as investors began to anticipate even greater demand for Applied’s equipment, as chipmakers build more complex chips to power feature-rich mobile devices. We’re hopeful that the merger with Tokyo Electron will close in 2015, and we believe the combined entity will be wellpositioned to benefit from significant cost synergies and cross-selling opportunities. Value on December 31, 2014 of $10,000 invested on April 29, 2005 30,000 Parnassus Mid Cap Fund $24,294 Russell Midcap Index $25,811 Lipper Multi-Cap Core Average $21,447 25,000 20,000 15,000 10,000 5,000 Outlook and Strategy 4/29/2005 2005 2006 2007 2008 2009 2010 2011 2012 2013 2014 U.S.
mid-cap stocks have returned over 17% on an The chart shows the growth in value of a hypothetical $10,000 investment since inception annualized basis over the last five years, and there (April 29, 2005) and does not reflect the deduction of taxes a shareholder would pay on fund are plenty of good arguments why the rally will distributions or the redemption of fund shares. continue: the U.S. economy is growing quickly, job creation is improving, energy is cheap and inflation is low. Analyst consensus is that the Russell will grow earnings by a double digit percentage rate in each of the next three years. We’re not sure if the pundits’ predictions will hold, because we’re more focused on what individual companies will do over three-year periods.
We’re more confident that it will be hard to keep up the performance of the past few years, because stocks are relatively expensive, trading close to 20 times earnings, which is just shy of a ten-year high. We also think that volatility is likely, because the Fed is turning away from its accommodating monetary policy, and most investors tend to flinch when political and economic issues abroad flare-up. The good news is that quick market moves create opportunities for us to buy or sell stocks that have gotten too cheap or too expensive. Toward the end of the year, we increased our position in Tennessee-based bank, First Horizon National Corporation. We started buying the stock at a low price back in 2011, after the company botched its expansion into the national-lending market, and a new management team recommitted the bank to its profitable, core Tennessee franchise.
We especially like the stock here, because the bank has a transparent balance sheet, is well-capitalized and management is close to settling the last of a series of legal issues related to its national lending platform. Loan growth is also good, and given the bank’s low-cost borrowing base and variable-rate mortgage assets, earnings and equity returns should rise if interest rates increase. Finally, the stock trades at a discount to its peers. We initiated a position last quarter in Genesee & Wyoming, a leading operator of short-line railroads mainly in the U.S., Canada and Australia.
Genesee has carved out a wide competitive moat by owning difficult-to-replicate, strategically-placed assets that offer cost advantages over trucking and pricing power over clients. We bought the stock, after management reported weaker earnings due to sluggish demand from Australian mining customers, and investors became concerned that cheap oil would draw customers to trucking options. We viewed this as a fantastic opportunity to buy a durable franchise with continued relevance, predictable free cash flow and reasonable valuation. As oil prices collapsed toward the end of the year, driven by the surge in oil production in North America and OPEC’s decision not to curb its own production, we added capital to existing energy holdings Energen and Cameron and conglomerate MDU.
While we don’t know when oil prices will recover, we think they will go up over our three-year investment horizon, and we believe that these companies, with their unique assets, will do very well. At year’s end, the biggest concentrations in the portfolio were in the industrials, information technology and health care sectors. Relative to the Russell, the portfolio has fewer holdings in the highly cyclical consumer discretionary, financials and materials sectors. 18 . Annual Report • 2014 PARNASSUS FUNDS We strive to outperform our indices over the long-term by capturing the majority of the Russell’s upside in bull markets and losing a lot less than the market and our peers in bear markets. We remain committed to doing this by investing in wellpriced businesses with increasing relevance, material and sustainable competitive advantages and properly incentivized managers. Thank you for your investment. Yours truly, Matthew D. Gershuny Lead Portfolio Manager Lori A. Keith Portfolio Manager 19 .
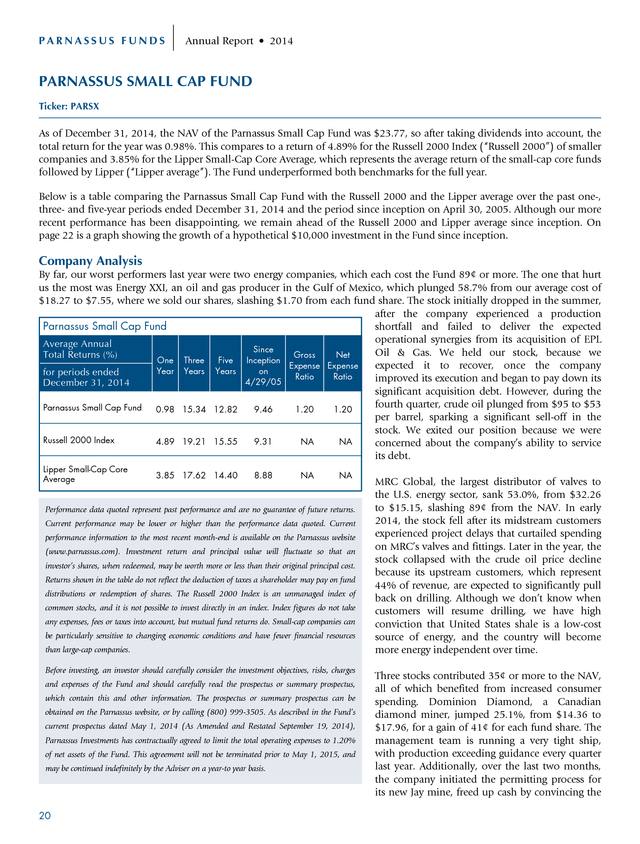
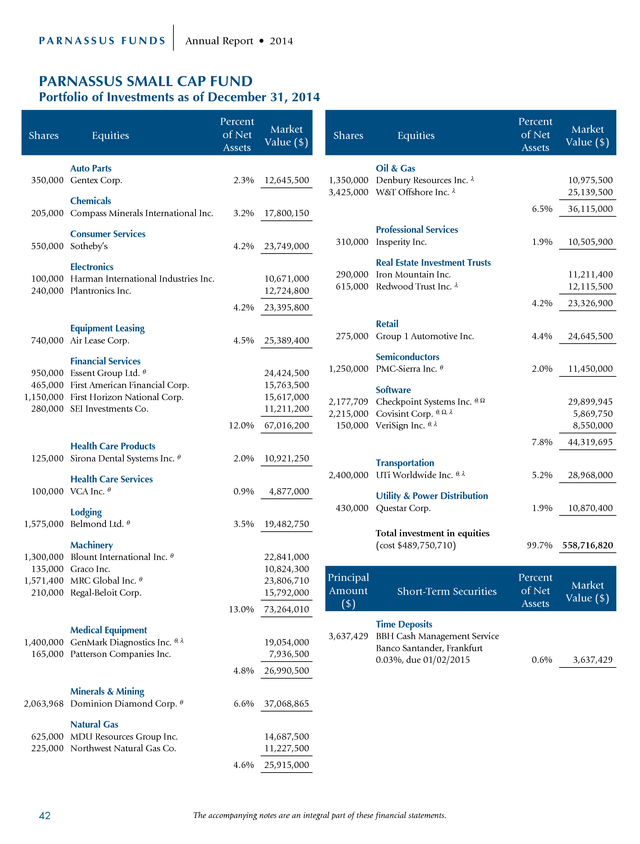
PARNASSUS FUNDS Annual Report • 2014 PARNASSUS SMALL CAP FUND Ticker: PARSX As of December 31, 2014, the NAV of the Parnassus Small Cap Fund was $23.77, so after taking dividends into account, the total return for the year was 0.98%. This compares to a return of 4.89% for the Russell 2000 Index (“Russell 2000”) of smaller companies and 3.85% for the Lipper Small-Cap Core Average, which represents the average return of the small-cap core funds followed by Lipper (“Lipper average”). The Fund underperformed both benchmarks for the full year. Below is a table comparing the Parnassus Small Cap Fund with the Russell 2000 and the Lipper average over the past one-, three- and five-year periods ended December 31, 2014 and the period since inception on April 30, 2005. Although our more recent performance has been disappointing, we remain ahead of the Russell 2000 and Lipper average since inception.
On page 22 is a graph showing the growth of a hypothetical $10,000 investment in the Fund since inception. Company Analysis By far, our worst performers last year were two energy companies, which each cost the Fund 89¢ or more. The one that hurt us the most was Energy XXI, an oil and gas producer in the Gulf of Mexico, which plunged 58.7% from our average cost of $18.27 to $7.55, where we sold our shares, slashing $1.70 from each fund share. The stock initially dropped in the summer, after the company experienced a production Parnassus Small Cap Fund shortfall and failed to deliver the expected operational synergies from its acquisition of EPL Average Annual Since Oil & Gas.
We held our stock, because we Total Returns (%) Gross Net One Three Five Inception Expense Expense expected it to recover, once the company Year Years Years on for periods ended Ratio Ratio improved its execution and began to pay down its 4/29/05 December 31, 2014 significant acquisition debt. However, during the fourth quarter, crude oil plunged from $95 to $53 Parnassus Small Cap Fund 0.98 15.34 12.82 9.46 1.20 1.20 per barrel, sparking a significant sell-off in the stock. We exited our position because we were Russell 2000 Index 4.89 19.21 15.55 9.31 NA NA concerned about the company’s ability to service its debt. Lipper Small-Cap Core Average 3.85 17.62 14.40 8.88 NA NA Performance data quoted represent past performance and are no guarantee of future returns. Current performance may be lower or higher than the performance data quoted.
Current performance information to the most recent month-end is available on the Parnassus website (www.parnassus.com). Investment return and principal value will fluctuate so that an investor’s shares, when redeemed, may be worth more or less than their original principal cost. Returns shown in the table do not reflect the deduction of taxes a shareholder may pay on fund distributions or redemption of shares. The Russell 2000 Index is an unmanaged index of common stocks, and it is not possible to invest directly in an index.
Index figures do not take any expenses, fees or taxes into account, but mutual fund returns do. Small-cap companies can be particularly sensitive to changing economic conditions and have fewer financial resources than large-cap companies. Before investing, an investor should carefully consider the investment objectives, risks, charges and expenses of the Fund and should carefully read the prospectus or summary prospectus, which contain this and other information. The prospectus or summary prospectus can be obtained on the Parnassus website, or by calling (800) 999-3505.
As described in the Fund’s current prospectus dated May 1, 2014 (As Amended and Restated September 19, 2014), Parnassus Investments has contractually agreed to limit the total operating expenses to 1.20% of net assets of the Fund. This agreement will not be terminated prior to May 1, 2015, and may be continued indefinitely by the Adviser on a year-to year basis. 20 MRC Global, the largest distributor of valves to the U.S. energy sector, sank 53.0%, from $32.26 to $15.15, slashing 89¢ from the NAV.
In early 2014, the stock fell after its midstream customers experienced project delays that curtailed spending on MRC’s valves and fittings. Later in the year, the stock collapsed with the crude oil price decline because its upstream customers, which represent 44% of revenue, are expected to significantly pull back on drilling. Although we don’t know when customers will resume drilling, we have high conviction that United States shale is a low-cost source of energy, and the country will become more energy independent over time. Three stocks contributed 35¢ or more to the NAV, all of which benefited from increased consumer spending.
Dominion Diamond, a Canadian diamond miner, jumped 25.1%, from $14.36 to $17.96, for a gain of 41¢ for each fund share. The management team is running a very tight ship, with production exceeding guidance every quarter last year. Additionally, over the last two months, the company initiated the permitting process for its new Jay mine, freed up cash by convincing the .
Annual Report • 2014 PARNASSUS FUNDS local government to let it use an insurance product to cover its reclamation bond liability, and its joint-venture partner, Rio Tinto, announced they will develop a new, profitable diamond reserve called A-21. Finally, management indicated it will likely initiate a dividend in 2015, which should attract new, income-oriented investors. Group 1 Automotive, the third largest automobile retailer in the United States, soared 36.4%, from our average purchase price of $65.72 to $89.62, increasing the NAV by 36¢. The company sells over 250,000 cars annually across 33 brands through 116 dealerships primarily in the Southern United States, as well as 17 dealerships in England and 20 dealerships in Brazil. The company’s United States and its United Kingdom businesses exceeded expectations, while its struggling Brazilian business finally showed signs of improvement.
We are holding our stock, because new car sales continue to increase. In August, the United States market exceeded 17 million in annual sales of new automobiles for the first time since 2006. The growing number of recently sold cars will lead to high-margin warranty and service revenue for years to come. Parnassus Small Cap Fund as of December 31, 2014 (percentage of net assets) Sector Weightings Fund Russell 2000 Index Consumer Discretionary 16.3% 14.0% Consumer Staples 0.0% 3.8% Energy 6.4% 3.7% Utilities 6.6% 3.7% VCA, the largest veterinary clinic and animal diagnostic-testing company in the country, rose 55.5%, from $31.36 to $48.77, contributing 35¢ to each fund share.
Revenue growth accelerated throughout the year, as consumers are once again spending on pet health, after pausing during the recession. Management also impressed shareholders with a large share buyback. We trimmed our position as the stock rose, but we continue to have a small holding because we expect the company to benefit from the long-term tailwind of rising pet spending. Outlook and Strategy Financials 16.1% 23.7% Health Care 7.6% 15.3% Industrials 24.6% 12.9% Materials 9.8% 4.2% Information Technology 12.3% 17.8% Telecom Services 0.0% 0.9% The United States economy continues to improve.
GDP growth increased 0.3% to 5.0% in the third quarter, up from 4.6% in the second quarter, the 0.0% fastest growth rate since 2003. Unemployment fell to 5.6% in December, 0 5 10 15 20 25 30 which is quickly approaching the level economists view as full employment. During the fourth quarter, the price of oil declined from $95 per barrel to $53 per barrel.
Although this dramatic decline hurt our energy investments, it provides a further stimulus to the economy because transportation costs for individuals, as well as goods, will decline. Short-term Investments, Other Assets & Liabilities We did take advantage of the significant decline of small-cap oil stocks to upgrade the quality of our holdings. We sold our Energy XXI position and redeployed capital into W&T Offshore and Denbury Resources. Like Energy XXI, W&T Offshore also participates in the Gulf of Mexico, but it has lower financial leverage and a CEO who owns a significant stake in the company, which directly aligns our interests.
Denbury Resources, on the other hand, has a competitively-advantaged business model that should allow it to earn excess returns over time. The company owns a one-of-a-kind, naturally occurring carbon-dioxide reserve that it injects into abandoned oil wells in order to extract additional oil. Given the predictability of its business, the company recently increased its dividend by 60%. In my first quarter 2014 report, I wrote that only one of three stock price drivers (revenue growth) remained strong, while the other two (multiple expansion and profit margin expansion) were likely near peaks.
My outlook has proven accurate. The forward price-to-earnings multiple for the Russell 2000 remains near a ten-year high at 22, but did not increase during the year. Profit margins also remain near a record high, and also did not increase in 2014.
Ultimately, this translated into the Russell 2000 only increasing 5% in 2014, about the same rate as revenue growth. My outlook remains the same for 2015. I expect the U.S. economy will continue to improve, which should fuel further revenue growth, but I suspect valuation multiples and profit margins will not move meaningfully higher.
The real risk, which no one can predict, is when there will be an unexpected shock to the system, and what that shock will be. When a shock inevitably occurs, valuation multiples will contract and, if the shock is prolonged, revenue growth will slow and profit margins will contract. If this triple-whammy occurs, stock prices will decline significantly.
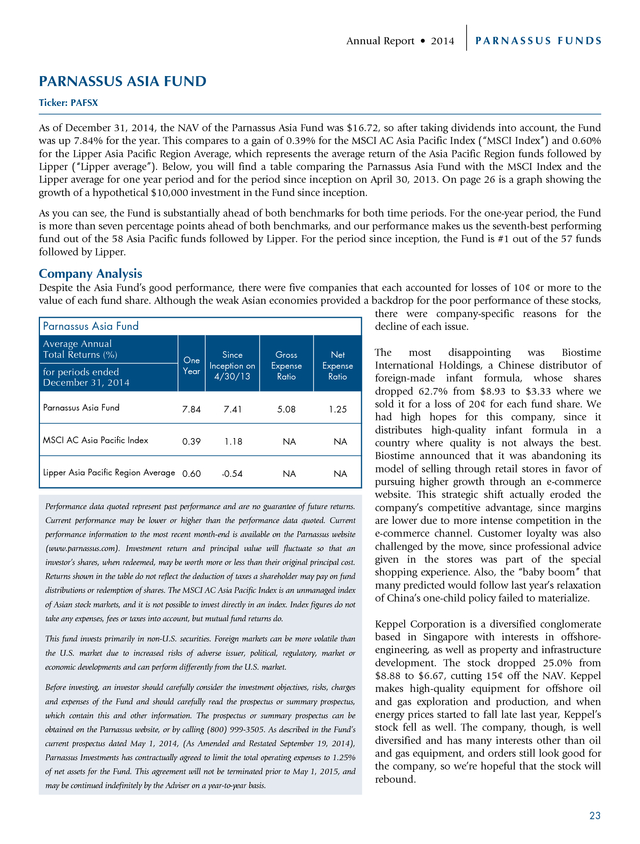
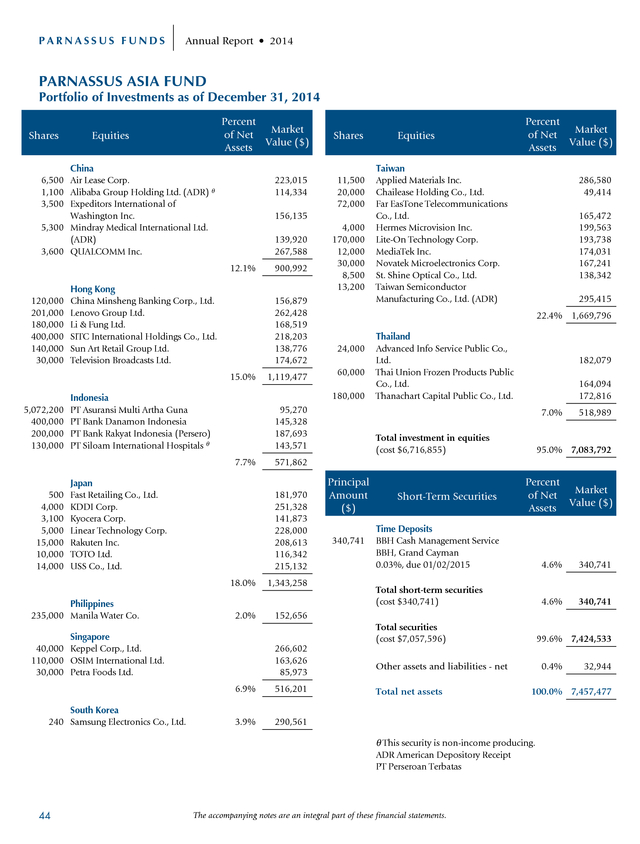
It’s impossible to construct a 21 . PARNASSUS FUNDS Annual Report • 2014 Top 10 Holdings (percentage of net assets) Value on December 31, 2014 of $10,000 invested on April 29, 2005 Dominion Diamond Corp. 6.6% Checkpoint Systems Inc. 5.3% UTi Worldwide Inc. 5.2% Air Lease Corp. W&T Offshore Inc. 4.5% Group 1 Automotive Inc. 4.4% Essent Group Ltd. 4.2% Sotheby’s 4.1% Lipper Small-Cap Core Average $23,051 4.2% Blount International Inc. Russell 2000 Index $23,673 4.4% MRC Global Inc. Parnassus Small Cap Fund $23,971 4.5% Portfolio characteristics and holdings are subject to change periodically. 30,000 25,000 20,000 15,000 10,000 5,000 4/29/2005 2005 2006 2007 2008 2009 2010 2011 2012 2013 2014 The chart shows the growth in value of a hypothetical $10,000 investment since inception (April 29, 2005) and does not reflect the deduction of taxes a shareholder would pay on fund distributions or the redemption of fund shares. portfolio of stocks that are immune to this decline; the best we can do is invest in competitively advantaged businesses, which will survive the initial shock, and then can take advantage of the challenging period to improve their competitive position. Thank you for your investment, Ryan Wilsey Portfolio Manager 22 . Annual Report • 2014 PARNASSUS FUNDS PARNASSUS ASIA FUND Ticker: PAFSX As of December 31, 2014, the NAV of the Parnassus Asia Fund was $16.72, so after taking dividends into account, the Fund was up 7.84% for the year. This compares to a gain of 0.39% for the MSCI AC Asia Pacific Index (“MSCI Index”) and 0.60% for the Lipper Asia Pacific Region Average, which represents the average return of the Asia Pacific Region funds followed by Lipper (“Lipper average”). Below, you will find a table comparing the Parnassus Asia Fund with the MSCI Index and the Lipper average for one year period and for the period since inception on April 30, 2013. On page 26 is a graph showing the growth of a hypothetical $10,000 investment in the Fund since inception. As you can see, the Fund is substantially ahead of both benchmarks for both time periods.
For the one-year period, the Fund is more than seven percentage points ahead of both benchmarks, and our performance makes us the seventh-best performing fund out of the 58 Asia Pacific funds followed by Lipper. For the period since inception, the Fund is #1 out of the 57 funds followed by Lipper. Company Analysis Despite the Asia Fund’s good performance, there were five companies that each accounted for losses of 10¢ or more to the value of each fund share. Although the weak Asian economies provided a backdrop for the poor performance of these stocks, there were company-specific reasons for the Parnassus Asia Fund decline of each issue. Average Annual Total Returns (%) One Year Since Inception on 4/30/13 Gross Expense Ratio Net Expense Ratio Parnassus Asia Fund 7.84 7.41 5.08 1.25 MSCI AC Asia Pacific Index 0.39 1.18 NA NA Lipper Asia Pacific Region Average 0.60 -0.54 NA NA for periods ended December 31, 2014 Performance data quoted represent past performance and are no guarantee of future returns. Current performance may be lower or higher than the performance data quoted.
Current performance information to the most recent month-end is available on the Parnassus website (www.parnassus.com). Investment return and principal value will fluctuate so that an investor’s shares, when redeemed, may be worth more or less than their original principal cost. Returns shown in the table do not reflect the deduction of taxes a shareholder may pay on fund distributions or redemption of shares. The MSCI AC Asia Pacific Index is an unmanaged index of Asian stock markets, and it is not possible to invest directly in an index.
Index figures do not take any expenses, fees or taxes into account, but mutual fund returns do. This fund invests primarily in non-U.S. securities. Foreign markets can be more volatile than the U.S.
market due to increased risks of adverse issuer, political, regulatory, market or economic developments and can perform differently from the U.S. market. Before investing, an investor should carefully consider the investment objectives, risks, charges and expenses of the Fund and should carefully read the prospectus or summary prospectus, which contain this and other information. The prospectus or summary prospectus can be obtained on the Parnassus website, or by calling (800) 999-3505.
As described in the Fund’s current prospectus dated May 1, 2014, (As Amended and Restated September 19, 2014), Parnassus Investments has contractually agreed to limit the total operating expenses to 1.25% of net assets for the Fund. This agreement will not be terminated prior to May 1, 2015, and may be continued indefinitely by the Adviser on a year-to-year basis. The most disappointing was Biostime International Holdings, a Chinese distributor of foreign-made infant formula, whose shares dropped 62.7% from $8.93 to $3.33 where we sold it for a loss of 20¢ for each fund share. We had high hopes for this company, since it distributes high-quality infant formula in a country where quality is not always the best. Biostime announced that it was abandoning its model of selling through retail stores in favor of pursuing higher growth through an e-commerce website.
This strategic shift actually eroded the company’s competitive advantage, since margins are lower due to more intense competition in the e-commerce channel. Customer loyalty was also challenged by the move, since professional advice given in the stores was part of the special shopping experience. Also, the “baby boom” that many predicted would follow last year’s relaxation of China’s one-child policy failed to materialize. Keppel Corporation is a diversified conglomerate based in Singapore with interests in offshoreengineering, as well as property and infrastructure development.
The stock dropped 25.0% from $8.88 to $6.67, cutting 15¢ off the NAV. Keppel makes high-quality equipment for offshore oil and gas exploration and production, and when energy prices started to fall late last year, Keppel’s stock fell as well. The company, though, is well diversified and has many interests other than oil and gas equipment, and orders still look good for the company, so we’re hopeful that the stock will rebound. 23 .
PARNASSUS FUNDS Annual Report • 2014 St. Shine Optical sliced 14¢ off the Fund’s NAV, as its stock sank 25.9% from our cost of $21.98 to $16.28. This Taiwanese maker of contact lenses provides contract-manufacturing services for local and international brands. Japan is the company’s most important international market, and growth slowed down as customers hesitated to launch new products given cost pressures from the weaker yen and the uncertainty in the Japanese economy.
The company’s smaller, but higher margin branded business in Taiwan also declined significantly in the latter half of the year, as new entrants to the Taiwanese market tried to increase market share through aggressive pricing. OSIM International, a Singapore-based retailer of healthy lifestyle products, took 11¢ off the NAV, as its stock dropped 18.4% from $1.82 to $1.49. The company makes and markets a range of consumer and household products including massage chairs, fitness and diagnostic equipment, vitamins, supplements and tea. Weak sales in the core massage chair business in China caused profits to drop 28% in the third quarter.
OSIM also had significant costs in connection with its recent acquisition of a high-end branded tea business. Margins, however, are steady at the firm, and the company is buying back stock. Parnassus Asia Fund as of December 31, 2014 (percentage of net assets) Fund Sector Weightings* MSCI AC Asia Pacific Index Consumer Discretionary 14.9% 13.1% Consumer Staples 21Vianet’s stock took 11¢ off the NAV, as it dropped 19.4% from $23.52 to $18.96 where we sold it. The company is one of the largest providers of data centers in China with 80 centers in 40 cities across the country.
On September 10, a short-seller issued a report accusing the company of fraud in its accounting statements. The company tried to defend itself, but the short-seller followed up with another report reiterating its charges. Since we were uncertain of the facts and were concerned about shareholder lawsuits and possible delisting, we sold our shares. 5.2% 6.2% Energy 0.0% 3.4% Utilities 2.0% 3.2% Financials 10.8% 30.5% Health Care 5.7% 4.1% Industrials 13.1% 12.5% Materials Fortunately, the winners had more impact on the Parnassus Asia Fund than did the losers.
Semiconductor-equipment manufacturer Applied Materials, with operations in both Silicon Valley and Tokyo, contributed 24¢ to the NAV, as its stock soared 40.9% from $17.69 to $24.92. Consumer demand for better mobile devices with more features and longer battery life is driving large investments in new semiconductor-manufacturing equipment. In 2014, industry spending increased 25% and spending levels should increase with the transition to more advanced manufacturing technology. 0.0% 6.9% Information Technology 35.3% 14.6% Telecom Services 8.0% 5.5% Short-term Investments, Other Assets & Liabilities 5.0% 0.0% 0 10 20 30 40 * For purposes of categorizing securities for diversification requirements Bank Rakyat of Indonesia saw its stock soar 56.9% from 60¢ to 94¢, under the Investment Company Act, the Fund uses industry while adding 21¢ to the NAV.
The bank exceeded expectations with classifications that are more specific than those used for the chart. strong growth in income, and increased its dividend payout ratio to 30%, the highest among its peers. We like the bank, because it has been consistently among the most profitable banks in the country for the last decade, and we like its social role as a microfinance lender to small businesses, where it has made a third of its total loans. Hermes Microvision, a Taiwan-based maker of semiconductor-manufacturing equipment, increased the value of each fund share by 21¢, as its stock price rocketed up 53.6% from $32.49 to $49.89. Hermes develops and markets electron beam inspection tools for semiconductor-manufacturers for use in testing for defects in silicon wafers.
Strong order flow moved the stock higher. More complex semiconductor-manufacturing processes and more exacting specifications will mean more chipmakers should shift away from older optical-inspection technology in favor of Hermes’ more advanced products. Sino-Thai Engineering, a leading engineering and construction company in Thailand, added 16¢ to the NAV, as its stock increased from our cost of 39¢ to 58¢, where we sold it for an increase of 48.7%. The company manages industrial projects for private firms and infrastructure products for the government including Bangkok’s subway and Skytrain.
The stock was very volatile last year, because of the military coup in Thailand and its sensitivity to government-related business, but the stock moved higher after Thailand’s army chief announced a commitment to push through long-stalled infrastructure projects. Although Sino-Thai is a well-run business, we decided to sell the stock because of political uncertainty in Thailand. 24 . Annual Report • 2014 Novatek Microelectronics lifted the value of each fund share by 14¢, as its stock surged 36.2% from $4.09 to $5.57. Based in Hsinchu, Taiwan’s version of Silicon Valley, Novatek is the world’s largest supplier of display-driver integrated circuits and Taiwan’s second-largest fabless semiconductor company. The company supplies chips that power such devices as television displays, notebook monitors, smartphones and settop boxes. This focus on growth helps Novatek maintain high margins and strong earnings, and its R&D efforts are focused on next-generation products to maintain that growth. PARNASSUS FUNDS Parnassus Asia Fund as of December 31, 2014 (percentage of net assets) Portfolio Composition by Country Fund (percentage of net assets) China 12.1% Hong Kong Hong Kong-based SITC International Holdings added 12¢ to the NAV, as its stock rose 17.0% from 47¢ where we bought it during the year to 55¢ at year’s end.
This shipping and logistics company has 47 service routes connecting 45 major ports across ten countries in Asia. Its logistics operations are strategically diversified between sea and land, helping to dampen exposure to swings in any one country’s business cycle, a business model that proved resilient in the latter half of the year. Despite the slower pace of the Chinese economy, SITC launched new vessels and opened new service routes to other parts of Asia, lifting volume, revenue and profits. 15.0% Indonesia 7.7% Japan 18.0% Philippines 2.0% Singapore 6.9% South Korea 3.9% Taiwan 22.4% Taiwan Semiconductor Manufacturing Company (TSMC) increased the value of each fund share by 12¢, as its stock climbed 28.3% from $17.44 to $22.38. Founded in 1987, TSMC was the world’s first independent foundry and is still the largest, producing a variety of semiconductors based on designs developed by its customers, primarily fabless chipmakers.
Investors pushed the stock higher in recognition of the ever-increasing demand for more complex semiconductors. Outlook and Strategy As we said earlier in this section, the Parnassus Asia Fund gained 7.84% in 2014, compared to 0.39% for the MSCI Index, so we were more than seven percentage points ahead of our benchmark, which is an enormous margin. We also pointed out that we were the best-performing of the 57 Asia Pacific funds followed by Lipper for the period since our inception on April 30, 2013. In last year’s annual report, we discussed our excellent returns in 2013, pointing out that we couldn’t brag too much about our performance, because the portfolio had a big cash position for a substantial period of time, when the Asian markets moved sharply lower, so we looked good on a relative basis. Thailand 7.0% 0 5 10 15 20 25 30 Parnassus considers companies that do a substantial amount of business in Asia to be Asian Companies. Top 10 Holdings (percentage of net assets) 4.0% Samsung Electronics Co., Ltd. 3.9% Applied Materials Inc. 3.8% QUALCOMM Inc. 3.6% Keppel Corp., Ltd. 3.6% Lenovo Group Ltd. 3.5% KDDI Corp. In 2014, though, we were almost fully invested for almost all of the year, so cash was not a factor.
As shareholders in the Parnassus Asia Fund, you may be asking yourselves, “were these guys skillful or lucky in 2014?” The answer? We were both. Taiwan Semiconductor Manufacturing Co., Ltd. (ADR) 3.4% Linear Technology Corp. 3.1% Air Lease Corp. 3.0% SITC International Holdings Co., Ltd. 2.9% Portfolio characteristics and holdings are First, let’s turn to the lucky part. Japan accounts for 39% of the MSCI subject to change periodically. Index, because it has most of the large, publicly-traded companies in the region.
While China has a bigger economy, most of its large enterprises are state-owned, so they are not publicly traded and don’t have any market capitalizations like the large Japanese companies. The Japanese market was up 9.8% last year, but the Japanese yen fell 12% against the dollar, so in dollar terms, the Japanese market lost 3.7%. (The return of the MSCI Index is quoted in dollars.) While Japan has a 40% weighting in the MSCI Index, Japanese companies comprise only 18% of the Parnassus Asia Fund, so being underweight in Japan helped the Fund.
At the beginning of the year, we had no idea that the Japanese market would do poorly in dollar terms, so the fact that we were underweight was definitely a stroke of luck. 25 . PARNASSUS FUNDS Annual Report • 2014 There was, however, some skill involved as well. The Japanese stocks in the Parnassus Asia Fund portfolio actually moved higher in dollar terms, going up 2.3% and adding 5¢ to the NAV. We do deserve credit for our skill in picking good Japanese companies. There were, however, two other pieces of luck that helped us. The two other countries that have substantial weighting in the MSCI Index are Australia with 14% and South Korea with 8%. In dollar terms, the Australian stock market dropped 3% in 2014, and the Korean stock market dropped 11%.
There are no companies in the portfolio based in Australia, and we have only one Korean company in the portfolio with a weighting of only 3.9%. That Korean company is Samsung, and although it dropped 7% in U.S. dollar terms, that was less than the 11% drop in the Korean market. Value on December 31, 2014 of $10,000 invested on April 30, 2013 15,000 Parnassus Asia Fund $11,265 MSCI AC Asia Pacific Index $10,163 Lipper Asia Pacific Region Average $9,923 12,500 10,000 7,500 4/30/2013 2013 2014 The chart shows the growth in value of a hypothetical $10,000 investment since inception (April 30, 2013) and does not reflect the deduction of taxes a shareholder would pay on fund distributions or the redemption of fund shares. The final piece of luck was overweighting Thailand and Indonesia; Thailand went up 16.8%, and Indonesia went up 27.2% in dollar terms.
However, we were also skillful in picking good companies in those two countries. Our Thai companies went up 25.5%, while our Indonesian companies went up 29.4% in dollar terms. In summary, then, we have a good record of picking companies that increase in value, but we have no ability to accurately forecast currency movements or predict which company’s corresponding stock market will do the best. Our strategy, then, should be to focus on picking good companies and not to worry about currency fluctuations or stock market movements in individual countries.
When it comes to the latter two, we’ll have some good luck and some bad luck, and over the long-run, the two should balance each other out. That doesn’t mean we won’t take country-wide conditions into account. We’ll look at how our portfolio compares to the MSCI Index, and we’ll assess economic opportunities in various countries, but we won’t try to pick countries based on an annual forecast of stock market returns. Yours truly, Jerome L.
Dodson Lead Portfolio Manager 26 Billy J. Hwan Portfolio Manager . Annual Report • 2014 PARNASSUS FUNDS PARNASSUS FIXED INCOME FUND Ticker: PRFIX As of December 31, 2014, the NAV of the Parnassus Fixed Income Fund was $16.66, producing a gain for the year of 4.49% (including dividends). This compares to a gain of 5.97% for the Barclays U.S. Aggregate Bond Index (“Barclays Aggregate Index”) and a gain of 7.66% for the Lipper A-Rated Bond Fund Average, which represents the average return of the A-rated bond funds followed by Lipper (“Lipper average”). Below is a table comparing the performance of the Fund with that of the Barclays Aggregate Index and the Lipper average. Average annual total returns are for the one-, three-, five- and ten-year periods. On page 28, you will find a graph that shows the growth of a hypothetical $10,000 investment in the Fund over the past ten years.
For December 2014, the 30-day subsidized SEC yield was 1.59%, and the unsubsidized SEC yield was 1.53%. 2014 Review Interest rates continued to deviate from their normal relationship to the economy in the fourth quarter, topping off an odd year for the bond market overall. Looking at domestic data alone, interest rates should have risen in 2014. The U.S.
economy grew at a robust rate in the last three quarters of the year after recovering from a first quarter contraction caused by the Polar Vortex. Typically, a growing economy causes interest rates to rise, as inflation picks up and investors demand higher rates of return. Instead, geopolitical events overwhelmed the positive economic data and ultimately determined the direction of this year’s interest rate movement. The 10-year Treasury bond yielded approximately 3.00% on January 1, 2014, but subsequently dropped to 2.17% by the end of the year. Parnassus Fixed Income Fund Average Annual Total Returns (%) Gross Net Expense Expense Ratio Ratio One Year Three Years Five Years Ten Years Parnassus Fixed Income Fund 4.49 1.24 3.48 4.35 0.78 0.68 Barclays U.S. Aggregate Bond Index 5.97 2.66 4.45 4.71 NA NA Lipper A-Rated Bond Fund Average 7.66 4.14 5.74 4.74 NA NA for periods ended December 31, 2014 Performance data quoted represent past performance and are no guarantee of future returns. Current performance may be lower or higher than the performance data quoted.
Current performance information to the most recent month-end is available on the Parnassus website (www.parnassus.com). Investment return and principal value will fluctuate so that an investor’s shares, when redeemed, may be worth more or less than their original cost. Returns shown in the table do not reflect the deduction of taxes a shareholder would pay in fund As Portfolio Manager of the Parnassus Fixed Income Fund, I make three strategic decisions each year: 1) how interest rates will behave; 2) which asset classes should perform well; and, 3) which individual bonds to hold.
Reflecting on the Fund’s performance for the year, I was wrong about the direction interest rates would move in 2014. I believed that robust economic growth, a reduction of stimulus from the Federal Reserve and a declining unemployment rate would all put upward pressure on rates. Because I expected interest rates to rise, the Fund had a shorter duration than the index, at 4.20 years versus 5.55 years. As a reminder, duration is a measure of interest rate sensitivity and indicates how much, in percentage terms, a bond price will move for a 1% change in interest rates.
A shorter duration means that the value of the Fund is less sensitive to interest rate movements. In this case, it did not gain as much when interest rates fell. distributions or redemption of shares. The Barclays U.S.
Aggregate Bond Index is an unmanaged index of bonds, and it is not possible to invest directly in an index. Index figures do not take any expenses, fees or taxes into account, but mutual fund returns do. Before investing, an investor should carefully consider the investment objectives, risks, charges and expenses of the Fund and should carefully read the prospectus or summary prospectus, which contain this and other information. The prospectus or summary prospectus can be obtained on the Parnassus website, or by calling (800) 999-3505.
As described in the Fund’s However, I am pleased that the Fund outperformed on the next two metrics: asset classes and securities. Duration-adjusted, the Fund produced 21 basis points (a basis point is 1/100th of one percent) of outperformance, due primarily to its overweight allocation to corporate bonds relative to the index. current prospectus dated May 1, 2014, (As Amended and Restated September 19, 2014), Parnassus Investments has contractually agreed to limit total operating expenses to 0.68% of net assets for the Fund. This agreement will not be terminated prior to May 1, 2015, and may be continued indefinitely by the Adviser on a year-to-year basis. Corporate bonds performed exceptionally well this year, returning 7.46% in the Barclays Aggregate Index.
The Fund benefitted from this outperformance as it holds 43.9% of its assets in 27 . PARNASSUS FUNDS Annual Report • 2014 corporate bonds versus 23.27% for the index. Several bonds that performed particularly well include: FedEx Corporation, Procter & Gamble Company and Starbucks Corporation. FedEx Corporation bonds returned 12.59% and added 3¢ to NAV. Shipment volumes increased due to overall economic strength and the growing importance of e-commerce, pushing revenue higher.
Additionally, the company is restructuring its operations to streamline the business, allowing it to accumulate cash more rapidly in 2014. The Fund’s Procter & Gamble (P&G) bonds gained 8.56% in the year and added 2¢ to NAV. A.G. Lafley, the CEO, is refocusing the company on its most valuable 70-80 brands, which means the company will shed about 100 brands globally.
This new approach is expected to improve earnings and cash flow, which benefit bond holders. Finally, Starbucks Corporation bonds performed especially well in the year, returning 12.15% and adding 2¢ to NAV. The company experienced strong revenue growth as food offerings and store throughput improved. Starbucks also continued to open new stores and redesign store formats, both domestically and abroad, and opened its 1,000th store in both China and Japan. Parnassus Fixed Income Fund as of December 31, 2014 (percentage of net assets) Sector Weightings U.S.
Treasury Bonds Fund Barclays U.S. Aggregate Bond Index 26.7% 35.8% Government Related Bonds 3.6% 9.5% Corporate Bonds 44.1% 23.3% Securitized Bonds 21.1% 31.4% The Fund’s convertible bond strategy performed very well, adding 8¢ to NAV overall. However, the two convertible bonds held in 2014 performed very differently. Intermune, a specialty pharmaceutical company, was the top performer overall for the Parnassus Fixed Income Short-term Investments, Other Assets & Liabilities 4.5% Fund in 2014, adding 9¢ to NAV.
The company’s phase III trial for 0.0% Esbriet, a breakthrough drug to treat idiopathic pulmonary fibrosis, 10 20 30 40 50 returned very positive results in February. The company’s underlying 0 shares shot higher on the news, and so the convertible bonds performed exceptionally well. Value on December 31, 2014 of $10,000 invested on December 31, 2004 On the other hand, Exelixis, a biotechnology company, was the worst performer in the Fund, Barclays U.S. Aggregate Lipper A-Rated Bond Fund Parnassus Fixed Income removing 2¢ from the NAV.
Exelixis had an Bond Index $15,842 Average $16,064 Fund $15,309 17,500 unsuccessful phase III trial this year, causing the bonds to substantially underperform. 15,000 Outlook and Strategy Low unemployment, increasing wages and higher 12,500 capital expenditures are converging to finally add momentum to the recovery, so I expect that 2015 10,000 will be a year of robust growth. The bond market will likely be volatile next year, as the U.S. economy accelerates in a slow global growth 7,500 environment. I expect the Federal Reserve to begin 2014 2007 2010 2011 2012 2013 2004 2005 2006 2008 2009 normalizing rates in late spring and this should The chart shows the growth in value of a hypothetical $10,000 investment over the last put upward pressure on short-term yields. 10 years and does not reflect the deduction of taxes a shareholder would pay on fund However, the path of longer-term rates is distributions or the redemption of fund shares. dependent not only on domestic economic growth, but international factors as well.
Low global growth rates and very low yields on foreign sovereign debt will continue to make U.S. debt attractive by comparison, likely keeping the 10-year Treasury rate somewhat depressed. Asset classes that historically outperform in a growing economy include corporate bonds, convertible bonds and high yield bonds. As a result, the Fund continues to be overweight corporate bonds and will opportunistically add high yield bonds that fit its long-term objectives. 28 .
Annual Report • 2014 PARNASSUS FUNDS Similar to 2014, I believe it is important to be conservative in this environment and not chase yield. With the economy growing well, the natural bias is for higher interest rates. As a result, the Fund continues to be conservatively positioned to protect against the impact of volatility, with a focus on principal preservation. Thank you for your investment in the Parnassus Fixed Income Fund. Yours truly, Samantha D. Palm Portfolio Manager 29 .
PARNASSUS FUNDS Annual Report • 2014 Responsible Investing Notes By Milton Moskowitz While 2014 started out with some turmoil, the stock market blasted its way to record highs by year end. Women advanced to C-suites and boards of directors. In Germany, the government followed the lead of Norway by mandating that corporate boards of directors allocate at least 30% of their seats to women. Jeans-maker Levi Strauss, a privately-owned company, cut back its orders from Cambodian factories after a strike by garment workers over low wages.
The minimum wage in Cambodian factories is $128 a month. It was a banner year for proxy resolutions asking corporations to address environmental, social and governance issues. A total of 454 resolutions were filed, well above previous years. And the average shareholder vote supporting these resolutions was 21.7%.
Five resolutions received majority support, 22 garnered 40%. Needless to say, these resolutions are strictly advisory. A resolution could attract 99% support – and the company could simply ignore it. I have a thing about corporate histories and so, for me, 2014 was notable for the publishing by HarperCollins of The Intel Trinity, a 541-page book written by Michael S.
Malone, a veteran observer of Silicon Valley. His subtitle is: “How Robert Noyce, Gordon Moore, and Andy Grove Built the World’s Most Important Company.” There will be arguments over whether Intel Corporation deserves this rating, but there is no question that it plays a key role in the technology that runs the world today. It has 107,000 employees and annual revenue of $55 billion.
Its semiconductors power most of the world’s computers. Malone traces the rise of Intel in a conversational tone. He does not shy away from setbacks and conflicts. This is not hagiography.
He relates the story of Intel from the standpoints of three leaders quite different in their personalities, capabilities and philosophies. Noyce, co-founder of the integrated circuit, was the charismatic entrepreneur, sometimes called “The Mayor of Silicon Valley.” Moore was the soft-spoken intellectual physicist, best known for “Moore’s Law,” which stated that computer power doubles every two years. Andy Grove was the feisty “take no prisoners” Jewish refugee from Hungary, responsible for the day-to-day running of Intel; his philosophy was best expressed in the title of his 1996 book, Only the Paranoid Survive. The trio came together in the 1960s at Fairchild Camera and were part of the eight engineers who left to found Intel in 1968. “At the heart of this story,” says Malone, “is the message that the company succeeded and reached the pinnacle of the modern economy not because its leadership was so brilliant (though it was) nor because its employees were so bright (though they were), nor that it had the best products (sometimes yes, most times no), nor that it made fewer mistakes than its competitors (completely wrong), but because Intel, more than any company America has ever known, had the ability to learn – from its successes and even more from its failures.” I first came across Intel in 1983 when I interviewed there for the 1984 book, The 100 Best Companies to Work for in America, which I co-authored with Robert Levering.
Intel then had 12,500 employees. Parnassus Investments was founded in 1984, and it had an early affinity for technology stocks. The Parnassus Fund made its first investment in Intel on June 9, 1986, paying $25 per shares.
That initial lot was sold four years later at $43.50 per share. Over the past 25 years Intel has remained one of the core holdings of three Parnassus Funds – the Parnassus Fund, Parnassus Core Equity Fund and Parnassus Endeavor Fund. Key inflection points were 1998, when the 100 Best list began appearing in Fortune magazine, and 2005 when the Parnassus Endeavor Fund was launched. Capital gains on the Intel holdings have totaled more than $9 million. At the present time, only one fund – the Parnassus Endeavor Fund – owns Intel stock, to the tune of 400,000 shares.
Intel has been a holding since inception of the Parnassus Endeavor Fund. Milton Moskowitz is the co-author of the Fortune magazine survey, “The 100 Best Companies to Work For,” and the co-originator of the annual Working Mother magazine survey, “The 100 Best Companies for Working Mothers.” Mr. Moskowitz serves as a consultant to Parnassus Investments in evaluating companies for workplace issues and responsible investing. Neither Fortune magazine nor Working Mother magazine has any role in the management of the Parnassus Funds, and there is no affiliation between Parnassus Investments and either publication. 30 .
Annual Report • 2014 PARNASSUS FUNDS Fund Expenses (unaudited) As a shareholder of the Funds, you incur ongoing costs, which include portfolio management fees, administrative fees, shareholder reports, and other fund expenses. The Funds do not charge transaction fees, so you do not incur transaction costs such as sales charges (loads) on purchase payments, reinvested dividends, or other distributions, redemption fees, and exchange fees. The information on this page is intended to help you understand your ongoing costs of investing in the Funds and to compare these costs with the ongoing costs of investing in other mutual funds. The following example is based on an investment of $1,000 invested at the beginning of the most recent six-month period and held for the period of July 1, 2014 through December 31, 2014. Actual Expenses In the example below, the first line for each Fund provides information about actual account values and actual expenses. You may use the information in this line, together with the amount you invested, to estimate the expenses that you paid over the period.
Simply divide your account value by $1,000 (for example, $8,600 account value divided by $1,000 = 8.6), then multiply the result by the number in the first line under the heading entitled “Expenses Paid During Period” to estimate the expenses you paid on your account during this period. Hypothetical Example for Comparison Purposes The second line of each Fund provides information about hypothetical account values and hypothetical expenses based on the Fund’s expense ratio and an assumed rate of return of 5% per year before expenses, which is not the Fund’s actual return. You may compare the ongoing costs of investing in the Fund with other mutual funds by comparing this 5% hypothetical example with the 5% hypothetical examples that appear in the shareholder reports of other funds. The hypothetical account values and expenses may not be used to estimate the actual ending account balance or expenses you paid for the period. Please note that the expenses shown in the table are meant to highlight only your ongoing costs in these Funds. Therefore, the second line of each Fund is useful in comparing only ongoing costs and will not help you determine the relative total costs of owning other mutual funds, which may include transactional costs such as loads. Beginning Account Value July 1, 2014 Ending Account Value December 31, 2014 Expenses Paid During Period* Parnassus Fund: Actual Hypothetical (5% before expenses) $1,000.00 $1,000.00 $1,060.90 $1,020.87 $ 4.47 $4.38 Parnassus Core Equity Fund – Investor Shares: Actual Hypothetical (5% before expenses) $1,000.00 $1,000.00 $1,057.10 $1,020.82 $4.51 $4.43 Parnassus Core Equity Fund – Institutional Shares: Actual Hypothetical (5% before expenses) $1,000.00 $1,000.00 $1,058.10 $1,021.73 $3.58 $3.52 Parnassus Endeavor Fund: Actual Hypothetical (5% before expenses) $1,000.00 $1,000.00 $1,088.30 $1,034.63 $5.00 $4.87 Parnassus Mid Cap Fund: Actual Hypothetical (5% before expenses) $1,000.00 $1,000.00 $1,041.40 $1,019.46 $5.87 $5.80 Parnassus Small Cap Fund: Actual Hypothetical (5% before expenses) $1,000.00 $1,000.00 $993.50 $1,019.16 $6.03 $6.11 Parnassus Asia Fund: Actual Hypothetical (5% before expenses) $1,000.00 $1,000.00 $974.50 $1,018.90 $6.22 $6.36 Parnassus Fixed Income Fund: Actual Hypothetical (5% before expenses) $1,000.00 $1,000.00 $1,010.30 $1,021.78 $3.45 $3.47 * Expenses are equal to the Fund’s annualized expense ratio of 0.86%, 0.87%, 0.69%, 0.95%, 1.14%, 1.20%, 1.25% and 0.68% for the Parnassus Fund, Parnassus Core Equity Fund – Investor Shares, Parnassus Core Equity Fund – Institutional Shares, Parnassus Endeavor Fund, Parnassus Mid Cap Fund, Parnassus Small Cap Fund, Parnassus Asia Fund and Parnassus Fixed Income Fund, respectively, multiplied by the average account value over the period, multiplied by the ratio of days in the period. The ratio of days in the period is 184/365 (to reflect the one-half year period). 31 .
PARNASSUS FUNDS Annual Report • 2014 REPORT OF INDEPENDENT REGISTERED PUBLIC ACCOUNTING FIRM To the Shareholders and Board of Trustees of the Parnassus Funds and the Parnassus Income Funds San Francisco, California We have audited the accompanying statements of assets and liabilities, including the portfolios of investments, of the Parnassus Funds (comprised of Parnassus Fund, Parnassus Mid Cap Fund, Parnassus Small Cap Fund, Parnassus Endeavor Fund, and Parnassus Asia Fund) and the Parnassus Income Funds (comprised of Parnassus Core Equity Fund and Parnassus Fixed Income Fund) (collectively, the “Trusts”) as of December 31, 2014, and the related statements of operations for the year then ended, the statements of changes in net assets for each of the two years in the period then ended for Parnassus Fund, Parnassus Mid Cap Fund, Parnassus Small Cap Fund, Parnassus Endeavor Fund, Parnassus Core Equity Fund, and Parnassus Fixed Income Fund, and for period April 30, 2013 (inception date) through December 31, 2014 for Parnassus Asia Fund, and the financial highlights for each of the five years in the period then ended for Parnassus Fund, Parnassus Mid Cap Fund, Parnassus Small Cap Fund, Parnassus Endeavor Fund, Parnassus Core Equity Fund, and Parnassus Fixed Income Fund and for period April 30, 2013 (inception date) through December 31, 2014 for Parnassus Asia Fund. These financial statements and financial highlights are the responsibility of the Trusts’ management. Our responsibility is to express an opinion on these financial statements and financial highlights based on our audits. We conducted our audits in accordance with the standards of the Public Company Accounting Oversight Board (United States). Those standards require that we plan and perform the audit to obtain reasonable assurance about whether the financial statements and financial highlights are free of material misstatement.
The Trusts are not required to have, nor were we engaged to perform, an audit of their internal control over financial reporting. Our audits included consideration of internal control over financial reporting as a basis for designing audit procedures that are appropriate in the circumstances, but not for the purpose of expressing an opinion on the effectiveness of the Trusts’ internal control over financial reporting. Accordingly, we express no such opinion. An audit also includes examining, on a test basis, evidence supporting the amounts and disclosures in the financial statements, assessing the accounting principles used and significant estimates made by management, as well as evaluating the overall financial statement presentation.
Our procedures included confirmation of securities owned as of December 31, 2014, by correspondence with the custodian and brokers; when replies were not received from brokers, we performed other auditing procedures. We believe that our audits provide a reasonable basis for our opinion. In our opinion, the financial statements and financial highlights referred to above present fairly, in all material respects, the financial position of each of the funds constituting the Parnassus Funds and the Parnassus Income Funds as of December 31, 2014, the results of their operations for the year then ended, the changes in their net assets for each of the two years in the period then ended for Parnassus Fund, Parnassus Mid Cap Fund, Parnassus Small Cap Fund, Parnassus Endeavor Fund, Parnassus Core Equity Fund, and Parnassus Fixed Income Fund and for the period April 30, 2013 (inception date) through December 31, 2014 for Parnassus Asia Fund, and the financial highlights for each of the five years in the period then ended for Parnassus Fund, Parnassus Mid Cap Fund, Parnassus Small Cap Fund, Parnassus Endeavor Fund, Parnassus Core Equity Fund, and Parnassus Fixed Income Fund and for the period April 30, 2013 (inception date) through December 31, 2014 for Parnassus Asia Fund, in conformity with accounting principles generally accepted in the United States of America. San Francisco, California February 3, 2015 32 . Annual Report • 2014 PARNASSUS FUNDS PARNASSUS FUND Portfolio of Investments as of December 31, 2014 Shares Percent Market of Net Value ($) Assets Equities Chemicals 75,000 Compass Minerals International Inc. 450,000 Potash Corporation of Saskatchewan Inc. 6,512,250 15,894,000 3.3% 22,406,250 Shares 20,000 75,000 200,000 140,000 Equities Pharmaceuticals Actavis PLC θ Allergan Inc. Gilead Sciences Inc. θ Novartis AG (ADR) 4.4% 29,732,000 Computers 165,000 International Business Machines Corp. 3.9% 26,472,600 Equipment Leasing 675,000 Air Lease Corp. 3.4% Real Estate Investment Trusts 502,972 Redwood Trust Inc. 23,159,250 Financial Services Capital One Financial Corp. Charles Schwab Corp. Essent Group Ltd. θ First Horizon National Corp. Wells Fargo & Co. 16,510,000 12,830,750 14,140,500 6,790,000 21,928,000 10.6% Food Products 350,000 Mondelez International Inc. 100,000 PepsiCo Inc. 2.7% 22,169,750 18,387,600 20,232,000 21,460,000 8,396,150 7.4% 250,000 60,000 55,000 40,000 5,148,200 15,944,250 18,852,000 12,972,400 52,916,850 1.5% 9,908,548 Retail 125,000 Target Corp. 650,000 Whole Foods Market Inc. 9,488,750 32,773,000 6.2% Semiconductor Capital Equipment 1,100,000 Applied Materials Inc. 200,000 Lam Research Corp. 42,261,750 27,412,000 15,868,000 6.3% Semiconductors 600,000 Altera Corp. 750,000 EZchip Semiconductor Ltd. θ, λ 43,280,000 22,164,000 14,355,000 5.4% Home Builders 800,000 D.R.
Horton Inc. 1,000,000 PulteGroup Inc. 245,000 Toll Brothers Inc. θ Industrial Manufacturing 200,000 Pentair PLC 72,199,250 12,713,750 9,456,000 3.3% Health Care Products 110,000 Perrigo Co. PLC Market Value ($) 7.8% Communications Equipment 400,000 QUALCOMM Inc. 200,000 425,000 550,000 500,000 400,000 Percent of Net Assets 2.0% Internet eBay Inc.
θ Equinix Inc. θ Google Inc., Class A θ LinkedIn Corp. θ 50,088,150 Services 450,000 Thomson Reuters Corp.
λ 9.7% 0.9% 1.1% 34,938,000 21,351,000 13,416,000 10.2% Transportation 200,000 C.H. Robinson Worldwide Inc. 500,000 Expeditors International of Washington Inc. 69,705,000 14,978,000 22,305,000 5.5% Total investment in equities (cost $537,708,235) 37,283,000 98.3% 667,262,998 6,185,000 Networking Products 350,000 Riverbed Technology Inc. θ 18,153,000 66,008,500 Lodging 500,000 Belmond Ltd.
θ 2.7% Telecommunications Equipment 1,800,000 Ciena Corp. θ, λ 1,100,000 Finisar Corp. θ, λ 200,000 Motorola Solutions Inc. 13,284,000 14,030,000 13,603,800 29,186,300 9,188,400 36,519,000 7,143,500 The accompanying notes are an integral part of these financial statements. 33 .
PARNASSUS FUNDS Annual Report • 2014 PARNASSUS FUND Portfolio of Investments as of December 31, 2014 (continued) Principal Amount ($) Short-Term Securities Percent Market of Net Value ($) Assets Certificates of Deposit α 100,000 Albina Community Bank 0.20%, matures 01/15/2015 100,000 Carver Federal Savings Bank 0.25%, matures 02/18/2015 250,000 Community Bank of the Bay 0.30%, matures 07/15/2015 100,000 Eastern Bank 0.10%, matures 01/29/2015 100,000 Latino Community Credit Union 0.60%, matures 02/20/2015 250,000 Metro Bank 0.25%, matures 05/10/2015 250,000 Opportunities Credit Union 0.20%, matures 04/25/2015 100,000 Self-Help Credit Union 0.55%, matures 01/15/2015 100,000 Southern Bancorp Bank 0.35%, matures 01/15/2015 250,000 Urban Partnership Bank 0.30%, matures 10/01/2015 99,847 99,474 244,658 99,452 246,439 Percent of Net Assets Market Value ($) Securities Purchased with Cash Collateral from Securities Lending Registered Investment Companies 9,018,468 Invesco Aim Government & Agency Portfolio Short-Term Investments Trust, Institutional Class variable rate, 0.01% 1.3% 9,018,468 Total short-term securities (cost $21,210,563) 3.1% 21,210,563 Total securities (cost $558,918,798) 101.4% 688,473,561 246,850 99,847 Payable upon return of securities loaned (1.3%) (9,018,468) 99,847 Other assets and liabilities - net (0.1%) (324,990) 242,465 Community Development Loans α 200,000 Boston Community Loan Fund 1.00%, matures 04/15/2015 200,000 Root Capital Loan Fund 1.25%, matures 01/25/2015 100,000 Vermont Community Loan Fund 0.85%, matures 10/15/2015 Total net assets 100.0% 679,130,103 1,578,573 196,582 199,212 95,282 0.1% 34 Short-Term Securities 99,694 0.2% Time Deposits 10,122,446 BBH Cash Management Service JPM Chase, Nassau 0.03%, due 01/02/2015 Principal Amount ($) 491,076 1.5% θ This security is non-income producing. λ This security, or partial position of this security, was on loan at December 31, 2014. The total value of the securities on loan at December 31, 2014 was $8,822,445. α Market value adjustments have been applied to these securities to reflect potential early withdrawal. ADR American Depository Receipt PLC Public Limited Company 10,122,446 The accompanying notes are an integral part of these financial statements. . Annual Report • 2014 PARNASSUS FUNDS PARNASSUS CORE EQUITY FUND Portfolio of Investments as of December 31, 2014 Shares Percent of Net Assets Equities Shares 168,537,030 272,076,000 Chemicals 1,941,000 Compass Minerals International Inc. Ω 2,100,000 Praxair Inc. Market Value ($) 3.8% Communications Equipment 5,015,000 QUALCOMM Inc. Computers 2,500,000 Apple Inc. 440,613,030 3.2% 372,764,950 2.4% 275,950,000 Consulting Services 2,153,000 Accenture PLC 1.7% 192,284,430 Cosmetics & Personal Care 4,200,000 Procter & Gamble Co. 3.3% 382,578,000 Market Value ($) 191,280,000 211,500,000 114,770,000 164,620,500 5.9% Oil & Gas 5,400,000 National Oilwell Varco Inc. 825,000 1,850,000 3,350,000 2,450,000 682,170,500 3.1% 353,862,000 Pharmaceuticals Actavis PLC θ Allergan Inc. Gilead Sciences Inc. θ Novartis AG (ADR) 212,363,250 393,291,500 315,771,000 227,017,000 9.9% Financial Services 7,774,500 Charles Schwab Corp. 2,750,000 MasterCard Inc. 1,148,442,750 234,712,155 236,940,000 4.0% 2,500,000 8,375,000 2,750,000 6,717,000 Percent of Net Assets Natural Gas 3,000,000 Energen Corp. 9,000,000 MDU Resources Group Inc. 2,300,000 Northwest Natural Gas Co. Ω 4,535,000 Spectra Energy Corp. Equities Food Products McCormick & Co. Mondelez International Inc. PepsiCo Inc. Sysco Corp. Real Estate Investment Trusts 9,913,000 Iron Mountain Inc. 3.3% 383,236,580 471,652,155 Retail 3,529,000 CVS Health Corp. 2.9% 339,877,990 185,750,000 304,221,875 260,040,000 266,597,730 3.9% 448,560,000 1,016,609,605 Services 6,610,000 Thomson Reuters Corp. 2.3% 266,647,400 Telecommunications Equipment 6,400,000 Motorola Solutions Inc. 3.7% 429,312,000 Telecommunications Provider 8,909,000 Shaw Communications Inc.
λ 8.7% Semiconductor Capital Equipment 18,000,000 Applied Materials Inc. 2.1% 240,453,910 Health Care Products 1,850,000 Perrigo Co. PLC 2.7% 309,246,000 Home Products 1,220,000 WD-40 Co. Ω 0.9% 103,797,600 Industrial Manufacturing 6,475,000 Pentair PLC 7,500,000 Xylem Inc. 430,069,500 285,525,000 6.2% Insurance 3,460,000 Verisk Analytics Inc.
θ 715,594,500 1.9% Transportation 5,166,000 Expeditors International of Washington Inc. 2,382,500 United Parcel Service Inc. 221,613,000 Internet 5,711,000 eBay Inc. θ 225,000 Google Inc., Class A θ 665,000 Google Inc., Class C θ 320,501,320 119,398,500 350,056,000 6.8% 4.3% Utility & Power Distribution 2,240,758 AGL Resources Inc. 8,743,343 Questar Corp. 230,880,000 97,482,180 2.8% 495,317,785 122,143,718 221,031,711 3.1% 343,175,429 1.9% 225,808,000 94.8% 10,977,885,614 789,955,820 Waste Management 4,400,000 Waste Management Inc. Medical Equipment 4,800,000 Patterson Companies Inc. 849,000 Teleflex Inc. 230,455,260 264,862,525 328,362,180 Total investment in equities (cost $7,951,862,161) The accompanying notes are an integral part of these financial statements. 35 . PARNASSUS FUNDS Annual Report • 2014 PARNASSUS CORE EQUITY FUND Portfolio of Investments as of December 31, 2014 (continued) Principal Amount ($) 250,000 250,000 250,000 Percent of Net Assets Short-Term Securities Certificates of Deposit α Community Bank of the Bay 0.30%, matures 07/15/2015 Community Trust Credit Union 0.55%, matures 10/15/2015 Urban Partnership Bank 0.30%, matures 09/24/2015 244,658 242,137 242,655 0.0% 500,000 500,000 500,000 500,000 Certificates of Deposit Account Registry Service α CDARS agreement with Community Bank of the Bay, dated 01/23/2014, matures 01/22/2015, 0.15% Participating depository institutions: Citizens Business Bank, par 203,129; EverBank, par 243,500; The PrivateBank and Trust Company, par 53,371; (cost $498,848) CDARS agreement with Community Bank of the Bay, dated 02/06/2014, matures 02/05/2015, 0.15% Participating depository institutions: Bank of America, N.A., par 241,000; Southern Bancorp Bank, par 241,000; The PrivateBank and Trust Company, par 18,000; (cost $498,079) CDARS agreement with Community Bank of the Bay, dated 04/10/2014, matures 04/09/2015, 0.20% Participating depository institutions: Apple Bank for Savings, par 243,500; The Park National Bank, par 243,500; The PrivateBank and Trust Company, par 13,000; (cost $494,617) CDARS agreement with Community Bank of the Bay, dated 10/16/2014, matures 10/15/2015, 0.15% Participating depository institutions: BB&T, par 241,000; Park Bank, par 241,000; United Community Bank, par 18,000; (cost $484,231) 100,000 36 729,450 Principal Amount ($) Percent Short-Term Securities of Net Assets 1,000,000 CEI Investment Notes Inc. 1.00%, matures 07/01/2015 7,500,000 MicroVest Plus, LP Note 2.25%, matures 04/15/2015 200,000 New Hampshire Community Loan Fund 1.00%, matures 07/15/2015 200,000 Root Capital Loan Fund 1.25%, matures 01/25/2015 100,000 Vermont Community Loan Fund 0.85%, matures 04/15/2015 498,848 Market Value ($) 970,246 7,371,782 193,589 199,212 98,290 0.1% Time Deposits 575,956,849 BBH Cash Management Service Anz, London 0.03%, due 01/02/2015 BTMU, Grand Cayman 0.03%, due 01/02/2015 STD Charter Bank, Nassau 0.03%, due 01/02/2015 Wells Fargo, Grand Cayman 0.03%, due 01/02/2015 8,931,410 56,254,202 173,531,003 198,553,442 147,618,202 5.0% 498,079 575,956,849 0.6% 73,344,197 5.7% 660,937,681 Securities Purchased with Cash Collateral from Securities Lending Registered Investment Companies 73,344,197 Invesco Aim Government & Agency Portfolio Short-Term Investments Trust, Institutional Class variable rate, 0.01% 494,617 Total short-term securities (cost $660,937,681) Total securities (cost $8,612,799,842) 484,231 0.0% Community Development Loans α Boston Community Loan Fund 1.00%, matures 04/15/2015 Market Value ($) 1,975,775 Payable upon return of securities loaned Other assets and liabilities -net Total net assets 98,291 The accompanying notes are an integral part of these financial statements. 100.5% 11,638,823,295 (0.6%) (73,344,197) 0.1% 17,494,979 100.0% 11,582,974,077 . Annual Report • 2014 PARNASSUS FUNDS PARNASSUS CORE EQUITY FUND Portfolio of Investments as of December 31, 2014 (continued) Ω Fund ownership consists of 5% or more of the shares outstanding of the Affiliated Issuer, as defined under the Investment Securities Act of 1940. θ This security is non-income producing. λ This security, or partial position of this security, was on loan at December 31, 2014. The total value of the securities on loan at December 31, 2014 was $71,827,804. α Market value adjustments have been applied to these securities to reflect potential early withdrawal. ADR American Depository Receipt PLC Public Limited Company The accompanying notes are an integral part of these financial statements. 37 . PARNASSUS FUNDS Annual Report • 2014 PARNASSUS ENDEAVOR FUND Portfolio of Investments as of December 31, 2014 Shares Percent of Net Assets Equities Market Value ($) Shares 4.6% 35,306,750 Computers 200,000 International Business Machines Corp. 4.2% 32,088,000 Cosmetics & Personal Care 140,000 Procter & Gamble Co. Electronic Components 675,000 Corning Inc. 200,000 565,000 500,000 510,000 1.7% 12,752,600 15,477,750 16,510,000 17,057,350 6,790,000 27,958,200 Food Products 415,000 Mondelez International Inc. 100,000 PepsiCo Inc. 1.8% Internet 300,000 eBay Inc. θ 75,000 Google Inc., Class A θ 10,000 LinkedIn Corp. θ 24,530,875 58,932,600 0.1% 884,700 4.2% 32,656,000 9,570,000 13,828,500 23,398,500 Telecommunications Equipment 1,925,000 Ciena Corp. θ, λ 4.9% 37,364,250 2.2% 16,868,750 Transportation 400,000 C.H.
Robinson Worldwide Inc. 500,000 Expeditors International of Washington Inc. Total investment in equities (cost $533,959,942) Principal Amount ($) Short-Term Securities Time Deposits 87,774,574 BBH Cash Management Service BBH, Grand Cayman 0.03%, due 01/02/2015 86,994,400 1.0% 7,455,800 Retail 450,000 Target Corp. 735,000 Whole Foods Market Inc. 34,159,500 37,058,700 9.2% 29,956,000 22,305,000 6.7% 38,266,200 28,278,000 12,972,400 7,477,800 11.4% 38 40,374,000 3.0% 16,836,000 39,799,500 2,297,100 Pharmaceuticals Allergan Inc. Gilead Sciences Inc. θ Novartis AG (ADR) Roche Holdings Ltd. (ADR) Professional Services 220,000 Insperity Inc. Software 150,000 Citrix Systems Inc.
θ 150,000 Intuit Inc. 14,018,950 7.7% 180,000 300,000 140,000 220,000 25,858,000 14,516,000 68,315,550 15,074,875 9,456,000 3.2% Networking Products 1,600,000 Riverbed Technology Inc. θ 49,739,000 Telecommunications Provider 625,000 Shaw Communications Inc. λ 8.8% Machinery 10,000 Deere & Co. Semiconductors 700,000 Altera Corp. 400,000 Intel Corp. 5.2% 2.0% Market Value ($) 29,904,000 19,835,000 6.5% Financial Services Capital One Financial Corp. Charles Schwab Corp. First Horizon National Corp. Wells Fargo & Co. Industrial Manufacturing 55,000 W.W.
Grainger Inc. λ Percent of Net Assets Semiconductor Capital Equipment 1,200,000 Applied Materials Inc. 250,000 Lam Research Corp. Communications Equipment 475,000 QUALCOMM Inc. Equities 71,218,200 The accompanying notes are an integral part of these financial statements. 52,261,000 88.4% 680,637,675 Percent of Net Assets 11.4% Market Value ($) 87,774,574 . Annual Report • 2014 PARNASSUS FUNDS PARNASSUS ENDEAVOR FUND Portfolio of Investments as of December 31, 2014 (continued) Principal Amount ($) Short-Term Securities Percent of Net Assets Market Value ($) Securities Purchased with Cash Collateral from Securities Lending Registered Investment Companies 38,086,610 Invesco Aim Government & Agency Portfolio Short-Term Investments Trust, Institutional Class variable rate, 0.01% Total short-term securities (cost $125,861,184) 38,086,610 16.3% 125,861,184 Total securities (cost $659,821,126) 104.7% 806,498,859 Payable upon return of securities loaned Other assets and liabilities - net Total net assets 4.9% (4.9%) (38,086,610) 0.2% 1,919,574 100.0% 770,331,823 λ This security, or partial position of this security, was on loan at December 31, 2014. The total value of the securities on loan at December 31, 2014 was $37,303,110. θ This security is non-income producing. ADR American Depository Receipt The accompanying notes are an integral part of these financial statements. 39 . PARNASSUS FUNDS Annual Report • 2014 PARNASSUS MID CAP FUND Portfolio of Investments as of December 31, 2014 Shares Percent Market of Net Value ($) Assets Equities Chemicals 71,000 Compass Minerals International Inc. 2.0% Data Processing 70,000 Equifax Inc. 107,500 Fiserv Inc. θ 6,164,930 5,660,900 7,629,275 4.4% Financial Services 200,000 Charles Schwab Corp. 861,200 First Horizon National Corp. 255,000 SEI Investments Co. 13,290,175 6,038,000 11,695,096 10,210,200 9.1% Food Products 123,276 McCormick & Co. 215,000 Sysco Corp. Health Care Products 139,270 DENTSPLY International Inc. 44,500 Perrigo Co. PLC 17,692,757 7,418,913 7,438,620 4.8% Health Care Services 95,000 Cardinal Health Inc. 14,857,533 2.5% 7,669,350 Industrial Manufacturing 168,800 Pentair PLC 292,280 Xylem Inc. 11,211,696 11,127,100 7.3% Insurance 134,583 Verisk Analytics Inc. θ 22,338,796 2.8% 8,620,041 8,315,239 6,602,150 5.0% Natural Gas 94,500 Energen Corp. 412,900 MDU Resources Group Inc. 145,000 Spectra Energy Corp. 14,917,389 6,025,320 9,703,150 5,263,500 7.0% Pharmaceuticals 15,000 Allergan Inc. 40 Percent of Net Assets 2.6% 8,058,127 Real Estate Investment Trusts 284,660 Iron Mountain Inc. 3.6% 11,004,956 2.0% 6,176,542 Retail 77,800 Nordstrom Inc. Semiconductor Capital Equipment 400,000 Applied Materials Inc. 182,900 Synopsys Inc.
θ 9,968,000 7,950,663 5.9% Services 21,000 Ecolab Inc. 17,918,663 0.7% 2,194,920 Software 96,000 Autodesk Inc. θ 51,400 Intuit Inc. 5,765,760 4,738,566 3.5% 10,504,326 Telecommunications Equipment 182,300 Motorola Solutions Inc. 4.0% 12,228,684 Telecommunications Provider 318,000 Shaw Communications Inc. λ 2.8% 8,582,820 Transportation 85,000 C.H.
Robinson Worldwide Inc. 167,000 Expeditors International of Washington Inc. 102,500 Genesee & Wyoming Inc., Class A θ 6,365,650 7,449,870 9,216,800 23,032,320 7,492,617 9,581,120 5.6% Waste Management 155,000 Waste Management Inc. Total investment in equities (cost $221,315,613) 6,268,725 1.0% Utility & Power Distribution 137,454 AGL Resources Inc. 379,000 Questar Corp. 20,991,970 2.1% Market Value ($) Professional Services 237,773 Insperity Inc. 7.5% Medical Equipment 172,874 Patterson Companies Inc. 57,500 Teleflex Inc. Oil & Gas 125,500 Cameron International Corp. θ Equities 27,943,296 9,159,407 8,533,350 5.8% Shares 3,188,850 The accompanying notes are an integral part of these financial statements. 17,073,737 2.6% 7,954,600 94.6% 288,673,507 . Annual Report • 2014 PARNASSUS FUNDS PARNASSUS MID CAP FUND Portfolio of Investments as of December 31, 2014 (continued) Principal Amount ($) Short-Term Securities Percent of Net Assets Time Deposits 15,934,874 BBH Cash Management Service JPM Chase, Nassau 0.03%, due 01/02/2015 Market Value ($) 5.2% 15,934,874 2.9% 8,705,955 8.1% 24,640,829 Securities Purchased with Cash Collateral from Securities Lending Registered Investment Companies 8,705,955 Invesco Aim Government & Agency Portfolio Short-Term Investments Trust, Institutional Class variable rate, 0.01% Total short-term securities (cost $24,640,829) Total securities (cost $245,956,442) 102.7% 313,314,336 Payable upon return of securities loaned (2.9%) Other assets and liabilities - net 0.2% Total net assets (8,705,955) 688,458 100.0% 305,296,839 θ This security is non-income producing. λ This security, or partial position of this security, was on loan at December 31, 2014. The total value of the securities on loan at December 31, 2014 was $8,525,326. PLC Public Limited Company The accompanying notes are an integral part of these financial statements. 41 . PARNASSUS FUNDS Annual Report • 2014 PARNASSUS SMALL CAP FUND Portfolio of Investments as of December 31, 2014 Shares Percent Market of Net Value ($) Assets Equities Shares Equities Auto Parts 350,000 Gentex Corp. 2.3% 12,645,500 Chemicals 205,000 Compass Minerals International Inc. 3.2% 17,800,150 Consumer Services 550,000 Sotheby’s 4.2% 23,749,000 Professional Services 310,000 Insperity Inc. 10,671,000 12,724,800 Percent of Net Assets Real Estate Investment Trusts 290,000 Iron Mountain Inc. 615,000 Redwood Trust Inc. λ Electronics 100,000 Harman International Industries Inc. 240,000 Plantronics Inc. 4.2% Equipment Leasing 740,000 Air Lease Corp. 950,000 465,000 1,150,000 280,000 4.5% Financial Services Essent Group Ltd. θ First American Financial Corp. First Horizon National Corp. SEI Investments Co. Health Care Products 125,000 Sirona Dental Systems Inc. θ Health Care Services 100,000 VCA Inc.
θ Lodging 1,575,000 Belmond Ltd. θ 1,300,000 135,000 1,571,400 210,000 25,389,400 67,016,200 2.0% 0.9% 3.5% 10,921,250 4,877,000 1.9% 10,505,900 11,211,400 12,115,500 4.2% Retail 275,000 Group 1 Automotive Inc. Semiconductors 1,250,000 PMC-Sierra Inc. θ 23,326,900 4.4% 24,645,500 2.0% 11,450,000 Software 2,177,709 Checkpoint Systems Inc.
θ, Ω 2,215,000 Covisint Corp. θ, Ω, λ 150,000 VeriSign Inc. θ, λ 29,899,945 5,869,750 8,550,000 Medical Equipment 1,400,000 GenMark Diagnostics Inc.
θ, λ 165,000 Patterson Companies Inc. 44,319,695 5.2% 28,968,000 Utility & Power Distribution 430,000 Questar Corp. 1.9% 10,870,400 Total investment in equities (cost $489,750,710) 99.7% 558,716,820 Transportation 2,400,000 UTi Worldwide Inc. θ, λ 19,482,750 22,841,000 10,824,300 23,806,710 15,792,000 13.0% 73,264,010 19,054,000 7,936,500 4.8% 6.6% Principal Amount ($) Short-Term Securities Time Deposits 3,637,429 BBH Cash Management Service Banco Santander, Frankfurt 0.03%, due 01/02/2015 26,990,500 37,068,865 Natural Gas 625,000 MDU Resources Group Inc. 225,000 Northwest Natural Gas Co. 14,687,500 11,227,500 4.6% 42 36,115,000 7.8% Machinery Blount International Inc. θ Graco Inc. MRC Global Inc.
θ Regal-Beloit Corp. Minerals & Mining 2,063,968 Dominion Diamond Corp. θ 10,975,500 25,139,500 6.5% 23,395,800 24,424,500 15,763,500 15,617,000 11,211,200 12.0% Oil & Gas 1,350,000 Denbury Resources Inc. λ 3,425,000 W&T Offshore Inc.
λ Market Value ($) 25,915,000 The accompanying notes are an integral part of these financial statements. Percent of Net Assets 0.6% Market Value ($) 3,637,429 . Annual Report • 2014 PARNASSUS FUNDS PARNASSUS SMALL CAP FUND Portfolio of Investments as of December 31, 2014 (continued) Principal Amount ($) Short-Term Securities Percent of Net Assets Market Value ($) Securities Purchased with Cash Collateral from Securities Lending Registered Investment Companies 68,702,942 Invesco Aim Government & Agency Portfolio Short-Term Investments Trust, Institutional Class variable rate, 0.01% 68,702,942 12.9% Total short-term securities (cost $72,340,371) 12.3% 72,340,371 Total securities (cost $562,091,081) 112.6% 631,057,191 Payable upon return of securities loaned (12.3%) (68,702,942) Other assets and liabilities - net Total net assets (0.3%) (1,892,744) 100.0% 560,461,505 Ω Fund ownership consists of 5% or more of the shares outstanding of the Affiliated Issuer, as defined under the Investment Securities Act of 1940. θ This security is non-income producing. λ This security, or partial position of this security, was on loan at December 31, 2014. The total value of the securities on loan at December 31, 2014 was $66,714,347. The accompanying notes are an integral part of these financial statements. 43 . PARNASSUS FUNDS Annual Report • 2014 PARNASSUS ASIA FUND Portfolio of Investments as of December 31, 2014 Shares Percent Market of Net Value ($) Assets Equities China 6,500 Air Lease Corp. 1,100 Alibaba Group Holding Ltd. (ADR) θ 3,500 Expeditors International of Washington Inc. 5,300 Mindray Medical International Ltd. (ADR) 3,600 QUALCOMM Inc. 223,015 114,334 139,920 267,588 Hong Kong China Minsheng Banking Corp., Ltd. Lenovo Group Ltd. Li & Fung Ltd. SITC International Holdings Co., Ltd. Sun Art Retail Group Ltd. Television Broadcasts Ltd. 1,119,477 Indonesia PT Asuransi Multi Artha Guna PT Bank Danamon Indonesia PT Bank Rakyat Indonesia (Persero) PT Siloam International Hospitals θ Percent Market of Net Value ($) Assets Taiwan Applied Materials Inc. Chailease Holding Co., Ltd. Far EasTone Telecommunications Co., Ltd. Hermes Microvision Inc. Lite-On Technology Corp. MediaTek Inc. Novatek Microelectronics Corp. St. Shine Optical Co., Ltd. Taiwan Semiconductor Manufacturing Co., Ltd. (ADR) 286,580 49,414 165,472 199,563 193,738 174,031 167,241 138,342 295,415 24,000 60,000 Thailand Advanced Info Service Public Co., Ltd. Thai Union Frozen Products Public Co., Ltd. Thanachart Capital Public Co., Ltd. 182,079 164,094 172,816 7.0% Total investment in equities (cost $6,716,855) 181,970 251,328 141,873 228,000 208,613 116,342 215,132 1,343,258 2.0% 95.0% 7,083,792 Principal Amount ($) 340,741 Short-Term Securities Percent Market of Net Value ($) Assets Time Deposits BBH Cash Management Service BBH, Grand Cayman 0.03%, due 01/02/2015 4.6% 340,741 Total short-term securities (cost $340,741) 4.6% 340,741 152,656 Total securities (cost $7,057,596) Singapore 40,000 Keppel Corp., Ltd. 110,000 OSIM International Ltd. 30,000 Petra Foods Ltd. 266,602 163,626 85,973 6.9% 516,201 3.9% 99.6% 7,424,533 Other assets and liabilities - net 0.4% 290,561 Total net assets The accompanying notes are an integral part of these financial statements. 32,944 100.0% 7,457,477 θ This security is non-income producing. ADR American Depository Receipt PT Perseroan Terbatas 44 518,989 571,862 18.0% South Korea 240 Samsung Electronics Co., Ltd. Equities 22.4% 1,669,796 95,270 145,328 187,693 143,571 Japan Fast Retailing Co., Ltd. KDDI Corp. Kyocera Corp. Linear Technology Corp. Rakuten Inc. TOTO Ltd. USS Co., Ltd. Philippines 235,000 Manila Water Co. 4,000 170,000 12,000 30,000 8,500 13,200 180,000 7.7% 500 4,000 3,100 5,000 15,000 10,000 14,000 900,992 156,879 262,428 168,519 218,203 138,776 174,672 15.0% 5,072,200 400,000 200,000 130,000 11,500 20,000 72,000 156,135 12.1% 120,000 201,000 180,000 400,000 140,000 30,000 Shares .
Annual Report • 2014 PARNASSUS FUNDS PARNASSUS FIXED INCOME FUND Portfolio of Investments as of December 31, 2014 Principal Amount ($) Commercial MortgageBacked Securities Percent Market of Net Value ($) Assets Commercial Mortgage-Backed Securities 986,086 DBUBS Mortgage Trust Series 2011-LC2A, Class A2, 3.39%, due 07/10/2044 1,500,000 JP Morgan Mortgage Trust Series 2011-C4, Class A3, 4.11%, due 07/15/2046 1,000,000 JP Morgan Mortgage Trust Series 2011-C4, Class A4, 4.39%, due 07/15/2046 1,000,000 JP Morgan Mortgage Trust Series 2013-C13, Class A2, 2.67%, due 01/15/2046 1,000,000 Morgan Stanley Capital Trust Series 2011-C1, Class A2, 3.88%, due 09/15/2047 1,000,000 UBS-Barclays Mortgage Trust Series 2012-C2, Class A3, 3.06%, due 05/10/2063 Total investment in commercial mortgage-backed securities (cost $6,743,779) Principal Amount ($) Convertible Bonds 3.5% Total investment in convertible bonds (cost $491,563) Principal Amount ($) Corporate Bonds Air Transportation 1,468,072 Southwest Air 07-1 Trust 6.15%, due 08/01/2022 Apparel 3,000,000 Hanesbrands Inc. 6.38%, due 12/15/2020 Cosmetics & Personal Care 2,000,000 Procter & Gamble Co. 2.30%, due 02/06/2022 Corporate Bonds Percent Market of Net Value ($) Assets Data Processing 2,000,000 Fiserv Inc. 3.13%, due 10/01/2015 1,013,578 1,602,984 1,097,489 1,021,659 1,019,711 1.1% 2,034,446 Equipment Leasing 1,500,000 United Rentals North America Inc. 6.13%, due 06/15/2023 0.8% 1,575,000 Financial Services 3,000,000 Discover Financial Services 5.20%, due 04/27/2022 1.7% 3,313,215 Food Products 3,000,000 Mondelez International Inc. 5.38%, due 02/10/2020 1.8% 3,398,412 Health Care Products 2,000,000 CR Bard Inc. 4.40%, due 01/15/2021 1.1% 2,196,930 1,032,539 6,787,960 Percent Market of Net Value ($) Assets Biotechnology 550,000 Exelixis Inc. 4.25%, due 08/15/2019 Principal Amount ($) 306,969 Health Care Services 2,100,000 Cardinal Health Inc. 1.90%, due 06/15/2017 1,000,000 Cardinal Health Inc. 1.70%, due 03/15/2018 2,116,485 993,536 1.6% Industrial Manufacturing 2,870,000 Danaher Corp. 5.40%, due 03/01/2019 4,050,000 Pentair Finance SA 3.15%, due 09/15/2022 3,110,021 3,235,096 3,978,121 0.9% 1.7% 1.0% 1.1% 2,053,738 Internet 3,000,000 Google Inc. 3.63%, due 05/19/2021 1.7% 3,218,811 1.6% 3,119,651 1.1% 2,110,036 Pharmaceuticals 2,000,000 Gilead Sciences Inc. 3.70%, due 04/01/2024 Percent Market of Net Value ($) Assets Insurance 2,000,000 Cigna Corp. 2.75%, due 11/15/2016 Networking Products 2,000,000 Cisco Systems Inc. 5.50%, due 02/22/2016 306,969 7,213,217 Medical Equipment 3,200,000 Agilent Technologies Inc. 3.20%, due 10/01/2022 0.2% 3.8% 1.1% 2,097,662 1,684,613 3,180,000 1,983,948 The accompanying notes are an integral part of these financial statements. 45 . PARNASSUS FUNDS Annual Report • 2014 PARNASSUS FIXED INCOME FUND Portfolio of Investments as of December 31, 2014 (continued) Principal Amount ($) Percent Market of Net Value ($) Assets Corporate Bonds 1.1% Retail 3,000,000 CVS Health Corp. 4.13%, due 05/15/2021 3,500,000 Nordstrom Inc. 4.00%, due 10/15/2021 2,500,000 Starbucks Corp. 3.85%, due 10/01/2023 2,035,278 Percent Market of Net Value ($) Assets 2,025,130 2.6% Total investment in corporate bonds (cost $83,352,850) 3,252,924 5,227,652 43.9% 84,583,375 3,744,346 2,665,128 5.0% Semiconductor Capital Equipment 2,000,000 Applied Materials Inc. 2.65%, due 06/15/2016 2,000,000 Applied Materials Inc. 4.30%, due 06/15/2021 Services 2,500,000 Ecolab Inc. 4.35%, due 12/08/2021 9,662,398 2,044,038 2,180,126 2.2% 1.4% Software 2,000,000 Adobe Systems Inc. 3.25%, due 02/01/2015 2,000,000 Intuit Inc. 5.75%, due 03/15/2017 4,224,164 2,723,973 2,003,796 2,198,010 2.1% Telecommunications Equipment 2,000,000 Corning Inc. 3.70%, due 11/15/2023 3,000,000 Juniper Networks Inc. 4.50%, due 03/15/2024 3,000,000 Motorola Solutions Inc. 3.75%, due 05/15/2022 4,201,806 2,060,454 3,028,221 3,043,542 4.3% Transportation 3,000,000 Burlington Northern Santa Fe Corp. 3.85%, due 09/01/2023 3,000,000 FedEx Corp. 2.70%, due 04/15/2023 8,132,217 3,164,442 2,921,745 3.1% 46 Corporate Bonds 2,000,000 Waste Management Inc. 3.50%, due 05/15/2024 Real Estate Investment Trusts 2,000,000 Regency Centers LP 3.75%, due 06/15/2024 Waste Management 1,000,000 Waste Management Inc. 6.38%, due 03/11/2015 2,000,000 Waste Management Inc. 4.75%, due 06/30/2020 Principal Amount ($) 6,086,187 1,010,300 2,192,222 Principal Amount ($) Percent Federal Agency Mortgage- of Net Market Backed Securities Value ($) Assets Federal Agency Mortgage-Backed Securities 788,504 Fannie Mae Pool 931739 4.00%, due 08/01/2024 849,405 Fannie Mae Pool AD5108 3.50%, due 12/01/2025 775,862 Fannie Mae Pool AH0973 4.00%, due 12/01/2025 984,080 Fannie Mae Pool MA0695 4.00%, due 04/01/2031 823,383 Fannie Mae Pool MA0844 4.50%, due 08/01/2031 928,827 Fannie Mae Pool MA1607 3.00%, due 10/01/2033 1,457,357 Fannie Mae Pool 926115 4.50%, due 04/01/2039 976,297 Fannie Mae Pool 931065 4.50%, due 05/01/2039 1,339,215 Fannie Mae Pool AD4296 5.00%, due 04/01/2040 1,009,058 Fannie Mae Pool AL0215 4.50%, due 04/01/2041 1,711,813 Fannie Mae Pool AL0393 4.50%, due 06/01/2041 1,304,540 Fannie Mae Pool AI8483 4.50%, due 07/01/2041 801,373 Fannie Mae Pool AJ4994 4.50%, due 11/01/2041 997,985 Fannie Mae Pool AK3103 4.00%, due 02/01/2042 1,409,588 Fannie Mae Pool AQ2925 3.50%, due 01/01/2043 1,168,972 Fannie Mae Pool AS1130 4.50%, due 11/01/2043 1,420,643 Fannie Mae Pool AS1587 4.50%, due 01/01/2044 960,719 FHLMC Multifamily Structured Pass Through Certificates K-029, Class A1, 2.84%, due 10/25/2022 851,646 Freddie Mac Pool E02746 3.50%, due 11/01/2025 The accompanying notes are an integral part of these financial statements. 840,142 898,836 829,349 1,060,885 899,387 959,377 1,584,177 1,066,425 1,484,526 1,096,709 1,874,536 1,424,375 870,580 1,070,449 1,472,388 1,268,891 1,543,323 994,214 900,336 . Annual Report • 2014 PARNASSUS FUNDS PARNASSUS FIXED INCOME FUND Portfolio of Investments as of December 31, 2014 (continued) Principal Amount ($) Percent Federal Agency Mortgage- of Net Market Backed Securities Value ($) Assets 746,558 Freddie Mac Pool G14820 3.50%, due 12/01/2026 852,674 Freddie Mac Pool G14809 3.00%, due 07/01/2028 916,353 Freddie Mac Pool G30672 3.50%, due 07/01/2033 1,796,905 Freddie Mac Pool C91754 4.50%, due 02/01/2034 980,269 Freddie Mac Pool C91762 4.50%, due 04/01/2034 985,721 Freddie Mac Pool G05514 5.00%, due 06/01/2039 1,795,523 Freddie Mac Pool A90225 4.00%, due 12/01/2039 1,915,447 Freddie Mac Pool A93451 4.50%, due 08/01/2040 843,474 Freddie Mac Pool G07426 4.00%, due 06/01/2043 789,240 887,365 964,220 1,963,616 1,070,140 1,100,333 1,916,255 2,084,330 900,528 Total investment in federal agency mortgage-backed securities (cost $33,442,158) Principal Amount ($) 17.6% Supranational Bonds Total investment in supranational bonds (cost $7,017,015) 3,000,000 3,000,000 6,000,000 4,000,000 4,990,685 3.6% 7,002,709 Percent Market of Net Value ($) Assets U.S. Government Treasury Bonds U.S. Government Treasury Bonds U.S. Treasury 2.50%, due 04/30/2015 U.S.
Treasury 2.13%, due 05/31/2015 U.S. Treasury 1.88%, due 06/30/2015 U.S. Treasury 0.38%, due 11/15/2015 Percent of Net Assets Market Value ($) 2,036,406 2,030,624 2,996,484 5,898,282 2,490,625 1,947,344 4,128,436 4,210,936 4,209,064 4,120,622 1,283,178 Total investment in U.S. government treasury bonds (cost $50,873,290) Principal Amount ($) 26.7% Total investment in long-term securities (cost $181,920,655) 33,814,932 2,012,024 U.S.
Government Treasury Bonds 2,000,000 U.S. Treasury 1.75%, due 05/31/2016 2,000,000 U.S. Treasury 1.50%, due 07/31/2016 3,000,000 U.S.
Treasury 0.50%, due 09/30/2016 6,000,000 U.S. Treasury 1.75%, due 05/15/2022 2,500,000 U.S. Treasury 2.00%, due 02/15/2023 2,000,000 U.S.
Treasury 1.75%, due 05/15/2023 4,000,000 U.S. Treasury 2.50%, due 08/15/2023 4,000,000 U.S. Treasury 2.75%, due 11/15/2023 4,000,000 U.S.
Treasury 2.75%, due 02/15/2024 4,000,000 U.S. Treasury 2.50%, due 05/15/2024 1,133,440 U.S. Treasury (TIPS) 1.75%, due 01/15/2028 Percent Market of Net Value ($) Assets Supranational Bonds 2,000,000 European Bank for Reconstruction & Development 1.63%, due 04/10/2018 5,000,000 International Finance Corp. 0.50%, due 05/16/2016 Principal Amount ($) Principal Amount ($) 95.5% 183,951,544 Short-Term Securities Percent of Net Assets 51,455,599 Market Value ($) Community Development Loans α 2,500,000 MicroVest Plus, LP Note 2.25%, matures 10/15/2015 1.3% 2,382,055 Time Deposits 5,280,390 BBH Cash Management Service JPM Chase, Nassau 0.03%, due 01/02/2015 2.7% 5,280,390 4.0% 7,662,445 Total short-term securities (cost $7,662,445) 3,023,673 Total securities (cost $189,583,100) 3,024,609 Other assets and liabilities - net 6,051,564 Total net assets 4,003,752 α Market value adjustments have been applied to these securities to reflect potential early withdrawal. TIPS Treasury Inflation Protected Security The accompanying notes are an integral part of these financial statements. 99.5% 191,613,989 0.5% 999,867 100.0% 192,613,856 47 .
PARNASSUS FUNDS Annual Report • 2014 STATEMENT OF ASSETS AND LIABILITIES December 31, 2014 Parnassus Fund Parnassus Core Equity Fund 667,262,998 $ 10,590,780,984 $ 680,637,675 - 387,104,630 - 21,210,563 321 660,937,681 14,144 125,861,184 2,337 $ 501,055 421,467 57,043 689,453,447 10,531,536 23,953,824 259,891 $ 11,673,582,690 362,384 2,408,762 37,987 $ 809,310,329 $ $ 9,018,468 693,555 402,219 209,102 10,323,344 679,130,103 73,344,197 10,614,628 6,267,248 382,540 $ 90,608,613 $ 11,582,974,077 38,086,610 366,426 470,510 54,960 $ 38,978,506 $ 770,331,823 $ 532,789 129,554,763 14,329,873 534,712,678 679,130,103 726,559 3,026,023,453 264,918,411 8,291,305,654 $ 11,582,974,077 1,165,768 146,677,733 831,236 621,657,086 $ 770,331,823 679,130,103 - $ $ 8,558,904,590 3,024,069,487 $ 770,331,823 - 210,334,786 74,205,242 25,721,643 - Parnassus Endeavor Fund Assets Investments in stocks and bonds, at market value-Unaffliliated (cost $537,708,235, $7,674,253,812, $533,959,942, $221,315,613, $458,800,978, $6,716,855, $181,920,655) Investments in stocks, at market value-Affliliated (cost of $0, $277,608,349, $0, $0, $30,949,732 $0, $0) Investments in short-term securities (at cost which approximates market value) Cash Receivables Investment securities sold Dividends and interest Capital shares sold Due from Parnassus Investments Other assets Total assets $ Liabilities Payable upon return of loaned securities Capital shares redeemed Fees payable to Parnassus Investments Accounts payable and accrued expenses Total liabilities Net assets Net assets consist of Undistributed net investment income (loss) Unrealized appreciation on securities and foreign currency Accumulated net realized gain (loss) on securities and foreign currency Capital paid-in Total net assets Net asset value and offering per share Net assets investor shares Net assets institutional shares $ Shares outstanding investor shares Shares outstanding institutional shares Net asset values and redemption price per share (Net asset value divided by shares outstanding) Investor shares Institutional shares 48 14,120,780 - $ 48.09 - $ $ The accompanying notes are an integral part of these financial statements. 40.69 40.75 $ 29.95 - . Annual Report • 2014 Parnassus Mid Cap Fund $ 288,673,507 Parnassus Small Cap Fund $ 522,947,125 Parnassus Asia Fund $ 7,083,792 PARNASSUS FUNDS Parnassus Fixed Income Fund $ 183,951,544 - 35,769,695 - - 24,640,829 415 72,340,371 34 340,741 19 7,662,445 137 $ 396,746 702,561 27,370 314,441,428 $ 313,818 161,865 44,227 631,577,135 $ 6,126 40,500 1,409 13,382 7,485,969 $ 1,062,194 236,730 13,753 192,926,803 $ $ 8,705,955 184,375 216,683 37,576 9,144,589 305,296,839 $ $ 68,702,942 1,720,060 524,132 168,496 71,115,630 560,461,505 $ $ 1,409 27,083 28,492 7,457,477 $ $ 156,940 84,396 71,611 312,947 192,613,856 $ 86 67,357,894 6,343,317 231,595,542 305,296,839 $ 68,966,110 (12,315,835) 503,811,230 560,461,505 $ (7,190) 366,973 (25,408) 7,123,102 7,457,477 $ 185,102 2,030,890 131,390 190,266,474 192,613,856 $ 305,296,839 - $ 11,141,329 - $ 27.40 - 560,461,505 - $ 23,578,050 - $ 23.77 - 7,457,477 - $ 446,128 - $ 16.72 - 192,613,856 11,562,799 - $ 16.66 - The accompanying notes are an integral part of these financial statements. 49 . PARNASSUS FUNDS Annual Report • 2014 STATEMENT OF OPERATIONS December 31, 2014 Parnassus Core Equity Fund Parnassus Fund Parnassus Endeavor Fund Investment income Dividends – Unaffiliated $ Dividends – Affiliated 8,036,105 $ 176,963,673 - Interest $ 8,944,254 10,135,412 - 14,901 Foreign witholding tax 18,138 1,282,583 43,429 8,812 Other income 398,969 171,764 Securities lending 13,563 4,400 (265,205) Total investment income $ 7,966,377 (3,290,570) $ 185,503,630 (219,086) $ 8,791,135 Expenses Investment advisory fees 3,857,332 57,380,379 4,312,786 339,896 1,226,108 151,446 - 298,848 - Fund administration 206,808 3,215,994 189,103 Service provider fees Transfer agent fees Investor shares Institutional shares 444,530 14,080,256 858,407 Reports to shareholders 94,952 864,779 69,177 Registration fees and expenses 33,915 204,405 33,580 Custody fees 49,489 317,362 31,960 Professional fees 41,994 206,923 33,737 Trustee fees and expenses 32,565 460,005 29,229 4,884 4,884 4,884 Proxy voting fees Pricing service fees 3,493 Total expenses $ 6,092 3,493 12,689 Other expenses 164,505 10,630 5,122,547 $ 78,430,540 Fees waived by Parnassus Investments - - Fees reimbursed by Parnassus Investments - $ - Net expenses 5,728,432 (419,980) - $ Net investment income (loss) 5,122,547 $ 78,430,540 $ 5,308,452 $ 2,843,830 $ 107,073,090 $ 3,482,683 Realized and unrealized gain (loss) on investments and foreign currency related transactions Net realized gain from securities transactions 69,326,086 440,188,076 43,998,833 - - - Net change in unrealized appreciation (depreciation) of securities 13,105,357 791,244,299 52,897,765 Net change in unrealized depreciation on foreign currency related transactions - - - Net realized loss from foreign currency related transactions Net realized and unrealized gain (loss) on securities and foreign currency related transactions $ 82,431,443 $ 1,231,432,375 $ 96,896,598 Net increase (decrease) in net assets resulting from operations $ 85,275,273 $ 1,338,505,465 $ 100,379,281 50 The accompanying notes are an integral part of these financial statements. . Annual Report • 2014 Parnassus Mid Cap Fund $ 4,999,885 Parnassus Small Cap Fund $ - 7,369,923 Parnassus Asia Fund $ 139,447 Parnassus Fixed Income Fund $ - - - - 3,124 1,588 152 4,606,866 19,098 92,152 - - 3,673 5,566 - 3,734 (45,987) $ 4,979,793 $ 7,469,229 (12,058) $ 127,541 $ 4,610,600 2,080,626 5,696,943 59,382 915,515 79,231 584,047 6,563 103,034 - - - - 87,076 222,230 1,823 61,961 432,729 960,113 2,505 227,322 39,350 152,440 1,694 35,890 32,813 50,916 38,861 28,733 13,587 46,457 11,898 8,190 19,874 68,189 42,286 19,922 14,198 47,894 672 9,339 4,884 4,884 10,419 - 3,493 3,493 13,564 4,349 5,038 $ PARNASSUS FUNDS 19,264 1,216 5,525 2,812,899 $ 7,856,870 $ 190,883 - - (59,382) - - $ (63,887) $ 2,812,899 $ $ 2,166,894 $ 7,856,870 (387,641) 7,536,082 $ 1,244,554 $ 59,927 $ 3,366,046 3,869 2,584,546 (27,248) (95,484,823) - - 67,614 - 18,808,437 (175,226) $ 95,466,713 - 1,419,780 - 427,819 - 1,929,191 (198,332) - $ 26,344,519 $ (18,110) $ 206,108 $ 4,513,737 $ 28,511,413 $ (405,751) $ 266,035 $ 7,879,783 The accompanying notes are an integral part of these financial statements. 51 . PARNASSUS FUNDS Annual Report • 2014 STATEMENT OF CHANGES IN NET ASSETS December 31, 2014 Parnassus Fund Year Ended December 31, 2014 Parnassus Core Equity Fund Year Ended Year Ended December 31, 2013 December 31, 2014 Year Ended December 31, 2013 Investment income from operations Net investment income (loss) $ Net realized gain from securities transactions Net realized gain (loss) on foreign currency related transactions Net change in unrealized appreciation (depreciation) of securities Net change in unrealized appreciation (depreciation) on foreign currency related transactions Increase (decrease) in net assets resulting from operations $ 2,843,830 69,326,086 - $ 13,105,357 85,275,273 2,786,793 86,277,993 - $ 60,377,042 $ 149,441,828 107,073,090 $ 440,188,076 791,244,299 84,874,686 423,456,156 1,369,149,479 $ 1,338,505,465 $ 1,877,480,321 Distributions From net investment income Investor shares Institutional shares From realized capital gains Investor shares Institutional shares From return of capital Investor shares Institutional shares Distributions to shareholders (22,221,590) - (114,823,029) (44,425,216) (75,672,898) (23,806,178) (36,499,383) - $ (23,310,790) (68,392,436) - (135,488,933) (48,522,737) (298,967,759) (85,271,546) (58,720,973) $ (91,703,226) $ (343,259,915) $ (483,718,381) Capital share transactions Investor shares Proceeds from sale of shares 123,143,996 127,652,026 2,558,040,385 1,753,249,729 Reinvestment of dividends 57,373,782 88,480,097 247,009,882 359,378,243 Shares repurchased (100,242,807) (171,705,411) (1,267,574,843) (951,505,148) Institutional shares Proceeds from sale of shares 1,247,685,257 723,167,847 Reinvestment of dividends 59,991,933 78,288,791 Shares repurchased (348,712,605) (295,341,991) Increase (decrease) in net assets from capital share transactions 80,274,971 44,426,712 2,496,440,009 1,667,237,471 Increase (decrease) in net assets $ 106,829,271 $ 102,165,314 $ 3,491,685,559 $ 3,060,999,411 Net Assets Beginning of year End of year Undistributed net investment income $ $ 572,300,832 679,130,103 532,789 $ $ 470,135,518 572,300,832 1,049,129 8,091,288,518 5,030,289,107 $11,582,974,077 $ 8,091,288,518 $ 726,559 $ 120,773 Shares issued and redeemed Investor shares Shares sold Shares issued through dividend reinvestment Shares repurchased Institutional shares Shares sold Shares issued through dividend reinvestment Shares repurchased Net increase (decrease) in shares outstanding Investor shares Institutional shares 52 2,567,800 1,179,490 (2,105,263) 2,810,597 1,937,939 (3,842,660) - - 1,642,027 - 905,876 - The accompanying notes are an integral part of these financial statements. 66,022,421 6,151,570 (33,128,690) 51,448,911 10,055,536 (27,983,088) 32,466,571 1,492,438 (9,000,677) 21,335,971 2,186,576 (8,690,922) 39,045,301 24,958,332 33,521,359 14,831,625 . Annual Report • 2014 Parnassus Endeavor Fund Year Ended December 31, 2014 $ 3,482,683 43,998,833 - $ 52,897,765 $ 100,379,281 Parnassus Mid Cap Fund Year Ended December 31, 2013 1,997,022 30,555,638 - Year Ended December 31, 2014 $ 68,276,432 $ 100,829,092 2,166,894 7,536,082 18,808,437 $ 28,511,413 Parnassus Small Cap Fund Year Ended December 31, 2013 $ 1,063,431 8,838,248 - Year Ended December 31, 2014 $ 37,143,232 $ PARNASSUS FUNDS 47,044,911 (387,641) 95,466,713 - Year Ended December 31, 2013 $ (95,484,823) (405,751) $ (1,052,243) 51,506,771 129,860,100 $ 180,314,628 (12,941,659) - (8,653,869) - (2,180,581) - (2,476,509) - (33,257) - (10,911,928) - (33,400,849) - (25,084,295) - (3,439,920) - (5,652,614) - (109,999,534) - (33,887,690) - $ (46,342,508) (33,738,164) (5,620,501) (8,129,123) (110,032,791) (44,799,618) $ 298,267,377 43,892,018 (101,804,232) $ $ $ 197,654,856 31,293,717 (101,128,527) 91,026,928 5,308,798 (55,092,184) 115,826,819 7,704,932 (50,249,048) 101,904,980 102,352,230 (309,012,380) 177,400,113 40,602,696 (257,842,979) $ 41,243,542 64,134,454 $ 73,282,703 112,198,491 $ (104,755,170) (215,193,712) $ (39,840,170) 95,674,840 $ $ 241,162,385 305,296,839 86 $ $ 128,963,894 241,162,385 7,209 $ $ 775,655,217 560,461,505 - $ $ 679,980,377 775,655,217 32,998 240,355,163 $ 294,391,936 $ 127,820,046 194,910,974 475,939,887 $ 770,331,823 $ 1,165,768 $ $ 281,028,913 475,939,887 14,510 10,193,157 1,462,440 (3,567,129) $ 7,784,676 1,174,236 (4,002,130) 3,488,133 192,747 (2,148,487) 5,093,991 311,933 (2,158,589) - - - - 8,088,468 - 4,956,782 - 1,532,393 - 3,737,605 4,280,727 (11,443,410) 3,247,335 - The accompanying notes are an integral part of these financial statements. (3,425,078) - 6,802,548 1,452,585 (9,858,364) (1,603,231) - 53 . PARNASSUS FUNDS Annual Report • 2014 STATEMENT OF CHANGES IN NET ASSETS December 31, 2014 (continued) Parnassus Asia Fund Year Ended December 31, 2014 Parnassus Fixed Income Fund For Period April 30, 2013 (inception date) through December 31, 2013 Year Ended December 31, 2014 Year Ended December 31, 2013 Investment income from operations Net investment income (loss) $ Net realized gain from securities transactions Net realized gain (loss) on foreign currency related transactions Net change in unrealized appreciation (depreciation) of securities Net change in unrealized depreciation on foreign currency related transactions Increase (decrease) in net assets resulting from operations $ 59,927 3,869 (27,248) $ 427,819 (198,332) 266,035 (12,919) 9,274 819 $ 193,089 $ (55,603) 134,660 3,366,046 2,584,546 - $ 1,929,191 $ 7,879,783 3,397,927 2,750,811 (11,858,353) $ (5,709,615) Distributions From net investment income Investor shares Institutional shares From realized capital gains Investor shares Institutional shares From return of capital Investor shares Institutional shares Distributions to shareholders (77,599) - - $ (77,599) $ (3,426,303) - - - (4,034,311) (1,559,479) - (3,235,241) - - (5,593,790) $ (682,090) (7,343,634) $ Capital share transactions Investor shares Proceeds from sale of shares Reinvestment of dividends Shares repurchased Institutional shares Proceeds from sale of shares Reinvestment of dividends Shares repurchased Increase (decrease) in net assets from capital share transactions Increase (decrease) in net assets $ 4,216,902 77,363 (401,104) 3,276,113 (34,893) 48,839,061 5,064,364 (39,365,324) 36,741,372 6,579,766 (80,201,405) 3,893,161 4,081,597 $ 3,241,220 3,375,880 $ 14,538,101 16,824,094 $ (36,880,267) (49,933,516) 3,375,880 7,457,477 (7,190) $ $ 3,375,880 - $ $ 175,789,762 192,613,856 185,102 $ $ 225,723,280 175,789,762 - Net Assets Beginning of period End of year Undistributed net investment income (loss) $ $ Shares issued and redeemed Investor shares Shares sold Shares issued through dividend reinvestment Shares repurchased Institutional shares Shares sold Shares issued through dividend reinvestment Shares repurchased Net increase (decrease) in shares outstanding Investor shares Institutional shares 54 249,746 4,621 (23,728) 217,799 (2,310) 2,911,578 303,000 (2,354,313) - - - 230,639 - 215,489 - 860,265 - The accompanying notes are an integral part of these financial statements. 2,133,356 391,178 (4,674,156) (2,149,622) - . Annual Report • 2014 PARNASSUS FUNDS Notes to Financial Statements 1. Organization The Parnassus Funds are comprised of two Trusts, the Parnassus Funds trust and the Parnassus Income Funds trust (collectively the “Trusts”), organized as Massachusetts Business Trusts registered under the Investment Company Act of 1940 as diversified, open-end investment management companies, and are comprised of seven separate funds (collectively the “Funds”). The Parnassus Funds trust includes the Parnassus Fund, which commenced operations on December 27, 1984, the Parnassus Endeavor Fund, the Parnassus Mid Cap Fund and the Parnassus Small Cap Fund, which commenced operations on April 29, 2005, and the Parnassus Asia Fund, which commenced operations on April 30, 2013. The Parnassus Income Funds trust includes the Parnassus Core Equity Fund and the Parnassus Fixed Income Fund, both of which commenced operations on August 31, 1992.
Each Fund has distinct investment objectives. In general, each of the Funds seeks long-term capital appreciation. Prior to May 1, 2014, the Parnassus Core Equity Fund was known as the Parnassus Equity Income Fund, and the Parnassus Endeavor Fund was known as the Parnassus Workplace Fund. 2.
Significant Accounting Policies Short-Term Securities Short-term securities represent investments of excess cash and consist of time deposits, community development loans, certificates of deposit and money market funds. Security Transactions and Related Investment Income and Expenses Securities transactions are recorded on the date the securities are purchased or sold (trade date). Realized gains and losses on securities transactions are determined on the basis of first-in, first-out for both financial statement and federal income tax purposes. Dividend income is recognized on the ex-dividend date and interest income is recognized on an accrual basis. Discounts and premiums on securities purchased are amortized over the lives of the respective securities using the constant yield method, which approximates the interest method.
Expenses are recorded on an accrual basis. Class Allocations Income, fees and expenses (other than class-specific fees and expenses) and realized and unrealized gains and losses are allocated daily among the various shares classes based on their relative net assets. Class-specific fees and expenses, such as distribution, administrative and shareholder services, are charged directly to the respective share class. Dividends and Distributions to Shareholders Dividends and distributions to shareholders are recorded on the ex-dividend date to shareholders of record on the record date. The Parnassus Core Equity Fund pays income dividends quarterly and capital-gain dividends annually.
The Parnassus Fixed Income Fund pays income dividends monthly and capital-gain dividends annually. The other Funds pay income and capital-gain dividends annually. Currency Translation Assets and liabilities, including investment securities, denominated in currencies other than U.S. dollars are translated into U.S.
dollars at the exchange rates supplied by the Funds’ pricing vendor on the valuation date. Purchases and sales of investment securities and income and expenses are translated into U.S. dollars at the exchange rates on the dates of such transactions.
On the accompanying financial statements, the effects of changes in exchange rates on investment securities are included with the net realized gain or loss and net unrealized appreciation or depreciation on investments. The realized gain or loss and unrealized appreciation or depreciation resulting from all other transactions denominated in currencies other than U.S. dollars are disclosed separately. 3.
Securities Valuations Methods and Inputs Equity securities that are listed or traded on a national securities exchange are stated at market value, based on recorded closing sales on the exchange or on the NASDAQ’s National Market official closing price. In the absence of a recorded sale, 55 . PARNASSUS FUNDS Annual Report • 2014 Notes to Financial Statements (continued) and for over-the-counter securities, equity securities are stated at the mean between the last recorded bid and asked prices. Long-term, fixed-income securities are valued each business day using prices based on procedures established by independent pricing services and approved by the Board of Trustees (the “Trustees”). Fixed-income securities with an active market are valued at the “bid” price where such quotes are readily available from brokers and dealers and are representative of the actual market for such securities. Other fixed-income securities experiencing a less active market are valued as determined by the pricing services based on methods which include consideration of trading in securities of comparable yield, quality, coupon, maturity and type, as well as indications as to values from dealers and other market data without exclusive reliance upon quoted prices or over-the-counter prices, since such valuations are believed to reflect more accurately the value of such securities. Investments in registered investment companies are valued at their net asset value. Investments where market quotations are not readily available are priced at their fair value, in accordance with procedures established by the Trustees.
These investments include certificates of deposit and community development loans. These investments carry interest rates ranging from 0.10% to 2.25% with maturities of one year or less. In determining fair value, the Trustees may consider a variety of information including, but not limited to, the following: price based upon a multiple of earnings or sales, fundamental analytical data and an evaluation of market conditions.
A valuation adjustment is applied to certificates of deposit, community development loans and other community development investments as an estimate of potential penalties for early withdrawal. The Funds follow Accounting Standards Codification (“ASC”) 820, Fair Value Measurements and Disclosure, which defines fair value, establishes a framework for measuring fair value and expands disclosures about fair value measurements. Various inputs are used in determining the value of the Funds’ portfolio investments. These inputs are summarized in three levels, Level 1 – unadjusted quoted prices in active markets for identical investments, Level 2 – other significant observable inputs (including quoted prices for similar investments) and Level 3 – significant unobservable inputs (including the Fund’s own assumptions in determining the fair value of investments). Securities Lending The Parnassus Funds, with the exception of the Parnassus Asia Fund, have entered into an agreement with Brown Brothers Harriman & Co., dated July 29, 2009 (“Agreement”), to provide securities lending services to the Funds.
Under this program, the proceeds (cash collateral) received from borrowers are used to invest in money market funds. Under the Agreement, the borrowers pay the Funds negotiated lenders’ fees and the Funds receive cash collateral in an amount equal to 102% of the market value of loaned securities. The borrower of securities is at all times required to post cash collateral to the portfolio in an amount equal to 100% of the market value of the securities loaned based on the previous day’s market value of the securities loaned, marked-to-market daily. Any collateral shortfalls are adjusted the next business day.
If the borrower defaults on its obligations to return the securities loaned because of insolvency or other reasons, the portfolio could experience delays and costs in recovering the securities loaned. The Funds retained beneficial ownership and all economic benefits in the securities they have loaned and continues to receive interest paid by the securities and payments equivalent to dividends, and to participate in any changes in their market value, but does not have the proxy voting rights with respect to loaned securities. Each portfolio manager of the Funds has the responsibility to request that the securities lending agent call back securities which are out on loan to vote on material matters and it is the Funds’ policy that the portfolio managers vote on all material matters.
However, the ability to timely recall shares for proxy voting purposes typically is not entirely within the control of the portfolio manager, the Funds or their securities lending agent. Under certain circumstances, the recall of shares in time for such shares to be voted may not be possible due to applicable proxy voting record dates and administrative considerations. Income generated from securities lending is presented in the Statement of Operations. Cash collateral received by the Funds is reflected as an asset (securities purchased with cash collateral from securities lending) and the related liability (payable upon return of securities loaned) is presented in the Statement of Assets and Liabilities. 56 .
Annual Report • 2014 PARNASSUS FUNDS Notes to Financial Statements (continued) Community Development Investment Programs The Parnassus Funds may each invest up to 2% of their assets in community investments and community-development loan funds. Each of the Funds may invest in obligations issued by community loan funds at below-market interest rates if the projects financed have a positive social impact. Generally, there is no secondary market on loan funds and thus these are considered illiquid. As part of our community development investment program, the Parnassus Core Equity Fund has entered into an agreement for fund investments through the Certificate of Deposit Account Registry Service (“CDARS”) network. The CDARS network allows members to place funds in time deposits with depository institutions whose accounts are insured by the Federal Deposit Insurance Corporation (“FDIC”).
Provisions stipulate that participating institutions are FDIC insured, however, in the event of default or bankruptcy by any party to the agreement, the proceeds of the investment may be delayed or subject to legal proceedings and are subject to FDIC limits. While certain investments of the Funds may be bank deposits and may be covered by FDIC insurance, the Funds are themselves not covered by FDIC insurance. The Parnassus Core Equity Fund and the Parnassus Fixed Income Fund hold debt instruments issued by MicroVest Plus, LP, a microfinance limited partnership specializing in providing capital to international microfinance institutions (“MFI’s”) that extend credit to developing countries and the entrepreneurial poor. This instrument may be subject to political and foreign currency exchange risk not normally associated with domestic debt instruments.
MicroVest Plus, LP’s investment in MFI’s can be affected by, among other factors, commodity prices, inflation, interest rates, taxation, social instability, and other political, economic or diplomatic developments in or affecting the various countries where MFI’s operate. Use of Estimates The preparation of financial statements in conformity with GAAP requires management to make estimates and assumptions that affect the reported amounts of assets and liabilities at the date of the financial statements and the reported amount of revenues and expenses during the reporting period. Actual results could differ from those estimates. Subsequent Events Management has evaluated the impact of all subsequent events on the Funds through the date the financial statements were issued and has determined that there were no subsequent events requiring adjustment to or additional disclosure in the financial statements. 4. Risk Factors Investing in the Parnassus Funds may involve certain risks including, but not limited to the following: Market Conditions The prices of, and the income generated by, the common stocks and other securities held by the Funds may decline in response to certain events taking place around the world, including those directly involving the companies whose securities are owned by the Funds; conditions affecting the general economy; overall market changes; local, regional or global political, social or economic instability; and currency, interest rate and commodity price fluctuations.
Additionally, the values of, and the income generated by, most debt securities held by the Fund may be affected by changing interest rates and by changes in the effective maturities and credit ratings of these debt securities. The Funds’ investment adviser attempts to reduce these risks through diversification of the portfolio and ongoing credit analysis as well as by monitoring economic and legislative developments, but there can be no assurance that it will be successful at doing so. Investments in securities issued by entities based outside the U.S.
may also be affected by currency controls; different accounting, auditing, financial reporting, and legal standards and practices; expropriation; changes in tax policy; greater market volatility; different securities market structures and higher transaction costs. Investing Outside the U.S. Securities of issuers domiciled outside the U.S., or with significant operations outside the U.S., may lose value because of political, social, economic or market developments or instability in the countries or regions in which the issuer operates. These securities may also lose value due to changes in foreign currency exchange rates against the U.S. dollar and/or currencies 57 . PARNASSUS FUNDS Annual Report • 2014 Notes to Financial Statements (continued) of other countries. Securities markets in certain countries may be more volatile and/or less liquid than those in the U.S. Investment outside the U.S. may also be subject to different settlement and accounting practices and different regulatory, legal and reporting standards, and may be more difficult to value, than those in the U.S. The risks of investing outside the U.S.
may be heightened in connection with investments in emerging and developing countries. Contractual Obligations Under the Trusts’ organizational documents, its officers and Trustees may be indemnified against certain liabilities and expenses arising out of the performance of their duties to the Trusts. Additionally, the Trusts have a variety of indemnification obligations under contracts with its service providers. The Trusts’ maximum exposure under these arrangements is unknown, as this would involve future claims that may be made against the Trusts that have not yet occurred. 5.
Taxation and Distributions Federal Income Taxes The Trusts intend to comply with the requirements of the Internal Revenue Code applicable to regulated investment companies and to distribute all taxable income to shareholders. Therefore, no federal income tax provision is required. Income distributions and capital-gain distributions are determined in accordance with income tax regulations, which may differ from U.S. Generally Accepted Accounting Principles (“GAAP”). The Funds follow ASC 740, Income Taxes, relating to uncertainty in income taxes and disclosures.
ASC 740 establishes a minimum threshold for income tax benefits to be recognized in the financial statements. These tax benefits must meet a “more likely than not” threshold, which means that based on technical merits, they have a more than 50% likelihood of being sustained upon examination by the tax authority. Tax benefits meeting this threshold are measured as the largest amount of tax benefit that is greater than 50% likely of being realized upon ultimate settlement with the tax authority.
As of and during the year ended December 31, 2014, the Funds did not have a liability for any unrecognized tax benefits. The Funds recognize interest and penalties, if any, related to unrecognized tax benefits as income tax expense in the Statement of Operations. During the year, the Funds did not incur interest or penalties.
The Funds are not subject to examination by U.S. federal taxing authorities before 2010 or state taxing authorities before 2009. Tax Matters and Distributions At December 31, 2014, the cost of investments in long-term securities and net unrealized appreciation/depreciation for income tax purposes were as follows: Parnassus Fund Distributions paid from: Ordinary Income 2014 $22,221,590 Long-term capital gains 2013 $23,310,790 36,499,383 68,392,436 184,011,670 $91,703,226 $343,259,915 Parnassus Mid Cap Fund Ordinary Income Long-term capital gains Return of capital Total distributions 58 2014 $159,248,245 $58,720,973 Total distributions Distributions paid from: Parnassus Core Equity Fund Parnassus Small Cap Fund 2014 2013 2014 $2,180,581 $2,476,509 3,439,920 5,652,614 $ 2013 $ 99,479,076 2014 $12,941,659 384,239,305 33,400,849 25,084,295 $483,718,381 $46,342,508 $33,738,164 Parnassus Asia Fund 2013 2014 33,257 $10,911,928 109,999,534 Parnassus Endeavor Fund 33,887,690 - - - - $5,620,501 $8,129,123 $110,032,791 $44,799,618 Parnassus Fixed Income Fund 2013 $77,599 $ 2013 $ 8,653,869 2014 2013 - $4,034,311 $3,426,303 - - 1,559,479 3,235,241 - - - 682,090 - $5,593,790 $7,343,634 $77,599 $ . Annual Report • 2014 PARNASSUS FUNDS Notes to Financial Statements (continued) Parnassus Fund Parnassus Core Equity Fund Parnassus Endeavor Fund Parnassus Mid Cap Fund Parnassus Small Cap Fund Parnassus Parnassus Asia Fixed Income Fund Fund Cost of investment $538,446,233 $7,951,941,765 $533,959,942 $221,458,572 $489,750,710 $6,720,068 $181,920,655 Unrealized appreciation $138,812,452 $3,073,195,838 $152,378,797 $ 70,178,604 $ 94,678,250 $ 695,231 $ Unrealized depreciation 9,995,687 47,251,989 5,701,064 2,963,669 25,712,140 331,471 2,931,412 900,522 Net unrealized appreciation $128,816,765 $3,025,943,849 $146,677,733 $ 67,214,935 $ 68,966,110 $ 363,760 $ 2,030,890 Distributable earnings – ordinary income $ 21,705,250 $ 159,854,031 $ 14,092,917 $ 2,173,460 $ - $ 69,146 $ 4,219,413 Distributable earnings – long-term capital gains $ 50,619,926 $ 387,407,135 $ 32,720,080 $ 7,976,324 $106,421,715 $ - $ 1,690,869 Undistributed earnings – ordinary income $ 726,559 $ 1,165,768 $ 86 $ - $ - $ 185,102 Undistributed earnings – long-term capital gains $ 15,067,871 $ 264,998,015 $ 831,236 $ 6,934,147 $ 3,172,135 $ - $ 131,390 532,789 $ At December 31, 2014, there were no estimated net capital loss carry forwards for the Parnassus Funds and no Post-October capital losses. Net investment income and net ordinary income are the same for all Funds for financial statement and income tax purposes during the year ended December 31, 2014. Net realized gains differ for financial statement and income tax purposes primarily due to differing treatments of wash sales. Reclassifications as shown in the following table have been made in each Fund’s capital accounts to report these balances on a tax basis, excluding certain temporary differences, as of December 31, 2014. Additional adjustments may be required in subsequent reporting periods. These reclassifications, which have no impact on the net asset value of the Funds, are primarily attributable to the reclassification of dividend income and certain differences in the computation of distributable income and capital gains under Federal tax rules versus GAAP. Fund Parnassus Fund Increase in Undistributed Net Investment Income Decrease in Undistributed Net Realized Gain/Loss Increase/Decrease in Capital Paid-In $18,861,420 $(18,861,420) Parnassus Core Equity Fund 52,780,941 (52,780,941) Parnassus Endeavor Fund 10,610,234 (10,610,234) - 6,564 (6,566) 2 Parnassus Mid Cap Fund Parnassus Small Cap Fund Parnassus Asia Fund Parnassus Fixed Income Fund $ - 387,900 (259) (387,641) 10,482 (2,029) (8,453) 853,367 (853,367) - 59 .
PARNASSUS FUNDS Annual Report • 2014 Notes to Financial Statements (continued) 6. Fair Value Measurements The following table summarizes the portfolios’ financial assets as of December 31, 2014, that is valued at fair value on a recurring basis: Parnassus Fund Investment Securities Level 1 Level 2 Level 3 Total Equities: Consumer Discretionary $ 83,914,900 $ - $ - $ 83,914,900 Consumer Staples 54,942,750 - - 54,942,750 Financials 82,107,798 - - 82,107,798 Healthcare 71,304,450 - - 71,304,450 Industrials 73,726,250 - - 73,726,250 Information Technology 278,860,600 - - 278,860,600 22,406,250 - - 22,406,250 Materials Short-Term Investments Total 19,140,914 $ 686,403,912 $ - 2,069,649 $ 2,069,649 21,210,563 $ 688,473,561 Parnassus Core Equity Fund Investment Securities Level 1 Level 2 Level 3 Total Equities: Consumer Discretionary $ Consumer Staples 507,101,310 $ - $ - $ 507,101,310 1,842,863,194 - - 1,842,863,194 Energy 709,762,500 - - 709,762,500 Financials 617,948,735 - - 617,948,735 Healthcare 1,786,050,930 - - 1,786,050,930 Industrials 1,658,333,285 - - 1,658,333,285 Information Technology 2,745,767,200 - - 2,745,767,200 Materials 440,613,030 - - 440,613,030 Utilities 669,445,430 - - 669,445,430 649,301,046 - 11,636,635 660,937,681 Short-Term Investments Total $ 11,627,186,660 $ - $ 11,636,635 $ 11,638,823,295 Parnassus Endeavor Fund Investment Securities Level 1 Level 2 Level 3 Total Equities: Consumer Discretionary $ 51,028,250 $ - $ - $ 51,028,250 Consumer Staples 74,342,175 - - 74,342,175 Financials 68,315,550 - - 68,315,550 Healthcare 86,994,400 - - 86,994,400 Industrials 74,620,450 Total 60 $ - 74,620,450 - - 325,336,850 125,861,184 Short-Term Investments - 325,336,850 Information Technology - - 125,861,184 806,498,859 $ - $ - $ 806,498,859 . PARNASSUS FUNDS Annual Report • 2014 Notes to Financial Statements (continued) Parnassus Mid Cap Fund Investment Securities Level 1 Level 2 Level 3 Total Equities: Consumer Discretionary $ 14,759,362 $ - $ - $ 14,759,362 Consumer Staples 17,692,757 - - 17,692,757 Energy 17,557,545 - - 17,557,545 Financials 38,948,252 - - 38,948,252 Healthcare 40,633,122 - - 40,633,122 Industrials 75,664,783 - - 75,664,783 Information Technology 48,280,948 - - 48,280,948 Materials 8,359,850 - - 8,359,850 Utilities 26,776,888 - - 26,776,888 24,640,829 - - 24,640,829 Short-Term Investments Total $ 313,314,336 $ - $ - $ 313,314,336 Parnassus Small Cap Fund Investment Securities Level 1 Level 2 Level 3 Total Equities: Consumer Discretionary $ 91,193,750 $ - $ - $ 91,193,750 Energy 36,115,000 - - 36,115,000 Financials 90,343,100 - - 90,343,100 Healthcare 42,788,750 - - 42,788,750 Industrials 138,127,310 - - 138,127,310 Information Technology 68,494,495 - - 68,494,495 Materials 54,869,015 - - 54,869,015 Utilities 36,785,400 - - 36,785,400 72,340,371 - - 72,340,371 Short-Term Investments Total $ 631,057,191 $ - $ - $ 631,057,191 61 . PARNASSUS FUNDS Annual Report • 2014 Notes to Financial Statements (continued) Parnassus Asia Fund Investment Securities China Level 1 $ 900,992 Level 2 $ - Level 3 $ - Total $ 900,992 Hong Kong 343,191 776,286 - 1,119,477 Indonesia 238,841 333,021 - 571,862 Japan 228,000 1,115,258 - 1,343,258 Philippines - 152,656 - 152,656 Singapore - 516,201 - 516,201 South Korea - 290,561 - 290,561 581,995 1,087,801 - 1,669,796 - 518,989 - 518,989 340,741 - - 340,741 Taiwan Thailand Short-Term Investments Total $ 2,633,760 $ 4,790,773 $ - $ 7,424,533 Parnassus Fixed Income Fund Investment Securities Commercial MortgageBacked Securities Level 1 $ - Level 2 $ 6,787,960 Level 3 $ - Total $ 6,787,960 Convertible Bonds - 306,969 - 306,969 Corporate Bonds - 84,583,375 - 84,583,375 Federal Agency MortgageBacked Securities - 33,814,932 - 33,814,932 Supranational Bonds - 7,002,709 - 7,002,709 U.S. Government Treasury Bonds - 51,455,599 - 51,455,599 Short-Term Investments Total 5,280,390 $ 5,280,390 $ 183,951,544 2,382,055 $ 2,382,055 7,662,445 $ 191,613,989 The following table reconciles the valuation of the Funds’ Level 3 investment securities and related transactions as of December 31, 2014: Parnassus Core Equity Fund Parnassus Fund Parnassus Fixed Income Fund Certificates of Deposit Certificates of Deposit Balance as of December 31, 2013 Community Development Loans $ 1,384,404 Discounts/premiums amortization Purchases 62 Community Development Loans $ 2,382,055 (14,755) 2,100,000 $ 98,929 11,850,000 2,500,000 (1,400,000) Sales Balance as of December 31, 2014 Community Development Loans $ 10,137,706 (10,450,000) (2,500,000) 2,069,649 $ 11,636,635 $ 2,382,055 . Annual Report • 2014 PARNASSUS FUNDS Notes to Financial Statements (continued) There were no significant transfers between Level 1, Level 2 and Level 3. Quantitative information about Level 3 fair value measurement: Fair Value at December 31, 2014 Valuation Technique Unobservable Input Range (Weighted Average) Parnassus Fund Certificates of Deposit 491,076 4% Liquidity Discount Discount for Lack of Marketability 6% 6% Liquidity Discount Discount for Lack of Marketability 4% Liquidity Discount Discount for Lack of Marketability 6% 6% Discount for Lack of Marketability 6% Probability of Default $ Discount for Lack of Marketability Probability of Default Community Development Loans 1,578,573 Liquidity Discount Probability of Default $ 6% Parnassus Core Equity Fund Certificates of Deposit $ Community Development Loans $ 2,705,225 8,931,410 Parnassus Fixed Income Fund Community Development Loans $ 2,382,055 Liquidity Discount The significant unobservable inputs used in fair value measurement of the Fund’s Certificates of Deposits are a discount for lack of marketability. The significant unobservable inputs used in the fair value measurement of the Fund’s Community Development Loans are a discount for lack of marketability and a discount for the probability of default. Significant increases in any of these inputs in isolation would result in a lower fair value measurement. Generally, a change in the assumption used for probability of default should be accompanied by a directionally-similar change in the assumption used for the lack of marketability. Certain foreign securities may be fair valued by independent pricing services if events occur between the time at which the market quotations are determined on the primary exchange and the close of trading on the NYSE.
These events may affect the value of these securities and render market quotations unreliable. Such fair valuations are categorized as Level 2 investments. Foreign securities that are valued based on market quotations are categorized as Level 1 investments. In accordance with procedures established by the Funds’ Trustees, all fair value securities as submitted by the Funds’ treasurer, are reviewed and approved by the Trustees. The Funds’ valuation committee is comprised of Independent Trustees who also comprise the Funds’ audit committee.
The committee reviews the methodologies used by the Funds when securities have been identified as being fair valued and include the percentages used when determining liquidity discounts or discounts to be taken for lack of marketability. The Trustees review the changes in fair value measurement and methods used to substantiate the unobservable inputs on a quarterly basis. 7. Capital Stock Capital stock consists of an unlimited number of authorized shares of capital stock with no par value. 63 .
PARNASSUS FUNDS Annual Report • 2014 Notes to Financial Statements (continued) 8. Purchases and Sales of Securities Purchases and proceeds from sales of securities, excluding short-term securities, for the period ended December 31, 2014 were as follows: Affiliated Purchases Fund Unaffiliated Purchases Parnassus Fund $ - $ 378,656,217 Parnassus Core Equity Fund 18,589,806 Parnassus Endeavor Fund Parnassus Mid Cap Fund Parnassus Small Cap Fund Affiliated Sales $ Unaffiliated Sales - $ 360,307,449 3,314,905,807 - 1,315,324,665 - 336,705,930 - 200,016,073 - 87,441,390 - 53,777,043 20,085,862 423,956,526 9,627,529 644,992,729 Parnassus Asia Fund - 5,177,472 - 1,195,635 Parnassus Fixed Income Fund - 105,482,880 - 91,968,951 The above includes purchases and sales of U.S. Government securities in the amount of $20,382,383 and $51,133,731, respectively, within the Parnassus Fixed Income Fund. 9. Investment Advisory Agreement and Transactions with Affiliates Under terms of an agreement which provides for furnishing investment management and advice to the Funds, Parnassus Investments is entitled to receive fees payable monthly, based on each Fund’s average daily net assets for the month, at the following annual rates: Parnassus Fund: 1.00% of the first $10,000,000, 0.75% of the next $20,000,000, 0.70% of the next $70,000,000, 0.65% of the next $100,000,000 and 0.60% of the amount above $200,000,000.
Parnassus Endeavor Fund and Parnassus Mid Cap Fund: 0.85% of the first $100,000,000, 0.80% of the next $100,000,000, 0.75% of the next $300,000,000 and 0.70% of the amount above $500,000,000. Parnassus Small Cap Fund: 1.00% of the first $100,000,000, 0.90% of the next $100,000,000, 0.85% of the next $300,000,000 and 0.80% of the amount above $500,000,000. Parnassus Asia Fund: 1.10% of the first $100,000,000, 1.05% of the next $400,000,000 and 1.00% of the amount above $500,000,000.
For the year ended December 31, 2014, Parnassus Investments has contractually agreed to limit total operating expenses to 0.99% of net assets for the Parnassus Fund, 0.95% of net assets for the Parnassus Endeavor Fund, and 1.20% of the net assets for the Parnassus Mid Cap Fund and Parnassus Small Cap Fund, and reduce its investment advisory fee to the extent necessary to limit total operating expenses to 1.25% of the net assets of the Parnassus Asia Fund. Parnassus Core Equity Fund: 0.75% of the first $30,000,000, 0.70% of the next $70,000,000, 0.65% of the next $400,000,000 and 0.60% of the amount above $500,000,000. Parnassus Fixed Income Fund: 0.50% of the first $200,000,000, 0.45% of the next $200,000,000 and 0.40% of the amount above $400,000,000. For the year ended December 31, 2014, Parnassus Investments has contractually agreed to limit total operating expenses to 0.99% of net assets for the Parnassus Core Equity Fund – Investor Shares and 0.78% of net assets for the Parnassus Core Equity Fund – Institutional Shares and reduce its investment advisory fee to the extent necessary to limit total operating expenses to 0.68% of net assets for the Parnassus Fixed Income Fund. Parnassus Investments receives fees under terms of a separate agreement which provides for furnishing transfer agent and fund administration services to the Funds.
The transfer agent fee was $2.50 per month per account plus any out-of-pocket expenses for the Parnassus Fund, Parnassus Endeavor Fund, Parnassus Mid Cap Fund, Parnassus Small Cap Fund and Parnassus Asia Fund. The transfer agent fee was $2.70 per month per account plus any out-of-pocket expenses for the Parnassus Core Equity Fund and Parnassus Fixed Income Fund. The Funds pay the monthly fee based on the number of accounts on record at each month-end.
The fund administration reflects annual rates based on net assets for all Funds managed by Parnassus Investments and was allocated based on respective Fund net assets. The fund administration services fee was 0.03% of average net assets under this new agreement for the year ended December 31, 2014. 64 . Annual Report • 2014 PARNASSUS FUNDS Notes to Financial Statements (continued) Parnassus Investments may also arrange for third parties to provide certain services, including account maintenance, recordkeeping and other personal services to their clients who invest in the Funds. For these services, the Funds may pay service providers an aggregate service fee on investment accounts at a rate not to exceed 0.25% per annum of average daily net assets. The Parnassus Core Equity Fund – Institutional Shares does not incur service provider fees. 10. Investments in affiliates The 1940 Act defines “affiliated companies” to include investments in portfolio companies in which a Fund owns 5% or more of the outstanding voting shares.
During the year ended December 31, 2014, the Funds below held 5% or more of the outstanding voting shares of the noted portfolio companies. During this period, other Funds in the Trust may also have held voting shares of the issuers at a level below 5%. A summary of transactions in securities of issuers affiliated with a Fund for the year ended December 31, 2014 is set forth below. Beginning shares as of December 31, 2013 Shares purchased Ending shares as of December 31, 2014 Shares sold Market Value of affiliates at December 31, 2014 Dividend Income January 1, 2014 December 31, 2014 Parnassus Core Equity Fund Name of Company: Compass Minerals International Inc. 1,941,000 - - 1,941,000 $168,537,030 $ 4,658,400 Northwest Natural Gas Co. 2,000,000 300,000 - 2,300,000 114,770,000 3,887,494 WD-40 Co. 1,140,000 80,000 - 1,220,000 103,797,600 1,589,518 $387,104,630 Total Affiliates $10,135,412 $ 29,899,945 $ Parnassus Small Cap Fund Name of Company: Checkpoint Systems Inc. Covisint Corp. Total Affiliates 1,785,000 1,105,000 712,291 2,177,709 - 2,215,000 - 2,215,000 5,869,750 $ 35,769,695 - $ - 65 . PARNASSUS FUNDS Annual Report • 2014 Financial Highlights Selected data for each share of capital stock outstanding, total return and ratios/supplement data for each of the five years ended December 31 are as follows: For a Share Outstanding for the Year Ended Net Asset Net Realized and Dividends Net Investment Total from Value Unrealized from Net Income Investment Beginning Gain (Loss) on Investment (Loss)(a) Operations(a) of Year Securities(a) Income Parnassus Fund 2014 $45.86 $0.22 2013 40.62 0.25 2012 35.23 0.28 2011 40.49 0.13 2010 34.82 0.15 Parnassus Core Equity Fund – Investor Shares 2014 36.68 0.43 2013 29.20 0.44 2012 26.35 0.39 2011 26.31 0.32 2010 24.45 0.30 Parnassus Core Equity Fund – Institutional Shares 2014 36.73 0.45 2013 29.26 0.49 2012 26.41 0.45 2011 26.36 0.38 2010 24.51 0.38 Parnassus Endeavor Fund 2014 26.99 0.18 2013 22.17 0.14 2012 19.64 0.12 2011 20.81 0.05 2010 19.45 0.02 Parnassus Mid Cap Fund 2014 25.10 0.22 2013 20.27 0.13 2012 17.69 0.16 2011 18.25 0.06 2010 16.28 0.30 Parnassus Small Cap Fund 2014 28.72 (0.02) 2013 23.77 (0.04) 2012 20.08 -(c) 2011 23.95 (0.04) 2010 17.92 0.15 Parnassus Asia Fund 2014 15.67 0.19 For the period ended December 31, 2013(d) 15.00 (0.07) Parnassus Fixed Income Fund 2014 16.43 0.31 2013 17.56 0.29 2012 17.53 0.31 2011 16.90 0.33 2010 16.74 0.45 66 Distributions from Net Distributions Total Realized from Return Dividends and Gains on of Capital Distributions Securities $6.47 13.34 8.64 (2.25) 5.67 $6.69 13.59 8.92 (2.12) 5.82 $(1.62) (1.94) (0.80) (0.12) (0.15) $(2.84) (6.41) (2.73) (3.02) - $- $(4.46) (8.35) (3.53) (3.14) (0.15) 4.84 9.39 3.64 0.48 1.85 5.27 9.83 4.03 0.80 2.15 (0.59) (0.48) (0.74) (0.31) (0.29) (0.67) (1.87) (0.44) (0.45) - - (1.26) (2.35) (1.18) (0.76) (0.29) 4.91 9.39 3.64 0.50 1.82 5.36 9.88 4.09 0.88 2.20 (0.67) (0.54) (0.80) (0.38) (0.35) (0.67) (1.87) (0.44) (0.45) - - (1.34) (2.41) (1.24) (0.83) (0.35) 4.79 6.71 4.13 (0.40) 2.48 4.97 6.85 4.25 (0.35) 2.50 (0.51) (0.50) (0.50) (0.05) (0.50) (1.50) (1.53) (1.22) (0.77) (0.64) - (2.01) (2.03) (1.72) (0.82) (1.14) 2.60 5.58 3.10 0.51 2.70 2.82 5.71 3.26 0.57 3.00 (0.20) (0.26) (0.30) (0.13) (0.24) (0.32) (0.62) (0.38) (1.00) (0.79) - (0.52) (0.88) (0.68) (1.13) (1.03) 0.33 6.71 3.69 (3.15) 6.53 0.31 6.67 3.69 (3.19) 6.68 (0.41) -(c) (0.47) (5.26) (1.31) -(c) (0.68) (0.18) - (5.26) (1.72) -(c) (0.68) (0.65) 1.04 1.23 (0.18) - - (0.18) 0.74 0.67 - - 0.43 (0.76) 0.05 0.88 0.65 0.74 (0.47) 0.36 1.21 1.10 (0.37) (0.29) (0.33) (0.34) (0.59) (0.14) (0.31) -(c) (0.24) (0.35) (0.06) - (0.51) (0.66) (0.33) (0.58) (0.94) . Annual Report • 2014 Net Asset Value End of Year Total Overall Return Net Assets End of Year (000s) Ratio of Gross Expenses to Average Net Assets Parnassus Fund $48.09 14.68% $679,130 0.84% 45.86 34.22 572,301 0.86 40.62 26.04 470,136 0.90 35.23 (5.01) 354,572 0.94 40.49 16.71 444,457 0.97 Parnassus Core Equity Fund – Investor Shares 40.69 14.48 8,558,905 0.87 36.68 34.01 6,282,235 0.87 29.20 15.43 4,023,309 0.90 26.35 3.13 3,398,905 0.94 26.31 8.89 3,150,408 0.99 Parnassus Core Equity Fund – Institutional Shares 40.75 14.71 3,024,069 0.67 36.73 34.13 1,809,054 0.69 29.26 15.64 1,006,980 0.68 26.41 3.40 630,035 0.70 26.36 9.07 407,423 0.75 Parnassus Endeavor Fund 29.95 18.51 770,332 1.02 26.99 31.15 475,940 1.07 22.17 22.03 281,029 1.14 19.64 (1.62) 216,269 1.16 20.81 12.96 143,491 1.25 Parnassus Mid Cap Fund 27.40 11.24 305,297 1.09 25.10 28.27 241,162 1.14 20.27 18.58 128,964 1.23 17.69 3.33 61,299 1.24 18.25 18.70 36,811 1.46 Parnassus Small Cap Fund 23.77 0.98 560,462 1.20 28.72 28.33 775,655 1.20 23.77 18.40 679,980 1.23 20.08 (13.29) 644,825 1.22 23.95 37.37 445,343 1.30 Parnassus Asia Fund 16.72 7.84 7,457 3.53 15.67 4.47(e) 3,376 Parnassus Fixed Income Fund 16.66 4.49 192,614 16.43 (2.71) 175,790 17.56 2.08 225,723 17.53 7.24 211,723 16.90 6.61 180,186 Ratio of Net Expenses to Average Net Assets (Net of Waiver and Expense Offset Arrangements)(b) Ratio of Net Investment Income (Loss) to Average Net Assets PARNASSUS FUNDS Portfolio Turnover Rate 0.84% 0.86 0.90 0.94 0.97 0.47% 0.54 0.70 0.33 0.42 60.44% 64.87 52.72 74.43 51.77 0.87 0.87 0.90 0.94 0.99 1.11 1.28 1.38 1.19 1.23 14.32 16.93 24.34 63.04 54.30 0.67 0.69 0.68 0.70 0.75 1.17 1.44 1.59 1.43 1.54 14.32 16.93 24.34 63.04 54.30 0.95 1.07 1.14 1.16 1.20 0.62 0.53 0.54 0.22 0.09 39.51 41.20 69.25 47.22 53.85 1.09 1.14 1.20 1.20 1.20 0.84 0.55 0.79 0.35 1.73 21.62 20.70 22.82 38.67 53.22 1.20 1.20 1.20 1.20 1.20 (0.06) (0.15) (0.02) (0.18) 0.75 67.96 49.36 32.85 39.50 35.33 1.25 1.11 24.41 5.08(f) 1.45(f) 0.78 0.78 0.79 0.81 0.83 0.68 0.68 0.75 0.75 0.75 (0.71)(f) 1.84 1.70 1.78 1.92 2.60 3.00(e) 52.57 35.15 5.45 29.25 56.06 (a) Income (loss) from operations per share is based on average daily shares outstanding. (b) Parnassus Investments has contractually limited expenses to an annualized rate of 0.95% for the Parnassus Endeavor Fund, 1.20% for the Parnassus Small Cap Fund, 1.25% for the Parnassus Asia Fund and 0.68% for the Parnassus Fixed Income Fund. (c) Amount less than $0.01. (d) The Parnassus Asia Fund commenced operations on April 30, 2013, and the period shown is from April 30, 2013 through December 31, 2013. (e) Not annualized for periods less than one year. (f) Annualized. 67 . PARNASSUS FUNDS Annual Report • 2014 ADDITIONAL INFORMATION (unaudited) Board of Trustees and Officers Independent Trustees§ Name Donald V. Potter Jeanie S. Joe Donald J. Boteler Alecia A.
DeCoudreaux Age 69 67 66 60 Address 1 Market Street, Suite 1600 San Francisco, California 94105 1 Market Street, Suite 1600 San Francisco, California 94105 1 Market Street, Suite 1600 San Francisco, California 94105 1 Market Street, Suite 1600 San Francisco, California 94105 Position(s) Held with Funds Lead Independent Trustee Trustee Trustee, Audit Committee Chairman Trustee Term of Office and Length of Service Indefinite. Since 2002. Indefinite.
Since October 2004. Indefinite. Since 2012. Indefinite.
Since December 2013 Principal Occupation(s) During Past 5 Years President of Strategystreet.com business strategy. President of Geo/ Resource Consultants, a geotechnical and environmental consulting firm, until 2009. Vice President, Operations & Continuing Education, Investment Company Institute, from 1986 to March 2012. Independent Trustee, FAM Funds, from October 2012 to present. President of Mills College since 2011. Various positions with Eli Lilly and affiliates from 1980-2011, including Vice President and General Counsel of Lilly USA from 2005-2009. Immediate Past Chair to the Wellesley College Board of Trustees. Honorary Director of the Indiana University Foundation and Emeritus Board Member of the Indiana University School of Law Board of Visitors, since 2007. Portfolios in the Fund Complex Overseen by Trustee Seven Seven Seven Seven Other Directorships Held by Trustee None None None None 68 .
Annual Report • 2014 PARNASSUS FUNDS ADDITIONAL INFORMATION (unaudited) (continued) Board of Trustees and Officers (continued) Interested Trustee† Name Jerome L. Dodson Age 71 Address 1 Market Street, Suite 1600 San Francisco, California 94105 Position(s) Held with Funds President and Trustee Term of Office and Length of Service Indefinite. Since 1992 for Parnassus Income Funds. Since 1984 for the Parnassus Funds. Principal Occupation(s) During Past 5 Years President and Trustee of the Parnassus Funds and the Parnassus Income Funds since their inceptions; President and Director of Parnassus Investments since June 1984. Portfolios in the Fund Complex Overseen by Trustee Seven Other Directorships Held by Trustee None § “Independent” Trustees are Trustees who are not deemed to be “interested persons” of the Funds as defined in the Investment Company Act of 1940. † An “interested” Trustee is a Trustee who is deemed to be an “interested person” of the Funds, as defined in the Investment Company Act of 1940.
Jerome L. Dodson is an interested person of the Funds because of his ownership in the Funds’ investment adviser and because he is an officer of the Trusts. Additional information about the Fund’s Board of Trustees is available in the Statement of Additional Information. The Statement of Additional Information is available without charge on the Securities and Exchange Commission’s website (www.sec.gov) or by calling us at (800) 999-3505 or at the Parnassus website, www.parnassus.com. 69 .
PARNASSUS FUNDS Annual Report • 2014 ADDITIONAL INFORMATION (unaudited) (continued) Board of Trustees and Officers (continued) Officers Name Todd C. Ahlsten Marc C. Mahon John V. Skidmore II Age 42 37 49 Address 1 Market Street, Suite 1600 San Francisco, California 94105 1 Market Street, Suite 1600 San Francisco, California 94105 1 Market Street, Suite 1600 San Francisco, California 94105 Position(s) Held with Funds Vice President Treasurer Chief Compliance Officer and Assistant Secretary Term of Office and Length of Service Indefinite.
Since 2001. Indefinite. Since 2007. Indefinite. Since 2008. Principal Occupation(s) During Past 5 Years Vice President of the Parnassus Funds and Parnassus Income Funds since 2001.
Chief Investment Officer of Parnassus Investments since 2007. Director of Research at Parnassus Investments from 1995 to 2007. Portfolio Manager of Parnassus Core Equity Fund since 2001. Chief Financial Officer of Parnassus Investments since 2007.
Treasurer of Parnassus Funds and Parnassus Income Funds since 2007. Chief Compliance Officer of Parnassus Investments since 2008. 70 . Annual Report • 2014 PARNASSUS FUNDS ADDITIONAL INFORMATION (unaudited) (continued) Proxy Disclosures Parnassus proxy voting policies and procedures are available, without charge, on our website (www.parnassus.com), on the Securities and Exchange Commission’s website (www.sec.gov) and by calling us at (800) 999-3505. The Funds file a proxy voting record with the Securities and Exchange Commission for the 12 months ended June 30. The most recent report is available by calling Parnassus or it may be obtained from the Securities and Exchange Commission’s website or the Parnassus website. Quarterly Portfolio Schedule The Funds file their complete schedule of portfolio holdings with the Securities and Exchange Commission for the first and third quarters of each fiscal year on Form N-Q. The quarterly portfolio holdings are available on the Securities and Exchange Commission’s website (www.sec.gov).
The Funds’ Form N-Q may also be reviewed and copied at the Securities and Exchange Commission’s Public Reference Room in Washington, DC, and information on the operation of the Public Reference Room may be obtained by calling (800) SEC-0330. Federal Income Tax Information For the year ended December 31, 2014, the following percentages of ordinary income distributed by the Funds that qualify for the individual qualified dividend income deduction (QDI) and the corporate dividends received deduction (DRD) are as follows: Fund QDI DRD 29.77% 29.77% 100.00% 100.00% Parnassus Endeavor Fund 56.13% 56.21% Parnassus Mid Cap Fund 100.00% 100.00% 48.08% 48.26% 100.00% 100.00% 0.00% 0.00% Parnassus Fund Parnassus Core Equity Fund Parnassus Small Cap Fund Parnassus Asia Fund Parnassus Fixed Income Fund 71 . Go Paperless with E-Delivery Sign up for electronic delivery of prospectuses, shareholder reports and account statements at www.parnassus.com/gopaperless If you do not hold your account directly with Parnassus, please contact the firm that holds your account to inquire about electronic delivery. PARNASSUS FUNDS 1 Market Street, Suite 1600 San Francisco, CA 94105 (800) 999-3505 www.parnassus.com This report must be preceded or accompanied by a current prospectus. Investment Adviser Parnassus Investments 1 Market Street, Suite 1600 San Francisco, CA 94105 Independent Registered Public Accounting Firm Deloitte and Touche, LLP 555 Mission Street San Francisco, CA 94105 Legal Counsel Foley and Lardner LLP 777 E. Wisconsin Ave. Milwaukee, WI 53202 Distributor Parnassus Funds Distributor 1 Market Street, Suite 1600 San Francisco, CA 94105 .
According to Bloomberg, only 10% of the actively-managed equity mutual funds available in the United States were able to beat the S&P 500*. According to Lipper, the average diversified U.S. stock mutual fund gained only 7.60% in 2014. By comparison, the Parnassus Funds had a great year with four of our six equity funds beating their benchmarks.
In other words, 67% of our funds beat their respective indices, while only 10% of the other funds accomplished that feat. Although the Parnassus Mid Cap Fund did not beat its index, it did beat its Lipper peer group, so 83% of our funds were ahead of mutual funds with similar strategies. Our best-performing fund was the Parnassus Endeavor Fund (formerly the Parnassus Workplace Fund); it was up 18.51% for the year. This made it the fourth-best performer of the 770 multi-cap core funds followed by Lipper, and it was the third-best performer of 388 multi-cap core funds since the Fund was established on April 29, 2005.
(For the three- and five-year periods respectively, the Fund was #24 of 685 funds and #73 of 581 funds.) Second was the Parnassus Fund, which gained 14.68%, and a close third was the Parnassus Core Equity Fund-Investor Shares, which gained 14.48%. If you own shares in any of these three funds, you should be very happy. The fourth fund of note was the Parnassus Asia Fund, which returned 7.84% for the year. This may not sound like a lot, when you compare it to the 13.68% earned by the S&P 500, but when you compare it to the 0.39% return of the MSCI AC Asia Pacific Index, it sounds very good.
While the composite Asian markets were basically flat for the year in dollar terms, the Parnassus Asia Fund was up 7.84%. Enclosed you will find the annual reports for all our funds. We think you’ll find they will make very interesting reading. Company News The dynamic duo of Todd Ahlsten and Ben Allen, who manage our Parnassus Core Equity Fund, have just been named as one of the five finalists for Morningstar’s Domestic-Stock Fund Manager of the Year.
We congratulate them for this well-deserved recognition. Our senior research analyst Robert Klaber has just been named to the Forbes’ magazine list of 30 under 30 rising stars in finance. We offer our congratulations to 29-year old Robby. Parnassus Survey In the last three reports, I mentioned that I knew all of our shareholders by name 30 years ago, when I started the Parnassus Fund. In those days, we had only a few million dollars in assets, so communication was easy.
Although there’s no way I can know each of you by name now, I would like to know more about you and why you chose the Parnassus Funds. You can help me to gain a better understanding of our shareholders by completing a survey that should take you no more than five * 4 According to Bloomberg, as of December 31, 2014, 960 of 9,979 actively managed U.S. equity mutual funds had one-year annual returns that exceeded the 13.68% one-year annual return of the S&P 500 Index. .
Annual Report • 2014 PARNASSUS FUNDS minutes. Your answers will be completely anonymous and your privacy will be respected. To participate in the survey, please go to www.parnassus.com/survey. I thank all of you for investing with us. Yours truly, Jerome L. Dodson President Performance data quoted represent past performance and are no guarantee of future returns.
Current performance may be lower or higher than the performance data quoted. Please see the following pages for more detailed information regarding each Fund’s performance, including information regarding the Fund’s Lipper rankings, and the risks associated with investing in the Funds. 5 . PARNASSUS FUNDS Annual Report • 2014 PARNASSUS FUND Ticker: PARNX As of December 31, 2014, the net asset value per share (“NAV”) of the Parnassus Fund was $48.09, so after taking dividends into account, the total return for the year was 14.68%, the second-best performance of the Parnassus Funds behind the Parnassus Endeavor Fund, and edging out the Parnassus Core Equity Fund for second place. This compares to 13.68% for the S&P 500 Index (“S&P 500”) and only 9.98% for the Lipper Multi-Cap Core Average, which represents the average return of the multi-cap core funds followed by Lipper (“Lipper average”). It was a great year for the Parnassus Fund. We beat the S&P 500 in a year when, according to Bloomberg, 90% of the actively-managed equity mutual funds available in the United States lagged the index*.
While we beat the S&P 500 by one percentage point, we beat the Lipper average by more than 4.5 percentage points, because most funds did so poorly compared to the index. Below is a table comparing the Parnassus Fund with the S&P 500 and the Lipper average over the past one-, three-, five- and ten-year periods. You will notice that we’re ahead of both benchmarks for all time periods. Most striking is the three-year number, where we have gained an average of 24.72% per year, which is more than four percentage points per year ahead of the S&P 500 and more than five percentage points per year ahead of the Lipper average. On page 8, you will find a graph that shows the growth of a hypothetical $10,000 investment in the Fund over the past ten years.
The graph shows that the Fund has grown much more than the same amount invested in either the S&P 500 or the Lipper average. Parnassus Fund Average Annual Total Returns (%) Company Analysis One Year Three Years Five Years Ten Years Gross Expense Ratio Parnassus Fund 14.68 24.72 16.55 9.99 0.86 0.86 S&P 500 Index 13.68 20.34 15.42 7.66 NA NA 9.98 19.22 13.90 7.17 NA NA for periods ended December 31, 2014 Lipper Multi-Cap Core Average Net Expense Ratio Performance data quoted represent past performance and are no guarantee of future returns. Current performance may be lower or higher than the performance data quoted. Current performance information to the most recent month-end is available on the Parnassus website Six companies each contributed 40¢ or more to the NAV, but there were no stocks that cut 40¢ or more off the NAV. If we wanted to put a gloss on things, we would only talk about the six winners and say that no company accounted for a loss of 40¢ or more.
However, we did have three stocks that each had a negative impact of 20¢ or more on the value of each fund share. We’ve decided to talk about them because each of the three presents an interesting situation from which we can learn something. Quite often, you learn more from your losers than you do from your winners.
Most importantly, each of the three has the potential to give us some good returns in 2015 and into the future, when some of the stocks that soared in 2014 might not perform as well. (www.parnassus.com). Investment return and principal value will fluctuate so that an investor’s shares, when redeemed, may be worth more or less than their original principal cost. Returns shown in the table do not reflect the deduction of taxes a shareholder may pay on fund distributions or redemption of shares. The S&P 500 Composite Stock Index (also known as the S&P 500) is an unmanaged index of common stocks, and it is not possible to invest directly in an index.
Index figures do not take any expenses, fees or taxes into account, but mutual fund returns do. Before investing, an investor should carefully consider the investment objectives, risks, charges and expenses of the Fund and should carefully read the prospectus or summary prospectus, which contain this and other information. The prospectus or summary prospectus can be obtained on the Parnassus website, or by calling (800) 999-3505. * 6 EZchip Semiconductor designs semiconductors known as network-processors, which are used in data-centers, enterprise-networks and telecommunications equipment. The stock sliced 29¢ off the NAV, falling 22.2% from $24.61 to $19.14.
It dropped in October, after the company reduced its revenue guidance because of weaker orders from telecom carriers. We think orders will come back this year, but more importantly, EZchip has some very interesting technology. In December, the company announced that its next generation NP-5 network-processor will be in full production.
More significant is the development According to Bloomberg, as of December 31, 2014, 960 of 9,979 actively managed U.S. equity mutual funds had one-year annual returns that exceeded the 13.68% one-year annual return of the S&P 500 Index. . Annual Report • 2014 PARNASSUS FUNDS of the new NPS chip, which has more flexibility and could find a big market with all the data-center operators that want to design their own systems. International Business Machines (IBM) dropped 14.5% from $187.57 to $160.44 for a loss of 24¢ for each fund share. The stock rose in early 2014, after the company announced its decision to divest its lower-margin server business, and it raised the dividend. The stock reversed its earlier gains in the fall, as demand for its software and consulting services declined. We originally became interested in this stock when we saw that Warren Buffett had a big position in his Berkshire-Hathaway portfolio.
IBM’s performance shows that even great stock-pickers can be wrong – at least during certain periods. We’re holding onto the stock, because we think it’s undervalued and there’s not much downside risk. We think the restructuring initiatives and the investment in new software and services will eventually move the stock higher. Ciena, maker of optical equipment for telecommunications, cut 22¢ off the value of each fund share, as its stock dropped from $23.93 to $19.41.
The stock dropped 22.8% to $16.72 in the third quarter, when it announced that as part of negotiations for a major contract with AT&T, it was offering a big discount that would depress margins in the fourth quarter, but the margins would come back later. Stock market investors are notoriously short-sighted, so Ciena moved lower and we added to our position. The stock came back in the fourth quarter, climbing 16.1% to $19.41 by the end of the year.
While the stock shows a loss for the year, it made a strong come-back in the fourth quarter, and we expect the issue to do very well going forward, because of its excellent technology and demand for more telecom services. Parnassus Fund as of December 31, 2014 (percentage of net assets) Fund Sector Weightings* S&P 500 Index Consumer Discretionary 12.4% 12.1% Consumer Staples 8.1% 10.6% Energy 0.0% 8.3% Utilities Turning to our winners, the biggest contributor was InterMune, a biotechnology company focused on respiratory and fibrotic diseases, which soared an amazing 402% from $14.73 to $73.89, for a gain of $1.06 for each fund share. The stock rose early in the year, after the company announced excellent results in the phase III trial of Esbriet, its new drug to treat idiopathic pulmonary fibrosis, a fatal lung disease. The strong results convinced the Food & Drug Administration to approve Esbriet, and later in the year, Switzerland-based Roche Pharmaceuticals paid $8.3 billion to acquire InterMune for $74 a share. Two of our best performers were semiconductor-equipment stocks. Applied Materials added 85¢ to the NAV during the year, as its stock rose 40.9% from $17.69 to $24.92. Consumer demand for new and better mobile devices with more features and longer battery life is driving large investments in new semiconductor-manufacturing equipment.
In 2014, industry spending increased 25%, and this demand should increase with the transition to more advanced manufacturing technology. 0.0% 3.1% Financials 12.1% 16.3% Health Care 10.5% 14.0% Industrials 10.9% 10.4% Materials 3.3% 3.2% Information Technology 41.0% 19.8% Telecom Services 0.0% 2.2% Short-term Investments, Other Assets & Liabilities 1.7% 0.0% 0 10 20 30 40 50 * For purposes of categorizing securities for diversification requirements under the Investment Company Act, the Fund uses industry classifications that are more specific than those used for the chart. Lam Research was the other semiconductor-equipment company that did well for us, as its stock climbed 45.7% from $54.45 to $79.34, contributing 40¢ to the NAV. The company had a strong start in 2014, as robust demand from semiconductor foundries and memory-chip makers drove earnings higher. Lam benefits from the same trends as Applied Materials, with strong demand for equipment to make increasingly sophisticated semiconductors. Whole Foods, the world’s largest retailer of organic food, added 66¢ to the value of each fund share, even though the stock dropped 12.8% during the year from $57.83 to $50.42.
At this point, you may be wondering what kind of magic we can work at Parnassus, if we can make money when a stock goes down, and we don’t do it by short-selling. Actually, there was no magic involved, since we bought 700,000 shares during the third quarter, when the stock dropped to our average cost of $38.36, because of negative investor sentiment. Shares slumped because revenue growth started to slow down, and investors were concerned about competition from grocery chains such as Wal-Mart, Kroger and Costco.
The stock jumped in November, after Whole Foods reported better-than-expected earnings. As we indicated earlier in this report in our discussion 7 . PARNASSUS FUNDS Annual Report • 2014 Top 10 Holdings (percentage of net assets) Ciena Corp. Value on December 31, 2014 of $10,000 invested on December 31, 2004 5.1% Whole Foods Market Inc. 4.8% QUALCOMM Inc. 4.4% Google Inc., Class A 4.0% International Business Machines Corp. 3.9% Air Lease Corp. 3.4% Expeditors International of Washington Inc. 3.3% Wells Fargo & Co. 3.2% Lipper Multi-Cap Core Average $20,458 3.3% Altera Corp. S&P 500 Index $20,935 Parnassus Fund $25,915 4.3% Applied Materials Inc. 30,000 Portfolio characteristics and holdings are subject to change periodically. 25,000 20,000 15,000 10,000 5,000 2004 2005 2006 2007 2008 2009 2010 2011 2012 2013 2014 The chart shows the growth in value of a hypothetical $10,000 investment over the last 10 years and does not reflect the deduction of taxes a shareholder would pay on fund distributions or the redemption of fund shares. of Ciena, investors have very short time-horizons; they tend to sell first and ask questions later, if the least bit of bad news surfaces. When we saw the stock sink so rapidly from the $50’s to the $30’s, we knew it was overdone. It was hard for us to believe that the people who shop at Whole Foods were going to make a sudden change and start shopping at Wal-Mart, even if Wal-Mart started carrying a few lines of organic food. Fortunately, we were right and, in just a few months, Whole Foods climbed an amazing 31.4% from our cost of $38.36 to $50.42 by year-end. C.H.
Robinson Worldwide, a logistics company with an emphasis on serving as a broker between shippers and truckers, added 59¢ to each fund share, as its stock rose 28.4% from $58.34 to $74.89. From 2010 through 2013, profits were squeezed, because truckers would not lower their rates and shippers would not pay higher prices, so the falling stock price reflected that squeeze. We invested in Robinson, because we thought that demand would eventually outstrip carrier supply, and the company would be able to raise prices to shippers.
As the economy has improved, freight volumes have increased and Robinson can get higher margins so the stock price has moved higher. Equinix provides data-centers and Internet-connection services to corporations, content-providers and Internet-service providers. Strong demand to move data around the Internet increased revenue and earnings, which boosted the stock by 27.8% from $177.45 to $226.73, increasing the value of each Parnassus share by 44¢. Outlook and Strategy (This section applies to the Parnassus Fund and the Parnassus Endeavor Fund.) It was a good year for the stock market with the S&P 500 up 13.68%. (It was an even better year for the Parnassus Fund and the Endeavor Fund.) Some market-commentators are saying that things will be difficult this year. Here are some of the concerns they have expressed: 1. The S&P 500 is trading at a price-earnings ratio of 18, so the market is at least fully-valued and perhaps even overvalued. 2. The Federal Reserve has said that interest rates will probably go up by the middle of the year. 3. The sharp drop in oil prices will be bad for the economy, since it will mean fewer jobs and less investment in energy. 4. National economies in both Asia and Europe are weak, so they may pull the U.S.
into a recession. All four of these concerns are legitimate, and these factors might pull the American economy into a recession in the near-term, and the stock market would fall quite a bit. Given this situation, a prudent investor might want to pull out of the market right now and wait for a better time to return. 8 . Annual Report • 2014 PARNASSUS FUNDS Although we acknowledge the validity of the four points, our view is somewhat different. First, while we agree that the market is fully-valued, that doesn’t mean that it will automatically go down. It can stay fully-valued for years without moving sharply lower. In fact, the market can become less than fully-valued without dropping at all, if companies grow their earnings.
(If the “E” in the P/E ratio goes up, that means the ratio goes down and the market becomes less than fully-valued or even undervalued.) In the current environment, businesses should be able to grow their earnings. Second, there is no doubt that the Federal Reserve will increase interest rates sometime this year, but this doesn’t mean that stocks will go down. If the Fed increases interest rates, that means the economy is getting better, and the stock market should go higher. Right now, it seems that the U.S.
economy is on the mend and is getting stronger by the day. Most encouraging is the increase in jobs, which has been running over 200,000 per month for a long time. A sharp spike in interest rates would probably move the market lower, but a gradual increase probably would not.
It’s unlikely that Janet Yellen would engineer a big hike in rates. Third, the sharp drop in oil prices is good for the economy. While it’s true that lower oil prices mean less investment and fewer jobs in the oil industry, most of the other industries should benefit. Operating costs for businesses will be lower, and people will have more money to spend on things other than gasoline.
Other parts of the economy will grow to make up for declines in the oil patch. Fourth, we’re concerned about the slowdown in Europe and Asia – especially Europe, since the Asian economies are more dynamic and will start growing again on their own. In the short-term, there’s not a lot of hope for Europe, but at some point, their economies will improve. The euro is now down to $1.18, so that should help their export industries.
Also, Mario Draghi, head of the European Central Bank, has finally started to pump a lot of money into the system, so that should help Europe the same way the Fed’s quantitative easing helped us. Finally, even though the market as a whole is fully-valued and may not go up much in 2015, our funds can still do well. It’s harder to find bargains now, but they do exist. For example, in this report, we talked about how Whole Foods and Target dropped down to very low levels, because of temporary conditions or over misunderstandings.
There may be more opportunities like these, and we’ll work hard to find them. Yours truly, Jerome L. Dodson Lead Portfolio Manager Ian Sexsmith Portfolio Manager 9 . PARNASSUS FUNDS Annual Report • 2014 PARNASSUS CORE EQUITY FUND Ticker: Investor Shares - PRBLX Ticker: Institutional Shares - PRILX As of December 31, 2014, the net asset value (NAV) of the Parnassus Core Equity Fund-Investor Shares was $40.69. After taking dividends into account, the total return for the fourth quarter was 6.30%. This compares to increases of 4.93% for the S&P 500 Index (“S&P 500”) and 3.37% for the Lipper Equity Income Fund Average, which represents the average equity income fund followed by Lipper (“Lipper average”). For the year, the Fund generated a return of 14.48%, which compares favorably to gains of 13.68% for the S&P 500 and 9.77% for the Lipper average. Below is a table that summarizes the performances of the Fund, the S&P 500 and the Lipper average.
The returns are for the one-, three-, five- and ten-year periods. On page 12, you will find a graph that shows the growth of a hypothetical $10,000 investment in the Fund over the past ten years. Parnassus Core Equity Fund Average Annual Total Returns (%) Year in Review Gross Net Expense Expense Ratio Ratio One Year Three Years Five Years Ten Years Parnassus Core Equity Fund Investor Shares 14.48 20.98 14.74 10.24 0.87 0.87 Parnassus Core Equity Fund Institutional Shares 14.71 21.17 14.95 10.42 0.69 0.69 S&P 500 Index 13.68 20.34 15.42 7.66 NA NA 9.77 16.31 13.29 7.23 NA NA for periods ended December 31, 2014 Lipper Equity Income Fund Average The average annual total return for the Parnassus Core Equity Fund-Institutional Shares from commencement (April 28, 2006) was 10.92%. Performance shown prior to the inception of the Institutional Shares reflects the performance of the Parnassus Core Equity Fund-Investor Shares and includes expenses that are not applicable to and are higher than those of the Institutional Shares.
The performance of Institutional Shares differs from that shown for the Investor Shares to the extent that the classes do not have the same expenses. Performance data quoted represent past performance and are no guarantee of future returns. Current performance may be lower or higher than the performance data quoted, and current performance information to the most recent month-end is available on the Parnassus website (www.parnassus.com).
Investment return and principal value will fluctuate so that an investor’s shares, when redeemed, may be worth more or less than their original principal cost. Returns shown in the table do not reflect the deduction of taxes a shareholder may pay on fund distributions or redemption of shares. The S&P 500 is an unmanaged index of common stocks, and it is not possible to invest directly in an index. Index figures do not take any expenses, fees or taxes into account, but mutual fund returns do. Before investing, an investor should carefully consider the investment objectives, risks, charges and expenses of the Fund and should carefully read the prospectus or summary prospectus, which contain this and other information.
The prospectus or summary prospectus can be obtained on the Parnassus website, or by calling (800) 999-3505. 10 2014 was the sixth year in a row of positive returns for the S&P 500, with the index gaining 13.68%. Stocks got a boost from continued earnings growth, with index constituents increasing total earnings-per-share by an expected 9% in 2014. Earnings have benefited from alltime high profit margins for U.S.
corporations, as well as modest revenue growth. As was the case in 2012 and 2013, price/earnings (P/E) multiples expanded last year, adding about 5% to the overall stock market return. Based on expected 2014 earnings, stocks closed the year at a P/E of 17.8x, which is up 37% from the 13.0x P/E that stocks traded at just three years ago. The Fund posted a return of 14.48% for the year, beating the index by 80 basis points (a basis point is 1/100th of one percent).
Our sector allocations had a positive effect on our performance for the year, with the largest benefit coming from our being underweighted in the energy sector, relative to the index. Our 4% average cash balance represented the biggest allocation headwind for the Fund, trimming about 40 basis points from our relative performance. Stock selection had a modest positive impact.
Thankfully, our healthcare and financials stocks more than offset our laggards in the utility and industrial sectors. Three stocks reduced the NAV by 14¢ or more for the year, while three added at least 50¢. MDU Resources was our biggest loser, falling 23.1% during the year from $30.55 to $23.50 and reducing the NAV by 20¢. MDU’s exploration and production (E&P) segment, which represents about a third of earnings, suffered from production shortfalls and lower oil prices.
In November, the company announced that it would consider selling this business. We applaud MDU’s . Annual Report • 2014 PARNASSUS FUNDS strategy to evaluate a divestiture, because its E&P segment is capital intensive and has generated low and volatile returns. We still like MDU’s remaining businesses, which are unique assets with good growth potential. One project we’re especially excited about is a $200 million wind farm investment recently proposed by MDU’s utility division. National Oilwell Varco (NOV), a leading provider of oil and gas services, fell 17.6% during 2014 to $65.53 from $79.53 and reduced the NAV by 18¢. The stock fell as the price of a barrel of oil plunged 46.0% during 2014 from $99 to $53.
This precipitous drop means that E&P companies will have less money to drill wells in 2015. Despite this short-term move down in oil prices, we are still bullish about NOV’s long-term outlook. We expect the capital intensity of the E&P industry (i.e., the dollars required to drill new wells) to increase long-term, which benefits equipment-providers like NOV.
Furthermore, we think the company has the best suite of products and services to help companies drill wells safely in complex geological formations. Pentair, a company that sells pumps, valves, filters and other waterrelated products, declined 14.5% during the year to $66.42 from $77.67, trimming the NAV by 14¢. Since 19% of Pentair’s sales are linked to oil and gas, the stock slid as investors feared that lower oil prices would reduce the company’s earnings next year. We think that investors have overreacted, because only 5% of Pentair’s sales are related to upstream energy (i.e., at the well site).
While these sales could fall 20% next year, the effect on Pentair’s total sales should be relatively small. In addition, almost half of Pentair’s oil and gas revenue is related to maintenance and repair, a piece of business that typically isn’t impacted much by oil prices. Most importantly, we still like Pentair’s long-term prospects with non-energy customers, and we’re impressed with management’s commitment to “lean enterprise” processes. Parnassus Core Equity Fund as of December 31, 2014 (percentage of net assets) Sector Weightings Fund S&P 500 Index Consumer Discretionary 4.4% 12.1% Consumer Staples 15.9% 10.6% Energy 6.1% 8.3% Utilities 5.8% 3.1% The Fund’s top three winners are led by Allergan, a pharmaceutical company based in Irvine, California.
The stock rose 91.4% from $111.08 to $212.59, increasing the NAV by $1.06. In April, Valeant Pharmaceuticals teamed up with activist investor Bill Ackman to make a hostile bid for Allergan. Valeant wanted to get control of Allergan’s blockbuster drug, Botox, as well as its prized eye-care products.
In addition, Valeant wanted to make deep cuts to Allergan’s R&D programs, which would result in massive layoffs. Financials 5.3% 16.3% Health Care 15.4% 14.0% Industrials 14.3% 10.4% Materials 3.8% 3.2% Information Technology 23.8% 19.8% Telecom Services After a drawn-out battle in which Allergan repeatedly rejected Valeant’s 0.0% 2.2% offers, pharmaceutical company Actavis finally emerged as a white Short-term Investments, Other Assets & Liabilities 5.2% knight. In late November, Actavis made a cash and stock offer valued at 0.0% more than $219 per share, well above Valeant’s best bid. We view the 5 10 15 20 25 30 Allergan-Actavis combination as a better outcome for Allergan’s 0 employees, investors and patients.
Given that a significant portion of the Actavis offer is in cash, we trimmed our Allergan position and bought shares of Actavis. The result of these transactions will be a position just over 3% in the combined company once the deal closes. Apple had a strong year: its shares rose 37.7% to $110.38 from $80.16 and boosted the NAV by 62¢. Apple continues to demonstrate the benefit of owning the most valuable brand in the world, as evidenced by its successful iPhone 6 launch during the third quarter.
We think the company can generate massive cash flows for many years to come based on its device ecosystem, innovative culture, potential new product categories and loyal user base. We sold about 40% of our Apple position during the second half of 2014 in response to the increased price, but still held some stock at year-end. Applied Materials, the semiconductor-manufacturing equipment giant, soared 40.9% during 2014 from $17.69 to $24.92 and increased the NAV by 56¢. The company had a strong year as chip manufacturing required more expensive equipment due to strong smartphone demand.
Amazingly, while chips built in the 1980’s had transistor gates with 10,000 atoms, the most advanced chips have transistor gates with as few as 50 atoms. These chips are very costly to manufacture, which represents a great long-term opportunity for Applied Materials. 11 . PARNASSUS FUNDS Annual Report • 2014 Top 10 Holdings (percentage of net assets) Applied Materials Inc. Value on December 31, 2014 of $10,000 invested on December 31, 2004 3.9% Pentair PLC 3.7% Motorola Solutions Inc. 3.7% Allergan Inc. 3.3% Procter & Gamble Co. 3.3% QUALCOMM Inc. 3.2% National Oilwell Varco Inc. 3.1% Google Inc., Class C 2.9% Lipper Equity Income Fund Average $20,313 3.0% CVS Health Corp. S&P 500 Index $20,935 Parnassus Core Equity Fund – Investor Shares $26,496 3.4% Iron Mountain Inc. 30,000 Portfolio characteristics and holdings are subject to change periodically. 25,000 20,000 15,000 10,000 5,000 2004 2005 2006 2007 2008 2009 2010 2011 2012 2013 2014 The chart shows the growth in value of a hypothetical $10,000 investment over the last 10 years and does not reflect the deduction of taxes a shareholder would pay on fund distributions or the redemption of fund shares. Outlook and Strategy The Fund enters 2015 with 41 portfolio companies in a variety of industries. The biggest concentrations in the portfolio are in the technology, industrial and consumer staples sectors. Relative to the index, the portfolio has very few holdings in the financial and consumer discretionary sectors. Our underweight allocations in these two highly cyclical areas add an element of defensiveness to the Fund’s overall positioning. During the fourth quarter, we took advantage of the dramatic plunge in crude oil prices to increase our exposure to stocks that should benefit from a recovery in that commodity.
In addition to having 6% of the Fund invested in pure-play energy stocks, we also own industrial and utility companies with business segments directly tied to the oil and gas sector. We expect oil prices to recover within our three-year investment horizon. The reason is that reinvesting in new wells at current prices is simply not profitable for most E&Ps.
This means that supply should go down as existing wells deplete. As supply gradually winds down, prices should go up. Actavis, the pharmaceutical company that agreed to buy Allergan, is the only new portfolio company in the Fund since our last quarterly report. In combination with Allergan, we expect about two-thirds of Actavis’ pro-forma revenue to come from branded pharmaceutical products, and almost 30% of sales to come from generics.
This company has a terrific executive team and great assets, so we’re excited about the long-term prospects of the business. Each of our holdings has a risk-reward profile that is beneficially asymmetric. This means that our optimistic investment scenarios are far more positive than our bearish scenarios are negative. Given this favorable ratio, we expect our portfolio to outperform modestly if the market rallies for a seventh year in a row.
At the same time, we would expect our stocks to experience less severe losses than the index, if 2015 marks the end of the bull market. So while we hope for the good times to continue for stocks, we’ve positioned the Fund to outperform in a wide range of potential outcomes. Thank you for trusting us to manage your money, Todd C. Ahlsten Lead Portfolio Manager 12 Ben E.
Allen Portfolio Manager . Annual Report • 2014 PARNASSUS FUNDS PARNASSUS ENDEAVOR FUND Ticker: PARWX As of December 31, 2014, the NAV of the Parnassus Endeavor Fund was $29.95, so after taking dividends into account, the total return for the year was 18.51%, the best performance of the Parnassus Funds. This compares to a return of 13.68% for the S&P 500 Index (“S&P 500”) and 9.98% for the Lipper Multi-Cap Core Average, which represents the average return of the multi-cap core funds followed by Lipper (“Lipper average”). It was a great year for the Parnassus Endeavor Fund: it beat the S&P 500 by almost five percentage points, and the Lipper average by 8.5 percentage points. According to Lipper, the average diversified U.S. stock fund gained 7.60% in 2014, so the Endeavor Fund returned well over twice what the average fund earned. For the year, the Parnassus Endeavor Fund was the fourth-best performer of the 770 multi-cap core funds followed by Lipper, and since inception on April 29, 2005, the Fund was the third-best performer of 388 funds.
(For the three- and five-year periods, the Fund was #24 out of 685 funds and #73 out of 581 funds, respectively.) Below is a table comparing the Parnassus Endeavor Fund with the S&P 500 and the Lipper average over the past one-, threeand five-year periods and the period since inception on April 29, 2005. We’re ahead of both benchmarks for all time periods. Most striking is the fact that since inception, we’ve earned more than four percentage points per year over the Lipper average. On page 15, you will find a graph that shows the growth of a hypothetical $10,000 investment in the Fund since inception. It shows that the growth of that hypothetical $10,000 would have been much greater in the Endeavor Fund than in either benchmark. Parnassus Endeavor Fund Average Annual Total Returns (%) Company Analysis Three Years Five Years Since Inception on 4/29/05 Parnassus Endeavor Fund 18.51 23.78 16.08 12.07 1.07 0.95 S&P 500 Index 13.68 20.34 15.42 8.39 NA NA 9.98 19.22 13.90 7.97 NA NA for periods ended December 31, 2014 Lipper Multi-Cap Core Average One Year Gross Net Expense Expense Ratio Ratio Performance data quoted represent past performance and are no guarantee of future returns. Current performance may be lower or higher than the performance data quoted.
Current performance information to the most recent month-end is available on the Parnassus website (www.parnassus.com). Investment return and principal value will fluctuate so that an investor’s shares, when redeemed, may be worth more or less than their original principal cost. Returns shown in the table do not reflect the deduction of taxes a shareholder may pay on fund distributions or redemption of shares. The S&P 500 Index is an unmanaged index of common stocks, and it is not possible to invest directly in an index.
Index figures do not take any expenses, fees or taxes into account, but mutual fund returns do. Before investing, an investor should carefully consider the investment objectives, risks, charges and expenses of the Fund and should carefully read the prospectus or summary prospectus, which contain this and other information. The prospectus or summary prospectus can be obtained on the Parnassus website, or by calling (800) 999-3505. As described in the Fund’s current prospectus dated May 1, 2014 (As Amended and Restated September 19, 2014), Parnassus Investments has contractually agreed to limit total operating expenses to 0.95% of net assets for the Fund.
This agreement will not be terminated prior to May 1, 2015, and may be continued indefinitely by the Adviser on a year-to-year basis. Seven companies each contributed 30¢ or more to the NAV during 2014. No company had a negative impact of 30¢ or more. The only stock that made a significant negative impact on the Fund was International Business Machines (IBM). That stock dropped 14.5% from $187.57 to $160.44 for a loss of 16¢ for each fund share.
The stock rose in early 2014, after the company announced its decision to divest its lower-margin server business, and it raised the dividend. The stock reversed its earlier gains in the fall, as demand for its software and consulting services declined. We originally became interested in this stock when we saw that Warren Buffett had a big position in his Berkshire-Hathaway portfolio. IBM’s performance shows that even great stockpickers can be wrong – at least during certain periods.
We’re holding onto the stock because we think it’s undervalued and there’s not much downside risk. We think the restructuring initiatives and the investment in new software and services will eventually move the stock higher. The stock that helped us the most was Allergan, a pharmaceutical company based in Irvine, California. The stock rose 91.4% from $111.08 to $212.59, increasing the Fund’s NAV by 70¢.
In April, Valeant, a rival pharmaceutical company, teamed up with activist investor, Bill Ackman, to make a hostile bid for Allergan. Valeant wanted to get control of Allergan’s blockbuster drug, Botox, as well as its prized eye-care products. After a drawn-out, highly-publicized battle in which 13 .
PARNASSUS FUNDS Annual Report • 2014 Allergan repeatedly rejected Valeant’s offers, Actavis, another pharmaceutical company, emerged as a white knight, making a cash and stock-offer valued at more than $219 per share. We view the Allergan-Actavis combination as a better outcome for Allergan and its employees. Whole Foods, the world’s largest retailer of organic foods, added 48¢ to the value of each fund share, even though the stock dropped 12.8% during the year from $57.83 to $50.42. At this point, you may be wondering what kind of magic we can work at Parnassus, if we can make money when a stock goes down, and we don’t do it by short-selling. Actually, there was no magic involved: we bought 700,000 shares during the third quarter, when the stock dropped to our average cost of $38.36, because of Parnassus Endeavor Fund as of December 31, 2014 negative investor sentiment.
Shares slumped because revenue growth (percentage of net assets) started to slow down, and investors were concerned about competition from retailing giants like Wal-Mart, Kroger and Costco. The stock jumped in November, after Whole Foods reported better-than-expected Fund Sector Weightings* S&P 500 Index earnings. As we indicated earlier in this report in our discussion of Ciena, investors have very short time-horizons, and they tend to sell first and ask questions later, if the least bit of bad news surfaces.
When we Consumer Discretionary 6.6% 12.1% saw the stock sink so rapidly from the $50’s to the $30’s, we knew it was Consumer Staples overdone. It was hard for us to believe that the people who shop at 9.7% 10.6% Whole Foods were going to make a sudden change and start shopping Energy 0.0% at Wal-Mart, even if Wal-Mart started carrying a few lines of organic 8.3% food. Fortunately, we were right and, in just a few months, Whole Utilities 0.0% Foods climbed an amazing 31.4% from our cost of $38.36 to $50.42 by 3.1% Financials year-end. 8.9% 16.3% Two of the Fund’s best performers were semiconductor-equipment stocks. Applied Materials added 47¢ to the NAV during the year, as its stock soared 40.9% from $17.69 to $24.92.
Consumer demand for better mobile devices with more features and longer battery life is driving large investments in new semiconductor-manufacturing equipment. In 2014, industry spending increased 25% and spending levels should increase with the transition to more advanced manufacturing technology. Lam Research was the other semiconductor-equipment company that did well for us. Its stock climbed 52.7% from our average cost of $51.96 to $79.34 for a contribution of 36¢ to each fund share.
The company had a strong start in 2014, as robust demand from semiconductor foundries and memory-chip makers drove earnings higher. Lam benefits from the same trends as Applied Materials, with strong demand for equipment to make increasingly sophisticated semiconductors. Health Care 11.3% 14.0% Industrials 9.7% 10.4% Materials 0.0% 3.2% Information Technology 42.2% 19.8% Telecom Services 0.0% 2.2% Short-term Investments, Other Assets & Liabilities 11.6% 0.0% 0 10 20 30 40 50 * For purposes of categorizing securities for diversification requirements under the Investment Company Act, the Fund uses industry classifications that are more specific than those used for the chart. C.H. Robinson Worldwide, a logistics company with an emphasis on serving as a broker between shippers and truckers, added 42¢ to the NAV, as its stock rose 28.4% from $58.34 to $74.89. From 2010 through 2013, profits were squeezed, because truckers would not lower their rates and shippers would not pay higher prices, so the falling stock price reflected that squeeze.
We invested in Robinson, because we thought that demand would eventually outstrip carrier supply, and the company would be able to raise prices to shippers. As the economy has improved, freight volumes have increased, Robinson can get higher margins and the stock price has moved higher. Riverbed Technology makes software used in optimizing wide-area networks, which speed the flow of information within an organization from site-to-remote-site. We started buying the stock in 2012 and 2013 at an average cost of $15.57 a share.
On November 8, 2013, Elliott Management, an activist investment firm, announced that it owned a 9% stake in Riverbed. The stock immediately shot up to $17.54 from $15.11 the previous day, then climbed to $19.04 on November 13. In the Parnassus quarterly report of March 31, 2014, I described the battle between Riverbed and Elliott, with Elliott trying to get the company sold at $25 a share to another firm, and Riverbed resisting any takeover.
Finally, Elliott made an offer of $21 a share, but Riverbed would not budge. I tried unsuccessfully to set up a meeting with Riverbed’s President, Jerry Kennelly, to urge him to consider outside offers. I considered the company undervalued, but thought that Kennelly’s poor management would keep the company undervalued indefinitely.
By June of 2014, we had sold all of our shares at an average price of $20.25. In the end, we 14 . PARNASSUS FUNDS Annual Report • 2014 Top 10 Holdings (percentage of net assets) Value on December 31, 2014 of $10,000 invested on April 29, 2005 Google Inc., Class A 5.2% Allergan Inc. 5.0% Ciena Corp. 4.9% Whole Foods Market Inc. 4.8% 4.6% Target Corp. 4.4% Riverbed Technology Inc. 4.2% 15,000 International Business Machines Corp. 4.2% 10,000 C.H. Robinson Worldwide Inc. 3.9% Applied Materials Inc. 3.9% Lipper Multi-Cap Core Average $21,447 25,000 QUALCOMM Inc. S&P 500 Index $21,820 Parnassus Endeavor Fund $30,087 30,000 Portfolio characteristics and holdings are subject to change periodically. 35,000 20,000 5,000 4/29/2005 2005 2006 2007 2008 2009 2010 2011 2012 2013 2014 The chart shows the growth in value of a hypothetical $10,000 investment since inception (April 29, 2005) and does not reflect the deduction of taxes a shareholder would pay on fund distributions or the redemption of fund shares. did very well on the stock. With an average cost of $15.57 per share and a sale price of $20.25, we had a 30% gain in the stock and profits of $6.5 million for the Parnassus Endeavor Fund. By October of 2014, other investors started to sell, and Riverbed’s stock dropped below $18 a share. I knew at that point it was quite undervalued, and Elliott had already made an offer of $21 a share.
The Fund purchased 1.6 million shares at an average cost of $17.79. It now looks as if Riverbed will be sold for $21 a share. The stock closed at $20.41 a share at year-end, so it’s gone up 14.7% since our most recent purchase.
Considering all our transactions in Riverbed’s stock for the year, the Fund has increased the value of the NAV by 37¢. Target, the Minneapolis-based discount-retailer, climbed 20.0% from $63.27 to $75.91 for a gain of 37¢ for each fund share. The stock price dipped into the $50’s early in the year, after a series of negative events including a hacker attack on the company’s customer credit card information, poor results from an expansion into Canada and the dismissal of chief executive officer Greg Steinhafel. We took advantage of the drop in the stock price to increase our position from 150,000 shares to 450,000 shares. The share price began to recover in August, after the board hired Brian Cornell, the respected former head of Pepsi’s Americas business, as the new chief executive officer.
The stock moved even higher in November, when management reported improved sales and profitability in the United States and stabilization in Canada. Yours truly, Jerome L. Dodson Portfolio Manager 15 . PARNASSUS FUNDS Annual Report • 2014 PARNASSUS MID CAP FUND Ticker: PARMX As of December 31, 2014, the NAV of the Parnassus Mid Cap Fund was $27.40, so after taking dividends into account, the total return for 2014 was 11.24%. This compares to 13.22% for the Russell Midcap Index (“Russell”) and 9.98% for the Lipper Multi-Cap Core Average, which represents the average multi-cap core fund followed by Lipper (“Lipper average”). For the quarter, the Fund was up 6.89%, ahead of the Russell’s 5.94% return and the Lipper average’s 4.38% gain. Below is a table comparing the Parnassus Mid Cap Fund with the Russell and the Lipper average for the one-, three- and fiveyear periods and for the period since inception on April 29, 2005. On page 18 is a graph showing the growth of a hypothetical $10,000 investment in the Fund since inception. 2014 Review The Russell jumped 13.22% in 2014, extending a rally that has driven mid-cap stocks up 268.7% since their low point in March of 2009.
Improving economic growth and better job creation in the U.S. pushed stocks higher throughout the year. Despite political, sectarian and economic troubles around the globe, a crash in oil prices and the end of the Federal Reserve’s bond-buying program, stocks closed at an all-time high. The Fund gained 11.24% for the year, beating the Lipper average’s 9.98% return but falling short of the Russell’s 13.22% jump. It’s never fun to trail the market, but we’re glad that we beat our Lipper peer-group so handily.
Our most positive allocation effect came from having a large exposure to one of the Russell’s best-performing Parnassus Mid Cap Fund sectors, healthcare. This contributed 53 basis Average Annual points (a basis point is 1/100th of 1%) to our Total Returns (%) Since Gross Net relative performance. On the flip-side, industrials One Three Five Inception on Expense Expense underperformed the Russell this year, so our for periods ended Year Years Years 4/29/05 Ratio Ratio December 31, 2014 overweight position in that group relative to the index hurt the Fund by 51 basis points.
Our slight Parnassus Mid Cap overweight position in energy, the Russell’s worst11.24 19.16 15.72 9.62 1.14 1.14 Fund performing sector, impacted the Fund by 47 basis points. Russell Midcap Index Lipper Multi-Cap Core Average 13.22 21.40 17.19 10.29 NA NA 9.98 19.22 13.90 7.97 NA NA Performance data quoted represent past performance and are no guarantee of future returns. Current performance may be lower or higher than the performance data quoted. Current performance information to the most recent month-end is available on the Parnassus website (www.parnassus.com). Investment return and principal value will fluctuate so that an investor’s shares, when redeemed, may be worth more or less than their original principal cost. Returns shown in the table do not reflect the deduction of taxes a shareholder may pay on fund distributions or redemption of shares.
The Russell Midcap Index is an unmanaged index of common stocks, and it is not possible to invest directly in an index. Index figures do not take any expenses, fees or taxes into account, but mutual fund returns do. Mid-cap companies can be more sensitive to changing economic conditions and have fewer financial resources than large-cap companies. Before investing, an investor should carefully consider the investment objectives, risks, charges Poor stock picks in the utility, industrial and energy sectors hurt us the most this year.
Our worst performer was MRC Global, the largest global distributor of pipes, valves and fittings to oil and gas companies. The stock plummeted 35.9% from $32.26 to $20.67, where we sold it, taking 21¢ from each fund share. The stock fell early in the year, after its midstream customers experienced project delays and subsequently cut spending on MRC’s products.
Although demand from these customers eventually improved, the stock continued to fall as investors worried that sinking oil prices would hurt demand by larger upstream customers. We sold our position, because we believed that MRC’s earnings would go down dramatically as a result of lower oil prices. The stock ended the year at $15.15, 26.7% below where we sold it. and expenses of the Fund and should carefully read the prospectus or summary prospectus, which contain this and other information.
The prospectus or summary prospectus can be obtained on the Parnassus website, or by calling (800) 999-3505. 16 MDU Resources slid 19.7% from $30.55 to $23.50, reducing the NAV by 20¢. The stock rallied in early 2014, after management reported . PARNASSUS FUNDS Annual Report • 2014 solid results in its construction and utility segments. However, the shares fell in the summer, after the company’s exploration and production (E&P) segment, fell short of expectations. Investor confidence eroded further in late 2014 as oil prices collapsed by 45%, from $99 to $53 per barrel, to a five-year low. MDU is currently exploring the divestiture of its capital intensive E&P business.
While the timing is not great with oil prices so cheap, we believe that the company is taking the right steps to create shareholder value. We also expect its construction and utilities segments to grow well over the long-term, because of a substantial project backlog and a growing utility customer base. Pentair, a diversified industrial company that sells pumps, filters, valves and water-related infrastructure products, dropped 14.5% from $77.67 to $66.42 for a loss of 12¢ per fund share. The stock fell in early 2014, after the company reported lower sales due to sluggish demand from energy and mining customers.
The shares fell further toward year-end, because about 20% of Pentair’s sales are from oil and gas customers, and investors worried that lower oil prices would hurt Pentair’s earnings. We believe investors overreacted, since only about 5% of its oil and gas exposure is tied to developing new wells, and a meaningful portion of its oil and gas revenue relates to selling maintenance and repair parts, a segment that is less impacted by low oil prices. We took advantage of the stock weakness to add to our position, since we believe that the company has good growth prospects, particularly in its industrial, residential and commercial segments, and plenty of marginexpansion opportunities. We had quite a few stocks with big gains this year, and our three largest contributors added at least 30¢ each to the NAV.
The Fund’s biggest winner was Allergan, a pharmaceutical company based in Irvine, California. The stock climbed an amazing 91.4% from $111.08 to $212.59, increasing the NAV by 55¢. In April, Valeant, a rival pharmaceutical company, teamed up with activist investor Bill Ackman to make a hostile bid for Allergan.
Valeant sought control of Allergan’s blockbuster drug, Botox, as well as its prized eye-care products. In December, after a lengthy battle in which Allergan repeatedly rejected Valeant’s offers, pharmaceutical company Actavis emerged as a white knight, offering $219 per share for Allergan. We began selling our position in late December, since we do not expect a higher offer to emerge. Iron Mountain, the nation’s largest document storage company, climbed 27.4% from $30.35 to $38.66, adding 38¢ to the NAV.
In early 2014, the stock was essentially flat, as strong international sales growth was offset by tepid storage demand in the U.S. The big event of the year was the announcement that the IRS had approved Iron Mountain to become a REIT. The stock surged on the news, since REITs receive favorable tax treatment in exchange for agreeing to distribute at least 90% of taxable income to investors.
Investor sentiment moved even higher in late 2014, as the company’s core storage rental business rebounded. We believe the company’s earnings prospects are bright, driven by its durable business model with high switching costs and long-term contracts, and a multi-year runway for global growth as its enterprise customers expand internationally. Parnassus Mid Cap Fund as of December 31, 2014 (percentage of net assets) Fund Sector Weightings Russell Midcap Index Consumer Discretionary 4.8% 18.1% Consumer Staples 5.8% 5.8% Energy 5.8% 4.7% Utilities 8.8% 5.7% Financials 12.8% 21.1% Health Care 13.3% 11.4% Industrials 24.8% 12.3% Materials 2.7% 5.6% Information Technology 15.8% 14.5% Telecom Services 0.0% 0.8% Short-term Investments, Other Assets & Liabilities 0 5 10 15 20 5.4% 0.0% 25 30 Top 10 Holdings (percentage of net assets) 4.0% First Horizon National Corp. 3.8% Pentair PLC 3.7% Xylem Inc. 3.6% Iron Mountain Inc. 3.6% SEI Investments Co. 3.3% Applied Materials Inc. 3.3% MDU Resources Group Inc. 3.2% Questar Corp. 3.1% Genesee & Wyoming Inc., Class A Applied Materials, a leading maker of semiconductor manufacturing equipment, saw its stock jump 40.9% from $17.69 to $24.92, for an increase of 33¢ to the NAV. Applied had another great start in 2014, as demand accelerated for its capital equipment by semiconductor Motorola Solutions Inc. 3.0% Portfolio characteristics and holdings are subject to change periodically. 17 .
PARNASSUS FUNDS Annual Report • 2014 customers such as Intel and Samsung. Investor sentiment cooled in the summer, after the company announced that approval for its merger with Tokyo Electron would slip into 2015 due to regulatory delays in China. The stock jumped in late 2014, as investors began to anticipate even greater demand for Applied’s equipment, as chipmakers build more complex chips to power feature-rich mobile devices. We’re hopeful that the merger with Tokyo Electron will close in 2015, and we believe the combined entity will be wellpositioned to benefit from significant cost synergies and cross-selling opportunities. Value on December 31, 2014 of $10,000 invested on April 29, 2005 30,000 Parnassus Mid Cap Fund $24,294 Russell Midcap Index $25,811 Lipper Multi-Cap Core Average $21,447 25,000 20,000 15,000 10,000 5,000 Outlook and Strategy 4/29/2005 2005 2006 2007 2008 2009 2010 2011 2012 2013 2014 U.S.
mid-cap stocks have returned over 17% on an The chart shows the growth in value of a hypothetical $10,000 investment since inception annualized basis over the last five years, and there (April 29, 2005) and does not reflect the deduction of taxes a shareholder would pay on fund are plenty of good arguments why the rally will distributions or the redemption of fund shares. continue: the U.S. economy is growing quickly, job creation is improving, energy is cheap and inflation is low. Analyst consensus is that the Russell will grow earnings by a double digit percentage rate in each of the next three years. We’re not sure if the pundits’ predictions will hold, because we’re more focused on what individual companies will do over three-year periods.
We’re more confident that it will be hard to keep up the performance of the past few years, because stocks are relatively expensive, trading close to 20 times earnings, which is just shy of a ten-year high. We also think that volatility is likely, because the Fed is turning away from its accommodating monetary policy, and most investors tend to flinch when political and economic issues abroad flare-up. The good news is that quick market moves create opportunities for us to buy or sell stocks that have gotten too cheap or too expensive. Toward the end of the year, we increased our position in Tennessee-based bank, First Horizon National Corporation. We started buying the stock at a low price back in 2011, after the company botched its expansion into the national-lending market, and a new management team recommitted the bank to its profitable, core Tennessee franchise.
We especially like the stock here, because the bank has a transparent balance sheet, is well-capitalized and management is close to settling the last of a series of legal issues related to its national lending platform. Loan growth is also good, and given the bank’s low-cost borrowing base and variable-rate mortgage assets, earnings and equity returns should rise if interest rates increase. Finally, the stock trades at a discount to its peers. We initiated a position last quarter in Genesee & Wyoming, a leading operator of short-line railroads mainly in the U.S., Canada and Australia.
Genesee has carved out a wide competitive moat by owning difficult-to-replicate, strategically-placed assets that offer cost advantages over trucking and pricing power over clients. We bought the stock, after management reported weaker earnings due to sluggish demand from Australian mining customers, and investors became concerned that cheap oil would draw customers to trucking options. We viewed this as a fantastic opportunity to buy a durable franchise with continued relevance, predictable free cash flow and reasonable valuation. As oil prices collapsed toward the end of the year, driven by the surge in oil production in North America and OPEC’s decision not to curb its own production, we added capital to existing energy holdings Energen and Cameron and conglomerate MDU.
While we don’t know when oil prices will recover, we think they will go up over our three-year investment horizon, and we believe that these companies, with their unique assets, will do very well. At year’s end, the biggest concentrations in the portfolio were in the industrials, information technology and health care sectors. Relative to the Russell, the portfolio has fewer holdings in the highly cyclical consumer discretionary, financials and materials sectors. 18 . Annual Report • 2014 PARNASSUS FUNDS We strive to outperform our indices over the long-term by capturing the majority of the Russell’s upside in bull markets and losing a lot less than the market and our peers in bear markets. We remain committed to doing this by investing in wellpriced businesses with increasing relevance, material and sustainable competitive advantages and properly incentivized managers. Thank you for your investment. Yours truly, Matthew D. Gershuny Lead Portfolio Manager Lori A. Keith Portfolio Manager 19 .
PARNASSUS FUNDS Annual Report • 2014 PARNASSUS SMALL CAP FUND Ticker: PARSX As of December 31, 2014, the NAV of the Parnassus Small Cap Fund was $23.77, so after taking dividends into account, the total return for the year was 0.98%. This compares to a return of 4.89% for the Russell 2000 Index (“Russell 2000”) of smaller companies and 3.85% for the Lipper Small-Cap Core Average, which represents the average return of the small-cap core funds followed by Lipper (“Lipper average”). The Fund underperformed both benchmarks for the full year. Below is a table comparing the Parnassus Small Cap Fund with the Russell 2000 and the Lipper average over the past one-, three- and five-year periods ended December 31, 2014 and the period since inception on April 30, 2005. Although our more recent performance has been disappointing, we remain ahead of the Russell 2000 and Lipper average since inception.
On page 22 is a graph showing the growth of a hypothetical $10,000 investment in the Fund since inception. Company Analysis By far, our worst performers last year were two energy companies, which each cost the Fund 89¢ or more. The one that hurt us the most was Energy XXI, an oil and gas producer in the Gulf of Mexico, which plunged 58.7% from our average cost of $18.27 to $7.55, where we sold our shares, slashing $1.70 from each fund share. The stock initially dropped in the summer, after the company experienced a production Parnassus Small Cap Fund shortfall and failed to deliver the expected operational synergies from its acquisition of EPL Average Annual Since Oil & Gas.
We held our stock, because we Total Returns (%) Gross Net One Three Five Inception Expense Expense expected it to recover, once the company Year Years Years on for periods ended Ratio Ratio improved its execution and began to pay down its 4/29/05 December 31, 2014 significant acquisition debt. However, during the fourth quarter, crude oil plunged from $95 to $53 Parnassus Small Cap Fund 0.98 15.34 12.82 9.46 1.20 1.20 per barrel, sparking a significant sell-off in the stock. We exited our position because we were Russell 2000 Index 4.89 19.21 15.55 9.31 NA NA concerned about the company’s ability to service its debt. Lipper Small-Cap Core Average 3.85 17.62 14.40 8.88 NA NA Performance data quoted represent past performance and are no guarantee of future returns. Current performance may be lower or higher than the performance data quoted.
Current performance information to the most recent month-end is available on the Parnassus website (www.parnassus.com). Investment return and principal value will fluctuate so that an investor’s shares, when redeemed, may be worth more or less than their original principal cost. Returns shown in the table do not reflect the deduction of taxes a shareholder may pay on fund distributions or redemption of shares. The Russell 2000 Index is an unmanaged index of common stocks, and it is not possible to invest directly in an index.
Index figures do not take any expenses, fees or taxes into account, but mutual fund returns do. Small-cap companies can be particularly sensitive to changing economic conditions and have fewer financial resources than large-cap companies. Before investing, an investor should carefully consider the investment objectives, risks, charges and expenses of the Fund and should carefully read the prospectus or summary prospectus, which contain this and other information. The prospectus or summary prospectus can be obtained on the Parnassus website, or by calling (800) 999-3505.
As described in the Fund’s current prospectus dated May 1, 2014 (As Amended and Restated September 19, 2014), Parnassus Investments has contractually agreed to limit the total operating expenses to 1.20% of net assets of the Fund. This agreement will not be terminated prior to May 1, 2015, and may be continued indefinitely by the Adviser on a year-to year basis. 20 MRC Global, the largest distributor of valves to the U.S. energy sector, sank 53.0%, from $32.26 to $15.15, slashing 89¢ from the NAV.
In early 2014, the stock fell after its midstream customers experienced project delays that curtailed spending on MRC’s valves and fittings. Later in the year, the stock collapsed with the crude oil price decline because its upstream customers, which represent 44% of revenue, are expected to significantly pull back on drilling. Although we don’t know when customers will resume drilling, we have high conviction that United States shale is a low-cost source of energy, and the country will become more energy independent over time. Three stocks contributed 35¢ or more to the NAV, all of which benefited from increased consumer spending.
Dominion Diamond, a Canadian diamond miner, jumped 25.1%, from $14.36 to $17.96, for a gain of 41¢ for each fund share. The management team is running a very tight ship, with production exceeding guidance every quarter last year. Additionally, over the last two months, the company initiated the permitting process for its new Jay mine, freed up cash by convincing the .
Annual Report • 2014 PARNASSUS FUNDS local government to let it use an insurance product to cover its reclamation bond liability, and its joint-venture partner, Rio Tinto, announced they will develop a new, profitable diamond reserve called A-21. Finally, management indicated it will likely initiate a dividend in 2015, which should attract new, income-oriented investors. Group 1 Automotive, the third largest automobile retailer in the United States, soared 36.4%, from our average purchase price of $65.72 to $89.62, increasing the NAV by 36¢. The company sells over 250,000 cars annually across 33 brands through 116 dealerships primarily in the Southern United States, as well as 17 dealerships in England and 20 dealerships in Brazil. The company’s United States and its United Kingdom businesses exceeded expectations, while its struggling Brazilian business finally showed signs of improvement.
We are holding our stock, because new car sales continue to increase. In August, the United States market exceeded 17 million in annual sales of new automobiles for the first time since 2006. The growing number of recently sold cars will lead to high-margin warranty and service revenue for years to come. Parnassus Small Cap Fund as of December 31, 2014 (percentage of net assets) Sector Weightings Fund Russell 2000 Index Consumer Discretionary 16.3% 14.0% Consumer Staples 0.0% 3.8% Energy 6.4% 3.7% Utilities 6.6% 3.7% VCA, the largest veterinary clinic and animal diagnostic-testing company in the country, rose 55.5%, from $31.36 to $48.77, contributing 35¢ to each fund share.
Revenue growth accelerated throughout the year, as consumers are once again spending on pet health, after pausing during the recession. Management also impressed shareholders with a large share buyback. We trimmed our position as the stock rose, but we continue to have a small holding because we expect the company to benefit from the long-term tailwind of rising pet spending. Outlook and Strategy Financials 16.1% 23.7% Health Care 7.6% 15.3% Industrials 24.6% 12.9% Materials 9.8% 4.2% Information Technology 12.3% 17.8% Telecom Services 0.0% 0.9% The United States economy continues to improve.
GDP growth increased 0.3% to 5.0% in the third quarter, up from 4.6% in the second quarter, the 0.0% fastest growth rate since 2003. Unemployment fell to 5.6% in December, 0 5 10 15 20 25 30 which is quickly approaching the level economists view as full employment. During the fourth quarter, the price of oil declined from $95 per barrel to $53 per barrel.
Although this dramatic decline hurt our energy investments, it provides a further stimulus to the economy because transportation costs for individuals, as well as goods, will decline. Short-term Investments, Other Assets & Liabilities We did take advantage of the significant decline of small-cap oil stocks to upgrade the quality of our holdings. We sold our Energy XXI position and redeployed capital into W&T Offshore and Denbury Resources. Like Energy XXI, W&T Offshore also participates in the Gulf of Mexico, but it has lower financial leverage and a CEO who owns a significant stake in the company, which directly aligns our interests.
Denbury Resources, on the other hand, has a competitively-advantaged business model that should allow it to earn excess returns over time. The company owns a one-of-a-kind, naturally occurring carbon-dioxide reserve that it injects into abandoned oil wells in order to extract additional oil. Given the predictability of its business, the company recently increased its dividend by 60%. In my first quarter 2014 report, I wrote that only one of three stock price drivers (revenue growth) remained strong, while the other two (multiple expansion and profit margin expansion) were likely near peaks.
My outlook has proven accurate. The forward price-to-earnings multiple for the Russell 2000 remains near a ten-year high at 22, but did not increase during the year. Profit margins also remain near a record high, and also did not increase in 2014.
Ultimately, this translated into the Russell 2000 only increasing 5% in 2014, about the same rate as revenue growth. My outlook remains the same for 2015. I expect the U.S. economy will continue to improve, which should fuel further revenue growth, but I suspect valuation multiples and profit margins will not move meaningfully higher.
The real risk, which no one can predict, is when there will be an unexpected shock to the system, and what that shock will be. When a shock inevitably occurs, valuation multiples will contract and, if the shock is prolonged, revenue growth will slow and profit margins will contract. If this triple-whammy occurs, stock prices will decline significantly.
It’s impossible to construct a 21 . PARNASSUS FUNDS Annual Report • 2014 Top 10 Holdings (percentage of net assets) Value on December 31, 2014 of $10,000 invested on April 29, 2005 Dominion Diamond Corp. 6.6% Checkpoint Systems Inc. 5.3% UTi Worldwide Inc. 5.2% Air Lease Corp. W&T Offshore Inc. 4.5% Group 1 Automotive Inc. 4.4% Essent Group Ltd. 4.2% Sotheby’s 4.1% Lipper Small-Cap Core Average $23,051 4.2% Blount International Inc. Russell 2000 Index $23,673 4.4% MRC Global Inc. Parnassus Small Cap Fund $23,971 4.5% Portfolio characteristics and holdings are subject to change periodically. 30,000 25,000 20,000 15,000 10,000 5,000 4/29/2005 2005 2006 2007 2008 2009 2010 2011 2012 2013 2014 The chart shows the growth in value of a hypothetical $10,000 investment since inception (April 29, 2005) and does not reflect the deduction of taxes a shareholder would pay on fund distributions or the redemption of fund shares. portfolio of stocks that are immune to this decline; the best we can do is invest in competitively advantaged businesses, which will survive the initial shock, and then can take advantage of the challenging period to improve their competitive position. Thank you for your investment, Ryan Wilsey Portfolio Manager 22 . Annual Report • 2014 PARNASSUS FUNDS PARNASSUS ASIA FUND Ticker: PAFSX As of December 31, 2014, the NAV of the Parnassus Asia Fund was $16.72, so after taking dividends into account, the Fund was up 7.84% for the year. This compares to a gain of 0.39% for the MSCI AC Asia Pacific Index (“MSCI Index”) and 0.60% for the Lipper Asia Pacific Region Average, which represents the average return of the Asia Pacific Region funds followed by Lipper (“Lipper average”). Below, you will find a table comparing the Parnassus Asia Fund with the MSCI Index and the Lipper average for one year period and for the period since inception on April 30, 2013. On page 26 is a graph showing the growth of a hypothetical $10,000 investment in the Fund since inception. As you can see, the Fund is substantially ahead of both benchmarks for both time periods.
For the one-year period, the Fund is more than seven percentage points ahead of both benchmarks, and our performance makes us the seventh-best performing fund out of the 58 Asia Pacific funds followed by Lipper. For the period since inception, the Fund is #1 out of the 57 funds followed by Lipper. Company Analysis Despite the Asia Fund’s good performance, there were five companies that each accounted for losses of 10¢ or more to the value of each fund share. Although the weak Asian economies provided a backdrop for the poor performance of these stocks, there were company-specific reasons for the Parnassus Asia Fund decline of each issue. Average Annual Total Returns (%) One Year Since Inception on 4/30/13 Gross Expense Ratio Net Expense Ratio Parnassus Asia Fund 7.84 7.41 5.08 1.25 MSCI AC Asia Pacific Index 0.39 1.18 NA NA Lipper Asia Pacific Region Average 0.60 -0.54 NA NA for periods ended December 31, 2014 Performance data quoted represent past performance and are no guarantee of future returns. Current performance may be lower or higher than the performance data quoted.
Current performance information to the most recent month-end is available on the Parnassus website (www.parnassus.com). Investment return and principal value will fluctuate so that an investor’s shares, when redeemed, may be worth more or less than their original principal cost. Returns shown in the table do not reflect the deduction of taxes a shareholder may pay on fund distributions or redemption of shares. The MSCI AC Asia Pacific Index is an unmanaged index of Asian stock markets, and it is not possible to invest directly in an index.
Index figures do not take any expenses, fees or taxes into account, but mutual fund returns do. This fund invests primarily in non-U.S. securities. Foreign markets can be more volatile than the U.S.
market due to increased risks of adverse issuer, political, regulatory, market or economic developments and can perform differently from the U.S. market. Before investing, an investor should carefully consider the investment objectives, risks, charges and expenses of the Fund and should carefully read the prospectus or summary prospectus, which contain this and other information. The prospectus or summary prospectus can be obtained on the Parnassus website, or by calling (800) 999-3505.
As described in the Fund’s current prospectus dated May 1, 2014, (As Amended and Restated September 19, 2014), Parnassus Investments has contractually agreed to limit the total operating expenses to 1.25% of net assets for the Fund. This agreement will not be terminated prior to May 1, 2015, and may be continued indefinitely by the Adviser on a year-to-year basis. The most disappointing was Biostime International Holdings, a Chinese distributor of foreign-made infant formula, whose shares dropped 62.7% from $8.93 to $3.33 where we sold it for a loss of 20¢ for each fund share. We had high hopes for this company, since it distributes high-quality infant formula in a country where quality is not always the best. Biostime announced that it was abandoning its model of selling through retail stores in favor of pursuing higher growth through an e-commerce website.
This strategic shift actually eroded the company’s competitive advantage, since margins are lower due to more intense competition in the e-commerce channel. Customer loyalty was also challenged by the move, since professional advice given in the stores was part of the special shopping experience. Also, the “baby boom” that many predicted would follow last year’s relaxation of China’s one-child policy failed to materialize. Keppel Corporation is a diversified conglomerate based in Singapore with interests in offshoreengineering, as well as property and infrastructure development.
The stock dropped 25.0% from $8.88 to $6.67, cutting 15¢ off the NAV. Keppel makes high-quality equipment for offshore oil and gas exploration and production, and when energy prices started to fall late last year, Keppel’s stock fell as well. The company, though, is well diversified and has many interests other than oil and gas equipment, and orders still look good for the company, so we’re hopeful that the stock will rebound. 23 .
PARNASSUS FUNDS Annual Report • 2014 St. Shine Optical sliced 14¢ off the Fund’s NAV, as its stock sank 25.9% from our cost of $21.98 to $16.28. This Taiwanese maker of contact lenses provides contract-manufacturing services for local and international brands. Japan is the company’s most important international market, and growth slowed down as customers hesitated to launch new products given cost pressures from the weaker yen and the uncertainty in the Japanese economy.
The company’s smaller, but higher margin branded business in Taiwan also declined significantly in the latter half of the year, as new entrants to the Taiwanese market tried to increase market share through aggressive pricing. OSIM International, a Singapore-based retailer of healthy lifestyle products, took 11¢ off the NAV, as its stock dropped 18.4% from $1.82 to $1.49. The company makes and markets a range of consumer and household products including massage chairs, fitness and diagnostic equipment, vitamins, supplements and tea. Weak sales in the core massage chair business in China caused profits to drop 28% in the third quarter.
OSIM also had significant costs in connection with its recent acquisition of a high-end branded tea business. Margins, however, are steady at the firm, and the company is buying back stock. Parnassus Asia Fund as of December 31, 2014 (percentage of net assets) Fund Sector Weightings* MSCI AC Asia Pacific Index Consumer Discretionary 14.9% 13.1% Consumer Staples 21Vianet’s stock took 11¢ off the NAV, as it dropped 19.4% from $23.52 to $18.96 where we sold it. The company is one of the largest providers of data centers in China with 80 centers in 40 cities across the country.
On September 10, a short-seller issued a report accusing the company of fraud in its accounting statements. The company tried to defend itself, but the short-seller followed up with another report reiterating its charges. Since we were uncertain of the facts and were concerned about shareholder lawsuits and possible delisting, we sold our shares. 5.2% 6.2% Energy 0.0% 3.4% Utilities 2.0% 3.2% Financials 10.8% 30.5% Health Care 5.7% 4.1% Industrials 13.1% 12.5% Materials Fortunately, the winners had more impact on the Parnassus Asia Fund than did the losers.
Semiconductor-equipment manufacturer Applied Materials, with operations in both Silicon Valley and Tokyo, contributed 24¢ to the NAV, as its stock soared 40.9% from $17.69 to $24.92. Consumer demand for better mobile devices with more features and longer battery life is driving large investments in new semiconductor-manufacturing equipment. In 2014, industry spending increased 25% and spending levels should increase with the transition to more advanced manufacturing technology. 0.0% 6.9% Information Technology 35.3% 14.6% Telecom Services 8.0% 5.5% Short-term Investments, Other Assets & Liabilities 5.0% 0.0% 0 10 20 30 40 * For purposes of categorizing securities for diversification requirements Bank Rakyat of Indonesia saw its stock soar 56.9% from 60¢ to 94¢, under the Investment Company Act, the Fund uses industry while adding 21¢ to the NAV.
The bank exceeded expectations with classifications that are more specific than those used for the chart. strong growth in income, and increased its dividend payout ratio to 30%, the highest among its peers. We like the bank, because it has been consistently among the most profitable banks in the country for the last decade, and we like its social role as a microfinance lender to small businesses, where it has made a third of its total loans. Hermes Microvision, a Taiwan-based maker of semiconductor-manufacturing equipment, increased the value of each fund share by 21¢, as its stock price rocketed up 53.6% from $32.49 to $49.89. Hermes develops and markets electron beam inspection tools for semiconductor-manufacturers for use in testing for defects in silicon wafers.
Strong order flow moved the stock higher. More complex semiconductor-manufacturing processes and more exacting specifications will mean more chipmakers should shift away from older optical-inspection technology in favor of Hermes’ more advanced products. Sino-Thai Engineering, a leading engineering and construction company in Thailand, added 16¢ to the NAV, as its stock increased from our cost of 39¢ to 58¢, where we sold it for an increase of 48.7%. The company manages industrial projects for private firms and infrastructure products for the government including Bangkok’s subway and Skytrain.
The stock was very volatile last year, because of the military coup in Thailand and its sensitivity to government-related business, but the stock moved higher after Thailand’s army chief announced a commitment to push through long-stalled infrastructure projects. Although Sino-Thai is a well-run business, we decided to sell the stock because of political uncertainty in Thailand. 24 . Annual Report • 2014 Novatek Microelectronics lifted the value of each fund share by 14¢, as its stock surged 36.2% from $4.09 to $5.57. Based in Hsinchu, Taiwan’s version of Silicon Valley, Novatek is the world’s largest supplier of display-driver integrated circuits and Taiwan’s second-largest fabless semiconductor company. The company supplies chips that power such devices as television displays, notebook monitors, smartphones and settop boxes. This focus on growth helps Novatek maintain high margins and strong earnings, and its R&D efforts are focused on next-generation products to maintain that growth. PARNASSUS FUNDS Parnassus Asia Fund as of December 31, 2014 (percentage of net assets) Portfolio Composition by Country Fund (percentage of net assets) China 12.1% Hong Kong Hong Kong-based SITC International Holdings added 12¢ to the NAV, as its stock rose 17.0% from 47¢ where we bought it during the year to 55¢ at year’s end.
This shipping and logistics company has 47 service routes connecting 45 major ports across ten countries in Asia. Its logistics operations are strategically diversified between sea and land, helping to dampen exposure to swings in any one country’s business cycle, a business model that proved resilient in the latter half of the year. Despite the slower pace of the Chinese economy, SITC launched new vessels and opened new service routes to other parts of Asia, lifting volume, revenue and profits. 15.0% Indonesia 7.7% Japan 18.0% Philippines 2.0% Singapore 6.9% South Korea 3.9% Taiwan 22.4% Taiwan Semiconductor Manufacturing Company (TSMC) increased the value of each fund share by 12¢, as its stock climbed 28.3% from $17.44 to $22.38. Founded in 1987, TSMC was the world’s first independent foundry and is still the largest, producing a variety of semiconductors based on designs developed by its customers, primarily fabless chipmakers.
Investors pushed the stock higher in recognition of the ever-increasing demand for more complex semiconductors. Outlook and Strategy As we said earlier in this section, the Parnassus Asia Fund gained 7.84% in 2014, compared to 0.39% for the MSCI Index, so we were more than seven percentage points ahead of our benchmark, which is an enormous margin. We also pointed out that we were the best-performing of the 57 Asia Pacific funds followed by Lipper for the period since our inception on April 30, 2013. In last year’s annual report, we discussed our excellent returns in 2013, pointing out that we couldn’t brag too much about our performance, because the portfolio had a big cash position for a substantial period of time, when the Asian markets moved sharply lower, so we looked good on a relative basis. Thailand 7.0% 0 5 10 15 20 25 30 Parnassus considers companies that do a substantial amount of business in Asia to be Asian Companies. Top 10 Holdings (percentage of net assets) 4.0% Samsung Electronics Co., Ltd. 3.9% Applied Materials Inc. 3.8% QUALCOMM Inc. 3.6% Keppel Corp., Ltd. 3.6% Lenovo Group Ltd. 3.5% KDDI Corp. In 2014, though, we were almost fully invested for almost all of the year, so cash was not a factor.
As shareholders in the Parnassus Asia Fund, you may be asking yourselves, “were these guys skillful or lucky in 2014?” The answer? We were both. Taiwan Semiconductor Manufacturing Co., Ltd. (ADR) 3.4% Linear Technology Corp. 3.1% Air Lease Corp. 3.0% SITC International Holdings Co., Ltd. 2.9% Portfolio characteristics and holdings are First, let’s turn to the lucky part. Japan accounts for 39% of the MSCI subject to change periodically. Index, because it has most of the large, publicly-traded companies in the region.
While China has a bigger economy, most of its large enterprises are state-owned, so they are not publicly traded and don’t have any market capitalizations like the large Japanese companies. The Japanese market was up 9.8% last year, but the Japanese yen fell 12% against the dollar, so in dollar terms, the Japanese market lost 3.7%. (The return of the MSCI Index is quoted in dollars.) While Japan has a 40% weighting in the MSCI Index, Japanese companies comprise only 18% of the Parnassus Asia Fund, so being underweight in Japan helped the Fund.
At the beginning of the year, we had no idea that the Japanese market would do poorly in dollar terms, so the fact that we were underweight was definitely a stroke of luck. 25 . PARNASSUS FUNDS Annual Report • 2014 There was, however, some skill involved as well. The Japanese stocks in the Parnassus Asia Fund portfolio actually moved higher in dollar terms, going up 2.3% and adding 5¢ to the NAV. We do deserve credit for our skill in picking good Japanese companies. There were, however, two other pieces of luck that helped us. The two other countries that have substantial weighting in the MSCI Index are Australia with 14% and South Korea with 8%. In dollar terms, the Australian stock market dropped 3% in 2014, and the Korean stock market dropped 11%.
There are no companies in the portfolio based in Australia, and we have only one Korean company in the portfolio with a weighting of only 3.9%. That Korean company is Samsung, and although it dropped 7% in U.S. dollar terms, that was less than the 11% drop in the Korean market. Value on December 31, 2014 of $10,000 invested on April 30, 2013 15,000 Parnassus Asia Fund $11,265 MSCI AC Asia Pacific Index $10,163 Lipper Asia Pacific Region Average $9,923 12,500 10,000 7,500 4/30/2013 2013 2014 The chart shows the growth in value of a hypothetical $10,000 investment since inception (April 30, 2013) and does not reflect the deduction of taxes a shareholder would pay on fund distributions or the redemption of fund shares. The final piece of luck was overweighting Thailand and Indonesia; Thailand went up 16.8%, and Indonesia went up 27.2% in dollar terms.
However, we were also skillful in picking good companies in those two countries. Our Thai companies went up 25.5%, while our Indonesian companies went up 29.4% in dollar terms. In summary, then, we have a good record of picking companies that increase in value, but we have no ability to accurately forecast currency movements or predict which company’s corresponding stock market will do the best. Our strategy, then, should be to focus on picking good companies and not to worry about currency fluctuations or stock market movements in individual countries.
When it comes to the latter two, we’ll have some good luck and some bad luck, and over the long-run, the two should balance each other out. That doesn’t mean we won’t take country-wide conditions into account. We’ll look at how our portfolio compares to the MSCI Index, and we’ll assess economic opportunities in various countries, but we won’t try to pick countries based on an annual forecast of stock market returns. Yours truly, Jerome L.
Dodson Lead Portfolio Manager 26 Billy J. Hwan Portfolio Manager . Annual Report • 2014 PARNASSUS FUNDS PARNASSUS FIXED INCOME FUND Ticker: PRFIX As of December 31, 2014, the NAV of the Parnassus Fixed Income Fund was $16.66, producing a gain for the year of 4.49% (including dividends). This compares to a gain of 5.97% for the Barclays U.S. Aggregate Bond Index (“Barclays Aggregate Index”) and a gain of 7.66% for the Lipper A-Rated Bond Fund Average, which represents the average return of the A-rated bond funds followed by Lipper (“Lipper average”). Below is a table comparing the performance of the Fund with that of the Barclays Aggregate Index and the Lipper average. Average annual total returns are for the one-, three-, five- and ten-year periods. On page 28, you will find a graph that shows the growth of a hypothetical $10,000 investment in the Fund over the past ten years.
For December 2014, the 30-day subsidized SEC yield was 1.59%, and the unsubsidized SEC yield was 1.53%. 2014 Review Interest rates continued to deviate from their normal relationship to the economy in the fourth quarter, topping off an odd year for the bond market overall. Looking at domestic data alone, interest rates should have risen in 2014. The U.S.
economy grew at a robust rate in the last three quarters of the year after recovering from a first quarter contraction caused by the Polar Vortex. Typically, a growing economy causes interest rates to rise, as inflation picks up and investors demand higher rates of return. Instead, geopolitical events overwhelmed the positive economic data and ultimately determined the direction of this year’s interest rate movement. The 10-year Treasury bond yielded approximately 3.00% on January 1, 2014, but subsequently dropped to 2.17% by the end of the year. Parnassus Fixed Income Fund Average Annual Total Returns (%) Gross Net Expense Expense Ratio Ratio One Year Three Years Five Years Ten Years Parnassus Fixed Income Fund 4.49 1.24 3.48 4.35 0.78 0.68 Barclays U.S. Aggregate Bond Index 5.97 2.66 4.45 4.71 NA NA Lipper A-Rated Bond Fund Average 7.66 4.14 5.74 4.74 NA NA for periods ended December 31, 2014 Performance data quoted represent past performance and are no guarantee of future returns. Current performance may be lower or higher than the performance data quoted.
Current performance information to the most recent month-end is available on the Parnassus website (www.parnassus.com). Investment return and principal value will fluctuate so that an investor’s shares, when redeemed, may be worth more or less than their original cost. Returns shown in the table do not reflect the deduction of taxes a shareholder would pay in fund As Portfolio Manager of the Parnassus Fixed Income Fund, I make three strategic decisions each year: 1) how interest rates will behave; 2) which asset classes should perform well; and, 3) which individual bonds to hold.
Reflecting on the Fund’s performance for the year, I was wrong about the direction interest rates would move in 2014. I believed that robust economic growth, a reduction of stimulus from the Federal Reserve and a declining unemployment rate would all put upward pressure on rates. Because I expected interest rates to rise, the Fund had a shorter duration than the index, at 4.20 years versus 5.55 years. As a reminder, duration is a measure of interest rate sensitivity and indicates how much, in percentage terms, a bond price will move for a 1% change in interest rates.
A shorter duration means that the value of the Fund is less sensitive to interest rate movements. In this case, it did not gain as much when interest rates fell. distributions or redemption of shares. The Barclays U.S.
Aggregate Bond Index is an unmanaged index of bonds, and it is not possible to invest directly in an index. Index figures do not take any expenses, fees or taxes into account, but mutual fund returns do. Before investing, an investor should carefully consider the investment objectives, risks, charges and expenses of the Fund and should carefully read the prospectus or summary prospectus, which contain this and other information. The prospectus or summary prospectus can be obtained on the Parnassus website, or by calling (800) 999-3505.
As described in the Fund’s However, I am pleased that the Fund outperformed on the next two metrics: asset classes and securities. Duration-adjusted, the Fund produced 21 basis points (a basis point is 1/100th of one percent) of outperformance, due primarily to its overweight allocation to corporate bonds relative to the index. current prospectus dated May 1, 2014, (As Amended and Restated September 19, 2014), Parnassus Investments has contractually agreed to limit total operating expenses to 0.68% of net assets for the Fund. This agreement will not be terminated prior to May 1, 2015, and may be continued indefinitely by the Adviser on a year-to-year basis. Corporate bonds performed exceptionally well this year, returning 7.46% in the Barclays Aggregate Index.
The Fund benefitted from this outperformance as it holds 43.9% of its assets in 27 . PARNASSUS FUNDS Annual Report • 2014 corporate bonds versus 23.27% for the index. Several bonds that performed particularly well include: FedEx Corporation, Procter & Gamble Company and Starbucks Corporation. FedEx Corporation bonds returned 12.59% and added 3¢ to NAV. Shipment volumes increased due to overall economic strength and the growing importance of e-commerce, pushing revenue higher.
Additionally, the company is restructuring its operations to streamline the business, allowing it to accumulate cash more rapidly in 2014. The Fund’s Procter & Gamble (P&G) bonds gained 8.56% in the year and added 2¢ to NAV. A.G. Lafley, the CEO, is refocusing the company on its most valuable 70-80 brands, which means the company will shed about 100 brands globally.
This new approach is expected to improve earnings and cash flow, which benefit bond holders. Finally, Starbucks Corporation bonds performed especially well in the year, returning 12.15% and adding 2¢ to NAV. The company experienced strong revenue growth as food offerings and store throughput improved. Starbucks also continued to open new stores and redesign store formats, both domestically and abroad, and opened its 1,000th store in both China and Japan. Parnassus Fixed Income Fund as of December 31, 2014 (percentage of net assets) Sector Weightings U.S.
Treasury Bonds Fund Barclays U.S. Aggregate Bond Index 26.7% 35.8% Government Related Bonds 3.6% 9.5% Corporate Bonds 44.1% 23.3% Securitized Bonds 21.1% 31.4% The Fund’s convertible bond strategy performed very well, adding 8¢ to NAV overall. However, the two convertible bonds held in 2014 performed very differently. Intermune, a specialty pharmaceutical company, was the top performer overall for the Parnassus Fixed Income Short-term Investments, Other Assets & Liabilities 4.5% Fund in 2014, adding 9¢ to NAV.
The company’s phase III trial for 0.0% Esbriet, a breakthrough drug to treat idiopathic pulmonary fibrosis, 10 20 30 40 50 returned very positive results in February. The company’s underlying 0 shares shot higher on the news, and so the convertible bonds performed exceptionally well. Value on December 31, 2014 of $10,000 invested on December 31, 2004 On the other hand, Exelixis, a biotechnology company, was the worst performer in the Fund, Barclays U.S. Aggregate Lipper A-Rated Bond Fund Parnassus Fixed Income removing 2¢ from the NAV.
Exelixis had an Bond Index $15,842 Average $16,064 Fund $15,309 17,500 unsuccessful phase III trial this year, causing the bonds to substantially underperform. 15,000 Outlook and Strategy Low unemployment, increasing wages and higher 12,500 capital expenditures are converging to finally add momentum to the recovery, so I expect that 2015 10,000 will be a year of robust growth. The bond market will likely be volatile next year, as the U.S. economy accelerates in a slow global growth 7,500 environment. I expect the Federal Reserve to begin 2014 2007 2010 2011 2012 2013 2004 2005 2006 2008 2009 normalizing rates in late spring and this should The chart shows the growth in value of a hypothetical $10,000 investment over the last put upward pressure on short-term yields. 10 years and does not reflect the deduction of taxes a shareholder would pay on fund However, the path of longer-term rates is distributions or the redemption of fund shares. dependent not only on domestic economic growth, but international factors as well.
Low global growth rates and very low yields on foreign sovereign debt will continue to make U.S. debt attractive by comparison, likely keeping the 10-year Treasury rate somewhat depressed. Asset classes that historically outperform in a growing economy include corporate bonds, convertible bonds and high yield bonds. As a result, the Fund continues to be overweight corporate bonds and will opportunistically add high yield bonds that fit its long-term objectives. 28 .
Annual Report • 2014 PARNASSUS FUNDS Similar to 2014, I believe it is important to be conservative in this environment and not chase yield. With the economy growing well, the natural bias is for higher interest rates. As a result, the Fund continues to be conservatively positioned to protect against the impact of volatility, with a focus on principal preservation. Thank you for your investment in the Parnassus Fixed Income Fund. Yours truly, Samantha D. Palm Portfolio Manager 29 .
PARNASSUS FUNDS Annual Report • 2014 Responsible Investing Notes By Milton Moskowitz While 2014 started out with some turmoil, the stock market blasted its way to record highs by year end. Women advanced to C-suites and boards of directors. In Germany, the government followed the lead of Norway by mandating that corporate boards of directors allocate at least 30% of their seats to women. Jeans-maker Levi Strauss, a privately-owned company, cut back its orders from Cambodian factories after a strike by garment workers over low wages.
The minimum wage in Cambodian factories is $128 a month. It was a banner year for proxy resolutions asking corporations to address environmental, social and governance issues. A total of 454 resolutions were filed, well above previous years. And the average shareholder vote supporting these resolutions was 21.7%.
Five resolutions received majority support, 22 garnered 40%. Needless to say, these resolutions are strictly advisory. A resolution could attract 99% support – and the company could simply ignore it. I have a thing about corporate histories and so, for me, 2014 was notable for the publishing by HarperCollins of The Intel Trinity, a 541-page book written by Michael S.
Malone, a veteran observer of Silicon Valley. His subtitle is: “How Robert Noyce, Gordon Moore, and Andy Grove Built the World’s Most Important Company.” There will be arguments over whether Intel Corporation deserves this rating, but there is no question that it plays a key role in the technology that runs the world today. It has 107,000 employees and annual revenue of $55 billion.
Its semiconductors power most of the world’s computers. Malone traces the rise of Intel in a conversational tone. He does not shy away from setbacks and conflicts. This is not hagiography.
He relates the story of Intel from the standpoints of three leaders quite different in their personalities, capabilities and philosophies. Noyce, co-founder of the integrated circuit, was the charismatic entrepreneur, sometimes called “The Mayor of Silicon Valley.” Moore was the soft-spoken intellectual physicist, best known for “Moore’s Law,” which stated that computer power doubles every two years. Andy Grove was the feisty “take no prisoners” Jewish refugee from Hungary, responsible for the day-to-day running of Intel; his philosophy was best expressed in the title of his 1996 book, Only the Paranoid Survive. The trio came together in the 1960s at Fairchild Camera and were part of the eight engineers who left to found Intel in 1968. “At the heart of this story,” says Malone, “is the message that the company succeeded and reached the pinnacle of the modern economy not because its leadership was so brilliant (though it was) nor because its employees were so bright (though they were), nor that it had the best products (sometimes yes, most times no), nor that it made fewer mistakes than its competitors (completely wrong), but because Intel, more than any company America has ever known, had the ability to learn – from its successes and even more from its failures.” I first came across Intel in 1983 when I interviewed there for the 1984 book, The 100 Best Companies to Work for in America, which I co-authored with Robert Levering.
Intel then had 12,500 employees. Parnassus Investments was founded in 1984, and it had an early affinity for technology stocks. The Parnassus Fund made its first investment in Intel on June 9, 1986, paying $25 per shares.
That initial lot was sold four years later at $43.50 per share. Over the past 25 years Intel has remained one of the core holdings of three Parnassus Funds – the Parnassus Fund, Parnassus Core Equity Fund and Parnassus Endeavor Fund. Key inflection points were 1998, when the 100 Best list began appearing in Fortune magazine, and 2005 when the Parnassus Endeavor Fund was launched. Capital gains on the Intel holdings have totaled more than $9 million. At the present time, only one fund – the Parnassus Endeavor Fund – owns Intel stock, to the tune of 400,000 shares.
Intel has been a holding since inception of the Parnassus Endeavor Fund. Milton Moskowitz is the co-author of the Fortune magazine survey, “The 100 Best Companies to Work For,” and the co-originator of the annual Working Mother magazine survey, “The 100 Best Companies for Working Mothers.” Mr. Moskowitz serves as a consultant to Parnassus Investments in evaluating companies for workplace issues and responsible investing. Neither Fortune magazine nor Working Mother magazine has any role in the management of the Parnassus Funds, and there is no affiliation between Parnassus Investments and either publication. 30 .
Annual Report • 2014 PARNASSUS FUNDS Fund Expenses (unaudited) As a shareholder of the Funds, you incur ongoing costs, which include portfolio management fees, administrative fees, shareholder reports, and other fund expenses. The Funds do not charge transaction fees, so you do not incur transaction costs such as sales charges (loads) on purchase payments, reinvested dividends, or other distributions, redemption fees, and exchange fees. The information on this page is intended to help you understand your ongoing costs of investing in the Funds and to compare these costs with the ongoing costs of investing in other mutual funds. The following example is based on an investment of $1,000 invested at the beginning of the most recent six-month period and held for the period of July 1, 2014 through December 31, 2014. Actual Expenses In the example below, the first line for each Fund provides information about actual account values and actual expenses. You may use the information in this line, together with the amount you invested, to estimate the expenses that you paid over the period.
Simply divide your account value by $1,000 (for example, $8,600 account value divided by $1,000 = 8.6), then multiply the result by the number in the first line under the heading entitled “Expenses Paid During Period” to estimate the expenses you paid on your account during this period. Hypothetical Example for Comparison Purposes The second line of each Fund provides information about hypothetical account values and hypothetical expenses based on the Fund’s expense ratio and an assumed rate of return of 5% per year before expenses, which is not the Fund’s actual return. You may compare the ongoing costs of investing in the Fund with other mutual funds by comparing this 5% hypothetical example with the 5% hypothetical examples that appear in the shareholder reports of other funds. The hypothetical account values and expenses may not be used to estimate the actual ending account balance or expenses you paid for the period. Please note that the expenses shown in the table are meant to highlight only your ongoing costs in these Funds. Therefore, the second line of each Fund is useful in comparing only ongoing costs and will not help you determine the relative total costs of owning other mutual funds, which may include transactional costs such as loads. Beginning Account Value July 1, 2014 Ending Account Value December 31, 2014 Expenses Paid During Period* Parnassus Fund: Actual Hypothetical (5% before expenses) $1,000.00 $1,000.00 $1,060.90 $1,020.87 $ 4.47 $4.38 Parnassus Core Equity Fund – Investor Shares: Actual Hypothetical (5% before expenses) $1,000.00 $1,000.00 $1,057.10 $1,020.82 $4.51 $4.43 Parnassus Core Equity Fund – Institutional Shares: Actual Hypothetical (5% before expenses) $1,000.00 $1,000.00 $1,058.10 $1,021.73 $3.58 $3.52 Parnassus Endeavor Fund: Actual Hypothetical (5% before expenses) $1,000.00 $1,000.00 $1,088.30 $1,034.63 $5.00 $4.87 Parnassus Mid Cap Fund: Actual Hypothetical (5% before expenses) $1,000.00 $1,000.00 $1,041.40 $1,019.46 $5.87 $5.80 Parnassus Small Cap Fund: Actual Hypothetical (5% before expenses) $1,000.00 $1,000.00 $993.50 $1,019.16 $6.03 $6.11 Parnassus Asia Fund: Actual Hypothetical (5% before expenses) $1,000.00 $1,000.00 $974.50 $1,018.90 $6.22 $6.36 Parnassus Fixed Income Fund: Actual Hypothetical (5% before expenses) $1,000.00 $1,000.00 $1,010.30 $1,021.78 $3.45 $3.47 * Expenses are equal to the Fund’s annualized expense ratio of 0.86%, 0.87%, 0.69%, 0.95%, 1.14%, 1.20%, 1.25% and 0.68% for the Parnassus Fund, Parnassus Core Equity Fund – Investor Shares, Parnassus Core Equity Fund – Institutional Shares, Parnassus Endeavor Fund, Parnassus Mid Cap Fund, Parnassus Small Cap Fund, Parnassus Asia Fund and Parnassus Fixed Income Fund, respectively, multiplied by the average account value over the period, multiplied by the ratio of days in the period. The ratio of days in the period is 184/365 (to reflect the one-half year period). 31 .
PARNASSUS FUNDS Annual Report • 2014 REPORT OF INDEPENDENT REGISTERED PUBLIC ACCOUNTING FIRM To the Shareholders and Board of Trustees of the Parnassus Funds and the Parnassus Income Funds San Francisco, California We have audited the accompanying statements of assets and liabilities, including the portfolios of investments, of the Parnassus Funds (comprised of Parnassus Fund, Parnassus Mid Cap Fund, Parnassus Small Cap Fund, Parnassus Endeavor Fund, and Parnassus Asia Fund) and the Parnassus Income Funds (comprised of Parnassus Core Equity Fund and Parnassus Fixed Income Fund) (collectively, the “Trusts”) as of December 31, 2014, and the related statements of operations for the year then ended, the statements of changes in net assets for each of the two years in the period then ended for Parnassus Fund, Parnassus Mid Cap Fund, Parnassus Small Cap Fund, Parnassus Endeavor Fund, Parnassus Core Equity Fund, and Parnassus Fixed Income Fund, and for period April 30, 2013 (inception date) through December 31, 2014 for Parnassus Asia Fund, and the financial highlights for each of the five years in the period then ended for Parnassus Fund, Parnassus Mid Cap Fund, Parnassus Small Cap Fund, Parnassus Endeavor Fund, Parnassus Core Equity Fund, and Parnassus Fixed Income Fund and for period April 30, 2013 (inception date) through December 31, 2014 for Parnassus Asia Fund. These financial statements and financial highlights are the responsibility of the Trusts’ management. Our responsibility is to express an opinion on these financial statements and financial highlights based on our audits. We conducted our audits in accordance with the standards of the Public Company Accounting Oversight Board (United States). Those standards require that we plan and perform the audit to obtain reasonable assurance about whether the financial statements and financial highlights are free of material misstatement.
The Trusts are not required to have, nor were we engaged to perform, an audit of their internal control over financial reporting. Our audits included consideration of internal control over financial reporting as a basis for designing audit procedures that are appropriate in the circumstances, but not for the purpose of expressing an opinion on the effectiveness of the Trusts’ internal control over financial reporting. Accordingly, we express no such opinion. An audit also includes examining, on a test basis, evidence supporting the amounts and disclosures in the financial statements, assessing the accounting principles used and significant estimates made by management, as well as evaluating the overall financial statement presentation.
Our procedures included confirmation of securities owned as of December 31, 2014, by correspondence with the custodian and brokers; when replies were not received from brokers, we performed other auditing procedures. We believe that our audits provide a reasonable basis for our opinion. In our opinion, the financial statements and financial highlights referred to above present fairly, in all material respects, the financial position of each of the funds constituting the Parnassus Funds and the Parnassus Income Funds as of December 31, 2014, the results of their operations for the year then ended, the changes in their net assets for each of the two years in the period then ended for Parnassus Fund, Parnassus Mid Cap Fund, Parnassus Small Cap Fund, Parnassus Endeavor Fund, Parnassus Core Equity Fund, and Parnassus Fixed Income Fund and for the period April 30, 2013 (inception date) through December 31, 2014 for Parnassus Asia Fund, and the financial highlights for each of the five years in the period then ended for Parnassus Fund, Parnassus Mid Cap Fund, Parnassus Small Cap Fund, Parnassus Endeavor Fund, Parnassus Core Equity Fund, and Parnassus Fixed Income Fund and for the period April 30, 2013 (inception date) through December 31, 2014 for Parnassus Asia Fund, in conformity with accounting principles generally accepted in the United States of America. San Francisco, California February 3, 2015 32 . Annual Report • 2014 PARNASSUS FUNDS PARNASSUS FUND Portfolio of Investments as of December 31, 2014 Shares Percent Market of Net Value ($) Assets Equities Chemicals 75,000 Compass Minerals International Inc. 450,000 Potash Corporation of Saskatchewan Inc. 6,512,250 15,894,000 3.3% 22,406,250 Shares 20,000 75,000 200,000 140,000 Equities Pharmaceuticals Actavis PLC θ Allergan Inc. Gilead Sciences Inc. θ Novartis AG (ADR) 4.4% 29,732,000 Computers 165,000 International Business Machines Corp. 3.9% 26,472,600 Equipment Leasing 675,000 Air Lease Corp. 3.4% Real Estate Investment Trusts 502,972 Redwood Trust Inc. 23,159,250 Financial Services Capital One Financial Corp. Charles Schwab Corp. Essent Group Ltd. θ First Horizon National Corp. Wells Fargo & Co. 16,510,000 12,830,750 14,140,500 6,790,000 21,928,000 10.6% Food Products 350,000 Mondelez International Inc. 100,000 PepsiCo Inc. 2.7% 22,169,750 18,387,600 20,232,000 21,460,000 8,396,150 7.4% 250,000 60,000 55,000 40,000 5,148,200 15,944,250 18,852,000 12,972,400 52,916,850 1.5% 9,908,548 Retail 125,000 Target Corp. 650,000 Whole Foods Market Inc. 9,488,750 32,773,000 6.2% Semiconductor Capital Equipment 1,100,000 Applied Materials Inc. 200,000 Lam Research Corp. 42,261,750 27,412,000 15,868,000 6.3% Semiconductors 600,000 Altera Corp. 750,000 EZchip Semiconductor Ltd. θ, λ 43,280,000 22,164,000 14,355,000 5.4% Home Builders 800,000 D.R.
Horton Inc. 1,000,000 PulteGroup Inc. 245,000 Toll Brothers Inc. θ Industrial Manufacturing 200,000 Pentair PLC 72,199,250 12,713,750 9,456,000 3.3% Health Care Products 110,000 Perrigo Co. PLC Market Value ($) 7.8% Communications Equipment 400,000 QUALCOMM Inc. 200,000 425,000 550,000 500,000 400,000 Percent of Net Assets 2.0% Internet eBay Inc.
θ Equinix Inc. θ Google Inc., Class A θ LinkedIn Corp. θ 50,088,150 Services 450,000 Thomson Reuters Corp.
λ 9.7% 0.9% 1.1% 34,938,000 21,351,000 13,416,000 10.2% Transportation 200,000 C.H. Robinson Worldwide Inc. 500,000 Expeditors International of Washington Inc. 69,705,000 14,978,000 22,305,000 5.5% Total investment in equities (cost $537,708,235) 37,283,000 98.3% 667,262,998 6,185,000 Networking Products 350,000 Riverbed Technology Inc. θ 18,153,000 66,008,500 Lodging 500,000 Belmond Ltd.
θ 2.7% Telecommunications Equipment 1,800,000 Ciena Corp. θ, λ 1,100,000 Finisar Corp. θ, λ 200,000 Motorola Solutions Inc. 13,284,000 14,030,000 13,603,800 29,186,300 9,188,400 36,519,000 7,143,500 The accompanying notes are an integral part of these financial statements. 33 .
PARNASSUS FUNDS Annual Report • 2014 PARNASSUS FUND Portfolio of Investments as of December 31, 2014 (continued) Principal Amount ($) Short-Term Securities Percent Market of Net Value ($) Assets Certificates of Deposit α 100,000 Albina Community Bank 0.20%, matures 01/15/2015 100,000 Carver Federal Savings Bank 0.25%, matures 02/18/2015 250,000 Community Bank of the Bay 0.30%, matures 07/15/2015 100,000 Eastern Bank 0.10%, matures 01/29/2015 100,000 Latino Community Credit Union 0.60%, matures 02/20/2015 250,000 Metro Bank 0.25%, matures 05/10/2015 250,000 Opportunities Credit Union 0.20%, matures 04/25/2015 100,000 Self-Help Credit Union 0.55%, matures 01/15/2015 100,000 Southern Bancorp Bank 0.35%, matures 01/15/2015 250,000 Urban Partnership Bank 0.30%, matures 10/01/2015 99,847 99,474 244,658 99,452 246,439 Percent of Net Assets Market Value ($) Securities Purchased with Cash Collateral from Securities Lending Registered Investment Companies 9,018,468 Invesco Aim Government & Agency Portfolio Short-Term Investments Trust, Institutional Class variable rate, 0.01% 1.3% 9,018,468 Total short-term securities (cost $21,210,563) 3.1% 21,210,563 Total securities (cost $558,918,798) 101.4% 688,473,561 246,850 99,847 Payable upon return of securities loaned (1.3%) (9,018,468) 99,847 Other assets and liabilities - net (0.1%) (324,990) 242,465 Community Development Loans α 200,000 Boston Community Loan Fund 1.00%, matures 04/15/2015 200,000 Root Capital Loan Fund 1.25%, matures 01/25/2015 100,000 Vermont Community Loan Fund 0.85%, matures 10/15/2015 Total net assets 100.0% 679,130,103 1,578,573 196,582 199,212 95,282 0.1% 34 Short-Term Securities 99,694 0.2% Time Deposits 10,122,446 BBH Cash Management Service JPM Chase, Nassau 0.03%, due 01/02/2015 Principal Amount ($) 491,076 1.5% θ This security is non-income producing. λ This security, or partial position of this security, was on loan at December 31, 2014. The total value of the securities on loan at December 31, 2014 was $8,822,445. α Market value adjustments have been applied to these securities to reflect potential early withdrawal. ADR American Depository Receipt PLC Public Limited Company 10,122,446 The accompanying notes are an integral part of these financial statements. . Annual Report • 2014 PARNASSUS FUNDS PARNASSUS CORE EQUITY FUND Portfolio of Investments as of December 31, 2014 Shares Percent of Net Assets Equities Shares 168,537,030 272,076,000 Chemicals 1,941,000 Compass Minerals International Inc. Ω 2,100,000 Praxair Inc. Market Value ($) 3.8% Communications Equipment 5,015,000 QUALCOMM Inc. Computers 2,500,000 Apple Inc. 440,613,030 3.2% 372,764,950 2.4% 275,950,000 Consulting Services 2,153,000 Accenture PLC 1.7% 192,284,430 Cosmetics & Personal Care 4,200,000 Procter & Gamble Co. 3.3% 382,578,000 Market Value ($) 191,280,000 211,500,000 114,770,000 164,620,500 5.9% Oil & Gas 5,400,000 National Oilwell Varco Inc. 825,000 1,850,000 3,350,000 2,450,000 682,170,500 3.1% 353,862,000 Pharmaceuticals Actavis PLC θ Allergan Inc. Gilead Sciences Inc. θ Novartis AG (ADR) 212,363,250 393,291,500 315,771,000 227,017,000 9.9% Financial Services 7,774,500 Charles Schwab Corp. 2,750,000 MasterCard Inc. 1,148,442,750 234,712,155 236,940,000 4.0% 2,500,000 8,375,000 2,750,000 6,717,000 Percent of Net Assets Natural Gas 3,000,000 Energen Corp. 9,000,000 MDU Resources Group Inc. 2,300,000 Northwest Natural Gas Co. Ω 4,535,000 Spectra Energy Corp. Equities Food Products McCormick & Co. Mondelez International Inc. PepsiCo Inc. Sysco Corp. Real Estate Investment Trusts 9,913,000 Iron Mountain Inc. 3.3% 383,236,580 471,652,155 Retail 3,529,000 CVS Health Corp. 2.9% 339,877,990 185,750,000 304,221,875 260,040,000 266,597,730 3.9% 448,560,000 1,016,609,605 Services 6,610,000 Thomson Reuters Corp. 2.3% 266,647,400 Telecommunications Equipment 6,400,000 Motorola Solutions Inc. 3.7% 429,312,000 Telecommunications Provider 8,909,000 Shaw Communications Inc.
λ 8.7% Semiconductor Capital Equipment 18,000,000 Applied Materials Inc. 2.1% 240,453,910 Health Care Products 1,850,000 Perrigo Co. PLC 2.7% 309,246,000 Home Products 1,220,000 WD-40 Co. Ω 0.9% 103,797,600 Industrial Manufacturing 6,475,000 Pentair PLC 7,500,000 Xylem Inc. 430,069,500 285,525,000 6.2% Insurance 3,460,000 Verisk Analytics Inc.
θ 715,594,500 1.9% Transportation 5,166,000 Expeditors International of Washington Inc. 2,382,500 United Parcel Service Inc. 221,613,000 Internet 5,711,000 eBay Inc. θ 225,000 Google Inc., Class A θ 665,000 Google Inc., Class C θ 320,501,320 119,398,500 350,056,000 6.8% 4.3% Utility & Power Distribution 2,240,758 AGL Resources Inc. 8,743,343 Questar Corp. 230,880,000 97,482,180 2.8% 495,317,785 122,143,718 221,031,711 3.1% 343,175,429 1.9% 225,808,000 94.8% 10,977,885,614 789,955,820 Waste Management 4,400,000 Waste Management Inc. Medical Equipment 4,800,000 Patterson Companies Inc. 849,000 Teleflex Inc. 230,455,260 264,862,525 328,362,180 Total investment in equities (cost $7,951,862,161) The accompanying notes are an integral part of these financial statements. 35 . PARNASSUS FUNDS Annual Report • 2014 PARNASSUS CORE EQUITY FUND Portfolio of Investments as of December 31, 2014 (continued) Principal Amount ($) 250,000 250,000 250,000 Percent of Net Assets Short-Term Securities Certificates of Deposit α Community Bank of the Bay 0.30%, matures 07/15/2015 Community Trust Credit Union 0.55%, matures 10/15/2015 Urban Partnership Bank 0.30%, matures 09/24/2015 244,658 242,137 242,655 0.0% 500,000 500,000 500,000 500,000 Certificates of Deposit Account Registry Service α CDARS agreement with Community Bank of the Bay, dated 01/23/2014, matures 01/22/2015, 0.15% Participating depository institutions: Citizens Business Bank, par 203,129; EverBank, par 243,500; The PrivateBank and Trust Company, par 53,371; (cost $498,848) CDARS agreement with Community Bank of the Bay, dated 02/06/2014, matures 02/05/2015, 0.15% Participating depository institutions: Bank of America, N.A., par 241,000; Southern Bancorp Bank, par 241,000; The PrivateBank and Trust Company, par 18,000; (cost $498,079) CDARS agreement with Community Bank of the Bay, dated 04/10/2014, matures 04/09/2015, 0.20% Participating depository institutions: Apple Bank for Savings, par 243,500; The Park National Bank, par 243,500; The PrivateBank and Trust Company, par 13,000; (cost $494,617) CDARS agreement with Community Bank of the Bay, dated 10/16/2014, matures 10/15/2015, 0.15% Participating depository institutions: BB&T, par 241,000; Park Bank, par 241,000; United Community Bank, par 18,000; (cost $484,231) 100,000 36 729,450 Principal Amount ($) Percent Short-Term Securities of Net Assets 1,000,000 CEI Investment Notes Inc. 1.00%, matures 07/01/2015 7,500,000 MicroVest Plus, LP Note 2.25%, matures 04/15/2015 200,000 New Hampshire Community Loan Fund 1.00%, matures 07/15/2015 200,000 Root Capital Loan Fund 1.25%, matures 01/25/2015 100,000 Vermont Community Loan Fund 0.85%, matures 04/15/2015 498,848 Market Value ($) 970,246 7,371,782 193,589 199,212 98,290 0.1% Time Deposits 575,956,849 BBH Cash Management Service Anz, London 0.03%, due 01/02/2015 BTMU, Grand Cayman 0.03%, due 01/02/2015 STD Charter Bank, Nassau 0.03%, due 01/02/2015 Wells Fargo, Grand Cayman 0.03%, due 01/02/2015 8,931,410 56,254,202 173,531,003 198,553,442 147,618,202 5.0% 498,079 575,956,849 0.6% 73,344,197 5.7% 660,937,681 Securities Purchased with Cash Collateral from Securities Lending Registered Investment Companies 73,344,197 Invesco Aim Government & Agency Portfolio Short-Term Investments Trust, Institutional Class variable rate, 0.01% 494,617 Total short-term securities (cost $660,937,681) Total securities (cost $8,612,799,842) 484,231 0.0% Community Development Loans α Boston Community Loan Fund 1.00%, matures 04/15/2015 Market Value ($) 1,975,775 Payable upon return of securities loaned Other assets and liabilities -net Total net assets 98,291 The accompanying notes are an integral part of these financial statements. 100.5% 11,638,823,295 (0.6%) (73,344,197) 0.1% 17,494,979 100.0% 11,582,974,077 . Annual Report • 2014 PARNASSUS FUNDS PARNASSUS CORE EQUITY FUND Portfolio of Investments as of December 31, 2014 (continued) Ω Fund ownership consists of 5% or more of the shares outstanding of the Affiliated Issuer, as defined under the Investment Securities Act of 1940. θ This security is non-income producing. λ This security, or partial position of this security, was on loan at December 31, 2014. The total value of the securities on loan at December 31, 2014 was $71,827,804. α Market value adjustments have been applied to these securities to reflect potential early withdrawal. ADR American Depository Receipt PLC Public Limited Company The accompanying notes are an integral part of these financial statements. 37 . PARNASSUS FUNDS Annual Report • 2014 PARNASSUS ENDEAVOR FUND Portfolio of Investments as of December 31, 2014 Shares Percent of Net Assets Equities Market Value ($) Shares 4.6% 35,306,750 Computers 200,000 International Business Machines Corp. 4.2% 32,088,000 Cosmetics & Personal Care 140,000 Procter & Gamble Co. Electronic Components 675,000 Corning Inc. 200,000 565,000 500,000 510,000 1.7% 12,752,600 15,477,750 16,510,000 17,057,350 6,790,000 27,958,200 Food Products 415,000 Mondelez International Inc. 100,000 PepsiCo Inc. 1.8% Internet 300,000 eBay Inc. θ 75,000 Google Inc., Class A θ 10,000 LinkedIn Corp. θ 24,530,875 58,932,600 0.1% 884,700 4.2% 32,656,000 9,570,000 13,828,500 23,398,500 Telecommunications Equipment 1,925,000 Ciena Corp. θ, λ 4.9% 37,364,250 2.2% 16,868,750 Transportation 400,000 C.H.
Robinson Worldwide Inc. 500,000 Expeditors International of Washington Inc. Total investment in equities (cost $533,959,942) Principal Amount ($) Short-Term Securities Time Deposits 87,774,574 BBH Cash Management Service BBH, Grand Cayman 0.03%, due 01/02/2015 86,994,400 1.0% 7,455,800 Retail 450,000 Target Corp. 735,000 Whole Foods Market Inc. 34,159,500 37,058,700 9.2% 29,956,000 22,305,000 6.7% 38,266,200 28,278,000 12,972,400 7,477,800 11.4% 38 40,374,000 3.0% 16,836,000 39,799,500 2,297,100 Pharmaceuticals Allergan Inc. Gilead Sciences Inc. θ Novartis AG (ADR) Roche Holdings Ltd. (ADR) Professional Services 220,000 Insperity Inc. Software 150,000 Citrix Systems Inc.
θ 150,000 Intuit Inc. 14,018,950 7.7% 180,000 300,000 140,000 220,000 25,858,000 14,516,000 68,315,550 15,074,875 9,456,000 3.2% Networking Products 1,600,000 Riverbed Technology Inc. θ 49,739,000 Telecommunications Provider 625,000 Shaw Communications Inc. λ 8.8% Machinery 10,000 Deere & Co. Semiconductors 700,000 Altera Corp. 400,000 Intel Corp. 5.2% 2.0% Market Value ($) 29,904,000 19,835,000 6.5% Financial Services Capital One Financial Corp. Charles Schwab Corp. First Horizon National Corp. Wells Fargo & Co. Industrial Manufacturing 55,000 W.W.
Grainger Inc. λ Percent of Net Assets Semiconductor Capital Equipment 1,200,000 Applied Materials Inc. 250,000 Lam Research Corp. Communications Equipment 475,000 QUALCOMM Inc. Equities 71,218,200 The accompanying notes are an integral part of these financial statements. 52,261,000 88.4% 680,637,675 Percent of Net Assets 11.4% Market Value ($) 87,774,574 . Annual Report • 2014 PARNASSUS FUNDS PARNASSUS ENDEAVOR FUND Portfolio of Investments as of December 31, 2014 (continued) Principal Amount ($) Short-Term Securities Percent of Net Assets Market Value ($) Securities Purchased with Cash Collateral from Securities Lending Registered Investment Companies 38,086,610 Invesco Aim Government & Agency Portfolio Short-Term Investments Trust, Institutional Class variable rate, 0.01% Total short-term securities (cost $125,861,184) 38,086,610 16.3% 125,861,184 Total securities (cost $659,821,126) 104.7% 806,498,859 Payable upon return of securities loaned Other assets and liabilities - net Total net assets 4.9% (4.9%) (38,086,610) 0.2% 1,919,574 100.0% 770,331,823 λ This security, or partial position of this security, was on loan at December 31, 2014. The total value of the securities on loan at December 31, 2014 was $37,303,110. θ This security is non-income producing. ADR American Depository Receipt The accompanying notes are an integral part of these financial statements. 39 . PARNASSUS FUNDS Annual Report • 2014 PARNASSUS MID CAP FUND Portfolio of Investments as of December 31, 2014 Shares Percent Market of Net Value ($) Assets Equities Chemicals 71,000 Compass Minerals International Inc. 2.0% Data Processing 70,000 Equifax Inc. 107,500 Fiserv Inc. θ 6,164,930 5,660,900 7,629,275 4.4% Financial Services 200,000 Charles Schwab Corp. 861,200 First Horizon National Corp. 255,000 SEI Investments Co. 13,290,175 6,038,000 11,695,096 10,210,200 9.1% Food Products 123,276 McCormick & Co. 215,000 Sysco Corp. Health Care Products 139,270 DENTSPLY International Inc. 44,500 Perrigo Co. PLC 17,692,757 7,418,913 7,438,620 4.8% Health Care Services 95,000 Cardinal Health Inc. 14,857,533 2.5% 7,669,350 Industrial Manufacturing 168,800 Pentair PLC 292,280 Xylem Inc. 11,211,696 11,127,100 7.3% Insurance 134,583 Verisk Analytics Inc. θ 22,338,796 2.8% 8,620,041 8,315,239 6,602,150 5.0% Natural Gas 94,500 Energen Corp. 412,900 MDU Resources Group Inc. 145,000 Spectra Energy Corp. 14,917,389 6,025,320 9,703,150 5,263,500 7.0% Pharmaceuticals 15,000 Allergan Inc. 40 Percent of Net Assets 2.6% 8,058,127 Real Estate Investment Trusts 284,660 Iron Mountain Inc. 3.6% 11,004,956 2.0% 6,176,542 Retail 77,800 Nordstrom Inc. Semiconductor Capital Equipment 400,000 Applied Materials Inc. 182,900 Synopsys Inc.
θ 9,968,000 7,950,663 5.9% Services 21,000 Ecolab Inc. 17,918,663 0.7% 2,194,920 Software 96,000 Autodesk Inc. θ 51,400 Intuit Inc. 5,765,760 4,738,566 3.5% 10,504,326 Telecommunications Equipment 182,300 Motorola Solutions Inc. 4.0% 12,228,684 Telecommunications Provider 318,000 Shaw Communications Inc. λ 2.8% 8,582,820 Transportation 85,000 C.H.
Robinson Worldwide Inc. 167,000 Expeditors International of Washington Inc. 102,500 Genesee & Wyoming Inc., Class A θ 6,365,650 7,449,870 9,216,800 23,032,320 7,492,617 9,581,120 5.6% Waste Management 155,000 Waste Management Inc. Total investment in equities (cost $221,315,613) 6,268,725 1.0% Utility & Power Distribution 137,454 AGL Resources Inc. 379,000 Questar Corp. 20,991,970 2.1% Market Value ($) Professional Services 237,773 Insperity Inc. 7.5% Medical Equipment 172,874 Patterson Companies Inc. 57,500 Teleflex Inc. Oil & Gas 125,500 Cameron International Corp. θ Equities 27,943,296 9,159,407 8,533,350 5.8% Shares 3,188,850 The accompanying notes are an integral part of these financial statements. 17,073,737 2.6% 7,954,600 94.6% 288,673,507 . Annual Report • 2014 PARNASSUS FUNDS PARNASSUS MID CAP FUND Portfolio of Investments as of December 31, 2014 (continued) Principal Amount ($) Short-Term Securities Percent of Net Assets Time Deposits 15,934,874 BBH Cash Management Service JPM Chase, Nassau 0.03%, due 01/02/2015 Market Value ($) 5.2% 15,934,874 2.9% 8,705,955 8.1% 24,640,829 Securities Purchased with Cash Collateral from Securities Lending Registered Investment Companies 8,705,955 Invesco Aim Government & Agency Portfolio Short-Term Investments Trust, Institutional Class variable rate, 0.01% Total short-term securities (cost $24,640,829) Total securities (cost $245,956,442) 102.7% 313,314,336 Payable upon return of securities loaned (2.9%) Other assets and liabilities - net 0.2% Total net assets (8,705,955) 688,458 100.0% 305,296,839 θ This security is non-income producing. λ This security, or partial position of this security, was on loan at December 31, 2014. The total value of the securities on loan at December 31, 2014 was $8,525,326. PLC Public Limited Company The accompanying notes are an integral part of these financial statements. 41 . PARNASSUS FUNDS Annual Report • 2014 PARNASSUS SMALL CAP FUND Portfolio of Investments as of December 31, 2014 Shares Percent Market of Net Value ($) Assets Equities Shares Equities Auto Parts 350,000 Gentex Corp. 2.3% 12,645,500 Chemicals 205,000 Compass Minerals International Inc. 3.2% 17,800,150 Consumer Services 550,000 Sotheby’s 4.2% 23,749,000 Professional Services 310,000 Insperity Inc. 10,671,000 12,724,800 Percent of Net Assets Real Estate Investment Trusts 290,000 Iron Mountain Inc. 615,000 Redwood Trust Inc. λ Electronics 100,000 Harman International Industries Inc. 240,000 Plantronics Inc. 4.2% Equipment Leasing 740,000 Air Lease Corp. 950,000 465,000 1,150,000 280,000 4.5% Financial Services Essent Group Ltd. θ First American Financial Corp. First Horizon National Corp. SEI Investments Co. Health Care Products 125,000 Sirona Dental Systems Inc. θ Health Care Services 100,000 VCA Inc.
θ Lodging 1,575,000 Belmond Ltd. θ 1,300,000 135,000 1,571,400 210,000 25,389,400 67,016,200 2.0% 0.9% 3.5% 10,921,250 4,877,000 1.9% 10,505,900 11,211,400 12,115,500 4.2% Retail 275,000 Group 1 Automotive Inc. Semiconductors 1,250,000 PMC-Sierra Inc. θ 23,326,900 4.4% 24,645,500 2.0% 11,450,000 Software 2,177,709 Checkpoint Systems Inc.
θ, Ω 2,215,000 Covisint Corp. θ, Ω, λ 150,000 VeriSign Inc. θ, λ 29,899,945 5,869,750 8,550,000 Medical Equipment 1,400,000 GenMark Diagnostics Inc.
θ, λ 165,000 Patterson Companies Inc. 44,319,695 5.2% 28,968,000 Utility & Power Distribution 430,000 Questar Corp. 1.9% 10,870,400 Total investment in equities (cost $489,750,710) 99.7% 558,716,820 Transportation 2,400,000 UTi Worldwide Inc. θ, λ 19,482,750 22,841,000 10,824,300 23,806,710 15,792,000 13.0% 73,264,010 19,054,000 7,936,500 4.8% 6.6% Principal Amount ($) Short-Term Securities Time Deposits 3,637,429 BBH Cash Management Service Banco Santander, Frankfurt 0.03%, due 01/02/2015 26,990,500 37,068,865 Natural Gas 625,000 MDU Resources Group Inc. 225,000 Northwest Natural Gas Co. 14,687,500 11,227,500 4.6% 42 36,115,000 7.8% Machinery Blount International Inc. θ Graco Inc. MRC Global Inc.
θ Regal-Beloit Corp. Minerals & Mining 2,063,968 Dominion Diamond Corp. θ 10,975,500 25,139,500 6.5% 23,395,800 24,424,500 15,763,500 15,617,000 11,211,200 12.0% Oil & Gas 1,350,000 Denbury Resources Inc. λ 3,425,000 W&T Offshore Inc.
λ Market Value ($) 25,915,000 The accompanying notes are an integral part of these financial statements. Percent of Net Assets 0.6% Market Value ($) 3,637,429 . Annual Report • 2014 PARNASSUS FUNDS PARNASSUS SMALL CAP FUND Portfolio of Investments as of December 31, 2014 (continued) Principal Amount ($) Short-Term Securities Percent of Net Assets Market Value ($) Securities Purchased with Cash Collateral from Securities Lending Registered Investment Companies 68,702,942 Invesco Aim Government & Agency Portfolio Short-Term Investments Trust, Institutional Class variable rate, 0.01% 68,702,942 12.9% Total short-term securities (cost $72,340,371) 12.3% 72,340,371 Total securities (cost $562,091,081) 112.6% 631,057,191 Payable upon return of securities loaned (12.3%) (68,702,942) Other assets and liabilities - net Total net assets (0.3%) (1,892,744) 100.0% 560,461,505 Ω Fund ownership consists of 5% or more of the shares outstanding of the Affiliated Issuer, as defined under the Investment Securities Act of 1940. θ This security is non-income producing. λ This security, or partial position of this security, was on loan at December 31, 2014. The total value of the securities on loan at December 31, 2014 was $66,714,347. The accompanying notes are an integral part of these financial statements. 43 . PARNASSUS FUNDS Annual Report • 2014 PARNASSUS ASIA FUND Portfolio of Investments as of December 31, 2014 Shares Percent Market of Net Value ($) Assets Equities China 6,500 Air Lease Corp. 1,100 Alibaba Group Holding Ltd. (ADR) θ 3,500 Expeditors International of Washington Inc. 5,300 Mindray Medical International Ltd. (ADR) 3,600 QUALCOMM Inc. 223,015 114,334 139,920 267,588 Hong Kong China Minsheng Banking Corp., Ltd. Lenovo Group Ltd. Li & Fung Ltd. SITC International Holdings Co., Ltd. Sun Art Retail Group Ltd. Television Broadcasts Ltd. 1,119,477 Indonesia PT Asuransi Multi Artha Guna PT Bank Danamon Indonesia PT Bank Rakyat Indonesia (Persero) PT Siloam International Hospitals θ Percent Market of Net Value ($) Assets Taiwan Applied Materials Inc. Chailease Holding Co., Ltd. Far EasTone Telecommunications Co., Ltd. Hermes Microvision Inc. Lite-On Technology Corp. MediaTek Inc. Novatek Microelectronics Corp. St. Shine Optical Co., Ltd. Taiwan Semiconductor Manufacturing Co., Ltd. (ADR) 286,580 49,414 165,472 199,563 193,738 174,031 167,241 138,342 295,415 24,000 60,000 Thailand Advanced Info Service Public Co., Ltd. Thai Union Frozen Products Public Co., Ltd. Thanachart Capital Public Co., Ltd. 182,079 164,094 172,816 7.0% Total investment in equities (cost $6,716,855) 181,970 251,328 141,873 228,000 208,613 116,342 215,132 1,343,258 2.0% 95.0% 7,083,792 Principal Amount ($) 340,741 Short-Term Securities Percent Market of Net Value ($) Assets Time Deposits BBH Cash Management Service BBH, Grand Cayman 0.03%, due 01/02/2015 4.6% 340,741 Total short-term securities (cost $340,741) 4.6% 340,741 152,656 Total securities (cost $7,057,596) Singapore 40,000 Keppel Corp., Ltd. 110,000 OSIM International Ltd. 30,000 Petra Foods Ltd. 266,602 163,626 85,973 6.9% 516,201 3.9% 99.6% 7,424,533 Other assets and liabilities - net 0.4% 290,561 Total net assets The accompanying notes are an integral part of these financial statements. 32,944 100.0% 7,457,477 θ This security is non-income producing. ADR American Depository Receipt PT Perseroan Terbatas 44 518,989 571,862 18.0% South Korea 240 Samsung Electronics Co., Ltd. Equities 22.4% 1,669,796 95,270 145,328 187,693 143,571 Japan Fast Retailing Co., Ltd. KDDI Corp. Kyocera Corp. Linear Technology Corp. Rakuten Inc. TOTO Ltd. USS Co., Ltd. Philippines 235,000 Manila Water Co. 4,000 170,000 12,000 30,000 8,500 13,200 180,000 7.7% 500 4,000 3,100 5,000 15,000 10,000 14,000 900,992 156,879 262,428 168,519 218,203 138,776 174,672 15.0% 5,072,200 400,000 200,000 130,000 11,500 20,000 72,000 156,135 12.1% 120,000 201,000 180,000 400,000 140,000 30,000 Shares .
Annual Report • 2014 PARNASSUS FUNDS PARNASSUS FIXED INCOME FUND Portfolio of Investments as of December 31, 2014 Principal Amount ($) Commercial MortgageBacked Securities Percent Market of Net Value ($) Assets Commercial Mortgage-Backed Securities 986,086 DBUBS Mortgage Trust Series 2011-LC2A, Class A2, 3.39%, due 07/10/2044 1,500,000 JP Morgan Mortgage Trust Series 2011-C4, Class A3, 4.11%, due 07/15/2046 1,000,000 JP Morgan Mortgage Trust Series 2011-C4, Class A4, 4.39%, due 07/15/2046 1,000,000 JP Morgan Mortgage Trust Series 2013-C13, Class A2, 2.67%, due 01/15/2046 1,000,000 Morgan Stanley Capital Trust Series 2011-C1, Class A2, 3.88%, due 09/15/2047 1,000,000 UBS-Barclays Mortgage Trust Series 2012-C2, Class A3, 3.06%, due 05/10/2063 Total investment in commercial mortgage-backed securities (cost $6,743,779) Principal Amount ($) Convertible Bonds 3.5% Total investment in convertible bonds (cost $491,563) Principal Amount ($) Corporate Bonds Air Transportation 1,468,072 Southwest Air 07-1 Trust 6.15%, due 08/01/2022 Apparel 3,000,000 Hanesbrands Inc. 6.38%, due 12/15/2020 Cosmetics & Personal Care 2,000,000 Procter & Gamble Co. 2.30%, due 02/06/2022 Corporate Bonds Percent Market of Net Value ($) Assets Data Processing 2,000,000 Fiserv Inc. 3.13%, due 10/01/2015 1,013,578 1,602,984 1,097,489 1,021,659 1,019,711 1.1% 2,034,446 Equipment Leasing 1,500,000 United Rentals North America Inc. 6.13%, due 06/15/2023 0.8% 1,575,000 Financial Services 3,000,000 Discover Financial Services 5.20%, due 04/27/2022 1.7% 3,313,215 Food Products 3,000,000 Mondelez International Inc. 5.38%, due 02/10/2020 1.8% 3,398,412 Health Care Products 2,000,000 CR Bard Inc. 4.40%, due 01/15/2021 1.1% 2,196,930 1,032,539 6,787,960 Percent Market of Net Value ($) Assets Biotechnology 550,000 Exelixis Inc. 4.25%, due 08/15/2019 Principal Amount ($) 306,969 Health Care Services 2,100,000 Cardinal Health Inc. 1.90%, due 06/15/2017 1,000,000 Cardinal Health Inc. 1.70%, due 03/15/2018 2,116,485 993,536 1.6% Industrial Manufacturing 2,870,000 Danaher Corp. 5.40%, due 03/01/2019 4,050,000 Pentair Finance SA 3.15%, due 09/15/2022 3,110,021 3,235,096 3,978,121 0.9% 1.7% 1.0% 1.1% 2,053,738 Internet 3,000,000 Google Inc. 3.63%, due 05/19/2021 1.7% 3,218,811 1.6% 3,119,651 1.1% 2,110,036 Pharmaceuticals 2,000,000 Gilead Sciences Inc. 3.70%, due 04/01/2024 Percent Market of Net Value ($) Assets Insurance 2,000,000 Cigna Corp. 2.75%, due 11/15/2016 Networking Products 2,000,000 Cisco Systems Inc. 5.50%, due 02/22/2016 306,969 7,213,217 Medical Equipment 3,200,000 Agilent Technologies Inc. 3.20%, due 10/01/2022 0.2% 3.8% 1.1% 2,097,662 1,684,613 3,180,000 1,983,948 The accompanying notes are an integral part of these financial statements. 45 . PARNASSUS FUNDS Annual Report • 2014 PARNASSUS FIXED INCOME FUND Portfolio of Investments as of December 31, 2014 (continued) Principal Amount ($) Percent Market of Net Value ($) Assets Corporate Bonds 1.1% Retail 3,000,000 CVS Health Corp. 4.13%, due 05/15/2021 3,500,000 Nordstrom Inc. 4.00%, due 10/15/2021 2,500,000 Starbucks Corp. 3.85%, due 10/01/2023 2,035,278 Percent Market of Net Value ($) Assets 2,025,130 2.6% Total investment in corporate bonds (cost $83,352,850) 3,252,924 5,227,652 43.9% 84,583,375 3,744,346 2,665,128 5.0% Semiconductor Capital Equipment 2,000,000 Applied Materials Inc. 2.65%, due 06/15/2016 2,000,000 Applied Materials Inc. 4.30%, due 06/15/2021 Services 2,500,000 Ecolab Inc. 4.35%, due 12/08/2021 9,662,398 2,044,038 2,180,126 2.2% 1.4% Software 2,000,000 Adobe Systems Inc. 3.25%, due 02/01/2015 2,000,000 Intuit Inc. 5.75%, due 03/15/2017 4,224,164 2,723,973 2,003,796 2,198,010 2.1% Telecommunications Equipment 2,000,000 Corning Inc. 3.70%, due 11/15/2023 3,000,000 Juniper Networks Inc. 4.50%, due 03/15/2024 3,000,000 Motorola Solutions Inc. 3.75%, due 05/15/2022 4,201,806 2,060,454 3,028,221 3,043,542 4.3% Transportation 3,000,000 Burlington Northern Santa Fe Corp. 3.85%, due 09/01/2023 3,000,000 FedEx Corp. 2.70%, due 04/15/2023 8,132,217 3,164,442 2,921,745 3.1% 46 Corporate Bonds 2,000,000 Waste Management Inc. 3.50%, due 05/15/2024 Real Estate Investment Trusts 2,000,000 Regency Centers LP 3.75%, due 06/15/2024 Waste Management 1,000,000 Waste Management Inc. 6.38%, due 03/11/2015 2,000,000 Waste Management Inc. 4.75%, due 06/30/2020 Principal Amount ($) 6,086,187 1,010,300 2,192,222 Principal Amount ($) Percent Federal Agency Mortgage- of Net Market Backed Securities Value ($) Assets Federal Agency Mortgage-Backed Securities 788,504 Fannie Mae Pool 931739 4.00%, due 08/01/2024 849,405 Fannie Mae Pool AD5108 3.50%, due 12/01/2025 775,862 Fannie Mae Pool AH0973 4.00%, due 12/01/2025 984,080 Fannie Mae Pool MA0695 4.00%, due 04/01/2031 823,383 Fannie Mae Pool MA0844 4.50%, due 08/01/2031 928,827 Fannie Mae Pool MA1607 3.00%, due 10/01/2033 1,457,357 Fannie Mae Pool 926115 4.50%, due 04/01/2039 976,297 Fannie Mae Pool 931065 4.50%, due 05/01/2039 1,339,215 Fannie Mae Pool AD4296 5.00%, due 04/01/2040 1,009,058 Fannie Mae Pool AL0215 4.50%, due 04/01/2041 1,711,813 Fannie Mae Pool AL0393 4.50%, due 06/01/2041 1,304,540 Fannie Mae Pool AI8483 4.50%, due 07/01/2041 801,373 Fannie Mae Pool AJ4994 4.50%, due 11/01/2041 997,985 Fannie Mae Pool AK3103 4.00%, due 02/01/2042 1,409,588 Fannie Mae Pool AQ2925 3.50%, due 01/01/2043 1,168,972 Fannie Mae Pool AS1130 4.50%, due 11/01/2043 1,420,643 Fannie Mae Pool AS1587 4.50%, due 01/01/2044 960,719 FHLMC Multifamily Structured Pass Through Certificates K-029, Class A1, 2.84%, due 10/25/2022 851,646 Freddie Mac Pool E02746 3.50%, due 11/01/2025 The accompanying notes are an integral part of these financial statements. 840,142 898,836 829,349 1,060,885 899,387 959,377 1,584,177 1,066,425 1,484,526 1,096,709 1,874,536 1,424,375 870,580 1,070,449 1,472,388 1,268,891 1,543,323 994,214 900,336 . Annual Report • 2014 PARNASSUS FUNDS PARNASSUS FIXED INCOME FUND Portfolio of Investments as of December 31, 2014 (continued) Principal Amount ($) Percent Federal Agency Mortgage- of Net Market Backed Securities Value ($) Assets 746,558 Freddie Mac Pool G14820 3.50%, due 12/01/2026 852,674 Freddie Mac Pool G14809 3.00%, due 07/01/2028 916,353 Freddie Mac Pool G30672 3.50%, due 07/01/2033 1,796,905 Freddie Mac Pool C91754 4.50%, due 02/01/2034 980,269 Freddie Mac Pool C91762 4.50%, due 04/01/2034 985,721 Freddie Mac Pool G05514 5.00%, due 06/01/2039 1,795,523 Freddie Mac Pool A90225 4.00%, due 12/01/2039 1,915,447 Freddie Mac Pool A93451 4.50%, due 08/01/2040 843,474 Freddie Mac Pool G07426 4.00%, due 06/01/2043 789,240 887,365 964,220 1,963,616 1,070,140 1,100,333 1,916,255 2,084,330 900,528 Total investment in federal agency mortgage-backed securities (cost $33,442,158) Principal Amount ($) 17.6% Supranational Bonds Total investment in supranational bonds (cost $7,017,015) 3,000,000 3,000,000 6,000,000 4,000,000 4,990,685 3.6% 7,002,709 Percent Market of Net Value ($) Assets U.S. Government Treasury Bonds U.S. Government Treasury Bonds U.S. Treasury 2.50%, due 04/30/2015 U.S.
Treasury 2.13%, due 05/31/2015 U.S. Treasury 1.88%, due 06/30/2015 U.S. Treasury 0.38%, due 11/15/2015 Percent of Net Assets Market Value ($) 2,036,406 2,030,624 2,996,484 5,898,282 2,490,625 1,947,344 4,128,436 4,210,936 4,209,064 4,120,622 1,283,178 Total investment in U.S. government treasury bonds (cost $50,873,290) Principal Amount ($) 26.7% Total investment in long-term securities (cost $181,920,655) 33,814,932 2,012,024 U.S.
Government Treasury Bonds 2,000,000 U.S. Treasury 1.75%, due 05/31/2016 2,000,000 U.S. Treasury 1.50%, due 07/31/2016 3,000,000 U.S.
Treasury 0.50%, due 09/30/2016 6,000,000 U.S. Treasury 1.75%, due 05/15/2022 2,500,000 U.S. Treasury 2.00%, due 02/15/2023 2,000,000 U.S.
Treasury 1.75%, due 05/15/2023 4,000,000 U.S. Treasury 2.50%, due 08/15/2023 4,000,000 U.S. Treasury 2.75%, due 11/15/2023 4,000,000 U.S.
Treasury 2.75%, due 02/15/2024 4,000,000 U.S. Treasury 2.50%, due 05/15/2024 1,133,440 U.S. Treasury (TIPS) 1.75%, due 01/15/2028 Percent Market of Net Value ($) Assets Supranational Bonds 2,000,000 European Bank for Reconstruction & Development 1.63%, due 04/10/2018 5,000,000 International Finance Corp. 0.50%, due 05/16/2016 Principal Amount ($) Principal Amount ($) 95.5% 183,951,544 Short-Term Securities Percent of Net Assets 51,455,599 Market Value ($) Community Development Loans α 2,500,000 MicroVest Plus, LP Note 2.25%, matures 10/15/2015 1.3% 2,382,055 Time Deposits 5,280,390 BBH Cash Management Service JPM Chase, Nassau 0.03%, due 01/02/2015 2.7% 5,280,390 4.0% 7,662,445 Total short-term securities (cost $7,662,445) 3,023,673 Total securities (cost $189,583,100) 3,024,609 Other assets and liabilities - net 6,051,564 Total net assets 4,003,752 α Market value adjustments have been applied to these securities to reflect potential early withdrawal. TIPS Treasury Inflation Protected Security The accompanying notes are an integral part of these financial statements. 99.5% 191,613,989 0.5% 999,867 100.0% 192,613,856 47 .
PARNASSUS FUNDS Annual Report • 2014 STATEMENT OF ASSETS AND LIABILITIES December 31, 2014 Parnassus Fund Parnassus Core Equity Fund 667,262,998 $ 10,590,780,984 $ 680,637,675 - 387,104,630 - 21,210,563 321 660,937,681 14,144 125,861,184 2,337 $ 501,055 421,467 57,043 689,453,447 10,531,536 23,953,824 259,891 $ 11,673,582,690 362,384 2,408,762 37,987 $ 809,310,329 $ $ 9,018,468 693,555 402,219 209,102 10,323,344 679,130,103 73,344,197 10,614,628 6,267,248 382,540 $ 90,608,613 $ 11,582,974,077 38,086,610 366,426 470,510 54,960 $ 38,978,506 $ 770,331,823 $ 532,789 129,554,763 14,329,873 534,712,678 679,130,103 726,559 3,026,023,453 264,918,411 8,291,305,654 $ 11,582,974,077 1,165,768 146,677,733 831,236 621,657,086 $ 770,331,823 679,130,103 - $ $ 8,558,904,590 3,024,069,487 $ 770,331,823 - 210,334,786 74,205,242 25,721,643 - Parnassus Endeavor Fund Assets Investments in stocks and bonds, at market value-Unaffliliated (cost $537,708,235, $7,674,253,812, $533,959,942, $221,315,613, $458,800,978, $6,716,855, $181,920,655) Investments in stocks, at market value-Affliliated (cost of $0, $277,608,349, $0, $0, $30,949,732 $0, $0) Investments in short-term securities (at cost which approximates market value) Cash Receivables Investment securities sold Dividends and interest Capital shares sold Due from Parnassus Investments Other assets Total assets $ Liabilities Payable upon return of loaned securities Capital shares redeemed Fees payable to Parnassus Investments Accounts payable and accrued expenses Total liabilities Net assets Net assets consist of Undistributed net investment income (loss) Unrealized appreciation on securities and foreign currency Accumulated net realized gain (loss) on securities and foreign currency Capital paid-in Total net assets Net asset value and offering per share Net assets investor shares Net assets institutional shares $ Shares outstanding investor shares Shares outstanding institutional shares Net asset values and redemption price per share (Net asset value divided by shares outstanding) Investor shares Institutional shares 48 14,120,780 - $ 48.09 - $ $ The accompanying notes are an integral part of these financial statements. 40.69 40.75 $ 29.95 - . Annual Report • 2014 Parnassus Mid Cap Fund $ 288,673,507 Parnassus Small Cap Fund $ 522,947,125 Parnassus Asia Fund $ 7,083,792 PARNASSUS FUNDS Parnassus Fixed Income Fund $ 183,951,544 - 35,769,695 - - 24,640,829 415 72,340,371 34 340,741 19 7,662,445 137 $ 396,746 702,561 27,370 314,441,428 $ 313,818 161,865 44,227 631,577,135 $ 6,126 40,500 1,409 13,382 7,485,969 $ 1,062,194 236,730 13,753 192,926,803 $ $ 8,705,955 184,375 216,683 37,576 9,144,589 305,296,839 $ $ 68,702,942 1,720,060 524,132 168,496 71,115,630 560,461,505 $ $ 1,409 27,083 28,492 7,457,477 $ $ 156,940 84,396 71,611 312,947 192,613,856 $ 86 67,357,894 6,343,317 231,595,542 305,296,839 $ 68,966,110 (12,315,835) 503,811,230 560,461,505 $ (7,190) 366,973 (25,408) 7,123,102 7,457,477 $ 185,102 2,030,890 131,390 190,266,474 192,613,856 $ 305,296,839 - $ 11,141,329 - $ 27.40 - 560,461,505 - $ 23,578,050 - $ 23.77 - 7,457,477 - $ 446,128 - $ 16.72 - 192,613,856 11,562,799 - $ 16.66 - The accompanying notes are an integral part of these financial statements. 49 . PARNASSUS FUNDS Annual Report • 2014 STATEMENT OF OPERATIONS December 31, 2014 Parnassus Core Equity Fund Parnassus Fund Parnassus Endeavor Fund Investment income Dividends – Unaffiliated $ Dividends – Affiliated 8,036,105 $ 176,963,673 - Interest $ 8,944,254 10,135,412 - 14,901 Foreign witholding tax 18,138 1,282,583 43,429 8,812 Other income 398,969 171,764 Securities lending 13,563 4,400 (265,205) Total investment income $ 7,966,377 (3,290,570) $ 185,503,630 (219,086) $ 8,791,135 Expenses Investment advisory fees 3,857,332 57,380,379 4,312,786 339,896 1,226,108 151,446 - 298,848 - Fund administration 206,808 3,215,994 189,103 Service provider fees Transfer agent fees Investor shares Institutional shares 444,530 14,080,256 858,407 Reports to shareholders 94,952 864,779 69,177 Registration fees and expenses 33,915 204,405 33,580 Custody fees 49,489 317,362 31,960 Professional fees 41,994 206,923 33,737 Trustee fees and expenses 32,565 460,005 29,229 4,884 4,884 4,884 Proxy voting fees Pricing service fees 3,493 Total expenses $ 6,092 3,493 12,689 Other expenses 164,505 10,630 5,122,547 $ 78,430,540 Fees waived by Parnassus Investments - - Fees reimbursed by Parnassus Investments - $ - Net expenses 5,728,432 (419,980) - $ Net investment income (loss) 5,122,547 $ 78,430,540 $ 5,308,452 $ 2,843,830 $ 107,073,090 $ 3,482,683 Realized and unrealized gain (loss) on investments and foreign currency related transactions Net realized gain from securities transactions 69,326,086 440,188,076 43,998,833 - - - Net change in unrealized appreciation (depreciation) of securities 13,105,357 791,244,299 52,897,765 Net change in unrealized depreciation on foreign currency related transactions - - - Net realized loss from foreign currency related transactions Net realized and unrealized gain (loss) on securities and foreign currency related transactions $ 82,431,443 $ 1,231,432,375 $ 96,896,598 Net increase (decrease) in net assets resulting from operations $ 85,275,273 $ 1,338,505,465 $ 100,379,281 50 The accompanying notes are an integral part of these financial statements. . Annual Report • 2014 Parnassus Mid Cap Fund $ 4,999,885 Parnassus Small Cap Fund $ - 7,369,923 Parnassus Asia Fund $ 139,447 Parnassus Fixed Income Fund $ - - - - 3,124 1,588 152 4,606,866 19,098 92,152 - - 3,673 5,566 - 3,734 (45,987) $ 4,979,793 $ 7,469,229 (12,058) $ 127,541 $ 4,610,600 2,080,626 5,696,943 59,382 915,515 79,231 584,047 6,563 103,034 - - - - 87,076 222,230 1,823 61,961 432,729 960,113 2,505 227,322 39,350 152,440 1,694 35,890 32,813 50,916 38,861 28,733 13,587 46,457 11,898 8,190 19,874 68,189 42,286 19,922 14,198 47,894 672 9,339 4,884 4,884 10,419 - 3,493 3,493 13,564 4,349 5,038 $ PARNASSUS FUNDS 19,264 1,216 5,525 2,812,899 $ 7,856,870 $ 190,883 - - (59,382) - - $ (63,887) $ 2,812,899 $ $ 2,166,894 $ 7,856,870 (387,641) 7,536,082 $ 1,244,554 $ 59,927 $ 3,366,046 3,869 2,584,546 (27,248) (95,484,823) - - 67,614 - 18,808,437 (175,226) $ 95,466,713 - 1,419,780 - 427,819 - 1,929,191 (198,332) - $ 26,344,519 $ (18,110) $ 206,108 $ 4,513,737 $ 28,511,413 $ (405,751) $ 266,035 $ 7,879,783 The accompanying notes are an integral part of these financial statements. 51 . PARNASSUS FUNDS Annual Report • 2014 STATEMENT OF CHANGES IN NET ASSETS December 31, 2014 Parnassus Fund Year Ended December 31, 2014 Parnassus Core Equity Fund Year Ended Year Ended December 31, 2013 December 31, 2014 Year Ended December 31, 2013 Investment income from operations Net investment income (loss) $ Net realized gain from securities transactions Net realized gain (loss) on foreign currency related transactions Net change in unrealized appreciation (depreciation) of securities Net change in unrealized appreciation (depreciation) on foreign currency related transactions Increase (decrease) in net assets resulting from operations $ 2,843,830 69,326,086 - $ 13,105,357 85,275,273 2,786,793 86,277,993 - $ 60,377,042 $ 149,441,828 107,073,090 $ 440,188,076 791,244,299 84,874,686 423,456,156 1,369,149,479 $ 1,338,505,465 $ 1,877,480,321 Distributions From net investment income Investor shares Institutional shares From realized capital gains Investor shares Institutional shares From return of capital Investor shares Institutional shares Distributions to shareholders (22,221,590) - (114,823,029) (44,425,216) (75,672,898) (23,806,178) (36,499,383) - $ (23,310,790) (68,392,436) - (135,488,933) (48,522,737) (298,967,759) (85,271,546) (58,720,973) $ (91,703,226) $ (343,259,915) $ (483,718,381) Capital share transactions Investor shares Proceeds from sale of shares 123,143,996 127,652,026 2,558,040,385 1,753,249,729 Reinvestment of dividends 57,373,782 88,480,097 247,009,882 359,378,243 Shares repurchased (100,242,807) (171,705,411) (1,267,574,843) (951,505,148) Institutional shares Proceeds from sale of shares 1,247,685,257 723,167,847 Reinvestment of dividends 59,991,933 78,288,791 Shares repurchased (348,712,605) (295,341,991) Increase (decrease) in net assets from capital share transactions 80,274,971 44,426,712 2,496,440,009 1,667,237,471 Increase (decrease) in net assets $ 106,829,271 $ 102,165,314 $ 3,491,685,559 $ 3,060,999,411 Net Assets Beginning of year End of year Undistributed net investment income $ $ 572,300,832 679,130,103 532,789 $ $ 470,135,518 572,300,832 1,049,129 8,091,288,518 5,030,289,107 $11,582,974,077 $ 8,091,288,518 $ 726,559 $ 120,773 Shares issued and redeemed Investor shares Shares sold Shares issued through dividend reinvestment Shares repurchased Institutional shares Shares sold Shares issued through dividend reinvestment Shares repurchased Net increase (decrease) in shares outstanding Investor shares Institutional shares 52 2,567,800 1,179,490 (2,105,263) 2,810,597 1,937,939 (3,842,660) - - 1,642,027 - 905,876 - The accompanying notes are an integral part of these financial statements. 66,022,421 6,151,570 (33,128,690) 51,448,911 10,055,536 (27,983,088) 32,466,571 1,492,438 (9,000,677) 21,335,971 2,186,576 (8,690,922) 39,045,301 24,958,332 33,521,359 14,831,625 . Annual Report • 2014 Parnassus Endeavor Fund Year Ended December 31, 2014 $ 3,482,683 43,998,833 - $ 52,897,765 $ 100,379,281 Parnassus Mid Cap Fund Year Ended December 31, 2013 1,997,022 30,555,638 - Year Ended December 31, 2014 $ 68,276,432 $ 100,829,092 2,166,894 7,536,082 18,808,437 $ 28,511,413 Parnassus Small Cap Fund Year Ended December 31, 2013 $ 1,063,431 8,838,248 - Year Ended December 31, 2014 $ 37,143,232 $ PARNASSUS FUNDS 47,044,911 (387,641) 95,466,713 - Year Ended December 31, 2013 $ (95,484,823) (405,751) $ (1,052,243) 51,506,771 129,860,100 $ 180,314,628 (12,941,659) - (8,653,869) - (2,180,581) - (2,476,509) - (33,257) - (10,911,928) - (33,400,849) - (25,084,295) - (3,439,920) - (5,652,614) - (109,999,534) - (33,887,690) - $ (46,342,508) (33,738,164) (5,620,501) (8,129,123) (110,032,791) (44,799,618) $ 298,267,377 43,892,018 (101,804,232) $ $ $ 197,654,856 31,293,717 (101,128,527) 91,026,928 5,308,798 (55,092,184) 115,826,819 7,704,932 (50,249,048) 101,904,980 102,352,230 (309,012,380) 177,400,113 40,602,696 (257,842,979) $ 41,243,542 64,134,454 $ 73,282,703 112,198,491 $ (104,755,170) (215,193,712) $ (39,840,170) 95,674,840 $ $ 241,162,385 305,296,839 86 $ $ 128,963,894 241,162,385 7,209 $ $ 775,655,217 560,461,505 - $ $ 679,980,377 775,655,217 32,998 240,355,163 $ 294,391,936 $ 127,820,046 194,910,974 475,939,887 $ 770,331,823 $ 1,165,768 $ $ 281,028,913 475,939,887 14,510 10,193,157 1,462,440 (3,567,129) $ 7,784,676 1,174,236 (4,002,130) 3,488,133 192,747 (2,148,487) 5,093,991 311,933 (2,158,589) - - - - 8,088,468 - 4,956,782 - 1,532,393 - 3,737,605 4,280,727 (11,443,410) 3,247,335 - The accompanying notes are an integral part of these financial statements. (3,425,078) - 6,802,548 1,452,585 (9,858,364) (1,603,231) - 53 . PARNASSUS FUNDS Annual Report • 2014 STATEMENT OF CHANGES IN NET ASSETS December 31, 2014 (continued) Parnassus Asia Fund Year Ended December 31, 2014 Parnassus Fixed Income Fund For Period April 30, 2013 (inception date) through December 31, 2013 Year Ended December 31, 2014 Year Ended December 31, 2013 Investment income from operations Net investment income (loss) $ Net realized gain from securities transactions Net realized gain (loss) on foreign currency related transactions Net change in unrealized appreciation (depreciation) of securities Net change in unrealized depreciation on foreign currency related transactions Increase (decrease) in net assets resulting from operations $ 59,927 3,869 (27,248) $ 427,819 (198,332) 266,035 (12,919) 9,274 819 $ 193,089 $ (55,603) 134,660 3,366,046 2,584,546 - $ 1,929,191 $ 7,879,783 3,397,927 2,750,811 (11,858,353) $ (5,709,615) Distributions From net investment income Investor shares Institutional shares From realized capital gains Investor shares Institutional shares From return of capital Investor shares Institutional shares Distributions to shareholders (77,599) - - $ (77,599) $ (3,426,303) - - - (4,034,311) (1,559,479) - (3,235,241) - - (5,593,790) $ (682,090) (7,343,634) $ Capital share transactions Investor shares Proceeds from sale of shares Reinvestment of dividends Shares repurchased Institutional shares Proceeds from sale of shares Reinvestment of dividends Shares repurchased Increase (decrease) in net assets from capital share transactions Increase (decrease) in net assets $ 4,216,902 77,363 (401,104) 3,276,113 (34,893) 48,839,061 5,064,364 (39,365,324) 36,741,372 6,579,766 (80,201,405) 3,893,161 4,081,597 $ 3,241,220 3,375,880 $ 14,538,101 16,824,094 $ (36,880,267) (49,933,516) 3,375,880 7,457,477 (7,190) $ $ 3,375,880 - $ $ 175,789,762 192,613,856 185,102 $ $ 225,723,280 175,789,762 - Net Assets Beginning of period End of year Undistributed net investment income (loss) $ $ Shares issued and redeemed Investor shares Shares sold Shares issued through dividend reinvestment Shares repurchased Institutional shares Shares sold Shares issued through dividend reinvestment Shares repurchased Net increase (decrease) in shares outstanding Investor shares Institutional shares 54 249,746 4,621 (23,728) 217,799 (2,310) 2,911,578 303,000 (2,354,313) - - - 230,639 - 215,489 - 860,265 - The accompanying notes are an integral part of these financial statements. 2,133,356 391,178 (4,674,156) (2,149,622) - . Annual Report • 2014 PARNASSUS FUNDS Notes to Financial Statements 1. Organization The Parnassus Funds are comprised of two Trusts, the Parnassus Funds trust and the Parnassus Income Funds trust (collectively the “Trusts”), organized as Massachusetts Business Trusts registered under the Investment Company Act of 1940 as diversified, open-end investment management companies, and are comprised of seven separate funds (collectively the “Funds”). The Parnassus Funds trust includes the Parnassus Fund, which commenced operations on December 27, 1984, the Parnassus Endeavor Fund, the Parnassus Mid Cap Fund and the Parnassus Small Cap Fund, which commenced operations on April 29, 2005, and the Parnassus Asia Fund, which commenced operations on April 30, 2013. The Parnassus Income Funds trust includes the Parnassus Core Equity Fund and the Parnassus Fixed Income Fund, both of which commenced operations on August 31, 1992.
Each Fund has distinct investment objectives. In general, each of the Funds seeks long-term capital appreciation. Prior to May 1, 2014, the Parnassus Core Equity Fund was known as the Parnassus Equity Income Fund, and the Parnassus Endeavor Fund was known as the Parnassus Workplace Fund. 2.
Significant Accounting Policies Short-Term Securities Short-term securities represent investments of excess cash and consist of time deposits, community development loans, certificates of deposit and money market funds. Security Transactions and Related Investment Income and Expenses Securities transactions are recorded on the date the securities are purchased or sold (trade date). Realized gains and losses on securities transactions are determined on the basis of first-in, first-out for both financial statement and federal income tax purposes. Dividend income is recognized on the ex-dividend date and interest income is recognized on an accrual basis. Discounts and premiums on securities purchased are amortized over the lives of the respective securities using the constant yield method, which approximates the interest method.
Expenses are recorded on an accrual basis. Class Allocations Income, fees and expenses (other than class-specific fees and expenses) and realized and unrealized gains and losses are allocated daily among the various shares classes based on their relative net assets. Class-specific fees and expenses, such as distribution, administrative and shareholder services, are charged directly to the respective share class. Dividends and Distributions to Shareholders Dividends and distributions to shareholders are recorded on the ex-dividend date to shareholders of record on the record date. The Parnassus Core Equity Fund pays income dividends quarterly and capital-gain dividends annually.
The Parnassus Fixed Income Fund pays income dividends monthly and capital-gain dividends annually. The other Funds pay income and capital-gain dividends annually. Currency Translation Assets and liabilities, including investment securities, denominated in currencies other than U.S. dollars are translated into U.S.
dollars at the exchange rates supplied by the Funds’ pricing vendor on the valuation date. Purchases and sales of investment securities and income and expenses are translated into U.S. dollars at the exchange rates on the dates of such transactions.
On the accompanying financial statements, the effects of changes in exchange rates on investment securities are included with the net realized gain or loss and net unrealized appreciation or depreciation on investments. The realized gain or loss and unrealized appreciation or depreciation resulting from all other transactions denominated in currencies other than U.S. dollars are disclosed separately. 3.
Securities Valuations Methods and Inputs Equity securities that are listed or traded on a national securities exchange are stated at market value, based on recorded closing sales on the exchange or on the NASDAQ’s National Market official closing price. In the absence of a recorded sale, 55 . PARNASSUS FUNDS Annual Report • 2014 Notes to Financial Statements (continued) and for over-the-counter securities, equity securities are stated at the mean between the last recorded bid and asked prices. Long-term, fixed-income securities are valued each business day using prices based on procedures established by independent pricing services and approved by the Board of Trustees (the “Trustees”). Fixed-income securities with an active market are valued at the “bid” price where such quotes are readily available from brokers and dealers and are representative of the actual market for such securities. Other fixed-income securities experiencing a less active market are valued as determined by the pricing services based on methods which include consideration of trading in securities of comparable yield, quality, coupon, maturity and type, as well as indications as to values from dealers and other market data without exclusive reliance upon quoted prices or over-the-counter prices, since such valuations are believed to reflect more accurately the value of such securities. Investments in registered investment companies are valued at their net asset value. Investments where market quotations are not readily available are priced at their fair value, in accordance with procedures established by the Trustees.
These investments include certificates of deposit and community development loans. These investments carry interest rates ranging from 0.10% to 2.25% with maturities of one year or less. In determining fair value, the Trustees may consider a variety of information including, but not limited to, the following: price based upon a multiple of earnings or sales, fundamental analytical data and an evaluation of market conditions.
A valuation adjustment is applied to certificates of deposit, community development loans and other community development investments as an estimate of potential penalties for early withdrawal. The Funds follow Accounting Standards Codification (“ASC”) 820, Fair Value Measurements and Disclosure, which defines fair value, establishes a framework for measuring fair value and expands disclosures about fair value measurements. Various inputs are used in determining the value of the Funds’ portfolio investments. These inputs are summarized in three levels, Level 1 – unadjusted quoted prices in active markets for identical investments, Level 2 – other significant observable inputs (including quoted prices for similar investments) and Level 3 – significant unobservable inputs (including the Fund’s own assumptions in determining the fair value of investments). Securities Lending The Parnassus Funds, with the exception of the Parnassus Asia Fund, have entered into an agreement with Brown Brothers Harriman & Co., dated July 29, 2009 (“Agreement”), to provide securities lending services to the Funds.
Under this program, the proceeds (cash collateral) received from borrowers are used to invest in money market funds. Under the Agreement, the borrowers pay the Funds negotiated lenders’ fees and the Funds receive cash collateral in an amount equal to 102% of the market value of loaned securities. The borrower of securities is at all times required to post cash collateral to the portfolio in an amount equal to 100% of the market value of the securities loaned based on the previous day’s market value of the securities loaned, marked-to-market daily. Any collateral shortfalls are adjusted the next business day.
If the borrower defaults on its obligations to return the securities loaned because of insolvency or other reasons, the portfolio could experience delays and costs in recovering the securities loaned. The Funds retained beneficial ownership and all economic benefits in the securities they have loaned and continues to receive interest paid by the securities and payments equivalent to dividends, and to participate in any changes in their market value, but does not have the proxy voting rights with respect to loaned securities. Each portfolio manager of the Funds has the responsibility to request that the securities lending agent call back securities which are out on loan to vote on material matters and it is the Funds’ policy that the portfolio managers vote on all material matters.
However, the ability to timely recall shares for proxy voting purposes typically is not entirely within the control of the portfolio manager, the Funds or their securities lending agent. Under certain circumstances, the recall of shares in time for such shares to be voted may not be possible due to applicable proxy voting record dates and administrative considerations. Income generated from securities lending is presented in the Statement of Operations. Cash collateral received by the Funds is reflected as an asset (securities purchased with cash collateral from securities lending) and the related liability (payable upon return of securities loaned) is presented in the Statement of Assets and Liabilities. 56 .
Annual Report • 2014 PARNASSUS FUNDS Notes to Financial Statements (continued) Community Development Investment Programs The Parnassus Funds may each invest up to 2% of their assets in community investments and community-development loan funds. Each of the Funds may invest in obligations issued by community loan funds at below-market interest rates if the projects financed have a positive social impact. Generally, there is no secondary market on loan funds and thus these are considered illiquid. As part of our community development investment program, the Parnassus Core Equity Fund has entered into an agreement for fund investments through the Certificate of Deposit Account Registry Service (“CDARS”) network. The CDARS network allows members to place funds in time deposits with depository institutions whose accounts are insured by the Federal Deposit Insurance Corporation (“FDIC”).
Provisions stipulate that participating institutions are FDIC insured, however, in the event of default or bankruptcy by any party to the agreement, the proceeds of the investment may be delayed or subject to legal proceedings and are subject to FDIC limits. While certain investments of the Funds may be bank deposits and may be covered by FDIC insurance, the Funds are themselves not covered by FDIC insurance. The Parnassus Core Equity Fund and the Parnassus Fixed Income Fund hold debt instruments issued by MicroVest Plus, LP, a microfinance limited partnership specializing in providing capital to international microfinance institutions (“MFI’s”) that extend credit to developing countries and the entrepreneurial poor. This instrument may be subject to political and foreign currency exchange risk not normally associated with domestic debt instruments.
MicroVest Plus, LP’s investment in MFI’s can be affected by, among other factors, commodity prices, inflation, interest rates, taxation, social instability, and other political, economic or diplomatic developments in or affecting the various countries where MFI’s operate. Use of Estimates The preparation of financial statements in conformity with GAAP requires management to make estimates and assumptions that affect the reported amounts of assets and liabilities at the date of the financial statements and the reported amount of revenues and expenses during the reporting period. Actual results could differ from those estimates. Subsequent Events Management has evaluated the impact of all subsequent events on the Funds through the date the financial statements were issued and has determined that there were no subsequent events requiring adjustment to or additional disclosure in the financial statements. 4. Risk Factors Investing in the Parnassus Funds may involve certain risks including, but not limited to the following: Market Conditions The prices of, and the income generated by, the common stocks and other securities held by the Funds may decline in response to certain events taking place around the world, including those directly involving the companies whose securities are owned by the Funds; conditions affecting the general economy; overall market changes; local, regional or global political, social or economic instability; and currency, interest rate and commodity price fluctuations.
Additionally, the values of, and the income generated by, most debt securities held by the Fund may be affected by changing interest rates and by changes in the effective maturities and credit ratings of these debt securities. The Funds’ investment adviser attempts to reduce these risks through diversification of the portfolio and ongoing credit analysis as well as by monitoring economic and legislative developments, but there can be no assurance that it will be successful at doing so. Investments in securities issued by entities based outside the U.S.
may also be affected by currency controls; different accounting, auditing, financial reporting, and legal standards and practices; expropriation; changes in tax policy; greater market volatility; different securities market structures and higher transaction costs. Investing Outside the U.S. Securities of issuers domiciled outside the U.S., or with significant operations outside the U.S., may lose value because of political, social, economic or market developments or instability in the countries or regions in which the issuer operates. These securities may also lose value due to changes in foreign currency exchange rates against the U.S. dollar and/or currencies 57 . PARNASSUS FUNDS Annual Report • 2014 Notes to Financial Statements (continued) of other countries. Securities markets in certain countries may be more volatile and/or less liquid than those in the U.S. Investment outside the U.S. may also be subject to different settlement and accounting practices and different regulatory, legal and reporting standards, and may be more difficult to value, than those in the U.S. The risks of investing outside the U.S.
may be heightened in connection with investments in emerging and developing countries. Contractual Obligations Under the Trusts’ organizational documents, its officers and Trustees may be indemnified against certain liabilities and expenses arising out of the performance of their duties to the Trusts. Additionally, the Trusts have a variety of indemnification obligations under contracts with its service providers. The Trusts’ maximum exposure under these arrangements is unknown, as this would involve future claims that may be made against the Trusts that have not yet occurred. 5.
Taxation and Distributions Federal Income Taxes The Trusts intend to comply with the requirements of the Internal Revenue Code applicable to regulated investment companies and to distribute all taxable income to shareholders. Therefore, no federal income tax provision is required. Income distributions and capital-gain distributions are determined in accordance with income tax regulations, which may differ from U.S. Generally Accepted Accounting Principles (“GAAP”). The Funds follow ASC 740, Income Taxes, relating to uncertainty in income taxes and disclosures.
ASC 740 establishes a minimum threshold for income tax benefits to be recognized in the financial statements. These tax benefits must meet a “more likely than not” threshold, which means that based on technical merits, they have a more than 50% likelihood of being sustained upon examination by the tax authority. Tax benefits meeting this threshold are measured as the largest amount of tax benefit that is greater than 50% likely of being realized upon ultimate settlement with the tax authority.
As of and during the year ended December 31, 2014, the Funds did not have a liability for any unrecognized tax benefits. The Funds recognize interest and penalties, if any, related to unrecognized tax benefits as income tax expense in the Statement of Operations. During the year, the Funds did not incur interest or penalties.
The Funds are not subject to examination by U.S. federal taxing authorities before 2010 or state taxing authorities before 2009. Tax Matters and Distributions At December 31, 2014, the cost of investments in long-term securities and net unrealized appreciation/depreciation for income tax purposes were as follows: Parnassus Fund Distributions paid from: Ordinary Income 2014 $22,221,590 Long-term capital gains 2013 $23,310,790 36,499,383 68,392,436 184,011,670 $91,703,226 $343,259,915 Parnassus Mid Cap Fund Ordinary Income Long-term capital gains Return of capital Total distributions 58 2014 $159,248,245 $58,720,973 Total distributions Distributions paid from: Parnassus Core Equity Fund Parnassus Small Cap Fund 2014 2013 2014 $2,180,581 $2,476,509 3,439,920 5,652,614 $ 2013 $ 99,479,076 2014 $12,941,659 384,239,305 33,400,849 25,084,295 $483,718,381 $46,342,508 $33,738,164 Parnassus Asia Fund 2013 2014 33,257 $10,911,928 109,999,534 Parnassus Endeavor Fund 33,887,690 - - - - $5,620,501 $8,129,123 $110,032,791 $44,799,618 Parnassus Fixed Income Fund 2013 $77,599 $ 2013 $ 8,653,869 2014 2013 - $4,034,311 $3,426,303 - - 1,559,479 3,235,241 - - - 682,090 - $5,593,790 $7,343,634 $77,599 $ . Annual Report • 2014 PARNASSUS FUNDS Notes to Financial Statements (continued) Parnassus Fund Parnassus Core Equity Fund Parnassus Endeavor Fund Parnassus Mid Cap Fund Parnassus Small Cap Fund Parnassus Parnassus Asia Fixed Income Fund Fund Cost of investment $538,446,233 $7,951,941,765 $533,959,942 $221,458,572 $489,750,710 $6,720,068 $181,920,655 Unrealized appreciation $138,812,452 $3,073,195,838 $152,378,797 $ 70,178,604 $ 94,678,250 $ 695,231 $ Unrealized depreciation 9,995,687 47,251,989 5,701,064 2,963,669 25,712,140 331,471 2,931,412 900,522 Net unrealized appreciation $128,816,765 $3,025,943,849 $146,677,733 $ 67,214,935 $ 68,966,110 $ 363,760 $ 2,030,890 Distributable earnings – ordinary income $ 21,705,250 $ 159,854,031 $ 14,092,917 $ 2,173,460 $ - $ 69,146 $ 4,219,413 Distributable earnings – long-term capital gains $ 50,619,926 $ 387,407,135 $ 32,720,080 $ 7,976,324 $106,421,715 $ - $ 1,690,869 Undistributed earnings – ordinary income $ 726,559 $ 1,165,768 $ 86 $ - $ - $ 185,102 Undistributed earnings – long-term capital gains $ 15,067,871 $ 264,998,015 $ 831,236 $ 6,934,147 $ 3,172,135 $ - $ 131,390 532,789 $ At December 31, 2014, there were no estimated net capital loss carry forwards for the Parnassus Funds and no Post-October capital losses. Net investment income and net ordinary income are the same for all Funds for financial statement and income tax purposes during the year ended December 31, 2014. Net realized gains differ for financial statement and income tax purposes primarily due to differing treatments of wash sales. Reclassifications as shown in the following table have been made in each Fund’s capital accounts to report these balances on a tax basis, excluding certain temporary differences, as of December 31, 2014. Additional adjustments may be required in subsequent reporting periods. These reclassifications, which have no impact on the net asset value of the Funds, are primarily attributable to the reclassification of dividend income and certain differences in the computation of distributable income and capital gains under Federal tax rules versus GAAP. Fund Parnassus Fund Increase in Undistributed Net Investment Income Decrease in Undistributed Net Realized Gain/Loss Increase/Decrease in Capital Paid-In $18,861,420 $(18,861,420) Parnassus Core Equity Fund 52,780,941 (52,780,941) Parnassus Endeavor Fund 10,610,234 (10,610,234) - 6,564 (6,566) 2 Parnassus Mid Cap Fund Parnassus Small Cap Fund Parnassus Asia Fund Parnassus Fixed Income Fund $ - 387,900 (259) (387,641) 10,482 (2,029) (8,453) 853,367 (853,367) - 59 .
PARNASSUS FUNDS Annual Report • 2014 Notes to Financial Statements (continued) 6. Fair Value Measurements The following table summarizes the portfolios’ financial assets as of December 31, 2014, that is valued at fair value on a recurring basis: Parnassus Fund Investment Securities Level 1 Level 2 Level 3 Total Equities: Consumer Discretionary $ 83,914,900 $ - $ - $ 83,914,900 Consumer Staples 54,942,750 - - 54,942,750 Financials 82,107,798 - - 82,107,798 Healthcare 71,304,450 - - 71,304,450 Industrials 73,726,250 - - 73,726,250 Information Technology 278,860,600 - - 278,860,600 22,406,250 - - 22,406,250 Materials Short-Term Investments Total 19,140,914 $ 686,403,912 $ - 2,069,649 $ 2,069,649 21,210,563 $ 688,473,561 Parnassus Core Equity Fund Investment Securities Level 1 Level 2 Level 3 Total Equities: Consumer Discretionary $ Consumer Staples 507,101,310 $ - $ - $ 507,101,310 1,842,863,194 - - 1,842,863,194 Energy 709,762,500 - - 709,762,500 Financials 617,948,735 - - 617,948,735 Healthcare 1,786,050,930 - - 1,786,050,930 Industrials 1,658,333,285 - - 1,658,333,285 Information Technology 2,745,767,200 - - 2,745,767,200 Materials 440,613,030 - - 440,613,030 Utilities 669,445,430 - - 669,445,430 649,301,046 - 11,636,635 660,937,681 Short-Term Investments Total $ 11,627,186,660 $ - $ 11,636,635 $ 11,638,823,295 Parnassus Endeavor Fund Investment Securities Level 1 Level 2 Level 3 Total Equities: Consumer Discretionary $ 51,028,250 $ - $ - $ 51,028,250 Consumer Staples 74,342,175 - - 74,342,175 Financials 68,315,550 - - 68,315,550 Healthcare 86,994,400 - - 86,994,400 Industrials 74,620,450 Total 60 $ - 74,620,450 - - 325,336,850 125,861,184 Short-Term Investments - 325,336,850 Information Technology - - 125,861,184 806,498,859 $ - $ - $ 806,498,859 . PARNASSUS FUNDS Annual Report • 2014 Notes to Financial Statements (continued) Parnassus Mid Cap Fund Investment Securities Level 1 Level 2 Level 3 Total Equities: Consumer Discretionary $ 14,759,362 $ - $ - $ 14,759,362 Consumer Staples 17,692,757 - - 17,692,757 Energy 17,557,545 - - 17,557,545 Financials 38,948,252 - - 38,948,252 Healthcare 40,633,122 - - 40,633,122 Industrials 75,664,783 - - 75,664,783 Information Technology 48,280,948 - - 48,280,948 Materials 8,359,850 - - 8,359,850 Utilities 26,776,888 - - 26,776,888 24,640,829 - - 24,640,829 Short-Term Investments Total $ 313,314,336 $ - $ - $ 313,314,336 Parnassus Small Cap Fund Investment Securities Level 1 Level 2 Level 3 Total Equities: Consumer Discretionary $ 91,193,750 $ - $ - $ 91,193,750 Energy 36,115,000 - - 36,115,000 Financials 90,343,100 - - 90,343,100 Healthcare 42,788,750 - - 42,788,750 Industrials 138,127,310 - - 138,127,310 Information Technology 68,494,495 - - 68,494,495 Materials 54,869,015 - - 54,869,015 Utilities 36,785,400 - - 36,785,400 72,340,371 - - 72,340,371 Short-Term Investments Total $ 631,057,191 $ - $ - $ 631,057,191 61 . PARNASSUS FUNDS Annual Report • 2014 Notes to Financial Statements (continued) Parnassus Asia Fund Investment Securities China Level 1 $ 900,992 Level 2 $ - Level 3 $ - Total $ 900,992 Hong Kong 343,191 776,286 - 1,119,477 Indonesia 238,841 333,021 - 571,862 Japan 228,000 1,115,258 - 1,343,258 Philippines - 152,656 - 152,656 Singapore - 516,201 - 516,201 South Korea - 290,561 - 290,561 581,995 1,087,801 - 1,669,796 - 518,989 - 518,989 340,741 - - 340,741 Taiwan Thailand Short-Term Investments Total $ 2,633,760 $ 4,790,773 $ - $ 7,424,533 Parnassus Fixed Income Fund Investment Securities Commercial MortgageBacked Securities Level 1 $ - Level 2 $ 6,787,960 Level 3 $ - Total $ 6,787,960 Convertible Bonds - 306,969 - 306,969 Corporate Bonds - 84,583,375 - 84,583,375 Federal Agency MortgageBacked Securities - 33,814,932 - 33,814,932 Supranational Bonds - 7,002,709 - 7,002,709 U.S. Government Treasury Bonds - 51,455,599 - 51,455,599 Short-Term Investments Total 5,280,390 $ 5,280,390 $ 183,951,544 2,382,055 $ 2,382,055 7,662,445 $ 191,613,989 The following table reconciles the valuation of the Funds’ Level 3 investment securities and related transactions as of December 31, 2014: Parnassus Core Equity Fund Parnassus Fund Parnassus Fixed Income Fund Certificates of Deposit Certificates of Deposit Balance as of December 31, 2013 Community Development Loans $ 1,384,404 Discounts/premiums amortization Purchases 62 Community Development Loans $ 2,382,055 (14,755) 2,100,000 $ 98,929 11,850,000 2,500,000 (1,400,000) Sales Balance as of December 31, 2014 Community Development Loans $ 10,137,706 (10,450,000) (2,500,000) 2,069,649 $ 11,636,635 $ 2,382,055 . Annual Report • 2014 PARNASSUS FUNDS Notes to Financial Statements (continued) There were no significant transfers between Level 1, Level 2 and Level 3. Quantitative information about Level 3 fair value measurement: Fair Value at December 31, 2014 Valuation Technique Unobservable Input Range (Weighted Average) Parnassus Fund Certificates of Deposit 491,076 4% Liquidity Discount Discount for Lack of Marketability 6% 6% Liquidity Discount Discount for Lack of Marketability 4% Liquidity Discount Discount for Lack of Marketability 6% 6% Discount for Lack of Marketability 6% Probability of Default $ Discount for Lack of Marketability Probability of Default Community Development Loans 1,578,573 Liquidity Discount Probability of Default $ 6% Parnassus Core Equity Fund Certificates of Deposit $ Community Development Loans $ 2,705,225 8,931,410 Parnassus Fixed Income Fund Community Development Loans $ 2,382,055 Liquidity Discount The significant unobservable inputs used in fair value measurement of the Fund’s Certificates of Deposits are a discount for lack of marketability. The significant unobservable inputs used in the fair value measurement of the Fund’s Community Development Loans are a discount for lack of marketability and a discount for the probability of default. Significant increases in any of these inputs in isolation would result in a lower fair value measurement. Generally, a change in the assumption used for probability of default should be accompanied by a directionally-similar change in the assumption used for the lack of marketability. Certain foreign securities may be fair valued by independent pricing services if events occur between the time at which the market quotations are determined on the primary exchange and the close of trading on the NYSE.
These events may affect the value of these securities and render market quotations unreliable. Such fair valuations are categorized as Level 2 investments. Foreign securities that are valued based on market quotations are categorized as Level 1 investments. In accordance with procedures established by the Funds’ Trustees, all fair value securities as submitted by the Funds’ treasurer, are reviewed and approved by the Trustees. The Funds’ valuation committee is comprised of Independent Trustees who also comprise the Funds’ audit committee.
The committee reviews the methodologies used by the Funds when securities have been identified as being fair valued and include the percentages used when determining liquidity discounts or discounts to be taken for lack of marketability. The Trustees review the changes in fair value measurement and methods used to substantiate the unobservable inputs on a quarterly basis. 7. Capital Stock Capital stock consists of an unlimited number of authorized shares of capital stock with no par value. 63 .
PARNASSUS FUNDS Annual Report • 2014 Notes to Financial Statements (continued) 8. Purchases and Sales of Securities Purchases and proceeds from sales of securities, excluding short-term securities, for the period ended December 31, 2014 were as follows: Affiliated Purchases Fund Unaffiliated Purchases Parnassus Fund $ - $ 378,656,217 Parnassus Core Equity Fund 18,589,806 Parnassus Endeavor Fund Parnassus Mid Cap Fund Parnassus Small Cap Fund Affiliated Sales $ Unaffiliated Sales - $ 360,307,449 3,314,905,807 - 1,315,324,665 - 336,705,930 - 200,016,073 - 87,441,390 - 53,777,043 20,085,862 423,956,526 9,627,529 644,992,729 Parnassus Asia Fund - 5,177,472 - 1,195,635 Parnassus Fixed Income Fund - 105,482,880 - 91,968,951 The above includes purchases and sales of U.S. Government securities in the amount of $20,382,383 and $51,133,731, respectively, within the Parnassus Fixed Income Fund. 9. Investment Advisory Agreement and Transactions with Affiliates Under terms of an agreement which provides for furnishing investment management and advice to the Funds, Parnassus Investments is entitled to receive fees payable monthly, based on each Fund’s average daily net assets for the month, at the following annual rates: Parnassus Fund: 1.00% of the first $10,000,000, 0.75% of the next $20,000,000, 0.70% of the next $70,000,000, 0.65% of the next $100,000,000 and 0.60% of the amount above $200,000,000.
Parnassus Endeavor Fund and Parnassus Mid Cap Fund: 0.85% of the first $100,000,000, 0.80% of the next $100,000,000, 0.75% of the next $300,000,000 and 0.70% of the amount above $500,000,000. Parnassus Small Cap Fund: 1.00% of the first $100,000,000, 0.90% of the next $100,000,000, 0.85% of the next $300,000,000 and 0.80% of the amount above $500,000,000. Parnassus Asia Fund: 1.10% of the first $100,000,000, 1.05% of the next $400,000,000 and 1.00% of the amount above $500,000,000.
For the year ended December 31, 2014, Parnassus Investments has contractually agreed to limit total operating expenses to 0.99% of net assets for the Parnassus Fund, 0.95% of net assets for the Parnassus Endeavor Fund, and 1.20% of the net assets for the Parnassus Mid Cap Fund and Parnassus Small Cap Fund, and reduce its investment advisory fee to the extent necessary to limit total operating expenses to 1.25% of the net assets of the Parnassus Asia Fund. Parnassus Core Equity Fund: 0.75% of the first $30,000,000, 0.70% of the next $70,000,000, 0.65% of the next $400,000,000 and 0.60% of the amount above $500,000,000. Parnassus Fixed Income Fund: 0.50% of the first $200,000,000, 0.45% of the next $200,000,000 and 0.40% of the amount above $400,000,000. For the year ended December 31, 2014, Parnassus Investments has contractually agreed to limit total operating expenses to 0.99% of net assets for the Parnassus Core Equity Fund – Investor Shares and 0.78% of net assets for the Parnassus Core Equity Fund – Institutional Shares and reduce its investment advisory fee to the extent necessary to limit total operating expenses to 0.68% of net assets for the Parnassus Fixed Income Fund. Parnassus Investments receives fees under terms of a separate agreement which provides for furnishing transfer agent and fund administration services to the Funds.
The transfer agent fee was $2.50 per month per account plus any out-of-pocket expenses for the Parnassus Fund, Parnassus Endeavor Fund, Parnassus Mid Cap Fund, Parnassus Small Cap Fund and Parnassus Asia Fund. The transfer agent fee was $2.70 per month per account plus any out-of-pocket expenses for the Parnassus Core Equity Fund and Parnassus Fixed Income Fund. The Funds pay the monthly fee based on the number of accounts on record at each month-end.
The fund administration reflects annual rates based on net assets for all Funds managed by Parnassus Investments and was allocated based on respective Fund net assets. The fund administration services fee was 0.03% of average net assets under this new agreement for the year ended December 31, 2014. 64 . Annual Report • 2014 PARNASSUS FUNDS Notes to Financial Statements (continued) Parnassus Investments may also arrange for third parties to provide certain services, including account maintenance, recordkeeping and other personal services to their clients who invest in the Funds. For these services, the Funds may pay service providers an aggregate service fee on investment accounts at a rate not to exceed 0.25% per annum of average daily net assets. The Parnassus Core Equity Fund – Institutional Shares does not incur service provider fees. 10. Investments in affiliates The 1940 Act defines “affiliated companies” to include investments in portfolio companies in which a Fund owns 5% or more of the outstanding voting shares.
During the year ended December 31, 2014, the Funds below held 5% or more of the outstanding voting shares of the noted portfolio companies. During this period, other Funds in the Trust may also have held voting shares of the issuers at a level below 5%. A summary of transactions in securities of issuers affiliated with a Fund for the year ended December 31, 2014 is set forth below. Beginning shares as of December 31, 2013 Shares purchased Ending shares as of December 31, 2014 Shares sold Market Value of affiliates at December 31, 2014 Dividend Income January 1, 2014 December 31, 2014 Parnassus Core Equity Fund Name of Company: Compass Minerals International Inc. 1,941,000 - - 1,941,000 $168,537,030 $ 4,658,400 Northwest Natural Gas Co. 2,000,000 300,000 - 2,300,000 114,770,000 3,887,494 WD-40 Co. 1,140,000 80,000 - 1,220,000 103,797,600 1,589,518 $387,104,630 Total Affiliates $10,135,412 $ 29,899,945 $ Parnassus Small Cap Fund Name of Company: Checkpoint Systems Inc. Covisint Corp. Total Affiliates 1,785,000 1,105,000 712,291 2,177,709 - 2,215,000 - 2,215,000 5,869,750 $ 35,769,695 - $ - 65 . PARNASSUS FUNDS Annual Report • 2014 Financial Highlights Selected data for each share of capital stock outstanding, total return and ratios/supplement data for each of the five years ended December 31 are as follows: For a Share Outstanding for the Year Ended Net Asset Net Realized and Dividends Net Investment Total from Value Unrealized from Net Income Investment Beginning Gain (Loss) on Investment (Loss)(a) Operations(a) of Year Securities(a) Income Parnassus Fund 2014 $45.86 $0.22 2013 40.62 0.25 2012 35.23 0.28 2011 40.49 0.13 2010 34.82 0.15 Parnassus Core Equity Fund – Investor Shares 2014 36.68 0.43 2013 29.20 0.44 2012 26.35 0.39 2011 26.31 0.32 2010 24.45 0.30 Parnassus Core Equity Fund – Institutional Shares 2014 36.73 0.45 2013 29.26 0.49 2012 26.41 0.45 2011 26.36 0.38 2010 24.51 0.38 Parnassus Endeavor Fund 2014 26.99 0.18 2013 22.17 0.14 2012 19.64 0.12 2011 20.81 0.05 2010 19.45 0.02 Parnassus Mid Cap Fund 2014 25.10 0.22 2013 20.27 0.13 2012 17.69 0.16 2011 18.25 0.06 2010 16.28 0.30 Parnassus Small Cap Fund 2014 28.72 (0.02) 2013 23.77 (0.04) 2012 20.08 -(c) 2011 23.95 (0.04) 2010 17.92 0.15 Parnassus Asia Fund 2014 15.67 0.19 For the period ended December 31, 2013(d) 15.00 (0.07) Parnassus Fixed Income Fund 2014 16.43 0.31 2013 17.56 0.29 2012 17.53 0.31 2011 16.90 0.33 2010 16.74 0.45 66 Distributions from Net Distributions Total Realized from Return Dividends and Gains on of Capital Distributions Securities $6.47 13.34 8.64 (2.25) 5.67 $6.69 13.59 8.92 (2.12) 5.82 $(1.62) (1.94) (0.80) (0.12) (0.15) $(2.84) (6.41) (2.73) (3.02) - $- $(4.46) (8.35) (3.53) (3.14) (0.15) 4.84 9.39 3.64 0.48 1.85 5.27 9.83 4.03 0.80 2.15 (0.59) (0.48) (0.74) (0.31) (0.29) (0.67) (1.87) (0.44) (0.45) - - (1.26) (2.35) (1.18) (0.76) (0.29) 4.91 9.39 3.64 0.50 1.82 5.36 9.88 4.09 0.88 2.20 (0.67) (0.54) (0.80) (0.38) (0.35) (0.67) (1.87) (0.44) (0.45) - - (1.34) (2.41) (1.24) (0.83) (0.35) 4.79 6.71 4.13 (0.40) 2.48 4.97 6.85 4.25 (0.35) 2.50 (0.51) (0.50) (0.50) (0.05) (0.50) (1.50) (1.53) (1.22) (0.77) (0.64) - (2.01) (2.03) (1.72) (0.82) (1.14) 2.60 5.58 3.10 0.51 2.70 2.82 5.71 3.26 0.57 3.00 (0.20) (0.26) (0.30) (0.13) (0.24) (0.32) (0.62) (0.38) (1.00) (0.79) - (0.52) (0.88) (0.68) (1.13) (1.03) 0.33 6.71 3.69 (3.15) 6.53 0.31 6.67 3.69 (3.19) 6.68 (0.41) -(c) (0.47) (5.26) (1.31) -(c) (0.68) (0.18) - (5.26) (1.72) -(c) (0.68) (0.65) 1.04 1.23 (0.18) - - (0.18) 0.74 0.67 - - 0.43 (0.76) 0.05 0.88 0.65 0.74 (0.47) 0.36 1.21 1.10 (0.37) (0.29) (0.33) (0.34) (0.59) (0.14) (0.31) -(c) (0.24) (0.35) (0.06) - (0.51) (0.66) (0.33) (0.58) (0.94) . Annual Report • 2014 Net Asset Value End of Year Total Overall Return Net Assets End of Year (000s) Ratio of Gross Expenses to Average Net Assets Parnassus Fund $48.09 14.68% $679,130 0.84% 45.86 34.22 572,301 0.86 40.62 26.04 470,136 0.90 35.23 (5.01) 354,572 0.94 40.49 16.71 444,457 0.97 Parnassus Core Equity Fund – Investor Shares 40.69 14.48 8,558,905 0.87 36.68 34.01 6,282,235 0.87 29.20 15.43 4,023,309 0.90 26.35 3.13 3,398,905 0.94 26.31 8.89 3,150,408 0.99 Parnassus Core Equity Fund – Institutional Shares 40.75 14.71 3,024,069 0.67 36.73 34.13 1,809,054 0.69 29.26 15.64 1,006,980 0.68 26.41 3.40 630,035 0.70 26.36 9.07 407,423 0.75 Parnassus Endeavor Fund 29.95 18.51 770,332 1.02 26.99 31.15 475,940 1.07 22.17 22.03 281,029 1.14 19.64 (1.62) 216,269 1.16 20.81 12.96 143,491 1.25 Parnassus Mid Cap Fund 27.40 11.24 305,297 1.09 25.10 28.27 241,162 1.14 20.27 18.58 128,964 1.23 17.69 3.33 61,299 1.24 18.25 18.70 36,811 1.46 Parnassus Small Cap Fund 23.77 0.98 560,462 1.20 28.72 28.33 775,655 1.20 23.77 18.40 679,980 1.23 20.08 (13.29) 644,825 1.22 23.95 37.37 445,343 1.30 Parnassus Asia Fund 16.72 7.84 7,457 3.53 15.67 4.47(e) 3,376 Parnassus Fixed Income Fund 16.66 4.49 192,614 16.43 (2.71) 175,790 17.56 2.08 225,723 17.53 7.24 211,723 16.90 6.61 180,186 Ratio of Net Expenses to Average Net Assets (Net of Waiver and Expense Offset Arrangements)(b) Ratio of Net Investment Income (Loss) to Average Net Assets PARNASSUS FUNDS Portfolio Turnover Rate 0.84% 0.86 0.90 0.94 0.97 0.47% 0.54 0.70 0.33 0.42 60.44% 64.87 52.72 74.43 51.77 0.87 0.87 0.90 0.94 0.99 1.11 1.28 1.38 1.19 1.23 14.32 16.93 24.34 63.04 54.30 0.67 0.69 0.68 0.70 0.75 1.17 1.44 1.59 1.43 1.54 14.32 16.93 24.34 63.04 54.30 0.95 1.07 1.14 1.16 1.20 0.62 0.53 0.54 0.22 0.09 39.51 41.20 69.25 47.22 53.85 1.09 1.14 1.20 1.20 1.20 0.84 0.55 0.79 0.35 1.73 21.62 20.70 22.82 38.67 53.22 1.20 1.20 1.20 1.20 1.20 (0.06) (0.15) (0.02) (0.18) 0.75 67.96 49.36 32.85 39.50 35.33 1.25 1.11 24.41 5.08(f) 1.45(f) 0.78 0.78 0.79 0.81 0.83 0.68 0.68 0.75 0.75 0.75 (0.71)(f) 1.84 1.70 1.78 1.92 2.60 3.00(e) 52.57 35.15 5.45 29.25 56.06 (a) Income (loss) from operations per share is based on average daily shares outstanding. (b) Parnassus Investments has contractually limited expenses to an annualized rate of 0.95% for the Parnassus Endeavor Fund, 1.20% for the Parnassus Small Cap Fund, 1.25% for the Parnassus Asia Fund and 0.68% for the Parnassus Fixed Income Fund. (c) Amount less than $0.01. (d) The Parnassus Asia Fund commenced operations on April 30, 2013, and the period shown is from April 30, 2013 through December 31, 2013. (e) Not annualized for periods less than one year. (f) Annualized. 67 . PARNASSUS FUNDS Annual Report • 2014 ADDITIONAL INFORMATION (unaudited) Board of Trustees and Officers Independent Trustees§ Name Donald V. Potter Jeanie S. Joe Donald J. Boteler Alecia A.
DeCoudreaux Age 69 67 66 60 Address 1 Market Street, Suite 1600 San Francisco, California 94105 1 Market Street, Suite 1600 San Francisco, California 94105 1 Market Street, Suite 1600 San Francisco, California 94105 1 Market Street, Suite 1600 San Francisco, California 94105 Position(s) Held with Funds Lead Independent Trustee Trustee Trustee, Audit Committee Chairman Trustee Term of Office and Length of Service Indefinite. Since 2002. Indefinite.
Since October 2004. Indefinite. Since 2012. Indefinite.
Since December 2013 Principal Occupation(s) During Past 5 Years President of Strategystreet.com business strategy. President of Geo/ Resource Consultants, a geotechnical and environmental consulting firm, until 2009. Vice President, Operations & Continuing Education, Investment Company Institute, from 1986 to March 2012. Independent Trustee, FAM Funds, from October 2012 to present. President of Mills College since 2011. Various positions with Eli Lilly and affiliates from 1980-2011, including Vice President and General Counsel of Lilly USA from 2005-2009. Immediate Past Chair to the Wellesley College Board of Trustees. Honorary Director of the Indiana University Foundation and Emeritus Board Member of the Indiana University School of Law Board of Visitors, since 2007. Portfolios in the Fund Complex Overseen by Trustee Seven Seven Seven Seven Other Directorships Held by Trustee None None None None 68 .
Annual Report • 2014 PARNASSUS FUNDS ADDITIONAL INFORMATION (unaudited) (continued) Board of Trustees and Officers (continued) Interested Trustee† Name Jerome L. Dodson Age 71 Address 1 Market Street, Suite 1600 San Francisco, California 94105 Position(s) Held with Funds President and Trustee Term of Office and Length of Service Indefinite. Since 1992 for Parnassus Income Funds. Since 1984 for the Parnassus Funds. Principal Occupation(s) During Past 5 Years President and Trustee of the Parnassus Funds and the Parnassus Income Funds since their inceptions; President and Director of Parnassus Investments since June 1984. Portfolios in the Fund Complex Overseen by Trustee Seven Other Directorships Held by Trustee None § “Independent” Trustees are Trustees who are not deemed to be “interested persons” of the Funds as defined in the Investment Company Act of 1940. † An “interested” Trustee is a Trustee who is deemed to be an “interested person” of the Funds, as defined in the Investment Company Act of 1940.
Jerome L. Dodson is an interested person of the Funds because of his ownership in the Funds’ investment adviser and because he is an officer of the Trusts. Additional information about the Fund’s Board of Trustees is available in the Statement of Additional Information. The Statement of Additional Information is available without charge on the Securities and Exchange Commission’s website (www.sec.gov) or by calling us at (800) 999-3505 or at the Parnassus website, www.parnassus.com. 69 .
PARNASSUS FUNDS Annual Report • 2014 ADDITIONAL INFORMATION (unaudited) (continued) Board of Trustees and Officers (continued) Officers Name Todd C. Ahlsten Marc C. Mahon John V. Skidmore II Age 42 37 49 Address 1 Market Street, Suite 1600 San Francisco, California 94105 1 Market Street, Suite 1600 San Francisco, California 94105 1 Market Street, Suite 1600 San Francisco, California 94105 Position(s) Held with Funds Vice President Treasurer Chief Compliance Officer and Assistant Secretary Term of Office and Length of Service Indefinite.
Since 2001. Indefinite. Since 2007. Indefinite. Since 2008. Principal Occupation(s) During Past 5 Years Vice President of the Parnassus Funds and Parnassus Income Funds since 2001.
Chief Investment Officer of Parnassus Investments since 2007. Director of Research at Parnassus Investments from 1995 to 2007. Portfolio Manager of Parnassus Core Equity Fund since 2001. Chief Financial Officer of Parnassus Investments since 2007.
Treasurer of Parnassus Funds and Parnassus Income Funds since 2007. Chief Compliance Officer of Parnassus Investments since 2008. 70 . Annual Report • 2014 PARNASSUS FUNDS ADDITIONAL INFORMATION (unaudited) (continued) Proxy Disclosures Parnassus proxy voting policies and procedures are available, without charge, on our website (www.parnassus.com), on the Securities and Exchange Commission’s website (www.sec.gov) and by calling us at (800) 999-3505. The Funds file a proxy voting record with the Securities and Exchange Commission for the 12 months ended June 30. The most recent report is available by calling Parnassus or it may be obtained from the Securities and Exchange Commission’s website or the Parnassus website. Quarterly Portfolio Schedule The Funds file their complete schedule of portfolio holdings with the Securities and Exchange Commission for the first and third quarters of each fiscal year on Form N-Q. The quarterly portfolio holdings are available on the Securities and Exchange Commission’s website (www.sec.gov).
The Funds’ Form N-Q may also be reviewed and copied at the Securities and Exchange Commission’s Public Reference Room in Washington, DC, and information on the operation of the Public Reference Room may be obtained by calling (800) SEC-0330. Federal Income Tax Information For the year ended December 31, 2014, the following percentages of ordinary income distributed by the Funds that qualify for the individual qualified dividend income deduction (QDI) and the corporate dividends received deduction (DRD) are as follows: Fund QDI DRD 29.77% 29.77% 100.00% 100.00% Parnassus Endeavor Fund 56.13% 56.21% Parnassus Mid Cap Fund 100.00% 100.00% 48.08% 48.26% 100.00% 100.00% 0.00% 0.00% Parnassus Fund Parnassus Core Equity Fund Parnassus Small Cap Fund Parnassus Asia Fund Parnassus Fixed Income Fund 71 . Go Paperless with E-Delivery Sign up for electronic delivery of prospectuses, shareholder reports and account statements at www.parnassus.com/gopaperless If you do not hold your account directly with Parnassus, please contact the firm that holds your account to inquire about electronic delivery. PARNASSUS FUNDS 1 Market Street, Suite 1600 San Francisco, CA 94105 (800) 999-3505 www.parnassus.com This report must be preceded or accompanied by a current prospectus. Investment Adviser Parnassus Investments 1 Market Street, Suite 1600 San Francisco, CA 94105 Independent Registered Public Accounting Firm Deloitte and Touche, LLP 555 Mission Street San Francisco, CA 94105 Legal Counsel Foley and Lardner LLP 777 E. Wisconsin Ave. Milwaukee, WI 53202 Distributor Parnassus Funds Distributor 1 Market Street, Suite 1600 San Francisco, CA 94105 .


