Parnassus Core Equity Fund – Fund Fact Sheet as of December 31, 2015
Parnassus Investments


Description
Parnassus Core Equity Fund
OVERALL MORNINGSTAR RATINGTM
SM
ï‚«ï‚«ï‚«ï‚«ï‚«
Overall rating out of 1,407 Large Blend funds as of
12/31/2015.
Fourth Quarter 2015
All information, unless otherwise indicated, is as of 12/31/2015
Objective
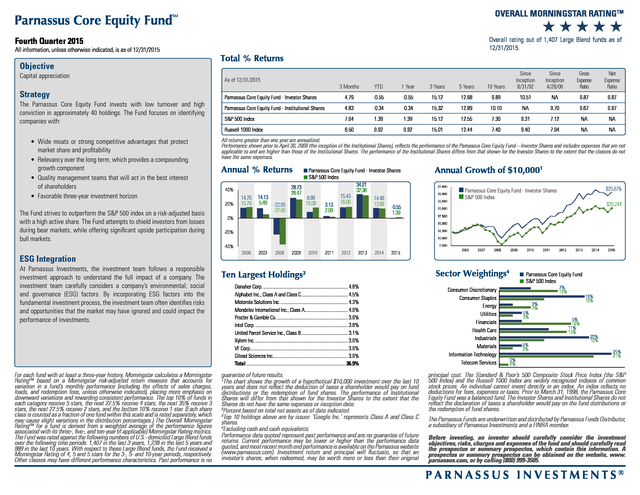
Total % Returns
Capital appreciation
3 Months
Strategy
Parnassus Core Equity Fund - Investor Shares
The Parnassus Core Equity Fund invests with low turnover and high
conviction in approximately 40 holdings. The Fund focuses on identifying
companies with:
YTD
1 Year
3 Years
5 Years
10 Years
Since
Inception
8/31/92
4.79
As of 12/31/2015
-0.55
-0.55
15.12
12.68
9.89
10.51
Since
Inception
4/28/06
Gross
Expense
Ratio
Net
Expense
Ratio
NA
0.87
0.87
0.67
4.83
-0.34
-0.34
15.32
12.89
10.10
NA
9.70
0.67
7.04
1.39
1.39
15.12
12.55
7.30
9.31
7.12
NA
NA
Russell 1000 Index
• ide moats or strong competitive advantages that protect
W
market share and profitability
• Relevancy over the long term, which provides a compounding
growth component
• Quality management teams that will act in the best interest
of shareholders
• Favorable three-year investment horizon
Parnassus Core Equity Fund - Institutional Shares
S&P 500 Index
6.50
0.92
0.92
15.01
12.44
7.40
9.40
7.04
NA
NA
All returns greater than one year are annualized.
Performance shown prior to April 30, 2006 (the inception of the Institutional Shares), reflects the performance of the Parnassus Core Equity Fund—Investor Shares and includes expenses that are not
applicable to and are higher than those of the Institutional Shares. The performance of the Institutional Shares differs from that shown for the Investor Shares to the extent that the classes do not
have the same expenses.
Annual % Returns
14.13
5.49 -22.95
-37.00
2006
2007
2009
40%
20%
The Fund strives to outperform the S&P 500 index on a risk-adjusted basis
with a high active share. The Fund attempts to shield investors from losses
during bear markets, while offering significant upside participation during
bull markets.
14.70
15.79
Parnassus Core Equity Fund - Investor Shares
S&P 500 Index
34.01
28.73
32.38
26.47
15.43
8.89
14.48
16.00
15.08
13.68
3.13
-0.55
2.09
1.39
0%
Annual Growth of $10,0001
$25,675
Parnassus Core Equity Fund - Investor Shares
S&P 500 Index
$20,241
-20%
-40%
ESG Integration
At Parnassus Investments, the investment team follows a responsible
investment approach to understand the full impact of a company.
The investment team carefully considers a company’s environmental, social and governance (ESG) factors. By incorporating ESG factors into the fundamental investment process, the investment team often identifies risks and opportunities that the market may have ignored and could impact the performance of investments. For each fund with at least a three-year history, Morningstar calculates a Morningstar RatingTM based on a Morningstar risk-adjusted return measure that accounts for variation in a fund’s monthly performance (including the effects of sales charges, loads, and redemption fees, unless otherwise indicated), placing more emphasis on downward variations and rewarding consistent performance. The top 10% of funds in each category receive 5 stars, the next 22.5% receive 4 stars, the next 35% receive 3 stars, the next 22.5% receive 2 stars, and the bottom 10% receive 1 star.
(Each share class is counted as a fraction of one fund within this scale and is rated separately, which may cause slight variations in the distribution percentages.) The Overall Morningstar RatingTM for a fund is derived from a weighted average of the performance figures associated with its three-, five-, and ten-year (if applicable) Morningstar Rating metrics. The Fund was rated against the following numbers of U.S.- domiciled Large Blend funds over the following time periods: 1,407 in the last 3 years, 1,238 in the last 5 years and 889 in the last 10 years. With respect to these Large Blend funds, the Fund received a Morningstar Rating of 4, 5 and 5 stars for the 3-, 5- and 10-year periods, respectively. Other classes may have different performance characteristics. Past performance is no 2008 2010 2011 2012 2013 2014 2015 Ten Largest Holdings2 Danaher Corp............................................................................
4.8% Alphabet Inc., Class A and Class C.......................................... 4.5% Motorola Solutions Inc............................................................. 4.3% Mondelez International Inc., Class A......................................
4.0% Procter & Gamble Co................................................................ 3.6% Intel Corp................................................................................... 3.6% United Parcel Service Inc., Class B..........................................
3.1% Xylem Inc................................................................................... 3.0% VF Corp...................................................................................... 3.0% Gilead Sciences Inc..................................................................
3.0% Total........................................................................................ 36.9% guarantee of future results. 1 The chart shows the growth of a hypothetical $10,000 investment over the last 10 years and does not reflect the deduction of taxes a shareholder would pay on fund distributions or the redemption of fund shares. The performance of Institutional Shares will differ from that shown for the Investor Shares to the extent that the Shares do not have the same expenses or inception date. 2 Percent based on total net assets as of date indicated. 3 Top 10 holdings above are by issuer.
‘Google Inc.’ represents Class A and Class C shares. 4 Excluding cash and cash equivalents. Performance data quoted represent past performance and are no guarantee of future returns. Current performance may be lower or higher than the performance data quoted, and most recent month end performance is available on the Parnassus website (www.parnassus.com). Investment return and principal will fluctuate, so that an investor’s shares, when redeemed, may be worth more or less than their original Sector Weightings4 Consumer Discretionary Consumer Staples Energy Utilities Financials Health Care Industrials Materials Information Technology Telecom Services Parnassus Core Equity Fund S&P 500 Index 7% 13% 5% 3% 5% 3% 0% 2% 19% 10% 3% 7% 5% 16% 11% 15% 20% 10% 25% 21% principal cost.
The Standard & Poor’s 500 Composite Stock Price Index (the S&P 500 Index) and the Russell 1000 Index are widely recognized indexes of common stock prices. An individual cannot invest directly in an index. An index reflects no deductions for fees, expenses or taxes.
Prior to March 31, 1998, the Parnassus Core Equity Fund was a balanced fund. The Investor Shares and Institutional Shares do not reflect the declaration of taxes a shareholder would pay on the fund distributions or the redemption of fund shares. The Parnassus Funds are underwritten and distributed by Parnassus Funds Distributor, a subsidiary of Parnassus Investments and a FINRA member. Before investing, an investor should carefully consider the investment objectives, risks, charges and expenses of the fund and should carefully read the prospectus or summary prospectus, which contain this information. A prospectus or summary prospectus can be obtained on the website, www. parnassus.com, or by calling (800) 999-3505. PARNASSUS INVESTMENTS® .
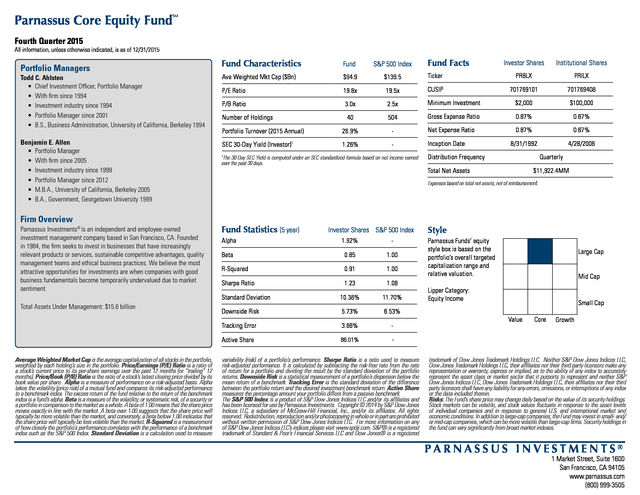
Parnassus Core Equity Fund SM Fourth Quarter 2015 All information, unless otherwise indicated, is as of 12/31/2015 Portfolio Managers Todd C. Ahlsten • Chief Investment Officer, Portfolio Manager • With firm since 1994 • Investment industry since 1994 • Portfolio Manager since 2001 • B.S., Business Administration, University of California, Berkeley 1994 Benjamin E. Allen • Portfolio Manager • With firm since 2005 • Investment industry since 1999 • Portfolio Manager since 2012 • M.B.A., University of California, Berkeley 2005 • B.A., Government, Georgetown University 1999 Firm Overview Parnassus Investments® is an independent and employee-owned investment management company based in San Francisco, CA. Founded in 1984, the firm seeks to invest in businesses that have increasingly relevant products or services, sustainable competitive advantages, quality management teams and ethical business practices.
We believe the most attractive opportunities for investments are when companies with good business fundamentals become temporarily undervalued due to market sentiment. Fund Characteristics Fund S&P 500 Index Ave Weighted Mkt Cap ($Bn) $94.9 $139.5 P/E Ratio 19.8x P/B Ratio Investor Shares Institutional Shares Ticker PRBLX PRILX 19.5x CUSIP 701769101 701769408 3.0x 2.5x Minimum Investment $2,000 $100,000 40 504 Gross Expense Ratio 0.87% 0.67% Portfolio Turnover (2015 Annual) 26.9% - Net Expense Ratio 0.87% 0.67% SEC 30-Day Yield (Investor)1 1.26% - Inception Date 8/31/1992 4/28/2006 Number of Holdings The 30-Day SEC Yield is computed under an SEC standardized formula based on net income earned over the past 30 days. 1 Fund Statistics (5 year) Investor Shares S&P 500 Index Alpha 1.92% - Beta 0.85 1.00 R-Squared 0.91 1.00 Sharpe Ratio 1.23 1.08 10.38% 11.70% Downside Risk 5.73% 6.53% Tracking Error 3.66% - Active Share Average Weighted Market Cap is the average capitalization of all stocks in the portfolio, weighted by each holding’s size in the portfolio. Price/Earnings (P/E) Ratio is a ratio of a stock’s current price to its per-share earnings over the past 12 months (or “trailing” 12 months). Price/Book (P/B) Ratio is the ratio of a stock’s latest closing price divided by its book value per share.
Alpha is a measure of performance on a risk-adjusted basis. Alpha takes the volatility (price risk) of a mutual fund and compares its risk-adjusted performance to a benchmark index. The excess return of the fund relative to the return of the benchmark index is a fund’s alpha.
Beta is a measure of the volatility, or systematic risk, of a security or a portfolio in comparison to the market as a whole. A beta of 1.00 means that the share price moves exactly in line with the market. A beta over 1.00 suggests that the share price will typically be more volatile than the market, and conversely, a beta below 1.00 indicates that the share price will typically be less volatile than the market.
R-Squared is a measurement of how closely the portfolio’s performance correlates with the performance of a benchmark index such as the S&P 500 Index. Standard Deviation is a calculation used to measure Distribution Frequency Quarterly Total Net Assets $11,922.4MM Expenses based on total net assets, net of reimbursement. Standard Deviation Total Assets Under Management: $15.6 billion Fund Facts 86.01% Style - variability (risk) of a portfolio’s performance. Sharpe Ratio is a ratio used to measure risk-adjusted performance.
It is calculated by subtracting the risk-free rate from the rate of return for a portfolio and dividing the result by the standard deviation of the portfolio returns. Downside Risk is a statistical measurement of a portfolio’s dispersion below the mean return of a benchmark. Tracking Error is the standard deviation of the difference between the portfolio return and the desired investment benchmark return.
Active Share measures the percentage amount your portfolio differs from a passive benchmark. The S&P 500 Index is a product of S&P Dow Jones Indices LLC and/or its affiliates and has been licensed for use by Parnassus Investments. Copyright © 2014 by S&P Dow Jones Indices LLC, a subsidiary of McGraw-Hill Financial, Inc., and/or its affiliates. All rights reserved.
Redistribution, reproduction and/or photocopying in whole or in part are prohibited without written permission of S&P Dow Jones Indices LLC. For more information on any of S&P Dow Jones Indices LLC’s indices please visit www.spdji.com. S&P® is a registered trademark of Standard & Poor’s Financial Services LLC and Dow Jones® is a registered Parnassus Funds’ equity style box is based on the portfolio’s overall targeted capitalization range and relative valuation. Large Cap Mid Cap Lipper Category: Equity Income Small Cap Value Core Growth trademark of Dow Jones Trademark Holdings LLC.
Neither S&P Dow Jones Indices LLC, Dow Jones Trademark Holdings LLC, their affiliates nor their third party licensors make any representation or warranty, express or implied, as to the ability of any index to accurately represent the asset class or market sector that it purports to represent and neither S&P Dow Jones Indices LLC, Dow Jones Trademark Holdings LLC, their affiliates nor their third party licensors shall have any liability for any errors, omissions, or interruptions of any index or the data included therein. Risks: The Fund’s share price may change daily based on the value of its security holdings. Stock markets can be volatile, and stock values fluctuate in response to the asset levels of individual companies and in response to general U.S. and international market and economic conditions. In addition to large-cap companies, the Fund may invest in small- and/ or mid-cap companies, which can be more volatile than large-cap firms.
Security holdings in the fund can vary significantly from broad market indexes. PARNASSUS INVESTMENTS® 1 Market Street, Suite 1600 San Francisco, CA 94105 www.parnassus.com (800) 999-3505 .
The investment team carefully considers a company’s environmental, social and governance (ESG) factors. By incorporating ESG factors into the fundamental investment process, the investment team often identifies risks and opportunities that the market may have ignored and could impact the performance of investments. For each fund with at least a three-year history, Morningstar calculates a Morningstar RatingTM based on a Morningstar risk-adjusted return measure that accounts for variation in a fund’s monthly performance (including the effects of sales charges, loads, and redemption fees, unless otherwise indicated), placing more emphasis on downward variations and rewarding consistent performance. The top 10% of funds in each category receive 5 stars, the next 22.5% receive 4 stars, the next 35% receive 3 stars, the next 22.5% receive 2 stars, and the bottom 10% receive 1 star.
(Each share class is counted as a fraction of one fund within this scale and is rated separately, which may cause slight variations in the distribution percentages.) The Overall Morningstar RatingTM for a fund is derived from a weighted average of the performance figures associated with its three-, five-, and ten-year (if applicable) Morningstar Rating metrics. The Fund was rated against the following numbers of U.S.- domiciled Large Blend funds over the following time periods: 1,407 in the last 3 years, 1,238 in the last 5 years and 889 in the last 10 years. With respect to these Large Blend funds, the Fund received a Morningstar Rating of 4, 5 and 5 stars for the 3-, 5- and 10-year periods, respectively. Other classes may have different performance characteristics. Past performance is no 2008 2010 2011 2012 2013 2014 2015 Ten Largest Holdings2 Danaher Corp............................................................................
4.8% Alphabet Inc., Class A and Class C.......................................... 4.5% Motorola Solutions Inc............................................................. 4.3% Mondelez International Inc., Class A......................................
4.0% Procter & Gamble Co................................................................ 3.6% Intel Corp................................................................................... 3.6% United Parcel Service Inc., Class B..........................................
3.1% Xylem Inc................................................................................... 3.0% VF Corp...................................................................................... 3.0% Gilead Sciences Inc..................................................................
3.0% Total........................................................................................ 36.9% guarantee of future results. 1 The chart shows the growth of a hypothetical $10,000 investment over the last 10 years and does not reflect the deduction of taxes a shareholder would pay on fund distributions or the redemption of fund shares. The performance of Institutional Shares will differ from that shown for the Investor Shares to the extent that the Shares do not have the same expenses or inception date. 2 Percent based on total net assets as of date indicated. 3 Top 10 holdings above are by issuer.
‘Google Inc.’ represents Class A and Class C shares. 4 Excluding cash and cash equivalents. Performance data quoted represent past performance and are no guarantee of future returns. Current performance may be lower or higher than the performance data quoted, and most recent month end performance is available on the Parnassus website (www.parnassus.com). Investment return and principal will fluctuate, so that an investor’s shares, when redeemed, may be worth more or less than their original Sector Weightings4 Consumer Discretionary Consumer Staples Energy Utilities Financials Health Care Industrials Materials Information Technology Telecom Services Parnassus Core Equity Fund S&P 500 Index 7% 13% 5% 3% 5% 3% 0% 2% 19% 10% 3% 7% 5% 16% 11% 15% 20% 10% 25% 21% principal cost.
The Standard & Poor’s 500 Composite Stock Price Index (the S&P 500 Index) and the Russell 1000 Index are widely recognized indexes of common stock prices. An individual cannot invest directly in an index. An index reflects no deductions for fees, expenses or taxes.
Prior to March 31, 1998, the Parnassus Core Equity Fund was a balanced fund. The Investor Shares and Institutional Shares do not reflect the declaration of taxes a shareholder would pay on the fund distributions or the redemption of fund shares. The Parnassus Funds are underwritten and distributed by Parnassus Funds Distributor, a subsidiary of Parnassus Investments and a FINRA member. Before investing, an investor should carefully consider the investment objectives, risks, charges and expenses of the fund and should carefully read the prospectus or summary prospectus, which contain this information. A prospectus or summary prospectus can be obtained on the website, www. parnassus.com, or by calling (800) 999-3505. PARNASSUS INVESTMENTS® .
Parnassus Core Equity Fund SM Fourth Quarter 2015 All information, unless otherwise indicated, is as of 12/31/2015 Portfolio Managers Todd C. Ahlsten • Chief Investment Officer, Portfolio Manager • With firm since 1994 • Investment industry since 1994 • Portfolio Manager since 2001 • B.S., Business Administration, University of California, Berkeley 1994 Benjamin E. Allen • Portfolio Manager • With firm since 2005 • Investment industry since 1999 • Portfolio Manager since 2012 • M.B.A., University of California, Berkeley 2005 • B.A., Government, Georgetown University 1999 Firm Overview Parnassus Investments® is an independent and employee-owned investment management company based in San Francisco, CA. Founded in 1984, the firm seeks to invest in businesses that have increasingly relevant products or services, sustainable competitive advantages, quality management teams and ethical business practices.
We believe the most attractive opportunities for investments are when companies with good business fundamentals become temporarily undervalued due to market sentiment. Fund Characteristics Fund S&P 500 Index Ave Weighted Mkt Cap ($Bn) $94.9 $139.5 P/E Ratio 19.8x P/B Ratio Investor Shares Institutional Shares Ticker PRBLX PRILX 19.5x CUSIP 701769101 701769408 3.0x 2.5x Minimum Investment $2,000 $100,000 40 504 Gross Expense Ratio 0.87% 0.67% Portfolio Turnover (2015 Annual) 26.9% - Net Expense Ratio 0.87% 0.67% SEC 30-Day Yield (Investor)1 1.26% - Inception Date 8/31/1992 4/28/2006 Number of Holdings The 30-Day SEC Yield is computed under an SEC standardized formula based on net income earned over the past 30 days. 1 Fund Statistics (5 year) Investor Shares S&P 500 Index Alpha 1.92% - Beta 0.85 1.00 R-Squared 0.91 1.00 Sharpe Ratio 1.23 1.08 10.38% 11.70% Downside Risk 5.73% 6.53% Tracking Error 3.66% - Active Share Average Weighted Market Cap is the average capitalization of all stocks in the portfolio, weighted by each holding’s size in the portfolio. Price/Earnings (P/E) Ratio is a ratio of a stock’s current price to its per-share earnings over the past 12 months (or “trailing” 12 months). Price/Book (P/B) Ratio is the ratio of a stock’s latest closing price divided by its book value per share.
Alpha is a measure of performance on a risk-adjusted basis. Alpha takes the volatility (price risk) of a mutual fund and compares its risk-adjusted performance to a benchmark index. The excess return of the fund relative to the return of the benchmark index is a fund’s alpha.
Beta is a measure of the volatility, or systematic risk, of a security or a portfolio in comparison to the market as a whole. A beta of 1.00 means that the share price moves exactly in line with the market. A beta over 1.00 suggests that the share price will typically be more volatile than the market, and conversely, a beta below 1.00 indicates that the share price will typically be less volatile than the market.
R-Squared is a measurement of how closely the portfolio’s performance correlates with the performance of a benchmark index such as the S&P 500 Index. Standard Deviation is a calculation used to measure Distribution Frequency Quarterly Total Net Assets $11,922.4MM Expenses based on total net assets, net of reimbursement. Standard Deviation Total Assets Under Management: $15.6 billion Fund Facts 86.01% Style - variability (risk) of a portfolio’s performance. Sharpe Ratio is a ratio used to measure risk-adjusted performance.
It is calculated by subtracting the risk-free rate from the rate of return for a portfolio and dividing the result by the standard deviation of the portfolio returns. Downside Risk is a statistical measurement of a portfolio’s dispersion below the mean return of a benchmark. Tracking Error is the standard deviation of the difference between the portfolio return and the desired investment benchmark return.
Active Share measures the percentage amount your portfolio differs from a passive benchmark. The S&P 500 Index is a product of S&P Dow Jones Indices LLC and/or its affiliates and has been licensed for use by Parnassus Investments. Copyright © 2014 by S&P Dow Jones Indices LLC, a subsidiary of McGraw-Hill Financial, Inc., and/or its affiliates. All rights reserved.
Redistribution, reproduction and/or photocopying in whole or in part are prohibited without written permission of S&P Dow Jones Indices LLC. For more information on any of S&P Dow Jones Indices LLC’s indices please visit www.spdji.com. S&P® is a registered trademark of Standard & Poor’s Financial Services LLC and Dow Jones® is a registered Parnassus Funds’ equity style box is based on the portfolio’s overall targeted capitalization range and relative valuation. Large Cap Mid Cap Lipper Category: Equity Income Small Cap Value Core Growth trademark of Dow Jones Trademark Holdings LLC.
Neither S&P Dow Jones Indices LLC, Dow Jones Trademark Holdings LLC, their affiliates nor their third party licensors make any representation or warranty, express or implied, as to the ability of any index to accurately represent the asset class or market sector that it purports to represent and neither S&P Dow Jones Indices LLC, Dow Jones Trademark Holdings LLC, their affiliates nor their third party licensors shall have any liability for any errors, omissions, or interruptions of any index or the data included therein. Risks: The Fund’s share price may change daily based on the value of its security holdings. Stock markets can be volatile, and stock values fluctuate in response to the asset levels of individual companies and in response to general U.S. and international market and economic conditions. In addition to large-cap companies, the Fund may invest in small- and/ or mid-cap companies, which can be more volatile than large-cap firms.
Security holdings in the fund can vary significantly from broad market indexes. PARNASSUS INVESTMENTS® 1 Market Street, Suite 1600 San Francisco, CA 94105 www.parnassus.com (800) 999-3505 .


