


Description
Parnassus Asia Fund
SM
Fourth Quarter 2015
All information, unless otherwise indicated, is as of 12/31/2015
Objective
Capital appreciation
Strategy
The Parnassus Asia Fund invests with high conviction in approximately 40
holdings. The Fund focuses on identifying companies with:
• Wide moats or strong competitive advantages that protect
market share and profitability
• Relevancy over the long term, which provides a compounding
growth component
• Quality management teams that will act in the best interest of
shareholders
• Favorable three-year investment horizon
The Fund provides access to equity securities of Asian companies across
the capitalization spectrum. Diversification across the Asian region
can serve to mitigate impact from any single country’s equity market
fluctuations. The Fund takes environmental, social, and governance factors
into account in making investment decisions.
ESG Integration
At Parnassus Investments, the investment team follows a responsible
investment approach to understand the full impact of a company.
The investment team carefully considers a company’s environmental, social and governance (ESG) factors. By incorporating ESG factors into the fundamental investment process, the investment team often identifies risks and opportunities that the market may have ignored and could impact the performance of investments. Percent based on total net assets of date indicated. Excluding cash and cash equivalents. As a percentage of long-term investments. Parnassus considers companies that do a substantial amount of business in Asia to be Asian companies. Performance data quoted represents past performance and are no guarantee of future returns.
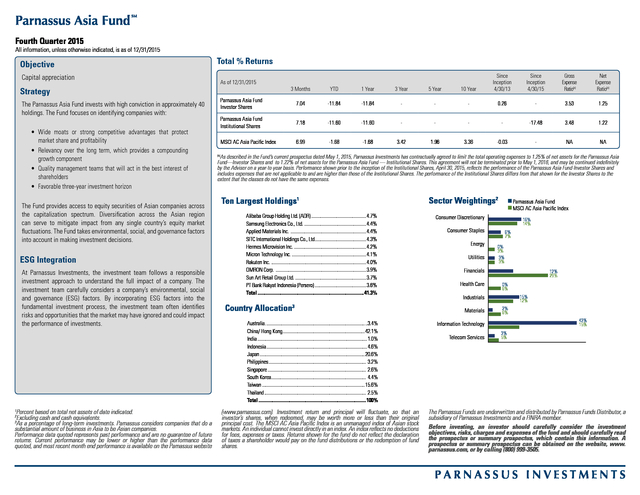
Current performance may be lower or higher than the performance data quoted, and most recent month end performance is available on the Parnassus website 1 2 3 Total % Returns 3 Months YTD 1 Year 3 Year 5 Year 10 Year Since Inception 4/30/13 Parnassus Asia Fund Investor Shares 7.04 -11.84 -11.84 - - - 0.26 - 3.53 1.25 Parnassus Asia Fund Institutional Shares 7.18 -11.60 -11.60 - - - - -17.48 3.48 1.22 MSCI AC Asia Pacific Index 6.99 -1.68 -1.68 3.42 1.96 3.36 -0.03 - NA NA As of 12/31/2015 Since Inception 4/30/15 Gross Expense Ratio(a) Net Expense Ratio(a) (a) As described in the Fund’s current prospectus dated May 1, 2015, Parnassus Investments has contractually agreed to limit the total operating expenses to 1.25% of net assets for the Parnassus Asia Fund—Investor Shares and to 1.22% of net assets for the Parnassus Asia Fund — Institutional Shares. This agreement will not be terminated prior to May 1, 2016, and may be continued indefinitely by the Adviser on a year-to-year basis. Performance shown prior to the inception of the Institutional Shares, April 30, 2015, reflects the performance of the Parnassus Asia Fund-Investor Shares and includes expenses that are not applicable to and are higher than those of the Institutional Shares.
The performance of the Institutional Shares differs from that shown for the Investor Shares to the extent that the classes do not have the same expenses. Ten Largest Holdings1 Alibaba Group Holding Ltd. (ADR).................................................4.7% Samsung Electronics Co., Ltd. .......................................................4.4% Applied Materials Inc. ...................................................................4.4% SITC International Holdings Co., Ltd..............................................4.3% Hermes Microvision Inc. ................................................................4.2% Micron Technology Inc. ..................................................................4.1% Rakuten Inc. ....................................................................................4.0% OMRON Corp. ................................................................................3.9% Sun Art Retail Group Ltd. ..............................................................3.7% PT Bank Rakyat Indonesia (Persero)..............................................3.6% Total..............................................................................................41.3% Country Allocation 3 Australia..........................................................................................3.4% China/ Hong Kong.........................................................................42.1% India.................................................................................................1.0% Indonesia.........................................................................................4.6% Japan.............................................................................................20.6% Philippines...................................................................................... 3.2% Singapore.......................................................................................
2.6% South Korea.................................................................................... 4.4% Taiwan...........................................................................................15.6% Thailand.......................................................................................... 2.5% Total...............................................................................................100% (www.parnassus.com).
Investment return and principal will fluctuate, so that an investor’s shares, when redeemed, may be worth more or less than their original principal cost. The MSCI AC Asia Pacific Index is an unmanaged index of Asian stock markets. An individual cannot invest directly in an index.
An index reflects no deductions for fees, expenses or taxes. Returns shown for the fund do not reflect the declaration of taxes a shareholder would pay on the fund distributions or the redemption of fund shares. Sector Weightings2 Parnassus Asia Fund MSCI AC Asia Pacific Index Consumer Discretionary 16% 14% Consumer Staples Energy Utilities 6% 7% 0% 3% 3% 3% Financials Health Care 12% 29% 0% 6% 15% 12% Industrials Materials 2% 6% 43% 15% Information Technology Telecom Services 3% 5% The Parnassus Funds are underwritten and distributed by Parnassus Funds Distributor, a subsidiary of Parnassus Investments and a FINRA member. Before investing, an investor should carefully consider the investment objectives, risks, charges and expenses of the fund and should carefully read the prospectus or summary prospectus, which contain this information. A prospectus or summary prospectus can be obtained on the website, www. parnassus.com, or by calling (800) 999-3505. PARNASSUS INVESTMENTS .
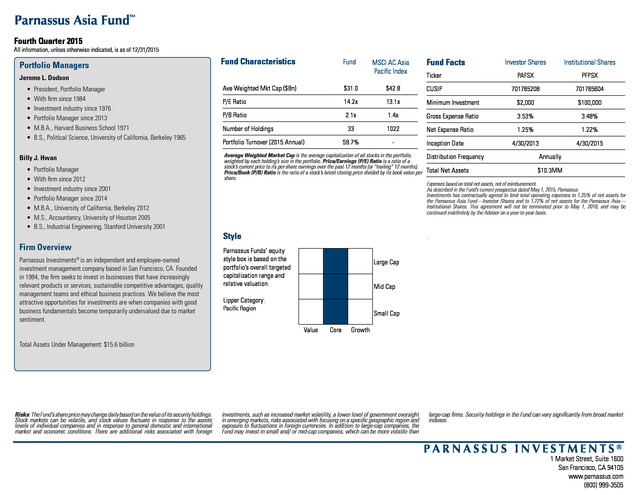
Parnassus Asia Fund SM Fourth Quarter 2015 All information, unless otherwise indicated, is as of 12/31/2015 Portfolio Managers Jerome L. Dodson • President, Portfolio Manager • With firm since 1984 • Investment industry since 1976 • Portfolio Manager since 2013 • M.B.A., Harvard Business School 1971 • B.S., Political Science, University of California, Berkeley 1965 Billy J. Hwan • Portfolio Manager • With firm since 2012 • Investment industry since 2001 • Portfolio Manager since 2014 • M.B.A., University of California, Berkeley 2012 • M.S., Accountancy, University of Houston 2005 • B.S., Industrial Engineering, Stanford University 2001 Firm Overview Parnassus Investments® is an independent and employee-owned investment management company based in San Francisco, CA. Founded in 1984, the firm seeks to invest in businesses that have increasingly relevant products or services, sustainable competitive advantages, quality management teams and ethical business practices.
We believe the most attractive opportunities for investments are when companies with good business fundamentals become temporarily undervalued due to market sentiment. Fund Characteristics Fund MSCI AC Asia Pacific Index Fund Facts Investor Shares Institutional Shares Ticker PAFSX PFPSX 701765208 701765604 Ave Weighted Mkt Cap ($Bn) $31.0 $42.8 CUSIP P/E Ratio 14.2x 13.1x Minimum Investment $2,000 $100,000 P/B Ratio 2.1x 1.4x Gross Expense Ratio 3.53% 3.48% 33 1022 Net Expense Ratio 1.25% 1.22% 59.7% - 4/30/2013 4/30/2015 Number of Holdings Portfolio Turnover (2015 Annual) Average Weighted Market Cap is the average capitalization of all stocks in the portfolio, weighted by each holding’s size in the portfolio. Price/Earnings (P/E) Ratio is a ratio of a stock’s current price to its per-share earnings over the past 12 months (or “trailing” 12 months). Price/Book (P/B) Ratio is the ratio of a stock’s latest closing price divided by its book value per share. Style Inception Date Distribution Frequency Annually Total Net Assets $10.3MM Expenses based on total net assets, net of reimbursement. As described in the Fund’s current prospectus dated May 1, 2015, Parnassus Investments has contractually agreed to limit total operating expenses to 1.25% of net assets for the Parnassus Asia Fund—Investor Shares and to 1.22% of net assets for the Parnassus Asia— Institutional Shares. This agreement will not be terminated prior to May 1, 2016, and may be continued indefinitely by the Adviser on a year-to-year basis. . Parnassus Funds’ equity style box is based on the portfolio’s overall targeted capitalization range and relative valuation. Large Cap Mid Cap Lipper Category: Pacific Region Small Cap Value Core Growth Total Assets Under Management: $15.6 billion Risks: The Fund’s share price may change daily based on the value of its security holdings. Stock markets can be volatile, and stock values fluctuate in response to the assets levels of individual companies and in response to general domestic and international market and economic conditions.
There are additional risks associated with foreign investments, such as increased market volatility, a lower level of government oversight in emerging markets, risks associated with focusing on a specific geographic region and exposure to fluctuations in foreign currencies. In addition to large-cap companies, the Fund may invest in small and/ or mid-cap companies, which can be more volatile than large-cap firms. Security holdings in the Fund can vary significantly from broad market indexes. PARNASSUS INVESTMENTS® 1 Market Street, Suite 1600 San Francisco, CA 94105 www.parnassus.com (800) 999-3505 .
The investment team carefully considers a company’s environmental, social and governance (ESG) factors. By incorporating ESG factors into the fundamental investment process, the investment team often identifies risks and opportunities that the market may have ignored and could impact the performance of investments. Percent based on total net assets of date indicated. Excluding cash and cash equivalents. As a percentage of long-term investments. Parnassus considers companies that do a substantial amount of business in Asia to be Asian companies. Performance data quoted represents past performance and are no guarantee of future returns.
Current performance may be lower or higher than the performance data quoted, and most recent month end performance is available on the Parnassus website 1 2 3 Total % Returns 3 Months YTD 1 Year 3 Year 5 Year 10 Year Since Inception 4/30/13 Parnassus Asia Fund Investor Shares 7.04 -11.84 -11.84 - - - 0.26 - 3.53 1.25 Parnassus Asia Fund Institutional Shares 7.18 -11.60 -11.60 - - - - -17.48 3.48 1.22 MSCI AC Asia Pacific Index 6.99 -1.68 -1.68 3.42 1.96 3.36 -0.03 - NA NA As of 12/31/2015 Since Inception 4/30/15 Gross Expense Ratio(a) Net Expense Ratio(a) (a) As described in the Fund’s current prospectus dated May 1, 2015, Parnassus Investments has contractually agreed to limit the total operating expenses to 1.25% of net assets for the Parnassus Asia Fund—Investor Shares and to 1.22% of net assets for the Parnassus Asia Fund — Institutional Shares. This agreement will not be terminated prior to May 1, 2016, and may be continued indefinitely by the Adviser on a year-to-year basis. Performance shown prior to the inception of the Institutional Shares, April 30, 2015, reflects the performance of the Parnassus Asia Fund-Investor Shares and includes expenses that are not applicable to and are higher than those of the Institutional Shares.
The performance of the Institutional Shares differs from that shown for the Investor Shares to the extent that the classes do not have the same expenses. Ten Largest Holdings1 Alibaba Group Holding Ltd. (ADR).................................................4.7% Samsung Electronics Co., Ltd. .......................................................4.4% Applied Materials Inc. ...................................................................4.4% SITC International Holdings Co., Ltd..............................................4.3% Hermes Microvision Inc. ................................................................4.2% Micron Technology Inc. ..................................................................4.1% Rakuten Inc. ....................................................................................4.0% OMRON Corp. ................................................................................3.9% Sun Art Retail Group Ltd. ..............................................................3.7% PT Bank Rakyat Indonesia (Persero)..............................................3.6% Total..............................................................................................41.3% Country Allocation 3 Australia..........................................................................................3.4% China/ Hong Kong.........................................................................42.1% India.................................................................................................1.0% Indonesia.........................................................................................4.6% Japan.............................................................................................20.6% Philippines...................................................................................... 3.2% Singapore.......................................................................................
2.6% South Korea.................................................................................... 4.4% Taiwan...........................................................................................15.6% Thailand.......................................................................................... 2.5% Total...............................................................................................100% (www.parnassus.com).
Investment return and principal will fluctuate, so that an investor’s shares, when redeemed, may be worth more or less than their original principal cost. The MSCI AC Asia Pacific Index is an unmanaged index of Asian stock markets. An individual cannot invest directly in an index.
An index reflects no deductions for fees, expenses or taxes. Returns shown for the fund do not reflect the declaration of taxes a shareholder would pay on the fund distributions or the redemption of fund shares. Sector Weightings2 Parnassus Asia Fund MSCI AC Asia Pacific Index Consumer Discretionary 16% 14% Consumer Staples Energy Utilities 6% 7% 0% 3% 3% 3% Financials Health Care 12% 29% 0% 6% 15% 12% Industrials Materials 2% 6% 43% 15% Information Technology Telecom Services 3% 5% The Parnassus Funds are underwritten and distributed by Parnassus Funds Distributor, a subsidiary of Parnassus Investments and a FINRA member. Before investing, an investor should carefully consider the investment objectives, risks, charges and expenses of the fund and should carefully read the prospectus or summary prospectus, which contain this information. A prospectus or summary prospectus can be obtained on the website, www. parnassus.com, or by calling (800) 999-3505. PARNASSUS INVESTMENTS .
Parnassus Asia Fund SM Fourth Quarter 2015 All information, unless otherwise indicated, is as of 12/31/2015 Portfolio Managers Jerome L. Dodson • President, Portfolio Manager • With firm since 1984 • Investment industry since 1976 • Portfolio Manager since 2013 • M.B.A., Harvard Business School 1971 • B.S., Political Science, University of California, Berkeley 1965 Billy J. Hwan • Portfolio Manager • With firm since 2012 • Investment industry since 2001 • Portfolio Manager since 2014 • M.B.A., University of California, Berkeley 2012 • M.S., Accountancy, University of Houston 2005 • B.S., Industrial Engineering, Stanford University 2001 Firm Overview Parnassus Investments® is an independent and employee-owned investment management company based in San Francisco, CA. Founded in 1984, the firm seeks to invest in businesses that have increasingly relevant products or services, sustainable competitive advantages, quality management teams and ethical business practices.
We believe the most attractive opportunities for investments are when companies with good business fundamentals become temporarily undervalued due to market sentiment. Fund Characteristics Fund MSCI AC Asia Pacific Index Fund Facts Investor Shares Institutional Shares Ticker PAFSX PFPSX 701765208 701765604 Ave Weighted Mkt Cap ($Bn) $31.0 $42.8 CUSIP P/E Ratio 14.2x 13.1x Minimum Investment $2,000 $100,000 P/B Ratio 2.1x 1.4x Gross Expense Ratio 3.53% 3.48% 33 1022 Net Expense Ratio 1.25% 1.22% 59.7% - 4/30/2013 4/30/2015 Number of Holdings Portfolio Turnover (2015 Annual) Average Weighted Market Cap is the average capitalization of all stocks in the portfolio, weighted by each holding’s size in the portfolio. Price/Earnings (P/E) Ratio is a ratio of a stock’s current price to its per-share earnings over the past 12 months (or “trailing” 12 months). Price/Book (P/B) Ratio is the ratio of a stock’s latest closing price divided by its book value per share. Style Inception Date Distribution Frequency Annually Total Net Assets $10.3MM Expenses based on total net assets, net of reimbursement. As described in the Fund’s current prospectus dated May 1, 2015, Parnassus Investments has contractually agreed to limit total operating expenses to 1.25% of net assets for the Parnassus Asia Fund—Investor Shares and to 1.22% of net assets for the Parnassus Asia— Institutional Shares. This agreement will not be terminated prior to May 1, 2016, and may be continued indefinitely by the Adviser on a year-to-year basis. . Parnassus Funds’ equity style box is based on the portfolio’s overall targeted capitalization range and relative valuation. Large Cap Mid Cap Lipper Category: Pacific Region Small Cap Value Core Growth Total Assets Under Management: $15.6 billion Risks: The Fund’s share price may change daily based on the value of its security holdings. Stock markets can be volatile, and stock values fluctuate in response to the assets levels of individual companies and in response to general domestic and international market and economic conditions.
There are additional risks associated with foreign investments, such as increased market volatility, a lower level of government oversight in emerging markets, risks associated with focusing on a specific geographic region and exposure to fluctuations in foreign currencies. In addition to large-cap companies, the Fund may invest in small and/ or mid-cap companies, which can be more volatile than large-cap firms. Security holdings in the Fund can vary significantly from broad market indexes. PARNASSUS INVESTMENTS® 1 Market Street, Suite 1600 San Francisco, CA 94105 www.parnassus.com (800) 999-3505 .


