


Description
Northwestern Mutual Life Insurance
Co. And Northwestern Long Term
Care Insurance Co.
Primary Credit Analyst:
Ferris Joanis, New York (1) 212-438-5552; ferris.joanis@standardandpoors.com
Secondary Contact:
Michael E Gross, San Francisco (1) 415-371-5003; michael.gross@standardandpoors.com
Table Of Contents
Rationale
Outlook
Base-Case Scenario
Company Description
Business Risk Profile
Financial Risk Profile
Other Assessments
Related Criteria And Research
WWW.STANDARDANDPOORS.COM/RATINGSDIRECT
MAY 29, 2015 1
1401135 | 300871100
. Northwestern Mutual Life Insurance Co. And
Northwestern Long Term Care Insurance Co.
SACP* Assessments
Anchor
aa+
Business Risk
Excellent
Financial Risk
Extremely Strong
+
Modifiers
SACP*
1
ERM and
Management
0
Holistic
Analysis
1
=
Support
+
aa+
Liquidity
Sovereign
Risk
0
-1
Ratings
=
0
Group
Support
0
Gov't
Support
Financial Strength Rating
0
AA+/Stable/--
*Stand-alone credit profile.
See Ratings Detail for a complete list of rated entities and ratings covered by this report.
Rationale
Business Risk Profile: Excellent
• Leading provider of life insurance in the U.S. with an emphasis on participating whole life insurance
• Controlled distribution channels utilizing a dedicated team of field representatives
• Low industry and country risk
Financial Risk Profile: Extremely Strong
• Capital adequacy redundant at 'AAA' level
• Profit-sharing characteristics of products offsets exposure to high-risk investments
• Adequate financial flexibility with ability to issue surplus notes if additional capital is needed
Other Factors
• Group credit profile adjusted upward by one notch from anchor to reflect mutual status, earnings quality, and
participating feature of whole life policies
• Low importance of enterprise risk management (ERM) to the rating reflects less risky product portfolio
WWW.STANDARDANDPOORS.COM/RATINGSDIRECT
MAY 29, 2015 2
1401135 | 300871100
. Northwestern Mutual Life Insurance Co. And Northwestern Long Term Care Insurance Co.
Outlook: Stable
The stable outlook reflects Standard & Poor's Ratings Services' view of the U.S. long-term sovereign credit rating.
We expect Northwestern Mutual Life Insurance Co. (Northwestern Mutual) and its subsidiary, Northwestern Long
Term Care Insurance Co., (collectively, Northwestern), to maintain its extremely strong competitive position while
maintaining extremely strong capital and exceptional liquidity.
Downside scenario
We may lower our rating if we lower the U.S.
sovereign credit rating or if Northwestern's financial risk profile--specifically its capital strength--deteriorates unexpectedly. Upside scenario We do not expect to raise our rating in the next two years given our current view of the credit quality of the U.S. sovereign, which constrains our ratings on insurers. Base-Case Scenario Macroeconomic Assumptions • • • • • Real GDP growth of about 3.0% in 2015 and 2.8% in 2016 Average 10-year U.S. Treasury yield of about 2.3% in 2015 and 3.2% in 2016 U.S. 'AAA' corporate bond yields of about 3.2% in 2015 and 4.5% in 2016 Average S&P 500 Index level of 2,111 in 2015 and 2,218 in 2016 Average payroll employment of 142 million in 2015 and 144 million in 2016 Company-Specific Assumptions • Capital adequacy remains redundant at the 'AAA' confidence level • Maintains its leading market position in the U.S.
individual life segment with total premium growth of 1%-3% in 2015-2016 Key Metrics --Year ended Dec. 31-(Mil. $) S&P capital adequacy/redundancy Fixed-charge coverage (x) 2016* 2015* 2014 2013 2012 AAA AAA AAA AAA AAA 6.1 6.2 6.3 5.7 7.7 *Forecast data reflect Standard & Poor's base-case assumptions. WWW.STANDARDANDPOORS.COM/RATINGSDIRECT MAY 29, 2015 3 1401135 | 300871100 .
Northwestern Mutual Life Insurance Co. And Northwestern Long Term Care Insurance Co. Company Description Northwestern is a mutual life insurance company with about $230 billion in consolidated assets. It is the largest direct provider of individual life insurance in the U.S., with a focus on participating whole life insurance. Northwestern and its subsidiaries offer an array of additional products including long-term care insurance, disability insurance, annuities, and wealth-management products and services. Business Risk Profile: Excellent We regard Northwestern's business risk profile as excellent.
Our view is supported by the company's leading market position in the individual life insurance segment, highly effective distribution force, and very strong operating performance. Our view also reflects our assessment of the low industry and country risk for the U.S. life insurance sector. Insurance industry and country risk Northwestern faces relatively low country risk and low industry risk given that all of its operations are in the U.S.
life insurance marketplace. Our view of low country risk for the U.S. is driven by stable economic growth prospects, relatively effective and stable political institutions, sophisticated financial systems, and a strong payment culture.
Our view of low industry risk reflects the relative maturity of the sector, adequate regulatory infrastructure, moderate product risk, and strong availability of fixed-income instruments to match life and annuity liabilities. Although U.S. life insurers face significant opportunities because of an underpenetrated U.S.
life insurance market and increased demand for investment and retirement products, we believe a stable but low-growth economy, low interest rates, and intense competition may limit the sector's near-term growth prospects and potential for higher operating margins. Table 1 Industry And Country Risk Insurance sector U.S. life Business mix (%) Low risk 100 Competitive position Northwestern has an extremely strong competitive position that stems from its national presence and top market position as one of the leading providers of individual whole life insurance in the U.S. Although whole life insurance accounts for the majority of the insurer's premium revenue, Northwestern maintains complementary product offerings including term and universal life insurance, disability income insurance, annuities and mutual funds, and long-term care insurance.
The company utilizes a dedicated team of sales representatives to sell its products, though in recent years the company has seen a decline in recruitment and retention of field staff. Despite this, premium revenue grew by 3% in 2014. In 2015, we expect Northwestern to report an operating gain before dividend and taxes of between $6.2-6.4 billion. WWW.STANDARDANDPOORS.COM/RATINGSDIRECT MAY 29, 2015 4 1401135 | 300871100 .
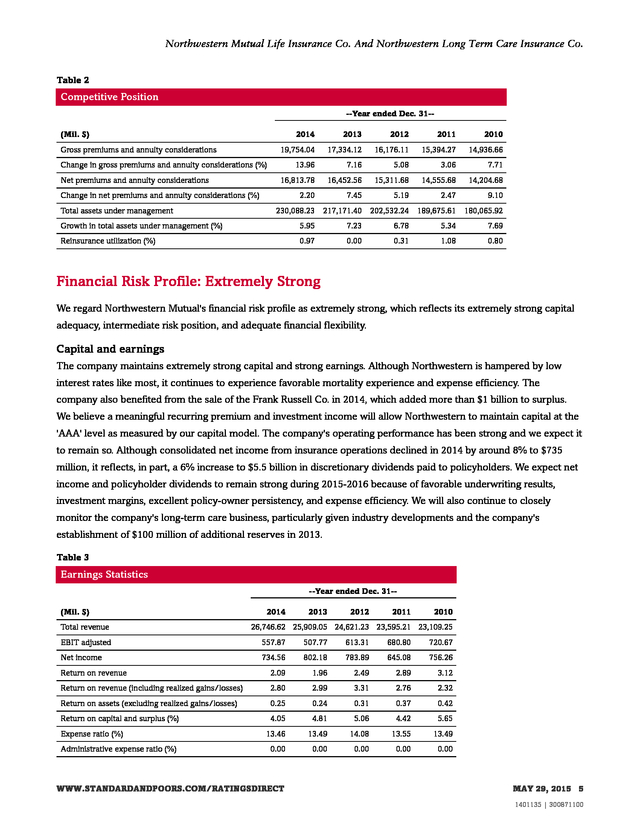
Northwestern Mutual Life Insurance Co. And Northwestern Long Term Care Insurance Co. Table 2 Competitive Position --Year ended Dec. 31-(Mil. $) 2014 2012 2011 2010 19,754.04 Gross premiums and annuity considerations 2013 17,334.12 16,176.11 15,394.27 14,936.66 Change in gross premiums and annuity considerations (%) 13.96 7.16 5.08 3.06 7.71 16,813.78 Net premiums and annuity considerations 16,452.56 15,311.68 14,555.68 14,204.68 2.20 7.45 5.19 2.47 9.10 Change in net premiums and annuity considerations (%) Total assets under management 230,088.23 217,171.40 202,532.24 189,675.61 180,065.92 Growth in total assets under management (%) 5.95 7.23 6.78 5.34 7.69 Reinsurance utilization (%) 0.97 0.00 0.31 1.08 0.80 Financial Risk Profile: Extremely Strong We regard Northwestern Mutual's financial risk profile as extremely strong, which reflects its extremely strong capital adequacy, intermediate risk position, and adequate financial flexibility. Capital and earnings The company maintains extremely strong capital and strong earnings.
Although Northwestern is hampered by low interest rates like most, it continues to experience favorable mortality experience and expense efficiency. The company also benefited from the sale of the Frank Russell Co. in 2014, which added more than $1 billion to surplus. We believe a meaningful recurring premium and investment income will allow Northwestern to maintain capital at the 'AAA' level as measured by our capital model.
The company's operating performance has been strong and we expect it to remain so. Although consolidated net income from insurance operations declined in 2014 by around 8% to $735 million, it reflects, in part, a 6% increase to $5.5 billion in discretionary dividends paid to policyholders. We expect net income and policyholder dividends to remain strong during 2015-2016 because of favorable underwriting results, investment margins, excellent policy-owner persistency, and expense efficiency.
We will also continue to closely monitor the company's long-term care business, particularly given industry developments and the company's establishment of $100 million of additional reserves in 2013. Table 3 Earnings Statistics --Year ended Dec. 31-(Mil. $) Total revenue 2014 2013 2012 2011 2010 26,746.62 25,909.05 24,621.23 23,595.21 23,109.25 EBIT adjusted 557.87 507.77 613.31 680.80 720.67 Net income 734.56 802.18 783.89 645.08 756.26 Return on revenue 2.09 1.96 2.49 2.89 3.12 Return on revenue (including realized gains/losses) 2.80 2.99 3.31 2.76 2.32 Return on assets (excluding realized gains/losses) 0.25 0.24 0.31 0.37 0.42 Return on capital and surplus (%) 4.05 4.81 5.06 4.42 5.65 13.46 13.49 14.08 13.55 13.49 0.00 0.00 0.00 0.00 0.00 Expense ratio (%) Administrative expense ratio (%) WWW.STANDARDANDPOORS.COM/RATINGSDIRECT MAY 29, 2015 5 1401135 | 300871100 .
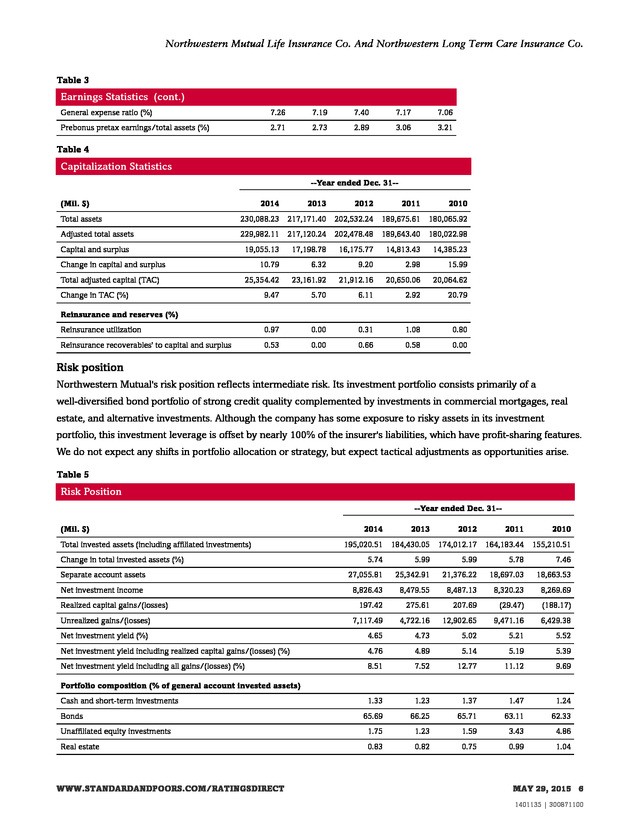
Northwestern Mutual Life Insurance Co. And Northwestern Long Term Care Insurance Co. Table 3 Earnings Statistics (cont.) General expense ratio (%) 7.26 7.19 7.40 7.17 7.06 Prebonus pretax earnings/total assets (%) 2.71 2.73 2.89 3.06 3.21 Table 4 Capitalization Statistics --Year ended Dec. 31-(Mil. $) 2014 2013 2012 2011 2010 Total assets 230,088.23 217,171.40 202,532.24 189,675.61 180,065.92 Adjusted total assets 229,982.11 217,120.24 202,478.48 189,643.40 180,022.98 Capital and surplus 19,055.13 17,198.78 16,175.77 14,813.43 14,385.23 10.79 6.32 9.20 2.98 15.99 25,354.42 23,161.92 21,912.16 20,650.06 20,064.62 9.47 5.70 6.11 2.92 20.79 Reinsurance utilization 0.97 0.00 0.31 1.08 0.80 Reinsurance recoverables' to capital and surplus 0.53 0.00 0.66 0.58 0.00 Change in capital and surplus Total adjusted capital (TAC) Change in TAC (%) Reinsurance and reserves (%) Risk position Northwestern Mutual's risk position reflects intermediate risk.
Its investment portfolio consists primarily of a well-diversified bond portfolio of strong credit quality complemented by investments in commercial mortgages, real estate, and alternative investments. Although the company has some exposure to risky assets in its investment portfolio, this investment leverage is offset by nearly 100% of the insurer's liabilities, which have profit-sharing features. We do not expect any shifts in portfolio allocation or strategy, but expect tactical adjustments as opportunities arise. Table 5 Risk Position --Year ended Dec. 31-(Mil.
$) Total invested assets (including affiliated investments) Change in total invested assets (%) 2014 2013 2012 2011 2010 195,020.51 184,430.05 174,012.17 164,183.44 155,210.51 5.74 5.99 5.99 5.78 7.46 Separate account assets 27,055.81 25,342.91 21,376.22 18,697.03 18,663.53 Net investment income 8,826.43 8,479.55 8,487.13 8,320.23 8,269.69 197.42 275.61 207.69 (29.47) (188.17) Unrealized gains/(losses) 7,117.49 4,722.16 12,902.65 9,471.16 6,429.38 Net investment yield (%) 4.65 4.73 5.02 5.21 5.52 Net investment yield including realized capital gains/(losses) (%) 4.76 4.89 5.14 5.19 5.39 Net investment yield including all gains/(losses) (%) 8.51 7.52 12.77 11.12 9.69 Realized capital gains/(losses) Portfolio composition (% of general account invested assets) Cash and short-term investments 1.33 1.23 1.37 1.47 1.24 65.69 66.25 65.71 63.11 62.33 Unaffiliated equity investments 1.75 1.23 1.59 3.43 4.86 Real estate 0.83 0.82 0.75 0.99 1.04 Bonds WWW.STANDARDANDPOORS.COM/RATINGSDIRECT MAY 29, 2015 6 1401135 | 300871100 . Northwestern Mutual Life Insurance Co. And Northwestern Long Term Care Insurance Co. Table 5 Risk Position (cont.) Mortgages 15.05 14.56 13.99 13.89 13.70 Investments in affiliates 0.93 1.42 2.10 1.92 1.84 Investments in partnerships, joint ventures, and other alternative investments 1.91 1.87 2.00 2.41 2.21 12.52 12.63 12.50 12.77 12.78 Other investments Financial flexibility Northwestern has adequate financial flexibility. As a mutual company, its access to capital markets is limited, although the insurer has demonstrated prior success in issuing surplus notes. Northwestern currently has $1.75 billion in surplus notes outstanding.
We view its low financial leverage of approximately 6.90%, fixed-charge coverage exceeding 6.3x, strong earnings generation, and flexible dividend policy as positive attributes to overall financial flexibility. Table 6 Financial Flexibility --Year ended Dec. 31-(Mil. $) 2014 2013 2012 2011 2010 EBIT interest coverage (x) N.A. N.A. N.A. N.A. N.A. Debt leverage (%) 9.18 10.18 10.82 11.81 12.17 Debt leverage including pension deficit as debt (%) 9.18 10.18 10.82 11.81 12.17 Financial leverage (%) 9.18 10.18 10.82 11.81 12.17 Financial leverage including pension deficit as debt (%) 9.18 10.18 10.82 11.81 12.17 Debt/EBIT including pension deficit as debt (x) 3.14 3.45 2.85 2.57 2.43 Debt/EBIT excluding pension deficit as debt (x) 3.14 3.45 2.85 2.57 2.43 9,233.23 9,525.90 8,817.60 8,664.05 8,929.34 Cash flows Net cash flow from operating activities Net cash flow from investing activities Net cash from from financing activities (9,102.55) (9,716.56) (8,703.74) (7,537.88) (9,534.43) 195.66 59.52 (141.46) (633.27) (76.74) N.A.
-- Not available Other Assessments We consider Northwestern Mutual's strong ERM and strong management and governance as consistent with the ratings. Liquidity is exceptional. Enterprise risk management Northwestern Mutual's strong ERM reflects a positive risk-management culture and positive controls of key risks. The efficacy of the insurer's ERM program is demonstrated by its strong operating performance and leading policy owner returns, which is driven by favorable mortality experience, persistency, and long-term investment performance. Northwestern Mutual's most significant quantifiable risk exposures relate to its investment portfolio.
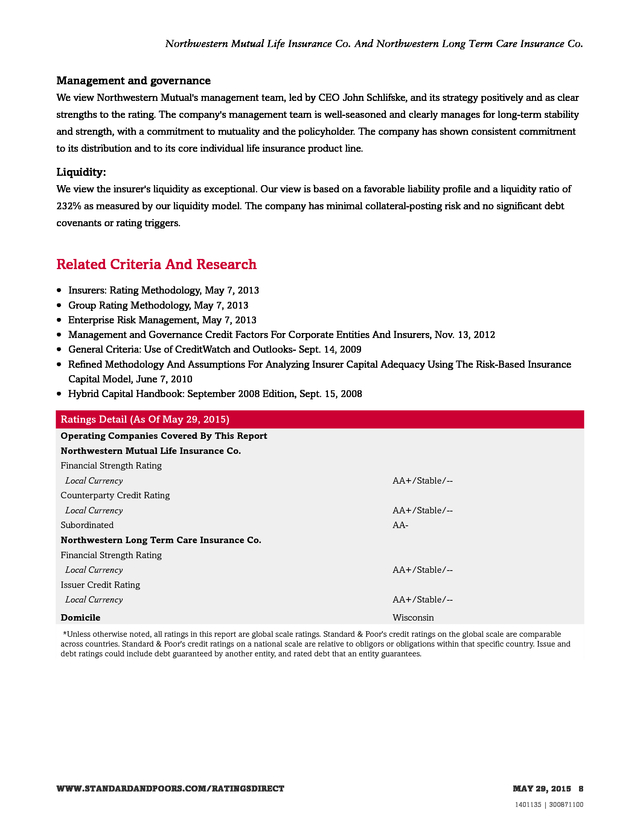
However, the company manages its investment exposures tightly and we don't expect major losses outside of these tolerances. WWW.STANDARDANDPOORS.COM/RATINGSDIRECT MAY 29, 2015 7 1401135 | 300871100 . Northwestern Mutual Life Insurance Co. And Northwestern Long Term Care Insurance Co. Management and governance We view Northwestern Mutual's management team, led by CEO John Schlifske, and its strategy positively and as clear strengths to the rating. The company's management team is well-seasoned and clearly manages for long-term stability and strength, with a commitment to mutuality and the policyholder. The company has shown consistent commitment to its distribution and to its core individual life insurance product line. Liquidity: We view the insurer's liquidity as exceptional.
Our view is based on a favorable liability profile and a liquidity ratio of 232% as measured by our liquidity model. The company has minimal collateral-posting risk and no significant debt covenants or rating triggers. Related Criteria And Research • • • • • • Insurers: Rating Methodology, May 7, 2013 Group Rating Methodology, May 7, 2013 Enterprise Risk Management, May 7, 2013 Management and Governance Credit Factors For Corporate Entities And Insurers, Nov. 13, 2012 General Criteria: Use of CreditWatch and Outlooks- Sept.
14, 2009 Refined Methodology And Assumptions For Analyzing Insurer Capital Adequacy Using The Risk-Based Insurance Capital Model, June 7, 2010 • Hybrid Capital Handbook: September 2008 Edition, Sept. 15, 2008 Ratings Detail (As Of May 29, 2015) Operating Companies Covered By This Report Northwestern Mutual Life Insurance Co. Financial Strength Rating Local Currency AA+/Stable/-- Counterparty Credit Rating Local Currency Subordinated AA+/Stable/-AA- Northwestern Long Term Care Insurance Co. Financial Strength Rating Local Currency AA+/Stable/-- Issuer Credit Rating Local Currency Domicile AA+/Stable/-Wisconsin *Unless otherwise noted, all ratings in this report are global scale ratings. Standard & Poor's credit ratings on the global scale are comparable across countries.
Standard & Poor's credit ratings on a national scale are relative to obligors or obligations within that specific country. Issue and debt ratings could include debt guaranteed by another entity, and rated debt that an entity guarantees. WWW.STANDARDANDPOORS.COM/RATINGSDIRECT MAY 29, 2015 8 1401135 | 300871100 . Copyright © 2015 Standard & Poor's Financial Services LLC, a part of McGraw Hill Financial. All rights reserved. No content (including ratings, credit-related analyses and data, valuations, model, software or other application or output therefrom) or any part thereof (Content) may be modified, reverse engineered, reproduced or distributed in any form by any means, or stored in a database or retrieval system, without the prior written permission of Standard & Poor's Financial Services LLC or its affiliates (collectively, S&P). The Content shall not be used for any unlawful or unauthorized purposes. S&P and any third-party providers, as well as their directors, officers, shareholders, employees or agents (collectively S&P Parties) do not guarantee the accuracy, completeness, timeliness or availability of the Content.
S&P Parties are not responsible for any errors or omissions (negligent or otherwise), regardless of the cause, for the results obtained from the use of the Content, or for the security or maintenance of any data input by the user. The Content is provided on an "as is" basis. S&P PARTIES DISCLAIM ANY AND ALL EXPRESS OR IMPLIED WARRANTIES, INCLUDING, BUT NOT LIMITED TO, ANY WARRANTIES OF MERCHANTABILITY OR FITNESS FOR A PARTICULAR PURPOSE OR USE, FREEDOM FROM BUGS, SOFTWARE ERRORS OR DEFECTS, THAT THE CONTENT'S FUNCTIONING WILL BE UNINTERRUPTED, OR THAT THE CONTENT WILL OPERATE WITH ANY SOFTWARE OR HARDWARE CONFIGURATION.
In no event shall S&P Parties be liable to any party for any direct, indirect, incidental, exemplary, compensatory, punitive, special or consequential damages, costs, expenses, legal fees, or losses (including, without limitation, lost income or lost profits and opportunity costs or losses caused by negligence) in connection with any use of the Content even if advised of the possibility of such damages. Credit-related and other analyses, including ratings, and statements in the Content are statements of opinion as of the date they are expressed and not statements of fact. S&P's opinions, analyses, and rating acknowledgment decisions (described below) are not recommendations to purchase, hold, or sell any securities or to make any investment decisions, and do not address the suitability of any security. S&P assumes no obligation to update the Content following publication in any form or format.
The Content should not be relied on and is not a substitute for the skill, judgment and experience of the user, its management, employees, advisors and/or clients when making investment and other business decisions. S&P does not act as a fiduciary or an investment advisor except where registered as such. While S&P has obtained information from sources it believes to be reliable, S&P does not perform an audit and undertakes no duty of due diligence or independent verification of any information it receives. To the extent that regulatory authorities allow a rating agency to acknowledge in one jurisdiction a rating issued in another jurisdiction for certain regulatory purposes, S&P reserves the right to assign, withdraw, or suspend such acknowledgement at any time and in its sole discretion.
S&P Parties disclaim any duty whatsoever arising out of the assignment, withdrawal, or suspension of an acknowledgment as well as any liability for any damage alleged to have been suffered on account thereof. S&P keeps certain activities of its business units separate from each other in order to preserve the independence and objectivity of their respective activities. As a result, certain business units of S&P may have information that is not available to other S&P business units. S&P has established policies and procedures to maintain the confidentiality of certain nonpublic information received in connection with each analytical process. S&P may receive compensation for its ratings and certain analyses, normally from issuers or underwriters of securities or from obligors.
S&P reserves the right to disseminate its opinions and analyses. S&P's public ratings and analyses are made available on its Web sites, www.standardandpoors.com (free of charge), and www.ratingsdirect.com and www.globalcreditportal.com (subscription) and www.spcapitaliq.com (subscription) and may be distributed through other means, including via S&P publications and third-party redistributors. Additional information about our ratings fees is available at www.standardandpoors.com/usratingsfees. WWW.STANDARDANDPOORS.COM/RATINGSDIRECT MAY 29, 2015 9 1401135 | 300871100 .
sovereign credit rating or if Northwestern's financial risk profile--specifically its capital strength--deteriorates unexpectedly. Upside scenario We do not expect to raise our rating in the next two years given our current view of the credit quality of the U.S. sovereign, which constrains our ratings on insurers. Base-Case Scenario Macroeconomic Assumptions • • • • • Real GDP growth of about 3.0% in 2015 and 2.8% in 2016 Average 10-year U.S. Treasury yield of about 2.3% in 2015 and 3.2% in 2016 U.S. 'AAA' corporate bond yields of about 3.2% in 2015 and 4.5% in 2016 Average S&P 500 Index level of 2,111 in 2015 and 2,218 in 2016 Average payroll employment of 142 million in 2015 and 144 million in 2016 Company-Specific Assumptions • Capital adequacy remains redundant at the 'AAA' confidence level • Maintains its leading market position in the U.S.
individual life segment with total premium growth of 1%-3% in 2015-2016 Key Metrics --Year ended Dec. 31-(Mil. $) S&P capital adequacy/redundancy Fixed-charge coverage (x) 2016* 2015* 2014 2013 2012 AAA AAA AAA AAA AAA 6.1 6.2 6.3 5.7 7.7 *Forecast data reflect Standard & Poor's base-case assumptions. WWW.STANDARDANDPOORS.COM/RATINGSDIRECT MAY 29, 2015 3 1401135 | 300871100 .
Northwestern Mutual Life Insurance Co. And Northwestern Long Term Care Insurance Co. Company Description Northwestern is a mutual life insurance company with about $230 billion in consolidated assets. It is the largest direct provider of individual life insurance in the U.S., with a focus on participating whole life insurance. Northwestern and its subsidiaries offer an array of additional products including long-term care insurance, disability insurance, annuities, and wealth-management products and services. Business Risk Profile: Excellent We regard Northwestern's business risk profile as excellent.
Our view is supported by the company's leading market position in the individual life insurance segment, highly effective distribution force, and very strong operating performance. Our view also reflects our assessment of the low industry and country risk for the U.S. life insurance sector. Insurance industry and country risk Northwestern faces relatively low country risk and low industry risk given that all of its operations are in the U.S.
life insurance marketplace. Our view of low country risk for the U.S. is driven by stable economic growth prospects, relatively effective and stable political institutions, sophisticated financial systems, and a strong payment culture.
Our view of low industry risk reflects the relative maturity of the sector, adequate regulatory infrastructure, moderate product risk, and strong availability of fixed-income instruments to match life and annuity liabilities. Although U.S. life insurers face significant opportunities because of an underpenetrated U.S.
life insurance market and increased demand for investment and retirement products, we believe a stable but low-growth economy, low interest rates, and intense competition may limit the sector's near-term growth prospects and potential for higher operating margins. Table 1 Industry And Country Risk Insurance sector U.S. life Business mix (%) Low risk 100 Competitive position Northwestern has an extremely strong competitive position that stems from its national presence and top market position as one of the leading providers of individual whole life insurance in the U.S. Although whole life insurance accounts for the majority of the insurer's premium revenue, Northwestern maintains complementary product offerings including term and universal life insurance, disability income insurance, annuities and mutual funds, and long-term care insurance.
The company utilizes a dedicated team of sales representatives to sell its products, though in recent years the company has seen a decline in recruitment and retention of field staff. Despite this, premium revenue grew by 3% in 2014. In 2015, we expect Northwestern to report an operating gain before dividend and taxes of between $6.2-6.4 billion. WWW.STANDARDANDPOORS.COM/RATINGSDIRECT MAY 29, 2015 4 1401135 | 300871100 .
Northwestern Mutual Life Insurance Co. And Northwestern Long Term Care Insurance Co. Table 2 Competitive Position --Year ended Dec. 31-(Mil. $) 2014 2012 2011 2010 19,754.04 Gross premiums and annuity considerations 2013 17,334.12 16,176.11 15,394.27 14,936.66 Change in gross premiums and annuity considerations (%) 13.96 7.16 5.08 3.06 7.71 16,813.78 Net premiums and annuity considerations 16,452.56 15,311.68 14,555.68 14,204.68 2.20 7.45 5.19 2.47 9.10 Change in net premiums and annuity considerations (%) Total assets under management 230,088.23 217,171.40 202,532.24 189,675.61 180,065.92 Growth in total assets under management (%) 5.95 7.23 6.78 5.34 7.69 Reinsurance utilization (%) 0.97 0.00 0.31 1.08 0.80 Financial Risk Profile: Extremely Strong We regard Northwestern Mutual's financial risk profile as extremely strong, which reflects its extremely strong capital adequacy, intermediate risk position, and adequate financial flexibility. Capital and earnings The company maintains extremely strong capital and strong earnings.
Although Northwestern is hampered by low interest rates like most, it continues to experience favorable mortality experience and expense efficiency. The company also benefited from the sale of the Frank Russell Co. in 2014, which added more than $1 billion to surplus. We believe a meaningful recurring premium and investment income will allow Northwestern to maintain capital at the 'AAA' level as measured by our capital model.
The company's operating performance has been strong and we expect it to remain so. Although consolidated net income from insurance operations declined in 2014 by around 8% to $735 million, it reflects, in part, a 6% increase to $5.5 billion in discretionary dividends paid to policyholders. We expect net income and policyholder dividends to remain strong during 2015-2016 because of favorable underwriting results, investment margins, excellent policy-owner persistency, and expense efficiency.
We will also continue to closely monitor the company's long-term care business, particularly given industry developments and the company's establishment of $100 million of additional reserves in 2013. Table 3 Earnings Statistics --Year ended Dec. 31-(Mil. $) Total revenue 2014 2013 2012 2011 2010 26,746.62 25,909.05 24,621.23 23,595.21 23,109.25 EBIT adjusted 557.87 507.77 613.31 680.80 720.67 Net income 734.56 802.18 783.89 645.08 756.26 Return on revenue 2.09 1.96 2.49 2.89 3.12 Return on revenue (including realized gains/losses) 2.80 2.99 3.31 2.76 2.32 Return on assets (excluding realized gains/losses) 0.25 0.24 0.31 0.37 0.42 Return on capital and surplus (%) 4.05 4.81 5.06 4.42 5.65 13.46 13.49 14.08 13.55 13.49 0.00 0.00 0.00 0.00 0.00 Expense ratio (%) Administrative expense ratio (%) WWW.STANDARDANDPOORS.COM/RATINGSDIRECT MAY 29, 2015 5 1401135 | 300871100 .
Northwestern Mutual Life Insurance Co. And Northwestern Long Term Care Insurance Co. Table 3 Earnings Statistics (cont.) General expense ratio (%) 7.26 7.19 7.40 7.17 7.06 Prebonus pretax earnings/total assets (%) 2.71 2.73 2.89 3.06 3.21 Table 4 Capitalization Statistics --Year ended Dec. 31-(Mil. $) 2014 2013 2012 2011 2010 Total assets 230,088.23 217,171.40 202,532.24 189,675.61 180,065.92 Adjusted total assets 229,982.11 217,120.24 202,478.48 189,643.40 180,022.98 Capital and surplus 19,055.13 17,198.78 16,175.77 14,813.43 14,385.23 10.79 6.32 9.20 2.98 15.99 25,354.42 23,161.92 21,912.16 20,650.06 20,064.62 9.47 5.70 6.11 2.92 20.79 Reinsurance utilization 0.97 0.00 0.31 1.08 0.80 Reinsurance recoverables' to capital and surplus 0.53 0.00 0.66 0.58 0.00 Change in capital and surplus Total adjusted capital (TAC) Change in TAC (%) Reinsurance and reserves (%) Risk position Northwestern Mutual's risk position reflects intermediate risk.
Its investment portfolio consists primarily of a well-diversified bond portfolio of strong credit quality complemented by investments in commercial mortgages, real estate, and alternative investments. Although the company has some exposure to risky assets in its investment portfolio, this investment leverage is offset by nearly 100% of the insurer's liabilities, which have profit-sharing features. We do not expect any shifts in portfolio allocation or strategy, but expect tactical adjustments as opportunities arise. Table 5 Risk Position --Year ended Dec. 31-(Mil.
$) Total invested assets (including affiliated investments) Change in total invested assets (%) 2014 2013 2012 2011 2010 195,020.51 184,430.05 174,012.17 164,183.44 155,210.51 5.74 5.99 5.99 5.78 7.46 Separate account assets 27,055.81 25,342.91 21,376.22 18,697.03 18,663.53 Net investment income 8,826.43 8,479.55 8,487.13 8,320.23 8,269.69 197.42 275.61 207.69 (29.47) (188.17) Unrealized gains/(losses) 7,117.49 4,722.16 12,902.65 9,471.16 6,429.38 Net investment yield (%) 4.65 4.73 5.02 5.21 5.52 Net investment yield including realized capital gains/(losses) (%) 4.76 4.89 5.14 5.19 5.39 Net investment yield including all gains/(losses) (%) 8.51 7.52 12.77 11.12 9.69 Realized capital gains/(losses) Portfolio composition (% of general account invested assets) Cash and short-term investments 1.33 1.23 1.37 1.47 1.24 65.69 66.25 65.71 63.11 62.33 Unaffiliated equity investments 1.75 1.23 1.59 3.43 4.86 Real estate 0.83 0.82 0.75 0.99 1.04 Bonds WWW.STANDARDANDPOORS.COM/RATINGSDIRECT MAY 29, 2015 6 1401135 | 300871100 . Northwestern Mutual Life Insurance Co. And Northwestern Long Term Care Insurance Co. Table 5 Risk Position (cont.) Mortgages 15.05 14.56 13.99 13.89 13.70 Investments in affiliates 0.93 1.42 2.10 1.92 1.84 Investments in partnerships, joint ventures, and other alternative investments 1.91 1.87 2.00 2.41 2.21 12.52 12.63 12.50 12.77 12.78 Other investments Financial flexibility Northwestern has adequate financial flexibility. As a mutual company, its access to capital markets is limited, although the insurer has demonstrated prior success in issuing surplus notes. Northwestern currently has $1.75 billion in surplus notes outstanding.
We view its low financial leverage of approximately 6.90%, fixed-charge coverage exceeding 6.3x, strong earnings generation, and flexible dividend policy as positive attributes to overall financial flexibility. Table 6 Financial Flexibility --Year ended Dec. 31-(Mil. $) 2014 2013 2012 2011 2010 EBIT interest coverage (x) N.A. N.A. N.A. N.A. N.A. Debt leverage (%) 9.18 10.18 10.82 11.81 12.17 Debt leverage including pension deficit as debt (%) 9.18 10.18 10.82 11.81 12.17 Financial leverage (%) 9.18 10.18 10.82 11.81 12.17 Financial leverage including pension deficit as debt (%) 9.18 10.18 10.82 11.81 12.17 Debt/EBIT including pension deficit as debt (x) 3.14 3.45 2.85 2.57 2.43 Debt/EBIT excluding pension deficit as debt (x) 3.14 3.45 2.85 2.57 2.43 9,233.23 9,525.90 8,817.60 8,664.05 8,929.34 Cash flows Net cash flow from operating activities Net cash flow from investing activities Net cash from from financing activities (9,102.55) (9,716.56) (8,703.74) (7,537.88) (9,534.43) 195.66 59.52 (141.46) (633.27) (76.74) N.A.
-- Not available Other Assessments We consider Northwestern Mutual's strong ERM and strong management and governance as consistent with the ratings. Liquidity is exceptional. Enterprise risk management Northwestern Mutual's strong ERM reflects a positive risk-management culture and positive controls of key risks. The efficacy of the insurer's ERM program is demonstrated by its strong operating performance and leading policy owner returns, which is driven by favorable mortality experience, persistency, and long-term investment performance. Northwestern Mutual's most significant quantifiable risk exposures relate to its investment portfolio.
However, the company manages its investment exposures tightly and we don't expect major losses outside of these tolerances. WWW.STANDARDANDPOORS.COM/RATINGSDIRECT MAY 29, 2015 7 1401135 | 300871100 . Northwestern Mutual Life Insurance Co. And Northwestern Long Term Care Insurance Co. Management and governance We view Northwestern Mutual's management team, led by CEO John Schlifske, and its strategy positively and as clear strengths to the rating. The company's management team is well-seasoned and clearly manages for long-term stability and strength, with a commitment to mutuality and the policyholder. The company has shown consistent commitment to its distribution and to its core individual life insurance product line. Liquidity: We view the insurer's liquidity as exceptional.
Our view is based on a favorable liability profile and a liquidity ratio of 232% as measured by our liquidity model. The company has minimal collateral-posting risk and no significant debt covenants or rating triggers. Related Criteria And Research • • • • • • Insurers: Rating Methodology, May 7, 2013 Group Rating Methodology, May 7, 2013 Enterprise Risk Management, May 7, 2013 Management and Governance Credit Factors For Corporate Entities And Insurers, Nov. 13, 2012 General Criteria: Use of CreditWatch and Outlooks- Sept.
14, 2009 Refined Methodology And Assumptions For Analyzing Insurer Capital Adequacy Using The Risk-Based Insurance Capital Model, June 7, 2010 • Hybrid Capital Handbook: September 2008 Edition, Sept. 15, 2008 Ratings Detail (As Of May 29, 2015) Operating Companies Covered By This Report Northwestern Mutual Life Insurance Co. Financial Strength Rating Local Currency AA+/Stable/-- Counterparty Credit Rating Local Currency Subordinated AA+/Stable/-AA- Northwestern Long Term Care Insurance Co. Financial Strength Rating Local Currency AA+/Stable/-- Issuer Credit Rating Local Currency Domicile AA+/Stable/-Wisconsin *Unless otherwise noted, all ratings in this report are global scale ratings. Standard & Poor's credit ratings on the global scale are comparable across countries.
Standard & Poor's credit ratings on a national scale are relative to obligors or obligations within that specific country. Issue and debt ratings could include debt guaranteed by another entity, and rated debt that an entity guarantees. WWW.STANDARDANDPOORS.COM/RATINGSDIRECT MAY 29, 2015 8 1401135 | 300871100 . Copyright © 2015 Standard & Poor's Financial Services LLC, a part of McGraw Hill Financial. All rights reserved. No content (including ratings, credit-related analyses and data, valuations, model, software or other application or output therefrom) or any part thereof (Content) may be modified, reverse engineered, reproduced or distributed in any form by any means, or stored in a database or retrieval system, without the prior written permission of Standard & Poor's Financial Services LLC or its affiliates (collectively, S&P). The Content shall not be used for any unlawful or unauthorized purposes. S&P and any third-party providers, as well as their directors, officers, shareholders, employees or agents (collectively S&P Parties) do not guarantee the accuracy, completeness, timeliness or availability of the Content.
S&P Parties are not responsible for any errors or omissions (negligent or otherwise), regardless of the cause, for the results obtained from the use of the Content, or for the security or maintenance of any data input by the user. The Content is provided on an "as is" basis. S&P PARTIES DISCLAIM ANY AND ALL EXPRESS OR IMPLIED WARRANTIES, INCLUDING, BUT NOT LIMITED TO, ANY WARRANTIES OF MERCHANTABILITY OR FITNESS FOR A PARTICULAR PURPOSE OR USE, FREEDOM FROM BUGS, SOFTWARE ERRORS OR DEFECTS, THAT THE CONTENT'S FUNCTIONING WILL BE UNINTERRUPTED, OR THAT THE CONTENT WILL OPERATE WITH ANY SOFTWARE OR HARDWARE CONFIGURATION.
In no event shall S&P Parties be liable to any party for any direct, indirect, incidental, exemplary, compensatory, punitive, special or consequential damages, costs, expenses, legal fees, or losses (including, without limitation, lost income or lost profits and opportunity costs or losses caused by negligence) in connection with any use of the Content even if advised of the possibility of such damages. Credit-related and other analyses, including ratings, and statements in the Content are statements of opinion as of the date they are expressed and not statements of fact. S&P's opinions, analyses, and rating acknowledgment decisions (described below) are not recommendations to purchase, hold, or sell any securities or to make any investment decisions, and do not address the suitability of any security. S&P assumes no obligation to update the Content following publication in any form or format.
The Content should not be relied on and is not a substitute for the skill, judgment and experience of the user, its management, employees, advisors and/or clients when making investment and other business decisions. S&P does not act as a fiduciary or an investment advisor except where registered as such. While S&P has obtained information from sources it believes to be reliable, S&P does not perform an audit and undertakes no duty of due diligence or independent verification of any information it receives. To the extent that regulatory authorities allow a rating agency to acknowledge in one jurisdiction a rating issued in another jurisdiction for certain regulatory purposes, S&P reserves the right to assign, withdraw, or suspend such acknowledgement at any time and in its sole discretion.
S&P Parties disclaim any duty whatsoever arising out of the assignment, withdrawal, or suspension of an acknowledgment as well as any liability for any damage alleged to have been suffered on account thereof. S&P keeps certain activities of its business units separate from each other in order to preserve the independence and objectivity of their respective activities. As a result, certain business units of S&P may have information that is not available to other S&P business units. S&P has established policies and procedures to maintain the confidentiality of certain nonpublic information received in connection with each analytical process. S&P may receive compensation for its ratings and certain analyses, normally from issuers or underwriters of securities or from obligors.
S&P reserves the right to disseminate its opinions and analyses. S&P's public ratings and analyses are made available on its Web sites, www.standardandpoors.com (free of charge), and www.ratingsdirect.com and www.globalcreditportal.com (subscription) and www.spcapitaliq.com (subscription) and may be distributed through other means, including via S&P publications and third-party redistributors. Additional information about our ratings fees is available at www.standardandpoors.com/usratingsfees. WWW.STANDARDANDPOORS.COM/RATINGSDIRECT MAY 29, 2015 9 1401135 | 300871100 .


