


Description
Food & Beverage
Spring 2016 Market Monitor
MOSS ADAMS CAPITAL LLC
. Table of Contents
Industry Update
4
Public Share Price Performance & Valuations
5
M&A Activity & Valuations
10
Moss Adams Overview
14
Food & Beverage
2
MOSS ADAMS CAPITALLLC
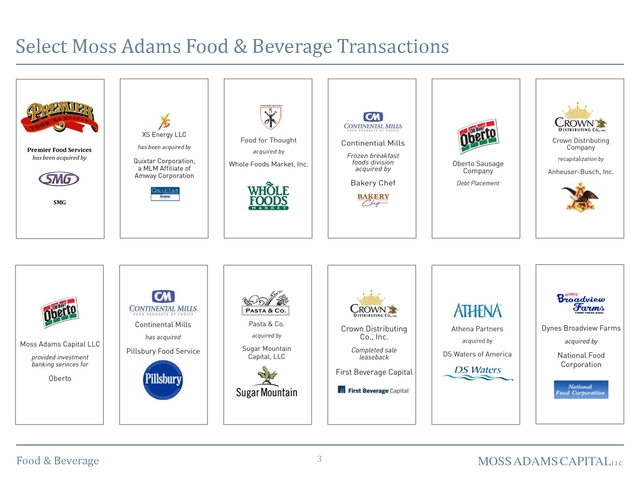
. Select Moss Adams Food & Beverage Transactions
Premier Food Services
has been acquired by
SMG
Food & Beverage
3
MOSS ADAMS CAPITALLLC
. 2015 F&B M&A Activity Finishes Modestly Short of 2014 Record
Commentary
105
8%
85
6%
75
4%
65
2%
55
0%
Food & Beverage
Store Sales y/y
Growth (right-axis)
45
Payroll y/y Growth
(right-axis)
35
(2%)
(4%)
Feb-16
Aug-15
Feb-15
Aug-14
Feb-14
Aug-13
Feb-13
Aug-12
Aug-11
Feb-11
Feb-10
Feb-12
(6%)
Aug-10
25
Commodity Costs and Pricing Levels
100%
80%
10%
(Mgf'er Prices)
Finished Processed
F&B PPI y/y Growth
(right-axis)
8%
60%
6%
(Grocer Prices) F&B
at Home CPI y/y
Growth (right-axis)
40%
4%
2%
20%
0%
0%
(4%)
Feb-16
Aug-15
Feb-15
Aug-14
Feb-14
Aug-13
Feb-13
Aug-12
Feb-12
(6%)
Aug-11
(40%)
FAO Food Price
Index y/y Growth
(left-axis)
CPI-PPI Spread
(right-axis)
Feb-11
(20%)
(2%)
Feb-10
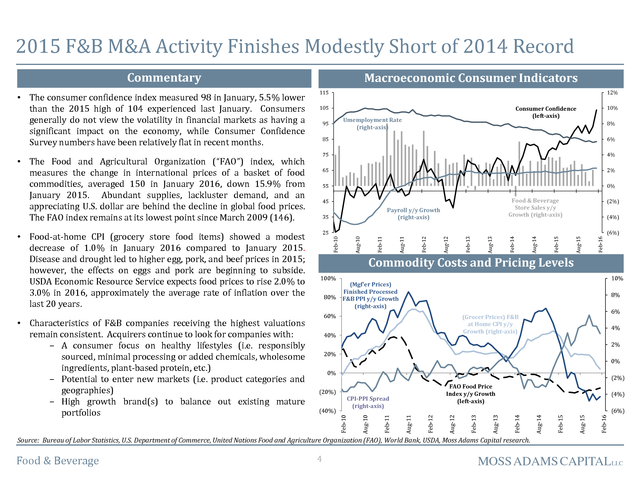
• Characteristics of F&B companies receiving the highest valuations
remain consistent. Acquirers continue to look for companies with:
− A consumer focus on healthy lifestyles (i.e. responsibly
sourced, minimal processing or added chemicals, wholesome
ingredients, plant-based protein, etc.)
− Potential to enter new markets (i.e. product categories and
geographies)
− High growth brand(s) to balance out existing mature
portfolios
10%
Consumer Confidence
(left-axis)
Umemployment Rate
(right-axis)
95
• The Food and Agricultural Organization (“FAO”) index, which
measures the change in international prices of a basket of food
commodities, averaged 150 in January 2016, down 15.9% from
January 2015.
Abundant supplies, lackluster demand, and an appreciating U.S. dollar are behind the decline in global food prices. The FAO index remains at its lowest point since March 2009 (146). • Food-at-home CPI (grocery store food items) showed a modest decrease of 1.0% in January 2016 compared to January 2015. Disease and drought led to higher egg, pork, and beef prices in 2015; however, the effects on eggs and pork are beginning to subside. USDA Economic Resource Service expects food prices to rise 2.0% to 3.0% in 2016, approximately the average rate of inflation over the last 20 years. 12% Aug-10 • The consumer confidence index measured 98 in January, 5.5% lower than the 2015 high of 104 experienced last January. Consumers generally do not view the volatility in financial markets as having a significant impact on the economy, while Consumer Confidence Survey numbers have been relatively flat in recent months. Macroeconomic Consumer Indicators 115 Source: Bureau of Labor Statistics, U.S.
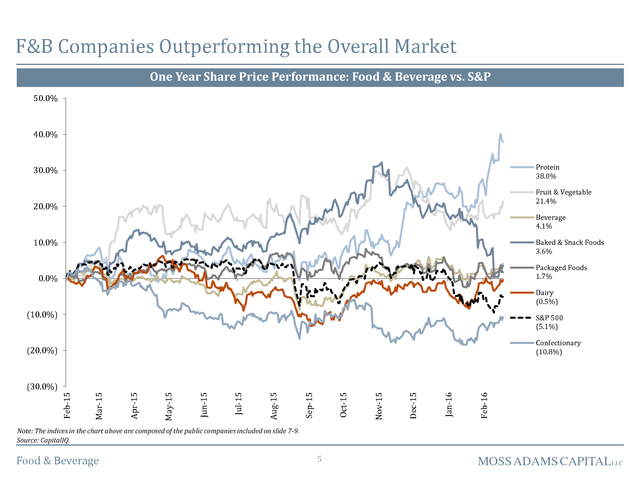
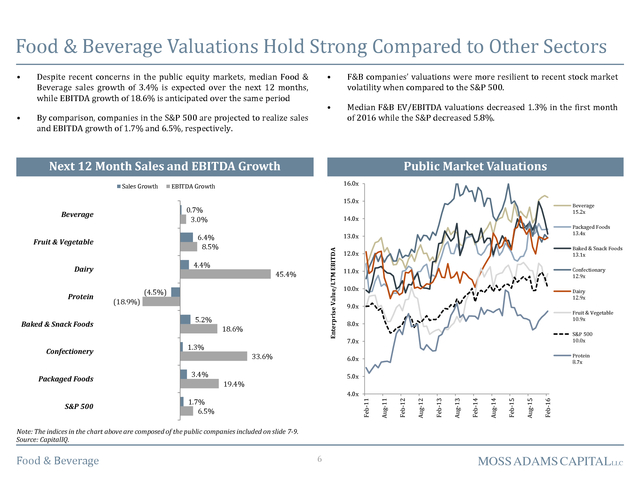
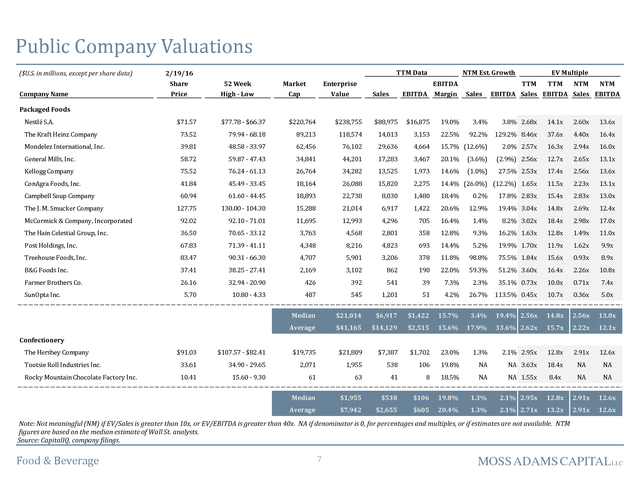
Department of Commerce, United Nations Food and Agriculture Organization (FAO), World Bank, USDA, Moss Adams Capital research. Food & Beverage 4 MOSS ADAMS CAPITALLLC . F&B Companies Outperforming the Overall Market One Year Share Price Performance: Food & Beverage vs. S&P 50.0% 40.0% Protein 38.0% 30.0% Fruit & Vegetable 21.4% 20.0% Beverage 4.1% 10.0% Baked & Snack Foods 3.6% Packaged Foods 1.7% 0.0% Dairy (0.5%) (10.0%) S&P 500 (5.1%) Confectionary (10.8%) (20.0%) Feb-16 Jan-16 Dec-15 Nov-15 Oct-15 Sep-15 Aug-15 Jul-15 Jun-15 May-15 Apr-15 Mar-15 Feb-15 (30.0%) Note: The indices in the chart above are composed of the public companies included on slide 7-9. Source: CapitalIQ. Food & Beverage 5 MOSS ADAMS CAPITALLLC . Food & Beverage Valuations Hold Strong Compared to Other Sectors • Despite recent concerns in the public equity markets, median Food & Beverage sales growth of 3.4% is expected over the next 12 months, while EBITDA growth of 18.6% is anticipated over the same period • • F&B companies’ valuations were more resilient to recent stock market volatility when compared to the S&P 500. By comparison, companies in the S&P 500 are projected to realize sales and EBITDA growth of 1.7% and 6.5%, respectively. • Median F&B EV/EBITDA valuations decreased 1.3% in the first month of 2016 while the S&P decreased 5.8%. Next 12 Month Sales and EBITDA Growth Sales Growth Public Market Valuations 16.0x EBITDA Growth 15.0x 0.7% 3.0% (18.9%) 5.2% 18.6% 11.0x Confectionary 12.9x 10.0x Dairy 12.9x 9.0x Fruit & Vegetable 10.9x 8.0x 33.6% 3.4% S&P 500 10.0x 6.0x 1.3% 7.0x Protein 8.7x 5.0x 19.4% Feb-16 Aug-15 Feb-15 Aug-14 Feb-14 Aug-13 Feb-13 4.0x 1.7% 6.5% Aug-12 S&P 500 (4.5%) Baked & Snack Foods 13.1x Feb-12 Packaged Foods 45.4% 12.0x Feb-11 Confectionery Enterprise Value/LTM EBITDA Baked & Snack Foods Packaged Foods 13.4x 13.0x 4.4% Dairy Protein 14.0x 6.4% 8.5% Fruit & Vegetable Beverage 15.2x Aug-11 Beverage Note: The indices in the chart above are composed of the public companies included on slide 7-9. Source: CapitalIQ. Food & Beverage 6 MOSS ADAMS CAPITALLLC . Public Company Valuations ($U.S. in millions, except per share data) Company Name TTM Data 2/19/16 Share Price 52 Week High - Low Market Cap Enterprise Value NTM Est. Growth EBITDA EBITDA Margin Sales Sales EV Multiple TTM TTM NTM NTM EBITDA Sales EBITDA Sales EBITDA Packaged Foods Nestlé S.A. $71.57 $77.78 - $66.37 $220,764 $238,755 $88,975 $16,875 19.0% 3.4% 3.8% 2.68x 14.1x 2.60x 13.6x The Kraft Heinz Company 73.52 79.94 - 68.18 89,213 118,574 14,013 3,153 22.5% 92.2% 129.2% 8.46x 37.6x 4.40x 16.4x Mondelez International, Inc. 39.81 48.58 - 33.97 62,456 76,102 29,636 4,664 15.7% (12.6%) 2.0% 2.57x 16.3x 2.94x 16.0x General Mills, Inc. 58.72 59.87 - 47.43 34,841 44,201 17,283 3,467 20.1% (3.6%) (2.9%) 2.56x 12.7x 2.65x 13.1x Kellogg Company 75.52 76.24 - 61.13 26,764 34,282 13,525 1,973 14.6% (1.0%) 27.5% 2.53x 17.4x 2.56x 13.6x ConAgra Foods, Inc. 41.84 45.49 - 33.45 18,164 26,088 15,820 2,275 14.4% (26.0%) (12.2%) 1.65x 11.5x 2.23x 13.1x Campbell Soup Company 60.94 61.60 - 44.45 18,893 22,738 8,030 1,480 18.4% 0.2% 17.8% 2.83x 15.4x 2.83x 13.0x The J. M.
Smucker Company 127.75 130.00 - 104.30 15,288 21,014 6,917 1,422 20.6% 12.9% 19.4% 3.04x 14.8x 2.69x 12.4x McCormick & Company, Incorporated 92.02 92.10 - 71.01 11,695 12,993 4,296 705 16.4% 1.4% 8.2% 3.02x 18.4x 2.98x 17.0x The Hain Celestial Group, Inc. 36.50 70.65 - 33.12 3,763 4,568 2,801 358 12.8% 9.3% 16.2% 1.63x 12.8x 1.49x 11.0x Post Holdings, Inc. 67.83 71.39 - 41.11 4,348 8,216 4,823 693 14.4% 5.2% 19.9% 1.70x 11.9x 1.62x 9.9x Treehouse Foods, Inc. 83.47 90.31 - 66.30 4,707 5,901 3,206 378 11.8% 98.8% 75.5% 1.84x 15.6x 0.93x 8.9x B&G Foods Inc. 37.41 38.25 - 27.41 2,169 3,102 862 190 22.0% 59.3% 51.2% 3.60x 16.4x 2.26x 10.8x Farmer Brothers Co. 26.16 32.94 - 20.90 426 392 541 39 7.3% 2.3% 35.1% 0.73x 10.0x 0.71x 7.4x 5.70 10.80 - 4.33 487 545 1,201 51 4.2% 26.7% 113.5% 0.45x 10.7x 0.36x 5.0x SunOpta Inc. Median $21,014 $6,917 $1,422 15.7% 3.4% 19.4% 2.56x 14.8x 2.56x 13.0x Average $41,165 $14,129 $2,515 15.6% 17.9% 33.6% 2.62x 15.7x 2.22x 12.1x Confectionery The Hershey Company $91.03 $107.57 - $82.41 $19,735 $21,809 $7,387 $1,702 23.0% 1.3% 2.1% 2.95x 12.8x 2.91x 12.6x Tootsie Roll Industries Inc. 33.61 34.90 - 29.65 2,071 1,955 538 106 19.8% NA NA 3.63x 18.4x NA NA Rocky Mountain Chocolate Factory Inc. 10.41 15.60 - 9.30 61 63 41 8 18.5% NA NA 1.55x 8.4x NA NA Median $1,955 $538 $106 19.8% 1.3% 2.1% 2.95x 12.8x 2.91x 12.6x Average $7,942 $2,655 $605 20.4% 1.3% 2.1% 2.71x 13.2x 2.91x 12.6x Note: Not meaningful (NM) if EV/Sales is greater than 10x, or EV/EBITDA is greater than 40x. NA if denominator is 0, for percentages and multiples, or if estimates are not available. NTM figures are based on the median estimate of Wall St.
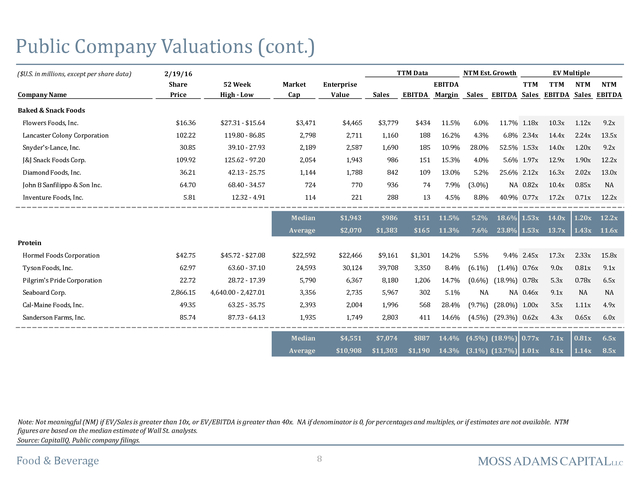
analysts. Source: CapitalIQ, company filings. Food & Beverage 7 MOSS ADAMS CAPITALLLC . Public Company Valuations (cont.) ($U.S. in millions, except per share data) Company Name TTM Data 2/19/16 Share Price 52 Week High - Low Market Cap Enterprise Value Sales NTM Est. Growth EBITDA EBITDA Margin Sales EV Multiple TTM TTM NTM NTM EBITDA Sales EBITDA Sales EBITDA Baked & Snack Foods Flowers Foods, Inc. $16.36 $27.31 - $15.64 $3,471 $4,465 $3,779 $434 11.5% 6.0% 11.7% 1.18x 10.3x 1.12x 9.2x Lancaster Colony Corporation 102.22 119.80 - 86.85 2,798 2,711 1,160 188 16.2% 4.3% 6.8% 2.34x 14.4x 2.24x 13.5x Snyder's-Lance, Inc. 30.85 39.10 - 27.93 2,189 2,587 1,690 185 10.9% 28.0% 52.5% 1.53x 14.0x 1.20x 9.2x 109.92 125.62 - 97.20 2,054 1,943 986 151 15.3% 4.0% 5.6% 1.97x 12.9x 1.90x 12.2x Diamond Foods, Inc. 36.21 42.13 - 25.75 1,144 1,788 842 109 13.0% 5.2% 25.6% 2.12x 16.3x 2.02x 13.0x John B Sanfilippo & Son Inc. 64.70 68.40 - 34.57 724 770 936 74 7.9% (3.0%) NA 0.82x 10.4x 0.85x NA 5.81 12.32 - 4.91 114 221 288 13 4.5% 8.8% 40.9% 0.77x 17.2x 0.71x 12.2x Median $1,943 $986 $151 11.5% 5.2% 18.6% 1.53x 14.0x 1.20x 12.2x Average $2,070 $1,383 $165 11.3% 7.6% 23.8% 1.53x 13.7x 1.43x 11.6x J&J Snack Foods Corp. Inventure Foods, Inc. Protein Hormel Foods Corporation Tyson Foods, Inc. Pilgrim's Pride Corporation $42.75 $45.72 - $27.08 $22,592 $22,466 $9,161 $1,301 14.2% 5.5% 9.4% 2.45x 17.3x 2.33x 15.8x 62.97 63.60 - 37.10 24,593 30,124 39,708 3,350 8.4% (6.1%) (1.4%) 0.76x 9.0x 0.81x 9.1x (0.6%) (18.9%) 0.78x 22.72 28.72 - 17.39 5,790 6,367 8,180 1,206 14.7% 2,866.15 4,640.00 - 2,427.01 3,356 2,735 5,967 302 5.1% Cal-Maine Foods, Inc. 49.35 63.25 - 35.75 2,393 2,004 1,996 568 Sanderson Farms, Inc. 85.74 87.73 - 64.13 1,935 1,749 2,803 411 Median $4,551 $7,074 Average $10,908 $11,303 Seaboard Corp. 5.3x 0.78x 6.5x NA 0.46x 9.1x NA NA 28.4% (9.7%) (28.0%) 1.00x 3.5x 1.11x 4.9x 14.6% (4.5%) (29.3%) 0.62x 4.3x 0.65x 6.0x $887 14.4% (4.5%) (18.9%) 0.77x 7.1x 0.81x 6.5x $1,190 14.3% (3.1%) (13.7%) 1.01x 8.1x 1.14x 8.5x NA Note: Not meaningful (NM) if EV/Sales is greater than 10x, or EV/EBITDA is greater than 40x. NA if denominator is 0, for percentages and multiples, or if estimates are not available.
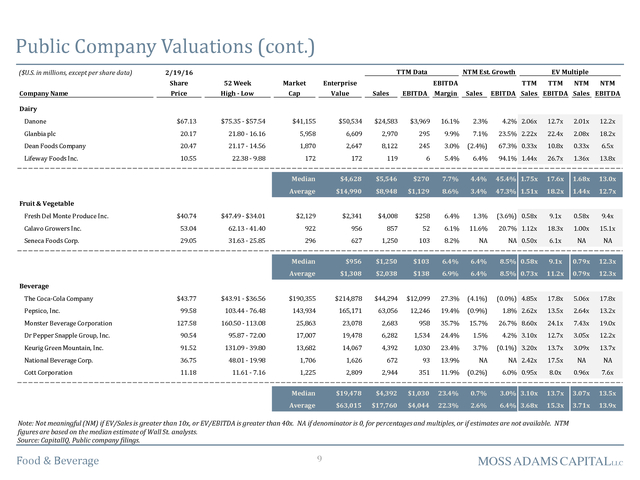
NTM figures are based on the median estimate of Wall St. analysts. Source: CapitalIQ, Public company filings. Food & Beverage 8 MOSS ADAMS CAPITALLLC . Public Company Valuations (cont.) ($U.S. in millions, except per share data) Company Name TTM Data 2/19/16 Share Price 52 Week High - Low Market Cap Enterprise Value Sales EBITDA NTM Est. Growth EBITDA Margin Sales EV Multiple TTM TTM NTM NTM EBITDA Sales EBITDA Sales EBITDA Dairy Danone $67.13 $75.35 - $57.54 $41,155 $50,534 $24,583 $3,969 16.1% 2.3% 4.2% 2.06x 12.7x 2.01x 12.2x Glanbia plc 20.17 21.80 - 16.16 5,958 6,609 2,970 295 Dean Foods Company 20.47 21.17 - 14.56 1,870 2,647 8,122 245 9.9% 7.1% 23.5% 2.22x 22.4x 2.08x 18.2x 3.0% (2.4%) 67.3% 0.33x 10.8x 0.33x 6.5x Lifeway Foods Inc. 10.55 22.38 - 9.88 172 172 119 6 5.4% 6.4% 94.1% 1.44x 26.7x 1.36x 13.8x Median $4,628 $5,546 $270 7.7% 4.4% 45.4% 1.75x 17.6x 1.68x 13.0x Average $14,990 $8,948 $1,129 8.6% 3.4% 47.3% 1.51x 18.2x 1.44x 12.7x Fruit & Vegetable Fresh Del Monte Produce Inc. $40.74 $47.49 - $34.01 $2,129 $2,341 $4,008 $258 6.4% 1.3% (3.6%) 0.58x 9.1x 0.58x 9.4x Calavo Growers Inc. 53.04 62.13 - 41.40 922 956 857 52 6.1% 11.6% 20.7% 1.12x 18.3x 1.00x 15.1x Seneca Foods Corp. 29.05 31.63 - 25.85 296 627 1,250 103 8.2% NA NA 0.50x 6.1x NA NA Median $956 $1,250 $103 6.4% 6.4% 8.5% 0.58x 9.1x 0.79x 12.3x Average $1,308 $2,038 $138 6.9% 6.4% 8.5% 0.73x 11.2x 0.79x 12.3x $43.91 - $36.56 $190,355 $214,878 $44,294 $12,099 27.3% (4.1%) (0.0%) 4.85x 17.8x 5.06x 17.8x Beverage The Coca-Cola Company Pepsico, Inc. $43.77 99.58 103.44 - 76.48 143,934 165,171 63,056 12,246 19.4% (0.9%) 1.8% 2.62x 13.5x 2.64x 13.2x Monster Beverage Corporation 127.58 160.50 - 113.08 25,863 23,078 2,683 958 35.7% 15.7% 26.7% 8.60x 24.1x 7.43x 19.0x Dr Pepper Snapple Group, Inc. 90.54 95.87 - 72.00 17,007 19,478 6,282 1,534 24.4% 1.5% 4.2% 3.10x 12.7x 3.05x 12.2x Keurig Green Mountain, Inc. 91.52 131.09 - 39.80 13,682 14,067 4,392 1,030 23.4% 3.7% (0.1%) 3.20x 13.7x 3.09x 13.7x National Beverage Corp. 36.75 48.01 - 19.98 1,706 1,626 672 93 13.9% NA NA 2.42x 17.5x NA NA Cott Corporation 11.18 11.61 - 7.16 1,225 2,809 2,944 351 11.9% (0.2%) 6.0% 0.95x 8.0x 0.96x 7.6x Median $19,478 $4,392 $1,030 23.4% 0.7% 3.0% 3.10x 13.7x 3.07x 13.5x Average $63,015 $17,760 $4,044 22.3% 2.6% 6.4% 3.68x 15.3x 3.71x 13.9x Note: Not meaningful (NM) if EV/Sales is greater than 10x, or EV/EBITDA is greater than 40x. NA if denominator is 0, for percentages and multiples, or if estimates are not available.
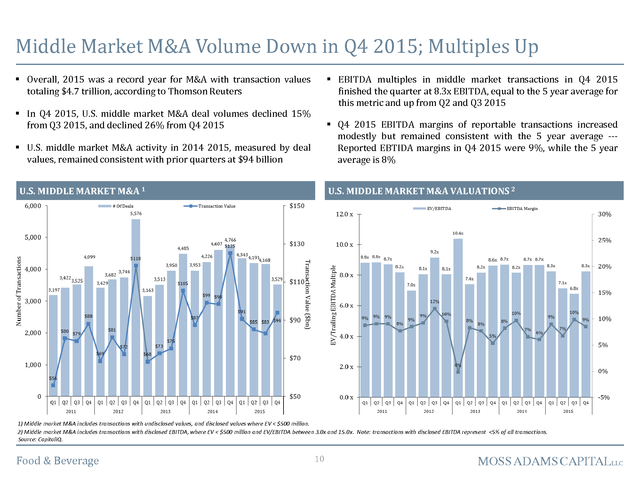
NTM figures are based on the median estimate of Wall St. analysts. Source: CapitalIQ, Public company filings. Food & Beverage 9 MOSS ADAMS CAPITALLLC . Middle Market M&A Volume Down in Q4 2015; Multiples Up  Overall, 2015 was a record year for M&A with transaction values totaling $4.7 trillion, according to Thomson Reuters  EBITDA multiples in middle market transactions in Q4 2015 finished the quarter at 8.3x EBITDA, equal to the 5 year average for this metric and up from Q2 and Q3 2015  In Q4 2015, U.S. middle market M&A deal volumes declined 15% from Q3 2015, and declined 26% from Q4 2015  Q4 2015 EBITDA margins of reportable transactions increased modestly but remained consistent with the 5 year average --Reported EBTIDA margins in Q4 2015 were 9%, while the 5 year average is 8%  U.S. middle market M&A activity in 2014 2015, measured by deal values, remained consistent with prior quarters at $94 billion U.S. MIDDLE MARKET M&A 1 U.S.
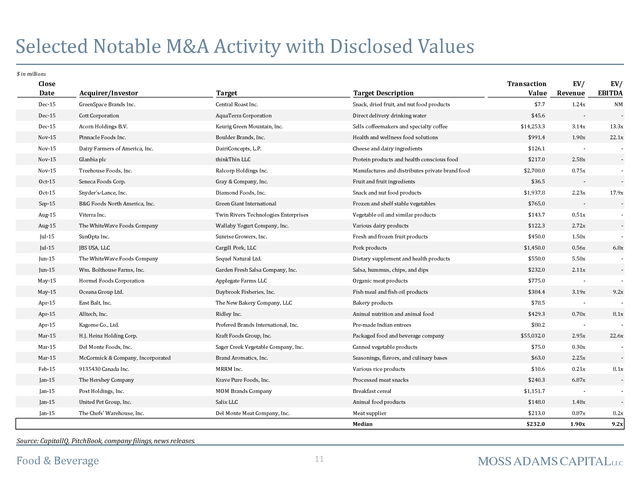
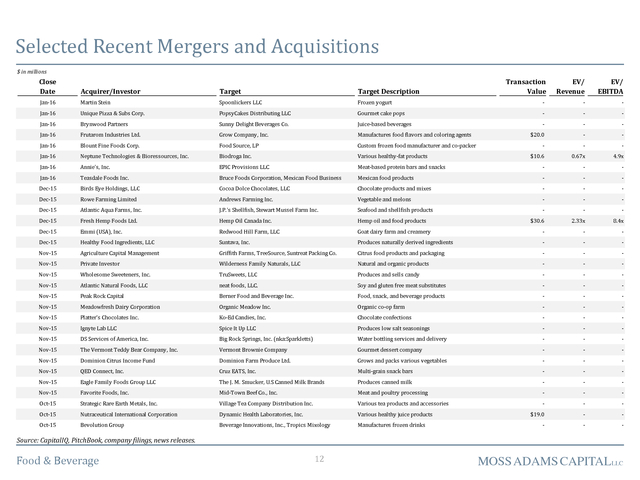
MIDDLE MARKET M&A VALUATIONS 2 1) Middle market M&A includes transactions with undisclosed values, and disclosed values where EV < $500 million. 2) Middle market M&A includes transactions with disclosed EBITDA, where EV < $500 million and EV/EBITDA between 3.0x and 15.0x. Note: transactions with disclosed EBITDA represent <5% of all transactions. Source: CapitalIQ. Food & Beverage 10 MOSS ADAMS CAPITALLLC . Selected Notable M&A Activity with Disclosed Values $ in millions Close Date Acquirer/Investor Target Target Description Dec-15 GreenSpace Brands Inc. Central Roast Inc. Snack, dried fruit, and nut food products Dec-15 Cott Corporation AquaTerra Corporation Direct delivery drinking water Transaction Value EV/ Revenue EV/ EBITDA $7.7 1.24x NM $45.6 - - Dec-15 Acorn Holdings B.V. Keurig Green Mountain, Inc. Sells coffeemakers and specialty coffee $14,253.3 3.14x 13.3x Nov-15 Pinnacle Foods Inc. Boulder Brands, Inc. Health and wellness food solutions $991.4 1.90x 22.1x Nov-15 Dairy Farmers of America, Inc. DairiConcepts, L.P. Cheese and dairy ingredients $126.1 - - Nov-15 Glanbia plc thinkThin LLC Protein products and health conscious food $217.0 2.58x - Nov-15 Treehouse Foods, Inc. Ralcorp Holdings Inc. Manufactures and distributes private brand food $2,700.0 0.75x - Oct-15 Seneca Foods Corp. Gray & Company, Inc. Fruit and fruit ingredients $36.5 - - Oct-15 Snyder's-Lance, Inc. Diamond Foods, Inc. Snack and nut food products $1,937.8 2.23x 17.9x Sep-15 B&G Foods North America, Inc. Green Giant International Frozen and shelf stable vegetables $765.0 - - Aug-15 Viterra Inc. Twin Rivers Technologies Enterprises Vegetable oil and similar products $143.7 0.51x - Aug-15 The WhiteWave Foods Company Wallaby Yogurt Company, Inc. Various dairy products $122.3 2.72x - Jul-15 SunOpta Inc. Sunrise Growers, Inc. Fresh and frozen fruit products Jul-15 JBS USA, LLC Cargill Pork, LLC Pork products Jun-15 The WhiteWave Foods Company Sequel Natural Ltd. Jun-15 Wm. Bolthouse Farms, Inc. Garden Fresh Salsa Company, Inc. May-15 Hormel Foods Corporation May-15 $450.0 1.50x - $1,450.0 0.56x 6.8x Dietary supplement and health products $550.0 5.50x - Salsa, hummus, chips, and dips $232.0 2.11x - Applegate Farms LLC Organic meat products $775.0 - - Oceana Group Ltd. Daybrook Fisheries, Inc. Fish meal and fish oil products $384.4 3.19x 9.2x Apr-15 East Balt, Inc. The New Bakery Company, LLC Bakery products Apr-15 Alltech, Inc. Ridley Inc. Animal nutrition and animal food Apr-15 Kagome Co., Ltd. Prefered Brands International, Inc. Pre-made Indian entrees Mar-15 H.J. Heinz Holding Corp. Kraft Foods Group, Inc. Packaged food and beverage company Mar-15 Del Monte Foods, Inc. Sager Creek Vegetable Company, Inc. Mar-15 McCormick & Company, Incorporated Brand Aromatics, Inc. Feb-15 9135430 Canada Inc. Jan-15 Jan-15 $78.5 - - $429.3 0.70x 8.1x $80.2 - - $55,032.0 2.95x 22.6x Canned vegetable products $75.0 0.30x - Seasonings, flavors, and culinary bases $63.0 2.25x - MRRM Inc. Various rice products $10.6 0.21x 8.1x The Hershey Company Krave Pure Foods, Inc. Processed meat snacks Post Holdings, Inc. MOM Brands Company Breakfast cereal Jan-15 United Pet Group, Inc. Salix LLC Jan-15 The Chefs' Warehouse, Inc. Del Monte Meat Company, Inc. $240.3 6.87x - $1,151.7 - - Animal food products $148.0 1.48x - Meat supplier $213.0 0.87x 8.2x $232.0 1.90x 9.2x Median Source: CapitalIQ, PitchBook, company filings, news releases. Food & Beverage 11 MOSS ADAMS CAPITALLLC . Selected Recent Mergers and Acquisitions $ in millions Close Date Acquirer/Investor Target Target Description Jan-16 Martin Stein Spoonlickers LLC Frozen yogurt Jan-16 Unique Pizza & Subs Corp. PopsyCakes Distributing LLC Gourmet cake pops Jan-16 Brynwood Partners Sunny Delight Beverages Co. Juice-based beverages Jan-16 Frutarom Industries Ltd. Grow Company, Inc. Manufactures food flavors and coloring agents Jan-16 Blount Fine Foods Corp. Food Source, LP Custom frozen food manufacturer and co-packer Jan-16 Neptune Technologies & Bioressources, Inc. Biodroga Inc. Various healthy-fat products Jan-16 Annie's, Inc. EPIC Provisions LLC Jan-16 Teasdale Foods Inc. Bruce Foods Corporation, Mexican Food Business Dec-15 Birds Eye Holdings, LLC Dec-15 Transaction Value EV/ Revenue EV/ EBITDA - - - - - - - - - $20.0 - - - - - $10.6 0.67x 4.9x Meat-based protein bars and snacks - - - Mexican food products - - - Cocoa Dolce Chocolates, LLC Chocolate products and mixes - - - Rowe Farming Limited Andrews Farming Inc. Vegetable and melons - - - Dec-15 Atlantic Aqua Farms, Inc. J.P.'s Shellfish, Stewart Mussel Farm Inc. Seafood and shellfish products - - - Dec-15 Fresh Hemp Foods Ltd. Hemp Oil Canada Inc. Hemp oil and food products $30.6 2.33x 8.4x Dec-15 Emmi (USA), Inc. Redwood Hill Farm, LLC Goat dairy farm and creamery - - - Dec-15 Healthy Food Ingredients, LLC Suntava, Inc. Produces naturally derived ingredients - - - Nov-15 Agriculture Capital Management Griffith Farms, TreeSource, Suntreat Packing Co. Citrus food products and packaging - - - Nov-15 Private Investor Wilderness Family Naturals, LLC Natural and organic products - - - Nov-15 Wholesome Sweeteners, Inc. TruSweets, LLC Produces and sells candy - - - Nov-15 Atlantic Natural Foods, LLC neat foods, LLC. Soy and gluten free meat substitutes - - - Nov-15 Peak Rock Capital Berner Food and Beverage Inc. Food, snack, and beverage products - - - Nov-15 Meadowfresh Dairy Corporation Organic Meadow Inc. Organic co-op farm - - - Nov-15 Platter's Chocolates Inc. Ko-Ed Candies, Inc. Chocolate confections - - - Nov-15 Ignyte Lab LLC Spice It Up LLC Produces low salt seasonings - - - Nov-15 DS Services of America, Inc. Big Rock Springs, Inc. (nka:Sparkletts) Water bottling services and delivery - - - Nov-15 The Vermont Teddy Bear Company, Inc. Vermont Brownie Company Gourmet dessert company - - - Nov-15 Dominion Citrus Income Fund Dominion Farm Produce Ltd. Grows and packs various vegetables - - - Nov-15 QED Connect, Inc. Cruz EATS, Inc. Multi-grain snack bars - - - Nov-15 Eagle Family Foods Group LLC The J. M. Smucker, U.S Canned Milk Brands Produces canned milk - - - Nov-15 Favorite Foods, Inc. Mid-Town Beef Co., Inc. Meat and poultry processing - - - Oct-15 Strategic Rare Earth Metals, Inc. Village Tea Company Distribution Inc. Various tea products and accessories - - - Oct-15 Nutraceutical International Corporation Dynamic Health Laboratories, Inc. Various healthy juice products $19.0 - - Oct-15 Bevolution Group Beverage Innovations, Inc., Tropics Mixology Manufactures frozen drinks - - - Source: CapitalIQ, PitchBook, company filings, news releases. Food & Beverage 12 MOSS ADAMS CAPITALLLC .
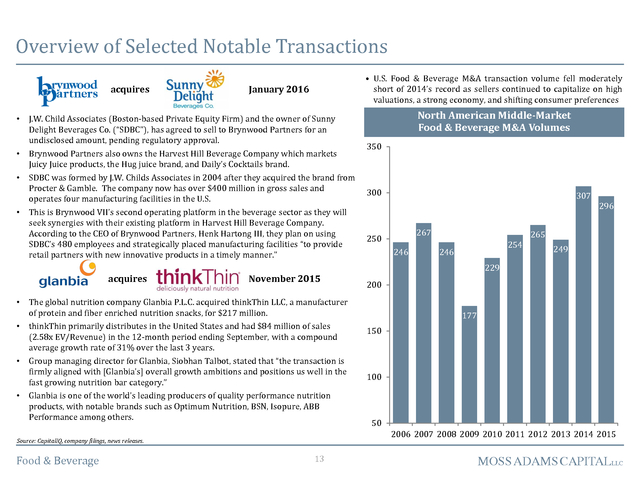
Overview of Selected Notable Transactions acquires • U.S. Food & Beverage M&A transaction volume fell moderately short of 2014’s record as sellers continued to capitalize on high valuations, a strong economy, and shifting consumer preferences January 2016 • J.W. Child Associates (Boston-based Private Equity Firm) and the owner of Sunny Delight Beverages Co. (“SDBC”), has agreed to sell to Brynwood Partners for an undisclosed amount, pending regulatory approval. • Brynwood Partners also owns the Harvest Hill Beverage Company which markets Juicy Juice products, the Hug juice brand, and Daily’s Cocktails brand. • SDBC was formed by J.W.
Childs Associates in 2004 after they acquired the brand from Procter & Gamble. The company now has over $400 million in gross sales and operates four manufacturing facilities in the U.S. • This is Brynwood VII’s second operating platform in the beverage sector as they will seek synergies with their existing platform in Harvest Hill Beverage Company. According to the CEO of Brynwood Partners, Henk Hartong III, they plan on using SDBC’s 480 employees and strategically placed manufacturing facilities “to provide retail partners with new innovative products in a timely manner.” acquires November 2015 • thinkThin primarily distributes in the United States and had $84 million of sales (2.58x EV/Revenue) in the 12-month period ending September, with a compound average growth rate of 31% over the last 3 years. • Group managing director for Glanbia, Siobhan Talbot, stated that “the transaction is firmly aligned with [Glanbia’s] overall growth ambitions and positions us well in the fast growing nutrition bar category.” 350 300 • Glanbia is one of the world’s leading producers of quality performance nutrition products, with notable brands such as Optimum Nutrition, BSN, Isopure, ABB Performance among others. 267 246 254 246 296 265 249 229 200 177 150 100 50 2006 2007 2008 2009 2010 2011 2012 2013 2014 2015 Source: CapitalIQ, company filings, news releases. Food & Beverage 307 250 The global nutrition company Glanbia P.L.C. acquired thinkThin LLC, a manufacturer of protein and fiber enriched nutrition snacks, for $217 million. • North American Middle-Market Food & Beverage M&A Volumes 13 MOSS ADAMS CAPITALLLC .
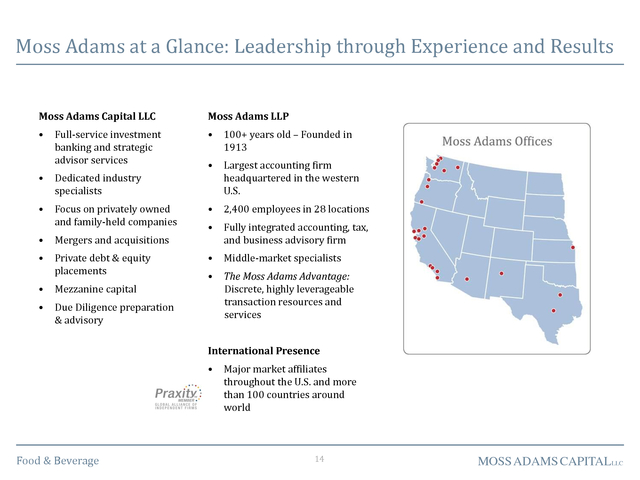
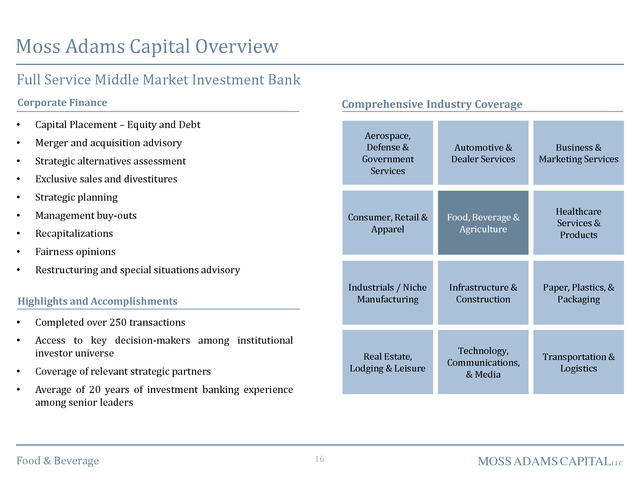
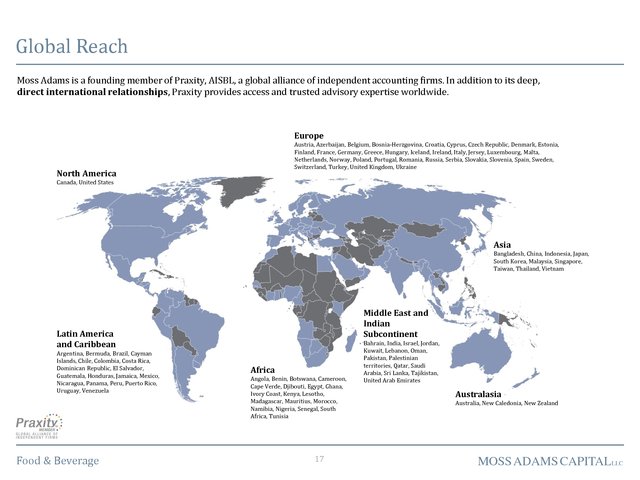
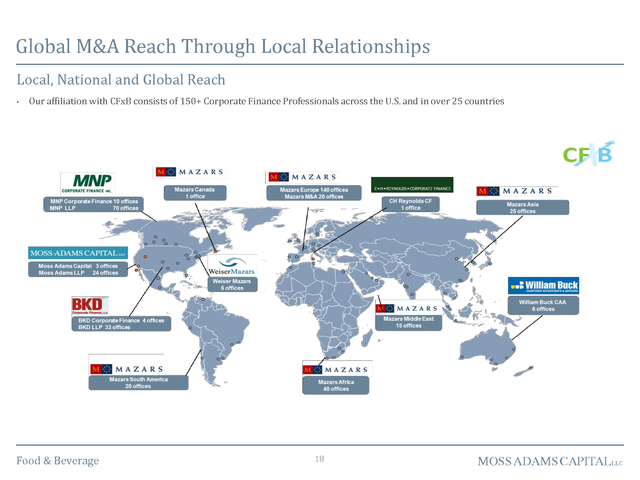
Moss Adams at a Glance: Leadership through Experience and Results Moss Adams Capital LLC Moss Adams LLP • • 100+ years old – Founded in 1913 • Largest accounting firm headquartered in the western U.S. • 2,400 employees in 28 locations • Fully integrated accounting, tax, and business advisory firm • Middle-market specialists • The Moss Adams Advantage: Discrete, highly leverageable transaction resources and services Full-service investment banking and strategic advisor services • Dedicated industry specialists • Focus on privately owned and family-held companies • Mergers and acquisitions • Private debt & equity placements • Mezzanine capital • Due Diligence preparation & advisory International Presence • Food & Beverage Major market affiliates throughout the U.S. and more than 100 countries around world 14 MOSS ADAMS CAPITALLLC . Expert Teams INDUSTRY KNOWLEDGE MATCHED WITH AN EXPERIENCED TEAM • Senior Level Attention • Commitment to our Clients • Professional Excellence • Objective & Independent Advice • Creating Value for Owners • Global Presence & Capabilities Premier accounting and financial services advice for middle-market food & beverage companies. Food & Beverage 15 MOSS ADAMS CAPITALLLC . Moss Adams Capital Overview Full Service Middle Market Investment Bank Corporate Finance • Capital Placement – Equity and Debt • Merger and acquisition advisory • Strategic alternatives assessment • Exclusive sales and divestitures • Strategic planning • Management buy-outs • Recapitalizations • Fairness opinions • Comprehensive Industry Coverage Restructuring and special situations advisory Aerospace, Defense & Government Services • Healthcare Services & Products Industrials / Niche Manufacturing Infrastructure & Construction Paper, Plastics, & Packaging Real Estate, Lodging & Leisure Access to key decision-makers among institutional investor universe Food, Beverage & Agriculture Technology, Communications, & Media Transportation & Logistics Completed over 250 transactions • Business & Marketing Services Consumer, Retail & Apparel Highlights and Accomplishments Automotive & Dealer Services • Coverage of relevant strategic partners • Average of 20 years of investment banking experience among senior leaders Food & Beverage 16 MOSS ADAMS CAPITALLLC . Global Reach Moss Adams is a founding member of Praxity, AISBL, a global alliance of independent accounting firms. In addition to its deep, direct international relationships, Praxity provides access and trusted advisory expertise worldwide. Europe Austria, Azerbaijan, Belgium, Bosnia-Herzgovina, Croatia, Cyprus, Czech Republic, Denmark, Estonia, Finland, France, Germany, Greece, Hungary, Iceland, Ireland, Italy, Jersey, Luxembourg, Malta, Netherlands, Norway, Poland, Portugal, Romania, Russia, Serbia, Slovakia, Slovenia, Spain, Sweden, Switzerland, Turkey, United Kingdom, Ukraine North America Canada, United States Asia Bangladesh, China, Indonesia, Japan, South Korea, Malaysia, Singapore, Taiwan, Thailand, Vietnam Middle East and Indian Subcontinent Latin America and Caribbean Argentina, Bermuda, Brazil, Cayman Islands, Chile, Colombia, Costa Rica, Dominican Republic, El Salvador, Guatemala, Honduras, Jamaica, Mexico, Nicaragua, Panama, Peru, Puerto Rico, Uruguay, Venezuela Food & Beverage Africa Angola, Benin, Botswana, Cameroon, Cape Verde, Djibouti, Egypt, Ghana, Ivory Coast, Kenya, Lesotho, Madagascar, Mauritius, Morocco, Namibia, Nigeria, Senegal, South Africa, Tunisia 17 Bahrain, India, Israel, Jordan, Kuwait, Lebanon, Oman, Pakistan, Palestinian territories, Qatar, Saudi Arabia, Sri Lanka, Tajikistan, United Arab Emirates Australasia Australia, New Caledonia, New Zealand MOSS ADAMS CAPITALLLC . Global M&A Reach Through Local Relationships Local, National and Global Reach • Our affiliation with CFxB consists of 150+ Corporate Finance Professionals across the U.S. and in over 25 countries • Food & Beverage more than 25 countries 18 MOSS ADAMS CAPITALLLC . Contact Us Contributing Authors: Richard Anderson Managing Director (949) 221-4006 rich.anderson@mossadams.com Wiley Kitchell Managing Director (206) 302-6780 wiley.kitchell@mossadams.com James Parr Analyst (949) 221- 4099 james.parr@mossadams.com Moss Adams Capital LLC 2040 Main Street Suite 900 Irvine, CA 92614 999 Third Avenue Suite 2800 Seattle, WA 98104 Harman Wales Managing Director (206) 302-6770 jet.wales@mossadams.com Robert Miranda Vice President (949) 221-4021 robert.miranda@mossadams.com Andrew Suen Vice President (949) 517-9428 andrew.suen@mossadams.com Brandon Clewett Director (949) 517-9426 brandon.clewett@mossadams.com Scott Porter Vice President (206) 306-6326 scott.porter@mossadams.com Bradley Erhart Associate (949) 517-9452 bradley.erhart@mossadams.com Tyler Dale Vice President (949) 221-4030 tyler.dale@mossadams.com James Rothenberger Vice President (206) 302-6777 james.rothenberger@mossadams.com Daniel Seubert Analyst (206) 302-6775 daniel.seubert@mossadams.com Food & Beverage 19 MOSS ADAMS CAPITALLLC .
Abundant supplies, lackluster demand, and an appreciating U.S. dollar are behind the decline in global food prices. The FAO index remains at its lowest point since March 2009 (146). • Food-at-home CPI (grocery store food items) showed a modest decrease of 1.0% in January 2016 compared to January 2015. Disease and drought led to higher egg, pork, and beef prices in 2015; however, the effects on eggs and pork are beginning to subside. USDA Economic Resource Service expects food prices to rise 2.0% to 3.0% in 2016, approximately the average rate of inflation over the last 20 years. 12% Aug-10 • The consumer confidence index measured 98 in January, 5.5% lower than the 2015 high of 104 experienced last January. Consumers generally do not view the volatility in financial markets as having a significant impact on the economy, while Consumer Confidence Survey numbers have been relatively flat in recent months. Macroeconomic Consumer Indicators 115 Source: Bureau of Labor Statistics, U.S.
Department of Commerce, United Nations Food and Agriculture Organization (FAO), World Bank, USDA, Moss Adams Capital research. Food & Beverage 4 MOSS ADAMS CAPITALLLC . F&B Companies Outperforming the Overall Market One Year Share Price Performance: Food & Beverage vs. S&P 50.0% 40.0% Protein 38.0% 30.0% Fruit & Vegetable 21.4% 20.0% Beverage 4.1% 10.0% Baked & Snack Foods 3.6% Packaged Foods 1.7% 0.0% Dairy (0.5%) (10.0%) S&P 500 (5.1%) Confectionary (10.8%) (20.0%) Feb-16 Jan-16 Dec-15 Nov-15 Oct-15 Sep-15 Aug-15 Jul-15 Jun-15 May-15 Apr-15 Mar-15 Feb-15 (30.0%) Note: The indices in the chart above are composed of the public companies included on slide 7-9. Source: CapitalIQ. Food & Beverage 5 MOSS ADAMS CAPITALLLC . Food & Beverage Valuations Hold Strong Compared to Other Sectors • Despite recent concerns in the public equity markets, median Food & Beverage sales growth of 3.4% is expected over the next 12 months, while EBITDA growth of 18.6% is anticipated over the same period • • F&B companies’ valuations were more resilient to recent stock market volatility when compared to the S&P 500. By comparison, companies in the S&P 500 are projected to realize sales and EBITDA growth of 1.7% and 6.5%, respectively. • Median F&B EV/EBITDA valuations decreased 1.3% in the first month of 2016 while the S&P decreased 5.8%. Next 12 Month Sales and EBITDA Growth Sales Growth Public Market Valuations 16.0x EBITDA Growth 15.0x 0.7% 3.0% (18.9%) 5.2% 18.6% 11.0x Confectionary 12.9x 10.0x Dairy 12.9x 9.0x Fruit & Vegetable 10.9x 8.0x 33.6% 3.4% S&P 500 10.0x 6.0x 1.3% 7.0x Protein 8.7x 5.0x 19.4% Feb-16 Aug-15 Feb-15 Aug-14 Feb-14 Aug-13 Feb-13 4.0x 1.7% 6.5% Aug-12 S&P 500 (4.5%) Baked & Snack Foods 13.1x Feb-12 Packaged Foods 45.4% 12.0x Feb-11 Confectionery Enterprise Value/LTM EBITDA Baked & Snack Foods Packaged Foods 13.4x 13.0x 4.4% Dairy Protein 14.0x 6.4% 8.5% Fruit & Vegetable Beverage 15.2x Aug-11 Beverage Note: The indices in the chart above are composed of the public companies included on slide 7-9. Source: CapitalIQ. Food & Beverage 6 MOSS ADAMS CAPITALLLC . Public Company Valuations ($U.S. in millions, except per share data) Company Name TTM Data 2/19/16 Share Price 52 Week High - Low Market Cap Enterprise Value NTM Est. Growth EBITDA EBITDA Margin Sales Sales EV Multiple TTM TTM NTM NTM EBITDA Sales EBITDA Sales EBITDA Packaged Foods Nestlé S.A. $71.57 $77.78 - $66.37 $220,764 $238,755 $88,975 $16,875 19.0% 3.4% 3.8% 2.68x 14.1x 2.60x 13.6x The Kraft Heinz Company 73.52 79.94 - 68.18 89,213 118,574 14,013 3,153 22.5% 92.2% 129.2% 8.46x 37.6x 4.40x 16.4x Mondelez International, Inc. 39.81 48.58 - 33.97 62,456 76,102 29,636 4,664 15.7% (12.6%) 2.0% 2.57x 16.3x 2.94x 16.0x General Mills, Inc. 58.72 59.87 - 47.43 34,841 44,201 17,283 3,467 20.1% (3.6%) (2.9%) 2.56x 12.7x 2.65x 13.1x Kellogg Company 75.52 76.24 - 61.13 26,764 34,282 13,525 1,973 14.6% (1.0%) 27.5% 2.53x 17.4x 2.56x 13.6x ConAgra Foods, Inc. 41.84 45.49 - 33.45 18,164 26,088 15,820 2,275 14.4% (26.0%) (12.2%) 1.65x 11.5x 2.23x 13.1x Campbell Soup Company 60.94 61.60 - 44.45 18,893 22,738 8,030 1,480 18.4% 0.2% 17.8% 2.83x 15.4x 2.83x 13.0x The J. M.
Smucker Company 127.75 130.00 - 104.30 15,288 21,014 6,917 1,422 20.6% 12.9% 19.4% 3.04x 14.8x 2.69x 12.4x McCormick & Company, Incorporated 92.02 92.10 - 71.01 11,695 12,993 4,296 705 16.4% 1.4% 8.2% 3.02x 18.4x 2.98x 17.0x The Hain Celestial Group, Inc. 36.50 70.65 - 33.12 3,763 4,568 2,801 358 12.8% 9.3% 16.2% 1.63x 12.8x 1.49x 11.0x Post Holdings, Inc. 67.83 71.39 - 41.11 4,348 8,216 4,823 693 14.4% 5.2% 19.9% 1.70x 11.9x 1.62x 9.9x Treehouse Foods, Inc. 83.47 90.31 - 66.30 4,707 5,901 3,206 378 11.8% 98.8% 75.5% 1.84x 15.6x 0.93x 8.9x B&G Foods Inc. 37.41 38.25 - 27.41 2,169 3,102 862 190 22.0% 59.3% 51.2% 3.60x 16.4x 2.26x 10.8x Farmer Brothers Co. 26.16 32.94 - 20.90 426 392 541 39 7.3% 2.3% 35.1% 0.73x 10.0x 0.71x 7.4x 5.70 10.80 - 4.33 487 545 1,201 51 4.2% 26.7% 113.5% 0.45x 10.7x 0.36x 5.0x SunOpta Inc. Median $21,014 $6,917 $1,422 15.7% 3.4% 19.4% 2.56x 14.8x 2.56x 13.0x Average $41,165 $14,129 $2,515 15.6% 17.9% 33.6% 2.62x 15.7x 2.22x 12.1x Confectionery The Hershey Company $91.03 $107.57 - $82.41 $19,735 $21,809 $7,387 $1,702 23.0% 1.3% 2.1% 2.95x 12.8x 2.91x 12.6x Tootsie Roll Industries Inc. 33.61 34.90 - 29.65 2,071 1,955 538 106 19.8% NA NA 3.63x 18.4x NA NA Rocky Mountain Chocolate Factory Inc. 10.41 15.60 - 9.30 61 63 41 8 18.5% NA NA 1.55x 8.4x NA NA Median $1,955 $538 $106 19.8% 1.3% 2.1% 2.95x 12.8x 2.91x 12.6x Average $7,942 $2,655 $605 20.4% 1.3% 2.1% 2.71x 13.2x 2.91x 12.6x Note: Not meaningful (NM) if EV/Sales is greater than 10x, or EV/EBITDA is greater than 40x. NA if denominator is 0, for percentages and multiples, or if estimates are not available. NTM figures are based on the median estimate of Wall St.
analysts. Source: CapitalIQ, company filings. Food & Beverage 7 MOSS ADAMS CAPITALLLC . Public Company Valuations (cont.) ($U.S. in millions, except per share data) Company Name TTM Data 2/19/16 Share Price 52 Week High - Low Market Cap Enterprise Value Sales NTM Est. Growth EBITDA EBITDA Margin Sales EV Multiple TTM TTM NTM NTM EBITDA Sales EBITDA Sales EBITDA Baked & Snack Foods Flowers Foods, Inc. $16.36 $27.31 - $15.64 $3,471 $4,465 $3,779 $434 11.5% 6.0% 11.7% 1.18x 10.3x 1.12x 9.2x Lancaster Colony Corporation 102.22 119.80 - 86.85 2,798 2,711 1,160 188 16.2% 4.3% 6.8% 2.34x 14.4x 2.24x 13.5x Snyder's-Lance, Inc. 30.85 39.10 - 27.93 2,189 2,587 1,690 185 10.9% 28.0% 52.5% 1.53x 14.0x 1.20x 9.2x 109.92 125.62 - 97.20 2,054 1,943 986 151 15.3% 4.0% 5.6% 1.97x 12.9x 1.90x 12.2x Diamond Foods, Inc. 36.21 42.13 - 25.75 1,144 1,788 842 109 13.0% 5.2% 25.6% 2.12x 16.3x 2.02x 13.0x John B Sanfilippo & Son Inc. 64.70 68.40 - 34.57 724 770 936 74 7.9% (3.0%) NA 0.82x 10.4x 0.85x NA 5.81 12.32 - 4.91 114 221 288 13 4.5% 8.8% 40.9% 0.77x 17.2x 0.71x 12.2x Median $1,943 $986 $151 11.5% 5.2% 18.6% 1.53x 14.0x 1.20x 12.2x Average $2,070 $1,383 $165 11.3% 7.6% 23.8% 1.53x 13.7x 1.43x 11.6x J&J Snack Foods Corp. Inventure Foods, Inc. Protein Hormel Foods Corporation Tyson Foods, Inc. Pilgrim's Pride Corporation $42.75 $45.72 - $27.08 $22,592 $22,466 $9,161 $1,301 14.2% 5.5% 9.4% 2.45x 17.3x 2.33x 15.8x 62.97 63.60 - 37.10 24,593 30,124 39,708 3,350 8.4% (6.1%) (1.4%) 0.76x 9.0x 0.81x 9.1x (0.6%) (18.9%) 0.78x 22.72 28.72 - 17.39 5,790 6,367 8,180 1,206 14.7% 2,866.15 4,640.00 - 2,427.01 3,356 2,735 5,967 302 5.1% Cal-Maine Foods, Inc. 49.35 63.25 - 35.75 2,393 2,004 1,996 568 Sanderson Farms, Inc. 85.74 87.73 - 64.13 1,935 1,749 2,803 411 Median $4,551 $7,074 Average $10,908 $11,303 Seaboard Corp. 5.3x 0.78x 6.5x NA 0.46x 9.1x NA NA 28.4% (9.7%) (28.0%) 1.00x 3.5x 1.11x 4.9x 14.6% (4.5%) (29.3%) 0.62x 4.3x 0.65x 6.0x $887 14.4% (4.5%) (18.9%) 0.77x 7.1x 0.81x 6.5x $1,190 14.3% (3.1%) (13.7%) 1.01x 8.1x 1.14x 8.5x NA Note: Not meaningful (NM) if EV/Sales is greater than 10x, or EV/EBITDA is greater than 40x. NA if denominator is 0, for percentages and multiples, or if estimates are not available.
NTM figures are based on the median estimate of Wall St. analysts. Source: CapitalIQ, Public company filings. Food & Beverage 8 MOSS ADAMS CAPITALLLC . Public Company Valuations (cont.) ($U.S. in millions, except per share data) Company Name TTM Data 2/19/16 Share Price 52 Week High - Low Market Cap Enterprise Value Sales EBITDA NTM Est. Growth EBITDA Margin Sales EV Multiple TTM TTM NTM NTM EBITDA Sales EBITDA Sales EBITDA Dairy Danone $67.13 $75.35 - $57.54 $41,155 $50,534 $24,583 $3,969 16.1% 2.3% 4.2% 2.06x 12.7x 2.01x 12.2x Glanbia plc 20.17 21.80 - 16.16 5,958 6,609 2,970 295 Dean Foods Company 20.47 21.17 - 14.56 1,870 2,647 8,122 245 9.9% 7.1% 23.5% 2.22x 22.4x 2.08x 18.2x 3.0% (2.4%) 67.3% 0.33x 10.8x 0.33x 6.5x Lifeway Foods Inc. 10.55 22.38 - 9.88 172 172 119 6 5.4% 6.4% 94.1% 1.44x 26.7x 1.36x 13.8x Median $4,628 $5,546 $270 7.7% 4.4% 45.4% 1.75x 17.6x 1.68x 13.0x Average $14,990 $8,948 $1,129 8.6% 3.4% 47.3% 1.51x 18.2x 1.44x 12.7x Fruit & Vegetable Fresh Del Monte Produce Inc. $40.74 $47.49 - $34.01 $2,129 $2,341 $4,008 $258 6.4% 1.3% (3.6%) 0.58x 9.1x 0.58x 9.4x Calavo Growers Inc. 53.04 62.13 - 41.40 922 956 857 52 6.1% 11.6% 20.7% 1.12x 18.3x 1.00x 15.1x Seneca Foods Corp. 29.05 31.63 - 25.85 296 627 1,250 103 8.2% NA NA 0.50x 6.1x NA NA Median $956 $1,250 $103 6.4% 6.4% 8.5% 0.58x 9.1x 0.79x 12.3x Average $1,308 $2,038 $138 6.9% 6.4% 8.5% 0.73x 11.2x 0.79x 12.3x $43.91 - $36.56 $190,355 $214,878 $44,294 $12,099 27.3% (4.1%) (0.0%) 4.85x 17.8x 5.06x 17.8x Beverage The Coca-Cola Company Pepsico, Inc. $43.77 99.58 103.44 - 76.48 143,934 165,171 63,056 12,246 19.4% (0.9%) 1.8% 2.62x 13.5x 2.64x 13.2x Monster Beverage Corporation 127.58 160.50 - 113.08 25,863 23,078 2,683 958 35.7% 15.7% 26.7% 8.60x 24.1x 7.43x 19.0x Dr Pepper Snapple Group, Inc. 90.54 95.87 - 72.00 17,007 19,478 6,282 1,534 24.4% 1.5% 4.2% 3.10x 12.7x 3.05x 12.2x Keurig Green Mountain, Inc. 91.52 131.09 - 39.80 13,682 14,067 4,392 1,030 23.4% 3.7% (0.1%) 3.20x 13.7x 3.09x 13.7x National Beverage Corp. 36.75 48.01 - 19.98 1,706 1,626 672 93 13.9% NA NA 2.42x 17.5x NA NA Cott Corporation 11.18 11.61 - 7.16 1,225 2,809 2,944 351 11.9% (0.2%) 6.0% 0.95x 8.0x 0.96x 7.6x Median $19,478 $4,392 $1,030 23.4% 0.7% 3.0% 3.10x 13.7x 3.07x 13.5x Average $63,015 $17,760 $4,044 22.3% 2.6% 6.4% 3.68x 15.3x 3.71x 13.9x Note: Not meaningful (NM) if EV/Sales is greater than 10x, or EV/EBITDA is greater than 40x. NA if denominator is 0, for percentages and multiples, or if estimates are not available.
NTM figures are based on the median estimate of Wall St. analysts. Source: CapitalIQ, Public company filings. Food & Beverage 9 MOSS ADAMS CAPITALLLC . Middle Market M&A Volume Down in Q4 2015; Multiples Up  Overall, 2015 was a record year for M&A with transaction values totaling $4.7 trillion, according to Thomson Reuters  EBITDA multiples in middle market transactions in Q4 2015 finished the quarter at 8.3x EBITDA, equal to the 5 year average for this metric and up from Q2 and Q3 2015  In Q4 2015, U.S. middle market M&A deal volumes declined 15% from Q3 2015, and declined 26% from Q4 2015  Q4 2015 EBITDA margins of reportable transactions increased modestly but remained consistent with the 5 year average --Reported EBTIDA margins in Q4 2015 were 9%, while the 5 year average is 8%  U.S. middle market M&A activity in 2014 2015, measured by deal values, remained consistent with prior quarters at $94 billion U.S. MIDDLE MARKET M&A 1 U.S.
MIDDLE MARKET M&A VALUATIONS 2 1) Middle market M&A includes transactions with undisclosed values, and disclosed values where EV < $500 million. 2) Middle market M&A includes transactions with disclosed EBITDA, where EV < $500 million and EV/EBITDA between 3.0x and 15.0x. Note: transactions with disclosed EBITDA represent <5% of all transactions. Source: CapitalIQ. Food & Beverage 10 MOSS ADAMS CAPITALLLC . Selected Notable M&A Activity with Disclosed Values $ in millions Close Date Acquirer/Investor Target Target Description Dec-15 GreenSpace Brands Inc. Central Roast Inc. Snack, dried fruit, and nut food products Dec-15 Cott Corporation AquaTerra Corporation Direct delivery drinking water Transaction Value EV/ Revenue EV/ EBITDA $7.7 1.24x NM $45.6 - - Dec-15 Acorn Holdings B.V. Keurig Green Mountain, Inc. Sells coffeemakers and specialty coffee $14,253.3 3.14x 13.3x Nov-15 Pinnacle Foods Inc. Boulder Brands, Inc. Health and wellness food solutions $991.4 1.90x 22.1x Nov-15 Dairy Farmers of America, Inc. DairiConcepts, L.P. Cheese and dairy ingredients $126.1 - - Nov-15 Glanbia plc thinkThin LLC Protein products and health conscious food $217.0 2.58x - Nov-15 Treehouse Foods, Inc. Ralcorp Holdings Inc. Manufactures and distributes private brand food $2,700.0 0.75x - Oct-15 Seneca Foods Corp. Gray & Company, Inc. Fruit and fruit ingredients $36.5 - - Oct-15 Snyder's-Lance, Inc. Diamond Foods, Inc. Snack and nut food products $1,937.8 2.23x 17.9x Sep-15 B&G Foods North America, Inc. Green Giant International Frozen and shelf stable vegetables $765.0 - - Aug-15 Viterra Inc. Twin Rivers Technologies Enterprises Vegetable oil and similar products $143.7 0.51x - Aug-15 The WhiteWave Foods Company Wallaby Yogurt Company, Inc. Various dairy products $122.3 2.72x - Jul-15 SunOpta Inc. Sunrise Growers, Inc. Fresh and frozen fruit products Jul-15 JBS USA, LLC Cargill Pork, LLC Pork products Jun-15 The WhiteWave Foods Company Sequel Natural Ltd. Jun-15 Wm. Bolthouse Farms, Inc. Garden Fresh Salsa Company, Inc. May-15 Hormel Foods Corporation May-15 $450.0 1.50x - $1,450.0 0.56x 6.8x Dietary supplement and health products $550.0 5.50x - Salsa, hummus, chips, and dips $232.0 2.11x - Applegate Farms LLC Organic meat products $775.0 - - Oceana Group Ltd. Daybrook Fisheries, Inc. Fish meal and fish oil products $384.4 3.19x 9.2x Apr-15 East Balt, Inc. The New Bakery Company, LLC Bakery products Apr-15 Alltech, Inc. Ridley Inc. Animal nutrition and animal food Apr-15 Kagome Co., Ltd. Prefered Brands International, Inc. Pre-made Indian entrees Mar-15 H.J. Heinz Holding Corp. Kraft Foods Group, Inc. Packaged food and beverage company Mar-15 Del Monte Foods, Inc. Sager Creek Vegetable Company, Inc. Mar-15 McCormick & Company, Incorporated Brand Aromatics, Inc. Feb-15 9135430 Canada Inc. Jan-15 Jan-15 $78.5 - - $429.3 0.70x 8.1x $80.2 - - $55,032.0 2.95x 22.6x Canned vegetable products $75.0 0.30x - Seasonings, flavors, and culinary bases $63.0 2.25x - MRRM Inc. Various rice products $10.6 0.21x 8.1x The Hershey Company Krave Pure Foods, Inc. Processed meat snacks Post Holdings, Inc. MOM Brands Company Breakfast cereal Jan-15 United Pet Group, Inc. Salix LLC Jan-15 The Chefs' Warehouse, Inc. Del Monte Meat Company, Inc. $240.3 6.87x - $1,151.7 - - Animal food products $148.0 1.48x - Meat supplier $213.0 0.87x 8.2x $232.0 1.90x 9.2x Median Source: CapitalIQ, PitchBook, company filings, news releases. Food & Beverage 11 MOSS ADAMS CAPITALLLC . Selected Recent Mergers and Acquisitions $ in millions Close Date Acquirer/Investor Target Target Description Jan-16 Martin Stein Spoonlickers LLC Frozen yogurt Jan-16 Unique Pizza & Subs Corp. PopsyCakes Distributing LLC Gourmet cake pops Jan-16 Brynwood Partners Sunny Delight Beverages Co. Juice-based beverages Jan-16 Frutarom Industries Ltd. Grow Company, Inc. Manufactures food flavors and coloring agents Jan-16 Blount Fine Foods Corp. Food Source, LP Custom frozen food manufacturer and co-packer Jan-16 Neptune Technologies & Bioressources, Inc. Biodroga Inc. Various healthy-fat products Jan-16 Annie's, Inc. EPIC Provisions LLC Jan-16 Teasdale Foods Inc. Bruce Foods Corporation, Mexican Food Business Dec-15 Birds Eye Holdings, LLC Dec-15 Transaction Value EV/ Revenue EV/ EBITDA - - - - - - - - - $20.0 - - - - - $10.6 0.67x 4.9x Meat-based protein bars and snacks - - - Mexican food products - - - Cocoa Dolce Chocolates, LLC Chocolate products and mixes - - - Rowe Farming Limited Andrews Farming Inc. Vegetable and melons - - - Dec-15 Atlantic Aqua Farms, Inc. J.P.'s Shellfish, Stewart Mussel Farm Inc. Seafood and shellfish products - - - Dec-15 Fresh Hemp Foods Ltd. Hemp Oil Canada Inc. Hemp oil and food products $30.6 2.33x 8.4x Dec-15 Emmi (USA), Inc. Redwood Hill Farm, LLC Goat dairy farm and creamery - - - Dec-15 Healthy Food Ingredients, LLC Suntava, Inc. Produces naturally derived ingredients - - - Nov-15 Agriculture Capital Management Griffith Farms, TreeSource, Suntreat Packing Co. Citrus food products and packaging - - - Nov-15 Private Investor Wilderness Family Naturals, LLC Natural and organic products - - - Nov-15 Wholesome Sweeteners, Inc. TruSweets, LLC Produces and sells candy - - - Nov-15 Atlantic Natural Foods, LLC neat foods, LLC. Soy and gluten free meat substitutes - - - Nov-15 Peak Rock Capital Berner Food and Beverage Inc. Food, snack, and beverage products - - - Nov-15 Meadowfresh Dairy Corporation Organic Meadow Inc. Organic co-op farm - - - Nov-15 Platter's Chocolates Inc. Ko-Ed Candies, Inc. Chocolate confections - - - Nov-15 Ignyte Lab LLC Spice It Up LLC Produces low salt seasonings - - - Nov-15 DS Services of America, Inc. Big Rock Springs, Inc. (nka:Sparkletts) Water bottling services and delivery - - - Nov-15 The Vermont Teddy Bear Company, Inc. Vermont Brownie Company Gourmet dessert company - - - Nov-15 Dominion Citrus Income Fund Dominion Farm Produce Ltd. Grows and packs various vegetables - - - Nov-15 QED Connect, Inc. Cruz EATS, Inc. Multi-grain snack bars - - - Nov-15 Eagle Family Foods Group LLC The J. M. Smucker, U.S Canned Milk Brands Produces canned milk - - - Nov-15 Favorite Foods, Inc. Mid-Town Beef Co., Inc. Meat and poultry processing - - - Oct-15 Strategic Rare Earth Metals, Inc. Village Tea Company Distribution Inc. Various tea products and accessories - - - Oct-15 Nutraceutical International Corporation Dynamic Health Laboratories, Inc. Various healthy juice products $19.0 - - Oct-15 Bevolution Group Beverage Innovations, Inc., Tropics Mixology Manufactures frozen drinks - - - Source: CapitalIQ, PitchBook, company filings, news releases. Food & Beverage 12 MOSS ADAMS CAPITALLLC .
Overview of Selected Notable Transactions acquires • U.S. Food & Beverage M&A transaction volume fell moderately short of 2014’s record as sellers continued to capitalize on high valuations, a strong economy, and shifting consumer preferences January 2016 • J.W. Child Associates (Boston-based Private Equity Firm) and the owner of Sunny Delight Beverages Co. (“SDBC”), has agreed to sell to Brynwood Partners for an undisclosed amount, pending regulatory approval. • Brynwood Partners also owns the Harvest Hill Beverage Company which markets Juicy Juice products, the Hug juice brand, and Daily’s Cocktails brand. • SDBC was formed by J.W.
Childs Associates in 2004 after they acquired the brand from Procter & Gamble. The company now has over $400 million in gross sales and operates four manufacturing facilities in the U.S. • This is Brynwood VII’s second operating platform in the beverage sector as they will seek synergies with their existing platform in Harvest Hill Beverage Company. According to the CEO of Brynwood Partners, Henk Hartong III, they plan on using SDBC’s 480 employees and strategically placed manufacturing facilities “to provide retail partners with new innovative products in a timely manner.” acquires November 2015 • thinkThin primarily distributes in the United States and had $84 million of sales (2.58x EV/Revenue) in the 12-month period ending September, with a compound average growth rate of 31% over the last 3 years. • Group managing director for Glanbia, Siobhan Talbot, stated that “the transaction is firmly aligned with [Glanbia’s] overall growth ambitions and positions us well in the fast growing nutrition bar category.” 350 300 • Glanbia is one of the world’s leading producers of quality performance nutrition products, with notable brands such as Optimum Nutrition, BSN, Isopure, ABB Performance among others. 267 246 254 246 296 265 249 229 200 177 150 100 50 2006 2007 2008 2009 2010 2011 2012 2013 2014 2015 Source: CapitalIQ, company filings, news releases. Food & Beverage 307 250 The global nutrition company Glanbia P.L.C. acquired thinkThin LLC, a manufacturer of protein and fiber enriched nutrition snacks, for $217 million. • North American Middle-Market Food & Beverage M&A Volumes 13 MOSS ADAMS CAPITALLLC .
Moss Adams at a Glance: Leadership through Experience and Results Moss Adams Capital LLC Moss Adams LLP • • 100+ years old – Founded in 1913 • Largest accounting firm headquartered in the western U.S. • 2,400 employees in 28 locations • Fully integrated accounting, tax, and business advisory firm • Middle-market specialists • The Moss Adams Advantage: Discrete, highly leverageable transaction resources and services Full-service investment banking and strategic advisor services • Dedicated industry specialists • Focus on privately owned and family-held companies • Mergers and acquisitions • Private debt & equity placements • Mezzanine capital • Due Diligence preparation & advisory International Presence • Food & Beverage Major market affiliates throughout the U.S. and more than 100 countries around world 14 MOSS ADAMS CAPITALLLC . Expert Teams INDUSTRY KNOWLEDGE MATCHED WITH AN EXPERIENCED TEAM • Senior Level Attention • Commitment to our Clients • Professional Excellence • Objective & Independent Advice • Creating Value for Owners • Global Presence & Capabilities Premier accounting and financial services advice for middle-market food & beverage companies. Food & Beverage 15 MOSS ADAMS CAPITALLLC . Moss Adams Capital Overview Full Service Middle Market Investment Bank Corporate Finance • Capital Placement – Equity and Debt • Merger and acquisition advisory • Strategic alternatives assessment • Exclusive sales and divestitures • Strategic planning • Management buy-outs • Recapitalizations • Fairness opinions • Comprehensive Industry Coverage Restructuring and special situations advisory Aerospace, Defense & Government Services • Healthcare Services & Products Industrials / Niche Manufacturing Infrastructure & Construction Paper, Plastics, & Packaging Real Estate, Lodging & Leisure Access to key decision-makers among institutional investor universe Food, Beverage & Agriculture Technology, Communications, & Media Transportation & Logistics Completed over 250 transactions • Business & Marketing Services Consumer, Retail & Apparel Highlights and Accomplishments Automotive & Dealer Services • Coverage of relevant strategic partners • Average of 20 years of investment banking experience among senior leaders Food & Beverage 16 MOSS ADAMS CAPITALLLC . Global Reach Moss Adams is a founding member of Praxity, AISBL, a global alliance of independent accounting firms. In addition to its deep, direct international relationships, Praxity provides access and trusted advisory expertise worldwide. Europe Austria, Azerbaijan, Belgium, Bosnia-Herzgovina, Croatia, Cyprus, Czech Republic, Denmark, Estonia, Finland, France, Germany, Greece, Hungary, Iceland, Ireland, Italy, Jersey, Luxembourg, Malta, Netherlands, Norway, Poland, Portugal, Romania, Russia, Serbia, Slovakia, Slovenia, Spain, Sweden, Switzerland, Turkey, United Kingdom, Ukraine North America Canada, United States Asia Bangladesh, China, Indonesia, Japan, South Korea, Malaysia, Singapore, Taiwan, Thailand, Vietnam Middle East and Indian Subcontinent Latin America and Caribbean Argentina, Bermuda, Brazil, Cayman Islands, Chile, Colombia, Costa Rica, Dominican Republic, El Salvador, Guatemala, Honduras, Jamaica, Mexico, Nicaragua, Panama, Peru, Puerto Rico, Uruguay, Venezuela Food & Beverage Africa Angola, Benin, Botswana, Cameroon, Cape Verde, Djibouti, Egypt, Ghana, Ivory Coast, Kenya, Lesotho, Madagascar, Mauritius, Morocco, Namibia, Nigeria, Senegal, South Africa, Tunisia 17 Bahrain, India, Israel, Jordan, Kuwait, Lebanon, Oman, Pakistan, Palestinian territories, Qatar, Saudi Arabia, Sri Lanka, Tajikistan, United Arab Emirates Australasia Australia, New Caledonia, New Zealand MOSS ADAMS CAPITALLLC . Global M&A Reach Through Local Relationships Local, National and Global Reach • Our affiliation with CFxB consists of 150+ Corporate Finance Professionals across the U.S. and in over 25 countries • Food & Beverage more than 25 countries 18 MOSS ADAMS CAPITALLLC . Contact Us Contributing Authors: Richard Anderson Managing Director (949) 221-4006 rich.anderson@mossadams.com Wiley Kitchell Managing Director (206) 302-6780 wiley.kitchell@mossadams.com James Parr Analyst (949) 221- 4099 james.parr@mossadams.com Moss Adams Capital LLC 2040 Main Street Suite 900 Irvine, CA 92614 999 Third Avenue Suite 2800 Seattle, WA 98104 Harman Wales Managing Director (206) 302-6770 jet.wales@mossadams.com Robert Miranda Vice President (949) 221-4021 robert.miranda@mossadams.com Andrew Suen Vice President (949) 517-9428 andrew.suen@mossadams.com Brandon Clewett Director (949) 517-9426 brandon.clewett@mossadams.com Scott Porter Vice President (206) 306-6326 scott.porter@mossadams.com Bradley Erhart Associate (949) 517-9452 bradley.erhart@mossadams.com Tyler Dale Vice President (949) 221-4030 tyler.dale@mossadams.com James Rothenberger Vice President (206) 302-6777 james.rothenberger@mossadams.com Daniel Seubert Analyst (206) 302-6775 daniel.seubert@mossadams.com Food & Beverage 19 MOSS ADAMS CAPITALLLC .


