Market Volatility – Emotion vs. Objectivity - David H. Barton - January 26, 2016
Mercer Global Advisors


Description
C MPASS
CEO
News, insight, and direction from Mercer Advisors’ Chief Executive Officer
January 26, 2016 | Page 1 of 3
MARKET UPDATE
Market Volatility – Emotion vs. Objectivity
Due to recent down market activity, we’ve refreshed the content of the following communication in
order to share again its important “avoid making short-term moves with long-term capital” message.
2016 marks the worst start for U.S. stock markets since 1930. This type of volatility is understandably unnerving for many and can trigger a subconscious ‘fight or flight’ response.
Add to that an onslaught of headlines (accentuated by a doom-and-gloom slant to boost ratings) related to: • plummeting oil prices; • Yuan devaluations; • global terror; • sluggish U.S. manufacturing and export data; • two consecutive quarters of corporate profit declines; • stock market routs in China; • the Fed’s first interest rate hike in nearly a decade; • the upcoming Presidential election… and it can become increasingly difficult to maintain peace of mind and discipline in the midst of what feels like never-ending market uncertainty. During the tough times, it’s our job to help you manage your emotions and expectations (stirred by short-term events) so you can focus on the purpose and strength of your intentionally designed long-term investment plan. Remember: knowledge and perspective drive discipline and discipline leads to success. MARKET CORRECTIONS FIGURE 1: The S&P Has Fallen Five Percent in a Week Eight Times Since the End of the Financial Crisis in 2009 2500.00 2011: U.S.
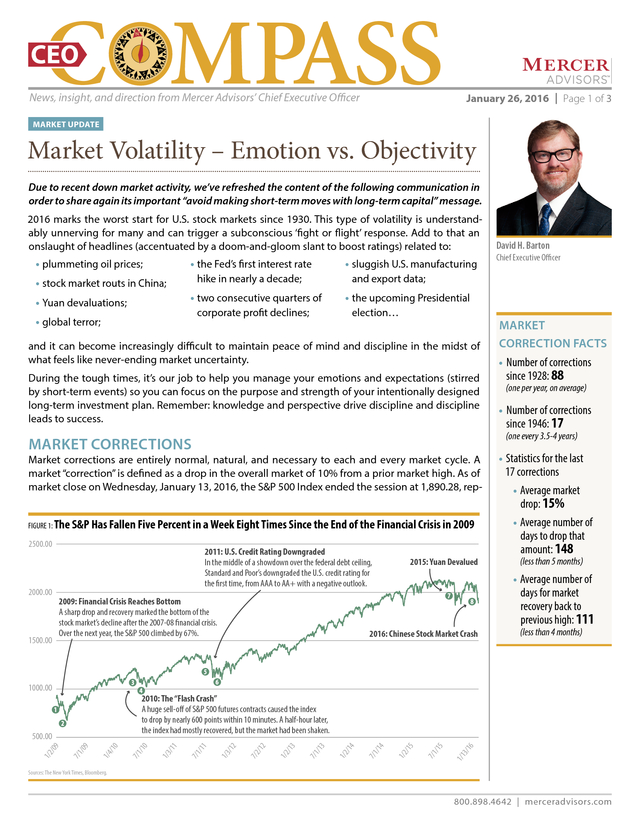
Credit Rating Downgraded In the middle of a showdown over the federal debt ceiling, Standard and Poor’s downgraded the U.S. credit rating for the first time, from AAA to AA+ with a negative outlook. 2009: Financial Crisis Reaches Bottom A sharp drop and recovery marked the bottom of the stock market’s decline after the 2007-08 financial crisis. Over the next year, the S&P 500 climbed by 67%. 1000.00 2015: Yuan Devalued (one per year, on average) • Number of corrections since 1946: 17 • Statistics for the last 17 corrections • Average market drop: 15% • Average number of days to drop that amount: 148 (less than 5 months) • Average number of days for market recovery back to previous high: 111 2016: Chinese Stock Market Crash (less than 4 months) 6 3/1 1/1 /15 7/1 15 1/2 / /14 7/1 /14 1/2 7/1 /13 /13 1/2 /12 7/2 /12 1/3 /11 7/1 /11 1/3 /10 /10 1/4 /09 7/1 /09 500.00 1/2 MARKET CORRECTION FACTS • Number of corrections since 1928: 88 2010: The “Flash Crash” A huge sell-off of S&P 500 futures contracts caused the index to drop by nearly 600 points within 10 minutes. A half-hour later, the index had mostly recovered, but the market had been shaken. 7/1 1500.00 Chief Executive Officer (one every 3.5-4 years) Market corrections are entirely normal, natural, and necessary to each and every market cycle.
A market “correction” is defined as a drop in the overall market of 10% from a prior market high. As of market close on Wednesday, January 13, 2016, the S&P 500 Index ended the session at 1,890.28, rep- 2000.00 David H. Barton Sources: The New York Times, Bloomberg. 800.898.4642 | merceradvisors.com .
CEO Compass January 26, 2016 | Page 2 of 3 resenting a 11.29% correction from its all-time peak of 2,130.82 on May 21, 2015, and a 10.40% correction from its November peak of 2,109.79 on November 3, 2015. For example, in the spring of 2010, the S&P 500 experienced a 69-day drop of 16%. The correction during the summer of 2011 lasted 154 days and came close to becoming a bear market (defined as an overall market drop of 20% or more). The spring 2012 correction, while barely a correction in the true sense of the word, had a peak-to-trough drop of 9.9% in just under 60 days. History shows us that the market recovers from its corrections. Historically, the average time frame from correction to full recovery is typically less than nine months.
Since the stock market’s trough on March 9, 2009, there have been four corrections including our most recent entry into correction territory on January 13, 2016. Yet despite these corrections, the S&P 500 Index has increased 179% since March 9, 2009. As with all things investment related, there is no guarantee that past correction recovery periods are indicative of current or future recovery time frames. However, unless you need liquid assets for near-term expenditures, the best thing you can do right now for your long-term financial wealth is to practice patience and discipline.
Turn off the television, re-read your investment policy document, and call your Wealth Management Team. Your dedicated Team is here to provide you with a listening ear, an objective viewpoint, and constructive advice for how to weather this latest bump in your investment journey. Until you and your Team connect, remember: There is no free lunch Stock markets are volatile; with investing comes risk and risk and return are related. We expect to be (and are) rewarded with higher long-term returns on stocks because they come part and parcel with greater volatility.
And to reap the full long- FIGURE 2: Market Drop Definitions PERCENTAGE DROP DEFINED AS FEELS LIKE less than 5% Pause ‘whatever’ 5% to 10% Dip refreshing 10%+ Correction nerve wracking 20%+ Bear Market panic 50%+ Crash 80%+ Depression train wreck “pack up the kids” Source: The Reformed Broker. term benefits afforded through stock market participation, it is necessary to remain invested in the stock market through the bad times as well as the good. All that said, we certainly understand it is not fun or easy to go through a market correction or bear market. It’s time to make lemonade With market volatility and corrections come opportunities to buy low. If you are holding cash, or sitting on unrealized gains or losses within your portfolio, your Team will explore options for tax loss harvesting to offset gains and/or rebalancing measures to restore asset class weightings to the optimized profile for your established investment strategy. This too shall pass We have worked together to construct a thoughtful investment plan based on your unique needs and specific goals for Economic Freedom®.
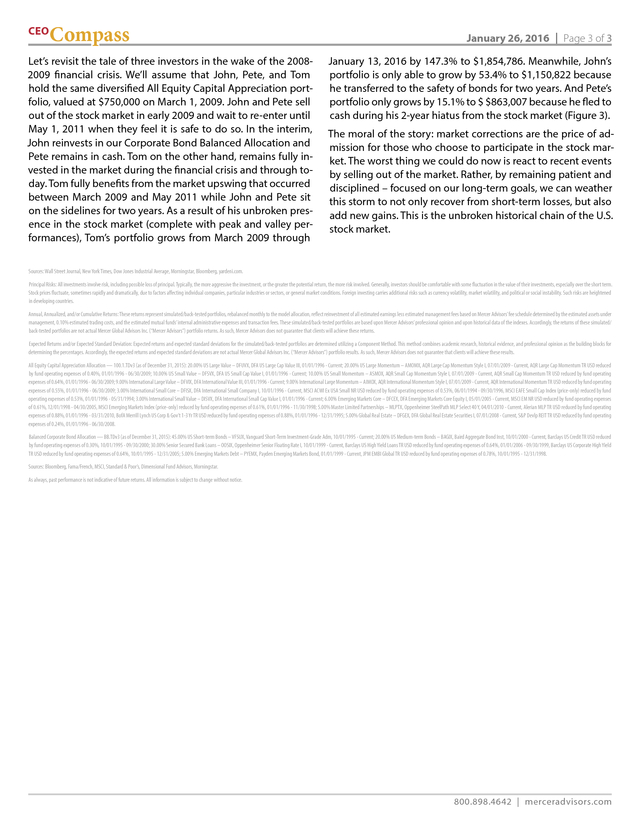
With your discipline and long-term focus, your plan will remain positioned to deliver on exactly what the Mercer Advisors Investment Committee designed it to do. FIGURE 3: Steady Tom vs. Nervous John vs. Frantic Pete $2.5 Steady Tom – Maintained Diversified Investments $1,854,786 Value in Millions $2.0 Nervous John – Reinvested in Bonds $1,150,822 $1.5 $1.0 $750,000 Frantic Pete – Retreated to Cash 1/1 1/2 1/1 5 1/3 4 1/1 1/3 3 1/1 1/3 2 1/1 1/3 1 1/1 1/3 0 1/1 1/3 9 1/0 1/3 8 1/0 1/3 7 1/0 1/3 6 1/0 1/3 5 1/0 1/3 6 $863,007 $0.5 Source: Mercer Advisors Investment Committee.
See end notes for strategy disclosures. 800.898.4642 | merceradvisors.com . CEO Compass Let’s revisit the tale of three investors in the wake of the 20082009 financial crisis. We’ll assume that John, Pete, and Tom hold the same diversified All Equity Capital Appreciation portfolio, valued at $750,000 on March 1, 2009. John and Pete sell out of the stock market in early 2009 and wait to re-enter until May 1, 2011 when they feel it is safe to do so. In the interim, John reinvests in our Corporate Bond Balanced Allocation and Pete remains in cash.
Tom on the other hand, remains fully invested in the market during the financial crisis and through today. Tom fully benefits from the market upswing that occurred between March 2009 and May 2011 while John and Pete sit on the sidelines for two years. As a result of his unbroken presence in the stock market (complete with peak and valley performances), Tom’s portfolio grows from March 2009 through January 26, 2016 | Page 3 of 3 January 13, 2016 by 147.3% to $1,854,786.
Meanwhile, John’s portfolio is only able to grow by 53.4% to $1,150,822 because he transferred to the safety of bonds for two years. And Pete’s portfolio only grows by 15.1% to $ $863,007 because he fled to cash during his 2-year hiatus from the stock market (Figure 3). The moral of the story: market corrections are the price of admission for those who choose to participate in the stock market. The worst thing we could do now is react to recent events by selling out of the market.
Rather, by remaining patient and disciplined – focused on our long-term goals, we can weather this storm to not only recover from short-term losses, but also add new gains. This is the unbroken historical chain of the U.S. stock market. Sources: Wall Street Journal, New York Times, Dow Jones Industrial Average, Morningstar, Bloomberg, yardeni.com. Principal Risks: All investments involve risk, including possible loss of principal. Typically, the more aggressive the investment, or the greater the potential return, the more risk involved.
Generally, investors should be comfortable with some fluctuation in the value of their investments, especially over the short term. Stock prices fluctuate, sometimes rapidly and dramatically, due to factors affecting individual companies, particular industries or sectors, or general market conditions. Foreign investing carries additional risks such as currency volatility, market volatility, and political or social instability. Such risks are heightened in developing countries. Annual, Annualized, and/or Cumulative Returns: These returns represent simulated/back-tested portfolios, rebalanced monthly to the model allocation, reflect reinvestment of all estimated earnings less estimated management fees based on Mercer Advisors’ fee schedule determined by the estimated assets under management, 0.10% estimated trading costs, and the estimated mutual funds’ internal administrative expenses and transaction fees.
These simulated/back-tested portfolios are based upon Mercer Advisors’ professional opinion and upon historical data of the indexes. Accordingly, the returns of these simulated/ back-tested portfolios are not actual Mercer Global Advisors Inc. (“Mercer Advisors”) portfolio returns.
As such, Mercer Advisors does not guarantee that clients will achieve these returns. Expected Returns and/or Expected Standard Deviation: Expected returns and expected standard deviations for the simulated/back-tested portfolios are determined utilizing a Component Method. This method combines academic research, historical evidence, and professional opinion as the building blocks for determining the percentages. Accordingly, the expected returns and expected standard deviations are not actual Mercer Global Advisors Inc.
(“Mercer Advisors”) portfolio results. As such, Mercer Advisors does not guarantee that clients will achieve these results. All Equity Capital Appreciation Allocation — 100.1.TDv3 (as of December 31, 2015): 20.00% US Large Value – DFUVX, DFA US Large Cap Value III, 01/01/1996 - Current; 20.00% US Large Momentum – AMOMX, AQR Large Cap Momentum Style I, 07/01/2009 - Current, AQR Large Cap Momentum TR USD reduced by fund operating expenses of 0.40%, 01/01/1996 - 06/30/2009; 10.00% US Small Value – DFSVX, DFA US Small Cap Value I, 01/01/1996 - Current; 10.00% US Small Momentum – ASMOX, AQR Small Cap Momentum Style I, 07/01/2009 - Current, AQR Small Cap Momentum TR USD reduced by fund operating expenses of 0.64%, 01/01/1996 - 06/30/2009; 9.00% International Large Value – DFVIX, DFA International Value III, 01/01/1996 - Current; 9.00% International Large Momentum – AIMOX, AQR International Momentum Style I, 07/01/2009 - Current, AQR International Momentum TR USD reduced by fund operating expenses of 0.55%, 01/01/1996 - 06/30/2009; 3.00% International Small Core – DFISX, DFA International Small Company I, 10/01/1996 - Current, MSCI ACWI Ex USA Small NR USD reduced by fund operating expenses of 0.53%, 06/01/1994 - 09/30/1996, MSCI EAFE Small Cap Index (price-only) reduced by fund operating expenses of 0.53%, 01/01/1996 - 05/31/1994; 3.00% International Small Value – DISVX, DFA International Small Cap Value I, 01/01/1996 - Current; 6.00% Emerging Markets Core – DFCEX, DFA Emerging Markets Core Equity I, 05/01/2005 - Current, MSCI EM NR USD reduced by fund operating expenses of 0.61%, 12/01/1998 - 04/30/2005, MSCI Emerging Markets Index (price-only) reduced by fund operating expenses of 0.61%, 01/01/1996 - 11/30/1998; 5.00% Master Limited Partnerships – MLPTX, Oppenheimer SteelPath MLP Select 40 Y, 04/01/2010 - Current, Alerian MLP TR USD reduced by fund operating expenses of 0.88%, 01/01/1996 - 03/31/2010, BofA Merrill Lynch US Corp & Gov’t 1-3 Yr TR USD reduced by fund operating expenses of 0.88%, 01/01/1996 - 12/31/1995; 5.00% Global Real Estate – DFGEX, DFA Global Real Estate Securities I, 07/01/2008 - Current, S&P Devlp REIT TR USD reduced by fund operating expenses of 0.24%, 01/01/1996 - 06/30/2008. Balanced Corporate Bond Allocation — BB.TDv3 (as of December 31, 2015): 45.00% US Short-term Bonds – VFSUX, Vanguard Short-Term Investment-Grade Adm, 10/01/1995 - Current; 20.00% US Medium-term Bonds – BAGIX, Baird Aggregate Bond Inst, 10/01/2000 - Current, Barclays US Credit TR USD reduced by fund operating expenses of 0.30%, 10/01/1995 - 09/30/2000; 30.00% Senior Secured Bank Loans – OOSIX, Oppenheimer Senior Floating Rate I, 10/01/1999 - Current, Barclays US High Yield Loans TR USD reduced by fund operating expenses of 0.64%, 01/01/2006 - 09/30/1999, Barclays US Corporate High Yield TR USD reduced by fund operating expenses of 0.64%, 10/01/1995 - 12/31/2005; 5.00% Emerging Markets Debt – PYEMX, Payden Emerging Markets Bond, 01/01/1999 - Current, JPM EMBI Global TR USD reduced by fund operating expenses of 0.78%, 10/01/1995 - 12/31/1998. Sources: Bloomberg, Fama/French, MSCI, Standard & Poor’s, Dimensional Fund Advisors, Morningstar. As always, past performance is not indicative of future returns. All information is subject to change without notice. 800.898.4642 | merceradvisors.com .
.
Add to that an onslaught of headlines (accentuated by a doom-and-gloom slant to boost ratings) related to: • plummeting oil prices; • Yuan devaluations; • global terror; • sluggish U.S. manufacturing and export data; • two consecutive quarters of corporate profit declines; • stock market routs in China; • the Fed’s first interest rate hike in nearly a decade; • the upcoming Presidential election… and it can become increasingly difficult to maintain peace of mind and discipline in the midst of what feels like never-ending market uncertainty. During the tough times, it’s our job to help you manage your emotions and expectations (stirred by short-term events) so you can focus on the purpose and strength of your intentionally designed long-term investment plan. Remember: knowledge and perspective drive discipline and discipline leads to success. MARKET CORRECTIONS FIGURE 1: The S&P Has Fallen Five Percent in a Week Eight Times Since the End of the Financial Crisis in 2009 2500.00 2011: U.S.
Credit Rating Downgraded In the middle of a showdown over the federal debt ceiling, Standard and Poor’s downgraded the U.S. credit rating for the first time, from AAA to AA+ with a negative outlook. 2009: Financial Crisis Reaches Bottom A sharp drop and recovery marked the bottom of the stock market’s decline after the 2007-08 financial crisis. Over the next year, the S&P 500 climbed by 67%. 1000.00 2015: Yuan Devalued (one per year, on average) • Number of corrections since 1946: 17 • Statistics for the last 17 corrections • Average market drop: 15% • Average number of days to drop that amount: 148 (less than 5 months) • Average number of days for market recovery back to previous high: 111 2016: Chinese Stock Market Crash (less than 4 months) 6 3/1 1/1 /15 7/1 15 1/2 / /14 7/1 /14 1/2 7/1 /13 /13 1/2 /12 7/2 /12 1/3 /11 7/1 /11 1/3 /10 /10 1/4 /09 7/1 /09 500.00 1/2 MARKET CORRECTION FACTS • Number of corrections since 1928: 88 2010: The “Flash Crash” A huge sell-off of S&P 500 futures contracts caused the index to drop by nearly 600 points within 10 minutes. A half-hour later, the index had mostly recovered, but the market had been shaken. 7/1 1500.00 Chief Executive Officer (one every 3.5-4 years) Market corrections are entirely normal, natural, and necessary to each and every market cycle.
A market “correction” is defined as a drop in the overall market of 10% from a prior market high. As of market close on Wednesday, January 13, 2016, the S&P 500 Index ended the session at 1,890.28, rep- 2000.00 David H. Barton Sources: The New York Times, Bloomberg. 800.898.4642 | merceradvisors.com .
CEO Compass January 26, 2016 | Page 2 of 3 resenting a 11.29% correction from its all-time peak of 2,130.82 on May 21, 2015, and a 10.40% correction from its November peak of 2,109.79 on November 3, 2015. For example, in the spring of 2010, the S&P 500 experienced a 69-day drop of 16%. The correction during the summer of 2011 lasted 154 days and came close to becoming a bear market (defined as an overall market drop of 20% or more). The spring 2012 correction, while barely a correction in the true sense of the word, had a peak-to-trough drop of 9.9% in just under 60 days. History shows us that the market recovers from its corrections. Historically, the average time frame from correction to full recovery is typically less than nine months.
Since the stock market’s trough on March 9, 2009, there have been four corrections including our most recent entry into correction territory on January 13, 2016. Yet despite these corrections, the S&P 500 Index has increased 179% since March 9, 2009. As with all things investment related, there is no guarantee that past correction recovery periods are indicative of current or future recovery time frames. However, unless you need liquid assets for near-term expenditures, the best thing you can do right now for your long-term financial wealth is to practice patience and discipline.
Turn off the television, re-read your investment policy document, and call your Wealth Management Team. Your dedicated Team is here to provide you with a listening ear, an objective viewpoint, and constructive advice for how to weather this latest bump in your investment journey. Until you and your Team connect, remember: There is no free lunch Stock markets are volatile; with investing comes risk and risk and return are related. We expect to be (and are) rewarded with higher long-term returns on stocks because they come part and parcel with greater volatility.
And to reap the full long- FIGURE 2: Market Drop Definitions PERCENTAGE DROP DEFINED AS FEELS LIKE less than 5% Pause ‘whatever’ 5% to 10% Dip refreshing 10%+ Correction nerve wracking 20%+ Bear Market panic 50%+ Crash 80%+ Depression train wreck “pack up the kids” Source: The Reformed Broker. term benefits afforded through stock market participation, it is necessary to remain invested in the stock market through the bad times as well as the good. All that said, we certainly understand it is not fun or easy to go through a market correction or bear market. It’s time to make lemonade With market volatility and corrections come opportunities to buy low. If you are holding cash, or sitting on unrealized gains or losses within your portfolio, your Team will explore options for tax loss harvesting to offset gains and/or rebalancing measures to restore asset class weightings to the optimized profile for your established investment strategy. This too shall pass We have worked together to construct a thoughtful investment plan based on your unique needs and specific goals for Economic Freedom®.
With your discipline and long-term focus, your plan will remain positioned to deliver on exactly what the Mercer Advisors Investment Committee designed it to do. FIGURE 3: Steady Tom vs. Nervous John vs. Frantic Pete $2.5 Steady Tom – Maintained Diversified Investments $1,854,786 Value in Millions $2.0 Nervous John – Reinvested in Bonds $1,150,822 $1.5 $1.0 $750,000 Frantic Pete – Retreated to Cash 1/1 1/2 1/1 5 1/3 4 1/1 1/3 3 1/1 1/3 2 1/1 1/3 1 1/1 1/3 0 1/1 1/3 9 1/0 1/3 8 1/0 1/3 7 1/0 1/3 6 1/0 1/3 5 1/0 1/3 6 $863,007 $0.5 Source: Mercer Advisors Investment Committee.
See end notes for strategy disclosures. 800.898.4642 | merceradvisors.com . CEO Compass Let’s revisit the tale of three investors in the wake of the 20082009 financial crisis. We’ll assume that John, Pete, and Tom hold the same diversified All Equity Capital Appreciation portfolio, valued at $750,000 on March 1, 2009. John and Pete sell out of the stock market in early 2009 and wait to re-enter until May 1, 2011 when they feel it is safe to do so. In the interim, John reinvests in our Corporate Bond Balanced Allocation and Pete remains in cash.
Tom on the other hand, remains fully invested in the market during the financial crisis and through today. Tom fully benefits from the market upswing that occurred between March 2009 and May 2011 while John and Pete sit on the sidelines for two years. As a result of his unbroken presence in the stock market (complete with peak and valley performances), Tom’s portfolio grows from March 2009 through January 26, 2016 | Page 3 of 3 January 13, 2016 by 147.3% to $1,854,786.
Meanwhile, John’s portfolio is only able to grow by 53.4% to $1,150,822 because he transferred to the safety of bonds for two years. And Pete’s portfolio only grows by 15.1% to $ $863,007 because he fled to cash during his 2-year hiatus from the stock market (Figure 3). The moral of the story: market corrections are the price of admission for those who choose to participate in the stock market. The worst thing we could do now is react to recent events by selling out of the market.
Rather, by remaining patient and disciplined – focused on our long-term goals, we can weather this storm to not only recover from short-term losses, but also add new gains. This is the unbroken historical chain of the U.S. stock market. Sources: Wall Street Journal, New York Times, Dow Jones Industrial Average, Morningstar, Bloomberg, yardeni.com. Principal Risks: All investments involve risk, including possible loss of principal. Typically, the more aggressive the investment, or the greater the potential return, the more risk involved.
Generally, investors should be comfortable with some fluctuation in the value of their investments, especially over the short term. Stock prices fluctuate, sometimes rapidly and dramatically, due to factors affecting individual companies, particular industries or sectors, or general market conditions. Foreign investing carries additional risks such as currency volatility, market volatility, and political or social instability. Such risks are heightened in developing countries. Annual, Annualized, and/or Cumulative Returns: These returns represent simulated/back-tested portfolios, rebalanced monthly to the model allocation, reflect reinvestment of all estimated earnings less estimated management fees based on Mercer Advisors’ fee schedule determined by the estimated assets under management, 0.10% estimated trading costs, and the estimated mutual funds’ internal administrative expenses and transaction fees.
These simulated/back-tested portfolios are based upon Mercer Advisors’ professional opinion and upon historical data of the indexes. Accordingly, the returns of these simulated/ back-tested portfolios are not actual Mercer Global Advisors Inc. (“Mercer Advisors”) portfolio returns.
As such, Mercer Advisors does not guarantee that clients will achieve these returns. Expected Returns and/or Expected Standard Deviation: Expected returns and expected standard deviations for the simulated/back-tested portfolios are determined utilizing a Component Method. This method combines academic research, historical evidence, and professional opinion as the building blocks for determining the percentages. Accordingly, the expected returns and expected standard deviations are not actual Mercer Global Advisors Inc.
(“Mercer Advisors”) portfolio results. As such, Mercer Advisors does not guarantee that clients will achieve these results. All Equity Capital Appreciation Allocation — 100.1.TDv3 (as of December 31, 2015): 20.00% US Large Value – DFUVX, DFA US Large Cap Value III, 01/01/1996 - Current; 20.00% US Large Momentum – AMOMX, AQR Large Cap Momentum Style I, 07/01/2009 - Current, AQR Large Cap Momentum TR USD reduced by fund operating expenses of 0.40%, 01/01/1996 - 06/30/2009; 10.00% US Small Value – DFSVX, DFA US Small Cap Value I, 01/01/1996 - Current; 10.00% US Small Momentum – ASMOX, AQR Small Cap Momentum Style I, 07/01/2009 - Current, AQR Small Cap Momentum TR USD reduced by fund operating expenses of 0.64%, 01/01/1996 - 06/30/2009; 9.00% International Large Value – DFVIX, DFA International Value III, 01/01/1996 - Current; 9.00% International Large Momentum – AIMOX, AQR International Momentum Style I, 07/01/2009 - Current, AQR International Momentum TR USD reduced by fund operating expenses of 0.55%, 01/01/1996 - 06/30/2009; 3.00% International Small Core – DFISX, DFA International Small Company I, 10/01/1996 - Current, MSCI ACWI Ex USA Small NR USD reduced by fund operating expenses of 0.53%, 06/01/1994 - 09/30/1996, MSCI EAFE Small Cap Index (price-only) reduced by fund operating expenses of 0.53%, 01/01/1996 - 05/31/1994; 3.00% International Small Value – DISVX, DFA International Small Cap Value I, 01/01/1996 - Current; 6.00% Emerging Markets Core – DFCEX, DFA Emerging Markets Core Equity I, 05/01/2005 - Current, MSCI EM NR USD reduced by fund operating expenses of 0.61%, 12/01/1998 - 04/30/2005, MSCI Emerging Markets Index (price-only) reduced by fund operating expenses of 0.61%, 01/01/1996 - 11/30/1998; 5.00% Master Limited Partnerships – MLPTX, Oppenheimer SteelPath MLP Select 40 Y, 04/01/2010 - Current, Alerian MLP TR USD reduced by fund operating expenses of 0.88%, 01/01/1996 - 03/31/2010, BofA Merrill Lynch US Corp & Gov’t 1-3 Yr TR USD reduced by fund operating expenses of 0.88%, 01/01/1996 - 12/31/1995; 5.00% Global Real Estate – DFGEX, DFA Global Real Estate Securities I, 07/01/2008 - Current, S&P Devlp REIT TR USD reduced by fund operating expenses of 0.24%, 01/01/1996 - 06/30/2008. Balanced Corporate Bond Allocation — BB.TDv3 (as of December 31, 2015): 45.00% US Short-term Bonds – VFSUX, Vanguard Short-Term Investment-Grade Adm, 10/01/1995 - Current; 20.00% US Medium-term Bonds – BAGIX, Baird Aggregate Bond Inst, 10/01/2000 - Current, Barclays US Credit TR USD reduced by fund operating expenses of 0.30%, 10/01/1995 - 09/30/2000; 30.00% Senior Secured Bank Loans – OOSIX, Oppenheimer Senior Floating Rate I, 10/01/1999 - Current, Barclays US High Yield Loans TR USD reduced by fund operating expenses of 0.64%, 01/01/2006 - 09/30/1999, Barclays US Corporate High Yield TR USD reduced by fund operating expenses of 0.64%, 10/01/1995 - 12/31/2005; 5.00% Emerging Markets Debt – PYEMX, Payden Emerging Markets Bond, 01/01/1999 - Current, JPM EMBI Global TR USD reduced by fund operating expenses of 0.78%, 10/01/1995 - 12/31/1998. Sources: Bloomberg, Fama/French, MSCI, Standard & Poor’s, Dimensional Fund Advisors, Morningstar. As always, past performance is not indicative of future returns. All information is subject to change without notice. 800.898.4642 | merceradvisors.com .
.