


Description
A WINDOW OF OPPORTUNITY
FOR EUROPE
JUNE 2015
DETAILED ANALYSIS
. In the 25 years since its founding, the McKinsey Global Institute (MGI) has
sought to develop a deeper understanding of the evolving global economy.
As the business and economics research arm of McKinsey & Company, MGI
aims to provide leaders in the commercial, public, and social sectors with the
facts and insights on which to base management and policy decisions.
MGI research combines the disciplines of economics and management,
employing the analytical tools of economics with the insights of business
leaders. Our “micro-to-macro” methodology examines microeconomic
industry trends to better understand the broad macroeconomic forces
affecting business strategy and public policy. MGI’s in-depth reports have
covered more than 20 countries and 30 industries. Current research focuses
on six themes: productivity and growth, natural resources, labour markets,
the evolution of global financial markets, the economic impact of technology
and innovation, and urbanisation.
Recent reports have assessed global flows; the economies of Brazil, Mexico, Nigeria, and Japan; China’s digital transformation; India’s path from poverty to empowerment; affordable housing; the economics of tackling obesity; and prospects for global GDP growth over the next 50 years. MGI is led by three McKinsey & Company directors: Richard Dobbs, James Manyika, and Jonathan Woetzel. Michael Chui, Susan Lund, and Jaana Remes serve as MGI partners. Project teams are led by the MGI partners and a group of senior fellows, and include consultants from McKinsey & Company’s offices around the world.
These teams draw on McKinsey & Company’s global network of partners and industry and management experts. In addition, leading economists, including Nobel laureates, act as research advisers. The partners of McKinsey & Company fund MGI’s research; it is not commissioned by any business, government, or other institution. For further information about MGI and to download reports, please visit www.mckinsey.com/mgi. McKinsey in Europe McKinsey & Company is a global management consulting firm, deeply committed to helping institutions achieve lasting success. McKinsey opened its first offices in Europe in 1959 as the region’s economy began to recover from World War II.
The Firm played an active role in that economic rebirth, working with leading business organisations, as well as governments, nonprofits, and cultural institutions. With offices in 37 cities across Europe, today we serve clients across a wide range of industries and business areas, as well as in the social and public sectors. Copyright © McKinsey & Company 2015 . A WINDOW OF OPPORTUNITY FOR EUROPE JUNE 2015 Eric Labaye | Paris Sven Smit | Amsterdam Eckart Windhagen | Frankfurt Richard Dobbs | London Jan Mischke | Zurich Matt Stone | London . PREFACE Seven years on from the global recession, the European economic recovery remains sluggish, and talk persists of countries exiting the Eurozone. Yet Europe has fundamental strengths on which to build. The question is how to use those strengths as a platform for a return to robust growth. In this report, the McKinsey Global Institute (MGI), which has studied productivity and growth in 30 industries in more than 20 countries over the past 25 years, has examined European growth from three angles. First, the research looked at the supply side and productivity of the European economy, discussing 11 competitiveness growth drivers that together would constitute a sweeping programme of structural reform.
Second, MGI has drawn on previous analysis on debt and deleveraging to examine the current shortage of aggregate demand in Europe and to highlight various options for stimulating investment and job creation. Third, MGI conducted a survey and conjoint analysis of 16,000 Europeans in eight countries during August 2014 to ascertain their aspirations and priorities. This research was led by Eric Labaye, a director of McKinsey and chairman of MGI based in Paris; Sven Smit, a McKinsey director based in Amsterdam; Eckart Windhagen, a McKinsey director based in Frankfurt; Richard Dobbs, a director of McKinsey and MGI based in London; and Jan Mischke, an MGI senior fellow based in Zurich. Matt Stone led the project team.
The team comprised Paraic Behan, Josef Ekman, Asher Ellerman, Sebastian Farquhar, Alec Guzov, Jakob Hensing, Anna Orthofer, Juliane Parys, Björn Saß, Anne-Marie Schoonbeek, Nigel Smith, Charlotte van Dixhoorn, and Ollie Wilson. We would like to acknowledge the helpful support and input of MGI colleagues Jonathan Ablett, Timothy Beacom, Ivo Eman, Lucia Fiorito, Jan Grabowiecki, Karen Jones, Priyanka Kamra, Krzysztof Kwiatkowski, Arshiya Nagi, Aditi Ramdorai, Vivien Singer, and Amber Yang. We are grateful to the academic advisers who helped shape this research and provided challenge and insights and guidance: Martin N. Baily, Bernard L. Schwartz Chair in Economic Policy Development and senior fellow and director of the Business and Public Policy Initiative at the Brookings Institution; Richard N. Cooper, Maurits C.
Boas Professor of International Economics at Harvard University; Howard Davies, chairman of Phoenix Group; Hans-Helmut Kotz, visiting professor of economics at Harvard University and senior fellow at the Center for Financial Studies; and Lord Adair Turner, senior fellow at the Institute for New Economic Thinking. In addition to MGI’s advisers, we benefitted hugely from insights and feedback provided by Bruno Bezard, general director, French Treasury; Laurence Boone, special advisor for International, European Economic and Financial affairs, French Presidency; Michael Bosnjak of the GESIS – Leibniz Institute for the Social Sciences, associate professor at the Free University of Bozen-Bolzano; Horace “Woody” Brock, president of Strategic Economic Decisions; Marco Buti, director-general for economic and financial affairs at the European Commission; Raffaele della Croce, lead manager, Long-Term Investment Project, at the OECD; Ian Davis, chairman of Rolls-Royce Group PLC; Klaus Günter Deutsch, head of the department of research, industrial and economic policy, Bundesverband Deutscher Industrie e.V.; José Manuel González-Páramo, member of the Board of Directors, BBVA; Yoram Gutgeld, member of the chamber of deputies and economic advisor to the prime minister, Italy; Thomas Heilmann, Senator for Justice and Consumer Protection, Berlin; Kalin Anev Janse, secretary general of the European Stability Mechanism; Ton Kuijlen, emeritus professor of methodology at Tilburg University; Pascal Lamy, president emeritus of the Jacques Delors Institute and former director general of the World Trade . Organisation; Jean Hervé Lorenzi, founder and chairman of the Cercle des économistes; Catherine L. Mann, OECD chief economist and head of the economics department; Giles Merritt, founder and secretary-general of Friends of Europe; Rudolf Minsch, chief economist of Economiesuisse; Peter Mooslechner, executive director, Oesterreichische Nationalbank; Ewald Nowotny, governor, Oesterreichische Nationalbank; Jean PisanyFerry, commissioner general for Policy Planning, Office of the French Prime Minister; Baudouin Regout, policy officer, secretariat general, European Commission; André Sapir, senior fellow at Bruegel; Gerhard Schwarz, director of Avenir Suisse; Jean Tirole, chairman of the Toulouse School of Economics and a Nobel laureate in economics; Claire Waysand, chief of staff for the Minister of Finance and Budget, France; Axel Weber, chairman, UBS; and Thomas Wieser, chair of the Eurogroup Working Group of the European Council. We also had the great honour of testing and refining our thinking in further confidential discussions with many policy makers and officials affiliated with governments and central banks throughout Europe and with European institutions. We thank them all deeply for their time. We would like to thank many McKinsey colleagues for their input and industry expertise, including Konrad Bauer, Cornelius Baur, Alejandro Beltran de Miguel, Kalle Bengtsson, Kirsten Best-Werbunat, Beril Beten, Marco Bianchini, Daniel Boniecki, Bogdan Buleandra, Christian Casal, Adam Chrzanowski, Miklos Dietz, Catarina Eklöf-Sohlström, Nicklas Garemo, Anna Granskog, Philipp Härle, Antony Hawkins, Matthias Heuser, Vivian Hunt, Alain Imbert, Andrew Jordan, Stijn Kooij, Peter Lambert, Sebastien Leger, Frank Mattern, Jean-Christophe Mieszala, Jorge Omeñaca, Jakob Österberg, Occo Roelofsen, Matt Rogers, Jimmy Sarakatsannis, Luuk Speksnijder, Leonardo Totaro, Thomas Vahlenkamp, Cornelius Walter, Peter de Wit, and Louise Young. MGI’s operations team provided crucial support for this research. We would like to thank MGI senior editor Janet Bush; Matt Cooke, Rebeca Robboy, Vanessa Gotthainer, Rachel Grant, Damaris O’Hanlon, and Vanessa Ratcliffe in external communications and media relations; Julie Philpot, editorial production manager; Marisa Carder, graphics specialist; and Deadra Henderson, manager of personnel and administration. We are grateful for all of the input we have received, but the final report is ours and any errors are our own. This report contributes to MGI’s mission to help business and policy leaders understand the forces transforming the global economy, identify strategic locations, and prepare for the next wave of long-term growth.
As with all MGI research, this work is independent and has not been commissioned or sponsored in any way by any business, government, or other institution, although it has benefitted from the input and collaborations that we have mentioned. We welcome your emailed comments on the research at MGI@mckinsey.com. Richard Dobbs Director, McKinsey Global Institute London James Manyika Director, McKinsey Global Institute San Francisco Jonathan Woetzel Director, McKinsey Global Institute Shanghai June 2015 . Chapter photo Contents: Construction sky © Getty Images . CONTENTS HIGHLIGHTS In brief 1 1. Europe has a platform for ambitious renewal Page 1 Europe’s recent performance has been lacklustre Page 6 But Europe has a foundation of strength and a window of opportunity for renewal Page 10 Europeans in eight countries say they would make tough trade-offs to achieve their high aspirations Page 18 Platform for renewal 29 There is reason to believe that Europe can grow faster with competitiveness reform and investment and job creation in tandem Page 25 2. Reform—much of it national—can deliver growth Page 29 1. Nurturing ecosystem for innovation Page 38 2.
Effective education to employment Page 51 Boosting competition 143 3. Productive infrastructure investment Page 59 4. Reduced energy burden Page 68 5.
Supporting urban development Page 79 6. Competitive and integrated markets in services and digital Page 89 Stimulating demand 7. Public-sector productivity Page 101 8.
Further openness to trade Page 109 9. Grey and female labour-force participation Page 117 10. Pro-growth immigration Page 125 11.
Enhanced labour-market flexibility Page 132 3. How Europe can reignite investment and job creation Page 143 Successful reform requires productive investment and demand for jobs—and vice versa Page 144 A gap in aggregate demand persists in all domestic sectors of the economy, leaving Europe to rely on net exports Page 145 Europe has several options for igniting investment and job creation Page 161 4. Europe can overcome barriers to action Page 193 Three-quarters of competitiveness growth drivers can happen nationally with European action to boost investment and job creation Page 195 There are ways to unlock European action on investment and job creation despite governance, moral hazard, and distributional issues Page 198 Europeans are willing to play their part in their region’s economic renaissance Page 199 Appendix Page 203 Bibliography Page 229 .
IN BRIEF A WINDOW OF OPPORTUNITY FOR EUROPE Europe’s growth since the start of the financial crisis has been sluggish, and the continent faces some difficult long-term challenges on demographics and debt levels. But new MGI research finds that, thanks to a convergence of low oil prices, a favourable exchange rate, and quantitative easing (QE), Europe has a window of opportunity to undertake ambitious reforms, stimulate job creation and investment, and unlock new economic dynamism.1 ƒƒ It may be tempting for some observers to write off Europe. That would be a mistake. The continent has a foundation of strength on which to take action.
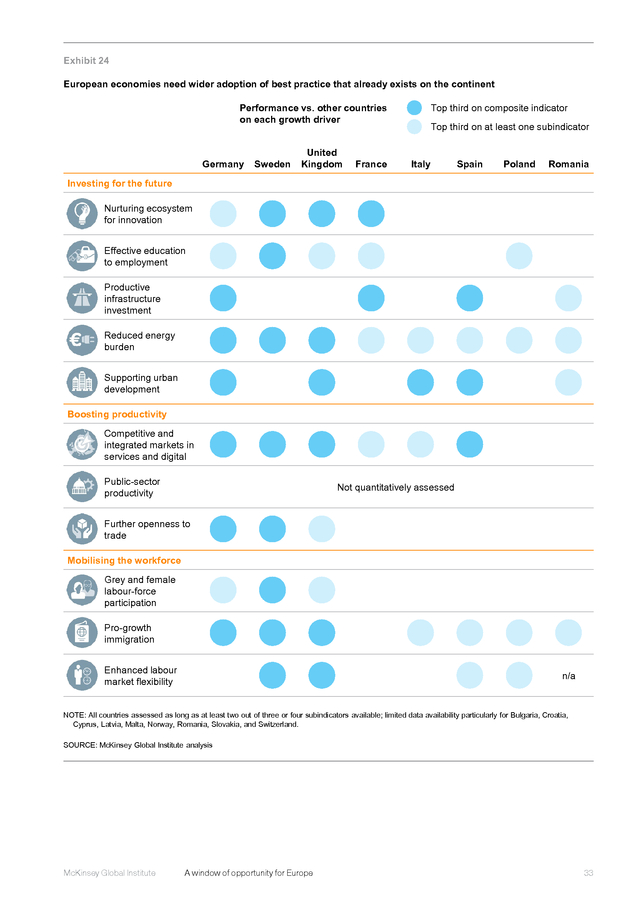
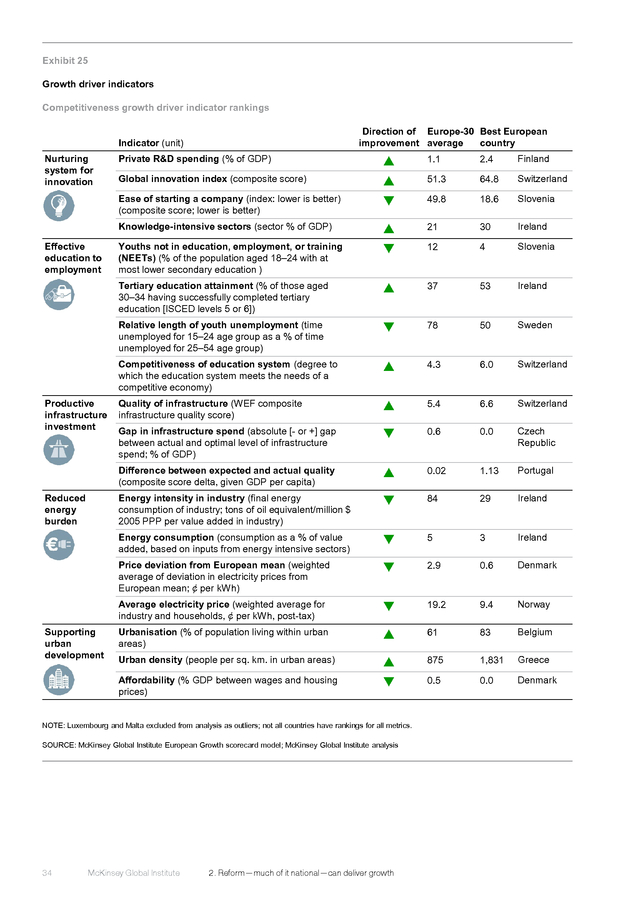
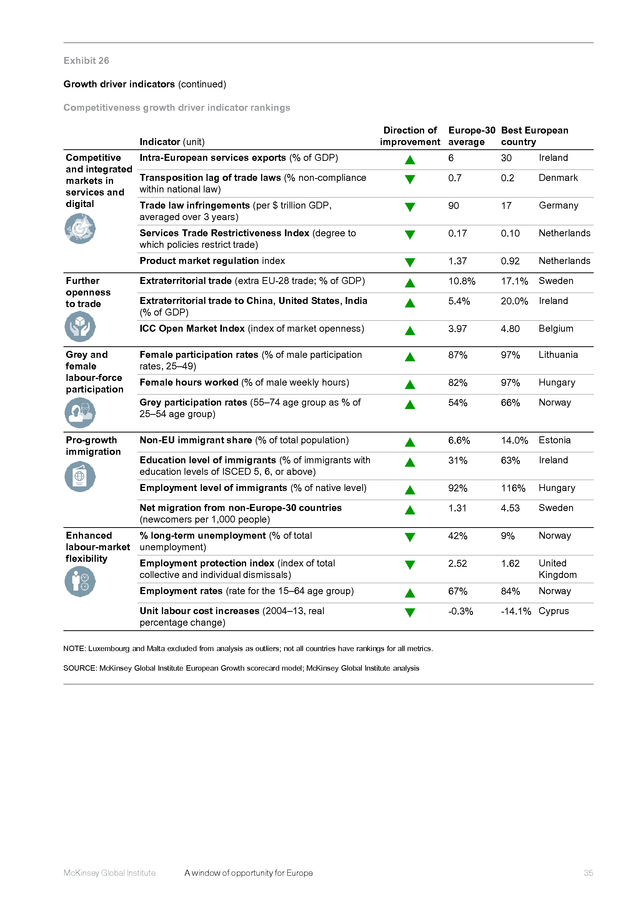
It remains a world leader on key indicators of social and economic progress. And respondents polled in an MGI survey and conjoint analysis of 16,000 Europeans in eight countries had high aspirations and expressed willingness to make tough trade-offs to achieve them. ƒƒ Three areas of reform with 11 growth drivers—many of which policy makers already implement in some form—can help deliver on European aspirations. They entail investing for the future (for example, nurturing innovation and reducing the energy burden), boosting productivity (for example, competitive and integrated markets in services and digital and more openness to trade), and mobilising the workforce (for example, increasing grey and female labour-force participation and enhancing labourmarket flexibility). ƒƒ Three-quarters of the impact of growth drivers can be obtained at the national level.
Best practice on every key dimension of the economy can be found somewhere in Europe. The challenge is to emulate that best practice and adopt it more widely. ƒƒ Scope for structural reform is limited while investment and job creation are weak. Corporations are piling up cash despite low interest rates, households have cut investment since the bubble, and governments have adopted austerity policies. While every sector is acting rationally, collectively they are causing weak demand that means output is still 15 percent below pre-crisis trends. ƒƒ Europe has several options for reigniting investment and job creation despite its complex institutional setup. Measures to unlock financing and quantitative easing can help but are insufficient on their own.
Fiscal stimulus is not easy to implement at scale in Europe. New ideas need to be explored, including accounting for public investment as assets depreciate rather than during capital formation, and carefully adjusting taxation and wage structures. ƒƒ By scaling up and speeding up reform mostly at the national level and stimulating investment and job creation at the European level in lockstep, Europe could close its output gap, return to a sustained growth rate of 2 to 3 percent over the next ten years, unleash investment of €250 billion to €550 billion a year, and create more than 20 million new jobs. This requires trust and the right governance structures that avoid moral hazard, bundle tight package deals, or lift investment programmes to the European level. We define Europe in this report as the EU-28 plus Norway and Switzerland. 1 . A window of opportunity for Europe €2.2 trillion a year needed to meet European aspirations by 2025 Europeans seen willing to make trade-offs— e.g., more working hours and/or less social protection—for higher incomes and better education, health care, security, and living environment Pro-growth immigration Grey and female labour-force participation M o B an oo d 11 growth drivers In ve Nurturing ecosystem for innovation he ng t lisi bi rkforce wo kets mar ing tivity st oduc pr Enhanced labour-market flexibilty Public-sector productivity Competitive and integrated markets in services and digital Further openness to trade s ti g n Effective education to employment fo r t h e f u t u re Productive infrastructure investment Act within current governance structure where possible (e.g., QE) Test potential for a post-Maastricht governance system to enable bolder action Look at new solutions like balance sheet accounting and unleashing household spend Supporting urban development Increasing competitiveness Implementing European best practice in three key areas can deliver growth aspirations 75% can be achieved by national governments Reduced energy burden Reigniting investment and job creation Action needed to kick-start growth 15% BELOW Europe’s output is well below its pre-crisis trend Growth potential If Europe undertakes reform on the supply side AND boosts investment and job creation—moving beyond crisis management and establishing the vision, trust, and governance to act at speed and scale—2–3% sustained GDP growth is possible 2–3 growth % . Chapter photo Chapter 1: Family on steps © Getty Images Alamy . 1. EUROPE HAS A PLATFORM FOR AMBITIOUS RENEWAL A number of forces have converged over the past year to provide Europe with a window of opportunity to accelerate reform and stimulate job creation and investment that has arguably not been available since the global financial crisis began in 2008. The sudden and largely unexpected drop in oil prices, a favourable euro exchange rate, the ECB’s announcement of a QE programme, and an improving business climate all suggest that 2015 is likely to be a strong year for GDP growth (Exhibit 1). This offers a promising backdrop for an ambitious programme of renewal. Exhibit 1 Strong 2015 growth projections create a window of opportunity for Europe to commit to reform, investment, and job creation for the longer term Estimated drivers of 2015 GDP growth for Europe-30 % 1.7–1.8 0.3 0.3 ~0.9 Baseline growth 0.2 Fiscal impact of QE Depreciation of euro Decreased oil prices Projected growth, 2015 NOTE: Baseline growth rate obtained when removing buoying factors: implies weak demand/slow reform In line with 2009– 13 average of ~0.9%.
Quantitative easing (QE): assumes primary economic benefit comes from increased accrued remittances via the European Central Bank, estimated up to a maximum impact of 0.2 percent of GDP. Depreciation: based on European Commission projections in early 2015; likely to interact with QE. Oil: calculated from shift in net exports after multiplier impact.
Projected growth: based on early 2015 European Commission projections. SOURCE: IMF; European Commission; McKinsey Global Institute analysis Europe's GDP shrank by 0.1% 2007–13 It is important that Europe not interpret these improving conditions as evidence that no further action is needed to improve the competitiveness of the economy and boost investment and job creation. Its leaders need to seize the moment because this precious window may soon close. Many of these trends are temporary or could reverse.
Although recent trends have led to a cautious return to a degree of optimism about Europe’s economic prospects, the fact remains that the continent’s recovery thus far has been sluggish, and considerable challenges clearly lie ahead. Europe has clearly underperformed on its long-term growth potential since the global financial crisis, with GDP shrinking marginally by 0.1 percent between 2007 and 2013. Per capita GDP in purchasing power parity terms has only just returned to its pre-crisis peak for the continent as a whole. .
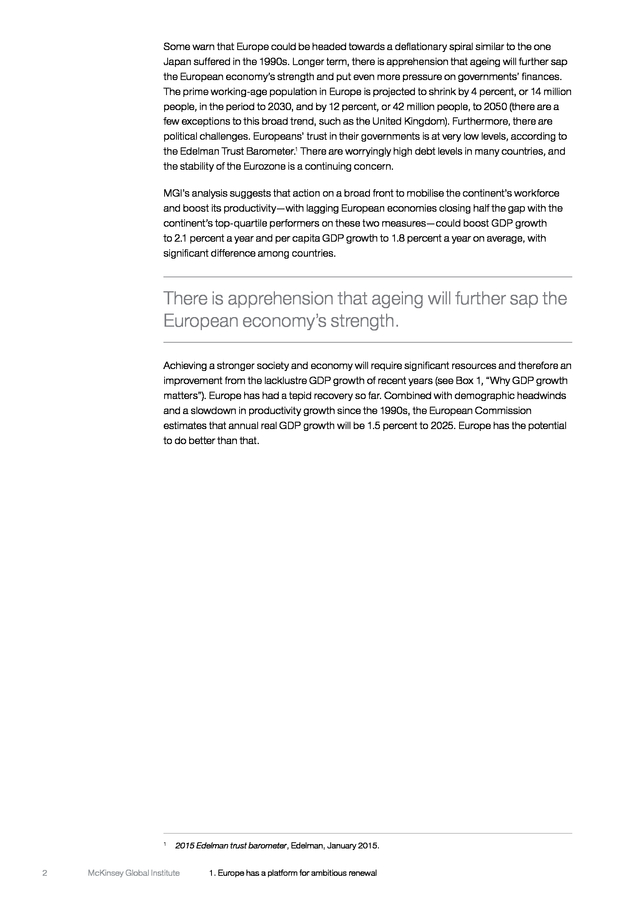
Some warn that Europe could be headed towards a deflationary spiral similar to the one Japan suffered in the 1990s. Longer term, there is apprehension that ageing will further sap the European economy’s strength and put even more pressure on governments’ finances. The prime working-age population in Europe is projected to shrink by 4 percent, or 14 million people, in the period to 2030, and by 12 percent, or 42 million people, to 2050 (there are a few exceptions to this broad trend, such as the United Kingdom). Furthermore, there are political challenges. Europeans’ trust in their governments is at very low levels, according to the Edelman Trust Barometer.1 There are worryingly high debt levels in many countries, and the stability of the Eurozone is a continuing concern. MGI’s analysis suggests that action on a broad front to mobilise the continent’s workforce and boost its productivity—with lagging European economies closing half the gap with the continent’s top-quartile performers on these two measures—could boost GDP growth to 2.1 percent a year and per capita GDP growth to 1.8 percent a year on average, with significant difference among countries. There is apprehension that ageing will further sap the European economy’s strength. Achieving a stronger society and economy will require significant resources and therefore an improvement from the lacklustre GDP growth of recent years (see Box 1, “Why GDP growth matters”).
Europe has had a tepid recovery so far. Combined with demographic headwinds and a slowdown in productivity growth since the 1990s, the European Commission estimates that annual real GDP growth will be 1.5 percent to 2025. Europe has the potential to do better than that. 1 2 2015 Edelman trust barometer, Edelman, January 2015. McKinsey Global Institute 1.
Europe has a platform for ambitious renewal . Box 1. Why GDP growth matters The debate on growth today is contentious and wide-ranging, from whether GDP is the right measure to use, to how growth can be sustainable and inclusive. We agree that GDP has serious shortcomings as a measure of growth, and we support the search for alternative measures of economic and social progress. We also acknowledge legitimate questions about how to make growth sustainable and inclusive.
However, such discussions should not distract attention from the strong empirical relationship between GDP growth and key societal goals. Growth is closely linked to employment and therefore has a direct impact on the economic livelihood of citizens. It also generates resources that can be invested to improve societal outcomes and deliver on the broader aspirations voiced in the MGI survey and conjoint analysis.
It helps societies address critical challenges such as managing public debt or, indeed, combatting environmental degradation. In fact, the link between real per capita growth and unemployment is almost mechanical. Unless growth is entirely driven by increasing labour productivity, it necessarily involves more hours worked and therefore leads to demand for more workers. For example, an analysis of European unemployment data since the 1980s shows that periods of strong growth in real per capita GDP have almost uniformly been ones when there have also been considerable reductions in unemployment. Unemployment across Europe fell continuously in the late 1980s when the rate of real per capita GDP growth consistently exceeded 2 percent per year.
As soon as real per capita GDP growth fell below this rate in the early 1990s, unemployment surged. Similar patterns occurred in subsequent years, Unemployment fell sharply in the late 1990s and mid-2000s, periods during which real per capita GDP was growing strongly. A common charge against GDP growth as a primary aim for economic policy is that it involves damaging environmental externalities. This is a multifaceted and complex issue.
An analysis of the evolution of energy consumption in advanced economies since 1970 appears to offer support for the “environmental Kuznets curve” hypothesis, which suggests that there is an inverse U-shaped relationship between economic development and environmental degradation.1 This hypothesis posits that the impact of growth on the environment decreases as economies develop and shift away from manufacturing towards services. Historically, growth in real per capita GDP in high-income economies increasingly uncouples from energy consumption. European countries including Germany, France, and the United Kingdom have reduced energy consumption while increasing real output per head (Exhibit 2).
Most European countries have reduced per capita carbon emissions since the early 2000s even while their economies were growing at a significant rate. 1 McKinsey Global Institute See, for example, Theodore Panayotou, Economic growth and the environment, presented at the spring seminar of the United Nations Economic Commission for Europe in Geneva, March 3, 2003. One criticism of the environmental Kuznets curve, which is, however, not contradictory to the argument outlined here, is that the inverse U-shaped relationship may not hold any longer because countries at earlier stages of development are increasingly able to mitigate the environmental impact of growth through technology. See David I.
Stern, “The rise and fall of the environmental Kuznets curve”, World Development, volume 32, issue 8, August 2004. A window of opportunity for Europe 3 . Box 1. Why GDP growth matters (continued) Exhibit 2 Beyond a level of around $30,000, per capita GDP is largely decoupled from energy consumption Per capita energy consumption, 1970–2008 Million British thermal units (BTU) per person 250 United States 200 Australia 150 Germany France 100 Historical range for energy consumption evolution United Kingdom 50 China Japan South Korea India 0 0 5,000 10,000 15,000 20,000 25,000 30,000 35,000 40,000 45,000 Per capita GDP Real 2005 $ per person at purchasing power parity SOURCE: International Energy Agency; IHS; McKinsey Global Institute analysis 4 McKinsey Global Institute 1. Europe has a platform for ambitious renewal . In the immediate aftermath of the global financial crisis in 2008 and 2009, Europe lost 6 percent of real per capita GDP in purchasing power parity terms. Real per capita GDP did not return to its pre-crisis peak until the beginning of 2015 (Exhibit 3). The path to recovery has also been uneven. It is evident that Southern European countries such as Greece and Spain will require several more years to reach their pre-crisis peaks in real per capita GDP. Surging unemployment levels have been a particularly difficult challenge in Europe.
More than five million jobs were lost across the continent between 2008 and 2013, especially in manufacturing, construction, and other industrial sectors. Exhibit 3 Europe lost 6 percent of output per head during the crisis and has only just recovered Purchasing power parity–adjusted per capita GDP1 Index: 1.00 = 1Q08 1.06 United States 1.04 1.02 1.00 Europe-302 0.98 -6% 0.96 0.94 0.92 0.90 2005 06 07 08 09 10 11 12 13 14 Expected return to pre-crisis peak Gap to pre-crisis peak, 4Q143 % Europe-30 Southern Europe 2015 ~0 ~2019 -10.4 Nordics ~2015 -1.5 United Kingdom and Ireland 2015 ~0 2014 2.2 Baltics 2011 2.9 Continental Europe Central and Eastern Europe 7.3 3.6 United States 2011 2013 1 Quarterly GDP data from Eurostat converted to 2005 purchasing power parity (PPP) in dollars using 2005 PPP from the IMF; European countries’ per capita GDP weighted with respective year population. 2 EU-28 countries plus Switzerland and Norway. 3 2014Q4 or Q3 compared with the corresponding quarter with the highest value before the financial crisis SOURCE: Eurostat; IMF; United Nations Population Division; McKinsey Global Institute analysis McKinsey Global Institute A window of opportunity for Europe 5 . Europe’s recent performance has been lacklustre Given current primary fiscal balances, interest rates, and projected real GDP growth, the ratio of government debt to GDP will continue to grow from already high levels in many European countries, including Belgium, Finland, France, Italy, the Netherlands, Portugal, Spain, and the United Kingdom. This is a source of concern since high debt levels have historically been a drag on growth and increased the risk of financial crises that can spark another set of deep economic recessions.2 However, similarly to Japan, most major European economies will require significant fiscal adjustment before public-sector deleveraging can begin (Exhibit 4). Exhibit 4 European economies require significant fiscal adjustment to start public-sector deleveraging Primary balance—current and required1 % Primary balance, 2014 Country Spain Primary balance to start deleveraging -2.3 Japan Fiscal adjustment required ï‚¢ – Percentage points 4.9 2.6 -5.4 4.1 -1.3 Portugal 0.1 France 3.7 -2.3 2.5 0.2 Italy 1.7 United Kingdom -2.7 Finland Netherlands Belgium 1.3 Ireland 1.1 0.1 0.1 -1.0 0.8 0.7 -0.8 0.2 0.4 -0.2 Greece n/a 1.4 Germany 1.9 1.9 -0.3 -1.0 United States 3.6 -0.8 -1.6 3.6 0.0 2.7 2.1 n/a n/a 1 Based on consensus GDP forecast, current inflation, 2Q14 government level of debt to GDP, and estimated 2014 effective interest rate. SOURCE: McKinsey Country Debt database; IMF; IHS; EIU; Oxford Economics; OECD; McKinsey Global Growth Model; McKinsey Global Institute analysis 2 6 Debt and (not much) deleveraging, McKinsey Global Institute, February 2015. McKinsey Global Institute 1. Europe has a platform for ambitious renewal . Other major trends appear worrying for Europe’s future, too. Youth unemployment remains stubbornly high, hovering just under the 20 percent mark across the EU. Unless this problem is tackled, there is a risk of rising popular unrest. Meanwhile, the risk of populist parties gaining power and calling for the dissolution of the EU has grown.
Such political groupings gained significant shares of the vote in the 2014 EU elections. The stability of the euro and the future of the Eurozone remain subject to concern and conjecture. Greek deposit outflows reached €500 million a day at some points during early 2015.
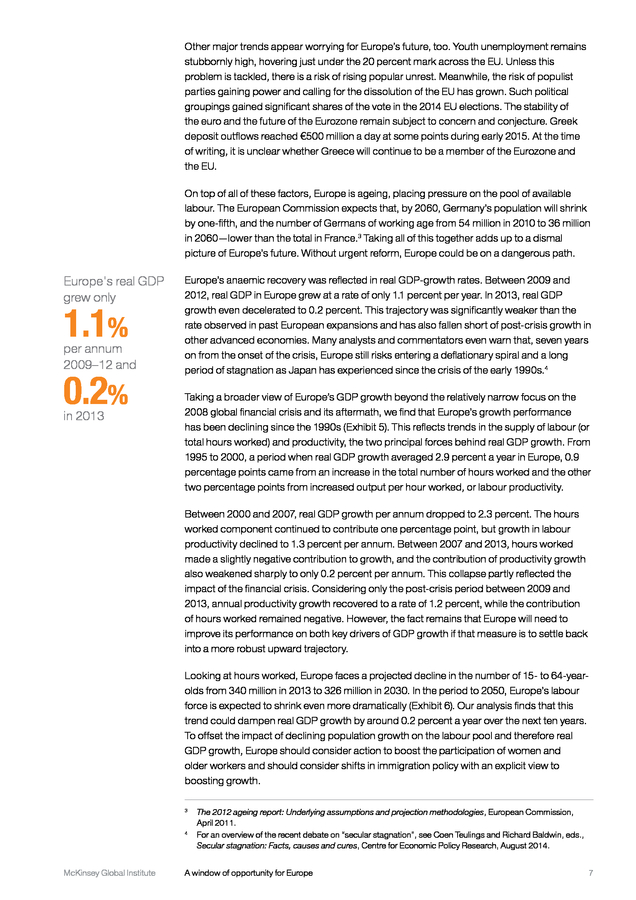
At the time of writing, it is unclear whether Greece will continue to be a member of the Eurozone and the EU. On top of all of these factors, Europe is ageing, placing pressure on the pool of available labour. The European Commission expects that, by 2060, Germany’s population will shrink by one-fifth, and the number of Germans of working age from 54 million in 2010 to 36 million in 2060—lower than the total in France.3 Taking all of this together adds up to a dismal picture of Europe’s future. Without urgent reform, Europe could be on a dangerous path. Europe's real GDP grew only 1.1% per annum 2009–12 and 0.2% in 2013 Europe’s anaemic recovery was reflected in real GDP-growth rates.
Between 2009 and 2012, real GDP in Europe grew at a rate of only 1.1 percent per year. In 2013, real GDP growth even decelerated to 0.2 percent. This trajectory was significantly weaker than the rate observed in past European expansions and has also fallen short of post-crisis growth in other advanced economies.
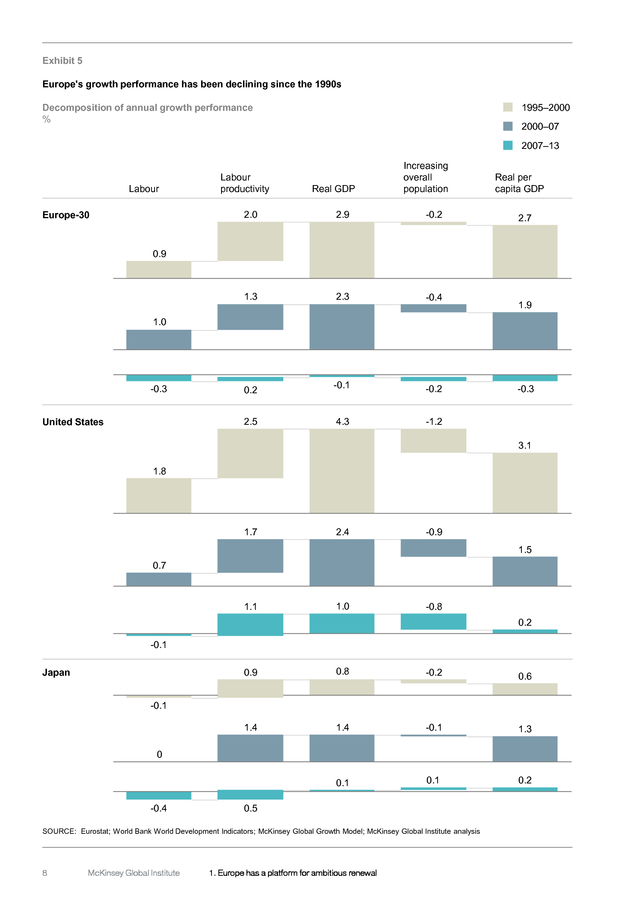
Many analysts and commentators even warn that, seven years on from the onset of the crisis, Europe still risks entering a deflationary spiral and a long period of stagnation as Japan has experienced since the crisis of the early 1990s.4 Taking a broader view of Europe’s GDP growth beyond the relatively narrow focus on the 2008 global financial crisis and its aftermath, we find that Europe’s growth performance has been declining since the 1990s (Exhibit 5). This reflects trends in the supply of labour (or total hours worked) and productivity, the two principal forces behind real GDP growth. From 1995 to 2000, a period when real GDP growth averaged 2.9 percent a year in Europe, 0.9 percentage points came from an increase in the total number of hours worked and the other two percentage points from increased output per hour worked, or labour productivity. Between 2000 and 2007, real GDP growth per annum dropped to 2.3 percent.
The hours worked component continued to contribute one percentage point, but growth in labour productivity declined to 1.3 percent per annum. Between 2007 and 2013, hours worked made a slightly negative contribution to growth, and the contribution of productivity growth also weakened sharply to only 0.2 percent per annum. This collapse partly reflected the impact of the financial crisis.
Considering only the post-crisis period between 2009 and 2013, annual productivity growth recovered to a rate of 1.2 percent, while the contribution of hours worked remained negative. However, the fact remains that Europe will need to improve its performance on both key drivers of GDP growth if that measure is to settle back into a more robust upward trajectory. Looking at hours worked, Europe faces a projected decline in the number of 15- to 64-yearolds from 340 million in 2013 to 326 million in 2030. In the period to 2050, Europe’s labour force is expected to shrink even more dramatically (Exhibit 6).
Our analysis finds that this trend could dampen real GDP growth by around 0.2 percent a year over the next ten years. To offset the impact of declining population growth on the labour pool and therefore real GDP growth, Europe should consider action to boost the participation of women and older workers and should consider shifts in immigration policy with an explicit view to boosting growth. The 2012 ageing report: Underlying assumptions and projection methodologies, European Commission, April 2011. 4 For an overview of the recent debate on “secular stagnation”, see Coen Teulings and Richard Baldwin, eds., Secular stagnation: Facts, causes and cures, Centre for Economic Policy Research, August 2014. 3 McKinsey Global Institute A window of opportunity for Europe 7 . Exhibit 5 Europe's growth performance has been declining since the 1990s Decomposition of annual growth performance % 1995–2000 2000–07 2007–13 Labour Labour productivity Real GDP Increasing overall population 2.0 2.9 -0.2 1.3 Europe-30 2.3 -0.4 -0.1 -0.2 4.3 Real per capita GDP -1.2 2.7 0.9 1.9 1.0 -0.3 0.2 2.5 United States -0.3 3.1 1.8 1.7 2.4 -0.9 1.5 0.7 1.1 1.0 -0.8 0.2 -0.1 0.9 0.8 -0.2 0.6 1.4 1.4 -0.1 1.3 0.1 Japan 0.1 0.2 -0.1 0 -0.4 0.5 SOURCE: Eurostat; World Bank World Development Indicators; McKinsey Global Growth Model; McKinsey Global Institute analysis 8 McKinsey Global Institute 1. Europe has a platform for ambitious renewal . Exhibit 6 Europe’s prime working-age population is in a steep long-term decline, dropping by a projected 42 million between 2013 and 2050 Europe-30 prime working-age population (15- to 64-year-olds), 1990, 2013, 2030, and 20501 Million Baltics Nordics United Kingdom and Ireland 326 15 340 5 17 40 4 44 326 17 4 45 298 18 Compound annual growth rate, 2013–50 % 3 -0.7 0.2 68 67 46 0.2 50 Central and Eastern Europe -0.8 69 -0.6 -0.3 61 Southern Europe 79 85 Continental Europe 120 123 117 111 1990 2013 2030 2050 81 1 Includes immigration. NOTE: Numbers may not sum due to rounding. SOURCE: United Nations Population Division; McKinsey Global Institute analysis Given the end of demographic tailwinds in Europe, the onus will be on productivity to drive growth. Even the recovery in productivity growth to 1.2 percent per annum between 2009 and 2013 leaves the rate of productivity growth relatively weak, suggesting room for improvement. Our analysis of long-term labour productivity growth in leading economies since 1800 finds a long-term average rate of productivity growth of 1.4 percent per annum (with large variations around that average) (Exhibit 7). Historically, every period of weakening productivity growth has been followed by a rebound to above-trend growth.
This was the case in the years after the Great Depression in the 1930s and the oil crisis in the 1970s, for instance. However, in the recovery from the global financial and economic crisis, this has not been the case. The rate of annual productivity-growth rate since 2009 has remained significantly weaker than in the late 1990s, when it was 2 percent a year on average. Europe is not alone in experiencing weakening productivity growth; a similar trend can be observed in other advanced economies.
For instance, US productivity growth was 2.5 percent a year from 1995 to 2000 but only 1.5 percent between 2009 and 2013. Nevertheless, Europe will have to find ways to reignite productivity growth in order to achieve a more promising economic outlook. McKinsey Global Institute A window of opportunity for Europe 9 . Exhibit 7 Productivity per worker has historically grown at 1.4 percent a year with significant variation around that average Growth of GDP1 per labour force worker,2 ten-year rolling growth3 % Productivity Period average Long-term average Second Industrial Revolution: electrical DC motors, telephone, typewriter, industrial capital formation 3.0 2.5 1.5 Deregulation and globalisation Roaring Twenties: mass production, especially automobiles Railroad, steam engine proliferation 2.0 Mass education, urbanisation Further electrification New economy 1.9 2.0 1.4 1.4 1.2 1.0 0.5 0.3 Great Depression 0.2 0 1800 10 20 30 40 50 Pre-railroad 60 70 80 90 1900 10 Rapid industrialisation 20 30 40 World Wars I and II 50 60 70 Postwar prosperity Bretton Woods 80 Oil crisis 90 00 2009 Great Moderation (deregulation) 1 Highest GDP per worker among group of companies shown; United Kingdom to 1879; United States from 1880. 2 Working-age population is very rough estimate derived from total population and life expectancy. Labour force derived from OECD and International Labour Organisation data from 1960 and assumed 58% before industrialisation (interpolation in between); 55% assumes 95% male participation and 15% female participation. We do not consider unemployment. 3 1939–45 and 1914–24 periods linearly interpolated; highest achieved GDP per worker kept constant during recessions/negative growth. SOURCE: Angus Maddison series; OECD; United Nations; Gapminder; McKinsey Global Institute analysis But Europe has a foundation of strength and a window of opportunity for renewal An ambitious programme of renewal is possible because Europe has fundamental strengths. It is one of the world’s largest economies, home to a huge, highly integrated domestic market of 500 million inhabitants.
It also is well connected to global flows and is home to half of the 20 most competitive economies in the world, according to the World Economic Forum (WEF). European economies remain world leaders on six dimensions of social progress and perform well on indicators of economic health. Indicators of economic health and societal wellbeing correlate strongly (Exhibit 8). While the causation between societal well-being and economic health is likely to run both ways, getting Europe’s economic house in order will be necessary to build a healthier society and meet Europeans’ ambitions. 10 McKinsey Global Institute 1.
Europe has a platform for ambitious renewal . Exhibit 8 Strong economic performance creates the foundation for improved societal outcomes Nordics Continental Europe United Kingdom and Ireland Southern Europe Baltics Central and Eastern Europe Societal well-being Z-score composite index, Europe-30 = 0 0.7 0.6 R-squared = 45% Denmark 0.5 0.4 Malta 0.3 Ireland 0.2 0.1 0 Cyprus Slovenia Sweden Germany Belgium Netherlands Finland Switzerland Luxembourg Austria France Spain Italy -0.1 United Kingdom Czech Republic -0.2 -0.3 Portugal -0.4 -0.5 -0.6 Norway Hungary Greece -0.7 Estonia Croatia Lithuania -0.8 Latvia Slovakia Poland -0.9 -1.0 Bulgaria -1.1 Romania -1.2 -1.3 -1.4 -1.3 -1.2 -1.1 -1.0 -0.9 -0.8 -0.7 -0.6 -0.5 -0.4 -0.3 -0.2 -0.1 0 0.1 0.2 0.3 0.4 0.5 0.6 0.7 0.8 Economic health Z-score composite index, Europe-30 = 0 SOURCE: Eurostat; OECD; UNESCO; UNODC; World Bank, WEF; WHO; CIA; national statistical offices; McKinsey Global Institute analysis To measure economic health, we use a composite index comprising five elements: prosperity, inclusiveness, agility, resilience, and connectedness (see Exhibit 9 for details on the indicators included in this measure). Countries including Germany, Luxembourg, the Netherlands, Sweden, and Switzerland that score highly on economic health have also performed strongly on the six dimensions of societal well-being we have detailed. Conversely, societal well-being indicators are below the European average in many countries whose economic performance has been weaker, including Greece, Portugal, Romania, and Slovakia. McKinsey Global Institute A window of opportunity for Europe 11 . Exhibit 9 Europe’s economic performance is more varied than its social performance, but the continent still boasts best practice Performance on attributes relative to Europe-30 average Composite indicators; ranges of country-level z-scores1 United States Europe-30 Countries with top indicator scores2 Population >1 million European average Norway Prosperity -1.1 Switzerland 1.2 United States Norway Inclusiveness -1.2 Switzerland 1.3 Japan Economic health United States -1.3 Agility 1.9 Japan Sweden Czech Republic -1.4 Resilience 1.0 Sweden Australia Connect-2.4 edness Germany 0.7 United States United Kingdom 1 Measurement of the number of standard deviations away from the mean. The selection of subindicators and metrics, of course, influences country scores; not all countries have rankings for all metrics. 2 Comparison among Europe-30 countries, Australia, Canada, Japan, South Korea, and the United States. SOURCE: Eurostat; OECD; UNESCO; UNODC; World Bank; WEF; WHO; CIA; national statistical offices; McKinsey Global Institute analysis On each of the five elements of economic health, it is only on inclusiveness that Europe, on average, outperforms the United States. Performance across the continent varies widely. For example, per capita GDP at purchasing power parity in Switzerland is more than three times that of Bulgaria. Productivity per hour in Norway is more than 12 times that of Romania.
Debt-to-GDP ratios in Europe’s public and private sectors range from 109 percent in Latvia to almost 450 percent in Ireland. Nevertheless, it is promising that at least one individual European economy represents best practice on each of the five dimensions. Norway and Switzerland are leaders on prosperity and inclusiveness, Sweden on agility, the Czech Republic and Sweden on resilience, and Germany and the United Kingdom on connectedness. If all European countries were to match the performance of the front-runners on each dimension, a much more robust continental economy would be created.
Furthermore, some European economies have made progress in the past few years on crucial structural policies needed to underpin future growth (Exhibit 10). This gives cause for optimism that such efforts can—as they must— continue at an accelerated pace.5 5 12 Economic policy reforms 2015: Going for growth, OECD, 2015. McKinsey Global Institute 1. Europe has a platform for ambitious renewal .
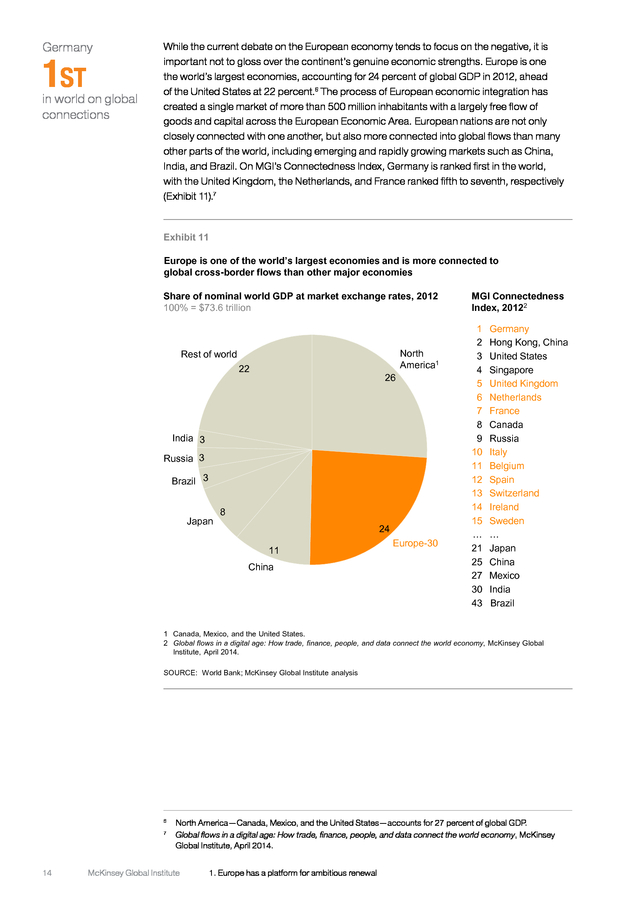
Exhibit 10 Economic progress indicators Economic health indicator rankings Indicator (unit) Prosperity Direction of Europe-30 improvement average Best practice ï° 147,975 379,550 Switzerland ï° 47.1 86.6 Norway ï° -821 2,611 Poland Employment to working-age population (ratio of those employed to overall working-age population) ï° 0.51 0.66 Norway Gini, post-tax, post-pensions (distribution of family income; Gini index – measure of inequality) ï± 0.31 0.23 Norway Ratio of highest to lowest income decile ï± 9.4 5.3 Czech Republic Wage share of GDP (adjusted wage share, % of GDP) ï° 56 69 Switzerland Entrepreneurship index (index of development of entrepreneurship) ï° 57 74 Sweden Patents per million capita (per year) ï° 48 164 Switzerland R&D expenditure (R&D spending, % of GDP) ï° 1.8 3.6 Finland Debt-to-GDP ratio (overall debt as % of GDP; excluding debt from financial corporations) ï± 245 109 Latvia Financial rating (composite financial rating of multiple economic indexes and credit agency scores) ï° 77.8 99.5 Switzerland Performing loans (non-performing loans, % of total bank loans) ï° 92 100 Finland Dependency ratio increase (percentage point change in ratio of the size of the over-65 population to 15- to 64-year-old population, 2014–35) ï± 15 5% Latvia Sectoral concentration (Herfindahl index: methodology to assess sectoral diversification) ï± 0.06 0.05 Czech Republic MGI connectedness index: goods ï± 18 3 Germany MGI connectedness index: services ï± 18 1 Ireland MGI connectedness index: finances ï± 33 7 Germany MGI connectedness index: people ï± 24 5 Germany MGI connectedness index: data Connectedness (global ranking: lower absolute figure is better) 62,858 Per capita GDP growth (change in GDP per capita, 2008–13, constant 2011 $) Resilience 33,747 Productivity per hour (real output [measured in deflated GDP] per hour of labour input, $) Agility ï° Net wealth per capita (net wealth per adult: assets less liabilities, $) Inclusiveness Per capita GDP (constant 2011 $, at purchasing power parity) ï± 11 1 Netherlands Norway NOTE: Luxembourg and Malta excluded from analysis as outliers, not all countries have rankings for all metrics. SOURCE: McKinsey Global Institute European Growth scorecard model; McKinsey Global Institute analysis McKinsey Global Institute A window of opportunity for Europe 13 . Germany 1ST in world on global connections While the current debate on the European economy tends to focus on the negative, it is important not to gloss over the continent’s genuine economic strengths. Europe is one the world’s largest economies, accounting for 24 percent of global GDP in 2012, ahead of the United States at 22 percent.6 The process of European economic integration has created a single market of more than 500 million inhabitants with a largely free flow of goods and capital across the European Economic Area. European nations are not only closely connected with one another, but also more connected into global flows than many other parts of the world, including emerging and rapidly growing markets such as China, India, and Brazil. On MGI’s Connectedness Index, Germany is ranked first in the world, with the United Kingdom, the Netherlands, and France ranked fifth to seventh, respectively (Exhibit 11).7 Exhibit 11 Europe is one of the world’s largest economies and is more connected to global cross-border flows than other major economies Share of nominal world GDP at market exchange rates, 2012 100% = $73.6 trillion Rest of world 22 26 North America1 India 3 Russia 3 Brazil 3 Japan 8 24 11 China Europe-30 MGI Connectedness Index, 20122 1 2 3 4 5 6 7 8 9 10 11 12 13 14 15 … 21 25 27 30 43 Germany Hong Kong, China United States Singapore United Kingdom Netherlands France Canada Russia Italy Belgium Spain Switzerland Ireland Sweden … Japan China Mexico India Brazil 1 Canada, Mexico, and the United States. 2 Global flows in a digital age: How trade, finance, people, and data connect the world economy, McKinsey Global Institute, April 2014. SOURCE: World Bank; McKinsey Global Institute analysis North America—Canada, Mexico, and the United States—accounts for 27 percent of global GDP. Global flows in a digital age: How trade, finance, people, and data connect the world economy, McKinsey Global Institute, April 2014. 6 7 14 McKinsey Global Institute 1.
Europe has a platform for ambitious renewal . According to the WEF, ten of the 20 most competitive economies in the world are located in Europe, with Switzerland topping the global ranking.8 The continent is also home to many world-class companies, including 142 Fortune 500 companies as of 2014, more than the 128 based in the United States. Particular strengths can be found in knowledgeintensive industries.9 Twenty-nine of the world’s most innovative companies in 2014 listed by Forbes magazine are headquartered in Europe.10 Europe retains major trade surpluses in knowledge-intensive manufacturing and services (2.8 percent and 1.4 percent of GDP, respectively, for the EU-15 in 2012). Combined with the right policies and priorities, these achievements can be the bedrock for a more robust future economic performance. There is scope to improve all five dimensions of economic health. The key indicator of whether those improvements are made will be GDP growth.11 Europeans enjoy a high quality of life The quality of life in European societies is very high.
Out of six widely recognised measures of social progress—health care, education, the living environment, public safety, social protection, and work-life balance—Europe scores on average higher than the United States on four (Exhibit 12). The views expressed by the Europeans surveyed on what it takes to have a better life are broadly similar to those of citizens of other advanced economies, according to online responses received on the website of the OECD’s Better Life Index.12 Like people in Australia, Canada, Japan, New Zealand, and the United States, Europeans tend to place emphasis on overall life satisfaction, health, and education. These are dimensions on which many European countries perform strongly. <3% of employees in Denmark, Netherlands, and Norway work >50 hours a week However, there is a great deal of variation within Europe on these social metrics (Exhibit 13). Some countries outperform other nations around the world by a considerable margin; others underperform. For example, Norway ranks in the top three of a peer group of advanced economies on education, public safety, and work-life balance.13 Denmark, the Netherlands, and Norway are the top performers on work-life balance.
In these three countries, people devote 15.6 to 16.1 hours a week to leisure and personal care, and less than 3 percent of all employees work more than 50 hours per week. In our set of countries and chosen set of metrics, Spain is Europe’s leading performer on health care and Germany is Europe’s leader on education. The high degree of variation in performance within Europe on these six quality-of-life indicators and the presence of world-leading examples on each of the six send an important message. Europe may have experienced several years of difficult economic conditions since the global financial crisis in 2007 and global recession in 2008, but it still boasts a high quality of life overall and is home to world leaders on different measures of social progress. Europe can look within its borders for the solution to the future. The global competitiveness report 2014–15, World Economic Forum, September 2914. Knowledge-intensive goods and services are those that have a high R&D component or utilise highly skilled labor. 10 “The world’s most innovative companies”, Forbes, August 2014. 11 We fully acknowledge the many measurement challenges and conceptual shortcomings associated with GDP and welcome the many initiatives under way to refine and broaden the measurement of growth.
For further discussion, see Global growth: Can productivity save the day in an aging world? McKinsey Global Institute, January 2015. 12 Better Life Index, OECD, 2014. 13 Comparisons include the Europe-30 plus Australia, Canada, Japan, South Korea, and the United States. 8 9 McKinsey Global Institute A window of opportunity for Europe 15 . Exhibit 12 Despite recent challenges, Europe remains a world leader on various indicators of social progress Performance on attributes relative to Europe-30 average Composite indicators; ranges of country-level z-scores1 United States Europe-30 Countries with top indicator scores2 Population >1 million European average Spain Health care 1.2 -1.5 Australia Switzerland Germany Education -1.2 0.8 Finland Norway Sweden Living environment -1.7 Finland 1.1 Portugal Societal well-being Norway Public safety -1.4 Austria 1.1 Switzerland Social protection Work-life balance Ireland Germany 1.1 -2.0 Austria Denmark -1.4 1.6 Netherlands Norway 1 Measurement of the number of standard deviations away from the mean. The selection of subindicators and metrics, of course, influences country scores; not all countries have rankings for all metrics. 2 Comparison among Europe-30 countries, Australia, Canada, Japan, South Korea, and the United States. SOURCE: Eurostat; OECD; UNESCO; UNODC; World Bank; WEF; WHO; CIA; national statistical offices; McKinsey Global Institute analysis 16 McKinsey Global Institute 1. Europe has a platform for ambitious renewal . Exhibit 13 Social-progress indicators Societal well-being indicator rankings Indicator (unit) Health Life expectancy at birth (years) Direction of Europe-30 improvement average Best practice ï° 80 83 Italy Healthy life expectancy at birth (healthy life expectancy at birth [years] ÷ life expectancy at birth [years], % of total) ï° 87.9 90.2 Cyprus Infant mortality rate (deaths per 1,000 births) ï± 3.8 1.6 Slovenia Self-reported good health (self-reported responses describing good or very good health, %) ï° 68 82 Switzerland Mortality from ischaemic heart disease (deaths per 1,000 population, age-adjusted) ï± 104 48 France ï° 498 529 Finland Preschool enrolment rate (% of children aged 3–5 enrolled in preschool/kindergarten) ï° 88 100 France Competitiveness of education system (degree to which the education system meets the needs of a competitive economy) ï° 4.30 6.0 Switzerland Matching of skills (indexed measure of over- or undereducation in workforce) ï± 0.97 0.63 Norway Vocational training attainment (25- to 64-year-olds attained upper-secondary and post-secondary non-tertiary education, %) ï° 46 72 Czech Republic Carbon dioxide emissions per GDP unit (kilotonnes of CO2 emissions per € million GDP) ï± 0.36 0.09 Switzerland Particulates per cubic metre (PM10, country level [micrograms per cubic meter]) ï± 27.9 15.8 Finland Housing quality (composite based on dwelling quality, housing expenditure, and rooms per person) ï° 100.4 102.2 Norway UNESCO cultural heritage sites (sites per 100,000 sq km land area) ï° 10.2 32.8 Belgium Non-congestion rate (ratio of average to free-flow speed, scores averaged across three speed limit zones) ï° 0.90 0.93 Czech Republic Homicide rate (intentional homicides per 100,000 people) ï± 1.1 0.6 Austria Rule of law (index score on perceived quality) ï° 3.7 4.5 Norway Political stability (index score on perceived quality) ï° 3.1 3.9 Switzerland ï± 12 3 Estonia ï° 55 91 Austria Social protection expenditure (total public social expenditure as % of GDP) ï° 28 35 Denmark Redistribution (observed delta between pre-tax/pensions Gini and post-tax/pensions Gini coefficients) ï° 0.19 0.27 Ireland Average time worked (hours worked per year per person employed) ï± 1,638 1,380 Netherlands Employees working long hours (% of employees working more than 50 hours per week) ï± 7 1 Netherlands Time devoted to leisure and personal care (hours per week) ï° 15.1 16.1 Denmark Education Average PISA score (maths, science, reading) Living environment Public safety Social Vulnerable employment (% of total employment) protection Unemployment benefits (coverage of contributory and non-contributory schemes, %) Work-life balance NOTE: Luxembourg and Malta excluded from analysis as outliers; not all countries have rankings for all metrics. SOURCE: McKinsey Global Institute European Growth scorecard model; McKinsey Global Institute analysis McKinsey Global Institute A window of opportunity for Europe 17 . Europeans in eight countries say they would make tough trade-offs to achieve their high aspirations While Europe is already a world leader on many dimensions of social progress, and Europeans generally enjoy an enviable quality of life even in comparison with citizens of other high-income countries and regions, they are not content merely to preserve these accomplishments. People in eight countries surveyed by MGI express a desire for an even better deal and are willing to make tough trade-offs to secure one. This is a key theme that emerges from a conjoint survey of 16,000 respondents in eight European countries, conducted by the McKinsey Global Institute in August 2014. The survey asked respondents to reflect on aspirations and priorities for their societies over the next ten years.14 While we acknowledge that what people say in response to survey questions may not entirely reflect the way they would vote when presented with actual policy options, we believe that the results offer an indication of attitudes across eight European countries that may be useful intelligence for decision makers. MGI’s survey asked respondents to make tangible trade-offs in order to secure an even higher quality of life (see Box 2, “Conjoint-survey methodology”, and the appendix for a detailed description of the survey and the methodology used, as well as the limitations). The survey found that individuals express broad agreement that even greater effort and resources should be invested in specific areas. 14 MGI conducted a survey among 2,000 participants each in France, Germany, Italy, Poland, Romania, Spain, Sweden, and the United Kingdom. Respondents were asked to choose between sets of conjoint scenarios that trade off a desire to have more or less of different attributes of societal aspirations in a cost- or GDPbalanced way.
The attributes were health care, education, the living environment, social security, public safety, buying power, working hours, and productivity (here represented by personal factors such as the willingness to work faster or under more pressure, or training oneself). A model ensures that scenarios economically balance: improvements in one attribute have to come at the expense of other attributes or willingness to work longer or more productively. See the appendix for details. Box 2.
Conjoint-survey methodology A weakness of many opinion polls is that questions on interdependent issues are often presented in isolation. This approach can fail to pick up the gap between one preference and another and how big that gap is, and can lead to unrealistic “wish lists”. Conjoint surveys are designed to address this problem by requiring respondents to make trade-offs between different priorities. The MGI European Aspirations Conjoint Survey on societal priorities over the next ten years required respondents to choose between GDP-balanced scenarios—that is, combinations of options that could be feasible economically—as improvements in one priority area had to be “paid for” through compromises on another.
The eight attributes were health care, the living environment, buying power, education, public safety, social protection, working hours, and productivity. The latter two offered respondents the possibility of increasing overall economic output and then allocating that additional output to the other six priorities. Respondents were presented with ten sets of two random GDP-balanced scenarios.
Based on their replies, we modelled optimal or utility-maximising scenarios for each respondent. These scenarios are the basis of the average scenarios discussed in this chapter. The underlying GDP model, which is based on current expenditure on the different social dimensions in the countries surveyed, allows for estimates of the implied change in spending per attribute as well as an overall GDP-growth rate for these scenarios. 18 McKinsey Global Institute 1.
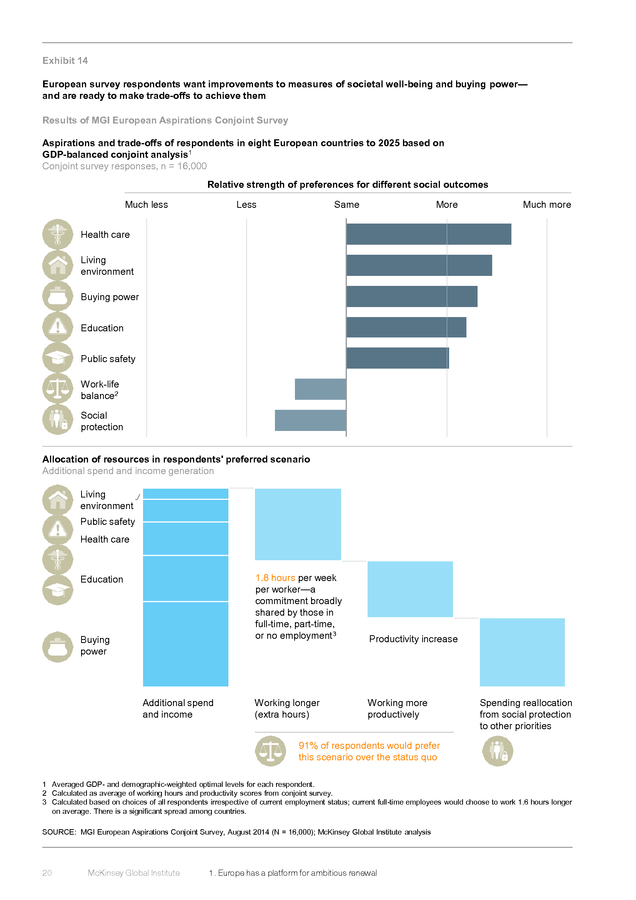
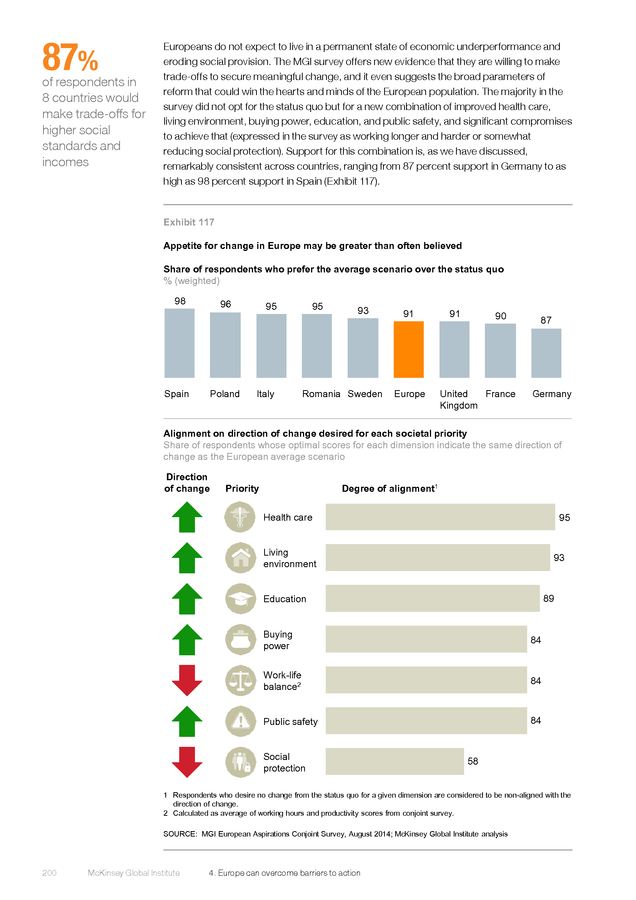
Europe has a platform for ambitious renewal . Respondents across countries, age groups, and levels of income and educational attainment express a common desire for additional investment in health care, the living environment, education, and public safety in the period to 2025, and at the same time say they want to increase their disposable income. The survey suggests that, on average, respondents would prioritise improvements in health care, the living environment, education, and public safety, and they would be willing to “pay” for these improvements by deprioritising their work-life balance and social protection (Exhibit 14). Those surveyed say that, to achieve improvements in these key social measures and rising incomes, they would be prepared to work longer—in the order of 1.8 hours a week (0.5 hours to three hours depending on the country)—and more productively, and to accept a reallocation of spending away from social-protection programmes. Specifically, the survey shows that 84 percent of respondents say that they would be willing to compromise on their work-life balance as long as this led to improved societal outcomes and higher individual incomes—the opposite of the image of a “lazy European”. It is important to note that, although respondents say they are prepared to invest additional effort to achieve improvements in their priorities for society as a whole, they also express a wish to see growth in their individual incomes—captured in the survey by “buying power”. To realise improvements in health, the living environment, education, public safety, and buying power, additional resources of €2.2 trillion a year would be required by 2025, equivalent to 15 percent of Europe’s current GDP. The survey shows that 84 % of respondents say that they would be willing to compromise on their worklife balance as long as this led to improved societal outcomes and higher individual incomes. 96% of respondents want improved health care 93% of respondents want improved living environment McKinsey Global Institute Respondents’ aspirations and commitments are broadly shared across Europe The priority the Europeans we surveyed give to improvements in the different dimensions of social progress is remarkably consistent.
While our survey does not adjust for cultural biases, it is notable that people in all eight countries agree on the areas where they would like to see improvements, namely health care, the living environment, education, and public safety. They all want their incomes to rise, too (Exhibit 15). There is very little variation in the ranking of these priorities among different age groups, educational levels, employment status, and income levels.
In each of these key social areas, more than 80 percent of all respondents expressed a common desire for improved outcomes, with almost unanimous agreement that improvements should be made with respect to health care and the living environment (96 percent and 93 percent agreement, respectively). A window of opportunity for Europe 19 . Exhibit 14 European survey respondents want improvements to measures of societal well-being and buying power— and are ready to make trade-offs to achieve them Results of MGI European Aspirations Conjoint Survey Aspirations and trade-offs of respondents in eight European countries to 2025 based on GDP-balanced conjoint analysis1 Conjoint survey responses, n = 16,000 Relative strength of preferences for different social outcomes Much less Less Same More Much more Health care Living environment Buying power Education Public safety Work-life balance2 Social protection Allocation of resources in respondents' preferred scenario Additional spend and income generation Living environment Public safety Health care 1.8 hours per week per worker—a commitment broadly shared by those in full-time, part-time, or no employment3 Education Buying power Additional spend and income Productivity increase Working longer (extra hours) Working more productively Spending reallocation from social protection to other priorities 91% of respondents would prefer this scenario over the status quo 1 Averaged GDP- and demographic-weighted optimal levels for each respondent. 2 Calculated as average of working hours and productivity scores from conjoint survey. 3 Calculated based on choices of all respondents irrespective of current employment status; current full-time employees would choose to work 1.6 hours longer on average. There is a significant spread among countries. SOURCE: MGI European Aspirations Conjoint Survey, August 2014 (N = 16,000); McKinsey Global Institute analysis 20 McKinsey Global Institute 1. Europe has a platform for ambitious renewal . Exhibit 15 Countries are aligned on most priorities, although opinion differs on the trade-off between work-life balance and social protection Desired change from status quo for country-specific “average” scenarios1 Weighted average deviation from status quo Germany Sweden United Kingdom France Italy Spain 26 24 Poland Romania Health care Living environment Buying power Education Public safety Work-life balance Social protection Purchasing power parity–adjusted real per capita GDP, 2012 € thousand 34 33 29 29 19 12 1 The “average” scenario takes averaged GDP- and demographic-weighted optimal levels for each respondent. SOURCE: MGI European Aspirations Conjoint Survey, August 2014; McKinsey Global Institute analysis The survey also revealed a shared readiness to work longer and more productively across geographies—and not only among those currently deprived of opportunities to work because of the economic environment. However, there is some variation among respondents on how to achieve this shift (Exhibit 16). For example, the survey found that Polish respondents expressed a preference for generating additional output mainly through significant productivity improvements but increasing their working hours by only a relatively modest 1.1 weekly hours per worker. In contrast, French respondents as a group said that they would be willing to work as much as 2.0 more hours a week while slightly decreasing productivity.
It is in Spain and Italy that respondents appear most willing to make large compromises on both aspects of their work-life balance for societal improvements and their incomes. The survey results show that, on average, Spanish respondents would accept working an extra 2.7 hours per week and working much more productively. On average, Italian respondents say that they would be prepared to work 2.5 additional hours a week and much more productively.
At first glance, these results may appear to reflect that fact that Spain and Italy have been facing particularly difficult economic conditions. However, the results also largely hold for Spanish and Italian respondents who are in fulltime employment. McKinsey Global Institute A window of opportunity for Europe 21 . Exhibit 16 Readiness to work longer and more productively to improve societal outcomes is common to most countries with some variations Extra hours worked Number Productivity increase Relative preference Less More Much more 2.7 Spain Italy 2.5 Romania 2.0 1.1 Poland 1.6 Germany 1.3 United Kingdom France Same 1.8 Europe Sweden AVERAGE SCENARIO 0.5 2.0 SOURCE: MGI European Aspirations Conjoint Survey, August 2014; McKinsey Global Institute analysis 72% of respondents would work longer In practice, any commitment among Europeans to compromise on their work-life balance could be achieved in several ways. Reducing holidays, delaying retirement, or bringing unemployed people into work could have a similar impact to extending the working week by 1.8 hours. The survey found that, if they were personally required to work more, the top choice of 54 percent of respondents in full-time employment would be to work more hours each week; 23 percent of this group would choose to forfeit holidays or delay retirement. In all eight countries surveyed, working more hours per week was the top choice among respondents, although that preference was more prevalent in some countries than in others. For instance, 64 percent of respondents in France indicated that they would prefer to work more hours per week compared with only 44 percent of respondents in the United Kingdom, where 35 percent of respondents chose later retirement as their preferred option. Many respondents expressed willingness to work longer hours not solely as a necessary trade-off to achieve better social outcomes but also as an intrinsically positive choice if doing so would increase their disposable income.
The survey asked separate questions about how long respondents were currently working and how long they would be willing to work if compensated accordingly. The survey found that 72 percent of respondents currently employed opted for increased working hours. This was true for workers currently in part-time employment who would like to find full-time positions and for those who already work full time and would like to increase their hours moderately in order to earn more (Exhibit 17).
In contrast, 17 percent of respondents currently employed would like to reduce their working hours even at the expense of lower earnings, mostly among those in full-time employment who aspire to part-time work. 22 McKinsey Global Institute 1. Europe has a platform for ambitious renewal . Exhibit 17 Many survey respondents currently working would be willing to increase their hours moderately if they were compensated for doing so Maximum willingness to work1 Hours per week Weighted group size >100 90–99 80–89 Readiness to further increase full-time working hours Desire to move into full-time employment 70–79 60–69 50–59 40–49 30–39 Interest in part-time employment 20–29 10–19 <10 <10 10–19 20–29 30–39 40–49 50–59 60–69 70–79 Current working hours2 Hours per week 1 Question: On average, how many hours a week do you spend on your work? 2 Question: Imagine you can work as many hours a week as you like and your net income increases accordingly; what is the maximum number of hours you would work in this case? SOURCE: MGI European Aspirations Conjoint Survey, August 2014; McKinsey Global Institute analysis The willingness to work more productively is more difficult to measure precisely than an increase in hours worked. While many productivity-enhancing measures can be nearly invisible to a worker, the commitments made in the conjoint survey refer to improvements that workers could influence directly. These include improved effort, greater ambition at work, and extra training. One piece of evidence corroborating these commitments is the considerable support among respondents for performance-based salaries.
The survey found that 64 percent of respondents believe that salaries in general should reflect performance “more” or “a lot more” than they currently do. Moreover, more than seven out of ten respondents would be prepared to make part or even all of their salary performancebased. Only 16 percent of respondents indicated that they already had a performancebased salary, suggesting that there is significant scope to improve the alignment of incentives with performance in a way that positively resonates with employees. Although the survey findings on working longer and more productively are broadly consistent among respondents, there is considerable disagreement on the degree to which people would want to compromise on social protection.
The survey finds that 84 percent of respondents said that, in their personal optimal scenario, they would be willing to trim their work-life balance in exchange for improvements on other priorities. There is modest variation in the strength of this commitment, according to the survey. However, only 58 percent of respondents expressed a preference for reducing the resources devoted to McKinsey Global Institute A window of opportunity for Europe 23 .
social protection. On this aspect of the survey, there are large differences among countries. For instance, 93 percent of British respondents said that they would accept cuts in social protection, but only 46 percent of those from Poland, 25 percent from Italy, and 24 percent from Spain felt the same way. The average Spanish respondent would like to increase social protection as well as invest more in the other social priorities while making considerable compromises on the work-life balance. In contrast, on average, respondents from France, Sweden, and the United Kingdom say they would be prepared to make relatively small changes to work-life balance and instead opt to cover more than half of the additional resources required through the reallocation of spending on social protection (Exhibit 18). Exhibit 18 The degree to which survey respondents are ready to compromise on social protection varies among countries Relative magnitude of compromises in country-specific average scenarios1 % of total incremental resources required for preferred outcomes Working longer and harder Reallocation away from social protection Increase in social protection spending desired Spain 100 Italy 100 31 69 Germany United Kingdom France 11 89 Romania Sweden 4 96 Poland Decrease in social protection spending desired 35 65 Europe 56 44 41 35 59 65 1 Calculated based on conjoint analysis results and country-specific GDP models. SOURCE: McKinsey Global Institute analysis 1/5 of survey respondents would make large compromises on work-life balance for increased social protection 24 A cluster analysis gives us more insight into these differences of opinion on social protection (Exhibit 19).
This analysis reveals five broad groups. Of these, one cluster would like to increase spending on social protection by making even larger compromises in the worklife balance; this group comprises roughly one-fifth of all respondents, more than half of whom are from Spain and Italy. A second cluster, with only 12 percent of respondents, does not favour cuts to social protection but would “pay” for maintaining current protection by forgoing individual income rather than working longer and harder; respondents from Sweden are most prominent in this cluster, accounting for one-third of respondents. The other three clusters all agree that spending on social protection should be reduced significantly, but they differ on the ambition of their aspirations for the other priorities and the extent of their readiness to compromise on their work-life balance.
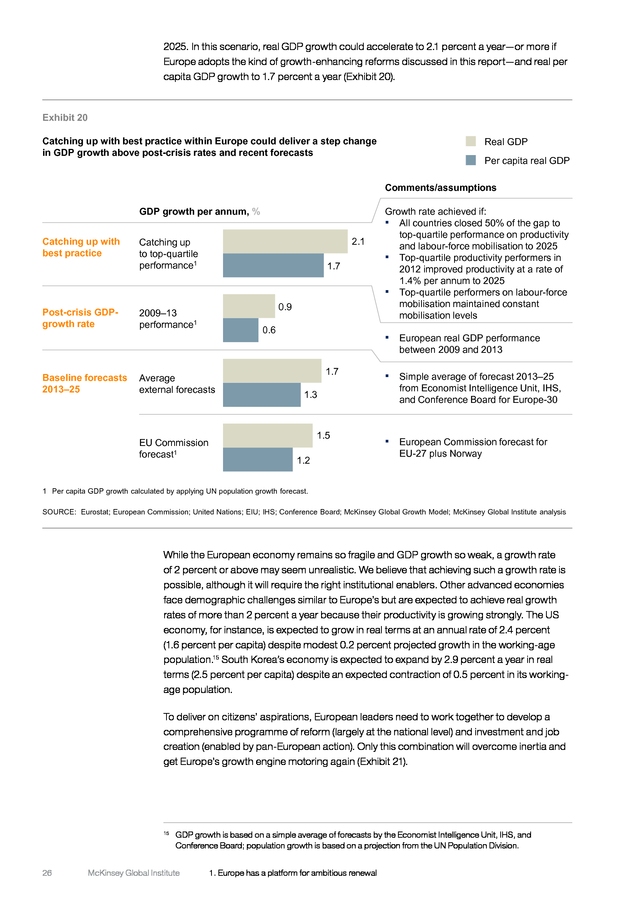
These diverse McKinsey Global Institute 1. Europe has a platform for ambitious renewal . attitudes on social protection come from people of all ages, educational attainment, and employment status. Exhibit 19 The survey results show some variation in attitudes towards social protection spending Desired change from status quo in cluster-specific “average” scenarios1 Cluster I II III IV V Cluster size (%) 25.0 12.3 26.8 21.8 14.1 Characteristic Highest willingness to trade away social protection while preserving worklife balance Low emphasis on buying power, wish to preserve social protection Willing to make moderate compromises for moderate improvements Highest willingness to trade away worklife balance to improve all other priorities including social security Less aspirational on societal priorities, wish to preserve work-life balance Health care Living environment Buying power Education Public safety Work-life balance2 Social protection 1 For cluster-specific average scenarios. 2 Calculated as average of working hours and productivity scores from conjoint survey. SOURCE: MGI European Aspirations Conjoint Survey, August 2014; McKinsey Global Institute analysis There is reason to believe that Europe can grow faster with competitiveness reform and investment and job creation in tandem Current forecasts suggest that there is an expectation that Europe will improve on its postcrisis performance. The average of mid-2014 projections from the Economist Intelligence Unit, IHS, and the Conference Board for real GDP growth between 2013 and 2025 yields a forecast of 1.7 percent per annum—despite the EIU’s projected decline of 0.4 percent in the working-age population. The European Commission takes a slightly more pessimistic view, forecasting growth of 1.5 percent per annum, assuming a slight uptick in annual labour supply growth by 0.1 percent and a productivity-growth boost of 1.4 percent per annum. Europe has an opportunity to grow faster by catching up with best practice. To grasp the potential, consider a scenario in which all countries were to close half of the gap to topquartile European performance on labour productivity and labour-force mobilisation; that is, the share of the working-age population that is active in the labour force) in the period to McKinsey Global Institute A window of opportunity for Europe 25 .
2025. In this scenario, real GDP growth could accelerate to 2.1 percent a year—or more if Europe adopts the kind of growth-enhancing reforms discussed in this report—and real per capita GDP growth to 1.7 percent a year (Exhibit 20). Exhibit 20 Catching up with best practice within Europe could deliver a step change in GDP growth above post-crisis rates and recent forecasts Real GDP Per capita real GDP Comments/assumptions GDP growth per annum, % Catching up with best practice Catching up to top-quartile performance1 Post-crisis GDPgrowth rate 2009–13 performance1 Baseline forecasts 2013–25 2.1 1.7 0.9 0.6 Average external forecasts EU Commission forecast1 Growth rate achieved if: â–ª All countries closed 50% of the gap to top-quartile performance on productivity and labour-force mobilisation to 2025 â–ª Top-quartile productivity performers in 2012 improved productivity at a rate of 1.4% per annum to 2025 â–ª Top-quartile performers on labour-force mobilisation maintained constant mobilisation levels â–ª 1.7 European real GDP performance between 2009 and 2013 â–ª Simple average of forecast 2013–25 from Economist Intelligence Unit, IHS, and Conference Board for Europe-30 â–ª European Commission forecast for EU-27 plus Norway 1.3 1.5 1.2 1 Per capita GDP growth calculated by applying UN population growth forecast. SOURCE: Eurostat; European Commission; United Nations; EIU; IHS; Conference Board; McKinsey Global Growth Model; McKinsey Global Institute analysis While the European economy remains so fragile and GDP growth so weak, a growth rate of 2 percent or above may seem unrealistic. We believe that achieving such a growth rate is possible, although it will require the right institutional enablers. Other advanced economies face demographic challenges similar to Europe’s but are expected to achieve real growth rates of more than 2 percent a year because their productivity is growing strongly.
The US economy, for instance, is expected to grow in real terms at an annual rate of 2.4 percent (1.6 percent per capita) despite modest 0.2 percent projected growth in the working-age population.15 South Korea’s economy is expected to expand by 2.9 percent a year in real terms (2.5 percent per capita) despite an expected contraction of 0.5 percent in its workingage population. To deliver on citizens’ aspirations, European leaders need to work together to develop a comprehensive programme of reform (largely at the national level) and investment and job creation (enabled by pan-European action). Only this combination will overcome inertia and get Europe’s growth engine motoring again (Exhibit 21). GDP growth is based on a simple average of forecasts by the Economist Intelligence Unit, IHS, and Conference Board; population growth is based on a projection from the UN Population Division. 15 26 McKinsey Global Institute 1. Europe has a platform for ambitious renewal .
Exhibit 21 Europe will need to work in tandem on reform and support for job creation and investment Reform to boost competitiveness, mostly at national level (75% impact), supported at European level Investment and job creation enabled mostly at the European level SOURCE: McKinsey Global Institute analysis ••• There is no guarantee that Europe will achieve the rates of GDP growth that we believe are possible if the region is to embrace reform to boost competitiveness and acts to stimulate investment and job creation. By the same token, these rates are not the upper limits of what can be achieved. Europe has fundamental strengths on which to build, and European citizens express themselves willing to make tough trade-offs to achieve higher growth and incomes. If they are to meet the high aspirations suggested by the MGI survey, Europe’s leaders need to set out a programme that delivers a step change in growth compared with the continent’s recent economic performance and uses the fruits of growth to further strengthen European society and quality of life.
Europe needs a healthier economic environment to deliver on what Europeans say they want, and that will require concerted action on both structural reform and support for investment and job creation. In the next chapter, we discuss three broad areas of supply-side reform that could become a platform for a new growth strategy that delivers a better deal for Europe. Then, in Chapter 3, we examine various options for stimulating investment and job creation within Europe before, in Chapter 4, sharing some thoughts on whether Europe can—and is likely to—act on these fronts. McKinsey Global Institute A window of opportunity for Europe 27 .
Chapter photo Chapter 2: Class © Getty Images . 2. REFORM—MUCH OF IT NATIONAL—CAN DELIVER GROWTH Competitiveness is the foundation of any healthy economy. Therefore, an agenda for sustainable growth must start with measures to deliver a more competitive Europe. A combination of 11 structural reforms that invest for the future, boost productivity, and mobilise the workforce could enhance the competitiveness of the European economy and generate the growth required to meet Europeans’ societal aspirations. Encouragingly, Europe does not need to look far to find best-practice examples for these reforms.
The continent can look to its own fundamental strengths and adopt leading practices found within its own borders. Three-quarters of the positive impact on growth possible from implementing competitiveness growth drivers can be achieved through decisions made at the national level, although these will need support at the European level to boost investment and job creation and foster more promising growth conditions for reform. Countries will need to prioritise and select which growth drivers are most applicable to their economies and societies. In combination, the 11 growth drivers could potentially help GDP growth to reach 2 to 3 percent per annum and sustain it in the longer term—beyond 2015, whose growth rate, as noted, could be relatively strong because of the confluence of a number of positive trends (Exhibit 22).
This would be more than enough to meet in full the aspirations voiced in the survey. These growth drivers could boost Europe’s GDP-growth rate by around 1.5 percentage points a year compared with a scenario in which no reform takes place. That is the equivalent of adding the current size of the Austrian economy every year.
Cumulatively, this would have an effect greater than the entire current size of the United Kingdom’s economy by 2025. Eleven growth drivers could potentially help GDP growth to reach 2 to 3 percent per annum. This estimate does not include any of the interaction effects or overlap among the growth drivers, although we believe that, implemented in concert, many of the growth drivers would magnify the effect of others. For example, promoting competitive and integrated markets in the service and digital sectors will help accelerate the development of a stronger ecosystem for innovation across Europe by enabling business-friendly policies and standards. Efforts to increase the competitiveness of European cities could work well in tandem with immigration policies that are growth-oriented and attract higher-skilled immigrants, and incentivising new entrepreneurial activity in urban hubs. .
The 2 to 3 percent that the 11 competitiveness growth drivers could help Europe reach is more than the 1.5 percent a year that MGI estimates would be needed to meet the aspirations expressed in the MGI survey (Exhibit 23). Some of the growth drivers may result in people working longer and more productively, but many others are smarter ways of achieving growth without necessarily increasing working hours. For example, high-quality infrastructure provision improves the productivity of workers almost invisibly. Stronger skills from a well-functioning education-to-employment system allow people to work more effectively and not necessarily longer or harder. Exhibit 22 The growth drivers could deliver sustainable growth of 2 to 3 percent even when oil and currency effects ebb away Potential GDP growth for Europe-30 (estimates) % 1.8 2015 EC forecast 0.8 2015 boom factors Oil Do nothing 0.3 0.2 0.8–1.5 Euro QE1 0–1.0 European aspirations 1.5 Growth driver impact >2.0 Potential sustained growth to 2025 2.0–3..0 1 Projected impact of QE from central bank remittances.
Much of the “Euro” impact also relates to QE; impact of QE estimated at up to a maximum of 0.2% of GDP; assumes a GDP weighted bond rate of between 1.3 and 2.2%. NOTE: Numbers may not sum due to rounding. SOURCE: IMF; European Commission; McKinsey Global Institute analysis 30 McKinsey Global Institute 2. Reform—much of it national—can deliver growth . Exhibit 23 Eleven growth drivers—about three-quarters achievable at the national level— can deliver on European aspirations Incremental real GDP growth % per annum National-level catching up to leading practice Leveraging European scale Enabler Changing incentive structures and taxation Investing for the future Boosting productivity Nurturing ecosystem for innovation 0.26 Competitive and integrated markets in services and digital 0.43 Effective education to employment 0.24 Public-sector productivity 0.15 Productive infrastructure investment 0.14 Further openness to trade 0.08 Reduced energy burden 0.13 Mobilising the workforce Grey and female labourforce participation Pro-growth immigration 0.26 Enhanced labour-market flexibility Supporting urban development 0.39 0.15 0.09 SOURCE: McKinsey Global Institute analysis McKinsey Global Institute A window of opportunity for Europe 31 . 3/4 of growth impact at national level Three-quarters of the growth potential can be achieved at the level of individual countries— as long as action is taken to unlock investment and job creation at the European level. The fact that so much potential for change is in national hands is an encouraging finding given the complexities of supra-national decision making within the EU. National governments can play a major role in delivering the growth impact of the drivers, including, for instance, increasing grey and female participation in the labour force, which will require governments to adjust labour and child-care policies. Regional and city authorities have a part to play, too. Each of these can, for instance, contribute to efforts to boost the competitiveness of cities. National, regional, and city governments have an enormous opportunity to learn from leading practice found elsewhere in Europe.
Leading practices abound, including Switzerland’s flexible dual-apprenticeship vocational training system, Denmark’s outcomesbased budgeting in the public sector, Spain’s recent labour-market reforms, Germany’s support services for exporters in destination countries, Flanders’ pre-commercial procurement initiative for innovative products and services, and Wroclaw’s efforts to make the Polish city more attractive to young workers. 1/4 of potential growth impact needs involvement of EU Europe’s supranational institutions need to be involved to coordinate the exchange of best practice and the delivery of the remaining one-quarter of the potential growth impact that will rely on leveraging the continental economy’s scale. For instance, the EU can spur innovation in sectors with significant economies of scale by setting Europe-wide standards for disruptive technologies or open data, and it can accelerate progress in interconnecting gas and electricity networks across Europe’s internal borders. The EU is also responsible for Single Market legislation and external trade agreements, and it can explore European-scale public procurement to boost efficiency of spending. It is unlikely that simultaneous implementation of all 11 growth drivers is feasible.
In reality, countries will need to consider how best to sequence structural reform, and their priorities will inevitably differ. Drawing on MGI’s assessment of countries’ performance on a range of subindicators (including, for instance, private spending on R&D, energy intensity in industry, and the quality of infrastructure relative to income levels), we have identified top performers on each of the 11 growth drivers and those countries that currently lag behind the European average on each growth driver by the largest margins (Exhibit 24). The gaps to that average are quite different for each country. Germany, for instance, has a gap on mobilising labour.
Poland and Romania have scope to catch up on their innovation ecosystems and the productivity of infrastructure investment. All European countries have considerable scope to boost the productivity of their public sectors, but we have not attempted to quantify this scope due to well-recognised difficulties in measuring productivity in these sectors. Our scoring system gives us a helpful overview, but we acknowledge that it is no substitute for a detailed discussion within each country on where its leaders would place their priorities (Exhibits 25 and 26). One vital component of enabling the programme of reform that the 11 growth drivers constitute is ensuring that tax systems are oriented towards economic growth (see Box 3, “Taxation and incentives”). 32 McKinsey Global Institute 2.
Reform—much of it national—can deliver growth . Exhibit 24 European economies need wider adoption of best practice that already exists on the continent Performance vs. other countries on each growth driver Germany Sweden United Kingdom France Top third on composite indicator Top third on at least one subindicator Italy Spain Poland Romania Investing for the future Nurturing ecosystem for innovation Effective education to employment Productive infrastructure investment Reduced energy burden Supporting urban development Boosting productivity Competitive and integrated markets in services and digital Public-sector productivity Not quantitatively assessed Further openness to trade Mobilising the workforce Grey and female labour-force participation Pro-growth immigration Enhanced labour market flexibility n/a NOTE: All countries assessed as long as at least two out of three or four subindicators available; limited data availability particularly for Bulgaria, Croatia, Cyprus, Latvia, Malta, Norway, Romania, Slovakia, and Switzerland. SOURCE: McKinsey Global Institute analysis McKinsey Global Institute A window of opportunity for Europe 33 . Exhibit 25 Growth driver indicators Competitiveness growth driver indicator rankings Direction of Europe-30 Best European improvement average country Indicator (unit) Nurturing system for innovation Finland Global innovation index (composite score) ï° 51.3 64.8 Switzerland ï± 49.8 18.6 Slovenia ï° 21 30 Ireland Youths not in education, employment, or training (NEETs) (% of the population aged 18–24 with at most lower secondary education ) ï± 12 4 Slovenia ï° 37 53 Ireland Relative length of youth unemployment (time unemployed for 15–24 age group as a % of time unemployed for 25–54 age group) ï± 78 50 Sweden Competitiveness of education system (degree to which the education system meets the needs of a competitive economy) ï° 4.3 6.0 Switzerland Quality of infrastructure (WEF composite infrastructure quality score) ï° 5.4 6.6 Switzerland Gap in infrastructure spend (absolute [- or +] gap between actual and optimal level of infrastructure spend; % of GDP) ï± 0.6 0.0 Czech Republic Difference between expected and actual quality (composite score delta, given GDP per capita) ï° 0.02 1.13 Portugal Energy intensity in industry (final energy consumption of industry; tons of oil equivalent/million $ 2005 PPP per value added in industry) ï± 84 29 Ireland Energy consumption (consumption as a % of value added, based on inputs from energy intensive sectors) ï± 5 3 Ireland Price deviation from European mean (weighted average of deviation in electricity prices from European mean; ¢ per kWh) ï± 2.9 0.6 Denmark Average electricity price (weighted average for industry and households, ¢ per kWh, post-tax) ï± 19.2 9.4 Norway Urbanisation (% of population living within urban areas) ï° 61 83 Belgium Urban density (people per sq. km. in urban areas) ï° 875 1,831 Greece Affordability (% GDP between wages and housing prices) Supporting urban development 2.4 Tertiary education attainment (% of those aged 30–34 having successfully completed tertiary education [ISCED levels 5 or 6]) Reduced energy burden 1.1 Knowledge-intensive sectors (sector % of GDP) Productive infrastructure investment ï° Ease of starting a company (index: lower is better) (composite score; lower is better) Effective education to employment Private R&D spending (% of GDP) ï± 0.5 0.0 Denmark NOTE: Luxembourg and Malta excluded from analysis as outliers; not all countries have rankings for all metrics. SOURCE: McKinsey Global Institute European Growth scorecard model; McKinsey Global Institute analysis 34 McKinsey Global Institute 2. Reform—much of it national—can deliver growth .
Exhibit 26 Growth driver indicators (continued) Competitiveness growth driver indicator rankings Indicator (unit) Competitive and integrated markets in services and digital Direction of Europe-30 Best European improvement average country 30 Ireland Transposition lag of trade laws (% non-compliance within national law) ï± 0.7 0.2 Denmark Trade law infringements (per $ trillion GDP, averaged over 3 years) ï± 90 17 Germany ï± 0.17 0.10 Netherlands ï± 1.37 0.92 Netherlands Extraterritorial trade (extra EU-28 trade; % of GDP) ï° 10.8% 17.1% Sweden Extraterritorial trade to China, United States, India (% of GDP) ï° 5.4% 20.0% Ireland ICC Open Market Index (index of market openness) ï° 3.97 4.80 Belgium Female participation rates (% of male participation rates, 25–49) ï° 87% 97% Lithuania Female hours worked (% of male weekly hours) ï° 82% 97% Hungary Grey participation rates (55–74 age group as % of 25–54 age group) ï° 54% 66% Norway Non-EU immigrant share (% of total population) ï° 6.6% 14.0% Estonia Education level of immigrants (% of immigrants with education levels of ISCED 5, 6, or above) ï° 31% 63% Ireland Employment level of immigrants (% of native level) ï° 92% 116% Hungary Net migration from non-Europe-30 countries (newcomers per 1,000 people) ï° 1.31 4.53 Sweden ï± 42% 9% Norway ï± 2.52 1.62 United Kingdom Employment rates (rate for the 15–64 age group) ï° 67% 84% Norway Unit labour cost increases (2004–13, real percentage change) Pro-growth immigration 6 Product market regulation index Grey and female labour-force participation ï° Services Trade Restrictiveness Index (degree to which policies restrict trade) Further openness to trade Intra-European services exports (% of GDP) ï± -0.3% -14.1% Cyprus Enhanced % long-term unemployment (% of total labour-market unemployment) flexibility Employment protection index (index of total collective and individual dismissals) NOTE: Luxembourg and Malta excluded from analysis as outliers; not all countries have rankings for all metrics. SOURCE: McKinsey Global Institute European Growth scorecard model; McKinsey Global Institute analysis McKinsey Global Institute A window of opportunity for Europe 35 . Box 3. Taxation and incentives A critical part of any discussion on growth is the impact of tax systems and how they shape incentives. There is a strong case for tax reform in Europe as a complement to the competitiveness growth drivers discussed in this chapter, and to accentuate their impact on growth. Tax systems that are fair, transparent, and involve minimal distortions to economic decisions are the most supportive of economic growth. On average, European governments take a larger share of national annual output in the form of taxes than governments in other countries (Exhibit 27).
France, Italy, and Sweden, for instance, each collect more than 40 percent of their respective GDP in taxes compared with less than 30 percent in Australia, South Korea, and the United States. Of the European countries that are members of the OECD group of developed economies, only three—Ireland, Slovakia, and Switzerland—have a tax take of less than 30 percent of GDP. There is no strong pattern in the types of taxes collected in Europe. For instance, 62 percent of Denmark’s tax revenue comes from levies on income and profits, while in Hungary that share is only 17 percent.
Effective tax rates on gross income in many Western European countries are higher than in other OECD economies. For example, the effective tax rate on an annual gross income of $300,000 is more than 50 percent in France and Italy, compared with around 30 percent in the United States.1 The reason for this difference is that Denmark, France, Portugal, and Sweden, among others, have marginal personal income tax rates of close to or more than 50 percent for top earners. 1 KPMG’s individual income tax and social security rate survey 2012, KPMG International, October 2012. Exhibit 27 European governments typically take a greater share of total output in taxation than those in other developed economies Public-sector tax take by type of tax, 2012 % 44 4 Other Property 43 Social security and payroll 42 1 Goods and services 3 36 1 14 18 Type of tax Income and profits 33 13 4 32 1 11 12 15 Sweden 11 3 28 3 5 7 Germany United Poland Kingdom 5 9 10 Spain Canada 27 2 1 9 8 8 Japan South Korea 2. Reform—much of it national—can deliver growth 3 5 12 Australia United States Selected non-European countries SOURCE: OECD; McKinsey Global Institute analysis 24 4 16 9 NOTE: Numbers may not sum due to rounding. McKinsey Global Institute 7 14 12 11 Selected European countries 36 30 8 12 Italy 3 12 10 14 11 31 12 11 France 2 14 6 10 32 .
How countries design taxation systems is crucial to their success. It is important, for example, to minimise the degree of distortion on decisions made by different actors in an economy on labour, capital, and technological advancement. Property and consumption taxes are generally regarded as involving the fewest distortions, and therefore the lowest negative impact on growth.16 In contrast, corporate and income taxes are less conducive to growth because they can potentially discourage entrepreneurial activity and encourage capital outflow. By avoiding distortions, taxation can increase the overall impact of the 11 competitiveness growth drivers by not creating incentives that work at cross-purposes to the reforms themselves, such as encouraging capital flight or decreasing the level of innovation and entrepreneurship in the economy. Governments inevitably have to balance many competing objectives, some of which may be inimical to achieving growth.
A comprehensive view of all the relevant trade-offs is important. For instance, a critical element of making the labour market more flexible—and, indeed, helping workers realise a better standard of living—is to reduce taxes on labour incomes. This reform is necessarily considered in isolation in this report. But it is likely to have knockon effects in the broader economy by forcing governments to either raise taxes elsewhere to maintain the same fiscal balance or to take on additional debt. Both responses will have social consequences. Another key ingredient of well-functioning taxation systems is that they are responsive to the concerns of stakeholders and feature a high degree of cooperation among governmental bodies to reduce compliance costs.17 There is significant opportunity for some European economies to improve compliance.
For instance, while it takes only 63 hours on average to comply with taxes (three major types of taxes: the corporate income tax, the value added or sales tax, and labour taxes) in Switzerland, it takes 413 hours in the Czech Republic and 454 hours in Bulgaria.18 Effective tax systems also need to be highly transparent not only to ensure public trust in the system but also to make it easier to tackle tax evasion and avoidance and therefore maximise revenue. Effective tax systems reduce complexity as much as possible. The administrative burden and complexity of a tax system may have a stronger negative correlation on economic growth than the actual level of business taxation.19 See Jens Arnold, Do tax structures affect aggregate economic growth? Empirical evidence from a panel of OECD countries, OECD economics department working paper number 643, October 2008, and Frank Zipfel and Caroline Heinrichs, The impact of tax systems on economic growth in Europe: An overview, DB Research, Deutsche Bank, October 2012. 17 Principles of good tax administration—practice note, OECD Committee of Fiscal Affairs Forum on Strategic Management, Centre for Tax Policy and Administration, OECD, amended May 2001. 18 Paying taxes 2013: The global picture, PricewaterhouseCoopers and the World Bank/International Finance Corporation, November 2013.
The data cover taxes payable by businesses, measuring all taxes and contributions that are government-mandated. 19 Ibid. 16 McKinsey Global Institute A window of opportunity for Europe 37 . We now describe each of the 11 competitiveness growth drivers in detail and briefly discuss the importance of growth-oriented tax systems as an enabler to these reforms. 1. NURTURING ECOSYSTEM FOR INNOVATION Innovation—the invention and adoption of new business models, products and processes— has driven a large share of the astonishing productivity gains the world has experienced since the first industrial revolution in the mid-18th century.20 For advanced economies where the potential for further productivity gains from the adoption of existing technologies is limited, and where companies can compete against lower-wage countries only by developing new high-value products or processes, innovation is vital for growth.21 For Europe’s lower-income economies, disseminating innovations is crucial if they are to continue to close the gap with their wealthier neighbours. Europe's private R&D spending is 1.3% 2.7% of GDP vs. in South Korea Comparing Europe as a whole with the world’s most innovative economies reveals a mixed picture. Europe’s innovation enablers—its education and research systems—are broadly in line with those of South Korea, Japan, and the United States. Public R&D expenditure is also in line with that of leading countries.
But some metrics of private-sector innovation lag behind. Europe’s private sector spends 1.3 percent of GDP on R&D, below South Korea at 2.7 percent, the United States at 1.8 percent, and China at 1.4 percent. One of the more tangible ways Europe can encourage innovation is by using government procurement. This approach has a successful track record.
One example is the way procurement by the US Department of Defense spurred the development of semiconductors. European governments spend at least 5 percent of GDP on procurement, compared with only 0.7 percent on public R&D and 0.1 percent on subsidies for privatesector R&D. Other measures that Europe can consider to nurture innovation are deepening the Single Market in services and digital to enable fast-growing companies to scale up more effectively, setting Europe-wide standards for transformational technologies, unblocking barriers to entrepreneurship and accepting “creative destruction” of industries, establishing standards and platforms for open data that extend to private-sector data sets, and enhancing digitisation across the public and private sectors.
Action on these fronts could accelerate Europe’s GDP-growth rate by 0.26 percentage points.22 Where Europe stands Innovation relates to new technologies, products, and processes or to new ways of doing business—ranging from radically original ideas to incremental improvements, and conducted by the public or the private sector. The impact of innovation depends on the degree to which ideas developed in one company or country spill over to other sectors and therefore to overall economic growth (see Box 4, “Varieties of capitalism = varieties of innovation?”).23 Robert J. Gordon, Is US economic growth over? Faltering innovation confronts the six headwinds, NBER working paper number 18315, August 2012. 21 Global competitiveness report 2014–2015, World Economic Forum, September 2014. 22 This estimate is based on historic correlations between R&D expenditure and growth in total factor productivity for the richest 15 European countries and assumes that this set of countries increased R&D expenditure to the same level as the United States. 23 Alvaro Escribano, Andrea Fosfuri, and Josep A.
Tribó, “Managing external knowledge flows: The moderating role of absorptive capacity”, Research Policy, volume 38, issue 1, February 2009. 20 38 McKinsey Global Institute 2. Reform—much of it national—can deliver growth . Box 4. Varieties of capitalism = varieties of innovation? The literature on different forms of capitalism illustrates the high degree to which the structure of a national economy can drive the type of innovation that occurs. According to the political economists Peter Hall and David Soskice, coordinated market economies such as Germany and South Korea tend to promote incremental innovation within companies, while liberal market economies such as the United Kingdom and the United States tend to be more favourable to disruptive innovation by entrepreneurs. The industrial structure, financial sector, labour markets, and government policy all have a role to play.1 Coordinated market economies tend to be dominated by private, often family-held, companies rather than ones that are publicly listed.
Germany’s large Mittelstand sector of small and medium-sized enterprises (SMEs) and South Korea’s chaebol conglomerates are examples. Commercial banks are the principal source of funding for these businesses and often are closely involved in investment decisions. Companies can take a longer-term view on R&D and other investments than corporations whose financing tends to hinge on quarterly results.
Leaders of South Korea’s Hyundai automotive business, for example, set their long-term strategy over a 30- to 50-year horizon with the aim of becoming the leading carmaker by 2050.2 Coordinated market economies tend to have a relatively high degree of labour-market regulation and a strong sense of loyalty among employees to their employers; long experience and deep expertise in one company can enable incremental innovation. The success of Germany’s Mittelstand companies is often founded on such incremental but continuous improvement of existing technologies. Liberal market economies, in contrast, are more conducive to short-term, radical innovation than to longer-term incremental investments. These economies tend to use capital markets as the main source of funding for businesses and to have few restrictions on mergers and acquisitions (M&A). Pharmaceuticals and biotechnology is one sector in which companies are increasingly treating strategic M&A activity—the acquisition of smaller companies with attractive products or technology portfolios—as a substitute for in-house R&D.
Liberal market economies also tend to have flexible labour markets with low degrees of employment protection and generally shorter job tenures. A start-up with a breakthrough idea can easily receive large amounts of venture funding, scale its workforce up and down, and start afresh when an idea fails. The success of many Silicon Valley start-ups was enabled by this liberal institutional framework. Peter A.
Hall and David Soskice, eds., Varieties of capitalism: The institutional foundations of comparative advantage, Oxford University Press, 2001; OECD reviews of innovation policy: Korea 2009, OECD; German Federal Ministry of Education and Research. 2 Manufacturing the future: The next era of global growth and innovation, McKinsey Global Institute, November 2012. 1 McKinsey Global Institute A window of opportunity for Europe 39 . 5 European economies in top 10 most innovative in world Despite broad agreement on what innovation looks like and why it is important to an economy, measuring performance on innovation is notoriously difficult. Two widely used rankings of innovation come from the WEF and the European Commission. The WEF’s 2014–2015 Global Competitiveness Index ranks five European economies among the ten most innovative in the world. Finland and Switzerland rank first and second, and Germany, Sweden and the Netherlands occupy ranks six to eight.
However, many other European economies score much lower. For instance, Bulgaria ranks 105th out of 144 countries on the index.24 The European Commission’s Innovation Union scoreboard 2014, which assesses seven dimensions of innovation, indicates that the EU overall is outperformed by Japan, South Korea, and the United States on private-sector R&D, and by the United States on entrepreneurship (Exhibit 28). While China still ranks below the EU today, its performance has improved markedly over the past five years, narrowing the gap.25 Exhibit 28 Europe is being outperformed most markedly on private-sector innovation efforts including corporate spending on R&D and entrepreneurship EU innovation performance competitors Normalised EU performance relative to the United States, South Korea, and Japan (EU performance shown as % difference) United States Educational attainment1 EU underperforms (>30 p.p.) EU outperforms (>30 p.p.) South Korea Japan -12 -11 -20 Enablers Research systems2 Public-sector R&D Innovation process Private-sector R&D3 Entrepreneurship4 Innovation outcomes Cluster development5 Economic impact6 58 12 -24 1 -15 1 -51 -53 -29 20 19 -33 -24 -9 -21 33 1 -11 1 Average of the share of new doctorate graduates per 1,000 of the population aged 25–34 plus share aged 30–34 that has completed tertiary education. 2 Average of the share of international scientific co-publications per million of the population and the share of scientific publications among the top 10% of most cited publications worldwide as a percentage of the country’s total scientific publications. 3 Patent Cooperation Treaty patent applications per billion dollars of GDP. 4 Global Entrepreneurship and Development Institute (GEDI) index on entrepreneurial attitudes, aspirations, and activity. 5 Global Innovation Index survey results on the state of cluster development and collaboration among firms. 6 Average of the contribution of medium and high-tech product exports to the trade balance, knowledge-intensive services exports as percentage of total services exports, and license and patent revenue from abroad as a percentage of GDP. SOURCE: Innovation Union scoreboard 2014, European Commission, March 2014; Global Innovation Index; GEDI Index, Global Entrepreneurship and Development Institute; McKinsey Global Institute analysis Ibid.
The innovation pillar of the WEF’s Global Competitiveness Index focuses on technological innovation. Non-technological innovation is reflected in the skills, know-how, and working conditions of organisations and is reflected in different pillars of the index. 25 Innovation Union scoreboard 2014, European Commission, March 2014. 24 40 McKinsey Global Institute 2. Reform—much of it national—can deliver growth . The 2 percent of GDP that Europe spends on R&D is lower than in Australia, Japan, South Korea, and the United States (Exhibit 29). This share increased by only 0.2 percentage points between 2003 and 2012, driven by increased R&D spending by Central and Eastern Europe and the Baltic countries. The EU has a target of spending 3 percent of GDP on R&D, but only two European countries—Finland and Sweden—have consistently kept their expenditure above this threshold. On average, Central and Eastern Europe and the Baltic countries spend only 1.1 percent of GDP on R&D.
It is notable that China already outperforms most European countries, spending 1.9 percent of its GDP on R&D, and is on track to overtake the performance of Europe as a whole on this measure of innovation within a few years. In 2013, China surpassed Germany on the number of international patent applications filed with 21,000 compared with 17,900 filed by Germany. On this measure, China now ranks third in the world behind the United States (57,200 filings) and Japan (43,900).26 Exhibit 29 Europe has a significant R&D gap with South Korea, Japan, and the United States, caused primarily by a shortfall in private-sector R&D R&D spending by country and source, 2012 % of GDP Total Business sector1 Public sector2 3.6 South Korea 3.3 Japan United States 0.5 1.4 1.7 1 Including private not-for-profit (0.02% in Europe). 2 Government and higher education. NOTE: Numbers may not sum due to rounding. 0.7 1.3 1.9 Canada 0.9 1.3 2.0 China 0.7 1.8 2.1 Europe-30 0.7 2.6 2.6 Australia 0.9 2.7 0.8 0.9 -1.6 -1.5 -0.1 SOURCE: Innovation Union scoreboard, European Commission, 2014; McKinsey Global Institute analysis Private companies account for two-thirds of European R&D expenditure, and it is their relatively low spending that accounts for virtually the whole of Europe’s R&D spending gap with the world’s top innovators.
Europe’s public-sector R&D spending at 0.7 percent of GDP is in line with that of other countries. However, the continent’s private-sector R&D at 1.3 percent of GDP is significantly lower than in South Korea at 2.7 percent, Japan’s 2.6 percent, and 1.8 percent in the United States. Ninety percent of the overall gap in R&D spending between the Europe-30 and South Korea, the leading performer, is due to lower private-sector spending. We draw on filings for patent application under the Patent Cooperation Treaty compiled by the World Intellectual Property Organization. 26 McKinsey Global Institute A window of opportunity for Europe 41 .
Within Europe more generally, about 70 percent of private-sector R&D expenditure is concentrated in large corporations that have more than 500 employees.27 An analysis of the 2,000 biggest companies in terms of spending on R&D shows that some sectors in Europe lead the world. In absolute terms, European pharmaceuticals and biotechnology companies, at €42 billion, spent as much on R&D in 2012 as their counterparts in the United States and four times as much as Japanese firms. More than half of this spending was by just five Swiss, French, and British pharmaceuticals companies. German corporations are the world’s biggest R&D spenders in automobiles and parts.
Overall, European companies in the automotive sector spend more than three times as much as US companies and 50 percent more than Japanese companies in this sector at €39 billion. Just four German companies—Volkswagen, Daimler, Robert Bosch, and BMW—spend more on R&D than automotive companies in any other single country put together, apart from Japan. Indeed, these four German automotive companies together contributed more than one-third of all German private-sector R&D spending in 2012. 4 Silicon Valley giants spend more on R&D than all European tech companies combined However, European companies lag behind those of other countries in some sectors. In technology hardware and equipment, for instance, European companies invest only €16 billion, one-third of what US companies spend.
In software and computer services, European firms spend only €6 billion, one-sixth of what their US counterparts spend. In technology, four Silicon Valley giants—Intel, Cisco, Qualcomm, and Hewlett-Packard— spend more on R&D than all European tech companies combined. In this sector, the leading European countries are Finland, the Netherlands, and Sweden, but all of them rank below China, Japan, Taiwan, and the United States.
In electronics and electrical equipment, the fifth-most R&D-intensive industry, Japan and South Korea rank ahead of Europe. Despite its relatively low spending on R&D in several key sectors, Europe still benefits from a high propensity to adopt innovations from other countries. Google and Amazon are US companies, but the United Kingdom leads the world in e-commerce, with online retail having a higher share of total retail than in the United States. The foundation of the success of some of Europe’s largest technology start-ups, such as Berlin-based Rocket Internet, has been in bringing US inventions to European markets and then adapting them.
In Sweden and the United Kingdom, MGI research has found that the contribution of the Internet to GDP is significantly higher than it is in the United States. In France and Germany, the contribution of the Internet to GDP is not far behind that in the United States.28 <5% of Europeans committed resources to new business in 2013 R&D spending is one important part of the innovation story; the other—where Europe lags behind other economies—is fostering entrepreneurship. The picture is mixed.
On average, Europe is less inclined towards entrepreneurship than the United States and Canada but is more entrepreneurial than Japan or South Korea, the world’s leading R&D investors. According to the Global Entrepreneurship Monitor in 2013, the percentage of European adults who considered entrepreneurship an interesting career path and who thought about starting a business in the next three years was broadly similar to the share in Canada and the United States. However, less than 5 percent of Europeans actually committed resources to a new business, compared with 8 percent of Canadians and 9 percent of Americans. Consequently, less than 10 percent of Europeans surveyed currently owned and managed a business, compared with 13 percent of Canadians and 11 percent of US adults. Ibid. The estimate of concentration in large companies is based on data for 14 European OECD countries. Internet matters: The Net’s sweeping impact on growth, jobs, and prosperity, McKinsey Global Institute, May 2011. 27 28 42 McKinsey Global Institute 2.
Reform—much of it national—can deliver growth . One factor that appears to be deterring Europeans from being entrepreneurs is fear that their business might fail—39 percent of Europeans who perceive good opportunities to start a business fear that they will fail, compared with 35 percent of Canadians and 31 percent of US citizens.29 Strict bankruptcy requirements probably contribute to this sentiment. While US bankruptcy rules discharge the affected party from debts in less than a year and Canadian rules in a maximum of two years, repayment obligations in Europe range from one year in the United Kingdom to three years in Belgium, six years in Germany, and more than nine years in France.30 15–20% of respondents in OECD survey cited finance access problems as bar to entrepreneurship Lack of access to finance is another hurdle deterring more Europeans from owning their own businesses, and expanding when they do. An OECD survey conducted in 2012 found that 15 to 20 percent of respondents cited difficulties accessing finance as the main reason that they could not envisage themselves being self-employed within the next five years.31 Moreover, since the global economic crisis in 2008, it has become more difficult for young companies to secure later-stage venture-capital funding once they have become established. In 2013, only around €4 billion of venture capital was raised, compared with €8.2 billion in 2007. The situation is most difficult for companies after the seed stage. Only about 40 percent of the companies that received seed or start-up capital in 2013 also received later-stage venture funding, compared with 70 percent before the crisis.32 Government agencies have tried to compensate for the decline of European venture capital—and today provide one-third of all venture finance—but have not been able to fully offset it.33 European companies can also do more to embrace the digital technologies that are increasingly crucial for success in an ever-more-connected world in which more and more consumers prefer buying and selling and browsing online, which cuts costs and saves time. Companies need to prioritise which areas to digitise, taking into account the perspective of their customers (or citizens in the case of governments), underpinned by future-proofed IT architecture.34 Europe lags behind the United States on private investment, especially in technology-heavy sectors (Exhibit 30).
This has translated into dramatically different outcomes between the United States and Europe. The United States has produced far and away more companies with a market capitalisation of greater than $1 billion over the past 20 years, even accounting for its relative size. The largest US tech companies are also disproportionally bigger than those of any other nations.
This may be attributable in part to much higher levels of venturecapital and growth-stage funding, a type of funding that is particularly applicable for tech start-ups. This type of funding is equivalent to 0.31 percent of GDP in the United States compared with less than 0.1 percent in most European countries. There are some reasons for optimism in Europe, however.
Existing entities such as the European Investment Fund can be leveraged to encourage innovation and entrepreneurship across Europe. This fund is a major venture capital and innovation investor in Europe, with around €3 billion in subscribed capital by the end of 2013. In addition, other innovative new financing options are emerging.
For instance, the Banque publique d'investissement, or BPI, a development bank in France, aims to finance and stimulate growth in SMEs by providing soft loans for innovation, guarantees and risk-sharing in support of bank financing, and private equity José Ernesto Amorós and Niels Bosma, Global Entrepreneurship Monitor 2013 global report: Fifteen years of assessing entrepreneurship across the globe, Global Entrepreneurship Research Association, 2014. 30 European Commission Judicial Network. 31 Entrepreneurship at a glance 2013, OECD, July 2013. 32 See Enhancing Europe’s competitiveness: Fostering innovation-driven entrepreneurship in Europe, World Economic Forum, June 2014. 33 European Private Equity Activity Data 2007–2013, European Venture Capital Association. 34 McKinsey & Company Digital Practice. Also see Global flows in a digital age: How trade, finance, people, and data connect the world economy, McKinsey Global Institute, April 2014. 29 McKinsey Global Institute A window of opportunity for Europe 43 . investments, along with co-financing loans and partnerships with commercial banks and other financial institutions. To close the competitiveness gap with the United States in the technology sector, Europe needs more of this kind of large-scale public co-financing of risk capital for new ventures. Exhibit 30 Europe needs to step up procurement and financing of innovation R&D spending by type and area1 % of GDP US R&D spending 2.6 Public gap 0 Private tech gap -0.7 Private other gap 0.2 Europe R&D spending 2.0 Companies founded in past 20 years with market capitalisation greater than $1 billion Companies per million people Peak market valuation of largest Internet company by country $ billion United States United States Germany 1.28 0.06 410 China 200 Israel United Kingdom 13 10 Sweden United States Sweden United Kingdom Germany 0.31 0.09 0.06 0.03 7 Germany Venture capital and growth investments % of GDP, 2012 7 Potential initiatives â–ª Emulate the funding model of the French development bank Banque publique d'investissement, or BPI. The bank aims to finance and stimulate growth of SMEs â–ª Deepen the Single Market and set Europe-wide standards and regulations for transformational technologies â–ª Adopt EU-level procurement of innovative e-government, health care, security, and education solutions on the order of 1% of GDP 1 Defined as private R&D spend in the pharmaceuticals and biotech, technology hardware and equipment, and software and computer services sectors. NOTE: Numbers may not sum due to rounding. SOURCE: The Economist, July 2014; McKinsey Global Institute analysis 44 McKinsey Global Institute 2. Reform—much of it national—can deliver growth . 16 days on average to start company in Central and Eastern Europe vs. 3 in Australia Regulation plays a part in the disparity between Europe and other regions, too. Take, for example, how many days it takes to start a business. In Australia, it takes three days; in the United States, six. But it takes 14 days on average in Continental European countries and 16 days in Central and Eastern European ones.
The process is quickest in the Baltic and Nordic countries, but even there, starting a business takes seven days on average. Moreover, regulatory burdens often increase sharply as microenterprises grow into SMEs. Once a company in France employs more than 49 people, it needs to comply with six additional types of social regulation and two additional accounting regulations, including a requirement to establish work councils with labour union delegates as well as health and safety committees. In 2005, France had more than 1,600 non-agricultural retailers with 49 employees, but only 680 companies with 50 employees. A similar picture can be found in manufacturing with 310 companies employing 49 employees vs.
160 companies employing 50.35 In Italy, a large number of businesses do not grow past 14 employees, since Article 18 of the country’s “workers’ statute” places a range of obligations on companies employing 15 people or more. “Smart” regulation can, however, encourage companies to accelerate the development of innovative products. Since the early 1990s, many OECD countries have introduced a combination of voluntary standards and compulsory requirements to promote improvements in the energy efficiency and environmental performance of products, from washing machines and refrigerators to lighting and information and communications technology (ICT) equipment. Sceptics of such reforms claimed that such measures would impose significant costs on producers and drive prices up for only marginal performance gains.
On the contrary, by driving innovation through a balanced mix of regulatory measures, these policies led to efficiency gains of 10 to 60 percent across a range of products, alongside real price declines of 10 to 45 percent.36 Scaling up new businesses from microenterprises into larger companies is challenging in Europe. While the continent is home to many microenterprises with fewer than ten employees, only a fraction of these are successful in building up their size. Europe has four microcompanies for every 100 people in the population compared with 3.5 in the United States.
Most of these microenterprises operate in retail, hospitality, and other low-growth industries. In stark contrast, the United States has 1.1 companies with more than ten employees per 100 people compared with only 0.4 in Europe.37 Testament to the dominance of long-established, rather than entrepreneurial, businesses, more than one-third of Europe’s largest companies today were founded in the 19th century (Exhibit 31).38 Nila Ceci-Renaud and Paul-Antoine Chevalier, “L’impact des seuils de 10, 20 et 50 salariés sur la taille des entreprises françaises”, Économie et statistique, number 437, March 2011; and Luis Garicano, Claire LeLarge, and John Van Reenen, Firm size distortions and the productivity distribution: Evidence from France, NBER working paper number 18841, February 2013. 36 Jacques Pelkmans and Andrea Renda, “Does EU regulation hinder or stimulate innovation?” Regulatory Policy, Centre for European Policy Studies special report number 96, November 2014; Mark Ellis, Experience with energy efficiency regulations for electrical equipment, OECD/International Energy Agency, August 2007. 37 Entrepreneurship at a glance 2013, OECD, July 2013. 38 Capital IQ, Breugel, and MGI analysis of the 480 largest European companies by revenue. 35 McKinsey Global Institute A window of opportunity for Europe 45 . Exhibit 31 Large companies in Europe are, on average, older than those in the United States Number of large companies by founding date1 Top 1,000 US and European companies by revenue as of August 11, 2014 United States Before 1800 6 1801–25 6 12 1851–75 1976–2014 -8 -41 52 -39 45 89 1951–75 +27 59 67 84 1926–50 +3 57 93 1901–25 +9 19 30 1876–1900 +6 15 16 1826–50 Europe vs. United States Europe -38 51 189 110 -79 1 Top 1,000 US and European companies by revenue. SOURCE: Capital IQ; Breugel; McKinsey Global Institute analysis Initiatives to change the game A set of policies to nurture innovation could accelerate overall European GDP growth by 0.26 percent a year. This estimate is based on historic correlations between R&D expenditure and growth in total factor productivity for the richest 15 European countries, and assumes that this set of countries increase R&D expenditure to the same level as the United States.39 This estimate of the potential impact on GDP growth is likely to be somewhat conservative as the returns to innovation grow in today’s less wealthy European economies where additional R&D spending is vital if they are to attain the per capita GDP levels of the wealthiest European economies. Policies to nurture innovation could accelerate overall European GDP growth by 0.26 percent a year. 39 46 Using a 65-country sample panel for 1965 to 2005, Claudio Bravo-Ortega and Álvaro Garcia estimated that a 10 percent increase in R&D per capita generates an average increase in total factor productivity (TFP) of around 1.6 percent. Due to the large gap in per capita R&D expenditure between the United States and most European countries, these coefficients imply that reaching US R&D levels in the richest 15 European countries would increase overall European TFP growth by 1.2 percent per year over the next decade. If all Europe-30 economies matched US per capita spending on R&D, their aggregate GDP growth could be as high as 1.7 percent.
If the Europe-30 matched South Korean R&D spending, incremental GDP growth would be 0.3 percent. See Claudio Bravo-Ortega and Álvaro Garcia, “R&D and productivity: A two way avenue?” World Development, volume 39, issue 7, July 2011. McKinsey Global Institute 2. Reform—much of it national—can deliver growth .
Governments can be effective in stimulating innovation across the innovation value chain from the initial development of new ideas to their commercialisation and adoption. While much of the focus has been on incentivising innovation at its source—through R&D subsidies—there is increasing recognition that interventions further down the value chain can be at least as effective, if not more so.40 Among the imperatives that we see as most important are the following: ƒƒ Deepen the Single Market. European governments can help to spur overall adoption by widening and deepening the market for innovative products. Many European policy makers, including the European Commission, have argued that completing the Single Market is one of the most powerful levers to promote innovation in Europe.
Doing so would not only expand the customer base for innovative products but also promote innovation spillovers between companies and entrepreneurs.41 ƒƒ Set Europe-wide standards and regulations for transformational technologies such as Industry 4.0. Beyond dismantling the barriers to a fully integrated European Single Market, policy makers could be proactive in their use of pan-European standards and regulations to make the market for innovative technologies both more predictable and more integrated. Such standards and regulations will have the most impact in industries with significant scale economies, including network effects, or where the production process is capital-intensive as it is in the manufacture of autonomous vehicles.
Previous MGI research has identified 12 transformational—or disruptive— technologies that governments could promote more than they do now.42 For example, the Internet of Things—the embedding of sensors in physical objects—could be advanced through European technology standards to enable interoperability between sensors and computers. In the transport sector, for instance, EU countries have already agreed on common standards for communication between cars and traffic infrastructure in certain areas. Further standards are needed to increase road efficiency, safety, and the environmental sustainability of driving.
For instance, European policy makers could consider putting in place a common legislative and regulatory framework that would govern autonomous vehicles. Individual countries are already pioneering change in this area. In the absence of EU legislation or standards, the United Kingdom is contemplating enacting a legal framework to allow the testing and deployment of autonomous vehicles on public roads.43 ƒƒ Gear public procurement spending, including defence spending, towards supporting innovation.
European governments spend at least 5 percent of GDP on procurement compared with only 0.7 percent on public R&D and 0.1 percent on subsidies for private-sector R&D. Public procurement can therefore be a potent tool for incentivising innovation. However, opportunities to use procurement to drive innovation are not always fully realised for a number of reasons.
Incentives are often not aligned, with procurers tending to favour low-cost, low-risk solutions even if greater long-term benefits can be derived by testing and procuring new technologies. The public authorities responsible for purchasing often lack in-depth knowledge of the new technologies available, while overly complex procurement procedures can be discouraging, particularly to SMEs.44 Demand-side innovation policies, OECD, May 2011. Simon Tilford and Philip Whyte, eds., Innovation: How Europe can take off, Centre for European Reform, July 2011. 42 Disruptive technologies: Advances that will transform life, business, and the global economy, McKinsey Global Institute, May 2013. 43 Chandrika Nath, Autonomous road vehicles, Houses of Parliament PostNote number 443, September 2013, amended April 2014. 44 Jacques Pelkmans and Andrea Renda, “Does EU regulation hinder or stimulate innovation?” Regulatory Policy, Centre for European Policy Studies special report number 96, November 2014. 40 41 McKinsey Global Institute A window of opportunity for Europe 47 . Despite these challenges, several European governments have already shown how public procurement can be used to further innovation in areas where society faces challenges, including the ageing of the population and the degradation of the environment, and in public services such as health care and transport.45 In Belgium, for instance, through the Flemish pre-commercial procurement initiative, public entities procure R&D services before launching conventional open tenders for the final procurement of the resulting product or services. Projects that have emerged from this approach include a digital book platform for public libraries and an eye screener to detect amblyopia among children.46 Another example is the Nordic Lighthouse Project on Public Procurement and Health Care, through which the five Nordic countries hold joint cross-border public tenders with public health-care providers for innovative solutions in this sector. Projects that have come to fruition as part of this scheme include PVC-free blood bags and “intelligent” hospital beds.47 The City of Vienna’s online platform for procurement, “WienWin”, connects local innovators with procurement officials in the city’s government and public services. The procurement officers act as pilot customers who can refer successful products to private-sector buyers.
Projects that have been developed using this approach include resource-efficient street lights and water-saving drip irrigation for public gardens.48 >€5B One way to bridge the gap in private-sector investment in R&D is through tax incentives, increasingly in use in OECD economies. For example, France’s Crédit d’impot recherche (CIR) offers a tax break amounting to a 30 percent refund of R&D expenses on the first €100 million invested and a 5 percent refund beyond that. France refunded more than €5 billion through this mechanism in 2012.
Although the majority flowed to large corporations, 29 percent of this funding benefited SMEs. refunded through French tax incentives in 2012 In the United States, the most prevalent form of innovation-promoting public procurement is in the defence sector. Between 1974 and 1995, for instance, the US Department of Defense invested approximately $10 billion in the Global Positioning System.49 GPS was first made available for civilian aircraft and quickly found other uses in consumer and business applications. Thanks to open GPS data, entire new industries in GPS and mapping services have developed, including surveying, automotive navigation, and precision agriculture.
In 2013, revenue from Global Navigation Satellite Systems totalled about €50 billion. Location-based services on smartphones are beginning to overtake automotive navigation systems as the largest market segment in terms of revenue.50 Defence spending in Europe is much lower than in the United States. In 2012, the 27 members of the European Defence Agency spent €190 billion, or 1.5 percent of GDP, on defence; the equivalent number for the United States was €500 billion ($645 billion), 4.4 percent of GDP.
Within this overall defence budget, defence procurement in Europe is still an important lever for procuring innovation. European countries could increase their effectiveness in this regard by creating an open and competitive single market in defence.51 Andrea Petrella, Fostering innovation through public procurement: Rationale, implementation and best practice in Italy and Europe, Bank of Italy Regional Economic Research Department, 2013; Demand-side innovation policies, OECD, May 2011. 46 Innovatief Aanbesteden. 47 Norden.org. 48 WienWin.at. 49 Scott Pace et al., The Global Positioning System, Rand Corporation, 1995. 50 GNSS Market Report, October 2013. 51 The 27 members of the European Defence Agency are the 28 EU member states except Denmark. See Ian Bond, The EU and defence procurement, Centre for European Reform, January 2014. 45 48 McKinsey Global Institute 2.
Reform—much of it national—can deliver growth . ƒƒ Unblock the barriers to entrepreneurship and accept “creative disruption” across sectors. The United Kingdom offers many aspects of best practice on promoting entrepreneurship in Europe. It is attracting entrepreneurial talent from overseas by offering a “start-up” visa for immigrants. The personal risks associated with entrepreneurship are much lower than in other countries; repayment obligations under bankruptcy last only one year (compared with France’s nine to ten years, as we have noted).
Moreover, the United Kingdom has facilitated access to seed and growth finance for entrepreneurs, putting in place a seed enterprise investment scheme that provides tax breaks to early-stage investors and relaxing the barriers to stock exchange listings. Similar measures to promote entrepreneurship have been suggested and debated across the continent. If European policy makers want to promote entrepreneurship, however, it is essential that an underlying issue be resolved. Joseph Schumpeter famously argued that the emergence of innovative firms is inseparably intertwined with the decline of uncompetitive incumbents—a process known as creative destruction.52 Some 65 years later, recent experience suggests that many European policy makers are still reluctant to accept creative destruction.
An example of this discomfort includes the attempt to ban Uber travel-sharing services in Germany and many other countries. Such barriers to entry by new players need to be lowered if entrepreneurship is to flourish in Europe. 2,500 data sets open in United Kingdom in 2009 and 10,000 in 2013 ƒƒ Establish standards and platforms for open data in the private as well as the public sector. Open government data is already providing significant opportunities for innovation and new business ideas.53 The United States pioneered open data by making weather and GPS data freely available, spurring the development of navigation systems, weather newscasts, location-based applications, precision farming tools, and other applications. An executive order in 2013 required that the new default for government information is to be open and machine-readable except where this would jeopardise privacy, confidentiality, or national security.54 The United Kingdom established an Open Government Data initiative in 2009 and is pioneering the publishing of data on a full range of maps, land ownership, census, government budget and spending, company registers, legislation, public transport, international trade, health care, education, crime, environment, and election results.
In 2009, 2,500 data sets were open; by 2013, this tally had grown to 10,000. The next horizon is for governments to establish standards and platforms in collaboration with the private sector to provide open access to anonymised private-sector data sets. One idea would be to introduce the concept of “data patents”—the right of companies to keep proprietary data to themselves for a number of years with a requirement to subsequently make them publicly available in an anonymised and machine-readable format. There is already growing interest among companies in publishing their data for purposes of open innovation. In 2006, for example, the video streaming company Netflix published more than 100 million anonymised user ratings and launched a competition for the best predictive algorithm for these ratings, leading to a more than 10 percent improvement in its predictions.55 Simon Tilford and Philip Whyte, eds., Innovation: How Europe can take off, Centre for European Reform, July 2011. 53 Open data: Unlocking innovation and performance with liquid information, McKinsey Global Institute, October 2013. 54 Executive order: Making open and machine readable the new default for government information, US White House, May 9, 2013. 55 www.netflixprize.com. 52 McKinsey Global Institute A window of opportunity for Europe 49 .
ƒƒ Embrace digitisation across the public and private sectors. Digitisation is reshaping the rules of competition in the private sector with many well-established incumbents at risk of being left behind in the face of competition from digitally savvy and nimble new entrants. Digital technologies are a powerful tool for lowering barriers to market entry across sectors and regions. Digitally enabled new players can scale up rapidly at a lower cost than those companies or organisations with legacy technologies, and enjoy higher returns as network effects accelerate.56 Digitising on a large scale in both the public and private sectors will be a crucial part of any efforts to boost European innovation.
In the private sector, digitisation drives innovation by enabling new business or operating models such as rapid product design and testing or smarter customer service. It also enables superior management decisions through the use of algorithms to crunch big data from social technologies, freeing up resources to focus on more creative efforts. Companies should take full advantage of the opportunities offered by digital sales channels to reduce costs, increase efficiency, and offer broader access to new markets.57 Digitisation in the public sector is very important for similar reasons. Customers and citizens increasingly demand easy-to-use digital services when they interact with public agencies.
Embracing digitisation in the public sector can also boost performance and productivity by minimising inefficient work, and freeing up resources. Most companies—and governments—recognise the power of digital technologies, but embedding these fully will require coordination. The first step is to ensure that businesses, governments, and citizens have reliable access to high-speed Internet. Second, there will be a need for more training to establish a “digital-first” attitude and provide the advanced skills required to take advantage of these technologies. In many European countries (as in other regions) the share of “knowledge” workers is rising—they need to be fully equipped.
European countries can measure their progress on digitisation using metrics such as the European Commission’s Digital Economy and Society Index, which scores countries on various dimensions of digital performance. Martin Hirt and Paul Wilmott, “Strategic principles for competing in the digital age”, McKinsey Quarterly, May 2014. 57 European Commission Digital Agenda, Digital Economy and Society Index. 56 50 McKinsey Global Institute 2. Reform—much of it national—can deliver growth . 2. EFFECTIVE EDUCATION TO EMPLOYMENT Improving education to employment could add 0.24 percentage points to Europe's annual GDP growth Education is a foundation of labour productivity. There are many pockets of excellence in Europe’s education systems, but there are also parts of the region where the provision and quality of education is not equipping young people well enough with the skills they need in the 21st-century economy. Seventy-four percent of educators say they are adequately preparing graduates for the workforce, but only 35 percent of employers and 38 percent of students say the same.
Meanwhile, we estimate the supply-demand balance for workers with tertiary education will move from a rough balance in 2010 to a shortage of 16 million workers in 2020. Fortunately, many highly effective education systems within Europe— in Finland and the Netherlands, for instance—can provide inspiration and examples to other countries. Among the measures European leaders could consider are increasing transparency about what skills are needed and jobs are available, dual-apprenticeship models, revamping the selection and training of teachers, measurement and evaluation of schools, and putting in place forums to facilitate dialogue between employers and educators.
Such approaches could increase Europe’s annual GDP growth by 0.24 percentage points. Where Europe stands Greater educational attainment serves as a shield against unemployment for young people. Unemployment has hit all segments of young people since the economic downturn, particularly those with lower educational attainment (Exhibit 32). Unemployment in Europe among people aged 15 to 24 has historically been higher than in other developed regions, but it has soared since the global economic crisis of 2008. The average youth unemployment rate in OECD economies increased from 12.0 percent in 2007 to 16.3 percent in 2012.
In the EU, the rate jumped from 16.5 percent to 25.1 percent over the same period. This statistic may convey an overly optimistic view of the situation because it does not reflect the number of young people who are so-called NEETs—not in employment, education, or training. In 2011, Europe had 5.2 million unemployed young people and 7.5 million NEETs. Factoring in underemployment—the percentage of part-time workers who want full-time opportunities—paints an even more challenging picture. Over the past half-decade, the share of young underemployed workers has increased from 7 percent to 9 percent.
The biggest increase was in Southern Europe, where the number of young underemployed nearly doubled from 11 percent to 21 percent. Underemployment is high, around 12 percent, even in the United Kingdom and Ireland and in the Nordics, two of the betterperforming regions in Europe on youth unemployment. The importance of education is demonstrated by the fact that individuals with a tertiary education have fared better than those who are less educated across Europe. Even regions that suffered the brunt of recent economic stresses, such as Southern Europe and Central and Eastern Europe, have experienced lower rates of youth unemployment among tertiaryeducated workers. McKinsey Global Institute A window of opportunity for Europe 51 .
Exhibit 32 Youth unemployment rates are extremely high in some parts of Europe, particularly among individuals with low educational attainment Youth unemployment by educational attainment, 2013 Unemployment rates by highest level of education attained, youths aged 15–24 years, % Primary/lower secondary Upper secondary/postsecondary 37 Tertiary 27 19 14 12 20 13 19 26 25 Nordics United Kingdom and Ireland 36 23 13 12 Continental Europe 52 44 Baltics 35 40 Central and Eastern Europe Southern Europe SOURCE: Eurostat; McKinsey Global Institute analysis 4M surplus in Europe's tertiary-educated workers in 2010, vs. 16M shortage in 2020 By 2020, Europe is expected to have a surfeit of people with a secondary education but a shortage of graduates with a tertiary education (Exhibit 33).58 Based on trends in GDP and productivity growth, we estimate the supply-demand mismatch for tertiary-educated workers will deteriorate from a surplus of four million in 2010 to a shortage of 16 million in 2020. Europe’s prime working-age population (conventionally defined as aged 15 to 64) is projected to fall by 4 percent by 2030 as a result of lower fertility. Current rates of tertiaryeducation attainment are not sufficient to provide the boost to labour productivity needed to sustain economic growth as populations age. Tertiary-education attainment among 30- to 34-year-olds varies from 22 percent in Italy to 53 percent in Ireland, and the variability in educational test scores is high across the continent.
This suggests considerable scope for some parts of Europe to catch up. However, educational attainment can go only so far to protect people from the vagaries of a difficult labour market. In Southern Europe and Central and Eastern Europe, graduates with a tertiary education are experiencing greater rates of unemployment than workers with only a primary education in Continental Europe and the United Kingdom and Ireland. Educational attainment has to be twinned with the skills that today’s companies need. In a recent McKinsey survey, employers specify a lack of skills as the most common reason for entry-level vacancies.
This sentiment is particularly strong among employers from countries with high youth unemployment rates. In Greece, 33 percent of employers could not find We use the same projection methodology as in The world at work: Jobs, pay, and skills for 3.5 billion people, McKinsey Global Institute, June 2012. 58 52 McKinsey Global Institute 2. Reform—much of it national—can deliver growth .
a candidate for an entry-level position because there was nobody with the right skills; in contrast, the share of employers citing this issue in Sweden was 21 percent.59 Exhibit 33 By 2020, Europe will have too few individuals with a tertiary education to meet labour-market demand Labour supply-demand mismatch: Comparison of projected labour demand and supply Million workers Tertiary Upper secondary/post-secondary 2010A Primary/lower secondary 2020E Gap 257 Million workers Gap %1 47 +4 +9 170 +30 +17 34 40 +7 +16 Demand Supply 216 42 140 Million workers %1 55 -16 +22 144 173 +29 +17 36 30 -6 -16 Demand Supply 259 252 71 1 Gaps are percentage of demand for shortages, and percentage of supply for surpluses. NOTE: Numbers may not sum due to rounding. SOURCE: United Nations Population Division (2010 revision); International Institute for Applied Systems Analysis; ILO; IHS; consensus estimates for GDP; national sources for the United States and France; McKinsey Global Institute analysis Europe’s high share of small businesses amplifies the importance of effective skills training. Across the continent, 37 percent of employees work for businesses with fewer than 20 people. It is noteworthy that those European regions with higher shares of small businesses also have higher levels of youth unemployment. This reflects the fact that most small businesses do not possess the resources that large companies have to provide training to smooth the gap between the skills that prospective employees have and the skills they need. If we group businesses by their satisfaction with the skills of their employees and their willingness to train new hires, business with fewer than 50 employees are overrepresented in the least satisfied group, accounting for 61 percent of that group.
Conversely, small businesses are most under-represented in the group that is proactive in improving the skills of the workforce, making up 44 percent of companies of that group (despite accounting for 50 percent of all companies) compared with 32 percent of large businesses, which account for 27 percent of all companies. McKinsey surveyed 5,300 young people, 2,600 employers, and 700 education providers from eight EU countries (France, Germany, Greece, Italy, Portugal, Spain, Sweden, and the United Kingdom). See Education to employment: Getting Europe’s youth into work, McKinsey Center for Government, January 2014. 59 McKinsey Global Institute A window of opportunity for Europe 53 . What is driving these trends? Preparedness for work depends on five components of effective education: childhood preparation, access to education, choice of study, provideremployer communication, and quality of education provided. ƒƒ Childhood preparation. How well a child is prepared at school for the world of work has an impact on the child’s employment prospects over the long term and is the foundation of economy-wide skills and productivity. The evidence shows that additional preschool early-childhood education has a dramatic effect on performance later in life.60 The Progress in International Reading Literacy Study of fourth-graders shows that reading achievement increases significantly with the length of early-childhood care.61 This effect is particularly pronounced for disadvantaged students. Even at the secondary school level, performance in mathematics, science, and reading of 15-year-old students measured by the Programme for International Student Assessment (PISA) improves by the equivalent of almost one full year of formal schooling if a child has participated in an early-childhood programme.62 Despite the proven benefits of preschool learning, particularly among children under three years of age, participation in such programmes in Europe is relatively low.
Participation has risen from 85.9 percent in 2001 to 92.9 percent in 2011, but still only 30 percent of children under three have received any kind of education. Underpreparedness continues at later stages of education for European children. In comparison with the OECD average, only countries in Continental Europe outperform on mathematics, reading, and science measured by PISA.
Most regions outperform the OECD average on science, but Southern Europe and Central and Eastern Europe have gaps across the board. 30% of Europeans not enrolling in postsecondary education cited costs ƒƒ Access to education. Perceived and real barriers to access to education are still present in Europe, especially at the tertiary level. While most European countries offer many postsecondary programmes at little or no cost, students still identify affordability as the main barrier to enrolling in these courses.
Of those young people who did not enrol in postsecondary education, 30 percent claimed that they could not afford it. While tuition costs are low across Europe, living expenses and the cost of materials such as books can act as a barrier for students, particularly those from a low-income background. Perhaps even more importantly, the opportunity costs of tertiary education can be prohibitive for such students. Of the young people who embark on a postsecondary education, one-quarter do not complete their programme because they could not afford to forgo the earnings from working. ƒƒ Choice of study.
What students choose to study has an impact on the skills mismatches that are leading to skills shortages in the labour market. Highly educated people whose skills are not in demand among employers can find themselves unemployed upon graduation, and those who do find a job in a field that does not match their qualifications tend to be less productive. In many cases, there is a lack of sufficient advice for students about the academic disciplines or skills that are most in demand among employers. Only 24 percent receive sufficient information on what fields to study.
This situation is compounded by the fact that many educational systems require choosing subjects at an early age, before students have sufficient information to know which subjects are likely to be most useful. Broadly, across all levels of educational attainment, unemployment is lowest in science, engineering, and health-care professions. Vocational students on the Key data on early childhood education and care in Europe, 2014 edition, Eurydice and Eurostat report, European Commission, 2004. 61 The Progress in International Reading Literacy Study is an international comparative study of the reading literacy of young students.
It studies the reading achievement and reading behaviour and attitudes of fourth-grade students in the United States and students in the equivalent of fourth grade in other participating countries. 62 The Programme for International Student Assessment is a worldwide study by OECD in member and nonmember nations of the performance of 15-year-old students on mathematics, science, and reading. The first study was in 2000, and it is repeated every three years. 60 54 McKinsey Global Institute 2. Reform—much of it national—can deliver growth .
whole have more success in finding employment, but only 44 percent of students who would have preferred to study a vocational field in their postsecondary education do so against 82 percent of students who preferred an academic discipline. Students see strong benefits in vocational education, but only one-third think that such an education is most valued by society. Only ƒƒ Provider-employer communication. Those who provide education and training need to communicate more effectively and more often with employers so that students emerge with the tools they need to find work. Perceptions diverge significantly.
In a McKinsey Center for Government survey, 74 percent of educators said that they were adequately preparing graduates for the workforce. However, only 35 percent of employers and 38 percent of students thought that this was the case (Exhibit 34). Employers need to tell educators what skills they need, and educators need to give their graduates the tools that will enable them to meet these requirements.63 Even in Germany and Sweden, which have some of the lowest rates of youth unemployment in Europe, only 43 percent and 33 percent of employers, respectively, agree that new hires are adequately prepared. 33% of employers in Sweden say new hires are adequately prepared Exhibit 34 Education providers typically have a more favourable view of the preparedness of graduates for work than employers and young people do Respondents who agree that graduates/new hires are adequately prepared % Employers1 Youth2 Education providers3 83 61 36 40 United Kingdom 79 69 43 40 50 42 39 23 26 Germany Spain Greece 74 72 33 Italy 48 42 22 Sweden 80 73 27 33 France 74 33 35 38 Portugal Europe 1 Overall, the entry-level employees we hired in the past year have been adequately prepared by their pre-hire education and/or training. 2 Overall, I think I was adequately prepared for an entry-level position in my chosen career field. 3 Overall, graduates from my institution are adequately prepared for entry-level positions in their chosen field of study. SOURCE: Education to employment: Getting Europe’s youth into work, McKinsey Center for Government, January 2014; McKinsey Global Institute analysis ƒƒ Quality of education. The overall quality of education affects all four other components, and European countries tend to lag behind other developed economies in this respect. The 2013 Survey of Adult Skills by the OECD revealed that only the working-age populations in the Nordic region and the Netherlands match the OECD average in numeracy, problem solving, and literacy.
Particular weaknesses persist in Southern Europe, Ireland, and Poland, which underperform on all three. In the case of digital literacy, Europe performs well with the exception of Central and Eastern Europe, where Education to employment: Getting Europe’s youth into work, McKinsey Center for Government, January 2014. 63 McKinsey Global Institute A window of opportunity for Europe 55 . a survey by the ECDL Foundation showed a lower share of digitally literate respondents than the survey average.64 Initiatives to change the game The initiatives on which we have focused are those that can deliver change within the next ten years that immediately help to address high youth unemployment rates and also set the foundation for future productivity growth by addressing gaps in education quality. If Europe improves the education of its workforce on the five dimensions we have discussed, the region’s annual GDP growth could increase by 0.24 percentage points. Of this, around 0.09 percent would come from reaching Europe 2020 targets for the share of tertiary graduates.65 A reduction of half of the gap with best practice on the mismatch between educational attainment and occupations—known as a vertical mismatch—would drive an additional 0.07 percent of GDP, reflecting productivity gains.66 The final 0.07 percent could be realised by reducing the share of NEETs from the current level of 12.2 percent to 8.9 percent (an aggregate of national targets).67 Lowering the share of NEETs would raise output from the incremental earnings, taxes, and social contributions provided by the newly employed members of the workforce. Our analysis suggests the following priorities: ƒƒ Establish dedicated schemes for matching youth to employment, and increase transparency about the labour market and career choices. For the many young people looking for work in Europe today, long-term, fundamental reform of education-toemployment systems will take too long to come to fruition.
However, there are examples within Europe of approaches that can help young people to adjust to the demands of the labour market in the relative short term. Since 2013, Finland’s Youth Guarantee has guaranteed all people under 25 years of age and all graduates under 30 years of age access to a job, training, or education within three months of declaring themselves unemployed. Public employment services work with participants on three steps: creating a personal development plan; carrying out a needs assessment; and identifying and undertaking whichever of the three options—job, training, or education—is deemed most appropriate.
Organised as a public-private partnership, the programme has ensured that all stakeholders are involved in a national working group. The success of this programme proves that well-crafted solutions can be effective even in the very short term. Of the 37,023 unemployed young people identified, 93 percent created job-seeking plans, and 72 percent found work or enrolled in training.
The programme has also proved cost-effective. Total annual costs for the scheme are approximately €114 million, against an estimated overall cost to society of youth unemployment of €300 million. Students cannot make optimal career choices without transparency about the labour market. A central repository of data on labour-market and education outcomes organised by youth employment integrators would achieve this aim.
The United Kingdom already provides a successful model of such a system. The National Careers Service was launched in the United Kingdom in 2011 as a three-channel delivery system to Digital literacy report—2009, ECDL Foundation, 2009. The ECDL (European Computer Driving Licence) Foundation survey of 8,000 people in 15 countries determined their self-perceived digital literacy and confidence level with different IT tasks, and posed actual questions that test IT skill level. 65 The GDP impact is based on the productivity elasticity of tertiary-education attainment and the correlation between total factor productivity growth and GDP growth.
See Dawn Holland et al., The relationship between graduates and economic growth across countries, Bank for International Settlements research paper number 110, August 2013. 66 The output elasticity of the short-run, country-specific reduction in vertical mismatch comes from António Morgado et al., Measuring labour mismatch in Europe, CEFAGE-UE working paper number 2014/13, Center for Advanced Studies in Management and Economics, Universidade de Évora, 2014. 67 The output impact is based on annual country-specific resource costs calculated in Massimiliano Mascherini et al., NEETs: Young people not in employment, education or training: Characteristics, costs and policy responses in Europe, Eurofound, October 2012. 64 56 McKinsey Global Institute 2. Reform—much of it national—can deliver growth . improve the effectiveness of the labour market by giving people information about the labour market, provide tools to job seekers to assess their preparedness for work, and develop an action plan. The website had in excess of seven million visitors in its first year of operation, and the UK government reported that of more than 10,000 people entering work or learning every month, more than half credited the programme. 70% of Swiss youth complete apprenticeship ƒƒ Develop a flexible dual-apprenticeship model. Another useful approach would be to put in place a flexible apprenticeship system to boost the credibility of vocational tracks and, at the same time, ensure that students acquire the skills that employers value. Apprenticeship programmes are a powerful tool for addressing youth unemployment (Exhibit 35). Countries with vocational education training programmes, including Germany and Austria, weathered the recent downturn relatively well with a youth unemployment rate of approximately 9 percent in 2010.
Ten other comparable countries in Western Europe had an average youth unemployment rate of 25 percent in that year. Switzerland, with its low youth unemployment rate, can provide a model for a strong apprenticeship programme. Not only is the apprenticeship programme an integral part of the educational system—70 percent of Swiss youth complete such programmes—but it also provides rigorous qualifications through more than 400 federal vocational exams. It also provides flexibility by enabling students to switch between vocational education and academic pathways.
The Swiss Confederation, cantons, and professional organisations work together to develop training standards and ensure that students have sufficient apprenticeship opportunities. Exhibit 35 Apprenticeship systems are a powerful way to address youth unemployment in Europe Youth (ages 15–24) unemployment and enrolment in apprenticeship programmes, 2010 % Nordics Continental Europe United Kingdom and Ireland Southern Europe Baltics Central and Eastern Europe Other Youth unemployment rate 45 Spain 40 35 Estonia Ireland 30 25 Poland 20 Belgium 15 Hungary France Finland Luxembourg Israel 10 Czech Republic Iceland Norway Denmark Austria Netherlands Germany 5 0 5 10 15 20 25 30 35 40 45 50 Enrolment in apprenticeship programmes1 1 Percentage of age cohort; six countries with zero enrolment not shown. SOURCE: OECD; McKinsey Global Institute analysis McKinsey Global Institute A window of opportunity for Europe 57 . ƒƒ Revamp the selection and training process for teachers. It will be difficult for Europe to develop a best-in-class education system without good teachers. The top-performing educational systems in Europe—in Finland, England, and the Netherlands—make recruiting the best talent to the teaching profession a top priority. England has raised starting conditions for teachers through the Training and Development Agency for Schools, a group that uses lessons from marketing in the private sector to develop dynamic recruitment strategies that adapt their message to better match top motivating factors.
The Netherlands has attracted higher-quality candidates by shortening the time it takes to reach the top of the salary schedule from 26 years to 18 years, and by raising the starting salary for teachers in line with the private sector (although this move has been curtailed by temporary salary freezes since 2010). In addition to attracting better candidates, school systems must make sure that they make the right hiring decisions since the effects of their choices can persist in the system for decades. Finland ensures that it brings in the best teachers through an extensive selection process that includes a multiple-choice national screening test, group work to assess communication and interpersonal skills, and interviews to see whether applicants are inspired to teach. The country also sets strict teaching qualifications that require all teachers, including kindergarten and preschool teachers, to hold a master’s degree.68 ƒƒ Proactively measure school performance on a defined set of metrics and intervene with targeted programmes where outcome gaps are identified. Diagnosing and reversing underperformance as quickly as possible requires comprehensive measurement.
The best school systems in Europe use a two-pronged monitoring approach of examination and independent school review, complemented by specialised one-on-one instruction. England has an independent inspectorate that is directly accountable to Parliament, which reviews schools on process and outcome indicators. Failure to improve gives the local authorities the right to replace school leadership.
The separation between driving and measuring outcomes reduces conflict of interest and boosts the objectivity of assessment. Once gaps in students’ achievement have been identified through regular and comparable examination, they should be addressed proactively through individually tailored instruction. In this vein, Finland has de-stigmatised special education by ensuring that a high proportion (28 percent) of students make use of some form of educational support, and also by occasionally sending the best students to participate in special education sessions.69 ƒƒ Stimulate dialogue between employers and educational providers.
Fostering communication between employers and providers can help to ensure that students are not the victims of poor communication between the two sides. Such forums could enable the establishment of agreed educational standards that meet the needs of employers, and ensure that curricula can be carried out by providers. Existing panEuropean mechanisms such as the Bologna and Copenhagen processes offer an effective platform through which this initiative can be executed.
These processes involve a formal set of meetings and agreements among European countries aimed at harmonising standards of higher education and vocational education, respectively. Incorporating the proposed forums into these established processes would be an effective way to get the forums up and running. Additional metrics on the frequency and effectiveness of this communication, tracked by each country and reported through these platforms, would help to assess the continent’s progress and adjust course if necessary. Michela Braga, Daniele Checchi, and Elena Meschi, Institutional reforms and educational attainment in Europe: A long run perspective, Institute for the Study of Labor (IZA) discussion paper number 6190, December 2011. 69 How the world’s best-performing school systems come out on top, McKinsey on Society survey, September 2007; Special education 2013: Share of students having received special support diminished, Statistics Finland, June 2014. 68 58 McKinsey Global Institute 2. Reform—much of it national—can deliver growth .
3. PRODUCTIVE INFRASTRUCTURE INVESTMENT Infrastructure is the connective tissue of an economy, and there is strong evidence linking productive infrastructure spending and economic growth.70 Without adequate spending, countries whose infrastructure is inadequate risk falling further behind and leading countries can quickly slip down the rankings. We estimate that European investment in transport, power, water, and telecoms infrastructure over the past ten years has been between 0.3 percent and 0.9 percent of GDP lower than needed to support the growth rates to which Europeans aspire. Net public investment has declined since the crisis and turned negative in several economies including Germany. However, simply increasing investment in infrastructure is not enough—particularly during a time of fiscal constraint.
Spending on infrastructure needs to be as productive as possible. Previous MGI research found that as much as 40 percent could be saved on countries’ infrastructure bills if they applied global best practice on project selection, delivery, asset management, governance, and finance.71 Even neighbouring European countries score very differently on these dimensions, suggesting ample opportunity to learn from each other. Europe should consider conducting a comprehensive infrastructure productivity assessment, take an integrated view of project selection, streamline the delivery of projects, improve the utilisation of existing infrastructure through pricing and the use of technology, and explore funding options outside general taxation. Stepping up European annual infrastructure delivery by the equivalent of 0.9 percent of GDP additional spending could boost Europe’s annual GDP growth by 0.14 percentage points, assuming an economic rate of return on additional infrastructure stock of 20 percent and ignoring demand-side effects. Only 4 Baltic and Central and Eastern European countries make world top 40 on infrastructure quality Where Europe stands The quality of Europe’s infrastructure quality compares well overall with that of other developed economies, according to the WEF’s index of infrastructure quality.72 Across all types of infrastructure, Europe performs in line with Canada and the United States.
Looking at regions within Europe, Continental Europe performs comparably with Japan despite that country’s high levels of investment over recent decades. However, although European countries are disproportionately represented in the top 20 of the WEF index, some countries have an opportunity to rise up the rankings. The Baltics and Central and Eastern Europe lag well behind other European regions.
Of the 11 countries in those two regions, only four—the Czech Republic, Estonia, Latvia, and Slovenia—make the top 40 in the world on infrastructure quality. While the quality of telecoms and water infrastructure in those regions is in line with the rest of Europe, transport infrastructure such as roads, rail, and ports has some way to catch up. In general, infrastructure quality has a strong positive correlation with per capita income (and the causation goes both ways). Nevertheless, some countries can outperform given their level of income while others fail to reach the level of infrastructure quality expected based on the stage of their economic development.
Within Southern Europe, for instance, Portugal outperforms Greece, and Spain outperforms Italy—despite similar levels of income (Exhibit 36). Even regions with generally higher infrastructure quality such as Continental Europe show significant variation. Switzerland has the highest-quality infrastructure in Continental Europe with a WEF score of 6.6, compared with a score of 5.8 in Belgium. Among the Nordics, Norway’s infrastructure quality overall is lower than one might expect for such a high-income country, largely due to the country’s underperforming transport infrastructure, particularly roads. World economic outlook: Legacies, clouds, uncertainties, IMF, October 2014. Infrastructure productivity: How to save $1 trillion a year, McKinsey Global Institute and the McKinsey Infrastructure Practice, January 2013. 72 Global competitiveness report 2014–2015, World Economic Forum, September 2014. 70 71 McKinsey Global Institute A window of opportunity for Europe 59 .
Exhibit 36 The quality of infrastructure varies widely at each income level Nordics Continental Europe United Kingdom and Ireland Southern Europe Baltics Central and Eastern Europe Infrastructure quality, 2014 WEF score 7.0 Switzerland 6.5 Finland Spain 5.5 5.0 Hungary Czech Estonia Republic Latvia Croatia Lithuania Malta 4.5 4.0 Poland Austria Germany France Portugal 6.0 Luxembourg Denmark Belgium Sweden Cyprus United Kingdom Slovenia Greece Netherlands Norway Ireland Italy Slovakia Romania Bulgaria 3.5 8.4 8.6 8.8 9.0 9.2 9.4 9.6 9.8 10.0 10.2 10.4 10.6 10.8 11.0 11.2 11.4 Income, 2012 Log GDP per capita, purchasing power parity SOURCE: WEF; Eurostat; World Bank; McKinsey Global Institute analysis The high overall quality of Europe’s infrastructure masks a worrying trend of considerable underinvestment. Left unaddressed, this would be likely to constrain the growth potential of many of the region’s economies. We base our analysis of investment needs on a crosscountry methodology that mostly reflects economic growth but also takes into account infrastructure stock and depreciation.73 While we recognise that the investment needs of any specific country depend on a more complex set of conditions including, for example, geography, demographics, efficiency of spending, or economic development priorities, this top-down methodology has proven effective in providing an indication of spending gaps or overinvestment. Europe would require infrastructure spending of 3.5% of GDP per year We find that, with the exception of Central and Eastern Europe, and Southern Europe, the continent did not spend a sufficient percentage of GDP on infrastructure in the 2000s (Exhibit 37). Between 2002 and 2011, Europe spent an average 2.6 percent of GDP per year, a level that would have been appropriate for an economy growing at 1.2 percent per annum in real terms.
This level of infrastructure spending is clearly insufficient to support Europe’s aspirations for future growth. The gap between required spending, based on an IHS forecast of 1.7 percent annual GDP growth in the Europe-30 to 2030, and actual spending was 0.3 percent of GDP in 2011. If Europe were to achieve a higher growth rate of 73 60 For details, see Infrastructure productivity: How to save $1 trillion a year, McKinsey Global Institute and the McKinsey Infrastructure Practice, January 2013. McKinsey Global Institute 2.
Reform—much of it national—can deliver growth . 2.5 percent per annum through the implementation of the growth drivers discussed in this report, this gap would widen further to 0.9 percent. To support higher future growth rates, Europe would require infrastructure spending of 3.5 percent of GDP per year. Exhibit 37 In most of Europe, infrastructure spending has fallen below the levels required to keep pace with expected GDP growth Historical aggregate infrastructure spending % of GDP Continental Europe Southern Europe Central and Eastern Europe United Kingdom and Ireland Nordics Europe-30 Expected future spending requirement vs. historical spending % of GDP, regionally weighted by GDP Historical average, 2002–11 Projected need (1.7% p.a. real GDP growth to 2030) Projected need (2.5% p.a. real GDP growth scenario) 4.5 Europe-30 2.6 2.9 3.5 4.0 3.5 3.0 United Kingdom and Ireland 2.5 Nordics 2.0 Continental Europe 3.7 Central and Eastern Europe 1.5 2002 03 04 05 06 07 08 09 10 2011 Southern Europe 3.7 2.3 3.4 2.3 3.0 2.3 2.8 3.1 2.6 NOTE: IHS forecast of 1.7% real GDP growth per annum for the Europe-30 to 2030; 2.5% figure based on assumption of implementing growth drivers. SOURCE: Eurostat; World Bank; McKinsey Global Institute analysis Beyond the general shortfall of spending levels in much of the continent, we discern variation in patterns of infrastructure investment within Europe.
We have grouped the economies into a number of archetypes determined by a country’s infrastructure quality relative to its per capita GDP, as well as its average annual infrastructure investment relative to its need (Exhibit 38).74 Three countries—Austria, the Czech Republic, and Denmark—fall into a zone where spending and quality have been about as expected given the countries’ degree of development and historical speed of growth. Eight countries—including Poland, Sweden, and the United Kingdom—have infrastructure that is below the expected quality and have not invested sufficiently to make up the gap. This suggests that these countries should assess carefully whether they need to take measures to avoid falling behind.
Four countries—Belgium, Finland, France, and Germany—have infrastructure that exceeds the quality expected for their per capita income but have recently invested less than expected. This may put their advantageous position at risk in future years. Another four countries— Hungary, Portugal, Spain, and Switzerland—have above-average infrastructure quality for With respect to the latter dimension, we compare each country’s average spending in 2002 to 2011 with its historical GDP-growth rate in the same period, rather than with a projected future growth rate. 74 McKinsey Global Institute A window of opportunity for Europe 61 . their income levels and high levels of infrastructure investment for their growth rates. Finally, Greece and Italy combine high recent infrastructure spending with quality that lags behind the level that would be expected given their incomes. This raises questions about why their high spending has not translated into improving infrastructure quality. Exhibit 38 MGI has analysed countries by their infrastructure spending characteristics Nordics Continental Europe United Kingdom and Ireland Southern Europe Baltics Central and Eastern Europe Infrastructure quality gap, 2014 Delta between actual WEF index and predicted value1 1.2 Portugal 1.0 â–ª Quality exceeds wealth-expected levels â–ª Recently investing below levels expected to support growth 0.8 â–ª Quality exceeds Finland 0.6 France Belgium Czech Republic wealth-expected levels â–ª Recently investing below levels expected to support growth Hungary Denmark â–ª Quality lags behind Romania wealth-expected levels â–ª Recently investing Slovakia Poland Ireland -0.8 above levels needed to support growth Greece Bulgaria -0.6 â–ª Recently investing United Kingdom -0.2 Sweden -0.4 Austria Germany 0 â–ª Quality lags behind Switzerland 0.4 0.2 wealth-expected levels Spain above levels needed to support growth Italy -1.0 -1.2 Norway -1.4 -0.8 -0.6 -0.4 -0.2 0 0.2 0.4 0.6 0.8 1.6 1.8 Spending gap, 2002–11 Delta between average spend (public and private) and estimated need in the same period2,3 1 Calculated as difference between actual WEF index and predicted value given per capita GDP on a purchasing power parity basis. 2 Spending requirement to maintain average infrastructure stock of 70 percent of GDP given 2.5 percent per annum depreciation and GDP growth 2002–11. 3 Several countries excluded from analysis due to incomplete data. SOURCE: WEF; Eurostat; McKinsey Global Institute analysis Differences in the quality of infrastructure within Europe are caused by different practices and conditions that affect all stages of a typical project development life cycle. Productive infrastructure investments are typically underpinned by fact-based project selection, streamlined delivery, effective management and utilisation of existing infrastructure, strong governance and capabilities, and a robust funding and finance framework. It is evident that high spending alone does not guarantee good infrastructure.
Where spending doesn’t lead to quality infrastructure, there tend to be shortcomings in the efficiency of procurement and delivery. Even among countries at a similar stage of economic development, differences in the cost of building infrastructure can be large (Exhibit 39). For example, the cost of building a road in the United Kingdom is about €10 million per kilometre 62 McKinsey Global Institute 2.
Reform—much of it national—can deliver growth . but in Germany is around 20 percent less. On the cost of materials, the United Kingdom consistently pays less than either France or Germany. In most advanced economies, labour productivity in the construction industry has stagnated or even fallen over the past two decades. There are many circumstantial explanations for such differences, but overall there is a large opportunity to optimise. Exhibit 39 Vast infrastructure cost differences within Europe demonstrate a significant opportunity to learn from best practice Cost benchmark Relative cost of road building Unit cost € million per kilometre Material costs United Kingdom 9.8 8.4 -21% 7.7 France Germany € per tonne (€ per m3 concrete) Steel rebar— high yield Structural steel 759 Ordinary cement 817 1,230 Concrete (20N/mm) Aggregate— all grades 93 105 1,314 1,425 1,101 65 202 1,121 58 140 190 n/a 12 19 99 166 30 System productivity Productivity changes, 1992–2009 Growth in construction labour productivity % Productivity, 2012 GDP per hour worked (all labour groups) € 45.2 26.0 36.9 44.3 Building labour costs (skilled labour) € per hour 16.9 42 12.2 19.2 16 6 2.3 -9.0 NOTE: Not to scale. SOURCE: Infrastructure UK, 2010; Gardiner and Theobald, 2011; OECD; McKinsey Global Institute analysis The five groups of countries that we have identified share characteristics that lead to lower or higher project delivery costs.
In 2012, on average, the group comprising Italy and Greece spent a median of 43 person-days per process in procurement compared with roughly 17 days for the central group of Austria, the Czech Republic, and Denmark. There is also significant variation in the composition of the construction sector. Less than 5 percent of construction employees in Italy and Greece work in firms with 250 or more employees; this McKinsey Global Institute A window of opportunity for Europe 63 .
share in the central group was 15 percent. While consolidated construction sectors are not uniformly associated with productive and high-quality infrastructure spending, a high degree of fragmentation in the sector is likely to obstruct economies of scale and to make it more difficult to coordinate complex projects, leading to lower productivity.75 There is scope to increase the productivity of capital investment by up to 40% Effective delivery systems are essential. However, in addition, countries need to be able to obtain adequate funding for projects, especially as the financial sector continues to adapt to a post-crisis regulatory environment. Countries in all five groups face further fiscal retrenchment by their public sectors, and in this difficult climate it will be easier for some to access finance than others.
The countries that have been systematically spending more in the past than expected to support growth could arguably reduce their spending in this area and focus their scarce fiscal capacity on more pressing priorities. The situation is more severe for those countries that have invested substantially but not achieved high-quality infrastructure. Their simultaneous challenge is to retrench on spending while designing a framework for infrastructure provision that ensures that the spending that is left is more productive.
Countries that have underinvested could be putting their competitiveness and growth potential at risk. For all countries, fiscal austerity and attempted publicsector deleveraging points to a need for governments to design a policy and governance framework that attracts additional private capital to help meet the infrastructure funding gap. Initiatives to change the game For Europe to deliver the societal and growth aspiration of its citizens would require an annual growth rate in excess of 2 percent, as we have discussed. A growth rate of 2.5 percent per annum to 2025 would require infrastructure spending to rise to 3.5 percent of GDP, an increase of 0.9 percent of GDP over current levels.
Such an increase would boost GDP growth by 0.14 percent annually. This assumes an economic rate of return on additional infrastructure stock of 20 percent. The impact of infrastructure investment may be greater due to short-term stimulus effects and may be enhanced by productivity improvements that stretch the value of each euro spent at all stages of project delivery. There is scope to increase the productivity of capital investment by up to 40 percent.76 Governments may choose to use those savings elsewhere rather than on additional infrastructure projects, and therefore we do not quantify this effect.
Our analysis suggests that the following measures would help Europe to meet its infrastructure imperative: ƒƒ Increase spending in countries currently underinvesting, and increase productivity of spend where overinvestment occurred. Our top-down methodology offers a first approximation of the gap between European infrastructure spending and the required level to support aspirational growth. All European countries could benefit from a detailed analysis of their current infrastructure situation to determine appropriate spending levels for the next ten years.
Many countries in the region, particularly those we have characterised as underinvesting, will likely find that they need to increase investment in infrastructure. Through such analysis, countries identified as having overspent should turn their attention to better prioritising projects and developing more efficient delivery systems. Although there are fiscal constraints in many European countries, in many respects this is a propitious moment to invest in infrastructure. Most European countries have historically low borrowing costs, and many have a long-overdue need for upgrades and improvements in transport infrastructure due to high traffic volumes.
Even Germany, which has high-quality transport infrastructure, is experiencing heavy congestion on 20 percent of its road network.77 In practice, these challenges can also be addressed through collaborative partnerships. See R. Beach, M. Webster, and K.
M. Campbell, “An evaluation of partnership development in the construction industry”, International Journal of Project Management, volume 23, issue 8, November 2005. 76 Infrastructure productivity: How to save $1 trillion a year, McKinsey Global Institute and the McKinsey Infrastructure Practice, January 2013. 77 Ibid. 75 64 McKinsey Global Institute 2. Reform—much of it national—can deliver growth .
ƒƒ Explore funding options outside the general tax budget. Fiscal constraints faced by many European countries require them to seek sources of funding outside of general taxation. Charging user fees for using infrastructure, as in congestion pricing on roads, can help pay for a project and optimise its use. Once user charges are in place, the private sector could be brought in to increase competition and as a source of additional finance.
Property-value capture, in which the public sector acquires land surrounding a project and then sells it at a profit when the project is completed, offers another promising avenue.78 Barcelona’s experience with property-value capture demonstrates its effectiveness. In 2001, the city re-designated four million square metres of land from industrial use for use by the services sector. This re-designation increased the value of the land, thereby giving local government increased leverage with private developers to help transform the area while also capturing value for the public.
The city exchanged a planning permit for 30 percent of land rights and a development fee of €80 per square metre of the land developed. This arrangement enabled the city to finance the project despite fiscal constraints at the national level. All the value captured was fed into the publicly owned 22@BCN company, which then allocated funds across social housing, green spaces, and advanced infrastructure such as transport, ICT networks, and heating and cooling systems.
This reinvestment approach created a virtuous cycle of value. The project’s success partly reflected up-front planning that ensured that the infrastructure built was attractive to businesses, including a central location and good transport links. The city has built 4,000 affordable housing units on the site and developed 114,000 square metres of green space and 145,000 square metres of public facilities, as well as installing fibre-optic cables, Wi-Fi networks, and modern waste-collection systems. The return to the developers is an estimated 6 to 7 percent per year, and the public value of the development is estimated at more than €1 billion for an initial outlay of only €180 million.79 ƒƒ Conduct comprehensive infrastructure productivity assessments. Countries can vary hugely on the money they spend on comparable infrastructure projects—even countries that have similar per capita incomes such as France, Germany, and the United Kingdom.
A McKinsey diagnostic of infrastructure productivity in two neighbouring European countries reveals not only that both countries have some way to go before achieving global leading practice but also that they can learn and improve significantly by looking at other countries in the region (Exhibit 40). A granular 360-degree diagnostic can show policy makers where the major gaps are that need rectifying, helping to boost the productivity of government infrastructure spending. €3.4B annual savings in UK infrastructure cost review ƒƒ Take an integrated view of project selection. One of the most powerful ways to reduce the overall cost of infrastructure is to avoid investing in projects that neither address clearly defined needs nor deliver sufficient benefits.
The United Kingdom has made impressive progress in improving its selection of infrastructure projects. In 2010, Infrastructure UK, a newly established entity within HM Treasury, published a National Infrastructure Plan that outlined priorities for allocating public spending in this area in a bid to increase transparency. It established an annual infrastructure cost review to encourage efficiency.
As a result of this framework, the government prioritised 40 projects out of a pipeline of around 250 that were deemed to encourage economic growth, enable a transition to a low-carbon economy, and be capable of attracting investment from the private sector. Across roads, rail, water, energy, and flood defences, in 2014 the United Kingdom achieved annual cost savings of £3.4 billion, 15 percent of a baseline of £22.3 billion.80 George E. Peterson, Unlocking land values to finance urban infrastructure, World Bank, 2009. Joe Huxley, Value capture finance: Making urban development pay its way, Urban Land Institute, 2009. 80 Infrastructure cost review, Infrastructure UK, July 2014. 78 79 McKinsey Global Institute A window of opportunity for Europe 65 .
Exhibit 40 An infrastructure diagnostic can enable more efficient spending Country A Robust funding and finance framework Country B Fact-based project selection Infrastructure strategy linked to socioeconomic objectives Effective approach to public-private partnerships Suitable regulation, pricing, and value capture investment Strong framework for long-term public funding Clear strategy for market competition and ownership Suitable conditions for private infrastructure finance Master planning coordinated across asset classes/ jurisdictions Prioritised optimisation of infrastructure before new build Fact-based and consistent project evaluation System-wide portfolio prioritisation Effective construction and supply market Strong value-assurance process Sufficient financial capacity Attractive overall investment climate Adequate owner team Concept, design, and engineering optimisation Robust infrastructure data Strong capabilities Seamless permitting and land acquisition Strong governance and collaboration Robust institutions and processes for combatting corruption Strong infrastructure governance and capabilities Effective procurement, tendering, and contracting Advanced procurement with synergies captured across projects Rigorous execution and contract management Total cost of ownership-oriented maintenance Increased asset utilisation and loss reduction Well-planned commissioning and ramp-up Well-defined approach to projects in distress Demand managed Making the most of existing infrastructure Streamlined delivery SOURCE: McKinsey Global Institute analysis ƒƒ Streamline delivery of infrastructure projects. Cost and time overruns can be avoided with smart planning. Tight management of contractors, cost-focused contracts, and the use of advanced construction techniques such as prefabrication can lead to potential savings of up to 15 percent.81 Sweden’s national transportation agency was able to use lean-manufacturing techniques and ways of optimising capital spending that helped to rationalise the costs of implementing infrastructure projects. Clearly defined ownership, flexible timelines, active management of planning reserves, optimised requirement and exemption management, and efficient production have led to reduction of both cost and timelines for almost all ongoing megaprojects. One example is the North Link, a 9.3 billion Swedish kroner road tunnel in Stockholm.
The tunnel opened in December 2014, a full year before schedule, and 2.6 billion Swedish kroner, or 22 percent, under budget. Applying similar approaches elsewhere led to a further cost reduction of around 20 percent that freed up funds for investment in road and rail projects. 81 66 Infrastructure productivity: How to save $1 trillion a year, McKinsey Global Institute and the McKinsey Infrastructure Practice, January 2013. McKinsey Global Institute 2. Reform—much of it national—can deliver growth .
ƒƒ Improve utilisation of existing infrastructure through pricing and technology use. Rather than invest in costly new projects, governments can often improve the quality of infrastructure and meet demand more cost-effectively by upgrading existing assets. Finland has done a great deal to improve use of existing infrastructure and reduce maintenance costs by deploying intelligent transport systems. Its aim is to use electronic operating models to improve the efficiency of transporting goods, targeting a 10 percent improvement in the productivity of the logistics sector. Finland is also developing a smart transport corridor across different modes of transport and using intelligent systems, including an information service on traffic incidents, to facilitate travel between Finland and Russia. These efforts have already yielded significant efficiency improvements.82 For example, systems offering weather information on roads and more efficient use of maintenance workers have saved an average of 23 minutes on each de-icing job.
In the capital, Helsinki, the installation of transit signal priority systems reduced the average journey time by 11 percent. Such improvements not only boost infrastructure productivity but are also cost-effective: benefit-to-cost ratios from improved traffic conditions range between 2 to 1 and 5 to 1. Although Finland’s implementation of these systems is not complete, they can serve as a model for other countries with heavy road use. “Smoother passenger traffic across the Finnish-Russian border”, press release, VTT Technical Research Centre of Finland, April 15, 2014. 82 McKinsey Global Institute A window of opportunity for Europe 67 .
4. REDUCED ENERGY BURDEN Energy—whether petroleum fuels, electricity, or the calories embodied in food—is one of the base ingredients of all economic activity.83 A divergence in energy prices with the United States in recent years has risked putting Europe at a competitive disadvantage in energy-intensive industries; the chemicals industry has already shifted a significant volume of investment abroad. At the same time, such industries generate a relatively small share of European output and can often be traded only regionally, mitigating global cost pressure. Higher energy prices may even aid a shift towards higher-value-added industries that are less energy-intensive.
Nevertheless—and despite the sharp fall in energy prices in late 2014—reducing Europe’s energy burden remains an important long-term economic issue. New sources of domestic supply should be explored, but the potential over the next ten years appears limited. Given this context, there is a broad imperative to use energy more productively—through efforts to boost efficiency, structural change in the composition of economies, and technological innovation.84 On this score, best practice already exists in Europe. Denmark, for instance, has successfully fostered energy efficiency through a concrete and coherent regulatory framework of energy-intensity standards.
Governments can also play an important role in accelerating progress towards a single European energy market and laying the foundation for long-term energy supply with a pan-European framework for new energy sources including renewables and, provided environmental concerns can be addressed, unconventional hydrocarbons. Progress on energy productivity and the single market alone could result in an annual uptick in GDP growth of 0.13 percent. 70% rise in household post-tax electricity prices 2004–13 Where Europe stands Between 2004 and 2013, European post-tax electricity prices for industry approximately doubled, while those for households rose by about 70 percent. In the same period, European natural gas prices increased by 160 percent.
This was a far greater increase than that observed in the United States, where large-scale exploitation of shale gas has helped to curtail price pressures (Exhibit 41).85 Both natural gas and electricity prices in the United States are now about half of European prices. The rising prices in Europe put pressure on the competitiveness of energy-intensive industries. Executives at the chemical giant BASF, for example, were widely cited in the media in 2014 saying that high electricity and feedstock prices were important factors behind the company’s decision to focus more of its €20 billion capital expenditure budget on Asia and the United States over the next five years, cutting investment in Europe from twothirds of its budget to just under half.86 Almost three times as many European households worry about rising energy prices as the number concerned about keeping up with mortgage or rent payments. This has resulted in 31 percent of respondents in 2014 planning energyefficiency changes compared with only 4 percent in 2012.87 Robert U.
Ayres and Benjamin Warr, “Accounting for growth: The role of physical work”, Structural Change and Economic Dynamics, volume 16, issue 2, June 2005. 84 For example, see Better growth, better climate: The new climate economy synthesis report, Global Commission on the Economy and Climate, September 2014, and Georg Zachmann and Valeria Cipollone, “Energy competitiveness”, in Manufacturing Europe’s future, Reinhilde Veugelers, ed., Bruegel Blueprint Series, volume XXI, 2013. 85 Despite some infrastructural bottlenecks and regulatory obstacles, crude oil and refined products have traded at generally similar price points in the United States and Europe due to the integrated global nature of these markets. 86 Chris Bryant, “BASF to focus investments outside Europe”, The Financial Times, February 25, 2014. 87 European home report 2014, Kingfisher, August 2014. 83 68 McKinsey Global Institute 2. Reform—much of it national—can deliver growth . Exhibit 41 European gas and electricity prices have diverged from those in the United States, putting pressure on industry and households US industry1 US households2 Europe industry1 Europe households2 Industry natural gas prices and US shale production 14 Natural gas prices $ per million BTU 12 10 8 -49 6 4 2 0 2004 US dry shale gas production Billion cubic feet per day 05 06 07 08 09 3 3 4 5 7 10 2004 05 06 07 08 09 10 15 11 22 12 13 28 31 10 11 12 13 10 11 12 2014 36 2014 2013 Household and industry electricity prices after tax $ per kilowatt-hour 0.30 0.25 0.20 0.15 0.10 0.05 0 2004 05 Average US 61 prices as % of European prices 06 07 08 09 49 44 1 US gas prices are Henry Hub; Europe gas prices are German border. 2 Weighted average of Europe-30 excluding Cyprus, Malta, and Norway in natural gas price due to data availability. SOURCE: German Federal Office for Economic Affairs and Export Control; Bloomberg; FACTS; US Energy Information Administration; Enerdata; McKinsey Global Institute analysis Energy supply The gas and power price differential between Europe and the United States partly reflects a regional supply-demand mismatch that has developed in recent years.88 Therefore, one way to reduce the economic burden of high energy costs would be through increased supply from domestic production or imports. However, expanding domestic energy production Howard Rogers, The impact of a globalising market on future European gas supply and pricing: The importance of Asian demand and North American supply, Oxford Institute for Energy Studies, January 2012. 88 McKinsey Global Institute A window of opportunity for Europe 69 . on a large enough scale to produce meaningful reductions in energy prices appears very difficult. United States drilled ~14X as many shale wells as Europe in 2002 Take shale gas, for example. Although shale resources are abundant in Europe, McKinsey experts expect domestically produced shale gas to meet only a small percentage of European gas demand by 2030—and at a higher price than in the United States. This reflects a combination of difficult geology, stringent regulations, an underdeveloped pipeline infrastructure, public opposition, and a rudimentary support-services sector. Even if Europe decided to intensify shale gas production, its current level of activity implies a very long ramp-up period.
By 2003, years before the “shale revolution” became a topic of household conversation, the United States had already drilled 127 shale wells per 1,000 square kilometres—approximately 14 times as many as Europe had in 2012 (Exhibit 42). What’s more, rather than growing at a rapid rate, shale exploration since 2011 has actually fallen by approximately 20 percent per year in critical European countries such as Poland and the United Kingdom. Exhibit 42 In shale gas exploration, Europe currently lags significantly behind the United States ten years before peak production Shale gas production Shale drilling activity Number of wells Estimated well density Wells drilled per 1,000 sq km 25–30x 14x 8.4 billion m3 United States (Barnett), 20031 Europe, 2013 = 0 30–40 Europe, 2013 973 United States (Barnett), 2003 9 Europe, 1983–2012 127 United States, 1973–2002 1 Gas production from the Barnett Shale basin peaked at 57 billion cubic metres per annum in 2011; therefore, 2003 data give an indication of the level of activity Europe would need to achieve to significantly expand production within ten years. SOURCE: Baker Hughes; McKinsey Global Institute analysis Other domestic energy sources also face significant headwinds. Germany, for example, has accelerated its phasing out of nuclear power.
Meanwhile, renewables are less subsidised than before as many European governments and consumers bristle at the legacy costs of past investments. In recent years, the Czech Republic and Spain have ended their feed-in tariffs for renewables. As an alternative to attempting to boost domestic supply, energy imports can help to reduce energy prices provided the transmission of resources is considered stable and predictable. Europe already imports a large share of its energy needs. In 2012, the EU procured 53 percent of its gross inland energy consumption from abroad, including 88 percent of its demand for crude oil and natural gas liquids, 66 percent of its natural gas demand, and 70 McKinsey Global Institute 2.
Reform—much of it national—can deliver growth . 62 percent of its hard coal demand.89 Even treating energy from Norway (not a member of the EU) as domestic supply, Europe remains highly reliant on imports, with dependency rates of 78 percent for crude oil and natural gas liquids and 45 percent for natural gas. Russia is the major supplier of all three types of energy and is a particularly critical partner for natural gas, accounting for 47 percent of extra-Europe-30 imports to the EU (Exhibit 43). Exhibit 43 The European Union relies heavily on energy imports EU-28, 2012 % Extra-Europe-30 origins of primary energy imports1 Final energy consumption by fuel Renewables 11 Nuclear Others 20 Nonrenewable waste Petroleum and 34 products 14 Qatar 12 United States 23 Nigeria 9 Algeria 20 Libya 9 Colombia 24 Solid fuels Others 34 Australia 7 1 Others 21 Saudi Arabia 10 17 23 Russia 26 Gas Hard coal Russia 47 Russia 38 Crude oil and NGLs2 Natural gas Dependency on extra-Europe-30 imports3 % 62 78 45 1 Intra-Europe-28 imports and imports from Norway not included. 2 Natural gas liquids. 3 Net imports (gross inland consumption plus bunkers); intra-Europe-28 imports and imports from Norway not included. SOURCE: European Commission; McKinsey Global Institute analysis In the face of many concerns about the security of Europe’s energy supplies, the European Commission has recommended supporting the development and expansion of infrastructure to allow for further increases in gas import volumes from Norway as well as from Central Asia, the Middle East, and North Africa. Complex geopolitics aside, any importbased strategy will be constrained by the situation in the global gas market. For instance, 89 McKinsey Global Institute Figures for EU-28. See European energy security strategy, European Commission, May 2014. A window of opportunity for Europe 71 .
in 2013 more than 80 percent of incremental liquefied natural gas (LNG) capacity under development around the world was already contracted to specific buyers, mostly in nonEuropean destinations.90 US LNG is often held up as a promising new opportunity. However, even if all US LNG exports expected in 2025 were directed to Europe, they would meet only 10 to 20 percent of European gas demand.91 In the case of coal, US exports to Europe more than doubled between 2000 and 2012. This had only a marginal impact on power prices but significant consequences for the EU’s 2020 carbon emissions targets. Energy transmission One way in which Europe could still significantly reduce its energy burden is by enhancing the efficiency and connectivity of its domestic energy market, which remains rather fragmented—a collection of national islands with only a few bridges between them. Spain’s LNG import terminals ran at around one-quarter capacity in 2013, partly due to depressed domestic demand and to a lack of interconnections with the rest of the continent.
By enhancing market efficiency and heightening competition, a single European energy market could reduce prices. For example, in the case of power, building and upgrading interconnectors such as those between France and Italy and between the Netherlands and Norway would yield the greatest gains due to large differences in price, supply, and demand.92 Some neighbouring European countries have significant variations in electricity prices. For example, in 2011, the average cost of electricity (excluding taxes) for industry in Italy was 20.73 US cents per kilowatt-hour compared with only 12.91 cents in Austria. Similarly, the cost for industry in Spain was 14.33 US cents per kilowatt-hour compared with 9.79 cents in France.
The significant variation in pre-tax electricity prices (when considering weighted household and industrial prices) between European countries that are close or even next to each other underlines the potential gains from closer integration (Exhibit 44). Capturing the full benefits of integration would require not only new infrastructural links across Europe but also more harmonisation of energy policies and regulation. Today, for instance, there are surcharges and taxes that contribute to the strong variation in prices paid by final energy consumers. For example, household- and industry-weighted average aftertax electricity prices in countries developing renewables such as Denmark and Germany are more than 50 percent greater than in France, which relies predominantly on nuclear power.
A more deeply integrated European energy market could also make efforts to foster renewable energy in Europe much more effective. Utility-scale photovoltaic (PV) solar is most efficient in parts of Southern Europe.93 However, in Germany, where solar PV is half as efficient, demand is stimulated through subsidies. A study for the European Parliament shows that, had German solar PV capacity been located in Spain, additional electricity worth €740 million would have been generated in 2011 alone.94 Medium-term gas market report 2013: Market trends and projections to 2018, International Energy Agency, June 2013. 91 “Figure MT-46: U.S.
exports of liquefied natural gas in five cases, 2005–40”, in Annual Energy Outlook 2014, US Energy Information Administration, April 2014. 92 ACER/CEER annual report on the results of monitoring the internal electricity and natural gas markets in 2011, Agency for the Cooperation of Energy Regulators and Council of European Energy Regulators, November 2012. 93 Photovoltaic Geographical Information System, European Commission, 2012. 94 Veit Böckers, Justus Haucap, and Ulrich Heimeshoff, Benefits of an integrated European electricity market, Düsseldorfer Institut für Wettberwerbsökonomie discussion paper number 109, September 2013. 90 72 McKinsey Global Institute 2. Reform—much of it national—can deliver growth . Exhibit 44 Variations in electricity prices within Europe demonstrate the potential gains possible from an integrated energy market Weighted average pre-tax electricity price of households and industry, 20111 Cents per kilowatt-hour >20¢ 15–20¢ 10–15¢ <10¢ 1 Malta excluded from analysis due to unavailability of data. SOURCE: Enerdata; McKinsey Global Institute analysis Europe's energy intensity is 129 tonnes of oil equivalent per $1 million in 2013, vs. 158 tonnes in United States Energy demand High energy prices—and constraints on the expansion of supply—need not necessarily impede European growth and competitiveness. High energy prices are primarily a concern for chemicals, steel, and other energy-intensive industries that are likely to have limited scope to reduce that intensity. However, energy-intensive industries, which we define as industries in which the share of energy in total value added exceeds 10 percent, generate only 7 percent of European total output. The comparable figure in the United States is 8 percent.
Many of the affected energy-intensive industries also tend to be regionally based for logistical reasons; this means that there is a limited threat that they will move their operations to other continents. There is scope to further reduce energy intensity in the European economy as a whole, and thereby reduce the burden of energy prices. A number of studies have demonstrated positive direct and indirect effects of energy efficiency on economic activity.95 Europe is already a global leader on energy efficiency. It has an energy intensity of 129 tonnes of oil equivalent per million US dollars of GDP in 2013.
This is a lower intensity than that of Australia and the United States, for instance, whose oil equivalents per million US dollars of GDP are 147 tonnes and 158 tonnes, respectively. Europe’s energy intensity is less than one-quarter that of China. Only Japan’s energy intensity, at 94 tonnes of oil equivalent per million US dollars of GDP, is lower.
Europe’s relatively low energy intensity means that the continent has been able to retain a share of energy costs in total output similar to that of the United States, despite gas and electricity prices that are nearly twice as high (Exhibit 45). Capturing the multiple benefits of energy efficiency, International Energy Agency, September 2014. 95 McKinsey Global Institute A window of opportunity for Europe 73 . Exhibit 45 Despite different energy costs, the share of energy input in economy-wide output is roughly the same across Europe and the United States Energy input share of total output, 20111 EU United States Share of energy in total output % 70 70 60 60 50 50 40 40 30 30 20 Share of energy input in total output = 4.96% 10 0 20 Share of energy input in total output = 4.63% 10 0 0 10 20 30 40 50 60 70 80 90 100 0 10 20 30 40 50 60 70 80 90 100 Output (value added) % 1 Includes the following inputs: coke, refined petroleum and nuclear fuel, mining and quarrying, and electricity, gas and water supply; excludes sales, maintenance, and repair of motor vehicles and motorcycles, and retail sales of fuel. Data are for 2011 for the Europe-30 excluding Croatia, Norway, and Switzerland. SOURCE: The World Input-Output database; McKinsey Global Institute analysis Industries in which energy plays a less important role in the generation of output can thrive and be internationally competitive even in an environment of high energy costs. A recent study found that countries facing high energy prices were successful at exporting products that required less energy to make, while creating more jobs and higher value added, than the goods exported by countries with lower energy prices.96 In a similar vein, a European Commission analysis of real unit energy costs found that the European manufacturing sector was maintaining its cost competitiveness by improving on energy intensity.97 There is an opportunity to leverage best practice across the continent in order to expand Europe’s leading position on energy intensity to all of its regions. The energy intensity of the Baltics and Central and Eastern Europe together stood at 267 tonnes of oil equivalent per million US dollars of GDP—1.4 times that of Continental Europe and 2.4 times that of the United Kingdom and Ireland, for instance.
The largest potential savings lie in the industry and household sectors, which consume about half of total energy and have the largest variations in energy intensity among countries (Exhibit 46). Georg Zachmann and Valeria Cipollone, “Energy competitiveness”, in Manufacturing Europe’s future, Reinhilde Veugelers, ed., Bruegel Blueprint Series, volume XXI, 2013. 97 Energy economic developments in Europe, European Commission, January 2014. 96 74 McKinsey Global Institute 2. Reform—much of it national—can deliver growth . Exhibit 46 Energy intensity can be reduced through improved energy efficiency, particularly in industry and among households Variation in energy intensity1 in Europe,2 2013 Tonnes of oil equivalent per million $ 2005 Nordics Continental Europe United Kingdom and Ireland Leaders3 Europe-30 Southern Europe Baltics Share in final energy consumption % Followers3 Transport 75 14 14 Switzerland United Kingdom 15 22 Denmark 42 Romania Croatia Bulgaria 136 23 23 26 Spain Portugal 27% 42 Households4 91 Central and Eastern Europe 25% 102 44 Switzerland Romania Poland Industry Bulgaria 315 167 24% 183 90 35 35 Switzerland United Kingdom 40 Denmark Romania Services4 52 10 United Kingdom 11 12 Switzerland Denmark Finland 60 Bulgaria 61 13% 20 Czech Republic Slovakia Bulgaria 1 Energy intensity of transport = transport energy use divided by GDP; energy intensity of households = climate-corrected household energy use divided by private consumption; energy intensity of industry (services) = industry (services) energy use divided by value added of industry (services). 2 Europe-30 except for households; Croatia, where energy-intensity data are not available, is not included. Data for Switzerland are for 2012. 3 Leaders and followers are the top and bottom three countries in terms of energy intensity in Europe-30 with populations of >5 million. 4 Climate-adjusted. SOURCE: Enerdata; Eurostat; McKinsey Global Institute analysis McKinsey Global Institute A window of opportunity for Europe 75 . Energy intensity within sectors in Europe varies widely. Laggards can be five times as energy-intensive as leaders. Of the four key sectors, the variation is greatest in industry. Denmark, Switzerland, and the United Kingdom have the most energy-efficient industrial sectors with energy intensities that are between four and nine times lower than in Bulgaria, Finland, and Romania, the most energy-intensive countries. This gap is due partly to the sector mix of these different economies.
In Bulgaria, Finland, and Romania, industries with high energy intensity, including steel, chemicals, non-metallic minerals, and paper, account for 70 to 80 percent of their total value added compared with 30 to 45 percent in best-practice countries. Yet improvements to energy intensity have often varied significantly across industries in these countries. Service sectors are far less energy-intensive than many industrial sectors. As Baltic and Central and Eastern European countries move along the usual development curve away from industry and towards services, energy intensity should naturally fall.
But this shift will take time. Today, industry (including construction) in these European regions accounts for almost 50 percent of their economies compared with only around 30 percent in the United Kingdom, for example.98 This means that, for now, energy prices are of greater concern for them. The share of energy input in economy-wide output is about 7 percent in the Baltics and Central and Eastern Europe compared with approximately 4 percent in the United Kingdom and Ireland.
Even within services, energy intensity can vary considerably. For example, the United Kingdom consumes ten tonnes of oil equivalent per million US dollars of value added in its services sectors—one-sixth the level in Slovakia. The transportation sector’s energy intensity is driven by a number of factors, including the share of road transport (accounting for 82 percent of total transport energy consumption in the EU), the efficiency of vehicles, and distances between hubs of economic activity. Continental Europe, the Nordics, and the United Kingdom and Ireland have the lowest transport energy intensity in Europe. In the Netherlands, strong tax incentives encouraging the adoption of efficient vehicles have been in place since 2006.
These include a bonuspenalty scheme that links the level of passenger car and motorcycle tax to carbon dioxide emissions per kilometre, as well as income tax incentives for efficient company cars. These measures have arguably contributed to the highest penetration of hybrid electric vehicles in Europe at 4.5 percent of car sales compared with 1 percent on average in the EU.99 The energy intensity of households in Europe is 44 tonnes of oil equivalent per million US dollars of private consumption largely due to high energy use in buildings in some European economies. Portugal, Spain, and Switzerland are Europe’s leaders in household energy efficiency (adjusted for differences in climate) with an energy intensity that is between 3.5 times and six times lower than that of households in Bulgaria, Poland, and Romania.
A key driver of energy efficiency among households is awareness of the costs of poor energy efficiency in the form of higher bills and of ways to tackle this. In economies in Central and Eastern Europe, policies aimed at increasing awareness and fostering energy efficiency in households have made progress, albeit only relatively recently. For instance, in 2009, the Czech Republic launched a scheme providing subsidies and grants for measures aimed at improving household energy efficiency.
Projects supported by the scheme included investments in home insulation, new construction that meets passive-energy house standards, and investments in heating equipment that relies on renewable sources of energy. In 2011, Poland required energy utilities to provide customers with comparisons of their electricity consumption with previous years, as well as with information on energyefficiency measures.100 Sector composition based on data from the CIA World Factbook. European vehicle market statistics 2013, International Council on Clean Transportation, October 2013. 100 Sara Pasquier and Aurelien Saussay, Progress implementing the IEA 25 energy efficiency policy recommendations: 2011 evaluation, International Energy Agency, March 2012. 98 99 76 McKinsey Global Institute 2. Reform—much of it national—can deliver growth .
Initiatives to change the game Between 2003 and 2013, the energy intensity in 30 European countries declined at an annual rate of 1.9 percent, and we believe progress on this front can continue. Further European progress on improving energy productivity and liberalising the gas and energy markets could result in an annual uptick in GDP growth of 0.13 percent. Among the imperatives that we see as most important are: 7.6% cut in energy consumption targeted by Denmark 2010–20 ƒƒ Use targets, standards, and fiscal policy to incentivise investment in energy productivity. While high energy prices are a major motivator for improving energy efficiency, government action is still necessary to address the many market failures and behavioural biases that undermine progress in this area.101 For example, investments in weatherised rental or leased properties don’t tend to happen because tenants, who pay the utility bills, would derive the benefit rather than the building owners. Similarly, consumers tend to buy cheaper but less energy-efficient appliances because it takes a relatively long time to reap the savings from the more energy-efficient choice.
In many cases, too, consumers don’t have the information they need to make the most sensible choice.102 Governments can address such issues in a variety of ways. Progressively higher energy-efficiency standards are a proven way to accelerate investments in energy efficiency. In Denmark, the government has set a target of reducing energy consumption by 7.6 percent between 2010 and 2020 through energy-efficiency measures.
From that overall target, regulations cascade down into each sector. Another way to promote energy efficiency is through fiscal policy. The EU’s Emissions Trading Scheme, which sets a price for carbon emissions, is, in effect, a tax on carbon-intensive energy use.
In the United States in 1977, then-President Jimmy Carter put forward a proposal known as the standby gas tax under which higher petrol taxes would be imposed every year that the United States failed to meet lower targets for petrol consumption, but with the income earned through the tax returned to citizens via income tax credits. The proposal was defeated in congressional committee. ƒƒ Accelerate progress towards a single European energy market. A Europe-wide energy market would promote competition and enable suppliers to achieve scale, thereby enhancing efficiency and reducing energy costs over the medium term.
The EU’s Third Energy Package recognised that initiatives were needed in a number of areas to make this happen. They include building numerous interconnectors between national energy markets, establishing a level playing field for domestic and international suppliers within individual countries, ensuring non-discriminatory access to transmission infrastructure, and allowing the resale of surplus energy purchases. While some progress has been made in this area, it has been largely incremental.
One step forward was the coupling of the electricity markets of the Czech Republic, Hungary, and Slovakia in 2012, which drove a convergence in power prices in these three economies. The fact that energy markets within Europe are designed differently is a constraint on market participants meeting demand from customers across the continent’s internal borders. Design differences within Europe include variations in price formation mechanisms such as gas-trading hubs and forward markets for electricity, and contractual structures like destination clauses that limit the trading of energy.103 A lack of infrastructure such as gas and power interconnectors among European economies makes trading across borders nearly impossible. In this regard, the EU’s Connecting Europe Facility—a €5.85 billion programme to build cross-border energy infrastructure—is an important start. Energy market report 2013: Market trends and medium-term prospects, International Energy Agency, 2013. Resource revolution: Meeting the world’s energy, materials, food, and water needs, McKinsey Global Institute, November 2011. 103 ACER/CEER annual report on the results of monitoring the internal electricity and natural gas markets in 2013, Agency for the Cooperation of Energy Regulators, October 2014. 101 102 McKinsey Global Institute A window of opportunity for Europe 77 .
Almost 30% of German electricity in 2014 from renewables ƒƒ Launch a cost-effective pan-European renewables and, provided environmental concerns can be addressed, unconventional oil and gas strategy. To enhance the security of supply and to foster industrial development, in recent years many European countries have provided incentives like feed-in tariffs to encourage the development of domestic production of renewable energy. Germany has taken this the furthest. In 2014, renewables accounted for almost 30 percent of German electricity production.104 The benefit of these schemes could be multiplied if they were to be rolled out Europe-wide and across many still-maturing technologies.
For example, subsidies for solar make more sense if they are directed towards the sunniest parts of Europe. Other frontier energy technologies could also be a target of assistance, including unconventional fossil fuels like shale gas and energy storage technologies. Shifting away from energy based on fossil fuels also reduces a country’s risk to future carbon regulations, or a rapid increase in the price of carbon dioxide, in the context of carbon markets. Bruno Burger, Electricity production from solar and wind in Germany in 2014, Fraunhofer ISE (Institute für Solare Energiesysteme), December 2014. 104 78 McKinsey Global Institute 2.
Reform—much of it national—can deliver growth . 5. SUPPORTING URBAN DEVELOPMENT Cities are the most dynamic centres of economic activity today. They create network effects, accentuate economies of scale in the provision of goods and services, enable more dynamic and flexible labour markets, and facilitate the transmission of knowledge and ideas. All of these boost productivity growth.105 Urbanisation and per capita GDP have moved in tandem for decades (Exhibit 47).106 Exhibit 47 Per capita GDP has risen in tandem with increases in the urbanisation rate Per capita GDP and urbanisation1 Per capita GDP2 1990 purchasing power parity $ (log scale) 30,000 Japan 2005 Germany 2005 Italy 2005 United States 2005 South Korea 2005 10,000 India 2005 3,000 China 2005 1950 1950 Brazil 2005 1820 1,000 1891 1930 1950 1920 1950 300 Increasing urbanisation rate % 1 Definition of urbanisation varies by country. 2 Historical per capita GDP series expressed in 1990 Geary-Khamis dollars, which reflect purchasing power parity. SOURCE: United Nations Population Division; Angus Maddison via Timetrics; IHS; census reports of England and Wales; Honda in Steckel and Floud,1997; Bairoch, 1975; McKinsey Global Institute analysis There is a large body of literature on urban economics focused on assessing the nature and size of urban economies of scale. See, for example, Edward L.
Glaeser and Joshua D. Gottlieb, The wealth of cities: Agglomeration economies and spatial equilibrium in the United States, NBER working paper number 14806, March 2009; World development report 2009: Reshaping economic geography, World Bank, December 2008; and Indermit S. Gill and Chor-Ching Goh, “Scale economies and cities”, World Bank Research Observer, volume 25, number 2, August 2010. 106 MGI has published extensively on urbanisation.
See Preparing for China’s urban billion, March 2009; India’s urban awakening: Building inclusive cities, sustaining economic growth, April 2010; Urban world: Mapping the economic power of cities, March 2011; Building globally competitive cities: The key to Latin American growth, August 2011; Urban America: US cities in the world economy, April 2012; Urban world: Cities and the rise of the consuming class, June 2012; and Urban world: The shifting global business landscape, October 2013. 105 McKinsey Global Institute A window of opportunity for Europe 79 . Europe is far less urbanised than either the United States or South Korea, for instance, and the share of people within Europe living in cities varies enormously. This suggests a considerable opportunity for some European economies to capture more of the economic benefits that urban living offers. While citizens should be free to choose where they want to live, and megacities (with populations of ten million or more) face particular challenges, there are barriers to rural-to-urban migration that should be removed, including high levels of support per capita in rural areas through the Common Agricultural Policy (CAP), high price-to-income ratios for housing, and low satisfaction with urban infrastructure. Europe can more broadly apply funding approaches such as property-value capture to support urban redevelopment, including affordable housing and the expansion of infrastructure, as Spain has done, and focus more on citizen-friendly provision of public services.
Cities that are experiencing significant emigration need to up their game in competing for talent at a European and even global level. Accelerating its rate of urbanisation to that of the Netherlands, the fastest urbanising country between 2000 and 2012, could generate an additional 0.09 percent of real GDP growth for Europe per annum. 30 percentage point difference between Europe's most and least urbanised regions Where Europe stands European cities started to grow and proliferate rapidly in the 18th century, but Europe’s urbanisation rate today still lags behind that of many other developed regions, and it varies enormously within the continent. According to recent data from the MGI Cityscope database, which uses a definition of urban areas derived from population density and travelto-work flows, only about 60 percent of Europe’s population can be classified as urban.107 This is well below the urbanisation rates in other developed economies, including South Korea at 87 percent, Japan at 82 percent, the United States at 81 percent, and Canada at 65 percent.
Within Europe, there is a difference of 30 percentage points between the most urbanised region (the United Kingdom and Ireland) and the least urbanised one (Central and Eastern Europe). These disparities clearly point to considerable scope for Europe to boost economic growth by stepping up the development of towns and cities, especially in regions that are still comparatively rural (Exhibit 48). Cityscope is a McKinsey Global Institute global database of more than 2,500 cities that brings together MGI research on cities. For a detailed explanation of the methodology used to define cities and map socioeconomic factors across regions, see Urban world: Cities and the rise of the consuming class, McKinsey Global Institute, June 2012. 107 80 McKinsey Global Institute 2.
Reform—much of it national—can deliver growth . Exhibit 48 There is significant scope to increase the urbanisation rate across Europe, particularly in Central and Eastern Europe and the Baltics Degree of urbanisation, 20121 % of population South Korea 87.1 81.7 Japan United States Canada 81.2 65.3 Absolute growth, 2000–122 % United Kingdom and Ireland 69.1 +2.7 Continental Europe 69.0 +2.5 Southern Europe Nordics Mexico Turkey 53.4 +2.2 +1.3 62.0 Baltics Europe-30 62.1 60.6 49.0 Central and Eastern Europe 44.4 39.0 -0.4 +0.3 1 Harmonised definition of urban areas on basis of population density and travel-to-work flows. 2 Absolute urbanisation growth calculated on the basis of UN urbanisation data (administrative definition of urban areas) and scaled to 2012 urbanisation rates based on MGI Cityscope database. SOURCE: MGI Cityscope database; Eurostat; United Nations Population Division; McKinsey Global Institute analysis McKinsey Global Institute A window of opportunity for Europe 81 . Over the past 15 years, however, Europe’s least urban countries, which are mostly located in Central and Eastern Europe and the Baltics, have not become significantly more urban; indeed, their rates of urbanisation have been static at best (Exhibit 49). Despite these countries’ low starting position on urbanisation, and even though some of their cities have experienced significant rises in per capita incomes, their urban areas have not managed to attract citizens in greater numbers. For example, Bulgaria’s capital city of Sofia and Romania’s capital city of Bucharest posted per capita GDP growth of more than 13 percentage points a year between 2000 and 2011, but their populations did not grow. Exhibit 49 Urbanisation in Central and Eastern Europe and the Baltics has been sluggish despite a low starting point in 2000 Size = Population, 2013 Nordics Continental Europe Urbanisation Compound annual growth rate, 2000–12, % United Kingdom and Ireland Southern Europe Baltics Central and Eastern Europe 1.3 1.2 Netherlands 1.1 Portugal 1.0 0.9 0.8 0.7 Hungary 0.6 United Kingdom Bulgaria 0.5 Ireland 0.4 Luxembourg Croatia Norway 0.3 0.2 Greece France Denmark Romania 0.1 0 Slovenia -0.1 Italy Lithuania Switzerland Czech Republic Belgium Austria Cyprus Estonia -0.3 Malta Germany Sweden Poland Latvia -0.2 Finland Spain Slovakia -0.4 20 25 30 35 40 45 50 55 60 65 70 Average urbanisation level, 2000 75 80 85 90 82 McKinsey Global Institute 2. Reform—much of it national—can deliver growth 100 Urbanisation rate, 20001 % 1 2000 urbanisation rates obtained by applying historic UN urbanisation growth rates to MGI Cityscope database urbanisation rate from 2012. SOURCE: United Nations; MGI Cityscope database; Eurostat; McKinsey Global Institute analysis 95 .
Rather than catching up with their more urbanised European peers, regions with relatively low urbanisation rates have experienced further declines in their city populations. For example, urbanisation rates decreased in seven countries in the Baltics and Central and Eastern Europe between 2000 and 2012. In some cases, including the Baltic countries and Poland, the decline in the urban population has outpaced the decline in their overall populations (Exhibit 50). Exhibit 50 Among countries whose populations have shrunk, only Hungary, Croatia, and Germany increased flows to cities Urbanisation trend decomposed by urban and total population growth Compound annual growth rate, 2000–12, % Population change -0.2 Hungary Growing urban population Positive urbanisation rate 0.4 -0.2 Croatia 0.1 -0.1 Germany Urban population shrinking at slower rate 0.1 -0.4 Romania -0.2 -0.7 Bulgaria -0.2 -0.1 Poland Negative urbanisation rate Urban population shrinking at faster pace -0.2 -0.3 Estonia -0.5 -0.9 Latvia Lithuania Urban population change -0.9 -1.0 -1.1 SOURCE: United Nations; McKinsey Global Institute analysis McKinsey Global Institute A window of opportunity for Europe 83 . Why are cities, especially in the Baltics and Central and Eastern Europe, not growing faster despite rising incomes that should, theoretically, attract workers looking for better jobs and a higher quality of life? Broadly speaking, there are “push” and “pull” factors that persuade migrants to move from rural to urban areas. An example of a push factor is a paucity of wellpaid jobs in the countryside; a pull factor is the promise of better public services in cities. In the case of Europe’s less urbanised regions, both types of factor come into play: ƒƒ Push factors. One of the factors limiting the migration of less productive rural workers to cities where incomes tend to be higher and job prospects arguably more promising is the existence of extensive subsidies for the rural economy.
These subsidies artificially enhance incomes in rural areas and therefore potentially discourage citizens from moving to more urbanised areas. The EU’s Common Agricultural Policy supports rural regions through direct payments to improve farmers’ incomes and subsidies to foster rural development. Despite the fact that agriculture accounts for only 5 percent of European jobs, the CAP commands 40 percent of the EU budget (approximately €60 billion in 2013, of which three-quarters was in the form of direct income subsidies to farmers).
These subsidies weaken the push towards urbanisation (Exhibit 51). CAP transfers are particularly large compared with rural per capita GDP in Bulgaria and other countries where urbanisation rates are lowest and where incentives to live and work in rural areas are least needed. Citizens in Greece and Latvia pay 12–14X annual income to buy a house vs. 5X in Ireland ƒƒ Pull factors. Cities can attract people from other areas by becoming more competitive. This is especially relevant for countries in the Schengen area, where cities no longer compete on a national scale but rather a Europe-wide scale.108 This may go some way towards explaining the declining urban populations of countries in the Baltics and Central and Eastern Europe.
Competitive cities tend to have a favourable regulatory environment for business, strong institutions, simple and transparent city-level policies, efficient infrastructure, and good-quality educational and training provision.109 These elements can attract both the businesses that provide jobs and the people who fill them. Affordable housing is another vital pull factor for cities. As analysed in detail in recent MGI research, a lack of decent housing as well as excessive costs for renting or acquiring it is an increasingly urgent social and economic problem around the world.110 Within the EU, an estimated 5 percent of the population faces severe housing deprivation (defined as living in overcrowded or substandard housing conditions), and many more are financially overstretched due to high housing costs. On this score, different locations within Europe vary enormously.
In terms of buying a house, affordability is a particularly pressing issue in Central and Eastern Europe as well as Southern European countries such as Greece and Italy (Exhibit 52). Citizens in these economies have to pay, on average, 12 to 14 times their annual income to buy a house, compared with five times in Ireland and six times in Germany or the Netherlands. In other countries, the affordability challenge is more concentrated in particular cities such as London or Paris, where newcomers often find it difficult to find housing that offers reasonable value for money. The Schengen Area comprises 26 European countries that have abolished passport and any other type of border control at their common borders, also referred to as internal borders. 109 The competitiveness of cities, World Economic Forum, August 2014. 110 A blueprint for addressing the global affordable housing challenge, McKinsey Global Institute, October 2014. 108 84 McKinsey Global Institute 2.
Reform—much of it national—can deliver growth . Cities whose populations are declining urgently need to respond to this trend by boosting their competitiveness. In order to drive growth in their urban economies, they will have to attract new inhabitants, not only from other cities but most importantly from rural areas in the same countries. The demographics of European rural areas underline the economic potential of spurring rural-to-urban migration. People of prime working age constitute a share of the total rural population very similar to that of urban areas (67 percent and 66 percent, respectively).
The performance of many European economies could be enhanced significantly if a greater share of working-age rural people moved to cities and into higher-productivity jobs, while still striking a productive balance between the deployment of labour in rural and urban areas. Exhibit 51 Common Agricultural Policy transfers per rural inhabitant are high in countries with low urbanisation rates Size = GDP, 2012 Nordics1 Continental Europe2 United Kingdom and Ireland Southern Europe3 Baltics Central and Eastern Europe4 Urbanisation rate, 2012 % 90 R-squared = 26.7% 85 Belgium 80 Netherlands 75 United Kingdom 70 65 Austria Germany Spain Cyprus 60 Italy Portugal France 55 Sweden 50 Slovenia 40 Greece Czech Republic Finland 45 Lithuania Denmark Poland Estonia Hungary Latvia 35 Slovakia 30 Bulgaria Ireland Romania 25 20 0 0.5 1.0 1.5 2.0 2.5 3.0 3.5 4.0 4.5 5.0 5.5 6.0 EU Common Agricultural Policy transfers, 2013 Percentage share of rural per capita GDP 1 2 3 4 Excluding Excluding Excluding Excluding Norway. Switzerland and Luxembourg. Malta. Croatia. SOURCE: European Commission; MGI Cityscope database; United Nations; McKinsey Global Institute analysis McKinsey Global Institute A window of opportunity for Europe 85 . Exhibit 52 Price-to-income ratios vary significantly within Europe, with ratios highest in the Baltics and Central and Eastern Europe Price-to-income ratio for housing , 2014 Nordics Continental Europe United Kingdom and Ireland Southern Europe Baltics Central and Eastern Europe Romania 13.8 13.5 Latvia 13.4 Croatia Malta 12.5 Greece 12.5 Italy 12.4 Lithuania 11.5 Estonia 10.8 10.5 Poland Bulgaria 10.0 Spain 9.9 Slovenia 9.9 Slovakia 9.3 France 9.3 9.0 Hungary 9.0 Czech Republic 8.5 Portugal 8.3 Austria 7.9 Norway United Kingdom 7.2 Luxembourg 7.1 Finland 7.0 Switzerland 7.0 Cyprus 6.8 Sweden 6.8 6.6 Belgium 6.4 Denmark Netherlands 6.1 Germany 6.1 5.5 Ireland SOURCE: Numbeo; McKinsey Global Institute analysis 86 McKinsey Global Institute 2. Reform—much of it national—can deliver growth . Initiatives to change the game If Europe acted to boost the rate of urbanisation across the region and, in particular, in the Baltics and Central and Eastern Europe, an additional 0.09 percent of real GDP growth per annum could be generated. This estimate assumes that all European countries accelerate the growth of their urban population to the rate of the fastest urbanising country between 2000 and 2012 (the Netherlands with 1.2 percent per year) while maintaining the difference in labour productivity between rural and urban areas. To make this happen, European governments should consider taking action in the following areas: ~80% of survey respondents in Luxembourg satisfied with public transport vs. 40% in Cyprus ƒƒ Enable urban redevelopment and expansion, supported by regulatory changes and property-value capture. For cities to attract people, they must have the capacity to support growth. Transport infrastructure—within cities, between city centres and suburbs, between cities, and between rural and urban areas—is a vital enabler for urban expansion.
When asked about their satisfaction levels with public transport, around 80 percent of respondents in Finland, Latvia, and Luxembourg said that they were satisfied, in contrast to the 45 to 50 percent of respondents in Cyprus and Italy who expressed the same view.111 Best-practice cities have been able to finance expansion of infrastructure through innovative funding mechanisms such as property-value capture, in which increases in the value of land near developments are used to fund projects. While urban development can boost the competitiveness of a city, projects often face regulatory barriers such as zoning restrictions that need to be tackled. In 1982, the government of the United Kingdom simplified the process for obtaining planning permission for ten years in order to redevelop derelict docklands to the east of London’s city centre. This led to the development of the Canary Wharf financial centre that today employs more than 100,000 people. Hamburg’s experience of building HafenCity, Europe’s largest development zone, offers a potential model for how to construct cost-effective infrastructure that enables highdensity development.
HafenCity Hamburg GmbH, a subsidiary of the Hamburg citystate government, planned and is managing the project that began in 2000 to reclaim 127 hectares in the former harbour areas near the city centre. It works closely with the private sector and the city-state government to review and approve projects, and revise the master plan according to macroeconomic conditions and feasibility reports. The project is not due for completion until 2025 but, even today, HafenCity has enlarged the city centre by 40 percent, created 45,000 jobs at 500 companies, and developed 6,000 homes.
HafenCity Hamburg GmbH has invested in streets, plazas, public transport systems, and the quay wall. By 2025, the company expects to break even and will subsequently pay taxes that will flow to the city-state. ƒƒ Develop affordable housing. Even if a city attracts employers and develops highquality infrastructure to support growth, people will not flock there if no affordable housing is available.
Cities can improve on this dimension by unlocking land supply, taking an industrial approach to development, building scale efficiency, and assisting in developer financing.112 For example, developers were able to sell half of the residential units in Barcelona’s La Marina development at one-third of market rates and still maintain a positive business proposition by increasing the 1.0 floor-area ratio to 2.3. By pooling demand, one consortium dedicated to buying social housing in the United Kingdom was able to reduce operations and maintenance costs in certain categories by 25 percent. Since such costs can account for 20 to 30 percent of annual housing expenditure, Europeans’ satisfaction with urban transport, Flash Eurobarometer 382b, European Commission, June 2014. A blueprint for solving the global affordable housing challenge, McKinsey Global Institute, September 2014. 111 112 McKinsey Global Institute A window of opportunity for Europe 87 . effective asset-management guidelines set by the government can improve the affordability of housing. ƒƒ Remove barriers to rural-urban migration and improve city attractiveness for talent. Europe can boost productivity by making sure that top talent goes to the right places. Given the trend of workers moving to more attractive cities within Europe that offer better prospects, it is imperative that governments remove barriers to both ruralurban migration and intercity migration. Existing incentive schemes such as the CAP tend to discourage rural workers from moving and artificially inflate the share of workers employed in agriculture and other less-productive industries.
Across Europe, there is a negative association between the amount of rural development support on offer on a per capita basis and the degree of urbanisation. This incentive to stay in rural areas poses a particular challenge in less-urbanised countries, where emigration to more competitive cities abroad depletes the urban workforce. To reverse this trend, regions such as the Baltics and Central and Eastern Europe should consider how to foster urban settings that enable them to retain talent. A positive example in this respect is the city of WrocÅ‚aw in Poland, which launched a comprehensive “strategy on preventing youth migration” in 2012 to complement the city’s economic development efforts.
This strategy covers a wide range of priority actions, including a regional “flexicurity” model to reduce youth unemployment, affordable housing tailored to young people, and improved child-care services. Another element of an attractive city is citizen-centric government services. Many municipalities in the United Kingdom have been grappling with shrinking budgets but have still managed to restructure their departments to improve their service to customers even while improving cost-effectiveness.
For example, Somerset County Council went through a radical transformation effort triggered by budgetary pressure. The council realised that, in order to maximise the value it delivers, employees at all levels needed to develop the right capabilities. Nine behaviour sets were created for employees—from the front line to executives—against which employees were assessed.
A complementary training programme was put in place to address any development needs. A transition from a command-and-control model to greater ownership for service delivery at the point of customer contact improved customer satisfaction and has kept employee relations positive. 88 McKinsey Global Institute 2. Reform—much of it national—can deliver growth .
6. COMPETITIVE AND INTEGRATED MARKETS IN SERVICES AND DIGITAL Despite Europe’s being one of the world’s most powerful regional economies, its productivity growth in services, including digital, has long lagged behind that of the United States. There is scope to reform the regulation governing many service activities in order to respond more effectively to the needs of the modern marketplace. Regulation varies significantly within Europe.
For example, in the Czech Republic, 395 professions are licensed—restricting market entry, reducing supply, and raising prices—compared with only 45 licensed professions in Estonia. Reforming land markets in Sweden resulted in a change in store formats and a major acceleration of productivity growth in the retail sector. Beyond regulation, an equally important lever for enhancing competitiveness and productivity is further integration of markets through Europe’s Single Market legislation.113 Today, the European Commission estimates that only around 40 to 50 percent of the potential impact of the EU Services Directive has been realised because of poor implementation and enforcement of the rules in some countries.114 We find that, in many cases, countries with the most infringements against the Services Directive between 2002 and 2012 also achieved the least productivity growth in services. Major initiatives within this growth driver include dismantling the remaining barriers to the competitive provision of services, fully implementing the Services Directive, developing a single European sky (coordinated air traffic management), and increasing connectivity and competition in rail as well as road haulage. Europe would also benefit from an integrated pan-European digital market.
Today, Europe’s telecoms and digital infrastructure remains fragmented, with high price variations. There are 250 collective management organisations in Europe for digital content, many with national monopolies in specific sectors. Further integration, including data and consumer protection rules, is needed.
Ensuring competitive transnational markets in services and digital could result in 0.43 percent of incremental real GDP growth. Services generate ~70% >70% of EU GDP and of jobs Where Europe stands Despite accounting for only 7 percent of the world’s population, the 30 European countries generated €14.1 trillion of GDP in 2013, or 25 percent of the world’s total compared with 22 percent for the United States and 13 percent for China.115 Creating a frontier-free economic region among its constituent nations is a defining purpose of the EU, which has pursued the integration between the economies of its member states since its inception. In 1986, with the adoption of the Single European Act, the EU established the free movement of goods, services, capital, and people within its borders. However, despite significant progress towards creating a true single market, significant barriers to cross-border trade remain. Within countries, the regulatory framework for certain products and services continues to act as a brake on competition and improvements in productivity.
This is partly as a result of a disconnection between the spirit of the policies As a member of the European Economic Area (EEA), Norway fully applies the entire acquis communautaire relevant to the free movement of goods, persons, services, and capital. Switzerland is not a member of the EEA, but it, too, enjoys full access to the Single Market, governed by around 100 bilateral agreements. The future of this privileged access is, however, in jeopardy following a referendum in Switzerland in February 2014 that called for the unilateral introduction of quotas for migrants from EU countries.
Both Norway and Switzerland are members of the European Free Trade Association, which governs their trade relations with non-EU countries. 114 Josefa Monteagudo, Aleksander Rutkowski, and Dimitri Lorenzani, The economic impact of the Services Directive: A first assessment following implementation, European Commission economic paper number 456, June 2012. 115 EU-28, plus Norway and Switzerland, 2013 GDP figures. See World economic outlook: Legacies, clouds, uncertainties, IMF, October 2014. 113 McKinsey Global Institute A window of opportunity for Europe 89 . agreed at the European level, the letter of the laws used to transpose these policies onto the national statute books, and the specific measures implemented to make them a reality. Overall, there is considerable scope to more fully translate European directives into tangible change. Governments could adopt ambitious and open approaches to ensure that their economies reap the greatest possible benefit of integration rather than doing just enough to avoid facing an infringement case before the European Court of Justice. Member states can also benefit by building on the EU measures to develop additional domestic policies to promote competition and productivity. The need to redouble efforts to integrate and liberalise Europe’s economy is particularly significant in the services sector. Services account for roughly 70 percent of EU GDP and more than 70 percent of EU employment.
However, most of the consumption of services happens within national borders. Exports of services within the EU stood at just 6 percent of GDP in 2012, while the equivalent figure for goods exports stood at 22 percent, up ten percentage points since 1992. A survey commissioned by the European Commission in 2013 explored consumer attitudes to the markets of goods and services.
Looking at market comparability, trust, complaints, expectations, and choice (and ease) of switching, it found that consumers still view the performance of the Single Market less positively in the case of services than for goods, suggesting that they find it less complete.116 The locally and nationally focused provision of services in Europe has important consequences for productivity. In the run-up to the global financial crisis, European productivity growth in goods had been on a par with that in the United States. However, productivity growth in services lagged behind that of the United States by 30 percent (Exhibit 53). Economic integration has many drivers, including factors that are difficult for policy makers to control, such as geographic distance and linguistic or cultural barriers.
Nevertheless, policy plays an important role.117 The OECD’s Services Trade Restrictiveness Index tracks the policy measures that most affect trade, with scores running between 0 (completely open) and 1 (completely closed). Although European economies are comparatively open overall with a score of 0.17, there is significant variation among countries as well as between sectors of the economy (Exhibit 54). To an extent, gaps in EU legislation and the incomplete transposition, implementation, and enforcement of Single Market legislation by EU member states have stood in the way of deeper integration.118 The five priority areas for completing the Single Market are those with the greatest potential for additional growth: boosting integration and competition in the services sector; completing the integration of Europe’s transport networks; fostering the digital single market; consolidating the market in financial services; and constructing a unified European energy market. Since finance and energy are discussed elsewhere in this report, this section focuses on the first three.119 See A single market for growth and jobs: An analysis of progress made and remaining obstacles in the member states, European Commission, November 2013, and Monitoring consumer markets in the European Union 2013 Part I, European Commission, August 2013. 117 Natalie Chen and Dennis Novy, International trade integration: A disaggregated approach, CEP discussion paper number dp0908, Centre for Economic Performance, London School of Economics, January 2009. 118 There are currently more than 1,600 directives that regulate the EU internal market, and most countries have correctly transposed this legislation into national law.
Only five countries—Austria, Belgium, Cyprus, Romania, and Slovenia—have adopted less than 99 percent of Single Market legislation. However, these numbers don’t consider how strictly EU legislation is enforced in national markets. In EU law, member states transpose directives by passing implementation measures through either primary or secondary legislation. 119 The free movement of people is also an area with significant gaps, as seen by the low mobility between EU member states.
Barriers to labour-market mobility are addressed in the discussion of enhanced labourmarket flexibility. 116 90 McKinsey Global Institute 2. Reform—much of it national—can deliver growth . Exhibit 53 Europe’s trade in goods is much more integrated than trade in services Trade integration and productivity growth Trade integration Trade intensity, 1992–20121 % Services3 Productivity growth Contribution to labour productivity increase, 1995–20072 Percentage points 18.3 12.9 3 6 22 Goods4 12 19925 1 2 3 4 5 -5.4 9.7 2012 United States 8.9 -0.8 Europe-25 Intra-EU exports as a percentage of GDP. Value added (at constant prices) per hour worked; sector weightings on the basis of 1995 levels. Private and public services; NACE classification groups L–Q. Resources and manufactured goods; NACE groups A–D. Intra-EU exports in 1992 refer to the composition of EU at the time. SOURCE: EU KLEMS growth and productivity accounts, March 2011 update; OECD; Eurostat; McKinsey Global Institute analysis McKinsey Global Institute A window of opportunity for Europe 91 . Exhibit 54 Ranking barriers to services trade reveal large differences between sectors and among countries STRI1 Barriers vary between different sectors … … and among countries GDP weighted average Sector Distribution Country Netherlands 0.09 Unweighted sector average 0.10 Construction 0.10 United Kingdom 0.13 Commercial banking 0.11 Germany 0.14 Telecom 0.11 Luxembourg 0.14 Computer 0.13 Denmark 0.15 Rail freight transport 0.13 Ireland 0.15 Sound recording 0.13 France 0.15 Insurance 0.14 Spain 0.16 Motion pictures 0.14 Slovenia 0.16 Courier 0.14 Hungary 0.16 Road freight transport 0.14 Czech Republic 0.17 Maritime transport 0.15 Sweden 0.17 Belgium 0.18 Engineering Architecture Broadcasting Legal 0.17 Portugal 0.19 Italy Air transport 0.36 European economies average 0.21 Norway 0.26 0.21 Finland 0.20 0.24 Accounting 0.19 0.22 Estonia 0.22 Greece 0.22 Austria 0.24 Switzerland 0.25 Poland 0.25 OECD average 1 OECD Services Trade Restrictiveness Index describes ease of cross-border trade in services. Averages for OECD countries in Europe, 0–1, where 0 = no barriers at all, and 1 = fully regulated monopoly. SOURCE: OECD; McKinsey Global Institute analysis 92 McKinsey Global Institute 2. Reform—much of it national—can deliver growth . Boosting integration and competition in the services sector The main vehicle for driving integration of services in the EU is the Services Directive of 2006. Activities covered by the directive accounted for 63 percent of intra-EU services exports in 2008.120 The centrepiece of the directive is a “freedom to provide services” clause that stipulates that member states should not impose their national requirements upon incoming service providers unless these requirements are non-discriminatory and justified by reasons of public policy, public safety, public health, or the protection of the environment.121 It also prohibits discriminatory requirements such as nationality and residence requirements or requirements such as “economic needs” tests, and establishes single points of contact in every member state as e-government portals for entrepreneurs active in the service sector. Finally, the directive contains measures to strengthen consumers’ rights, including non-discriminatory requirements, and disclosure and transparency requirements. While the Services Directive has formally been adopted by all EU member states, the degree to which its aims are realised in practice varies among countries. The European Commission’s “zero-tolerance” approach, proclaimed in 2012, has prompted some member states to implement further reforms.
However, significant restrictions on foreign services companies still exist. The European Commission estimates that only between 40 and 50 percent of the potential positive impact on GDP of the Services Directive has been realised thus far because of poor implementation and enforcement of the rules.122 If all member states were to reduce the level of restrictions to that of the five best countries in the EU per sector, additional gains amounting to 1.6 percent of GDP are projected.123 The sluggish pace of reform in some sectors is likely to have limited productivity gains in the services sector. In many cases, countries with high compliance with the Services Directive between 2002 and 2012 were also those that achieved high productivity growth in services over this period (Exhibit 55). Beyond the implementation of Single Market legislation to facilitate cross-border provision of services, effective competition in local services is often hampered by technical and administrative barriers at the national level.124 These include lengthy procedures for registering new businesses, opaque public tenders, and complex national legislation on taxation and labour standards.
Such barriers impose high costs on the providers of services, particularly small companies, and therefore reduce the potential for productivity gains through competition.125 Some progress has been made in this area in recent years, according to the OECD’s Indicators of Product Market Regulation, which tracks the openness of regulatory policy on a scale of 0 (most open) to 6 (least open). Even throughout the economic crisis, this index for European countries fell from an average of 1.45 in 2008 to 1.33 in 2013. The main reasons Services covered are distributive trades, including retail and wholesale; regulated professions (e.g., legal and tax advisers, architects, engineers); construction services and crafts; business-related services (e.g., management consultancy, advertising); tourism and leisure services (e.g., travel agents, sports centres); installation and maintenance of equipment; information society services (e.g., publishing, news, programming); accommodation and food services (hotels, restaurants, caterers); training and education services; rentals and leasing services, including car rental; real estate services; and household support services (e.g., cleaning, nannies). 121 Directive 2006/123/EC on Services in the Internal Market. 122 Josefa Monteagudo, Aleksander Rutkowski, and Dimitri Lorenzani, The economic impact of the Services Directive: A first assessment following implementation, European Commission economic paper number 456, June 2012. 123 Ibid.
Also see Better governance of the Single Market: An assessment accompanying the European Parliament’s legislative own-initiative report (rapporteur Andreas Schwab MEP), European Added Value Assessment number 2, 2013, and A single market for growth and jobs: An analysis of progress made and remaining obstacles in the member states, European Commission, November 2013. 124 A single market for growth and jobs: An analysis of progress made and remaining obstacles in the member states, European Commission, November 2013. 125 Ibid. 120 McKinsey Global Institute A window of opportunity for Europe 93 . for this decline were a reduction in the administrative burden on starting a new business and a decline in the complexity of regulatory procedures.126 Nevertheless, Europe still lags significantly behind the United States, which was already scoring as low as 1.11 in 2008 (Exhibit 56).127 Exhibit 55 European countries that have high compliance with the EU Services Directive had higher services productivity growth from 2002 to 2012 Nordics Continental Europe United Kingdom and Ireland Southern Europe Baltics Central and Eastern Europe Services1 productivity growth, 2002–122 Compound annual growth rate, % 3.0 Bulgaria 2.5 Czech Republic Poland 2.0 United Kingdom Greece Ireland Denmark 1.5 Slovakia 1.0 France Netherlands Hungary 0.5 Sweden Portugal Finland Belgium 0 Germany Austria -0.5 -1.0 Spain Italy -1.5 0 2 4 6 8 10 12 14 16 18 20 22 24 26 28 30 Number of infringement cases in service sector, 2002–12 1 Private services only (NACE G–K) excluding education, health care, and social services (NACE L, M, N, O) due to value-added measurement difficulties. 2 Calculated as growth of value created by sector development relative to the numbers of hours input. Not Fisher chain-weighted. Trend triangulated and verified with EU KLEMS and Eurostat value-added data. SOURCE: IHS value-added data; Eurostat; European Commission; McKinsey Global Institute analysis OECD, Indicators of Product Market Regulation. The GDP-weighted average product-market regulation for 2013 is for the EU-28 plus Norway and Switzerland.
The 2008 average excludes non-OECD members (Bulgaria, Croatia, Cyprus, Latvia, Lithuania, Malta, Romania) as no data are available. 127 Data collected at five-year intervals; 2013 data are extrapolated for the United States. 126 94 McKinsey Global Institute 2. Reform—much of it national—can deliver growth . Exhibit 56 Europe has gradually liberalised product market regulation—even during the economic crisis—but significant variations persist among countries OECD Product Market Regulation Index Economy-wide regulation (0 = least regulated; 6 = most regulated) 3.5 3.0 Poland 2.5 France 2.0 EU1 1.5 Germany 1.0 United Kingdom Average product market regulation in Europe fell from 2.1 in 1998 to 1.33 in 2013 0.5 United States2 0 1998 2000 2003 2008 2013 1 GDP-weighted average. Due to the absence of historical data on product-market regulation, excludes Bulgaria, Croatia, Cyprus, Latvia, Lithuania, Malta, and Romania before 2013. Excludes Slovenia before 2008. Excludes Luxembourg and Slovakia before 2003. 2 2013 data for the United States not available. SOURCE: OECD Indicators of Product Market Regulation Many European countries effectively grant monopolies to professionals in certain sectors through regulations that erect high barriers to entry.
For example, by limiting the number of licenced pharmacies within their jurisdiction and granting exclusive rights to the sale of medicinal products, most European countries reduce consumer choice and the supply of service providers (for example, by preventing the sale of “over-the-counter” products in supermarkets). Similarly, attempts to protect consumers by banning advertising and marketing (by, for instance, notaries in France and Spain, and pharmacies in Greece) restrict competition and the potential for growth in these sectors. Moreover, the practice of implementing price ceilings or floors for certain professions (such as architects and lawyers in Germany and Greece) aimed at ensuring service quality and preventing overcharging in reality remove incentives to improve efficiency.128 The restrictions are arguably most severe in the case of regulated professions such as lawyers and accountants.
The number of licensed professions varies greatly within Europe, from 45 in Estonia to 395 in the Czech Republic.129 There is thus significant potential to further generate productivity gains by reducing some of the barriers faced by those in regulated professions. Many of the countries hit hardest by the economic crisis, including Greece, Italy, Portugal, and Spain, have made good progress in opening up competition in professional services over the past five years. However, in Belgium and Hungary, for instance, which were already lagging behind others in this respect, there has been no progress. Indeed, Hungary has gone in the opposite direction with the introduction of more restrictive educational requirements in the architecture and engineering professions.130 Beyond austerity: A path to economic growth and renewal in Europe, McKinsey Global Institute, October 2010. 129 Regulated professions in Hungary include bartenders, nail beauticians, and solarium owners. 130 OECD, Indicators of Product Market Regulation.
Data on professional services are disaggregated under sector regulation. 128 McKinsey Global Institute A window of opportunity for Europe 95 . The potential for greater competition and productivity is not limited to regulated professions. Construction is a large sector in Europe, accounting for 5 percent of GDP, but it has suffered from prolonged stagnation in productivity. The high labour intensity and fragmentation of the construction industry hinder the diffusion of organisational best practice and standardised processes.131 Standardisation in the industry overall is rather low and varies significantly among countries. For example, Finland’s use of standardised pre-fabricated materials in residential projects is seven times that of Denmark. Failing to capture the benefits of economies of scale associated with greater standardisation hampers Danish firms’ ability to compete internationally and hurts the sector’s productivity in that country.132 By contrast, the United Kingdom enjoyed one of the highest productivity-growth rates in construction in Europe of 1.7 percent over the period 1995 to 2005.
Its “Achieving Excellence in Construction” initiative is just one example of its innovative approach. The initiative launched a series of demonstration projects that integrated a range of best practice, including switching to a focus on life-cycle project costs instead of lowest initial offer prices and implementing clear cost transparency and cost-effectiveness measurements. In 2009, these demonstration projects had nearly double the productivity of the industry average while delivering more predictable construction times and project costs.133 Swedish retail 41% above average European productivity growth 1993–2007 The retail sector is another prime example of the potential to boost productivity through targeted government action.
The Swedish retail sector enjoys a remarkable productivity advantage, outperforming the European average by 41 percent between 1993 and 2007. One key reason for this was an amendment to the country’s Planning and Building Act in 1993 that required municipalities to take greater account of the competitive situation in decisions to award licences to retailers. By easing zoning restrictions and facilitating the growth of out-of-town superstores, the average size of new food-retail outlets doubled between 1990 and 2000. These larger stores were able to take advantage of scale in purchasing, supply-chain and store management, and marketing.
Advances in the use of IT improved supply-chain, assortment, and inventory management are also best-practice examples that other European countries could emulate.134 Completing the integration of Europe’s transport networks Another vital service sector with significant potential for improvement is transport. Achieving an integrated and competitive market in transport is important not only because this would boost the sector’s productivity but also because it would enable the integration of other sectors. European authorities have made efforts to deepen the integration of transport in seven areas: expanding an internal market for rail services; completing the single European sky; developing the capacity and quality of airports; putting in place a maritime “blue belt” (reduced or simplified customs procedures in ports); ensuring that there is a sustainable framework for inland navigation of waterways; taking action on road freight; and putting forth an initiative on e-freight (automation of the freight transport process through electronic information). Recent emphasis has been on rail and aviation, for which the European Commission launched major initiatives in 2013—the Single European Sky 2+ and the Fourth Railway Package. Beyond austerity: A path to economic growth and renewal in Europe, McKinsey Global Institute, October 2010. 132 Creating economic growth in Denmark through competition, McKinsey & Company, November 2010. 133 Beyond austerity: A path to economic growth and renewal in Europe, McKinsey Global Institute, October 2010. 134 Ibid; Growth and renewal in the Swedish economy: Development, current situation and priorities for the future, McKinsey Global Institute, May 2012. 131 96 McKinsey Global Institute 2.
Reform—much of it national—can deliver growth . While member states have been quick to transpose the seven Single Market directives on transport into national statute books, there is still some way to go to achieve full implementation of the legislation. The market remains significantly fragmented along national boundaries. The biggest gaps remain in rail, where national monopolies and a lack of transparency in public tenders limit cross-border competition.135 State-owned players dominate the sector, which prevents the development of competitive intensity. In France and Italy, for instance, incumbents hold a market share of more than 80 percent in rail freight although their shares were previously even higher. The passenger rail sector also remains mostly a closed shop with the exception of the United Kingdom, which holds competitive tenders for the provision of all regional rail services; Sweden, which holds competitive tenders for all regional rail services that cannot be profitable in a free market, with all others fully open; and Denmark and Germany, which require tendering for at least some lines.
However, there is still a tendency to underinvest in rail infrastructure. Projects often require complex government permissions and long planning processes that can delay or even cancel large-scale projects. Differing technical standards for signalling systems, power, and track gauges also hamper cross-border operations. Market opening has been more successful in road freight, but even in this case there are still restrictions.
For example, “cabotage” restrictions limit access to national road-haulage markets. This leads to an unnecessarily high number of empty return trips for non-resident hauliers.136 Moreover, truck sizes still differ among countries, meaning that goods have to be reloaded at borders. The use of swap bodies—standardised road-freight containers— instead of lorries or truck trailers facilitates the use of longer, more productive vehicles (albeit at a cost to the flexibility of loads).
Swap bodies are also easily transferrable from a road tractor to a train, leading to greater integration. Longer, modular trucks such as those used in Scandinavia would also increase productivity (but at the expense, opponents argue, of increased accidents and road wear). Productivity in the road-freight industry is also hampered by the high degree of fragmentation, with a large number of small operators lacking the advantages that come with scale. One reason for this is the high level of self-employment in the sector and its related “self-exploitation” circumventing labour regulation (the self-employed working more than would be allowed if they were employees), keeping small and less efficient players in the business.
In 14 countries for which data are available, 59 percent of companies in the sector have fewer than 20 employees.137 This fragmentation bears down on productivity. Larger companies employing more people have the advantage of smaller overheads per driver and can decrease the share of empty trucks through improved planning systems to reduce idle time and through more substantial investments in IT. Fostering the digital single market Europe would also benefit from an integrated pan-European digital market. The European Commission made creating a single digital market a priority in 2012, and action on this front has picked up. Since 2011, 14 directives have been adopted on key areas such as harmonising consumer rights, electronic identification, value-added taxes, and digital content rights, and have tended to be transposed by member states.
However, some barriers to a truly integrated digital economy remain. A single market for growth and jobs: An analysis of progress made and remaining obstacles in the member states, European Commission, November 2013. 136 Ibid. 137 Employment in goods road transport enterprises 2011 data from Eurostat. 135 McKinsey Global Institute A window of opportunity for Europe 97 . Every 10% increase in broadband penetration adds 0.6– 0.7% to GDP Some European countries—particularly in Central and Eastern Europe—lag behind on high-speed broadband penetration, and the uptake of mobile broadband has been hampered in many nations due to insufficient investment in the enabling networks. There is already a significant body of evidence that demonstrates the positive impact of access to broadband on stimulating economic growth. Cross-country analysis of the effects of broadband penetration suggests a 0.6 to 0.7 percent boost to GDP for every 10 percent of additional penetration.138 This boost includes direct effects (for example, investment in infrastructure, increased availability and penetration of services, and increased employment in the ICT sector) as well as indirect effects such as productivity benefits, job creation in related sectors, e-government benefits, improved health-care provision, and gains in energy efficiency. Mobile networks still tend to be national and fragmented, as revealed by wide price differences among countries. Average phone call prices in 2011 ranged from less than two euro cents per minute in Lithuania to almost 15 cents per minute in the Netherlands.139 Similar differences apply in flat-rate packages, with the cheapest offer in Austria costing less than a quarter of the most expensive offer in Germany. Online commercial activity, too, remains national in nature.
A 2013 Eurobarometer survey on the barriers to digital trade suggests that, for a significant proportion of Europeans, there is some way to go before they are comfortable participating in the online marketplace. Only 45 percent of those surveyed had made an online purchase within the preceding 12 months, and most of those purchases were made within the consumer’s home country. In essence, there are still large numbers of people who do not see the attraction of online purchasing—37 percent of those who had never made an online purchase simply preferred to buy in bricks-and-mortar shops, while 33 percent said they don’t need to shop online. However, there is also a lack of confidence in e-commerce as a medium, particularly when purchasing from abroad. While the share of respondents who encountered problems with e-commerce is the same for domestic and cross-border purchases, in the latter case respondents were significantly more uncertain whether products would be delivered and concerned about whether they would be reimbursed when the products were returned. Shipping costs were a much more important barrier to cross-border purchases than to domestic online purchases.140 For providers, too, there are barriers to cross-border online activities. The management of digital content and royalties is highly fragmented.
Currently, there are more than 250 content-management organisations (CMOs) in the EU that license copyrighted material and collect royalties for the right holders they represent, typically on a national basis. In the music sector alone, 25 CMOs, many of them acting as national monopolies, cover 27 countries; in the United States, by contrast, only three CMOs cover the entire country. Moreover, European countries have different value-added tax regimes, digital payment structures, e-identification systems, and data protection rules, all of which complicate cross-border digital trade. Scott C.
Beardsley et al., “Fostering the economic and social benefits of ICT”, in Global information technology report 2009–2010, Soumitra Dutta and Irene Mia, eds., World Economic Forum, March 2010. 139 European Commission press release, August 6, 2013. 140 Internal market, Special Eurobarometer 398, European Commission, October 2013. The concerns about data protection and payment security were comparable between domestic and cross-border purchases. 138 98 McKinsey Global Institute 2. Reform—much of it national—can deliver growth .
Initiatives to change the game Taken together, the further deepening of the Single Market and the boost to competition in the service sector from the measures outlined have the potential to increase annual European growth by up to 0.43 percentage points. If all countries implemented the Services Directive to the level of the five leading countries in each sector—which comes close to the elimination of all restrictions covered by the Services Directive—0.14 percentage points could be added to annual GDP over ten years, according to estimates prepared for the European Commission.141 Adopting best practice in competition and market integration for the regulated professions and other local service sectors could add a further 0.29 percentage points in annual growth. Creating an integrated digital sector is also a vital lever. According to an analysis by the European Parliamentary Research Service, this could boost annual GDP growth by 0.4 percent a year over the course of a decade.142 We do not include the estimate here due to possible overlap with other initiatives such as innovation. Since transport accounts for a much smaller share of GDP, the impact of creating an integrated transport market comes mostly from enabling productivity growth in other areas.
The European Commission has made extensive recommendations on how to achieve a true internal market.143 We second these efforts. But countries can also go beyond the spirit and letter of EU Single Market legislation and be bolder in unlocking productivity growth in these critical sectors: ƒƒ Dismantle remaining barriers to competitive service provision, and fully implement the EU Services Directive. Many European countries need to redouble their efforts to foster a truly competitive market in services, and to make the EU Services Directive a reality.
Many de facto barriers to competitive service provision, such as lengthy registration procedures or complex national regulations, remain in place. These barriers should be removed, especially in regulated professions. Other sector restrictions should also be examined, including limits on opening times in retail as well as zoning laws that cap store size and density.
The dissemination of best practice and the promotion of common industry standards can also boost productivity. Broadly speaking, Denmark, Sweden, and the United Kingdom have led the way in eliminating barriers to competitive service provision and experienced higher productivity growth than the European average as a result. Yet even these countries may have significant untapped growth potential that would come from a more complete single market in services. ƒƒ Enhance the competitiveness and integration of the European transport network. Despite ongoing efforts to create a single market for transport, significant barriers to competition remain in the form of differing regulatory and technical standards that limit interoperability.
The road-freight business remains highly fragmented. In rail, incumbents still dominate the market in many European countries, despite efforts at liberalisation. More needs to be done at the national level to enable cross-border operations and create a truly integrated market. The economies of Continental Europe are relatively well connected to each other.
Reflecting this, Germany and the Netherlands led the EU’s Single Market scoreboard on transport in 2014. Each of these countries has transposed all EU directives in this area. The Netherlands and Nordic EU countries enjoy higher transport-sector productivity than other countries, partly reflecting the fact that these economies allow larger, 60-ton trucks on their roads. Josefa Monteagudo, Aleksander Rutkowski, and Dimitri Lorenzani, The economic impact of the Services Directive: A first assessment following implementation, European Commission economic paper number 456, June 2012. 142 Joseph Dunne, Mapping the costs of non-Europe, 2014–19, European Parliamentary Research Service, March 2014. 143 A single market for growth and jobs: An analysis of progress made and remaining obstacles in the member states, European Commission, November 2013. 141 McKinsey Global Institute A window of opportunity for Europe 99 .
ƒƒ Build ICT infrastructure and enhance consumer and intellectual-property protection. Europe needs to ensure that its ICT infrastructure is adequate and that its telecommunications market is as fully integrated and competitive as possible. This can be achieved by ensuring adequate access to high-quality broadband across Europe, allowing further cross-border competition and consolidation, making available sufficient wireless spectrum (for example, through pan-European frequency auctions), and implementing regulation that is conducive to greater competition and the extension of networks. Nordic countries and the United Kingdom lead Europe on telecoms infrastructure and broadband penetration.
However, expanding the use of the Internet for commercial purposes will also require improved consumer awareness of their rights and obligations online. Therefore, it will be important to clarify and harmonise consumer protection, guarantees, and reimbursement rules for customers across Europe, and to create a clear system for recourse for consumers across European national borders. Another useful step would be to simplify intellectual property rights and royalty structures for content providers through, for instance, a single entry point, licensing system, and collective management of intellectual property and royalties for the EU.144 As proposed by the February 2014 European Commission directive on collective management of copyright and related rights and multiterritorial licensing. 144 100 McKinsey Global Institute 2. Reform—much of it national—can deliver growth .
7. PUBLIC-SECTOR PRODUCTIVITY One UK study says public-sector productivity 2000–10 grew 0% 1.4% vs. in private sector The public sector delivers vital services to citizens and is a key component in a wellfunctioning society. Its productivity is particularly important in Europe—even more so at a time of significant fiscal pressures—because the public sector accounts for 26 percent of GDP and public transfers account for an additional 22 percent of GDP. Measuring publicsector productivity is notoriously difficult, but the evidence available suggests it is weak and broadly static.
Among the key measures that should be considered are fostering competitive conditions in the public sector wherever possible, creating dedicated bodies within the public sector with a mandate to drive productivity improvements, redoubling efforts to improve the measurement of productivity in order to establish accountability and enable progress to be tracked, and pursuing ways of pooling procurement and resources.145 Stepping up productivity growth to 1.4 percent in those parts of the public sector amenable to a measure of competition could yield additional real GDP growth of 0.15 percent a year. Where Europe stands Europe’s public sector (output and transfers) is very large compared with those of other economies. For instance, government consumption in Japan accounts for only 19 percent of annual GDP. Yet most attempted calculations of Europe’s public-sector productivity suggest that it is static or has even slightly dropped in recent times (Exhibit 57). According to one UK measure, the productivity of the public sector was static between 2000 and 2010, a period during which the private sector increased its productivity by 1.4 percent a year.146 Ambitious efforts are under way to develop an effective measurement method of public-sector productivity, but it remains very difficult because the nature of the sector’s output, which often lacks a market price, means that there is still only a broad indication of trends.
In the absence of a methodology for calculating value added, many measurements assume that input equals output for public services. The task ahead will vary according to the specific characteristics of the public sector in different European countries. The size of Europe’s public sectors ranges widely (Exhibit 58). In 2012, government investment and consumption ranged from 18 percent of GDP in Slovakia to 38 percent in Denmark.147 Even among the continent’s largest economies, significant variation is evident, In the United Kingdom and France, for example, direct government consumption as a share of GDP was approximately ten percentage points higher than in Germany in 2012. Governments also differ significantly in how much they spend on different priorities such as social protection and defence, and the type of spending (for example, the compensation for employees compared with investment) (Exhibit 59). Some examples illustrate these variations.
Greece spends 14 percent of GDP on general public services compared with the European average of 6 percent. Germany spends 2 percent of GDP on social protection, one-quarter of Denmark’s 8 percent. How public-sector programmes are designed McKinsey & Company and the McKinsey Global Institute have published extensively on the topic of publicsector productivity.
For instance, see Better for less: Improving public sector performance on a tight budget, McKinsey & Company, July 2011, and The public-sector productivity imperative, McKinsey Public Sector Practice, March 2011. 146 With no price for the output of the public sector, there is no quantifiable value added. For this reason, most measurements of public-sector productivity assume that output is equal to inputs, resulting in zero productivity growth by definition. 147 These figures do not include transfers and subsidies, which are not directly consumed by the government and thus not directly affected by public-sector productivity. However, the mechanisms by which transfers and subsidies are distributed can be a source of efficiency gains, especially in systems rife with leakages.
See, for example, From poverty to empowerment: India’s imperative for jobs, growth, and effective basic services, McKinsey Global Institute, February 2014. 145 McKinsey Global Institute A window of opportunity for Europe 101 . typically has a major impact on the amount of resources they absorb. For instance, in Germany’s health-care system, the majority of costs are covered by public and private health insurance providers. This means that government outlays amount to only 1 percent of GDP. Meanwhile, the government-funded National Health Service in the United Kingdom accounts for 8 percent of GDP.
Such differences mean that it is not possible to use spending as a percentage of GDP as a proxy for productivity. The scope, quantity, and quality of services delivered have to be taken into account. Exhibit 57 The public sector accounts for 26 percent of European GDP, but one experimental measure finds its productivity was flat during the 2000s Public-sector share of final consumption, Europe-30, 2012 % of GDP Productivity development by sector in the United Kingdom1 Private consumption via public transfers 120 Gross value added, labour productivity Index: 100 = 2000 Compound annual growth rate, 2000–10 % Private Private 115 22 1.4 110 51 Public 26 105 100 Public 0 95 2000 2005 2010 1 Measuring public-sector productivity is very difficult due to the nature of the sector’s output, which often lacks a market price. In the absence of a methodology for calculating value added, many value-add measurements assume input=output for public services (thus assuming constant productivity).
The most sophisticated method to measure public-sector productivity comes from the UK Office for National Statistics, which tracks annual productivity trends by collecting >100 input data sets (e.g., labour input, capital, purchased services) and comparing this with the change in output (e.g., number of surgeries, doctor appointments, trained students, children in social care). Health care and education output are adjusted for quality (e.g., mortality, patient surveys, PISA score). For the remaining ~one-third of spending (police, defence, general), input=output is assumed as the output affects all inhabitants. NOTE: Numbers may not sum due to rounding. SOURCE: Eurostat; UK Office for National Statistics; McKinsey Global Institute analysis 102 McKinsey Global Institute 2.
Reform—much of it national—can deliver growth . Exhibit 58 Government consumption among European countries varies from 18 to 38 percent of national GDP Government spending in selected Europe-30 countries, 2012 % of GDP 59 Transfers and subsidies (Not consumed by the government and therefore excluded from analysis of publicsector productivity) 57 53 21 38 Government investment and consumption Direct consumption by general government 7 3 10 Other 49 48 23 16 Procurement 32 30 38 11 7 7 2 2 5 12 11 17 29 18 Compensation 45 22 12 Government investment 42 27 3 6 13 26 6 20 25 7 25 20 5 18 6 4 6 2 5 2 11 9 8 7 2 7 5 Denmark United (maximum) Kingdom Total government investment and consumption € billion x2 Greece France Europe30 Poland Germany Slovakia (minimum) 93 58 596 3,653 97 523 13 615 NOTE: Numbers may not sum due to rounding. SOURCE: Eurostat; McKinsey Global Institute analysis McKinsey Global Institute A window of opportunity for Europe 103 . Exhibit 59 The composition of government consumption varies hugely among countries, especially in general services, health care, and social protection Government spending (less transfers and subsidies) in Europe-30 countries, 2012 % of GDP 38 Other 2 1 1 Defence Public order and safety 8 Social protection 2 Economic affairs 7 Health care 32 30 1 3 2 2 2 2 1 3 4 2 26 2 3 2 3 3 4 3 1 2 3 4 4 7 6 6 1 2 2 4 3 9 6 6 20 2 1 2 2 18 3 1 2 1 2 11 3 11 5 5 14 General public services x2 25 3 3 2 8 Education 29 4 6 6 4 6 5 Denmark United (maximum) Kingdom Total government investment and consumption € billion Greece France Europe30 Poland Germany Slovakia (minimum) 93 58 596 3,653 97 523 13 615 1 In some countries, health care is managed privately but funded to some extent by government transfers or subsidies, excluded in this exhibit. NOTE: Numbers may not sum due to rounding. SOURCE: Eurostat; McKinsey Global Institute analysis Because policy design and delivery have a major bearing on productivity in the public sector, a systemic view is necessary. Labour productivity, the typical measure of productivity in the private sector, is only one factor affecting the public sector’s ability to deliver value for money (Exhibit 60). In the public sector, factors such as an evidence-based approach to policy, a clear definition of the boundary between public and private tasks, and sound financial management are all just as important determinants of government efficiency. 104 McKinsey Global Institute 2. Reform—much of it national—can deliver growth .
Exhibit 60 Labour productivity is only one factor affecting the public sector’s ability to deliver value for money Examples Define the scope, objectives, and priorities of government Policy design Refine policy and regulatory framework Achieve government objectives Improve government performance given chosen scope, objectives, and priorities Set public-, privatesector boundaries Define policy interventions and tools Defining the respective roles of the public and private sectors Thorough economic analysis of alternative policy options, e.g., in carbon abatement or public health Productivity Increase productivity through higher quality and efficiency1 Policy delivery Improve delivery of public services within given policy framework Lean techniques that can produce simultaneous improvements in outputs, customer service, job satisfaction, and cost efficiency Financial management Lower cost of government inputs Reduce financial leakage Adoption of best practice in procurement Reducing fraud and error in tax, through prioritisation of cases for audit 1 While the OECD’s definition of efficiency implicitly includes quality improvements, we include them explicitly because they are a large, yet often overlooked, component of productivity improvements. SOURCE: OECD; McKinsey Global Institute analysis A large body of evidence has demonstrated that competition is an important driver of productivity. Productivity growth has consistently been higher in market sectors with higher competitive intensity than in monopolistic or tightly regulated markets. If that evidence is applied to the public sector, where there is typically little internal competition and few productivity-enhancing mechanisms, indications of low productivity are unsurprising. Therefore, one way to achieve improved public-sector productivity is to develop an element of competition. In many functions, introducing competition through private alternatives to public-service providers would be neither beneficial nor plausible due to the nature of the service.
Yet, there are many ways to introduce “competition-like” mechanisms other than through outright privatisation or introducing private alternatives. Concentrating on creating conditions that foster a competitive attitude and setting up institutional capabilities focused on driving productivity improvements can help governments get closer to private-sector efficiency levels. McKinsey Global Institute A window of opportunity for Europe 105 . We find that there are five broad characteristics of competition that relate to accountability and institutional capacity (Exhibit 61). Specific approaches are competitive benchmarking, increased transparency of quality and rights, dedicated delivery units, improved handling of sub-contracts, and an increased focus on performance within organisations. Examples can be found of each approach being pursued successfully within Europe; the challenge is to spread such best practice more widely and consistently. Exhibit 61 There are five characteristics of competition that the public sector can leverage to unlock productivity growth Characteristics of competition Accountability NOT EXHAUSTIVE Examples of potential public-sector interventions Degree of customer “satisfaction” with service that the organisation provides Competitive benchmarking  Create indirect competition by benchmarking similar units  Introduce alternatives and let customers choose supplier Reputational Societal expectations of performance enabled through clear standards and targets Quality and rights transparency  Define clear customers’ rights that service providers are accountable to  Leverage data technologies to make performance and quality transparent for customers when choosing suppliers Structure Organisation designed to promote a culture of performance Dedicated delivery unit  Establish a centralised group to track and enable productivity enhancements through metric design, prioritisation, and monitoring Processes Improved sub-contract execution Ability to leverage  Tender multiyear execution contracts, with clear technology and lean management to streamline performance targets coupled to incentive schemes processes People Institutional capacity Transactional Sufficient resources invested in hiring people with right capabilities and retaining talent Performance-focused organisation  Focus on recruiting talent that is motivated to boost productivity in the public sector across all levels of the organisation SOURCE: McKinsey Global Institute analysis One example of the power of accountability to drive productivity in the public sector is the Programme for International Student Assessment (PISA), the OECD’s comparative study of educational outcomes that was launched in 2000. This initiative transformed educational attainment in Germany by providing transparency on its performance.
PISA revealed that Germany lagged behind the OECD average on reading, mathematics, and science. Germany also had the highest educational inequality (measured as the correlation between educational outcome and socioeconomic background) of any country in the OECD. These poor readings triggered a vigorous national debate—the PISA shock—that galvanised rapid reform. By 2009, Germany had boosted its ranking in reading from 21 to 16 and in mathematics from 22 to 10, largely reflecting improved performance among disadvantaged students.
Even more impressively, these gains were achieved without an increase in spending on education. To the contrary, spending as a percentage of GDP fell slightly to 4.0 percent in 2008 from 4.1 percent in 2000. Europe also boasts examples of institutions driving public-sector productivity. In 2008, Sweden was facing an influx of refugees from Afghanistan and Iraq.
In response, the Swedish Migration Agency streamlined its operations and improved the quality of the 106 McKinsey Global Institute 2. Reform—much of it national—can deliver growth . services it provided by using lean-management principles and developing the capabilities of its employees.148 The agency identified and supported “change agents” whose job was to transfer skills and knowledge throughout the organisation. The result of these initiatives was a fall in the average time it took to process an application from 270 days to 105, generating savings of more than €100 million. The focus on the quality of the workforce also led to more accurate decisions on applications, demonstrated by a decline in successful appeals from 5 percent to 3 percent. Initiatives to change the game It is not easy to measure the precise impact of the introduction of competition-like mechanisms. However, our analysis suggests that this approach, effectively implemented, would enable the public sector to close much of the gap with private-sector productivity growth, potentially generating incremental GDP growth of 0.15 percent per annum.
We acknowledge that not all parts of the public sector are amenable to such measures. In our estimate of the potential impact on GDP growth, we therefore assume faster productivity growth only for the 41 percent of public-sector final expenditure devoted to compensation— approximately 11 percent of Europe’s GDP. Our estimate is only an approximation at best.
Governments may already have achieved productivity improvements that have not been measured, and not all mechanisms can be implemented effectively in each country. With these caveats, initiatives in four areas could help to change the game in Europe’s public sector: Dutch health websites led to insurance switching rate of 4–6% ƒƒ Create conditions for competition in the provision of public services where possible. Governments can all too easily become complacent about the quality of services when citizens cannot choose their providers. Introducing choice is not possible in all parts of the public sector, but where it is possible—say, a choice of doctor or school—choice can be a powerful incentive for providers to become more productive. The introduction of regulated competition in health care in the Netherlands increased choice and improved the efficiency of hospitals.
The Netherlands replaced its dual system of mandatory health insurance and voluntary private insurance with mandatory private insurance for all in a bid to address long-standing criticisms. The new system emphasised controlling health-care spending, increasing consumer choice, raising effectiveness and quality, guaranteeing accessibility, and stimulating innovation. Between 2006 and 2009, hospital prices fell and the volume of treatments increased considerably. The launch of websites with price and quality information on insurers led to a switching rate of 4 to 6 percent, and hospital productivity grew by 2.9 percent between 2003 and 2008.
Competition also harmonised the standard of care across the country— variations among hospitals decreased in both the length of stay and the price of care.149 ƒƒ Set up an internal stakeholder to identify, advocate for, and potentially implement productivity-enhancing initiatives. Efforts to improve public-sector productivity are often hampered by the fact that no single government stakeholder “owns” the problem and is accountable for setting it right. This argues for new organisations with a remit to focus on improving productivity.
These organisations need to have the political clout and the right incentives, and they need to be held accountable for results. In 2010, the United Kingdom set up an Efficiency and Reform Group within the central government as part of the Cabinet Office. The unit works jointly with HM Treasury and other government departments to identify and deliver savings, focusing on six areas: defining and implementing spending controls; sharing best practice across government on executing projects; centralising procurement in selected categories and, in others, disseminating See Transforming government performance through lean management, McKinsey Center for Government, December 2012. 149 Ilaria Mosca, “Evaluating reforms in the Netherlands’ competitive health insurance system”, Eurohealth, volume 18, number 3, January 2012. 148 McKinsey Global Institute A window of opportunity for Europe 107 .
best practice; managing the government’s property portfolio; developing commercial models for delivering services; and promoting a mindset of “digital by default”. The unit achieved savings—reviewed and verified by an auditor—of £14.3 billion in the fiscal year 2013–14 compared with a 2009–10 baseline forecast, equivalent to around 2 percent of total government spending. Examples of the savings that resulted from the group’s efforts include £2.4 billion saved from reducing the size of the civil service, £1.5 billion from the centralisation of purchasing of common goods and services, £0.8 billion from higher efficiency in construction projects, £0.5 billion from lower real estate costs by vacating, renting, or consolidating underused properties, and £0.2 billion from moving many government transactions online. ƒƒ Launch a productivity-measurement programme and publish results that establish accountability. Without a comprehensive way to measure public-sector productivity, government agencies can avoid being held accountable by citizens.
They may be attempting to improve value for money in the services that they deliver, but it is virtually impossible to assess whether they are doing so successfully. Mechanisms such as published scorecards are not a perfect solution, but they are useful because they can track input and output metrics over time that show taxpayers how their money is being spent and can also enable governments themselves to assess the effectiveness of initiatives. It is important that these scorecards are published for specific departments within a government to establish accountability.
In France, then-President Nicolas Sarkozy put in place a General Review of Public Policies in 2007, aimed at making significant cuts to public spending and boosting the effectiveness of existing spending.150 A central piece of this effort was a customer-centric barometer that tracked indicators based on customer expectations developed through focus groups. An annual report monitors progress on 450 initiatives across all 18 ministries. Since the launch, there has been very significant progress.
Accident and emergency waiting times have fallen by 28 percent. The civil service has 100,000 fewer employees through the simple mechanism of not replacing one of every two retirees. Over the past three years, the government has saved €10 billion—lowering its payroll by €3 billion, reducing operating expenses by €2 billion, and saving €5 billion through more efficient processes. Consolidation of medical procurement in Norway cut costs by 62% ƒƒ Implement joint purchasing and pooling of resources.
Although Europe is one of the world’s largest economies, its governance and operations are fragmented among its many separate countries, and this means that many government activities are subscale in efficiency terms. Leveraging Europe’s huge size and its degree of political integration could greatly improve the productivity of numerous operations. This is especially true in public procurement, as consolidating procurement processes strengthens governments’ bargaining positions and thereby lowers costs. In Norway, national consolidation of the procurement of medical consumables reduced the average cost for the same or similar goods by 62 percent.
Government activities can even be consolidated on a pan-European scale. As a first step, the European Commission has put in place EU-level procurement of pandemic vaccines and other strategic supplies. Another area with significant savings potential is defence—development and maintenance fixed costs are particularly high in this sector, and the use of defence equipment remains highly fragmented among member states.
As illustration, there are 154 main weapon systems in the EU-28 compared with 27 in the United States, leading to higher costs for all. Steps towards an integrated European defence policy clearly require common objectives, careful analysis of scenarios and equipment needs, and a strong political mandate. Notwithstanding the challenges, by pooling resources and joint purchasing, Europe could potentially save more than 30 percent on its military equipment budget. Karim Tadjeddine, “‘A duty to modernize’: Reforming the French civil service”, McKinsey Quarterly, April 2011. 150 108 McKinsey Global Institute 2.
Reform—much of it national—can deliver growth . 8. FURTHER OPENNESS TO TRADE Europe had 13% share of global goods and services trade in 2012, higher than the United States and China In the current economic environment of deleveraging and anaemic domestic demand in Europe, exports have been, and will continue to be, a vital component of the recovery from recession. But beyond the needs of the short-term recovery, trade is important because the competition it creates is a strong driver of longer-term productivity gains and helps to shift economies towards innovative knowledge-intensive sectors. Europe is already the world’s largest exporting region, but there is scope for trade to play an even larger role in growth. Excluding intra-European trade flows, the EU’s share in global flows in goods and services was 13 percent in 2012, higher than the share of China, Japan, or the United States.
The rising prominence of emerging markets in global trade is a formidable opportunity (and competitive threat) for European businesses to grow and for consumers to access less expensive goods and services. Among the measures that Europe could consider to enhance its trade performance are agreeing to robust trade agreements with the growth engines of the next decade, namely China, India, and the United States; improving its trade logistics systems; establishing trade support networks similar to Germany’s networks of chambers of commerce in destination countries; and designing policies to offset any adverse effects from trade. Tapping into greater trade with the China, India, and the United States through these initiatives could generate 0.08 percent additional annual GDP growth. Where Europe stands Europe-30 is the world’s largest exporting region. Excluding intra-European trade flows, the EU’s share in global flows in goods and commercial services was 13.4 percent in 2012, exceeding China’s share of 9.9 percent, the US share of 9.7 percent, and Japan’s share of 4.2 percent.
Germany is Europe’s largest trading nation, participating in 3.5 percent of global trade excluding intra-European trade. It is followed by the United Kingdom with 1.9 percent of global trade and France with 1.5 percent. Global trade activity has increased substantially over the past decade, driven by the rise of emerging markets. Today, roughly one-fifth of all money spent on goods in the global economy goes on a product shipped across borders, up from one in seven in 1995. Over this period, the global flow of goods has increased at a rate of 7.7 percent a year (Exhibit 62).151 The counterpart of increasing participation in global trade by emerging markets has been a steady decline in Europe’s share of global trade activity.
Yet the growing presence of emerging economies in international trade makes it even more important for Europe to be open to the opportunities that they bring. The importance of exports in Europe-30 GDP has increased substantially, from 12 percent in 2004 to 17 percent in 2012. Stunning strides have been made by many countries. The economies of the Baltic region and Central and Eastern Europe have posted remarkable growth in exports, doubling and tripling over this period to reach 14 percent and 30 percent of their GDP, respectively. Overall, the EU has historically imported more than it exports, but the region ran a trade surplus for the first time in 2013.
Strong surpluses with countries such as the United States and Turkey more than offset significant deficits with countries like China and Russia. Europe’s exports are generally geared towards knowledge-intensive, high-value-added goods and services, which are traded against primary resources and labour-intensive goods. Broadly speaking, the EU is a strong net exporter of machinery and equipment, chemicals, and manufactured goods, and a net importer of crude materials and fuels as well as of miscellaneous manufactured articles.152 Global flows in a digital age: How trade, finance, people, and data connect the world economy, McKinsey Global Institute, April 2014. 152 European Commission, Directorate General for Trade. 151 McKinsey Global Institute A window of opportunity for Europe 109 . However, there are significant differences among European countries and regions. Continental Europe drives the EU’s impressive overall trade performance. It is a large net exporter of knowledge-intensive manufacturing. The United Kingdom and Ireland stand out for their large surpluses in knowledge-intensive services. Overall, Southern Europe fares less well in knowledge-intensive sectors, but there are signs of improvement.
Italy, in particular, stands out for its strength in labour-intensive manufactured goods including apparel and furniture; it is also one of the largest European producers of machinery and equipment. The Nordic countries run a surplus in capital-intensive manufacturing, notably in fuel products and capital-intensive crude materials (Exhibit 63).153 Exhibit 62 Global goods trade has increased in both its value and share of GDP since 1995 Nominal values, 1995–2012 $ trillion Growth of global goods trade Growth of global services trade 18 Capitalintensive 16 Laborintensive 14 Primary resources and commodities 12 10 18 16 14 12 10 8 8 6 6 R&Dintensive 4 2 Transport 4 Travel 2 Other services 0 0 1995 Share 16 of GDP % 2000 2005 2012 1995 2000 2005 2012 20 23 24 4 5 5 6 SOURCE: UN Comtrade; IHS; United Nations Conference on Trade and Development (UNCTAD); World Development Indicators, World Bank; McKinsey Global Institute analysis Trading myths: Addressing misconceptions about trade, jobs, and competitiveness, McKinsey Global Institute, May 2012. 153 110 McKinsey Global Institute 2. Reform—much of it national—can deliver growth .
Exhibit 63 Continental Europe has a large surplus in knowledge-intensive manufacturing, and the United Kingdom and Ireland have a large surplus in knowledge-intensive services Net exports1,2 % of GDP 2009 Continental Europe Primary resources United Kingdom and Ireland -2.5 -3.5 -1.1 -1.7 0.8 0.9 Capital-intensive manufacturing -0.2 -0.2 0.7 1.7 0.1 0.1 2.5 0 3.9 -0.2 -1.1 -0.3 -0.5 1.7 1.7 -0.4 4.6 -0.1 -0.1 1.8 1.8 -0.1 0 -0.1 -0.1 0.1 1.8 Health care, education, and public services 1.0 -0.6 -0.1 1.4 Knowledge-intensive services -1.3 1.5 0.3 0.1 0.1 Capital-intensive services -0.7 -0.7 0.1 1.4 -1.5 5.8 Labour-intensive services 3.8 4.1 0.3 0.8 4.1 Knowledge-intensive manufacturing Nordics -2.8 -4.4 -1.8 -1.7 -0.7 -0.7 Labour-intensive manufacturing Southern Europe 2013 0 0 0 0 0 1 Excludes unclassified commodities and confidential trade that may lead to deviations from national accounts data. 2 2013 data were not available for specific services categories for several countries (Finland, Greece, Lithuania, Poland, and Switzerland). In these cases, 2011 data were used. Construction services is not available for Ireland; 2013 data for services from ITC are preliminary. SOURCE: World Bank World Integrated Trade Solution; ITC Trade Map; McKinsey Global Institute analysis The continuing rise of emerging markets is a significant growth opportunity for European businesses and has the potential to create new jobs in knowledge-intensive industries and services. In the past 25 years, Europe has, for example, benefited from growth in Africa, which has long relied on Europe as its biggest trading partner.
Trade volumes between the two regions have grown by 12 percent a year over this period. However, as South-South trade volumes have increased, Europe’s share of trade with Africa has dropped from around 65 percent to 39 percent.154 Future incremental demand for European exports is likely to be concentrated in China, India, and the United States, which together are expected to account for 48 percent of incremental growth in global GDP between 2012 and 2025 (Exhibit 64). China alone will account for 24 percent of global GDP growth to 2025, although the United States and India are also of significance with shares of 17 and 7 percent, respectively. Lions go global: Deepening Africa’s ties to the United States, McKinsey Global Institute, August 2014. 154 McKinsey Global Institute A window of opportunity for Europe 111 . Exhibit 64 EU preferential trade agreements cover only a fraction of future incremental demand Global real GDP, 2012 and 2025 2005 $ trillion 2.3 100.7 4.8 2.2 4.0 4.2 2.2 5.7 8.2 67.0 2012 China United States India Western Europe Latin Middle America/ East and Caribbean Africa % of increment 24 17 7 12 12 No trade agreements in place EU 7 Trade agreements with 40 countries1 Other Other Asia Pacific 14 2025 7 Scarce trade agreements2, 3 1 Preferential trade agreements with 40 countries including Chile, Colombia, Peru, Mexico, Caribbean members of the African, Caribbean, and Pacific Group of States (APAC), Algeria, Egypt, Israel, Morocco, Tunisia, and South Africa. 2 Other APAC = South Korea and Papua New Guinea. 3 Other = customs union with Andorra, Monaco, San Marino, and Turkey; European Economic Area with Iceland, Liechtenstein, and Norway; preferential trade agreements with Albania, Bosnia-Herzegovina, FYR Macedonia, Montenegro, Serbia, and Switzerland. NOTE: Without consideration of preferential trade agreements currently under negotiation. Numbers may not sum due to rounding. SOURCE: McKinsey Global Growth Model; McKinsey Global Institute analysis Europe already maintains strong trading relations with these countries. Being among the world’s largest economies, China and the United States are Europe’s main trading partners today. While Europe runs a trade surplus with China and a trade deficit with the United States, both countries are important sales outlets for European goods; 13.4 percent of EU exports go to the United States and 7.1 percent to China.
Due to the still relatively small size of the Indian economy in comparison with the United States and China, the importance of exports to India for EU companies is still limited at 2.1 percent of exports, but that will grow along with the size of the Indian market. Given the strong and growing importance of these outlets for European goods and services—trade with China, India, and the United States accounts for roughly 4 percent of Europe’s GDP—it is disappointing that the EU has not concluded free trade agreements with any of these countries. The volume of EU exports to the United States and China already exceeds exports to each of the three main existing free trade agreements—the European Free Trade Association, which includes Iceland, Liechtenstein, Norway, and Switzerland; 112 McKinsey Global Institute 2. Reform—much of it national—can deliver growth .
the Euro-Mediterranean Partnership with nine Middle Eastern and North African countries; and the Customs Union with Turkey. Given slow growth in Europe and the uncertainties associated with Central Asia and the Middle East, it is increasingly critical that Europe secures and extends its access to the growth markets in the rest of Asia and the Americas. Trade in services in the form of tourism from these countries is a particular opportunity for Europe (see Box 5, “Opportunities from China: Attracting students and tourists”). European countries are not all equally prepared to seize current trade opportunities. Small countries in northern and Continental Europe have long been among the world’s most open economies. In 2013, total exports reached 102 percent of GDP in Ireland, 83 percent in Belgium, 79 percent in the Netherlands, 55 percent in Austria, and 54 percent in Denmark. In total, extra-EU exports in 2013 amounted to 24 percent of GDP in the Nordics, 19 percent in Continental Europe, and 18 percent in the United Kingdom and Ireland.
The Baltic countries have rapidly internationalised over the past ten years, increasing their extra-EU exports from 17 percent of GDP to 30 percent. However, extra-EU exports still account for just 15 percent of GDP in Central and Eastern Europe and in Southern Europe (Exhibit 65). It is noteworthy that these differences among European economies exist despite their being subject to the same international trade regimes set by the EU Customs Union. Box 5. Opportunities from China: Attracting students and tourists Incomes in developing economies are rising faster and Europe can further tap into the increasing demand from at a greater scale than at any previous point in history. China and other emerging markets by improving on This trend is driving the growth of the global consuming the following: class from 2.4 billion people in 2010 to 4.2 billion in 2025. ƒƒ Simplify immigration.
Europe can improve its Chinese households will account for 19 percent of global accessibility to Chinese tourists and students by growth in urban households with an annual income of simplifying the visa application process through a more than $20,000. The new consumer class is finding its single online visa application portal. Non-Schengen way to Europe, primarily as tourists or students.
Between countries should also consider joining the Schengen 2005 and 2011, the number of arrivals from China almost area. After Switzerland entered the Schengen area in doubled from about 1.7 million to roughly 3.1 million. 2008, the number of Chinese visitors more than tripled The number of inbound students from Asia into Europe from around 130,000 to more than 450,000 in 2011. increased to around 300,000 in 2012. With its rich cultural heritage, Europe is well-positioned to further benefit from an increasingly travel-oriented consumer class in China. A top performer in this regard is Switzerland, which attracted 58 Chinese visitors for every 1,000 Swiss citizens in 2011.
With a share of 35 percent of the top 100 universities in the world, Europe is also well-positioned to attract Chinese students. The United Kingdom, which boasts some of the most prestigious universities in Europe, attracted more than 76,000 Chinese students in 2012. McKinsey Global Institute A window of opportunity for Europe ƒƒ Enable seamless access. Increasing airport capacity and connectivity with China’s main hubs facilitates travel into Europe.
Schiphol Airport in the Netherlands serves six Chinese cities daily and provides several services to welcome Chinese tourists. For instance, all Schiphol shops accept Chinese renminbi. ƒƒ Become an education powerhouse. To attract more Chinese students, European universities should intensify their efforts to establish an international academic reputation in line with that of the United Kingdom’s cutting-edge institutions and should market themselves in China more actively. 113 .
Exhibit 65 Extra-European trade corresponds to ~18 percent of European GDP, a share that has been increasing across all regions of the continent since 2004 Extra-territorial trade, 2004–131 % of GDP 2013 Compound annual growth rate, 2004–13 % 2004 Canada 36 30 Baltics 12 24 Nordics 20 Australia 18 Continental Europe 19 Southern Europe 9 1 5 1 6 1 4 2 7 -1 5 13 18 United Kingdom and Ireland Central and Eastern Europe 1 17 13 9 Exports 17 18 Europe-282 United States GDP 29 14 15 10 15 10 1 Export of goods and services. 2 Europe-30 excluding Norway and Switzerland. SOURCE: Eurostat; UNCTAD; IHS; McKinsey Global Institute analysis The difference in the export performance of different developed economies is increasingly explained by the countries’ involvement in global value chains of businesses and the imports of intermediate goods that this entails. Structural, economy-wide factors such as geographic location and sector specialisation play a diminishing role.155 Since developing new markets abroad is an expensive, time-consuming task with high risks and substantial fixed costs, larger, more productive, and more highly skilled companies are more likely to export than other companies, irrespective of the country in which they are located.156 For example, Germany benefits from a high concentration of innovative businesses in the fastgrowing machinery and equipment industry, which contributes to its position as the world’s top exporter in 2013, running a bigger trade surplus than China.157 In other countries— particularly in Southern Europe and Central and Eastern Europe—companies are smaller and less productive on average. Moreover, these regions have a less beneficial sector Andrea Beltramello, Koen De Backer, and Laurent Moussiegt, The export performance of countries within global value chains (GVCs), OECD science, technology, and industry working paper number 2012/02, April 2012. 156 Giorgio Barba Navaretti et al., The global operations of European firms: The second EFIGE policy report, Bruegel Blueprint Series, volume XII, July 2011; Loris Rubini et al., Breaking down the barriers to firm growth in Europe: The fourth EFIGE policy report, Bruegel Blueprint Series, volume XVIII, August 2012. 157 This includes exports to other European countries. 155 114 McKinsey Global Institute 2. Reform—much of it national—can deliver growth .
composition—companies tend to be specialised in products with slower-growing demand than their Continental European counterparts.158 Finally, infrastructure also plays a part in enabling or preventing companies' access to foreign markets. The Continental European trading hubs of Germany, the Netherlands, and Belgium as well as the United Kingdom topped the World Bank’s Logistics Performance Index in 2014, while the southern and Central and Eastern European countries lagged behind; Bulgaria, for instance, ranks 47th. Preferential trade agreements with China, India, and the United States could add 0.08 percent to Europe's real GDP growth. Initiatives to change the game Establishing preferential trade relations with China, India, and the United States would significantly spur export growth, allowing domestic companies to achieve scale and realise productivity gains while lowering prices for consumers in tradable sectors. The European Commission estimates that the realisation of the Transatlantic Trade and Investment Partnership with the United States alone would result in 0.5 percent additional GDP for Europe, amounting to roughly 0.05 percent additional growth per year in the period to 2025. Scaling this estimate to China and India on the basis of current export volumes, we estimate that preferential trade agreements with these three growing economies could yield incremental real GDP growth of 0.08 percent to 2025. Our analysis suggests that the priorities to consider in the trade arena include: ƒƒ Agree on robust trade agreements with the growth engines of the next decade: China, India, and the United States.
The biggest near-term opportunity is concluding the Transatlantic Trade and Investment Partnership with the United States, which not only would further integrate the world’s two largest developed markets but could also establish a framework for future European trade negotiations. Europe has been negotiating with India on a free trade agreement since 2007 and with China on an investment agreement since 2013; however, neither has reached a significant degree of maturity. Even more than is the case with trade in goods, trade in services is still significantly restricted with these two countries, with tariff equivalents exceeding 60 percent.159 As we have argued, establishing open and fair terms by which firms in the respective countries can conduct commerce in goods and services will be a critical determinant of Europe’s growth trajectory to 2025. ƒƒ Expand an efficient trade logistics ecosystem.
Much of the friction of global trade can take place before goods or services even leave the country of origin. In addition to the manufacturing and trading hub of Germany, the Netherlands is an example of how to minimise the burden on domestic companies by building world-class infrastructure, streamlining customs procedures, and ensuring that high-quality support services are available. The Dutch export infrastructure is ranked third in the world after that of Andrea Beltramello, Koen De Backer, and Laurent Moussiegt, The export performance of countries within global value chains (GVCs), OECD science, technology, and industry working paper number 2012/02, April 2012. 159 Trading myths: Addressing misconceptions about trade, jobs, and competitiveness, McKinsey Global Institute, May 2012.
Also see J. Bradford Jensen, Global trade in services: Fear, facts, and offshoring, Peterson Institute for International Economics, 2011, and Gary Clyde Hufbauer, Jeffrey J. Schott, and Woan Foong Wong, “Figuring out the Doha Round”, Policy Analyses in International Economics, number 91, July 2010. 158 McKinsey Global Institute A window of opportunity for Europe 115 .
Germany and Singapore on the World Bank’s Logistics Performance infrastructure sub-index. In 2012, the Port of Rotterdam shipped about twice the bulk cargo and processed about 30 percent more container shipments than the second-busiest European port, the Port of Hamburg. Processing about 1.6 million metric tons of cargo in 2013, Amsterdam’s Schiphol airport ranks third in Europe, not far behind Frankfurt and Paris. Efficient customs procedures place a minimum burden on the conduct of trade. Exporting requires seven days and $915 per container, lower than the OECD average of 11 days and $1,070.
Finally, the Netherlands boasts high-quality support providers such as shipping brokers and agents. It ranks fifth in Europe after Finland, Denmark, Austria, and Germany on the quality of its support services. ƒƒ Establish support networks in destination countries. For many firms, especially SMEs, developing new markets abroad is expensive, time-consuming, and risky. Germany has helped its businesses access foreign markets by establishing a dense constellation of related organisations at the regional and national levels that pull together to support businesses and their export aspirations.
These include, for instance, Germany Trade and Invest, which has more than 50 international representative offices and a worldwide network of 130 German chambers of commerce around the world—a system of “coordinated decentralisation”. Germany Trade and Invest acts as a hub and convenor of entities including national- and regional-level development agencies, and others. Development agencies based in Germany’s Länder have detailed knowledge of local businesses and are able to access resources at the national level.
For instance, KfW, the government-owned development bank, had a credit portfolio of about €60 billion in export and project finance in 2013. Germany also provides its exporting firms with export guarantees—the Hermes cover—that protect exporting firms from both country and buyer risk. ƒƒ Offset the adverse effects from trade through adequate investments and policies. While trade promotes longer-term productivity gains and the transition to knowledgeand innovation-driven economies, it can, in the short run, create disadvantaged groups in labour-intensive industries. Rather than focusing on winning back low-skilled jobs, European policy makers should prepare their economies and workforces for higherskilled activities.
Promoting world-class education and innovation is critical if Europe is to build on its comparative advantage in knowledge-intensive goods and sustain high-skilled job creation. In the short term, Europe should seek to create employment for those who have been disadvantaged by trade in industries that help improve Europe’s competitiveness and trade performance in the future. Investment in infrastructure that improves the access of firms to foreign markets, as well as in energy-efficiency measures such as the insulation of residential buildings, can create low-skilled employment while contributing to the improvement of the trade balance of most European countries.160 Trading myths: Addressing misconceptions about trade, jobs, and competitiveness, McKinsey Global Institute, May 2012 160 116 McKinsey Global Institute 2.
Reform—much of it national—can deliver growth . 9. GREY AND FEMALE LABOURFORCE PARTICIPATION Europe faces the prospect of a shrinking working-age population—those aged between 15 and 64—which, left unaddressed, could dampen GDP growth. One vital element of a gamechanging growth strategy would be boosting participation among groups that are currently under-represented in the workforce, in particular “grey”—adults aged 55 to 74—and female workers. Labour-market policies and pension and taxation systems should be geared towards promoting participation.
Governments and companies need to provide more support and flexibility for their workers to encourage participation, and remove barriers— perceived and real—to employment. Finally, everyone needs to be able to access lifelong learning to ensure that they are, and remain, employable. Stepping up participation in both groups to best-practice levels by 2025 could boost European GDP growth by 0.39 percent per annum. Where Europe stands Despite improvements over the ten-year period to 2013, female and grey participation rates of 79 and 35 percent, respectively, continue to lag behind the rate for prime working-age males, which stands at 91 percent (Exhibit 66).
Narrowing the gap by one-quarter would result in an additional 19 million workers—an 8 percent increase in the current labour force of approximately 250 million. Exhibit 66 Europe has large variations in labour-force participation rates among gender and age groups Europe-30 labour-force participation rate, 2013 % 91 79 Age Male Female 45 15–24 Difference between male and female participation Percentage points 5 40 25–34 91 35–44 93 45–54 90 78 35 Change -0.1 since 2003 Percentage points Female2 4.4 79 63 55–64 Male1 81 47 Grey3 8.2 12 65–74 >75 2 6 1 13 12 11 16 6 1 1 Activity rate of male population aged 25–54. 2 Female workers aged 25–54 to avoid overlap with grey workers. 3 Grey workers defined as aged 55–74. SOURCE: Eurostat; McKinsey Global Institute analysis McKinsey Global Institute A window of opportunity for Europe 117 . Female workers Europe has much to celebrate in its effort to expand opportunities for women in the workforce, but scope remains to do even better. Over four decades, labour-force participation for females aged 25 to 54 increased from less than 50 percent to 79 percent by 2013, higher than the 74 percent in the United States.161 Moreover, while female participation in the United States is stagnating, in Europe it continues to increase. However, variation in female participation within Europe reveals ample scope to boost participation further. In the Nordics and Baltics, 86 percent of women are part of the labour force. That is 12 percentage points more than in Southern Europe.
Many women are also inclined to work more. According to Eurostat, about one-third of women over the age of 15 who are classified as economically “inactive” are willing to work, and almost one-quarter of female part-timers are willing to work more hours. This finding about part-timers also implies that there is an opportunity to increase female participation, as 30 percent of European women in the workforce are currently not working full time (Exhibit 67). Exhibit 67 Europe has increased female labour-market participation but the incidence of women’s part-time work is higher than in the United States Female labour-force participation rate Female population aged 25–54, % 85 80 Regional variation in Europe, 2013 75 Baltics 86.1 Nordics 85.6 70 65 60 Part-time incidence of women 25–54, 2013 % 20 Canada 55 50 Europe1 Australia 40 41 United States 45 30 Continental Europe 82.8 United Kingdom and Ireland Central and Eastern Europe 79.1 77.9 19 Southern Europe 74.0 35 1970 1980 1990 2000 2013 1 Europe-15 before 1995 due to data availability; remainder is Europe-30 with missing data for Bulgaria, Croatia, and Malta to 2000 and for Cyprus, Czech Republic, Estonia, Latvia, Lithuania, Poland, Romania, and Slovakia to 1997. SOURCE: OECD; Eurostat; US Bureau of Labor Statistics; McKinsey Global Institute analysis We focus the discussion on the 25-to-54 age segment to avoid overlap with our analysis of grey labourforce participation. 161 118 McKinsey Global Institute 2.
Reform—much of it national—can deliver growth . Female integration into the workforce can be assessed on two dimensions: participation rates and the average number of hours worked per capita, each relative to the same figures for men.162 On both, the performance of European countries varies to a significant extent (Exhibit 68). In many countries, there is a relatively strong degree of parity between men and women, with many Central and Eastern European countries, as well as Baltic countries, standing out with high participation. In contrast, female participation rates in Italy and Malta are only 75 percent and 65 percent, respectively, those of men, with hours worked per capita for females at about the European average level of 83 percent of hours per capita for males. Many continental European countries have achieved relatively strong female participation rates but lag behind the European average on hours worked per capita.
In the Netherlands, for example, nearly four-fifths of employed women work part time, resulting in an average working week of just 25 hours, 30 percent less than for men. Exhibit 68 MGI has defined female participation in the European workforce in terms of activity rates and hours worked Nordics Continental Europe United Kingdom and Ireland Southern Europe Baltics Central and Eastern Europe Female hours worked Average actual weekly hours worked by women as a % of men, all ages 100 Bulgaria Romania Slovakia 95 90 Greece 85 Europe-30 Italy 80 Hungary Czech Republic Malta Luxembourg Ireland United Kingdom 75 Croatia Cyprus Poland Estonia Latvia Lithuania Portugal Slovenia Finland France Spain Belgium Sweden Denmark Norway Austria Germany Switzerland 70 Netherlands 65 64 65 75 76 77 78 79 80 81 82 83 84 85 86 87 88 89 90 91 92 93 94 95 96 97 98 Female labour-force participation rate Female activity rate as a % of men’s, 25- to 54-year-olds SOURCE: Eurostat; McKinsey Global Institute analysis While both dimensions are important, one of the levers for improving female participation rates is flexible working arrangements, which in some cases may lead to a higher incidence of part-time work. 162 McKinsey Global Institute A window of opportunity for Europe 119 . Countries that outperform on both dimensions are a diverse group, including Portugal and Spain and many from Central and Eastern Europe, the Baltics, and the Nordics. Overall, a U-shaped relationship between per capita income and female participation can be observed both across and within countries.163 The challenge for the countries with relatively lower income levels included in this group will be to maintain and improve on their participation rates as welfare increases. High-income countries that do not share this outperformance should look to the example set by the Nordics to find policies that can accelerate their progress up the right-hand side of the field (Exhibit 69). Exhibit 69 Low-income countries need to maintain high female participation rates as welfare increases Nordics Continental Europe United Kingdom and Ireland Southern Europe Baltics Central and Eastern Europe Female labour-force participation rate Female activity rate as a % of men’s, 25- to 54-year-olds 98 Lithuania 96 94 92 Sweden Denmark Austria Finland Portugal Latvia Bulgaria Slovenia Croatia 90 France Estonia 88 Netherlands Spain Cyprus Germany Slovakia Belgium Europe-30 United Czech Kingdom Republic Poland Hungary 86 84 82 Norway Romania Switzerland Luxembourg Ireland 80 Greece 78 76 Italy 74 10 12 14 16 18 20 22 24 26 28 30 32 34 36 46 48 66 68 70 72 74 Per capita GDP Purchasing power standard per inhabitant, thousand SOURCE: Eurostat; OECD; Jobs and growth: Supporting the European recovery, IMF, 2014; McKinsey Global Institute analysis See Kristin Mammen and Christina Paxson, “Women’s work and economic development”, Journal of Economic Perspectives, volume 14, number 4, fall 2000, and Claudia Goldin, “The U-shaped female labor force function in economic development and economic history”, in Investment in women’s human capital and economic development, T. Paul Schultz, ed., University of Chicago Press, 1995. 163 120 McKinsey Global Institute 2. Reform—much of it national—can deliver growth .
Grey workers Grey labour-force participation in Europe was 35 percent in 2013, 50 percentage points less than the participation rate of 25- to 54-year-olds. In a handful of countries—including Norway, Switzerland, Sweden, and the United Kingdom—grey participation rates are more closely aligned with those of the prime working-age population. These cases are largely the exception to the rule, but the trend is positive. Over the past ten years, grey participation has increased by more than eight percentage points compared with an increase of just two percentage points among 25- to 54-year-olds.
The United Kingdom is notable because it already had a relatively high grey participation rate of 37 percent in 2003 and posted a significant 4.7 percentage point increase in that rate over the subsequent ten years. In Germany, at 41 percent in 2013, participation increased three times as much as it did in the United Kingdom, but from a lower base in 2003 of 27 percent. A major determinant of grey participation is the statutory retirement age, which acts as an anchor around which actual retirements occur.164 Most European regions match or exceed the average statutory retirement age in the OECD of 65, with some catch-up occurring in the Baltics and Central and Eastern Europe, where the average statutory retirement age for males is 62 and 64 years, respectively. France recently decreased the official age to 60 with an increase to 62 planned for 2017.
Germany recently introduced the option that workers with 40 years of continuous service can retire two years earlier than the official retirement age.165 In all European regions, the average individual stops working before reaching the official retirement age. The gap between the statutory and effective retirement age is particularly large in Continental and Southern Europe at 3.6 and 3.2 years, respectively. Despite significant increases in life expectancy and healthy life years across Europe, most increases in the statutory retirement age have taken place only in recent years.166 Life expectancy has increased by more than nine years since 1970, but, over the same period, the male average effective retirement age has fallen by six years (Exhibit 70). This has caused the gap between the average age at which people retire and life expectancy to balloon to 18 years in 2012.
Having started at the same level as the United States, the effective retirement age in Europe has dropped to 62 compared with 65 in the United States and 69 in Japan. As a result, the 54 percent European participation rate of those aged 55 to 64 is ten percentage points lower than the 64 percent rate in the United States. See, for example, Romain Duval, The retirement effects of old-age pension and early retirement schemes in OECD countries, OECD Economics Department working paper number 370, November 2003, and JeanOlivier Hairault, Thepthida Sopraseuth, and François Langot, “Distance to retirement and older workers’ employment: The case for delaying the retirement age”, Journal of the European Economic Association, volume 8, issue 5, September 2010. 165 The current retirement age in Germany is 65 years and three months, although it currently rises by one month each year and is set to rise by two months a year starting in 2024. 166 Adair Turner, “Population ageing: What should we worry about?” Philosophical Transactions of the Royal Society, volume 364, issue 1532, October 2009. 164 McKinsey Global Institute A window of opportunity for Europe 121 . Exhibit 70 Although life expectancy has increased, the effective retirement age has fallen in Europe more than it has in the United States Average improvement, 2003–13 Percentage points Grey participation across Europe Activity rate, 2013 % of 25- to 54-year-olds Nordics 50 49 United Kingdom and Ireland 0.7 4.5 Effective retirement age and life expectancy1 Age 80 Life expectancy Europe-27 78 76 74 46 Baltics 8.4 Continental Europe 41 12.6 Europe-30 41 8.8 Retirement age 72 70 Japan 68 66 64 Central and Eastern Europe 38 8.3 Southern Europe 36 6.9 United States 62 Europe-27 60 1970 80 90 2000 2012 1 Average effective male retirement age and total average life expectancy at birth. SOURCE: Eurostat; OECD; McKinsey Global Institute analysis Boosting female and grey participation could add 0.39 percentage points to real annual GDP growth Initiatives to change the game Increasing female and grey labour-force participation to best-practice levels could boost real GDP growth by 0.39 percentage points per annum to 2025. This estimate is based on the incremental improvement that European countries could achieve if they catch up with 2013 best practice in 2025. In the case of female participation, achieving this boost to growth would entail catching up with Sweden’s 25- to 54-year-old female labour market participation rate of 88 percent. In the case of grey participation, it would entail catching up with Hungary’s ratio between grey and prime working-age participation rates of 0.58.
The incremental increase in participation is compared with an expected baseline scenario, in which average female and grey participation rates across Europe are assumed to grow in line with historical experience from countries that have developed participation rates similar to the European averages of 2013. Our estimates suggests that grey participation could become a major driver of future GDP growth, with an expected effect of about double the size of increased female participation. Both estimates are based purely on increased activity rates, keeping average weekly hours worked and productivity constant.
Among the key levers to achieve rising participation rates are: ƒƒ Reduce incentives to not work. Labour-market policies, and pension and taxation systems, should be geared towards promoting participation.167 According to a 2012 Eurobarometer survey on “active ageing”, 53 percent of Europeans oppose a mandatory For elaboration, see Economic policy reforms: Going for growth 2013, OECD, 2013; Pensions at a glance, OECD, 2012; OECD pensions outlook 2012, OECD, 2012; Employment trends and policies for older workers in the recession, European Foundation for the Improvement of Living and Working Conditions, 2012; and David Sinclair, Jessica Watson, and Brian Beach, Working longer: An EU perspective, International Longevity Centre, September 2013. 167 122 McKinsey Global Institute 2. Reform—much of it national—can deliver growth .
retirement age. The United Kingdom recently phased out its default retirement age, so that most people can work as long as they wish. The country has also moved to a defined contribution system that reduces the incentives to retire early. Meanwhile Finland’s recent pension reforms propose a gradual increase in the retirement age to 65, and thereafter to link it to life expectancy.
With respect to female participation, tax policy can shape incentives in important ways. In Germany, household incomes are pooled and progressive income taxes applied on the average amount, resulting in a particularly high taxation of income for second earners. An alternative and potentially fairer arrangement would have working couples experiencing a reduction in their combined tax burden compared with single earner households. ƒƒ Provide more support and flexibility to workers.
Research shows that childcare provision and flexible working arrangements are key drivers of female and grey participation.168 In Sweden and Finland, municipalities provide child care to parents during the ordinary working day, and in many cases even outside these times. In Sweden, about one-third of children up to the age of three are in child care for more than 30 hours per week compared with 4 percent in the United Kingdom. To make child care affordable, Sweden and Denmark subsidise it to the tune of 1.4 percent of GDP, double the European average.169 Part-time work is an attractive form of employment for people rearing their children and as a gradual pathway to full retirement.
In the United Kingdom and Belgium, about one-third of grey workers work part time, compared with an average of 22 percent in Europe. Other measures to improve flexibility—more common in the Nordics than elsewhere in Europe—include being able to determine the start and end of the working day, “save up” hours and days worked overtime to use as holiday, and even choose total hours worked.170 In Germany, Daimler has put in place a “senior-expert” programme that rehires retirees on short-term contracts for particular projects—a win-win for the company that buys-in the knowledge, experience, and motivation it needs, and for the grey worker. Such schemes help to preserve and share experience across generations. ƒƒ Eliminate (perceived) barriers to employment.
Many employers worry that grey workers will be less productive than their younger colleagues and that female workers will take breaks to give birth to and care for children or opt for part-time work, adding complexity compared with their male colleagues. In the case of females, harmonising paternity and maternity leave would reduce the bias against hiring women of childbearing age. In Sweden, parents receive 480 days paid leave, of which 120 days cannot be reallocated between parents and must therefore be taken as 60 days per parent or be lost.
A monetary bonus is provided when both parents take more than 60 days. For each day extra above 60 days taken by the parent who has taken the least parental leave, the government pays 50 Swedish kroner to each of the parents. At most, couples can receive an additional 13,500 Swedish kroner combined.
In 2007, Germany changed its parental leave scheme in similar ways and, within two years, 20 percent of fathers took paid leave compared with an initial 3 percent.171 In the case of grey workers, a more flexible system of wages would greatly help maintain their attractiveness for employers. In Denmark and the United Kingdom, the average full-time wage declines once workers have reached the age of 50, breaking the system of automatic increase of wages with seniority.172 Replacing seniority with performance clauses in public-sector wage See, for example, Olivier Thévenon, Policy drivers of female labour force participation in OECD countries, presented at Seminar on Early Childhood Education and Care in Brussels, December 4, 2013, and Ted Aranki and Corrado Macchiarelli, Employment duration and shifts into retirement in the EU, London School of Economics Europe in Question discussion paper number 58, February 2013. 169 Latest available data from OECD are from 2009. 170 EU Expert Group on Gender and Employment (EGGE). 171 “Why Swedish men take so much paternity leave”, The Economist, July 22, 2014. 172 Ageing and employment policies: Norway 2013: Working better with age, OECD, June 2013. 168 McKinsey Global Institute A window of opportunity for Europe 123 . arrangements, as Sweden does, can point the way for companies in the private sector.173 In addition, protective legislation and an “Age Positive” campaign in the United Kingdom aim to overcome age discrimination. Such discrimination is deemed to be widespread by almost half of Europeans.174 ~40% of women in Sweden and Norway have tertiary education vs. European average of 25% ƒƒ Offer lifelong learning to everyone. Ensuring workers have the right skills is the key criterion for employability.
In the case of female workers, we find that completion of a tertiary education is the most important driver of their participation in the labour force. In the best-performing countries, Sweden and Norway, about 40 percent of women over the age of 25 have a tertiary education compared with the European average of 25 percent. Grey workers can also benefit from lifelong education and training. Germany’s “Perspektive 50plus” programme finances training in communication skills and job applications as well as internships, personal coaching, and counselling. In 2011, 200,000 long-term unemployed went back to work, and 70,000 of them found regular jobs.175 Businesses can do more, too.
Siemens, for example, experienced an increase of almost two years in its average retirement age following reforms in 2011. These included an increase in the firm’s maximum age by three years to 70, personal “milestone” dialogues with employees aged between 55 and 60, and company health and fitness schemes. Pensions at a glance 2011, OECD, 2011. Eurobarometer, 2012. 175 EEO review: Employment policies to promote active ageing 2012, European Commission, 2012. 173 174 124 McKinsey Global Institute 2. Reform—much of it national—can deliver growth . 10. PRO-GROWTH IMMIGRATION Pro-growth immigration could add 0.26% to annual real GDP growth One way that Europe could compensate for its declining prime working-age population would be through greater inflows of immigrants from outside the Europe-30 region who are equipped with the skills needed for positions that employers currently struggle to fill. Although immigration is a contentious political issue in many countries, revisiting this topic— and viewing it through a pro-growth lens—could have significant economic benefits, These include expanding the workforce, increasing demand and investment as more people need housing or local services, contributing to more sustainable debt levels as debt is carried on more shoulders, and reducing some of the pressure from ageing because immigrants tend to be younger than established citizens. On average, immigrant populations feature a much higher share of working-age people than natives, and in some countries they are better educated than native individuals. Some European countries, notably Belgium, Norway, and Sweden, already have high levels of net migration from outside Europe. Others could emulate their approach.
By increasing net non-European migration from 2.6 people per 1,000 inhabitants per year to 4.9, the European working-age population could stabilise by 2025. Among the measures that European countries could consider are introducing open and transparent systems contingent on employment as Sweden has done, using shortage lists as Germany does, enhancing education and integration support for immigrants, setting up welcome centres overseas to attract skilled migrants, and creating a pan-European immigration portal. If Europe boosted its net immigration from non-European countries to this level—and did so in a way that led to equal employment rates between natives and immigrants—real GDP growth could accelerate by 0.26 percent per annum. Where Europe stands Europe can counteract the demographic drag on its workforce through higher participation, increased fertility rates, or greater inflows of non-European migrants.176 Fertility is an option that can be addressed only indirectly through government policy and, in any case, evolves over a long period.
In reality, in addition to action to boost participation, only immigration offers a genuine potential to expand the working-age labour pool in the period to 2025. Together, these two approaches could have a powerful effect on European economies. Today, annual net non-European migration ranges from zero in the Baltics and Central and Eastern Europe to three immigrants per 1,000 inhabitants a year in the Nordics. On average, extraterritorial—non-Europe-30—net immigration is about 60 percent lower than the equivalent figure in the United States and 85 percent below the rate in Canada.177 Over time, this has resulted in only 6.6 percent of the population of Europe having been born outside the region. This is significantly lower than the share in the United States, Canada, New Zealand, and Australia where between 13 percent and 27 percent of the population was born abroad. If we were to assume that immigration was the only tool available to Europe to stabilise its working-age population, we estimate that Europe could need an additional 11 million nonEuropean immigrants by 2025 compared with the UN Population Division’s 2025 normal migration scenario.
To achieve this increase, Europe may need to boost its net migration rate from 2.6 people per 1,000 inhabitants per year to 4.9 people (Exhibit 71).178 Today, Belgium, Norway, and Sweden are the only European countries that have such levels of We focus on immigration from countries outside Europe rather than migration among Europe-30 countries. This comparison uses Central Intelligence Agency data for Canada and United States; we note that comparability with Eurostat figures for Europe-30 may be limited. 178 This scenario is the base case 2025 normal migration scenario of the UN Population Division. 176 177 McKinsey Global Institute A window of opportunity for Europe 125 . net migration. By way of contrast, Canada and Australia receive about 5.7 newcomers per 1,000 inhabitants. Exhibit 71 To stabilise its prime working-age population, Europe-30 needs 11 million more immigrants, increasing the net migration rate to 4.9 per 1,000 Europe-30 prime working-age population, 15- to 64-year-olds Million European-born Additional net migration Annual net migration Persons per 1,000 population3 Current 1.3 345 Base case 2025, no migration1 0 321 Base case 2025, normal migration1 321 Stable prime WAP case, 20252 321 12 2.6 333 24 4.9 345 +11 Annual net migration of non-Europe-30 migrants Persons per 1,000 population, 2013 4.3 3.0 2.3 1.6 1.3 0.9 0.2 -0.1 Highimmigration, highpopulation countries4 Share of foreign-born population6 % Nordics United Kingdom and Ireland Continental Europe Europe-30 Southern Europe Central and Eastern Europe5 Baltics 8.6 7.1 7.9 8.3 6.6 7.2 1.5 8.9 1 Based on a medium-fertility scenario. 2 Working-age population. 3 Assumes stable working-age population to total population ratio. 4 Belgium, Norway, Sweden, i.e., countries with non-Europe-30 net migration of >4 newcomers per 1,000 population and population >5 million. 5 No data for Croatia, so Slovenia’s immigrant share is used as a proxy. 6 For Europe-30, this is non-Europe-30 immigrant share of total population. NOTE: Numbers may not sum due to rounding. SOURCE: Eurostat; United Nations Population Division; McKinsey Global Institute analysis 126 McKinsey Global Institute 2. Reform—much of it national—can deliver growth . We acknowledge sensitivities around this issue, but it is indisputable that, in economic terms, there are distinct advantages to growing the labour pool through immigration. One of these is that the age mix of immigrants tends to be skewed towards working age compared with the overall population. In 2013, 80 percent of non-European immigrants were aged between 15 and 59, compared with 60 percent in the European-born population (Exhibit 72). Consequently, a large part of the immigrant population is active in the labour market. At the same time, many studies have shown that this higher prevalence of immigrants in employment does not result in fewer jobs for the indigenous population.179 There is a counterpoint to the disproportionate share of immigrants in the workforce, however.
Unemployment among immigrants stands at 20 percent of those active in the labour force, compared with 10 percent among established EU-27 citizens (Exhibit 73). Exhibit 72 The positive impact of immigration comes from differences in the age structure between natives and incomers Distribution of population by age category, 2013 % Age >85 75–85 – Non-Europe-30 immigrants 1 = Europe-30 natives 3 -3 6 9 16 23 45–59 22 15–29 -7 21 7 18 16 +2 21 35 30–44 Difference Percentage points -1 2 60–74 <15 Prime working-age population +14 +4 -9 SOURCE: Eurostat; McKinsey Global Institute analysis See Alain Jousten et al., The effects of early retirement on youth unemployment: The case of Belgium, IMF working paper number 08/30, February 2008; Arie Kapteyn, Adriaan Kalwij, and Asghar Zaidi, The myth of worksharing, IZA discussion paper number 188, August 2000; and Tom Walker, “Why economists dislike a lump of labor”, Review of Social Economy, volume 65, issue 3, September 2007. 179 McKinsey Global Institute A window of opportunity for Europe 127 . Exhibit 73 Non-European immigrants are more likely than native Europeans to be of working age and active in the labour force Breakdown of total non-Europe-27 immigrant population compared with native population, 20131 % 100% = 461 million 35 million 16 Not of prime working age2 36 24 Prime working age not in the labour force Unemployed 18 5 Prime working-age population2 Employed 11 42 Europe-27 natives3 49 Non-Europe-27 immigrants4 1 Immigrants are people who were not born in the EU-27; natives are individuals born in the reporting country. 2 Prime working-age population is defined as 15- to 64-year-olds. 3 Natives are individuals born in the reporting country. 4 For Germany, foreign-born individuals are considered due to data availability. NOTE: Numbers may not sum due to rounding. SOURCE: Eurostat; McKinsey Global Institute analysis Rates of unemployment among immigrants from outside Europe compared with the established population vary in different countries (Exhibit 74). In the Czech Republic and Lithuania, for example, unemployment rates for immigrants are equal to or even lower than those of the native population. In Ireland and the United Kingdom, unemployment rates for both groups are also relatively similar. In Ireland, the unemployment rate of immigrants stood at 15.6 percent in 2013 compared with 12.7 percent for the native population.
In the United Kingdom, the equivalent shares are 9.8 percent and 7.5 percent. In many European countries, immigrants tend to be more educated than the average native citizen. In Ireland, 56 percent of non-European immigrants have completed a tertiary education compared with 34 percent of the native population.
However, this is not always the case. In Belgium, Norway, Sweden, and Switzerland, unemployment among non-European immigrants is more than triple that among established citizens, and an equal or lower share of immigrants has a higher education compared to established citizens. 128 McKinsey Global Institute 2. Reform—much of it national—can deliver growth .
Exhibit 74 Unemployment rates among immigrants compared with European natives vary from country to country Unemployment rate of immigrants vs. natives, 15- to 64-year-olds, 20131 % of native values Immigrant unemployment rate >2x native rate 1–2x native rate < native rate No data 1 Malta excluded from analysis due to data being unavailable. SOURCE: Enerdata; McKinsey Global Institute analysis Initiatives to change the game If Europe opted for policies that boosted the number of immigrants by the amount needed to fully offset the projected decline in its working-age population—with no other efforts on this front such as boosting participation or fertility—we estimate that this could increase real GDP growth by 0.26 percent per annum to 2025. This estimate assumes that governments put in place immigration systems that are better geared towards attracting immigrants who have received a higher education and therefore have better job prospects than many immigrants today, equalising employment rates among immigrants and natives. Apart from the direct boost to GDP from immigration, the rebalancing towards a larger working-age population would help to carry the costs of an ageing population, including the fiscal burden of pensions and health care. Among the initiatives that Europe could consider are: ƒƒ Introduce open and transparent immigration systems contingent on employment. At the very minimum, governments need to make immigration less burdensome and shape it according to societal and economic needs.
Sweden, for example, introduced an uncapped “demand-driven system” in 2008 following concerns about labour shortages.180 The system enables employers to hire from abroad as long as the vacancy had been advertised for more than ten days and the job meets collective wage and conditions contracts. Upon unemployment, immigrants have three months to secure a new job offer or they are required to leave. Australia has a two-stage system that relies Recruiting immigrant workers: Sweden 2011, OECD, December 2011. 180 McKinsey Global Institute A window of opportunity for Europe 129 .
heavily on temporary visas.181 There is no cap on temporary workers but light regulation of them. Immigrants are incentivised to undertake high-skilled employment, education, or training to qualify for permanent residency. The system has reduced unemployment among immigrants, and about 50 percent of temporary visa holders are given the right to stay permanently. Canada’s “supply-driven system” is based on points awarded for specific criteria.
These standardised criteria can change according to what jobs need to be filled, but at all times they are updated and available online with a test so that potential immigrants can calculate their personal score. Applications can be filled out online (unlike in 80 percent of Europe), reducing processing times and costs.182 The points-based system also helps to assure citizens that immigrants bring specifically needed skills and desired characteristics, thereby tempering political opposition to their arrival. ƒƒ Implement shortage lists that ease entry. Matching the skills of immigrants with the needs of employers can help to ensure that immigrants are employed for a sustained period.
Denmark, Germany, and Sweden have “shortage lists” published online in an effort to focus immigration on occupations with vacancies. In Sweden, the demandbased system guarantees employment; in addition, anyone who desires to fill an occupation on the shortage list does not need to return to the home country to apply for a work permit. One result has been a stronger correlation between visa applications and job openings, and about half of immigrants arriving under the worker immigration rules are focused in shortage occupations.183 In Denmark, someone whose skills match the shortage list receives bonus points to enable the applicant to obtain a residence permit for seeking and undertaking work.
In Germany, any immigrant whose skills match the shortage list can be hired without the employer having to meet a labour-market test. Such a test would usually be required to determine whether a job offering can be filled by someone from abroad. ƒƒ Increase education and integration opportunities. The potential value added of immigrants increases with their employment status and participation in society. As workers retire and the population ages, Europe faces a potential skill shortage, in particular for medium- and high-skilled jobs in engineering, information technology, and health.184 Germany and the Netherlands have average stay rates of highly educated international students that are 26 percent and 27 percent, respectively, above the OECD average of around 25 percent.185 International graduates in these countries have direct access to job-search visas and can apply for a permit without having to return to their home country.
Both countries have reformed their academic systems to international standards to attract foreign students. The Netherlands also benefits from widespread use of English.186 Internationally, stay rates remain below Canada’s 34 percent. By allocating additional points for higher education, immigration to Canada is skewed towards the higher-skilled end of the spectrum.
Notwithstanding the political complexities, expanding the EU Blue Card system to Denmark, Ireland, Norway, Switzerland, and the United Kingdom could help to encourage skilled immigration. The scheme gives highly educated immigrants who have a job offer at strict salary requirements the right to work in Europe through a single application procedure. Post Robert G. Gregory, The two-step Australian immigration policy and its impact on immigrant employment outcomes, IZA discussion paper number 8061, March 2014. 182 Comparative immigration study 2013–2014: Migration formalities for third-country nationals in 26 European countries, Deloitte, November 2013. 183 Recruiting immigrant workers: Germany 2013, OECD, February 2013; Recruiting immigrant workers: Sweden, OECD, December 2011. 184 Martin van der Ende et al., European vacancy and recruitment report 2012, European Commission, November 2012; 2013 skills and demand forecasts from the European Centre for the Development of Vocational Training (Cedefop). 185 International migration outlook 2011, OECD, July 2011. 186 Brooke Sykes, Mobile talent? The staying intentions of international students in five EU countries, Migration Policy Group, April 2012. 181 130 McKinsey Global Institute 2.
Reform—much of it national—can deliver growth . entry, Canada provides free language training to immigrants, helps them find a job and a place to live, and provides information about available community services to encourage integration. Similarly, Germany offers free language classes and has recently opened online, as well as physical, welcome centres that offer personal assistance to improve immigrant perceptions and aid integration. ƒƒ Establish European welcome centres abroad to attract foreigners. To attract more foreign migrants, Europe would need to brand itself as an attractive destination with a strong job market, high social mobility, and a pleasant living environment for highly skilled immigrants. Agencies can support foreign students and qualified workers in the immigration process, establishing better links with local universities and businesses. For example, the British Council is represented in more than 100 countries, its aim being to encourage educational and cultural exchanges with the United Kingdom.
The organisation promotes educational opportunities in the United Kingdom and provides English-language training. Similarly, the Australian Agency for Education and Training has a number of offices in the Middle East to attract students from that region. With a central point of contact—rather than individual universities marketing themselves separately— countries can increase their reach and impact. ƒƒ Create a pan-European immigration portal.
A significant barrier for incoming immigrants in Europe is admission procedures that tend to impose a multitude of requirements and involve long processing times for applications and high rejection rates.187 The EU Blue Card is promising because it has a single application procedure. A single online visa application portal for all European countries could potentially serve to streamline the immigration process while maintaining national sovereignty over the assessment and decisions on entry. The idea would be that a candidate for immigration would be able to access all the documents required in one place, and then decide which European country (or countries) to apply for. This system would have similar characteristics to the Common Application, a single portal for students to apply to more than 500 universities in 12 countries.
Such a system could also be a useful step towards a unified points-based immigration system. Recruiting immigrant workers: Germany 2013, OECD, February 2013; Recruiting immigrant workers: Sweden 2011, OECD, December 2011. 187 McKinsey Global Institute A window of opportunity for Europe 131 . 11. ENHANCED LABOUR-MARKET FLEXIBILITY The labour market is where most people feel the ups and downs of the economy most acutely. In the two decades to 2012, two-thirds of European economic growth accrued to workers through labour incomes.188 The effective functioning of the labour market is the most important way of ensuring that growth is inclusive. Yet Europe is underperforming other developed economies.
In 2013, the share of people of working age employed in Europe was lower than the OECD average, and there is a large degree of bifurcation between workers on permanent and temporary contracts, with many young people employed on the latter. Moreover, labour mobility in Europe is relatively low. Given these relatively poor labour-market outcomes, it is essential that everything be done to ensure that the job market works more effectively. A number of European economies have successfully reformed their labour markets over the past decade, reducing unemployment or increasing the share of people of working age with jobs in other ways. Initiatives to change the game include a reduction in employment protection and labour taxes to incentivise hiring, particularly in the case of younger workers (Spain used both levers in its labour-market reform), adopting more assertive active labour-market policies at the expense of passive benefits such as Denmark’s flexicurity model, or making wagebargaining mechanisms more flexible.
Europe should also intensify efforts to make the single labour market work in reality. Reforms of this nature could unlock approximately 0.15 percent of additional real GDP growth per annum. 64% labour-force participation among 15–64 age group in Europe in 2013 Where Europe stands Europe’s labour markets are not in good shape. In 2013, the continent’s share of those aged 15 to 64 in employment stood at 64 percent.
That compared with 72 percent in Australia and Canada, for instance. Even before the financial crisis in 2007, only 66 percent of Europe’s working-age population was employed. The two percentage point decline since late 2007 was led by Southern European countries, whose share fell by seven percentage points to only 55 percent by late 2013.
In other parts of Europe, the picture is not as bleak. In the Nordic countries and the United Kingdom and Ireland, the employed share in late 2013 stood at 73 and 70 percent, respectively, despite a decline of 1.5 percentage points since late 2007. During the same period, the countries of Continental Europe experienced an increase of two percentage points, to 70 percent, in the share of people employed. While the Baltics’ share dropped dramatically, from 67 percent to 59 percent, in only three years, it had recovered to 67 percent by late 2013 (Exhibit 75). 188 132 The annual labour income share is calculated by the OECD as total labour costs (compensation of employees, adjusted for the self-employed) divided by nominal output.
It is available for all Europe-30 countries except Croatia and Malta. McKinsey Global Institute 2. Reform—much of it national—can deliver growth . Exhibit 75 European employment rates are, on average, below those of other OECD economies but have improved lately, except in Southern Europe Employed share of working-age population, 20131 Annual data, % Employment rate, 1Q07–4Q13 % 78 72 Australia 76 74 72 Canada Nordics 72 United Kingdom and Ireland 70 68 OECD 67 65 66 Baltics 64 United States Continental Europe Europe-30 62 Central and Eastern Europe 60 58 Europe 64 56 Southern Europe 54 2007 08 09 10 11 12 2013 1 Defined as aged 15–64. SOURCE: OECD; Eurostat; McKinsey Global Institute analysis Many of Europe’s labour markets are also characterised by a high degree of bifurcation between workers on permanent and on temporary contracts, and—related to that—between the older and younger labour force (Exhibit 76). At 25 percent, youth unemployment (aged 15 to 24) in 2013 was nearly three times that of adult (aged 25 to 64) unemployment at 9 percent. Moreover, those young people who are employed are much more likely to work on temporary contracts: 43 percent of employees younger than 25 are temporary workers, with shares exceeding 60 percent in some countries (69 percent in Poland, 65 percent in Spain, 61 percent in Portugal). The equivalent number for the adult population is 11 percent.
Incomes, too, have developed less favourably for young workers than for older employees. In Spain, for instance, the incomes of adult workers have declined by 1 percent a year since 2007, while young employees have experienced a 4 percent fall in their incomes every year. McKinsey Global Institute A window of opportunity for Europe 133 . Exhibit 76 Labour-market conditions are toughest for young people, particularly in Southern Europe Indicators of labour-market duality Unemployment, 2013 % Temporary employment, 2013 % of total employees Income increases, 2007–12 Median equivalised net income; compound annual growth rate, purchasing power standard % Youth 15–24 15–24 18–24 Adult 25–74 25–64 25–54 27 58 Greece -5 9 25 -3 65 56 Spain 21 24 -1 53 40 Italy 11 10 Germany Europe 1 1 59 24 France -4 4 12 8 4 53 8 3 8 5 2 43 25 11 9 1 2 SOURCE: Eurostat; McKinsey Global Institute analysis In Europe, the labour market also has an important international dimension. A major element of the European single market is that the EU and its partners Iceland, Liechtenstein, and Norway have written into law the free movement of labour across borders. However, the reality still lags behind the aspiration. In 2012, intra-EU immigration stood at 0.35 percent of the EU population compared with 1.4 percent internal migration among the German Länder, 1.7 percent internal migration among the Swiss cantons, and 2.2 percent interstate migration in the United States. What explains these poor European labour-market outcomes? There is no doubt that the post-crisis economic environment has compounded the employment situation, but many structural labour-market issues were apparent well before 2008.
Moreover, the stark differences observed in the outcomes of various European countries point towards the importance of different labour-market regulations and institutions in determining the performance across the business cycle (Exhibit 77). 134 McKinsey Global Institute 2. Reform—much of it national—can deliver growth . Exhibit 77 Regulation and institutions determine how well a national labour market works for employers and employees Labour-market regulation and institutions during the job life cycle â–ª Wage-setting mechanisms such as â–ª â–ª The generosity of (and constraints on) unemployment benefits shapes the incentives for the unemployed and inactive to return to the labour market Active labour-market policies support the unemployed in their job search, e.g., through training and matching â–ª Seeking employment centralised bargaining determine the costs and conditions of employment The tax wedge on remuneration also affects the cost of keeping people employed During employment Exiting employment â–ª Employment protection legislation affects the degree of contract flexibility and labour mobility SOURCE: McKinsey Global Institute analysis European labour markets have often been characterised as falling into four different social models: Anglo-Saxon, Continental/Germanic, Nordic, and Mediterranean (Exhibit 78).189 Three of these archetypes have achieved more favourable labour-market outcomes: the Anglo-Saxon countries with a highly flexible liberal model, the Germanic countries in Continental Europe with a cooperative model supporting (re-)entry into employment, and the Nordic countries with a flexicurity model that combines relatively flexible labour markets with high support for the unemployed. In recent years, some Mediterranean countries, notably Portugal, Spain, and Greece, have made considerable progress towards making their labour markets more flexible. It is vital that others emulate some form of the successful arrangements in order to boost employment and ensure that businesses have access to the workers they need. The liberal Anglo-Saxon model is characterised by very low unemployment protection. It prevails in the United Kingdom, Ireland, and, to a lesser extent, Eastern European countries such as Poland.
While the highly flexible Anglo-Saxon model provides only limited support for job seekers, modest unemployment benefits ensure high personal incentives for reentry into employment. The tax wedges between labour costs and take-home income in the United Kingdom, Ireland, and Poland are at the bottom end of the OECD spectrum. André Sapir, “Globalization and the reform of European social models”, Journal of Common Market Studies, volume 44, number 2, June 2006. 189 McKinsey Global Institute A window of opportunity for Europe 135 . Exhibit 78 There are four main labour-market archetypes Labour-market regulation and institutions across the employment life cycle Employment protection legislation, 2013 OECD indicator on the protection of regular contracts against dismissals1 Anglo-Saxon 1.6 0.4 Continental/ Germanic Nordic Spending on active labour-market policies, 2011 Active measures2 (% of GDP) 0.9 2.4 Europe 1.0 2.7 2.5 OECD 31.1 2.9 Mediterranean 2.3 0.6 0.7 0.4 Tax wedge on labour costs, 2013 Income tax plus social security contributions (% of labour costs) Labour-market outcomes, 2013 % Employment rate Unemployment rate 70 45.2 43.0 45.4 41.4 35.9 8 73 6 73 7 58 16 64 11 65 8 1 Scale: 0 = least restrictive, 6 = most restrictive; weightings: 5/7 weight on individual dismissals, 2/7 weight on collective dismissals. 2 Including placement services, training, employment or start-up incentives, supported employment and rehabilitation, and job-creation measures. NOTE: Anglo-Saxon = United Kingdom and Ireland; Continental/Germanic = Germany, Austria, Switzerland, Belgium, and Netherlands; Nordics = Denmark, Norway, Sweden, and Finland; Mediterranean = France, Italy, Spain, Portugal, and Greece. SOURCE: OECD; Eurostat; McKinsey Global Institute analysis The second archetype is the coordinated Continental/Germanic model, typified by Germany and Austria and characterised by widespread tripartite cooperation. Belgium and the Netherlands also fall within this archetype. While employment protection is high and labour-market flexibility low, an extensive infrastructure ranging from vocational training to short-term working schemes help keep employment levels relatively high and resilient in times of downturns. In contrast to the extensive active labour-market policies, passive unemployment benefits are subject to tight eligibility criteria, underpinning the incentives for the unemployed and inactive to pick up employment.
Moreover, a significant degree of wage restraint is embedded in the coordinated bargaining process of Germany and Austria and partly offsets the high tax wedge on employment. Indeed, Continental Europe is the only European region in which real labour costs did not increase between 2000 and 2008, driven by German wage moderation. Since the crisis, however, real labour costs have declined in all European regions. The third archetype is the Nordic model, typified by the Danish system of flexicurity.
This approach balances high labour-market flexibility with high levels of support for those seeking employment. With a significant degree of tripartite cooperation, the Nordic countries also benefit from wage restraint in coordinated bargaining systems while maintaining a relatively high tax wedge on labour costs.190 The Danish labour-market reforms in the 1990s that began to develop the country’s flexicurity model enabled a sharp fall in unemployment. Between 1993 and 2008, Danish unemployment dropped from 8.9 percent to 2.5 percent, while during the same period EU-wide unemployment decreased from 8.2 percent to only Jan Hendeliowitz, Danish employment policy: National target setting, regional performance management and local delivery, Danish National Labour Market Authority, February 2008. 190 . 6.0 percent. The Danish reforms included a partial decentralisation of wage bargaining, a tightening of eligibility criteria for unemployment benefits, and the strengthening of active labour-market policies focused on upgrading the skills of those unemployed. In 2008, Denmark spent 1.3 percent of GDP on such programmes.191 A less successful approach has been typical in Southern Europe and France. This Mediterranean model is characterised by high employment protection for permanent workers, high tax wedges on labour incomes, and high unemployment benefits, while providing limited support to activate the unemployed.
Partly in consequence, the Mediterranean countries have suffered from high unemployment and high social expenditure, especially since the 2008 crisis. Moreover, the duality between highly protected permanent workers and less protected temporary workers has led to young people being particularly vulnerable in the labour market. In recent years, some Southern European countries, notably Greece, Portugal, and Spain, have made considerable progress in making their labour markets more flexible.
However, reform efforts are still lacking in France and Italy, though in the latter case legislation is being prepared that proposes greater labour flexibility and reform of unemployment-related social protection. Initiatives to change the game Reforming Europe’s labour markets could increase GDP growth between 0.1 percent and 0.2 percent a year. The IMF and the ECB estimate that growth would increase by 0.1 percent per year if Europe were to close half of the gap with “best-in-class” OECD countries in terms of looser employment protection legislation, moderate unemployment benefits, and more assertive active labour-market policies.192 Of this total, 0.04 percent would come from each of employment protection legislation and unemployment benefits, and 0.01 percent from active labour-market policies. Other estimates point towards a higher impact from labourmarket flexibility.
The OECD has estimated that a 0.5-point reduction in the employment protection legislation score could result in a 0.3 percentage point increase in labour productivity growth in the business sector.193 This would imply an impact on growth of between 0.1 and 0.2 percent for the same change in employment protection legislation. While we suggest some specific labour-market reforms, it is important to note that the problems of unemployment in Europe are multifaceted and country-specific and that there is no “one-size-fits-all” solution at the national or EU level. Moreover, individual labour-market policies or reforms are most effective when they are part of a comprehensive strategy that is consistent with the particular institutional context in individual countries.194 Our analysis suggests that the following should be considered as potential cornerstones of that strategy: ƒƒ Reduce employment protection and labour taxes to incentivise hiring, particularly for younger workers. While the impact of employment protection on overall unemployment is ambiguous, high employment protection for permanent contracts can exacerbate the duality between permanent and temporary employees as well Beyond austerity: A path to economic growth and renewal in Europe, McKinsey Global Institute, October 2010. 192 The assumptions behind this calculation are as follows: reduction of half the gap on employment protection legislation to the average of the three lowest levels in the OECD (Canada, the United Kingdom, and the United States); reduction in half of the gap in the average replacement rate of unemployment benefits relative to the average within a set of countries with low replacement rates (Australia, Canada, Japan, New Zealand, the United Kingdom, and the United States); increase in the ratio of spending on active labour-market policies relative to six OECD countries with high spending (Austria, Denmark, the Netherlands, Norway, Sweden, and Switzerland).
We assume that 80 percent of the long-term potential (to 2060) is realised by 2025. See Derek Anderson et al., “Assessing the gains from structural reforms for jobs and growth”, in Jobs and growth: Supporting the European recovery, Martin Shindler et al., eds., IMF, 2014. 193 The 2012 labour market reform in Spain: A preliminary assessment, OECD, December 2013. 194 Euro area policies: 2014 Article IV consultation, selected issues, IMF Country Report number 14/199, July 2014; Andrea Bassanini and Romain Duval, “The determinants of unemployment across OECD countries: Reassessing the role of policies and institutions”, OECD Economic Studies, number 42, issue 1, 2006. 191 McKinsey Global Institute A window of opportunity for Europe 137 . as between older and younger employees.195 Elevated hiring costs due to high tax wedges are associated with lower employment across groups, while high minimum wages particularly affect younger workers.196 The Spanish labour-market reforms in 2012 focused on introducing greater flexibility in wage-setting and working conditions and making work contracts more flexible, particularly for small businesses. The OECD estimates that these reforms will result in a longer-term decline in unit labour costs of up to 2 percent and in an increase in annual labour productivity growth by 0.25 percent, while reducing the bifurcation between permanent and temporary workers (Exhibit 79).197 Exhibit 79 Some Southern European countries have made considerable progress in making their labour markets more flexible and reducing bifurcation Labour-market reform and labour-market bifurcation, 2008–12 Nordics Continental Europe United Kingdom and Ireland Southern Europe Baltics Central and Eastern Europe Change in temporary share of employment Percentage points 2.5 Slovakia 2.0 Hungary 1.5 Estonia 1.0 Ireland Luxembourg Netherlands United Kingdom 0.5 Czech Republic Italy France 0 Finland Austria Poland Denmark Belgium Switzerland Slovenia -0.5 Norway Germany -1.0 -1.5 -2.0 Greece Portugal -5.5 -6.0 -0.90 Spain -0.50 -0.45 -0.40 -0.35 -0.30 -0.25 -0.20 -0.15 -0.10 -0.05 0 0.05 0.10 Change in employment protection legislation score for regular contracts Points SOURCE: OECD Indicators of Employment Protection; McKinsey Global Institute analysis Ibid. Ana Rincon-Aznar and W. S. Siebert, Employment protection, productivity, wages and jobs in Europe, INDICSER discussion paper number 36, December 2012; Euro area policies: 2014 Article IV consultation, selected issues, IMF Country Report number 14/1999, July 2014. 197 The 2012 labour market reform in Spain: A preliminary assessment, OECD, December 2013. 195 196 138 McKinsey Global Institute 2.
Reform—much of it national—can deliver growth . ƒƒ Adopt more assertive active labour-market policies at the expense of passive benefits. Stepping up active labour-market policies (for instance, training and matching employment seekers with vacancies) while tightening eligibility criteria for unemployment benefits is generally associated with an increase in employment, although the effectiveness varies by the type of the programme.198 The German Hartz reforms of 2002 to 2005 combined a strengthening of active labour-market policies with a comprehensive reform of passive unemployment benefits, which included tightening of eligibility criteria, shortening of payment durations and reduction of amounts.199 This combination attempts to activate the unemployed in their search for work, while supporting them in the process. It is widely held that these reforms, alongside the existing extensive active labour-market policies, contributed to Germany’s favourable employment outcomes.200 ƒƒ Intensify efforts to make the single labour market work. Increasing labour mobility among European countries can help improve the matching of workers and jobs across countries.
While personal, cultural, and language barriers likely dwarf administrative or policy-induced barriers to migration, there are some measures policy makers can take to improve the functioning of the European Single Market.201 For instance, promoting English-language education across the EU as well as enhancing the provision of training in local languages could ease the path for people seeking jobs outside their home country. Another useful step would be to improve the coordination of job centres and employment agencies to help match available workers with available jobs. A system in which professional qualifications in one country are recognised in another and pensions are transferable would further reduce friction. 100K Germany, where unemployment is among the lowest in the EU, has made proactive efforts to attract EU nationals from countries with higher unemployment, for example, through a “permanent co-operation bridge” between Spanish and German job centres. In 2013, there was a net influx of more than 100,000 Southern Europeans—40,000 of whom were Italian—into Germany.
That compares with annual figures of only about 40,000 prior to the crisis. However, there is considerable room for growth, as no other region has yet reached the mobility levels of Central and Eastern Europe, the region from which almost 500,000 people net moved to Germany in 2013. Southern Europeans migrated to Germany in 2013 A common European unemployment insurance scheme is a complementary tool to mitigate asymmetric business cycles in Europe, and particularly the Eurozone. It serves as an automatic stabiliser transferring funds from booming regions to those in recession, thus helping to offset the consequences of negative economic shocks.
As long as the unemployment benefits funded under such a scheme are limited to a relatively short duration (say, less than one year), they remain linked to the economic cycle rather than to structural differences and therefore would not result in systematic fiscal transfers across countries over the business cycle.202 As a consequence, every country should, at times, become a net contributor as well as a beneficiary. The European Parliament estimates Andrea Bassanini and Romain Duval, “The determinants of unemployment across OECD countries: Reassessing the role of policies and institutions”, OECD Economic Studies, number 42, issue 1, 2006; Euro area policies: 2014 Article IV Consultation, selected issues, IMF Country Report number 14/1999, July 2014. 199 For example, reform and expansion of federal job centres as well as start-up grants for the unemployed transitioning into self-employment. 200 See, for example, Tom Krebs and Martin Scheffel, “Macroeconomic evaluation of labor market reform in Germany”, IMF Economic Review, volume 61, number 4, December 2013. 201 Internal market, Special Eurobarometer 398, European Commission, October 2013. 202 Sebastian Dullien and Ferdinand Fichtner, “A common unemployment insurance system for the euro area”, DIW Economic Bulletin, volume 3, issue 1, January 2013. 198 McKinsey Global Institute A window of opportunity for Europe 139 . that an integrated scheme for short-term unemployment benefits would have attenuated the GDP loss in the most affected countries of the Eurozone by €15 billion per year.203 ••• The 11 growth drivers discussed in this chapter together would constitute a sweeping programme of reform that has the potential to transform Europe’s growth prospects. It is notable that three-quarters of them can be put in place at the national, rather than the EU, level—holding out the promise of real change that doesn’t rely on the complexities of European decision making. However, it is highly unlikely that the transformative change that they could deliver will be possible without strong investment and job creation in Europe to pay for the up-front investment needed, and to ease the transition and make reform palatable to Europe’s citizens. We turn to the question of investment and job creation in the next chapter. Joseph Dunne, Mapping the costs of non-Europe, 2014–19, European Parliamentary Research Service, March 2014. 203 140 McKinsey Global Institute 2.
Reform—much of it national—can deliver growth . © Getty Images McKinsey Global Institute A window of opportunity for Europe 141 . Chapter photo Chapter 3: Orange scientists © Getty Images 142 McKinsey Global Institute 2. Reform—much of it national—can deliver growth . 3. HOW EUROPE CAN REIGNITE INVESTMENT AND JOB CREATION A programme of structural reform based on the 11 growth drivers that we have discussed has the power to profoundly change the way the European economy works, boosting productivity and competitiveness in the long term. But such a programme will cost money in the short term. This is the nub of Europe’s challenge.
The continent needs reform to boost the long-term performance of the economy to meet Europeans’ economic and societal aspirations. But, in order to reform and produce healthier long-term growth, Europe needs more investment and job creation in the short term. Europe has a significant demand deficit, leaving the continental economy to rely largely on exports to drive the recovery thus far. Households are attempting to deleverage, corporations are piling up cash rather than investing because of the uncertain economic outlook, and the public sector has embarked on austerity policies to keep debt levels under control.
While each sector is acting rationally in its own right, the result is that aggregate demand remains weak. Output overall remains 15 percent below where it would have been on pre-crisis trends. Many proposals have been made on how investment and job creation could be unleashed, but discussion to date has tended to focus narrowly on the magnitude and composition of a QE programme and on the capacity for fiscal stimulus. Europe needs to engage urgently in a robust and unbiased debate on a broader range of investment and job creation options. Some options are comparatively feasible.
For example, there could be moderate increases in some government deficits in line with the Fiscal Compact. Others, such as central bank– financed spending vouchers, are bolder and more radical, requiring a substantial shift in thinking. This does not mean that they should be dismissed.
Rather, their merits and drawbacks should be debated in the public and political arena so that Europe can create innovative solutions to its investment and job creation crisis. We acknowledge that there is bound to be nervousness about some measures for stimulating investment and job creation. Decision makers and citizens are rightly concerned about any unsustainable spending. All the options we discuss in this chapter entail risk and possibly unintended, often distributional, consequences.
But the status quo has significant risks, too. The onus is therefore on policy makers to find ways to enable additional public and private spending that is sustainable. Only by doing so will Europe be able to put in place a credible programme of reform that enhances the continent’s long-term competitiveness and growth prospects. .
Successful reform requires productive investment and demand for jobs—and vice versa Many growth drivers will be difficult to implement without more spending. Those that invest for the future could require additional spending of between 1.7 percent and 3.7 percent of European GDP per annum (Exhibit 80).204 For example, developing competitive cities will require the construction of more good-quality affordable housing and transport infrastructure.205 Establishing a more nurturing environment for innovation will require governments to gear public procurement towards R&D-intensive goods and services. Exhibit 80 To be put into practice, the growth drivers will require investment and stronger demand to create jobs Up-front investment required Estimated annual outlay1 % of Europe-30 GDP Nurturing ecosystem for innovation Effective education to employment Investing for the future 0.6–1.6 0.4–0.7 Supporting urban development Stronger demand required to create jobs and make reforms palatable Competitive and integrated markets in services and digital 0.4–0.5 Productive infrastructure investment Reduced energy burden Total Boosting productivity Public-sector productivity Further openness to trade Grey and female labour-force participation 0.3–0.9 Mobilising the workforce 1.7–3.7 Pro-growth immigration Enhanced labourmarket flexibility 1 Estimate assumptions are in the appendix. SOURCE: McKinsey Global Institute analysis Many of the growth drivers involve substantial transitional costs to society. Those that mobilise the workforce may not be palatable to many citizens—and are therefore not politically feasible while investment and job creation are weak and unemployment high. They could exacerbate a difficult economic context in the short term even while likely to produce favourable outcomes in the longer term.
Although, for example, enhancing labour-market flexibility will help the economy over the long haul, many individuals may be negatively Costs are calculated at the country level and aggregated for Europe. The cost of an improved innovation ecosystem is based on the gap between the proportion of R&D spending in the private and public sectors together among European countries and the international top performer (South Korea) and the third-best performer (the United States). Education costs are estimated based on the gap between each country and average spending as a share of GDP among countries that score highly on the effective education-toemployment growth driver, corrected for the number of students in each country.
Affordable housing draws on the 2014 MGI report A blueprint for addressing the global affordable housing challenge and takes the estimate of the cost to raise housing across Europe to the minimally acceptable standard. Costs are allocated to countries, where specific estimate is not available, on the basis of severe housing deprivation from Eurostat’s SILC data set. The cost of future infrastructure needs is calculated based on the range of projected GDPgrowth rates and the methodology developed in the 2013 MGI report Infrastructure productivity: How to save $1 trillion a year. 205 A blueprint for addressing the global affordable housing challenge, McKinsey Global Institute, October 2014. 204 144 McKinsey Global Institute 3.
How Europe can reignite investment and job creation . affected in the short term.206 Further openness to trade can harm those working in sectors that are newly exposed to global competition. Growth drivers that boost productivity involve difficult transitions as economies rebalance and companies and public organisations restructure. Such transitions are difficult even in benign phases of an economic cycle and are all but politically impossible when those who may lose their jobs in the process will find it hard to find another one. Helping those whose economic prospects are hurt by the transition may require generous outlays. In addition to the direct and indirect costs of implementing the growth drivers, there is a broader need for a positive demand environment that can help create jobs. This can make many reforms easier.
For example, increasing female and grey labour participation or immigration at a time of already high unemployment will be difficult. Policy makers may find that political resistance to trade agreements is too strong when voters feel economically insecure. Of course, some of the reforms can themselves trigger private investment and therefore stimulate investment and job creation. For instance, greater immigration may require investment in housing and create opportunities for local service firms such as retailers. Progress on building a single market in energy or telecoms and clarity on regulation in those sectors could unleash investment in the respective infrastructure. Spain's R&D budget needs to increase by €24B to match that of South Korea In practice, European countries will need to prioritise reforms that meet their most pressing needs.
Regardless of which items in the menu of growth drivers a country chooses to implement, there will be substantial additional costs that will not be met in the current demand context. For instance, Spain’s education-to-employment system is in need of an overhaul, and its total R&D budget would need to increase by €24 billion to almost three times its current level in order to reach South Korea’s R&D share of GDP. At the same time, Spain’s infrastructure spending is near or above the level required for expected long-term GDP growth, suggesting that additional resources devoted to infrastructure are unlikely to be productive.
Similarly, Italy has a large need for further spending on education and innovation. In contrast, Germany already has relatively high levels of R&D spending but spends €14 billion less on infrastructure than would be suitable for long-term GDP growth. Germany also spends relatively little on education to employment as a share of GDP and controlling for the number of students—almost €30 billion less per year than what would be expected. A gap in aggregate demand persists in all domestic sectors of the economy, leaving Europe to rely on net exports Seven years on from the global recession of 2008, the European economy is running well below its long-term potential. Thus far, Europe has relied on net exports—despite the weakness of the world economy—while all other sources of demand remain constrained. Accommodative monetary policy has not compensated, and it cannot on its own compensate for weak demand.
All sectors will need to play their part to overcome Europe’s demand deficit and thereby help to build the platform needed for structural reform. Daiji Kawaguchi and Tetsushi Murao, Labor market institutions and long-term effects of youth unemployment, IZA discussion paper number 8156, April 2014. 206 McKinsey Global Institute A window of opportunity for Europe 145 . A large output gap persists In 2014, Europe was still running an output gap—the difference between the actual GDP and the potential capacity of existing labour and capital—of 2.4 to 2.7 percent of GDP, according to the European Commission, the IMF, and the OECD.207 That is slightly more than the size of the economies of Greece and Ireland combined.208 There are other ways to measure how much the economy is running below its potential. For instance, real potential output growth has dropped from 2 percent a year before the crisis to 0.7 percent per annum (Exhibit 81). This has left Europe’s economy at 10 percent below its pre-crisis potential output trend. The drop in the potential output growth rate stems from factors including a loss in human capital due to long-term unemployment, falling investment, and a rebalancing of the economy resulting in a glut of unproductive assets in some sectors. Looking at actual output, extrapolating from the pre-crisis trend that in the mid-2000s was running ahead of potential output suggests that the output of the European economy is currently around 15 percent below where it would have been if the crisis had not occurred. Exhibit 81 Across all measures, output has significantly lagged behind the potential of the European economy Europe-28 actual vs.
potential output 2010 chain-linked € trillion Actual output Potential output1 Extrapolated pre-crisis actual2 Extrapolated pre-crisis potential3 16.0 Output gap % of GDP 15.5 15.0 14.5 -15.4 14.0 -10.0 13.5 -2.4 13.0 12.5 12.0 11.5 2004 05 06 07 08 09 10 11 12 13 2014 Forecast 1 “Potential output” describes the productive capacity of an economy in case of sustainable use of available labour, capital, and technologies. 2 “Extrapolated pre-crisis actual” assumes real growth continues at same rate as it did during the pre-crisis boom years. This would have been unsustainable even in the old economy. 3 “Extrapolated pre-crisis potential” assumes that potential GDP continues to grow at same rate as it did pre-crisis. In this regime, sustainable growth could have occurred faster. SOURCE: European Commission; OECD; McKinsey Global Institute analysis Based on European Commission (2.4 percent for the EU-28), IMF (2.5 percent excluding countries amounting to 6.9 percent of EU-28 GDP for which data were not available), and OECD (2.7 percent excluding countries amounting to 3.3 percent of EU-28 GDP for which data were not available). 208 Output gaps cannot be directly observed from the economy and are therefore subject to a great deal of uncertainty.
While they are usually directionally correct, revisions to the magnitude of output gaps are frequent and large. The average revision is 1.5 percent of GDP. See, for example, Karel Havik et al., The production function methodology for calculating potential growth rates and output gaps, European Commission economic paper number 535, November 2014, and Eugen Tereanu, Anita Tuladhar, and Alejandro Simone, Structural balance targeting and output gap uncertainty, IMF working paper number 14/107, June 2014. 207 146 McKinsey Global Institute 3.
How Europe can reignite investment and job creation . The European average masks a great deal of variation among countries (Exhibit 82). Greece has an output gap of 11 percent of GDP, and its economy’s output is 45 percent below its pre-crisis trend. Italy’s output gap amounts to nearly 5 percent of GDP and France’s to 2 percent of GDP. Germany and the United Kingdom are two major exceptions to the general picture of significant output gaps across Europe.
Both economies are running at approximately their estimated potential, although, like other European economies, still far below their pre-crisis trend.209 Exhibit 82 The output gap measures only a small part of the difference between European GDP today and where it would have been on pre-crisis trends Output gap Output gap and gap to position on pre-crisis trend1 % of potential GDP, 2014 (forecast) Germany -0.8 United Kingdom Spain -0.8 France Italy Greece Ireland Portugal -0.2 -2.3 -4.5 -6.0 -6.5 Gap to pre-crisis trend -5.0 -11.0 -15.4 -10.9 -13.5 -16.1 -25.9 -29.3 -44.7 1 Based on European Commission data. Pre-crisis trend defined from the geometric mean of actual real growth between 2002 and 2007. SOURCE: European Commission; IMF; OECD; McKinsey Global Institute analysis Countries with high output gaps are not using the full capacity of their economies, which leaves almost everyone worse off than they would otherwise be. Periods with large output gaps impose a substantial human cost and raise the risk of a “lost generation” as young people are forced out of the job market and lose the opportunity to develop the skills that would make them more productive in the future.210 It is no coincidence that roughly 75 percent of survey respondents in Spain and Italy, countries with high output gaps, say that they are unhappy or very unhappy with their countries compared with only 27 percent of respondents in Germany, whose output gap is close to zero (Exhibit 83).211 Estimates of Germany’s output gap come from the European Commission (-0.8 percent), the IMF (-0.6 percent), and OECD (0.1 percent). 210 Daiji Kawaguchi and Tetsushi Murao, Labor market institutions and long-term effects of youth unemployment, IZA discussion paper number 8156, April 2014. 211 MGI European Aspirations Conjoint Survey, August 2014 (N = 2,000 in each country). 209 McKinsey Global Institute A window of opportunity for Europe 147 .
Exhibit 83 European survey respondents in countries with high output gaps and unemployment tend to be significantly less satisfied Respondents “unhappy” or “very unhappy” with their country Weighted; % Unhappy Very unhappy 77 73 64 34 39 47 39 27 23 7 32 22 22 20 16 34 31 6 24 14 12 9 43 34 Poland Germany Sweden United Kingdom France Romania Spain Italy Output gap % of GDP, 2014 -0.8 -0.8 -1.6 -0.8 -2.3 -1.3 -6.0 -4.5 Unemployment rate %, 2013 10 5 8 8 11 7 26 12 NOTE: Numbers may not sum due to rounding. SOURCE: MGI European Aspirations Conjoint Survey, August 2014; World economic outlook: Recovery strengthens, remains uneven, IMF, April 2014; McKinsey Global Institute analysis Europe has had to rely on net exports to drive recovery while spending in all domestic sectors remains weak A rise in net exports has not been nearly enough to counteract contracting spending in all domestic sectors. Net exports as a share of GDP for Europe grew by 2.4 percentage points between 2008 and 2013, the only source of demand that grew significantly over the period (Exhibit 84).212 In contrast, the recovery in the United States has been mostly generated by the domestic economy. While net exports have performed strongly since the crisis in Europe, questions linger over how much further they can grow as the global economy remains weak and further imbalances can contribute to low economic growth elsewhere in the world, depressing destination markets. Much of the growth in net exports outside the EU came from Germany, which had increases in gross exports of greater than €100 billion between 2008 and 2013. 212 148 Where statistics on the European economy are cited without other clarification, they are based on the AMECO database. McKinsey Global Institute 3. How Europe can reignite investment and job creation .
This is a mixed blessing for the European economy. Export-led growth is susceptible to sudden changes in the external economic environment outside domestic policy makers’ control. High net exports can also be a symptom of weak domestic demand. At the same time, the Eurozone has started to rebalance. The economies of Southern Europe have strongly increased their net exports.
Spain increased its nominal net exports by €90 billion from 2008 to 2013, and Italy increased its by €45 billion over the same period. Such rebalancing can help the most troubled economies and will be required for longer-term sustainability. However, such rebalancing is difficult to achieve in a monetary union. Exhibit 84 Europe’s recovery has mainly come from exports despite a weak global economy, while the US recovery has been powered by domestic consumption Change in real GDP, 2008–13 % of real 2008 GDP Europe-30 GDP in 2005 € United States GDP in 2009 $ Real GDP 2008 100.0 Corporates -2.3 Households Public sector -1.2 0.3 100.0 1.0 4.6 -0.7 Net exports 2.4 0.9 Real GDP 2013 99.1 105.8 NOTE: Numbers may not sum due to rounding. SOURCE: Eurostat; AMECO database; US Bureau of Economic Analysis; National Export Initiative; McKinsey Global Institute analysis Meanwhile, companies, governments, and households have all been cutting their spending at the same time that they seek to reduce their debts. Public debt has ballooned since the financial crisis, but private sector balance sheet repair is slowly under way in Europe (Exhibit 85). McKinsey Global Institute A window of opportunity for Europe 149 .
Exhibit 85 Balance sheet repair is under way in private sectors in Europe Debt by sector in 20 major European economies, 1Q04–4Q131 % of GDP Lehman Brothers bankruptcy 110 Change since Lehman bankruptcy Percentage points 105 100 95 Non-financial corporations 90 Quarters of deleveraging since peak -2 18 Government +26 2 Households -1 18 85 80 75 70 65 60 55 50 2004 05 06 07 08 09 10 11 12 2013 1 Austria, Belgium, Czech Republic, Denmark, Finland, France, Germany, Greece, Hungary, Ireland, Italy, the Netherlands, Norway, Poland, Portugal, Romania, Slovakia, Spain, Sweden, and the United Kingdom. SOURCE: Haver Analytics; national central banks; McKinsey Global Institute analysis Corporations are piling up cash in response to weak demand Corporate investment has dropped precipitously in response to a fragile macroeconomic outlook and weak demand. If history is a guide, the trend will not reverse until public and household spending recover and grow. Access to, and the cost of, finance, in contrast, appear to be constraints mostly in the SME sector in those economies worst hit by the crisis. Corporate investment has historically made up 11 to 12 percent of GDP and lays the groundwork for future productivity growth. However, since 2008, corporate investment has fallen by 19 percent.
Corporate investment would need to increase by an estimated €200 billion to €250 billion to reach pre-crisis levels. Corporate cash holdings are hitting record highs. Europe’s 500 largest companies increased their excess cash holdings—the amount of cash over and above what they need for day-to-day operations—by 60 percent from 2008 to 2013 to nearly €800 billion (Exhibit 86).213 The cash holdings of SMEs have also risen but by less. Although many SMEs are finding it hard to get the financing they need, cash assets increased by 1.4 percentage “Excess cash holdings” are defined as the amount of cash above that needed to meet the day-to-day running of the company, estimated as cash above 2 percent of revenue.
See McKinsey Corporate Performance Analysis Tool, 2013. 213 150 McKinsey Global Institute 3. How Europe can reignite investment and job creation . points as a share of turnover between 2008 and 2012.214 Since SMEs generate 60 percent of value added in the EU-28, this build-up of cash is significant.215 Exhibit 86 Corporations are piling up cash, citing weak demand and regulation—not credit—as the primary obstacles to investment Excess cash holdings of Europe’s 500 largest companies (by revenue)2 € billion 800 High Investment barriers % of respondents citing high or medium barriers, 20133 Macroeconomic outlook 750 Medium 67 Regulation 700 56 Product structure and economics 650 +60% 600 24 Taxes and incentives 23 21 Market infrastructure 550 Information and transparency 16 500 Internal governance and capabilities 16 450 2008 09 11 10 12 2013 Accounting principles 10 1 Potential borrowing capacity for September and December 2014 long-term refinancing operations (LTRO) combined. 2 “Excess cash” defined as cash above 2% of revenue. Data used for 457 companies for which excess cash figures above zero were available for the full sample 2008–13. 3 Interviews with executives of 36 large corporations with combined revenue of €400 billion commissioned by the Association for Financial Markets in Europe (AFME). SOURCE: McKinsey Corporate Performance Analysis Tool; Unlocking funding for European investment and growth, AFME, 2013; McKinsey Global Institute analysis Corporations are piling up cash largely because of weak demand. In a recent survey, respondents from 67 percent of a selection of large corporations in France, Germany, Italy, Portugal, Spain, and the United Kingdom ranked the macroeconomic outlook as a high or medium barrier to investment—higher than regulation or taxes.216 A historical review of recessions characterised by large declines in private investment reveals that the recovery of the broader economy typically leads the rebound in private investment by several years (Exhibit 87).217 This is likely due to businesses first working through their overcapacity before building up additional capital stock. BACH database from the Banque de France, data pulled in 2014 but available only to 2011. Data are from Austria, Belgium, Czech Republic, France, Germany, Italy, Poland, Portugal, Spain, and Slovakia weighted by turnover.
SME is defined as an organisation with turnover of less than €50 million. 215 Survey on the access to finance of enterprises in the euro area, European Central Bank, November 2014. Note that this figure is based on defining SMEs as having fewer than 250 employees, which is different from the BACH definition. Also see Patrice Muller et al., Annual report on European SMEs 2013/2014: A partial and fragile recovery, Final report, European Commission, July 2014. 216 Unlocking funding for European investment and growth: An industry survey of obstacles in the European funding markets and potential solutions, Association for Financial Markets in Europe, 2013. AFME surveyed 32 large European corporations. 217 Investing in growth: Europe’s next challenge, McKinsey Global Institute, December 2012. 214 McKinsey Global Institute A window of opportunity for Europe 151 .
Exhibit 87 Private investment typically recovers with a lag compared with the overall economy Private investment and GDP indexed to 100 in the year prior to each recession identified1 Current crisis GDP middle quartiles Private investment middle quartiles Index: 100 = peak real GDP prior to recession 150 140 130 120 110 100 90 80 70 0 1 2 3 4 5 6 7 8 9 10 Years following recession 1 Episodes in which private investment fell at least 10% from GDP peak to GDP trough, excluding 17 episodes when private investment fell by less than 10%. All values in year zero are equal to 100 since private investment is indexed to 100 in that year. NOTE: Data for 2014 not yet available for real GDP. SOURCE: Investing in growth: Europe’s next challenge, McKinsey Global Institute, December 2012; McKinsey Global Institute analysis Relatively few business leaders complain that access to financing is a substantial barrier to investment (Exhibit 88). In 2014, only 11 percent of executives from large companies expressed the view that access to finance is the most pressing problem their organisation faces. For businesses with fewer than ten employees, the equivalent figure is 15 percent, down from 21 percent in 2009.218 Corporate lending rates have fallen to roughly 3 percent in most large European economies.219 However, there are still pockets of Europe in which potentially creditworthy borrowers are finding it difficult to access finance.
For the very smallest enterprises, and particularly those in peripheral economies where liquidity is still not universally present, access to finance can represent a potential barrier to investment. In some countries, the situation is far more severe; 55 percent of Greek SME executives have said that on a scale of 1 (no need) to 10 (high need), their need for finance in 2014 was 8 or more. Survey on the access to finance of enterprises in the euro area, European Central Bank, H1 2014. ECB statistical data warehouse. 218 219 152 McKinsey Global Institute 3. How Europe can reignite investment and job creation .
Exhibit 88 Access to finance has improved for firms of all sizes since 2009, and the gap between large firms and the rest has shrunk Financing constraints by company size, 2009–14 % of executives responding that “access to finance” is “currently the most pressing problem your firm is facing” 21 19 15 Micro <10 employees 2009 2014 17 13 Small 10–49 employees 64% 11 Medium 50–249 employees 13 11 35% Large >250 employees SOURCE: Survey on the access to finance of enterprises in the euro area, ECB, November 2014; McKinsey Global Institute analysis Governments have embarked on austerity in order to control debt levels For fear that public debt levels are unsustainable, fiscal stimulus in Europe has been shorter and less aggressive than it has been in the United States. The focus of European governments has moved to consolidation, public investment has been cut, and European economies have reinforced their commitment to containing debt and deficit levels through the Fiscal Compact. But slow growth and low inflation have nonetheless resulted in an increase in public debt levels of close to 30 percentage points of GDP since the crisis. Deficit cutting has become an imperative for European governments because of concern over the effect of rising—and potentially unsustainable—sovereign debt levels. Research suggests that when debt rises above around 90 to 100 percent as a share of GDP, it becomes much less sustainable and begins to have a negative impact on growth (although the debate is not fully settled on this point).220 Average European government debt stood at 85 percent of GDP in 2014.
The sovereign debt burden is especially high in Belgium, Greece, Ireland, Italy, and Portugal, each of which has a sovereign debt-to-GDP ratio in excess of 100 percent (Exhibit 89). Some of Europe’s largest economies, including Germany, France, and the United Kingdom, have public-sector debt ratios of 75 to 100 percent of GDP. Silvia Ardagna, Francesco Caselli, and Timothy Lane, Fiscal discipline and the cost of public debt service: Some estimates for OECD countries, NBER working paper number 10788, September 2004; Cristina D. Checherita-Westphal and Philipp Rother, The impact of high and growing government debt on economic growth: An empirical investigation for the euro area, European Central Bank working paper number 1237, August 2010. 220 McKinsey Global Institute A window of opportunity for Europe 153 . Exhibit 89 European governments have limited capacity to further stimulate and invest in growth Government debt1 and fiscal balance by Europe-30 country % of GDP debt Size = Population, 2013 Nordics Continental Europe EU target United Kingdom and Ireland Southern Europe Baltics Central and Eastern Europe Fiscal balance, 2013 15 Norway 10 Germany 5 Switzerland 0 France Italy Sweden -5 Portugal Poland Ireland -10 United Kingdom Spain Greece -15 10 20 30 40 50 60 70 80 90 100 110 120 130 140 150 160 170 Gross government debt1, 20132 1 Includes all non-consolidated loans and fixed-income securities. 2 Or latest available. SOURCE: Haver Analytics; national central banks; Eurostat, McKinsey Global Institute analysis Government spending increased during the recession as automatic stabilisers and stimulus kicked in. However, most of this stimulus has ended. In 2013, the government spending share of GDP was only marginally higher than it was in 2008. There has been a shift away from investment towards government consumption. Government investment cumulatively fell by 16 percent between 2008 and 2014 while consumption grew by 3 percent. This largely reflects the fact that the slow recovery has meant that automatic stabilisers such as unemployment benefits have remained in place while discretionary investment spending has been cut as governments seek to meet deficit reduction targets. Stimulus in Europe, particularly in the Eurozone, was shorter and less aggressive than that in the United States (Exhibit 90).
Between 2008 and 2010, the Eurozone’s fiscal stimulus was 4.7 percent of GDP and the United Kingdom’s was 6.9 percent of GDP compared with 8.9 percent of GDP in the United States. About three-quarters of the US stimulus came from an uptick in discretionary spending; in the Eurozone, that share was only one-third. Because fiscal stimulus in the United States coincided with the depth of the recession, the effective fiscal multiplier on the stimulus was much larger than it was in Europe, contributing to more robust growth afterwards (although we note that the exact effect of government spending on output is uncertain). 154 McKinsey Global Institute 3.
How Europe can reignite investment and job creation . Exhibit 90 The Eurozone gave a comparatively small fiscal stimulus after the crisis and experienced a slow recovery Change in real GDP and fiscal impulse, 2007–10 and 2010–131 % of start of period GDP Real GDP Fiscal impulse, including the effect of fiscal multipliers Fiscal impulse, direct effect United States 2008–10 United Kingdom Eurozone 19.5 12.2 7.9 6.9 8.9 -0.6 2011–13 -2.2 -4.3 6.3 4.7 3.1 0.5 -2.2 -6.7 -0.6 -5.6 -3.4 -3.8 1 “Fiscal Impulse” is defined as the negative change in deficits. NOTE: The effect of fiscal multipliers on the cumulative effect is large, although there is a great deal of uncertainty about its size. The fiscal multiplier during recession is estimated to be large (United States: 2.18; Eurozone: 2.56; UK: 1.0) while the multiplier outside of a recession is small (United States: 0.33; Eurozone: 0.43, UK: 0.1). The timing of fiscal impulse therefore plays a large role it its effectiveness. SOURCE: Batini et al, 2012; Eurostat; FRED; McKinsey Global Institute analysis Not only was fiscal policy more aggressive and better timed in the United States, but monetary policy was, too (Exhibit 91). This can partly explain why demand has been slower to recover in Europe than in the United States. Average European government deficit 4.6 percentage points smaller than US deficit over past 7 years McKinsey Global Institute Real per capita GDP, population, and prices have all grown faster in the United States, and therefore debt as a proportion of GDP has grown less quickly despite high borrowing. Roughly half of the gap in real GDP growth between the United States and Europe is attributable to population growth rates.
Although the average European annual general government deficit has been 4.6 percentage points smaller on average than the deficit in the United States over the past seven years, this has resulted in an increase in debt levels over the period that was only eleven percentage points lower than in the United States (Exhibit 92). A window of opportunity for Europe 155 . Exhibit 91 The United States acted faster and more decisively than Europe in response to financial and economic crisis ILLUSTRATIVE EXAMPLES United States Eurozone Timeline (crisis in Europe occurred approximately 1–2 quarters later than in the United States) Decision domain Action 2009 2010 2011 2012 Acting as lender of last resort NOV US agency debt ($175B) and mortgagebacked securities ($1.25T) JUL Covered Bond Purchase (€60B in first round) MAY Initiated Securities Market Programme to buy government bonds (€220B) Maturity Extension Program: buying long-term and selling short-term securities JUL Draghi’s “do whatever it takes” speech Funds rate Central banks 2007 2008 DEC Lowered funds rate to 0–0.25% MAY Reached policy rate of 1% MBS purchases also provided liquidity MAR Extended purchases to Treasury securities ($900B to Increase of mid-2012) liquidity and higher provision to volumes banking sector Liquidity provision, securities purchases, QE OCT Troubled Asset Relief Program gives immediate relief to financial institutions Stress tests/ recapitalisation Bank cleanup 2013 2014 SEP Lowered policy rate to 0.05% Long-term refinancing operations (LTRO): 2011/12: ~€1T; targeted programme 2014 DEC Monthly asset purchases while unemployment >6.5%, totalling $1,665T MAY Supervisory Capital Assessment Program JAN 2015 €60T of monthly asset purchases up to September 2016 to reach inflation target OCT–NOV Comprehensive stress test and Single Supervisory Mechanism to monitor financial stability in force Bank nationalisations and recapitalisations ongoing beginning in 2008 in both the United States and Europe1 Bank stress tests in 2009, 2010, and 2011, but not assessed to be fully comprehensive Regional transfers Fiscal measures Regionwide stimulus Annual transfers between states accounting for 8.4% of GDP—as an example, Florida in 2013 received 17.9% of its GDP through federal transfers Intra-EU transfers at 1.6% of GDP only via EU budget, mostly structural, no automatic stabilizers Cumulative 2007–10 stimulus 8.9%2 of 2007 GDP Cumulative 2007–10 stimulus only 4.7%2 of 2007 GDP 1 European countries faced additional challenges as the banking sector is much larger as a percentage share of GDP than in the United States, requiring larger recapitalisation amounts and limiting countries' capacities to stem banking crises. 2 Combined discretionary and automatic fiscal impulses. SOURCE: ECB; Federal Reserve System; Congressional Research Service; European Commission; McKinsey Global Institute analysis 156 McKinsey Global Institute 3. How Europe can reignite investment and job creation . Exhibit 92 The US annual deficit was 4.6 percent larger on average between 2007 and 2013, but the country’s debt rose only 11 percentage points more than Europe’s 2007–13 % of GDP Europe Fiscal deficits1 United States General government debt 12.7 12.0 +41 p.p. 105 +29 p.p. 10.6 87 9.2 7.0 3.6 6.9 6.5 6.2 4.4 3.9 2.4 58 64 3.3 0.9 2007 2008 2009 2010 2011 2012 2013 2007 2013 2007 2013 1 EU-28 general government deficit under the excessive deficit procedure (EDP); US general government deficit; ESA 2010 and former definitions. NOTE: Numbers may not sum due to rounding. SOURCE: Eurostat; FRED; Haver Analytics; national central banks; McKinsey Global Institute analysis Households are slowly deleveraging Household demand is still weak as households cut investment in residential property while holding savings rates steady to slowly work through their burden of debt. Household spending fell by €154 billion in real 2005 terms between 2008 and 2013. More than 80 percent of this decline was due to a drop in household investment as the real estate boom collapsed. When asset prices fell sharply in 2008, many households were left with a larger debt burden—on the order of 70 percent of GDP in 2008—relative to the underlying assets than originally expected. However, the process of deleveraging has been slow.
In the final quarter of 2013, household debt as a percentage of GDP was only one percentage point below its level in the third quarter of 2008 when the financial crisis began in earnest—even after around five years of successive deleveraging. The fact that debts remain relatively high is constraining households from spending.221 Weak household demand cannot be explained by precautionary saving, but rather by a lack of demand for investment. Earlier in the recession households had faced high levels of uncertainty, and reacted to it by increasing their savings rates in order to ensure against future shocks.
These precautionary savings led to a spike in savings rates in 2009, reaching 13.2 percent of gross household disposable income across Europe. Savings rates have since stabilised at roughly their long-term trend levels of 11 percent (Exhibit 93). However, household investment has not recovered.
Indeed, 91 percent of the fall in household investment between 2007 and 2013 comes from only five economies—Greece, Ireland, Italy, Spain, and the United Kingdom. Spain was particularly badly affected by its housing bubble, with a decline of more than 50 percent in household investment. Karen Dynan, “Is a household debt overhang holding back consumption?” Brookings Papers on Economic Activity, spring 2012. 221 McKinsey Global Institute A window of opportunity for Europe 157 . Exhibit 93 Although household savings rates spiked in some countries following the crisis, in Europe as a whole these rates were largely unaffected Household savings rate % of household gross disposable income 18 16 14 12 EU United Kingdom 10 8 Spain Greece 6 4 2 0 -2 -4 -6 2003 Italy France Ireland 04 05 06 07 08 09 10 11 12 2013 NOTE: Greece, Bulgaria, Latvia, and Romania all have negative savings rates. This is because households in these countries are borrowing to consume, meaning that consumption is greater than gross disposable income. SOURCE: AMECO database; McKinsey Global Institute analysis The demand situation is very different among European economies Although clusters of European nations face very similar issues, the context can vary and decision makers cannot ignore differences among nations. Different European economies have very different capacities to spend to stimulate investment and job creation (Exhibit 94). ƒƒ Germany did not experience a housing bubble, and the economy is running at or near potential output. As a result, Germany is unique among major European economies in needing to focus on growth-enhancing reforms; aggregate demand would gain little from stimulus, despite the fact that Germany’s public sector is in a fairly solid fiscal position and would be capable of financing it.
However, although the German economy is growing, growth in household demand remains weak and corporate investment remains €24 billion below 2008 levels in nominal terms. ƒƒ Spain has experienced a housing bubble and subsequent asset write-downs followed by deleveraging in both the household and the corporate sectors. Spain faces an output gap of at least 5 percent of potential GDP as investment has collapsed and unemployment soared. Stimulating private spending in this deflationary environment will be difficult, particularly because the economy is now also hamstrung by a heavily indebted public sector after saving failing banks.
The country will need to rely on net exports or European support to change its demand situation. 158 McKinsey Global Institute 3. How Europe can reignite investment and job creation . ƒƒ The United Kingdom has similarly experienced a housing bubble, followed by a strong decline in household and corporate investment and high levels of debt. Despite public deficits that began larger than those in many other European nations and remain high at 5.4 percent of GDP, general government expenditure has contracted as a share of GDP since 2008 because both government revenue and expenditure grew more slowly than GDP. With its own currency, the United Kingdom has been engaging in more expansionary monetary policy than the Eurozone. Robust growth has returned. Corporations are becoming more optimistic.
Households continue to deleverage and have reduced debt substantially below 2008 levels. After dipping sharply, household investment has recovered and grown 8 percent in nominal terms since the crisis. The corporate sector continues to deleverage more slowly. ƒƒ In France, household debt was low before the crisis and remains small in comparison with other large European nations, but household investment is down after a steep increase in real estate prices.
Other sectors have experienced weak growth in nominal terms, while the trade balance is deteriorating. The public sector expanded by approximately four percentage points of GDP between 2008 and 2014 and has a deficit of 4.4 percent of GDP in continued violation of the Fiscal Compact. France still has a potential GDP output gap of 2.3 percent. ƒƒ Italy’s household debt remains low despite an increase before the crisis.
Household and business investment rates have declined slightly, and GDP growth has declined further from very low levels even before the crisis. Household consumption has hardly grown despite a material reduction in the savings rate as wage growth has been slow and even, at times, negative. Public debt, at around 128 percent of GDP, is very high.
Italy has been able to reduce its deficit below the threshold specified by the Fiscal Compact and run a primary surplus, but its debt is large enough that it will take many years to reach the debt target. Italy’s output gap—at almost 5 percent of potential GDP—remains one of the biggest of the large European nations. McKinsey Global Institute A window of opportunity for Europe 159 . Exhibit 94 The largest European economies have significantly different priorities and spending capacities % of GDP unless noted Domain Indicator Germany France Output gap to close -0.8 United Kingdom Sweden Spain Italy -2.3 -6.0 -4.5 -0.8 -1.6 -0.8 United States Europe1 -1.3 -0.5 -2.4 Poland Romania Net exports Current account balance 2007 7.0 -1.1 -9.6 -1.4 -2.7 9.0 -6.5 -14.0 -5.0 -0.5 2013 6.9 -2.0 1.5 1.0 -4.2 6.5 -1.4 -1.4 -2.5 1.4 -1.9 0.0 Corporate (non-financial) Corporate debt 2004 2008 2012/13/14 150 0 Business investment2 25 0 Household Household debt 100 0 Household investment2 10 0 20 Household savings rate3 % 0 Public Public debt 150 0 Fiscal capacity4 To reduce debt to 60% of GDP in 20 years (approx.) 1.3 -4.8 -8.2 -7.8 To reach 3% deficit 3.2 -1.4 -2.6 0.0 -2.4 0.6 -0.4 0.9 Investment opportunities2 2.0 2.3 3.4 4.6 2.4 0.9 6.5 12.9 1.7–3.7 1 Figures for Europe-30 where available, or extrapolated figures for subset (Europe-27, Europe-28, etc.). 2 Figures for business and household investments are defined as gross fixed capital formation expressed as a percentage of GDP for the business and households sectors. Investment opportunities listed under “Public” include a selection of private and public opportunities—and could include partnerships. 3 Household savings rates are gross saving as percentage of gross disposable income 4 Fiscal capacity under current debt rules assumes no effect on growth—United Kingdom, Sweden, and Poland are not bound by the Fiscal Compact debt reduction rules. NOTE: Not to scale. SOURCE: Eurostat; AMECO; IMF; FRED; McKinsey Global Institute analysis 160 McKinsey Global Institute 3. How Europe can reignite investment and job creation . Europe has several options for igniting investment and job creation Now is the time for Europe to consider all feasible options for igniting investment and job creation. While there are different economic schools of thought on demand (and the neoclassical view would negate the need for stimulus) the sector analysis in the previous section, in our view, provides proof that, without measures to shore up investment and job creation, a strong recovery seems difficult at best and Europe’s debt overhang will only increase (Exhibit 95). Exhibit 95 Outside of a neo-classical view of the crisis, measures will be required to stimulate investment and job creation Commonalities Neoclassical economics: Rational expectations (Robert Lucas) New Keynesianism: Liquidity trap (Paul Krugman) Post-Keynesian: Balance sheet recession (Richard Koo) Diagnosis of the ongoing crisis  Financial crisis as a temporary shock to the economy caused by a liquidity crisis  Stagnation as a consequence of overextension of the government in the economy (over-regulation and overspending on welfare)  Stagnation as consequence of uncertainty and volatility in private investment demand  After the crash, households have a higher propensity to save at any given interest rate,1 so that rates would have to drop sharply to spur spending (“liquidity trap” at the zero-lower bound)  Risk of a permanent depression  Stagnation as consequence of an inherently unstable economy that creates creditfuelled bubbles  As households are left with a debt overhang and binding balance sheet constraints, savings are inelastic with respect to changes in the interest rate  Risk of a permanent depression/deflationary spiral Role for monetary policy  Case for temporary monetary policy measures to stimulate bank lending; longer-term need to keep money supply in line with production to avoid over- or under-supply  Case for unconventional monetary policy to drive up inflation expectations and thus drive real interest rates below the zero lower bound of nominal rates (e.g., QE)  Limited/no role for monetary policy since saving/borrowing decisions do not respond to changes in the interest rate because the money multiplier is zero Role for fiscal policy  Case for fiscal contraction and deregulation/supply-side reforms, since the economy will return to equilibrium if unimpeded by distortionary government policy and spending (“expansionary austerity”)  Case for expansive fiscal policy to support aggregate demand  Case for expansive fiscal policy to support aggregate demand; explicit prescription to fully offset private-sector deleveraging through publicsector borrowing and spending 1 Propensity to save meaning tendency to run a financial surplus. SOURCE: Richard C. Koo, “The world in balance sheet recession: Causes, cure, and politics”, Real-World Economics Review, issue number 58, 2011; Paul Krugman Blog; McKinsey Global Institute analysis Recent discussions on stimulating investment and job creation have tended to focus narrowly on the traditional prescription of additional fiscal spending and quantitative easing. But spending within the Fiscal Compact as well as QE will likely be insufficient to drive the recovery without additional measures. Moreover, loosening the Fiscal Compact, mutualising debt, or stepping up transfer payments appears impossible in the current Eurozone institutional framework. McKinsey Global Institute A window of opportunity for Europe 161 .
However, more feasible options with significant potential effects receive relatively little discussion (Exhibit 96). These include choices such as changing public-accounting standards so that investments are activated on a public balance sheet and depreciated over time rather than being accounted for immediately as a deficit in the year in which they occur. Another option is stimulating private consumption, for instance by carefully adjusting tax structures to reduce the burden on labour while increasing taxation on property and capital gains, or by creating attractive services that help unleash spending by older people in the economy. There is also the possibility of opting for more radical options with little or no track record, such as issuing vouchers redeemable by the ECB directly to the populace. This approach has strong potential to increase investment and job creation while reducing the risk of deflation, but, with the exception of a small number of commentators, has not been part of the mainstream debate.222 Exhibit 96 A menu of investment and job creation options can complement structural reform even outside a federal setup Prerequisites for all options: Progress on competitiveness and growth drivers and structural reform Addresses >50% of aggregate demand gap Fiscal stimulus and debt relief  Introducing cyclical flexibility beyond 3% in the Fiscal Compact  Partially mutualising debt Issuing vouchers redeemable with the ECB to households1 Demand impact Options deserving wider debate  Accounting for public investments as they depreciate  Carefully adjusting taxation and wage structures  Unleashing the silver economy Improved monetary and financing conditions Addresses <50% of aggregate demand gap  Quantitative easing  Expanding fiscal-transfer schemes between countries (possibly including debt restructuring)  Improving access to finance for businesses and increasing European Investment Bank lending  Maximising spending within the Fiscal Compact Requires “European Federation” with common fiscal and economic policy to establish trust and avoid moral hazard Conceivable in current “Maastricht +” setup Feasibility 1 Debate persists over whether this option would constitute hidden fiscal policy. NOTE: There is a neoclassical school of thought that argues that structural reform is enough; however, our analyses clearly indicate a structural weakness in demand across all sectors of the economy in line with the balance sheet recession or liquidity trap school of thought. SOURCE: McKinsey Global Institute analysis Willem H.
Buiter, Helicopter money: Irredeemable fiat money and the liquidity trap, NBER working paper number 10163, December 2003. Commentators including Lord Adair Turner and Financial Times columnist Martin Wolf have promoted the concept. 222 162 McKinsey Global Institute 3. How Europe can reignite investment and job creation .
All options for increasing investment and job creation entail risk and may have possibly unintended, often distributional, consequences that require careful consideration. For instance, making it easier for corporations or households to access finance could, if done carelessly, cause a build-up of excessive debt like the one that led to the 2008 crisis. Changing tax regimes can have unintended consequences either by changing incentive structures in a deleterious way or by causing capital flight. Debt monetisation would require very strong governance and reinforced central-bank independence to avoid overuse by governments and inflation. Redistributive policies that support the deleveraging of debtors through one mechanism or another can create moral hazard. Mitigating the risks associated with the fiscal, monetary, and redistributive options that are available requires careful design and trade-offs, but inaction is not an option.
Every extra year of low growth shrinks the long-term path of the economy. The risks of deflation in Europe are uncomfortably high. Forecasts for Eurozone inflation in the remainder of 2015 and 2016 are still well below the target rate.
Deflation in a context of deleveraging is dangerous because it becomes harder to repay debt. Which, if any, of the options we discuss in this chapter is pursued and what specific policies should be deployed to achieve any of these outcomes is a decision for policy makers rather than economists because many of these choices entail some form of redistribution in the broader economy and may have unintended consequences. It is for this reason that we present a range of options that we believe, with humility, deserve broader debate. While we reflect on the feasibility and effectiveness of the options presented, we do not advocate any one specific solution. In the Eurozone, the traditional prescription of higher fiscal spending and debt relief cannot be easily replicated During a balance sheet recession—one in which companies and households en masse opt to deleverage, potentially resulting in deflation and rising debt burdens in real terms—the role of government is especially important in shoring up investment and job creation and thereby helping to accelerate private-sector deleveraging.223 The example of Finland and Sweden in the early 1990s is telling.
After a financial crisis induced by a burst asset-price bubble, both countries faced deep recessions (Exhibit 97). The governments of these two countries nationalised bank assets, particularly bad ones, and attempted to cushion the impact of the recession by expanding public debt by 15 percentage points of GDP in the first two years after the crisis. They went on to expand the public-debt-to-GDP ratio by 21 percentage points over the following four to six years.224 This helped the private sector in both countries deleverage by 26 percentage points of GDP while keeping growth positive. Tellingly, public-sector deleveraging did not begin until after GDP growth started to recover and private debt levels began to fall. Richard C.
Koo, “The world in balance sheet recession: Causes, cure, and politics”, Real-world Economics Review, issue number 58, 2011. 224 Debt and deleveraging: Uneven progress on the path to growth, McKinsey Global Institute, January 2012. 223 McKinsey Global Institute A window of opportunity for Europe 163 . Exhibit 97 Episodes of successful private-sector deleveraging have been supported by public-sector spending ILLUSTRATIVE Average of Swedish and Finnish deleveraging episodes Deleveraging Recession Real GDP Private debt/GDP Public debt/GDP Pre-crisis period Early stage of recession Private-sector deleveraging Rebound and public-sector deleveraging 10 years 1–2 years 4–6 years ~10 years -3% 1% 3% Real GDP growth 3% Annual average (%) Time Change in debt/GDP Percentage points â–ª â–ª Private sector 60 8 -26 87 Public sector 3 15 21 -30 SOURCE: IMF; Haver Analytics; McKinsey Global Institute analysis In contrast, European governments today have begun to reduce debt levels at a time when the private sector has deleveraged by only about five percentage points of GDP relative to their position when they left recession in the first quarter of 2009. The countries of the Eurozone have attempted to contain deficits and debt levels through such institutional vehicles as the Fiscal Compact (see Box 6, “The Fiscal Compact”). 164 McKinsey Global Institute 3. How Europe can reignite investment and job creation . Box 6. The Fiscal Compact The fiscal rules that today govern the members of the Fiscal Compact grew out of the convergence criteria of the Maastricht treaty of 1993 that European economies were required to meet before being allowed to join the euro. The convergence criteria specified limits of 60 percent of GDP for debt and 3 percent of GDP for budget deficits, set a reference value for inflation, established exchange rate stability, and gave guidance on long-term interest rates. The aim of setting these criteria was to ensure that any economy joining the monetary union was sufficiently “harmonised” with other members to limit the risk of economic imbalances developing that could not be mitigated by unilateral currency devaluation and/or independent changes in monetary policy—a flexibility that was no longer available in the monetary union. These limits were converted into fiscal rules for Eurozone members, and the other EU member states that voluntarily subscribe to it, through the Stability and Growth Pact in 1998 and 1999.
This set out an enforcement mechanism whereby countries could be fined up to 0.3 percent of GDP if they broke the rules and were found not to have a good reason for doing so. This procedure proved toothless, as both Germany and France broke the limits of the pact in the early 2000s and faced no consequences. The then-president of the European Commission, Romano Prodi, described the pact as “stupid” in 2002.1 The pact has since been reformed and strengthened several times, most recently as the Fiscal Compact in the Treaty on Stability, Coordination, and Governance that came into force in 16 countries in 2013 and nine more in 2014. Key points in the current framework include: ƒƒ Countries are obliged to keep deficits below 3 percent of GDP, while also targeting a structural deficit of no more than 0.5 percent of GDP.2 ƒƒ Countries are obliged to keep general government debt below 60 percent of GDP, and if above the limit, they must close 1/20th of the gap to that threshold annually.3 ƒƒ Countries are obliged to transpose the stipulations of the Fiscal Compact into national law—and are encouraged to make the stipulations constitutional provisions. Quoted in an interview with Romano Prodi in Le Monde, “Le pacte de stabilité est-il stupide?” November 15, 2002. 2 In some instances, a structural budget deficit of 1 percent of GDP is allowed. 3 This must happen, on average, over three-year periods.
However, it is rarely enforced. For example, although Belgium and Italy are unlikely to reach the debt target of 60 percent of GDP anytime soon, neither is currently subject to the excessive deficit procedure. McKinsey Global Institute A window of opportunity for Europe 1 ƒƒ Successive treaties have made penalties clearer, more automatic, and harder to avoid, and they have increased the oversight faced by countries in the excessive deficit procedure (EDP). The original limits were intended as membership criteria for monetary union rather than as fiscal rules. Some commentators suggest that the choice of numbers, particularly for the debt limit, may have been influenced by a desire to exclude some nations from the union.4 Most purpose-built fiscal rules are very different from those of the Fiscal Compact.
Typically, a more explicit adjustment is made for changes in the business cycle or the main drivers of government revenue. It is also rare to have a fiscal rule that does not have a mechanism to actively encourage a surplus during good times—a property known as symmetry. Observers of the Fiscal Compact have been particularly critical of the 60 percent debt limit, calling it “devoid of theoretical value” and “arbitrary and neither necessary nor sufficient for national fiscal-financial sustainability”.5 An example of a purpose-made fiscal rule is the one used by Switzerland.
The rule stabilises government spending over the economic cycle. When the economy is running below potential, the government can spend more than it earns. When the economy is operating above potential, the government must put money aside.6 Enforcement of the rule as well as an incentive to estimate correctly comes from the use of a compensation account.
Any overspending, including that due to poor forecasting, is debited to the compensation account. Once the account passes a threshold, the government must budget to bring the account into credit within three years.7 A similar rule, applied across all of Europe and adjusted for the relative sizes of government spending, would require most European economies to cut their deficits. Among the members of the Fiscal Compact, it would require deficit cuts of roughly €60 billion. Willem H. Buiter, “The ‘sense and nonsense of Maastricht’ revisited: What have we learnt about stabilization in EMU?” Journal of Common Market Studies, volume 44, issue 4, November 2006. 5 See Panos C.
Afxentiou, “Convergence, the Maastricht criteria, and their benefits”, The Brown Journal of World Affairs, volume VII, issue 1, winter-spring 2000, and Willem H. Buiter, “The ‘sense and nonsense of Maastricht’ revisited: What have we learnt about stabilization in EMU?” Journal of Common Market Studies, volume 44, issue 4, November 2006. 6 Alain Geier, The debt brake: The Swiss fiscal rule at the federal level, Swiss Federal Finance Administration working paper number 15, February 2011. 7 The problem of bias in forecasting is substantial. Even with an external body standardising forecasts as in the EU, countries have a substantial optimistic bias in forecasts that becomes larger further into the future.
This is especially the case in EU countries that risk going above the 3 percent deficit limit. See Jeffrey A. Frankel and Jesse Schreger, “Over-optimistic forecasts and fiscal rules in the Eurozone”, Review of World Economics, volume 149, issue 2, June 2013. 165 4 .
Independent fiscal regimes in a monetary union require either stringent rules to control deficits or credible no-bailout commitments to avoid requiring some countries to pay the bill for high deficits in another country within the union (Exhibit 98). Exhibit 98 Many investment and job creation measures are not viable in the current Eurozone setup Two stable regimes in a currency union Current European setup “Gold Standard/Maastricht +” “European Federation” â–ª Independent sovereign â–ª Key fiscal and economic policies â–ª decisions for fiscal and economic policies Stringent fiscal rules to avoid moral hazard from implicit guarantees across the currency union and/or â–ª Strict “no-bailout” rule put into decided at the federal level as a means to avoid moral hazard and ensure trust for: – Debt mutualisation and common liabilities across the federation – Fiscal flexibility – Fiscal transfers practice including clear regime for sovereign bankruptcy to ensure exposure to financial market discipline Setup for countries under EDP Sovereignty partially limited via bailout conditions in return for debt guarantees and fiscal flexibility SOURCE: McKinsey Global Institute analysis Although the Fiscal Compact has been criticised for aggravating the shortage in demand at a time when the private sector deleverages, it has had the benefit of helping to restore trust among Eurozone nations. It paved the way for bailouts of highly indebted economies, limited restructuring of government debt in Greece, and later bolder action and a commitment by Mario Draghi, president of the European Central Bank, to do “whatever it takes” to preserve the currency union (Exhibit 99).225 The Fiscal Compact is also an important step towards removing the moral hazard embedded in a monetary union among economies that retain national fiscal policies. Mario Draghi said, “Within our mandate, the ECB is ready to do whatever it takes to preserve the euro. And believe me, it will be enough”. The commitment was made during a speech at the Global Investment Conference in London on July 26, 2012. 225 166 McKinsey Global Institute 3. How Europe can reignite investment and job creation .
Exhibit 99 Decisive action was necessary to calm markets and restore access to credit German-Spanish spread on long-term bonds1 Percentage points 6 5 4 3 2 1 0 2007 08 09 10 11 May 2010 EFSF and EFSM established2 12 December 2011 LTRO1 by ECB January 2012 Fiscal compact finalised February LTRO2 by ECB March Fiscal Compact signed; Greek debt restructuring 13 2014 January 2013 Fiscal Compact in force September ESM established3 July Draghi pledges to do “whatever it takes” June Spanish bank rescue announcement 1 Difference in yields of long-term euro-denominated bonds issued by Spain and Germany. 2 European Financial Stability Facility and European Financial Stabilisation Mechanism. 3 European Stability Mechanism. SOURCE: Datastream; McKinsey Global Institute analysis Maximising spending within the Fiscal Compact would allow around €50 billion in additional fiscal expenditure The Fiscal Compact sets clear targets for countries to maintain deficits below 3 percent of GDP and debt below 60 percent of GDP.226 While some countries currently exceed the deficit limit, including the major economies of France and Spain, other economies have headroom for additional spending. These countries could increase their borrowing without breaking the rules of the Fiscal Compact. Even those countries that are above the debt limit, but not the deficit limit, could potentially increase spending.227 The Fiscal Compact sets out separate requirements for structural and total deficits. The structural deficit must be below 0.5 percent of GDP, while the noncyclically adjusted deficit must be below 3 percent of GDP. 227 Countries are expected in most cases to reduce their debt levels by 1/20th of the gap between their existing debt and the 60 percent target every year, on average.
In some cases, like Germany, this would set a 1.5 percent deficit limit, after growth forecasts are considered. In other cases, like Italy, this requirement is plainly unmanageable. Italy’s debt stands at 135 percent of GDP and therefore Italy would have to reduce its debt by 3.5 percent of GDP.
This would require budget cuts of more than 6 percent of GDP even after accounting for growth. 226 McKinsey Global Institute A window of opportunity for Europe 167 . If countries that have less than 3 percent deficits were to increase their spending to reach the deficit limit, but those with debt above 60 percent with extra spending capacity worked towards meeting their debt reduction targets, additional spending capacity of €48 billion would be created. Germany would account for €39 billion of that capacity. However, because Germany’s economy has a negligible output gap, this additional spending would have little effect on aggregate demand. After applying fiscal multipliers, the overall demand effect is likely to lie between €15 billion and €49 billion.
This large range reflects considerable uncertainty around the size of the fiscal multiplier (see Box 7, “Fiscal multipliers”). What’s more, the effect of that spending on Southern European economies facing the largest shortages in demand is unclear, as Southern European exports to Germany account for only 2.4 percent of Southern European GDP. Box 7. Fiscal multipliers When a government spends, the impact on aggregate demand can be larger or smaller than the absolute amount spent.
On the one hand, fiscal expenditure can circulate through the economy as suppliers to government procurement hire more workers who in turn have more money to spend on their needs. On the other hand, government spending may simply displace private-sector spending or increase imports, leaving aggregate demand largely unaffected. For our calculations of the size of fiscal multipliers in cases where empirical estimates for the fiscal multiplier of a nation during recession were not available, we have drawn on the IMF’s methodology suggested for calculating back-of-the-envelope fiscal multipliers. This process has led to a range of fiscal multipliers such as 0.2 to 1.0 for Germany or 1.6 to 2.1 for Italy (see the appendix for full details). Many factors affect the fiscal multiplier: ƒƒ Output gap.
Large output gaps mean larger multipliers as the economy has more capacity before government spending crowds out private activity. ƒƒ Monetary policy. Countries with monetary policy near the zero lower bound have higher multipliers because monetary policy will be less sensitive to changes in demand. ƒƒ Trade openness. Closed economies typically have higher multipliers as spending does not lead to additional imports. ƒƒ Exchange rate.
Countries with fixed exchange rates have higher multipliers, as exchange rates will not move to offset increased spending. ƒƒ Debt level. Countries with low debts have higher multipliers as increased spending does not lead to businesses and households embarking on precautionary saving in the expectation of higher taxes or interest rates. ƒƒ Labour market rigidity. Countries with rigid labour markets have higher multipliers because rigid wages mean spending creates more new jobs rather than just inflating wages and prices. ƒƒ Automatic stabilisers.
Countries with smaller stabilisers have higher multipliers because the new demand reduces unemployment payments, for example, and increases tax take that counteracts the output effect. ƒƒ Public administration. Countries that are better run have higher multipliers because money is spent more effectively.1 1 168 Nicoletta Batini et al., Fiscal multipliers: Size, determinants and use in macroeconomic projections, IMF, October 2014. McKinsey Global Institute 3. How Europe can reignite investment and job creation .
Introducing cyclical flexibility beyond 3 percent in the Fiscal Compact would help but is hardly conceivable in the current Eurozone setup Throughout the recession, incremental government spending, also known as the fiscal impulse, in Europe has been substantially below that of the United States. At its peak, in 2009, the US structural fiscal impulse—the magnitude of change structural spending—was 2.2 percentage points of GDP larger than Europe’s.228 This may explain at least part of the difference in real GDP growth between the two regions. A European fiscal impulse of 2.2% of GDP could have maximum impact of €440B If Europe implemented a one-time fiscal impulse of 2.2 percent of GDP—increasing spending uniformly by 2.2 percentage points—the impact on the size of the output gap would be dramatic. A rough estimate—it can only be rough since this impact is larger than the total output gap—suggests a maximum impact in the order of €440 billion, including fiscal multipliers. As the output gap shrinks due to the stimulus, one would expect additional government spending to be less effective and multipliers to change. A government that is willing to rewrite the rules when expedient, even for a short time, might be expected by financial markets to do so again.
As such, a change to fiscal rules to allow more spending for only a short time might be treated by the markets similarly to how they would treat a long-term change. This would effectively require Europe to mutualise the debt of the more indebted and currently economically weaker nations, and it would likely require a federal institutional framework to avoid the associated moral hazard. Partially mutualising debt can lower the cost of borrowing if governance issues could be resolved A partial mutualisation of European debt could remove concerns over the solvency of the continent’s most indebted governments and lower average interest rates across the continent. But major governance changes would be required to avoid moral hazard. Although all Eurozone members issue government debt in euros, each country is liable for its own debt.
If the Greek government cannot repay its debt, it is the Greek government that must default. Other Eurozone countries are not liable for the debt simply because they share a currency. That is the official version.
However, the Greek debt crisis and subsequent bailout by the IMF, ECB, and European Commission demonstrate that national debts of countries within the Eurozone are not, in reality, separate. Because European economies are so deeply intertwined, debt default has enormous externalities. Eurozone debt is ambiguous and involves an implicit partial guarantee. Despite convergence in recent years, there is still a significant spread between the eurodenominated debts of different countries.
Although yields on Greek debt are well below their 2011 peaks, spreads over the German bund remained around seven percentage points even before the renewed discussion in 2015 about a potential exit of Greece from the Eurozone. When perceptions of risk are heightened, a “flight to safety” causes the yield on some countries’ debt to drop to negligible levels, while other countries can still face very high yields. At its peak, the yield differential between Greek and German debt exceeded 25 percentage points, effectively shutting Greece out of sovereign debt markets and jeopardising its ability to engage in counter-cyclical spending (Exhibit 100).
Weak economies in recession can experience soaring interest rates at exactly the point at which they most need to be able to borrow. Mutualising debt would reduce the effect of a flight to safety, enabling peripheral economies to have a functioning fiscal policy even during difficult times. It would also reduce overall borrowing costs because the risk of default of the Eurozone as a whole is small. In addition, Based on the change in structural and total deficit reported by the IMF. 228 McKinsey Global Institute A window of opportunity for Europe 169 .
the liquidity premium charged by the market would fall, especially in the case of small economies with less liquid sovereign debt markets. Exhibit 100 Debt mutualisation reduces pro-cyclical financing effects harmful to economies when they can least bear the cost German-Greek spread on long-term bonds1 Real Greek GDP growth2 Interest rate % 40 35 30 25 20 15 10 5 0 -5 -10 2007 08 09 10 11 12 13 2014 1 Difference in yields of long-term government bonds issued by Greece and Germany. 2 Annual real rate of change of GDP in Greece. SOURCE: Eurostat; S&P; McKinsey Global Institute analysis Mutualisation can occur in many ways. It is possible to issue only part of a government’s debt as mutual debt and to grant it senior or junior status relative to national debt. For example, on the one hand, countries could decide to mutualise only the riskiest parts of debt in order to keep borrowing costs lower. On the other hand, countries might decide not to put their collective name on debt in jeopardy but to mutualise only the safest debt.
By doing so, individual countries would remain responsible for high levels of debt while reducing the borrowing cost of the bulk of their debt. The first approach would do more to protect weak economies from a flight to safety, but it would increase moral hazard. The exact details of a “Eurobond” would require extensive negotiation depending on the particular risk preferences of members of the Eurozone and the political compromises they are willing to make. Debt mutualisation would reduce the cost of borrowing.
A range of econometric models suggest that the cost of mutualised debt would be between 10 and 60 basis points higher than the rate on a German bund.229 Based on 2013 borrowing rates and taking the interest rate on ten-year government bonds as representative, governments would have saved 229 170 See Sergio Mayordomo, Juan Ignacio Peña, and Eduardo S. Schwartz, Towards a common European Monetary Union risk free rate, NBER working paper number 15353, September 2009; Green paper on the feasibility of introducing stability bonds, European Commission, November 2011; Christian Aßmann and Jens Boysen-Hogrefe, Determinants of government bond spreads in the Euro area—in good times as in bad, Kiel working paper number 1548, September 2009; European banks: All eyes on funding: LCR, the next undiscounted regulatory headwind, JP Morgan, 2011; Patrick Artus, The effect of debt mutualisation in the euro zone would be more complex than what is usually claimed, Natixis economic research, number 560, August 2013; Carlo Favero and Alessandro Missale, Sovereign spreads in the euro area: Which prospects for a Eurobond? presented at an Economic Policy panel meeting in Warsaw, October 27–28, 2011; Séverine Menguy, “Can Eurobonds save the euro?” in States, banks and the financing of the economy: Monetary policy and regulatory perspective, Morten Balling, Ernest Gnan, and Patricia Jackson, eds., SUERF, 2013; Sylvester C. W.
Eijffinger, “Eurobonds—concepts and implications”, in Eurobonds: Concepts and implications: Compilation of notes for the monetary dialogue of March 2011, European Parliament, March 2011; Rien Wagenvoort and Sanne Zwart, Uncovering the common risk-free rate in the European Monetary Union, European Investment Bank economic and financial report number 2010/05, September 2010. McKinsey Global Institute 3. How Europe can reignite investment and job creation . €6.4 billion to €8.5 billion every year over the life of the bonds issued that year alone, or as much as €85 billion in total (although some, such as Germany, would have had to pay more) (Exhibit 101). Taking into account the fiscal multiplier and assuming that all savings on interest payments are spent rather than used to reduce deficits, the effect on aggregate demand would be €30 billion to €65 billion annually. Debt mutualisation amplifies moral hazard. If borrowing costs are mutualised, the effect of any one country’s fiscal profligacy on the cost of borrowing will be small, increasing the incentive to borrow beyond a country’s means. For this reason, debt mutualisation cannot be safely implemented without extremely robust governance of reliable fiscal rules, stringent criteria on what parts of debt can be mutualised, or, indeed, full economic and fiscal integration. Exhibit 101 Lower interest rates resulting from debt mutualisation could have saved the Eurozone as much as €85 billion on ten-year maturities alone vs.
2013 Hypothetical mutualised borrowing, 2013 Actual borrowing, 2013 Borrowing requirement € billion Spain Interest rate on long-term debt, average % 89.3 Italy 2.1 Netherlands Austria 0.4–0.5 0.1–0.2 2.4 3.2 Cyprus 0–0.7 3.8 21.8 Slovenia 0.9–1.0 2.2 25.0 Belgium 1.0–1.3 6.3 123.0 Ireland 1.9–2.0 4.3 21.2 France Slovakia 2.1–2.6 10.1 47.9 Portugal Potential average saving on cost of borrowing1 € billion 4.6 23.7 Greece EXCLUDES FISCAL MULTIPLIER ~0.1 5.8 ~0.1 6.5 21.7 ~0.1 2.0 3.0 <1 3.2 12.7 <1 2.0 Latvia 0.5 3.3 <1 Malta 0.3 3.4 <1 Luxembourg 0.1 Germany <1 1.9 28.6 1.6 <0 1 Reduction in annual cost of debt issued in 2013 if rate went from actual rate to an estimated Eurobond rate with a value 10–60 basis points higher than the German rate. 2 Countries in EDP might use their savings to reduce borrowing rather than create demand, which would not contribute to closing the output gap in the short term. SOURCE: Eurostat; ECB; Mayordomo et al., 2009; European Commission green paper, 2011; Aβmann et al., 2011; JP Morgan, 2011; Artus, 2011; Favero and Missale, 2011; Menguy, 2013; Eijffinger, 2011; Wagenvoort and Zwart, 2010; McKinsey Global Institute analysis McKinsey Global Institute A window of opportunity for Europe 171 . Expanding fiscal transfer schemes among countries could close the output gap if Europe were to further integrate fiscal and economic policies The overall size of the EU budget is small compared with the size of European economies. In Europe, the average absolute net contribution/receipt of EU member countries was 1.6 percent of GDP in 2013.230 For comparison, the average absolute net contribution/ receipt between US states and the federal government was 8.4 percent.231 Transfers between European states are far less distributive than they are in the United States. The net contribution in Europe is only weakly responsive to relative per capita GDP at purchasing power parity, while the sensitivity in the United States is very strong (Exhibit 102). Exhibit 102 Transfer payments are much bigger in the United States than they are in Europe Net contribution, 20131 % of GDP Europe 8 United States West North Central 6 4 West South Central East North Central 2 Italy Mountain 0 France Middle Atlantic New England Germany Nordics Other Western Europe United Kingdom and Ireland Mediterranean -2 Pacific Central and Eastern Europe -4 -6 South Atlantic -8 The mean absolute redistribution in Europe is 1.6% of GDP compared with 8.4% in the United States. Europe’s transfers are therefore roughly 19% of the US level -10 -12 East South Central -14 60 65 70 75 80 85 90 95 100 105 110 115 120 125 130 Per capita GDP at purchasing power parity, 2013 Index: 100 = EU and the United States, respectively 1 In the United States, total federal spending in state inclusive of all programmes and transfers less total federal tax revenue generated in state including business, income, employment, estates, railroad, gift, and excise tax. In the EU, total expenditure on all programmes including co-payments less all revenue generated by nations including traditional own resources (e.g., excise and agricultural tax). SOURCE: European data: European Commission, and Eurostat; US data: Inland Revenue Service; USASpending.gov, States’ Departments of Labor and Workforce Development; US Census Bureau; Bureau of Economic Analysis; McKinsey Global Institute analysis The unweighted average of the absolute value of contribution/receipt for each country.
This figure is somewhat inflated by the contributions of small countries such as Hungary, which received 5.0 percent of its GDP in net. 231 Based on a refreshed version of the analysis found in Zsolt Darvas, Fiscal federalism in crisis: Lessons for Europe from the US, Bruegel, July 2010. 230 172 McKinsey Global Institute 3. How Europe can reignite investment and job creation . The comparison with the United States is useful, not because Europe ought to emulate the United States, but because it gives a directional illustration of the magnitude of the fiscal transfers required for a successful monetary union. In the United States, for example, Florida was hit particularly badly by the recession; its unemployment rate peaked at 11 percent. If the state had had its own currency, it would have been able to devalue to restore competitiveness. Instead, Florida received 17.9 percent of its GDP through federal transfers in 2013. In contrast, unemployment in Spain reached 26 percent as a result of the recent economic crisis, but it received transfers of only 0.2 percent of GDP.232 The composition of transfers is also relevant.
Most European transfers are linked to agriculture and do not act as an economic stabiliser. Transfer schemes linked to unemployment rates would have a strong stabilising effect. Alternatively, fiscal transfers might redirect public investment to where it is most productive.
For example, a common European renewables subsidy scheme, coupled with a more integrated power sector, would promote investment in solar plants in Spain and Italy to produce energy for German and French consumers. Although the impact on demand depends heavily on the details of how any expanded fiscal transfer system is designed, it is possible to get a rough idea of the potential scale of such approaches (Exhibit 103). Assuming a hypothetical unemployment benefit transfer programme in which all Europeans pay in according to existing EU funding ratios, the effect on demand would be between €38 billion and €56 billion, as money would flow from strong countries to crisis-hit countries with large fiscal multipliers.233 Any such programme would require further fiscal and economic policy integration in Europe. Another important protection for Florida was the free movement of labour. Many Floridians moved to other states with more prosperous economies. 233 This assumes that countries move their entire unemployment benefit through this package, giving a replacement rate of 50 to 70 percent, as is typical in European economies.
The benefit comes from the fact that more of the payments come from countries with smaller output gaps where additional fiscal spending is less effective and go to countries with larger output gaps where it is more effective. 232 McKinsey Global Institute A window of opportunity for Europe 173 . Exhibit 103 A pan-European transfer programme could benefit from higher fiscal multipliers in worse-off economies INCLUDES FISCAL MULTIPLIER— LOWER BOUND SHOWN Unemployment benefit programme—implementation example National net benefit from policy, 20141 € billion Gap Spain Fiscal multiplier2 33.1 Additional multiplier effect possible in 20143 € billion 1.3–2.5 Greece 4.1 1.1–1.6 Italy 3.7 43.1 4.4 1.6–2.1 6.0 France 1.6 0.2–2.1 0.3 Portugal 1.0 0.8–1.2 0.8 Croatia 0.7 0.5–0.8 0.4 Cyprus 0.4 0.8–1.2 0.3 Slovakia 0.3 1.2–1.7 0.3 Ireland 0.2 0.5–0.8 0.1 Slovenia 0 1.2 –1.6 0 0 Sweden -0.1 0.6–1.0 Malta -0.1 0.9–1.3 -0.1 Bulgaria -0.1 0.9–1.3 -0.1 Latvia -0.1 0.9–1.2 -0.1 Estonia -0.2 0.8 –1.2 -0.1 Lithuania -0.2 0.9–1.3 -0.2 Luxembourg -0.2 1.1–1.6 -0.2 Finland -0.2 0.7–1.0 -0.2 Hungary -0.7 0.1–0.3 -0.1 Czech Republic -1.2 0.6–0.9 -0.7 Denmark -1.7 0.7–1.1 -1.2 Romania -1.8 0.5–0.7 -0.8 Poland -1.8 0.1–0.3 -0.2 Austria -2.5 0.6–0.9 Netherlands -2.9 1.3–1.9 -3.9 Belgium -3.4 1.1–1.5 -3.6 United Kingdom -3.9 0.1–1.0 Germany -24.2 0.2–1.0 -1.5 -0.4 -4.8 Total opportunity = €37.6–56.0 billion 1 Based on national unemployment figures and a benefit equal to 50–70% of nominal median income in that country (based on typical EU unemployment replacement rates) and a contribution distribution proportional to current EU contribution. 2 Back-of-the-envelope estimate based on IMF methodology. 3 Based on the assumption that total governmental spending is fixed and just involves spending in more efficient geographies. NOTE: Assumes a pan-European unemployment benefit of 50–70% of local per capita median income. The scheme is funded proportionally to the current EU funding formulas. SOURCE: Eurostat; European Commission; IMF; Salomäki and Munzi, 1999; McKinsey Global Institute analysis 174 McKinsey Global Institute 3. How Europe can reignite investment and job creation . Measures to unlock financing for companies, as well as increased lending by the EIB, can help but may prove insufficient on their own Access to finance, particularly for SMEs, is a hot topic of discussion. SMEs have historically found it harder to access credit than larger firms.234 While the scope for increasing demand is likely to be smaller than what can be achieved in the public and household sector, there is still room to improve access to finance for these firms, particularly in badly affected parts of the European economy. Proposals include improving liquidity for bank lending via liquidity facilities or secondary markets, establishing a stronger European capital market for securitised debt, or improving equity financing through simpler private placements or removing tax distortions favouring debt financing. Many programmes to improve access to finance are already under way (Exhibit 104). Exhibit 104 Several measures have been proposed to strengthen and diversify funding sources, particularly for SMEs Measures that have been proposed Accelerate the cleanup of bank balance sheets NOT EXHAUSTIVE Suggested by Increase the incentives for prudent bank provisioning and write-offs and  IMF ensure that overcapitalised banks use their capital buffers to crystallise losses Promote a secondary market for non-performing loans; improve the transparency of bank and corporate balance sheets to enhance market discipline; reform and resource legal frameworks to facilitate timely resolution  IMF Restore integration and resilience Revitalise cross-border lending to benefit from imbalances among deposit-rich and lending-rich countries in Europe while improving overall resilience by fully implementing the European Banking Union  ECB  European Commission  IMF Free up bank capital to support lending, particularly to small and medium-sized enterprises Increase balance sheet turnover by creating broad-based, plain-vanilla securitisation markets (with lending standards, skin-in-the game requirements, and resecuritisation limits) by reviewing regulatory capital requirements attached to asset-backed securities and by developing new instruments for SME securitisation      Temporarily support lending to preferred sectors (SMEs and infrastructure investments) through state credit guarantees or through expansion of national business-support agencies  AFME  IMF Promote non-bank credit intermediation (insurance companies, pension funds) to hard-to-service borrowers such as SMEs by reviewing regulatory investment restrictions and by improving transparency on borrowers (e.g., standards for credit-scoring assessments)     Facilitate securities offerings by small enterprises (high-yield bonds, private placements) by reviewing investment restrictions for large investors (insurance companies, pension funds)  AFME  IMF Develop or promote other non-traditional sources of finance (such as crowd-sourcing, peer-to-peer lending) by providing an appropriate regulatory framework as well as venture capital markets (e.g., through fund of guarantees for institutional investors)  AFME  City of London  European Commission Promote an increase in equity funding by recalibrating the tax bias against equity, reducing management incentives against equity, and promoting access to equity for SMEs (“mini-IPOs”)  AFME  City of London Develop non-bank sources of funding, particularly for SMEs AFME City of London ECB European Commission IMF AFME City of London European Commission IMF Regulate loss-leading corporate lending to limit bank funding of large corporates and stimulate the development of corporate bond markets SOURCE: Global financial stability report, IMF, April 2014; Euro area policies: 2014 Article IV consultation, IMF, July 2014; European Commission green paper, March 2013; AFME briefing note, June 2013; Unlocking funding for European investment and growth, AFME, 2013; Llewellyn Consulting, June 2014; McKinsey Global Institute analysis Survey on the access to finance of enterprises in the euro area, European Central Bank, November 2014. 234 McKinsey Global Institute A window of opportunity for Europe 175 .
Increased lending by the EIB, which today is enabled by government capital contributions outside the Fiscal Compact or through ECB purchases of EIB debt, could help to advance infrastructure and other projects that are facing capital constraints. The effects will be contingent, however, on finding ways to structure additional projects that become economically viable through reduced cost of capital. We estimate that the effect of resolving any remaining blockages in access to finance would likely enable €6 billion to €23 billion of additional demand, once multiplier effects are considered. This is only a fraction of the fall in corporate investment since 2008. A return to pre-crisis corporate investment trends would yield €227 billion in incremental investment. But only part of this gap can be closed by improving access to finance—just 12.4 percent of business leaders say that access to finance is their primary obstacle to investment, weighted by size.235 If we assume that the share of the investment gap that corresponds to companies facing problems with access to finance is the same as the weighted proportion of companies for which it is their primary problem, raising access to finance would mean an additional €28 billion of investment.
This is, however, a very aggressive assumption. There will always be some companies that believe that their primary obstacle is finance. For our lower bound, we assume that Germany—where 9 percent of companies face similar financing constraints—is the benchmark for normal financing conditions. In this case, improving access to finance would enable €7.8 billion of additional business investment. Estimating the true effect of improving access to financing for SMEs is difficult because it requires making a judgment about when a loan is appropriate.
This is subjective. Neither the business owner nor the bank can know for certain what the return will be on any given investment. ~60% of bank managers said lending standards to SMEs tighter than in 2003–14 survey Facilitating bank lending It is harder to obtain credit in Europe today than it was before the crisis. A survey of bank managers by the ECB in 2014 found that around 60 percent felt that lending standards for SMEs were considerably or moderately tighter than they were in 2003.236 Although tighter prudential standards may be a good thing, there are pockets where this creates problems for growth.
Thirty-two percent of SMEs surveyed in Greece, 17 percent in Spain, and 14 percent in Italy report that access to finance is the most pressing problem their firm is facing. Rates in other countries, such as Germany, are as low as 9 percent.237 The conditions for borrowing are dependent on geography because most SME lending is driven by local banks. Local banks can have very different liquidity provisions, even within Europe.238 Where local banks’ liquidity remains an issue, the ECB is in a position to improve their liquidity.
However, programmes to offer long-term financing have been available and under-subscribed. Moreover, the ECB has already waived the credit rating requirement for banks from the Eurozone periphery that seek refinancing. It is therefore not clear that further financing for banks will unlock lending. Ibid. Euro area bank lending survey, European Central Bank, April 2014. 237 Survey on the access to finance of enterprises in the euro area, European Central Bank, November 2014. 238 Iftekhar Hasan et al., Bank ownership structure, SME lending, and local credit markets, Bank of Finland research discussion paper number 22/2104, 2014. 235 236 176 McKinsey Global Institute 3.
How Europe can reignite investment and job creation . Banks may be hesitant to lend further because small business loans are illiquid. Europe has only a very small secondary market for SME loan-backed securities. Creating a large, liquid, Europe-wide market for such securities could encourage bank managers to increase lending.239 Regulators and voters are rightly cautious about the regulation required for a functioning securitisation market for new asset classes given the role mortgage-backed securities played in the 2008 crisis. However, sensible proposals can address this concern. The ECB should continue its work by creating clear new securitisation markets built on transparency—including loan-level visibility of credit risk.
This will allow purchasers of debtbacked securities to build risk models that incorporate the characteristics of individual loans within the bundle. In addition, “skin-in-the-game” rules that require issuers to maintain a minimum stake in the security will reduce the risk of using securitisation to hide bad assets. Restrictions on resecuritisation will make it easier for banks to model the risk of the security and reduce the complexity of counter-party risk. Enabling access to debt from the market Developing Europe’s debt security market might help slightly larger companies to access lending through capital markets rather than from banks. Although the role of debt securities has been growing, they remain only about one-third of the European capital market compared with half in the United States and Japan (Exhibit 105).240 Exhibit 105 European corporations rely relatively heavily on bank intermediation; although the use of securities is growing, they still have a much smaller share Capital market composition, 2012 % Equity1 Debt securities (public and private) Bank assets2 25 12 25 48 26 Corporate balance sheet composition, 2006–133 % of GDP; quarterly3 17 29 34 95 90 85 53 22 Lehman Brothers bankruptcy 12 48 40 54 55 80 Bank 91 assets % of GDP Japan Canada United EU Kingdom 208 212 438 308 Loans 75 15 United States -5% 10 Securities +49% 5 2006 07 08 09 10 11 12 2013 1 Stock market capitalisation. 2 Total assets of domestic commercial banks, including foreign banks’ subsidiaries operated domestically. 3 Excluding Bulgaria, Croatia, Luxembourg, Romania, Switzerland, and Norway NOTE: Numbers may not sum due to rounding. SOURCE: Global financial stability report, IMF, April 2014; Eurostat; McKinsey's Global Economics Intelligence analysis; McKinsey Global Institute analysis See The case for a better functioning securitisation market in the European Union: A discussion paper, European Central Bank and Bank of England, May 2014, and The impaired EU securitisation market: Causes, roadblocks and how to deal with them, European Central Bank and Bank of England, May 2014. 240 Global financial stability report: Moving from liquidity- to growth-driven markets, IMF, April 2014. 239 McKinsey Global Institute A window of opportunity for Europe 177 .
Expanding this channel provides an alternative in case bank lending dries up, increasing the resilience of the financial system. However, one of the reasons for the high exposure of European firms to bank lending is the competitive lending rates they find in Europe.241 Unlike US banks, European banks sometimes regard business lending as a route into cross-selling higher value-added services. This means it will be more challenging to develop capital markets on the scale seen in the United States. Creating a more liquid European capital market for debt securities would, in addition to bolstering resilience, attract international attention from supply-side investment services firms. This would increase the visibility to investors of firms seeking debt, which would reduce borrowing costs and increase the availability of capital.
Ongoing efforts by the European Commission to reduce the current fragmentation of regulation through a capital markets union will play a role in building a large liquid European market, although it continues to be unclear exactly which proposals the EU will incorporate (see Box 8, “The EU’s planned capital markets union”). Doing so by reducing the competitiveness of bank loans would increase the cost to business in the short term at the very least. Box 8. The EU’s planned capital markets union European capital markets are not as integrated as they could be, and many advantages would flow from their further integration.
Today, investment in Europe remains heavily reliant on banks, while equity, debt, and other capital markets play a minor role in financing growth compared with the case in other economies. The capital market is fragmented because of different regulations covering such aspects as insolvency, company law, taxation, and securities law, as well as because of different market practices for products such as securitised instruments and private placements. As a result, financing conditions vary significantly among member states, and shareholders and buyers of corporate debt rarely go beyond their national borders when investing.
Many SMEs still have limited access to finance. Building a true single capital market in Europe by removing such barriers to cross-border investment would improve access to financing for all businesses, in particular for SMEs, in Europe at a low—and comparable—cost. It would also reduce the cost of raising capital, allow investors to diversify funding of their investment, and therefore help the EU to attract investment from all over the world, thereby contributing to economic growth. If European capital markets were to become more efficient, risk and capital allocation would be improved.
It also would contribute to stabilising the financial system by improving its ability to absorb shocks. For the ECB, integrated capital markets would facilitate the implementation of monetary policy.1 In its green paper presented on February 18, 2015, the European Commission laid out its vision for step-by-step progress towards achieving a capital markets union in 2019.2 At the time of writing, the Commission was in discussions about its initial suggestions with all interested stakeholders with the intention of publishing a more detailed white paper in summer 2015. The Commission has signalled its desire to start with efforts to encourage high-quality securitisation across Europe, improve the availability of credit information on SMEs to provide investors with an improved fact base, put into place a pan-European private placement regime to encourage cross-border direct investment in smaller businesses, and support a new European long-term infrastructure investment fund. Yves Mersch, Capital markets union: The “why” and the “how”, speech at the Joint EIB-IMF High Level Workshop, Brussels, October 22, 2014. Breakaway: How leading banks outperform through differentiation: McKinsey global banking annual review 2 2013, McKinsey markets Services Practice, November green Building a capitalFinancial union, European Commission2013.
paper, February 2015. 1 241 178 McKinsey Global Institute 3. How Europe can reignite investment and job creation . Enabling access to equity European SMEs are much more likely to use debt to finance investment than they are to issue equity. Enabling equity issuance as an alternative channel would improve resilience much like creating a debt securities market. There are good reasons that SMEs tend to prefer debt over equity. SMEs often want shortterm or revolving liquidity on a small scale, not suited to the higher transaction costs of issuing equity. In addition, SMEs tend to have lower standards of accounting, which make it harder to satisfy regulatory requirements on equity listings.
National governments and the ECB could take further steps to reduce the impact of the latter hurdle by simplifying and reducing the reporting requirements for SMEs that are issuing equity, particularly for those offering private placements to sophisticated investors. Of course, regulatory requirements on SME equity need to continue to protect unsophisticated investors from fraud.242 However, there are also less justifiable reasons that many SMEs prefer debt over equity. For instance, systematic tax distortions in many countries encourage this preference.
When an SME borrows money, interest payments on the debt are treated as a cost of business and are tax-deductible. In contrast, when SME owners (often founders or entrepreneurs) sell equity to invest, they have to pay capital-gains tax for the shares sold on the increase in value since the owner paid in capital originally. This makes debt a much more tax-efficient instrument for SMEs than equity.
Removing the tax deduction on interest payments would create a more level playing field, but it would also make it more costly to invest now than later. An alternative—providing a tax break on capital gains for equity used for investment— has been implemented in Belgium and proposed in many countries.243 The jury is still out on whether this approach increases investment rates among SMEs.244 In the Eurozone, there is room for doubt about whether monetary stimulus— including QE—will be effective in boosting investment and job creation The evidence suggests that accommodative monetary policy—traditional or nontraditional—has been beneficial to the European economy during a period of stagnation, but that, by itself, cannot fully resolve Europe’s shortage of investment and job creation. Low inflation keeps real interest rates fairly high, and companies continue to hold cash despite ultra-low nominal rates as they rarely adjust their hurdle rates and the macroeconomic outlook remains fragile. Low nominal interest rates have not fully translated into real interest rates.
In some countries, nominal interest rates are near zero, but, because of low inflation or even deflation, the real cost of borrowing has not fallen significantly and may even be higher than before the crisis (Exhibit 106). For example, in Spain, the real corporate lending rate at the end of 2007 was 1.5 percent; in 2014, it was around 3 percent. “Securitisation rules: ‘Significant risk transfer’, retention and due diligence”, fact sheet, De Nederlandsche Bank, February 2014. 243 Mirrlees Review, Institute for Fiscal Studies, 2010. 244 Geert van Campenhout and Tom Van Caneghem, “How did the notional interest deduction affect Belgian SMEs’ capital structure?” Small Business Economics, volume 40, issue 2, February 2013. 242 McKinsey Global Institute A window of opportunity for Europe 179 . Exhibit 106 Although interest rates have fallen, low inflation means that the real cost of borrowing has not declined significantly Real corporate lending rates1 % 8 7 Germany 6 Netherlands 5 France 4 Greece 3 Italy 2 1 Spain 0 Portugal Ireland -1 -2 2004 05 06 07 08 09 10 11 12 13 2014 1 Annualised agreed rate/narrowly defined effective rate, loans with an original maturity of more than one year to nonfinancial corporations (S.11) sector, less inflation calculated with Harmonised Index of Consumer Prices (HICP) method. SOURCE: ECB monetary financial institution (MFI) interest-rate data; Eurostat HICP data; McKinsey Global Institute analysis And, despite an enormous increase in the ECB’s balance sheet, broad money supply has grown more slowly than pre-crisis as the money multiplier has broken down (Exhibit 107). The creation of money happens endogenously when banks lend, and therefore a lack of demand for loans hampers the transmission of monetary policy. An example of this situation in action is the very low uptake of the ECB’s offer of €400 billion of low-cost, four-year financing under the targeted long-term refinancing operation programme. By the end of 2014, only €212 billion of the facility had been used because demand for bank loans is low. The offering in March 2015 had a significantly higher than expected uptake of €98 billion, but this success was overshadowed by the fact that QE had been launched two months earlier. 180 McKinsey Global Institute 3. How Europe can reignite investment and job creation .
Exhibit 107 Monetary policy has been highly accommodative, but it has not driven money circulation and inflation up proportionately Policy interest rates and inflation rate ECB main refinancing operations; % Eurozone HICP at constant taxes; monthly figures; % per year Policy rate Inflation rate 6 5 4 3 2 1 0 -1 2008 09 10 11 12 13 Money supply and money circulation Eurosystem total assets/liabilities; base money1 and M2 Index: 100 = January 2006 2014 Balance sheet Base money M2 300 250 200 150 100 50 2006 07 08 09 10 11 12 13 Pre-recession Post-2008 r = 0.99 2014 Correlation between base money and M2 = 0.45 1 Currency in circulation and MFI current accounts (covering minimum and excess reserves). SOURCE: Eurostat; ECB; McKinsey Global Institute analysis McKinsey Global Institute A window of opportunity for Europe 181 . Why are low interest rates not creating demand for borrowing? In the case of companies, low interest rates, by definition, reduce the cost of capital, but the lower cost of capital is not necessarily reflected in the hurdle rate the company uses when deciding whether to invest.245 The hurdle rate is determined by a number of other factors including the company’s organisational capacity constraints, uncertainty about potential future returns, a desire for financial flexibility, and even the fact that managers are biased towards optimism when they forecast future returns.246 Many companies—especially smaller organisations that may lack financial sophistication—do not adjust their hurdle rates in line with changes in their cost of capital. Indeed, companies adjust their hurdle rates fairly infrequently. A survey carried out in the United States in 2003 when interest rates were low after the dot-com bubble burst found that more than half of companies had not changed their hurdle rates in the previous three years. Most companies fix hurdle rates that are easy to remember—in whole numbers that cluster on 10 percent, 15 percent, 20 percent, and 25 percent.247 Another study finds that many companies—especially smaller organisations that may lack financial sophistication—do not adjust their hurdle rates in line with changes in their cost of capital.248 Whether the ECB should undertake QE has been a topic of intense discussion in Europe for some time—well before the ECB decided to go ahead. One argument put forward is that additional monetary easing through the purchase of securities is an indirect way of financing governments that encourages fiscal profligacy and is therefore against the mandate of the ECB.
But it may still be necessary in order for the ECB to meet its inflation target—and therefore to meet its mandate. Another argument is that securities purchases make taxpayers responsible for any losses—albeit purchases by the ECB (and the Bank of England) have explicitly been of high-quality assets. €1.1T QE programme announced January 2015 In January 2015, the ECB announced a €1.1 trillion QE programme planned to add €60 billion a month to financial markets until September 2016. ECB President Mario Draghi said that the operation would continue until the central bank observed a sustained adjustment in the path of inflation.249 But, given that interest rates are already low and that there are several weak transmission mechanisms in Europe, the effect of QE on investment and job creation might be modest (see Box 9, “QE”).250 Quantitative Easing and ultra-low interest rates: Distributional effects and risks, McKinsey Global Institute, November 2013. 246 Ravi Jagannathan et al., Why do firms use high discount rates? Social Science Research Network Electronic Journal, June 2014. 247 Iwan Meier and Vefa Tarhan, Corporate investment decision practices and the hurdle rate premium puzzle, SSRN Electronic Journal, January 2007. 248 Tor Brunzell, Eva Liljeblom, and Mika Vaihekoski, “Determinants of capital budgeting methods and hurdle rates in Nordic firms”, Accounting & Finance, volume 53, issue 1, March 2013. 249 “ECB announces expanded asset purchase programme”, press release, ECB, January 22, 2015. 250 H.
Woody Brock, Quantitative easing: Myths and half-truths, Strategic Economic Decisions, October 2012. 245 182 McKinsey Global Institute 3. How Europe can reignite investment and job creation . Box 9. QE Quantitative easing by a central bank is the purchase of securities in the open market against central-bank reserves.1 It has been used by the US Federal Reserve, the Bank of England, the Bank of Japan, and now the ECB and the Riksbank.2 QE can play a role in providing banks and financial markets with reserves and liquidity, especially when the usual mechanisms of financial and interbank markets are not working. QE should not be confused with creating money because central banks do not directly affect the supply of broad money through QE. They merely provide the contingent liquidity for banks to create money by lending more.
This is not currently happening on pre-crisis scale, and it can be controlled via capitalisation rules and interest payments on reserves when needed.3 The impact of QE on economic activity is not clear, and the effect of different transmission mechanisms depends on the state of the economy. When there is an acute shortage of liquidity, even solvent companies could be at risk of bankruptcy for cash-flow reasons, and the purchase of assets by central banks helps both banks and companies access cash quickly. The US Federal Reserve System resorted to QE when illiquidity on mortgage and interbank markets threatened to cause a chain reaction of bankruptcies.
It bought $1.25 trillion in mortgage-backed securities between 2008 and 2010 as well as US Treasury securities and agency debt worth hundreds of billions of dollars. The combined actions of the Federal Reserve and US Treasury were able to stabilise financial markets and the banking sector. They did not create strong lending, nor have they created inflation. The ECB faced a different situation, because mortgagebacked securities markets are less developed in Europe. It reacted to the credit squeeze following the bankruptcy of Lehman Brothers by offering long-term refinancing operations that gave banks access to long-term liquidity. It also reduced requirements for how much collateral a bank needed to hold for a given amount of loans.
Unlike the Federal Reserve, it did not engage in a large asset purchase programme.4 Eurozone banks took longer to stabilise. This was partly because of a less aggressive response on the part of the ECB, but more so because of the relative size of the banking sector, the speed of response of national governments, and the time it took European banks to recognise and dispose of bad assets.5 Once the immediate liquidity challenge was resolved, further asset purchases by central banks such as the Federal Reserve’s QE2 and QE3 programmes or the announced ECB programme can have several transmission channels, but the jury is still out on their effectiveness: wealth effects from increased asset prices, reduced long-term interest rates, higher fiscal spending capacity, and weakened currencies. By buying assets, the central bank changes asset prices. If asset prices go up, a wealth effect can be created in which people feel wealthier and therefore spend more— which in turn can lead to higher domestic investment and consumption. The segments of the population affected, however, have the lowest marginal propensity to consume, particularly in Europe where household stock holdings are modest. Asset purchases can also reduce interest rates on specific asset classes, but this effect depends a great deal on other market participants.
Purchasing Treasuries ought to increase demand, reducing yields and bringing down interest rates.6 This could encourage investment. However, if central-bank purchases raise fears of inflation, it could result in higher yields on sovereign debt. For example, interest rates rose following the Federal Reserve’s QE2 and QE3 programmes.7 Establishing clear causation either way is all but impossible.8 As a result, the debate remains inconclusive.
If QE reduces real interest rates, it may trigger investment in those pockets where credit is a constraint—but it may not address the weak demand for credit in the current environment of tepid growth prospects. And the liquid assets of European households in countries such as Germany and France tend to be much larger than total household debt, so total household spending may be negatively affected by low policy rates.9 QE may also weaken the euro and even further boost net exports. This seems currently to be happening, but the effects could also be undone by other central banks’ efforts. QE in Europe today could potentially support government spending by returning the dividends of purchases to ECB shareholders.10 Banking structures report, European Central Bank, November 2013. 6 George Kapetanios et al., Assessing the economy-wide effects of quantitative easing, Bank of England working paper number 443, January 2012. 7 US Department of the Treasury. 8 M.
Hashem Pesaran and Ron P. Smith, Counterfactual analysis in macroeconometrics: An empirical investigation into the effects of quantitative easing, IZA discussion paper number 6618, June 2012. 9 John Muellbauer, Combatting Eurozone deflation: QE for the people, Vox, December 23, 2014. 10 QE and ultra-low interest rates: Distributional effects and risks, McKinsey Global Institute, November 2013. 183 5 QE is also sometimes used to include lending programmes, too, such as those used by the ECB to improve banking liquidity. Here, we focus on the role of asset purchases. 2 Brett W.
Fawley and Christopher J. Neely, “Four stories of quantitative easing”, Federal Reserve Bank of St. Louis Review, volume 95, number 1, January/February 2013; Sweden cuts rates below zero and starts QE, BBC, February 12, 2015. 3 H.
Woody Brock, Quantitative easing: Myths and half-truths, Strategic Economic Decisions, October 2012. 4 Brett W. Fawley and Christopher J. Neely, “Four stories of quantitative easing”, Federal Reserve Bank of St.
Louis Review, 2013. McKinsey Global Institute A window of opportunity for Europe 1 . New ideas should now be debated to widen the range of potential investment and job creation measures The debate on demand-side measures—focused on QE and the appropriate degree of retrenchment in countries’ budget deficits—has become stale. New ideas that open up new possibilities deserve more debate. Europe now needs to consider what could be the next wave of bold action that helps to restore growth without undermining confidence in government solvency and, in the Eurozone, confidence in the euro. In this section we highlight four options: accounting for public investments as they depreciate; careful adjustment of taxation and wage structures; unleashing the silver economy; and issuing vouchers to households redeemable with the ECB. Account for public investments as they depreciate Since the crisis, governments have cut public investment.
Treating such investment as an asset on a public balance sheet and accounting for the related expenditure only during depreciation, often over many decades, could avoid the bias against investment and unlock sufficient spending to almost close the output gap. A strong supervisory body would need to ensure productivity of that spending or test the impairment of assets. Public investment is typically a very small share of overall government budgets, but arguably more discretionary in nature than many ongoing expenses or transfer payments. In Europe, net public capital investment fell by around two-thirds, from 0.9 percent of GDP in 2007 to only 0.3 percent of GDP in 2013.
This implies that governments were barely maintaining their depreciating assets. Indeed, since the crisis, spending has increasingly focused on past obligations such as debt service and pensions rather than investing in future growth (Exhibit 108). Exhibit 108 Since the recession, governments have de-prioritised investment for today and the future In order to repay unavoidable liabilities Time orientation of government expenditure1 % of GDP Index: 100 = 2008 115 â–ª Interest and pension liabilities Past 110 â–ª Future spending has a planning 105 lag but was cut 100 Future 95 Present 90 2008 were growing and almost impossible to avoid 09 10 â–ª Present spending went sharply up as unemployment costs rose and fell as discretionary budgets were slashed 2011 1 Expenditure is calculated as “past-oriented” when it is servicing liabilities incurred by previous commitments (interest payments, pensions), “future-oriented” when it builds up human or physical capital (gross fixed-capital formation, education, R&D), and “present-oriented” in all other cases. SOURCE: Eurostat; AMECO database; McKinsey Global Institute analysis 184 McKinsey Global Institute 3. How Europe can reignite investment and job creation .
In the Eurozone, the Fiscal Compact treats investment spending the same as consumption spending.251 This is not a universal norm. Most US states, for example, have rules that require balanced budgets on operating expenses but allow for debt to be used to fund public investment.252 As a modest step towards such an approach, the European Parliament recommended in October 2013 that all investments in projects co-funded by the EU be excluded from calculations under the EDP.253 In addition, it recommended that separate deficits should be calculated and reported for operating and capital expenditure—although these would not be used for the EDP.254 While this suggestion was rejected by the European Council, the European Commission announced in November 2014 that capital contributions to the new European Fund for Strategic Investments (also known as the “Juncker Plan”) would be treated favourably during assessments of country finances under the Fiscal Compact.255 One approach that would reorient incentives without undermining the Fiscal Compact would be to adjust the calculation of the capital component of government spending.256 Currently, capital spending is calculated on an accruals basis with the expenditure booked at the time that the building work on the project is carried out. This is in keeping with ESA 2010 standards of accounting that costs should be booked when the economic activity associated with them takes place.257 A different way would be to calculate expenditure during the consumption, rather than the creation, of an infrastructure asset, as companies do. Suppose a three-year, €6 billion road project is contracted out to a private construction firm and the government pays half of that amount up-front and the second half on completion to the required standard. Today, although the government is actually paying money only in years one and three, for instance, it books spending of €2 billion in each of the three years.
However, the roads will be operational for the next 20 years. It would make just as much sense for the government to book an expense of €300 million every year for 20 years as the public asset is consumed. Many public assets are unlike private assets in that they do not have corresponding revenue streams attached to them. However, socioeconomic rates of return on public investment can far exceed the government’s cost of capital—and substantially increase the future tax base in a way that makes it self-funding over the long run.258 This makes it appropriate to treat such investments as assets from a fiscal as well as a social point of view. The effect of this proposal would vary by country.
The impact on the size of deficits that are reported under current spending would be small. For most countries, the rate of capital consumption is quite similar to the rate of capital investment. For countries that are bound by the Fiscal Compact, these changes would require a total cut in government consumption When it is making a decision about whether a country should be placed in the EDP, the European Council may take into account the fact that investments were being made as part of structural reform.
However, no criteria are given for when this condition may be in effect, and it is not in regular use. Similarly, there is an exemption for gross capital formation expenditure as part of deficit limits. However, it is applicable only if a country is still meeting the 3 percent limit, is not in the EDP, the country is in recession, and the expenditure in question is the national contribution to a project partially financed by the EU. 252 Capital budgeting in the states, National Association of State Budget Officers, spring 2014. 253 “Resolution of 8 October 2013 on effects of budgetary constraints for regional and local authorities regarding the EU’s Structural Funds expenditure in the member states”, European Parliament, October 2013. 254 Francesca Barbiero and Zsolt Darvas, “In sickness and in health: Protecting and supporting public investment in Europe”, Bruegel Policy Contribution, issue 2014/02, February 2014. 255 “Factsheet 2: Where does the money come from?” European Commission and European Investment Bank, November 2014. 256 Olivier J.
Blanchard and Francesco Giavazzi, Improving the SGP through a proper accounting of public investment, Centre for Economic Policy Research discussion paper number 4220, February 2004. 257 European system of accounts 2010, Eurostat, June 2013. 258 Infrastructure productivity: How to save $1 trillion a year, McKinsey Global Institute and the McKinsey Infrastructure Practice, January 2013. 251 McKinsey Global Institute A window of opportunity for Europe 185 . of €9 billion. But it would enable governments to invest into the future. Estimating the level of investment required in public infrastructure, affordable housing, and R&D spending suggests an unmet investment need of around €140 billion to €152 billion a year among countries signed up for the Fiscal Compact. This total comprises €34 billion of additional infrastructure spending, €59 billion of additional R&D spending, and €47 billion of additional spending on affordable housing.259 If governments were to address this entire investment shortfall under the suggested accounting standard, this option could create aggregate demand between €90 billion and €220 billion after fiscal multipliers are taken into account. This one accounting adjustment would nearly be sufficient to close the output gap (Exhibit 109). An important caveat is that this accounting approach could undermine the productivity of public investment.
There is a risk that government leaders, freed from the responsibility of having projects appear in their fiscal expenses during their tenure, might decide to spend ineffectually on white elephants. This may be politically useful in the short term—boosting particular constituencies such as construction workers and the unemployed—but the costs would be borne by future generations. In order to address this risk, a powerful oversight body would be required to stress-test the productivity of investment programmes and advise on the depreciation schedules of projects and a mechanism for impairment. Carefully adjust taxation and wage structures to redirect resources to households with the greatest pent-up demand Changes to taxation and wage structures have the potential to redirect resources to households with the greatest pent-up demand, which will be critical to stimulating European investment and job creation overall. The marginal propensity to consume of higher-net-worth households is only about one-third that of lower-wealth households, and capital income is less likely to be spent than labour income (see Box 10, “Marginal propensity to consume”). Box 10.
Marginal propensity to consume The marginal propensity to consume (MPC) is a measure of the likelihood that extra income will translate into additional spending. Typically the MPC of low-income households is greater than that of high-income households. For example, a household earning €20,000 a year might spend, say, 90 percent of any extra income due to pent-up demand for things that are outside its budget.
Meanwhile, a household earning €1 million a year may have only marginal unmet demands and would spend only 10 percent of any extra income. Thus giving a euro to the first household would result in an increase in consumption of €0.90, while doing the same for the second household would lead to extra consumption of €0.10. Factors that result in a high MPC include having a low income, having little wealth, being able to access only low interest rates on savings, having low consumption taxes, and having high wealth taxes. Of these effects, the income and wealth effects are very large.
The wealthiest 20 percent of households have a marginal propensity to consume in the order of 10 percent, 259 The need for while the lessinfrastructure investment is basedhas one in the order of 60 percent.1 levels of GDP wealthy half of households on the rate of investment associated with the growth to which Europe aspires. The need for R&D investment is based on the gap between European R&D expenditure and best-in-class countries such as South Korea, assuming that half of the difference must be 1 borne by the public sector in the form of subsidies. The affordable housing estimate is based on the cost of Christopher D.
Carroll, Jiri Slacalek and Kiichi Tokuoka, The distribution of wealth and the marginal propensity replacing substandard Central in major cities by 2025. to consume, European housing Bank working paper number 1655, March 2014. 186 McKinsey Global Institute 3. How Europe can reignite investment and job creation . Exhibit 109 Accounting for investments as they depreciate would enable more public investment Within 3% limit Above 3% limit Existing view Capital consumption view Government deficit, 20141,2 % of GDP New deficit value, 20141,3 % of GDP Germany 0.2 Luxembourg Change to base deficit capacity, 20141,3 € billion 0.2 Estonia 0.3 1.0 1.2 4.7 -2.4 0.3 -2.5 2.3 0.2 -2.9 -2.5 Netherlands 0.3 -0.1 -2.1 Malta 0.5 -0.7 -1.6 Romania 0.6 1.3 -1.1 Greece 27.8 1.5 -1.0 Latvia -3.8 0.1 -0.4 Denmark 3.7 0.1 -1.8 2.5 -2.1 Finland -2.9 Austria -2.9 -3.1 -0.7 Belgium -3.0 -3.3 -1.2 Cyprus -3.0 Slovakia -3.0 Italy -3.0 Ireland -3.9 -3.4 Portugal Spain -4.9 -5.6 1.5 0.3 1.7 38.0 0.3 0.7 -4.2 -6.4 4.1 -6.3 -2.5 -5.5 0.1 4.7 -0.7 -3.5 -4.4 15.1 1.6 0.2 -1.8 -4.4 France 1.2 -2.3 -3.7 Slovenia Infrastructure, housing, and R&D spending increase needed4 € billion 1.9 0.5 4.2 -1.1 29.9 2.7 -7.8 13.3 Total opportunity € billion -9.0 152.1 1 Eurostat forecast, winter 2014. 2 Based on a deficit calculated with gross capital formation on an accruals production basis. 3 Based on a deficit calculated with gross capital consumption on an accruals lifetime use basis. New capacity is given by the current maximum capacity as calculated previously with adjustment to figures caused by the new accounting rule. 4 Assumes that all countries that are currently underspending relative to the levels expected of their GDP growth increase to the appropriate level, while those that are overspending do not change their behaviour in light of a new fiscal rule. Infrastructure gap is based on GDP modelling from Chapter 2, and R&D need is calculated relative to total R&D gap to Japan assuming 50% of the gap needs to be closed by the public sector. Affordable-housing infrastructure estimate based on extrapolation of MGI’s affordable housing analysis of replacing substandard housing stock by 2025.
Extrapolated based on the population in each country with severe housing deprivation. Lower estimate shown. SOURCE Eurostat; OECD growth forecast 2014; EU-SILC; McKinsey Global Institute analysis . Meanwhile, the labour share of national income has declined, and wealth concentration has increased (Exhibit 110). For all the current discussion about the high levels of household debt and slow deleveraging, the fact remains that the value of European households’ net financial assets is approximately 140 percent of GDP—for every debt, there is an asset to match. Exhibit 110 Skewed distribution of income and wealth may have contributed to increased household debt by sustaining consumption growth to 2008 Capital and labour shares in national income, United Kingdom, 1970–2010 % of national income 80 75 70 65 Labour share Capital share 25 20 15 10 1975 80 85 90 95 2000 05 2010 SOURCE: Thomas Piketty database; Kumhof and Rancière, 2010; Rajan, 2010; McKinsey Global Institute analysis Capital income is highly concentrated, so if it plays a bigger role in determining income, income inequality is increased. Richer households that are less likely to consume “recycle” their excess income by lending through financial intermediaries.260 Households at the bottom of the income distribution compensate for stagnant real wages by increasing leverage. In some cases, commentators have argued that governments encouraged debt as a substitute for redistribution to address growing inequality, most notably in the US mortgage sector.261 This situation is not dissimilar to the circumstances that occurred in the run-up to the Great Depression in the 1930s.
Franklin D. Roosevelt said on May 22, 1932: "... No, our basic trouble was not an insufficiency of capital.
It was an insufficient distribution of buying power coupled with an over-sufficient speculation in production. While wages rose in many of our industries, they did not as a whole rise proportionately to the reward to capital, and at the same time the purchasing power of other great groups of our population was permitted to shrink. We accumulated such a superabundance of capital that our great bankers were vying with each other, some of them employing questionable methods, in their efforts to lend this capital at home and abroad”. Michael Kumhof and Romain Rancière, Inequality, leverage and crises, IMF working paper number 10/268, November 2010. 261 Raghuram G.
Rajan, Fault lines: How hidden fractures still threaten the world economy, Princeton University Press, 2011. 260 188 McKinsey Global Institute 3. How Europe can reignite investment and job creation . Options for Europe today include the reduction of labour tax wedges, favourable wage rounds in the Eurozone “core” countries, and judicious land, property, wealth, or capitalgains taxation. As a first approximation, MGI estimates a redistribution equivalent to 1 percent of GDP could trigger additional spending of €95 billion to €273 billion. Great care in designing policy is critical. A poorly conceived measure could harm growth by promoting capital flight or a decline in investment.262 Progressive taxation may reduce growth by reducing the incentives to work and take risks.263 However, inequality also reduces growth by decreasing the development of skills and access to opportunities of talented individuals from disadvantaged backgrounds.264 Empirical estimates of the sizes of each effect on growth are inconclusive but suggest that the detail of how inequality reduction measures are implemented is important. 55+ age group makes up 45% of Europe's households but has nearly 60% of wealth Unleash the silver economy In common with many other economies, Europe’s population is projected to age at an increasing pace and eventually decline. This report outlines numerous options for offsetting these trends through increased productivity and labour-force participation, but ageing demographic trends also offer new opportunities.
European countries can turn ageing into an advantage by offering services and experiences focused on older generations. These could include high-quality leisure activities and destinations, advanced health-care options, and unique cultural experiences. The fact is that, in the Eurozone, those aged 55 and older make up around 45 percent of households but hold almost 60 percent of household wealth (Exhibit 111).265 They typically have stronger balance sheets than younger generations, having saved at an increasing rate throughout their prime working years and having benefited from favourable asset-price developments in the decades prior to the crisis. Encouraging increased spending of this demographic’s accumulated wealth could be a significant lever for boosting investment and job creation and improving the economy for all generations.
Simultaneously, European governments might consider addressing intergenerational equality through other means, such as adjusting capital transfer taxes, or increasing the stock of affordable housing stock, whose current shortage has been a major source of disparity in wealth between the millennial and silver generations. As an example, Japan, which has one of the oldest populations in the world, recently changed its taxation policies to incentivise the transfer of accumulated savings from seniors to their descendants and increased inheritance taxes to increase the redistribution of wealth. Unlocking just 1 percent of the silver age group’s saved wealth as new consumption could offer a stimulus to the European economy of approximately 0.3 to 0.6 percent of GDP.
With its excellent health-care system, its innumerable and highly developed tourism destinations, and strong cultural heritage, Europe is well placed to take advantage of the silver economy. Martin Paldam, “Safe havens in Europe: Switzerland and the ten dwarfs”, European Journal of Comparative Economics, volume 10, number 3, December 2013. 263 Tax systems must balance many societal objectives, including economic growth, wealth equality, and perceived fairness. Property taxes are the most favourable to growth, especially those on immovable fixed property, because its supply is relatively inelastic. Consumption taxes are the next least detrimental to growth, distorting saving, work, and leisure decisions less strongly than income taxes (except where “‘sin’” taxes are deliberately distorting).
Income and corporate taxes have the strongest negative impact on growth because they affect short-term decisions about the supply of labour. Corporate taxes, if not internationally coordinated, are particularly likely to create capital flight for purpose of tax avoidance. See Jens M.
Arnold, Do tax structures affect aggregate economic growth? Empirical evidence from a panel of OECD countries, OECD economics department working paper number 643, October 2008. 264 Federico Cingano, Trends in income inequality and its impact on economic growth, OECD social, employment and migration working paper number 163, December 2014. 265 A household is defined as a person living alone or a group of people who live together and share expenditure. 262 McKinsey Global Institute A window of opportunity for Europe 189 . Exhibit 111 Unleashing the silver economy can stimulate household demand People aged 55+ command nearly 60% of wealth … … save more rather than consuming … … and make up an increasing share of the population Distribution of wealth by age demographic group, Euro area % Savings rate by age demographic % of disposable income2 People aged 55+ are set to make up more than 40% of Europe’s population by 2050, up from 30% today 100% 16–34 16 35–44 20 45–54 20 55–64 17 65–74 15 13 15 18 75+ 15 13 Share of households 5 13 16 23 8 26 2050 Share of total net wealth 16–34 35–44 45–44 55+ 1 Includes housing. 2 Based on a weighted average of historical data from France, Germany, and Italy. NOTE: Numbers may not sum due to rounding. SOURCE: The Eurosystem Household Finance and Consumption Survey, April 2013; Wall Street Journal; Antonin & Piketty, 2009; Aging, Savings, and Financial Markets (World Bank); McKinsey Global Institute analysis Issue vouchers redeemable with the ECB to householders Issuing vouchers to households that are redeemable with the ECB could stimulate incremental spending, accelerate household deleveraging, and raise inflation closer to the ECB’s target level. The central bank would effectively credit households with a certain amount of money through time-limited spending vouchers, redeemable with the central bank. This would be the equivalent of printing money, but it would ensure that the newly minted money was used for spending in the near term. An equitable distribution of vouchers across the Eurozone would avoid the need for lengthy discussions about redistribution between countries, moral hazard, or implicit liabilities. MGI’s first-order estimate is that crediting citizens with around €650 billion through such an approach could close the demand gap in Europe.
While people are concerned about the inflationary effects of such an approach, escaping deflation and restoring an inflation rate close to 2 percent would be the explicit goal of the policy. As such, it may also well be within the ECB’s mandate, although this position could be challenged and the policy regarded as a hidden form of fiscal policy. The target inflation rate could be kept well under control because directly crediting households minimises the money multiplier effect, and the balance sheet expansion for a given increase in aggregate demand would likely be smaller than is the case with QE.
Some commentators are concerned about setting a precedent for future calls on the ECB to print money repeatedly, but as long as its independence is assured, the central bank could do so only if the other monetary-policy tools at its disposal failed to satisfy its mandate, which would typically happen only in as severe an economic turbulence and deflationary environment as today's. 190 McKinsey Global Institute 3. How Europe can reignite investment and job creation . The measure remains risky, however, as it is conceivable that low growth and low inflation or even deflation could continue for longer than desired, as happened in Japan. Moreover, it is difficult to predict what impact deploying this option could have on the perception of citizens and their trust in the common currency. ••• Faced with the immediate pressures of the Eurozone crisis, European government leaders have been able to coordinate policy and take bold decisions to stabilise financial markets at least to a degree. But the fact remains that Europe still has a very significant output gap and a large deficit in investment and job creation. Many approaches—some entirely practical, others more radical—could help to alleviate this situation.
Now is the time to consider all the available options. The next question is how feasible a programme of change is, both on the supply side and on investment and job creation. We explore this question in the next, and final, chapter. McKinsey Global Institute A window of opportunity for Europe 191 .
Chapter photo Chapter 4: Cashier © Getty Images 192 McKinsey Global Institute 3. How Europe can reignite investment and job creation . 4. EUROPE CAN OVERCOME BARRIERS TO ACTION Europe’s economic future depends on whether the continent moves forward on broadranging reform on the supply side, backed by decisive action on investment and job creation. The question is whether—and how—Europe now moves forward on this sweeping agenda. This analysis suggests several powerful sources of optimism. Best practice already exists across Europe.
Three-quarters of all the ideas discussed on the 11 competitiveness growth drivers can be implemented by national governments, potentially bypassing the more complex and lengthy decision making that happens at the European level. According to the results of the MGI survey, Europeans are willing to play their part in unlocking change by making tough trade-offs. And there are, in fact, mechanisms that can help Europe overcome the stalemate in the debate of investment vs.
stimulus, and establish the governance that enables both—even absent a move to a more federal economic and fiscal European system. European decision makers now need to move beyond pure crisis management, articulate a longer-term vision for Europe based on simultaneous action on supply and investment and job creation, and take bold action. If they do not—if the status quo remains—there is a distinct risk that Europe will continue to face a long period of stagnation and instability as unemployment remains endemic and debt burdens stay high. Youth unemployment in particular is associated with increased crime and social disruption.266 Denis Fougère, Francis Kramarz, and Julien Pouget, Youth unemployment and crime in France, IZA discussion paper number 2009, March 2006. 266 .
We broadly see four possible futures for Europe, and in only one of these is greater prosperity highly probable (Exhibit 112). Sustainable growth and prosperity will likely be obtained only when both far-reaching structural reforms implemented mostly at the national level and investment and job creation enabled at the European level are carried out in concert. They are mutually reinforcing, amplifying each other’s impact, and together they have a strong likelihood of returning Europe to a growth trajectory that can meet the aspirations of its population. Should Europe embark on a fiscal spending spree without accelerating reforms to boost competitiveness, the resulting growth will not prove sustainable as increasing debt burdens become unbearable.
Conversely, pushing through reform at all costs in the absence of measures to support investment and job creation risks continued deflation, high unemployment, increasing political instability, and even, potentially, the breakup of the Eurozone. Exhibit 112 MGI has identified four potential scenarios for Europe—only reform, investment, and job creation combined will deliver prosperity <1% growth scenario Yes Running out of steam and political capital â–ª Short-term recession particularly in France â–ª Structural reform —mostly at the national level and Italy; medium-term stagnation in Europe, followed by sluggish growth Risk of populist parties gaining power, calling for dissolution of the European Union as unemployment and debt increase Gridlock â–ª Status quo: Slow growth and significant volatility due to uncertainty on future direction â–ª Japan-style deflationary spiral and risk of need to restructure public debt High-risk scenario >2% growth scenario Lockstep to prosperity â–ª Higher GDP growth (2–3% in the medium term) European shot in the arm â–ª Short-term GDP boost could end in financial collapse No No Yes Reigniting investment and job creation—enabled at the European level SOURCE: McKinsey Global Institute analysis Europe has significant challenges to overcome. On the structural side, there will be opposition to the short-term effects of reform. There also will be significant fiscal constraints, and the ever-present issues of fragmented decision making and strong vested interests.
For reform on investment and job creation, huge issues of trust and questions of governance must be worked through, along with genuine disagreement over the right economic path. But the inertia of these challenges can be overcome if Europe’s leaders take the opportunity to build on popular sentiment and work towards packaged deals that combine reform and job creation, leverage existing EU investment programmes, and strengthen key institutions to avoid moral hazard (Exhibit 113). 194 McKinsey Global Institute 4. Europe can overcome barriers to action . Exhibit 113 Europe will need to work in tandem on reform and support for investment and job creation Challenges Reform to boost competitiveness, mostly at national level (75% impact), supported at European level â–ª Opposition to short-term fallout of reform â–ª Fiscal constraints â–ª Fragmented decision making â–ª Vested interests â–ª Lack of trust and battles on who picks up the tab Investment and job creation, enabled mostly at the European level â–ª Insufficient institutions and governance Mechanisms to overcome inertia â–ª Demand support mechanisms that avoid moral hazard â–ª Package deals combining reform and job creation â–ª EU investment programme â–ª Genuine disagreement on the economics â–ª Complexity of implementation SOURCE: McKinsey Global Institute analysis Three-quarters of competitiveness growth drivers can happen nationally with European action to boost investment and job creation The fact that three-quarters of the competitiveness growth drivers discussed in this report can be implemented by national governments is an important key to unlocking change. Nevertheless, meaningful progress on accelerating reform will require visionary political leadership and, importantly, as we have stressed, simultaneous consensus and action at the European level to shore up investment and job creation. There are many institutional and political barriers to implementing competitiveness reforms that political leaders need to tackle (Exhibit 114). Together, the 11 competitiveness growth drivers amount to sweeping and radical change—and change is often hard. For some, willingness to implement the growth drivers may be weak because they are unpopular, require considerable time to take effect, and are subject to disagreement among experts. Immigration may be a powerful part of the answer to shrinking labour pools, but it is generally unpopular among citizens who worry that there will be more competition for jobs, housing, and even social benefits. Improving infrastructure is complicated by the fact that these projects are long term and therefore have to outlast any political cycle.
Innovation policy is an example where most people would be in favour, but there is disagreement about the nuance of how to improve outcomes in the most effective way. Other growth drivers are difficult to implement. In an era of rapid technological change, more flexible labour markets are necessary, but they face resistance from groups with vested interests that may feel negative effects from reform.
Openness to more trade is another such issue. Budget limitations stand in the way of improved education. And decision making on completing the Single Market can be fragmented and difficult. McKinsey Global Institute A window of opportunity for Europe 195 .
Exhibit 114 Europe needs to overcome many institutional and political obstacles to change Significant obstacle Moderate obstacle Willingness to implement Growth driver Ability to implement Fragmented Perceived Expert Time lag Budget decision unpopu- disagree- until benefits materialise constraints making larity ment Vested interests Complex implementation Nurturing ecosystem for innovation    Effective education to employment                             Reduced energy burden  Productive infrastructure investment Supporting urban development  Competitive and integrated markets in services/digital Public-sector productivity  Further openness to trade   Pro-growth immigration    Investment and job creation stimulation       SOURCE: McKinsey Global Institute analysis 196     Enhanced labourmarket flexibility   Grey and female labour-force participation  McKinsey Global Institute 4. Europe can overcome barriers to action  . Europeans tend to be sceptical about the ability of the politicians who represent them to move forward decisively. But crises often create strong incentives to take action. In the teeth of a severe financial and economic crisis in the 1990s and despite a very weak economy, Sweden boldly undertook sweeping structural reforms, transformed its public finances, and revamped productivity growth in many sectors. In the first decade of this millennium, Germany undertook radical reform of its labour market, thereby reducing unemployment, holding down unit labour costs, and improving the economy’s overall competitiveness. More recently, Spain’s labour-market reforms are projected to increase that economy’s productivity growth by an estimated 0.25 percent a year.
Effective reform depends on building an appetite for change, demonstrable government commitment, and the careful management of interest groups (Exhibit 115). Exhibit 115 Successful economic reforms managed to translate an appetite for change into concrete reforms, while managing opposing interests â–ª A popular sentiment that “things need â–ª to change”, often triggered by exogenous events or crises Shaping the terms of the debate on the need and proposals for economic reform Appetite for change â–ª A concrete reform plan, â–ª Government commitment â–ª Selecting, scoping, â–ª sequencing, and bundling reform steps to impact incentive structures and distributional effects Strategic consensus and trust building with stakeholders â–ª Interest group management1 developed with the involvement of experts and stakeholders A high degree of government commitment with respect to the reforms, based on strong cohesion within the entire government and/or across parties Effective communication of the reform efforts to the public and active involvement of stakeholders; no “reform by stealth” 1 Mancur Olson’s Logic of collective action (1965) implies that small, organized groups have incentives to influence policies in their favor—usually, these interests are protectionist and thus counter to many economic reforms; Alesina and Drazen (1991) hypothesized that the more unequal the distribution of the costs of reform, and the more polarized the society is, the longer it takes to be adopted (see also Alesina and Rodrik, 1994. SOURCE: Tompson and Price, 2009; literature review; Lora and Olivera, 2004; McKinsey Global Institute analysis McKinsey Global Institute A window of opportunity for Europe 197 . There are ways to unlock European action on investment and job creation despite governance, moral hazard, and distributional issues Agreeing to investment and job creation measures at the European level is difficult—as we know from the fact that debate on the best path forward has been going on for six years. Most of the barriers relate to governance and a lack of trust among European partners and a fear of creating moral hazard. However, most of these issues can be overcome within Europe’s—specifically the Eurozone’s—current institutional framework. Without moving to a full federal system of economic and fiscal governance, there is scope to use levers that don’t cause moral hazard and to design “package” deals in which national-level supply-side reform is coupled with European action on investment and job creation. It is in the interests of all to move forward given the strong economic ties that bind all parts of Europe together. Investment and job creation measures face many tangible barriers.
Many measures, including debt restructuring and transfer payments, have explicit distributional consequences. In some cases, there is genuine disagreement about the economics and what is the most effective path ahead. Examples where there is disagreement include the capacity of economies to raise more public debt and whether crisis economies are sufficiently small and open to export their way out of recession.
There are formidable institutional barriers, too. National leaders and sometimes their parliaments and even the constitutional courts of 28 EU member states need to agree on the path ahead. The ECB has a mandate to control Eurozone inflation but not to target employment as the US Federal Reserve does.
In the long term, Eurozone economies, in particular, need to address even more fundamental questions about the institutional design of economic and fiscal governance. In the absence of a move to greater fiscal and economic integration, designing stimulus in a way that minimises moral hazard has to be an important part of the mix. Changes in national accounting rules, or adjustment of taxation structures, could be as viable as elevating large-scale investment programmes to the European level. Ideally, the types of investments selected would be large scale, and in the interest of all Europeans, such as in coordinating pan-European energy grids and production facilities, upgrading the continent’s security and defence capabilities, or implementing multinational R&D and education programmes. Crafting package deals of measures designed to boost competitiveness and stimulate investment and job creation may serve as a viable approach, too.
We have already seen agreements that combine action on the supply side—a commitment to detailed reform— with financial support for those economies that were bailed out by the ECB, the European Commission, and the IMF. There could now be scope for other economies, including large ones that have not been subject to such bailout conditions, to make a commitment to comprehensive reform in exchange for decisive action at the European level to reignite investment and job creation beyond bare-minimum credit programmes. This could be coupled with multiple topic-focused pairings of reform and investment, such as an energy union that combined investment with reform of national regulation like market access and competition barriers.
For such package deals to be successful, it is imperative that European leaders work towards restoring trust among individual states. Today, there is a lack of trust that countries will spend wisely and follow through with difficult reform, rather than later seeking a bailout from their peers, which is a barrier to action. It is understandable that people living in areas that have felt relatively less economic pressure feel less of an imperative to act beyond a broad sense of solidarity and that these people regard the burden of resuming growth as lying squarely on the shoulders of more affected regions. But the reality is that all European countries have specific needs for reform (Exhibit 116).
All European economies have been through periods of both strength and weakness. 198 McKinsey Global Institute 4. Europe can overcome barriers to action . Exhibit 116 Each country has different relative priorities for structural reform and investment and job creation measures Relative importance of structural reforms and demand-side measures Nordics Continental Europe United Kingdom and Ireland Southern Europe Baltics Central and Eastern Europe Need for structural reform Inverse average country z-score for competitiveness growth drivers Higher 0.8 Bulgaria 0.7 0.6 Romania 0.5 Croatia Poland 0.4 Italy Slovakia Greece Malta 0.3 Latvia 0.2 0.1 Europe-30 average = 0 -0.1 Czech Republic Lithuania Austria Norway Estonia -0.3 -0.4 France Belgium Germany Finland Switzerland Ireland United Kingdom -0.5 Portugal Slovenia Hungary -0.2 Cyprus Spain -0.6 Netherlands Denmark Sweden Luxembourg Lower -0.7 -2 -1 0 1 2 Lower need 3 4 5 6 7 10 11 Higher need Need for investment and job creation Output gap (inverse) as % of GDP1 1 Positive values indicate an economy running below potential. SOURCE: European Commission; McKinsey Global Institute analysis Europeans are willing to play their part in their region’s economic renaissance Many politicians may fear that reform will not find favour with voters, and they therefore opt for inertia. But the evidence suggests that perceptions of electoral risk from voters who do not support the case for reform are not justified. First, research suggests that the probability of being re-elected is approximately the same for a reforming government as for a government that does not embark on reforms.267 Second, the results of the MGI survey suggest that, far from being anti-reform, Europeans actually want their leaders to act decisively in favour of growth. Marco Buti, Alessandro Turrini, and Paul van den Noord, Reform and be re-elected: Evidence from the postcrisis period, Vox, Centre for Economic Policy Research, July 2014. 267 McKinsey Global Institute A window of opportunity for Europe 199 . 87% of respondents in 8 countries would make trade-offs for higher social standards and incomes Europeans do not expect to live in a permanent state of economic underperformance and eroding social provision. The MGI survey offers new evidence that they are willing to make trade-offs to secure meaningful change, and it even suggests the broad parameters of reform that could win the hearts and minds of the European population. The majority in the survey did not opt for the status quo but for a new combination of improved health care, living environment, buying power, education, and public safety, and significant compromises to achieve that (expressed in the survey as working longer and harder or somewhat reducing social protection). Support for this combination is, as we have discussed, remarkably consistent across countries, ranging from 87 percent support in Germany to as high as 98 percent support in Spain (Exhibit 117). Exhibit 117 Appetite for change in Europe may be greater than often believed Share of respondents who prefer the average scenario over the status quo % (weighted) 98 96 Spain Poland 95 Italy 95 93 Romania Sweden 91 Europe 91 90 United France Kingdom 87 Germany Alignment on direction of change desired for each societal priority Share of respondents whose optimal scores for each dimension indicate the same direction of change as the European average scenario Direction of change Priority Degree of alignment1 Health care 95 Living environment 93 89 Education Buying power 84 Work-life balance2 84 Public safety 84 Social protection 58 1 Respondents who desire no change from the status quo for a given dimension are considered to be non-aligned with the direction of change. 2 Calculated as average of working hours and productivity scores from conjoint survey. SOURCE: MGI European Aspirations Conjoint Survey, August 2014; McKinsey Global Institute analysis 200 McKinsey Global Institute 4.
Europe can overcome barriers to action . ••• Europe has fundamental strengths on which to build. The question is how to use those strengths as a platform for a return to robust growth. There are solid grounds for optimism that a better European society is possible. Importantly, policy makers, business people, and civil society leaders should be emboldened by the fact that the solutions to Europe’s current underperformance do not need to be “imported” from the rest of the world; they are already in place elsewhere on the continent.
Europe can largely boost its competitiveness through action on the national level, obviating the need for complex decision making at the European level. MGI’s survey indicates that citizens are willing to make a contribution to Europe’s longterm recovery. There is a genuine opportunity for real change and a positive narrative for Europe, building on the continent's undoubted strengths and seizing the current window of opportunity created by the confluence of a number of positive trends observed in 2015. Now is the time for Europe’s leaders to shift focus from crisis management and towards framing a broad programme of supply-side and investment and job creation that can put Europe’s economy on a healthier footing for the long term. McKinsey Global Institute A window of opportunity for Europe 201 .
Chapter photo Appendix: Health care © Getty Images 202 McKinsey Global Institute 4. Europe can overcome barriers to action . APPENDIX This appendix provides details on the MGI survey, and the data sources and methodologies used in this report in the following sections: 1. The MGI European Aspirations Conjoint Survey 2. Growth scenarios and GDP growth impact sizing for competitiveness growth drivers 3. Investment-requirement sizing for competitiveness growth drivers 4. Aggregate impact sizing for investment and job creation options 1. The MGI European Aspirations Conjoint Survey Aim, scope, and overview of instruments and limitations The purpose of the MGI European Aspirations Conjoint Survey was to reach an understanding of Europeans’ aspirations regarding various societal outcomes underpinned by economic prosperity, as well as their own economic situation, for the coming decade. As such, the survey provides an empirical contribution to the ongoing debate about whether Europe has evolved into a “post-growth society” or whether there is still a desire for, and commitment to, elements of economic growth among European citizens. It also aims to understand whether citizens are prepared to personally contribute to such growth and make the kind of trade-offs that it involves. The survey, undertaken between August 13, 2014 and August 22, 2014, by SKIM of the Netherlands using online panels of Global Market Insite, covered eight European countries: France, Germany, Italy, Poland, Romania, Spain, Sweden, and the United Kingdom. Together, these countries make up about three-quarters of the Europe-30 population and represent the five European regions this report considers.
Two thousand people were included in the survey in each of the eight countries, giving a total sample of 16,000 people. A conjoint methodology was chosen as primary instrument to allow us to account for the trade-offs Europeans may have to make in order to achieve desired improvements, and to avoid establishing a “wish list” of priorities that does not properly take cost into account. The survey also comprised a number of regular polling questions that were asked after the conjoint was completed (listed below) in order to (1) deep-dive into important elements of the conjoint such as the willingness to work; (2) test further attributes and attitudes like current satisfaction levels; and (3) provide the socio-demographic background of respondents for sample weighting and analysis of results by demographic grouping. Like any field research, this survey had a number of limitations and biases. Details of these can be found in the following methodology sections. However, the largest limitations and biased we would note include (1) the fact that online polling creates a bias towards Internet users: (2) the use of professional panels, as well as drop-out rates during the survey, creates a certain self-selection bias; (3) cross-cultural differences; (4) the choice of conjoint variables limits trade-offs to the variables presented; (5) the use of qualitative description of attributes and levels in the conjoint presentation, in conjunction with the quantitative model lying in the background to balance scenarios in terms of cost and GDP impact, introduces a degree of subjectivity in how respondents interpret attribute descriptions and whether they perceive .
scenarios as balanced; (6) post-processing techniques and estimation of utility values can introduce additional bias from weighting and extrapolating partial responses; and (7) in this pure cross-sectional study, we gain no data with which to assess variations over time. Sampling and recruitment of participants We used professional online panels of individuals in each country who are rewarded for their participation in surveys. Within the panel population, the panel provider sought to obtain 2,000 respondents for each country, and sent out invitations to participate in random batches of approximately 200. The socioeconomic distribution of respondents after each batch was carefully monitored and the next batches geared towards randomly selected participants of underrepresented groups where needed. As the survey panels were recruited online, there may be a bias in the results towards individuals who are active Internet users. Fielding Respondents received an invite, along with a short description, via email.
The questionnaire itself was conducted online in a web browser. During the process, some respondents finished the survey, some stopped and later resumed, and some dropped out completely. Invitations were sent until 2,000 completed surveys were reached for each country. We saw very typical dropout rates for the survey.
By country, these were 20 percent in the United Kingdom, 19 percent in France, 14 percent in Germany, 12 percent in Italy, 11 percent in Poland, 13 percent in Romania, 10 percent in Spain, and 18 percent in Sweden. Country-specific adaptation and quality assurance The MGI survey covered eight different countries and as many languages, each with a distinct culture. As such, survey respondents may have interpreted the questions and attributes they were presented with in different ways. Any cross-country comparisons need to be interpreted in that context.
Score results observed in cross-cultural comparisons may have a different meaning than those derived from intercultural comparisons. The equivalence of concepts, and the similarity in meanings attached to a behaviour or concept, can vary significantly among cultures. Linguistic equivalence, the wording of items (in terms of form, meaning, and structure) can also vary across the different language versions of a document, including the reading complexity of the items presented, and how natural the text may sound to a native speaker.268 We used a professional translation firm to translate the survey from English into national languages and test semantic equivalence.
We also tested the survey translation with a native speaker per country who also spoke English and was familiar with the objective of the survey. Finally, we provided respondents with definitions of the terms and concepts used in each question to help moderate the impact of cross-cultural differences. The same conjoint design was used for all eight countries. Post-processing: RIM-weighting procedure The responses were weighted to match national distributions for each country individually, according to gender, age, income, education levels, employment (both status and occupation), country of birth, and household composition. Using demographic data obtained from Eurostat, deviations in the sample from the national average were measured. Using a technique called RIM weighting (Random Iterative Method, also known as raking), we applied weights to individual respondents to match demographic distributions.
For See Fons van de Vijver and Norbert K. Tanzer, “Bias and equivalence in cross-cultural assessment: An overview”, Revue européenne de psychologie appliquée, volume 54, issue 2, 2004, and StefaniÌa Ægisdóttir, Lawrence H. Gerstein, and Deniz Canel Çinarbas, “Methodological Issues in cross-cultural counseling research: Equivalence, bias, and translations”, The Counseling Psychologist, volume 36, March 2008. 268 204 McKinsey Global Institute Appendix .
example, if we surveyed more males than represented in the national population, we would adjust the weight of males downwards. Instrument 1: Conjoint—methodology, variables, attributes, and presentation of trade-offs We used a conjoint methodology to uncover the preferences of the respondents when faced with different scenarios, each consisting of a combination of outcomes for several interdependent dimensions or variables. Choice of variables The variables included in the conjoint were chosen to reflect on the one hand the dimensions that citizens typically value in their lives, and on the other hand the key drivers of (public) expenditure as well as, in turn, income generation. To capture what people value, we base the choice of variables on the OECD Better Life Index, a widely recognised instrument for grasping and comparing social progress and quality of life, as a starting point. Attributes from the OECD Better Life Index such as “civic engagement” and “life satisfaction” were, however, excluded from the conjoint as our focus was on attributes whose quality could clearly be linked to the availability of economic resources (such as public or private spending). For the same reason, we chose to consider “social protection” rather than the Better Life Index attribute “community”, and we disaggregated the attribute “work-life balance” into “working hours” and “productivity” in order to provide respondents with a more tangible understanding of what an improvement or sacrifice in this dimension would entail, and to be able to estimate economic impact. Correspondingly, we included the following eight variables in the conjoint scenarios, and provided the ensuing definitions to ensure that respondents had a clear and common understanding of these variables: ƒƒ Health care. The quality of health care involves, for example, longer life expectancy, higher quality of life, better technologies and treatments, and shorter waiting lists.
It also includes care for the elderly. ƒƒ Education. The quality of education relates to all types (primary, secondary and higher education). ƒƒ Living environment. Environment and public space involves protecting the environment (like forests and lakes) and the quality and appearance of public spaces (for example, parks, roads, and stations). ƒƒ Public safety.
Safety involves more police officers on the street, more prisons, and more traffic checks. It also includes national defence. ƒƒ Social protection. Social protection could involve the level of, and entitlement to, allowances in case of unemployment and/or disability.
This also includes welfare. ƒƒ Buying power. This refers to income from work and/or allowances and benefits effectively available to spend each month (after paying tax, social protection costs, and health-care premiums). ƒƒ Working hours. Work time refers to actually worked hours in a working week.
It does not include unpaid work, such as volunteer work. ƒƒ Productivity. Investment in productivity could include extra training, re-training, improved effort, and being more ambitious when looking for a job. McKinsey Global Institute A window of opportunity for Europe 205 . The overall number of variables was limited to eight to keep the complexity of the survey manageable. We would, of course, have liked to decompose buying power into typical personal expenditure items, fully cover all elements of public spending also including, for instance, general administration, or test each of the specific trade-offs involved in the 11 growth drivers described in our report (e.g., a later retirement age), but this would have led to unmanageable complexity of the conjoint scenarios. Choice of attribute levels To limit the cognitive load of respondents when considering scenarios, we used quantitative specifications of the levels only for two variables, namely disposable income due to its high weight in GDP and working hours as our key balancing variable. We used simpler standardized qualitative levels for the remaining six variables. For disposable income, the levels were 20 percent lower, 10 percent lower, the same, 10 percent higher, and 20 percent higher. For working hours, the levels were six hours less, three hours less, the same, three hours more, and six hours more per week.
For health care, education, the living environment, social protection, public safety, and productivity, the levels were much lower, lower, the same, higher, much higher. Balancing the conjoint scenarios in a GDP model To balance the scenarios and to assess the economic implications, we translated the levels described above into additional or reduced spending or income generation. We based this calculation on the current share of GDP of the eight variables in base case, using a GDPweighted average (2012) of the eight countries for each of the topics addressed in the survey (Exhibit A1). If one variable was improved in a scenario, other variables had to be reduced by collectively an equivalent monetary amount—or working hours or productivity had to increase to generate the equivalent higher income. Exhibit A1 Survey: GDP model Theme Description Europe-8 value1 Source Health care Cure and care; public and private expenditure (% of GDP) 10.22% World Bank Education Total expenditure (% of GDP) 6.03% Eurostat Living environment Total expenditure on environmental protection (% of GDP) 1.21% Eurostat Social security Public expenditure on social protection against the risks related to unemployment, sickness and disability, and old age (% of GDP) 15.16% Eurostat Public safety Public expenditure on defence, public order, and safety (% of GDP) 3.44% Eurostat Buying power Share of GDP not attributable to 46.83% government expenditure and not committed to private expenditure on health care, education, and environmental protection Eurostat 1 Does not sum to 100% as not all dimensions of non-disposable expenditure were considered. SOURCE: MGI European Aspirations Conjoint Survey, 2014; Eurostat; World Bank; McKinsey Global Institute analysis 206 McKinsey Global Institute Appendix .
We applied the following translations from scenario descriptions and attribute levels to spending: ƒƒ For disposable income, working hours, and productivity, we assumed increases or decreases of zero, 10, or 20 percent relative to the current level as a percentage of GDP. For disposable income, this corresponds exactly to the levels shown to respondents in the survey. For working hours, this corresponds roughly to the 3 or 6 hours more/less shown in the survey, slightly less to reflect declining marginal productivity of additional hours worked. For productivity, we chose the same changes as for hours worked, as productivity also directly affects the entire economy in terms of additional (or lower) output generated. ƒƒ For health care, we assumed an increase in spending even when respondents chose “the same” level due to increasing health care cost in line with demographics. We used the European Commission’s 2012 report on ageing as basis for this.269 “Much lower” health care was assumed to correspond to no increase in health-care expenditure, resulting in a negative effect of 42 percent due to GDP growth and ageing.
We assumed that “lower” corresponds to compensating for demographic shifts but not GDP growth; building on the European Commission’s “demographic scenario”, we arrive at a reduction of 29 percent of health care spend as share of GDP. Compensating for demographics plus the assumed growth in GDP yield “the same” quality of health care as today—entailing an increase of 8 percent of health care spend as a share of GDP. The “income elasticity” and the “non-demographic determinants” scenarios defined by the European Commission were used for “better” and “much better” health care, entailing increases in health care spend as a share of GDP of 28 and 39 percent, respectively. ƒƒ For education, the living environment, social protection, and public safety, we assumed that the options “much lower”, “lower”, “higher”, and “much higher” corresponded to a 50 percent and 100 percent decrease or increase in expenditure as a percentage of GDP, respectively (for example, current spending on education is about 6 percent of GDP and therefore “higher” spending would imply about an extra 3 percent of GDP). “The same” level for a given attribute implied a constant GDP share of spending.
We chose these large increments between options to ensure that the scenario choices would entail discernible trade-offs and therefore reveal respondents’ priorities. Exhibit A2 summarises the additional/lower cost or reduction/increase in available resources by variable and level. There is necessarily a degree of subjectivity involved in assigning quantitative spending values to qualitative levels. This caveat should be taken into account when interpreting the quantitative results of the conjoint analysis. The 2012 ageing report: Underlying assumptions and projection methodologies, European Commission, April 2011. 269 McKinsey Global Institute A window of opportunity for Europe 207 . Exhibit A2 Additional/reduced cost and lower/higher resources available by conjoint variable and level % of GDP, Europe 1 2 3 4 5 Health care -4.2 -2.9 0.8 2.8 4.0 Education -6.0 -3.0 0.0 3.0 6.0 Living environment -1.2 -0.6 0.0 0.6 1.2 -15.2 -7.6 0.0 7.6 15.2 Public safety -3.4 -1.7 0.0 1.7 3.4 Buying Power -10.2 -5.1 0.0 5.1 10.2 Working hours -20.0 -10.0 0.0 10.0 20.0 Productivity -20.0 -10.0 0.0 10.0 20.0 Social Security SOURCE: McKinsey Global Institute analysis Presentation of the conjoint scenarios The conjoint approach consisted of two stages—an introductory stage and the conjoint exercises or scenario choices. In the introductory stage, a respondent was able to build a personal ideal scenario using seven of the eight variables (excluding productivity) (Exhibit A3). This initial step of the survey gave respondents the opportunity to rank the variables and to express the intensity of their preference for one variable over another. A GDP model (described above) balanced the cost of the selected attributes by automatically increasing or decreasing working hours as much as needed to generate the additional economic resources. This exercise served two goals. First, it provided the respondent with a general understanding of the components and tradeoff principle of the conjoint.
Second, it also revealed whether there was a desire to improve spending on health care, education, the living environment, social protection, and safety, given the constraints on each individual’s buying power and free time. This also served as input for the second stage, the conjoint trade-offs (see explanation below). The second stage was the conjoint exercise during which each respondent was presented with ten sets of two alternative GDP-balanced scenarios at a time, and then asked to choose between them (Exhibit A4). The scenarios each specified a combination of variables at five different levels denoting spending and/or quality. The conjoint technique we used was a Partial Profile Conjoint.
In each trade-off exercise we randomly showed only four out of eight possible variables per scenario. The main reason for this approach is to prevent information overload, while still generating accurate outcomes thanks to our big samples. To ensure a more realistic and accurate trade-off exercise, the conjoint scenario choices were tailored to the preferences of individual respondents from the introductory stage. We picked the two themes for which the respondent indicated the strongest preference to spend more, and, for these themes, we did not show any of the lower—unfavourable—levels in the conjoint scenarios.
This adaptive phase increased the accuracy of our preference estimations (utilities) and prevented respondent fatigue and frustration. Each scenario 208 McKinsey Global Institute Appendix . shown is designed in such a way that it is roughly GDP-neutral so that respondents are offered realistic choices. Each respondent is shown ten sets of scenarios to trade off. Exhibit A3 Building an ideal personal scenario SOURCE: The MGI European Aspirations Conjoint Survey, 2014; McKinsey Global Institute analysis Exhibit A4 Choosing between scenarios SOURCE: The MGI European Aspirations Conjoint Survey, 2014; McKinsey Global Institute analysis McKinsey Global Institute A window of opportunity for Europe 209 . Estimating optimal and average scenarios We estimated the relative preferences each individual has for each of the eight attributes based on the choices each respondent made in the ten conjoint exercises presented. For example, if someone consistently chooses a scenario with much higher spend on education, then the estimated preference score for much higher education spend will be high. We applied a Hierarchical Bayes (HB) technique (using the industry standard Sawtooth software) to calculate these preferences or utility scores. The HB method enables relatively stable estimators of preferences at individual level, which allows analysis at subgroup level (unlike logit models or LC). HB is an iterative approach that seeks to optimize the utility scores for each individual and variable such that they best predict the actual choices a respondent makes in the conjoint exercises.
For example, assume a respondent chooses between scenario A and B, each containing four variables and levels, and he selects A. Then the HB method estimates utility scores so that the total estimated preference score—the sum of the estimated utility scores for the four variables and levels presented—is higher for scenario A than for scenario B. The HB method tries to estimate utility scores in order to maximize the instances where prediction and actual choice match across all scenario choices presented to a respondent. We estimated an average scenario by calculating the average of all respondent-level optimum scenarios.
Based on the GDP model, each possible GDP-balanced scenario was determined—in other words, all combinations of more or less education, social protection, working hours, etc., which matched economic spend and available resources. Note that these scenarios were full-profile and contained all eight variables and respective levels and not only four, which we had in the partial-profile conjoint exercises. Also note that for this processing step, we applied country-specific adaptations of the European shares of GDP listed in Exhibit A1, based on the same sources.
For all these full-profile scenarios we calculated the total preference score for each individual respondent as the sum of utilities of the associated levels. On this basis, we identified the most preferred balanced scenario per individual. For optimum scenarios per country, we chose the scenario that maximises total preference score for the entire sample of respondents. To determine a country-specific or European-average scenario, we took the average level of each variable among all the optimal scenarios of individual respondents.
For instance, if 50 percent of respondents had education “much higher”—translated for averaging to a numeric level 5 on a scale of 1 (much lower) to 5 (much higher)—as most preferred, and the other 50 percent had “higher” (level 4) as most preferred, then the average scenario was set to 4.5. In practice, the difference between optimum and average scenarios was small. Average scenarios have the advantage vis-à-vis optimum ones that we can determine more granular values in between the discrete choices of 1, 2, 3, 4, and 5 as in an optimum scenario. We calculated how many people preferred the country-specific average (or European average) scenario over the current status-quo scenario (nothing lower or higher) by calculating total preference scores for each respondent and comparing how many times the average scenario has a higher preference compared to status quo.
The level of preference was similar as for the optimum scenario. Based on the differing preferences amongst individuals (e.g., some people prefer higher education, whereas others opt for more income) we ran a cluster analysis to identify different segments of respondents. We tested several clustering techniques and applied a hybrid of SPSS Two-step and K-Means, which generated the most discriminating clusters. The inputs for the cluster algorithm were the respondent level optimal scenario levels for each of the eight attributes (e.g., one respondent could have had health care at level 4, education at level 5, etc., and another respondent could have had health care at level 2 and education at level 210 McKinsey Global Institute Appendix .
4). The cluster algorithm then looked for groups of people with very similar optimal scenarios whereas between different groups the typical scenarios were truly different. Instrument 2: Traditional survey questions Besides the conjoint exercises, the survey also posed a number of other questions. The goals of asking further survey questions were to obtain socio-demographic profiling information and deepen our understanding of respondents’ values and attitudes as well as their more specific preferences regarding some of the issues raised by the conjoint exercises. Not all respondents received all of the additional questions; they were randomly assigned a selection, except for the socio-demographic profiling. In this report, we evaluate only a few aspects most related to the conjoint trade-offs, but list the full set of questions for reference. Socio-demographic profiling: ƒƒ Are you…? Female or male. ƒƒ How old are you? Under 15, 15–19, 20–24, 25–29, 30–34, 35–39, 40–44, 45–49, 50–54, 55–59, 60–64, 65–69, or 70 years or older. ƒƒ What is the highest level of education you have successfully completed? Preprimary, primary, and lower secondary education (ISCED 0–2), upper secondary and post-secondary non-tertiary education (ISCED 3–4), or first and second stage of tertiary education (ISCED 5–6). ƒƒ Which of the following situations is most applicable to you? I am self-employed, I am employed (not by the government), I am employed (by the government), I am occupationally disabled, I am unemployed and looking for work or on social welfare, I am in early retirement, I am retired or am a renter, I am a student or go to school, I am a housewife or househusband, I work as a volunteer, or other. ƒƒ In which sector do you work? Agriculture, forestry and fishery, mineral mining, industry, energy, water companies and waste management, construction sector, trade, transport and storage, hospitality, information and communication, financial services, real-estate letting and sales, special commercial services, letting and other commercial services, public administration and government services, education, health and welfare, culture, sport and well-being, other services, household, extraterritorial organisations, or other. ƒƒ For how many hours a week are you contracted? Full-time, part-time, varies, I do not have a fixed contract, or none of the above. ƒƒ On average, how many hours a week do you spend on your work? (This question was followed by a free text box). ƒƒ Where were you and your parents born? You, your mother, your father (these questions were followed by drop-down boxes of country names). ƒƒ What is your net monthly income? £799, £800 to £1,099, £1,100 to £1,499, £1,500 to £1,999, £2,000, prefer not to say, or don’t know (UK survey example shown only). ƒƒ What is the composition of your household? Single without children living at home, single with children living at home, co-habiting/married without children living at home, co-habiting/married with children living at home, living at home with parents/family, residential group/student house, or other. McKinsey Global Institute A window of opportunity for Europe 211 .
Further attitudes and level of satisfaction ƒƒ How would you describe [country] society today? Please select from the following characteristics (maximum three: individualistic, shows solidarity, assertive, humble, entrepreneurial, risk-averse, rewarding of risk-taking, conservative, well-behaved, progressive, values individual responsibility, social, rewarding of performance, values equality, respect for authority, nationally orientated, internationally orientated, tolerant, strives for the best, satisfied with just having enough, and values personal freedom. ƒƒ What would you like [country] society to be like in ten years’ time? Please select from the following characteristics (maximum three): individualistic, shows solidarity, assertive, humble, entrepreneurial, risk-averse, rewarding of risk-taking, conservative, well-behaved, progressive, values individual responsibility, social, rewarding of performance, values equality, respect for authority, nationally orientated, internationally orientated, tolerant, strives for the best, satisfied with just having enough, and values personal freedom. ƒƒ In which three areas do you think [country] should stand out? Choose from the following areas (maximum three): poverty reduction, European integration, behaviour of decision makers, health care, green living environment, infrastructure and accessibility, income equality, innovation, integration of immigrants, dealing with climate change, arts and culture, treatment of foreign workers, manners and morality, entrepreneurial climate, education, development aid, level and certainty of pensions, recreational facilities, social protection, sports facilities, safety, employment, availability of housing, healthy government finances, democracy, the justice system, economic growth, and other. ƒƒ Which areas are you most concerned about when you think about [country]? Choose from the following areas (maximum three): poverty reduction, European integration, behaviour of decision makers, health care, green living environment, infrastructure and accessibility, income equality, innovation, integration of immigrants, dealing with climate change, arts and culture, treatment of foreign workers, manners and morality, entrepreneurial climate, education, development aid, level and certainty of pensions, recreational facilities, social protection, sports facilities, safety, employment, availability of housing, healthy government finances, democracy, the justice system, economic growth, and other. ƒƒ All in all, how happy have you felt lately? Very unhappy, unhappy, neutral, happy, or very happy. ƒƒ How happy are you with [country]? Very unhappy, unhappy, neutral, happy, or very happy. ƒƒ How happy do you expect the next generation will be with [country]? Very unhappy, unhappy, neutral, happy, or very happy. ƒƒ To what extent are you interested in politics? Very uninterested, uninterested, interested, and very interested. ƒƒ To what extent do you follow national political news in the media? Not at all, rarely, in general, intensively, and very intensively. 212 McKinsey Global Institute Appendix . Details on the conjoint trade-offs regarding working hours and productivity ƒƒ Imagine you had to work more. How would you prefer to do this? Rank the following aspects, where 1 indicates you would prefer it most. If this situation does not apply to you, do your best to put yourself in the situation: If I have to work longer, I would prefer to retire at a later age, work more hours a week, or sacrifice holidays. ƒƒ Imagine you can work as many hours a week as you like and your net income increases accordingly; what is the maximum number of hours you would work in this case? You can enter a number between 0 and 100. (This question was followed by a free text box). ƒƒ To what extent do you think a person’s salary in [country] should reflect their performance? A lot less than now, less than now, the same as now, more than now, or a lot more than now. ƒƒ To what extent are you prepared to accept a performance-based salary? I already have one, I am prepared to make my whole salary performance-based, I am prepared to make part of my salary performance-based, or I am not prepared to do so. ƒƒ Would you be prepared to work more hours a week if working times were more flexible? No, yes (up to two extra hours), yes (up to four extra hours, yes (up to six extra hours), yes (up to eight extra hours), yes (up to ten extra hours), or yes (more than ten extra hours). Testing further trade-offs related to the conjoint analysis (not used in analyses, but listed here for reference) ƒƒ Which statement do you agree with most when considering [country] in ten years’ time? I want to pay more taxes so that government can perform more tasks than it currently does, I want to pay the same amount of taxes so that government can perform the same tasks as it currently does, or I want to pay less taxes so that government performs fewer tasks than it currently does. ƒƒ If you think about [country] in ten years’ time and have to choose from the following scenarios, which scenario would you favour most (or oppose least)? If a situation does not apply to you, do your best to put yourself in the situation in question: Slower growth in welfare and lower purchasing power, and I receive more holidays each year, or faster growth in wellbeing and higher purchasing power, and I receive fewer holidays each year. ƒƒ If you think about [country] in ten years’ time and have to choose from the following scenarios, which scenario would you favour most (or oppose least)? If a situation does not apply to you, do your best to put yourself in the situation in question: Slower growth in welfare and lower purchasing power… and I have more free time, or faster growth in wellbeing and higher purchasing power…and I work more hours a week. ƒƒ If you think about [country] in ten years’ time and have to choose from the following scenarios, which scenario would you favour most (or oppose least)? If a situation does not apply to you, do your best to put yourself in the situation in question: Slower growth in welfare and lower purchasing power, and my retirement age decreases, or faster growth in wellbeing and higher purchasing power, and my retirement age increases. McKinsey Global Institute A window of opportunity for Europe 213 .
ƒƒ If you think about [country] in ten years’ time and have to choose from the following scenarios, which scenario would you favour most (or oppose least)? If a situation does not apply to you, do your best to put yourself in the situation in question: Slower growth in welfare and lower purchasing power, and women work more part-time, or faster growth in wellbeing and higher purchasing power, and women work more full-time. ƒƒ If you think about [country] in ten years’ time and have to choose from the following scenarios, which scenario would you favour most (or oppose least)? If a situation does not apply to you, do your best to put yourself in the situation in question: Slower growth in welfare and lower purchasing power, and people over 55 stop working before reaching the retirement age more often, or faster growth in wellbeing and higher purchasing power, and more people over 55 work up to the retirement age. ƒƒ If you think about [country] in ten years’ time, and have to choose from the scenarios below, which scenario would you favour most (or oppose least)? If a situation does not apply to you, do your best to put yourself in the situation in question: More immigrants and a higher disposable income, or fewer immigrants and a lower disposable income. ƒƒ If you think about [country] in ten years’ time, and have to choose from the scenarios below, which scenario would you favour most (or oppose least)? If a situation does not apply to you, do your best to put yourself in the situation in question: More qualified/educated immigrants and a higher disposable income, or fewer qualified/educated immigrants and a higher disposable income. ƒƒ If you think about [country] in ten years’ time, and have to choose from the scenarios below, which scenario would you favour most (or oppose least)? If a situation does not apply to you, do your best to put yourself in the situation in question: It is easier for me to find a job, and the minimum wage is reduced, or it is more difficult for me to find a job, and the minimum wage is increased. ƒƒ If you think about [country] in ten years’ time, and have to choose from the scenarios below, which scenario would you favour most (or oppose least)? If a situation does not apply to you, do your best to put yourself in the situation in question: It is easier for me to find a job, and I do not automatically receive annual wage increases, or it is more difficult for me to find a job, and I automatically receive annual wage increases. ƒƒ If you think about [country] in ten years’ time, and have to choose from the scenarios below, which scenario would you favour most (or oppose least)? If a situation does not apply to you, do your best to put yourself in the situation in question: My disposable income decreases, and I have more job security, or my disposable income increases, and I have less job security. ƒƒ If you think about [country] in ten years’ time, and have to choose from the scenarios below, which scenario would you favour most (or oppose least)? If a situation does not apply to you, do your best to put yourself in the situation in question: My disposable income decreases, and I invest less time and/or money in my training, or my disposable income increases, and I invest more time and/or money in my training. 214 McKinsey Global Institute Appendix . ƒƒ If you think about [country] in ten years’ time, and have to choose from the scenarios below, which scenario would you favour most (or oppose least)? If a situation does not apply to you, do your best to put yourself in the situation in question: My disposable income decreases, and I work longer for the same employer, or my disposable income increases, and I change jobs more often. ƒƒ If you think about [country] in ten years’ time, and have to choose from the scenarios below, which scenario would you favour most (or oppose least)? If a situation does not apply to you, do your best to put yourself in the situation in question: My disposable income decreases, and I do not have to relocate for a better job, or my disposable income increases, and I have to relocate for a better job. ƒƒ For which of the goals below are you prepared to work two extra hours per week, work an extra two years, have four days less holiday, or have 10 percent less disposable income?270 Longer parental leave, better elderly care, a more comprehensive health-insurance package, more opportunities for personal development, better education, a cleaner environment, a higher pension, more police on the street, higher benefits for people who are unemployed, suffer from a disability or rely on social welfare, higher disposable income, or none of the above. ƒƒ The government makes a financial contribution in various situations. Indicate which of these situations you would prioritise. Rank the following situations, where one indicates your highest priority. If this situation does not apply to you, do your best to put yourself in the situation: Having children (e.g., child support), becoming unemployed (e.g., unemployment benefits/welfare), suffering from a disability (e.g., disability benefits), ageing (e.g., retirement and pensions), death of a working partner, or becoming ill (e.g., health/medical insurance). 2.
Growth scenarios and GDP-growth impact sizing for competitiveness growth drivers Growth scenarios External forecasts The Economist Intelligence Unit, IHS, and the Conference Board all provide country-level GDP-growth forecasts up to 2025. We calculated the simple average of these three external benchmarks for each country, and calculated a GDP-weighted average to arrive at the Europe-30 level forecast figure. To disaggregate the real GDP-growth figure into the two drivers of labour and productivity, we used the United Nations Population Division forecast of the change in the workingage population between 2013 and 2025 and assumed this is equal to the change in the labour component. The labour productivity-growth rate up to 2025 was then calculated by subtracting the labour growth number from the real GDP-growth number. 2015 growth The early 2015 European Commission forecast predicts real GDP growth of approximately 1.8 percent across the EU.
For the so-called “boom factors”, we used a number of methods to estimate the impact of various trends on GDP growth. For lower oil prices, we assessed the impact of a relative shift in imports and exports after multipliers of petroleum-related products across the European economy, and cross-referenced this with academic benchmarks to obtain an estimated range of 0.3 to 1.0 percent impact on real GDP across Europe. The impact of a depreciated euro and QE are likely to be interrelated.
Taking this Respondents were offered one of these four options at random. Options 1 to 3 would be offered only if the respondent was currently in employment. 270 McKinsey Global Institute A window of opportunity for Europe 215 . into consideration, we based our estimate on an early 2015 European Commission estimate of the impact on real GDP across the Eurozone. We assumed a conservative mediumterm decrease in the euro’s nominal effective exchange rate of 10 percent and applied our sizing of the impact across Europe. This exercise gave us a estimate of around 0.3 percent of GDP. For the impact of QE, we assessed the post-multiplier impact of ECB remittances from sovereign bond purchases, using a GDP-weighted interest rate across the Eurozone countries.
This resulted in an estimated impact on real GDP of up to 0.2 percent, assuming the ECB front-loads its QE programme in 2015. We assumed a GDP-weighted bond rate of between 1.3 and 2.2 percent. Official forecast The European Commission provides a projection of real GDP growth for the EU, as well as for productivity per hour and the number of hours worked, up to 2025. It expects productivity to grow at 1.4 percent annually and the number of hours worked to grow by 0.1 percentage points.
For Norway and Switzerland, we assumed the same growth trends hold as for the EU. The European Commission expects the EU population to increase up to 2042, due to convergence of fertility rates across the member states and increasing life expectancy for both men and women. However, the working-age population is expected to decline, dropping by 14 percent by 2060 from its 2012 peak, implying there will be a larger number of persons aged 65 and older. The participation rate in EU-27 is projected to increase by 3.2 percentage points between 2010 and 2060, reaching a level of 78.8 percentage points in 2060.
Employment rates in the EU are assumed to converge to structural unemployment rates, and in EU-27 this rate is expected to decline by 3.2 percentage points from 2010 to 2060. Finally, while the total number of hours worked is set to increase in the short run, it is expected to decline overall by 2060, due to a rising share of part-time workers.271 Catching up with best-practice scenario In this scenario all Europe-30 countries are assumed to close 50 percent of the gap between their 2012 labour and labour productivity performance levels and the respective top-quartile performance seen in Europe-30 in the period from 2007 to 2012. We measured performance in labour as the number of employees as a share of workingage population and in labour productivity by the amount of GDP generated by an employee in the respective country. The top-quartile performance for labour-force participation is a rate of 0.71 employees per working-age population and for labour productivity $96,000 of GDP (2005 dollars) per employee.
If the 2012 performance of a country on a metric is not top quartile, we assumed that, by 2025, 50 percent of the gap would be closed. If a country is already in the top quartile for labour, we assumed that the level remains constant, and if a country’s performance on labour productivity is already in the top quartile, we assumed annual growth of 1.4 percentage points to 2025 in line with the long-term average of productivity growth. We then calculated the GDP impact by multiplying the 2025 projected percentage of labourforce activation and the expected size of the working-age population, as projected by the United Nations, to arrive at an expectation of the number of employees, which we then multiplied by projected labour productivity. The 2012 ageing report: Economic and budgetary projections for the 27 EU member states (2010–2060), European Commission, 2012 271 216 McKinsey Global Institute Appendix . Realising impact from growth drivers 1. Nurturing ecosystem for innovation If the richest 15 European countries were to take action to increase innovation—measured by R&D expenditure—to current levels observed in the United States and South Korea, we estimate that overall European GDP growth could be accelerated by up to 0.26 percentage points. This estimate is based on historic correlations between R&D expenditure and total factor productivity growth. For the 15 richest Europe-30 countries, the average annual R&D spending in 1995 to 2012 and the average annual total factor productivity growth over the same period are correlated with a correlation coefficient of 0.6 (R²: 0.34); the correlation coefficient for the 15 poorer countries is zero.
Since the correlation was zero for the poorer 15 countries over the past two decades, no impact has been estimated for these countries. In the longer run, however, reliance on innovation will increase even in these parts of Europe. 2. Effective education to employment If European countries were to take action to improve mechanisms between education and employment, this could increase overall European GDP growth by 0.24 percentage points. The impact assessment is the cumulative effect of increasing the tertiary graduate share, reducing vertical mismatch, and reducing the share of the population not in employment, education, or training (NEETs). The tertiary graduate share is projected to increase to 41.4 percent (EU 2020 target) from the current share of 37.0 percent.
This increase was multiplied by 0.35, the elasticity of productivity from tertiary education.272 This was, in turn, multiplied by 0.87, the cross-country correlation between total factor productivity and GDP growth. Regarding the vertical mismatch, we assumed that European countries close half the gap to the average vertical mismatch of the five best-practice countries and multiply this reduction by country-specific estimates of the short-term effect of a 1 percent decrease in vertical mismatch on the change in per capita GDP.273 The impact of a reduction of NEETs was calculated by assuming that all Europe-30 countries reach their country-specific EU 2020 targets, and then multiplying the change in the number of NEETs by country-specific resource costs per NEET.274 3. Productive infrastructure investment The impact of additional infrastructure spending was assessed for a scenario in which the Europe-30 increased infrastructure spending by 0.9 percent of GDP per year (from 2.6 percent in 2002 to 2011 to 3.5 percent for the next decade), the additional amount that our analysis suggests would be required in order to support an overall GDP-growth rate of 2.5 percent per year.
With an assumed rate of return of 20 percent on additional infrastructure stock, real GDP growth will increase by 0.14 percent on an annualised basis. Our estimate did not assume any additional growth impact from improved infrastructure productivity nor demand side effects. 4. Reduced energy burden The impact of the reduced energy burden growth driver is based on two primary components: improved energy efficiency, and liberalised gas and electricity markets. For the improved energy-efficiency component, a range of energy-use scenarios sourced from the European Commission, the International Energy Agency, and other academic literature were analysed to give a baseline view on the incremental improvements to energy efficiency possible over ten years, and the corresponding annualised impact on GDP growth.
The incremental annual GDP growth from this component was determined to be 0.05 percent. For the second component, liberalising gas and electricity markets, the incremental Dawn Holland et al., The relationship between graduates and growth across countries, Bank for International Settlements research paper number 110, August 2013. 273 António Morgado et al., Measuring labour mismatch in Europe, CEFAGE-UE working paper number 2014/13, Center for Advanced Studies in Management and Economics, Universidade de Évora, 2014. . 274 Based on NEETS. See Massimiliano Mascherini et al., NEETS: Young people not in employment, education or training: Characteristics, costs and policy responses in Europe, Eurofound, October 2012. 272 McKinsey Global Institute A window of opportunity for Europe 217 .
annual GDP impact, estimated at 0.08 percent, was taken from an EAVA (European Added Value Unit) report.275 Combined, this gives an annual GDP impact of .13 percent for this growth driver. 5. Supporting urban development In aggregate, supporting urban development could boost overall European GDP growth by 0.09 percentage points. The impact of accelerated urbanisation was calculated by comparing a scenario in which all Europe-30 countries improve their urbanisation rate at the rate of the fastest-urbanising country in the period from 2000 to 2012 to a baseline scenario where urbanisation is assumed to grow at the same rate as in the 2000 to 2012 period in all countries. The economic benefit stems from the additional number of urban employees compared with the baseline scenario for each country, multiplied by country-specific productivity gaps between urban and rural employees. Historical urbanisation growth rates as well as forecasts of overall population size are based on data provided by the United Nations.
We calculated the productivity gap between urban and rural workers using data from MGI’s Cityscope 2.55 and Eurostat, assuming that the distribution of the working-age population between urban and rural areas is similar to the distribution of the overall population. For both urban and rural workers, we assumed that productivity grows at a rate of 1.4 percent per year, in line with the long-term historical average. 6. Competitive and integrated markets in services and digital The potential impact of further deepening the Single Market and boosting competition in the service sector, was projected to be up to 0.43 percentage points.
According to the European Commission, if all countries implemented the Services Directive to the level of the five best-performing countries per sector, this could add 0.14 percent to annual GDP growth between 2015 and 2025.276 Adopting best practice in competition and market integration for the regulated professions and other local service sectors could add a further 0.29 percent in annual growth. Creating a truly integrated European digital market could boost annual GDP growth by 0.4 percent, according to estimates by the European Parliamentary Research Service.277 We did not include this estimate in our overall estimate, however, because considerable uncertainty is associated with the digital economy. In transport, the direct impact is projected to be lower, with most gains from the creation of an integrated transport network coming from its enabling effect on productivity growth in other areas.
Since these gains are not quantified, we believe that our overall estimate for growth generated from this growth driver is conservative. 7. Public-sector productivity The potential impact of initiatives to improve public-sector productivity was calculated by assessing the extent to which different areas of public-sector consumption and investment are amenable to competition-like mechanisms, and by applying the long-term average productivity-growth rate of the private sector (1.4 percent per year) to a corresponding share of the spending on these areas. We assumed that 41 percent of total government final expenditure is amenable to competition-like mechanisms (41 percent represents the share of compensation in public-sector final expenditure).
Since Europe-30 total publicsector final consumption in 2012 equals 26.4 percent of GDP, this implies that 10.7 percent of Europe-30 2012 GDP can benefit from acceleration in productivity growth to 1.4 percent Micaela Del Monte, Cost of non-Europe in the Single Market for energy, European Added Value Unit, European Parliamentary Research Service, June 2013. 276 Josefa Monteagudo, Aleksander Rutkowski, and Dimitri Lorenzani, The economic impact of the Services Directive: A first assessment following implementation, European Commission economic paper number 456, June 2012. 277 Joseph Dunne, Mapping the costs of non-Europe, 2014–19, European Parliament, March 2014. 275 218 McKinsey Global Institute Appendix . per annum from the current rate of approximately zero percent per annum. This results in incremental real GDP growth of 0.15 percent annually. 8. Further openness to trade The impact from this growth driver is assessed as the benefit the Europe-30 could achieve as by setting up trade agreements with the United States, China, and India. The European Commission estimates a benefit of $119 billion for the EU resulting from the realisation of the Transatlantic Trade and Investment Partnership with the United States.
This would be equivalent to incremental GDP growth of 0.05 percentage points in the EU in the period to 2025. Using export volumes in 2012 to China and India, respectively, as a ratio of Europe’s 2012 exports to the United States, we extrapolated the potential benefit for China and India. In total, establishing trade agreements with all three countries yields a projected increase in Europe’s annual real GDP of 0.08 percentage points to 2025. 9. Grey and female labour-force participation Improved grey and female labour-force participation could add 0.39 percentage points to Europe’s overall GDP-growth rate.
The impact of improved grey and female labour-force participation was assessed by comparing a scenario in which all Europe-30 countries increased participation rates to 2013 best-practice levels in Europe to a base-case scenario in which rates grow in line with historical experience from countries that have developed from similar participation rates as the European averages of 2013. For female participation (25 to 54 years old), the 2013 best-practice level of male participation is found in Slovenia, translating into a general female participation rate of 89 percent in 2015 compared with 79 percent today. For grey participation (55 to 74 years old), the 2013 best-practice level of the participation rate of the 25 to 54 age group is found in Hungary, translating to a general grey participation rate of 49 percent in 2015 compared with 35 percent today.
The impact estimate was based purely on increased activity rates, keeping employment rates, average weekly hours worked, and productivity constant. 10. Pro-growth immigration Strengthening pro-growth immigration systems could boost overall European GDP growth by 0.26 percentage points. In order to stabilise the prime working-age population over the next decade exclusively through increased immigration, 11.2 million additional immigrants to the continent would be required.
We assumed that these additional incoming immigrants would have a participation rate of 72.2 percent, an employment rate of 90 percent, and output per worker equal to that of the native population. 11. Enhanced labour-market flexibility Reforming Europe’s labour markets could increase GDP growth between 0.1 and 0.2 percent a year. The IMF and the ECB estimate that growth would increase by 0.1 percent per year if Europe were to close half of the gap with the respective “best-in-class” OECD countries in terms of looser employment protection legislation, moderate unemployment benefits, and more assertive active labour-market policies.278 Of this total, 0.04 percent would come from each of employment protection legislation and unemployment benefits, and 0.01 percent from active labour-market policies.
Other estimates point towards a higher impact from labour-market flexibility. The OECD has estimated that a one percentage point reduction in the employment protection legislation score could result in a 0.3 percent The assumptions behind this calculation are as follows: reduction of half the gap on employment protection legislation to the average of the three lowest levels in the OECD (Canada, the United Kingdom, and the United States); reduction in half of the gap in the average replacement rate of unemployment benefits relative to the average within a set of countries with low replacement rates (Australia, Canada, Japan, New Zealand, the United Kingdom, and the United States); increase in the ratio of spending on active labour-market policies relative to six OECD countries with high spending (Austria, Denmark, the Netherlands, Norway, Sweden, and Switzerland). We assume that 80 percent of the long-term potential (to 2060) is realised by 2025.
See Derek Anderson et al., “Assessing the gains from structural reforms for jobs and growth”, in Jobs and growth: Supporting the European recovery Martin Schindler et al., eds., IMF, 2014. 278 McKinsey Global Institute A window of opportunity for Europe 219 . productivity increase.279 This would imply an impact on growth of between 0.1 and 0.2 percent for the same change in employment protection legislation. 3. Investment-requirement sizing for competitiveness growth drivers In this section, we detail the sources and methodologies used for calculating the costs of some of the growth drivers discussed in Chapter 3. Nurturing ecosystem for innovation Data on GDP and the proportion of GDP spent on R&D were taken from Eurostat. Each country was benchmarked to a best-practice country on combined private- and public-sector research spending. The upper-bound benchmark is South Korea, which spends 3.6 percent of GDP on R&D. The lower bound is the United States, which spends 2.7 percent of GDP on R&D.
If each country were to increase its R&D to meet the benchmarks, an increase in spending on R&D of 0.6 to 1.6 percent of EU GDP would be required. Because data were available only for the share of GDP going to R&D until 2012, where we discuss R&D as a share of GDP, we used 2012 figures. Where values are expressed in euros, the share applies to 2014 GDP. Effective education to employment Data on average spending on education as a proportion of GDP were taken from Eurostat.
We used a weighted average of the top-scoring countries on the education-toemployment index discussed in Chapter 3, corrected for the size of the student population in each country.280 For those countries whose z-score is greater than zero, the average is 5.6 percent of GDP. For those with z-scores greater than 0.5, the average is 6.1 percent of GDP. Raising all countries’ spending on education to the best-practice average (corrected for the relative proportion of students by country) would require an increase in expenditure equal to 0.4 to 0.7 percent of EU GDP. Supporting urban development Data on the burden of replacing housing in Europe to meet minimum standards were taken from A blueprint for addressing the global affordable housing challenge, McKinsey Global Institute, October 2014.
This research estimated the cost in 2012 of replacing all substandard housing units and the incremental cost of providing housing for new residents by 2025. Spread over the period from 2012 to 2025, this would require 0.4 to 0.5 percent of GDP to be invested in improving the housing stock. Productive infrastructure and energy We calculated the level of infrastructure investment required to support future growth using projections of GDP growth. Controlling for asset depreciation, we assumed that countries sustain a stock of infrastructure equivalent to 70 percent of GDP, in line with global averages. Using this rule indicates that between 2.9 and 3.5 percent of future GDP would need to be spent on infrastructure (including power infrastructure) to cover depreciation and keep pace with growth.
The GDP-weighted average of historical investment stands at 2.6 percent of GDP based on data from Eurostat. This indicates a spending gap of 0.3 to 0.9 percent. The 2012 labour market reform in Spain: A preliminary assessment, OECD, December 2013. The index aggregates each country’s average PISA score, preschool enrolment rate, population in tertiary education, and research publications. 279 280 220 McKinsey Global Institute Appendix . 4. Aggregate impact sizing for investment and job creation options In this section, we discuss our estimates for the size of the impact from different options. We used annual corporate gross capital formation and GDP data from AMECO for the EU-28 plus Norway and Switzerland. Data were not available for Bulgaria, Croatia, Ireland, Luxembourg, or Romania. We found that the average ratio of corporate gross capital formation over GDP was 12.1 percent between 1998 and 2008, compared with 10.5 percent in 2015.
This gap, applied to the GDP of the 30 European countries, gives a total corporate investment gap of €227 billion in 2014 at current market prices. Maximise spending within the Fiscal Compact We took data on annual deficits, GDP, and debt levels at market prices from AMECO. Countries that are not bound by the requirements of the Stability and Growth Pact were excluded. For each country, we calculated the gap between deficits forecast for 2014 and the deficit limit. Where there was a gap—and therefore capacity for additional spending— we calculated this for 2014.
In cases where countries had exceeded their deficit limits, we assumed that they were already reaching their medium-term budgetary objective set by the European Commission as fast as appropriate and that no further adjustment was possible. We made a separate calculation for the capacity for additional spending by Germany, the only country whose deficit stands below the limit but whose debt reduction obligation allows additional capacity. Based on a 2013 debt-to-GDP ratio, we calculated a target for the debt-to-GDP ratio for 2014 following the rule that 1/20th of the gap to the 60 percent target must be closed. We then compared the target with the forecast 2014 debt level.
The gap between this forecast and the target represented the additional capacity of 1.3 percent of GDP in 2014. In euros, the total gap across all countries equals €47.8 billion. Applying fiscal multipliers for each country (as discussed in the section on fiscal multipliers) results in an impact on demand of €15 billion to €49 billion. Match the US post-crisis fiscal impulse We calculated the structural fiscal impulse using International Monetary Fund data on deficits as a percentage of GDP for the EU-28 and the United States.
The fiscal impulse is the previous year’s budget deficit minus the current year’s deficit. The largest gap in the period from 2008 to 2014 between these two regions was 2.2 percentage points in 2010, when the United States increased its deficit by 1.9 percentage points while the EU reduced its deficit by 0.3 percentage points. The average size of the gap was 0.2 percentage points. The United States had a larger impulse than the EU from 2008 to 2010 and a smaller impulse from 2011 to 2014. We modelled the effect in 2014 of an increase in the budget deficit of 0.2 percentage points and 1.9 percentage points, from the above, to simulate the impact of a strong fiscal impulse. Assuming the lower impulse of 0.2 percentage points and applying the lower-bound estimate of fiscal multipliers, we estimated that the impact on demand is €18 billion. Assuming a larger impulse of 2.2 percentage points and applying the upper bound of fiscal multipliers, we estimated an impact of €440 billion (to two significant figures) but acknowledge that this calculation is less accurate and is probably an overestimate.
This is because the size of the impulse is large relative to the size of the output gap, so the fiscal multiplier is likely to change significantly as a result of the impulse. McKinsey Global Institute A window of opportunity for Europe 221 . Introduce partial debt mutualisation We took data on the actual borrowing requirement and interest rates in 2013 from the ECB as borrowing requirements for 2014 were not available at the time of writing.281 We excluded countries that do not use the euro as their currency. We used an average of the long-term interest rates on representative EMU convergence criteria bonds over the year as a representative borrowing rate.282 Based on a review of external estimates, we estimated that the rate for a mutualised Eurobond was 10 basis points to 60 basis points above the German bund.283 This rate of 1.67 to 2.17 percent on average in 2013 was then applied to the total borrowing requirement. This resulted in a total net annual saving on borrowing in 2013 of between €6.4 billion and €8.5 billion. These savings would occur for each year of the maturity of the bond issue. Data on the specific maturities of bonds issued were not available across the Eurozone.
Assuming an average maturity of ten years, the total saving on the first year’s issuance would be €64 billion to €85 billion. It would also be possible to borrow more at new rates to repay or purchase old bonds, potentially allowing greater savings. We note, however, that not all countries would choose to use these savings to finance additional spending; some countries would opt to reduce deficits instead. Expand the fiscal transfer schemes between countries We took data on unemployment, GDP, population, and median income from AMECO in current prices.
We modelled a programme in which each country received payment for each unemployed citizen equal to between 50 and 70 percent of the national median wage. We assumed that the cost of this programme is paid in proportion to the current contribution made by each country to the EU (including traditional own resources) published by the European Commission. The net effect on each country is multiplied by a range of fiscal multipliers and added up.
The net effect including multipliers lies between €38 billion and €56 billion. Improve access to finance Data on access to finance were taken from the SAFE survey carried out by the ECB using first-half 2014 figures. The potential for improvement in each of four categories of company size was calculated between the overall data relative to Germany’s scores, which we took to be best practice.284 The difference between the two was weighted by the percentage of the workforce in each category of firm. We assumed that the resulting gap of 3.4 percent is the share of the investment gap addressable through financing.
This gap was multiplied by an estimated one-year multiplier for corporate investment spending between 0.8 and 2.9 based on economic modelling of a similar effect in the United States. The final effect on output in Europe is between €6.2 billion and €22.6 billion. The amount each country borrowed in a year, which can differ from the deficit when, for example, the government sells or purchases assets. 282 As defined by the ECB, a bundle of bonds with maturities of roughly ten years. 283 See Sergio Mayordomo, Juan Ignacio Peña, and Eduardo S. Schwartz, Towards a common European Monetary Union risk free rate, NBER working paper number 15353, September 2009; Green paper on the feasibility of introducing stability bonds, European Commission, November 2011; Christian Aßmann and Jens Boysen-Hogrefe, Determinants of government bond spreads in the Euro area—in good times as in bad, Kiel working paper number 1548, September 2009; Patrick Artus, The effect of debt mutualisation in the euro zone would be more complex than what is usually claimed, Natixis economic research, number 560, August 2013; Carlo Favero and Alessandro Missale, Sovereign spreads in the euro area: Which prospects for a Eurobond? presented at an Economic Policy panel meeting in Warsaw, October 27–28, 2011; Séverine Menguy, “Can Eurobonds save the euro?” in States, banks and the financing of the economy: Monetary policy and regulatory perspective, Morten Balling, Ernest Gnan, and Patricia Jackson, eds., SUERF, 2013; Sylvester C.
W. Eijffinger, “Eurobonds—concepts and implications”, in Eurobonds: Concepts and implications: Compilation of notes for the monetary dialogue of March 2011, European Parliament, March 2011; Rien Wagenvoort and Sanne Zwart, Uncovering the common risk free rate in the European Monetary Union, European Investment Bank economic and financial report number 2010/05, September 2010. 284 Large companies are those with 250 employees or more; medium are those with 50 to 249 employees; small are those with ten to 49 employees; and micro are those with fewer than ten employees. 281 222 McKinsey Global Institute Appendix . Account for public investments as they depreciate We took data on annual deficits, GDP, gross capital formation, gross capital consumption, and all-sector R&D spending at market prices for each country from AMECO. Countries that are not bound by the requirements of the Stability and Growth Pact were excluded. For each country, we calculated an infrastructure investment need using the methodology discussed in Chapter 3.285 This produced an estimate for 2011 as a share of GDP that we then applied to 2014 GDP, an approach that was not ideal but was necessary because of limits to the availability of data. Where the investment need was positive, it was treated as room for additional spending. Where it was negative, we assumed that the presence of the deficit rule was not the cause of overspending and therefore that spending would not be affected. For each country, we calculated an R&D investment need by comparing each nation’s R&D spending as a proportion of GDP with the investment spending of Japan, the second best globally in R&D spending at 3.3 percent of GDP.
Where the investment need was positive, we assumed that half of the gap would require either direct public spending or public subsidy of private work. Because of limits on the availability of data, we calculated this gap as a percentage of 2012 GDP and then applied it to 2014 GDP. We calculated the need for investment in affordable housing for each country with the methodology used in the October 2014 MGI report on affordable housing.286 Where data were not available for a particular country, we extrapolated investment need based on the prevalence of unsuitable housing. We used the “severe deprivation” category in the EU’s Statistics on Income and Living Conditions database as a proxy, weighted by population size.
Because of limits on available data, we calculated this gap as a percentage of 2012 GDP and applied it to 2014 GDP. We then added the need for investment in these three categories—infrastructure, R&D, and affordable housing—to arrive at a total figure for new spending that would be enabled. The total figure is €140.4 billion, made up of €34.4 billion on infrastructure, €59.2 billion on R&D, and €46.8 billion on affordable housing. In addition, we adjusted the deficit forecast for 2014 by the difference between gross capital formation and consumption for each country bound by the Fiscal Compact. This increased the size of deficits, resulting in a €9.0 billion reduction in spending capacity across Europe. Applying fiscal multipliers for each country (as discussed in the section on fiscal multipliers) results in an impact on demand of €95 billion to €228 billion. Carefully adjust taxation and wage structure We took the marginal propensity to consume for different wealth bands from the ECB’s 2014 report The distribution of wealth and the marginal propensity to consume.
We took the distribution of net wealth from the ECB’s 2013 Household consumption survey. We model redistribution as proportional to the store of wealth, calculated using Eurostat’s household consumption survey and population data. For each wealth quintile, we assumed a contribution equivalent to 1 percent of wealth, although this need not be in the form of a tax on the wealth itself. For the bottom quintile, which has negative wealth (net debt), we did not model a contribution.
We then redistributed the flow to the bottom half of the wealth distribution and treated it as fresh permanent income. Based on the marginal propensity to consume of each quintile, this gives us an estimate of the loss of consumption and the We assume a long-term trend of 70 percent of GDP in infrastructure, and calculate the amount of investment required to make up for depreciation and growth of GDP. 286 A blueprint for addressing the global affordable housing challenge, McKinsey Global Institute, October 2014. 285 McKinsey Global Institute A window of opportunity for Europe 223 . increase in consumption that accompanies the redistribution. The net size of this effect is €189 billion to €206 billion. Household consumption multipliers were estimated within a model provided by Oxford Economics to be between 0.50 and 1.32 by applying a shock to household consumption through government redistribution funded by an increase in corporate taxes. After multipliers, the output effect is €95 billion to €273 billion. Unleash the silver economy Using Eurosystem reports, we estimated the approximate wealth of Eurozone households, broken out by age category. When using an upper and lower bound of the proportion of wealth that is liquid (such as deposits, and other non-housing-type assets), we estimate that converting 1 percent of this wealth into consumption could provide a spending boost of between 0.3 and 0.6 percent of Eurozone GDP, using a fiscal multiplier of 1.0. Issue vouchers to households redeemable with the ECB We derived the marginal propensity to consume and the distribution of wealth the same way as we did in the case of wealth redistribution.
Here, however, the programme is funded through the creation of new money rather than through taxation. In addition, the funds are distributed evenly across the population rather than being targeted at the bottom half. This programme would be slightly smaller than proposed “QE-lite” programmes to purchase covered bonds and asset-backed securities announced by the ECB in late 2014 and slightly larger than tax breaks given in the United States in 2008.
The size of this effect would be €246 billion to €272 billion of additional direct consumption. After multipliers, this rises to between €207 billion and €395 billion, which could be sufficient to close the Eurozone’s output gap. Fiscal multipliers We drew on econometric analyses where possible to arrive at fiscal multipliers that represent the effect in a single year of a change in government spending on demand. However, these estimates were available for both recessionary and non-recessionary periods only for France, Germany, Italy, Spain, and the United Kingdom. For these countries, where possible, we used a range of multiple sources for recessionary fiscal multipliers (and non-recessionary multipliers for Germany). Where econometric analysis was not available for smaller economies, we used the approach advocated in the 2014 IMF report Fiscal multipliers: Size, determinants and use in macroeconomic projections.
This requires the assessment of a national economy on six dimensions, with adjustments for the business cycle and monetary-policy conditions: 1. We assessed low openness to trade as being cases where the ratio of imports to GDP was less than 30 percent. 2. We assessed high labour-market rigidities using the OECD Employment Protection Legislation Index, using the central point of the index as the threshold value. 3. We defined low automatic stabilisers as being when the level of public spending as a share of GDP was below 40 percent, as suggested by the IMF. 4. We assessed fixed or quasi-fixed exchange rates for Eurozone members and countries with a currency pegged to the euro or as part of the exchange rate mechanism (ERM-II) to reduce exchange rate variability.287 The ERM-II maintains currency exchange rates within a band of a central rate with the euro. It currently applies only to Lithuania and Denmark. 287 224 McKinsey Global Institute Appendix . 5. We assessed “safe” public debt as being below 100 percent of GDP, as suggested by the IMF. 6. We assessed the effectiveness of public expenditure management using the World Bank Worldwide Governance Indicators, choosing the central value of the index as the threshold value. We then assigned countries a basic multiplier of 0.1 to 0.3 if they met up to two of the six criteria, 0.4 to 0.6 if they met three, and 0.7 to 1.0 if they met more than three (Exhibit A5). Where a country was borderline on three or more criteria, we adjusted the country up or down to reflect this. The adjustment affected only Greece. We then corrected for the stage of the business cycle. As recommended by the IMF, we estimated this as a 60 percent increase in the fiscal multiplier at the peak of recession. We determined the stage of the recession using output gaps as calculated by the European Commission and taken from AMECO.
For each country, we found a historical maximum and minimum output gap. We then averaged these across countries with a separate category for large (GDP greater than €1 trillion), medium (GDP €300 billion to €1 trillion), and small (GDP less than €300 million) economies. We then determined the position of each country relative to this average maximum and used the ratio used as a factor for judging the severity of the recession.
Using this approach, it was possible for a country to have a modifier greater than 60 percent. For example, Greece’s output gap is estimated to be 10.9 percent, while the average maximum output gap for a small economy was 6.1 percent. The ratio of those figures is greater than one, so the business cycle adjustment for Greece is 107 percent, greater than the IMF’s upper estimate. We also applied monetary-policy corrections.
We took Eurozone countries, countries with a euro peg, and countries that are part of an ERM-II arrangement as being at the zero lower bound and applied a correction of an additional 30 percent to the fiscal impulse. The United Kingdom and Sweden were also taken to be at the lower bound, while Romania, Hungary, Poland, and Croatia were not. Total impact In total, we estimate that Europe could unleash investment in innovation, education, infrastructure, and energy of €250 billion to €550 billion a year and, by closing its output gap and mobilising the workforce, create more than 20 million new jobs. To derive the €250 billion to €550 billion range for investment, we took the 1.7 to 3.7 percent estimate for the annual investment required for the growth drivers and applied it to Europe-30 GDP.
We obtained the figure for new jobs created through the cumulative addition of new jobs through several sources. First, we assume that closing the European output gap of 2.4 percent would create approximately 2.4 percent new jobs, assuming constant productivity. We then add the number of incremental jobs created by the grey and female labour-force participation and immigration growth drivers to obtain the cumulative figure of 20 million incremental jobs by 2025. McKinsey Global Institute A window of opportunity for Europe 225 .
Exhibit A5 Fiscal multipliers Output gap % Lower-bound multiplier1 Upper-bound multiplier1 Austria -1.1 0.6 0.9 Belgium -1.1 1.1 1.5 Bulgaria -0.1 0.9 1.3 Croatia -3.4 0.5 0.8 Cyprus -6.1 0.8 1.2 Czech Republic -2.0 0.6 0.9 Denmark -3.8 0.7 1.1 Estonia 1.4 0.8 1.2 Finland -3.1 0.7 1.0 France -2.3 0.2 2.1 Germany -0.8 0.2 1.0 Greece -10.9 1.1 1.6 Hungary -0.7 0.1 0.3 Ireland -0.2 0.5 0.8 Italy -4.5 1.6 2.1 Latvia 1.0 0.9 1.2 Lithuania 0.2 0.9 1.3 -2.1 1.1 1.6 0.1 0.9 1.3 Netherlands -3.0 1.3 1.9 Poland -0.8 0.1 0.3 Portugal -5.0 0.8 1.2 Romania -1.3 0.5 0.7 Slovakia -3.3 1.2 1.7 Slovenia -2.7 1.2 1.6 Spain -6.0 1.3 2.5 Sweden -1.6 0.6 1.0 United Kingdom -0.8 0.1 1.0 Country Luxembourg Malta Estimates taken from empirical studies 1 Multiplier is an estimated one-year fiscal multiplier for increase in government expenditure in country's current circumstances. SOURCE: Batini, IMF, 2014; Batini, IMF, 2012; Baum, 2012; Hernández de Cos and Moral-Benito, 2013; McKinsey Global Institute analysis 226 McKinsey Global Institute Appendix . Chapter end photo: Tulips © Getty Images McKinsey Global Institute A window of opportunity for Europe 227 . Chapter photo Biblio: Flags © Getty Images 228 McKinsey Global Institute Appendix . BIBLIOGRAPHY A Ægisdóttir, StefaniÌa, Lawrence H. Gerstein, and Deniz Canel Çinarbas, “Methodological Issues in cross-cultural counseling research: Equivalence, bias, and translations”, The Counseling Psychologist, volume 36, March 2008. Afxentiou, Panos C., “Convergence, the Maastricht criteria, and their benefits”, The Brown Journal of World Affairs, volume VII, issue 1, winter-spring 2000. Agency for the Cooperation of Energy Regulators and Council of European Energy Regulators, ACER/CEER annual report on the results of monitoring the internal electricity and natural gas markets in 2011, November 2012. Agency for the Cooperation of Energy Regulators and Council of European Energy Regulators, ACER/CEER annual report on the results of monitoring the internal electricity and natural gas markets in 2013, October 2014. Alesina, Alberto, and Dani Rodrik, “Distributive policies and economic growth”, The Quarterly Journal of Economics, volume 109, number 2, 1994. Amorós, José Ernesto, and Neils Bosma, Global Entrepreneurship Monitor 2013 global report: Fifteen years of assessing entrepreneurship across the globe, Global Entrepreneurship Research Association, 2014. Anderson, Derek, Bergljot Barkbu, Lusine Lusinyan, and Dirk Muir, “Assessing the gains from structural reforms for jobs and growth”, in Jobs and growth: Supporting the European recovery, Martin Schindler, Helge Berger, Bas B. Bakker, and Antonio Spilimbergo, eds., IMF, 2014. Aranki, Ted, and Corrado Macchiarelli, Employment duration and shifts into retirement in the EU, London School of Economics Europe in Question discussion paper number 58, February 2013. Ardagna, Silvia, Francesco Caselli, and Timothy Lane, Fiscal discipline and the cost of public debt service: Some estimates for OECD countries, NBER working paper number 10788, September 2004. Arnold, Jens, Do tax structures affect aggregate economic growth? Empirical evidence from a panel of OECD countries, OECD economics department working paper number 643, October 2008. Artus, Patrick, The effect of debt mutualisation in the euro zone would be more complex than what is usually claimed, Natixis economic research, number 560, August 2013. Aßmann, Christian, and Jens Boysen-Hogrefe, Determinants of government bond spreads in the Euro area—in good times as in bad, Kiel working paper number 1548, September 2009. . Association for Financial Markets in Europe, Unlocking funding for European investment and growth: An industry survey of obstacles in the European funding markets and potential solutions, 2013. Association for Financial Markets in Europe, The role of secondary markets and market making in the long-term financing of the European economy, AFME briefing note, June 2013. Ayres, Robert U., and Benjamin Warr, “Accounting for growth: The role of physical work”, Structural Change and Economic Dynamics, volume 16, issue 2, June 2005. B Bairoch, Paul, The economic development of the third world since 1900, University of California Press, 1975. Barbiero, Francesca, and Zsolt Darvas, “In sickness and in health: Protecting and supporting public investment in Europe”, Bruegel Policy Contribution, issue 2014/02, February 2014. Bassanini, Andrea, and Romain Duval, “The determinants of unemployment across OECD countries: Reassessing the role of policies and institutions”, OECD Economic Studies, number 42, issue 1, 2006. Batini, Nicoletta, Luc Eyraud, Lorenzo Forni, and Anke Weber, Fiscal multipliers: Size, determinants and use in macroeconomic projections, IMF, September 2014. Batini, Nicoletta, Giovanni Callegari, and Giovanni Melina, Successful austerity in the United States, Europe and Japan, IMF working paper 12/190, July 2012. Baum, Anja, Marcos Poplawski-Ribeiro, and Anke Weber, Fiscal multipliers and the state of the economy, IMF working paper 12/286, December 2012. BBC, Sweden cuts rates below zero and starts QE, February 12, 2015. Beach, R., M. Webster, and K. M. Campbell, “An evaluation of partnership development in the construction industry”, International Journal of Project Management, volume 23, issue 8, November 2005. Beardsley, Scott C., Luis Enriquez, Sheila Bonini, Sergio Sandoval, and Noëmie Brun, “Fostering the economic and social benefits of ICT”, in Global information technology report 2009–2010, Soumitra Dutta and Irene Mia, eds., World Economic Forum, March 2010. Beltramello, Andrea, Koen De Backer, and Laurent Moussiegt, The export performance of countries within global value chains (GVCs), OECD science, technology, and industry working paper number 2012/02, April 2012. Berthou, Antoine, and Guillaume Gaulier, “Wage dynamics and current account rebalancing in the euro area”, Bulletin de la Banque de France, issue 30, 2013. Blanchard, Olivier J., and Francesco Giavazzi, Improving the SGP through a proper accounting of public investment, Centre for Economic Policy Research discussion paper number 4220, February 2004. Böckers, Veit, Justus Haucap, and Ulrich Heimeshoff, Benefits of an integrated European electricity market, Düsseldorfer Institut für Wettberwerbsökonomie discussion paper number 109, September 2013. 230 McKinsey Global Institute Bibliography .
Boeri, Tito, Michael Burda, and Francis Kramarz, eds., Working hours and job sharing in the EU and USA: Are Europeans lazy? Or Americans crazy? Oxford University Press, 2008. Bond, Ian, The EU and defence procurement, Centre for European Reform, January 2014. Braga, Michela, Daniele Checchi, and Elena Meschi, Institutional reforms and educational attainment in Europe: A long run perspective, Institute for the Study of Labor (IZA) discussion paper number 6190, December 2011. Bravo-Ortega, Claudio, and Álvaro García Marin, “R&D and productivity: A two way avenue?” World Development, volume 39, issue 7, July 2011. Brock, H. Woody, Quantitative easing: Myths and half-truths, Strategic Economic Decisions, October 2012. Brunzell, Tor, Eva Liljeblom, and Mika Vaihekoski, “Determinants of capital budgeting methods and hurdle rates in Nordic firms”, Accounting & Finance, volume 53, issue 1, March 2013. Bryant, Chris, “BASF to focus investments outside Europe”, The Financial Times, February 25, 2014. Buiter, Willem H., Helicopter money: Irredeemable fiat money and the liquidity trap, NBER working paper number 10163, December 2003. Buiter, Willem H., “The ‘sense and nonsense of Maastricht’ revisited: What have we learnt about stabilization in EMU?” Journal of Common Market Studies, volume 44, issue 4, November 2006. Buiter, Willem H., The simple analytics of helicopter money: Why it works—always, Kiel Institute for the World Economy economics discussion paper number 2014–24, 2014. Burger, Bruno, Electricity production from solar and wind in Germany in 2014, Fraunhofer ISE (Institut für Solare Energiesysteme), December 2014. Buti, Marco, Alessandro Turrini, and Paul van den Noord, Reform and be re-elected: Evidence from the post-crisis period, Vox, Centre for Economic Policy Research, July 2014. C Carroll, Christopher D., Jiri Slacalek, and Kiichi Tokuoka, The distribution of wealth and the marginal propensity to consume, European Central Bank working paper number 1655, March 2014. Ceci-Renaud, Nila, and Paul-Antoine Chevalier, “L’impact des seuils de 10, 20 et 50 salariés sur la taille des entreprises françaises”, Économie et Statistique, number 437, March 2011. Chawla, Mukesh, Gordon Betcherman, and Arup Banerji, “Aging, savings, and financial markets”, in From red to gray: The “third transition” of aging populations in Eastern Europe and the former Soviet Union, World Bank, 2007. Checherita-Westphal, Cristina D., and Philipp Rother, The impact of high and growing government debt on economic growth: An empirical investigation for the euro area, European Central Bank working paper number 1237, August 2010. McKinsey Global Institute A window of opportunity for Europe 231 . Chen, Natalie, and Dennis Novy, International trade integration: A disaggregated approach, CEP discussion paper number dp0908, Centre for Economic Performance, London School of Economics, 2009. Cingano, Federico, Trends in income inequality and its impact on economic growth, OECD social, employment and migration working paper number 163, December 2014. Coeuré, Benoit, Structural reforms: Learning the right lessons from the crisis, presented at an economic conference in Latvijas Banka, Riga, October 17, 2014. D Darvas, Zsolt, Fiscal federalism in crisis: Lessons for Europe from the US, Bruegel, July 2010. De Bonis, Riccardo, and Andrea Silvestrini, “The effects of financial and real wealth on consumption: New evidence from OECD countries”, Applied Financial Economics, volume 22, issue 5, March 2012. De Nederlandsche Bank, “Securitisation rules: ‘Significant risk transfer’, retention and due diligence”, fact sheet, February 2014. Del Monte, Micaela, Cost of non-Europe in the Single Market for energy, European Added Value Unit, European Parliamentary Research Service, June 2013. Deloitte, Comparative immigration study 2013–2014: Migration formalities for third-country nationals in 26 European countries, November 2013. Dullien, Sebastian, and Ferdinand Fichtner, “A common unemployment insurance system for the euro area”, DIW Economic Bulletin, volume 3, issue 1, January 2013. Dunne, Joseph, Mapping the cost of non-Europe, 2014–19, European Parliament, March 2014. Duval, Romain, The retirement effects of old-age pension and early retirement schemes in OECD countries, OECD Economics Department working paper number 370, November 2003. Dynan, Karen, “Is a household debt overhang holding back consumption?” Brookings Papers on Economic Activity, spring 2012. E ECDL Foundation, Digital literacy report—2009, 2009. The Economist, “Why Swedish men take so much paternity leave”, July 22, 2014. Edelman, 2015 Edelman trust barometer, January 2015. Eijffinger, Sylvester C. W., “Eurobonds—concepts and implications”, in Eurobonds: Concepts and implications: Compilation of notes for the monetary dialogue of March 2011, European Parliament, March 2011. Elekdag, Selim, and Dirk Muir, Das Public Kapital: How much would higher German public investment help Germany and the euro area? IMF working paper number 14/227, 2014. 232 McKinsey Global Institute Bibliography . Ellis, Mark, Experience with energy efficiency regulations for electrical equipment, OECD/ International Energy Agency, August 2007. Enderlein, Henrik, and Jean Pisani-Ferry, Reforms, investment and growth: An agenda for France, Germany, and Europe, Hertie School of Governance, November 2014. Escribano, Alvaro, Andrea Fosfuri, and Josep A. Tribó, “Managing external knowledge flows: The moderating role of absorptive capacity”, Research Policy, volume 38, issue 1, February 2009. European Central Bank, Banking structures report, November 2013. European Central Bank, “ECB announces expanded asset purchase programme”, press release, January 22, 2015. European Central Bank, Euro area bank lending survey, April 2014. European Central Bank, The eurosystem household finance and consumption survey: Results from the first wave, statistics paper series number 2, April 2013. European Central Bank, Survey on the access to finance of enterprises in the euro area, November 2014. European Central Bank, Survey on the access to finance of small- and medium-sized enterprises, November 2013. European Central Bank and Bank of England, The case for a better functioning securitisation market in the European Union: A discussion paper, May 2014. European Central Bank and Bank of England, The impaired EU securitisation market: Causes, roadblocks and how to deal with them, April 2014. European Commission, Building a capital markets union, green paper, February 2015. European Commission, Energy economic developments in Europe, January 2014. European Commission, “The EU’s bilateral trade and investment agreements: Where are we?” press release, December 3, 2013. European Commission, EEO review: Employment policies to promote active ageing 2012, 2012. European Commission, European energy security strategy, 2014. European Commission, European system of accounts 2010, Eurostat, June 2013. European Commission, Europeans’ satisfaction with urban transport, Flash Eurobarometer 382b, June 2014. European Commission, Green paper on the feasibility of introducing stability bonds, November 2011. European Commission, Innovation Union scoreboard 2014, March 2014. European Commission, Internal market, Special Eurobarometer 398, October 2013. European Commission, Key data on early childhood education and care in Europe, 2014 edition, Eurydice and Eurostat report, 2014. McKinsey Global Institute A window of opportunity for Europe 233 . European Commission, Long-term financing of the European economy, green paper, March 2013. European Commission, Monitoring consumer markets in the European Union 2013, Part I, August 2013. European Commission, “Public opinion in the European Union”, Standard Eurobarometer 82, December 2014. European Commission, A single market for growth and jobs: An analysis of progress made and remaining obstacles in the member states, November 2013. European Commission, The 2012 ageing report: Economic and budgetary projections for the 27 EU member states (2010–2060), 2012. European Commission, The 2012 ageing report: Underlying assumptions and projection methodologies, 2011. European Commission and European Investment Bank, “Factsheet 2: Where does the money come from?” November 2014. European Foundation for the Improvement of Living and Working Conditions, Employment trends and policies for older workers in the recession, 2012. European Global Navigation Satellite Systems Agency, GNSS Market Report, issue 3, October 2013. European Parliament, Better governance of the Single Market: An assessment accompanying the European Parliament’s legislative own-initiative report (rapporteur Andreas Schwab, MEP), European Added Value Assessment number 2, 2013. European Parliament, “Resolution of 8 October 2013 on effects of budgetary constraints for regional and local authorities regarding the EU’s structural funds expenditure in the member states”, October 2013. European Union, “Directive on services in the internal market”, Directive 2006/123/EC, 2006. European Union, “774% difference in phone call prices across the EU”, press release, August 6, 2013. European Union and OECD, Matching economic migration with labour market needs, September 2014. European Venture Capital Association, European Private Equity Activity Data 2007–2013, May 2014. F Favero, Carlo, and Alessandro Missale, Sovereign spreads in the euro area: Which prospects for a eurobond? presented at an Economic Policy panel meeting in Warsaw, October 27–28, 2011. Fawley, Brett W., and Christopher J. Neely, “Four stories of quantitative easing”, Federal Reserve Bank of St. Louis Review, volume 95, number 1, January/February 2013. 234 McKinsey Global Institute Bibliography . Forbes, “The world’s most innovative companies”, August 2014. Fougère, Denis, Francis Kramarz, and Julien Pouget, Youth unemployment and crime in France, IZA discussion paper number 2009, March 2006. Frankel, Jeffrey, and Jesse Schreger, “Over-optimistic official forecasts and fiscal rules in the Eurozone”, Review of World Economics, volume 149, issue 2, June 2013. G Gardiner and Theobald, International construction cost survey, December 2011. Garicano, Luis, Claire LeLarge, and John Van Reenen, Firm size distortions and the productivity distribution: Evidence from France, NBER working paper number 18841, February 2013. Gas infrastructure Europe, LNG import potential to Europe, presentation at Ifri Energy roundtable in Brussels, April 29, 2014. Geier, Alain, The debt brake: The Swiss fiscal rule at the federal level, Swiss Federal Finance Administration working paper number 15, February 2011. Gill, Indermit S., and Chor-Ching Goh, “Scale economies and cities”, World Bank Research Observer, volume 25, number 2, August 2010. Gill, Indermit S., and Martin Raiser, Golden growth: Restoring the lustre of the European economic model, World Bank, January 2012. Glaeser, Edward L., and Joshua D. Gottlieb, The wealth of cities: Agglomeration economies and spatial equilibrium in the United States, NBER working paper number 14806, March 2009. Global Commission on the Economy and Climate, Better growth, better climate: The new climate economy report, September 2014. Goldin, Claudia, “The U-shaped female labor force function in economic development and economic history”, in Investment in women’s human capital, T. Paul Schultz, ed., University of Chicago Press, 1995. Gordon, Robert J., Is US economic growth over? Faltering innovation confronts the six headwinds, NBER working paper number 18315, August 2012. Gregory, Robert G., The two-step Australian immigration policy and its impact on immigrant employment outcomes, IZA discussion paper number 8061, March 2014. H Hairault, Jean-Olivier, Thepthida Sopraseuth, and François Langot, “Distance to retirement and older workers’ employment: The case for delaying the retirement age”, Journal of the European Economic Association, volume 8, issue 5, September 2010. Hall, Peter A., and David Soskice, eds., Varieties of capitalism: The institutional foundations of comparative advantage, Oxford University Press, 2001. McKinsey Global Institute A window of opportunity for Europe 235 . Hasan, Iftekhar, Krzysztof Jackowicz, Oskar Kowalewski, and Åukasz KozÅ‚owski, Bank ownership structure, SME lending and local credit markets, Bank of Finland research discussion paper number 22/2014, 2014. Havik, Karel, Kieran Mc Morrow, Fabrice Orlandi, Christophe Planas, Rafal Raciborski, Werner Röger, et al., The production function methodology for calculating potential growth rates and output gaps, European Commission economic paper number 535, November 2014. Hendeliowitz, Jan, Danish employment policy: National target setting, regional performance management and local delivery, Danish National Labour Market Authority, February 2008. Hernández de Cos, Pablo, and Enrique Moral-Benito, Fiscal multipliers in turbulent times: The case of Spain, Banco de España working paper number 1309, 2013. Hirt, Martin, and Paul Wilmott, “Strategic principles for competing in the digital age”, McKinsey Quarterly, May 2014. Holland, Dawn, Iana Liadze, Cinzia Rienzo, and David Wilkinson, The relationship between graduates and economic growth across countries, Bank for International Settlements research paper number 110, August 2013. Honda, Gail, “Differential structure, differential health: Industrialization in Japan 1868–1940”, in Health and welfare during industrialization, Richard Steckel and Roderick Floud, eds., University of Chicago Press, 1997. Hufbauer, Gary Clyde, Jeffrey J. Schott, and Woan Foong Wong, “Figuring out the Doha Round”, Policy Analyses in International Economics, number 91, July 2010. Huxley, Joe, Value capture finance: Making urban development pay its way, Urban Land Institute, 2009. I Infrastructure UK, Infrastructure cost review, July 2014. Infrastructure UK, Infrastructure cost review: Technical report, December 2010. Institute for Fiscal Studies, Mirrlees Review, 2010. International Council on Clean Transportation, European vehicle market statistics, 2013, October 2013. International Energy Agency, Capturing the multiple benefits of energy efficiency, September 2014. International Energy Agency, Energy efficiency market report 2013: Market trends and medium-term prospects, 2013. International Energy Agency, Medium-term gas market report 2013: Market trends and projections to 2018, June 2013. IMF, Euro area policies: 2014 Article IV consultation, selected issues, IMF Country Report number 14/1999, July 2014. IMF, Global financial stability report: Moving from liquidity- to growth-driven markets, April 2014. 236 McKinsey Global Institute Bibliography . IMF, World economic outlook: Legacies, clouds, uncertainties, October 2014. IMF, World economic outlook: Recovery strengthens, remains uneven, April 2014. J Jagannathan, Ravi, David A. Matsa, Iwan Meier, and Vefa Tarhan, Why do firms use high discount rates? Social Science Research Network (SSRN) Electronic Journal, June 2014. Jensen, J. Bradford, Global trade in services: Fear, facts, and offshoring, Peterson Institute for International Economics, 2011. Jousten, Alain, M. Lefèbvre, S.
Perelman, and P. Pestieau, The effects of early retirement on youth unemployment: The case of Belgium, IMF working paper number 08/30, February 2008. JP Morgan, European banks: All eyes on funding: LCR, the next undiscounted regulatory headwind, 2011. K Kapetanios, George, Haroon Mumtaz, Ibrahim Stevens, and Konstantinos Theodoridis, Assessing the economy-wide effects of quantitative easing, Bank of England working paper number 443, January 2012. Kapteyn, Arie, Adriaan S. Kalwij, and Asghar Zaidi, The myth of worksharing, IZA discussion paper number 188, August 2000. Kawaguchi, Daiji, and Tetsushi Murao, Labor market institutions and long-term effects of youth unemployment, IZA discussion paper number 8156, April 2014. Kingfisher, European home report 2014, 2014. Koo, Richard C., “The world in balance sheet recession: Causes, cure, and politics”, RealWorld Economics Review, issue number 58, 2011. Kowalski, Przemyslaw, Comparative advantage and trade performance: Policy implications, OECD trade policy paper number 121, October 2011. KPMG International, KPMG’s individual income tax and social security rate survey 2012, October 2012. Krebs, Tom, and Martin Scheffel, “Macroeconomic evaluation of labor market reform in Germany”, IMF Economic Review, volume 61, number 4, December 2013. Kumhof, Michael, and Romain Rancière, Inequality, leverage and crises, IMF working paper number 10/268, November 2010. L Llewellyn Consulting, Financing Europe’s investment and economic growth, June 2014. Lora, Eduardo, and Mauricio Olivera, “What makes reforms likely: political economy determinants of reforms in Latin America”, Journal of Applied Economics, volume VII, number 1, May 2004. McKinsey Global Institute A window of opportunity for Europe 237 .
M Mammen, Kristin, and Christina Paxson, “Women’s work and economic development”, Journal of Economic Perspectives, volume 14, number 4, fall 2000. Mascherini, Massimiliano, Lidia Salvatore, Anja Meierkord, and Jean-Marie Jungblut, NEETs: Young people not in employment, education or training: Characteristics, costs and policy responses in Europe, Eurofound, October 2012. Mayordomo, Sergio, Juan Ignacio Peña, and Eduardo S. Schwartz, Towards a common European Monetary Union risk free rate, NBER working paper number 15353, September 2009. McKinsey & Company, Better for less: Improving public sector performance on a tight budget, July 2011. McKinsey & Company, “The energy advantage: How Germany can benefit in energy efficiency”, in Energy efficiency: A compelling global resource, 2010. McKinsey & Company, McKinsey-Studie zu Industrie 4.0: Deutsche Unternehmen trotz wachsender Konkurrenz zuversichtlich, 2015. McKinsey Center for Government, Education to employment: Getting Europe’s youth into work, January 2014. McKinsey Center for Government, Transforming government performance through lean management, December 2012. McKinsey Financial Services Practice, Breakaway: How leading banks outperform through differentiation: McKinsey global banking annual review 2013, November 2013. McKinsey Global Institute, Beyond austerity: A path to economic growth and renewal in Europe, October 2010. McKinsey Global Institute, A blueprint for addressing the global affordable housing challenge, October 2014. McKinsey Global Institute, Building globally competitive cities: The key to Latin American growth, August 2011. McKinsey Global Institute, Creating economic growth in Denmark through competition, November 2010. McKinsey Global Institute, Debt and deleveraging: Uneven progress on the path to growth, January 2012. McKinsey Global Institute, Debt and (not much) deleveraging, February 2015. McKinsey Global Institute, Disruptive technologies: Advances that will transform life, business, and the global economy, May 2013. McKinsey Global Institute, From poverty to empowerment: India’s imperative for jobs, growth, and effective basic services, February 2014. McKinsey Global Institute, Global flows in a digital age: How trade, finance, people, and data connect the world economy, April 2014. 238 McKinsey Global Institute Bibliography . McKinsey Global Institute, Global growth: Can productivity save the day in an aging world? January 2015. McKinsey Global Institute, Growth and renewal in the Swedish economy: Development, current situation and priorities for the future, May 2012. McKinsey Global Institute, India’s urban awakening: Building inclusive cities, sustaining economic growth, April 2010. McKinsey Global Institute, Internet matters: The Net’s sweeping impact on growth, jobs, and prosperity, May 2011. McKinsey Global Institute, Investing in growth: Europe’s next challenge, December 2012. McKinsey Global Institute, Lions go global: Deepening Africa’s ties to the United States, August 2014. McKinsey Global Institute, Manufacturing the future: The next era of global growth and innovation, November 2012. McKinsey Global Institute, A new dawn: Reigniting growth in Central and Eastern Europe, December 2013. McKinsey Global Institute, Open data: Unlocking innovation and performance with liquid information, October 2013. McKinsey Global Institute, Preparing for China’s urban billion, March 2009. McKinsey Global Institute, QE and ultra-low interest rates: Distributional effects and risks, November 2013. McKinsey Global Institute, Resource revolution: Meeting the world’s energy, materials, food, and water needs, November 2011. McKinsey Global Institute, Trading myths: Addressing misconceptions about trade, jobs, and competitiveness, May 2012. McKinsey Global Institute, Urban America: US cities in the world economy, April 2012. McKinsey Global Institute, Urban world: Cities and the rise of the consuming class, June 2012. McKinsey Global Institute, Urban world: Mapping the economic power of cities, March 2011. McKinsey Global Institute, Urban world: The shifting global business landscape, October 2013. McKinsey Global Institute, The world at work: Jobs, pay, and skills for 3.5 billion people, June 2012. McKinsey Global Institute and McKinsey Infrastructure Practice, Infrastructure productivity: How to save $1 trillion a year, January 2013. McKinsey on Society, How the world’s best-performing school systems come out on top, September 2007. McKinsey Public Sector Practice, The public-sector productivity imperative, March 2011. McKinsey Global Institute A window of opportunity for Europe 239 . Meier, Iwan, and Vefa Tarhan, Corporate investment decision practices and the hurdle rate premium puzzle, SSRN Electronic Journal, January 2007. Menguy, Séverine, “Can eurobonds save the euro?” in States, banks, and the financing of the economy: Monetary policy and regulatory perspective, Morten Balling, Ernest Gnan, and Patricia Jackson, eds., SUERF, 2013. Mersch, Yves, Capital markets union: The “why” and the “how”, speech at the Joint EIB-IMF High Level Workshop in Brussels, October 22, 2014. Monteagudo, Josefa, Aleksander Rutkowski, and Dimitri Lorenzani, The economic impact of the Services Directive: A first assessment following implementation, European Commission economic paper number 456, June 2012. Morgado, António, Tiago Neves Sequeira, Marcelo Santos, Alexandra Ferreira-Lopes, and Ana Balcão Reis, Measuring labour mismatch in Europe, CEFAGE-UE working paper number 2014/13, Center for Advanced Studies in Management and Economics, Universidade de Évora, 2014. Mosca, Ilaria, “Evaluating reforms in the Netherlands’ competitive health insurance system”, Eurohealth, volume 18, number 3, January 2012. Muellbauer, John, Combatting Eurozone deflation: QE for the people, Vox, December 23, 2014. Muller, Patrice, Dimitri Gagliardi, Cecilia Caliandro, Nuray Unlu Bohn, and Demetrius Klitou, Annual report on European SMEs 2013/2014: A partial and fragile recovery, Final report, European Commission, July 2014. N Nath, Chandrika, Autonomous road vehicles, Houses of Parliament PostNote number 443, September 2013, amended April 2014. National Association of State Budget Officers, Capital budgeting in the states, spring 2014. Navaretti, Giorgio Barba, Matteo Bugamelli, Fabiano Schivardi, Carlo Altomonte, Daniel Horgos, and Daniela Maggioni, The global operations of European firms: The second EFIGE policy report, Breugel Blueprint Series, volume XII, July 2011. O Olson, Mancur, The logic of collective action: Public goods and the theory of groups, Harvard University Press, 1965. Onaran, Özlem, and Giorgos Galanis, Is aggregate demand wage-led or profit-led? National and global effects, Conditions of work and employment series number 40, International Labour Organisation, 2012. OECD, Ageing and employment policies: Norway 2013: Working better with age, June 2013. OECD, Better Life Index, 2014. OECD, Demand-side innovation policies, May 2011. 240 McKinsey Global Institute Bibliography . OECD, Economic policy reforms: Going for growth 2013, 2013. OECD, Economic policy reforms: Going for growth 2015, 2015 OECD, Employment outlook 2013, 2013. OECD, Entrepreneurship at a glance 2013, July 2013. OECD, International migration outlook 2011, July 2011. OECD, “Mobility and migration in Europe”, in OECD Economic Surveys: European Union 2012, March 2012. OECD, OECD Pensions outlook 2012, 2012. OECD, Pensions at a glance, 2011. OECD, Pensions at a glance, 2012. OECD, Recruiting immigrant workers: Germany 2013, February 2013. OECD, Recruiting immigrant workers: Sweden 2011, December 2011. OECD, Reviews of innovation policy: Korea, 2009. OECD, The 2012 labour market reform in Spain: A preliminary assessment, December 2013. OECD Committee of Fiscal Affairs Forum on Strategic Management, Principles of good tax administration—practice note, Centre for Tax Policy and Administration, amended May 2001. P Pace, Scott, Gerald P. Frost, Irving Lachow, David R. Frelinger, Donna Fossum, Don Wassem, and Monica M. Pinto, The Global Positioning System: Assessing national policies, Rand Corporation, 1995. Paldam, Martin, “Safe havens in Europe: Switzerland and the ten dwarfs”, European Journal of Comparative Economics, volume 10, number 3, December 2013. Panayotou, Theodore, “Economic growth and the environment”, presented at the spring seminar of the United Nations Economic Commission for Europe in Geneva, March 3, 2003. Pasquier, Sara, and Aurelien Saussay, Progress implementing the IEA 25 energy efficiency policy recommendations: 2011 evaluation, International Energy Agency, March 2012. Pelkmans, Jacques, “The economics of Single Market regulation”, Bruges European Economic Policy Briefings, number 25, College of Europe, 2012. Pelkmans, Jacques, and Andrea Renda, “Does EU regulation hinder or stimulate innovation?” Regulatory Policy, Centre for European Policy Studies special report number 96, November 2014. Pesaran, M.
Hashem, and Ron P. Smith, Counterfactual analysis in macroeconometrics: An empirical investigation into the effects of quantitative easing, IZA discussion paper number 6618, June 2012. McKinsey Global Institute A window of opportunity for Europe 241 . Peterson, George E., Unlocking land values to finance urban infrastructure, World Bank, 2009. Petrella, Andrea, Fostering innovation through public procurement: Rationale, implementation and best practice in Italy and Europe, Bank of Italy Regional Economic Research Department, 2013. PricewaterhouseCoopers and the World Bank/International Finance Corporation, Paying taxes 2013: The global picture, November 2013. R Rajan, Raghuram G., Fault lines: How hidden fractures still threaten the world economy, Princeton University Press, 2010. Rincon-Aznar, Ana, and W. S. Siebert, Employment protection, productivity, wages and jobs in Europe, INDICSER discussion paper number 36, December 2012. Rogers, Howard, The impact of a globalising market on future European gas supply and pricing: The importance of Asian demand and North American supply, Oxford Institute for Energy Studies, January 2012. Rubini, Loris, Klaus Desmet, Facundo Piguillem, and Aránzazu Crespo, Breaking down the barriers to firm growth in Europe: The fourth EFIGE policy report, Bruegel Blueprint Series, volume XVIII, August 2012. S Salomäki, Aino, and Teresa Munzi, Net replacement rate of the unemployed: Comparisons of various approaches, European Union economic paper number 133, February 1999. Sapir, André, “Globalization and the reform of European social models”, Journal of Common Market Studies, volume 44, number 2, June 2006. Sinclair, David, Jessica Watson, and Brian Beach, Working longer: An EU perspective, International Longevity Centre, September 2013. Statistics Finland, Special education 2013: Share of students having received special support diminished, June 2014. Stern, David I., “The rise and fall of the environmental Kuznets curve”, World Development, volume 32, issue 8, August 2004. Sykes, Brooke, Mobile talent? The staying intentions of international students in five EU countries, Migration Policy Group, April 2012. T Tadjeddine, Karim, “‘A duty to modernize’: Reforming the French civil service”, McKinsey Quarterly, April 2011. Tereanu, Eugen, Anita Tuladhar, and Alejandro Simone, Structural balance targeting and output gap uncertainty, IMF working paper number 14/107, June 2014. 242 McKinsey Global Institute Bibliography . Teulings, Coen, and Richard Baldwin, eds., Secular stagnation: Facts, causes and cures, Centre for Economic Policy Research, August 2014. Thévenon, Olivier, Policy drivers of female labour force participation in OECD countries, presented at Seminar on Early Childhood Education and Care in Brussels, December 4, 2013. Tilford, Simon, and Philip Whyte, eds., Innovation: How Europe can take off, Centre for European Reform, July 2011. Tompson, William, and Robert Price, The political economy of reform: Lessons from pensions, product markets and labour markets in ten OECD countries, OECD, 2009. Turner, Adair, “Population ageing: What should we worry about?” Philosophical Transactions of the Royal Society, volume 364, issue 1532, October 2009. U United Kingdom Office for National Statistics, Public service productivity estimates: Total public services, 2010, April 2013. US Energy Information Administration, “Figure MT-46: U.S. exports of liquefied natural gas in five cases, 2005–40”, in Annual Energy Outlook 2014, April 2014. US White House, Executive order: Making open and machine readable the new default for government information, May 9, 2013. V Van Campenhout, Geert, and Tom Van Caneghem, “How did the notional interest deduction affect Belgian SMEs’ capital structure?” Small Business Economics, volume 40, issue 2, February 2013. Van der Ende, Martin, Peter Donker van Heel, Kenneth Walsh, Jena de Wit, and Natalija Ziminiene, European vacancy and recruitment report 2012, European Commission, November 2012. Van de Vijver, Fons, and Norbert K. Tanzer, “Bias and equivalence in cross-cultural assessment: An overview”, Revue européenne de psychologie appliquée, volume 54, issue 2, 2004. VTT Technical Research Centre of Finland, “Smoother passenger traffic across the FinnishRussian border”, press release, April 15, 2014. W Wagenvoort, Rien, and Sanne Zwart, Uncovering the common risk free rate in the European Monetary Union, European Investment Bank economic and financial report number 2010/05, September 2010. Walker, Tom, “Why economists dislike a lump of labor”, Review of Social Economy, volume 65, issue 3, September 2007. World Bank, World development report 2009: Reshaping economic geography, 2008. McKinsey Global Institute A window of opportunity for Europe 243 . World Economic Forum, The competitiveness of cities, August 2014. World Economic Forum, Enhancing Europe’s competitiveness: Fostering innovation-driven entrepreneurship in Europe, June 2014. World Economic Forum, Global competitiveness report 2013–2014, September 2013. World Economic Forum, Global competiveness report 2014–2015, September 2014. Z Zachmann, Georg, and Valeria Cipollone, “Energy competitiveness”, in Manufacturing Europe’s future, Reinhilde Veugelers, ed., Breugel Blueprint Series, volume XXI, 2013. Zipfel, Frank, and Caroline Heinrichs, The impact of tax systems on economic growth in Europe: An overview, DB Research, Deutsche Bank, October 2012. 244 McKinsey Global Institute Bibliography . RELATED MGI AND MCKINSEY RESEARCH Global growth: Can productivity save the day in an aging world? (January 2015) Without action, global economic growth will almost halve in the next 50 years. A new McKinsey Global Institute report offers a solution: a dramatic improvement in productivity. Game changers: Five opportunities for US growth and renewal (July 2013) Five “growth drivers” have the potential to add hundreds of billions of dollars to annual GDP and create millions of new jobs by 2020. Global flows in a digital age: How trade, finance, people, and data connect the world economy (April 2014) The movement of goods and services, finance, and people has reached previously unimagined levels. Global flows are creating new degrees of connectedness among economies—and playing an ever-larger role in determining the fate of nations, companies, and individuals. To be unconnected is to fall behind. McKinsey Insights app Explore insights from McKinsey, MGI, and McKinsey Quarterly—all delivered seamlessly to your mobile devices.
Broaden your knowledge and widen your perspective on our latest thinking on issues facing senior leaders and spanning all industries, functions, and geographies. A new dawn: Reigniting growth in Central and Eastern Europe (December 2013) The nations of Central and Eastern Europe were among the fastest growing in the world before the global financial crisis. Restoring that kind of growth will require a strategy that raises investment, expands high-value exports, unleashes productivity in domestic sectors, revives foreign direct investment, and increases domestic savings. www.mckinsey.com/mgi E-book versions of selected MGI reports are available at MGI’s website, Amazon’s Kindle bookstore, and Apple’s iBooks Store. Download and listen to MGI podcasts on iTunes or at www.mckinsey.com/mgi/publications/multimedia/ Cover image: Thumbs up © iStockphoto. Contents page images: Woodworkers © Getty Images; .scientists © Getty Images; writers © Corbis. Infographic by Darby Films. . McKinsey Global Institute June 2015 Copyright © McKinsey & Company www.mckinsey.com/mgi @McKinsey_MGI McKinseyGlobalInstitute .
Recent reports have assessed global flows; the economies of Brazil, Mexico, Nigeria, and Japan; China’s digital transformation; India’s path from poverty to empowerment; affordable housing; the economics of tackling obesity; and prospects for global GDP growth over the next 50 years. MGI is led by three McKinsey & Company directors: Richard Dobbs, James Manyika, and Jonathan Woetzel. Michael Chui, Susan Lund, and Jaana Remes serve as MGI partners. Project teams are led by the MGI partners and a group of senior fellows, and include consultants from McKinsey & Company’s offices around the world.
These teams draw on McKinsey & Company’s global network of partners and industry and management experts. In addition, leading economists, including Nobel laureates, act as research advisers. The partners of McKinsey & Company fund MGI’s research; it is not commissioned by any business, government, or other institution. For further information about MGI and to download reports, please visit www.mckinsey.com/mgi. McKinsey in Europe McKinsey & Company is a global management consulting firm, deeply committed to helping institutions achieve lasting success. McKinsey opened its first offices in Europe in 1959 as the region’s economy began to recover from World War II.
The Firm played an active role in that economic rebirth, working with leading business organisations, as well as governments, nonprofits, and cultural institutions. With offices in 37 cities across Europe, today we serve clients across a wide range of industries and business areas, as well as in the social and public sectors. Copyright © McKinsey & Company 2015 . A WINDOW OF OPPORTUNITY FOR EUROPE JUNE 2015 Eric Labaye | Paris Sven Smit | Amsterdam Eckart Windhagen | Frankfurt Richard Dobbs | London Jan Mischke | Zurich Matt Stone | London . PREFACE Seven years on from the global recession, the European economic recovery remains sluggish, and talk persists of countries exiting the Eurozone. Yet Europe has fundamental strengths on which to build. The question is how to use those strengths as a platform for a return to robust growth. In this report, the McKinsey Global Institute (MGI), which has studied productivity and growth in 30 industries in more than 20 countries over the past 25 years, has examined European growth from three angles. First, the research looked at the supply side and productivity of the European economy, discussing 11 competitiveness growth drivers that together would constitute a sweeping programme of structural reform.
Second, MGI has drawn on previous analysis on debt and deleveraging to examine the current shortage of aggregate demand in Europe and to highlight various options for stimulating investment and job creation. Third, MGI conducted a survey and conjoint analysis of 16,000 Europeans in eight countries during August 2014 to ascertain their aspirations and priorities. This research was led by Eric Labaye, a director of McKinsey and chairman of MGI based in Paris; Sven Smit, a McKinsey director based in Amsterdam; Eckart Windhagen, a McKinsey director based in Frankfurt; Richard Dobbs, a director of McKinsey and MGI based in London; and Jan Mischke, an MGI senior fellow based in Zurich. Matt Stone led the project team.
The team comprised Paraic Behan, Josef Ekman, Asher Ellerman, Sebastian Farquhar, Alec Guzov, Jakob Hensing, Anna Orthofer, Juliane Parys, Björn Saß, Anne-Marie Schoonbeek, Nigel Smith, Charlotte van Dixhoorn, and Ollie Wilson. We would like to acknowledge the helpful support and input of MGI colleagues Jonathan Ablett, Timothy Beacom, Ivo Eman, Lucia Fiorito, Jan Grabowiecki, Karen Jones, Priyanka Kamra, Krzysztof Kwiatkowski, Arshiya Nagi, Aditi Ramdorai, Vivien Singer, and Amber Yang. We are grateful to the academic advisers who helped shape this research and provided challenge and insights and guidance: Martin N. Baily, Bernard L. Schwartz Chair in Economic Policy Development and senior fellow and director of the Business and Public Policy Initiative at the Brookings Institution; Richard N. Cooper, Maurits C.
Boas Professor of International Economics at Harvard University; Howard Davies, chairman of Phoenix Group; Hans-Helmut Kotz, visiting professor of economics at Harvard University and senior fellow at the Center for Financial Studies; and Lord Adair Turner, senior fellow at the Institute for New Economic Thinking. In addition to MGI’s advisers, we benefitted hugely from insights and feedback provided by Bruno Bezard, general director, French Treasury; Laurence Boone, special advisor for International, European Economic and Financial affairs, French Presidency; Michael Bosnjak of the GESIS – Leibniz Institute for the Social Sciences, associate professor at the Free University of Bozen-Bolzano; Horace “Woody” Brock, president of Strategic Economic Decisions; Marco Buti, director-general for economic and financial affairs at the European Commission; Raffaele della Croce, lead manager, Long-Term Investment Project, at the OECD; Ian Davis, chairman of Rolls-Royce Group PLC; Klaus Günter Deutsch, head of the department of research, industrial and economic policy, Bundesverband Deutscher Industrie e.V.; José Manuel González-Páramo, member of the Board of Directors, BBVA; Yoram Gutgeld, member of the chamber of deputies and economic advisor to the prime minister, Italy; Thomas Heilmann, Senator for Justice and Consumer Protection, Berlin; Kalin Anev Janse, secretary general of the European Stability Mechanism; Ton Kuijlen, emeritus professor of methodology at Tilburg University; Pascal Lamy, president emeritus of the Jacques Delors Institute and former director general of the World Trade . Organisation; Jean Hervé Lorenzi, founder and chairman of the Cercle des économistes; Catherine L. Mann, OECD chief economist and head of the economics department; Giles Merritt, founder and secretary-general of Friends of Europe; Rudolf Minsch, chief economist of Economiesuisse; Peter Mooslechner, executive director, Oesterreichische Nationalbank; Ewald Nowotny, governor, Oesterreichische Nationalbank; Jean PisanyFerry, commissioner general for Policy Planning, Office of the French Prime Minister; Baudouin Regout, policy officer, secretariat general, European Commission; André Sapir, senior fellow at Bruegel; Gerhard Schwarz, director of Avenir Suisse; Jean Tirole, chairman of the Toulouse School of Economics and a Nobel laureate in economics; Claire Waysand, chief of staff for the Minister of Finance and Budget, France; Axel Weber, chairman, UBS; and Thomas Wieser, chair of the Eurogroup Working Group of the European Council. We also had the great honour of testing and refining our thinking in further confidential discussions with many policy makers and officials affiliated with governments and central banks throughout Europe and with European institutions. We thank them all deeply for their time. We would like to thank many McKinsey colleagues for their input and industry expertise, including Konrad Bauer, Cornelius Baur, Alejandro Beltran de Miguel, Kalle Bengtsson, Kirsten Best-Werbunat, Beril Beten, Marco Bianchini, Daniel Boniecki, Bogdan Buleandra, Christian Casal, Adam Chrzanowski, Miklos Dietz, Catarina Eklöf-Sohlström, Nicklas Garemo, Anna Granskog, Philipp Härle, Antony Hawkins, Matthias Heuser, Vivian Hunt, Alain Imbert, Andrew Jordan, Stijn Kooij, Peter Lambert, Sebastien Leger, Frank Mattern, Jean-Christophe Mieszala, Jorge Omeñaca, Jakob Österberg, Occo Roelofsen, Matt Rogers, Jimmy Sarakatsannis, Luuk Speksnijder, Leonardo Totaro, Thomas Vahlenkamp, Cornelius Walter, Peter de Wit, and Louise Young. MGI’s operations team provided crucial support for this research. We would like to thank MGI senior editor Janet Bush; Matt Cooke, Rebeca Robboy, Vanessa Gotthainer, Rachel Grant, Damaris O’Hanlon, and Vanessa Ratcliffe in external communications and media relations; Julie Philpot, editorial production manager; Marisa Carder, graphics specialist; and Deadra Henderson, manager of personnel and administration. We are grateful for all of the input we have received, but the final report is ours and any errors are our own. This report contributes to MGI’s mission to help business and policy leaders understand the forces transforming the global economy, identify strategic locations, and prepare for the next wave of long-term growth.
As with all MGI research, this work is independent and has not been commissioned or sponsored in any way by any business, government, or other institution, although it has benefitted from the input and collaborations that we have mentioned. We welcome your emailed comments on the research at MGI@mckinsey.com. Richard Dobbs Director, McKinsey Global Institute London James Manyika Director, McKinsey Global Institute San Francisco Jonathan Woetzel Director, McKinsey Global Institute Shanghai June 2015 . Chapter photo Contents: Construction sky © Getty Images . CONTENTS HIGHLIGHTS In brief 1 1. Europe has a platform for ambitious renewal Page 1 Europe’s recent performance has been lacklustre Page 6 But Europe has a foundation of strength and a window of opportunity for renewal Page 10 Europeans in eight countries say they would make tough trade-offs to achieve their high aspirations Page 18 Platform for renewal 29 There is reason to believe that Europe can grow faster with competitiveness reform and investment and job creation in tandem Page 25 2. Reform—much of it national—can deliver growth Page 29 1. Nurturing ecosystem for innovation Page 38 2.
Effective education to employment Page 51 Boosting competition 143 3. Productive infrastructure investment Page 59 4. Reduced energy burden Page 68 5.
Supporting urban development Page 79 6. Competitive and integrated markets in services and digital Page 89 Stimulating demand 7. Public-sector productivity Page 101 8.
Further openness to trade Page 109 9. Grey and female labour-force participation Page 117 10. Pro-growth immigration Page 125 11.
Enhanced labour-market flexibility Page 132 3. How Europe can reignite investment and job creation Page 143 Successful reform requires productive investment and demand for jobs—and vice versa Page 144 A gap in aggregate demand persists in all domestic sectors of the economy, leaving Europe to rely on net exports Page 145 Europe has several options for igniting investment and job creation Page 161 4. Europe can overcome barriers to action Page 193 Three-quarters of competitiveness growth drivers can happen nationally with European action to boost investment and job creation Page 195 There are ways to unlock European action on investment and job creation despite governance, moral hazard, and distributional issues Page 198 Europeans are willing to play their part in their region’s economic renaissance Page 199 Appendix Page 203 Bibliography Page 229 .
IN BRIEF A WINDOW OF OPPORTUNITY FOR EUROPE Europe’s growth since the start of the financial crisis has been sluggish, and the continent faces some difficult long-term challenges on demographics and debt levels. But new MGI research finds that, thanks to a convergence of low oil prices, a favourable exchange rate, and quantitative easing (QE), Europe has a window of opportunity to undertake ambitious reforms, stimulate job creation and investment, and unlock new economic dynamism.1 ƒƒ It may be tempting for some observers to write off Europe. That would be a mistake. The continent has a foundation of strength on which to take action.
It remains a world leader on key indicators of social and economic progress. And respondents polled in an MGI survey and conjoint analysis of 16,000 Europeans in eight countries had high aspirations and expressed willingness to make tough trade-offs to achieve them. ƒƒ Three areas of reform with 11 growth drivers—many of which policy makers already implement in some form—can help deliver on European aspirations. They entail investing for the future (for example, nurturing innovation and reducing the energy burden), boosting productivity (for example, competitive and integrated markets in services and digital and more openness to trade), and mobilising the workforce (for example, increasing grey and female labour-force participation and enhancing labourmarket flexibility). ƒƒ Three-quarters of the impact of growth drivers can be obtained at the national level.
Best practice on every key dimension of the economy can be found somewhere in Europe. The challenge is to emulate that best practice and adopt it more widely. ƒƒ Scope for structural reform is limited while investment and job creation are weak. Corporations are piling up cash despite low interest rates, households have cut investment since the bubble, and governments have adopted austerity policies. While every sector is acting rationally, collectively they are causing weak demand that means output is still 15 percent below pre-crisis trends. ƒƒ Europe has several options for reigniting investment and job creation despite its complex institutional setup. Measures to unlock financing and quantitative easing can help but are insufficient on their own.
Fiscal stimulus is not easy to implement at scale in Europe. New ideas need to be explored, including accounting for public investment as assets depreciate rather than during capital formation, and carefully adjusting taxation and wage structures. ƒƒ By scaling up and speeding up reform mostly at the national level and stimulating investment and job creation at the European level in lockstep, Europe could close its output gap, return to a sustained growth rate of 2 to 3 percent over the next ten years, unleash investment of €250 billion to €550 billion a year, and create more than 20 million new jobs. This requires trust and the right governance structures that avoid moral hazard, bundle tight package deals, or lift investment programmes to the European level. We define Europe in this report as the EU-28 plus Norway and Switzerland. 1 . A window of opportunity for Europe €2.2 trillion a year needed to meet European aspirations by 2025 Europeans seen willing to make trade-offs— e.g., more working hours and/or less social protection—for higher incomes and better education, health care, security, and living environment Pro-growth immigration Grey and female labour-force participation M o B an oo d 11 growth drivers In ve Nurturing ecosystem for innovation he ng t lisi bi rkforce wo kets mar ing tivity st oduc pr Enhanced labour-market flexibilty Public-sector productivity Competitive and integrated markets in services and digital Further openness to trade s ti g n Effective education to employment fo r t h e f u t u re Productive infrastructure investment Act within current governance structure where possible (e.g., QE) Test potential for a post-Maastricht governance system to enable bolder action Look at new solutions like balance sheet accounting and unleashing household spend Supporting urban development Increasing competitiveness Implementing European best practice in three key areas can deliver growth aspirations 75% can be achieved by national governments Reduced energy burden Reigniting investment and job creation Action needed to kick-start growth 15% BELOW Europe’s output is well below its pre-crisis trend Growth potential If Europe undertakes reform on the supply side AND boosts investment and job creation—moving beyond crisis management and establishing the vision, trust, and governance to act at speed and scale—2–3% sustained GDP growth is possible 2–3 growth % . Chapter photo Chapter 1: Family on steps © Getty Images Alamy . 1. EUROPE HAS A PLATFORM FOR AMBITIOUS RENEWAL A number of forces have converged over the past year to provide Europe with a window of opportunity to accelerate reform and stimulate job creation and investment that has arguably not been available since the global financial crisis began in 2008. The sudden and largely unexpected drop in oil prices, a favourable euro exchange rate, the ECB’s announcement of a QE programme, and an improving business climate all suggest that 2015 is likely to be a strong year for GDP growth (Exhibit 1). This offers a promising backdrop for an ambitious programme of renewal. Exhibit 1 Strong 2015 growth projections create a window of opportunity for Europe to commit to reform, investment, and job creation for the longer term Estimated drivers of 2015 GDP growth for Europe-30 % 1.7–1.8 0.3 0.3 ~0.9 Baseline growth 0.2 Fiscal impact of QE Depreciation of euro Decreased oil prices Projected growth, 2015 NOTE: Baseline growth rate obtained when removing buoying factors: implies weak demand/slow reform In line with 2009– 13 average of ~0.9%.
Quantitative easing (QE): assumes primary economic benefit comes from increased accrued remittances via the European Central Bank, estimated up to a maximum impact of 0.2 percent of GDP. Depreciation: based on European Commission projections in early 2015; likely to interact with QE. Oil: calculated from shift in net exports after multiplier impact.
Projected growth: based on early 2015 European Commission projections. SOURCE: IMF; European Commission; McKinsey Global Institute analysis Europe's GDP shrank by 0.1% 2007–13 It is important that Europe not interpret these improving conditions as evidence that no further action is needed to improve the competitiveness of the economy and boost investment and job creation. Its leaders need to seize the moment because this precious window may soon close. Many of these trends are temporary or could reverse.
Although recent trends have led to a cautious return to a degree of optimism about Europe’s economic prospects, the fact remains that the continent’s recovery thus far has been sluggish, and considerable challenges clearly lie ahead. Europe has clearly underperformed on its long-term growth potential since the global financial crisis, with GDP shrinking marginally by 0.1 percent between 2007 and 2013. Per capita GDP in purchasing power parity terms has only just returned to its pre-crisis peak for the continent as a whole. .
Some warn that Europe could be headed towards a deflationary spiral similar to the one Japan suffered in the 1990s. Longer term, there is apprehension that ageing will further sap the European economy’s strength and put even more pressure on governments’ finances. The prime working-age population in Europe is projected to shrink by 4 percent, or 14 million people, in the period to 2030, and by 12 percent, or 42 million people, to 2050 (there are a few exceptions to this broad trend, such as the United Kingdom). Furthermore, there are political challenges. Europeans’ trust in their governments is at very low levels, according to the Edelman Trust Barometer.1 There are worryingly high debt levels in many countries, and the stability of the Eurozone is a continuing concern. MGI’s analysis suggests that action on a broad front to mobilise the continent’s workforce and boost its productivity—with lagging European economies closing half the gap with the continent’s top-quartile performers on these two measures—could boost GDP growth to 2.1 percent a year and per capita GDP growth to 1.8 percent a year on average, with significant difference among countries. There is apprehension that ageing will further sap the European economy’s strength. Achieving a stronger society and economy will require significant resources and therefore an improvement from the lacklustre GDP growth of recent years (see Box 1, “Why GDP growth matters”).
Europe has had a tepid recovery so far. Combined with demographic headwinds and a slowdown in productivity growth since the 1990s, the European Commission estimates that annual real GDP growth will be 1.5 percent to 2025. Europe has the potential to do better than that. 1 2 2015 Edelman trust barometer, Edelman, January 2015. McKinsey Global Institute 1.
Europe has a platform for ambitious renewal . Box 1. Why GDP growth matters The debate on growth today is contentious and wide-ranging, from whether GDP is the right measure to use, to how growth can be sustainable and inclusive. We agree that GDP has serious shortcomings as a measure of growth, and we support the search for alternative measures of economic and social progress. We also acknowledge legitimate questions about how to make growth sustainable and inclusive.
However, such discussions should not distract attention from the strong empirical relationship between GDP growth and key societal goals. Growth is closely linked to employment and therefore has a direct impact on the economic livelihood of citizens. It also generates resources that can be invested to improve societal outcomes and deliver on the broader aspirations voiced in the MGI survey and conjoint analysis.
It helps societies address critical challenges such as managing public debt or, indeed, combatting environmental degradation. In fact, the link between real per capita growth and unemployment is almost mechanical. Unless growth is entirely driven by increasing labour productivity, it necessarily involves more hours worked and therefore leads to demand for more workers. For example, an analysis of European unemployment data since the 1980s shows that periods of strong growth in real per capita GDP have almost uniformly been ones when there have also been considerable reductions in unemployment. Unemployment across Europe fell continuously in the late 1980s when the rate of real per capita GDP growth consistently exceeded 2 percent per year.
As soon as real per capita GDP growth fell below this rate in the early 1990s, unemployment surged. Similar patterns occurred in subsequent years, Unemployment fell sharply in the late 1990s and mid-2000s, periods during which real per capita GDP was growing strongly. A common charge against GDP growth as a primary aim for economic policy is that it involves damaging environmental externalities. This is a multifaceted and complex issue.
An analysis of the evolution of energy consumption in advanced economies since 1970 appears to offer support for the “environmental Kuznets curve” hypothesis, which suggests that there is an inverse U-shaped relationship between economic development and environmental degradation.1 This hypothesis posits that the impact of growth on the environment decreases as economies develop and shift away from manufacturing towards services. Historically, growth in real per capita GDP in high-income economies increasingly uncouples from energy consumption. European countries including Germany, France, and the United Kingdom have reduced energy consumption while increasing real output per head (Exhibit 2).
Most European countries have reduced per capita carbon emissions since the early 2000s even while their economies were growing at a significant rate. 1 McKinsey Global Institute See, for example, Theodore Panayotou, Economic growth and the environment, presented at the spring seminar of the United Nations Economic Commission for Europe in Geneva, March 3, 2003. One criticism of the environmental Kuznets curve, which is, however, not contradictory to the argument outlined here, is that the inverse U-shaped relationship may not hold any longer because countries at earlier stages of development are increasingly able to mitigate the environmental impact of growth through technology. See David I.
Stern, “The rise and fall of the environmental Kuznets curve”, World Development, volume 32, issue 8, August 2004. A window of opportunity for Europe 3 . Box 1. Why GDP growth matters (continued) Exhibit 2 Beyond a level of around $30,000, per capita GDP is largely decoupled from energy consumption Per capita energy consumption, 1970–2008 Million British thermal units (BTU) per person 250 United States 200 Australia 150 Germany France 100 Historical range for energy consumption evolution United Kingdom 50 China Japan South Korea India 0 0 5,000 10,000 15,000 20,000 25,000 30,000 35,000 40,000 45,000 Per capita GDP Real 2005 $ per person at purchasing power parity SOURCE: International Energy Agency; IHS; McKinsey Global Institute analysis 4 McKinsey Global Institute 1. Europe has a platform for ambitious renewal . In the immediate aftermath of the global financial crisis in 2008 and 2009, Europe lost 6 percent of real per capita GDP in purchasing power parity terms. Real per capita GDP did not return to its pre-crisis peak until the beginning of 2015 (Exhibit 3). The path to recovery has also been uneven. It is evident that Southern European countries such as Greece and Spain will require several more years to reach their pre-crisis peaks in real per capita GDP. Surging unemployment levels have been a particularly difficult challenge in Europe.
More than five million jobs were lost across the continent between 2008 and 2013, especially in manufacturing, construction, and other industrial sectors. Exhibit 3 Europe lost 6 percent of output per head during the crisis and has only just recovered Purchasing power parity–adjusted per capita GDP1 Index: 1.00 = 1Q08 1.06 United States 1.04 1.02 1.00 Europe-302 0.98 -6% 0.96 0.94 0.92 0.90 2005 06 07 08 09 10 11 12 13 14 Expected return to pre-crisis peak Gap to pre-crisis peak, 4Q143 % Europe-30 Southern Europe 2015 ~0 ~2019 -10.4 Nordics ~2015 -1.5 United Kingdom and Ireland 2015 ~0 2014 2.2 Baltics 2011 2.9 Continental Europe Central and Eastern Europe 7.3 3.6 United States 2011 2013 1 Quarterly GDP data from Eurostat converted to 2005 purchasing power parity (PPP) in dollars using 2005 PPP from the IMF; European countries’ per capita GDP weighted with respective year population. 2 EU-28 countries plus Switzerland and Norway. 3 2014Q4 or Q3 compared with the corresponding quarter with the highest value before the financial crisis SOURCE: Eurostat; IMF; United Nations Population Division; McKinsey Global Institute analysis McKinsey Global Institute A window of opportunity for Europe 5 . Europe’s recent performance has been lacklustre Given current primary fiscal balances, interest rates, and projected real GDP growth, the ratio of government debt to GDP will continue to grow from already high levels in many European countries, including Belgium, Finland, France, Italy, the Netherlands, Portugal, Spain, and the United Kingdom. This is a source of concern since high debt levels have historically been a drag on growth and increased the risk of financial crises that can spark another set of deep economic recessions.2 However, similarly to Japan, most major European economies will require significant fiscal adjustment before public-sector deleveraging can begin (Exhibit 4). Exhibit 4 European economies require significant fiscal adjustment to start public-sector deleveraging Primary balance—current and required1 % Primary balance, 2014 Country Spain Primary balance to start deleveraging -2.3 Japan Fiscal adjustment required ï‚¢ – Percentage points 4.9 2.6 -5.4 4.1 -1.3 Portugal 0.1 France 3.7 -2.3 2.5 0.2 Italy 1.7 United Kingdom -2.7 Finland Netherlands Belgium 1.3 Ireland 1.1 0.1 0.1 -1.0 0.8 0.7 -0.8 0.2 0.4 -0.2 Greece n/a 1.4 Germany 1.9 1.9 -0.3 -1.0 United States 3.6 -0.8 -1.6 3.6 0.0 2.7 2.1 n/a n/a 1 Based on consensus GDP forecast, current inflation, 2Q14 government level of debt to GDP, and estimated 2014 effective interest rate. SOURCE: McKinsey Country Debt database; IMF; IHS; EIU; Oxford Economics; OECD; McKinsey Global Growth Model; McKinsey Global Institute analysis 2 6 Debt and (not much) deleveraging, McKinsey Global Institute, February 2015. McKinsey Global Institute 1. Europe has a platform for ambitious renewal . Other major trends appear worrying for Europe’s future, too. Youth unemployment remains stubbornly high, hovering just under the 20 percent mark across the EU. Unless this problem is tackled, there is a risk of rising popular unrest. Meanwhile, the risk of populist parties gaining power and calling for the dissolution of the EU has grown.
Such political groupings gained significant shares of the vote in the 2014 EU elections. The stability of the euro and the future of the Eurozone remain subject to concern and conjecture. Greek deposit outflows reached €500 million a day at some points during early 2015.
At the time of writing, it is unclear whether Greece will continue to be a member of the Eurozone and the EU. On top of all of these factors, Europe is ageing, placing pressure on the pool of available labour. The European Commission expects that, by 2060, Germany’s population will shrink by one-fifth, and the number of Germans of working age from 54 million in 2010 to 36 million in 2060—lower than the total in France.3 Taking all of this together adds up to a dismal picture of Europe’s future. Without urgent reform, Europe could be on a dangerous path. Europe's real GDP grew only 1.1% per annum 2009–12 and 0.2% in 2013 Europe’s anaemic recovery was reflected in real GDP-growth rates.
Between 2009 and 2012, real GDP in Europe grew at a rate of only 1.1 percent per year. In 2013, real GDP growth even decelerated to 0.2 percent. This trajectory was significantly weaker than the rate observed in past European expansions and has also fallen short of post-crisis growth in other advanced economies.
Many analysts and commentators even warn that, seven years on from the onset of the crisis, Europe still risks entering a deflationary spiral and a long period of stagnation as Japan has experienced since the crisis of the early 1990s.4 Taking a broader view of Europe’s GDP growth beyond the relatively narrow focus on the 2008 global financial crisis and its aftermath, we find that Europe’s growth performance has been declining since the 1990s (Exhibit 5). This reflects trends in the supply of labour (or total hours worked) and productivity, the two principal forces behind real GDP growth. From 1995 to 2000, a period when real GDP growth averaged 2.9 percent a year in Europe, 0.9 percentage points came from an increase in the total number of hours worked and the other two percentage points from increased output per hour worked, or labour productivity. Between 2000 and 2007, real GDP growth per annum dropped to 2.3 percent.
The hours worked component continued to contribute one percentage point, but growth in labour productivity declined to 1.3 percent per annum. Between 2007 and 2013, hours worked made a slightly negative contribution to growth, and the contribution of productivity growth also weakened sharply to only 0.2 percent per annum. This collapse partly reflected the impact of the financial crisis.
Considering only the post-crisis period between 2009 and 2013, annual productivity growth recovered to a rate of 1.2 percent, while the contribution of hours worked remained negative. However, the fact remains that Europe will need to improve its performance on both key drivers of GDP growth if that measure is to settle back into a more robust upward trajectory. Looking at hours worked, Europe faces a projected decline in the number of 15- to 64-yearolds from 340 million in 2013 to 326 million in 2030. In the period to 2050, Europe’s labour force is expected to shrink even more dramatically (Exhibit 6).
Our analysis finds that this trend could dampen real GDP growth by around 0.2 percent a year over the next ten years. To offset the impact of declining population growth on the labour pool and therefore real GDP growth, Europe should consider action to boost the participation of women and older workers and should consider shifts in immigration policy with an explicit view to boosting growth. The 2012 ageing report: Underlying assumptions and projection methodologies, European Commission, April 2011. 4 For an overview of the recent debate on “secular stagnation”, see Coen Teulings and Richard Baldwin, eds., Secular stagnation: Facts, causes and cures, Centre for Economic Policy Research, August 2014. 3 McKinsey Global Institute A window of opportunity for Europe 7 . Exhibit 5 Europe's growth performance has been declining since the 1990s Decomposition of annual growth performance % 1995–2000 2000–07 2007–13 Labour Labour productivity Real GDP Increasing overall population 2.0 2.9 -0.2 1.3 Europe-30 2.3 -0.4 -0.1 -0.2 4.3 Real per capita GDP -1.2 2.7 0.9 1.9 1.0 -0.3 0.2 2.5 United States -0.3 3.1 1.8 1.7 2.4 -0.9 1.5 0.7 1.1 1.0 -0.8 0.2 -0.1 0.9 0.8 -0.2 0.6 1.4 1.4 -0.1 1.3 0.1 Japan 0.1 0.2 -0.1 0 -0.4 0.5 SOURCE: Eurostat; World Bank World Development Indicators; McKinsey Global Growth Model; McKinsey Global Institute analysis 8 McKinsey Global Institute 1. Europe has a platform for ambitious renewal . Exhibit 6 Europe’s prime working-age population is in a steep long-term decline, dropping by a projected 42 million between 2013 and 2050 Europe-30 prime working-age population (15- to 64-year-olds), 1990, 2013, 2030, and 20501 Million Baltics Nordics United Kingdom and Ireland 326 15 340 5 17 40 4 44 326 17 4 45 298 18 Compound annual growth rate, 2013–50 % 3 -0.7 0.2 68 67 46 0.2 50 Central and Eastern Europe -0.8 69 -0.6 -0.3 61 Southern Europe 79 85 Continental Europe 120 123 117 111 1990 2013 2030 2050 81 1 Includes immigration. NOTE: Numbers may not sum due to rounding. SOURCE: United Nations Population Division; McKinsey Global Institute analysis Given the end of demographic tailwinds in Europe, the onus will be on productivity to drive growth. Even the recovery in productivity growth to 1.2 percent per annum between 2009 and 2013 leaves the rate of productivity growth relatively weak, suggesting room for improvement. Our analysis of long-term labour productivity growth in leading economies since 1800 finds a long-term average rate of productivity growth of 1.4 percent per annum (with large variations around that average) (Exhibit 7). Historically, every period of weakening productivity growth has been followed by a rebound to above-trend growth.
This was the case in the years after the Great Depression in the 1930s and the oil crisis in the 1970s, for instance. However, in the recovery from the global financial and economic crisis, this has not been the case. The rate of annual productivity-growth rate since 2009 has remained significantly weaker than in the late 1990s, when it was 2 percent a year on average. Europe is not alone in experiencing weakening productivity growth; a similar trend can be observed in other advanced economies.
For instance, US productivity growth was 2.5 percent a year from 1995 to 2000 but only 1.5 percent between 2009 and 2013. Nevertheless, Europe will have to find ways to reignite productivity growth in order to achieve a more promising economic outlook. McKinsey Global Institute A window of opportunity for Europe 9 . Exhibit 7 Productivity per worker has historically grown at 1.4 percent a year with significant variation around that average Growth of GDP1 per labour force worker,2 ten-year rolling growth3 % Productivity Period average Long-term average Second Industrial Revolution: electrical DC motors, telephone, typewriter, industrial capital formation 3.0 2.5 1.5 Deregulation and globalisation Roaring Twenties: mass production, especially automobiles Railroad, steam engine proliferation 2.0 Mass education, urbanisation Further electrification New economy 1.9 2.0 1.4 1.4 1.2 1.0 0.5 0.3 Great Depression 0.2 0 1800 10 20 30 40 50 Pre-railroad 60 70 80 90 1900 10 Rapid industrialisation 20 30 40 World Wars I and II 50 60 70 Postwar prosperity Bretton Woods 80 Oil crisis 90 00 2009 Great Moderation (deregulation) 1 Highest GDP per worker among group of companies shown; United Kingdom to 1879; United States from 1880. 2 Working-age population is very rough estimate derived from total population and life expectancy. Labour force derived from OECD and International Labour Organisation data from 1960 and assumed 58% before industrialisation (interpolation in between); 55% assumes 95% male participation and 15% female participation. We do not consider unemployment. 3 1939–45 and 1914–24 periods linearly interpolated; highest achieved GDP per worker kept constant during recessions/negative growth. SOURCE: Angus Maddison series; OECD; United Nations; Gapminder; McKinsey Global Institute analysis But Europe has a foundation of strength and a window of opportunity for renewal An ambitious programme of renewal is possible because Europe has fundamental strengths. It is one of the world’s largest economies, home to a huge, highly integrated domestic market of 500 million inhabitants.
It also is well connected to global flows and is home to half of the 20 most competitive economies in the world, according to the World Economic Forum (WEF). European economies remain world leaders on six dimensions of social progress and perform well on indicators of economic health. Indicators of economic health and societal wellbeing correlate strongly (Exhibit 8). While the causation between societal well-being and economic health is likely to run both ways, getting Europe’s economic house in order will be necessary to build a healthier society and meet Europeans’ ambitions. 10 McKinsey Global Institute 1.
Europe has a platform for ambitious renewal . Exhibit 8 Strong economic performance creates the foundation for improved societal outcomes Nordics Continental Europe United Kingdom and Ireland Southern Europe Baltics Central and Eastern Europe Societal well-being Z-score composite index, Europe-30 = 0 0.7 0.6 R-squared = 45% Denmark 0.5 0.4 Malta 0.3 Ireland 0.2 0.1 0 Cyprus Slovenia Sweden Germany Belgium Netherlands Finland Switzerland Luxembourg Austria France Spain Italy -0.1 United Kingdom Czech Republic -0.2 -0.3 Portugal -0.4 -0.5 -0.6 Norway Hungary Greece -0.7 Estonia Croatia Lithuania -0.8 Latvia Slovakia Poland -0.9 -1.0 Bulgaria -1.1 Romania -1.2 -1.3 -1.4 -1.3 -1.2 -1.1 -1.0 -0.9 -0.8 -0.7 -0.6 -0.5 -0.4 -0.3 -0.2 -0.1 0 0.1 0.2 0.3 0.4 0.5 0.6 0.7 0.8 Economic health Z-score composite index, Europe-30 = 0 SOURCE: Eurostat; OECD; UNESCO; UNODC; World Bank, WEF; WHO; CIA; national statistical offices; McKinsey Global Institute analysis To measure economic health, we use a composite index comprising five elements: prosperity, inclusiveness, agility, resilience, and connectedness (see Exhibit 9 for details on the indicators included in this measure). Countries including Germany, Luxembourg, the Netherlands, Sweden, and Switzerland that score highly on economic health have also performed strongly on the six dimensions of societal well-being we have detailed. Conversely, societal well-being indicators are below the European average in many countries whose economic performance has been weaker, including Greece, Portugal, Romania, and Slovakia. McKinsey Global Institute A window of opportunity for Europe 11 . Exhibit 9 Europe’s economic performance is more varied than its social performance, but the continent still boasts best practice Performance on attributes relative to Europe-30 average Composite indicators; ranges of country-level z-scores1 United States Europe-30 Countries with top indicator scores2 Population >1 million European average Norway Prosperity -1.1 Switzerland 1.2 United States Norway Inclusiveness -1.2 Switzerland 1.3 Japan Economic health United States -1.3 Agility 1.9 Japan Sweden Czech Republic -1.4 Resilience 1.0 Sweden Australia Connect-2.4 edness Germany 0.7 United States United Kingdom 1 Measurement of the number of standard deviations away from the mean. The selection of subindicators and metrics, of course, influences country scores; not all countries have rankings for all metrics. 2 Comparison among Europe-30 countries, Australia, Canada, Japan, South Korea, and the United States. SOURCE: Eurostat; OECD; UNESCO; UNODC; World Bank; WEF; WHO; CIA; national statistical offices; McKinsey Global Institute analysis On each of the five elements of economic health, it is only on inclusiveness that Europe, on average, outperforms the United States. Performance across the continent varies widely. For example, per capita GDP at purchasing power parity in Switzerland is more than three times that of Bulgaria. Productivity per hour in Norway is more than 12 times that of Romania.
Debt-to-GDP ratios in Europe’s public and private sectors range from 109 percent in Latvia to almost 450 percent in Ireland. Nevertheless, it is promising that at least one individual European economy represents best practice on each of the five dimensions. Norway and Switzerland are leaders on prosperity and inclusiveness, Sweden on agility, the Czech Republic and Sweden on resilience, and Germany and the United Kingdom on connectedness. If all European countries were to match the performance of the front-runners on each dimension, a much more robust continental economy would be created.
Furthermore, some European economies have made progress in the past few years on crucial structural policies needed to underpin future growth (Exhibit 10). This gives cause for optimism that such efforts can—as they must— continue at an accelerated pace.5 5 12 Economic policy reforms 2015: Going for growth, OECD, 2015. McKinsey Global Institute 1. Europe has a platform for ambitious renewal .
Exhibit 10 Economic progress indicators Economic health indicator rankings Indicator (unit) Prosperity Direction of Europe-30 improvement average Best practice ï° 147,975 379,550 Switzerland ï° 47.1 86.6 Norway ï° -821 2,611 Poland Employment to working-age population (ratio of those employed to overall working-age population) ï° 0.51 0.66 Norway Gini, post-tax, post-pensions (distribution of family income; Gini index – measure of inequality) ï± 0.31 0.23 Norway Ratio of highest to lowest income decile ï± 9.4 5.3 Czech Republic Wage share of GDP (adjusted wage share, % of GDP) ï° 56 69 Switzerland Entrepreneurship index (index of development of entrepreneurship) ï° 57 74 Sweden Patents per million capita (per year) ï° 48 164 Switzerland R&D expenditure (R&D spending, % of GDP) ï° 1.8 3.6 Finland Debt-to-GDP ratio (overall debt as % of GDP; excluding debt from financial corporations) ï± 245 109 Latvia Financial rating (composite financial rating of multiple economic indexes and credit agency scores) ï° 77.8 99.5 Switzerland Performing loans (non-performing loans, % of total bank loans) ï° 92 100 Finland Dependency ratio increase (percentage point change in ratio of the size of the over-65 population to 15- to 64-year-old population, 2014–35) ï± 15 5% Latvia Sectoral concentration (Herfindahl index: methodology to assess sectoral diversification) ï± 0.06 0.05 Czech Republic MGI connectedness index: goods ï± 18 3 Germany MGI connectedness index: services ï± 18 1 Ireland MGI connectedness index: finances ï± 33 7 Germany MGI connectedness index: people ï± 24 5 Germany MGI connectedness index: data Connectedness (global ranking: lower absolute figure is better) 62,858 Per capita GDP growth (change in GDP per capita, 2008–13, constant 2011 $) Resilience 33,747 Productivity per hour (real output [measured in deflated GDP] per hour of labour input, $) Agility ï° Net wealth per capita (net wealth per adult: assets less liabilities, $) Inclusiveness Per capita GDP (constant 2011 $, at purchasing power parity) ï± 11 1 Netherlands Norway NOTE: Luxembourg and Malta excluded from analysis as outliers, not all countries have rankings for all metrics. SOURCE: McKinsey Global Institute European Growth scorecard model; McKinsey Global Institute analysis McKinsey Global Institute A window of opportunity for Europe 13 . Germany 1ST in world on global connections While the current debate on the European economy tends to focus on the negative, it is important not to gloss over the continent’s genuine economic strengths. Europe is one the world’s largest economies, accounting for 24 percent of global GDP in 2012, ahead of the United States at 22 percent.6 The process of European economic integration has created a single market of more than 500 million inhabitants with a largely free flow of goods and capital across the European Economic Area. European nations are not only closely connected with one another, but also more connected into global flows than many other parts of the world, including emerging and rapidly growing markets such as China, India, and Brazil. On MGI’s Connectedness Index, Germany is ranked first in the world, with the United Kingdom, the Netherlands, and France ranked fifth to seventh, respectively (Exhibit 11).7 Exhibit 11 Europe is one of the world’s largest economies and is more connected to global cross-border flows than other major economies Share of nominal world GDP at market exchange rates, 2012 100% = $73.6 trillion Rest of world 22 26 North America1 India 3 Russia 3 Brazil 3 Japan 8 24 11 China Europe-30 MGI Connectedness Index, 20122 1 2 3 4 5 6 7 8 9 10 11 12 13 14 15 … 21 25 27 30 43 Germany Hong Kong, China United States Singapore United Kingdom Netherlands France Canada Russia Italy Belgium Spain Switzerland Ireland Sweden … Japan China Mexico India Brazil 1 Canada, Mexico, and the United States. 2 Global flows in a digital age: How trade, finance, people, and data connect the world economy, McKinsey Global Institute, April 2014. SOURCE: World Bank; McKinsey Global Institute analysis North America—Canada, Mexico, and the United States—accounts for 27 percent of global GDP. Global flows in a digital age: How trade, finance, people, and data connect the world economy, McKinsey Global Institute, April 2014. 6 7 14 McKinsey Global Institute 1.
Europe has a platform for ambitious renewal . According to the WEF, ten of the 20 most competitive economies in the world are located in Europe, with Switzerland topping the global ranking.8 The continent is also home to many world-class companies, including 142 Fortune 500 companies as of 2014, more than the 128 based in the United States. Particular strengths can be found in knowledgeintensive industries.9 Twenty-nine of the world’s most innovative companies in 2014 listed by Forbes magazine are headquartered in Europe.10 Europe retains major trade surpluses in knowledge-intensive manufacturing and services (2.8 percent and 1.4 percent of GDP, respectively, for the EU-15 in 2012). Combined with the right policies and priorities, these achievements can be the bedrock for a more robust future economic performance. There is scope to improve all five dimensions of economic health. The key indicator of whether those improvements are made will be GDP growth.11 Europeans enjoy a high quality of life The quality of life in European societies is very high.
Out of six widely recognised measures of social progress—health care, education, the living environment, public safety, social protection, and work-life balance—Europe scores on average higher than the United States on four (Exhibit 12). The views expressed by the Europeans surveyed on what it takes to have a better life are broadly similar to those of citizens of other advanced economies, according to online responses received on the website of the OECD’s Better Life Index.12 Like people in Australia, Canada, Japan, New Zealand, and the United States, Europeans tend to place emphasis on overall life satisfaction, health, and education. These are dimensions on which many European countries perform strongly. <3% of employees in Denmark, Netherlands, and Norway work >50 hours a week However, there is a great deal of variation within Europe on these social metrics (Exhibit 13). Some countries outperform other nations around the world by a considerable margin; others underperform. For example, Norway ranks in the top three of a peer group of advanced economies on education, public safety, and work-life balance.13 Denmark, the Netherlands, and Norway are the top performers on work-life balance.
In these three countries, people devote 15.6 to 16.1 hours a week to leisure and personal care, and less than 3 percent of all employees work more than 50 hours per week. In our set of countries and chosen set of metrics, Spain is Europe’s leading performer on health care and Germany is Europe’s leader on education. The high degree of variation in performance within Europe on these six quality-of-life indicators and the presence of world-leading examples on each of the six send an important message. Europe may have experienced several years of difficult economic conditions since the global financial crisis in 2007 and global recession in 2008, but it still boasts a high quality of life overall and is home to world leaders on different measures of social progress. Europe can look within its borders for the solution to the future. The global competitiveness report 2014–15, World Economic Forum, September 2914. Knowledge-intensive goods and services are those that have a high R&D component or utilise highly skilled labor. 10 “The world’s most innovative companies”, Forbes, August 2014. 11 We fully acknowledge the many measurement challenges and conceptual shortcomings associated with GDP and welcome the many initiatives under way to refine and broaden the measurement of growth.
For further discussion, see Global growth: Can productivity save the day in an aging world? McKinsey Global Institute, January 2015. 12 Better Life Index, OECD, 2014. 13 Comparisons include the Europe-30 plus Australia, Canada, Japan, South Korea, and the United States. 8 9 McKinsey Global Institute A window of opportunity for Europe 15 . Exhibit 12 Despite recent challenges, Europe remains a world leader on various indicators of social progress Performance on attributes relative to Europe-30 average Composite indicators; ranges of country-level z-scores1 United States Europe-30 Countries with top indicator scores2 Population >1 million European average Spain Health care 1.2 -1.5 Australia Switzerland Germany Education -1.2 0.8 Finland Norway Sweden Living environment -1.7 Finland 1.1 Portugal Societal well-being Norway Public safety -1.4 Austria 1.1 Switzerland Social protection Work-life balance Ireland Germany 1.1 -2.0 Austria Denmark -1.4 1.6 Netherlands Norway 1 Measurement of the number of standard deviations away from the mean. The selection of subindicators and metrics, of course, influences country scores; not all countries have rankings for all metrics. 2 Comparison among Europe-30 countries, Australia, Canada, Japan, South Korea, and the United States. SOURCE: Eurostat; OECD; UNESCO; UNODC; World Bank; WEF; WHO; CIA; national statistical offices; McKinsey Global Institute analysis 16 McKinsey Global Institute 1. Europe has a platform for ambitious renewal . Exhibit 13 Social-progress indicators Societal well-being indicator rankings Indicator (unit) Health Life expectancy at birth (years) Direction of Europe-30 improvement average Best practice ï° 80 83 Italy Healthy life expectancy at birth (healthy life expectancy at birth [years] ÷ life expectancy at birth [years], % of total) ï° 87.9 90.2 Cyprus Infant mortality rate (deaths per 1,000 births) ï± 3.8 1.6 Slovenia Self-reported good health (self-reported responses describing good or very good health, %) ï° 68 82 Switzerland Mortality from ischaemic heart disease (deaths per 1,000 population, age-adjusted) ï± 104 48 France ï° 498 529 Finland Preschool enrolment rate (% of children aged 3–5 enrolled in preschool/kindergarten) ï° 88 100 France Competitiveness of education system (degree to which the education system meets the needs of a competitive economy) ï° 4.30 6.0 Switzerland Matching of skills (indexed measure of over- or undereducation in workforce) ï± 0.97 0.63 Norway Vocational training attainment (25- to 64-year-olds attained upper-secondary and post-secondary non-tertiary education, %) ï° 46 72 Czech Republic Carbon dioxide emissions per GDP unit (kilotonnes of CO2 emissions per € million GDP) ï± 0.36 0.09 Switzerland Particulates per cubic metre (PM10, country level [micrograms per cubic meter]) ï± 27.9 15.8 Finland Housing quality (composite based on dwelling quality, housing expenditure, and rooms per person) ï° 100.4 102.2 Norway UNESCO cultural heritage sites (sites per 100,000 sq km land area) ï° 10.2 32.8 Belgium Non-congestion rate (ratio of average to free-flow speed, scores averaged across three speed limit zones) ï° 0.90 0.93 Czech Republic Homicide rate (intentional homicides per 100,000 people) ï± 1.1 0.6 Austria Rule of law (index score on perceived quality) ï° 3.7 4.5 Norway Political stability (index score on perceived quality) ï° 3.1 3.9 Switzerland ï± 12 3 Estonia ï° 55 91 Austria Social protection expenditure (total public social expenditure as % of GDP) ï° 28 35 Denmark Redistribution (observed delta between pre-tax/pensions Gini and post-tax/pensions Gini coefficients) ï° 0.19 0.27 Ireland Average time worked (hours worked per year per person employed) ï± 1,638 1,380 Netherlands Employees working long hours (% of employees working more than 50 hours per week) ï± 7 1 Netherlands Time devoted to leisure and personal care (hours per week) ï° 15.1 16.1 Denmark Education Average PISA score (maths, science, reading) Living environment Public safety Social Vulnerable employment (% of total employment) protection Unemployment benefits (coverage of contributory and non-contributory schemes, %) Work-life balance NOTE: Luxembourg and Malta excluded from analysis as outliers; not all countries have rankings for all metrics. SOURCE: McKinsey Global Institute European Growth scorecard model; McKinsey Global Institute analysis McKinsey Global Institute A window of opportunity for Europe 17 . Europeans in eight countries say they would make tough trade-offs to achieve their high aspirations While Europe is already a world leader on many dimensions of social progress, and Europeans generally enjoy an enviable quality of life even in comparison with citizens of other high-income countries and regions, they are not content merely to preserve these accomplishments. People in eight countries surveyed by MGI express a desire for an even better deal and are willing to make tough trade-offs to secure one. This is a key theme that emerges from a conjoint survey of 16,000 respondents in eight European countries, conducted by the McKinsey Global Institute in August 2014. The survey asked respondents to reflect on aspirations and priorities for their societies over the next ten years.14 While we acknowledge that what people say in response to survey questions may not entirely reflect the way they would vote when presented with actual policy options, we believe that the results offer an indication of attitudes across eight European countries that may be useful intelligence for decision makers. MGI’s survey asked respondents to make tangible trade-offs in order to secure an even higher quality of life (see Box 2, “Conjoint-survey methodology”, and the appendix for a detailed description of the survey and the methodology used, as well as the limitations). The survey found that individuals express broad agreement that even greater effort and resources should be invested in specific areas. 14 MGI conducted a survey among 2,000 participants each in France, Germany, Italy, Poland, Romania, Spain, Sweden, and the United Kingdom. Respondents were asked to choose between sets of conjoint scenarios that trade off a desire to have more or less of different attributes of societal aspirations in a cost- or GDPbalanced way.
The attributes were health care, education, the living environment, social security, public safety, buying power, working hours, and productivity (here represented by personal factors such as the willingness to work faster or under more pressure, or training oneself). A model ensures that scenarios economically balance: improvements in one attribute have to come at the expense of other attributes or willingness to work longer or more productively. See the appendix for details. Box 2.
Conjoint-survey methodology A weakness of many opinion polls is that questions on interdependent issues are often presented in isolation. This approach can fail to pick up the gap between one preference and another and how big that gap is, and can lead to unrealistic “wish lists”. Conjoint surveys are designed to address this problem by requiring respondents to make trade-offs between different priorities. The MGI European Aspirations Conjoint Survey on societal priorities over the next ten years required respondents to choose between GDP-balanced scenarios—that is, combinations of options that could be feasible economically—as improvements in one priority area had to be “paid for” through compromises on another.
The eight attributes were health care, the living environment, buying power, education, public safety, social protection, working hours, and productivity. The latter two offered respondents the possibility of increasing overall economic output and then allocating that additional output to the other six priorities. Respondents were presented with ten sets of two random GDP-balanced scenarios.
Based on their replies, we modelled optimal or utility-maximising scenarios for each respondent. These scenarios are the basis of the average scenarios discussed in this chapter. The underlying GDP model, which is based on current expenditure on the different social dimensions in the countries surveyed, allows for estimates of the implied change in spending per attribute as well as an overall GDP-growth rate for these scenarios. 18 McKinsey Global Institute 1.
Europe has a platform for ambitious renewal . Respondents across countries, age groups, and levels of income and educational attainment express a common desire for additional investment in health care, the living environment, education, and public safety in the period to 2025, and at the same time say they want to increase their disposable income. The survey suggests that, on average, respondents would prioritise improvements in health care, the living environment, education, and public safety, and they would be willing to “pay” for these improvements by deprioritising their work-life balance and social protection (Exhibit 14). Those surveyed say that, to achieve improvements in these key social measures and rising incomes, they would be prepared to work longer—in the order of 1.8 hours a week (0.5 hours to three hours depending on the country)—and more productively, and to accept a reallocation of spending away from social-protection programmes. Specifically, the survey shows that 84 percent of respondents say that they would be willing to compromise on their work-life balance as long as this led to improved societal outcomes and higher individual incomes—the opposite of the image of a “lazy European”. It is important to note that, although respondents say they are prepared to invest additional effort to achieve improvements in their priorities for society as a whole, they also express a wish to see growth in their individual incomes—captured in the survey by “buying power”. To realise improvements in health, the living environment, education, public safety, and buying power, additional resources of €2.2 trillion a year would be required by 2025, equivalent to 15 percent of Europe’s current GDP. The survey shows that 84 % of respondents say that they would be willing to compromise on their worklife balance as long as this led to improved societal outcomes and higher individual incomes. 96% of respondents want improved health care 93% of respondents want improved living environment McKinsey Global Institute Respondents’ aspirations and commitments are broadly shared across Europe The priority the Europeans we surveyed give to improvements in the different dimensions of social progress is remarkably consistent.
While our survey does not adjust for cultural biases, it is notable that people in all eight countries agree on the areas where they would like to see improvements, namely health care, the living environment, education, and public safety. They all want their incomes to rise, too (Exhibit 15). There is very little variation in the ranking of these priorities among different age groups, educational levels, employment status, and income levels.
In each of these key social areas, more than 80 percent of all respondents expressed a common desire for improved outcomes, with almost unanimous agreement that improvements should be made with respect to health care and the living environment (96 percent and 93 percent agreement, respectively). A window of opportunity for Europe 19 . Exhibit 14 European survey respondents want improvements to measures of societal well-being and buying power— and are ready to make trade-offs to achieve them Results of MGI European Aspirations Conjoint Survey Aspirations and trade-offs of respondents in eight European countries to 2025 based on GDP-balanced conjoint analysis1 Conjoint survey responses, n = 16,000 Relative strength of preferences for different social outcomes Much less Less Same More Much more Health care Living environment Buying power Education Public safety Work-life balance2 Social protection Allocation of resources in respondents' preferred scenario Additional spend and income generation Living environment Public safety Health care 1.8 hours per week per worker—a commitment broadly shared by those in full-time, part-time, or no employment3 Education Buying power Additional spend and income Productivity increase Working longer (extra hours) Working more productively Spending reallocation from social protection to other priorities 91% of respondents would prefer this scenario over the status quo 1 Averaged GDP- and demographic-weighted optimal levels for each respondent. 2 Calculated as average of working hours and productivity scores from conjoint survey. 3 Calculated based on choices of all respondents irrespective of current employment status; current full-time employees would choose to work 1.6 hours longer on average. There is a significant spread among countries. SOURCE: MGI European Aspirations Conjoint Survey, August 2014 (N = 16,000); McKinsey Global Institute analysis 20 McKinsey Global Institute 1. Europe has a platform for ambitious renewal . Exhibit 15 Countries are aligned on most priorities, although opinion differs on the trade-off between work-life balance and social protection Desired change from status quo for country-specific “average” scenarios1 Weighted average deviation from status quo Germany Sweden United Kingdom France Italy Spain 26 24 Poland Romania Health care Living environment Buying power Education Public safety Work-life balance Social protection Purchasing power parity–adjusted real per capita GDP, 2012 € thousand 34 33 29 29 19 12 1 The “average” scenario takes averaged GDP- and demographic-weighted optimal levels for each respondent. SOURCE: MGI European Aspirations Conjoint Survey, August 2014; McKinsey Global Institute analysis The survey also revealed a shared readiness to work longer and more productively across geographies—and not only among those currently deprived of opportunities to work because of the economic environment. However, there is some variation among respondents on how to achieve this shift (Exhibit 16). For example, the survey found that Polish respondents expressed a preference for generating additional output mainly through significant productivity improvements but increasing their working hours by only a relatively modest 1.1 weekly hours per worker. In contrast, French respondents as a group said that they would be willing to work as much as 2.0 more hours a week while slightly decreasing productivity.
It is in Spain and Italy that respondents appear most willing to make large compromises on both aspects of their work-life balance for societal improvements and their incomes. The survey results show that, on average, Spanish respondents would accept working an extra 2.7 hours per week and working much more productively. On average, Italian respondents say that they would be prepared to work 2.5 additional hours a week and much more productively.
At first glance, these results may appear to reflect that fact that Spain and Italy have been facing particularly difficult economic conditions. However, the results also largely hold for Spanish and Italian respondents who are in fulltime employment. McKinsey Global Institute A window of opportunity for Europe 21 . Exhibit 16 Readiness to work longer and more productively to improve societal outcomes is common to most countries with some variations Extra hours worked Number Productivity increase Relative preference Less More Much more 2.7 Spain Italy 2.5 Romania 2.0 1.1 Poland 1.6 Germany 1.3 United Kingdom France Same 1.8 Europe Sweden AVERAGE SCENARIO 0.5 2.0 SOURCE: MGI European Aspirations Conjoint Survey, August 2014; McKinsey Global Institute analysis 72% of respondents would work longer In practice, any commitment among Europeans to compromise on their work-life balance could be achieved in several ways. Reducing holidays, delaying retirement, or bringing unemployed people into work could have a similar impact to extending the working week by 1.8 hours. The survey found that, if they were personally required to work more, the top choice of 54 percent of respondents in full-time employment would be to work more hours each week; 23 percent of this group would choose to forfeit holidays or delay retirement. In all eight countries surveyed, working more hours per week was the top choice among respondents, although that preference was more prevalent in some countries than in others. For instance, 64 percent of respondents in France indicated that they would prefer to work more hours per week compared with only 44 percent of respondents in the United Kingdom, where 35 percent of respondents chose later retirement as their preferred option. Many respondents expressed willingness to work longer hours not solely as a necessary trade-off to achieve better social outcomes but also as an intrinsically positive choice if doing so would increase their disposable income.
The survey asked separate questions about how long respondents were currently working and how long they would be willing to work if compensated accordingly. The survey found that 72 percent of respondents currently employed opted for increased working hours. This was true for workers currently in part-time employment who would like to find full-time positions and for those who already work full time and would like to increase their hours moderately in order to earn more (Exhibit 17).
In contrast, 17 percent of respondents currently employed would like to reduce their working hours even at the expense of lower earnings, mostly among those in full-time employment who aspire to part-time work. 22 McKinsey Global Institute 1. Europe has a platform for ambitious renewal . Exhibit 17 Many survey respondents currently working would be willing to increase their hours moderately if they were compensated for doing so Maximum willingness to work1 Hours per week Weighted group size >100 90–99 80–89 Readiness to further increase full-time working hours Desire to move into full-time employment 70–79 60–69 50–59 40–49 30–39 Interest in part-time employment 20–29 10–19 <10 <10 10–19 20–29 30–39 40–49 50–59 60–69 70–79 Current working hours2 Hours per week 1 Question: On average, how many hours a week do you spend on your work? 2 Question: Imagine you can work as many hours a week as you like and your net income increases accordingly; what is the maximum number of hours you would work in this case? SOURCE: MGI European Aspirations Conjoint Survey, August 2014; McKinsey Global Institute analysis The willingness to work more productively is more difficult to measure precisely than an increase in hours worked. While many productivity-enhancing measures can be nearly invisible to a worker, the commitments made in the conjoint survey refer to improvements that workers could influence directly. These include improved effort, greater ambition at work, and extra training. One piece of evidence corroborating these commitments is the considerable support among respondents for performance-based salaries.
The survey found that 64 percent of respondents believe that salaries in general should reflect performance “more” or “a lot more” than they currently do. Moreover, more than seven out of ten respondents would be prepared to make part or even all of their salary performancebased. Only 16 percent of respondents indicated that they already had a performancebased salary, suggesting that there is significant scope to improve the alignment of incentives with performance in a way that positively resonates with employees. Although the survey findings on working longer and more productively are broadly consistent among respondents, there is considerable disagreement on the degree to which people would want to compromise on social protection.
The survey finds that 84 percent of respondents said that, in their personal optimal scenario, they would be willing to trim their work-life balance in exchange for improvements on other priorities. There is modest variation in the strength of this commitment, according to the survey. However, only 58 percent of respondents expressed a preference for reducing the resources devoted to McKinsey Global Institute A window of opportunity for Europe 23 .
social protection. On this aspect of the survey, there are large differences among countries. For instance, 93 percent of British respondents said that they would accept cuts in social protection, but only 46 percent of those from Poland, 25 percent from Italy, and 24 percent from Spain felt the same way. The average Spanish respondent would like to increase social protection as well as invest more in the other social priorities while making considerable compromises on the work-life balance. In contrast, on average, respondents from France, Sweden, and the United Kingdom say they would be prepared to make relatively small changes to work-life balance and instead opt to cover more than half of the additional resources required through the reallocation of spending on social protection (Exhibit 18). Exhibit 18 The degree to which survey respondents are ready to compromise on social protection varies among countries Relative magnitude of compromises in country-specific average scenarios1 % of total incremental resources required for preferred outcomes Working longer and harder Reallocation away from social protection Increase in social protection spending desired Spain 100 Italy 100 31 69 Germany United Kingdom France 11 89 Romania Sweden 4 96 Poland Decrease in social protection spending desired 35 65 Europe 56 44 41 35 59 65 1 Calculated based on conjoint analysis results and country-specific GDP models. SOURCE: McKinsey Global Institute analysis 1/5 of survey respondents would make large compromises on work-life balance for increased social protection 24 A cluster analysis gives us more insight into these differences of opinion on social protection (Exhibit 19).
This analysis reveals five broad groups. Of these, one cluster would like to increase spending on social protection by making even larger compromises in the worklife balance; this group comprises roughly one-fifth of all respondents, more than half of whom are from Spain and Italy. A second cluster, with only 12 percent of respondents, does not favour cuts to social protection but would “pay” for maintaining current protection by forgoing individual income rather than working longer and harder; respondents from Sweden are most prominent in this cluster, accounting for one-third of respondents. The other three clusters all agree that spending on social protection should be reduced significantly, but they differ on the ambition of their aspirations for the other priorities and the extent of their readiness to compromise on their work-life balance.
These diverse McKinsey Global Institute 1. Europe has a platform for ambitious renewal . attitudes on social protection come from people of all ages, educational attainment, and employment status. Exhibit 19 The survey results show some variation in attitudes towards social protection spending Desired change from status quo in cluster-specific “average” scenarios1 Cluster I II III IV V Cluster size (%) 25.0 12.3 26.8 21.8 14.1 Characteristic Highest willingness to trade away social protection while preserving worklife balance Low emphasis on buying power, wish to preserve social protection Willing to make moderate compromises for moderate improvements Highest willingness to trade away worklife balance to improve all other priorities including social security Less aspirational on societal priorities, wish to preserve work-life balance Health care Living environment Buying power Education Public safety Work-life balance2 Social protection 1 For cluster-specific average scenarios. 2 Calculated as average of working hours and productivity scores from conjoint survey. SOURCE: MGI European Aspirations Conjoint Survey, August 2014; McKinsey Global Institute analysis There is reason to believe that Europe can grow faster with competitiveness reform and investment and job creation in tandem Current forecasts suggest that there is an expectation that Europe will improve on its postcrisis performance. The average of mid-2014 projections from the Economist Intelligence Unit, IHS, and the Conference Board for real GDP growth between 2013 and 2025 yields a forecast of 1.7 percent per annum—despite the EIU’s projected decline of 0.4 percent in the working-age population. The European Commission takes a slightly more pessimistic view, forecasting growth of 1.5 percent per annum, assuming a slight uptick in annual labour supply growth by 0.1 percent and a productivity-growth boost of 1.4 percent per annum. Europe has an opportunity to grow faster by catching up with best practice. To grasp the potential, consider a scenario in which all countries were to close half of the gap to topquartile European performance on labour productivity and labour-force mobilisation; that is, the share of the working-age population that is active in the labour force) in the period to McKinsey Global Institute A window of opportunity for Europe 25 .
2025. In this scenario, real GDP growth could accelerate to 2.1 percent a year—or more if Europe adopts the kind of growth-enhancing reforms discussed in this report—and real per capita GDP growth to 1.7 percent a year (Exhibit 20). Exhibit 20 Catching up with best practice within Europe could deliver a step change in GDP growth above post-crisis rates and recent forecasts Real GDP Per capita real GDP Comments/assumptions GDP growth per annum, % Catching up with best practice Catching up to top-quartile performance1 Post-crisis GDPgrowth rate 2009–13 performance1 Baseline forecasts 2013–25 2.1 1.7 0.9 0.6 Average external forecasts EU Commission forecast1 Growth rate achieved if: â–ª All countries closed 50% of the gap to top-quartile performance on productivity and labour-force mobilisation to 2025 â–ª Top-quartile productivity performers in 2012 improved productivity at a rate of 1.4% per annum to 2025 â–ª Top-quartile performers on labour-force mobilisation maintained constant mobilisation levels â–ª 1.7 European real GDP performance between 2009 and 2013 â–ª Simple average of forecast 2013–25 from Economist Intelligence Unit, IHS, and Conference Board for Europe-30 â–ª European Commission forecast for EU-27 plus Norway 1.3 1.5 1.2 1 Per capita GDP growth calculated by applying UN population growth forecast. SOURCE: Eurostat; European Commission; United Nations; EIU; IHS; Conference Board; McKinsey Global Growth Model; McKinsey Global Institute analysis While the European economy remains so fragile and GDP growth so weak, a growth rate of 2 percent or above may seem unrealistic. We believe that achieving such a growth rate is possible, although it will require the right institutional enablers. Other advanced economies face demographic challenges similar to Europe’s but are expected to achieve real growth rates of more than 2 percent a year because their productivity is growing strongly.
The US economy, for instance, is expected to grow in real terms at an annual rate of 2.4 percent (1.6 percent per capita) despite modest 0.2 percent projected growth in the working-age population.15 South Korea’s economy is expected to expand by 2.9 percent a year in real terms (2.5 percent per capita) despite an expected contraction of 0.5 percent in its workingage population. To deliver on citizens’ aspirations, European leaders need to work together to develop a comprehensive programme of reform (largely at the national level) and investment and job creation (enabled by pan-European action). Only this combination will overcome inertia and get Europe’s growth engine motoring again (Exhibit 21). GDP growth is based on a simple average of forecasts by the Economist Intelligence Unit, IHS, and Conference Board; population growth is based on a projection from the UN Population Division. 15 26 McKinsey Global Institute 1. Europe has a platform for ambitious renewal .
Exhibit 21 Europe will need to work in tandem on reform and support for job creation and investment Reform to boost competitiveness, mostly at national level (75% impact), supported at European level Investment and job creation enabled mostly at the European level SOURCE: McKinsey Global Institute analysis ••• There is no guarantee that Europe will achieve the rates of GDP growth that we believe are possible if the region is to embrace reform to boost competitiveness and acts to stimulate investment and job creation. By the same token, these rates are not the upper limits of what can be achieved. Europe has fundamental strengths on which to build, and European citizens express themselves willing to make tough trade-offs to achieve higher growth and incomes. If they are to meet the high aspirations suggested by the MGI survey, Europe’s leaders need to set out a programme that delivers a step change in growth compared with the continent’s recent economic performance and uses the fruits of growth to further strengthen European society and quality of life.
Europe needs a healthier economic environment to deliver on what Europeans say they want, and that will require concerted action on both structural reform and support for investment and job creation. In the next chapter, we discuss three broad areas of supply-side reform that could become a platform for a new growth strategy that delivers a better deal for Europe. Then, in Chapter 3, we examine various options for stimulating investment and job creation within Europe before, in Chapter 4, sharing some thoughts on whether Europe can—and is likely to—act on these fronts. McKinsey Global Institute A window of opportunity for Europe 27 .
Chapter photo Chapter 2: Class © Getty Images . 2. REFORM—MUCH OF IT NATIONAL—CAN DELIVER GROWTH Competitiveness is the foundation of any healthy economy. Therefore, an agenda for sustainable growth must start with measures to deliver a more competitive Europe. A combination of 11 structural reforms that invest for the future, boost productivity, and mobilise the workforce could enhance the competitiveness of the European economy and generate the growth required to meet Europeans’ societal aspirations. Encouragingly, Europe does not need to look far to find best-practice examples for these reforms.
The continent can look to its own fundamental strengths and adopt leading practices found within its own borders. Three-quarters of the positive impact on growth possible from implementing competitiveness growth drivers can be achieved through decisions made at the national level, although these will need support at the European level to boost investment and job creation and foster more promising growth conditions for reform. Countries will need to prioritise and select which growth drivers are most applicable to their economies and societies. In combination, the 11 growth drivers could potentially help GDP growth to reach 2 to 3 percent per annum and sustain it in the longer term—beyond 2015, whose growth rate, as noted, could be relatively strong because of the confluence of a number of positive trends (Exhibit 22).
This would be more than enough to meet in full the aspirations voiced in the survey. These growth drivers could boost Europe’s GDP-growth rate by around 1.5 percentage points a year compared with a scenario in which no reform takes place. That is the equivalent of adding the current size of the Austrian economy every year.
Cumulatively, this would have an effect greater than the entire current size of the United Kingdom’s economy by 2025. Eleven growth drivers could potentially help GDP growth to reach 2 to 3 percent per annum. This estimate does not include any of the interaction effects or overlap among the growth drivers, although we believe that, implemented in concert, many of the growth drivers would magnify the effect of others. For example, promoting competitive and integrated markets in the service and digital sectors will help accelerate the development of a stronger ecosystem for innovation across Europe by enabling business-friendly policies and standards. Efforts to increase the competitiveness of European cities could work well in tandem with immigration policies that are growth-oriented and attract higher-skilled immigrants, and incentivising new entrepreneurial activity in urban hubs. .
The 2 to 3 percent that the 11 competitiveness growth drivers could help Europe reach is more than the 1.5 percent a year that MGI estimates would be needed to meet the aspirations expressed in the MGI survey (Exhibit 23). Some of the growth drivers may result in people working longer and more productively, but many others are smarter ways of achieving growth without necessarily increasing working hours. For example, high-quality infrastructure provision improves the productivity of workers almost invisibly. Stronger skills from a well-functioning education-to-employment system allow people to work more effectively and not necessarily longer or harder. Exhibit 22 The growth drivers could deliver sustainable growth of 2 to 3 percent even when oil and currency effects ebb away Potential GDP growth for Europe-30 (estimates) % 1.8 2015 EC forecast 0.8 2015 boom factors Oil Do nothing 0.3 0.2 0.8–1.5 Euro QE1 0–1.0 European aspirations 1.5 Growth driver impact >2.0 Potential sustained growth to 2025 2.0–3..0 1 Projected impact of QE from central bank remittances.
Much of the “Euro” impact also relates to QE; impact of QE estimated at up to a maximum of 0.2% of GDP; assumes a GDP weighted bond rate of between 1.3 and 2.2%. NOTE: Numbers may not sum due to rounding. SOURCE: IMF; European Commission; McKinsey Global Institute analysis 30 McKinsey Global Institute 2. Reform—much of it national—can deliver growth . Exhibit 23 Eleven growth drivers—about three-quarters achievable at the national level— can deliver on European aspirations Incremental real GDP growth % per annum National-level catching up to leading practice Leveraging European scale Enabler Changing incentive structures and taxation Investing for the future Boosting productivity Nurturing ecosystem for innovation 0.26 Competitive and integrated markets in services and digital 0.43 Effective education to employment 0.24 Public-sector productivity 0.15 Productive infrastructure investment 0.14 Further openness to trade 0.08 Reduced energy burden 0.13 Mobilising the workforce Grey and female labourforce participation Pro-growth immigration 0.26 Enhanced labour-market flexibility Supporting urban development 0.39 0.15 0.09 SOURCE: McKinsey Global Institute analysis McKinsey Global Institute A window of opportunity for Europe 31 . 3/4 of growth impact at national level Three-quarters of the growth potential can be achieved at the level of individual countries— as long as action is taken to unlock investment and job creation at the European level. The fact that so much potential for change is in national hands is an encouraging finding given the complexities of supra-national decision making within the EU. National governments can play a major role in delivering the growth impact of the drivers, including, for instance, increasing grey and female participation in the labour force, which will require governments to adjust labour and child-care policies. Regional and city authorities have a part to play, too. Each of these can, for instance, contribute to efforts to boost the competitiveness of cities. National, regional, and city governments have an enormous opportunity to learn from leading practice found elsewhere in Europe.
Leading practices abound, including Switzerland’s flexible dual-apprenticeship vocational training system, Denmark’s outcomesbased budgeting in the public sector, Spain’s recent labour-market reforms, Germany’s support services for exporters in destination countries, Flanders’ pre-commercial procurement initiative for innovative products and services, and Wroclaw’s efforts to make the Polish city more attractive to young workers. 1/4 of potential growth impact needs involvement of EU Europe’s supranational institutions need to be involved to coordinate the exchange of best practice and the delivery of the remaining one-quarter of the potential growth impact that will rely on leveraging the continental economy’s scale. For instance, the EU can spur innovation in sectors with significant economies of scale by setting Europe-wide standards for disruptive technologies or open data, and it can accelerate progress in interconnecting gas and electricity networks across Europe’s internal borders. The EU is also responsible for Single Market legislation and external trade agreements, and it can explore European-scale public procurement to boost efficiency of spending. It is unlikely that simultaneous implementation of all 11 growth drivers is feasible.
In reality, countries will need to consider how best to sequence structural reform, and their priorities will inevitably differ. Drawing on MGI’s assessment of countries’ performance on a range of subindicators (including, for instance, private spending on R&D, energy intensity in industry, and the quality of infrastructure relative to income levels), we have identified top performers on each of the 11 growth drivers and those countries that currently lag behind the European average on each growth driver by the largest margins (Exhibit 24). The gaps to that average are quite different for each country. Germany, for instance, has a gap on mobilising labour.
Poland and Romania have scope to catch up on their innovation ecosystems and the productivity of infrastructure investment. All European countries have considerable scope to boost the productivity of their public sectors, but we have not attempted to quantify this scope due to well-recognised difficulties in measuring productivity in these sectors. Our scoring system gives us a helpful overview, but we acknowledge that it is no substitute for a detailed discussion within each country on where its leaders would place their priorities (Exhibits 25 and 26). One vital component of enabling the programme of reform that the 11 growth drivers constitute is ensuring that tax systems are oriented towards economic growth (see Box 3, “Taxation and incentives”). 32 McKinsey Global Institute 2.
Reform—much of it national—can deliver growth . Exhibit 24 European economies need wider adoption of best practice that already exists on the continent Performance vs. other countries on each growth driver Germany Sweden United Kingdom France Top third on composite indicator Top third on at least one subindicator Italy Spain Poland Romania Investing for the future Nurturing ecosystem for innovation Effective education to employment Productive infrastructure investment Reduced energy burden Supporting urban development Boosting productivity Competitive and integrated markets in services and digital Public-sector productivity Not quantitatively assessed Further openness to trade Mobilising the workforce Grey and female labour-force participation Pro-growth immigration Enhanced labour market flexibility n/a NOTE: All countries assessed as long as at least two out of three or four subindicators available; limited data availability particularly for Bulgaria, Croatia, Cyprus, Latvia, Malta, Norway, Romania, Slovakia, and Switzerland. SOURCE: McKinsey Global Institute analysis McKinsey Global Institute A window of opportunity for Europe 33 . Exhibit 25 Growth driver indicators Competitiveness growth driver indicator rankings Direction of Europe-30 Best European improvement average country Indicator (unit) Nurturing system for innovation Finland Global innovation index (composite score) ï° 51.3 64.8 Switzerland ï± 49.8 18.6 Slovenia ï° 21 30 Ireland Youths not in education, employment, or training (NEETs) (% of the population aged 18–24 with at most lower secondary education ) ï± 12 4 Slovenia ï° 37 53 Ireland Relative length of youth unemployment (time unemployed for 15–24 age group as a % of time unemployed for 25–54 age group) ï± 78 50 Sweden Competitiveness of education system (degree to which the education system meets the needs of a competitive economy) ï° 4.3 6.0 Switzerland Quality of infrastructure (WEF composite infrastructure quality score) ï° 5.4 6.6 Switzerland Gap in infrastructure spend (absolute [- or +] gap between actual and optimal level of infrastructure spend; % of GDP) ï± 0.6 0.0 Czech Republic Difference between expected and actual quality (composite score delta, given GDP per capita) ï° 0.02 1.13 Portugal Energy intensity in industry (final energy consumption of industry; tons of oil equivalent/million $ 2005 PPP per value added in industry) ï± 84 29 Ireland Energy consumption (consumption as a % of value added, based on inputs from energy intensive sectors) ï± 5 3 Ireland Price deviation from European mean (weighted average of deviation in electricity prices from European mean; ¢ per kWh) ï± 2.9 0.6 Denmark Average electricity price (weighted average for industry and households, ¢ per kWh, post-tax) ï± 19.2 9.4 Norway Urbanisation (% of population living within urban areas) ï° 61 83 Belgium Urban density (people per sq. km. in urban areas) ï° 875 1,831 Greece Affordability (% GDP between wages and housing prices) Supporting urban development 2.4 Tertiary education attainment (% of those aged 30–34 having successfully completed tertiary education [ISCED levels 5 or 6]) Reduced energy burden 1.1 Knowledge-intensive sectors (sector % of GDP) Productive infrastructure investment ï° Ease of starting a company (index: lower is better) (composite score; lower is better) Effective education to employment Private R&D spending (% of GDP) ï± 0.5 0.0 Denmark NOTE: Luxembourg and Malta excluded from analysis as outliers; not all countries have rankings for all metrics. SOURCE: McKinsey Global Institute European Growth scorecard model; McKinsey Global Institute analysis 34 McKinsey Global Institute 2. Reform—much of it national—can deliver growth .
Exhibit 26 Growth driver indicators (continued) Competitiveness growth driver indicator rankings Indicator (unit) Competitive and integrated markets in services and digital Direction of Europe-30 Best European improvement average country 30 Ireland Transposition lag of trade laws (% non-compliance within national law) ï± 0.7 0.2 Denmark Trade law infringements (per $ trillion GDP, averaged over 3 years) ï± 90 17 Germany ï± 0.17 0.10 Netherlands ï± 1.37 0.92 Netherlands Extraterritorial trade (extra EU-28 trade; % of GDP) ï° 10.8% 17.1% Sweden Extraterritorial trade to China, United States, India (% of GDP) ï° 5.4% 20.0% Ireland ICC Open Market Index (index of market openness) ï° 3.97 4.80 Belgium Female participation rates (% of male participation rates, 25–49) ï° 87% 97% Lithuania Female hours worked (% of male weekly hours) ï° 82% 97% Hungary Grey participation rates (55–74 age group as % of 25–54 age group) ï° 54% 66% Norway Non-EU immigrant share (% of total population) ï° 6.6% 14.0% Estonia Education level of immigrants (% of immigrants with education levels of ISCED 5, 6, or above) ï° 31% 63% Ireland Employment level of immigrants (% of native level) ï° 92% 116% Hungary Net migration from non-Europe-30 countries (newcomers per 1,000 people) ï° 1.31 4.53 Sweden ï± 42% 9% Norway ï± 2.52 1.62 United Kingdom Employment rates (rate for the 15–64 age group) ï° 67% 84% Norway Unit labour cost increases (2004–13, real percentage change) Pro-growth immigration 6 Product market regulation index Grey and female labour-force participation ï° Services Trade Restrictiveness Index (degree to which policies restrict trade) Further openness to trade Intra-European services exports (% of GDP) ï± -0.3% -14.1% Cyprus Enhanced % long-term unemployment (% of total labour-market unemployment) flexibility Employment protection index (index of total collective and individual dismissals) NOTE: Luxembourg and Malta excluded from analysis as outliers; not all countries have rankings for all metrics. SOURCE: McKinsey Global Institute European Growth scorecard model; McKinsey Global Institute analysis McKinsey Global Institute A window of opportunity for Europe 35 . Box 3. Taxation and incentives A critical part of any discussion on growth is the impact of tax systems and how they shape incentives. There is a strong case for tax reform in Europe as a complement to the competitiveness growth drivers discussed in this chapter, and to accentuate their impact on growth. Tax systems that are fair, transparent, and involve minimal distortions to economic decisions are the most supportive of economic growth. On average, European governments take a larger share of national annual output in the form of taxes than governments in other countries (Exhibit 27).
France, Italy, and Sweden, for instance, each collect more than 40 percent of their respective GDP in taxes compared with less than 30 percent in Australia, South Korea, and the United States. Of the European countries that are members of the OECD group of developed economies, only three—Ireland, Slovakia, and Switzerland—have a tax take of less than 30 percent of GDP. There is no strong pattern in the types of taxes collected in Europe. For instance, 62 percent of Denmark’s tax revenue comes from levies on income and profits, while in Hungary that share is only 17 percent.
Effective tax rates on gross income in many Western European countries are higher than in other OECD economies. For example, the effective tax rate on an annual gross income of $300,000 is more than 50 percent in France and Italy, compared with around 30 percent in the United States.1 The reason for this difference is that Denmark, France, Portugal, and Sweden, among others, have marginal personal income tax rates of close to or more than 50 percent for top earners. 1 KPMG’s individual income tax and social security rate survey 2012, KPMG International, October 2012. Exhibit 27 European governments typically take a greater share of total output in taxation than those in other developed economies Public-sector tax take by type of tax, 2012 % 44 4 Other Property 43 Social security and payroll 42 1 Goods and services 3 36 1 14 18 Type of tax Income and profits 33 13 4 32 1 11 12 15 Sweden 11 3 28 3 5 7 Germany United Poland Kingdom 5 9 10 Spain Canada 27 2 1 9 8 8 Japan South Korea 2. Reform—much of it national—can deliver growth 3 5 12 Australia United States Selected non-European countries SOURCE: OECD; McKinsey Global Institute analysis 24 4 16 9 NOTE: Numbers may not sum due to rounding. McKinsey Global Institute 7 14 12 11 Selected European countries 36 30 8 12 Italy 3 12 10 14 11 31 12 11 France 2 14 6 10 32 .
How countries design taxation systems is crucial to their success. It is important, for example, to minimise the degree of distortion on decisions made by different actors in an economy on labour, capital, and technological advancement. Property and consumption taxes are generally regarded as involving the fewest distortions, and therefore the lowest negative impact on growth.16 In contrast, corporate and income taxes are less conducive to growth because they can potentially discourage entrepreneurial activity and encourage capital outflow. By avoiding distortions, taxation can increase the overall impact of the 11 competitiveness growth drivers by not creating incentives that work at cross-purposes to the reforms themselves, such as encouraging capital flight or decreasing the level of innovation and entrepreneurship in the economy. Governments inevitably have to balance many competing objectives, some of which may be inimical to achieving growth.
A comprehensive view of all the relevant trade-offs is important. For instance, a critical element of making the labour market more flexible—and, indeed, helping workers realise a better standard of living—is to reduce taxes on labour incomes. This reform is necessarily considered in isolation in this report. But it is likely to have knockon effects in the broader economy by forcing governments to either raise taxes elsewhere to maintain the same fiscal balance or to take on additional debt. Both responses will have social consequences. Another key ingredient of well-functioning taxation systems is that they are responsive to the concerns of stakeholders and feature a high degree of cooperation among governmental bodies to reduce compliance costs.17 There is significant opportunity for some European economies to improve compliance.
For instance, while it takes only 63 hours on average to comply with taxes (three major types of taxes: the corporate income tax, the value added or sales tax, and labour taxes) in Switzerland, it takes 413 hours in the Czech Republic and 454 hours in Bulgaria.18 Effective tax systems also need to be highly transparent not only to ensure public trust in the system but also to make it easier to tackle tax evasion and avoidance and therefore maximise revenue. Effective tax systems reduce complexity as much as possible. The administrative burden and complexity of a tax system may have a stronger negative correlation on economic growth than the actual level of business taxation.19 See Jens Arnold, Do tax structures affect aggregate economic growth? Empirical evidence from a panel of OECD countries, OECD economics department working paper number 643, October 2008, and Frank Zipfel and Caroline Heinrichs, The impact of tax systems on economic growth in Europe: An overview, DB Research, Deutsche Bank, October 2012. 17 Principles of good tax administration—practice note, OECD Committee of Fiscal Affairs Forum on Strategic Management, Centre for Tax Policy and Administration, OECD, amended May 2001. 18 Paying taxes 2013: The global picture, PricewaterhouseCoopers and the World Bank/International Finance Corporation, November 2013.
The data cover taxes payable by businesses, measuring all taxes and contributions that are government-mandated. 19 Ibid. 16 McKinsey Global Institute A window of opportunity for Europe 37 . We now describe each of the 11 competitiveness growth drivers in detail and briefly discuss the importance of growth-oriented tax systems as an enabler to these reforms. 1. NURTURING ECOSYSTEM FOR INNOVATION Innovation—the invention and adoption of new business models, products and processes— has driven a large share of the astonishing productivity gains the world has experienced since the first industrial revolution in the mid-18th century.20 For advanced economies where the potential for further productivity gains from the adoption of existing technologies is limited, and where companies can compete against lower-wage countries only by developing new high-value products or processes, innovation is vital for growth.21 For Europe’s lower-income economies, disseminating innovations is crucial if they are to continue to close the gap with their wealthier neighbours. Europe's private R&D spending is 1.3% 2.7% of GDP vs. in South Korea Comparing Europe as a whole with the world’s most innovative economies reveals a mixed picture. Europe’s innovation enablers—its education and research systems—are broadly in line with those of South Korea, Japan, and the United States. Public R&D expenditure is also in line with that of leading countries.
But some metrics of private-sector innovation lag behind. Europe’s private sector spends 1.3 percent of GDP on R&D, below South Korea at 2.7 percent, the United States at 1.8 percent, and China at 1.4 percent. One of the more tangible ways Europe can encourage innovation is by using government procurement. This approach has a successful track record.
One example is the way procurement by the US Department of Defense spurred the development of semiconductors. European governments spend at least 5 percent of GDP on procurement, compared with only 0.7 percent on public R&D and 0.1 percent on subsidies for privatesector R&D. Other measures that Europe can consider to nurture innovation are deepening the Single Market in services and digital to enable fast-growing companies to scale up more effectively, setting Europe-wide standards for transformational technologies, unblocking barriers to entrepreneurship and accepting “creative destruction” of industries, establishing standards and platforms for open data that extend to private-sector data sets, and enhancing digitisation across the public and private sectors.
Action on these fronts could accelerate Europe’s GDP-growth rate by 0.26 percentage points.22 Where Europe stands Innovation relates to new technologies, products, and processes or to new ways of doing business—ranging from radically original ideas to incremental improvements, and conducted by the public or the private sector. The impact of innovation depends on the degree to which ideas developed in one company or country spill over to other sectors and therefore to overall economic growth (see Box 4, “Varieties of capitalism = varieties of innovation?”).23 Robert J. Gordon, Is US economic growth over? Faltering innovation confronts the six headwinds, NBER working paper number 18315, August 2012. 21 Global competitiveness report 2014–2015, World Economic Forum, September 2014. 22 This estimate is based on historic correlations between R&D expenditure and growth in total factor productivity for the richest 15 European countries and assumes that this set of countries increased R&D expenditure to the same level as the United States. 23 Alvaro Escribano, Andrea Fosfuri, and Josep A.
Tribó, “Managing external knowledge flows: The moderating role of absorptive capacity”, Research Policy, volume 38, issue 1, February 2009. 20 38 McKinsey Global Institute 2. Reform—much of it national—can deliver growth . Box 4. Varieties of capitalism = varieties of innovation? The literature on different forms of capitalism illustrates the high degree to which the structure of a national economy can drive the type of innovation that occurs. According to the political economists Peter Hall and David Soskice, coordinated market economies such as Germany and South Korea tend to promote incremental innovation within companies, while liberal market economies such as the United Kingdom and the United States tend to be more favourable to disruptive innovation by entrepreneurs. The industrial structure, financial sector, labour markets, and government policy all have a role to play.1 Coordinated market economies tend to be dominated by private, often family-held, companies rather than ones that are publicly listed.
Germany’s large Mittelstand sector of small and medium-sized enterprises (SMEs) and South Korea’s chaebol conglomerates are examples. Commercial banks are the principal source of funding for these businesses and often are closely involved in investment decisions. Companies can take a longer-term view on R&D and other investments than corporations whose financing tends to hinge on quarterly results.
Leaders of South Korea’s Hyundai automotive business, for example, set their long-term strategy over a 30- to 50-year horizon with the aim of becoming the leading carmaker by 2050.2 Coordinated market economies tend to have a relatively high degree of labour-market regulation and a strong sense of loyalty among employees to their employers; long experience and deep expertise in one company can enable incremental innovation. The success of Germany’s Mittelstand companies is often founded on such incremental but continuous improvement of existing technologies. Liberal market economies, in contrast, are more conducive to short-term, radical innovation than to longer-term incremental investments. These economies tend to use capital markets as the main source of funding for businesses and to have few restrictions on mergers and acquisitions (M&A). Pharmaceuticals and biotechnology is one sector in which companies are increasingly treating strategic M&A activity—the acquisition of smaller companies with attractive products or technology portfolios—as a substitute for in-house R&D.
Liberal market economies also tend to have flexible labour markets with low degrees of employment protection and generally shorter job tenures. A start-up with a breakthrough idea can easily receive large amounts of venture funding, scale its workforce up and down, and start afresh when an idea fails. The success of many Silicon Valley start-ups was enabled by this liberal institutional framework. Peter A.
Hall and David Soskice, eds., Varieties of capitalism: The institutional foundations of comparative advantage, Oxford University Press, 2001; OECD reviews of innovation policy: Korea 2009, OECD; German Federal Ministry of Education and Research. 2 Manufacturing the future: The next era of global growth and innovation, McKinsey Global Institute, November 2012. 1 McKinsey Global Institute A window of opportunity for Europe 39 . 5 European economies in top 10 most innovative in world Despite broad agreement on what innovation looks like and why it is important to an economy, measuring performance on innovation is notoriously difficult. Two widely used rankings of innovation come from the WEF and the European Commission. The WEF’s 2014–2015 Global Competitiveness Index ranks five European economies among the ten most innovative in the world. Finland and Switzerland rank first and second, and Germany, Sweden and the Netherlands occupy ranks six to eight.
However, many other European economies score much lower. For instance, Bulgaria ranks 105th out of 144 countries on the index.24 The European Commission’s Innovation Union scoreboard 2014, which assesses seven dimensions of innovation, indicates that the EU overall is outperformed by Japan, South Korea, and the United States on private-sector R&D, and by the United States on entrepreneurship (Exhibit 28). While China still ranks below the EU today, its performance has improved markedly over the past five years, narrowing the gap.25 Exhibit 28 Europe is being outperformed most markedly on private-sector innovation efforts including corporate spending on R&D and entrepreneurship EU innovation performance competitors Normalised EU performance relative to the United States, South Korea, and Japan (EU performance shown as % difference) United States Educational attainment1 EU underperforms (>30 p.p.) EU outperforms (>30 p.p.) South Korea Japan -12 -11 -20 Enablers Research systems2 Public-sector R&D Innovation process Private-sector R&D3 Entrepreneurship4 Innovation outcomes Cluster development5 Economic impact6 58 12 -24 1 -15 1 -51 -53 -29 20 19 -33 -24 -9 -21 33 1 -11 1 Average of the share of new doctorate graduates per 1,000 of the population aged 25–34 plus share aged 30–34 that has completed tertiary education. 2 Average of the share of international scientific co-publications per million of the population and the share of scientific publications among the top 10% of most cited publications worldwide as a percentage of the country’s total scientific publications. 3 Patent Cooperation Treaty patent applications per billion dollars of GDP. 4 Global Entrepreneurship and Development Institute (GEDI) index on entrepreneurial attitudes, aspirations, and activity. 5 Global Innovation Index survey results on the state of cluster development and collaboration among firms. 6 Average of the contribution of medium and high-tech product exports to the trade balance, knowledge-intensive services exports as percentage of total services exports, and license and patent revenue from abroad as a percentage of GDP. SOURCE: Innovation Union scoreboard 2014, European Commission, March 2014; Global Innovation Index; GEDI Index, Global Entrepreneurship and Development Institute; McKinsey Global Institute analysis Ibid.
The innovation pillar of the WEF’s Global Competitiveness Index focuses on technological innovation. Non-technological innovation is reflected in the skills, know-how, and working conditions of organisations and is reflected in different pillars of the index. 25 Innovation Union scoreboard 2014, European Commission, March 2014. 24 40 McKinsey Global Institute 2. Reform—much of it national—can deliver growth . The 2 percent of GDP that Europe spends on R&D is lower than in Australia, Japan, South Korea, and the United States (Exhibit 29). This share increased by only 0.2 percentage points between 2003 and 2012, driven by increased R&D spending by Central and Eastern Europe and the Baltic countries. The EU has a target of spending 3 percent of GDP on R&D, but only two European countries—Finland and Sweden—have consistently kept their expenditure above this threshold. On average, Central and Eastern Europe and the Baltic countries spend only 1.1 percent of GDP on R&D.
It is notable that China already outperforms most European countries, spending 1.9 percent of its GDP on R&D, and is on track to overtake the performance of Europe as a whole on this measure of innovation within a few years. In 2013, China surpassed Germany on the number of international patent applications filed with 21,000 compared with 17,900 filed by Germany. On this measure, China now ranks third in the world behind the United States (57,200 filings) and Japan (43,900).26 Exhibit 29 Europe has a significant R&D gap with South Korea, Japan, and the United States, caused primarily by a shortfall in private-sector R&D R&D spending by country and source, 2012 % of GDP Total Business sector1 Public sector2 3.6 South Korea 3.3 Japan United States 0.5 1.4 1.7 1 Including private not-for-profit (0.02% in Europe). 2 Government and higher education. NOTE: Numbers may not sum due to rounding. 0.7 1.3 1.9 Canada 0.9 1.3 2.0 China 0.7 1.8 2.1 Europe-30 0.7 2.6 2.6 Australia 0.9 2.7 0.8 0.9 -1.6 -1.5 -0.1 SOURCE: Innovation Union scoreboard, European Commission, 2014; McKinsey Global Institute analysis Private companies account for two-thirds of European R&D expenditure, and it is their relatively low spending that accounts for virtually the whole of Europe’s R&D spending gap with the world’s top innovators.
Europe’s public-sector R&D spending at 0.7 percent of GDP is in line with that of other countries. However, the continent’s private-sector R&D at 1.3 percent of GDP is significantly lower than in South Korea at 2.7 percent, Japan’s 2.6 percent, and 1.8 percent in the United States. Ninety percent of the overall gap in R&D spending between the Europe-30 and South Korea, the leading performer, is due to lower private-sector spending. We draw on filings for patent application under the Patent Cooperation Treaty compiled by the World Intellectual Property Organization. 26 McKinsey Global Institute A window of opportunity for Europe 41 .
Within Europe more generally, about 70 percent of private-sector R&D expenditure is concentrated in large corporations that have more than 500 employees.27 An analysis of the 2,000 biggest companies in terms of spending on R&D shows that some sectors in Europe lead the world. In absolute terms, European pharmaceuticals and biotechnology companies, at €42 billion, spent as much on R&D in 2012 as their counterparts in the United States and four times as much as Japanese firms. More than half of this spending was by just five Swiss, French, and British pharmaceuticals companies. German corporations are the world’s biggest R&D spenders in automobiles and parts.
Overall, European companies in the automotive sector spend more than three times as much as US companies and 50 percent more than Japanese companies in this sector at €39 billion. Just four German companies—Volkswagen, Daimler, Robert Bosch, and BMW—spend more on R&D than automotive companies in any other single country put together, apart from Japan. Indeed, these four German automotive companies together contributed more than one-third of all German private-sector R&D spending in 2012. 4 Silicon Valley giants spend more on R&D than all European tech companies combined However, European companies lag behind those of other countries in some sectors. In technology hardware and equipment, for instance, European companies invest only €16 billion, one-third of what US companies spend.
In software and computer services, European firms spend only €6 billion, one-sixth of what their US counterparts spend. In technology, four Silicon Valley giants—Intel, Cisco, Qualcomm, and Hewlett-Packard— spend more on R&D than all European tech companies combined. In this sector, the leading European countries are Finland, the Netherlands, and Sweden, but all of them rank below China, Japan, Taiwan, and the United States.
In electronics and electrical equipment, the fifth-most R&D-intensive industry, Japan and South Korea rank ahead of Europe. Despite its relatively low spending on R&D in several key sectors, Europe still benefits from a high propensity to adopt innovations from other countries. Google and Amazon are US companies, but the United Kingdom leads the world in e-commerce, with online retail having a higher share of total retail than in the United States. The foundation of the success of some of Europe’s largest technology start-ups, such as Berlin-based Rocket Internet, has been in bringing US inventions to European markets and then adapting them.
In Sweden and the United Kingdom, MGI research has found that the contribution of the Internet to GDP is significantly higher than it is in the United States. In France and Germany, the contribution of the Internet to GDP is not far behind that in the United States.28 <5% of Europeans committed resources to new business in 2013 R&D spending is one important part of the innovation story; the other—where Europe lags behind other economies—is fostering entrepreneurship. The picture is mixed.
On average, Europe is less inclined towards entrepreneurship than the United States and Canada but is more entrepreneurial than Japan or South Korea, the world’s leading R&D investors. According to the Global Entrepreneurship Monitor in 2013, the percentage of European adults who considered entrepreneurship an interesting career path and who thought about starting a business in the next three years was broadly similar to the share in Canada and the United States. However, less than 5 percent of Europeans actually committed resources to a new business, compared with 8 percent of Canadians and 9 percent of Americans. Consequently, less than 10 percent of Europeans surveyed currently owned and managed a business, compared with 13 percent of Canadians and 11 percent of US adults. Ibid. The estimate of concentration in large companies is based on data for 14 European OECD countries. Internet matters: The Net’s sweeping impact on growth, jobs, and prosperity, McKinsey Global Institute, May 2011. 27 28 42 McKinsey Global Institute 2.
Reform—much of it national—can deliver growth . One factor that appears to be deterring Europeans from being entrepreneurs is fear that their business might fail—39 percent of Europeans who perceive good opportunities to start a business fear that they will fail, compared with 35 percent of Canadians and 31 percent of US citizens.29 Strict bankruptcy requirements probably contribute to this sentiment. While US bankruptcy rules discharge the affected party from debts in less than a year and Canadian rules in a maximum of two years, repayment obligations in Europe range from one year in the United Kingdom to three years in Belgium, six years in Germany, and more than nine years in France.30 15–20% of respondents in OECD survey cited finance access problems as bar to entrepreneurship Lack of access to finance is another hurdle deterring more Europeans from owning their own businesses, and expanding when they do. An OECD survey conducted in 2012 found that 15 to 20 percent of respondents cited difficulties accessing finance as the main reason that they could not envisage themselves being self-employed within the next five years.31 Moreover, since the global economic crisis in 2008, it has become more difficult for young companies to secure later-stage venture-capital funding once they have become established. In 2013, only around €4 billion of venture capital was raised, compared with €8.2 billion in 2007. The situation is most difficult for companies after the seed stage. Only about 40 percent of the companies that received seed or start-up capital in 2013 also received later-stage venture funding, compared with 70 percent before the crisis.32 Government agencies have tried to compensate for the decline of European venture capital—and today provide one-third of all venture finance—but have not been able to fully offset it.33 European companies can also do more to embrace the digital technologies that are increasingly crucial for success in an ever-more-connected world in which more and more consumers prefer buying and selling and browsing online, which cuts costs and saves time. Companies need to prioritise which areas to digitise, taking into account the perspective of their customers (or citizens in the case of governments), underpinned by future-proofed IT architecture.34 Europe lags behind the United States on private investment, especially in technology-heavy sectors (Exhibit 30).
This has translated into dramatically different outcomes between the United States and Europe. The United States has produced far and away more companies with a market capitalisation of greater than $1 billion over the past 20 years, even accounting for its relative size. The largest US tech companies are also disproportionally bigger than those of any other nations.
This may be attributable in part to much higher levels of venturecapital and growth-stage funding, a type of funding that is particularly applicable for tech start-ups. This type of funding is equivalent to 0.31 percent of GDP in the United States compared with less than 0.1 percent in most European countries. There are some reasons for optimism in Europe, however.
Existing entities such as the European Investment Fund can be leveraged to encourage innovation and entrepreneurship across Europe. This fund is a major venture capital and innovation investor in Europe, with around €3 billion in subscribed capital by the end of 2013. In addition, other innovative new financing options are emerging.
For instance, the Banque publique d'investissement, or BPI, a development bank in France, aims to finance and stimulate growth in SMEs by providing soft loans for innovation, guarantees and risk-sharing in support of bank financing, and private equity José Ernesto Amorós and Niels Bosma, Global Entrepreneurship Monitor 2013 global report: Fifteen years of assessing entrepreneurship across the globe, Global Entrepreneurship Research Association, 2014. 30 European Commission Judicial Network. 31 Entrepreneurship at a glance 2013, OECD, July 2013. 32 See Enhancing Europe’s competitiveness: Fostering innovation-driven entrepreneurship in Europe, World Economic Forum, June 2014. 33 European Private Equity Activity Data 2007–2013, European Venture Capital Association. 34 McKinsey & Company Digital Practice. Also see Global flows in a digital age: How trade, finance, people, and data connect the world economy, McKinsey Global Institute, April 2014. 29 McKinsey Global Institute A window of opportunity for Europe 43 . investments, along with co-financing loans and partnerships with commercial banks and other financial institutions. To close the competitiveness gap with the United States in the technology sector, Europe needs more of this kind of large-scale public co-financing of risk capital for new ventures. Exhibit 30 Europe needs to step up procurement and financing of innovation R&D spending by type and area1 % of GDP US R&D spending 2.6 Public gap 0 Private tech gap -0.7 Private other gap 0.2 Europe R&D spending 2.0 Companies founded in past 20 years with market capitalisation greater than $1 billion Companies per million people Peak market valuation of largest Internet company by country $ billion United States United States Germany 1.28 0.06 410 China 200 Israel United Kingdom 13 10 Sweden United States Sweden United Kingdom Germany 0.31 0.09 0.06 0.03 7 Germany Venture capital and growth investments % of GDP, 2012 7 Potential initiatives â–ª Emulate the funding model of the French development bank Banque publique d'investissement, or BPI. The bank aims to finance and stimulate growth of SMEs â–ª Deepen the Single Market and set Europe-wide standards and regulations for transformational technologies â–ª Adopt EU-level procurement of innovative e-government, health care, security, and education solutions on the order of 1% of GDP 1 Defined as private R&D spend in the pharmaceuticals and biotech, technology hardware and equipment, and software and computer services sectors. NOTE: Numbers may not sum due to rounding. SOURCE: The Economist, July 2014; McKinsey Global Institute analysis 44 McKinsey Global Institute 2. Reform—much of it national—can deliver growth . 16 days on average to start company in Central and Eastern Europe vs. 3 in Australia Regulation plays a part in the disparity between Europe and other regions, too. Take, for example, how many days it takes to start a business. In Australia, it takes three days; in the United States, six. But it takes 14 days on average in Continental European countries and 16 days in Central and Eastern European ones.
The process is quickest in the Baltic and Nordic countries, but even there, starting a business takes seven days on average. Moreover, regulatory burdens often increase sharply as microenterprises grow into SMEs. Once a company in France employs more than 49 people, it needs to comply with six additional types of social regulation and two additional accounting regulations, including a requirement to establish work councils with labour union delegates as well as health and safety committees. In 2005, France had more than 1,600 non-agricultural retailers with 49 employees, but only 680 companies with 50 employees. A similar picture can be found in manufacturing with 310 companies employing 49 employees vs.
160 companies employing 50.35 In Italy, a large number of businesses do not grow past 14 employees, since Article 18 of the country’s “workers’ statute” places a range of obligations on companies employing 15 people or more. “Smart” regulation can, however, encourage companies to accelerate the development of innovative products. Since the early 1990s, many OECD countries have introduced a combination of voluntary standards and compulsory requirements to promote improvements in the energy efficiency and environmental performance of products, from washing machines and refrigerators to lighting and information and communications technology (ICT) equipment. Sceptics of such reforms claimed that such measures would impose significant costs on producers and drive prices up for only marginal performance gains.
On the contrary, by driving innovation through a balanced mix of regulatory measures, these policies led to efficiency gains of 10 to 60 percent across a range of products, alongside real price declines of 10 to 45 percent.36 Scaling up new businesses from microenterprises into larger companies is challenging in Europe. While the continent is home to many microenterprises with fewer than ten employees, only a fraction of these are successful in building up their size. Europe has four microcompanies for every 100 people in the population compared with 3.5 in the United States.
Most of these microenterprises operate in retail, hospitality, and other low-growth industries. In stark contrast, the United States has 1.1 companies with more than ten employees per 100 people compared with only 0.4 in Europe.37 Testament to the dominance of long-established, rather than entrepreneurial, businesses, more than one-third of Europe’s largest companies today were founded in the 19th century (Exhibit 31).38 Nila Ceci-Renaud and Paul-Antoine Chevalier, “L’impact des seuils de 10, 20 et 50 salariés sur la taille des entreprises françaises”, Économie et statistique, number 437, March 2011; and Luis Garicano, Claire LeLarge, and John Van Reenen, Firm size distortions and the productivity distribution: Evidence from France, NBER working paper number 18841, February 2013. 36 Jacques Pelkmans and Andrea Renda, “Does EU regulation hinder or stimulate innovation?” Regulatory Policy, Centre for European Policy Studies special report number 96, November 2014; Mark Ellis, Experience with energy efficiency regulations for electrical equipment, OECD/International Energy Agency, August 2007. 37 Entrepreneurship at a glance 2013, OECD, July 2013. 38 Capital IQ, Breugel, and MGI analysis of the 480 largest European companies by revenue. 35 McKinsey Global Institute A window of opportunity for Europe 45 . Exhibit 31 Large companies in Europe are, on average, older than those in the United States Number of large companies by founding date1 Top 1,000 US and European companies by revenue as of August 11, 2014 United States Before 1800 6 1801–25 6 12 1851–75 1976–2014 -8 -41 52 -39 45 89 1951–75 +27 59 67 84 1926–50 +3 57 93 1901–25 +9 19 30 1876–1900 +6 15 16 1826–50 Europe vs. United States Europe -38 51 189 110 -79 1 Top 1,000 US and European companies by revenue. SOURCE: Capital IQ; Breugel; McKinsey Global Institute analysis Initiatives to change the game A set of policies to nurture innovation could accelerate overall European GDP growth by 0.26 percent a year. This estimate is based on historic correlations between R&D expenditure and growth in total factor productivity for the richest 15 European countries, and assumes that this set of countries increase R&D expenditure to the same level as the United States.39 This estimate of the potential impact on GDP growth is likely to be somewhat conservative as the returns to innovation grow in today’s less wealthy European economies where additional R&D spending is vital if they are to attain the per capita GDP levels of the wealthiest European economies. Policies to nurture innovation could accelerate overall European GDP growth by 0.26 percent a year. 39 46 Using a 65-country sample panel for 1965 to 2005, Claudio Bravo-Ortega and Álvaro Garcia estimated that a 10 percent increase in R&D per capita generates an average increase in total factor productivity (TFP) of around 1.6 percent. Due to the large gap in per capita R&D expenditure between the United States and most European countries, these coefficients imply that reaching US R&D levels in the richest 15 European countries would increase overall European TFP growth by 1.2 percent per year over the next decade. If all Europe-30 economies matched US per capita spending on R&D, their aggregate GDP growth could be as high as 1.7 percent.
If the Europe-30 matched South Korean R&D spending, incremental GDP growth would be 0.3 percent. See Claudio Bravo-Ortega and Álvaro Garcia, “R&D and productivity: A two way avenue?” World Development, volume 39, issue 7, July 2011. McKinsey Global Institute 2. Reform—much of it national—can deliver growth .
Governments can be effective in stimulating innovation across the innovation value chain from the initial development of new ideas to their commercialisation and adoption. While much of the focus has been on incentivising innovation at its source—through R&D subsidies—there is increasing recognition that interventions further down the value chain can be at least as effective, if not more so.40 Among the imperatives that we see as most important are the following: ƒƒ Deepen the Single Market. European governments can help to spur overall adoption by widening and deepening the market for innovative products. Many European policy makers, including the European Commission, have argued that completing the Single Market is one of the most powerful levers to promote innovation in Europe.
Doing so would not only expand the customer base for innovative products but also promote innovation spillovers between companies and entrepreneurs.41 ƒƒ Set Europe-wide standards and regulations for transformational technologies such as Industry 4.0. Beyond dismantling the barriers to a fully integrated European Single Market, policy makers could be proactive in their use of pan-European standards and regulations to make the market for innovative technologies both more predictable and more integrated. Such standards and regulations will have the most impact in industries with significant scale economies, including network effects, or where the production process is capital-intensive as it is in the manufacture of autonomous vehicles.
Previous MGI research has identified 12 transformational—or disruptive— technologies that governments could promote more than they do now.42 For example, the Internet of Things—the embedding of sensors in physical objects—could be advanced through European technology standards to enable interoperability between sensors and computers. In the transport sector, for instance, EU countries have already agreed on common standards for communication between cars and traffic infrastructure in certain areas. Further standards are needed to increase road efficiency, safety, and the environmental sustainability of driving.
For instance, European policy makers could consider putting in place a common legislative and regulatory framework that would govern autonomous vehicles. Individual countries are already pioneering change in this area. In the absence of EU legislation or standards, the United Kingdom is contemplating enacting a legal framework to allow the testing and deployment of autonomous vehicles on public roads.43 ƒƒ Gear public procurement spending, including defence spending, towards supporting innovation.
European governments spend at least 5 percent of GDP on procurement compared with only 0.7 percent on public R&D and 0.1 percent on subsidies for private-sector R&D. Public procurement can therefore be a potent tool for incentivising innovation. However, opportunities to use procurement to drive innovation are not always fully realised for a number of reasons.
Incentives are often not aligned, with procurers tending to favour low-cost, low-risk solutions even if greater long-term benefits can be derived by testing and procuring new technologies. The public authorities responsible for purchasing often lack in-depth knowledge of the new technologies available, while overly complex procurement procedures can be discouraging, particularly to SMEs.44 Demand-side innovation policies, OECD, May 2011. Simon Tilford and Philip Whyte, eds., Innovation: How Europe can take off, Centre for European Reform, July 2011. 42 Disruptive technologies: Advances that will transform life, business, and the global economy, McKinsey Global Institute, May 2013. 43 Chandrika Nath, Autonomous road vehicles, Houses of Parliament PostNote number 443, September 2013, amended April 2014. 44 Jacques Pelkmans and Andrea Renda, “Does EU regulation hinder or stimulate innovation?” Regulatory Policy, Centre for European Policy Studies special report number 96, November 2014. 40 41 McKinsey Global Institute A window of opportunity for Europe 47 . Despite these challenges, several European governments have already shown how public procurement can be used to further innovation in areas where society faces challenges, including the ageing of the population and the degradation of the environment, and in public services such as health care and transport.45 In Belgium, for instance, through the Flemish pre-commercial procurement initiative, public entities procure R&D services before launching conventional open tenders for the final procurement of the resulting product or services. Projects that have emerged from this approach include a digital book platform for public libraries and an eye screener to detect amblyopia among children.46 Another example is the Nordic Lighthouse Project on Public Procurement and Health Care, through which the five Nordic countries hold joint cross-border public tenders with public health-care providers for innovative solutions in this sector. Projects that have come to fruition as part of this scheme include PVC-free blood bags and “intelligent” hospital beds.47 The City of Vienna’s online platform for procurement, “WienWin”, connects local innovators with procurement officials in the city’s government and public services. The procurement officers act as pilot customers who can refer successful products to private-sector buyers.
Projects that have been developed using this approach include resource-efficient street lights and water-saving drip irrigation for public gardens.48 >€5B One way to bridge the gap in private-sector investment in R&D is through tax incentives, increasingly in use in OECD economies. For example, France’s Crédit d’impot recherche (CIR) offers a tax break amounting to a 30 percent refund of R&D expenses on the first €100 million invested and a 5 percent refund beyond that. France refunded more than €5 billion through this mechanism in 2012.
Although the majority flowed to large corporations, 29 percent of this funding benefited SMEs. refunded through French tax incentives in 2012 In the United States, the most prevalent form of innovation-promoting public procurement is in the defence sector. Between 1974 and 1995, for instance, the US Department of Defense invested approximately $10 billion in the Global Positioning System.49 GPS was first made available for civilian aircraft and quickly found other uses in consumer and business applications. Thanks to open GPS data, entire new industries in GPS and mapping services have developed, including surveying, automotive navigation, and precision agriculture.
In 2013, revenue from Global Navigation Satellite Systems totalled about €50 billion. Location-based services on smartphones are beginning to overtake automotive navigation systems as the largest market segment in terms of revenue.50 Defence spending in Europe is much lower than in the United States. In 2012, the 27 members of the European Defence Agency spent €190 billion, or 1.5 percent of GDP, on defence; the equivalent number for the United States was €500 billion ($645 billion), 4.4 percent of GDP.
Within this overall defence budget, defence procurement in Europe is still an important lever for procuring innovation. European countries could increase their effectiveness in this regard by creating an open and competitive single market in defence.51 Andrea Petrella, Fostering innovation through public procurement: Rationale, implementation and best practice in Italy and Europe, Bank of Italy Regional Economic Research Department, 2013; Demand-side innovation policies, OECD, May 2011. 46 Innovatief Aanbesteden. 47 Norden.org. 48 WienWin.at. 49 Scott Pace et al., The Global Positioning System, Rand Corporation, 1995. 50 GNSS Market Report, October 2013. 51 The 27 members of the European Defence Agency are the 28 EU member states except Denmark. See Ian Bond, The EU and defence procurement, Centre for European Reform, January 2014. 45 48 McKinsey Global Institute 2.
Reform—much of it national—can deliver growth . ƒƒ Unblock the barriers to entrepreneurship and accept “creative disruption” across sectors. The United Kingdom offers many aspects of best practice on promoting entrepreneurship in Europe. It is attracting entrepreneurial talent from overseas by offering a “start-up” visa for immigrants. The personal risks associated with entrepreneurship are much lower than in other countries; repayment obligations under bankruptcy last only one year (compared with France’s nine to ten years, as we have noted).
Moreover, the United Kingdom has facilitated access to seed and growth finance for entrepreneurs, putting in place a seed enterprise investment scheme that provides tax breaks to early-stage investors and relaxing the barriers to stock exchange listings. Similar measures to promote entrepreneurship have been suggested and debated across the continent. If European policy makers want to promote entrepreneurship, however, it is essential that an underlying issue be resolved. Joseph Schumpeter famously argued that the emergence of innovative firms is inseparably intertwined with the decline of uncompetitive incumbents—a process known as creative destruction.52 Some 65 years later, recent experience suggests that many European policy makers are still reluctant to accept creative destruction.
An example of this discomfort includes the attempt to ban Uber travel-sharing services in Germany and many other countries. Such barriers to entry by new players need to be lowered if entrepreneurship is to flourish in Europe. 2,500 data sets open in United Kingdom in 2009 and 10,000 in 2013 ƒƒ Establish standards and platforms for open data in the private as well as the public sector. Open government data is already providing significant opportunities for innovation and new business ideas.53 The United States pioneered open data by making weather and GPS data freely available, spurring the development of navigation systems, weather newscasts, location-based applications, precision farming tools, and other applications. An executive order in 2013 required that the new default for government information is to be open and machine-readable except where this would jeopardise privacy, confidentiality, or national security.54 The United Kingdom established an Open Government Data initiative in 2009 and is pioneering the publishing of data on a full range of maps, land ownership, census, government budget and spending, company registers, legislation, public transport, international trade, health care, education, crime, environment, and election results.
In 2009, 2,500 data sets were open; by 2013, this tally had grown to 10,000. The next horizon is for governments to establish standards and platforms in collaboration with the private sector to provide open access to anonymised private-sector data sets. One idea would be to introduce the concept of “data patents”—the right of companies to keep proprietary data to themselves for a number of years with a requirement to subsequently make them publicly available in an anonymised and machine-readable format. There is already growing interest among companies in publishing their data for purposes of open innovation. In 2006, for example, the video streaming company Netflix published more than 100 million anonymised user ratings and launched a competition for the best predictive algorithm for these ratings, leading to a more than 10 percent improvement in its predictions.55 Simon Tilford and Philip Whyte, eds., Innovation: How Europe can take off, Centre for European Reform, July 2011. 53 Open data: Unlocking innovation and performance with liquid information, McKinsey Global Institute, October 2013. 54 Executive order: Making open and machine readable the new default for government information, US White House, May 9, 2013. 55 www.netflixprize.com. 52 McKinsey Global Institute A window of opportunity for Europe 49 .
ƒƒ Embrace digitisation across the public and private sectors. Digitisation is reshaping the rules of competition in the private sector with many well-established incumbents at risk of being left behind in the face of competition from digitally savvy and nimble new entrants. Digital technologies are a powerful tool for lowering barriers to market entry across sectors and regions. Digitally enabled new players can scale up rapidly at a lower cost than those companies or organisations with legacy technologies, and enjoy higher returns as network effects accelerate.56 Digitising on a large scale in both the public and private sectors will be a crucial part of any efforts to boost European innovation.
In the private sector, digitisation drives innovation by enabling new business or operating models such as rapid product design and testing or smarter customer service. It also enables superior management decisions through the use of algorithms to crunch big data from social technologies, freeing up resources to focus on more creative efforts. Companies should take full advantage of the opportunities offered by digital sales channels to reduce costs, increase efficiency, and offer broader access to new markets.57 Digitisation in the public sector is very important for similar reasons. Customers and citizens increasingly demand easy-to-use digital services when they interact with public agencies.
Embracing digitisation in the public sector can also boost performance and productivity by minimising inefficient work, and freeing up resources. Most companies—and governments—recognise the power of digital technologies, but embedding these fully will require coordination. The first step is to ensure that businesses, governments, and citizens have reliable access to high-speed Internet. Second, there will be a need for more training to establish a “digital-first” attitude and provide the advanced skills required to take advantage of these technologies. In many European countries (as in other regions) the share of “knowledge” workers is rising—they need to be fully equipped.
European countries can measure their progress on digitisation using metrics such as the European Commission’s Digital Economy and Society Index, which scores countries on various dimensions of digital performance. Martin Hirt and Paul Wilmott, “Strategic principles for competing in the digital age”, McKinsey Quarterly, May 2014. 57 European Commission Digital Agenda, Digital Economy and Society Index. 56 50 McKinsey Global Institute 2. Reform—much of it national—can deliver growth . 2. EFFECTIVE EDUCATION TO EMPLOYMENT Improving education to employment could add 0.24 percentage points to Europe's annual GDP growth Education is a foundation of labour productivity. There are many pockets of excellence in Europe’s education systems, but there are also parts of the region where the provision and quality of education is not equipping young people well enough with the skills they need in the 21st-century economy. Seventy-four percent of educators say they are adequately preparing graduates for the workforce, but only 35 percent of employers and 38 percent of students say the same.
Meanwhile, we estimate the supply-demand balance for workers with tertiary education will move from a rough balance in 2010 to a shortage of 16 million workers in 2020. Fortunately, many highly effective education systems within Europe— in Finland and the Netherlands, for instance—can provide inspiration and examples to other countries. Among the measures European leaders could consider are increasing transparency about what skills are needed and jobs are available, dual-apprenticeship models, revamping the selection and training of teachers, measurement and evaluation of schools, and putting in place forums to facilitate dialogue between employers and educators.
Such approaches could increase Europe’s annual GDP growth by 0.24 percentage points. Where Europe stands Greater educational attainment serves as a shield against unemployment for young people. Unemployment has hit all segments of young people since the economic downturn, particularly those with lower educational attainment (Exhibit 32). Unemployment in Europe among people aged 15 to 24 has historically been higher than in other developed regions, but it has soared since the global economic crisis of 2008. The average youth unemployment rate in OECD economies increased from 12.0 percent in 2007 to 16.3 percent in 2012.
In the EU, the rate jumped from 16.5 percent to 25.1 percent over the same period. This statistic may convey an overly optimistic view of the situation because it does not reflect the number of young people who are so-called NEETs—not in employment, education, or training. In 2011, Europe had 5.2 million unemployed young people and 7.5 million NEETs. Factoring in underemployment—the percentage of part-time workers who want full-time opportunities—paints an even more challenging picture. Over the past half-decade, the share of young underemployed workers has increased from 7 percent to 9 percent.
The biggest increase was in Southern Europe, where the number of young underemployed nearly doubled from 11 percent to 21 percent. Underemployment is high, around 12 percent, even in the United Kingdom and Ireland and in the Nordics, two of the betterperforming regions in Europe on youth unemployment. The importance of education is demonstrated by the fact that individuals with a tertiary education have fared better than those who are less educated across Europe. Even regions that suffered the brunt of recent economic stresses, such as Southern Europe and Central and Eastern Europe, have experienced lower rates of youth unemployment among tertiaryeducated workers. McKinsey Global Institute A window of opportunity for Europe 51 .
Exhibit 32 Youth unemployment rates are extremely high in some parts of Europe, particularly among individuals with low educational attainment Youth unemployment by educational attainment, 2013 Unemployment rates by highest level of education attained, youths aged 15–24 years, % Primary/lower secondary Upper secondary/postsecondary 37 Tertiary 27 19 14 12 20 13 19 26 25 Nordics United Kingdom and Ireland 36 23 13 12 Continental Europe 52 44 Baltics 35 40 Central and Eastern Europe Southern Europe SOURCE: Eurostat; McKinsey Global Institute analysis 4M surplus in Europe's tertiary-educated workers in 2010, vs. 16M shortage in 2020 By 2020, Europe is expected to have a surfeit of people with a secondary education but a shortage of graduates with a tertiary education (Exhibit 33).58 Based on trends in GDP and productivity growth, we estimate the supply-demand mismatch for tertiary-educated workers will deteriorate from a surplus of four million in 2010 to a shortage of 16 million in 2020. Europe’s prime working-age population (conventionally defined as aged 15 to 64) is projected to fall by 4 percent by 2030 as a result of lower fertility. Current rates of tertiaryeducation attainment are not sufficient to provide the boost to labour productivity needed to sustain economic growth as populations age. Tertiary-education attainment among 30- to 34-year-olds varies from 22 percent in Italy to 53 percent in Ireland, and the variability in educational test scores is high across the continent.
This suggests considerable scope for some parts of Europe to catch up. However, educational attainment can go only so far to protect people from the vagaries of a difficult labour market. In Southern Europe and Central and Eastern Europe, graduates with a tertiary education are experiencing greater rates of unemployment than workers with only a primary education in Continental Europe and the United Kingdom and Ireland. Educational attainment has to be twinned with the skills that today’s companies need. In a recent McKinsey survey, employers specify a lack of skills as the most common reason for entry-level vacancies.
This sentiment is particularly strong among employers from countries with high youth unemployment rates. In Greece, 33 percent of employers could not find We use the same projection methodology as in The world at work: Jobs, pay, and skills for 3.5 billion people, McKinsey Global Institute, June 2012. 58 52 McKinsey Global Institute 2. Reform—much of it national—can deliver growth .
a candidate for an entry-level position because there was nobody with the right skills; in contrast, the share of employers citing this issue in Sweden was 21 percent.59 Exhibit 33 By 2020, Europe will have too few individuals with a tertiary education to meet labour-market demand Labour supply-demand mismatch: Comparison of projected labour demand and supply Million workers Tertiary Upper secondary/post-secondary 2010A Primary/lower secondary 2020E Gap 257 Million workers Gap %1 47 +4 +9 170 +30 +17 34 40 +7 +16 Demand Supply 216 42 140 Million workers %1 55 -16 +22 144 173 +29 +17 36 30 -6 -16 Demand Supply 259 252 71 1 Gaps are percentage of demand for shortages, and percentage of supply for surpluses. NOTE: Numbers may not sum due to rounding. SOURCE: United Nations Population Division (2010 revision); International Institute for Applied Systems Analysis; ILO; IHS; consensus estimates for GDP; national sources for the United States and France; McKinsey Global Institute analysis Europe’s high share of small businesses amplifies the importance of effective skills training. Across the continent, 37 percent of employees work for businesses with fewer than 20 people. It is noteworthy that those European regions with higher shares of small businesses also have higher levels of youth unemployment. This reflects the fact that most small businesses do not possess the resources that large companies have to provide training to smooth the gap between the skills that prospective employees have and the skills they need. If we group businesses by their satisfaction with the skills of their employees and their willingness to train new hires, business with fewer than 50 employees are overrepresented in the least satisfied group, accounting for 61 percent of that group.
Conversely, small businesses are most under-represented in the group that is proactive in improving the skills of the workforce, making up 44 percent of companies of that group (despite accounting for 50 percent of all companies) compared with 32 percent of large businesses, which account for 27 percent of all companies. McKinsey surveyed 5,300 young people, 2,600 employers, and 700 education providers from eight EU countries (France, Germany, Greece, Italy, Portugal, Spain, Sweden, and the United Kingdom). See Education to employment: Getting Europe’s youth into work, McKinsey Center for Government, January 2014. 59 McKinsey Global Institute A window of opportunity for Europe 53 . What is driving these trends? Preparedness for work depends on five components of effective education: childhood preparation, access to education, choice of study, provideremployer communication, and quality of education provided. ƒƒ Childhood preparation. How well a child is prepared at school for the world of work has an impact on the child’s employment prospects over the long term and is the foundation of economy-wide skills and productivity. The evidence shows that additional preschool early-childhood education has a dramatic effect on performance later in life.60 The Progress in International Reading Literacy Study of fourth-graders shows that reading achievement increases significantly with the length of early-childhood care.61 This effect is particularly pronounced for disadvantaged students. Even at the secondary school level, performance in mathematics, science, and reading of 15-year-old students measured by the Programme for International Student Assessment (PISA) improves by the equivalent of almost one full year of formal schooling if a child has participated in an early-childhood programme.62 Despite the proven benefits of preschool learning, particularly among children under three years of age, participation in such programmes in Europe is relatively low.
Participation has risen from 85.9 percent in 2001 to 92.9 percent in 2011, but still only 30 percent of children under three have received any kind of education. Underpreparedness continues at later stages of education for European children. In comparison with the OECD average, only countries in Continental Europe outperform on mathematics, reading, and science measured by PISA.
Most regions outperform the OECD average on science, but Southern Europe and Central and Eastern Europe have gaps across the board. 30% of Europeans not enrolling in postsecondary education cited costs ƒƒ Access to education. Perceived and real barriers to access to education are still present in Europe, especially at the tertiary level. While most European countries offer many postsecondary programmes at little or no cost, students still identify affordability as the main barrier to enrolling in these courses.
Of those young people who did not enrol in postsecondary education, 30 percent claimed that they could not afford it. While tuition costs are low across Europe, living expenses and the cost of materials such as books can act as a barrier for students, particularly those from a low-income background. Perhaps even more importantly, the opportunity costs of tertiary education can be prohibitive for such students. Of the young people who embark on a postsecondary education, one-quarter do not complete their programme because they could not afford to forgo the earnings from working. ƒƒ Choice of study.
What students choose to study has an impact on the skills mismatches that are leading to skills shortages in the labour market. Highly educated people whose skills are not in demand among employers can find themselves unemployed upon graduation, and those who do find a job in a field that does not match their qualifications tend to be less productive. In many cases, there is a lack of sufficient advice for students about the academic disciplines or skills that are most in demand among employers. Only 24 percent receive sufficient information on what fields to study.
This situation is compounded by the fact that many educational systems require choosing subjects at an early age, before students have sufficient information to know which subjects are likely to be most useful. Broadly, across all levels of educational attainment, unemployment is lowest in science, engineering, and health-care professions. Vocational students on the Key data on early childhood education and care in Europe, 2014 edition, Eurydice and Eurostat report, European Commission, 2004. 61 The Progress in International Reading Literacy Study is an international comparative study of the reading literacy of young students.
It studies the reading achievement and reading behaviour and attitudes of fourth-grade students in the United States and students in the equivalent of fourth grade in other participating countries. 62 The Programme for International Student Assessment is a worldwide study by OECD in member and nonmember nations of the performance of 15-year-old students on mathematics, science, and reading. The first study was in 2000, and it is repeated every three years. 60 54 McKinsey Global Institute 2. Reform—much of it national—can deliver growth .
whole have more success in finding employment, but only 44 percent of students who would have preferred to study a vocational field in their postsecondary education do so against 82 percent of students who preferred an academic discipline. Students see strong benefits in vocational education, but only one-third think that such an education is most valued by society. Only ƒƒ Provider-employer communication. Those who provide education and training need to communicate more effectively and more often with employers so that students emerge with the tools they need to find work. Perceptions diverge significantly.
In a McKinsey Center for Government survey, 74 percent of educators said that they were adequately preparing graduates for the workforce. However, only 35 percent of employers and 38 percent of students thought that this was the case (Exhibit 34). Employers need to tell educators what skills they need, and educators need to give their graduates the tools that will enable them to meet these requirements.63 Even in Germany and Sweden, which have some of the lowest rates of youth unemployment in Europe, only 43 percent and 33 percent of employers, respectively, agree that new hires are adequately prepared. 33% of employers in Sweden say new hires are adequately prepared Exhibit 34 Education providers typically have a more favourable view of the preparedness of graduates for work than employers and young people do Respondents who agree that graduates/new hires are adequately prepared % Employers1 Youth2 Education providers3 83 61 36 40 United Kingdom 79 69 43 40 50 42 39 23 26 Germany Spain Greece 74 72 33 Italy 48 42 22 Sweden 80 73 27 33 France 74 33 35 38 Portugal Europe 1 Overall, the entry-level employees we hired in the past year have been adequately prepared by their pre-hire education and/or training. 2 Overall, I think I was adequately prepared for an entry-level position in my chosen career field. 3 Overall, graduates from my institution are adequately prepared for entry-level positions in their chosen field of study. SOURCE: Education to employment: Getting Europe’s youth into work, McKinsey Center for Government, January 2014; McKinsey Global Institute analysis ƒƒ Quality of education. The overall quality of education affects all four other components, and European countries tend to lag behind other developed economies in this respect. The 2013 Survey of Adult Skills by the OECD revealed that only the working-age populations in the Nordic region and the Netherlands match the OECD average in numeracy, problem solving, and literacy.
Particular weaknesses persist in Southern Europe, Ireland, and Poland, which underperform on all three. In the case of digital literacy, Europe performs well with the exception of Central and Eastern Europe, where Education to employment: Getting Europe’s youth into work, McKinsey Center for Government, January 2014. 63 McKinsey Global Institute A window of opportunity for Europe 55 . a survey by the ECDL Foundation showed a lower share of digitally literate respondents than the survey average.64 Initiatives to change the game The initiatives on which we have focused are those that can deliver change within the next ten years that immediately help to address high youth unemployment rates and also set the foundation for future productivity growth by addressing gaps in education quality. If Europe improves the education of its workforce on the five dimensions we have discussed, the region’s annual GDP growth could increase by 0.24 percentage points. Of this, around 0.09 percent would come from reaching Europe 2020 targets for the share of tertiary graduates.65 A reduction of half of the gap with best practice on the mismatch between educational attainment and occupations—known as a vertical mismatch—would drive an additional 0.07 percent of GDP, reflecting productivity gains.66 The final 0.07 percent could be realised by reducing the share of NEETs from the current level of 12.2 percent to 8.9 percent (an aggregate of national targets).67 Lowering the share of NEETs would raise output from the incremental earnings, taxes, and social contributions provided by the newly employed members of the workforce. Our analysis suggests the following priorities: ƒƒ Establish dedicated schemes for matching youth to employment, and increase transparency about the labour market and career choices. For the many young people looking for work in Europe today, long-term, fundamental reform of education-toemployment systems will take too long to come to fruition.
However, there are examples within Europe of approaches that can help young people to adjust to the demands of the labour market in the relative short term. Since 2013, Finland’s Youth Guarantee has guaranteed all people under 25 years of age and all graduates under 30 years of age access to a job, training, or education within three months of declaring themselves unemployed. Public employment services work with participants on three steps: creating a personal development plan; carrying out a needs assessment; and identifying and undertaking whichever of the three options—job, training, or education—is deemed most appropriate.
Organised as a public-private partnership, the programme has ensured that all stakeholders are involved in a national working group. The success of this programme proves that well-crafted solutions can be effective even in the very short term. Of the 37,023 unemployed young people identified, 93 percent created job-seeking plans, and 72 percent found work or enrolled in training.
The programme has also proved cost-effective. Total annual costs for the scheme are approximately €114 million, against an estimated overall cost to society of youth unemployment of €300 million. Students cannot make optimal career choices without transparency about the labour market. A central repository of data on labour-market and education outcomes organised by youth employment integrators would achieve this aim.
The United Kingdom already provides a successful model of such a system. The National Careers Service was launched in the United Kingdom in 2011 as a three-channel delivery system to Digital literacy report—2009, ECDL Foundation, 2009. The ECDL (European Computer Driving Licence) Foundation survey of 8,000 people in 15 countries determined their self-perceived digital literacy and confidence level with different IT tasks, and posed actual questions that test IT skill level. 65 The GDP impact is based on the productivity elasticity of tertiary-education attainment and the correlation between total factor productivity growth and GDP growth.
See Dawn Holland et al., The relationship between graduates and economic growth across countries, Bank for International Settlements research paper number 110, August 2013. 66 The output elasticity of the short-run, country-specific reduction in vertical mismatch comes from António Morgado et al., Measuring labour mismatch in Europe, CEFAGE-UE working paper number 2014/13, Center for Advanced Studies in Management and Economics, Universidade de Évora, 2014. 67 The output impact is based on annual country-specific resource costs calculated in Massimiliano Mascherini et al., NEETs: Young people not in employment, education or training: Characteristics, costs and policy responses in Europe, Eurofound, October 2012. 64 56 McKinsey Global Institute 2. Reform—much of it national—can deliver growth . improve the effectiveness of the labour market by giving people information about the labour market, provide tools to job seekers to assess their preparedness for work, and develop an action plan. The website had in excess of seven million visitors in its first year of operation, and the UK government reported that of more than 10,000 people entering work or learning every month, more than half credited the programme. 70% of Swiss youth complete apprenticeship ƒƒ Develop a flexible dual-apprenticeship model. Another useful approach would be to put in place a flexible apprenticeship system to boost the credibility of vocational tracks and, at the same time, ensure that students acquire the skills that employers value. Apprenticeship programmes are a powerful tool for addressing youth unemployment (Exhibit 35). Countries with vocational education training programmes, including Germany and Austria, weathered the recent downturn relatively well with a youth unemployment rate of approximately 9 percent in 2010.
Ten other comparable countries in Western Europe had an average youth unemployment rate of 25 percent in that year. Switzerland, with its low youth unemployment rate, can provide a model for a strong apprenticeship programme. Not only is the apprenticeship programme an integral part of the educational system—70 percent of Swiss youth complete such programmes—but it also provides rigorous qualifications through more than 400 federal vocational exams. It also provides flexibility by enabling students to switch between vocational education and academic pathways.
The Swiss Confederation, cantons, and professional organisations work together to develop training standards and ensure that students have sufficient apprenticeship opportunities. Exhibit 35 Apprenticeship systems are a powerful way to address youth unemployment in Europe Youth (ages 15–24) unemployment and enrolment in apprenticeship programmes, 2010 % Nordics Continental Europe United Kingdom and Ireland Southern Europe Baltics Central and Eastern Europe Other Youth unemployment rate 45 Spain 40 35 Estonia Ireland 30 25 Poland 20 Belgium 15 Hungary France Finland Luxembourg Israel 10 Czech Republic Iceland Norway Denmark Austria Netherlands Germany 5 0 5 10 15 20 25 30 35 40 45 50 Enrolment in apprenticeship programmes1 1 Percentage of age cohort; six countries with zero enrolment not shown. SOURCE: OECD; McKinsey Global Institute analysis McKinsey Global Institute A window of opportunity for Europe 57 . ƒƒ Revamp the selection and training process for teachers. It will be difficult for Europe to develop a best-in-class education system without good teachers. The top-performing educational systems in Europe—in Finland, England, and the Netherlands—make recruiting the best talent to the teaching profession a top priority. England has raised starting conditions for teachers through the Training and Development Agency for Schools, a group that uses lessons from marketing in the private sector to develop dynamic recruitment strategies that adapt their message to better match top motivating factors.
The Netherlands has attracted higher-quality candidates by shortening the time it takes to reach the top of the salary schedule from 26 years to 18 years, and by raising the starting salary for teachers in line with the private sector (although this move has been curtailed by temporary salary freezes since 2010). In addition to attracting better candidates, school systems must make sure that they make the right hiring decisions since the effects of their choices can persist in the system for decades. Finland ensures that it brings in the best teachers through an extensive selection process that includes a multiple-choice national screening test, group work to assess communication and interpersonal skills, and interviews to see whether applicants are inspired to teach. The country also sets strict teaching qualifications that require all teachers, including kindergarten and preschool teachers, to hold a master’s degree.68 ƒƒ Proactively measure school performance on a defined set of metrics and intervene with targeted programmes where outcome gaps are identified. Diagnosing and reversing underperformance as quickly as possible requires comprehensive measurement.
The best school systems in Europe use a two-pronged monitoring approach of examination and independent school review, complemented by specialised one-on-one instruction. England has an independent inspectorate that is directly accountable to Parliament, which reviews schools on process and outcome indicators. Failure to improve gives the local authorities the right to replace school leadership.
The separation between driving and measuring outcomes reduces conflict of interest and boosts the objectivity of assessment. Once gaps in students’ achievement have been identified through regular and comparable examination, they should be addressed proactively through individually tailored instruction. In this vein, Finland has de-stigmatised special education by ensuring that a high proportion (28 percent) of students make use of some form of educational support, and also by occasionally sending the best students to participate in special education sessions.69 ƒƒ Stimulate dialogue between employers and educational providers.
Fostering communication between employers and providers can help to ensure that students are not the victims of poor communication between the two sides. Such forums could enable the establishment of agreed educational standards that meet the needs of employers, and ensure that curricula can be carried out by providers. Existing panEuropean mechanisms such as the Bologna and Copenhagen processes offer an effective platform through which this initiative can be executed.
These processes involve a formal set of meetings and agreements among European countries aimed at harmonising standards of higher education and vocational education, respectively. Incorporating the proposed forums into these established processes would be an effective way to get the forums up and running. Additional metrics on the frequency and effectiveness of this communication, tracked by each country and reported through these platforms, would help to assess the continent’s progress and adjust course if necessary. Michela Braga, Daniele Checchi, and Elena Meschi, Institutional reforms and educational attainment in Europe: A long run perspective, Institute for the Study of Labor (IZA) discussion paper number 6190, December 2011. 69 How the world’s best-performing school systems come out on top, McKinsey on Society survey, September 2007; Special education 2013: Share of students having received special support diminished, Statistics Finland, June 2014. 68 58 McKinsey Global Institute 2. Reform—much of it national—can deliver growth .
3. PRODUCTIVE INFRASTRUCTURE INVESTMENT Infrastructure is the connective tissue of an economy, and there is strong evidence linking productive infrastructure spending and economic growth.70 Without adequate spending, countries whose infrastructure is inadequate risk falling further behind and leading countries can quickly slip down the rankings. We estimate that European investment in transport, power, water, and telecoms infrastructure over the past ten years has been between 0.3 percent and 0.9 percent of GDP lower than needed to support the growth rates to which Europeans aspire. Net public investment has declined since the crisis and turned negative in several economies including Germany. However, simply increasing investment in infrastructure is not enough—particularly during a time of fiscal constraint.
Spending on infrastructure needs to be as productive as possible. Previous MGI research found that as much as 40 percent could be saved on countries’ infrastructure bills if they applied global best practice on project selection, delivery, asset management, governance, and finance.71 Even neighbouring European countries score very differently on these dimensions, suggesting ample opportunity to learn from each other. Europe should consider conducting a comprehensive infrastructure productivity assessment, take an integrated view of project selection, streamline the delivery of projects, improve the utilisation of existing infrastructure through pricing and the use of technology, and explore funding options outside general taxation. Stepping up European annual infrastructure delivery by the equivalent of 0.9 percent of GDP additional spending could boost Europe’s annual GDP growth by 0.14 percentage points, assuming an economic rate of return on additional infrastructure stock of 20 percent and ignoring demand-side effects. Only 4 Baltic and Central and Eastern European countries make world top 40 on infrastructure quality Where Europe stands The quality of Europe’s infrastructure quality compares well overall with that of other developed economies, according to the WEF’s index of infrastructure quality.72 Across all types of infrastructure, Europe performs in line with Canada and the United States.
Looking at regions within Europe, Continental Europe performs comparably with Japan despite that country’s high levels of investment over recent decades. However, although European countries are disproportionately represented in the top 20 of the WEF index, some countries have an opportunity to rise up the rankings. The Baltics and Central and Eastern Europe lag well behind other European regions.
Of the 11 countries in those two regions, only four—the Czech Republic, Estonia, Latvia, and Slovenia—make the top 40 in the world on infrastructure quality. While the quality of telecoms and water infrastructure in those regions is in line with the rest of Europe, transport infrastructure such as roads, rail, and ports has some way to catch up. In general, infrastructure quality has a strong positive correlation with per capita income (and the causation goes both ways). Nevertheless, some countries can outperform given their level of income while others fail to reach the level of infrastructure quality expected based on the stage of their economic development.
Within Southern Europe, for instance, Portugal outperforms Greece, and Spain outperforms Italy—despite similar levels of income (Exhibit 36). Even regions with generally higher infrastructure quality such as Continental Europe show significant variation. Switzerland has the highest-quality infrastructure in Continental Europe with a WEF score of 6.6, compared with a score of 5.8 in Belgium. Among the Nordics, Norway’s infrastructure quality overall is lower than one might expect for such a high-income country, largely due to the country’s underperforming transport infrastructure, particularly roads. World economic outlook: Legacies, clouds, uncertainties, IMF, October 2014. Infrastructure productivity: How to save $1 trillion a year, McKinsey Global Institute and the McKinsey Infrastructure Practice, January 2013. 72 Global competitiveness report 2014–2015, World Economic Forum, September 2014. 70 71 McKinsey Global Institute A window of opportunity for Europe 59 .
Exhibit 36 The quality of infrastructure varies widely at each income level Nordics Continental Europe United Kingdom and Ireland Southern Europe Baltics Central and Eastern Europe Infrastructure quality, 2014 WEF score 7.0 Switzerland 6.5 Finland Spain 5.5 5.0 Hungary Czech Estonia Republic Latvia Croatia Lithuania Malta 4.5 4.0 Poland Austria Germany France Portugal 6.0 Luxembourg Denmark Belgium Sweden Cyprus United Kingdom Slovenia Greece Netherlands Norway Ireland Italy Slovakia Romania Bulgaria 3.5 8.4 8.6 8.8 9.0 9.2 9.4 9.6 9.8 10.0 10.2 10.4 10.6 10.8 11.0 11.2 11.4 Income, 2012 Log GDP per capita, purchasing power parity SOURCE: WEF; Eurostat; World Bank; McKinsey Global Institute analysis The high overall quality of Europe’s infrastructure masks a worrying trend of considerable underinvestment. Left unaddressed, this would be likely to constrain the growth potential of many of the region’s economies. We base our analysis of investment needs on a crosscountry methodology that mostly reflects economic growth but also takes into account infrastructure stock and depreciation.73 While we recognise that the investment needs of any specific country depend on a more complex set of conditions including, for example, geography, demographics, efficiency of spending, or economic development priorities, this top-down methodology has proven effective in providing an indication of spending gaps or overinvestment. Europe would require infrastructure spending of 3.5% of GDP per year We find that, with the exception of Central and Eastern Europe, and Southern Europe, the continent did not spend a sufficient percentage of GDP on infrastructure in the 2000s (Exhibit 37). Between 2002 and 2011, Europe spent an average 2.6 percent of GDP per year, a level that would have been appropriate for an economy growing at 1.2 percent per annum in real terms.
This level of infrastructure spending is clearly insufficient to support Europe’s aspirations for future growth. The gap between required spending, based on an IHS forecast of 1.7 percent annual GDP growth in the Europe-30 to 2030, and actual spending was 0.3 percent of GDP in 2011. If Europe were to achieve a higher growth rate of 73 60 For details, see Infrastructure productivity: How to save $1 trillion a year, McKinsey Global Institute and the McKinsey Infrastructure Practice, January 2013. McKinsey Global Institute 2.
Reform—much of it national—can deliver growth . 2.5 percent per annum through the implementation of the growth drivers discussed in this report, this gap would widen further to 0.9 percent. To support higher future growth rates, Europe would require infrastructure spending of 3.5 percent of GDP per year. Exhibit 37 In most of Europe, infrastructure spending has fallen below the levels required to keep pace with expected GDP growth Historical aggregate infrastructure spending % of GDP Continental Europe Southern Europe Central and Eastern Europe United Kingdom and Ireland Nordics Europe-30 Expected future spending requirement vs. historical spending % of GDP, regionally weighted by GDP Historical average, 2002–11 Projected need (1.7% p.a. real GDP growth to 2030) Projected need (2.5% p.a. real GDP growth scenario) 4.5 Europe-30 2.6 2.9 3.5 4.0 3.5 3.0 United Kingdom and Ireland 2.5 Nordics 2.0 Continental Europe 3.7 Central and Eastern Europe 1.5 2002 03 04 05 06 07 08 09 10 2011 Southern Europe 3.7 2.3 3.4 2.3 3.0 2.3 2.8 3.1 2.6 NOTE: IHS forecast of 1.7% real GDP growth per annum for the Europe-30 to 2030; 2.5% figure based on assumption of implementing growth drivers. SOURCE: Eurostat; World Bank; McKinsey Global Institute analysis Beyond the general shortfall of spending levels in much of the continent, we discern variation in patterns of infrastructure investment within Europe.
We have grouped the economies into a number of archetypes determined by a country’s infrastructure quality relative to its per capita GDP, as well as its average annual infrastructure investment relative to its need (Exhibit 38).74 Three countries—Austria, the Czech Republic, and Denmark—fall into a zone where spending and quality have been about as expected given the countries’ degree of development and historical speed of growth. Eight countries—including Poland, Sweden, and the United Kingdom—have infrastructure that is below the expected quality and have not invested sufficiently to make up the gap. This suggests that these countries should assess carefully whether they need to take measures to avoid falling behind.
Four countries—Belgium, Finland, France, and Germany—have infrastructure that exceeds the quality expected for their per capita income but have recently invested less than expected. This may put their advantageous position at risk in future years. Another four countries— Hungary, Portugal, Spain, and Switzerland—have above-average infrastructure quality for With respect to the latter dimension, we compare each country’s average spending in 2002 to 2011 with its historical GDP-growth rate in the same period, rather than with a projected future growth rate. 74 McKinsey Global Institute A window of opportunity for Europe 61 . their income levels and high levels of infrastructure investment for their growth rates. Finally, Greece and Italy combine high recent infrastructure spending with quality that lags behind the level that would be expected given their incomes. This raises questions about why their high spending has not translated into improving infrastructure quality. Exhibit 38 MGI has analysed countries by their infrastructure spending characteristics Nordics Continental Europe United Kingdom and Ireland Southern Europe Baltics Central and Eastern Europe Infrastructure quality gap, 2014 Delta between actual WEF index and predicted value1 1.2 Portugal 1.0 â–ª Quality exceeds wealth-expected levels â–ª Recently investing below levels expected to support growth 0.8 â–ª Quality exceeds Finland 0.6 France Belgium Czech Republic wealth-expected levels â–ª Recently investing below levels expected to support growth Hungary Denmark â–ª Quality lags behind Romania wealth-expected levels â–ª Recently investing Slovakia Poland Ireland -0.8 above levels needed to support growth Greece Bulgaria -0.6 â–ª Recently investing United Kingdom -0.2 Sweden -0.4 Austria Germany 0 â–ª Quality lags behind Switzerland 0.4 0.2 wealth-expected levels Spain above levels needed to support growth Italy -1.0 -1.2 Norway -1.4 -0.8 -0.6 -0.4 -0.2 0 0.2 0.4 0.6 0.8 1.6 1.8 Spending gap, 2002–11 Delta between average spend (public and private) and estimated need in the same period2,3 1 Calculated as difference between actual WEF index and predicted value given per capita GDP on a purchasing power parity basis. 2 Spending requirement to maintain average infrastructure stock of 70 percent of GDP given 2.5 percent per annum depreciation and GDP growth 2002–11. 3 Several countries excluded from analysis due to incomplete data. SOURCE: WEF; Eurostat; McKinsey Global Institute analysis Differences in the quality of infrastructure within Europe are caused by different practices and conditions that affect all stages of a typical project development life cycle. Productive infrastructure investments are typically underpinned by fact-based project selection, streamlined delivery, effective management and utilisation of existing infrastructure, strong governance and capabilities, and a robust funding and finance framework. It is evident that high spending alone does not guarantee good infrastructure.
Where spending doesn’t lead to quality infrastructure, there tend to be shortcomings in the efficiency of procurement and delivery. Even among countries at a similar stage of economic development, differences in the cost of building infrastructure can be large (Exhibit 39). For example, the cost of building a road in the United Kingdom is about €10 million per kilometre 62 McKinsey Global Institute 2.
Reform—much of it national—can deliver growth . but in Germany is around 20 percent less. On the cost of materials, the United Kingdom consistently pays less than either France or Germany. In most advanced economies, labour productivity in the construction industry has stagnated or even fallen over the past two decades. There are many circumstantial explanations for such differences, but overall there is a large opportunity to optimise. Exhibit 39 Vast infrastructure cost differences within Europe demonstrate a significant opportunity to learn from best practice Cost benchmark Relative cost of road building Unit cost € million per kilometre Material costs United Kingdom 9.8 8.4 -21% 7.7 France Germany € per tonne (€ per m3 concrete) Steel rebar— high yield Structural steel 759 Ordinary cement 817 1,230 Concrete (20N/mm) Aggregate— all grades 93 105 1,314 1,425 1,101 65 202 1,121 58 140 190 n/a 12 19 99 166 30 System productivity Productivity changes, 1992–2009 Growth in construction labour productivity % Productivity, 2012 GDP per hour worked (all labour groups) € 45.2 26.0 36.9 44.3 Building labour costs (skilled labour) € per hour 16.9 42 12.2 19.2 16 6 2.3 -9.0 NOTE: Not to scale. SOURCE: Infrastructure UK, 2010; Gardiner and Theobald, 2011; OECD; McKinsey Global Institute analysis The five groups of countries that we have identified share characteristics that lead to lower or higher project delivery costs.
In 2012, on average, the group comprising Italy and Greece spent a median of 43 person-days per process in procurement compared with roughly 17 days for the central group of Austria, the Czech Republic, and Denmark. There is also significant variation in the composition of the construction sector. Less than 5 percent of construction employees in Italy and Greece work in firms with 250 or more employees; this McKinsey Global Institute A window of opportunity for Europe 63 .
share in the central group was 15 percent. While consolidated construction sectors are not uniformly associated with productive and high-quality infrastructure spending, a high degree of fragmentation in the sector is likely to obstruct economies of scale and to make it more difficult to coordinate complex projects, leading to lower productivity.75 There is scope to increase the productivity of capital investment by up to 40% Effective delivery systems are essential. However, in addition, countries need to be able to obtain adequate funding for projects, especially as the financial sector continues to adapt to a post-crisis regulatory environment. Countries in all five groups face further fiscal retrenchment by their public sectors, and in this difficult climate it will be easier for some to access finance than others.
The countries that have been systematically spending more in the past than expected to support growth could arguably reduce their spending in this area and focus their scarce fiscal capacity on more pressing priorities. The situation is more severe for those countries that have invested substantially but not achieved high-quality infrastructure. Their simultaneous challenge is to retrench on spending while designing a framework for infrastructure provision that ensures that the spending that is left is more productive.
Countries that have underinvested could be putting their competitiveness and growth potential at risk. For all countries, fiscal austerity and attempted publicsector deleveraging points to a need for governments to design a policy and governance framework that attracts additional private capital to help meet the infrastructure funding gap. Initiatives to change the game For Europe to deliver the societal and growth aspiration of its citizens would require an annual growth rate in excess of 2 percent, as we have discussed. A growth rate of 2.5 percent per annum to 2025 would require infrastructure spending to rise to 3.5 percent of GDP, an increase of 0.9 percent of GDP over current levels.
Such an increase would boost GDP growth by 0.14 percent annually. This assumes an economic rate of return on additional infrastructure stock of 20 percent. The impact of infrastructure investment may be greater due to short-term stimulus effects and may be enhanced by productivity improvements that stretch the value of each euro spent at all stages of project delivery. There is scope to increase the productivity of capital investment by up to 40 percent.76 Governments may choose to use those savings elsewhere rather than on additional infrastructure projects, and therefore we do not quantify this effect.
Our analysis suggests that the following measures would help Europe to meet its infrastructure imperative: ƒƒ Increase spending in countries currently underinvesting, and increase productivity of spend where overinvestment occurred. Our top-down methodology offers a first approximation of the gap between European infrastructure spending and the required level to support aspirational growth. All European countries could benefit from a detailed analysis of their current infrastructure situation to determine appropriate spending levels for the next ten years.
Many countries in the region, particularly those we have characterised as underinvesting, will likely find that they need to increase investment in infrastructure. Through such analysis, countries identified as having overspent should turn their attention to better prioritising projects and developing more efficient delivery systems. Although there are fiscal constraints in many European countries, in many respects this is a propitious moment to invest in infrastructure. Most European countries have historically low borrowing costs, and many have a long-overdue need for upgrades and improvements in transport infrastructure due to high traffic volumes.
Even Germany, which has high-quality transport infrastructure, is experiencing heavy congestion on 20 percent of its road network.77 In practice, these challenges can also be addressed through collaborative partnerships. See R. Beach, M. Webster, and K.
M. Campbell, “An evaluation of partnership development in the construction industry”, International Journal of Project Management, volume 23, issue 8, November 2005. 76 Infrastructure productivity: How to save $1 trillion a year, McKinsey Global Institute and the McKinsey Infrastructure Practice, January 2013. 77 Ibid. 75 64 McKinsey Global Institute 2. Reform—much of it national—can deliver growth .
ƒƒ Explore funding options outside the general tax budget. Fiscal constraints faced by many European countries require them to seek sources of funding outside of general taxation. Charging user fees for using infrastructure, as in congestion pricing on roads, can help pay for a project and optimise its use. Once user charges are in place, the private sector could be brought in to increase competition and as a source of additional finance.
Property-value capture, in which the public sector acquires land surrounding a project and then sells it at a profit when the project is completed, offers another promising avenue.78 Barcelona’s experience with property-value capture demonstrates its effectiveness. In 2001, the city re-designated four million square metres of land from industrial use for use by the services sector. This re-designation increased the value of the land, thereby giving local government increased leverage with private developers to help transform the area while also capturing value for the public.
The city exchanged a planning permit for 30 percent of land rights and a development fee of €80 per square metre of the land developed. This arrangement enabled the city to finance the project despite fiscal constraints at the national level. All the value captured was fed into the publicly owned 22@BCN company, which then allocated funds across social housing, green spaces, and advanced infrastructure such as transport, ICT networks, and heating and cooling systems.
This reinvestment approach created a virtuous cycle of value. The project’s success partly reflected up-front planning that ensured that the infrastructure built was attractive to businesses, including a central location and good transport links. The city has built 4,000 affordable housing units on the site and developed 114,000 square metres of green space and 145,000 square metres of public facilities, as well as installing fibre-optic cables, Wi-Fi networks, and modern waste-collection systems. The return to the developers is an estimated 6 to 7 percent per year, and the public value of the development is estimated at more than €1 billion for an initial outlay of only €180 million.79 ƒƒ Conduct comprehensive infrastructure productivity assessments. Countries can vary hugely on the money they spend on comparable infrastructure projects—even countries that have similar per capita incomes such as France, Germany, and the United Kingdom.
A McKinsey diagnostic of infrastructure productivity in two neighbouring European countries reveals not only that both countries have some way to go before achieving global leading practice but also that they can learn and improve significantly by looking at other countries in the region (Exhibit 40). A granular 360-degree diagnostic can show policy makers where the major gaps are that need rectifying, helping to boost the productivity of government infrastructure spending. €3.4B annual savings in UK infrastructure cost review ƒƒ Take an integrated view of project selection. One of the most powerful ways to reduce the overall cost of infrastructure is to avoid investing in projects that neither address clearly defined needs nor deliver sufficient benefits.
The United Kingdom has made impressive progress in improving its selection of infrastructure projects. In 2010, Infrastructure UK, a newly established entity within HM Treasury, published a National Infrastructure Plan that outlined priorities for allocating public spending in this area in a bid to increase transparency. It established an annual infrastructure cost review to encourage efficiency.
As a result of this framework, the government prioritised 40 projects out of a pipeline of around 250 that were deemed to encourage economic growth, enable a transition to a low-carbon economy, and be capable of attracting investment from the private sector. Across roads, rail, water, energy, and flood defences, in 2014 the United Kingdom achieved annual cost savings of £3.4 billion, 15 percent of a baseline of £22.3 billion.80 George E. Peterson, Unlocking land values to finance urban infrastructure, World Bank, 2009. Joe Huxley, Value capture finance: Making urban development pay its way, Urban Land Institute, 2009. 80 Infrastructure cost review, Infrastructure UK, July 2014. 78 79 McKinsey Global Institute A window of opportunity for Europe 65 .
Exhibit 40 An infrastructure diagnostic can enable more efficient spending Country A Robust funding and finance framework Country B Fact-based project selection Infrastructure strategy linked to socioeconomic objectives Effective approach to public-private partnerships Suitable regulation, pricing, and value capture investment Strong framework for long-term public funding Clear strategy for market competition and ownership Suitable conditions for private infrastructure finance Master planning coordinated across asset classes/ jurisdictions Prioritised optimisation of infrastructure before new build Fact-based and consistent project evaluation System-wide portfolio prioritisation Effective construction and supply market Strong value-assurance process Sufficient financial capacity Attractive overall investment climate Adequate owner team Concept, design, and engineering optimisation Robust infrastructure data Strong capabilities Seamless permitting and land acquisition Strong governance and collaboration Robust institutions and processes for combatting corruption Strong infrastructure governance and capabilities Effective procurement, tendering, and contracting Advanced procurement with synergies captured across projects Rigorous execution and contract management Total cost of ownership-oriented maintenance Increased asset utilisation and loss reduction Well-planned commissioning and ramp-up Well-defined approach to projects in distress Demand managed Making the most of existing infrastructure Streamlined delivery SOURCE: McKinsey Global Institute analysis ƒƒ Streamline delivery of infrastructure projects. Cost and time overruns can be avoided with smart planning. Tight management of contractors, cost-focused contracts, and the use of advanced construction techniques such as prefabrication can lead to potential savings of up to 15 percent.81 Sweden’s national transportation agency was able to use lean-manufacturing techniques and ways of optimising capital spending that helped to rationalise the costs of implementing infrastructure projects. Clearly defined ownership, flexible timelines, active management of planning reserves, optimised requirement and exemption management, and efficient production have led to reduction of both cost and timelines for almost all ongoing megaprojects. One example is the North Link, a 9.3 billion Swedish kroner road tunnel in Stockholm.
The tunnel opened in December 2014, a full year before schedule, and 2.6 billion Swedish kroner, or 22 percent, under budget. Applying similar approaches elsewhere led to a further cost reduction of around 20 percent that freed up funds for investment in road and rail projects. 81 66 Infrastructure productivity: How to save $1 trillion a year, McKinsey Global Institute and the McKinsey Infrastructure Practice, January 2013. McKinsey Global Institute 2. Reform—much of it national—can deliver growth .
ƒƒ Improve utilisation of existing infrastructure through pricing and technology use. Rather than invest in costly new projects, governments can often improve the quality of infrastructure and meet demand more cost-effectively by upgrading existing assets. Finland has done a great deal to improve use of existing infrastructure and reduce maintenance costs by deploying intelligent transport systems. Its aim is to use electronic operating models to improve the efficiency of transporting goods, targeting a 10 percent improvement in the productivity of the logistics sector. Finland is also developing a smart transport corridor across different modes of transport and using intelligent systems, including an information service on traffic incidents, to facilitate travel between Finland and Russia. These efforts have already yielded significant efficiency improvements.82 For example, systems offering weather information on roads and more efficient use of maintenance workers have saved an average of 23 minutes on each de-icing job.
In the capital, Helsinki, the installation of transit signal priority systems reduced the average journey time by 11 percent. Such improvements not only boost infrastructure productivity but are also cost-effective: benefit-to-cost ratios from improved traffic conditions range between 2 to 1 and 5 to 1. Although Finland’s implementation of these systems is not complete, they can serve as a model for other countries with heavy road use. “Smoother passenger traffic across the Finnish-Russian border”, press release, VTT Technical Research Centre of Finland, April 15, 2014. 82 McKinsey Global Institute A window of opportunity for Europe 67 .
4. REDUCED ENERGY BURDEN Energy—whether petroleum fuels, electricity, or the calories embodied in food—is one of the base ingredients of all economic activity.83 A divergence in energy prices with the United States in recent years has risked putting Europe at a competitive disadvantage in energy-intensive industries; the chemicals industry has already shifted a significant volume of investment abroad. At the same time, such industries generate a relatively small share of European output and can often be traded only regionally, mitigating global cost pressure. Higher energy prices may even aid a shift towards higher-value-added industries that are less energy-intensive.
Nevertheless—and despite the sharp fall in energy prices in late 2014—reducing Europe’s energy burden remains an important long-term economic issue. New sources of domestic supply should be explored, but the potential over the next ten years appears limited. Given this context, there is a broad imperative to use energy more productively—through efforts to boost efficiency, structural change in the composition of economies, and technological innovation.84 On this score, best practice already exists in Europe. Denmark, for instance, has successfully fostered energy efficiency through a concrete and coherent regulatory framework of energy-intensity standards.
Governments can also play an important role in accelerating progress towards a single European energy market and laying the foundation for long-term energy supply with a pan-European framework for new energy sources including renewables and, provided environmental concerns can be addressed, unconventional hydrocarbons. Progress on energy productivity and the single market alone could result in an annual uptick in GDP growth of 0.13 percent. 70% rise in household post-tax electricity prices 2004–13 Where Europe stands Between 2004 and 2013, European post-tax electricity prices for industry approximately doubled, while those for households rose by about 70 percent. In the same period, European natural gas prices increased by 160 percent.
This was a far greater increase than that observed in the United States, where large-scale exploitation of shale gas has helped to curtail price pressures (Exhibit 41).85 Both natural gas and electricity prices in the United States are now about half of European prices. The rising prices in Europe put pressure on the competitiveness of energy-intensive industries. Executives at the chemical giant BASF, for example, were widely cited in the media in 2014 saying that high electricity and feedstock prices were important factors behind the company’s decision to focus more of its €20 billion capital expenditure budget on Asia and the United States over the next five years, cutting investment in Europe from twothirds of its budget to just under half.86 Almost three times as many European households worry about rising energy prices as the number concerned about keeping up with mortgage or rent payments. This has resulted in 31 percent of respondents in 2014 planning energyefficiency changes compared with only 4 percent in 2012.87 Robert U.
Ayres and Benjamin Warr, “Accounting for growth: The role of physical work”, Structural Change and Economic Dynamics, volume 16, issue 2, June 2005. 84 For example, see Better growth, better climate: The new climate economy synthesis report, Global Commission on the Economy and Climate, September 2014, and Georg Zachmann and Valeria Cipollone, “Energy competitiveness”, in Manufacturing Europe’s future, Reinhilde Veugelers, ed., Bruegel Blueprint Series, volume XXI, 2013. 85 Despite some infrastructural bottlenecks and regulatory obstacles, crude oil and refined products have traded at generally similar price points in the United States and Europe due to the integrated global nature of these markets. 86 Chris Bryant, “BASF to focus investments outside Europe”, The Financial Times, February 25, 2014. 87 European home report 2014, Kingfisher, August 2014. 83 68 McKinsey Global Institute 2. Reform—much of it national—can deliver growth . Exhibit 41 European gas and electricity prices have diverged from those in the United States, putting pressure on industry and households US industry1 US households2 Europe industry1 Europe households2 Industry natural gas prices and US shale production 14 Natural gas prices $ per million BTU 12 10 8 -49 6 4 2 0 2004 US dry shale gas production Billion cubic feet per day 05 06 07 08 09 3 3 4 5 7 10 2004 05 06 07 08 09 10 15 11 22 12 13 28 31 10 11 12 13 10 11 12 2014 36 2014 2013 Household and industry electricity prices after tax $ per kilowatt-hour 0.30 0.25 0.20 0.15 0.10 0.05 0 2004 05 Average US 61 prices as % of European prices 06 07 08 09 49 44 1 US gas prices are Henry Hub; Europe gas prices are German border. 2 Weighted average of Europe-30 excluding Cyprus, Malta, and Norway in natural gas price due to data availability. SOURCE: German Federal Office for Economic Affairs and Export Control; Bloomberg; FACTS; US Energy Information Administration; Enerdata; McKinsey Global Institute analysis Energy supply The gas and power price differential between Europe and the United States partly reflects a regional supply-demand mismatch that has developed in recent years.88 Therefore, one way to reduce the economic burden of high energy costs would be through increased supply from domestic production or imports. However, expanding domestic energy production Howard Rogers, The impact of a globalising market on future European gas supply and pricing: The importance of Asian demand and North American supply, Oxford Institute for Energy Studies, January 2012. 88 McKinsey Global Institute A window of opportunity for Europe 69 . on a large enough scale to produce meaningful reductions in energy prices appears very difficult. United States drilled ~14X as many shale wells as Europe in 2002 Take shale gas, for example. Although shale resources are abundant in Europe, McKinsey experts expect domestically produced shale gas to meet only a small percentage of European gas demand by 2030—and at a higher price than in the United States. This reflects a combination of difficult geology, stringent regulations, an underdeveloped pipeline infrastructure, public opposition, and a rudimentary support-services sector. Even if Europe decided to intensify shale gas production, its current level of activity implies a very long ramp-up period.
By 2003, years before the “shale revolution” became a topic of household conversation, the United States had already drilled 127 shale wells per 1,000 square kilometres—approximately 14 times as many as Europe had in 2012 (Exhibit 42). What’s more, rather than growing at a rapid rate, shale exploration since 2011 has actually fallen by approximately 20 percent per year in critical European countries such as Poland and the United Kingdom. Exhibit 42 In shale gas exploration, Europe currently lags significantly behind the United States ten years before peak production Shale gas production Shale drilling activity Number of wells Estimated well density Wells drilled per 1,000 sq km 25–30x 14x 8.4 billion m3 United States (Barnett), 20031 Europe, 2013 = 0 30–40 Europe, 2013 973 United States (Barnett), 2003 9 Europe, 1983–2012 127 United States, 1973–2002 1 Gas production from the Barnett Shale basin peaked at 57 billion cubic metres per annum in 2011; therefore, 2003 data give an indication of the level of activity Europe would need to achieve to significantly expand production within ten years. SOURCE: Baker Hughes; McKinsey Global Institute analysis Other domestic energy sources also face significant headwinds. Germany, for example, has accelerated its phasing out of nuclear power.
Meanwhile, renewables are less subsidised than before as many European governments and consumers bristle at the legacy costs of past investments. In recent years, the Czech Republic and Spain have ended their feed-in tariffs for renewables. As an alternative to attempting to boost domestic supply, energy imports can help to reduce energy prices provided the transmission of resources is considered stable and predictable. Europe already imports a large share of its energy needs. In 2012, the EU procured 53 percent of its gross inland energy consumption from abroad, including 88 percent of its demand for crude oil and natural gas liquids, 66 percent of its natural gas demand, and 70 McKinsey Global Institute 2.
Reform—much of it national—can deliver growth . 62 percent of its hard coal demand.89 Even treating energy from Norway (not a member of the EU) as domestic supply, Europe remains highly reliant on imports, with dependency rates of 78 percent for crude oil and natural gas liquids and 45 percent for natural gas. Russia is the major supplier of all three types of energy and is a particularly critical partner for natural gas, accounting for 47 percent of extra-Europe-30 imports to the EU (Exhibit 43). Exhibit 43 The European Union relies heavily on energy imports EU-28, 2012 % Extra-Europe-30 origins of primary energy imports1 Final energy consumption by fuel Renewables 11 Nuclear Others 20 Nonrenewable waste Petroleum and 34 products 14 Qatar 12 United States 23 Nigeria 9 Algeria 20 Libya 9 Colombia 24 Solid fuels Others 34 Australia 7 1 Others 21 Saudi Arabia 10 17 23 Russia 26 Gas Hard coal Russia 47 Russia 38 Crude oil and NGLs2 Natural gas Dependency on extra-Europe-30 imports3 % 62 78 45 1 Intra-Europe-28 imports and imports from Norway not included. 2 Natural gas liquids. 3 Net imports (gross inland consumption plus bunkers); intra-Europe-28 imports and imports from Norway not included. SOURCE: European Commission; McKinsey Global Institute analysis In the face of many concerns about the security of Europe’s energy supplies, the European Commission has recommended supporting the development and expansion of infrastructure to allow for further increases in gas import volumes from Norway as well as from Central Asia, the Middle East, and North Africa. Complex geopolitics aside, any importbased strategy will be constrained by the situation in the global gas market. For instance, 89 McKinsey Global Institute Figures for EU-28. See European energy security strategy, European Commission, May 2014. A window of opportunity for Europe 71 .
in 2013 more than 80 percent of incremental liquefied natural gas (LNG) capacity under development around the world was already contracted to specific buyers, mostly in nonEuropean destinations.90 US LNG is often held up as a promising new opportunity. However, even if all US LNG exports expected in 2025 were directed to Europe, they would meet only 10 to 20 percent of European gas demand.91 In the case of coal, US exports to Europe more than doubled between 2000 and 2012. This had only a marginal impact on power prices but significant consequences for the EU’s 2020 carbon emissions targets. Energy transmission One way in which Europe could still significantly reduce its energy burden is by enhancing the efficiency and connectivity of its domestic energy market, which remains rather fragmented—a collection of national islands with only a few bridges between them. Spain’s LNG import terminals ran at around one-quarter capacity in 2013, partly due to depressed domestic demand and to a lack of interconnections with the rest of the continent.
By enhancing market efficiency and heightening competition, a single European energy market could reduce prices. For example, in the case of power, building and upgrading interconnectors such as those between France and Italy and between the Netherlands and Norway would yield the greatest gains due to large differences in price, supply, and demand.92 Some neighbouring European countries have significant variations in electricity prices. For example, in 2011, the average cost of electricity (excluding taxes) for industry in Italy was 20.73 US cents per kilowatt-hour compared with only 12.91 cents in Austria. Similarly, the cost for industry in Spain was 14.33 US cents per kilowatt-hour compared with 9.79 cents in France.
The significant variation in pre-tax electricity prices (when considering weighted household and industrial prices) between European countries that are close or even next to each other underlines the potential gains from closer integration (Exhibit 44). Capturing the full benefits of integration would require not only new infrastructural links across Europe but also more harmonisation of energy policies and regulation. Today, for instance, there are surcharges and taxes that contribute to the strong variation in prices paid by final energy consumers. For example, household- and industry-weighted average aftertax electricity prices in countries developing renewables such as Denmark and Germany are more than 50 percent greater than in France, which relies predominantly on nuclear power.
A more deeply integrated European energy market could also make efforts to foster renewable energy in Europe much more effective. Utility-scale photovoltaic (PV) solar is most efficient in parts of Southern Europe.93 However, in Germany, where solar PV is half as efficient, demand is stimulated through subsidies. A study for the European Parliament shows that, had German solar PV capacity been located in Spain, additional electricity worth €740 million would have been generated in 2011 alone.94 Medium-term gas market report 2013: Market trends and projections to 2018, International Energy Agency, June 2013. 91 “Figure MT-46: U.S.
exports of liquefied natural gas in five cases, 2005–40”, in Annual Energy Outlook 2014, US Energy Information Administration, April 2014. 92 ACER/CEER annual report on the results of monitoring the internal electricity and natural gas markets in 2011, Agency for the Cooperation of Energy Regulators and Council of European Energy Regulators, November 2012. 93 Photovoltaic Geographical Information System, European Commission, 2012. 94 Veit Böckers, Justus Haucap, and Ulrich Heimeshoff, Benefits of an integrated European electricity market, Düsseldorfer Institut für Wettberwerbsökonomie discussion paper number 109, September 2013. 90 72 McKinsey Global Institute 2. Reform—much of it national—can deliver growth . Exhibit 44 Variations in electricity prices within Europe demonstrate the potential gains possible from an integrated energy market Weighted average pre-tax electricity price of households and industry, 20111 Cents per kilowatt-hour >20¢ 15–20¢ 10–15¢ <10¢ 1 Malta excluded from analysis due to unavailability of data. SOURCE: Enerdata; McKinsey Global Institute analysis Europe's energy intensity is 129 tonnes of oil equivalent per $1 million in 2013, vs. 158 tonnes in United States Energy demand High energy prices—and constraints on the expansion of supply—need not necessarily impede European growth and competitiveness. High energy prices are primarily a concern for chemicals, steel, and other energy-intensive industries that are likely to have limited scope to reduce that intensity. However, energy-intensive industries, which we define as industries in which the share of energy in total value added exceeds 10 percent, generate only 7 percent of European total output. The comparable figure in the United States is 8 percent.
Many of the affected energy-intensive industries also tend to be regionally based for logistical reasons; this means that there is a limited threat that they will move their operations to other continents. There is scope to further reduce energy intensity in the European economy as a whole, and thereby reduce the burden of energy prices. A number of studies have demonstrated positive direct and indirect effects of energy efficiency on economic activity.95 Europe is already a global leader on energy efficiency. It has an energy intensity of 129 tonnes of oil equivalent per million US dollars of GDP in 2013.
This is a lower intensity than that of Australia and the United States, for instance, whose oil equivalents per million US dollars of GDP are 147 tonnes and 158 tonnes, respectively. Europe’s energy intensity is less than one-quarter that of China. Only Japan’s energy intensity, at 94 tonnes of oil equivalent per million US dollars of GDP, is lower.
Europe’s relatively low energy intensity means that the continent has been able to retain a share of energy costs in total output similar to that of the United States, despite gas and electricity prices that are nearly twice as high (Exhibit 45). Capturing the multiple benefits of energy efficiency, International Energy Agency, September 2014. 95 McKinsey Global Institute A window of opportunity for Europe 73 . Exhibit 45 Despite different energy costs, the share of energy input in economy-wide output is roughly the same across Europe and the United States Energy input share of total output, 20111 EU United States Share of energy in total output % 70 70 60 60 50 50 40 40 30 30 20 Share of energy input in total output = 4.96% 10 0 20 Share of energy input in total output = 4.63% 10 0 0 10 20 30 40 50 60 70 80 90 100 0 10 20 30 40 50 60 70 80 90 100 Output (value added) % 1 Includes the following inputs: coke, refined petroleum and nuclear fuel, mining and quarrying, and electricity, gas and water supply; excludes sales, maintenance, and repair of motor vehicles and motorcycles, and retail sales of fuel. Data are for 2011 for the Europe-30 excluding Croatia, Norway, and Switzerland. SOURCE: The World Input-Output database; McKinsey Global Institute analysis Industries in which energy plays a less important role in the generation of output can thrive and be internationally competitive even in an environment of high energy costs. A recent study found that countries facing high energy prices were successful at exporting products that required less energy to make, while creating more jobs and higher value added, than the goods exported by countries with lower energy prices.96 In a similar vein, a European Commission analysis of real unit energy costs found that the European manufacturing sector was maintaining its cost competitiveness by improving on energy intensity.97 There is an opportunity to leverage best practice across the continent in order to expand Europe’s leading position on energy intensity to all of its regions. The energy intensity of the Baltics and Central and Eastern Europe together stood at 267 tonnes of oil equivalent per million US dollars of GDP—1.4 times that of Continental Europe and 2.4 times that of the United Kingdom and Ireland, for instance.
The largest potential savings lie in the industry and household sectors, which consume about half of total energy and have the largest variations in energy intensity among countries (Exhibit 46). Georg Zachmann and Valeria Cipollone, “Energy competitiveness”, in Manufacturing Europe’s future, Reinhilde Veugelers, ed., Bruegel Blueprint Series, volume XXI, 2013. 97 Energy economic developments in Europe, European Commission, January 2014. 96 74 McKinsey Global Institute 2. Reform—much of it national—can deliver growth . Exhibit 46 Energy intensity can be reduced through improved energy efficiency, particularly in industry and among households Variation in energy intensity1 in Europe,2 2013 Tonnes of oil equivalent per million $ 2005 Nordics Continental Europe United Kingdom and Ireland Leaders3 Europe-30 Southern Europe Baltics Share in final energy consumption % Followers3 Transport 75 14 14 Switzerland United Kingdom 15 22 Denmark 42 Romania Croatia Bulgaria 136 23 23 26 Spain Portugal 27% 42 Households4 91 Central and Eastern Europe 25% 102 44 Switzerland Romania Poland Industry Bulgaria 315 167 24% 183 90 35 35 Switzerland United Kingdom 40 Denmark Romania Services4 52 10 United Kingdom 11 12 Switzerland Denmark Finland 60 Bulgaria 61 13% 20 Czech Republic Slovakia Bulgaria 1 Energy intensity of transport = transport energy use divided by GDP; energy intensity of households = climate-corrected household energy use divided by private consumption; energy intensity of industry (services) = industry (services) energy use divided by value added of industry (services). 2 Europe-30 except for households; Croatia, where energy-intensity data are not available, is not included. Data for Switzerland are for 2012. 3 Leaders and followers are the top and bottom three countries in terms of energy intensity in Europe-30 with populations of >5 million. 4 Climate-adjusted. SOURCE: Enerdata; Eurostat; McKinsey Global Institute analysis McKinsey Global Institute A window of opportunity for Europe 75 . Energy intensity within sectors in Europe varies widely. Laggards can be five times as energy-intensive as leaders. Of the four key sectors, the variation is greatest in industry. Denmark, Switzerland, and the United Kingdom have the most energy-efficient industrial sectors with energy intensities that are between four and nine times lower than in Bulgaria, Finland, and Romania, the most energy-intensive countries. This gap is due partly to the sector mix of these different economies.
In Bulgaria, Finland, and Romania, industries with high energy intensity, including steel, chemicals, non-metallic minerals, and paper, account for 70 to 80 percent of their total value added compared with 30 to 45 percent in best-practice countries. Yet improvements to energy intensity have often varied significantly across industries in these countries. Service sectors are far less energy-intensive than many industrial sectors. As Baltic and Central and Eastern European countries move along the usual development curve away from industry and towards services, energy intensity should naturally fall.
But this shift will take time. Today, industry (including construction) in these European regions accounts for almost 50 percent of their economies compared with only around 30 percent in the United Kingdom, for example.98 This means that, for now, energy prices are of greater concern for them. The share of energy input in economy-wide output is about 7 percent in the Baltics and Central and Eastern Europe compared with approximately 4 percent in the United Kingdom and Ireland.
Even within services, energy intensity can vary considerably. For example, the United Kingdom consumes ten tonnes of oil equivalent per million US dollars of value added in its services sectors—one-sixth the level in Slovakia. The transportation sector’s energy intensity is driven by a number of factors, including the share of road transport (accounting for 82 percent of total transport energy consumption in the EU), the efficiency of vehicles, and distances between hubs of economic activity. Continental Europe, the Nordics, and the United Kingdom and Ireland have the lowest transport energy intensity in Europe. In the Netherlands, strong tax incentives encouraging the adoption of efficient vehicles have been in place since 2006.
These include a bonuspenalty scheme that links the level of passenger car and motorcycle tax to carbon dioxide emissions per kilometre, as well as income tax incentives for efficient company cars. These measures have arguably contributed to the highest penetration of hybrid electric vehicles in Europe at 4.5 percent of car sales compared with 1 percent on average in the EU.99 The energy intensity of households in Europe is 44 tonnes of oil equivalent per million US dollars of private consumption largely due to high energy use in buildings in some European economies. Portugal, Spain, and Switzerland are Europe’s leaders in household energy efficiency (adjusted for differences in climate) with an energy intensity that is between 3.5 times and six times lower than that of households in Bulgaria, Poland, and Romania.
A key driver of energy efficiency among households is awareness of the costs of poor energy efficiency in the form of higher bills and of ways to tackle this. In economies in Central and Eastern Europe, policies aimed at increasing awareness and fostering energy efficiency in households have made progress, albeit only relatively recently. For instance, in 2009, the Czech Republic launched a scheme providing subsidies and grants for measures aimed at improving household energy efficiency.
Projects supported by the scheme included investments in home insulation, new construction that meets passive-energy house standards, and investments in heating equipment that relies on renewable sources of energy. In 2011, Poland required energy utilities to provide customers with comparisons of their electricity consumption with previous years, as well as with information on energyefficiency measures.100 Sector composition based on data from the CIA World Factbook. European vehicle market statistics 2013, International Council on Clean Transportation, October 2013. 100 Sara Pasquier and Aurelien Saussay, Progress implementing the IEA 25 energy efficiency policy recommendations: 2011 evaluation, International Energy Agency, March 2012. 98 99 76 McKinsey Global Institute 2. Reform—much of it national—can deliver growth .
Initiatives to change the game Between 2003 and 2013, the energy intensity in 30 European countries declined at an annual rate of 1.9 percent, and we believe progress on this front can continue. Further European progress on improving energy productivity and liberalising the gas and energy markets could result in an annual uptick in GDP growth of 0.13 percent. Among the imperatives that we see as most important are: 7.6% cut in energy consumption targeted by Denmark 2010–20 ƒƒ Use targets, standards, and fiscal policy to incentivise investment in energy productivity. While high energy prices are a major motivator for improving energy efficiency, government action is still necessary to address the many market failures and behavioural biases that undermine progress in this area.101 For example, investments in weatherised rental or leased properties don’t tend to happen because tenants, who pay the utility bills, would derive the benefit rather than the building owners. Similarly, consumers tend to buy cheaper but less energy-efficient appliances because it takes a relatively long time to reap the savings from the more energy-efficient choice.
In many cases, too, consumers don’t have the information they need to make the most sensible choice.102 Governments can address such issues in a variety of ways. Progressively higher energy-efficiency standards are a proven way to accelerate investments in energy efficiency. In Denmark, the government has set a target of reducing energy consumption by 7.6 percent between 2010 and 2020 through energy-efficiency measures.
From that overall target, regulations cascade down into each sector. Another way to promote energy efficiency is through fiscal policy. The EU’s Emissions Trading Scheme, which sets a price for carbon emissions, is, in effect, a tax on carbon-intensive energy use.
In the United States in 1977, then-President Jimmy Carter put forward a proposal known as the standby gas tax under which higher petrol taxes would be imposed every year that the United States failed to meet lower targets for petrol consumption, but with the income earned through the tax returned to citizens via income tax credits. The proposal was defeated in congressional committee. ƒƒ Accelerate progress towards a single European energy market. A Europe-wide energy market would promote competition and enable suppliers to achieve scale, thereby enhancing efficiency and reducing energy costs over the medium term.
The EU’s Third Energy Package recognised that initiatives were needed in a number of areas to make this happen. They include building numerous interconnectors between national energy markets, establishing a level playing field for domestic and international suppliers within individual countries, ensuring non-discriminatory access to transmission infrastructure, and allowing the resale of surplus energy purchases. While some progress has been made in this area, it has been largely incremental.
One step forward was the coupling of the electricity markets of the Czech Republic, Hungary, and Slovakia in 2012, which drove a convergence in power prices in these three economies. The fact that energy markets within Europe are designed differently is a constraint on market participants meeting demand from customers across the continent’s internal borders. Design differences within Europe include variations in price formation mechanisms such as gas-trading hubs and forward markets for electricity, and contractual structures like destination clauses that limit the trading of energy.103 A lack of infrastructure such as gas and power interconnectors among European economies makes trading across borders nearly impossible. In this regard, the EU’s Connecting Europe Facility—a €5.85 billion programme to build cross-border energy infrastructure—is an important start. Energy market report 2013: Market trends and medium-term prospects, International Energy Agency, 2013. Resource revolution: Meeting the world’s energy, materials, food, and water needs, McKinsey Global Institute, November 2011. 103 ACER/CEER annual report on the results of monitoring the internal electricity and natural gas markets in 2013, Agency for the Cooperation of Energy Regulators, October 2014. 101 102 McKinsey Global Institute A window of opportunity for Europe 77 .
Almost 30% of German electricity in 2014 from renewables ƒƒ Launch a cost-effective pan-European renewables and, provided environmental concerns can be addressed, unconventional oil and gas strategy. To enhance the security of supply and to foster industrial development, in recent years many European countries have provided incentives like feed-in tariffs to encourage the development of domestic production of renewable energy. Germany has taken this the furthest. In 2014, renewables accounted for almost 30 percent of German electricity production.104 The benefit of these schemes could be multiplied if they were to be rolled out Europe-wide and across many still-maturing technologies.
For example, subsidies for solar make more sense if they are directed towards the sunniest parts of Europe. Other frontier energy technologies could also be a target of assistance, including unconventional fossil fuels like shale gas and energy storage technologies. Shifting away from energy based on fossil fuels also reduces a country’s risk to future carbon regulations, or a rapid increase in the price of carbon dioxide, in the context of carbon markets. Bruno Burger, Electricity production from solar and wind in Germany in 2014, Fraunhofer ISE (Institute für Solare Energiesysteme), December 2014. 104 78 McKinsey Global Institute 2.
Reform—much of it national—can deliver growth . 5. SUPPORTING URBAN DEVELOPMENT Cities are the most dynamic centres of economic activity today. They create network effects, accentuate economies of scale in the provision of goods and services, enable more dynamic and flexible labour markets, and facilitate the transmission of knowledge and ideas. All of these boost productivity growth.105 Urbanisation and per capita GDP have moved in tandem for decades (Exhibit 47).106 Exhibit 47 Per capita GDP has risen in tandem with increases in the urbanisation rate Per capita GDP and urbanisation1 Per capita GDP2 1990 purchasing power parity $ (log scale) 30,000 Japan 2005 Germany 2005 Italy 2005 United States 2005 South Korea 2005 10,000 India 2005 3,000 China 2005 1950 1950 Brazil 2005 1820 1,000 1891 1930 1950 1920 1950 300 Increasing urbanisation rate % 1 Definition of urbanisation varies by country. 2 Historical per capita GDP series expressed in 1990 Geary-Khamis dollars, which reflect purchasing power parity. SOURCE: United Nations Population Division; Angus Maddison via Timetrics; IHS; census reports of England and Wales; Honda in Steckel and Floud,1997; Bairoch, 1975; McKinsey Global Institute analysis There is a large body of literature on urban economics focused on assessing the nature and size of urban economies of scale. See, for example, Edward L.
Glaeser and Joshua D. Gottlieb, The wealth of cities: Agglomeration economies and spatial equilibrium in the United States, NBER working paper number 14806, March 2009; World development report 2009: Reshaping economic geography, World Bank, December 2008; and Indermit S. Gill and Chor-Ching Goh, “Scale economies and cities”, World Bank Research Observer, volume 25, number 2, August 2010. 106 MGI has published extensively on urbanisation.
See Preparing for China’s urban billion, March 2009; India’s urban awakening: Building inclusive cities, sustaining economic growth, April 2010; Urban world: Mapping the economic power of cities, March 2011; Building globally competitive cities: The key to Latin American growth, August 2011; Urban America: US cities in the world economy, April 2012; Urban world: Cities and the rise of the consuming class, June 2012; and Urban world: The shifting global business landscape, October 2013. 105 McKinsey Global Institute A window of opportunity for Europe 79 . Europe is far less urbanised than either the United States or South Korea, for instance, and the share of people within Europe living in cities varies enormously. This suggests a considerable opportunity for some European economies to capture more of the economic benefits that urban living offers. While citizens should be free to choose where they want to live, and megacities (with populations of ten million or more) face particular challenges, there are barriers to rural-to-urban migration that should be removed, including high levels of support per capita in rural areas through the Common Agricultural Policy (CAP), high price-to-income ratios for housing, and low satisfaction with urban infrastructure. Europe can more broadly apply funding approaches such as property-value capture to support urban redevelopment, including affordable housing and the expansion of infrastructure, as Spain has done, and focus more on citizen-friendly provision of public services.
Cities that are experiencing significant emigration need to up their game in competing for talent at a European and even global level. Accelerating its rate of urbanisation to that of the Netherlands, the fastest urbanising country between 2000 and 2012, could generate an additional 0.09 percent of real GDP growth for Europe per annum. 30 percentage point difference between Europe's most and least urbanised regions Where Europe stands European cities started to grow and proliferate rapidly in the 18th century, but Europe’s urbanisation rate today still lags behind that of many other developed regions, and it varies enormously within the continent. According to recent data from the MGI Cityscope database, which uses a definition of urban areas derived from population density and travelto-work flows, only about 60 percent of Europe’s population can be classified as urban.107 This is well below the urbanisation rates in other developed economies, including South Korea at 87 percent, Japan at 82 percent, the United States at 81 percent, and Canada at 65 percent.
Within Europe, there is a difference of 30 percentage points between the most urbanised region (the United Kingdom and Ireland) and the least urbanised one (Central and Eastern Europe). These disparities clearly point to considerable scope for Europe to boost economic growth by stepping up the development of towns and cities, especially in regions that are still comparatively rural (Exhibit 48). Cityscope is a McKinsey Global Institute global database of more than 2,500 cities that brings together MGI research on cities. For a detailed explanation of the methodology used to define cities and map socioeconomic factors across regions, see Urban world: Cities and the rise of the consuming class, McKinsey Global Institute, June 2012. 107 80 McKinsey Global Institute 2.
Reform—much of it national—can deliver growth . Exhibit 48 There is significant scope to increase the urbanisation rate across Europe, particularly in Central and Eastern Europe and the Baltics Degree of urbanisation, 20121 % of population South Korea 87.1 81.7 Japan United States Canada 81.2 65.3 Absolute growth, 2000–122 % United Kingdom and Ireland 69.1 +2.7 Continental Europe 69.0 +2.5 Southern Europe Nordics Mexico Turkey 53.4 +2.2 +1.3 62.0 Baltics Europe-30 62.1 60.6 49.0 Central and Eastern Europe 44.4 39.0 -0.4 +0.3 1 Harmonised definition of urban areas on basis of population density and travel-to-work flows. 2 Absolute urbanisation growth calculated on the basis of UN urbanisation data (administrative definition of urban areas) and scaled to 2012 urbanisation rates based on MGI Cityscope database. SOURCE: MGI Cityscope database; Eurostat; United Nations Population Division; McKinsey Global Institute analysis McKinsey Global Institute A window of opportunity for Europe 81 . Over the past 15 years, however, Europe’s least urban countries, which are mostly located in Central and Eastern Europe and the Baltics, have not become significantly more urban; indeed, their rates of urbanisation have been static at best (Exhibit 49). Despite these countries’ low starting position on urbanisation, and even though some of their cities have experienced significant rises in per capita incomes, their urban areas have not managed to attract citizens in greater numbers. For example, Bulgaria’s capital city of Sofia and Romania’s capital city of Bucharest posted per capita GDP growth of more than 13 percentage points a year between 2000 and 2011, but their populations did not grow. Exhibit 49 Urbanisation in Central and Eastern Europe and the Baltics has been sluggish despite a low starting point in 2000 Size = Population, 2013 Nordics Continental Europe Urbanisation Compound annual growth rate, 2000–12, % United Kingdom and Ireland Southern Europe Baltics Central and Eastern Europe 1.3 1.2 Netherlands 1.1 Portugal 1.0 0.9 0.8 0.7 Hungary 0.6 United Kingdom Bulgaria 0.5 Ireland 0.4 Luxembourg Croatia Norway 0.3 0.2 Greece France Denmark Romania 0.1 0 Slovenia -0.1 Italy Lithuania Switzerland Czech Republic Belgium Austria Cyprus Estonia -0.3 Malta Germany Sweden Poland Latvia -0.2 Finland Spain Slovakia -0.4 20 25 30 35 40 45 50 55 60 65 70 Average urbanisation level, 2000 75 80 85 90 82 McKinsey Global Institute 2. Reform—much of it national—can deliver growth 100 Urbanisation rate, 20001 % 1 2000 urbanisation rates obtained by applying historic UN urbanisation growth rates to MGI Cityscope database urbanisation rate from 2012. SOURCE: United Nations; MGI Cityscope database; Eurostat; McKinsey Global Institute analysis 95 .
Rather than catching up with their more urbanised European peers, regions with relatively low urbanisation rates have experienced further declines in their city populations. For example, urbanisation rates decreased in seven countries in the Baltics and Central and Eastern Europe between 2000 and 2012. In some cases, including the Baltic countries and Poland, the decline in the urban population has outpaced the decline in their overall populations (Exhibit 50). Exhibit 50 Among countries whose populations have shrunk, only Hungary, Croatia, and Germany increased flows to cities Urbanisation trend decomposed by urban and total population growth Compound annual growth rate, 2000–12, % Population change -0.2 Hungary Growing urban population Positive urbanisation rate 0.4 -0.2 Croatia 0.1 -0.1 Germany Urban population shrinking at slower rate 0.1 -0.4 Romania -0.2 -0.7 Bulgaria -0.2 -0.1 Poland Negative urbanisation rate Urban population shrinking at faster pace -0.2 -0.3 Estonia -0.5 -0.9 Latvia Lithuania Urban population change -0.9 -1.0 -1.1 SOURCE: United Nations; McKinsey Global Institute analysis McKinsey Global Institute A window of opportunity for Europe 83 . Why are cities, especially in the Baltics and Central and Eastern Europe, not growing faster despite rising incomes that should, theoretically, attract workers looking for better jobs and a higher quality of life? Broadly speaking, there are “push” and “pull” factors that persuade migrants to move from rural to urban areas. An example of a push factor is a paucity of wellpaid jobs in the countryside; a pull factor is the promise of better public services in cities. In the case of Europe’s less urbanised regions, both types of factor come into play: ƒƒ Push factors. One of the factors limiting the migration of less productive rural workers to cities where incomes tend to be higher and job prospects arguably more promising is the existence of extensive subsidies for the rural economy.
These subsidies artificially enhance incomes in rural areas and therefore potentially discourage citizens from moving to more urbanised areas. The EU’s Common Agricultural Policy supports rural regions through direct payments to improve farmers’ incomes and subsidies to foster rural development. Despite the fact that agriculture accounts for only 5 percent of European jobs, the CAP commands 40 percent of the EU budget (approximately €60 billion in 2013, of which three-quarters was in the form of direct income subsidies to farmers).
These subsidies weaken the push towards urbanisation (Exhibit 51). CAP transfers are particularly large compared with rural per capita GDP in Bulgaria and other countries where urbanisation rates are lowest and where incentives to live and work in rural areas are least needed. Citizens in Greece and Latvia pay 12–14X annual income to buy a house vs. 5X in Ireland ƒƒ Pull factors. Cities can attract people from other areas by becoming more competitive. This is especially relevant for countries in the Schengen area, where cities no longer compete on a national scale but rather a Europe-wide scale.108 This may go some way towards explaining the declining urban populations of countries in the Baltics and Central and Eastern Europe.
Competitive cities tend to have a favourable regulatory environment for business, strong institutions, simple and transparent city-level policies, efficient infrastructure, and good-quality educational and training provision.109 These elements can attract both the businesses that provide jobs and the people who fill them. Affordable housing is another vital pull factor for cities. As analysed in detail in recent MGI research, a lack of decent housing as well as excessive costs for renting or acquiring it is an increasingly urgent social and economic problem around the world.110 Within the EU, an estimated 5 percent of the population faces severe housing deprivation (defined as living in overcrowded or substandard housing conditions), and many more are financially overstretched due to high housing costs. On this score, different locations within Europe vary enormously.
In terms of buying a house, affordability is a particularly pressing issue in Central and Eastern Europe as well as Southern European countries such as Greece and Italy (Exhibit 52). Citizens in these economies have to pay, on average, 12 to 14 times their annual income to buy a house, compared with five times in Ireland and six times in Germany or the Netherlands. In other countries, the affordability challenge is more concentrated in particular cities such as London or Paris, where newcomers often find it difficult to find housing that offers reasonable value for money. The Schengen Area comprises 26 European countries that have abolished passport and any other type of border control at their common borders, also referred to as internal borders. 109 The competitiveness of cities, World Economic Forum, August 2014. 110 A blueprint for addressing the global affordable housing challenge, McKinsey Global Institute, October 2014. 108 84 McKinsey Global Institute 2.
Reform—much of it national—can deliver growth . Cities whose populations are declining urgently need to respond to this trend by boosting their competitiveness. In order to drive growth in their urban economies, they will have to attract new inhabitants, not only from other cities but most importantly from rural areas in the same countries. The demographics of European rural areas underline the economic potential of spurring rural-to-urban migration. People of prime working age constitute a share of the total rural population very similar to that of urban areas (67 percent and 66 percent, respectively).
The performance of many European economies could be enhanced significantly if a greater share of working-age rural people moved to cities and into higher-productivity jobs, while still striking a productive balance between the deployment of labour in rural and urban areas. Exhibit 51 Common Agricultural Policy transfers per rural inhabitant are high in countries with low urbanisation rates Size = GDP, 2012 Nordics1 Continental Europe2 United Kingdom and Ireland Southern Europe3 Baltics Central and Eastern Europe4 Urbanisation rate, 2012 % 90 R-squared = 26.7% 85 Belgium 80 Netherlands 75 United Kingdom 70 65 Austria Germany Spain Cyprus 60 Italy Portugal France 55 Sweden 50 Slovenia 40 Greece Czech Republic Finland 45 Lithuania Denmark Poland Estonia Hungary Latvia 35 Slovakia 30 Bulgaria Ireland Romania 25 20 0 0.5 1.0 1.5 2.0 2.5 3.0 3.5 4.0 4.5 5.0 5.5 6.0 EU Common Agricultural Policy transfers, 2013 Percentage share of rural per capita GDP 1 2 3 4 Excluding Excluding Excluding Excluding Norway. Switzerland and Luxembourg. Malta. Croatia. SOURCE: European Commission; MGI Cityscope database; United Nations; McKinsey Global Institute analysis McKinsey Global Institute A window of opportunity for Europe 85 . Exhibit 52 Price-to-income ratios vary significantly within Europe, with ratios highest in the Baltics and Central and Eastern Europe Price-to-income ratio for housing , 2014 Nordics Continental Europe United Kingdom and Ireland Southern Europe Baltics Central and Eastern Europe Romania 13.8 13.5 Latvia 13.4 Croatia Malta 12.5 Greece 12.5 Italy 12.4 Lithuania 11.5 Estonia 10.8 10.5 Poland Bulgaria 10.0 Spain 9.9 Slovenia 9.9 Slovakia 9.3 France 9.3 9.0 Hungary 9.0 Czech Republic 8.5 Portugal 8.3 Austria 7.9 Norway United Kingdom 7.2 Luxembourg 7.1 Finland 7.0 Switzerland 7.0 Cyprus 6.8 Sweden 6.8 6.6 Belgium 6.4 Denmark Netherlands 6.1 Germany 6.1 5.5 Ireland SOURCE: Numbeo; McKinsey Global Institute analysis 86 McKinsey Global Institute 2. Reform—much of it national—can deliver growth . Initiatives to change the game If Europe acted to boost the rate of urbanisation across the region and, in particular, in the Baltics and Central and Eastern Europe, an additional 0.09 percent of real GDP growth per annum could be generated. This estimate assumes that all European countries accelerate the growth of their urban population to the rate of the fastest urbanising country between 2000 and 2012 (the Netherlands with 1.2 percent per year) while maintaining the difference in labour productivity between rural and urban areas. To make this happen, European governments should consider taking action in the following areas: ~80% of survey respondents in Luxembourg satisfied with public transport vs. 40% in Cyprus ƒƒ Enable urban redevelopment and expansion, supported by regulatory changes and property-value capture. For cities to attract people, they must have the capacity to support growth. Transport infrastructure—within cities, between city centres and suburbs, between cities, and between rural and urban areas—is a vital enabler for urban expansion.
When asked about their satisfaction levels with public transport, around 80 percent of respondents in Finland, Latvia, and Luxembourg said that they were satisfied, in contrast to the 45 to 50 percent of respondents in Cyprus and Italy who expressed the same view.111 Best-practice cities have been able to finance expansion of infrastructure through innovative funding mechanisms such as property-value capture, in which increases in the value of land near developments are used to fund projects. While urban development can boost the competitiveness of a city, projects often face regulatory barriers such as zoning restrictions that need to be tackled. In 1982, the government of the United Kingdom simplified the process for obtaining planning permission for ten years in order to redevelop derelict docklands to the east of London’s city centre. This led to the development of the Canary Wharf financial centre that today employs more than 100,000 people. Hamburg’s experience of building HafenCity, Europe’s largest development zone, offers a potential model for how to construct cost-effective infrastructure that enables highdensity development.
HafenCity Hamburg GmbH, a subsidiary of the Hamburg citystate government, planned and is managing the project that began in 2000 to reclaim 127 hectares in the former harbour areas near the city centre. It works closely with the private sector and the city-state government to review and approve projects, and revise the master plan according to macroeconomic conditions and feasibility reports. The project is not due for completion until 2025 but, even today, HafenCity has enlarged the city centre by 40 percent, created 45,000 jobs at 500 companies, and developed 6,000 homes.
HafenCity Hamburg GmbH has invested in streets, plazas, public transport systems, and the quay wall. By 2025, the company expects to break even and will subsequently pay taxes that will flow to the city-state. ƒƒ Develop affordable housing. Even if a city attracts employers and develops highquality infrastructure to support growth, people will not flock there if no affordable housing is available.
Cities can improve on this dimension by unlocking land supply, taking an industrial approach to development, building scale efficiency, and assisting in developer financing.112 For example, developers were able to sell half of the residential units in Barcelona’s La Marina development at one-third of market rates and still maintain a positive business proposition by increasing the 1.0 floor-area ratio to 2.3. By pooling demand, one consortium dedicated to buying social housing in the United Kingdom was able to reduce operations and maintenance costs in certain categories by 25 percent. Since such costs can account for 20 to 30 percent of annual housing expenditure, Europeans’ satisfaction with urban transport, Flash Eurobarometer 382b, European Commission, June 2014. A blueprint for solving the global affordable housing challenge, McKinsey Global Institute, September 2014. 111 112 McKinsey Global Institute A window of opportunity for Europe 87 . effective asset-management guidelines set by the government can improve the affordability of housing. ƒƒ Remove barriers to rural-urban migration and improve city attractiveness for talent. Europe can boost productivity by making sure that top talent goes to the right places. Given the trend of workers moving to more attractive cities within Europe that offer better prospects, it is imperative that governments remove barriers to both ruralurban migration and intercity migration. Existing incentive schemes such as the CAP tend to discourage rural workers from moving and artificially inflate the share of workers employed in agriculture and other less-productive industries.
Across Europe, there is a negative association between the amount of rural development support on offer on a per capita basis and the degree of urbanisation. This incentive to stay in rural areas poses a particular challenge in less-urbanised countries, where emigration to more competitive cities abroad depletes the urban workforce. To reverse this trend, regions such as the Baltics and Central and Eastern Europe should consider how to foster urban settings that enable them to retain talent. A positive example in this respect is the city of WrocÅ‚aw in Poland, which launched a comprehensive “strategy on preventing youth migration” in 2012 to complement the city’s economic development efforts.
This strategy covers a wide range of priority actions, including a regional “flexicurity” model to reduce youth unemployment, affordable housing tailored to young people, and improved child-care services. Another element of an attractive city is citizen-centric government services. Many municipalities in the United Kingdom have been grappling with shrinking budgets but have still managed to restructure their departments to improve their service to customers even while improving cost-effectiveness.
For example, Somerset County Council went through a radical transformation effort triggered by budgetary pressure. The council realised that, in order to maximise the value it delivers, employees at all levels needed to develop the right capabilities. Nine behaviour sets were created for employees—from the front line to executives—against which employees were assessed.
A complementary training programme was put in place to address any development needs. A transition from a command-and-control model to greater ownership for service delivery at the point of customer contact improved customer satisfaction and has kept employee relations positive. 88 McKinsey Global Institute 2. Reform—much of it national—can deliver growth .
6. COMPETITIVE AND INTEGRATED MARKETS IN SERVICES AND DIGITAL Despite Europe’s being one of the world’s most powerful regional economies, its productivity growth in services, including digital, has long lagged behind that of the United States. There is scope to reform the regulation governing many service activities in order to respond more effectively to the needs of the modern marketplace. Regulation varies significantly within Europe.
For example, in the Czech Republic, 395 professions are licensed—restricting market entry, reducing supply, and raising prices—compared with only 45 licensed professions in Estonia. Reforming land markets in Sweden resulted in a change in store formats and a major acceleration of productivity growth in the retail sector. Beyond regulation, an equally important lever for enhancing competitiveness and productivity is further integration of markets through Europe’s Single Market legislation.113 Today, the European Commission estimates that only around 40 to 50 percent of the potential impact of the EU Services Directive has been realised because of poor implementation and enforcement of the rules in some countries.114 We find that, in many cases, countries with the most infringements against the Services Directive between 2002 and 2012 also achieved the least productivity growth in services. Major initiatives within this growth driver include dismantling the remaining barriers to the competitive provision of services, fully implementing the Services Directive, developing a single European sky (coordinated air traffic management), and increasing connectivity and competition in rail as well as road haulage. Europe would also benefit from an integrated pan-European digital market.
Today, Europe’s telecoms and digital infrastructure remains fragmented, with high price variations. There are 250 collective management organisations in Europe for digital content, many with national monopolies in specific sectors. Further integration, including data and consumer protection rules, is needed.
Ensuring competitive transnational markets in services and digital could result in 0.43 percent of incremental real GDP growth. Services generate ~70% >70% of EU GDP and of jobs Where Europe stands Despite accounting for only 7 percent of the world’s population, the 30 European countries generated €14.1 trillion of GDP in 2013, or 25 percent of the world’s total compared with 22 percent for the United States and 13 percent for China.115 Creating a frontier-free economic region among its constituent nations is a defining purpose of the EU, which has pursued the integration between the economies of its member states since its inception. In 1986, with the adoption of the Single European Act, the EU established the free movement of goods, services, capital, and people within its borders. However, despite significant progress towards creating a true single market, significant barriers to cross-border trade remain. Within countries, the regulatory framework for certain products and services continues to act as a brake on competition and improvements in productivity.
This is partly as a result of a disconnection between the spirit of the policies As a member of the European Economic Area (EEA), Norway fully applies the entire acquis communautaire relevant to the free movement of goods, persons, services, and capital. Switzerland is not a member of the EEA, but it, too, enjoys full access to the Single Market, governed by around 100 bilateral agreements. The future of this privileged access is, however, in jeopardy following a referendum in Switzerland in February 2014 that called for the unilateral introduction of quotas for migrants from EU countries.
Both Norway and Switzerland are members of the European Free Trade Association, which governs their trade relations with non-EU countries. 114 Josefa Monteagudo, Aleksander Rutkowski, and Dimitri Lorenzani, The economic impact of the Services Directive: A first assessment following implementation, European Commission economic paper number 456, June 2012. 115 EU-28, plus Norway and Switzerland, 2013 GDP figures. See World economic outlook: Legacies, clouds, uncertainties, IMF, October 2014. 113 McKinsey Global Institute A window of opportunity for Europe 89 . agreed at the European level, the letter of the laws used to transpose these policies onto the national statute books, and the specific measures implemented to make them a reality. Overall, there is considerable scope to more fully translate European directives into tangible change. Governments could adopt ambitious and open approaches to ensure that their economies reap the greatest possible benefit of integration rather than doing just enough to avoid facing an infringement case before the European Court of Justice. Member states can also benefit by building on the EU measures to develop additional domestic policies to promote competition and productivity. The need to redouble efforts to integrate and liberalise Europe’s economy is particularly significant in the services sector. Services account for roughly 70 percent of EU GDP and more than 70 percent of EU employment.
However, most of the consumption of services happens within national borders. Exports of services within the EU stood at just 6 percent of GDP in 2012, while the equivalent figure for goods exports stood at 22 percent, up ten percentage points since 1992. A survey commissioned by the European Commission in 2013 explored consumer attitudes to the markets of goods and services.
Looking at market comparability, trust, complaints, expectations, and choice (and ease) of switching, it found that consumers still view the performance of the Single Market less positively in the case of services than for goods, suggesting that they find it less complete.116 The locally and nationally focused provision of services in Europe has important consequences for productivity. In the run-up to the global financial crisis, European productivity growth in goods had been on a par with that in the United States. However, productivity growth in services lagged behind that of the United States by 30 percent (Exhibit 53). Economic integration has many drivers, including factors that are difficult for policy makers to control, such as geographic distance and linguistic or cultural barriers.
Nevertheless, policy plays an important role.117 The OECD’s Services Trade Restrictiveness Index tracks the policy measures that most affect trade, with scores running between 0 (completely open) and 1 (completely closed). Although European economies are comparatively open overall with a score of 0.17, there is significant variation among countries as well as between sectors of the economy (Exhibit 54). To an extent, gaps in EU legislation and the incomplete transposition, implementation, and enforcement of Single Market legislation by EU member states have stood in the way of deeper integration.118 The five priority areas for completing the Single Market are those with the greatest potential for additional growth: boosting integration and competition in the services sector; completing the integration of Europe’s transport networks; fostering the digital single market; consolidating the market in financial services; and constructing a unified European energy market. Since finance and energy are discussed elsewhere in this report, this section focuses on the first three.119 See A single market for growth and jobs: An analysis of progress made and remaining obstacles in the member states, European Commission, November 2013, and Monitoring consumer markets in the European Union 2013 Part I, European Commission, August 2013. 117 Natalie Chen and Dennis Novy, International trade integration: A disaggregated approach, CEP discussion paper number dp0908, Centre for Economic Performance, London School of Economics, January 2009. 118 There are currently more than 1,600 directives that regulate the EU internal market, and most countries have correctly transposed this legislation into national law.
Only five countries—Austria, Belgium, Cyprus, Romania, and Slovenia—have adopted less than 99 percent of Single Market legislation. However, these numbers don’t consider how strictly EU legislation is enforced in national markets. In EU law, member states transpose directives by passing implementation measures through either primary or secondary legislation. 119 The free movement of people is also an area with significant gaps, as seen by the low mobility between EU member states.
Barriers to labour-market mobility are addressed in the discussion of enhanced labourmarket flexibility. 116 90 McKinsey Global Institute 2. Reform—much of it national—can deliver growth . Exhibit 53 Europe’s trade in goods is much more integrated than trade in services Trade integration and productivity growth Trade integration Trade intensity, 1992–20121 % Services3 Productivity growth Contribution to labour productivity increase, 1995–20072 Percentage points 18.3 12.9 3 6 22 Goods4 12 19925 1 2 3 4 5 -5.4 9.7 2012 United States 8.9 -0.8 Europe-25 Intra-EU exports as a percentage of GDP. Value added (at constant prices) per hour worked; sector weightings on the basis of 1995 levels. Private and public services; NACE classification groups L–Q. Resources and manufactured goods; NACE groups A–D. Intra-EU exports in 1992 refer to the composition of EU at the time. SOURCE: EU KLEMS growth and productivity accounts, March 2011 update; OECD; Eurostat; McKinsey Global Institute analysis McKinsey Global Institute A window of opportunity for Europe 91 . Exhibit 54 Ranking barriers to services trade reveal large differences between sectors and among countries STRI1 Barriers vary between different sectors … … and among countries GDP weighted average Sector Distribution Country Netherlands 0.09 Unweighted sector average 0.10 Construction 0.10 United Kingdom 0.13 Commercial banking 0.11 Germany 0.14 Telecom 0.11 Luxembourg 0.14 Computer 0.13 Denmark 0.15 Rail freight transport 0.13 Ireland 0.15 Sound recording 0.13 France 0.15 Insurance 0.14 Spain 0.16 Motion pictures 0.14 Slovenia 0.16 Courier 0.14 Hungary 0.16 Road freight transport 0.14 Czech Republic 0.17 Maritime transport 0.15 Sweden 0.17 Belgium 0.18 Engineering Architecture Broadcasting Legal 0.17 Portugal 0.19 Italy Air transport 0.36 European economies average 0.21 Norway 0.26 0.21 Finland 0.20 0.24 Accounting 0.19 0.22 Estonia 0.22 Greece 0.22 Austria 0.24 Switzerland 0.25 Poland 0.25 OECD average 1 OECD Services Trade Restrictiveness Index describes ease of cross-border trade in services. Averages for OECD countries in Europe, 0–1, where 0 = no barriers at all, and 1 = fully regulated monopoly. SOURCE: OECD; McKinsey Global Institute analysis 92 McKinsey Global Institute 2. Reform—much of it national—can deliver growth . Boosting integration and competition in the services sector The main vehicle for driving integration of services in the EU is the Services Directive of 2006. Activities covered by the directive accounted for 63 percent of intra-EU services exports in 2008.120 The centrepiece of the directive is a “freedom to provide services” clause that stipulates that member states should not impose their national requirements upon incoming service providers unless these requirements are non-discriminatory and justified by reasons of public policy, public safety, public health, or the protection of the environment.121 It also prohibits discriminatory requirements such as nationality and residence requirements or requirements such as “economic needs” tests, and establishes single points of contact in every member state as e-government portals for entrepreneurs active in the service sector. Finally, the directive contains measures to strengthen consumers’ rights, including non-discriminatory requirements, and disclosure and transparency requirements. While the Services Directive has formally been adopted by all EU member states, the degree to which its aims are realised in practice varies among countries. The European Commission’s “zero-tolerance” approach, proclaimed in 2012, has prompted some member states to implement further reforms.
However, significant restrictions on foreign services companies still exist. The European Commission estimates that only between 40 and 50 percent of the potential positive impact on GDP of the Services Directive has been realised thus far because of poor implementation and enforcement of the rules.122 If all member states were to reduce the level of restrictions to that of the five best countries in the EU per sector, additional gains amounting to 1.6 percent of GDP are projected.123 The sluggish pace of reform in some sectors is likely to have limited productivity gains in the services sector. In many cases, countries with high compliance with the Services Directive between 2002 and 2012 were also those that achieved high productivity growth in services over this period (Exhibit 55). Beyond the implementation of Single Market legislation to facilitate cross-border provision of services, effective competition in local services is often hampered by technical and administrative barriers at the national level.124 These include lengthy procedures for registering new businesses, opaque public tenders, and complex national legislation on taxation and labour standards.
Such barriers impose high costs on the providers of services, particularly small companies, and therefore reduce the potential for productivity gains through competition.125 Some progress has been made in this area in recent years, according to the OECD’s Indicators of Product Market Regulation, which tracks the openness of regulatory policy on a scale of 0 (most open) to 6 (least open). Even throughout the economic crisis, this index for European countries fell from an average of 1.45 in 2008 to 1.33 in 2013. The main reasons Services covered are distributive trades, including retail and wholesale; regulated professions (e.g., legal and tax advisers, architects, engineers); construction services and crafts; business-related services (e.g., management consultancy, advertising); tourism and leisure services (e.g., travel agents, sports centres); installation and maintenance of equipment; information society services (e.g., publishing, news, programming); accommodation and food services (hotels, restaurants, caterers); training and education services; rentals and leasing services, including car rental; real estate services; and household support services (e.g., cleaning, nannies). 121 Directive 2006/123/EC on Services in the Internal Market. 122 Josefa Monteagudo, Aleksander Rutkowski, and Dimitri Lorenzani, The economic impact of the Services Directive: A first assessment following implementation, European Commission economic paper number 456, June 2012. 123 Ibid.
Also see Better governance of the Single Market: An assessment accompanying the European Parliament’s legislative own-initiative report (rapporteur Andreas Schwab MEP), European Added Value Assessment number 2, 2013, and A single market for growth and jobs: An analysis of progress made and remaining obstacles in the member states, European Commission, November 2013. 124 A single market for growth and jobs: An analysis of progress made and remaining obstacles in the member states, European Commission, November 2013. 125 Ibid. 120 McKinsey Global Institute A window of opportunity for Europe 93 . for this decline were a reduction in the administrative burden on starting a new business and a decline in the complexity of regulatory procedures.126 Nevertheless, Europe still lags significantly behind the United States, which was already scoring as low as 1.11 in 2008 (Exhibit 56).127 Exhibit 55 European countries that have high compliance with the EU Services Directive had higher services productivity growth from 2002 to 2012 Nordics Continental Europe United Kingdom and Ireland Southern Europe Baltics Central and Eastern Europe Services1 productivity growth, 2002–122 Compound annual growth rate, % 3.0 Bulgaria 2.5 Czech Republic Poland 2.0 United Kingdom Greece Ireland Denmark 1.5 Slovakia 1.0 France Netherlands Hungary 0.5 Sweden Portugal Finland Belgium 0 Germany Austria -0.5 -1.0 Spain Italy -1.5 0 2 4 6 8 10 12 14 16 18 20 22 24 26 28 30 Number of infringement cases in service sector, 2002–12 1 Private services only (NACE G–K) excluding education, health care, and social services (NACE L, M, N, O) due to value-added measurement difficulties. 2 Calculated as growth of value created by sector development relative to the numbers of hours input. Not Fisher chain-weighted. Trend triangulated and verified with EU KLEMS and Eurostat value-added data. SOURCE: IHS value-added data; Eurostat; European Commission; McKinsey Global Institute analysis OECD, Indicators of Product Market Regulation. The GDP-weighted average product-market regulation for 2013 is for the EU-28 plus Norway and Switzerland.
The 2008 average excludes non-OECD members (Bulgaria, Croatia, Cyprus, Latvia, Lithuania, Malta, Romania) as no data are available. 127 Data collected at five-year intervals; 2013 data are extrapolated for the United States. 126 94 McKinsey Global Institute 2. Reform—much of it national—can deliver growth . Exhibit 56 Europe has gradually liberalised product market regulation—even during the economic crisis—but significant variations persist among countries OECD Product Market Regulation Index Economy-wide regulation (0 = least regulated; 6 = most regulated) 3.5 3.0 Poland 2.5 France 2.0 EU1 1.5 Germany 1.0 United Kingdom Average product market regulation in Europe fell from 2.1 in 1998 to 1.33 in 2013 0.5 United States2 0 1998 2000 2003 2008 2013 1 GDP-weighted average. Due to the absence of historical data on product-market regulation, excludes Bulgaria, Croatia, Cyprus, Latvia, Lithuania, Malta, and Romania before 2013. Excludes Slovenia before 2008. Excludes Luxembourg and Slovakia before 2003. 2 2013 data for the United States not available. SOURCE: OECD Indicators of Product Market Regulation Many European countries effectively grant monopolies to professionals in certain sectors through regulations that erect high barriers to entry.
For example, by limiting the number of licenced pharmacies within their jurisdiction and granting exclusive rights to the sale of medicinal products, most European countries reduce consumer choice and the supply of service providers (for example, by preventing the sale of “over-the-counter” products in supermarkets). Similarly, attempts to protect consumers by banning advertising and marketing (by, for instance, notaries in France and Spain, and pharmacies in Greece) restrict competition and the potential for growth in these sectors. Moreover, the practice of implementing price ceilings or floors for certain professions (such as architects and lawyers in Germany and Greece) aimed at ensuring service quality and preventing overcharging in reality remove incentives to improve efficiency.128 The restrictions are arguably most severe in the case of regulated professions such as lawyers and accountants.
The number of licensed professions varies greatly within Europe, from 45 in Estonia to 395 in the Czech Republic.129 There is thus significant potential to further generate productivity gains by reducing some of the barriers faced by those in regulated professions. Many of the countries hit hardest by the economic crisis, including Greece, Italy, Portugal, and Spain, have made good progress in opening up competition in professional services over the past five years. However, in Belgium and Hungary, for instance, which were already lagging behind others in this respect, there has been no progress. Indeed, Hungary has gone in the opposite direction with the introduction of more restrictive educational requirements in the architecture and engineering professions.130 Beyond austerity: A path to economic growth and renewal in Europe, McKinsey Global Institute, October 2010. 129 Regulated professions in Hungary include bartenders, nail beauticians, and solarium owners. 130 OECD, Indicators of Product Market Regulation.
Data on professional services are disaggregated under sector regulation. 128 McKinsey Global Institute A window of opportunity for Europe 95 . The potential for greater competition and productivity is not limited to regulated professions. Construction is a large sector in Europe, accounting for 5 percent of GDP, but it has suffered from prolonged stagnation in productivity. The high labour intensity and fragmentation of the construction industry hinder the diffusion of organisational best practice and standardised processes.131 Standardisation in the industry overall is rather low and varies significantly among countries. For example, Finland’s use of standardised pre-fabricated materials in residential projects is seven times that of Denmark. Failing to capture the benefits of economies of scale associated with greater standardisation hampers Danish firms’ ability to compete internationally and hurts the sector’s productivity in that country.132 By contrast, the United Kingdom enjoyed one of the highest productivity-growth rates in construction in Europe of 1.7 percent over the period 1995 to 2005.
Its “Achieving Excellence in Construction” initiative is just one example of its innovative approach. The initiative launched a series of demonstration projects that integrated a range of best practice, including switching to a focus on life-cycle project costs instead of lowest initial offer prices and implementing clear cost transparency and cost-effectiveness measurements. In 2009, these demonstration projects had nearly double the productivity of the industry average while delivering more predictable construction times and project costs.133 Swedish retail 41% above average European productivity growth 1993–2007 The retail sector is another prime example of the potential to boost productivity through targeted government action.
The Swedish retail sector enjoys a remarkable productivity advantage, outperforming the European average by 41 percent between 1993 and 2007. One key reason for this was an amendment to the country’s Planning and Building Act in 1993 that required municipalities to take greater account of the competitive situation in decisions to award licences to retailers. By easing zoning restrictions and facilitating the growth of out-of-town superstores, the average size of new food-retail outlets doubled between 1990 and 2000. These larger stores were able to take advantage of scale in purchasing, supply-chain and store management, and marketing.
Advances in the use of IT improved supply-chain, assortment, and inventory management are also best-practice examples that other European countries could emulate.134 Completing the integration of Europe’s transport networks Another vital service sector with significant potential for improvement is transport. Achieving an integrated and competitive market in transport is important not only because this would boost the sector’s productivity but also because it would enable the integration of other sectors. European authorities have made efforts to deepen the integration of transport in seven areas: expanding an internal market for rail services; completing the single European sky; developing the capacity and quality of airports; putting in place a maritime “blue belt” (reduced or simplified customs procedures in ports); ensuring that there is a sustainable framework for inland navigation of waterways; taking action on road freight; and putting forth an initiative on e-freight (automation of the freight transport process through electronic information). Recent emphasis has been on rail and aviation, for which the European Commission launched major initiatives in 2013—the Single European Sky 2+ and the Fourth Railway Package. Beyond austerity: A path to economic growth and renewal in Europe, McKinsey Global Institute, October 2010. 132 Creating economic growth in Denmark through competition, McKinsey & Company, November 2010. 133 Beyond austerity: A path to economic growth and renewal in Europe, McKinsey Global Institute, October 2010. 134 Ibid; Growth and renewal in the Swedish economy: Development, current situation and priorities for the future, McKinsey Global Institute, May 2012. 131 96 McKinsey Global Institute 2.
Reform—much of it national—can deliver growth . While member states have been quick to transpose the seven Single Market directives on transport into national statute books, there is still some way to go to achieve full implementation of the legislation. The market remains significantly fragmented along national boundaries. The biggest gaps remain in rail, where national monopolies and a lack of transparency in public tenders limit cross-border competition.135 State-owned players dominate the sector, which prevents the development of competitive intensity. In France and Italy, for instance, incumbents hold a market share of more than 80 percent in rail freight although their shares were previously even higher. The passenger rail sector also remains mostly a closed shop with the exception of the United Kingdom, which holds competitive tenders for the provision of all regional rail services; Sweden, which holds competitive tenders for all regional rail services that cannot be profitable in a free market, with all others fully open; and Denmark and Germany, which require tendering for at least some lines.
However, there is still a tendency to underinvest in rail infrastructure. Projects often require complex government permissions and long planning processes that can delay or even cancel large-scale projects. Differing technical standards for signalling systems, power, and track gauges also hamper cross-border operations. Market opening has been more successful in road freight, but even in this case there are still restrictions.
For example, “cabotage” restrictions limit access to national road-haulage markets. This leads to an unnecessarily high number of empty return trips for non-resident hauliers.136 Moreover, truck sizes still differ among countries, meaning that goods have to be reloaded at borders. The use of swap bodies—standardised road-freight containers— instead of lorries or truck trailers facilitates the use of longer, more productive vehicles (albeit at a cost to the flexibility of loads).
Swap bodies are also easily transferrable from a road tractor to a train, leading to greater integration. Longer, modular trucks such as those used in Scandinavia would also increase productivity (but at the expense, opponents argue, of increased accidents and road wear). Productivity in the road-freight industry is also hampered by the high degree of fragmentation, with a large number of small operators lacking the advantages that come with scale. One reason for this is the high level of self-employment in the sector and its related “self-exploitation” circumventing labour regulation (the self-employed working more than would be allowed if they were employees), keeping small and less efficient players in the business.
In 14 countries for which data are available, 59 percent of companies in the sector have fewer than 20 employees.137 This fragmentation bears down on productivity. Larger companies employing more people have the advantage of smaller overheads per driver and can decrease the share of empty trucks through improved planning systems to reduce idle time and through more substantial investments in IT. Fostering the digital single market Europe would also benefit from an integrated pan-European digital market. The European Commission made creating a single digital market a priority in 2012, and action on this front has picked up. Since 2011, 14 directives have been adopted on key areas such as harmonising consumer rights, electronic identification, value-added taxes, and digital content rights, and have tended to be transposed by member states.
However, some barriers to a truly integrated digital economy remain. A single market for growth and jobs: An analysis of progress made and remaining obstacles in the member states, European Commission, November 2013. 136 Ibid. 137 Employment in goods road transport enterprises 2011 data from Eurostat. 135 McKinsey Global Institute A window of opportunity for Europe 97 . Every 10% increase in broadband penetration adds 0.6– 0.7% to GDP Some European countries—particularly in Central and Eastern Europe—lag behind on high-speed broadband penetration, and the uptake of mobile broadband has been hampered in many nations due to insufficient investment in the enabling networks. There is already a significant body of evidence that demonstrates the positive impact of access to broadband on stimulating economic growth. Cross-country analysis of the effects of broadband penetration suggests a 0.6 to 0.7 percent boost to GDP for every 10 percent of additional penetration.138 This boost includes direct effects (for example, investment in infrastructure, increased availability and penetration of services, and increased employment in the ICT sector) as well as indirect effects such as productivity benefits, job creation in related sectors, e-government benefits, improved health-care provision, and gains in energy efficiency. Mobile networks still tend to be national and fragmented, as revealed by wide price differences among countries. Average phone call prices in 2011 ranged from less than two euro cents per minute in Lithuania to almost 15 cents per minute in the Netherlands.139 Similar differences apply in flat-rate packages, with the cheapest offer in Austria costing less than a quarter of the most expensive offer in Germany. Online commercial activity, too, remains national in nature.
A 2013 Eurobarometer survey on the barriers to digital trade suggests that, for a significant proportion of Europeans, there is some way to go before they are comfortable participating in the online marketplace. Only 45 percent of those surveyed had made an online purchase within the preceding 12 months, and most of those purchases were made within the consumer’s home country. In essence, there are still large numbers of people who do not see the attraction of online purchasing—37 percent of those who had never made an online purchase simply preferred to buy in bricks-and-mortar shops, while 33 percent said they don’t need to shop online. However, there is also a lack of confidence in e-commerce as a medium, particularly when purchasing from abroad. While the share of respondents who encountered problems with e-commerce is the same for domestic and cross-border purchases, in the latter case respondents were significantly more uncertain whether products would be delivered and concerned about whether they would be reimbursed when the products were returned. Shipping costs were a much more important barrier to cross-border purchases than to domestic online purchases.140 For providers, too, there are barriers to cross-border online activities. The management of digital content and royalties is highly fragmented.
Currently, there are more than 250 content-management organisations (CMOs) in the EU that license copyrighted material and collect royalties for the right holders they represent, typically on a national basis. In the music sector alone, 25 CMOs, many of them acting as national monopolies, cover 27 countries; in the United States, by contrast, only three CMOs cover the entire country. Moreover, European countries have different value-added tax regimes, digital payment structures, e-identification systems, and data protection rules, all of which complicate cross-border digital trade. Scott C.
Beardsley et al., “Fostering the economic and social benefits of ICT”, in Global information technology report 2009–2010, Soumitra Dutta and Irene Mia, eds., World Economic Forum, March 2010. 139 European Commission press release, August 6, 2013. 140 Internal market, Special Eurobarometer 398, European Commission, October 2013. The concerns about data protection and payment security were comparable between domestic and cross-border purchases. 138 98 McKinsey Global Institute 2. Reform—much of it national—can deliver growth .
Initiatives to change the game Taken together, the further deepening of the Single Market and the boost to competition in the service sector from the measures outlined have the potential to increase annual European growth by up to 0.43 percentage points. If all countries implemented the Services Directive to the level of the five leading countries in each sector—which comes close to the elimination of all restrictions covered by the Services Directive—0.14 percentage points could be added to annual GDP over ten years, according to estimates prepared for the European Commission.141 Adopting best practice in competition and market integration for the regulated professions and other local service sectors could add a further 0.29 percentage points in annual growth. Creating an integrated digital sector is also a vital lever. According to an analysis by the European Parliamentary Research Service, this could boost annual GDP growth by 0.4 percent a year over the course of a decade.142 We do not include the estimate here due to possible overlap with other initiatives such as innovation. Since transport accounts for a much smaller share of GDP, the impact of creating an integrated transport market comes mostly from enabling productivity growth in other areas.
The European Commission has made extensive recommendations on how to achieve a true internal market.143 We second these efforts. But countries can also go beyond the spirit and letter of EU Single Market legislation and be bolder in unlocking productivity growth in these critical sectors: ƒƒ Dismantle remaining barriers to competitive service provision, and fully implement the EU Services Directive. Many European countries need to redouble their efforts to foster a truly competitive market in services, and to make the EU Services Directive a reality.
Many de facto barriers to competitive service provision, such as lengthy registration procedures or complex national regulations, remain in place. These barriers should be removed, especially in regulated professions. Other sector restrictions should also be examined, including limits on opening times in retail as well as zoning laws that cap store size and density.
The dissemination of best practice and the promotion of common industry standards can also boost productivity. Broadly speaking, Denmark, Sweden, and the United Kingdom have led the way in eliminating barriers to competitive service provision and experienced higher productivity growth than the European average as a result. Yet even these countries may have significant untapped growth potential that would come from a more complete single market in services. ƒƒ Enhance the competitiveness and integration of the European transport network. Despite ongoing efforts to create a single market for transport, significant barriers to competition remain in the form of differing regulatory and technical standards that limit interoperability.
The road-freight business remains highly fragmented. In rail, incumbents still dominate the market in many European countries, despite efforts at liberalisation. More needs to be done at the national level to enable cross-border operations and create a truly integrated market. The economies of Continental Europe are relatively well connected to each other.
Reflecting this, Germany and the Netherlands led the EU’s Single Market scoreboard on transport in 2014. Each of these countries has transposed all EU directives in this area. The Netherlands and Nordic EU countries enjoy higher transport-sector productivity than other countries, partly reflecting the fact that these economies allow larger, 60-ton trucks on their roads. Josefa Monteagudo, Aleksander Rutkowski, and Dimitri Lorenzani, The economic impact of the Services Directive: A first assessment following implementation, European Commission economic paper number 456, June 2012. 142 Joseph Dunne, Mapping the costs of non-Europe, 2014–19, European Parliamentary Research Service, March 2014. 143 A single market for growth and jobs: An analysis of progress made and remaining obstacles in the member states, European Commission, November 2013. 141 McKinsey Global Institute A window of opportunity for Europe 99 .
ƒƒ Build ICT infrastructure and enhance consumer and intellectual-property protection. Europe needs to ensure that its ICT infrastructure is adequate and that its telecommunications market is as fully integrated and competitive as possible. This can be achieved by ensuring adequate access to high-quality broadband across Europe, allowing further cross-border competition and consolidation, making available sufficient wireless spectrum (for example, through pan-European frequency auctions), and implementing regulation that is conducive to greater competition and the extension of networks. Nordic countries and the United Kingdom lead Europe on telecoms infrastructure and broadband penetration.
However, expanding the use of the Internet for commercial purposes will also require improved consumer awareness of their rights and obligations online. Therefore, it will be important to clarify and harmonise consumer protection, guarantees, and reimbursement rules for customers across Europe, and to create a clear system for recourse for consumers across European national borders. Another useful step would be to simplify intellectual property rights and royalty structures for content providers through, for instance, a single entry point, licensing system, and collective management of intellectual property and royalties for the EU.144 As proposed by the February 2014 European Commission directive on collective management of copyright and related rights and multiterritorial licensing. 144 100 McKinsey Global Institute 2. Reform—much of it national—can deliver growth .
7. PUBLIC-SECTOR PRODUCTIVITY One UK study says public-sector productivity 2000–10 grew 0% 1.4% vs. in private sector The public sector delivers vital services to citizens and is a key component in a wellfunctioning society. Its productivity is particularly important in Europe—even more so at a time of significant fiscal pressures—because the public sector accounts for 26 percent of GDP and public transfers account for an additional 22 percent of GDP. Measuring publicsector productivity is notoriously difficult, but the evidence available suggests it is weak and broadly static.
Among the key measures that should be considered are fostering competitive conditions in the public sector wherever possible, creating dedicated bodies within the public sector with a mandate to drive productivity improvements, redoubling efforts to improve the measurement of productivity in order to establish accountability and enable progress to be tracked, and pursuing ways of pooling procurement and resources.145 Stepping up productivity growth to 1.4 percent in those parts of the public sector amenable to a measure of competition could yield additional real GDP growth of 0.15 percent a year. Where Europe stands Europe’s public sector (output and transfers) is very large compared with those of other economies. For instance, government consumption in Japan accounts for only 19 percent of annual GDP. Yet most attempted calculations of Europe’s public-sector productivity suggest that it is static or has even slightly dropped in recent times (Exhibit 57). According to one UK measure, the productivity of the public sector was static between 2000 and 2010, a period during which the private sector increased its productivity by 1.4 percent a year.146 Ambitious efforts are under way to develop an effective measurement method of public-sector productivity, but it remains very difficult because the nature of the sector’s output, which often lacks a market price, means that there is still only a broad indication of trends.
In the absence of a methodology for calculating value added, many measurements assume that input equals output for public services. The task ahead will vary according to the specific characteristics of the public sector in different European countries. The size of Europe’s public sectors ranges widely (Exhibit 58). In 2012, government investment and consumption ranged from 18 percent of GDP in Slovakia to 38 percent in Denmark.147 Even among the continent’s largest economies, significant variation is evident, In the United Kingdom and France, for example, direct government consumption as a share of GDP was approximately ten percentage points higher than in Germany in 2012. Governments also differ significantly in how much they spend on different priorities such as social protection and defence, and the type of spending (for example, the compensation for employees compared with investment) (Exhibit 59). Some examples illustrate these variations.
Greece spends 14 percent of GDP on general public services compared with the European average of 6 percent. Germany spends 2 percent of GDP on social protection, one-quarter of Denmark’s 8 percent. How public-sector programmes are designed McKinsey & Company and the McKinsey Global Institute have published extensively on the topic of publicsector productivity.
For instance, see Better for less: Improving public sector performance on a tight budget, McKinsey & Company, July 2011, and The public-sector productivity imperative, McKinsey Public Sector Practice, March 2011. 146 With no price for the output of the public sector, there is no quantifiable value added. For this reason, most measurements of public-sector productivity assume that output is equal to inputs, resulting in zero productivity growth by definition. 147 These figures do not include transfers and subsidies, which are not directly consumed by the government and thus not directly affected by public-sector productivity. However, the mechanisms by which transfers and subsidies are distributed can be a source of efficiency gains, especially in systems rife with leakages.
See, for example, From poverty to empowerment: India’s imperative for jobs, growth, and effective basic services, McKinsey Global Institute, February 2014. 145 McKinsey Global Institute A window of opportunity for Europe 101 . typically has a major impact on the amount of resources they absorb. For instance, in Germany’s health-care system, the majority of costs are covered by public and private health insurance providers. This means that government outlays amount to only 1 percent of GDP. Meanwhile, the government-funded National Health Service in the United Kingdom accounts for 8 percent of GDP.
Such differences mean that it is not possible to use spending as a percentage of GDP as a proxy for productivity. The scope, quantity, and quality of services delivered have to be taken into account. Exhibit 57 The public sector accounts for 26 percent of European GDP, but one experimental measure finds its productivity was flat during the 2000s Public-sector share of final consumption, Europe-30, 2012 % of GDP Productivity development by sector in the United Kingdom1 Private consumption via public transfers 120 Gross value added, labour productivity Index: 100 = 2000 Compound annual growth rate, 2000–10 % Private Private 115 22 1.4 110 51 Public 26 105 100 Public 0 95 2000 2005 2010 1 Measuring public-sector productivity is very difficult due to the nature of the sector’s output, which often lacks a market price. In the absence of a methodology for calculating value added, many value-add measurements assume input=output for public services (thus assuming constant productivity).
The most sophisticated method to measure public-sector productivity comes from the UK Office for National Statistics, which tracks annual productivity trends by collecting >100 input data sets (e.g., labour input, capital, purchased services) and comparing this with the change in output (e.g., number of surgeries, doctor appointments, trained students, children in social care). Health care and education output are adjusted for quality (e.g., mortality, patient surveys, PISA score). For the remaining ~one-third of spending (police, defence, general), input=output is assumed as the output affects all inhabitants. NOTE: Numbers may not sum due to rounding. SOURCE: Eurostat; UK Office for National Statistics; McKinsey Global Institute analysis 102 McKinsey Global Institute 2.
Reform—much of it national—can deliver growth . Exhibit 58 Government consumption among European countries varies from 18 to 38 percent of national GDP Government spending in selected Europe-30 countries, 2012 % of GDP 59 Transfers and subsidies (Not consumed by the government and therefore excluded from analysis of publicsector productivity) 57 53 21 38 Government investment and consumption Direct consumption by general government 7 3 10 Other 49 48 23 16 Procurement 32 30 38 11 7 7 2 2 5 12 11 17 29 18 Compensation 45 22 12 Government investment 42 27 3 6 13 26 6 20 25 7 25 20 5 18 6 4 6 2 5 2 11 9 8 7 2 7 5 Denmark United (maximum) Kingdom Total government investment and consumption € billion x2 Greece France Europe30 Poland Germany Slovakia (minimum) 93 58 596 3,653 97 523 13 615 NOTE: Numbers may not sum due to rounding. SOURCE: Eurostat; McKinsey Global Institute analysis McKinsey Global Institute A window of opportunity for Europe 103 . Exhibit 59 The composition of government consumption varies hugely among countries, especially in general services, health care, and social protection Government spending (less transfers and subsidies) in Europe-30 countries, 2012 % of GDP 38 Other 2 1 1 Defence Public order and safety 8 Social protection 2 Economic affairs 7 Health care 32 30 1 3 2 2 2 2 1 3 4 2 26 2 3 2 3 3 4 3 1 2 3 4 4 7 6 6 1 2 2 4 3 9 6 6 20 2 1 2 2 18 3 1 2 1 2 11 3 11 5 5 14 General public services x2 25 3 3 2 8 Education 29 4 6 6 4 6 5 Denmark United (maximum) Kingdom Total government investment and consumption € billion Greece France Europe30 Poland Germany Slovakia (minimum) 93 58 596 3,653 97 523 13 615 1 In some countries, health care is managed privately but funded to some extent by government transfers or subsidies, excluded in this exhibit. NOTE: Numbers may not sum due to rounding. SOURCE: Eurostat; McKinsey Global Institute analysis Because policy design and delivery have a major bearing on productivity in the public sector, a systemic view is necessary. Labour productivity, the typical measure of productivity in the private sector, is only one factor affecting the public sector’s ability to deliver value for money (Exhibit 60). In the public sector, factors such as an evidence-based approach to policy, a clear definition of the boundary between public and private tasks, and sound financial management are all just as important determinants of government efficiency. 104 McKinsey Global Institute 2. Reform—much of it national—can deliver growth .
Exhibit 60 Labour productivity is only one factor affecting the public sector’s ability to deliver value for money Examples Define the scope, objectives, and priorities of government Policy design Refine policy and regulatory framework Achieve government objectives Improve government performance given chosen scope, objectives, and priorities Set public-, privatesector boundaries Define policy interventions and tools Defining the respective roles of the public and private sectors Thorough economic analysis of alternative policy options, e.g., in carbon abatement or public health Productivity Increase productivity through higher quality and efficiency1 Policy delivery Improve delivery of public services within given policy framework Lean techniques that can produce simultaneous improvements in outputs, customer service, job satisfaction, and cost efficiency Financial management Lower cost of government inputs Reduce financial leakage Adoption of best practice in procurement Reducing fraud and error in tax, through prioritisation of cases for audit 1 While the OECD’s definition of efficiency implicitly includes quality improvements, we include them explicitly because they are a large, yet often overlooked, component of productivity improvements. SOURCE: OECD; McKinsey Global Institute analysis A large body of evidence has demonstrated that competition is an important driver of productivity. Productivity growth has consistently been higher in market sectors with higher competitive intensity than in monopolistic or tightly regulated markets. If that evidence is applied to the public sector, where there is typically little internal competition and few productivity-enhancing mechanisms, indications of low productivity are unsurprising. Therefore, one way to achieve improved public-sector productivity is to develop an element of competition. In many functions, introducing competition through private alternatives to public-service providers would be neither beneficial nor plausible due to the nature of the service.
Yet, there are many ways to introduce “competition-like” mechanisms other than through outright privatisation or introducing private alternatives. Concentrating on creating conditions that foster a competitive attitude and setting up institutional capabilities focused on driving productivity improvements can help governments get closer to private-sector efficiency levels. McKinsey Global Institute A window of opportunity for Europe 105 . We find that there are five broad characteristics of competition that relate to accountability and institutional capacity (Exhibit 61). Specific approaches are competitive benchmarking, increased transparency of quality and rights, dedicated delivery units, improved handling of sub-contracts, and an increased focus on performance within organisations. Examples can be found of each approach being pursued successfully within Europe; the challenge is to spread such best practice more widely and consistently. Exhibit 61 There are five characteristics of competition that the public sector can leverage to unlock productivity growth Characteristics of competition Accountability NOT EXHAUSTIVE Examples of potential public-sector interventions Degree of customer “satisfaction” with service that the organisation provides Competitive benchmarking  Create indirect competition by benchmarking similar units  Introduce alternatives and let customers choose supplier Reputational Societal expectations of performance enabled through clear standards and targets Quality and rights transparency  Define clear customers’ rights that service providers are accountable to  Leverage data technologies to make performance and quality transparent for customers when choosing suppliers Structure Organisation designed to promote a culture of performance Dedicated delivery unit  Establish a centralised group to track and enable productivity enhancements through metric design, prioritisation, and monitoring Processes Improved sub-contract execution Ability to leverage  Tender multiyear execution contracts, with clear technology and lean management to streamline performance targets coupled to incentive schemes processes People Institutional capacity Transactional Sufficient resources invested in hiring people with right capabilities and retaining talent Performance-focused organisation  Focus on recruiting talent that is motivated to boost productivity in the public sector across all levels of the organisation SOURCE: McKinsey Global Institute analysis One example of the power of accountability to drive productivity in the public sector is the Programme for International Student Assessment (PISA), the OECD’s comparative study of educational outcomes that was launched in 2000. This initiative transformed educational attainment in Germany by providing transparency on its performance.
PISA revealed that Germany lagged behind the OECD average on reading, mathematics, and science. Germany also had the highest educational inequality (measured as the correlation between educational outcome and socioeconomic background) of any country in the OECD. These poor readings triggered a vigorous national debate—the PISA shock—that galvanised rapid reform. By 2009, Germany had boosted its ranking in reading from 21 to 16 and in mathematics from 22 to 10, largely reflecting improved performance among disadvantaged students.
Even more impressively, these gains were achieved without an increase in spending on education. To the contrary, spending as a percentage of GDP fell slightly to 4.0 percent in 2008 from 4.1 percent in 2000. Europe also boasts examples of institutions driving public-sector productivity. In 2008, Sweden was facing an influx of refugees from Afghanistan and Iraq.
In response, the Swedish Migration Agency streamlined its operations and improved the quality of the 106 McKinsey Global Institute 2. Reform—much of it national—can deliver growth . services it provided by using lean-management principles and developing the capabilities of its employees.148 The agency identified and supported “change agents” whose job was to transfer skills and knowledge throughout the organisation. The result of these initiatives was a fall in the average time it took to process an application from 270 days to 105, generating savings of more than €100 million. The focus on the quality of the workforce also led to more accurate decisions on applications, demonstrated by a decline in successful appeals from 5 percent to 3 percent. Initiatives to change the game It is not easy to measure the precise impact of the introduction of competition-like mechanisms. However, our analysis suggests that this approach, effectively implemented, would enable the public sector to close much of the gap with private-sector productivity growth, potentially generating incremental GDP growth of 0.15 percent per annum.
We acknowledge that not all parts of the public sector are amenable to such measures. In our estimate of the potential impact on GDP growth, we therefore assume faster productivity growth only for the 41 percent of public-sector final expenditure devoted to compensation— approximately 11 percent of Europe’s GDP. Our estimate is only an approximation at best.
Governments may already have achieved productivity improvements that have not been measured, and not all mechanisms can be implemented effectively in each country. With these caveats, initiatives in four areas could help to change the game in Europe’s public sector: Dutch health websites led to insurance switching rate of 4–6% ƒƒ Create conditions for competition in the provision of public services where possible. Governments can all too easily become complacent about the quality of services when citizens cannot choose their providers. Introducing choice is not possible in all parts of the public sector, but where it is possible—say, a choice of doctor or school—choice can be a powerful incentive for providers to become more productive. The introduction of regulated competition in health care in the Netherlands increased choice and improved the efficiency of hospitals.
The Netherlands replaced its dual system of mandatory health insurance and voluntary private insurance with mandatory private insurance for all in a bid to address long-standing criticisms. The new system emphasised controlling health-care spending, increasing consumer choice, raising effectiveness and quality, guaranteeing accessibility, and stimulating innovation. Between 2006 and 2009, hospital prices fell and the volume of treatments increased considerably. The launch of websites with price and quality information on insurers led to a switching rate of 4 to 6 percent, and hospital productivity grew by 2.9 percent between 2003 and 2008.
Competition also harmonised the standard of care across the country— variations among hospitals decreased in both the length of stay and the price of care.149 ƒƒ Set up an internal stakeholder to identify, advocate for, and potentially implement productivity-enhancing initiatives. Efforts to improve public-sector productivity are often hampered by the fact that no single government stakeholder “owns” the problem and is accountable for setting it right. This argues for new organisations with a remit to focus on improving productivity.
These organisations need to have the political clout and the right incentives, and they need to be held accountable for results. In 2010, the United Kingdom set up an Efficiency and Reform Group within the central government as part of the Cabinet Office. The unit works jointly with HM Treasury and other government departments to identify and deliver savings, focusing on six areas: defining and implementing spending controls; sharing best practice across government on executing projects; centralising procurement in selected categories and, in others, disseminating See Transforming government performance through lean management, McKinsey Center for Government, December 2012. 149 Ilaria Mosca, “Evaluating reforms in the Netherlands’ competitive health insurance system”, Eurohealth, volume 18, number 3, January 2012. 148 McKinsey Global Institute A window of opportunity for Europe 107 .
best practice; managing the government’s property portfolio; developing commercial models for delivering services; and promoting a mindset of “digital by default”. The unit achieved savings—reviewed and verified by an auditor—of £14.3 billion in the fiscal year 2013–14 compared with a 2009–10 baseline forecast, equivalent to around 2 percent of total government spending. Examples of the savings that resulted from the group’s efforts include £2.4 billion saved from reducing the size of the civil service, £1.5 billion from the centralisation of purchasing of common goods and services, £0.8 billion from higher efficiency in construction projects, £0.5 billion from lower real estate costs by vacating, renting, or consolidating underused properties, and £0.2 billion from moving many government transactions online. ƒƒ Launch a productivity-measurement programme and publish results that establish accountability. Without a comprehensive way to measure public-sector productivity, government agencies can avoid being held accountable by citizens.
They may be attempting to improve value for money in the services that they deliver, but it is virtually impossible to assess whether they are doing so successfully. Mechanisms such as published scorecards are not a perfect solution, but they are useful because they can track input and output metrics over time that show taxpayers how their money is being spent and can also enable governments themselves to assess the effectiveness of initiatives. It is important that these scorecards are published for specific departments within a government to establish accountability.
In France, then-President Nicolas Sarkozy put in place a General Review of Public Policies in 2007, aimed at making significant cuts to public spending and boosting the effectiveness of existing spending.150 A central piece of this effort was a customer-centric barometer that tracked indicators based on customer expectations developed through focus groups. An annual report monitors progress on 450 initiatives across all 18 ministries. Since the launch, there has been very significant progress.
Accident and emergency waiting times have fallen by 28 percent. The civil service has 100,000 fewer employees through the simple mechanism of not replacing one of every two retirees. Over the past three years, the government has saved €10 billion—lowering its payroll by €3 billion, reducing operating expenses by €2 billion, and saving €5 billion through more efficient processes. Consolidation of medical procurement in Norway cut costs by 62% ƒƒ Implement joint purchasing and pooling of resources.
Although Europe is one of the world’s largest economies, its governance and operations are fragmented among its many separate countries, and this means that many government activities are subscale in efficiency terms. Leveraging Europe’s huge size and its degree of political integration could greatly improve the productivity of numerous operations. This is especially true in public procurement, as consolidating procurement processes strengthens governments’ bargaining positions and thereby lowers costs. In Norway, national consolidation of the procurement of medical consumables reduced the average cost for the same or similar goods by 62 percent.
Government activities can even be consolidated on a pan-European scale. As a first step, the European Commission has put in place EU-level procurement of pandemic vaccines and other strategic supplies. Another area with significant savings potential is defence—development and maintenance fixed costs are particularly high in this sector, and the use of defence equipment remains highly fragmented among member states.
As illustration, there are 154 main weapon systems in the EU-28 compared with 27 in the United States, leading to higher costs for all. Steps towards an integrated European defence policy clearly require common objectives, careful analysis of scenarios and equipment needs, and a strong political mandate. Notwithstanding the challenges, by pooling resources and joint purchasing, Europe could potentially save more than 30 percent on its military equipment budget. Karim Tadjeddine, “‘A duty to modernize’: Reforming the French civil service”, McKinsey Quarterly, April 2011. 150 108 McKinsey Global Institute 2.
Reform—much of it national—can deliver growth . 8. FURTHER OPENNESS TO TRADE Europe had 13% share of global goods and services trade in 2012, higher than the United States and China In the current economic environment of deleveraging and anaemic domestic demand in Europe, exports have been, and will continue to be, a vital component of the recovery from recession. But beyond the needs of the short-term recovery, trade is important because the competition it creates is a strong driver of longer-term productivity gains and helps to shift economies towards innovative knowledge-intensive sectors. Europe is already the world’s largest exporting region, but there is scope for trade to play an even larger role in growth. Excluding intra-European trade flows, the EU’s share in global flows in goods and services was 13 percent in 2012, higher than the share of China, Japan, or the United States.
The rising prominence of emerging markets in global trade is a formidable opportunity (and competitive threat) for European businesses to grow and for consumers to access less expensive goods and services. Among the measures that Europe could consider to enhance its trade performance are agreeing to robust trade agreements with the growth engines of the next decade, namely China, India, and the United States; improving its trade logistics systems; establishing trade support networks similar to Germany’s networks of chambers of commerce in destination countries; and designing policies to offset any adverse effects from trade. Tapping into greater trade with the China, India, and the United States through these initiatives could generate 0.08 percent additional annual GDP growth. Where Europe stands Europe-30 is the world’s largest exporting region. Excluding intra-European trade flows, the EU’s share in global flows in goods and commercial services was 13.4 percent in 2012, exceeding China’s share of 9.9 percent, the US share of 9.7 percent, and Japan’s share of 4.2 percent.
Germany is Europe’s largest trading nation, participating in 3.5 percent of global trade excluding intra-European trade. It is followed by the United Kingdom with 1.9 percent of global trade and France with 1.5 percent. Global trade activity has increased substantially over the past decade, driven by the rise of emerging markets. Today, roughly one-fifth of all money spent on goods in the global economy goes on a product shipped across borders, up from one in seven in 1995. Over this period, the global flow of goods has increased at a rate of 7.7 percent a year (Exhibit 62).151 The counterpart of increasing participation in global trade by emerging markets has been a steady decline in Europe’s share of global trade activity.
Yet the growing presence of emerging economies in international trade makes it even more important for Europe to be open to the opportunities that they bring. The importance of exports in Europe-30 GDP has increased substantially, from 12 percent in 2004 to 17 percent in 2012. Stunning strides have been made by many countries. The economies of the Baltic region and Central and Eastern Europe have posted remarkable growth in exports, doubling and tripling over this period to reach 14 percent and 30 percent of their GDP, respectively. Overall, the EU has historically imported more than it exports, but the region ran a trade surplus for the first time in 2013.
Strong surpluses with countries such as the United States and Turkey more than offset significant deficits with countries like China and Russia. Europe’s exports are generally geared towards knowledge-intensive, high-value-added goods and services, which are traded against primary resources and labour-intensive goods. Broadly speaking, the EU is a strong net exporter of machinery and equipment, chemicals, and manufactured goods, and a net importer of crude materials and fuels as well as of miscellaneous manufactured articles.152 Global flows in a digital age: How trade, finance, people, and data connect the world economy, McKinsey Global Institute, April 2014. 152 European Commission, Directorate General for Trade. 151 McKinsey Global Institute A window of opportunity for Europe 109 . However, there are significant differences among European countries and regions. Continental Europe drives the EU’s impressive overall trade performance. It is a large net exporter of knowledge-intensive manufacturing. The United Kingdom and Ireland stand out for their large surpluses in knowledge-intensive services. Overall, Southern Europe fares less well in knowledge-intensive sectors, but there are signs of improvement.
Italy, in particular, stands out for its strength in labour-intensive manufactured goods including apparel and furniture; it is also one of the largest European producers of machinery and equipment. The Nordic countries run a surplus in capital-intensive manufacturing, notably in fuel products and capital-intensive crude materials (Exhibit 63).153 Exhibit 62 Global goods trade has increased in both its value and share of GDP since 1995 Nominal values, 1995–2012 $ trillion Growth of global goods trade Growth of global services trade 18 Capitalintensive 16 Laborintensive 14 Primary resources and commodities 12 10 18 16 14 12 10 8 8 6 6 R&Dintensive 4 2 Transport 4 Travel 2 Other services 0 0 1995 Share 16 of GDP % 2000 2005 2012 1995 2000 2005 2012 20 23 24 4 5 5 6 SOURCE: UN Comtrade; IHS; United Nations Conference on Trade and Development (UNCTAD); World Development Indicators, World Bank; McKinsey Global Institute analysis Trading myths: Addressing misconceptions about trade, jobs, and competitiveness, McKinsey Global Institute, May 2012. 153 110 McKinsey Global Institute 2. Reform—much of it national—can deliver growth .
Exhibit 63 Continental Europe has a large surplus in knowledge-intensive manufacturing, and the United Kingdom and Ireland have a large surplus in knowledge-intensive services Net exports1,2 % of GDP 2009 Continental Europe Primary resources United Kingdom and Ireland -2.5 -3.5 -1.1 -1.7 0.8 0.9 Capital-intensive manufacturing -0.2 -0.2 0.7 1.7 0.1 0.1 2.5 0 3.9 -0.2 -1.1 -0.3 -0.5 1.7 1.7 -0.4 4.6 -0.1 -0.1 1.8 1.8 -0.1 0 -0.1 -0.1 0.1 1.8 Health care, education, and public services 1.0 -0.6 -0.1 1.4 Knowledge-intensive services -1.3 1.5 0.3 0.1 0.1 Capital-intensive services -0.7 -0.7 0.1 1.4 -1.5 5.8 Labour-intensive services 3.8 4.1 0.3 0.8 4.1 Knowledge-intensive manufacturing Nordics -2.8 -4.4 -1.8 -1.7 -0.7 -0.7 Labour-intensive manufacturing Southern Europe 2013 0 0 0 0 0 1 Excludes unclassified commodities and confidential trade that may lead to deviations from national accounts data. 2 2013 data were not available for specific services categories for several countries (Finland, Greece, Lithuania, Poland, and Switzerland). In these cases, 2011 data were used. Construction services is not available for Ireland; 2013 data for services from ITC are preliminary. SOURCE: World Bank World Integrated Trade Solution; ITC Trade Map; McKinsey Global Institute analysis The continuing rise of emerging markets is a significant growth opportunity for European businesses and has the potential to create new jobs in knowledge-intensive industries and services. In the past 25 years, Europe has, for example, benefited from growth in Africa, which has long relied on Europe as its biggest trading partner.
Trade volumes between the two regions have grown by 12 percent a year over this period. However, as South-South trade volumes have increased, Europe’s share of trade with Africa has dropped from around 65 percent to 39 percent.154 Future incremental demand for European exports is likely to be concentrated in China, India, and the United States, which together are expected to account for 48 percent of incremental growth in global GDP between 2012 and 2025 (Exhibit 64). China alone will account for 24 percent of global GDP growth to 2025, although the United States and India are also of significance with shares of 17 and 7 percent, respectively. Lions go global: Deepening Africa’s ties to the United States, McKinsey Global Institute, August 2014. 154 McKinsey Global Institute A window of opportunity for Europe 111 . Exhibit 64 EU preferential trade agreements cover only a fraction of future incremental demand Global real GDP, 2012 and 2025 2005 $ trillion 2.3 100.7 4.8 2.2 4.0 4.2 2.2 5.7 8.2 67.0 2012 China United States India Western Europe Latin Middle America/ East and Caribbean Africa % of increment 24 17 7 12 12 No trade agreements in place EU 7 Trade agreements with 40 countries1 Other Other Asia Pacific 14 2025 7 Scarce trade agreements2, 3 1 Preferential trade agreements with 40 countries including Chile, Colombia, Peru, Mexico, Caribbean members of the African, Caribbean, and Pacific Group of States (APAC), Algeria, Egypt, Israel, Morocco, Tunisia, and South Africa. 2 Other APAC = South Korea and Papua New Guinea. 3 Other = customs union with Andorra, Monaco, San Marino, and Turkey; European Economic Area with Iceland, Liechtenstein, and Norway; preferential trade agreements with Albania, Bosnia-Herzegovina, FYR Macedonia, Montenegro, Serbia, and Switzerland. NOTE: Without consideration of preferential trade agreements currently under negotiation. Numbers may not sum due to rounding. SOURCE: McKinsey Global Growth Model; McKinsey Global Institute analysis Europe already maintains strong trading relations with these countries. Being among the world’s largest economies, China and the United States are Europe’s main trading partners today. While Europe runs a trade surplus with China and a trade deficit with the United States, both countries are important sales outlets for European goods; 13.4 percent of EU exports go to the United States and 7.1 percent to China.
Due to the still relatively small size of the Indian economy in comparison with the United States and China, the importance of exports to India for EU companies is still limited at 2.1 percent of exports, but that will grow along with the size of the Indian market. Given the strong and growing importance of these outlets for European goods and services—trade with China, India, and the United States accounts for roughly 4 percent of Europe’s GDP—it is disappointing that the EU has not concluded free trade agreements with any of these countries. The volume of EU exports to the United States and China already exceeds exports to each of the three main existing free trade agreements—the European Free Trade Association, which includes Iceland, Liechtenstein, Norway, and Switzerland; 112 McKinsey Global Institute 2. Reform—much of it national—can deliver growth .
the Euro-Mediterranean Partnership with nine Middle Eastern and North African countries; and the Customs Union with Turkey. Given slow growth in Europe and the uncertainties associated with Central Asia and the Middle East, it is increasingly critical that Europe secures and extends its access to the growth markets in the rest of Asia and the Americas. Trade in services in the form of tourism from these countries is a particular opportunity for Europe (see Box 5, “Opportunities from China: Attracting students and tourists”). European countries are not all equally prepared to seize current trade opportunities. Small countries in northern and Continental Europe have long been among the world’s most open economies. In 2013, total exports reached 102 percent of GDP in Ireland, 83 percent in Belgium, 79 percent in the Netherlands, 55 percent in Austria, and 54 percent in Denmark. In total, extra-EU exports in 2013 amounted to 24 percent of GDP in the Nordics, 19 percent in Continental Europe, and 18 percent in the United Kingdom and Ireland.
The Baltic countries have rapidly internationalised over the past ten years, increasing their extra-EU exports from 17 percent of GDP to 30 percent. However, extra-EU exports still account for just 15 percent of GDP in Central and Eastern Europe and in Southern Europe (Exhibit 65). It is noteworthy that these differences among European economies exist despite their being subject to the same international trade regimes set by the EU Customs Union. Box 5. Opportunities from China: Attracting students and tourists Incomes in developing economies are rising faster and Europe can further tap into the increasing demand from at a greater scale than at any previous point in history. China and other emerging markets by improving on This trend is driving the growth of the global consuming the following: class from 2.4 billion people in 2010 to 4.2 billion in 2025. ƒƒ Simplify immigration.
Europe can improve its Chinese households will account for 19 percent of global accessibility to Chinese tourists and students by growth in urban households with an annual income of simplifying the visa application process through a more than $20,000. The new consumer class is finding its single online visa application portal. Non-Schengen way to Europe, primarily as tourists or students.
Between countries should also consider joining the Schengen 2005 and 2011, the number of arrivals from China almost area. After Switzerland entered the Schengen area in doubled from about 1.7 million to roughly 3.1 million. 2008, the number of Chinese visitors more than tripled The number of inbound students from Asia into Europe from around 130,000 to more than 450,000 in 2011. increased to around 300,000 in 2012. With its rich cultural heritage, Europe is well-positioned to further benefit from an increasingly travel-oriented consumer class in China. A top performer in this regard is Switzerland, which attracted 58 Chinese visitors for every 1,000 Swiss citizens in 2011.
With a share of 35 percent of the top 100 universities in the world, Europe is also well-positioned to attract Chinese students. The United Kingdom, which boasts some of the most prestigious universities in Europe, attracted more than 76,000 Chinese students in 2012. McKinsey Global Institute A window of opportunity for Europe ƒƒ Enable seamless access. Increasing airport capacity and connectivity with China’s main hubs facilitates travel into Europe.
Schiphol Airport in the Netherlands serves six Chinese cities daily and provides several services to welcome Chinese tourists. For instance, all Schiphol shops accept Chinese renminbi. ƒƒ Become an education powerhouse. To attract more Chinese students, European universities should intensify their efforts to establish an international academic reputation in line with that of the United Kingdom’s cutting-edge institutions and should market themselves in China more actively. 113 .
Exhibit 65 Extra-European trade corresponds to ~18 percent of European GDP, a share that has been increasing across all regions of the continent since 2004 Extra-territorial trade, 2004–131 % of GDP 2013 Compound annual growth rate, 2004–13 % 2004 Canada 36 30 Baltics 12 24 Nordics 20 Australia 18 Continental Europe 19 Southern Europe 9 1 5 1 6 1 4 2 7 -1 5 13 18 United Kingdom and Ireland Central and Eastern Europe 1 17 13 9 Exports 17 18 Europe-282 United States GDP 29 14 15 10 15 10 1 Export of goods and services. 2 Europe-30 excluding Norway and Switzerland. SOURCE: Eurostat; UNCTAD; IHS; McKinsey Global Institute analysis The difference in the export performance of different developed economies is increasingly explained by the countries’ involvement in global value chains of businesses and the imports of intermediate goods that this entails. Structural, economy-wide factors such as geographic location and sector specialisation play a diminishing role.155 Since developing new markets abroad is an expensive, time-consuming task with high risks and substantial fixed costs, larger, more productive, and more highly skilled companies are more likely to export than other companies, irrespective of the country in which they are located.156 For example, Germany benefits from a high concentration of innovative businesses in the fastgrowing machinery and equipment industry, which contributes to its position as the world’s top exporter in 2013, running a bigger trade surplus than China.157 In other countries— particularly in Southern Europe and Central and Eastern Europe—companies are smaller and less productive on average. Moreover, these regions have a less beneficial sector Andrea Beltramello, Koen De Backer, and Laurent Moussiegt, The export performance of countries within global value chains (GVCs), OECD science, technology, and industry working paper number 2012/02, April 2012. 156 Giorgio Barba Navaretti et al., The global operations of European firms: The second EFIGE policy report, Bruegel Blueprint Series, volume XII, July 2011; Loris Rubini et al., Breaking down the barriers to firm growth in Europe: The fourth EFIGE policy report, Bruegel Blueprint Series, volume XVIII, August 2012. 157 This includes exports to other European countries. 155 114 McKinsey Global Institute 2. Reform—much of it national—can deliver growth .
composition—companies tend to be specialised in products with slower-growing demand than their Continental European counterparts.158 Finally, infrastructure also plays a part in enabling or preventing companies' access to foreign markets. The Continental European trading hubs of Germany, the Netherlands, and Belgium as well as the United Kingdom topped the World Bank’s Logistics Performance Index in 2014, while the southern and Central and Eastern European countries lagged behind; Bulgaria, for instance, ranks 47th. Preferential trade agreements with China, India, and the United States could add 0.08 percent to Europe's real GDP growth. Initiatives to change the game Establishing preferential trade relations with China, India, and the United States would significantly spur export growth, allowing domestic companies to achieve scale and realise productivity gains while lowering prices for consumers in tradable sectors. The European Commission estimates that the realisation of the Transatlantic Trade and Investment Partnership with the United States alone would result in 0.5 percent additional GDP for Europe, amounting to roughly 0.05 percent additional growth per year in the period to 2025. Scaling this estimate to China and India on the basis of current export volumes, we estimate that preferential trade agreements with these three growing economies could yield incremental real GDP growth of 0.08 percent to 2025. Our analysis suggests that the priorities to consider in the trade arena include: ƒƒ Agree on robust trade agreements with the growth engines of the next decade: China, India, and the United States.
The biggest near-term opportunity is concluding the Transatlantic Trade and Investment Partnership with the United States, which not only would further integrate the world’s two largest developed markets but could also establish a framework for future European trade negotiations. Europe has been negotiating with India on a free trade agreement since 2007 and with China on an investment agreement since 2013; however, neither has reached a significant degree of maturity. Even more than is the case with trade in goods, trade in services is still significantly restricted with these two countries, with tariff equivalents exceeding 60 percent.159 As we have argued, establishing open and fair terms by which firms in the respective countries can conduct commerce in goods and services will be a critical determinant of Europe’s growth trajectory to 2025. ƒƒ Expand an efficient trade logistics ecosystem.
Much of the friction of global trade can take place before goods or services even leave the country of origin. In addition to the manufacturing and trading hub of Germany, the Netherlands is an example of how to minimise the burden on domestic companies by building world-class infrastructure, streamlining customs procedures, and ensuring that high-quality support services are available. The Dutch export infrastructure is ranked third in the world after that of Andrea Beltramello, Koen De Backer, and Laurent Moussiegt, The export performance of countries within global value chains (GVCs), OECD science, technology, and industry working paper number 2012/02, April 2012. 159 Trading myths: Addressing misconceptions about trade, jobs, and competitiveness, McKinsey Global Institute, May 2012.
Also see J. Bradford Jensen, Global trade in services: Fear, facts, and offshoring, Peterson Institute for International Economics, 2011, and Gary Clyde Hufbauer, Jeffrey J. Schott, and Woan Foong Wong, “Figuring out the Doha Round”, Policy Analyses in International Economics, number 91, July 2010. 158 McKinsey Global Institute A window of opportunity for Europe 115 .
Germany and Singapore on the World Bank’s Logistics Performance infrastructure sub-index. In 2012, the Port of Rotterdam shipped about twice the bulk cargo and processed about 30 percent more container shipments than the second-busiest European port, the Port of Hamburg. Processing about 1.6 million metric tons of cargo in 2013, Amsterdam’s Schiphol airport ranks third in Europe, not far behind Frankfurt and Paris. Efficient customs procedures place a minimum burden on the conduct of trade. Exporting requires seven days and $915 per container, lower than the OECD average of 11 days and $1,070.
Finally, the Netherlands boasts high-quality support providers such as shipping brokers and agents. It ranks fifth in Europe after Finland, Denmark, Austria, and Germany on the quality of its support services. ƒƒ Establish support networks in destination countries. For many firms, especially SMEs, developing new markets abroad is expensive, time-consuming, and risky. Germany has helped its businesses access foreign markets by establishing a dense constellation of related organisations at the regional and national levels that pull together to support businesses and their export aspirations.
These include, for instance, Germany Trade and Invest, which has more than 50 international representative offices and a worldwide network of 130 German chambers of commerce around the world—a system of “coordinated decentralisation”. Germany Trade and Invest acts as a hub and convenor of entities including national- and regional-level development agencies, and others. Development agencies based in Germany’s Länder have detailed knowledge of local businesses and are able to access resources at the national level.
For instance, KfW, the government-owned development bank, had a credit portfolio of about €60 billion in export and project finance in 2013. Germany also provides its exporting firms with export guarantees—the Hermes cover—that protect exporting firms from both country and buyer risk. ƒƒ Offset the adverse effects from trade through adequate investments and policies. While trade promotes longer-term productivity gains and the transition to knowledgeand innovation-driven economies, it can, in the short run, create disadvantaged groups in labour-intensive industries. Rather than focusing on winning back low-skilled jobs, European policy makers should prepare their economies and workforces for higherskilled activities.
Promoting world-class education and innovation is critical if Europe is to build on its comparative advantage in knowledge-intensive goods and sustain high-skilled job creation. In the short term, Europe should seek to create employment for those who have been disadvantaged by trade in industries that help improve Europe’s competitiveness and trade performance in the future. Investment in infrastructure that improves the access of firms to foreign markets, as well as in energy-efficiency measures such as the insulation of residential buildings, can create low-skilled employment while contributing to the improvement of the trade balance of most European countries.160 Trading myths: Addressing misconceptions about trade, jobs, and competitiveness, McKinsey Global Institute, May 2012 160 116 McKinsey Global Institute 2.
Reform—much of it national—can deliver growth . 9. GREY AND FEMALE LABOURFORCE PARTICIPATION Europe faces the prospect of a shrinking working-age population—those aged between 15 and 64—which, left unaddressed, could dampen GDP growth. One vital element of a gamechanging growth strategy would be boosting participation among groups that are currently under-represented in the workforce, in particular “grey”—adults aged 55 to 74—and female workers. Labour-market policies and pension and taxation systems should be geared towards promoting participation.
Governments and companies need to provide more support and flexibility for their workers to encourage participation, and remove barriers— perceived and real—to employment. Finally, everyone needs to be able to access lifelong learning to ensure that they are, and remain, employable. Stepping up participation in both groups to best-practice levels by 2025 could boost European GDP growth by 0.39 percent per annum. Where Europe stands Despite improvements over the ten-year period to 2013, female and grey participation rates of 79 and 35 percent, respectively, continue to lag behind the rate for prime working-age males, which stands at 91 percent (Exhibit 66).
Narrowing the gap by one-quarter would result in an additional 19 million workers—an 8 percent increase in the current labour force of approximately 250 million. Exhibit 66 Europe has large variations in labour-force participation rates among gender and age groups Europe-30 labour-force participation rate, 2013 % 91 79 Age Male Female 45 15–24 Difference between male and female participation Percentage points 5 40 25–34 91 35–44 93 45–54 90 78 35 Change -0.1 since 2003 Percentage points Female2 4.4 79 63 55–64 Male1 81 47 Grey3 8.2 12 65–74 >75 2 6 1 13 12 11 16 6 1 1 Activity rate of male population aged 25–54. 2 Female workers aged 25–54 to avoid overlap with grey workers. 3 Grey workers defined as aged 55–74. SOURCE: Eurostat; McKinsey Global Institute analysis McKinsey Global Institute A window of opportunity for Europe 117 . Female workers Europe has much to celebrate in its effort to expand opportunities for women in the workforce, but scope remains to do even better. Over four decades, labour-force participation for females aged 25 to 54 increased from less than 50 percent to 79 percent by 2013, higher than the 74 percent in the United States.161 Moreover, while female participation in the United States is stagnating, in Europe it continues to increase. However, variation in female participation within Europe reveals ample scope to boost participation further. In the Nordics and Baltics, 86 percent of women are part of the labour force. That is 12 percentage points more than in Southern Europe.
Many women are also inclined to work more. According to Eurostat, about one-third of women over the age of 15 who are classified as economically “inactive” are willing to work, and almost one-quarter of female part-timers are willing to work more hours. This finding about part-timers also implies that there is an opportunity to increase female participation, as 30 percent of European women in the workforce are currently not working full time (Exhibit 67). Exhibit 67 Europe has increased female labour-market participation but the incidence of women’s part-time work is higher than in the United States Female labour-force participation rate Female population aged 25–54, % 85 80 Regional variation in Europe, 2013 75 Baltics 86.1 Nordics 85.6 70 65 60 Part-time incidence of women 25–54, 2013 % 20 Canada 55 50 Europe1 Australia 40 41 United States 45 30 Continental Europe 82.8 United Kingdom and Ireland Central and Eastern Europe 79.1 77.9 19 Southern Europe 74.0 35 1970 1980 1990 2000 2013 1 Europe-15 before 1995 due to data availability; remainder is Europe-30 with missing data for Bulgaria, Croatia, and Malta to 2000 and for Cyprus, Czech Republic, Estonia, Latvia, Lithuania, Poland, Romania, and Slovakia to 1997. SOURCE: OECD; Eurostat; US Bureau of Labor Statistics; McKinsey Global Institute analysis We focus the discussion on the 25-to-54 age segment to avoid overlap with our analysis of grey labourforce participation. 161 118 McKinsey Global Institute 2.
Reform—much of it national—can deliver growth . Female integration into the workforce can be assessed on two dimensions: participation rates and the average number of hours worked per capita, each relative to the same figures for men.162 On both, the performance of European countries varies to a significant extent (Exhibit 68). In many countries, there is a relatively strong degree of parity between men and women, with many Central and Eastern European countries, as well as Baltic countries, standing out with high participation. In contrast, female participation rates in Italy and Malta are only 75 percent and 65 percent, respectively, those of men, with hours worked per capita for females at about the European average level of 83 percent of hours per capita for males. Many continental European countries have achieved relatively strong female participation rates but lag behind the European average on hours worked per capita.
In the Netherlands, for example, nearly four-fifths of employed women work part time, resulting in an average working week of just 25 hours, 30 percent less than for men. Exhibit 68 MGI has defined female participation in the European workforce in terms of activity rates and hours worked Nordics Continental Europe United Kingdom and Ireland Southern Europe Baltics Central and Eastern Europe Female hours worked Average actual weekly hours worked by women as a % of men, all ages 100 Bulgaria Romania Slovakia 95 90 Greece 85 Europe-30 Italy 80 Hungary Czech Republic Malta Luxembourg Ireland United Kingdom 75 Croatia Cyprus Poland Estonia Latvia Lithuania Portugal Slovenia Finland France Spain Belgium Sweden Denmark Norway Austria Germany Switzerland 70 Netherlands 65 64 65 75 76 77 78 79 80 81 82 83 84 85 86 87 88 89 90 91 92 93 94 95 96 97 98 Female labour-force participation rate Female activity rate as a % of men’s, 25- to 54-year-olds SOURCE: Eurostat; McKinsey Global Institute analysis While both dimensions are important, one of the levers for improving female participation rates is flexible working arrangements, which in some cases may lead to a higher incidence of part-time work. 162 McKinsey Global Institute A window of opportunity for Europe 119 . Countries that outperform on both dimensions are a diverse group, including Portugal and Spain and many from Central and Eastern Europe, the Baltics, and the Nordics. Overall, a U-shaped relationship between per capita income and female participation can be observed both across and within countries.163 The challenge for the countries with relatively lower income levels included in this group will be to maintain and improve on their participation rates as welfare increases. High-income countries that do not share this outperformance should look to the example set by the Nordics to find policies that can accelerate their progress up the right-hand side of the field (Exhibit 69). Exhibit 69 Low-income countries need to maintain high female participation rates as welfare increases Nordics Continental Europe United Kingdom and Ireland Southern Europe Baltics Central and Eastern Europe Female labour-force participation rate Female activity rate as a % of men’s, 25- to 54-year-olds 98 Lithuania 96 94 92 Sweden Denmark Austria Finland Portugal Latvia Bulgaria Slovenia Croatia 90 France Estonia 88 Netherlands Spain Cyprus Germany Slovakia Belgium Europe-30 United Czech Kingdom Republic Poland Hungary 86 84 82 Norway Romania Switzerland Luxembourg Ireland 80 Greece 78 76 Italy 74 10 12 14 16 18 20 22 24 26 28 30 32 34 36 46 48 66 68 70 72 74 Per capita GDP Purchasing power standard per inhabitant, thousand SOURCE: Eurostat; OECD; Jobs and growth: Supporting the European recovery, IMF, 2014; McKinsey Global Institute analysis See Kristin Mammen and Christina Paxson, “Women’s work and economic development”, Journal of Economic Perspectives, volume 14, number 4, fall 2000, and Claudia Goldin, “The U-shaped female labor force function in economic development and economic history”, in Investment in women’s human capital and economic development, T. Paul Schultz, ed., University of Chicago Press, 1995. 163 120 McKinsey Global Institute 2. Reform—much of it national—can deliver growth .
Grey workers Grey labour-force participation in Europe was 35 percent in 2013, 50 percentage points less than the participation rate of 25- to 54-year-olds. In a handful of countries—including Norway, Switzerland, Sweden, and the United Kingdom—grey participation rates are more closely aligned with those of the prime working-age population. These cases are largely the exception to the rule, but the trend is positive. Over the past ten years, grey participation has increased by more than eight percentage points compared with an increase of just two percentage points among 25- to 54-year-olds.
The United Kingdom is notable because it already had a relatively high grey participation rate of 37 percent in 2003 and posted a significant 4.7 percentage point increase in that rate over the subsequent ten years. In Germany, at 41 percent in 2013, participation increased three times as much as it did in the United Kingdom, but from a lower base in 2003 of 27 percent. A major determinant of grey participation is the statutory retirement age, which acts as an anchor around which actual retirements occur.164 Most European regions match or exceed the average statutory retirement age in the OECD of 65, with some catch-up occurring in the Baltics and Central and Eastern Europe, where the average statutory retirement age for males is 62 and 64 years, respectively. France recently decreased the official age to 60 with an increase to 62 planned for 2017.
Germany recently introduced the option that workers with 40 years of continuous service can retire two years earlier than the official retirement age.165 In all European regions, the average individual stops working before reaching the official retirement age. The gap between the statutory and effective retirement age is particularly large in Continental and Southern Europe at 3.6 and 3.2 years, respectively. Despite significant increases in life expectancy and healthy life years across Europe, most increases in the statutory retirement age have taken place only in recent years.166 Life expectancy has increased by more than nine years since 1970, but, over the same period, the male average effective retirement age has fallen by six years (Exhibit 70). This has caused the gap between the average age at which people retire and life expectancy to balloon to 18 years in 2012.
Having started at the same level as the United States, the effective retirement age in Europe has dropped to 62 compared with 65 in the United States and 69 in Japan. As a result, the 54 percent European participation rate of those aged 55 to 64 is ten percentage points lower than the 64 percent rate in the United States. See, for example, Romain Duval, The retirement effects of old-age pension and early retirement schemes in OECD countries, OECD Economics Department working paper number 370, November 2003, and JeanOlivier Hairault, Thepthida Sopraseuth, and François Langot, “Distance to retirement and older workers’ employment: The case for delaying the retirement age”, Journal of the European Economic Association, volume 8, issue 5, September 2010. 165 The current retirement age in Germany is 65 years and three months, although it currently rises by one month each year and is set to rise by two months a year starting in 2024. 166 Adair Turner, “Population ageing: What should we worry about?” Philosophical Transactions of the Royal Society, volume 364, issue 1532, October 2009. 164 McKinsey Global Institute A window of opportunity for Europe 121 . Exhibit 70 Although life expectancy has increased, the effective retirement age has fallen in Europe more than it has in the United States Average improvement, 2003–13 Percentage points Grey participation across Europe Activity rate, 2013 % of 25- to 54-year-olds Nordics 50 49 United Kingdom and Ireland 0.7 4.5 Effective retirement age and life expectancy1 Age 80 Life expectancy Europe-27 78 76 74 46 Baltics 8.4 Continental Europe 41 12.6 Europe-30 41 8.8 Retirement age 72 70 Japan 68 66 64 Central and Eastern Europe 38 8.3 Southern Europe 36 6.9 United States 62 Europe-27 60 1970 80 90 2000 2012 1 Average effective male retirement age and total average life expectancy at birth. SOURCE: Eurostat; OECD; McKinsey Global Institute analysis Boosting female and grey participation could add 0.39 percentage points to real annual GDP growth Initiatives to change the game Increasing female and grey labour-force participation to best-practice levels could boost real GDP growth by 0.39 percentage points per annum to 2025. This estimate is based on the incremental improvement that European countries could achieve if they catch up with 2013 best practice in 2025. In the case of female participation, achieving this boost to growth would entail catching up with Sweden’s 25- to 54-year-old female labour market participation rate of 88 percent. In the case of grey participation, it would entail catching up with Hungary’s ratio between grey and prime working-age participation rates of 0.58.
The incremental increase in participation is compared with an expected baseline scenario, in which average female and grey participation rates across Europe are assumed to grow in line with historical experience from countries that have developed participation rates similar to the European averages of 2013. Our estimates suggests that grey participation could become a major driver of future GDP growth, with an expected effect of about double the size of increased female participation. Both estimates are based purely on increased activity rates, keeping average weekly hours worked and productivity constant.
Among the key levers to achieve rising participation rates are: ƒƒ Reduce incentives to not work. Labour-market policies, and pension and taxation systems, should be geared towards promoting participation.167 According to a 2012 Eurobarometer survey on “active ageing”, 53 percent of Europeans oppose a mandatory For elaboration, see Economic policy reforms: Going for growth 2013, OECD, 2013; Pensions at a glance, OECD, 2012; OECD pensions outlook 2012, OECD, 2012; Employment trends and policies for older workers in the recession, European Foundation for the Improvement of Living and Working Conditions, 2012; and David Sinclair, Jessica Watson, and Brian Beach, Working longer: An EU perspective, International Longevity Centre, September 2013. 167 122 McKinsey Global Institute 2. Reform—much of it national—can deliver growth .
retirement age. The United Kingdom recently phased out its default retirement age, so that most people can work as long as they wish. The country has also moved to a defined contribution system that reduces the incentives to retire early. Meanwhile Finland’s recent pension reforms propose a gradual increase in the retirement age to 65, and thereafter to link it to life expectancy.
With respect to female participation, tax policy can shape incentives in important ways. In Germany, household incomes are pooled and progressive income taxes applied on the average amount, resulting in a particularly high taxation of income for second earners. An alternative and potentially fairer arrangement would have working couples experiencing a reduction in their combined tax burden compared with single earner households. ƒƒ Provide more support and flexibility to workers.
Research shows that childcare provision and flexible working arrangements are key drivers of female and grey participation.168 In Sweden and Finland, municipalities provide child care to parents during the ordinary working day, and in many cases even outside these times. In Sweden, about one-third of children up to the age of three are in child care for more than 30 hours per week compared with 4 percent in the United Kingdom. To make child care affordable, Sweden and Denmark subsidise it to the tune of 1.4 percent of GDP, double the European average.169 Part-time work is an attractive form of employment for people rearing their children and as a gradual pathway to full retirement.
In the United Kingdom and Belgium, about one-third of grey workers work part time, compared with an average of 22 percent in Europe. Other measures to improve flexibility—more common in the Nordics than elsewhere in Europe—include being able to determine the start and end of the working day, “save up” hours and days worked overtime to use as holiday, and even choose total hours worked.170 In Germany, Daimler has put in place a “senior-expert” programme that rehires retirees on short-term contracts for particular projects—a win-win for the company that buys-in the knowledge, experience, and motivation it needs, and for the grey worker. Such schemes help to preserve and share experience across generations. ƒƒ Eliminate (perceived) barriers to employment.
Many employers worry that grey workers will be less productive than their younger colleagues and that female workers will take breaks to give birth to and care for children or opt for part-time work, adding complexity compared with their male colleagues. In the case of females, harmonising paternity and maternity leave would reduce the bias against hiring women of childbearing age. In Sweden, parents receive 480 days paid leave, of which 120 days cannot be reallocated between parents and must therefore be taken as 60 days per parent or be lost.
A monetary bonus is provided when both parents take more than 60 days. For each day extra above 60 days taken by the parent who has taken the least parental leave, the government pays 50 Swedish kroner to each of the parents. At most, couples can receive an additional 13,500 Swedish kroner combined.
In 2007, Germany changed its parental leave scheme in similar ways and, within two years, 20 percent of fathers took paid leave compared with an initial 3 percent.171 In the case of grey workers, a more flexible system of wages would greatly help maintain their attractiveness for employers. In Denmark and the United Kingdom, the average full-time wage declines once workers have reached the age of 50, breaking the system of automatic increase of wages with seniority.172 Replacing seniority with performance clauses in public-sector wage See, for example, Olivier Thévenon, Policy drivers of female labour force participation in OECD countries, presented at Seminar on Early Childhood Education and Care in Brussels, December 4, 2013, and Ted Aranki and Corrado Macchiarelli, Employment duration and shifts into retirement in the EU, London School of Economics Europe in Question discussion paper number 58, February 2013. 169 Latest available data from OECD are from 2009. 170 EU Expert Group on Gender and Employment (EGGE). 171 “Why Swedish men take so much paternity leave”, The Economist, July 22, 2014. 172 Ageing and employment policies: Norway 2013: Working better with age, OECD, June 2013. 168 McKinsey Global Institute A window of opportunity for Europe 123 . arrangements, as Sweden does, can point the way for companies in the private sector.173 In addition, protective legislation and an “Age Positive” campaign in the United Kingdom aim to overcome age discrimination. Such discrimination is deemed to be widespread by almost half of Europeans.174 ~40% of women in Sweden and Norway have tertiary education vs. European average of 25% ƒƒ Offer lifelong learning to everyone. Ensuring workers have the right skills is the key criterion for employability.
In the case of female workers, we find that completion of a tertiary education is the most important driver of their participation in the labour force. In the best-performing countries, Sweden and Norway, about 40 percent of women over the age of 25 have a tertiary education compared with the European average of 25 percent. Grey workers can also benefit from lifelong education and training. Germany’s “Perspektive 50plus” programme finances training in communication skills and job applications as well as internships, personal coaching, and counselling. In 2011, 200,000 long-term unemployed went back to work, and 70,000 of them found regular jobs.175 Businesses can do more, too.
Siemens, for example, experienced an increase of almost two years in its average retirement age following reforms in 2011. These included an increase in the firm’s maximum age by three years to 70, personal “milestone” dialogues with employees aged between 55 and 60, and company health and fitness schemes. Pensions at a glance 2011, OECD, 2011. Eurobarometer, 2012. 175 EEO review: Employment policies to promote active ageing 2012, European Commission, 2012. 173 174 124 McKinsey Global Institute 2. Reform—much of it national—can deliver growth . 10. PRO-GROWTH IMMIGRATION Pro-growth immigration could add 0.26% to annual real GDP growth One way that Europe could compensate for its declining prime working-age population would be through greater inflows of immigrants from outside the Europe-30 region who are equipped with the skills needed for positions that employers currently struggle to fill. Although immigration is a contentious political issue in many countries, revisiting this topic— and viewing it through a pro-growth lens—could have significant economic benefits, These include expanding the workforce, increasing demand and investment as more people need housing or local services, contributing to more sustainable debt levels as debt is carried on more shoulders, and reducing some of the pressure from ageing because immigrants tend to be younger than established citizens. On average, immigrant populations feature a much higher share of working-age people than natives, and in some countries they are better educated than native individuals. Some European countries, notably Belgium, Norway, and Sweden, already have high levels of net migration from outside Europe. Others could emulate their approach.
By increasing net non-European migration from 2.6 people per 1,000 inhabitants per year to 4.9, the European working-age population could stabilise by 2025. Among the measures that European countries could consider are introducing open and transparent systems contingent on employment as Sweden has done, using shortage lists as Germany does, enhancing education and integration support for immigrants, setting up welcome centres overseas to attract skilled migrants, and creating a pan-European immigration portal. If Europe boosted its net immigration from non-European countries to this level—and did so in a way that led to equal employment rates between natives and immigrants—real GDP growth could accelerate by 0.26 percent per annum. Where Europe stands Europe can counteract the demographic drag on its workforce through higher participation, increased fertility rates, or greater inflows of non-European migrants.176 Fertility is an option that can be addressed only indirectly through government policy and, in any case, evolves over a long period.
In reality, in addition to action to boost participation, only immigration offers a genuine potential to expand the working-age labour pool in the period to 2025. Together, these two approaches could have a powerful effect on European economies. Today, annual net non-European migration ranges from zero in the Baltics and Central and Eastern Europe to three immigrants per 1,000 inhabitants a year in the Nordics. On average, extraterritorial—non-Europe-30—net immigration is about 60 percent lower than the equivalent figure in the United States and 85 percent below the rate in Canada.177 Over time, this has resulted in only 6.6 percent of the population of Europe having been born outside the region. This is significantly lower than the share in the United States, Canada, New Zealand, and Australia where between 13 percent and 27 percent of the population was born abroad. If we were to assume that immigration was the only tool available to Europe to stabilise its working-age population, we estimate that Europe could need an additional 11 million nonEuropean immigrants by 2025 compared with the UN Population Division’s 2025 normal migration scenario.
To achieve this increase, Europe may need to boost its net migration rate from 2.6 people per 1,000 inhabitants per year to 4.9 people (Exhibit 71).178 Today, Belgium, Norway, and Sweden are the only European countries that have such levels of We focus on immigration from countries outside Europe rather than migration among Europe-30 countries. This comparison uses Central Intelligence Agency data for Canada and United States; we note that comparability with Eurostat figures for Europe-30 may be limited. 178 This scenario is the base case 2025 normal migration scenario of the UN Population Division. 176 177 McKinsey Global Institute A window of opportunity for Europe 125 . net migration. By way of contrast, Canada and Australia receive about 5.7 newcomers per 1,000 inhabitants. Exhibit 71 To stabilise its prime working-age population, Europe-30 needs 11 million more immigrants, increasing the net migration rate to 4.9 per 1,000 Europe-30 prime working-age population, 15- to 64-year-olds Million European-born Additional net migration Annual net migration Persons per 1,000 population3 Current 1.3 345 Base case 2025, no migration1 0 321 Base case 2025, normal migration1 321 Stable prime WAP case, 20252 321 12 2.6 333 24 4.9 345 +11 Annual net migration of non-Europe-30 migrants Persons per 1,000 population, 2013 4.3 3.0 2.3 1.6 1.3 0.9 0.2 -0.1 Highimmigration, highpopulation countries4 Share of foreign-born population6 % Nordics United Kingdom and Ireland Continental Europe Europe-30 Southern Europe Central and Eastern Europe5 Baltics 8.6 7.1 7.9 8.3 6.6 7.2 1.5 8.9 1 Based on a medium-fertility scenario. 2 Working-age population. 3 Assumes stable working-age population to total population ratio. 4 Belgium, Norway, Sweden, i.e., countries with non-Europe-30 net migration of >4 newcomers per 1,000 population and population >5 million. 5 No data for Croatia, so Slovenia’s immigrant share is used as a proxy. 6 For Europe-30, this is non-Europe-30 immigrant share of total population. NOTE: Numbers may not sum due to rounding. SOURCE: Eurostat; United Nations Population Division; McKinsey Global Institute analysis 126 McKinsey Global Institute 2. Reform—much of it national—can deliver growth . We acknowledge sensitivities around this issue, but it is indisputable that, in economic terms, there are distinct advantages to growing the labour pool through immigration. One of these is that the age mix of immigrants tends to be skewed towards working age compared with the overall population. In 2013, 80 percent of non-European immigrants were aged between 15 and 59, compared with 60 percent in the European-born population (Exhibit 72). Consequently, a large part of the immigrant population is active in the labour market. At the same time, many studies have shown that this higher prevalence of immigrants in employment does not result in fewer jobs for the indigenous population.179 There is a counterpoint to the disproportionate share of immigrants in the workforce, however.
Unemployment among immigrants stands at 20 percent of those active in the labour force, compared with 10 percent among established EU-27 citizens (Exhibit 73). Exhibit 72 The positive impact of immigration comes from differences in the age structure between natives and incomers Distribution of population by age category, 2013 % Age >85 75–85 – Non-Europe-30 immigrants 1 = Europe-30 natives 3 -3 6 9 16 23 45–59 22 15–29 -7 21 7 18 16 +2 21 35 30–44 Difference Percentage points -1 2 60–74 <15 Prime working-age population +14 +4 -9 SOURCE: Eurostat; McKinsey Global Institute analysis See Alain Jousten et al., The effects of early retirement on youth unemployment: The case of Belgium, IMF working paper number 08/30, February 2008; Arie Kapteyn, Adriaan Kalwij, and Asghar Zaidi, The myth of worksharing, IZA discussion paper number 188, August 2000; and Tom Walker, “Why economists dislike a lump of labor”, Review of Social Economy, volume 65, issue 3, September 2007. 179 McKinsey Global Institute A window of opportunity for Europe 127 . Exhibit 73 Non-European immigrants are more likely than native Europeans to be of working age and active in the labour force Breakdown of total non-Europe-27 immigrant population compared with native population, 20131 % 100% = 461 million 35 million 16 Not of prime working age2 36 24 Prime working age not in the labour force Unemployed 18 5 Prime working-age population2 Employed 11 42 Europe-27 natives3 49 Non-Europe-27 immigrants4 1 Immigrants are people who were not born in the EU-27; natives are individuals born in the reporting country. 2 Prime working-age population is defined as 15- to 64-year-olds. 3 Natives are individuals born in the reporting country. 4 For Germany, foreign-born individuals are considered due to data availability. NOTE: Numbers may not sum due to rounding. SOURCE: Eurostat; McKinsey Global Institute analysis Rates of unemployment among immigrants from outside Europe compared with the established population vary in different countries (Exhibit 74). In the Czech Republic and Lithuania, for example, unemployment rates for immigrants are equal to or even lower than those of the native population. In Ireland and the United Kingdom, unemployment rates for both groups are also relatively similar. In Ireland, the unemployment rate of immigrants stood at 15.6 percent in 2013 compared with 12.7 percent for the native population.
In the United Kingdom, the equivalent shares are 9.8 percent and 7.5 percent. In many European countries, immigrants tend to be more educated than the average native citizen. In Ireland, 56 percent of non-European immigrants have completed a tertiary education compared with 34 percent of the native population.
However, this is not always the case. In Belgium, Norway, Sweden, and Switzerland, unemployment among non-European immigrants is more than triple that among established citizens, and an equal or lower share of immigrants has a higher education compared to established citizens. 128 McKinsey Global Institute 2. Reform—much of it national—can deliver growth .
Exhibit 74 Unemployment rates among immigrants compared with European natives vary from country to country Unemployment rate of immigrants vs. natives, 15- to 64-year-olds, 20131 % of native values Immigrant unemployment rate >2x native rate 1–2x native rate < native rate No data 1 Malta excluded from analysis due to data being unavailable. SOURCE: Enerdata; McKinsey Global Institute analysis Initiatives to change the game If Europe opted for policies that boosted the number of immigrants by the amount needed to fully offset the projected decline in its working-age population—with no other efforts on this front such as boosting participation or fertility—we estimate that this could increase real GDP growth by 0.26 percent per annum to 2025. This estimate assumes that governments put in place immigration systems that are better geared towards attracting immigrants who have received a higher education and therefore have better job prospects than many immigrants today, equalising employment rates among immigrants and natives. Apart from the direct boost to GDP from immigration, the rebalancing towards a larger working-age population would help to carry the costs of an ageing population, including the fiscal burden of pensions and health care. Among the initiatives that Europe could consider are: ƒƒ Introduce open and transparent immigration systems contingent on employment. At the very minimum, governments need to make immigration less burdensome and shape it according to societal and economic needs.
Sweden, for example, introduced an uncapped “demand-driven system” in 2008 following concerns about labour shortages.180 The system enables employers to hire from abroad as long as the vacancy had been advertised for more than ten days and the job meets collective wage and conditions contracts. Upon unemployment, immigrants have three months to secure a new job offer or they are required to leave. Australia has a two-stage system that relies Recruiting immigrant workers: Sweden 2011, OECD, December 2011. 180 McKinsey Global Institute A window of opportunity for Europe 129 .
heavily on temporary visas.181 There is no cap on temporary workers but light regulation of them. Immigrants are incentivised to undertake high-skilled employment, education, or training to qualify for permanent residency. The system has reduced unemployment among immigrants, and about 50 percent of temporary visa holders are given the right to stay permanently. Canada’s “supply-driven system” is based on points awarded for specific criteria.
These standardised criteria can change according to what jobs need to be filled, but at all times they are updated and available online with a test so that potential immigrants can calculate their personal score. Applications can be filled out online (unlike in 80 percent of Europe), reducing processing times and costs.182 The points-based system also helps to assure citizens that immigrants bring specifically needed skills and desired characteristics, thereby tempering political opposition to their arrival. ƒƒ Implement shortage lists that ease entry. Matching the skills of immigrants with the needs of employers can help to ensure that immigrants are employed for a sustained period.
Denmark, Germany, and Sweden have “shortage lists” published online in an effort to focus immigration on occupations with vacancies. In Sweden, the demandbased system guarantees employment; in addition, anyone who desires to fill an occupation on the shortage list does not need to return to the home country to apply for a work permit. One result has been a stronger correlation between visa applications and job openings, and about half of immigrants arriving under the worker immigration rules are focused in shortage occupations.183 In Denmark, someone whose skills match the shortage list receives bonus points to enable the applicant to obtain a residence permit for seeking and undertaking work.
In Germany, any immigrant whose skills match the shortage list can be hired without the employer having to meet a labour-market test. Such a test would usually be required to determine whether a job offering can be filled by someone from abroad. ƒƒ Increase education and integration opportunities. The potential value added of immigrants increases with their employment status and participation in society. As workers retire and the population ages, Europe faces a potential skill shortage, in particular for medium- and high-skilled jobs in engineering, information technology, and health.184 Germany and the Netherlands have average stay rates of highly educated international students that are 26 percent and 27 percent, respectively, above the OECD average of around 25 percent.185 International graduates in these countries have direct access to job-search visas and can apply for a permit without having to return to their home country.
Both countries have reformed their academic systems to international standards to attract foreign students. The Netherlands also benefits from widespread use of English.186 Internationally, stay rates remain below Canada’s 34 percent. By allocating additional points for higher education, immigration to Canada is skewed towards the higher-skilled end of the spectrum.
Notwithstanding the political complexities, expanding the EU Blue Card system to Denmark, Ireland, Norway, Switzerland, and the United Kingdom could help to encourage skilled immigration. The scheme gives highly educated immigrants who have a job offer at strict salary requirements the right to work in Europe through a single application procedure. Post Robert G. Gregory, The two-step Australian immigration policy and its impact on immigrant employment outcomes, IZA discussion paper number 8061, March 2014. 182 Comparative immigration study 2013–2014: Migration formalities for third-country nationals in 26 European countries, Deloitte, November 2013. 183 Recruiting immigrant workers: Germany 2013, OECD, February 2013; Recruiting immigrant workers: Sweden, OECD, December 2011. 184 Martin van der Ende et al., European vacancy and recruitment report 2012, European Commission, November 2012; 2013 skills and demand forecasts from the European Centre for the Development of Vocational Training (Cedefop). 185 International migration outlook 2011, OECD, July 2011. 186 Brooke Sykes, Mobile talent? The staying intentions of international students in five EU countries, Migration Policy Group, April 2012. 181 130 McKinsey Global Institute 2.
Reform—much of it national—can deliver growth . entry, Canada provides free language training to immigrants, helps them find a job and a place to live, and provides information about available community services to encourage integration. Similarly, Germany offers free language classes and has recently opened online, as well as physical, welcome centres that offer personal assistance to improve immigrant perceptions and aid integration. ƒƒ Establish European welcome centres abroad to attract foreigners. To attract more foreign migrants, Europe would need to brand itself as an attractive destination with a strong job market, high social mobility, and a pleasant living environment for highly skilled immigrants. Agencies can support foreign students and qualified workers in the immigration process, establishing better links with local universities and businesses. For example, the British Council is represented in more than 100 countries, its aim being to encourage educational and cultural exchanges with the United Kingdom.
The organisation promotes educational opportunities in the United Kingdom and provides English-language training. Similarly, the Australian Agency for Education and Training has a number of offices in the Middle East to attract students from that region. With a central point of contact—rather than individual universities marketing themselves separately— countries can increase their reach and impact. ƒƒ Create a pan-European immigration portal.
A significant barrier for incoming immigrants in Europe is admission procedures that tend to impose a multitude of requirements and involve long processing times for applications and high rejection rates.187 The EU Blue Card is promising because it has a single application procedure. A single online visa application portal for all European countries could potentially serve to streamline the immigration process while maintaining national sovereignty over the assessment and decisions on entry. The idea would be that a candidate for immigration would be able to access all the documents required in one place, and then decide which European country (or countries) to apply for. This system would have similar characteristics to the Common Application, a single portal for students to apply to more than 500 universities in 12 countries.
Such a system could also be a useful step towards a unified points-based immigration system. Recruiting immigrant workers: Germany 2013, OECD, February 2013; Recruiting immigrant workers: Sweden 2011, OECD, December 2011. 187 McKinsey Global Institute A window of opportunity for Europe 131 . 11. ENHANCED LABOUR-MARKET FLEXIBILITY The labour market is where most people feel the ups and downs of the economy most acutely. In the two decades to 2012, two-thirds of European economic growth accrued to workers through labour incomes.188 The effective functioning of the labour market is the most important way of ensuring that growth is inclusive. Yet Europe is underperforming other developed economies.
In 2013, the share of people of working age employed in Europe was lower than the OECD average, and there is a large degree of bifurcation between workers on permanent and temporary contracts, with many young people employed on the latter. Moreover, labour mobility in Europe is relatively low. Given these relatively poor labour-market outcomes, it is essential that everything be done to ensure that the job market works more effectively. A number of European economies have successfully reformed their labour markets over the past decade, reducing unemployment or increasing the share of people of working age with jobs in other ways. Initiatives to change the game include a reduction in employment protection and labour taxes to incentivise hiring, particularly in the case of younger workers (Spain used both levers in its labour-market reform), adopting more assertive active labour-market policies at the expense of passive benefits such as Denmark’s flexicurity model, or making wagebargaining mechanisms more flexible.
Europe should also intensify efforts to make the single labour market work in reality. Reforms of this nature could unlock approximately 0.15 percent of additional real GDP growth per annum. 64% labour-force participation among 15–64 age group in Europe in 2013 Where Europe stands Europe’s labour markets are not in good shape. In 2013, the continent’s share of those aged 15 to 64 in employment stood at 64 percent.
That compared with 72 percent in Australia and Canada, for instance. Even before the financial crisis in 2007, only 66 percent of Europe’s working-age population was employed. The two percentage point decline since late 2007 was led by Southern European countries, whose share fell by seven percentage points to only 55 percent by late 2013.
In other parts of Europe, the picture is not as bleak. In the Nordic countries and the United Kingdom and Ireland, the employed share in late 2013 stood at 73 and 70 percent, respectively, despite a decline of 1.5 percentage points since late 2007. During the same period, the countries of Continental Europe experienced an increase of two percentage points, to 70 percent, in the share of people employed. While the Baltics’ share dropped dramatically, from 67 percent to 59 percent, in only three years, it had recovered to 67 percent by late 2013 (Exhibit 75). 188 132 The annual labour income share is calculated by the OECD as total labour costs (compensation of employees, adjusted for the self-employed) divided by nominal output.
It is available for all Europe-30 countries except Croatia and Malta. McKinsey Global Institute 2. Reform—much of it national—can deliver growth . Exhibit 75 European employment rates are, on average, below those of other OECD economies but have improved lately, except in Southern Europe Employed share of working-age population, 20131 Annual data, % Employment rate, 1Q07–4Q13 % 78 72 Australia 76 74 72 Canada Nordics 72 United Kingdom and Ireland 70 68 OECD 67 65 66 Baltics 64 United States Continental Europe Europe-30 62 Central and Eastern Europe 60 58 Europe 64 56 Southern Europe 54 2007 08 09 10 11 12 2013 1 Defined as aged 15–64. SOURCE: OECD; Eurostat; McKinsey Global Institute analysis Many of Europe’s labour markets are also characterised by a high degree of bifurcation between workers on permanent and on temporary contracts, and—related to that—between the older and younger labour force (Exhibit 76). At 25 percent, youth unemployment (aged 15 to 24) in 2013 was nearly three times that of adult (aged 25 to 64) unemployment at 9 percent. Moreover, those young people who are employed are much more likely to work on temporary contracts: 43 percent of employees younger than 25 are temporary workers, with shares exceeding 60 percent in some countries (69 percent in Poland, 65 percent in Spain, 61 percent in Portugal). The equivalent number for the adult population is 11 percent.
Incomes, too, have developed less favourably for young workers than for older employees. In Spain, for instance, the incomes of adult workers have declined by 1 percent a year since 2007, while young employees have experienced a 4 percent fall in their incomes every year. McKinsey Global Institute A window of opportunity for Europe 133 . Exhibit 76 Labour-market conditions are toughest for young people, particularly in Southern Europe Indicators of labour-market duality Unemployment, 2013 % Temporary employment, 2013 % of total employees Income increases, 2007–12 Median equivalised net income; compound annual growth rate, purchasing power standard % Youth 15–24 15–24 18–24 Adult 25–74 25–64 25–54 27 58 Greece -5 9 25 -3 65 56 Spain 21 24 -1 53 40 Italy 11 10 Germany Europe 1 1 59 24 France -4 4 12 8 4 53 8 3 8 5 2 43 25 11 9 1 2 SOURCE: Eurostat; McKinsey Global Institute analysis In Europe, the labour market also has an important international dimension. A major element of the European single market is that the EU and its partners Iceland, Liechtenstein, and Norway have written into law the free movement of labour across borders. However, the reality still lags behind the aspiration. In 2012, intra-EU immigration stood at 0.35 percent of the EU population compared with 1.4 percent internal migration among the German Länder, 1.7 percent internal migration among the Swiss cantons, and 2.2 percent interstate migration in the United States. What explains these poor European labour-market outcomes? There is no doubt that the post-crisis economic environment has compounded the employment situation, but many structural labour-market issues were apparent well before 2008.
Moreover, the stark differences observed in the outcomes of various European countries point towards the importance of different labour-market regulations and institutions in determining the performance across the business cycle (Exhibit 77). 134 McKinsey Global Institute 2. Reform—much of it national—can deliver growth . Exhibit 77 Regulation and institutions determine how well a national labour market works for employers and employees Labour-market regulation and institutions during the job life cycle â–ª Wage-setting mechanisms such as â–ª â–ª The generosity of (and constraints on) unemployment benefits shapes the incentives for the unemployed and inactive to return to the labour market Active labour-market policies support the unemployed in their job search, e.g., through training and matching â–ª Seeking employment centralised bargaining determine the costs and conditions of employment The tax wedge on remuneration also affects the cost of keeping people employed During employment Exiting employment â–ª Employment protection legislation affects the degree of contract flexibility and labour mobility SOURCE: McKinsey Global Institute analysis European labour markets have often been characterised as falling into four different social models: Anglo-Saxon, Continental/Germanic, Nordic, and Mediterranean (Exhibit 78).189 Three of these archetypes have achieved more favourable labour-market outcomes: the Anglo-Saxon countries with a highly flexible liberal model, the Germanic countries in Continental Europe with a cooperative model supporting (re-)entry into employment, and the Nordic countries with a flexicurity model that combines relatively flexible labour markets with high support for the unemployed. In recent years, some Mediterranean countries, notably Portugal, Spain, and Greece, have made considerable progress towards making their labour markets more flexible. It is vital that others emulate some form of the successful arrangements in order to boost employment and ensure that businesses have access to the workers they need. The liberal Anglo-Saxon model is characterised by very low unemployment protection. It prevails in the United Kingdom, Ireland, and, to a lesser extent, Eastern European countries such as Poland.
While the highly flexible Anglo-Saxon model provides only limited support for job seekers, modest unemployment benefits ensure high personal incentives for reentry into employment. The tax wedges between labour costs and take-home income in the United Kingdom, Ireland, and Poland are at the bottom end of the OECD spectrum. André Sapir, “Globalization and the reform of European social models”, Journal of Common Market Studies, volume 44, number 2, June 2006. 189 McKinsey Global Institute A window of opportunity for Europe 135 . Exhibit 78 There are four main labour-market archetypes Labour-market regulation and institutions across the employment life cycle Employment protection legislation, 2013 OECD indicator on the protection of regular contracts against dismissals1 Anglo-Saxon 1.6 0.4 Continental/ Germanic Nordic Spending on active labour-market policies, 2011 Active measures2 (% of GDP) 0.9 2.4 Europe 1.0 2.7 2.5 OECD 31.1 2.9 Mediterranean 2.3 0.6 0.7 0.4 Tax wedge on labour costs, 2013 Income tax plus social security contributions (% of labour costs) Labour-market outcomes, 2013 % Employment rate Unemployment rate 70 45.2 43.0 45.4 41.4 35.9 8 73 6 73 7 58 16 64 11 65 8 1 Scale: 0 = least restrictive, 6 = most restrictive; weightings: 5/7 weight on individual dismissals, 2/7 weight on collective dismissals. 2 Including placement services, training, employment or start-up incentives, supported employment and rehabilitation, and job-creation measures. NOTE: Anglo-Saxon = United Kingdom and Ireland; Continental/Germanic = Germany, Austria, Switzerland, Belgium, and Netherlands; Nordics = Denmark, Norway, Sweden, and Finland; Mediterranean = France, Italy, Spain, Portugal, and Greece. SOURCE: OECD; Eurostat; McKinsey Global Institute analysis The second archetype is the coordinated Continental/Germanic model, typified by Germany and Austria and characterised by widespread tripartite cooperation. Belgium and the Netherlands also fall within this archetype. While employment protection is high and labour-market flexibility low, an extensive infrastructure ranging from vocational training to short-term working schemes help keep employment levels relatively high and resilient in times of downturns. In contrast to the extensive active labour-market policies, passive unemployment benefits are subject to tight eligibility criteria, underpinning the incentives for the unemployed and inactive to pick up employment.
Moreover, a significant degree of wage restraint is embedded in the coordinated bargaining process of Germany and Austria and partly offsets the high tax wedge on employment. Indeed, Continental Europe is the only European region in which real labour costs did not increase between 2000 and 2008, driven by German wage moderation. Since the crisis, however, real labour costs have declined in all European regions. The third archetype is the Nordic model, typified by the Danish system of flexicurity.
This approach balances high labour-market flexibility with high levels of support for those seeking employment. With a significant degree of tripartite cooperation, the Nordic countries also benefit from wage restraint in coordinated bargaining systems while maintaining a relatively high tax wedge on labour costs.190 The Danish labour-market reforms in the 1990s that began to develop the country’s flexicurity model enabled a sharp fall in unemployment. Between 1993 and 2008, Danish unemployment dropped from 8.9 percent to 2.5 percent, while during the same period EU-wide unemployment decreased from 8.2 percent to only Jan Hendeliowitz, Danish employment policy: National target setting, regional performance management and local delivery, Danish National Labour Market Authority, February 2008. 190 . 6.0 percent. The Danish reforms included a partial decentralisation of wage bargaining, a tightening of eligibility criteria for unemployment benefits, and the strengthening of active labour-market policies focused on upgrading the skills of those unemployed. In 2008, Denmark spent 1.3 percent of GDP on such programmes.191 A less successful approach has been typical in Southern Europe and France. This Mediterranean model is characterised by high employment protection for permanent workers, high tax wedges on labour incomes, and high unemployment benefits, while providing limited support to activate the unemployed.
Partly in consequence, the Mediterranean countries have suffered from high unemployment and high social expenditure, especially since the 2008 crisis. Moreover, the duality between highly protected permanent workers and less protected temporary workers has led to young people being particularly vulnerable in the labour market. In recent years, some Southern European countries, notably Greece, Portugal, and Spain, have made considerable progress in making their labour markets more flexible.
However, reform efforts are still lacking in France and Italy, though in the latter case legislation is being prepared that proposes greater labour flexibility and reform of unemployment-related social protection. Initiatives to change the game Reforming Europe’s labour markets could increase GDP growth between 0.1 percent and 0.2 percent a year. The IMF and the ECB estimate that growth would increase by 0.1 percent per year if Europe were to close half of the gap with “best-in-class” OECD countries in terms of looser employment protection legislation, moderate unemployment benefits, and more assertive active labour-market policies.192 Of this total, 0.04 percent would come from each of employment protection legislation and unemployment benefits, and 0.01 percent from active labour-market policies. Other estimates point towards a higher impact from labourmarket flexibility.
The OECD has estimated that a 0.5-point reduction in the employment protection legislation score could result in a 0.3 percentage point increase in labour productivity growth in the business sector.193 This would imply an impact on growth of between 0.1 and 0.2 percent for the same change in employment protection legislation. While we suggest some specific labour-market reforms, it is important to note that the problems of unemployment in Europe are multifaceted and country-specific and that there is no “one-size-fits-all” solution at the national or EU level. Moreover, individual labour-market policies or reforms are most effective when they are part of a comprehensive strategy that is consistent with the particular institutional context in individual countries.194 Our analysis suggests that the following should be considered as potential cornerstones of that strategy: ƒƒ Reduce employment protection and labour taxes to incentivise hiring, particularly for younger workers. While the impact of employment protection on overall unemployment is ambiguous, high employment protection for permanent contracts can exacerbate the duality between permanent and temporary employees as well Beyond austerity: A path to economic growth and renewal in Europe, McKinsey Global Institute, October 2010. 192 The assumptions behind this calculation are as follows: reduction of half the gap on employment protection legislation to the average of the three lowest levels in the OECD (Canada, the United Kingdom, and the United States); reduction in half of the gap in the average replacement rate of unemployment benefits relative to the average within a set of countries with low replacement rates (Australia, Canada, Japan, New Zealand, the United Kingdom, and the United States); increase in the ratio of spending on active labour-market policies relative to six OECD countries with high spending (Austria, Denmark, the Netherlands, Norway, Sweden, and Switzerland).
We assume that 80 percent of the long-term potential (to 2060) is realised by 2025. See Derek Anderson et al., “Assessing the gains from structural reforms for jobs and growth”, in Jobs and growth: Supporting the European recovery, Martin Shindler et al., eds., IMF, 2014. 193 The 2012 labour market reform in Spain: A preliminary assessment, OECD, December 2013. 194 Euro area policies: 2014 Article IV consultation, selected issues, IMF Country Report number 14/199, July 2014; Andrea Bassanini and Romain Duval, “The determinants of unemployment across OECD countries: Reassessing the role of policies and institutions”, OECD Economic Studies, number 42, issue 1, 2006. 191 McKinsey Global Institute A window of opportunity for Europe 137 . as between older and younger employees.195 Elevated hiring costs due to high tax wedges are associated with lower employment across groups, while high minimum wages particularly affect younger workers.196 The Spanish labour-market reforms in 2012 focused on introducing greater flexibility in wage-setting and working conditions and making work contracts more flexible, particularly for small businesses. The OECD estimates that these reforms will result in a longer-term decline in unit labour costs of up to 2 percent and in an increase in annual labour productivity growth by 0.25 percent, while reducing the bifurcation between permanent and temporary workers (Exhibit 79).197 Exhibit 79 Some Southern European countries have made considerable progress in making their labour markets more flexible and reducing bifurcation Labour-market reform and labour-market bifurcation, 2008–12 Nordics Continental Europe United Kingdom and Ireland Southern Europe Baltics Central and Eastern Europe Change in temporary share of employment Percentage points 2.5 Slovakia 2.0 Hungary 1.5 Estonia 1.0 Ireland Luxembourg Netherlands United Kingdom 0.5 Czech Republic Italy France 0 Finland Austria Poland Denmark Belgium Switzerland Slovenia -0.5 Norway Germany -1.0 -1.5 -2.0 Greece Portugal -5.5 -6.0 -0.90 Spain -0.50 -0.45 -0.40 -0.35 -0.30 -0.25 -0.20 -0.15 -0.10 -0.05 0 0.05 0.10 Change in employment protection legislation score for regular contracts Points SOURCE: OECD Indicators of Employment Protection; McKinsey Global Institute analysis Ibid. Ana Rincon-Aznar and W. S. Siebert, Employment protection, productivity, wages and jobs in Europe, INDICSER discussion paper number 36, December 2012; Euro area policies: 2014 Article IV consultation, selected issues, IMF Country Report number 14/1999, July 2014. 197 The 2012 labour market reform in Spain: A preliminary assessment, OECD, December 2013. 195 196 138 McKinsey Global Institute 2.
Reform—much of it national—can deliver growth . ƒƒ Adopt more assertive active labour-market policies at the expense of passive benefits. Stepping up active labour-market policies (for instance, training and matching employment seekers with vacancies) while tightening eligibility criteria for unemployment benefits is generally associated with an increase in employment, although the effectiveness varies by the type of the programme.198 The German Hartz reforms of 2002 to 2005 combined a strengthening of active labour-market policies with a comprehensive reform of passive unemployment benefits, which included tightening of eligibility criteria, shortening of payment durations and reduction of amounts.199 This combination attempts to activate the unemployed in their search for work, while supporting them in the process. It is widely held that these reforms, alongside the existing extensive active labour-market policies, contributed to Germany’s favourable employment outcomes.200 ƒƒ Intensify efforts to make the single labour market work. Increasing labour mobility among European countries can help improve the matching of workers and jobs across countries.
While personal, cultural, and language barriers likely dwarf administrative or policy-induced barriers to migration, there are some measures policy makers can take to improve the functioning of the European Single Market.201 For instance, promoting English-language education across the EU as well as enhancing the provision of training in local languages could ease the path for people seeking jobs outside their home country. Another useful step would be to improve the coordination of job centres and employment agencies to help match available workers with available jobs. A system in which professional qualifications in one country are recognised in another and pensions are transferable would further reduce friction. 100K Germany, where unemployment is among the lowest in the EU, has made proactive efforts to attract EU nationals from countries with higher unemployment, for example, through a “permanent co-operation bridge” between Spanish and German job centres. In 2013, there was a net influx of more than 100,000 Southern Europeans—40,000 of whom were Italian—into Germany.
That compares with annual figures of only about 40,000 prior to the crisis. However, there is considerable room for growth, as no other region has yet reached the mobility levels of Central and Eastern Europe, the region from which almost 500,000 people net moved to Germany in 2013. Southern Europeans migrated to Germany in 2013 A common European unemployment insurance scheme is a complementary tool to mitigate asymmetric business cycles in Europe, and particularly the Eurozone. It serves as an automatic stabiliser transferring funds from booming regions to those in recession, thus helping to offset the consequences of negative economic shocks.
As long as the unemployment benefits funded under such a scheme are limited to a relatively short duration (say, less than one year), they remain linked to the economic cycle rather than to structural differences and therefore would not result in systematic fiscal transfers across countries over the business cycle.202 As a consequence, every country should, at times, become a net contributor as well as a beneficiary. The European Parliament estimates Andrea Bassanini and Romain Duval, “The determinants of unemployment across OECD countries: Reassessing the role of policies and institutions”, OECD Economic Studies, number 42, issue 1, 2006; Euro area policies: 2014 Article IV Consultation, selected issues, IMF Country Report number 14/1999, July 2014. 199 For example, reform and expansion of federal job centres as well as start-up grants for the unemployed transitioning into self-employment. 200 See, for example, Tom Krebs and Martin Scheffel, “Macroeconomic evaluation of labor market reform in Germany”, IMF Economic Review, volume 61, number 4, December 2013. 201 Internal market, Special Eurobarometer 398, European Commission, October 2013. 202 Sebastian Dullien and Ferdinand Fichtner, “A common unemployment insurance system for the euro area”, DIW Economic Bulletin, volume 3, issue 1, January 2013. 198 McKinsey Global Institute A window of opportunity for Europe 139 . that an integrated scheme for short-term unemployment benefits would have attenuated the GDP loss in the most affected countries of the Eurozone by €15 billion per year.203 ••• The 11 growth drivers discussed in this chapter together would constitute a sweeping programme of reform that has the potential to transform Europe’s growth prospects. It is notable that three-quarters of them can be put in place at the national, rather than the EU, level—holding out the promise of real change that doesn’t rely on the complexities of European decision making. However, it is highly unlikely that the transformative change that they could deliver will be possible without strong investment and job creation in Europe to pay for the up-front investment needed, and to ease the transition and make reform palatable to Europe’s citizens. We turn to the question of investment and job creation in the next chapter. Joseph Dunne, Mapping the costs of non-Europe, 2014–19, European Parliamentary Research Service, March 2014. 203 140 McKinsey Global Institute 2.
Reform—much of it national—can deliver growth . © Getty Images McKinsey Global Institute A window of opportunity for Europe 141 . Chapter photo Chapter 3: Orange scientists © Getty Images 142 McKinsey Global Institute 2. Reform—much of it national—can deliver growth . 3. HOW EUROPE CAN REIGNITE INVESTMENT AND JOB CREATION A programme of structural reform based on the 11 growth drivers that we have discussed has the power to profoundly change the way the European economy works, boosting productivity and competitiveness in the long term. But such a programme will cost money in the short term. This is the nub of Europe’s challenge.
The continent needs reform to boost the long-term performance of the economy to meet Europeans’ economic and societal aspirations. But, in order to reform and produce healthier long-term growth, Europe needs more investment and job creation in the short term. Europe has a significant demand deficit, leaving the continental economy to rely largely on exports to drive the recovery thus far. Households are attempting to deleverage, corporations are piling up cash rather than investing because of the uncertain economic outlook, and the public sector has embarked on austerity policies to keep debt levels under control.
While each sector is acting rationally in its own right, the result is that aggregate demand remains weak. Output overall remains 15 percent below where it would have been on pre-crisis trends. Many proposals have been made on how investment and job creation could be unleashed, but discussion to date has tended to focus narrowly on the magnitude and composition of a QE programme and on the capacity for fiscal stimulus. Europe needs to engage urgently in a robust and unbiased debate on a broader range of investment and job creation options. Some options are comparatively feasible.
For example, there could be moderate increases in some government deficits in line with the Fiscal Compact. Others, such as central bank– financed spending vouchers, are bolder and more radical, requiring a substantial shift in thinking. This does not mean that they should be dismissed.
Rather, their merits and drawbacks should be debated in the public and political arena so that Europe can create innovative solutions to its investment and job creation crisis. We acknowledge that there is bound to be nervousness about some measures for stimulating investment and job creation. Decision makers and citizens are rightly concerned about any unsustainable spending. All the options we discuss in this chapter entail risk and possibly unintended, often distributional, consequences.
But the status quo has significant risks, too. The onus is therefore on policy makers to find ways to enable additional public and private spending that is sustainable. Only by doing so will Europe be able to put in place a credible programme of reform that enhances the continent’s long-term competitiveness and growth prospects. .
Successful reform requires productive investment and demand for jobs—and vice versa Many growth drivers will be difficult to implement without more spending. Those that invest for the future could require additional spending of between 1.7 percent and 3.7 percent of European GDP per annum (Exhibit 80).204 For example, developing competitive cities will require the construction of more good-quality affordable housing and transport infrastructure.205 Establishing a more nurturing environment for innovation will require governments to gear public procurement towards R&D-intensive goods and services. Exhibit 80 To be put into practice, the growth drivers will require investment and stronger demand to create jobs Up-front investment required Estimated annual outlay1 % of Europe-30 GDP Nurturing ecosystem for innovation Effective education to employment Investing for the future 0.6–1.6 0.4–0.7 Supporting urban development Stronger demand required to create jobs and make reforms palatable Competitive and integrated markets in services and digital 0.4–0.5 Productive infrastructure investment Reduced energy burden Total Boosting productivity Public-sector productivity Further openness to trade Grey and female labour-force participation 0.3–0.9 Mobilising the workforce 1.7–3.7 Pro-growth immigration Enhanced labourmarket flexibility 1 Estimate assumptions are in the appendix. SOURCE: McKinsey Global Institute analysis Many of the growth drivers involve substantial transitional costs to society. Those that mobilise the workforce may not be palatable to many citizens—and are therefore not politically feasible while investment and job creation are weak and unemployment high. They could exacerbate a difficult economic context in the short term even while likely to produce favourable outcomes in the longer term.
Although, for example, enhancing labour-market flexibility will help the economy over the long haul, many individuals may be negatively Costs are calculated at the country level and aggregated for Europe. The cost of an improved innovation ecosystem is based on the gap between the proportion of R&D spending in the private and public sectors together among European countries and the international top performer (South Korea) and the third-best performer (the United States). Education costs are estimated based on the gap between each country and average spending as a share of GDP among countries that score highly on the effective education-toemployment growth driver, corrected for the number of students in each country.
Affordable housing draws on the 2014 MGI report A blueprint for addressing the global affordable housing challenge and takes the estimate of the cost to raise housing across Europe to the minimally acceptable standard. Costs are allocated to countries, where specific estimate is not available, on the basis of severe housing deprivation from Eurostat’s SILC data set. The cost of future infrastructure needs is calculated based on the range of projected GDPgrowth rates and the methodology developed in the 2013 MGI report Infrastructure productivity: How to save $1 trillion a year. 205 A blueprint for addressing the global affordable housing challenge, McKinsey Global Institute, October 2014. 204 144 McKinsey Global Institute 3.
How Europe can reignite investment and job creation . affected in the short term.206 Further openness to trade can harm those working in sectors that are newly exposed to global competition. Growth drivers that boost productivity involve difficult transitions as economies rebalance and companies and public organisations restructure. Such transitions are difficult even in benign phases of an economic cycle and are all but politically impossible when those who may lose their jobs in the process will find it hard to find another one. Helping those whose economic prospects are hurt by the transition may require generous outlays. In addition to the direct and indirect costs of implementing the growth drivers, there is a broader need for a positive demand environment that can help create jobs. This can make many reforms easier.
For example, increasing female and grey labour participation or immigration at a time of already high unemployment will be difficult. Policy makers may find that political resistance to trade agreements is too strong when voters feel economically insecure. Of course, some of the reforms can themselves trigger private investment and therefore stimulate investment and job creation. For instance, greater immigration may require investment in housing and create opportunities for local service firms such as retailers. Progress on building a single market in energy or telecoms and clarity on regulation in those sectors could unleash investment in the respective infrastructure. Spain's R&D budget needs to increase by €24B to match that of South Korea In practice, European countries will need to prioritise reforms that meet their most pressing needs.
Regardless of which items in the menu of growth drivers a country chooses to implement, there will be substantial additional costs that will not be met in the current demand context. For instance, Spain’s education-to-employment system is in need of an overhaul, and its total R&D budget would need to increase by €24 billion to almost three times its current level in order to reach South Korea’s R&D share of GDP. At the same time, Spain’s infrastructure spending is near or above the level required for expected long-term GDP growth, suggesting that additional resources devoted to infrastructure are unlikely to be productive.
Similarly, Italy has a large need for further spending on education and innovation. In contrast, Germany already has relatively high levels of R&D spending but spends €14 billion less on infrastructure than would be suitable for long-term GDP growth. Germany also spends relatively little on education to employment as a share of GDP and controlling for the number of students—almost €30 billion less per year than what would be expected. A gap in aggregate demand persists in all domestic sectors of the economy, leaving Europe to rely on net exports Seven years on from the global recession of 2008, the European economy is running well below its long-term potential. Thus far, Europe has relied on net exports—despite the weakness of the world economy—while all other sources of demand remain constrained. Accommodative monetary policy has not compensated, and it cannot on its own compensate for weak demand.
All sectors will need to play their part to overcome Europe’s demand deficit and thereby help to build the platform needed for structural reform. Daiji Kawaguchi and Tetsushi Murao, Labor market institutions and long-term effects of youth unemployment, IZA discussion paper number 8156, April 2014. 206 McKinsey Global Institute A window of opportunity for Europe 145 . A large output gap persists In 2014, Europe was still running an output gap—the difference between the actual GDP and the potential capacity of existing labour and capital—of 2.4 to 2.7 percent of GDP, according to the European Commission, the IMF, and the OECD.207 That is slightly more than the size of the economies of Greece and Ireland combined.208 There are other ways to measure how much the economy is running below its potential. For instance, real potential output growth has dropped from 2 percent a year before the crisis to 0.7 percent per annum (Exhibit 81). This has left Europe’s economy at 10 percent below its pre-crisis potential output trend. The drop in the potential output growth rate stems from factors including a loss in human capital due to long-term unemployment, falling investment, and a rebalancing of the economy resulting in a glut of unproductive assets in some sectors. Looking at actual output, extrapolating from the pre-crisis trend that in the mid-2000s was running ahead of potential output suggests that the output of the European economy is currently around 15 percent below where it would have been if the crisis had not occurred. Exhibit 81 Across all measures, output has significantly lagged behind the potential of the European economy Europe-28 actual vs.
potential output 2010 chain-linked € trillion Actual output Potential output1 Extrapolated pre-crisis actual2 Extrapolated pre-crisis potential3 16.0 Output gap % of GDP 15.5 15.0 14.5 -15.4 14.0 -10.0 13.5 -2.4 13.0 12.5 12.0 11.5 2004 05 06 07 08 09 10 11 12 13 2014 Forecast 1 “Potential output” describes the productive capacity of an economy in case of sustainable use of available labour, capital, and technologies. 2 “Extrapolated pre-crisis actual” assumes real growth continues at same rate as it did during the pre-crisis boom years. This would have been unsustainable even in the old economy. 3 “Extrapolated pre-crisis potential” assumes that potential GDP continues to grow at same rate as it did pre-crisis. In this regime, sustainable growth could have occurred faster. SOURCE: European Commission; OECD; McKinsey Global Institute analysis Based on European Commission (2.4 percent for the EU-28), IMF (2.5 percent excluding countries amounting to 6.9 percent of EU-28 GDP for which data were not available), and OECD (2.7 percent excluding countries amounting to 3.3 percent of EU-28 GDP for which data were not available). 208 Output gaps cannot be directly observed from the economy and are therefore subject to a great deal of uncertainty.
While they are usually directionally correct, revisions to the magnitude of output gaps are frequent and large. The average revision is 1.5 percent of GDP. See, for example, Karel Havik et al., The production function methodology for calculating potential growth rates and output gaps, European Commission economic paper number 535, November 2014, and Eugen Tereanu, Anita Tuladhar, and Alejandro Simone, Structural balance targeting and output gap uncertainty, IMF working paper number 14/107, June 2014. 207 146 McKinsey Global Institute 3.
How Europe can reignite investment and job creation . The European average masks a great deal of variation among countries (Exhibit 82). Greece has an output gap of 11 percent of GDP, and its economy’s output is 45 percent below its pre-crisis trend. Italy’s output gap amounts to nearly 5 percent of GDP and France’s to 2 percent of GDP. Germany and the United Kingdom are two major exceptions to the general picture of significant output gaps across Europe.
Both economies are running at approximately their estimated potential, although, like other European economies, still far below their pre-crisis trend.209 Exhibit 82 The output gap measures only a small part of the difference between European GDP today and where it would have been on pre-crisis trends Output gap Output gap and gap to position on pre-crisis trend1 % of potential GDP, 2014 (forecast) Germany -0.8 United Kingdom Spain -0.8 France Italy Greece Ireland Portugal -0.2 -2.3 -4.5 -6.0 -6.5 Gap to pre-crisis trend -5.0 -11.0 -15.4 -10.9 -13.5 -16.1 -25.9 -29.3 -44.7 1 Based on European Commission data. Pre-crisis trend defined from the geometric mean of actual real growth between 2002 and 2007. SOURCE: European Commission; IMF; OECD; McKinsey Global Institute analysis Countries with high output gaps are not using the full capacity of their economies, which leaves almost everyone worse off than they would otherwise be. Periods with large output gaps impose a substantial human cost and raise the risk of a “lost generation” as young people are forced out of the job market and lose the opportunity to develop the skills that would make them more productive in the future.210 It is no coincidence that roughly 75 percent of survey respondents in Spain and Italy, countries with high output gaps, say that they are unhappy or very unhappy with their countries compared with only 27 percent of respondents in Germany, whose output gap is close to zero (Exhibit 83).211 Estimates of Germany’s output gap come from the European Commission (-0.8 percent), the IMF (-0.6 percent), and OECD (0.1 percent). 210 Daiji Kawaguchi and Tetsushi Murao, Labor market institutions and long-term effects of youth unemployment, IZA discussion paper number 8156, April 2014. 211 MGI European Aspirations Conjoint Survey, August 2014 (N = 2,000 in each country). 209 McKinsey Global Institute A window of opportunity for Europe 147 .
Exhibit 83 European survey respondents in countries with high output gaps and unemployment tend to be significantly less satisfied Respondents “unhappy” or “very unhappy” with their country Weighted; % Unhappy Very unhappy 77 73 64 34 39 47 39 27 23 7 32 22 22 20 16 34 31 6 24 14 12 9 43 34 Poland Germany Sweden United Kingdom France Romania Spain Italy Output gap % of GDP, 2014 -0.8 -0.8 -1.6 -0.8 -2.3 -1.3 -6.0 -4.5 Unemployment rate %, 2013 10 5 8 8 11 7 26 12 NOTE: Numbers may not sum due to rounding. SOURCE: MGI European Aspirations Conjoint Survey, August 2014; World economic outlook: Recovery strengthens, remains uneven, IMF, April 2014; McKinsey Global Institute analysis Europe has had to rely on net exports to drive recovery while spending in all domestic sectors remains weak A rise in net exports has not been nearly enough to counteract contracting spending in all domestic sectors. Net exports as a share of GDP for Europe grew by 2.4 percentage points between 2008 and 2013, the only source of demand that grew significantly over the period (Exhibit 84).212 In contrast, the recovery in the United States has been mostly generated by the domestic economy. While net exports have performed strongly since the crisis in Europe, questions linger over how much further they can grow as the global economy remains weak and further imbalances can contribute to low economic growth elsewhere in the world, depressing destination markets. Much of the growth in net exports outside the EU came from Germany, which had increases in gross exports of greater than €100 billion between 2008 and 2013. 212 148 Where statistics on the European economy are cited without other clarification, they are based on the AMECO database. McKinsey Global Institute 3. How Europe can reignite investment and job creation .
This is a mixed blessing for the European economy. Export-led growth is susceptible to sudden changes in the external economic environment outside domestic policy makers’ control. High net exports can also be a symptom of weak domestic demand. At the same time, the Eurozone has started to rebalance. The economies of Southern Europe have strongly increased their net exports.
Spain increased its nominal net exports by €90 billion from 2008 to 2013, and Italy increased its by €45 billion over the same period. Such rebalancing can help the most troubled economies and will be required for longer-term sustainability. However, such rebalancing is difficult to achieve in a monetary union. Exhibit 84 Europe’s recovery has mainly come from exports despite a weak global economy, while the US recovery has been powered by domestic consumption Change in real GDP, 2008–13 % of real 2008 GDP Europe-30 GDP in 2005 € United States GDP in 2009 $ Real GDP 2008 100.0 Corporates -2.3 Households Public sector -1.2 0.3 100.0 1.0 4.6 -0.7 Net exports 2.4 0.9 Real GDP 2013 99.1 105.8 NOTE: Numbers may not sum due to rounding. SOURCE: Eurostat; AMECO database; US Bureau of Economic Analysis; National Export Initiative; McKinsey Global Institute analysis Meanwhile, companies, governments, and households have all been cutting their spending at the same time that they seek to reduce their debts. Public debt has ballooned since the financial crisis, but private sector balance sheet repair is slowly under way in Europe (Exhibit 85). McKinsey Global Institute A window of opportunity for Europe 149 .
Exhibit 85 Balance sheet repair is under way in private sectors in Europe Debt by sector in 20 major European economies, 1Q04–4Q131 % of GDP Lehman Brothers bankruptcy 110 Change since Lehman bankruptcy Percentage points 105 100 95 Non-financial corporations 90 Quarters of deleveraging since peak -2 18 Government +26 2 Households -1 18 85 80 75 70 65 60 55 50 2004 05 06 07 08 09 10 11 12 2013 1 Austria, Belgium, Czech Republic, Denmark, Finland, France, Germany, Greece, Hungary, Ireland, Italy, the Netherlands, Norway, Poland, Portugal, Romania, Slovakia, Spain, Sweden, and the United Kingdom. SOURCE: Haver Analytics; national central banks; McKinsey Global Institute analysis Corporations are piling up cash in response to weak demand Corporate investment has dropped precipitously in response to a fragile macroeconomic outlook and weak demand. If history is a guide, the trend will not reverse until public and household spending recover and grow. Access to, and the cost of, finance, in contrast, appear to be constraints mostly in the SME sector in those economies worst hit by the crisis. Corporate investment has historically made up 11 to 12 percent of GDP and lays the groundwork for future productivity growth. However, since 2008, corporate investment has fallen by 19 percent.
Corporate investment would need to increase by an estimated €200 billion to €250 billion to reach pre-crisis levels. Corporate cash holdings are hitting record highs. Europe’s 500 largest companies increased their excess cash holdings—the amount of cash over and above what they need for day-to-day operations—by 60 percent from 2008 to 2013 to nearly €800 billion (Exhibit 86).213 The cash holdings of SMEs have also risen but by less. Although many SMEs are finding it hard to get the financing they need, cash assets increased by 1.4 percentage “Excess cash holdings” are defined as the amount of cash above that needed to meet the day-to-day running of the company, estimated as cash above 2 percent of revenue.
See McKinsey Corporate Performance Analysis Tool, 2013. 213 150 McKinsey Global Institute 3. How Europe can reignite investment and job creation . points as a share of turnover between 2008 and 2012.214 Since SMEs generate 60 percent of value added in the EU-28, this build-up of cash is significant.215 Exhibit 86 Corporations are piling up cash, citing weak demand and regulation—not credit—as the primary obstacles to investment Excess cash holdings of Europe’s 500 largest companies (by revenue)2 € billion 800 High Investment barriers % of respondents citing high or medium barriers, 20133 Macroeconomic outlook 750 Medium 67 Regulation 700 56 Product structure and economics 650 +60% 600 24 Taxes and incentives 23 21 Market infrastructure 550 Information and transparency 16 500 Internal governance and capabilities 16 450 2008 09 11 10 12 2013 Accounting principles 10 1 Potential borrowing capacity for September and December 2014 long-term refinancing operations (LTRO) combined. 2 “Excess cash” defined as cash above 2% of revenue. Data used for 457 companies for which excess cash figures above zero were available for the full sample 2008–13. 3 Interviews with executives of 36 large corporations with combined revenue of €400 billion commissioned by the Association for Financial Markets in Europe (AFME). SOURCE: McKinsey Corporate Performance Analysis Tool; Unlocking funding for European investment and growth, AFME, 2013; McKinsey Global Institute analysis Corporations are piling up cash largely because of weak demand. In a recent survey, respondents from 67 percent of a selection of large corporations in France, Germany, Italy, Portugal, Spain, and the United Kingdom ranked the macroeconomic outlook as a high or medium barrier to investment—higher than regulation or taxes.216 A historical review of recessions characterised by large declines in private investment reveals that the recovery of the broader economy typically leads the rebound in private investment by several years (Exhibit 87).217 This is likely due to businesses first working through their overcapacity before building up additional capital stock. BACH database from the Banque de France, data pulled in 2014 but available only to 2011. Data are from Austria, Belgium, Czech Republic, France, Germany, Italy, Poland, Portugal, Spain, and Slovakia weighted by turnover.
SME is defined as an organisation with turnover of less than €50 million. 215 Survey on the access to finance of enterprises in the euro area, European Central Bank, November 2014. Note that this figure is based on defining SMEs as having fewer than 250 employees, which is different from the BACH definition. Also see Patrice Muller et al., Annual report on European SMEs 2013/2014: A partial and fragile recovery, Final report, European Commission, July 2014. 216 Unlocking funding for European investment and growth: An industry survey of obstacles in the European funding markets and potential solutions, Association for Financial Markets in Europe, 2013. AFME surveyed 32 large European corporations. 217 Investing in growth: Europe’s next challenge, McKinsey Global Institute, December 2012. 214 McKinsey Global Institute A window of opportunity for Europe 151 .
Exhibit 87 Private investment typically recovers with a lag compared with the overall economy Private investment and GDP indexed to 100 in the year prior to each recession identified1 Current crisis GDP middle quartiles Private investment middle quartiles Index: 100 = peak real GDP prior to recession 150 140 130 120 110 100 90 80 70 0 1 2 3 4 5 6 7 8 9 10 Years following recession 1 Episodes in which private investment fell at least 10% from GDP peak to GDP trough, excluding 17 episodes when private investment fell by less than 10%. All values in year zero are equal to 100 since private investment is indexed to 100 in that year. NOTE: Data for 2014 not yet available for real GDP. SOURCE: Investing in growth: Europe’s next challenge, McKinsey Global Institute, December 2012; McKinsey Global Institute analysis Relatively few business leaders complain that access to financing is a substantial barrier to investment (Exhibit 88). In 2014, only 11 percent of executives from large companies expressed the view that access to finance is the most pressing problem their organisation faces. For businesses with fewer than ten employees, the equivalent figure is 15 percent, down from 21 percent in 2009.218 Corporate lending rates have fallen to roughly 3 percent in most large European economies.219 However, there are still pockets of Europe in which potentially creditworthy borrowers are finding it difficult to access finance.
For the very smallest enterprises, and particularly those in peripheral economies where liquidity is still not universally present, access to finance can represent a potential barrier to investment. In some countries, the situation is far more severe; 55 percent of Greek SME executives have said that on a scale of 1 (no need) to 10 (high need), their need for finance in 2014 was 8 or more. Survey on the access to finance of enterprises in the euro area, European Central Bank, H1 2014. ECB statistical data warehouse. 218 219 152 McKinsey Global Institute 3. How Europe can reignite investment and job creation .
Exhibit 88 Access to finance has improved for firms of all sizes since 2009, and the gap between large firms and the rest has shrunk Financing constraints by company size, 2009–14 % of executives responding that “access to finance” is “currently the most pressing problem your firm is facing” 21 19 15 Micro <10 employees 2009 2014 17 13 Small 10–49 employees 64% 11 Medium 50–249 employees 13 11 35% Large >250 employees SOURCE: Survey on the access to finance of enterprises in the euro area, ECB, November 2014; McKinsey Global Institute analysis Governments have embarked on austerity in order to control debt levels For fear that public debt levels are unsustainable, fiscal stimulus in Europe has been shorter and less aggressive than it has been in the United States. The focus of European governments has moved to consolidation, public investment has been cut, and European economies have reinforced their commitment to containing debt and deficit levels through the Fiscal Compact. But slow growth and low inflation have nonetheless resulted in an increase in public debt levels of close to 30 percentage points of GDP since the crisis. Deficit cutting has become an imperative for European governments because of concern over the effect of rising—and potentially unsustainable—sovereign debt levels. Research suggests that when debt rises above around 90 to 100 percent as a share of GDP, it becomes much less sustainable and begins to have a negative impact on growth (although the debate is not fully settled on this point).220 Average European government debt stood at 85 percent of GDP in 2014.
The sovereign debt burden is especially high in Belgium, Greece, Ireland, Italy, and Portugal, each of which has a sovereign debt-to-GDP ratio in excess of 100 percent (Exhibit 89). Some of Europe’s largest economies, including Germany, France, and the United Kingdom, have public-sector debt ratios of 75 to 100 percent of GDP. Silvia Ardagna, Francesco Caselli, and Timothy Lane, Fiscal discipline and the cost of public debt service: Some estimates for OECD countries, NBER working paper number 10788, September 2004; Cristina D. Checherita-Westphal and Philipp Rother, The impact of high and growing government debt on economic growth: An empirical investigation for the euro area, European Central Bank working paper number 1237, August 2010. 220 McKinsey Global Institute A window of opportunity for Europe 153 . Exhibit 89 European governments have limited capacity to further stimulate and invest in growth Government debt1 and fiscal balance by Europe-30 country % of GDP debt Size = Population, 2013 Nordics Continental Europe EU target United Kingdom and Ireland Southern Europe Baltics Central and Eastern Europe Fiscal balance, 2013 15 Norway 10 Germany 5 Switzerland 0 France Italy Sweden -5 Portugal Poland Ireland -10 United Kingdom Spain Greece -15 10 20 30 40 50 60 70 80 90 100 110 120 130 140 150 160 170 Gross government debt1, 20132 1 Includes all non-consolidated loans and fixed-income securities. 2 Or latest available. SOURCE: Haver Analytics; national central banks; Eurostat, McKinsey Global Institute analysis Government spending increased during the recession as automatic stabilisers and stimulus kicked in. However, most of this stimulus has ended. In 2013, the government spending share of GDP was only marginally higher than it was in 2008. There has been a shift away from investment towards government consumption. Government investment cumulatively fell by 16 percent between 2008 and 2014 while consumption grew by 3 percent. This largely reflects the fact that the slow recovery has meant that automatic stabilisers such as unemployment benefits have remained in place while discretionary investment spending has been cut as governments seek to meet deficit reduction targets. Stimulus in Europe, particularly in the Eurozone, was shorter and less aggressive than that in the United States (Exhibit 90).
Between 2008 and 2010, the Eurozone’s fiscal stimulus was 4.7 percent of GDP and the United Kingdom’s was 6.9 percent of GDP compared with 8.9 percent of GDP in the United States. About three-quarters of the US stimulus came from an uptick in discretionary spending; in the Eurozone, that share was only one-third. Because fiscal stimulus in the United States coincided with the depth of the recession, the effective fiscal multiplier on the stimulus was much larger than it was in Europe, contributing to more robust growth afterwards (although we note that the exact effect of government spending on output is uncertain). 154 McKinsey Global Institute 3.
How Europe can reignite investment and job creation . Exhibit 90 The Eurozone gave a comparatively small fiscal stimulus after the crisis and experienced a slow recovery Change in real GDP and fiscal impulse, 2007–10 and 2010–131 % of start of period GDP Real GDP Fiscal impulse, including the effect of fiscal multipliers Fiscal impulse, direct effect United States 2008–10 United Kingdom Eurozone 19.5 12.2 7.9 6.9 8.9 -0.6 2011–13 -2.2 -4.3 6.3 4.7 3.1 0.5 -2.2 -6.7 -0.6 -5.6 -3.4 -3.8 1 “Fiscal Impulse” is defined as the negative change in deficits. NOTE: The effect of fiscal multipliers on the cumulative effect is large, although there is a great deal of uncertainty about its size. The fiscal multiplier during recession is estimated to be large (United States: 2.18; Eurozone: 2.56; UK: 1.0) while the multiplier outside of a recession is small (United States: 0.33; Eurozone: 0.43, UK: 0.1). The timing of fiscal impulse therefore plays a large role it its effectiveness. SOURCE: Batini et al, 2012; Eurostat; FRED; McKinsey Global Institute analysis Not only was fiscal policy more aggressive and better timed in the United States, but monetary policy was, too (Exhibit 91). This can partly explain why demand has been slower to recover in Europe than in the United States. Average European government deficit 4.6 percentage points smaller than US deficit over past 7 years McKinsey Global Institute Real per capita GDP, population, and prices have all grown faster in the United States, and therefore debt as a proportion of GDP has grown less quickly despite high borrowing. Roughly half of the gap in real GDP growth between the United States and Europe is attributable to population growth rates.
Although the average European annual general government deficit has been 4.6 percentage points smaller on average than the deficit in the United States over the past seven years, this has resulted in an increase in debt levels over the period that was only eleven percentage points lower than in the United States (Exhibit 92). A window of opportunity for Europe 155 . Exhibit 91 The United States acted faster and more decisively than Europe in response to financial and economic crisis ILLUSTRATIVE EXAMPLES United States Eurozone Timeline (crisis in Europe occurred approximately 1–2 quarters later than in the United States) Decision domain Action 2009 2010 2011 2012 Acting as lender of last resort NOV US agency debt ($175B) and mortgagebacked securities ($1.25T) JUL Covered Bond Purchase (€60B in first round) MAY Initiated Securities Market Programme to buy government bonds (€220B) Maturity Extension Program: buying long-term and selling short-term securities JUL Draghi’s “do whatever it takes” speech Funds rate Central banks 2007 2008 DEC Lowered funds rate to 0–0.25% MAY Reached policy rate of 1% MBS purchases also provided liquidity MAR Extended purchases to Treasury securities ($900B to Increase of mid-2012) liquidity and higher provision to volumes banking sector Liquidity provision, securities purchases, QE OCT Troubled Asset Relief Program gives immediate relief to financial institutions Stress tests/ recapitalisation Bank cleanup 2013 2014 SEP Lowered policy rate to 0.05% Long-term refinancing operations (LTRO): 2011/12: ~€1T; targeted programme 2014 DEC Monthly asset purchases while unemployment >6.5%, totalling $1,665T MAY Supervisory Capital Assessment Program JAN 2015 €60T of monthly asset purchases up to September 2016 to reach inflation target OCT–NOV Comprehensive stress test and Single Supervisory Mechanism to monitor financial stability in force Bank nationalisations and recapitalisations ongoing beginning in 2008 in both the United States and Europe1 Bank stress tests in 2009, 2010, and 2011, but not assessed to be fully comprehensive Regional transfers Fiscal measures Regionwide stimulus Annual transfers between states accounting for 8.4% of GDP—as an example, Florida in 2013 received 17.9% of its GDP through federal transfers Intra-EU transfers at 1.6% of GDP only via EU budget, mostly structural, no automatic stabilizers Cumulative 2007–10 stimulus 8.9%2 of 2007 GDP Cumulative 2007–10 stimulus only 4.7%2 of 2007 GDP 1 European countries faced additional challenges as the banking sector is much larger as a percentage share of GDP than in the United States, requiring larger recapitalisation amounts and limiting countries' capacities to stem banking crises. 2 Combined discretionary and automatic fiscal impulses. SOURCE: ECB; Federal Reserve System; Congressional Research Service; European Commission; McKinsey Global Institute analysis 156 McKinsey Global Institute 3. How Europe can reignite investment and job creation . Exhibit 92 The US annual deficit was 4.6 percent larger on average between 2007 and 2013, but the country’s debt rose only 11 percentage points more than Europe’s 2007–13 % of GDP Europe Fiscal deficits1 United States General government debt 12.7 12.0 +41 p.p. 105 +29 p.p. 10.6 87 9.2 7.0 3.6 6.9 6.5 6.2 4.4 3.9 2.4 58 64 3.3 0.9 2007 2008 2009 2010 2011 2012 2013 2007 2013 2007 2013 1 EU-28 general government deficit under the excessive deficit procedure (EDP); US general government deficit; ESA 2010 and former definitions. NOTE: Numbers may not sum due to rounding. SOURCE: Eurostat; FRED; Haver Analytics; national central banks; McKinsey Global Institute analysis Households are slowly deleveraging Household demand is still weak as households cut investment in residential property while holding savings rates steady to slowly work through their burden of debt. Household spending fell by €154 billion in real 2005 terms between 2008 and 2013. More than 80 percent of this decline was due to a drop in household investment as the real estate boom collapsed. When asset prices fell sharply in 2008, many households were left with a larger debt burden—on the order of 70 percent of GDP in 2008—relative to the underlying assets than originally expected. However, the process of deleveraging has been slow.
In the final quarter of 2013, household debt as a percentage of GDP was only one percentage point below its level in the third quarter of 2008 when the financial crisis began in earnest—even after around five years of successive deleveraging. The fact that debts remain relatively high is constraining households from spending.221 Weak household demand cannot be explained by precautionary saving, but rather by a lack of demand for investment. Earlier in the recession households had faced high levels of uncertainty, and reacted to it by increasing their savings rates in order to ensure against future shocks.
These precautionary savings led to a spike in savings rates in 2009, reaching 13.2 percent of gross household disposable income across Europe. Savings rates have since stabilised at roughly their long-term trend levels of 11 percent (Exhibit 93). However, household investment has not recovered.
Indeed, 91 percent of the fall in household investment between 2007 and 2013 comes from only five economies—Greece, Ireland, Italy, Spain, and the United Kingdom. Spain was particularly badly affected by its housing bubble, with a decline of more than 50 percent in household investment. Karen Dynan, “Is a household debt overhang holding back consumption?” Brookings Papers on Economic Activity, spring 2012. 221 McKinsey Global Institute A window of opportunity for Europe 157 . Exhibit 93 Although household savings rates spiked in some countries following the crisis, in Europe as a whole these rates were largely unaffected Household savings rate % of household gross disposable income 18 16 14 12 EU United Kingdom 10 8 Spain Greece 6 4 2 0 -2 -4 -6 2003 Italy France Ireland 04 05 06 07 08 09 10 11 12 2013 NOTE: Greece, Bulgaria, Latvia, and Romania all have negative savings rates. This is because households in these countries are borrowing to consume, meaning that consumption is greater than gross disposable income. SOURCE: AMECO database; McKinsey Global Institute analysis The demand situation is very different among European economies Although clusters of European nations face very similar issues, the context can vary and decision makers cannot ignore differences among nations. Different European economies have very different capacities to spend to stimulate investment and job creation (Exhibit 94). ƒƒ Germany did not experience a housing bubble, and the economy is running at or near potential output. As a result, Germany is unique among major European economies in needing to focus on growth-enhancing reforms; aggregate demand would gain little from stimulus, despite the fact that Germany’s public sector is in a fairly solid fiscal position and would be capable of financing it.
However, although the German economy is growing, growth in household demand remains weak and corporate investment remains €24 billion below 2008 levels in nominal terms. ƒƒ Spain has experienced a housing bubble and subsequent asset write-downs followed by deleveraging in both the household and the corporate sectors. Spain faces an output gap of at least 5 percent of potential GDP as investment has collapsed and unemployment soared. Stimulating private spending in this deflationary environment will be difficult, particularly because the economy is now also hamstrung by a heavily indebted public sector after saving failing banks.
The country will need to rely on net exports or European support to change its demand situation. 158 McKinsey Global Institute 3. How Europe can reignite investment and job creation . ƒƒ The United Kingdom has similarly experienced a housing bubble, followed by a strong decline in household and corporate investment and high levels of debt. Despite public deficits that began larger than those in many other European nations and remain high at 5.4 percent of GDP, general government expenditure has contracted as a share of GDP since 2008 because both government revenue and expenditure grew more slowly than GDP. With its own currency, the United Kingdom has been engaging in more expansionary monetary policy than the Eurozone. Robust growth has returned. Corporations are becoming more optimistic.
Households continue to deleverage and have reduced debt substantially below 2008 levels. After dipping sharply, household investment has recovered and grown 8 percent in nominal terms since the crisis. The corporate sector continues to deleverage more slowly. ƒƒ In France, household debt was low before the crisis and remains small in comparison with other large European nations, but household investment is down after a steep increase in real estate prices.
Other sectors have experienced weak growth in nominal terms, while the trade balance is deteriorating. The public sector expanded by approximately four percentage points of GDP between 2008 and 2014 and has a deficit of 4.4 percent of GDP in continued violation of the Fiscal Compact. France still has a potential GDP output gap of 2.3 percent. ƒƒ Italy’s household debt remains low despite an increase before the crisis.
Household and business investment rates have declined slightly, and GDP growth has declined further from very low levels even before the crisis. Household consumption has hardly grown despite a material reduction in the savings rate as wage growth has been slow and even, at times, negative. Public debt, at around 128 percent of GDP, is very high.
Italy has been able to reduce its deficit below the threshold specified by the Fiscal Compact and run a primary surplus, but its debt is large enough that it will take many years to reach the debt target. Italy’s output gap—at almost 5 percent of potential GDP—remains one of the biggest of the large European nations. McKinsey Global Institute A window of opportunity for Europe 159 . Exhibit 94 The largest European economies have significantly different priorities and spending capacities % of GDP unless noted Domain Indicator Germany France Output gap to close -0.8 United Kingdom Sweden Spain Italy -2.3 -6.0 -4.5 -0.8 -1.6 -0.8 United States Europe1 -1.3 -0.5 -2.4 Poland Romania Net exports Current account balance 2007 7.0 -1.1 -9.6 -1.4 -2.7 9.0 -6.5 -14.0 -5.0 -0.5 2013 6.9 -2.0 1.5 1.0 -4.2 6.5 -1.4 -1.4 -2.5 1.4 -1.9 0.0 Corporate (non-financial) Corporate debt 2004 2008 2012/13/14 150 0 Business investment2 25 0 Household Household debt 100 0 Household investment2 10 0 20 Household savings rate3 % 0 Public Public debt 150 0 Fiscal capacity4 To reduce debt to 60% of GDP in 20 years (approx.) 1.3 -4.8 -8.2 -7.8 To reach 3% deficit 3.2 -1.4 -2.6 0.0 -2.4 0.6 -0.4 0.9 Investment opportunities2 2.0 2.3 3.4 4.6 2.4 0.9 6.5 12.9 1.7–3.7 1 Figures for Europe-30 where available, or extrapolated figures for subset (Europe-27, Europe-28, etc.). 2 Figures for business and household investments are defined as gross fixed capital formation expressed as a percentage of GDP for the business and households sectors. Investment opportunities listed under “Public” include a selection of private and public opportunities—and could include partnerships. 3 Household savings rates are gross saving as percentage of gross disposable income 4 Fiscal capacity under current debt rules assumes no effect on growth—United Kingdom, Sweden, and Poland are not bound by the Fiscal Compact debt reduction rules. NOTE: Not to scale. SOURCE: Eurostat; AMECO; IMF; FRED; McKinsey Global Institute analysis 160 McKinsey Global Institute 3. How Europe can reignite investment and job creation . Europe has several options for igniting investment and job creation Now is the time for Europe to consider all feasible options for igniting investment and job creation. While there are different economic schools of thought on demand (and the neoclassical view would negate the need for stimulus) the sector analysis in the previous section, in our view, provides proof that, without measures to shore up investment and job creation, a strong recovery seems difficult at best and Europe’s debt overhang will only increase (Exhibit 95). Exhibit 95 Outside of a neo-classical view of the crisis, measures will be required to stimulate investment and job creation Commonalities Neoclassical economics: Rational expectations (Robert Lucas) New Keynesianism: Liquidity trap (Paul Krugman) Post-Keynesian: Balance sheet recession (Richard Koo) Diagnosis of the ongoing crisis  Financial crisis as a temporary shock to the economy caused by a liquidity crisis  Stagnation as a consequence of overextension of the government in the economy (over-regulation and overspending on welfare)  Stagnation as consequence of uncertainty and volatility in private investment demand  After the crash, households have a higher propensity to save at any given interest rate,1 so that rates would have to drop sharply to spur spending (“liquidity trap” at the zero-lower bound)  Risk of a permanent depression  Stagnation as consequence of an inherently unstable economy that creates creditfuelled bubbles  As households are left with a debt overhang and binding balance sheet constraints, savings are inelastic with respect to changes in the interest rate  Risk of a permanent depression/deflationary spiral Role for monetary policy  Case for temporary monetary policy measures to stimulate bank lending; longer-term need to keep money supply in line with production to avoid over- or under-supply  Case for unconventional monetary policy to drive up inflation expectations and thus drive real interest rates below the zero lower bound of nominal rates (e.g., QE)  Limited/no role for monetary policy since saving/borrowing decisions do not respond to changes in the interest rate because the money multiplier is zero Role for fiscal policy  Case for fiscal contraction and deregulation/supply-side reforms, since the economy will return to equilibrium if unimpeded by distortionary government policy and spending (“expansionary austerity”)  Case for expansive fiscal policy to support aggregate demand  Case for expansive fiscal policy to support aggregate demand; explicit prescription to fully offset private-sector deleveraging through publicsector borrowing and spending 1 Propensity to save meaning tendency to run a financial surplus. SOURCE: Richard C. Koo, “The world in balance sheet recession: Causes, cure, and politics”, Real-World Economics Review, issue number 58, 2011; Paul Krugman Blog; McKinsey Global Institute analysis Recent discussions on stimulating investment and job creation have tended to focus narrowly on the traditional prescription of additional fiscal spending and quantitative easing. But spending within the Fiscal Compact as well as QE will likely be insufficient to drive the recovery without additional measures. Moreover, loosening the Fiscal Compact, mutualising debt, or stepping up transfer payments appears impossible in the current Eurozone institutional framework. McKinsey Global Institute A window of opportunity for Europe 161 .
However, more feasible options with significant potential effects receive relatively little discussion (Exhibit 96). These include choices such as changing public-accounting standards so that investments are activated on a public balance sheet and depreciated over time rather than being accounted for immediately as a deficit in the year in which they occur. Another option is stimulating private consumption, for instance by carefully adjusting tax structures to reduce the burden on labour while increasing taxation on property and capital gains, or by creating attractive services that help unleash spending by older people in the economy. There is also the possibility of opting for more radical options with little or no track record, such as issuing vouchers redeemable by the ECB directly to the populace. This approach has strong potential to increase investment and job creation while reducing the risk of deflation, but, with the exception of a small number of commentators, has not been part of the mainstream debate.222 Exhibit 96 A menu of investment and job creation options can complement structural reform even outside a federal setup Prerequisites for all options: Progress on competitiveness and growth drivers and structural reform Addresses >50% of aggregate demand gap Fiscal stimulus and debt relief  Introducing cyclical flexibility beyond 3% in the Fiscal Compact  Partially mutualising debt Issuing vouchers redeemable with the ECB to households1 Demand impact Options deserving wider debate  Accounting for public investments as they depreciate  Carefully adjusting taxation and wage structures  Unleashing the silver economy Improved monetary and financing conditions Addresses <50% of aggregate demand gap  Quantitative easing  Expanding fiscal-transfer schemes between countries (possibly including debt restructuring)  Improving access to finance for businesses and increasing European Investment Bank lending  Maximising spending within the Fiscal Compact Requires “European Federation” with common fiscal and economic policy to establish trust and avoid moral hazard Conceivable in current “Maastricht +” setup Feasibility 1 Debate persists over whether this option would constitute hidden fiscal policy. NOTE: There is a neoclassical school of thought that argues that structural reform is enough; however, our analyses clearly indicate a structural weakness in demand across all sectors of the economy in line with the balance sheet recession or liquidity trap school of thought. SOURCE: McKinsey Global Institute analysis Willem H.
Buiter, Helicopter money: Irredeemable fiat money and the liquidity trap, NBER working paper number 10163, December 2003. Commentators including Lord Adair Turner and Financial Times columnist Martin Wolf have promoted the concept. 222 162 McKinsey Global Institute 3. How Europe can reignite investment and job creation .
All options for increasing investment and job creation entail risk and may have possibly unintended, often distributional, consequences that require careful consideration. For instance, making it easier for corporations or households to access finance could, if done carelessly, cause a build-up of excessive debt like the one that led to the 2008 crisis. Changing tax regimes can have unintended consequences either by changing incentive structures in a deleterious way or by causing capital flight. Debt monetisation would require very strong governance and reinforced central-bank independence to avoid overuse by governments and inflation. Redistributive policies that support the deleveraging of debtors through one mechanism or another can create moral hazard. Mitigating the risks associated with the fiscal, monetary, and redistributive options that are available requires careful design and trade-offs, but inaction is not an option.
Every extra year of low growth shrinks the long-term path of the economy. The risks of deflation in Europe are uncomfortably high. Forecasts for Eurozone inflation in the remainder of 2015 and 2016 are still well below the target rate.
Deflation in a context of deleveraging is dangerous because it becomes harder to repay debt. Which, if any, of the options we discuss in this chapter is pursued and what specific policies should be deployed to achieve any of these outcomes is a decision for policy makers rather than economists because many of these choices entail some form of redistribution in the broader economy and may have unintended consequences. It is for this reason that we present a range of options that we believe, with humility, deserve broader debate. While we reflect on the feasibility and effectiveness of the options presented, we do not advocate any one specific solution. In the Eurozone, the traditional prescription of higher fiscal spending and debt relief cannot be easily replicated During a balance sheet recession—one in which companies and households en masse opt to deleverage, potentially resulting in deflation and rising debt burdens in real terms—the role of government is especially important in shoring up investment and job creation and thereby helping to accelerate private-sector deleveraging.223 The example of Finland and Sweden in the early 1990s is telling.
After a financial crisis induced by a burst asset-price bubble, both countries faced deep recessions (Exhibit 97). The governments of these two countries nationalised bank assets, particularly bad ones, and attempted to cushion the impact of the recession by expanding public debt by 15 percentage points of GDP in the first two years after the crisis. They went on to expand the public-debt-to-GDP ratio by 21 percentage points over the following four to six years.224 This helped the private sector in both countries deleverage by 26 percentage points of GDP while keeping growth positive. Tellingly, public-sector deleveraging did not begin until after GDP growth started to recover and private debt levels began to fall. Richard C.
Koo, “The world in balance sheet recession: Causes, cure, and politics”, Real-world Economics Review, issue number 58, 2011. 224 Debt and deleveraging: Uneven progress on the path to growth, McKinsey Global Institute, January 2012. 223 McKinsey Global Institute A window of opportunity for Europe 163 . Exhibit 97 Episodes of successful private-sector deleveraging have been supported by public-sector spending ILLUSTRATIVE Average of Swedish and Finnish deleveraging episodes Deleveraging Recession Real GDP Private debt/GDP Public debt/GDP Pre-crisis period Early stage of recession Private-sector deleveraging Rebound and public-sector deleveraging 10 years 1–2 years 4–6 years ~10 years -3% 1% 3% Real GDP growth 3% Annual average (%) Time Change in debt/GDP Percentage points â–ª â–ª Private sector 60 8 -26 87 Public sector 3 15 21 -30 SOURCE: IMF; Haver Analytics; McKinsey Global Institute analysis In contrast, European governments today have begun to reduce debt levels at a time when the private sector has deleveraged by only about five percentage points of GDP relative to their position when they left recession in the first quarter of 2009. The countries of the Eurozone have attempted to contain deficits and debt levels through such institutional vehicles as the Fiscal Compact (see Box 6, “The Fiscal Compact”). 164 McKinsey Global Institute 3. How Europe can reignite investment and job creation . Box 6. The Fiscal Compact The fiscal rules that today govern the members of the Fiscal Compact grew out of the convergence criteria of the Maastricht treaty of 1993 that European economies were required to meet before being allowed to join the euro. The convergence criteria specified limits of 60 percent of GDP for debt and 3 percent of GDP for budget deficits, set a reference value for inflation, established exchange rate stability, and gave guidance on long-term interest rates. The aim of setting these criteria was to ensure that any economy joining the monetary union was sufficiently “harmonised” with other members to limit the risk of economic imbalances developing that could not be mitigated by unilateral currency devaluation and/or independent changes in monetary policy—a flexibility that was no longer available in the monetary union. These limits were converted into fiscal rules for Eurozone members, and the other EU member states that voluntarily subscribe to it, through the Stability and Growth Pact in 1998 and 1999.
This set out an enforcement mechanism whereby countries could be fined up to 0.3 percent of GDP if they broke the rules and were found not to have a good reason for doing so. This procedure proved toothless, as both Germany and France broke the limits of the pact in the early 2000s and faced no consequences. The then-president of the European Commission, Romano Prodi, described the pact as “stupid” in 2002.1 The pact has since been reformed and strengthened several times, most recently as the Fiscal Compact in the Treaty on Stability, Coordination, and Governance that came into force in 16 countries in 2013 and nine more in 2014. Key points in the current framework include: ƒƒ Countries are obliged to keep deficits below 3 percent of GDP, while also targeting a structural deficit of no more than 0.5 percent of GDP.2 ƒƒ Countries are obliged to keep general government debt below 60 percent of GDP, and if above the limit, they must close 1/20th of the gap to that threshold annually.3 ƒƒ Countries are obliged to transpose the stipulations of the Fiscal Compact into national law—and are encouraged to make the stipulations constitutional provisions. Quoted in an interview with Romano Prodi in Le Monde, “Le pacte de stabilité est-il stupide?” November 15, 2002. 2 In some instances, a structural budget deficit of 1 percent of GDP is allowed. 3 This must happen, on average, over three-year periods.
However, it is rarely enforced. For example, although Belgium and Italy are unlikely to reach the debt target of 60 percent of GDP anytime soon, neither is currently subject to the excessive deficit procedure. McKinsey Global Institute A window of opportunity for Europe 1 ƒƒ Successive treaties have made penalties clearer, more automatic, and harder to avoid, and they have increased the oversight faced by countries in the excessive deficit procedure (EDP). The original limits were intended as membership criteria for monetary union rather than as fiscal rules. Some commentators suggest that the choice of numbers, particularly for the debt limit, may have been influenced by a desire to exclude some nations from the union.4 Most purpose-built fiscal rules are very different from those of the Fiscal Compact.
Typically, a more explicit adjustment is made for changes in the business cycle or the main drivers of government revenue. It is also rare to have a fiscal rule that does not have a mechanism to actively encourage a surplus during good times—a property known as symmetry. Observers of the Fiscal Compact have been particularly critical of the 60 percent debt limit, calling it “devoid of theoretical value” and “arbitrary and neither necessary nor sufficient for national fiscal-financial sustainability”.5 An example of a purpose-made fiscal rule is the one used by Switzerland.
The rule stabilises government spending over the economic cycle. When the economy is running below potential, the government can spend more than it earns. When the economy is operating above potential, the government must put money aside.6 Enforcement of the rule as well as an incentive to estimate correctly comes from the use of a compensation account.
Any overspending, including that due to poor forecasting, is debited to the compensation account. Once the account passes a threshold, the government must budget to bring the account into credit within three years.7 A similar rule, applied across all of Europe and adjusted for the relative sizes of government spending, would require most European economies to cut their deficits. Among the members of the Fiscal Compact, it would require deficit cuts of roughly €60 billion. Willem H. Buiter, “The ‘sense and nonsense of Maastricht’ revisited: What have we learnt about stabilization in EMU?” Journal of Common Market Studies, volume 44, issue 4, November 2006. 5 See Panos C.
Afxentiou, “Convergence, the Maastricht criteria, and their benefits”, The Brown Journal of World Affairs, volume VII, issue 1, winter-spring 2000, and Willem H. Buiter, “The ‘sense and nonsense of Maastricht’ revisited: What have we learnt about stabilization in EMU?” Journal of Common Market Studies, volume 44, issue 4, November 2006. 6 Alain Geier, The debt brake: The Swiss fiscal rule at the federal level, Swiss Federal Finance Administration working paper number 15, February 2011. 7 The problem of bias in forecasting is substantial. Even with an external body standardising forecasts as in the EU, countries have a substantial optimistic bias in forecasts that becomes larger further into the future.
This is especially the case in EU countries that risk going above the 3 percent deficit limit. See Jeffrey A. Frankel and Jesse Schreger, “Over-optimistic forecasts and fiscal rules in the Eurozone”, Review of World Economics, volume 149, issue 2, June 2013. 165 4 .
Independent fiscal regimes in a monetary union require either stringent rules to control deficits or credible no-bailout commitments to avoid requiring some countries to pay the bill for high deficits in another country within the union (Exhibit 98). Exhibit 98 Many investment and job creation measures are not viable in the current Eurozone setup Two stable regimes in a currency union Current European setup “Gold Standard/Maastricht +” “European Federation” â–ª Independent sovereign â–ª Key fiscal and economic policies â–ª decisions for fiscal and economic policies Stringent fiscal rules to avoid moral hazard from implicit guarantees across the currency union and/or â–ª Strict “no-bailout” rule put into decided at the federal level as a means to avoid moral hazard and ensure trust for: – Debt mutualisation and common liabilities across the federation – Fiscal flexibility – Fiscal transfers practice including clear regime for sovereign bankruptcy to ensure exposure to financial market discipline Setup for countries under EDP Sovereignty partially limited via bailout conditions in return for debt guarantees and fiscal flexibility SOURCE: McKinsey Global Institute analysis Although the Fiscal Compact has been criticised for aggravating the shortage in demand at a time when the private sector deleverages, it has had the benefit of helping to restore trust among Eurozone nations. It paved the way for bailouts of highly indebted economies, limited restructuring of government debt in Greece, and later bolder action and a commitment by Mario Draghi, president of the European Central Bank, to do “whatever it takes” to preserve the currency union (Exhibit 99).225 The Fiscal Compact is also an important step towards removing the moral hazard embedded in a monetary union among economies that retain national fiscal policies. Mario Draghi said, “Within our mandate, the ECB is ready to do whatever it takes to preserve the euro. And believe me, it will be enough”. The commitment was made during a speech at the Global Investment Conference in London on July 26, 2012. 225 166 McKinsey Global Institute 3. How Europe can reignite investment and job creation .
Exhibit 99 Decisive action was necessary to calm markets and restore access to credit German-Spanish spread on long-term bonds1 Percentage points 6 5 4 3 2 1 0 2007 08 09 10 11 May 2010 EFSF and EFSM established2 12 December 2011 LTRO1 by ECB January 2012 Fiscal compact finalised February LTRO2 by ECB March Fiscal Compact signed; Greek debt restructuring 13 2014 January 2013 Fiscal Compact in force September ESM established3 July Draghi pledges to do “whatever it takes” June Spanish bank rescue announcement 1 Difference in yields of long-term euro-denominated bonds issued by Spain and Germany. 2 European Financial Stability Facility and European Financial Stabilisation Mechanism. 3 European Stability Mechanism. SOURCE: Datastream; McKinsey Global Institute analysis Maximising spending within the Fiscal Compact would allow around €50 billion in additional fiscal expenditure The Fiscal Compact sets clear targets for countries to maintain deficits below 3 percent of GDP and debt below 60 percent of GDP.226 While some countries currently exceed the deficit limit, including the major economies of France and Spain, other economies have headroom for additional spending. These countries could increase their borrowing without breaking the rules of the Fiscal Compact. Even those countries that are above the debt limit, but not the deficit limit, could potentially increase spending.227 The Fiscal Compact sets out separate requirements for structural and total deficits. The structural deficit must be below 0.5 percent of GDP, while the noncyclically adjusted deficit must be below 3 percent of GDP. 227 Countries are expected in most cases to reduce their debt levels by 1/20th of the gap between their existing debt and the 60 percent target every year, on average.
In some cases, like Germany, this would set a 1.5 percent deficit limit, after growth forecasts are considered. In other cases, like Italy, this requirement is plainly unmanageable. Italy’s debt stands at 135 percent of GDP and therefore Italy would have to reduce its debt by 3.5 percent of GDP.
This would require budget cuts of more than 6 percent of GDP even after accounting for growth. 226 McKinsey Global Institute A window of opportunity for Europe 167 . If countries that have less than 3 percent deficits were to increase their spending to reach the deficit limit, but those with debt above 60 percent with extra spending capacity worked towards meeting their debt reduction targets, additional spending capacity of €48 billion would be created. Germany would account for €39 billion of that capacity. However, because Germany’s economy has a negligible output gap, this additional spending would have little effect on aggregate demand. After applying fiscal multipliers, the overall demand effect is likely to lie between €15 billion and €49 billion.
This large range reflects considerable uncertainty around the size of the fiscal multiplier (see Box 7, “Fiscal multipliers”). What’s more, the effect of that spending on Southern European economies facing the largest shortages in demand is unclear, as Southern European exports to Germany account for only 2.4 percent of Southern European GDP. Box 7. Fiscal multipliers When a government spends, the impact on aggregate demand can be larger or smaller than the absolute amount spent.
On the one hand, fiscal expenditure can circulate through the economy as suppliers to government procurement hire more workers who in turn have more money to spend on their needs. On the other hand, government spending may simply displace private-sector spending or increase imports, leaving aggregate demand largely unaffected. For our calculations of the size of fiscal multipliers in cases where empirical estimates for the fiscal multiplier of a nation during recession were not available, we have drawn on the IMF’s methodology suggested for calculating back-of-the-envelope fiscal multipliers. This process has led to a range of fiscal multipliers such as 0.2 to 1.0 for Germany or 1.6 to 2.1 for Italy (see the appendix for full details). Many factors affect the fiscal multiplier: ƒƒ Output gap.
Large output gaps mean larger multipliers as the economy has more capacity before government spending crowds out private activity. ƒƒ Monetary policy. Countries with monetary policy near the zero lower bound have higher multipliers because monetary policy will be less sensitive to changes in demand. ƒƒ Trade openness. Closed economies typically have higher multipliers as spending does not lead to additional imports. ƒƒ Exchange rate.
Countries with fixed exchange rates have higher multipliers, as exchange rates will not move to offset increased spending. ƒƒ Debt level. Countries with low debts have higher multipliers as increased spending does not lead to businesses and households embarking on precautionary saving in the expectation of higher taxes or interest rates. ƒƒ Labour market rigidity. Countries with rigid labour markets have higher multipliers because rigid wages mean spending creates more new jobs rather than just inflating wages and prices. ƒƒ Automatic stabilisers.
Countries with smaller stabilisers have higher multipliers because the new demand reduces unemployment payments, for example, and increases tax take that counteracts the output effect. ƒƒ Public administration. Countries that are better run have higher multipliers because money is spent more effectively.1 1 168 Nicoletta Batini et al., Fiscal multipliers: Size, determinants and use in macroeconomic projections, IMF, October 2014. McKinsey Global Institute 3. How Europe can reignite investment and job creation .
Introducing cyclical flexibility beyond 3 percent in the Fiscal Compact would help but is hardly conceivable in the current Eurozone setup Throughout the recession, incremental government spending, also known as the fiscal impulse, in Europe has been substantially below that of the United States. At its peak, in 2009, the US structural fiscal impulse—the magnitude of change structural spending—was 2.2 percentage points of GDP larger than Europe’s.228 This may explain at least part of the difference in real GDP growth between the two regions. A European fiscal impulse of 2.2% of GDP could have maximum impact of €440B If Europe implemented a one-time fiscal impulse of 2.2 percent of GDP—increasing spending uniformly by 2.2 percentage points—the impact on the size of the output gap would be dramatic. A rough estimate—it can only be rough since this impact is larger than the total output gap—suggests a maximum impact in the order of €440 billion, including fiscal multipliers. As the output gap shrinks due to the stimulus, one would expect additional government spending to be less effective and multipliers to change. A government that is willing to rewrite the rules when expedient, even for a short time, might be expected by financial markets to do so again.
As such, a change to fiscal rules to allow more spending for only a short time might be treated by the markets similarly to how they would treat a long-term change. This would effectively require Europe to mutualise the debt of the more indebted and currently economically weaker nations, and it would likely require a federal institutional framework to avoid the associated moral hazard. Partially mutualising debt can lower the cost of borrowing if governance issues could be resolved A partial mutualisation of European debt could remove concerns over the solvency of the continent’s most indebted governments and lower average interest rates across the continent. But major governance changes would be required to avoid moral hazard. Although all Eurozone members issue government debt in euros, each country is liable for its own debt.
If the Greek government cannot repay its debt, it is the Greek government that must default. Other Eurozone countries are not liable for the debt simply because they share a currency. That is the official version.
However, the Greek debt crisis and subsequent bailout by the IMF, ECB, and European Commission demonstrate that national debts of countries within the Eurozone are not, in reality, separate. Because European economies are so deeply intertwined, debt default has enormous externalities. Eurozone debt is ambiguous and involves an implicit partial guarantee. Despite convergence in recent years, there is still a significant spread between the eurodenominated debts of different countries.
Although yields on Greek debt are well below their 2011 peaks, spreads over the German bund remained around seven percentage points even before the renewed discussion in 2015 about a potential exit of Greece from the Eurozone. When perceptions of risk are heightened, a “flight to safety” causes the yield on some countries’ debt to drop to negligible levels, while other countries can still face very high yields. At its peak, the yield differential between Greek and German debt exceeded 25 percentage points, effectively shutting Greece out of sovereign debt markets and jeopardising its ability to engage in counter-cyclical spending (Exhibit 100).
Weak economies in recession can experience soaring interest rates at exactly the point at which they most need to be able to borrow. Mutualising debt would reduce the effect of a flight to safety, enabling peripheral economies to have a functioning fiscal policy even during difficult times. It would also reduce overall borrowing costs because the risk of default of the Eurozone as a whole is small. In addition, Based on the change in structural and total deficit reported by the IMF. 228 McKinsey Global Institute A window of opportunity for Europe 169 .
the liquidity premium charged by the market would fall, especially in the case of small economies with less liquid sovereign debt markets. Exhibit 100 Debt mutualisation reduces pro-cyclical financing effects harmful to economies when they can least bear the cost German-Greek spread on long-term bonds1 Real Greek GDP growth2 Interest rate % 40 35 30 25 20 15 10 5 0 -5 -10 2007 08 09 10 11 12 13 2014 1 Difference in yields of long-term government bonds issued by Greece and Germany. 2 Annual real rate of change of GDP in Greece. SOURCE: Eurostat; S&P; McKinsey Global Institute analysis Mutualisation can occur in many ways. It is possible to issue only part of a government’s debt as mutual debt and to grant it senior or junior status relative to national debt. For example, on the one hand, countries could decide to mutualise only the riskiest parts of debt in order to keep borrowing costs lower. On the other hand, countries might decide not to put their collective name on debt in jeopardy but to mutualise only the safest debt.
By doing so, individual countries would remain responsible for high levels of debt while reducing the borrowing cost of the bulk of their debt. The first approach would do more to protect weak economies from a flight to safety, but it would increase moral hazard. The exact details of a “Eurobond” would require extensive negotiation depending on the particular risk preferences of members of the Eurozone and the political compromises they are willing to make. Debt mutualisation would reduce the cost of borrowing.
A range of econometric models suggest that the cost of mutualised debt would be between 10 and 60 basis points higher than the rate on a German bund.229 Based on 2013 borrowing rates and taking the interest rate on ten-year government bonds as representative, governments would have saved 229 170 See Sergio Mayordomo, Juan Ignacio Peña, and Eduardo S. Schwartz, Towards a common European Monetary Union risk free rate, NBER working paper number 15353, September 2009; Green paper on the feasibility of introducing stability bonds, European Commission, November 2011; Christian Aßmann and Jens Boysen-Hogrefe, Determinants of government bond spreads in the Euro area—in good times as in bad, Kiel working paper number 1548, September 2009; European banks: All eyes on funding: LCR, the next undiscounted regulatory headwind, JP Morgan, 2011; Patrick Artus, The effect of debt mutualisation in the euro zone would be more complex than what is usually claimed, Natixis economic research, number 560, August 2013; Carlo Favero and Alessandro Missale, Sovereign spreads in the euro area: Which prospects for a Eurobond? presented at an Economic Policy panel meeting in Warsaw, October 27–28, 2011; Séverine Menguy, “Can Eurobonds save the euro?” in States, banks and the financing of the economy: Monetary policy and regulatory perspective, Morten Balling, Ernest Gnan, and Patricia Jackson, eds., SUERF, 2013; Sylvester C. W.
Eijffinger, “Eurobonds—concepts and implications”, in Eurobonds: Concepts and implications: Compilation of notes for the monetary dialogue of March 2011, European Parliament, March 2011; Rien Wagenvoort and Sanne Zwart, Uncovering the common risk-free rate in the European Monetary Union, European Investment Bank economic and financial report number 2010/05, September 2010. McKinsey Global Institute 3. How Europe can reignite investment and job creation . €6.4 billion to €8.5 billion every year over the life of the bonds issued that year alone, or as much as €85 billion in total (although some, such as Germany, would have had to pay more) (Exhibit 101). Taking into account the fiscal multiplier and assuming that all savings on interest payments are spent rather than used to reduce deficits, the effect on aggregate demand would be €30 billion to €65 billion annually. Debt mutualisation amplifies moral hazard. If borrowing costs are mutualised, the effect of any one country’s fiscal profligacy on the cost of borrowing will be small, increasing the incentive to borrow beyond a country’s means. For this reason, debt mutualisation cannot be safely implemented without extremely robust governance of reliable fiscal rules, stringent criteria on what parts of debt can be mutualised, or, indeed, full economic and fiscal integration. Exhibit 101 Lower interest rates resulting from debt mutualisation could have saved the Eurozone as much as €85 billion on ten-year maturities alone vs.
2013 Hypothetical mutualised borrowing, 2013 Actual borrowing, 2013 Borrowing requirement € billion Spain Interest rate on long-term debt, average % 89.3 Italy 2.1 Netherlands Austria 0.4–0.5 0.1–0.2 2.4 3.2 Cyprus 0–0.7 3.8 21.8 Slovenia 0.9–1.0 2.2 25.0 Belgium 1.0–1.3 6.3 123.0 Ireland 1.9–2.0 4.3 21.2 France Slovakia 2.1–2.6 10.1 47.9 Portugal Potential average saving on cost of borrowing1 € billion 4.6 23.7 Greece EXCLUDES FISCAL MULTIPLIER ~0.1 5.8 ~0.1 6.5 21.7 ~0.1 2.0 3.0 <1 3.2 12.7 <1 2.0 Latvia 0.5 3.3 <1 Malta 0.3 3.4 <1 Luxembourg 0.1 Germany <1 1.9 28.6 1.6 <0 1 Reduction in annual cost of debt issued in 2013 if rate went from actual rate to an estimated Eurobond rate with a value 10–60 basis points higher than the German rate. 2 Countries in EDP might use their savings to reduce borrowing rather than create demand, which would not contribute to closing the output gap in the short term. SOURCE: Eurostat; ECB; Mayordomo et al., 2009; European Commission green paper, 2011; Aβmann et al., 2011; JP Morgan, 2011; Artus, 2011; Favero and Missale, 2011; Menguy, 2013; Eijffinger, 2011; Wagenvoort and Zwart, 2010; McKinsey Global Institute analysis McKinsey Global Institute A window of opportunity for Europe 171 . Expanding fiscal transfer schemes among countries could close the output gap if Europe were to further integrate fiscal and economic policies The overall size of the EU budget is small compared with the size of European economies. In Europe, the average absolute net contribution/receipt of EU member countries was 1.6 percent of GDP in 2013.230 For comparison, the average absolute net contribution/ receipt between US states and the federal government was 8.4 percent.231 Transfers between European states are far less distributive than they are in the United States. The net contribution in Europe is only weakly responsive to relative per capita GDP at purchasing power parity, while the sensitivity in the United States is very strong (Exhibit 102). Exhibit 102 Transfer payments are much bigger in the United States than they are in Europe Net contribution, 20131 % of GDP Europe 8 United States West North Central 6 4 West South Central East North Central 2 Italy Mountain 0 France Middle Atlantic New England Germany Nordics Other Western Europe United Kingdom and Ireland Mediterranean -2 Pacific Central and Eastern Europe -4 -6 South Atlantic -8 The mean absolute redistribution in Europe is 1.6% of GDP compared with 8.4% in the United States. Europe’s transfers are therefore roughly 19% of the US level -10 -12 East South Central -14 60 65 70 75 80 85 90 95 100 105 110 115 120 125 130 Per capita GDP at purchasing power parity, 2013 Index: 100 = EU and the United States, respectively 1 In the United States, total federal spending in state inclusive of all programmes and transfers less total federal tax revenue generated in state including business, income, employment, estates, railroad, gift, and excise tax. In the EU, total expenditure on all programmes including co-payments less all revenue generated by nations including traditional own resources (e.g., excise and agricultural tax). SOURCE: European data: European Commission, and Eurostat; US data: Inland Revenue Service; USASpending.gov, States’ Departments of Labor and Workforce Development; US Census Bureau; Bureau of Economic Analysis; McKinsey Global Institute analysis The unweighted average of the absolute value of contribution/receipt for each country.
This figure is somewhat inflated by the contributions of small countries such as Hungary, which received 5.0 percent of its GDP in net. 231 Based on a refreshed version of the analysis found in Zsolt Darvas, Fiscal federalism in crisis: Lessons for Europe from the US, Bruegel, July 2010. 230 172 McKinsey Global Institute 3. How Europe can reignite investment and job creation . The comparison with the United States is useful, not because Europe ought to emulate the United States, but because it gives a directional illustration of the magnitude of the fiscal transfers required for a successful monetary union. In the United States, for example, Florida was hit particularly badly by the recession; its unemployment rate peaked at 11 percent. If the state had had its own currency, it would have been able to devalue to restore competitiveness. Instead, Florida received 17.9 percent of its GDP through federal transfers in 2013. In contrast, unemployment in Spain reached 26 percent as a result of the recent economic crisis, but it received transfers of only 0.2 percent of GDP.232 The composition of transfers is also relevant.
Most European transfers are linked to agriculture and do not act as an economic stabiliser. Transfer schemes linked to unemployment rates would have a strong stabilising effect. Alternatively, fiscal transfers might redirect public investment to where it is most productive.
For example, a common European renewables subsidy scheme, coupled with a more integrated power sector, would promote investment in solar plants in Spain and Italy to produce energy for German and French consumers. Although the impact on demand depends heavily on the details of how any expanded fiscal transfer system is designed, it is possible to get a rough idea of the potential scale of such approaches (Exhibit 103). Assuming a hypothetical unemployment benefit transfer programme in which all Europeans pay in according to existing EU funding ratios, the effect on demand would be between €38 billion and €56 billion, as money would flow from strong countries to crisis-hit countries with large fiscal multipliers.233 Any such programme would require further fiscal and economic policy integration in Europe. Another important protection for Florida was the free movement of labour. Many Floridians moved to other states with more prosperous economies. 233 This assumes that countries move their entire unemployment benefit through this package, giving a replacement rate of 50 to 70 percent, as is typical in European economies.
The benefit comes from the fact that more of the payments come from countries with smaller output gaps where additional fiscal spending is less effective and go to countries with larger output gaps where it is more effective. 232 McKinsey Global Institute A window of opportunity for Europe 173 . Exhibit 103 A pan-European transfer programme could benefit from higher fiscal multipliers in worse-off economies INCLUDES FISCAL MULTIPLIER— LOWER BOUND SHOWN Unemployment benefit programme—implementation example National net benefit from policy, 20141 € billion Gap Spain Fiscal multiplier2 33.1 Additional multiplier effect possible in 20143 € billion 1.3–2.5 Greece 4.1 1.1–1.6 Italy 3.7 43.1 4.4 1.6–2.1 6.0 France 1.6 0.2–2.1 0.3 Portugal 1.0 0.8–1.2 0.8 Croatia 0.7 0.5–0.8 0.4 Cyprus 0.4 0.8–1.2 0.3 Slovakia 0.3 1.2–1.7 0.3 Ireland 0.2 0.5–0.8 0.1 Slovenia 0 1.2 –1.6 0 0 Sweden -0.1 0.6–1.0 Malta -0.1 0.9–1.3 -0.1 Bulgaria -0.1 0.9–1.3 -0.1 Latvia -0.1 0.9–1.2 -0.1 Estonia -0.2 0.8 –1.2 -0.1 Lithuania -0.2 0.9–1.3 -0.2 Luxembourg -0.2 1.1–1.6 -0.2 Finland -0.2 0.7–1.0 -0.2 Hungary -0.7 0.1–0.3 -0.1 Czech Republic -1.2 0.6–0.9 -0.7 Denmark -1.7 0.7–1.1 -1.2 Romania -1.8 0.5–0.7 -0.8 Poland -1.8 0.1–0.3 -0.2 Austria -2.5 0.6–0.9 Netherlands -2.9 1.3–1.9 -3.9 Belgium -3.4 1.1–1.5 -3.6 United Kingdom -3.9 0.1–1.0 Germany -24.2 0.2–1.0 -1.5 -0.4 -4.8 Total opportunity = €37.6–56.0 billion 1 Based on national unemployment figures and a benefit equal to 50–70% of nominal median income in that country (based on typical EU unemployment replacement rates) and a contribution distribution proportional to current EU contribution. 2 Back-of-the-envelope estimate based on IMF methodology. 3 Based on the assumption that total governmental spending is fixed and just involves spending in more efficient geographies. NOTE: Assumes a pan-European unemployment benefit of 50–70% of local per capita median income. The scheme is funded proportionally to the current EU funding formulas. SOURCE: Eurostat; European Commission; IMF; Salomäki and Munzi, 1999; McKinsey Global Institute analysis 174 McKinsey Global Institute 3. How Europe can reignite investment and job creation . Measures to unlock financing for companies, as well as increased lending by the EIB, can help but may prove insufficient on their own Access to finance, particularly for SMEs, is a hot topic of discussion. SMEs have historically found it harder to access credit than larger firms.234 While the scope for increasing demand is likely to be smaller than what can be achieved in the public and household sector, there is still room to improve access to finance for these firms, particularly in badly affected parts of the European economy. Proposals include improving liquidity for bank lending via liquidity facilities or secondary markets, establishing a stronger European capital market for securitised debt, or improving equity financing through simpler private placements or removing tax distortions favouring debt financing. Many programmes to improve access to finance are already under way (Exhibit 104). Exhibit 104 Several measures have been proposed to strengthen and diversify funding sources, particularly for SMEs Measures that have been proposed Accelerate the cleanup of bank balance sheets NOT EXHAUSTIVE Suggested by Increase the incentives for prudent bank provisioning and write-offs and  IMF ensure that overcapitalised banks use their capital buffers to crystallise losses Promote a secondary market for non-performing loans; improve the transparency of bank and corporate balance sheets to enhance market discipline; reform and resource legal frameworks to facilitate timely resolution  IMF Restore integration and resilience Revitalise cross-border lending to benefit from imbalances among deposit-rich and lending-rich countries in Europe while improving overall resilience by fully implementing the European Banking Union  ECB  European Commission  IMF Free up bank capital to support lending, particularly to small and medium-sized enterprises Increase balance sheet turnover by creating broad-based, plain-vanilla securitisation markets (with lending standards, skin-in-the game requirements, and resecuritisation limits) by reviewing regulatory capital requirements attached to asset-backed securities and by developing new instruments for SME securitisation      Temporarily support lending to preferred sectors (SMEs and infrastructure investments) through state credit guarantees or through expansion of national business-support agencies  AFME  IMF Promote non-bank credit intermediation (insurance companies, pension funds) to hard-to-service borrowers such as SMEs by reviewing regulatory investment restrictions and by improving transparency on borrowers (e.g., standards for credit-scoring assessments)     Facilitate securities offerings by small enterprises (high-yield bonds, private placements) by reviewing investment restrictions for large investors (insurance companies, pension funds)  AFME  IMF Develop or promote other non-traditional sources of finance (such as crowd-sourcing, peer-to-peer lending) by providing an appropriate regulatory framework as well as venture capital markets (e.g., through fund of guarantees for institutional investors)  AFME  City of London  European Commission Promote an increase in equity funding by recalibrating the tax bias against equity, reducing management incentives against equity, and promoting access to equity for SMEs (“mini-IPOs”)  AFME  City of London Develop non-bank sources of funding, particularly for SMEs AFME City of London ECB European Commission IMF AFME City of London European Commission IMF Regulate loss-leading corporate lending to limit bank funding of large corporates and stimulate the development of corporate bond markets SOURCE: Global financial stability report, IMF, April 2014; Euro area policies: 2014 Article IV consultation, IMF, July 2014; European Commission green paper, March 2013; AFME briefing note, June 2013; Unlocking funding for European investment and growth, AFME, 2013; Llewellyn Consulting, June 2014; McKinsey Global Institute analysis Survey on the access to finance of enterprises in the euro area, European Central Bank, November 2014. 234 McKinsey Global Institute A window of opportunity for Europe 175 .
Increased lending by the EIB, which today is enabled by government capital contributions outside the Fiscal Compact or through ECB purchases of EIB debt, could help to advance infrastructure and other projects that are facing capital constraints. The effects will be contingent, however, on finding ways to structure additional projects that become economically viable through reduced cost of capital. We estimate that the effect of resolving any remaining blockages in access to finance would likely enable €6 billion to €23 billion of additional demand, once multiplier effects are considered. This is only a fraction of the fall in corporate investment since 2008. A return to pre-crisis corporate investment trends would yield €227 billion in incremental investment. But only part of this gap can be closed by improving access to finance—just 12.4 percent of business leaders say that access to finance is their primary obstacle to investment, weighted by size.235 If we assume that the share of the investment gap that corresponds to companies facing problems with access to finance is the same as the weighted proportion of companies for which it is their primary problem, raising access to finance would mean an additional €28 billion of investment.
This is, however, a very aggressive assumption. There will always be some companies that believe that their primary obstacle is finance. For our lower bound, we assume that Germany—where 9 percent of companies face similar financing constraints—is the benchmark for normal financing conditions. In this case, improving access to finance would enable €7.8 billion of additional business investment. Estimating the true effect of improving access to financing for SMEs is difficult because it requires making a judgment about when a loan is appropriate.
This is subjective. Neither the business owner nor the bank can know for certain what the return will be on any given investment. ~60% of bank managers said lending standards to SMEs tighter than in 2003–14 survey Facilitating bank lending It is harder to obtain credit in Europe today than it was before the crisis. A survey of bank managers by the ECB in 2014 found that around 60 percent felt that lending standards for SMEs were considerably or moderately tighter than they were in 2003.236 Although tighter prudential standards may be a good thing, there are pockets where this creates problems for growth.
Thirty-two percent of SMEs surveyed in Greece, 17 percent in Spain, and 14 percent in Italy report that access to finance is the most pressing problem their firm is facing. Rates in other countries, such as Germany, are as low as 9 percent.237 The conditions for borrowing are dependent on geography because most SME lending is driven by local banks. Local banks can have very different liquidity provisions, even within Europe.238 Where local banks’ liquidity remains an issue, the ECB is in a position to improve their liquidity.
However, programmes to offer long-term financing have been available and under-subscribed. Moreover, the ECB has already waived the credit rating requirement for banks from the Eurozone periphery that seek refinancing. It is therefore not clear that further financing for banks will unlock lending. Ibid. Euro area bank lending survey, European Central Bank, April 2014. 237 Survey on the access to finance of enterprises in the euro area, European Central Bank, November 2014. 238 Iftekhar Hasan et al., Bank ownership structure, SME lending, and local credit markets, Bank of Finland research discussion paper number 22/2104, 2014. 235 236 176 McKinsey Global Institute 3.
How Europe can reignite investment and job creation . Banks may be hesitant to lend further because small business loans are illiquid. Europe has only a very small secondary market for SME loan-backed securities. Creating a large, liquid, Europe-wide market for such securities could encourage bank managers to increase lending.239 Regulators and voters are rightly cautious about the regulation required for a functioning securitisation market for new asset classes given the role mortgage-backed securities played in the 2008 crisis. However, sensible proposals can address this concern. The ECB should continue its work by creating clear new securitisation markets built on transparency—including loan-level visibility of credit risk.
This will allow purchasers of debtbacked securities to build risk models that incorporate the characteristics of individual loans within the bundle. In addition, “skin-in-the-game” rules that require issuers to maintain a minimum stake in the security will reduce the risk of using securitisation to hide bad assets. Restrictions on resecuritisation will make it easier for banks to model the risk of the security and reduce the complexity of counter-party risk. Enabling access to debt from the market Developing Europe’s debt security market might help slightly larger companies to access lending through capital markets rather than from banks. Although the role of debt securities has been growing, they remain only about one-third of the European capital market compared with half in the United States and Japan (Exhibit 105).240 Exhibit 105 European corporations rely relatively heavily on bank intermediation; although the use of securities is growing, they still have a much smaller share Capital market composition, 2012 % Equity1 Debt securities (public and private) Bank assets2 25 12 25 48 26 Corporate balance sheet composition, 2006–133 % of GDP; quarterly3 17 29 34 95 90 85 53 22 Lehman Brothers bankruptcy 12 48 40 54 55 80 Bank 91 assets % of GDP Japan Canada United EU Kingdom 208 212 438 308 Loans 75 15 United States -5% 10 Securities +49% 5 2006 07 08 09 10 11 12 2013 1 Stock market capitalisation. 2 Total assets of domestic commercial banks, including foreign banks’ subsidiaries operated domestically. 3 Excluding Bulgaria, Croatia, Luxembourg, Romania, Switzerland, and Norway NOTE: Numbers may not sum due to rounding. SOURCE: Global financial stability report, IMF, April 2014; Eurostat; McKinsey's Global Economics Intelligence analysis; McKinsey Global Institute analysis See The case for a better functioning securitisation market in the European Union: A discussion paper, European Central Bank and Bank of England, May 2014, and The impaired EU securitisation market: Causes, roadblocks and how to deal with them, European Central Bank and Bank of England, May 2014. 240 Global financial stability report: Moving from liquidity- to growth-driven markets, IMF, April 2014. 239 McKinsey Global Institute A window of opportunity for Europe 177 .
Expanding this channel provides an alternative in case bank lending dries up, increasing the resilience of the financial system. However, one of the reasons for the high exposure of European firms to bank lending is the competitive lending rates they find in Europe.241 Unlike US banks, European banks sometimes regard business lending as a route into cross-selling higher value-added services. This means it will be more challenging to develop capital markets on the scale seen in the United States. Creating a more liquid European capital market for debt securities would, in addition to bolstering resilience, attract international attention from supply-side investment services firms. This would increase the visibility to investors of firms seeking debt, which would reduce borrowing costs and increase the availability of capital.
Ongoing efforts by the European Commission to reduce the current fragmentation of regulation through a capital markets union will play a role in building a large liquid European market, although it continues to be unclear exactly which proposals the EU will incorporate (see Box 8, “The EU’s planned capital markets union”). Doing so by reducing the competitiveness of bank loans would increase the cost to business in the short term at the very least. Box 8. The EU’s planned capital markets union European capital markets are not as integrated as they could be, and many advantages would flow from their further integration.
Today, investment in Europe remains heavily reliant on banks, while equity, debt, and other capital markets play a minor role in financing growth compared with the case in other economies. The capital market is fragmented because of different regulations covering such aspects as insolvency, company law, taxation, and securities law, as well as because of different market practices for products such as securitised instruments and private placements. As a result, financing conditions vary significantly among member states, and shareholders and buyers of corporate debt rarely go beyond their national borders when investing.
Many SMEs still have limited access to finance. Building a true single capital market in Europe by removing such barriers to cross-border investment would improve access to financing for all businesses, in particular for SMEs, in Europe at a low—and comparable—cost. It would also reduce the cost of raising capital, allow investors to diversify funding of their investment, and therefore help the EU to attract investment from all over the world, thereby contributing to economic growth. If European capital markets were to become more efficient, risk and capital allocation would be improved.
It also would contribute to stabilising the financial system by improving its ability to absorb shocks. For the ECB, integrated capital markets would facilitate the implementation of monetary policy.1 In its green paper presented on February 18, 2015, the European Commission laid out its vision for step-by-step progress towards achieving a capital markets union in 2019.2 At the time of writing, the Commission was in discussions about its initial suggestions with all interested stakeholders with the intention of publishing a more detailed white paper in summer 2015. The Commission has signalled its desire to start with efforts to encourage high-quality securitisation across Europe, improve the availability of credit information on SMEs to provide investors with an improved fact base, put into place a pan-European private placement regime to encourage cross-border direct investment in smaller businesses, and support a new European long-term infrastructure investment fund. Yves Mersch, Capital markets union: The “why” and the “how”, speech at the Joint EIB-IMF High Level Workshop, Brussels, October 22, 2014. Breakaway: How leading banks outperform through differentiation: McKinsey global banking annual review 2 2013, McKinsey markets Services Practice, November green Building a capitalFinancial union, European Commission2013.
paper, February 2015. 1 241 178 McKinsey Global Institute 3. How Europe can reignite investment and job creation . Enabling access to equity European SMEs are much more likely to use debt to finance investment than they are to issue equity. Enabling equity issuance as an alternative channel would improve resilience much like creating a debt securities market. There are good reasons that SMEs tend to prefer debt over equity. SMEs often want shortterm or revolving liquidity on a small scale, not suited to the higher transaction costs of issuing equity. In addition, SMEs tend to have lower standards of accounting, which make it harder to satisfy regulatory requirements on equity listings.
National governments and the ECB could take further steps to reduce the impact of the latter hurdle by simplifying and reducing the reporting requirements for SMEs that are issuing equity, particularly for those offering private placements to sophisticated investors. Of course, regulatory requirements on SME equity need to continue to protect unsophisticated investors from fraud.242 However, there are also less justifiable reasons that many SMEs prefer debt over equity. For instance, systematic tax distortions in many countries encourage this preference.
When an SME borrows money, interest payments on the debt are treated as a cost of business and are tax-deductible. In contrast, when SME owners (often founders or entrepreneurs) sell equity to invest, they have to pay capital-gains tax for the shares sold on the increase in value since the owner paid in capital originally. This makes debt a much more tax-efficient instrument for SMEs than equity.
Removing the tax deduction on interest payments would create a more level playing field, but it would also make it more costly to invest now than later. An alternative—providing a tax break on capital gains for equity used for investment— has been implemented in Belgium and proposed in many countries.243 The jury is still out on whether this approach increases investment rates among SMEs.244 In the Eurozone, there is room for doubt about whether monetary stimulus— including QE—will be effective in boosting investment and job creation The evidence suggests that accommodative monetary policy—traditional or nontraditional—has been beneficial to the European economy during a period of stagnation, but that, by itself, cannot fully resolve Europe’s shortage of investment and job creation. Low inflation keeps real interest rates fairly high, and companies continue to hold cash despite ultra-low nominal rates as they rarely adjust their hurdle rates and the macroeconomic outlook remains fragile. Low nominal interest rates have not fully translated into real interest rates.
In some countries, nominal interest rates are near zero, but, because of low inflation or even deflation, the real cost of borrowing has not fallen significantly and may even be higher than before the crisis (Exhibit 106). For example, in Spain, the real corporate lending rate at the end of 2007 was 1.5 percent; in 2014, it was around 3 percent. “Securitisation rules: ‘Significant risk transfer’, retention and due diligence”, fact sheet, De Nederlandsche Bank, February 2014. 243 Mirrlees Review, Institute for Fiscal Studies, 2010. 244 Geert van Campenhout and Tom Van Caneghem, “How did the notional interest deduction affect Belgian SMEs’ capital structure?” Small Business Economics, volume 40, issue 2, February 2013. 242 McKinsey Global Institute A window of opportunity for Europe 179 . Exhibit 106 Although interest rates have fallen, low inflation means that the real cost of borrowing has not declined significantly Real corporate lending rates1 % 8 7 Germany 6 Netherlands 5 France 4 Greece 3 Italy 2 1 Spain 0 Portugal Ireland -1 -2 2004 05 06 07 08 09 10 11 12 13 2014 1 Annualised agreed rate/narrowly defined effective rate, loans with an original maturity of more than one year to nonfinancial corporations (S.11) sector, less inflation calculated with Harmonised Index of Consumer Prices (HICP) method. SOURCE: ECB monetary financial institution (MFI) interest-rate data; Eurostat HICP data; McKinsey Global Institute analysis And, despite an enormous increase in the ECB’s balance sheet, broad money supply has grown more slowly than pre-crisis as the money multiplier has broken down (Exhibit 107). The creation of money happens endogenously when banks lend, and therefore a lack of demand for loans hampers the transmission of monetary policy. An example of this situation in action is the very low uptake of the ECB’s offer of €400 billion of low-cost, four-year financing under the targeted long-term refinancing operation programme. By the end of 2014, only €212 billion of the facility had been used because demand for bank loans is low. The offering in March 2015 had a significantly higher than expected uptake of €98 billion, but this success was overshadowed by the fact that QE had been launched two months earlier. 180 McKinsey Global Institute 3. How Europe can reignite investment and job creation .
Exhibit 107 Monetary policy has been highly accommodative, but it has not driven money circulation and inflation up proportionately Policy interest rates and inflation rate ECB main refinancing operations; % Eurozone HICP at constant taxes; monthly figures; % per year Policy rate Inflation rate 6 5 4 3 2 1 0 -1 2008 09 10 11 12 13 Money supply and money circulation Eurosystem total assets/liabilities; base money1 and M2 Index: 100 = January 2006 2014 Balance sheet Base money M2 300 250 200 150 100 50 2006 07 08 09 10 11 12 13 Pre-recession Post-2008 r = 0.99 2014 Correlation between base money and M2 = 0.45 1 Currency in circulation and MFI current accounts (covering minimum and excess reserves). SOURCE: Eurostat; ECB; McKinsey Global Institute analysis McKinsey Global Institute A window of opportunity for Europe 181 . Why are low interest rates not creating demand for borrowing? In the case of companies, low interest rates, by definition, reduce the cost of capital, but the lower cost of capital is not necessarily reflected in the hurdle rate the company uses when deciding whether to invest.245 The hurdle rate is determined by a number of other factors including the company’s organisational capacity constraints, uncertainty about potential future returns, a desire for financial flexibility, and even the fact that managers are biased towards optimism when they forecast future returns.246 Many companies—especially smaller organisations that may lack financial sophistication—do not adjust their hurdle rates in line with changes in their cost of capital. Indeed, companies adjust their hurdle rates fairly infrequently. A survey carried out in the United States in 2003 when interest rates were low after the dot-com bubble burst found that more than half of companies had not changed their hurdle rates in the previous three years. Most companies fix hurdle rates that are easy to remember—in whole numbers that cluster on 10 percent, 15 percent, 20 percent, and 25 percent.247 Another study finds that many companies—especially smaller organisations that may lack financial sophistication—do not adjust their hurdle rates in line with changes in their cost of capital.248 Whether the ECB should undertake QE has been a topic of intense discussion in Europe for some time—well before the ECB decided to go ahead. One argument put forward is that additional monetary easing through the purchase of securities is an indirect way of financing governments that encourages fiscal profligacy and is therefore against the mandate of the ECB.
But it may still be necessary in order for the ECB to meet its inflation target—and therefore to meet its mandate. Another argument is that securities purchases make taxpayers responsible for any losses—albeit purchases by the ECB (and the Bank of England) have explicitly been of high-quality assets. €1.1T QE programme announced January 2015 In January 2015, the ECB announced a €1.1 trillion QE programme planned to add €60 billion a month to financial markets until September 2016. ECB President Mario Draghi said that the operation would continue until the central bank observed a sustained adjustment in the path of inflation.249 But, given that interest rates are already low and that there are several weak transmission mechanisms in Europe, the effect of QE on investment and job creation might be modest (see Box 9, “QE”).250 Quantitative Easing and ultra-low interest rates: Distributional effects and risks, McKinsey Global Institute, November 2013. 246 Ravi Jagannathan et al., Why do firms use high discount rates? Social Science Research Network Electronic Journal, June 2014. 247 Iwan Meier and Vefa Tarhan, Corporate investment decision practices and the hurdle rate premium puzzle, SSRN Electronic Journal, January 2007. 248 Tor Brunzell, Eva Liljeblom, and Mika Vaihekoski, “Determinants of capital budgeting methods and hurdle rates in Nordic firms”, Accounting & Finance, volume 53, issue 1, March 2013. 249 “ECB announces expanded asset purchase programme”, press release, ECB, January 22, 2015. 250 H.
Woody Brock, Quantitative easing: Myths and half-truths, Strategic Economic Decisions, October 2012. 245 182 McKinsey Global Institute 3. How Europe can reignite investment and job creation . Box 9. QE Quantitative easing by a central bank is the purchase of securities in the open market against central-bank reserves.1 It has been used by the US Federal Reserve, the Bank of England, the Bank of Japan, and now the ECB and the Riksbank.2 QE can play a role in providing banks and financial markets with reserves and liquidity, especially when the usual mechanisms of financial and interbank markets are not working. QE should not be confused with creating money because central banks do not directly affect the supply of broad money through QE. They merely provide the contingent liquidity for banks to create money by lending more.
This is not currently happening on pre-crisis scale, and it can be controlled via capitalisation rules and interest payments on reserves when needed.3 The impact of QE on economic activity is not clear, and the effect of different transmission mechanisms depends on the state of the economy. When there is an acute shortage of liquidity, even solvent companies could be at risk of bankruptcy for cash-flow reasons, and the purchase of assets by central banks helps both banks and companies access cash quickly. The US Federal Reserve System resorted to QE when illiquidity on mortgage and interbank markets threatened to cause a chain reaction of bankruptcies.
It bought $1.25 trillion in mortgage-backed securities between 2008 and 2010 as well as US Treasury securities and agency debt worth hundreds of billions of dollars. The combined actions of the Federal Reserve and US Treasury were able to stabilise financial markets and the banking sector. They did not create strong lending, nor have they created inflation. The ECB faced a different situation, because mortgagebacked securities markets are less developed in Europe. It reacted to the credit squeeze following the bankruptcy of Lehman Brothers by offering long-term refinancing operations that gave banks access to long-term liquidity. It also reduced requirements for how much collateral a bank needed to hold for a given amount of loans.
Unlike the Federal Reserve, it did not engage in a large asset purchase programme.4 Eurozone banks took longer to stabilise. This was partly because of a less aggressive response on the part of the ECB, but more so because of the relative size of the banking sector, the speed of response of national governments, and the time it took European banks to recognise and dispose of bad assets.5 Once the immediate liquidity challenge was resolved, further asset purchases by central banks such as the Federal Reserve’s QE2 and QE3 programmes or the announced ECB programme can have several transmission channels, but the jury is still out on their effectiveness: wealth effects from increased asset prices, reduced long-term interest rates, higher fiscal spending capacity, and weakened currencies. By buying assets, the central bank changes asset prices. If asset prices go up, a wealth effect can be created in which people feel wealthier and therefore spend more— which in turn can lead to higher domestic investment and consumption. The segments of the population affected, however, have the lowest marginal propensity to consume, particularly in Europe where household stock holdings are modest. Asset purchases can also reduce interest rates on specific asset classes, but this effect depends a great deal on other market participants.
Purchasing Treasuries ought to increase demand, reducing yields and bringing down interest rates.6 This could encourage investment. However, if central-bank purchases raise fears of inflation, it could result in higher yields on sovereign debt. For example, interest rates rose following the Federal Reserve’s QE2 and QE3 programmes.7 Establishing clear causation either way is all but impossible.8 As a result, the debate remains inconclusive.
If QE reduces real interest rates, it may trigger investment in those pockets where credit is a constraint—but it may not address the weak demand for credit in the current environment of tepid growth prospects. And the liquid assets of European households in countries such as Germany and France tend to be much larger than total household debt, so total household spending may be negatively affected by low policy rates.9 QE may also weaken the euro and even further boost net exports. This seems currently to be happening, but the effects could also be undone by other central banks’ efforts. QE in Europe today could potentially support government spending by returning the dividends of purchases to ECB shareholders.10 Banking structures report, European Central Bank, November 2013. 6 George Kapetanios et al., Assessing the economy-wide effects of quantitative easing, Bank of England working paper number 443, January 2012. 7 US Department of the Treasury. 8 M.
Hashem Pesaran and Ron P. Smith, Counterfactual analysis in macroeconometrics: An empirical investigation into the effects of quantitative easing, IZA discussion paper number 6618, June 2012. 9 John Muellbauer, Combatting Eurozone deflation: QE for the people, Vox, December 23, 2014. 10 QE and ultra-low interest rates: Distributional effects and risks, McKinsey Global Institute, November 2013. 183 5 QE is also sometimes used to include lending programmes, too, such as those used by the ECB to improve banking liquidity. Here, we focus on the role of asset purchases. 2 Brett W.
Fawley and Christopher J. Neely, “Four stories of quantitative easing”, Federal Reserve Bank of St. Louis Review, volume 95, number 1, January/February 2013; Sweden cuts rates below zero and starts QE, BBC, February 12, 2015. 3 H.
Woody Brock, Quantitative easing: Myths and half-truths, Strategic Economic Decisions, October 2012. 4 Brett W. Fawley and Christopher J. Neely, “Four stories of quantitative easing”, Federal Reserve Bank of St.
Louis Review, 2013. McKinsey Global Institute A window of opportunity for Europe 1 . New ideas should now be debated to widen the range of potential investment and job creation measures The debate on demand-side measures—focused on QE and the appropriate degree of retrenchment in countries’ budget deficits—has become stale. New ideas that open up new possibilities deserve more debate. Europe now needs to consider what could be the next wave of bold action that helps to restore growth without undermining confidence in government solvency and, in the Eurozone, confidence in the euro. In this section we highlight four options: accounting for public investments as they depreciate; careful adjustment of taxation and wage structures; unleashing the silver economy; and issuing vouchers to households redeemable with the ECB. Account for public investments as they depreciate Since the crisis, governments have cut public investment.
Treating such investment as an asset on a public balance sheet and accounting for the related expenditure only during depreciation, often over many decades, could avoid the bias against investment and unlock sufficient spending to almost close the output gap. A strong supervisory body would need to ensure productivity of that spending or test the impairment of assets. Public investment is typically a very small share of overall government budgets, but arguably more discretionary in nature than many ongoing expenses or transfer payments. In Europe, net public capital investment fell by around two-thirds, from 0.9 percent of GDP in 2007 to only 0.3 percent of GDP in 2013.
This implies that governments were barely maintaining their depreciating assets. Indeed, since the crisis, spending has increasingly focused on past obligations such as debt service and pensions rather than investing in future growth (Exhibit 108). Exhibit 108 Since the recession, governments have de-prioritised investment for today and the future In order to repay unavoidable liabilities Time orientation of government expenditure1 % of GDP Index: 100 = 2008 115 â–ª Interest and pension liabilities Past 110 â–ª Future spending has a planning 105 lag but was cut 100 Future 95 Present 90 2008 were growing and almost impossible to avoid 09 10 â–ª Present spending went sharply up as unemployment costs rose and fell as discretionary budgets were slashed 2011 1 Expenditure is calculated as “past-oriented” when it is servicing liabilities incurred by previous commitments (interest payments, pensions), “future-oriented” when it builds up human or physical capital (gross fixed-capital formation, education, R&D), and “present-oriented” in all other cases. SOURCE: Eurostat; AMECO database; McKinsey Global Institute analysis 184 McKinsey Global Institute 3. How Europe can reignite investment and job creation .
In the Eurozone, the Fiscal Compact treats investment spending the same as consumption spending.251 This is not a universal norm. Most US states, for example, have rules that require balanced budgets on operating expenses but allow for debt to be used to fund public investment.252 As a modest step towards such an approach, the European Parliament recommended in October 2013 that all investments in projects co-funded by the EU be excluded from calculations under the EDP.253 In addition, it recommended that separate deficits should be calculated and reported for operating and capital expenditure—although these would not be used for the EDP.254 While this suggestion was rejected by the European Council, the European Commission announced in November 2014 that capital contributions to the new European Fund for Strategic Investments (also known as the “Juncker Plan”) would be treated favourably during assessments of country finances under the Fiscal Compact.255 One approach that would reorient incentives without undermining the Fiscal Compact would be to adjust the calculation of the capital component of government spending.256 Currently, capital spending is calculated on an accruals basis with the expenditure booked at the time that the building work on the project is carried out. This is in keeping with ESA 2010 standards of accounting that costs should be booked when the economic activity associated with them takes place.257 A different way would be to calculate expenditure during the consumption, rather than the creation, of an infrastructure asset, as companies do. Suppose a three-year, €6 billion road project is contracted out to a private construction firm and the government pays half of that amount up-front and the second half on completion to the required standard. Today, although the government is actually paying money only in years one and three, for instance, it books spending of €2 billion in each of the three years.
However, the roads will be operational for the next 20 years. It would make just as much sense for the government to book an expense of €300 million every year for 20 years as the public asset is consumed. Many public assets are unlike private assets in that they do not have corresponding revenue streams attached to them. However, socioeconomic rates of return on public investment can far exceed the government’s cost of capital—and substantially increase the future tax base in a way that makes it self-funding over the long run.258 This makes it appropriate to treat such investments as assets from a fiscal as well as a social point of view. The effect of this proposal would vary by country.
The impact on the size of deficits that are reported under current spending would be small. For most countries, the rate of capital consumption is quite similar to the rate of capital investment. For countries that are bound by the Fiscal Compact, these changes would require a total cut in government consumption When it is making a decision about whether a country should be placed in the EDP, the European Council may take into account the fact that investments were being made as part of structural reform.
However, no criteria are given for when this condition may be in effect, and it is not in regular use. Similarly, there is an exemption for gross capital formation expenditure as part of deficit limits. However, it is applicable only if a country is still meeting the 3 percent limit, is not in the EDP, the country is in recession, and the expenditure in question is the national contribution to a project partially financed by the EU. 252 Capital budgeting in the states, National Association of State Budget Officers, spring 2014. 253 “Resolution of 8 October 2013 on effects of budgetary constraints for regional and local authorities regarding the EU’s Structural Funds expenditure in the member states”, European Parliament, October 2013. 254 Francesca Barbiero and Zsolt Darvas, “In sickness and in health: Protecting and supporting public investment in Europe”, Bruegel Policy Contribution, issue 2014/02, February 2014. 255 “Factsheet 2: Where does the money come from?” European Commission and European Investment Bank, November 2014. 256 Olivier J.
Blanchard and Francesco Giavazzi, Improving the SGP through a proper accounting of public investment, Centre for Economic Policy Research discussion paper number 4220, February 2004. 257 European system of accounts 2010, Eurostat, June 2013. 258 Infrastructure productivity: How to save $1 trillion a year, McKinsey Global Institute and the McKinsey Infrastructure Practice, January 2013. 251 McKinsey Global Institute A window of opportunity for Europe 185 . of €9 billion. But it would enable governments to invest into the future. Estimating the level of investment required in public infrastructure, affordable housing, and R&D spending suggests an unmet investment need of around €140 billion to €152 billion a year among countries signed up for the Fiscal Compact. This total comprises €34 billion of additional infrastructure spending, €59 billion of additional R&D spending, and €47 billion of additional spending on affordable housing.259 If governments were to address this entire investment shortfall under the suggested accounting standard, this option could create aggregate demand between €90 billion and €220 billion after fiscal multipliers are taken into account. This one accounting adjustment would nearly be sufficient to close the output gap (Exhibit 109). An important caveat is that this accounting approach could undermine the productivity of public investment.
There is a risk that government leaders, freed from the responsibility of having projects appear in their fiscal expenses during their tenure, might decide to spend ineffectually on white elephants. This may be politically useful in the short term—boosting particular constituencies such as construction workers and the unemployed—but the costs would be borne by future generations. In order to address this risk, a powerful oversight body would be required to stress-test the productivity of investment programmes and advise on the depreciation schedules of projects and a mechanism for impairment. Carefully adjust taxation and wage structures to redirect resources to households with the greatest pent-up demand Changes to taxation and wage structures have the potential to redirect resources to households with the greatest pent-up demand, which will be critical to stimulating European investment and job creation overall. The marginal propensity to consume of higher-net-worth households is only about one-third that of lower-wealth households, and capital income is less likely to be spent than labour income (see Box 10, “Marginal propensity to consume”). Box 10.
Marginal propensity to consume The marginal propensity to consume (MPC) is a measure of the likelihood that extra income will translate into additional spending. Typically the MPC of low-income households is greater than that of high-income households. For example, a household earning €20,000 a year might spend, say, 90 percent of any extra income due to pent-up demand for things that are outside its budget.
Meanwhile, a household earning €1 million a year may have only marginal unmet demands and would spend only 10 percent of any extra income. Thus giving a euro to the first household would result in an increase in consumption of €0.90, while doing the same for the second household would lead to extra consumption of €0.10. Factors that result in a high MPC include having a low income, having little wealth, being able to access only low interest rates on savings, having low consumption taxes, and having high wealth taxes. Of these effects, the income and wealth effects are very large.
The wealthiest 20 percent of households have a marginal propensity to consume in the order of 10 percent, 259 The need for while the lessinfrastructure investment is basedhas one in the order of 60 percent.1 levels of GDP wealthy half of households on the rate of investment associated with the growth to which Europe aspires. The need for R&D investment is based on the gap between European R&D expenditure and best-in-class countries such as South Korea, assuming that half of the difference must be 1 borne by the public sector in the form of subsidies. The affordable housing estimate is based on the cost of Christopher D.
Carroll, Jiri Slacalek and Kiichi Tokuoka, The distribution of wealth and the marginal propensity replacing substandard Central in major cities by 2025. to consume, European housing Bank working paper number 1655, March 2014. 186 McKinsey Global Institute 3. How Europe can reignite investment and job creation . Exhibit 109 Accounting for investments as they depreciate would enable more public investment Within 3% limit Above 3% limit Existing view Capital consumption view Government deficit, 20141,2 % of GDP New deficit value, 20141,3 % of GDP Germany 0.2 Luxembourg Change to base deficit capacity, 20141,3 € billion 0.2 Estonia 0.3 1.0 1.2 4.7 -2.4 0.3 -2.5 2.3 0.2 -2.9 -2.5 Netherlands 0.3 -0.1 -2.1 Malta 0.5 -0.7 -1.6 Romania 0.6 1.3 -1.1 Greece 27.8 1.5 -1.0 Latvia -3.8 0.1 -0.4 Denmark 3.7 0.1 -1.8 2.5 -2.1 Finland -2.9 Austria -2.9 -3.1 -0.7 Belgium -3.0 -3.3 -1.2 Cyprus -3.0 Slovakia -3.0 Italy -3.0 Ireland -3.9 -3.4 Portugal Spain -4.9 -5.6 1.5 0.3 1.7 38.0 0.3 0.7 -4.2 -6.4 4.1 -6.3 -2.5 -5.5 0.1 4.7 -0.7 -3.5 -4.4 15.1 1.6 0.2 -1.8 -4.4 France 1.2 -2.3 -3.7 Slovenia Infrastructure, housing, and R&D spending increase needed4 € billion 1.9 0.5 4.2 -1.1 29.9 2.7 -7.8 13.3 Total opportunity € billion -9.0 152.1 1 Eurostat forecast, winter 2014. 2 Based on a deficit calculated with gross capital formation on an accruals production basis. 3 Based on a deficit calculated with gross capital consumption on an accruals lifetime use basis. New capacity is given by the current maximum capacity as calculated previously with adjustment to figures caused by the new accounting rule. 4 Assumes that all countries that are currently underspending relative to the levels expected of their GDP growth increase to the appropriate level, while those that are overspending do not change their behaviour in light of a new fiscal rule. Infrastructure gap is based on GDP modelling from Chapter 2, and R&D need is calculated relative to total R&D gap to Japan assuming 50% of the gap needs to be closed by the public sector. Affordable-housing infrastructure estimate based on extrapolation of MGI’s affordable housing analysis of replacing substandard housing stock by 2025.
Extrapolated based on the population in each country with severe housing deprivation. Lower estimate shown. SOURCE Eurostat; OECD growth forecast 2014; EU-SILC; McKinsey Global Institute analysis . Meanwhile, the labour share of national income has declined, and wealth concentration has increased (Exhibit 110). For all the current discussion about the high levels of household debt and slow deleveraging, the fact remains that the value of European households’ net financial assets is approximately 140 percent of GDP—for every debt, there is an asset to match. Exhibit 110 Skewed distribution of income and wealth may have contributed to increased household debt by sustaining consumption growth to 2008 Capital and labour shares in national income, United Kingdom, 1970–2010 % of national income 80 75 70 65 Labour share Capital share 25 20 15 10 1975 80 85 90 95 2000 05 2010 SOURCE: Thomas Piketty database; Kumhof and Rancière, 2010; Rajan, 2010; McKinsey Global Institute analysis Capital income is highly concentrated, so if it plays a bigger role in determining income, income inequality is increased. Richer households that are less likely to consume “recycle” their excess income by lending through financial intermediaries.260 Households at the bottom of the income distribution compensate for stagnant real wages by increasing leverage. In some cases, commentators have argued that governments encouraged debt as a substitute for redistribution to address growing inequality, most notably in the US mortgage sector.261 This situation is not dissimilar to the circumstances that occurred in the run-up to the Great Depression in the 1930s.
Franklin D. Roosevelt said on May 22, 1932: "... No, our basic trouble was not an insufficiency of capital.
It was an insufficient distribution of buying power coupled with an over-sufficient speculation in production. While wages rose in many of our industries, they did not as a whole rise proportionately to the reward to capital, and at the same time the purchasing power of other great groups of our population was permitted to shrink. We accumulated such a superabundance of capital that our great bankers were vying with each other, some of them employing questionable methods, in their efforts to lend this capital at home and abroad”. Michael Kumhof and Romain Rancière, Inequality, leverage and crises, IMF working paper number 10/268, November 2010. 261 Raghuram G.
Rajan, Fault lines: How hidden fractures still threaten the world economy, Princeton University Press, 2011. 260 188 McKinsey Global Institute 3. How Europe can reignite investment and job creation . Options for Europe today include the reduction of labour tax wedges, favourable wage rounds in the Eurozone “core” countries, and judicious land, property, wealth, or capitalgains taxation. As a first approximation, MGI estimates a redistribution equivalent to 1 percent of GDP could trigger additional spending of €95 billion to €273 billion. Great care in designing policy is critical. A poorly conceived measure could harm growth by promoting capital flight or a decline in investment.262 Progressive taxation may reduce growth by reducing the incentives to work and take risks.263 However, inequality also reduces growth by decreasing the development of skills and access to opportunities of talented individuals from disadvantaged backgrounds.264 Empirical estimates of the sizes of each effect on growth are inconclusive but suggest that the detail of how inequality reduction measures are implemented is important. 55+ age group makes up 45% of Europe's households but has nearly 60% of wealth Unleash the silver economy In common with many other economies, Europe’s population is projected to age at an increasing pace and eventually decline. This report outlines numerous options for offsetting these trends through increased productivity and labour-force participation, but ageing demographic trends also offer new opportunities.
European countries can turn ageing into an advantage by offering services and experiences focused on older generations. These could include high-quality leisure activities and destinations, advanced health-care options, and unique cultural experiences. The fact is that, in the Eurozone, those aged 55 and older make up around 45 percent of households but hold almost 60 percent of household wealth (Exhibit 111).265 They typically have stronger balance sheets than younger generations, having saved at an increasing rate throughout their prime working years and having benefited from favourable asset-price developments in the decades prior to the crisis. Encouraging increased spending of this demographic’s accumulated wealth could be a significant lever for boosting investment and job creation and improving the economy for all generations.
Simultaneously, European governments might consider addressing intergenerational equality through other means, such as adjusting capital transfer taxes, or increasing the stock of affordable housing stock, whose current shortage has been a major source of disparity in wealth between the millennial and silver generations. As an example, Japan, which has one of the oldest populations in the world, recently changed its taxation policies to incentivise the transfer of accumulated savings from seniors to their descendants and increased inheritance taxes to increase the redistribution of wealth. Unlocking just 1 percent of the silver age group’s saved wealth as new consumption could offer a stimulus to the European economy of approximately 0.3 to 0.6 percent of GDP.
With its excellent health-care system, its innumerable and highly developed tourism destinations, and strong cultural heritage, Europe is well placed to take advantage of the silver economy. Martin Paldam, “Safe havens in Europe: Switzerland and the ten dwarfs”, European Journal of Comparative Economics, volume 10, number 3, December 2013. 263 Tax systems must balance many societal objectives, including economic growth, wealth equality, and perceived fairness. Property taxes are the most favourable to growth, especially those on immovable fixed property, because its supply is relatively inelastic. Consumption taxes are the next least detrimental to growth, distorting saving, work, and leisure decisions less strongly than income taxes (except where “‘sin’” taxes are deliberately distorting).
Income and corporate taxes have the strongest negative impact on growth because they affect short-term decisions about the supply of labour. Corporate taxes, if not internationally coordinated, are particularly likely to create capital flight for purpose of tax avoidance. See Jens M.
Arnold, Do tax structures affect aggregate economic growth? Empirical evidence from a panel of OECD countries, OECD economics department working paper number 643, October 2008. 264 Federico Cingano, Trends in income inequality and its impact on economic growth, OECD social, employment and migration working paper number 163, December 2014. 265 A household is defined as a person living alone or a group of people who live together and share expenditure. 262 McKinsey Global Institute A window of opportunity for Europe 189 . Exhibit 111 Unleashing the silver economy can stimulate household demand People aged 55+ command nearly 60% of wealth … … save more rather than consuming … … and make up an increasing share of the population Distribution of wealth by age demographic group, Euro area % Savings rate by age demographic % of disposable income2 People aged 55+ are set to make up more than 40% of Europe’s population by 2050, up from 30% today 100% 16–34 16 35–44 20 45–54 20 55–64 17 65–74 15 13 15 18 75+ 15 13 Share of households 5 13 16 23 8 26 2050 Share of total net wealth 16–34 35–44 45–44 55+ 1 Includes housing. 2 Based on a weighted average of historical data from France, Germany, and Italy. NOTE: Numbers may not sum due to rounding. SOURCE: The Eurosystem Household Finance and Consumption Survey, April 2013; Wall Street Journal; Antonin & Piketty, 2009; Aging, Savings, and Financial Markets (World Bank); McKinsey Global Institute analysis Issue vouchers redeemable with the ECB to householders Issuing vouchers to households that are redeemable with the ECB could stimulate incremental spending, accelerate household deleveraging, and raise inflation closer to the ECB’s target level. The central bank would effectively credit households with a certain amount of money through time-limited spending vouchers, redeemable with the central bank. This would be the equivalent of printing money, but it would ensure that the newly minted money was used for spending in the near term. An equitable distribution of vouchers across the Eurozone would avoid the need for lengthy discussions about redistribution between countries, moral hazard, or implicit liabilities. MGI’s first-order estimate is that crediting citizens with around €650 billion through such an approach could close the demand gap in Europe.
While people are concerned about the inflationary effects of such an approach, escaping deflation and restoring an inflation rate close to 2 percent would be the explicit goal of the policy. As such, it may also well be within the ECB’s mandate, although this position could be challenged and the policy regarded as a hidden form of fiscal policy. The target inflation rate could be kept well under control because directly crediting households minimises the money multiplier effect, and the balance sheet expansion for a given increase in aggregate demand would likely be smaller than is the case with QE.
Some commentators are concerned about setting a precedent for future calls on the ECB to print money repeatedly, but as long as its independence is assured, the central bank could do so only if the other monetary-policy tools at its disposal failed to satisfy its mandate, which would typically happen only in as severe an economic turbulence and deflationary environment as today's. 190 McKinsey Global Institute 3. How Europe can reignite investment and job creation . The measure remains risky, however, as it is conceivable that low growth and low inflation or even deflation could continue for longer than desired, as happened in Japan. Moreover, it is difficult to predict what impact deploying this option could have on the perception of citizens and their trust in the common currency. ••• Faced with the immediate pressures of the Eurozone crisis, European government leaders have been able to coordinate policy and take bold decisions to stabilise financial markets at least to a degree. But the fact remains that Europe still has a very significant output gap and a large deficit in investment and job creation. Many approaches—some entirely practical, others more radical—could help to alleviate this situation.
Now is the time to consider all the available options. The next question is how feasible a programme of change is, both on the supply side and on investment and job creation. We explore this question in the next, and final, chapter. McKinsey Global Institute A window of opportunity for Europe 191 .
Chapter photo Chapter 4: Cashier © Getty Images 192 McKinsey Global Institute 3. How Europe can reignite investment and job creation . 4. EUROPE CAN OVERCOME BARRIERS TO ACTION Europe’s economic future depends on whether the continent moves forward on broadranging reform on the supply side, backed by decisive action on investment and job creation. The question is whether—and how—Europe now moves forward on this sweeping agenda. This analysis suggests several powerful sources of optimism. Best practice already exists across Europe.
Three-quarters of all the ideas discussed on the 11 competitiveness growth drivers can be implemented by national governments, potentially bypassing the more complex and lengthy decision making that happens at the European level. According to the results of the MGI survey, Europeans are willing to play their part in unlocking change by making tough trade-offs. And there are, in fact, mechanisms that can help Europe overcome the stalemate in the debate of investment vs.
stimulus, and establish the governance that enables both—even absent a move to a more federal economic and fiscal European system. European decision makers now need to move beyond pure crisis management, articulate a longer-term vision for Europe based on simultaneous action on supply and investment and job creation, and take bold action. If they do not—if the status quo remains—there is a distinct risk that Europe will continue to face a long period of stagnation and instability as unemployment remains endemic and debt burdens stay high. Youth unemployment in particular is associated with increased crime and social disruption.266 Denis Fougère, Francis Kramarz, and Julien Pouget, Youth unemployment and crime in France, IZA discussion paper number 2009, March 2006. 266 .
We broadly see four possible futures for Europe, and in only one of these is greater prosperity highly probable (Exhibit 112). Sustainable growth and prosperity will likely be obtained only when both far-reaching structural reforms implemented mostly at the national level and investment and job creation enabled at the European level are carried out in concert. They are mutually reinforcing, amplifying each other’s impact, and together they have a strong likelihood of returning Europe to a growth trajectory that can meet the aspirations of its population. Should Europe embark on a fiscal spending spree without accelerating reforms to boost competitiveness, the resulting growth will not prove sustainable as increasing debt burdens become unbearable.
Conversely, pushing through reform at all costs in the absence of measures to support investment and job creation risks continued deflation, high unemployment, increasing political instability, and even, potentially, the breakup of the Eurozone. Exhibit 112 MGI has identified four potential scenarios for Europe—only reform, investment, and job creation combined will deliver prosperity <1% growth scenario Yes Running out of steam and political capital â–ª Short-term recession particularly in France â–ª Structural reform —mostly at the national level and Italy; medium-term stagnation in Europe, followed by sluggish growth Risk of populist parties gaining power, calling for dissolution of the European Union as unemployment and debt increase Gridlock â–ª Status quo: Slow growth and significant volatility due to uncertainty on future direction â–ª Japan-style deflationary spiral and risk of need to restructure public debt High-risk scenario >2% growth scenario Lockstep to prosperity â–ª Higher GDP growth (2–3% in the medium term) European shot in the arm â–ª Short-term GDP boost could end in financial collapse No No Yes Reigniting investment and job creation—enabled at the European level SOURCE: McKinsey Global Institute analysis Europe has significant challenges to overcome. On the structural side, there will be opposition to the short-term effects of reform. There also will be significant fiscal constraints, and the ever-present issues of fragmented decision making and strong vested interests.
For reform on investment and job creation, huge issues of trust and questions of governance must be worked through, along with genuine disagreement over the right economic path. But the inertia of these challenges can be overcome if Europe’s leaders take the opportunity to build on popular sentiment and work towards packaged deals that combine reform and job creation, leverage existing EU investment programmes, and strengthen key institutions to avoid moral hazard (Exhibit 113). 194 McKinsey Global Institute 4. Europe can overcome barriers to action . Exhibit 113 Europe will need to work in tandem on reform and support for investment and job creation Challenges Reform to boost competitiveness, mostly at national level (75% impact), supported at European level â–ª Opposition to short-term fallout of reform â–ª Fiscal constraints â–ª Fragmented decision making â–ª Vested interests â–ª Lack of trust and battles on who picks up the tab Investment and job creation, enabled mostly at the European level â–ª Insufficient institutions and governance Mechanisms to overcome inertia â–ª Demand support mechanisms that avoid moral hazard â–ª Package deals combining reform and job creation â–ª EU investment programme â–ª Genuine disagreement on the economics â–ª Complexity of implementation SOURCE: McKinsey Global Institute analysis Three-quarters of competitiveness growth drivers can happen nationally with European action to boost investment and job creation The fact that three-quarters of the competitiveness growth drivers discussed in this report can be implemented by national governments is an important key to unlocking change. Nevertheless, meaningful progress on accelerating reform will require visionary political leadership and, importantly, as we have stressed, simultaneous consensus and action at the European level to shore up investment and job creation. There are many institutional and political barriers to implementing competitiveness reforms that political leaders need to tackle (Exhibit 114). Together, the 11 competitiveness growth drivers amount to sweeping and radical change—and change is often hard. For some, willingness to implement the growth drivers may be weak because they are unpopular, require considerable time to take effect, and are subject to disagreement among experts. Immigration may be a powerful part of the answer to shrinking labour pools, but it is generally unpopular among citizens who worry that there will be more competition for jobs, housing, and even social benefits. Improving infrastructure is complicated by the fact that these projects are long term and therefore have to outlast any political cycle.
Innovation policy is an example where most people would be in favour, but there is disagreement about the nuance of how to improve outcomes in the most effective way. Other growth drivers are difficult to implement. In an era of rapid technological change, more flexible labour markets are necessary, but they face resistance from groups with vested interests that may feel negative effects from reform.
Openness to more trade is another such issue. Budget limitations stand in the way of improved education. And decision making on completing the Single Market can be fragmented and difficult. McKinsey Global Institute A window of opportunity for Europe 195 .
Exhibit 114 Europe needs to overcome many institutional and political obstacles to change Significant obstacle Moderate obstacle Willingness to implement Growth driver Ability to implement Fragmented Perceived Expert Time lag Budget decision unpopu- disagree- until benefits materialise constraints making larity ment Vested interests Complex implementation Nurturing ecosystem for innovation    Effective education to employment                             Reduced energy burden  Productive infrastructure investment Supporting urban development  Competitive and integrated markets in services/digital Public-sector productivity  Further openness to trade   Pro-growth immigration    Investment and job creation stimulation       SOURCE: McKinsey Global Institute analysis 196     Enhanced labourmarket flexibility   Grey and female labour-force participation  McKinsey Global Institute 4. Europe can overcome barriers to action  . Europeans tend to be sceptical about the ability of the politicians who represent them to move forward decisively. But crises often create strong incentives to take action. In the teeth of a severe financial and economic crisis in the 1990s and despite a very weak economy, Sweden boldly undertook sweeping structural reforms, transformed its public finances, and revamped productivity growth in many sectors. In the first decade of this millennium, Germany undertook radical reform of its labour market, thereby reducing unemployment, holding down unit labour costs, and improving the economy’s overall competitiveness. More recently, Spain’s labour-market reforms are projected to increase that economy’s productivity growth by an estimated 0.25 percent a year.
Effective reform depends on building an appetite for change, demonstrable government commitment, and the careful management of interest groups (Exhibit 115). Exhibit 115 Successful economic reforms managed to translate an appetite for change into concrete reforms, while managing opposing interests â–ª A popular sentiment that “things need â–ª to change”, often triggered by exogenous events or crises Shaping the terms of the debate on the need and proposals for economic reform Appetite for change â–ª A concrete reform plan, â–ª Government commitment â–ª Selecting, scoping, â–ª sequencing, and bundling reform steps to impact incentive structures and distributional effects Strategic consensus and trust building with stakeholders â–ª Interest group management1 developed with the involvement of experts and stakeholders A high degree of government commitment with respect to the reforms, based on strong cohesion within the entire government and/or across parties Effective communication of the reform efforts to the public and active involvement of stakeholders; no “reform by stealth” 1 Mancur Olson’s Logic of collective action (1965) implies that small, organized groups have incentives to influence policies in their favor—usually, these interests are protectionist and thus counter to many economic reforms; Alesina and Drazen (1991) hypothesized that the more unequal the distribution of the costs of reform, and the more polarized the society is, the longer it takes to be adopted (see also Alesina and Rodrik, 1994. SOURCE: Tompson and Price, 2009; literature review; Lora and Olivera, 2004; McKinsey Global Institute analysis McKinsey Global Institute A window of opportunity for Europe 197 . There are ways to unlock European action on investment and job creation despite governance, moral hazard, and distributional issues Agreeing to investment and job creation measures at the European level is difficult—as we know from the fact that debate on the best path forward has been going on for six years. Most of the barriers relate to governance and a lack of trust among European partners and a fear of creating moral hazard. However, most of these issues can be overcome within Europe’s—specifically the Eurozone’s—current institutional framework. Without moving to a full federal system of economic and fiscal governance, there is scope to use levers that don’t cause moral hazard and to design “package” deals in which national-level supply-side reform is coupled with European action on investment and job creation. It is in the interests of all to move forward given the strong economic ties that bind all parts of Europe together. Investment and job creation measures face many tangible barriers.
Many measures, including debt restructuring and transfer payments, have explicit distributional consequences. In some cases, there is genuine disagreement about the economics and what is the most effective path ahead. Examples where there is disagreement include the capacity of economies to raise more public debt and whether crisis economies are sufficiently small and open to export their way out of recession.
There are formidable institutional barriers, too. National leaders and sometimes their parliaments and even the constitutional courts of 28 EU member states need to agree on the path ahead. The ECB has a mandate to control Eurozone inflation but not to target employment as the US Federal Reserve does.
In the long term, Eurozone economies, in particular, need to address even more fundamental questions about the institutional design of economic and fiscal governance. In the absence of a move to greater fiscal and economic integration, designing stimulus in a way that minimises moral hazard has to be an important part of the mix. Changes in national accounting rules, or adjustment of taxation structures, could be as viable as elevating large-scale investment programmes to the European level. Ideally, the types of investments selected would be large scale, and in the interest of all Europeans, such as in coordinating pan-European energy grids and production facilities, upgrading the continent’s security and defence capabilities, or implementing multinational R&D and education programmes. Crafting package deals of measures designed to boost competitiveness and stimulate investment and job creation may serve as a viable approach, too.
We have already seen agreements that combine action on the supply side—a commitment to detailed reform— with financial support for those economies that were bailed out by the ECB, the European Commission, and the IMF. There could now be scope for other economies, including large ones that have not been subject to such bailout conditions, to make a commitment to comprehensive reform in exchange for decisive action at the European level to reignite investment and job creation beyond bare-minimum credit programmes. This could be coupled with multiple topic-focused pairings of reform and investment, such as an energy union that combined investment with reform of national regulation like market access and competition barriers.
For such package deals to be successful, it is imperative that European leaders work towards restoring trust among individual states. Today, there is a lack of trust that countries will spend wisely and follow through with difficult reform, rather than later seeking a bailout from their peers, which is a barrier to action. It is understandable that people living in areas that have felt relatively less economic pressure feel less of an imperative to act beyond a broad sense of solidarity and that these people regard the burden of resuming growth as lying squarely on the shoulders of more affected regions. But the reality is that all European countries have specific needs for reform (Exhibit 116).
All European economies have been through periods of both strength and weakness. 198 McKinsey Global Institute 4. Europe can overcome barriers to action . Exhibit 116 Each country has different relative priorities for structural reform and investment and job creation measures Relative importance of structural reforms and demand-side measures Nordics Continental Europe United Kingdom and Ireland Southern Europe Baltics Central and Eastern Europe Need for structural reform Inverse average country z-score for competitiveness growth drivers Higher 0.8 Bulgaria 0.7 0.6 Romania 0.5 Croatia Poland 0.4 Italy Slovakia Greece Malta 0.3 Latvia 0.2 0.1 Europe-30 average = 0 -0.1 Czech Republic Lithuania Austria Norway Estonia -0.3 -0.4 France Belgium Germany Finland Switzerland Ireland United Kingdom -0.5 Portugal Slovenia Hungary -0.2 Cyprus Spain -0.6 Netherlands Denmark Sweden Luxembourg Lower -0.7 -2 -1 0 1 2 Lower need 3 4 5 6 7 10 11 Higher need Need for investment and job creation Output gap (inverse) as % of GDP1 1 Positive values indicate an economy running below potential. SOURCE: European Commission; McKinsey Global Institute analysis Europeans are willing to play their part in their region’s economic renaissance Many politicians may fear that reform will not find favour with voters, and they therefore opt for inertia. But the evidence suggests that perceptions of electoral risk from voters who do not support the case for reform are not justified. First, research suggests that the probability of being re-elected is approximately the same for a reforming government as for a government that does not embark on reforms.267 Second, the results of the MGI survey suggest that, far from being anti-reform, Europeans actually want their leaders to act decisively in favour of growth. Marco Buti, Alessandro Turrini, and Paul van den Noord, Reform and be re-elected: Evidence from the postcrisis period, Vox, Centre for Economic Policy Research, July 2014. 267 McKinsey Global Institute A window of opportunity for Europe 199 . 87% of respondents in 8 countries would make trade-offs for higher social standards and incomes Europeans do not expect to live in a permanent state of economic underperformance and eroding social provision. The MGI survey offers new evidence that they are willing to make trade-offs to secure meaningful change, and it even suggests the broad parameters of reform that could win the hearts and minds of the European population. The majority in the survey did not opt for the status quo but for a new combination of improved health care, living environment, buying power, education, and public safety, and significant compromises to achieve that (expressed in the survey as working longer and harder or somewhat reducing social protection). Support for this combination is, as we have discussed, remarkably consistent across countries, ranging from 87 percent support in Germany to as high as 98 percent support in Spain (Exhibit 117). Exhibit 117 Appetite for change in Europe may be greater than often believed Share of respondents who prefer the average scenario over the status quo % (weighted) 98 96 Spain Poland 95 Italy 95 93 Romania Sweden 91 Europe 91 90 United France Kingdom 87 Germany Alignment on direction of change desired for each societal priority Share of respondents whose optimal scores for each dimension indicate the same direction of change as the European average scenario Direction of change Priority Degree of alignment1 Health care 95 Living environment 93 89 Education Buying power 84 Work-life balance2 84 Public safety 84 Social protection 58 1 Respondents who desire no change from the status quo for a given dimension are considered to be non-aligned with the direction of change. 2 Calculated as average of working hours and productivity scores from conjoint survey. SOURCE: MGI European Aspirations Conjoint Survey, August 2014; McKinsey Global Institute analysis 200 McKinsey Global Institute 4.
Europe can overcome barriers to action . ••• Europe has fundamental strengths on which to build. The question is how to use those strengths as a platform for a return to robust growth. There are solid grounds for optimism that a better European society is possible. Importantly, policy makers, business people, and civil society leaders should be emboldened by the fact that the solutions to Europe’s current underperformance do not need to be “imported” from the rest of the world; they are already in place elsewhere on the continent.
Europe can largely boost its competitiveness through action on the national level, obviating the need for complex decision making at the European level. MGI’s survey indicates that citizens are willing to make a contribution to Europe’s longterm recovery. There is a genuine opportunity for real change and a positive narrative for Europe, building on the continent's undoubted strengths and seizing the current window of opportunity created by the confluence of a number of positive trends observed in 2015. Now is the time for Europe’s leaders to shift focus from crisis management and towards framing a broad programme of supply-side and investment and job creation that can put Europe’s economy on a healthier footing for the long term. McKinsey Global Institute A window of opportunity for Europe 201 .
Chapter photo Appendix: Health care © Getty Images 202 McKinsey Global Institute 4. Europe can overcome barriers to action . APPENDIX This appendix provides details on the MGI survey, and the data sources and methodologies used in this report in the following sections: 1. The MGI European Aspirations Conjoint Survey 2. Growth scenarios and GDP growth impact sizing for competitiveness growth drivers 3. Investment-requirement sizing for competitiveness growth drivers 4. Aggregate impact sizing for investment and job creation options 1. The MGI European Aspirations Conjoint Survey Aim, scope, and overview of instruments and limitations The purpose of the MGI European Aspirations Conjoint Survey was to reach an understanding of Europeans’ aspirations regarding various societal outcomes underpinned by economic prosperity, as well as their own economic situation, for the coming decade. As such, the survey provides an empirical contribution to the ongoing debate about whether Europe has evolved into a “post-growth society” or whether there is still a desire for, and commitment to, elements of economic growth among European citizens. It also aims to understand whether citizens are prepared to personally contribute to such growth and make the kind of trade-offs that it involves. The survey, undertaken between August 13, 2014 and August 22, 2014, by SKIM of the Netherlands using online panels of Global Market Insite, covered eight European countries: France, Germany, Italy, Poland, Romania, Spain, Sweden, and the United Kingdom. Together, these countries make up about three-quarters of the Europe-30 population and represent the five European regions this report considers.
Two thousand people were included in the survey in each of the eight countries, giving a total sample of 16,000 people. A conjoint methodology was chosen as primary instrument to allow us to account for the trade-offs Europeans may have to make in order to achieve desired improvements, and to avoid establishing a “wish list” of priorities that does not properly take cost into account. The survey also comprised a number of regular polling questions that were asked after the conjoint was completed (listed below) in order to (1) deep-dive into important elements of the conjoint such as the willingness to work; (2) test further attributes and attitudes like current satisfaction levels; and (3) provide the socio-demographic background of respondents for sample weighting and analysis of results by demographic grouping. Like any field research, this survey had a number of limitations and biases. Details of these can be found in the following methodology sections. However, the largest limitations and biased we would note include (1) the fact that online polling creates a bias towards Internet users: (2) the use of professional panels, as well as drop-out rates during the survey, creates a certain self-selection bias; (3) cross-cultural differences; (4) the choice of conjoint variables limits trade-offs to the variables presented; (5) the use of qualitative description of attributes and levels in the conjoint presentation, in conjunction with the quantitative model lying in the background to balance scenarios in terms of cost and GDP impact, introduces a degree of subjectivity in how respondents interpret attribute descriptions and whether they perceive .
scenarios as balanced; (6) post-processing techniques and estimation of utility values can introduce additional bias from weighting and extrapolating partial responses; and (7) in this pure cross-sectional study, we gain no data with which to assess variations over time. Sampling and recruitment of participants We used professional online panels of individuals in each country who are rewarded for their participation in surveys. Within the panel population, the panel provider sought to obtain 2,000 respondents for each country, and sent out invitations to participate in random batches of approximately 200. The socioeconomic distribution of respondents after each batch was carefully monitored and the next batches geared towards randomly selected participants of underrepresented groups where needed. As the survey panels were recruited online, there may be a bias in the results towards individuals who are active Internet users. Fielding Respondents received an invite, along with a short description, via email.
The questionnaire itself was conducted online in a web browser. During the process, some respondents finished the survey, some stopped and later resumed, and some dropped out completely. Invitations were sent until 2,000 completed surveys were reached for each country. We saw very typical dropout rates for the survey.
By country, these were 20 percent in the United Kingdom, 19 percent in France, 14 percent in Germany, 12 percent in Italy, 11 percent in Poland, 13 percent in Romania, 10 percent in Spain, and 18 percent in Sweden. Country-specific adaptation and quality assurance The MGI survey covered eight different countries and as many languages, each with a distinct culture. As such, survey respondents may have interpreted the questions and attributes they were presented with in different ways. Any cross-country comparisons need to be interpreted in that context.
Score results observed in cross-cultural comparisons may have a different meaning than those derived from intercultural comparisons. The equivalence of concepts, and the similarity in meanings attached to a behaviour or concept, can vary significantly among cultures. Linguistic equivalence, the wording of items (in terms of form, meaning, and structure) can also vary across the different language versions of a document, including the reading complexity of the items presented, and how natural the text may sound to a native speaker.268 We used a professional translation firm to translate the survey from English into national languages and test semantic equivalence.
We also tested the survey translation with a native speaker per country who also spoke English and was familiar with the objective of the survey. Finally, we provided respondents with definitions of the terms and concepts used in each question to help moderate the impact of cross-cultural differences. The same conjoint design was used for all eight countries. Post-processing: RIM-weighting procedure The responses were weighted to match national distributions for each country individually, according to gender, age, income, education levels, employment (both status and occupation), country of birth, and household composition. Using demographic data obtained from Eurostat, deviations in the sample from the national average were measured. Using a technique called RIM weighting (Random Iterative Method, also known as raking), we applied weights to individual respondents to match demographic distributions.
For See Fons van de Vijver and Norbert K. Tanzer, “Bias and equivalence in cross-cultural assessment: An overview”, Revue européenne de psychologie appliquée, volume 54, issue 2, 2004, and StefaniÌa Ægisdóttir, Lawrence H. Gerstein, and Deniz Canel Çinarbas, “Methodological Issues in cross-cultural counseling research: Equivalence, bias, and translations”, The Counseling Psychologist, volume 36, March 2008. 268 204 McKinsey Global Institute Appendix .
example, if we surveyed more males than represented in the national population, we would adjust the weight of males downwards. Instrument 1: Conjoint—methodology, variables, attributes, and presentation of trade-offs We used a conjoint methodology to uncover the preferences of the respondents when faced with different scenarios, each consisting of a combination of outcomes for several interdependent dimensions or variables. Choice of variables The variables included in the conjoint were chosen to reflect on the one hand the dimensions that citizens typically value in their lives, and on the other hand the key drivers of (public) expenditure as well as, in turn, income generation. To capture what people value, we base the choice of variables on the OECD Better Life Index, a widely recognised instrument for grasping and comparing social progress and quality of life, as a starting point. Attributes from the OECD Better Life Index such as “civic engagement” and “life satisfaction” were, however, excluded from the conjoint as our focus was on attributes whose quality could clearly be linked to the availability of economic resources (such as public or private spending). For the same reason, we chose to consider “social protection” rather than the Better Life Index attribute “community”, and we disaggregated the attribute “work-life balance” into “working hours” and “productivity” in order to provide respondents with a more tangible understanding of what an improvement or sacrifice in this dimension would entail, and to be able to estimate economic impact. Correspondingly, we included the following eight variables in the conjoint scenarios, and provided the ensuing definitions to ensure that respondents had a clear and common understanding of these variables: ƒƒ Health care. The quality of health care involves, for example, longer life expectancy, higher quality of life, better technologies and treatments, and shorter waiting lists.
It also includes care for the elderly. ƒƒ Education. The quality of education relates to all types (primary, secondary and higher education). ƒƒ Living environment. Environment and public space involves protecting the environment (like forests and lakes) and the quality and appearance of public spaces (for example, parks, roads, and stations). ƒƒ Public safety.
Safety involves more police officers on the street, more prisons, and more traffic checks. It also includes national defence. ƒƒ Social protection. Social protection could involve the level of, and entitlement to, allowances in case of unemployment and/or disability.
This also includes welfare. ƒƒ Buying power. This refers to income from work and/or allowances and benefits effectively available to spend each month (after paying tax, social protection costs, and health-care premiums). ƒƒ Working hours. Work time refers to actually worked hours in a working week.
It does not include unpaid work, such as volunteer work. ƒƒ Productivity. Investment in productivity could include extra training, re-training, improved effort, and being more ambitious when looking for a job. McKinsey Global Institute A window of opportunity for Europe 205 . The overall number of variables was limited to eight to keep the complexity of the survey manageable. We would, of course, have liked to decompose buying power into typical personal expenditure items, fully cover all elements of public spending also including, for instance, general administration, or test each of the specific trade-offs involved in the 11 growth drivers described in our report (e.g., a later retirement age), but this would have led to unmanageable complexity of the conjoint scenarios. Choice of attribute levels To limit the cognitive load of respondents when considering scenarios, we used quantitative specifications of the levels only for two variables, namely disposable income due to its high weight in GDP and working hours as our key balancing variable. We used simpler standardized qualitative levels for the remaining six variables. For disposable income, the levels were 20 percent lower, 10 percent lower, the same, 10 percent higher, and 20 percent higher. For working hours, the levels were six hours less, three hours less, the same, three hours more, and six hours more per week.
For health care, education, the living environment, social protection, public safety, and productivity, the levels were much lower, lower, the same, higher, much higher. Balancing the conjoint scenarios in a GDP model To balance the scenarios and to assess the economic implications, we translated the levels described above into additional or reduced spending or income generation. We based this calculation on the current share of GDP of the eight variables in base case, using a GDPweighted average (2012) of the eight countries for each of the topics addressed in the survey (Exhibit A1). If one variable was improved in a scenario, other variables had to be reduced by collectively an equivalent monetary amount—or working hours or productivity had to increase to generate the equivalent higher income. Exhibit A1 Survey: GDP model Theme Description Europe-8 value1 Source Health care Cure and care; public and private expenditure (% of GDP) 10.22% World Bank Education Total expenditure (% of GDP) 6.03% Eurostat Living environment Total expenditure on environmental protection (% of GDP) 1.21% Eurostat Social security Public expenditure on social protection against the risks related to unemployment, sickness and disability, and old age (% of GDP) 15.16% Eurostat Public safety Public expenditure on defence, public order, and safety (% of GDP) 3.44% Eurostat Buying power Share of GDP not attributable to 46.83% government expenditure and not committed to private expenditure on health care, education, and environmental protection Eurostat 1 Does not sum to 100% as not all dimensions of non-disposable expenditure were considered. SOURCE: MGI European Aspirations Conjoint Survey, 2014; Eurostat; World Bank; McKinsey Global Institute analysis 206 McKinsey Global Institute Appendix .
We applied the following translations from scenario descriptions and attribute levels to spending: ƒƒ For disposable income, working hours, and productivity, we assumed increases or decreases of zero, 10, or 20 percent relative to the current level as a percentage of GDP. For disposable income, this corresponds exactly to the levels shown to respondents in the survey. For working hours, this corresponds roughly to the 3 or 6 hours more/less shown in the survey, slightly less to reflect declining marginal productivity of additional hours worked. For productivity, we chose the same changes as for hours worked, as productivity also directly affects the entire economy in terms of additional (or lower) output generated. ƒƒ For health care, we assumed an increase in spending even when respondents chose “the same” level due to increasing health care cost in line with demographics. We used the European Commission’s 2012 report on ageing as basis for this.269 “Much lower” health care was assumed to correspond to no increase in health-care expenditure, resulting in a negative effect of 42 percent due to GDP growth and ageing.
We assumed that “lower” corresponds to compensating for demographic shifts but not GDP growth; building on the European Commission’s “demographic scenario”, we arrive at a reduction of 29 percent of health care spend as share of GDP. Compensating for demographics plus the assumed growth in GDP yield “the same” quality of health care as today—entailing an increase of 8 percent of health care spend as a share of GDP. The “income elasticity” and the “non-demographic determinants” scenarios defined by the European Commission were used for “better” and “much better” health care, entailing increases in health care spend as a share of GDP of 28 and 39 percent, respectively. ƒƒ For education, the living environment, social protection, and public safety, we assumed that the options “much lower”, “lower”, “higher”, and “much higher” corresponded to a 50 percent and 100 percent decrease or increase in expenditure as a percentage of GDP, respectively (for example, current spending on education is about 6 percent of GDP and therefore “higher” spending would imply about an extra 3 percent of GDP). “The same” level for a given attribute implied a constant GDP share of spending.
We chose these large increments between options to ensure that the scenario choices would entail discernible trade-offs and therefore reveal respondents’ priorities. Exhibit A2 summarises the additional/lower cost or reduction/increase in available resources by variable and level. There is necessarily a degree of subjectivity involved in assigning quantitative spending values to qualitative levels. This caveat should be taken into account when interpreting the quantitative results of the conjoint analysis. The 2012 ageing report: Underlying assumptions and projection methodologies, European Commission, April 2011. 269 McKinsey Global Institute A window of opportunity for Europe 207 . Exhibit A2 Additional/reduced cost and lower/higher resources available by conjoint variable and level % of GDP, Europe 1 2 3 4 5 Health care -4.2 -2.9 0.8 2.8 4.0 Education -6.0 -3.0 0.0 3.0 6.0 Living environment -1.2 -0.6 0.0 0.6 1.2 -15.2 -7.6 0.0 7.6 15.2 Public safety -3.4 -1.7 0.0 1.7 3.4 Buying Power -10.2 -5.1 0.0 5.1 10.2 Working hours -20.0 -10.0 0.0 10.0 20.0 Productivity -20.0 -10.0 0.0 10.0 20.0 Social Security SOURCE: McKinsey Global Institute analysis Presentation of the conjoint scenarios The conjoint approach consisted of two stages—an introductory stage and the conjoint exercises or scenario choices. In the introductory stage, a respondent was able to build a personal ideal scenario using seven of the eight variables (excluding productivity) (Exhibit A3). This initial step of the survey gave respondents the opportunity to rank the variables and to express the intensity of their preference for one variable over another. A GDP model (described above) balanced the cost of the selected attributes by automatically increasing or decreasing working hours as much as needed to generate the additional economic resources. This exercise served two goals. First, it provided the respondent with a general understanding of the components and tradeoff principle of the conjoint.
Second, it also revealed whether there was a desire to improve spending on health care, education, the living environment, social protection, and safety, given the constraints on each individual’s buying power and free time. This also served as input for the second stage, the conjoint trade-offs (see explanation below). The second stage was the conjoint exercise during which each respondent was presented with ten sets of two alternative GDP-balanced scenarios at a time, and then asked to choose between them (Exhibit A4). The scenarios each specified a combination of variables at five different levels denoting spending and/or quality. The conjoint technique we used was a Partial Profile Conjoint.
In each trade-off exercise we randomly showed only four out of eight possible variables per scenario. The main reason for this approach is to prevent information overload, while still generating accurate outcomes thanks to our big samples. To ensure a more realistic and accurate trade-off exercise, the conjoint scenario choices were tailored to the preferences of individual respondents from the introductory stage. We picked the two themes for which the respondent indicated the strongest preference to spend more, and, for these themes, we did not show any of the lower—unfavourable—levels in the conjoint scenarios.
This adaptive phase increased the accuracy of our preference estimations (utilities) and prevented respondent fatigue and frustration. Each scenario 208 McKinsey Global Institute Appendix . shown is designed in such a way that it is roughly GDP-neutral so that respondents are offered realistic choices. Each respondent is shown ten sets of scenarios to trade off. Exhibit A3 Building an ideal personal scenario SOURCE: The MGI European Aspirations Conjoint Survey, 2014; McKinsey Global Institute analysis Exhibit A4 Choosing between scenarios SOURCE: The MGI European Aspirations Conjoint Survey, 2014; McKinsey Global Institute analysis McKinsey Global Institute A window of opportunity for Europe 209 . Estimating optimal and average scenarios We estimated the relative preferences each individual has for each of the eight attributes based on the choices each respondent made in the ten conjoint exercises presented. For example, if someone consistently chooses a scenario with much higher spend on education, then the estimated preference score for much higher education spend will be high. We applied a Hierarchical Bayes (HB) technique (using the industry standard Sawtooth software) to calculate these preferences or utility scores. The HB method enables relatively stable estimators of preferences at individual level, which allows analysis at subgroup level (unlike logit models or LC). HB is an iterative approach that seeks to optimize the utility scores for each individual and variable such that they best predict the actual choices a respondent makes in the conjoint exercises.
For example, assume a respondent chooses between scenario A and B, each containing four variables and levels, and he selects A. Then the HB method estimates utility scores so that the total estimated preference score—the sum of the estimated utility scores for the four variables and levels presented—is higher for scenario A than for scenario B. The HB method tries to estimate utility scores in order to maximize the instances where prediction and actual choice match across all scenario choices presented to a respondent. We estimated an average scenario by calculating the average of all respondent-level optimum scenarios.
Based on the GDP model, each possible GDP-balanced scenario was determined—in other words, all combinations of more or less education, social protection, working hours, etc., which matched economic spend and available resources. Note that these scenarios were full-profile and contained all eight variables and respective levels and not only four, which we had in the partial-profile conjoint exercises. Also note that for this processing step, we applied country-specific adaptations of the European shares of GDP listed in Exhibit A1, based on the same sources.
For all these full-profile scenarios we calculated the total preference score for each individual respondent as the sum of utilities of the associated levels. On this basis, we identified the most preferred balanced scenario per individual. For optimum scenarios per country, we chose the scenario that maximises total preference score for the entire sample of respondents. To determine a country-specific or European-average scenario, we took the average level of each variable among all the optimal scenarios of individual respondents.
For instance, if 50 percent of respondents had education “much higher”—translated for averaging to a numeric level 5 on a scale of 1 (much lower) to 5 (much higher)—as most preferred, and the other 50 percent had “higher” (level 4) as most preferred, then the average scenario was set to 4.5. In practice, the difference between optimum and average scenarios was small. Average scenarios have the advantage vis-à-vis optimum ones that we can determine more granular values in between the discrete choices of 1, 2, 3, 4, and 5 as in an optimum scenario. We calculated how many people preferred the country-specific average (or European average) scenario over the current status-quo scenario (nothing lower or higher) by calculating total preference scores for each respondent and comparing how many times the average scenario has a higher preference compared to status quo.
The level of preference was similar as for the optimum scenario. Based on the differing preferences amongst individuals (e.g., some people prefer higher education, whereas others opt for more income) we ran a cluster analysis to identify different segments of respondents. We tested several clustering techniques and applied a hybrid of SPSS Two-step and K-Means, which generated the most discriminating clusters. The inputs for the cluster algorithm were the respondent level optimal scenario levels for each of the eight attributes (e.g., one respondent could have had health care at level 4, education at level 5, etc., and another respondent could have had health care at level 2 and education at level 210 McKinsey Global Institute Appendix .
4). The cluster algorithm then looked for groups of people with very similar optimal scenarios whereas between different groups the typical scenarios were truly different. Instrument 2: Traditional survey questions Besides the conjoint exercises, the survey also posed a number of other questions. The goals of asking further survey questions were to obtain socio-demographic profiling information and deepen our understanding of respondents’ values and attitudes as well as their more specific preferences regarding some of the issues raised by the conjoint exercises. Not all respondents received all of the additional questions; they were randomly assigned a selection, except for the socio-demographic profiling. In this report, we evaluate only a few aspects most related to the conjoint trade-offs, but list the full set of questions for reference. Socio-demographic profiling: ƒƒ Are you…? Female or male. ƒƒ How old are you? Under 15, 15–19, 20–24, 25–29, 30–34, 35–39, 40–44, 45–49, 50–54, 55–59, 60–64, 65–69, or 70 years or older. ƒƒ What is the highest level of education you have successfully completed? Preprimary, primary, and lower secondary education (ISCED 0–2), upper secondary and post-secondary non-tertiary education (ISCED 3–4), or first and second stage of tertiary education (ISCED 5–6). ƒƒ Which of the following situations is most applicable to you? I am self-employed, I am employed (not by the government), I am employed (by the government), I am occupationally disabled, I am unemployed and looking for work or on social welfare, I am in early retirement, I am retired or am a renter, I am a student or go to school, I am a housewife or househusband, I work as a volunteer, or other. ƒƒ In which sector do you work? Agriculture, forestry and fishery, mineral mining, industry, energy, water companies and waste management, construction sector, trade, transport and storage, hospitality, information and communication, financial services, real-estate letting and sales, special commercial services, letting and other commercial services, public administration and government services, education, health and welfare, culture, sport and well-being, other services, household, extraterritorial organisations, or other. ƒƒ For how many hours a week are you contracted? Full-time, part-time, varies, I do not have a fixed contract, or none of the above. ƒƒ On average, how many hours a week do you spend on your work? (This question was followed by a free text box). ƒƒ Where were you and your parents born? You, your mother, your father (these questions were followed by drop-down boxes of country names). ƒƒ What is your net monthly income? £799, £800 to £1,099, £1,100 to £1,499, £1,500 to £1,999, £2,000, prefer not to say, or don’t know (UK survey example shown only). ƒƒ What is the composition of your household? Single without children living at home, single with children living at home, co-habiting/married without children living at home, co-habiting/married with children living at home, living at home with parents/family, residential group/student house, or other. McKinsey Global Institute A window of opportunity for Europe 211 .
Further attitudes and level of satisfaction ƒƒ How would you describe [country] society today? Please select from the following characteristics (maximum three: individualistic, shows solidarity, assertive, humble, entrepreneurial, risk-averse, rewarding of risk-taking, conservative, well-behaved, progressive, values individual responsibility, social, rewarding of performance, values equality, respect for authority, nationally orientated, internationally orientated, tolerant, strives for the best, satisfied with just having enough, and values personal freedom. ƒƒ What would you like [country] society to be like in ten years’ time? Please select from the following characteristics (maximum three): individualistic, shows solidarity, assertive, humble, entrepreneurial, risk-averse, rewarding of risk-taking, conservative, well-behaved, progressive, values individual responsibility, social, rewarding of performance, values equality, respect for authority, nationally orientated, internationally orientated, tolerant, strives for the best, satisfied with just having enough, and values personal freedom. ƒƒ In which three areas do you think [country] should stand out? Choose from the following areas (maximum three): poverty reduction, European integration, behaviour of decision makers, health care, green living environment, infrastructure and accessibility, income equality, innovation, integration of immigrants, dealing with climate change, arts and culture, treatment of foreign workers, manners and morality, entrepreneurial climate, education, development aid, level and certainty of pensions, recreational facilities, social protection, sports facilities, safety, employment, availability of housing, healthy government finances, democracy, the justice system, economic growth, and other. ƒƒ Which areas are you most concerned about when you think about [country]? Choose from the following areas (maximum three): poverty reduction, European integration, behaviour of decision makers, health care, green living environment, infrastructure and accessibility, income equality, innovation, integration of immigrants, dealing with climate change, arts and culture, treatment of foreign workers, manners and morality, entrepreneurial climate, education, development aid, level and certainty of pensions, recreational facilities, social protection, sports facilities, safety, employment, availability of housing, healthy government finances, democracy, the justice system, economic growth, and other. ƒƒ All in all, how happy have you felt lately? Very unhappy, unhappy, neutral, happy, or very happy. ƒƒ How happy are you with [country]? Very unhappy, unhappy, neutral, happy, or very happy. ƒƒ How happy do you expect the next generation will be with [country]? Very unhappy, unhappy, neutral, happy, or very happy. ƒƒ To what extent are you interested in politics? Very uninterested, uninterested, interested, and very interested. ƒƒ To what extent do you follow national political news in the media? Not at all, rarely, in general, intensively, and very intensively. 212 McKinsey Global Institute Appendix . Details on the conjoint trade-offs regarding working hours and productivity ƒƒ Imagine you had to work more. How would you prefer to do this? Rank the following aspects, where 1 indicates you would prefer it most. If this situation does not apply to you, do your best to put yourself in the situation: If I have to work longer, I would prefer to retire at a later age, work more hours a week, or sacrifice holidays. ƒƒ Imagine you can work as many hours a week as you like and your net income increases accordingly; what is the maximum number of hours you would work in this case? You can enter a number between 0 and 100. (This question was followed by a free text box). ƒƒ To what extent do you think a person’s salary in [country] should reflect their performance? A lot less than now, less than now, the same as now, more than now, or a lot more than now. ƒƒ To what extent are you prepared to accept a performance-based salary? I already have one, I am prepared to make my whole salary performance-based, I am prepared to make part of my salary performance-based, or I am not prepared to do so. ƒƒ Would you be prepared to work more hours a week if working times were more flexible? No, yes (up to two extra hours), yes (up to four extra hours, yes (up to six extra hours), yes (up to eight extra hours), yes (up to ten extra hours), or yes (more than ten extra hours). Testing further trade-offs related to the conjoint analysis (not used in analyses, but listed here for reference) ƒƒ Which statement do you agree with most when considering [country] in ten years’ time? I want to pay more taxes so that government can perform more tasks than it currently does, I want to pay the same amount of taxes so that government can perform the same tasks as it currently does, or I want to pay less taxes so that government performs fewer tasks than it currently does. ƒƒ If you think about [country] in ten years’ time and have to choose from the following scenarios, which scenario would you favour most (or oppose least)? If a situation does not apply to you, do your best to put yourself in the situation in question: Slower growth in welfare and lower purchasing power, and I receive more holidays each year, or faster growth in wellbeing and higher purchasing power, and I receive fewer holidays each year. ƒƒ If you think about [country] in ten years’ time and have to choose from the following scenarios, which scenario would you favour most (or oppose least)? If a situation does not apply to you, do your best to put yourself in the situation in question: Slower growth in welfare and lower purchasing power… and I have more free time, or faster growth in wellbeing and higher purchasing power…and I work more hours a week. ƒƒ If you think about [country] in ten years’ time and have to choose from the following scenarios, which scenario would you favour most (or oppose least)? If a situation does not apply to you, do your best to put yourself in the situation in question: Slower growth in welfare and lower purchasing power, and my retirement age decreases, or faster growth in wellbeing and higher purchasing power, and my retirement age increases. McKinsey Global Institute A window of opportunity for Europe 213 .
ƒƒ If you think about [country] in ten years’ time and have to choose from the following scenarios, which scenario would you favour most (or oppose least)? If a situation does not apply to you, do your best to put yourself in the situation in question: Slower growth in welfare and lower purchasing power, and women work more part-time, or faster growth in wellbeing and higher purchasing power, and women work more full-time. ƒƒ If you think about [country] in ten years’ time and have to choose from the following scenarios, which scenario would you favour most (or oppose least)? If a situation does not apply to you, do your best to put yourself in the situation in question: Slower growth in welfare and lower purchasing power, and people over 55 stop working before reaching the retirement age more often, or faster growth in wellbeing and higher purchasing power, and more people over 55 work up to the retirement age. ƒƒ If you think about [country] in ten years’ time, and have to choose from the scenarios below, which scenario would you favour most (or oppose least)? If a situation does not apply to you, do your best to put yourself in the situation in question: More immigrants and a higher disposable income, or fewer immigrants and a lower disposable income. ƒƒ If you think about [country] in ten years’ time, and have to choose from the scenarios below, which scenario would you favour most (or oppose least)? If a situation does not apply to you, do your best to put yourself in the situation in question: More qualified/educated immigrants and a higher disposable income, or fewer qualified/educated immigrants and a higher disposable income. ƒƒ If you think about [country] in ten years’ time, and have to choose from the scenarios below, which scenario would you favour most (or oppose least)? If a situation does not apply to you, do your best to put yourself in the situation in question: It is easier for me to find a job, and the minimum wage is reduced, or it is more difficult for me to find a job, and the minimum wage is increased. ƒƒ If you think about [country] in ten years’ time, and have to choose from the scenarios below, which scenario would you favour most (or oppose least)? If a situation does not apply to you, do your best to put yourself in the situation in question: It is easier for me to find a job, and I do not automatically receive annual wage increases, or it is more difficult for me to find a job, and I automatically receive annual wage increases. ƒƒ If you think about [country] in ten years’ time, and have to choose from the scenarios below, which scenario would you favour most (or oppose least)? If a situation does not apply to you, do your best to put yourself in the situation in question: My disposable income decreases, and I have more job security, or my disposable income increases, and I have less job security. ƒƒ If you think about [country] in ten years’ time, and have to choose from the scenarios below, which scenario would you favour most (or oppose least)? If a situation does not apply to you, do your best to put yourself in the situation in question: My disposable income decreases, and I invest less time and/or money in my training, or my disposable income increases, and I invest more time and/or money in my training. 214 McKinsey Global Institute Appendix . ƒƒ If you think about [country] in ten years’ time, and have to choose from the scenarios below, which scenario would you favour most (or oppose least)? If a situation does not apply to you, do your best to put yourself in the situation in question: My disposable income decreases, and I work longer for the same employer, or my disposable income increases, and I change jobs more often. ƒƒ If you think about [country] in ten years’ time, and have to choose from the scenarios below, which scenario would you favour most (or oppose least)? If a situation does not apply to you, do your best to put yourself in the situation in question: My disposable income decreases, and I do not have to relocate for a better job, or my disposable income increases, and I have to relocate for a better job. ƒƒ For which of the goals below are you prepared to work two extra hours per week, work an extra two years, have four days less holiday, or have 10 percent less disposable income?270 Longer parental leave, better elderly care, a more comprehensive health-insurance package, more opportunities for personal development, better education, a cleaner environment, a higher pension, more police on the street, higher benefits for people who are unemployed, suffer from a disability or rely on social welfare, higher disposable income, or none of the above. ƒƒ The government makes a financial contribution in various situations. Indicate which of these situations you would prioritise. Rank the following situations, where one indicates your highest priority. If this situation does not apply to you, do your best to put yourself in the situation: Having children (e.g., child support), becoming unemployed (e.g., unemployment benefits/welfare), suffering from a disability (e.g., disability benefits), ageing (e.g., retirement and pensions), death of a working partner, or becoming ill (e.g., health/medical insurance). 2.
Growth scenarios and GDP-growth impact sizing for competitiveness growth drivers Growth scenarios External forecasts The Economist Intelligence Unit, IHS, and the Conference Board all provide country-level GDP-growth forecasts up to 2025. We calculated the simple average of these three external benchmarks for each country, and calculated a GDP-weighted average to arrive at the Europe-30 level forecast figure. To disaggregate the real GDP-growth figure into the two drivers of labour and productivity, we used the United Nations Population Division forecast of the change in the workingage population between 2013 and 2025 and assumed this is equal to the change in the labour component. The labour productivity-growth rate up to 2025 was then calculated by subtracting the labour growth number from the real GDP-growth number. 2015 growth The early 2015 European Commission forecast predicts real GDP growth of approximately 1.8 percent across the EU.
For the so-called “boom factors”, we used a number of methods to estimate the impact of various trends on GDP growth. For lower oil prices, we assessed the impact of a relative shift in imports and exports after multipliers of petroleum-related products across the European economy, and cross-referenced this with academic benchmarks to obtain an estimated range of 0.3 to 1.0 percent impact on real GDP across Europe. The impact of a depreciated euro and QE are likely to be interrelated.
Taking this Respondents were offered one of these four options at random. Options 1 to 3 would be offered only if the respondent was currently in employment. 270 McKinsey Global Institute A window of opportunity for Europe 215 . into consideration, we based our estimate on an early 2015 European Commission estimate of the impact on real GDP across the Eurozone. We assumed a conservative mediumterm decrease in the euro’s nominal effective exchange rate of 10 percent and applied our sizing of the impact across Europe. This exercise gave us a estimate of around 0.3 percent of GDP. For the impact of QE, we assessed the post-multiplier impact of ECB remittances from sovereign bond purchases, using a GDP-weighted interest rate across the Eurozone countries.
This resulted in an estimated impact on real GDP of up to 0.2 percent, assuming the ECB front-loads its QE programme in 2015. We assumed a GDP-weighted bond rate of between 1.3 and 2.2 percent. Official forecast The European Commission provides a projection of real GDP growth for the EU, as well as for productivity per hour and the number of hours worked, up to 2025. It expects productivity to grow at 1.4 percent annually and the number of hours worked to grow by 0.1 percentage points.
For Norway and Switzerland, we assumed the same growth trends hold as for the EU. The European Commission expects the EU population to increase up to 2042, due to convergence of fertility rates across the member states and increasing life expectancy for both men and women. However, the working-age population is expected to decline, dropping by 14 percent by 2060 from its 2012 peak, implying there will be a larger number of persons aged 65 and older. The participation rate in EU-27 is projected to increase by 3.2 percentage points between 2010 and 2060, reaching a level of 78.8 percentage points in 2060.
Employment rates in the EU are assumed to converge to structural unemployment rates, and in EU-27 this rate is expected to decline by 3.2 percentage points from 2010 to 2060. Finally, while the total number of hours worked is set to increase in the short run, it is expected to decline overall by 2060, due to a rising share of part-time workers.271 Catching up with best-practice scenario In this scenario all Europe-30 countries are assumed to close 50 percent of the gap between their 2012 labour and labour productivity performance levels and the respective top-quartile performance seen in Europe-30 in the period from 2007 to 2012. We measured performance in labour as the number of employees as a share of workingage population and in labour productivity by the amount of GDP generated by an employee in the respective country. The top-quartile performance for labour-force participation is a rate of 0.71 employees per working-age population and for labour productivity $96,000 of GDP (2005 dollars) per employee.
If the 2012 performance of a country on a metric is not top quartile, we assumed that, by 2025, 50 percent of the gap would be closed. If a country is already in the top quartile for labour, we assumed that the level remains constant, and if a country’s performance on labour productivity is already in the top quartile, we assumed annual growth of 1.4 percentage points to 2025 in line with the long-term average of productivity growth. We then calculated the GDP impact by multiplying the 2025 projected percentage of labourforce activation and the expected size of the working-age population, as projected by the United Nations, to arrive at an expectation of the number of employees, which we then multiplied by projected labour productivity. The 2012 ageing report: Economic and budgetary projections for the 27 EU member states (2010–2060), European Commission, 2012 271 216 McKinsey Global Institute Appendix . Realising impact from growth drivers 1. Nurturing ecosystem for innovation If the richest 15 European countries were to take action to increase innovation—measured by R&D expenditure—to current levels observed in the United States and South Korea, we estimate that overall European GDP growth could be accelerated by up to 0.26 percentage points. This estimate is based on historic correlations between R&D expenditure and total factor productivity growth. For the 15 richest Europe-30 countries, the average annual R&D spending in 1995 to 2012 and the average annual total factor productivity growth over the same period are correlated with a correlation coefficient of 0.6 (R²: 0.34); the correlation coefficient for the 15 poorer countries is zero.
Since the correlation was zero for the poorer 15 countries over the past two decades, no impact has been estimated for these countries. In the longer run, however, reliance on innovation will increase even in these parts of Europe. 2. Effective education to employment If European countries were to take action to improve mechanisms between education and employment, this could increase overall European GDP growth by 0.24 percentage points. The impact assessment is the cumulative effect of increasing the tertiary graduate share, reducing vertical mismatch, and reducing the share of the population not in employment, education, or training (NEETs). The tertiary graduate share is projected to increase to 41.4 percent (EU 2020 target) from the current share of 37.0 percent.
This increase was multiplied by 0.35, the elasticity of productivity from tertiary education.272 This was, in turn, multiplied by 0.87, the cross-country correlation between total factor productivity and GDP growth. Regarding the vertical mismatch, we assumed that European countries close half the gap to the average vertical mismatch of the five best-practice countries and multiply this reduction by country-specific estimates of the short-term effect of a 1 percent decrease in vertical mismatch on the change in per capita GDP.273 The impact of a reduction of NEETs was calculated by assuming that all Europe-30 countries reach their country-specific EU 2020 targets, and then multiplying the change in the number of NEETs by country-specific resource costs per NEET.274 3. Productive infrastructure investment The impact of additional infrastructure spending was assessed for a scenario in which the Europe-30 increased infrastructure spending by 0.9 percent of GDP per year (from 2.6 percent in 2002 to 2011 to 3.5 percent for the next decade), the additional amount that our analysis suggests would be required in order to support an overall GDP-growth rate of 2.5 percent per year.
With an assumed rate of return of 20 percent on additional infrastructure stock, real GDP growth will increase by 0.14 percent on an annualised basis. Our estimate did not assume any additional growth impact from improved infrastructure productivity nor demand side effects. 4. Reduced energy burden The impact of the reduced energy burden growth driver is based on two primary components: improved energy efficiency, and liberalised gas and electricity markets. For the improved energy-efficiency component, a range of energy-use scenarios sourced from the European Commission, the International Energy Agency, and other academic literature were analysed to give a baseline view on the incremental improvements to energy efficiency possible over ten years, and the corresponding annualised impact on GDP growth.
The incremental annual GDP growth from this component was determined to be 0.05 percent. For the second component, liberalising gas and electricity markets, the incremental Dawn Holland et al., The relationship between graduates and growth across countries, Bank for International Settlements research paper number 110, August 2013. 273 António Morgado et al., Measuring labour mismatch in Europe, CEFAGE-UE working paper number 2014/13, Center for Advanced Studies in Management and Economics, Universidade de Évora, 2014. . 274 Based on NEETS. See Massimiliano Mascherini et al., NEETS: Young people not in employment, education or training: Characteristics, costs and policy responses in Europe, Eurofound, October 2012. 272 McKinsey Global Institute A window of opportunity for Europe 217 .
annual GDP impact, estimated at 0.08 percent, was taken from an EAVA (European Added Value Unit) report.275 Combined, this gives an annual GDP impact of .13 percent for this growth driver. 5. Supporting urban development In aggregate, supporting urban development could boost overall European GDP growth by 0.09 percentage points. The impact of accelerated urbanisation was calculated by comparing a scenario in which all Europe-30 countries improve their urbanisation rate at the rate of the fastest-urbanising country in the period from 2000 to 2012 to a baseline scenario where urbanisation is assumed to grow at the same rate as in the 2000 to 2012 period in all countries. The economic benefit stems from the additional number of urban employees compared with the baseline scenario for each country, multiplied by country-specific productivity gaps between urban and rural employees. Historical urbanisation growth rates as well as forecasts of overall population size are based on data provided by the United Nations.
We calculated the productivity gap between urban and rural workers using data from MGI’s Cityscope 2.55 and Eurostat, assuming that the distribution of the working-age population between urban and rural areas is similar to the distribution of the overall population. For both urban and rural workers, we assumed that productivity grows at a rate of 1.4 percent per year, in line with the long-term historical average. 6. Competitive and integrated markets in services and digital The potential impact of further deepening the Single Market and boosting competition in the service sector, was projected to be up to 0.43 percentage points.
According to the European Commission, if all countries implemented the Services Directive to the level of the five best-performing countries per sector, this could add 0.14 percent to annual GDP growth between 2015 and 2025.276 Adopting best practice in competition and market integration for the regulated professions and other local service sectors could add a further 0.29 percent in annual growth. Creating a truly integrated European digital market could boost annual GDP growth by 0.4 percent, according to estimates by the European Parliamentary Research Service.277 We did not include this estimate in our overall estimate, however, because considerable uncertainty is associated with the digital economy. In transport, the direct impact is projected to be lower, with most gains from the creation of an integrated transport network coming from its enabling effect on productivity growth in other areas.
Since these gains are not quantified, we believe that our overall estimate for growth generated from this growth driver is conservative. 7. Public-sector productivity The potential impact of initiatives to improve public-sector productivity was calculated by assessing the extent to which different areas of public-sector consumption and investment are amenable to competition-like mechanisms, and by applying the long-term average productivity-growth rate of the private sector (1.4 percent per year) to a corresponding share of the spending on these areas. We assumed that 41 percent of total government final expenditure is amenable to competition-like mechanisms (41 percent represents the share of compensation in public-sector final expenditure).
Since Europe-30 total publicsector final consumption in 2012 equals 26.4 percent of GDP, this implies that 10.7 percent of Europe-30 2012 GDP can benefit from acceleration in productivity growth to 1.4 percent Micaela Del Monte, Cost of non-Europe in the Single Market for energy, European Added Value Unit, European Parliamentary Research Service, June 2013. 276 Josefa Monteagudo, Aleksander Rutkowski, and Dimitri Lorenzani, The economic impact of the Services Directive: A first assessment following implementation, European Commission economic paper number 456, June 2012. 277 Joseph Dunne, Mapping the costs of non-Europe, 2014–19, European Parliament, March 2014. 275 218 McKinsey Global Institute Appendix . per annum from the current rate of approximately zero percent per annum. This results in incremental real GDP growth of 0.15 percent annually. 8. Further openness to trade The impact from this growth driver is assessed as the benefit the Europe-30 could achieve as by setting up trade agreements with the United States, China, and India. The European Commission estimates a benefit of $119 billion for the EU resulting from the realisation of the Transatlantic Trade and Investment Partnership with the United States.
This would be equivalent to incremental GDP growth of 0.05 percentage points in the EU in the period to 2025. Using export volumes in 2012 to China and India, respectively, as a ratio of Europe’s 2012 exports to the United States, we extrapolated the potential benefit for China and India. In total, establishing trade agreements with all three countries yields a projected increase in Europe’s annual real GDP of 0.08 percentage points to 2025. 9. Grey and female labour-force participation Improved grey and female labour-force participation could add 0.39 percentage points to Europe’s overall GDP-growth rate.
The impact of improved grey and female labour-force participation was assessed by comparing a scenario in which all Europe-30 countries increased participation rates to 2013 best-practice levels in Europe to a base-case scenario in which rates grow in line with historical experience from countries that have developed from similar participation rates as the European averages of 2013. For female participation (25 to 54 years old), the 2013 best-practice level of male participation is found in Slovenia, translating into a general female participation rate of 89 percent in 2015 compared with 79 percent today. For grey participation (55 to 74 years old), the 2013 best-practice level of the participation rate of the 25 to 54 age group is found in Hungary, translating to a general grey participation rate of 49 percent in 2015 compared with 35 percent today.
The impact estimate was based purely on increased activity rates, keeping employment rates, average weekly hours worked, and productivity constant. 10. Pro-growth immigration Strengthening pro-growth immigration systems could boost overall European GDP growth by 0.26 percentage points. In order to stabilise the prime working-age population over the next decade exclusively through increased immigration, 11.2 million additional immigrants to the continent would be required.
We assumed that these additional incoming immigrants would have a participation rate of 72.2 percent, an employment rate of 90 percent, and output per worker equal to that of the native population. 11. Enhanced labour-market flexibility Reforming Europe’s labour markets could increase GDP growth between 0.1 and 0.2 percent a year. The IMF and the ECB estimate that growth would increase by 0.1 percent per year if Europe were to close half of the gap with the respective “best-in-class” OECD countries in terms of looser employment protection legislation, moderate unemployment benefits, and more assertive active labour-market policies.278 Of this total, 0.04 percent would come from each of employment protection legislation and unemployment benefits, and 0.01 percent from active labour-market policies.
Other estimates point towards a higher impact from labour-market flexibility. The OECD has estimated that a one percentage point reduction in the employment protection legislation score could result in a 0.3 percent The assumptions behind this calculation are as follows: reduction of half the gap on employment protection legislation to the average of the three lowest levels in the OECD (Canada, the United Kingdom, and the United States); reduction in half of the gap in the average replacement rate of unemployment benefits relative to the average within a set of countries with low replacement rates (Australia, Canada, Japan, New Zealand, the United Kingdom, and the United States); increase in the ratio of spending on active labour-market policies relative to six OECD countries with high spending (Austria, Denmark, the Netherlands, Norway, Sweden, and Switzerland). We assume that 80 percent of the long-term potential (to 2060) is realised by 2025.
See Derek Anderson et al., “Assessing the gains from structural reforms for jobs and growth”, in Jobs and growth: Supporting the European recovery Martin Schindler et al., eds., IMF, 2014. 278 McKinsey Global Institute A window of opportunity for Europe 219 . productivity increase.279 This would imply an impact on growth of between 0.1 and 0.2 percent for the same change in employment protection legislation. 3. Investment-requirement sizing for competitiveness growth drivers In this section, we detail the sources and methodologies used for calculating the costs of some of the growth drivers discussed in Chapter 3. Nurturing ecosystem for innovation Data on GDP and the proportion of GDP spent on R&D were taken from Eurostat. Each country was benchmarked to a best-practice country on combined private- and public-sector research spending. The upper-bound benchmark is South Korea, which spends 3.6 percent of GDP on R&D. The lower bound is the United States, which spends 2.7 percent of GDP on R&D.
If each country were to increase its R&D to meet the benchmarks, an increase in spending on R&D of 0.6 to 1.6 percent of EU GDP would be required. Because data were available only for the share of GDP going to R&D until 2012, where we discuss R&D as a share of GDP, we used 2012 figures. Where values are expressed in euros, the share applies to 2014 GDP. Effective education to employment Data on average spending on education as a proportion of GDP were taken from Eurostat.
We used a weighted average of the top-scoring countries on the education-toemployment index discussed in Chapter 3, corrected for the size of the student population in each country.280 For those countries whose z-score is greater than zero, the average is 5.6 percent of GDP. For those with z-scores greater than 0.5, the average is 6.1 percent of GDP. Raising all countries’ spending on education to the best-practice average (corrected for the relative proportion of students by country) would require an increase in expenditure equal to 0.4 to 0.7 percent of EU GDP. Supporting urban development Data on the burden of replacing housing in Europe to meet minimum standards were taken from A blueprint for addressing the global affordable housing challenge, McKinsey Global Institute, October 2014.
This research estimated the cost in 2012 of replacing all substandard housing units and the incremental cost of providing housing for new residents by 2025. Spread over the period from 2012 to 2025, this would require 0.4 to 0.5 percent of GDP to be invested in improving the housing stock. Productive infrastructure and energy We calculated the level of infrastructure investment required to support future growth using projections of GDP growth. Controlling for asset depreciation, we assumed that countries sustain a stock of infrastructure equivalent to 70 percent of GDP, in line with global averages. Using this rule indicates that between 2.9 and 3.5 percent of future GDP would need to be spent on infrastructure (including power infrastructure) to cover depreciation and keep pace with growth.
The GDP-weighted average of historical investment stands at 2.6 percent of GDP based on data from Eurostat. This indicates a spending gap of 0.3 to 0.9 percent. The 2012 labour market reform in Spain: A preliminary assessment, OECD, December 2013. The index aggregates each country’s average PISA score, preschool enrolment rate, population in tertiary education, and research publications. 279 280 220 McKinsey Global Institute Appendix . 4. Aggregate impact sizing for investment and job creation options In this section, we discuss our estimates for the size of the impact from different options. We used annual corporate gross capital formation and GDP data from AMECO for the EU-28 plus Norway and Switzerland. Data were not available for Bulgaria, Croatia, Ireland, Luxembourg, or Romania. We found that the average ratio of corporate gross capital formation over GDP was 12.1 percent between 1998 and 2008, compared with 10.5 percent in 2015.
This gap, applied to the GDP of the 30 European countries, gives a total corporate investment gap of €227 billion in 2014 at current market prices. Maximise spending within the Fiscal Compact We took data on annual deficits, GDP, and debt levels at market prices from AMECO. Countries that are not bound by the requirements of the Stability and Growth Pact were excluded. For each country, we calculated the gap between deficits forecast for 2014 and the deficit limit. Where there was a gap—and therefore capacity for additional spending— we calculated this for 2014.
In cases where countries had exceeded their deficit limits, we assumed that they were already reaching their medium-term budgetary objective set by the European Commission as fast as appropriate and that no further adjustment was possible. We made a separate calculation for the capacity for additional spending by Germany, the only country whose deficit stands below the limit but whose debt reduction obligation allows additional capacity. Based on a 2013 debt-to-GDP ratio, we calculated a target for the debt-to-GDP ratio for 2014 following the rule that 1/20th of the gap to the 60 percent target must be closed. We then compared the target with the forecast 2014 debt level.
The gap between this forecast and the target represented the additional capacity of 1.3 percent of GDP in 2014. In euros, the total gap across all countries equals €47.8 billion. Applying fiscal multipliers for each country (as discussed in the section on fiscal multipliers) results in an impact on demand of €15 billion to €49 billion. Match the US post-crisis fiscal impulse We calculated the structural fiscal impulse using International Monetary Fund data on deficits as a percentage of GDP for the EU-28 and the United States.
The fiscal impulse is the previous year’s budget deficit minus the current year’s deficit. The largest gap in the period from 2008 to 2014 between these two regions was 2.2 percentage points in 2010, when the United States increased its deficit by 1.9 percentage points while the EU reduced its deficit by 0.3 percentage points. The average size of the gap was 0.2 percentage points. The United States had a larger impulse than the EU from 2008 to 2010 and a smaller impulse from 2011 to 2014. We modelled the effect in 2014 of an increase in the budget deficit of 0.2 percentage points and 1.9 percentage points, from the above, to simulate the impact of a strong fiscal impulse. Assuming the lower impulse of 0.2 percentage points and applying the lower-bound estimate of fiscal multipliers, we estimated that the impact on demand is €18 billion. Assuming a larger impulse of 2.2 percentage points and applying the upper bound of fiscal multipliers, we estimated an impact of €440 billion (to two significant figures) but acknowledge that this calculation is less accurate and is probably an overestimate.
This is because the size of the impulse is large relative to the size of the output gap, so the fiscal multiplier is likely to change significantly as a result of the impulse. McKinsey Global Institute A window of opportunity for Europe 221 . Introduce partial debt mutualisation We took data on the actual borrowing requirement and interest rates in 2013 from the ECB as borrowing requirements for 2014 were not available at the time of writing.281 We excluded countries that do not use the euro as their currency. We used an average of the long-term interest rates on representative EMU convergence criteria bonds over the year as a representative borrowing rate.282 Based on a review of external estimates, we estimated that the rate for a mutualised Eurobond was 10 basis points to 60 basis points above the German bund.283 This rate of 1.67 to 2.17 percent on average in 2013 was then applied to the total borrowing requirement. This resulted in a total net annual saving on borrowing in 2013 of between €6.4 billion and €8.5 billion. These savings would occur for each year of the maturity of the bond issue. Data on the specific maturities of bonds issued were not available across the Eurozone.
Assuming an average maturity of ten years, the total saving on the first year’s issuance would be €64 billion to €85 billion. It would also be possible to borrow more at new rates to repay or purchase old bonds, potentially allowing greater savings. We note, however, that not all countries would choose to use these savings to finance additional spending; some countries would opt to reduce deficits instead. Expand the fiscal transfer schemes between countries We took data on unemployment, GDP, population, and median income from AMECO in current prices.
We modelled a programme in which each country received payment for each unemployed citizen equal to between 50 and 70 percent of the national median wage. We assumed that the cost of this programme is paid in proportion to the current contribution made by each country to the EU (including traditional own resources) published by the European Commission. The net effect on each country is multiplied by a range of fiscal multipliers and added up.
The net effect including multipliers lies between €38 billion and €56 billion. Improve access to finance Data on access to finance were taken from the SAFE survey carried out by the ECB using first-half 2014 figures. The potential for improvement in each of four categories of company size was calculated between the overall data relative to Germany’s scores, which we took to be best practice.284 The difference between the two was weighted by the percentage of the workforce in each category of firm. We assumed that the resulting gap of 3.4 percent is the share of the investment gap addressable through financing.
This gap was multiplied by an estimated one-year multiplier for corporate investment spending between 0.8 and 2.9 based on economic modelling of a similar effect in the United States. The final effect on output in Europe is between €6.2 billion and €22.6 billion. The amount each country borrowed in a year, which can differ from the deficit when, for example, the government sells or purchases assets. 282 As defined by the ECB, a bundle of bonds with maturities of roughly ten years. 283 See Sergio Mayordomo, Juan Ignacio Peña, and Eduardo S. Schwartz, Towards a common European Monetary Union risk free rate, NBER working paper number 15353, September 2009; Green paper on the feasibility of introducing stability bonds, European Commission, November 2011; Christian Aßmann and Jens Boysen-Hogrefe, Determinants of government bond spreads in the Euro area—in good times as in bad, Kiel working paper number 1548, September 2009; Patrick Artus, The effect of debt mutualisation in the euro zone would be more complex than what is usually claimed, Natixis economic research, number 560, August 2013; Carlo Favero and Alessandro Missale, Sovereign spreads in the euro area: Which prospects for a Eurobond? presented at an Economic Policy panel meeting in Warsaw, October 27–28, 2011; Séverine Menguy, “Can Eurobonds save the euro?” in States, banks and the financing of the economy: Monetary policy and regulatory perspective, Morten Balling, Ernest Gnan, and Patricia Jackson, eds., SUERF, 2013; Sylvester C.
W. Eijffinger, “Eurobonds—concepts and implications”, in Eurobonds: Concepts and implications: Compilation of notes for the monetary dialogue of March 2011, European Parliament, March 2011; Rien Wagenvoort and Sanne Zwart, Uncovering the common risk free rate in the European Monetary Union, European Investment Bank economic and financial report number 2010/05, September 2010. 284 Large companies are those with 250 employees or more; medium are those with 50 to 249 employees; small are those with ten to 49 employees; and micro are those with fewer than ten employees. 281 222 McKinsey Global Institute Appendix . Account for public investments as they depreciate We took data on annual deficits, GDP, gross capital formation, gross capital consumption, and all-sector R&D spending at market prices for each country from AMECO. Countries that are not bound by the requirements of the Stability and Growth Pact were excluded. For each country, we calculated an infrastructure investment need using the methodology discussed in Chapter 3.285 This produced an estimate for 2011 as a share of GDP that we then applied to 2014 GDP, an approach that was not ideal but was necessary because of limits to the availability of data. Where the investment need was positive, it was treated as room for additional spending. Where it was negative, we assumed that the presence of the deficit rule was not the cause of overspending and therefore that spending would not be affected. For each country, we calculated an R&D investment need by comparing each nation’s R&D spending as a proportion of GDP with the investment spending of Japan, the second best globally in R&D spending at 3.3 percent of GDP.
Where the investment need was positive, we assumed that half of the gap would require either direct public spending or public subsidy of private work. Because of limits on the availability of data, we calculated this gap as a percentage of 2012 GDP and then applied it to 2014 GDP. We calculated the need for investment in affordable housing for each country with the methodology used in the October 2014 MGI report on affordable housing.286 Where data were not available for a particular country, we extrapolated investment need based on the prevalence of unsuitable housing. We used the “severe deprivation” category in the EU’s Statistics on Income and Living Conditions database as a proxy, weighted by population size.
Because of limits on available data, we calculated this gap as a percentage of 2012 GDP and applied it to 2014 GDP. We then added the need for investment in these three categories—infrastructure, R&D, and affordable housing—to arrive at a total figure for new spending that would be enabled. The total figure is €140.4 billion, made up of €34.4 billion on infrastructure, €59.2 billion on R&D, and €46.8 billion on affordable housing. In addition, we adjusted the deficit forecast for 2014 by the difference between gross capital formation and consumption for each country bound by the Fiscal Compact. This increased the size of deficits, resulting in a €9.0 billion reduction in spending capacity across Europe. Applying fiscal multipliers for each country (as discussed in the section on fiscal multipliers) results in an impact on demand of €95 billion to €228 billion. Carefully adjust taxation and wage structure We took the marginal propensity to consume for different wealth bands from the ECB’s 2014 report The distribution of wealth and the marginal propensity to consume.
We took the distribution of net wealth from the ECB’s 2013 Household consumption survey. We model redistribution as proportional to the store of wealth, calculated using Eurostat’s household consumption survey and population data. For each wealth quintile, we assumed a contribution equivalent to 1 percent of wealth, although this need not be in the form of a tax on the wealth itself. For the bottom quintile, which has negative wealth (net debt), we did not model a contribution.
We then redistributed the flow to the bottom half of the wealth distribution and treated it as fresh permanent income. Based on the marginal propensity to consume of each quintile, this gives us an estimate of the loss of consumption and the We assume a long-term trend of 70 percent of GDP in infrastructure, and calculate the amount of investment required to make up for depreciation and growth of GDP. 286 A blueprint for addressing the global affordable housing challenge, McKinsey Global Institute, October 2014. 285 McKinsey Global Institute A window of opportunity for Europe 223 . increase in consumption that accompanies the redistribution. The net size of this effect is €189 billion to €206 billion. Household consumption multipliers were estimated within a model provided by Oxford Economics to be between 0.50 and 1.32 by applying a shock to household consumption through government redistribution funded by an increase in corporate taxes. After multipliers, the output effect is €95 billion to €273 billion. Unleash the silver economy Using Eurosystem reports, we estimated the approximate wealth of Eurozone households, broken out by age category. When using an upper and lower bound of the proportion of wealth that is liquid (such as deposits, and other non-housing-type assets), we estimate that converting 1 percent of this wealth into consumption could provide a spending boost of between 0.3 and 0.6 percent of Eurozone GDP, using a fiscal multiplier of 1.0. Issue vouchers to households redeemable with the ECB We derived the marginal propensity to consume and the distribution of wealth the same way as we did in the case of wealth redistribution.
Here, however, the programme is funded through the creation of new money rather than through taxation. In addition, the funds are distributed evenly across the population rather than being targeted at the bottom half. This programme would be slightly smaller than proposed “QE-lite” programmes to purchase covered bonds and asset-backed securities announced by the ECB in late 2014 and slightly larger than tax breaks given in the United States in 2008.
The size of this effect would be €246 billion to €272 billion of additional direct consumption. After multipliers, this rises to between €207 billion and €395 billion, which could be sufficient to close the Eurozone’s output gap. Fiscal multipliers We drew on econometric analyses where possible to arrive at fiscal multipliers that represent the effect in a single year of a change in government spending on demand. However, these estimates were available for both recessionary and non-recessionary periods only for France, Germany, Italy, Spain, and the United Kingdom. For these countries, where possible, we used a range of multiple sources for recessionary fiscal multipliers (and non-recessionary multipliers for Germany). Where econometric analysis was not available for smaller economies, we used the approach advocated in the 2014 IMF report Fiscal multipliers: Size, determinants and use in macroeconomic projections.
This requires the assessment of a national economy on six dimensions, with adjustments for the business cycle and monetary-policy conditions: 1. We assessed low openness to trade as being cases where the ratio of imports to GDP was less than 30 percent. 2. We assessed high labour-market rigidities using the OECD Employment Protection Legislation Index, using the central point of the index as the threshold value. 3. We defined low automatic stabilisers as being when the level of public spending as a share of GDP was below 40 percent, as suggested by the IMF. 4. We assessed fixed or quasi-fixed exchange rates for Eurozone members and countries with a currency pegged to the euro or as part of the exchange rate mechanism (ERM-II) to reduce exchange rate variability.287 The ERM-II maintains currency exchange rates within a band of a central rate with the euro. It currently applies only to Lithuania and Denmark. 287 224 McKinsey Global Institute Appendix . 5. We assessed “safe” public debt as being below 100 percent of GDP, as suggested by the IMF. 6. We assessed the effectiveness of public expenditure management using the World Bank Worldwide Governance Indicators, choosing the central value of the index as the threshold value. We then assigned countries a basic multiplier of 0.1 to 0.3 if they met up to two of the six criteria, 0.4 to 0.6 if they met three, and 0.7 to 1.0 if they met more than three (Exhibit A5). Where a country was borderline on three or more criteria, we adjusted the country up or down to reflect this. The adjustment affected only Greece. We then corrected for the stage of the business cycle. As recommended by the IMF, we estimated this as a 60 percent increase in the fiscal multiplier at the peak of recession. We determined the stage of the recession using output gaps as calculated by the European Commission and taken from AMECO.
For each country, we found a historical maximum and minimum output gap. We then averaged these across countries with a separate category for large (GDP greater than €1 trillion), medium (GDP €300 billion to €1 trillion), and small (GDP less than €300 million) economies. We then determined the position of each country relative to this average maximum and used the ratio used as a factor for judging the severity of the recession.
Using this approach, it was possible for a country to have a modifier greater than 60 percent. For example, Greece’s output gap is estimated to be 10.9 percent, while the average maximum output gap for a small economy was 6.1 percent. The ratio of those figures is greater than one, so the business cycle adjustment for Greece is 107 percent, greater than the IMF’s upper estimate. We also applied monetary-policy corrections.
We took Eurozone countries, countries with a euro peg, and countries that are part of an ERM-II arrangement as being at the zero lower bound and applied a correction of an additional 30 percent to the fiscal impulse. The United Kingdom and Sweden were also taken to be at the lower bound, while Romania, Hungary, Poland, and Croatia were not. Total impact In total, we estimate that Europe could unleash investment in innovation, education, infrastructure, and energy of €250 billion to €550 billion a year and, by closing its output gap and mobilising the workforce, create more than 20 million new jobs. To derive the €250 billion to €550 billion range for investment, we took the 1.7 to 3.7 percent estimate for the annual investment required for the growth drivers and applied it to Europe-30 GDP.
We obtained the figure for new jobs created through the cumulative addition of new jobs through several sources. First, we assume that closing the European output gap of 2.4 percent would create approximately 2.4 percent new jobs, assuming constant productivity. We then add the number of incremental jobs created by the grey and female labour-force participation and immigration growth drivers to obtain the cumulative figure of 20 million incremental jobs by 2025. McKinsey Global Institute A window of opportunity for Europe 225 .
Exhibit A5 Fiscal multipliers Output gap % Lower-bound multiplier1 Upper-bound multiplier1 Austria -1.1 0.6 0.9 Belgium -1.1 1.1 1.5 Bulgaria -0.1 0.9 1.3 Croatia -3.4 0.5 0.8 Cyprus -6.1 0.8 1.2 Czech Republic -2.0 0.6 0.9 Denmark -3.8 0.7 1.1 Estonia 1.4 0.8 1.2 Finland -3.1 0.7 1.0 France -2.3 0.2 2.1 Germany -0.8 0.2 1.0 Greece -10.9 1.1 1.6 Hungary -0.7 0.1 0.3 Ireland -0.2 0.5 0.8 Italy -4.5 1.6 2.1 Latvia 1.0 0.9 1.2 Lithuania 0.2 0.9 1.3 -2.1 1.1 1.6 0.1 0.9 1.3 Netherlands -3.0 1.3 1.9 Poland -0.8 0.1 0.3 Portugal -5.0 0.8 1.2 Romania -1.3 0.5 0.7 Slovakia -3.3 1.2 1.7 Slovenia -2.7 1.2 1.6 Spain -6.0 1.3 2.5 Sweden -1.6 0.6 1.0 United Kingdom -0.8 0.1 1.0 Country Luxembourg Malta Estimates taken from empirical studies 1 Multiplier is an estimated one-year fiscal multiplier for increase in government expenditure in country's current circumstances. SOURCE: Batini, IMF, 2014; Batini, IMF, 2012; Baum, 2012; Hernández de Cos and Moral-Benito, 2013; McKinsey Global Institute analysis 226 McKinsey Global Institute Appendix . Chapter end photo: Tulips © Getty Images McKinsey Global Institute A window of opportunity for Europe 227 . Chapter photo Biblio: Flags © Getty Images 228 McKinsey Global Institute Appendix . BIBLIOGRAPHY A Ægisdóttir, StefaniÌa, Lawrence H. Gerstein, and Deniz Canel Çinarbas, “Methodological Issues in cross-cultural counseling research: Equivalence, bias, and translations”, The Counseling Psychologist, volume 36, March 2008. Afxentiou, Panos C., “Convergence, the Maastricht criteria, and their benefits”, The Brown Journal of World Affairs, volume VII, issue 1, winter-spring 2000. Agency for the Cooperation of Energy Regulators and Council of European Energy Regulators, ACER/CEER annual report on the results of monitoring the internal electricity and natural gas markets in 2011, November 2012. Agency for the Cooperation of Energy Regulators and Council of European Energy Regulators, ACER/CEER annual report on the results of monitoring the internal electricity and natural gas markets in 2013, October 2014. Alesina, Alberto, and Dani Rodrik, “Distributive policies and economic growth”, The Quarterly Journal of Economics, volume 109, number 2, 1994. Amorós, José Ernesto, and Neils Bosma, Global Entrepreneurship Monitor 2013 global report: Fifteen years of assessing entrepreneurship across the globe, Global Entrepreneurship Research Association, 2014. Anderson, Derek, Bergljot Barkbu, Lusine Lusinyan, and Dirk Muir, “Assessing the gains from structural reforms for jobs and growth”, in Jobs and growth: Supporting the European recovery, Martin Schindler, Helge Berger, Bas B. Bakker, and Antonio Spilimbergo, eds., IMF, 2014. Aranki, Ted, and Corrado Macchiarelli, Employment duration and shifts into retirement in the EU, London School of Economics Europe in Question discussion paper number 58, February 2013. Ardagna, Silvia, Francesco Caselli, and Timothy Lane, Fiscal discipline and the cost of public debt service: Some estimates for OECD countries, NBER working paper number 10788, September 2004. Arnold, Jens, Do tax structures affect aggregate economic growth? Empirical evidence from a panel of OECD countries, OECD economics department working paper number 643, October 2008. Artus, Patrick, The effect of debt mutualisation in the euro zone would be more complex than what is usually claimed, Natixis economic research, number 560, August 2013. Aßmann, Christian, and Jens Boysen-Hogrefe, Determinants of government bond spreads in the Euro area—in good times as in bad, Kiel working paper number 1548, September 2009. . Association for Financial Markets in Europe, Unlocking funding for European investment and growth: An industry survey of obstacles in the European funding markets and potential solutions, 2013. Association for Financial Markets in Europe, The role of secondary markets and market making in the long-term financing of the European economy, AFME briefing note, June 2013. Ayres, Robert U., and Benjamin Warr, “Accounting for growth: The role of physical work”, Structural Change and Economic Dynamics, volume 16, issue 2, June 2005. B Bairoch, Paul, The economic development of the third world since 1900, University of California Press, 1975. Barbiero, Francesca, and Zsolt Darvas, “In sickness and in health: Protecting and supporting public investment in Europe”, Bruegel Policy Contribution, issue 2014/02, February 2014. Bassanini, Andrea, and Romain Duval, “The determinants of unemployment across OECD countries: Reassessing the role of policies and institutions”, OECD Economic Studies, number 42, issue 1, 2006. Batini, Nicoletta, Luc Eyraud, Lorenzo Forni, and Anke Weber, Fiscal multipliers: Size, determinants and use in macroeconomic projections, IMF, September 2014. Batini, Nicoletta, Giovanni Callegari, and Giovanni Melina, Successful austerity in the United States, Europe and Japan, IMF working paper 12/190, July 2012. Baum, Anja, Marcos Poplawski-Ribeiro, and Anke Weber, Fiscal multipliers and the state of the economy, IMF working paper 12/286, December 2012. BBC, Sweden cuts rates below zero and starts QE, February 12, 2015. Beach, R., M. Webster, and K. M. Campbell, “An evaluation of partnership development in the construction industry”, International Journal of Project Management, volume 23, issue 8, November 2005. Beardsley, Scott C., Luis Enriquez, Sheila Bonini, Sergio Sandoval, and Noëmie Brun, “Fostering the economic and social benefits of ICT”, in Global information technology report 2009–2010, Soumitra Dutta and Irene Mia, eds., World Economic Forum, March 2010. Beltramello, Andrea, Koen De Backer, and Laurent Moussiegt, The export performance of countries within global value chains (GVCs), OECD science, technology, and industry working paper number 2012/02, April 2012. Berthou, Antoine, and Guillaume Gaulier, “Wage dynamics and current account rebalancing in the euro area”, Bulletin de la Banque de France, issue 30, 2013. Blanchard, Olivier J., and Francesco Giavazzi, Improving the SGP through a proper accounting of public investment, Centre for Economic Policy Research discussion paper number 4220, February 2004. Böckers, Veit, Justus Haucap, and Ulrich Heimeshoff, Benefits of an integrated European electricity market, Düsseldorfer Institut für Wettberwerbsökonomie discussion paper number 109, September 2013. 230 McKinsey Global Institute Bibliography .
Boeri, Tito, Michael Burda, and Francis Kramarz, eds., Working hours and job sharing in the EU and USA: Are Europeans lazy? Or Americans crazy? Oxford University Press, 2008. Bond, Ian, The EU and defence procurement, Centre for European Reform, January 2014. Braga, Michela, Daniele Checchi, and Elena Meschi, Institutional reforms and educational attainment in Europe: A long run perspective, Institute for the Study of Labor (IZA) discussion paper number 6190, December 2011. Bravo-Ortega, Claudio, and Álvaro García Marin, “R&D and productivity: A two way avenue?” World Development, volume 39, issue 7, July 2011. Brock, H. Woody, Quantitative easing: Myths and half-truths, Strategic Economic Decisions, October 2012. Brunzell, Tor, Eva Liljeblom, and Mika Vaihekoski, “Determinants of capital budgeting methods and hurdle rates in Nordic firms”, Accounting & Finance, volume 53, issue 1, March 2013. Bryant, Chris, “BASF to focus investments outside Europe”, The Financial Times, February 25, 2014. Buiter, Willem H., Helicopter money: Irredeemable fiat money and the liquidity trap, NBER working paper number 10163, December 2003. Buiter, Willem H., “The ‘sense and nonsense of Maastricht’ revisited: What have we learnt about stabilization in EMU?” Journal of Common Market Studies, volume 44, issue 4, November 2006. Buiter, Willem H., The simple analytics of helicopter money: Why it works—always, Kiel Institute for the World Economy economics discussion paper number 2014–24, 2014. Burger, Bruno, Electricity production from solar and wind in Germany in 2014, Fraunhofer ISE (Institut für Solare Energiesysteme), December 2014. Buti, Marco, Alessandro Turrini, and Paul van den Noord, Reform and be re-elected: Evidence from the post-crisis period, Vox, Centre for Economic Policy Research, July 2014. C Carroll, Christopher D., Jiri Slacalek, and Kiichi Tokuoka, The distribution of wealth and the marginal propensity to consume, European Central Bank working paper number 1655, March 2014. Ceci-Renaud, Nila, and Paul-Antoine Chevalier, “L’impact des seuils de 10, 20 et 50 salariés sur la taille des entreprises françaises”, Économie et Statistique, number 437, March 2011. Chawla, Mukesh, Gordon Betcherman, and Arup Banerji, “Aging, savings, and financial markets”, in From red to gray: The “third transition” of aging populations in Eastern Europe and the former Soviet Union, World Bank, 2007. Checherita-Westphal, Cristina D., and Philipp Rother, The impact of high and growing government debt on economic growth: An empirical investigation for the euro area, European Central Bank working paper number 1237, August 2010. McKinsey Global Institute A window of opportunity for Europe 231 . Chen, Natalie, and Dennis Novy, International trade integration: A disaggregated approach, CEP discussion paper number dp0908, Centre for Economic Performance, London School of Economics, 2009. Cingano, Federico, Trends in income inequality and its impact on economic growth, OECD social, employment and migration working paper number 163, December 2014. Coeuré, Benoit, Structural reforms: Learning the right lessons from the crisis, presented at an economic conference in Latvijas Banka, Riga, October 17, 2014. D Darvas, Zsolt, Fiscal federalism in crisis: Lessons for Europe from the US, Bruegel, July 2010. De Bonis, Riccardo, and Andrea Silvestrini, “The effects of financial and real wealth on consumption: New evidence from OECD countries”, Applied Financial Economics, volume 22, issue 5, March 2012. De Nederlandsche Bank, “Securitisation rules: ‘Significant risk transfer’, retention and due diligence”, fact sheet, February 2014. Del Monte, Micaela, Cost of non-Europe in the Single Market for energy, European Added Value Unit, European Parliamentary Research Service, June 2013. Deloitte, Comparative immigration study 2013–2014: Migration formalities for third-country nationals in 26 European countries, November 2013. Dullien, Sebastian, and Ferdinand Fichtner, “A common unemployment insurance system for the euro area”, DIW Economic Bulletin, volume 3, issue 1, January 2013. Dunne, Joseph, Mapping the cost of non-Europe, 2014–19, European Parliament, March 2014. Duval, Romain, The retirement effects of old-age pension and early retirement schemes in OECD countries, OECD Economics Department working paper number 370, November 2003. Dynan, Karen, “Is a household debt overhang holding back consumption?” Brookings Papers on Economic Activity, spring 2012. E ECDL Foundation, Digital literacy report—2009, 2009. The Economist, “Why Swedish men take so much paternity leave”, July 22, 2014. Edelman, 2015 Edelman trust barometer, January 2015. Eijffinger, Sylvester C. W., “Eurobonds—concepts and implications”, in Eurobonds: Concepts and implications: Compilation of notes for the monetary dialogue of March 2011, European Parliament, March 2011. Elekdag, Selim, and Dirk Muir, Das Public Kapital: How much would higher German public investment help Germany and the euro area? IMF working paper number 14/227, 2014. 232 McKinsey Global Institute Bibliography . Ellis, Mark, Experience with energy efficiency regulations for electrical equipment, OECD/ International Energy Agency, August 2007. Enderlein, Henrik, and Jean Pisani-Ferry, Reforms, investment and growth: An agenda for France, Germany, and Europe, Hertie School of Governance, November 2014. Escribano, Alvaro, Andrea Fosfuri, and Josep A. Tribó, “Managing external knowledge flows: The moderating role of absorptive capacity”, Research Policy, volume 38, issue 1, February 2009. European Central Bank, Banking structures report, November 2013. European Central Bank, “ECB announces expanded asset purchase programme”, press release, January 22, 2015. European Central Bank, Euro area bank lending survey, April 2014. European Central Bank, The eurosystem household finance and consumption survey: Results from the first wave, statistics paper series number 2, April 2013. European Central Bank, Survey on the access to finance of enterprises in the euro area, November 2014. European Central Bank, Survey on the access to finance of small- and medium-sized enterprises, November 2013. European Central Bank and Bank of England, The case for a better functioning securitisation market in the European Union: A discussion paper, May 2014. European Central Bank and Bank of England, The impaired EU securitisation market: Causes, roadblocks and how to deal with them, April 2014. European Commission, Building a capital markets union, green paper, February 2015. European Commission, Energy economic developments in Europe, January 2014. European Commission, “The EU’s bilateral trade and investment agreements: Where are we?” press release, December 3, 2013. European Commission, EEO review: Employment policies to promote active ageing 2012, 2012. European Commission, European energy security strategy, 2014. European Commission, European system of accounts 2010, Eurostat, June 2013. European Commission, Europeans’ satisfaction with urban transport, Flash Eurobarometer 382b, June 2014. European Commission, Green paper on the feasibility of introducing stability bonds, November 2011. European Commission, Innovation Union scoreboard 2014, March 2014. European Commission, Internal market, Special Eurobarometer 398, October 2013. European Commission, Key data on early childhood education and care in Europe, 2014 edition, Eurydice and Eurostat report, 2014. McKinsey Global Institute A window of opportunity for Europe 233 . European Commission, Long-term financing of the European economy, green paper, March 2013. European Commission, Monitoring consumer markets in the European Union 2013, Part I, August 2013. European Commission, “Public opinion in the European Union”, Standard Eurobarometer 82, December 2014. European Commission, A single market for growth and jobs: An analysis of progress made and remaining obstacles in the member states, November 2013. European Commission, The 2012 ageing report: Economic and budgetary projections for the 27 EU member states (2010–2060), 2012. European Commission, The 2012 ageing report: Underlying assumptions and projection methodologies, 2011. European Commission and European Investment Bank, “Factsheet 2: Where does the money come from?” November 2014. European Foundation for the Improvement of Living and Working Conditions, Employment trends and policies for older workers in the recession, 2012. European Global Navigation Satellite Systems Agency, GNSS Market Report, issue 3, October 2013. European Parliament, Better governance of the Single Market: An assessment accompanying the European Parliament’s legislative own-initiative report (rapporteur Andreas Schwab, MEP), European Added Value Assessment number 2, 2013. European Parliament, “Resolution of 8 October 2013 on effects of budgetary constraints for regional and local authorities regarding the EU’s structural funds expenditure in the member states”, October 2013. European Union, “Directive on services in the internal market”, Directive 2006/123/EC, 2006. European Union, “774% difference in phone call prices across the EU”, press release, August 6, 2013. European Union and OECD, Matching economic migration with labour market needs, September 2014. European Venture Capital Association, European Private Equity Activity Data 2007–2013, May 2014. F Favero, Carlo, and Alessandro Missale, Sovereign spreads in the euro area: Which prospects for a eurobond? presented at an Economic Policy panel meeting in Warsaw, October 27–28, 2011. Fawley, Brett W., and Christopher J. Neely, “Four stories of quantitative easing”, Federal Reserve Bank of St. Louis Review, volume 95, number 1, January/February 2013. 234 McKinsey Global Institute Bibliography . Forbes, “The world’s most innovative companies”, August 2014. Fougère, Denis, Francis Kramarz, and Julien Pouget, Youth unemployment and crime in France, IZA discussion paper number 2009, March 2006. Frankel, Jeffrey, and Jesse Schreger, “Over-optimistic official forecasts and fiscal rules in the Eurozone”, Review of World Economics, volume 149, issue 2, June 2013. G Gardiner and Theobald, International construction cost survey, December 2011. Garicano, Luis, Claire LeLarge, and John Van Reenen, Firm size distortions and the productivity distribution: Evidence from France, NBER working paper number 18841, February 2013. Gas infrastructure Europe, LNG import potential to Europe, presentation at Ifri Energy roundtable in Brussels, April 29, 2014. Geier, Alain, The debt brake: The Swiss fiscal rule at the federal level, Swiss Federal Finance Administration working paper number 15, February 2011. Gill, Indermit S., and Chor-Ching Goh, “Scale economies and cities”, World Bank Research Observer, volume 25, number 2, August 2010. Gill, Indermit S., and Martin Raiser, Golden growth: Restoring the lustre of the European economic model, World Bank, January 2012. Glaeser, Edward L., and Joshua D. Gottlieb, The wealth of cities: Agglomeration economies and spatial equilibrium in the United States, NBER working paper number 14806, March 2009. Global Commission on the Economy and Climate, Better growth, better climate: The new climate economy report, September 2014. Goldin, Claudia, “The U-shaped female labor force function in economic development and economic history”, in Investment in women’s human capital, T. Paul Schultz, ed., University of Chicago Press, 1995. Gordon, Robert J., Is US economic growth over? Faltering innovation confronts the six headwinds, NBER working paper number 18315, August 2012. Gregory, Robert G., The two-step Australian immigration policy and its impact on immigrant employment outcomes, IZA discussion paper number 8061, March 2014. H Hairault, Jean-Olivier, Thepthida Sopraseuth, and François Langot, “Distance to retirement and older workers’ employment: The case for delaying the retirement age”, Journal of the European Economic Association, volume 8, issue 5, September 2010. Hall, Peter A., and David Soskice, eds., Varieties of capitalism: The institutional foundations of comparative advantage, Oxford University Press, 2001. McKinsey Global Institute A window of opportunity for Europe 235 . Hasan, Iftekhar, Krzysztof Jackowicz, Oskar Kowalewski, and Åukasz KozÅ‚owski, Bank ownership structure, SME lending and local credit markets, Bank of Finland research discussion paper number 22/2014, 2014. Havik, Karel, Kieran Mc Morrow, Fabrice Orlandi, Christophe Planas, Rafal Raciborski, Werner Röger, et al., The production function methodology for calculating potential growth rates and output gaps, European Commission economic paper number 535, November 2014. Hendeliowitz, Jan, Danish employment policy: National target setting, regional performance management and local delivery, Danish National Labour Market Authority, February 2008. Hernández de Cos, Pablo, and Enrique Moral-Benito, Fiscal multipliers in turbulent times: The case of Spain, Banco de España working paper number 1309, 2013. Hirt, Martin, and Paul Wilmott, “Strategic principles for competing in the digital age”, McKinsey Quarterly, May 2014. Holland, Dawn, Iana Liadze, Cinzia Rienzo, and David Wilkinson, The relationship between graduates and economic growth across countries, Bank for International Settlements research paper number 110, August 2013. Honda, Gail, “Differential structure, differential health: Industrialization in Japan 1868–1940”, in Health and welfare during industrialization, Richard Steckel and Roderick Floud, eds., University of Chicago Press, 1997. Hufbauer, Gary Clyde, Jeffrey J. Schott, and Woan Foong Wong, “Figuring out the Doha Round”, Policy Analyses in International Economics, number 91, July 2010. Huxley, Joe, Value capture finance: Making urban development pay its way, Urban Land Institute, 2009. I Infrastructure UK, Infrastructure cost review, July 2014. Infrastructure UK, Infrastructure cost review: Technical report, December 2010. Institute for Fiscal Studies, Mirrlees Review, 2010. International Council on Clean Transportation, European vehicle market statistics, 2013, October 2013. International Energy Agency, Capturing the multiple benefits of energy efficiency, September 2014. International Energy Agency, Energy efficiency market report 2013: Market trends and medium-term prospects, 2013. International Energy Agency, Medium-term gas market report 2013: Market trends and projections to 2018, June 2013. IMF, Euro area policies: 2014 Article IV consultation, selected issues, IMF Country Report number 14/1999, July 2014. IMF, Global financial stability report: Moving from liquidity- to growth-driven markets, April 2014. 236 McKinsey Global Institute Bibliography . IMF, World economic outlook: Legacies, clouds, uncertainties, October 2014. IMF, World economic outlook: Recovery strengthens, remains uneven, April 2014. J Jagannathan, Ravi, David A. Matsa, Iwan Meier, and Vefa Tarhan, Why do firms use high discount rates? Social Science Research Network (SSRN) Electronic Journal, June 2014. Jensen, J. Bradford, Global trade in services: Fear, facts, and offshoring, Peterson Institute for International Economics, 2011. Jousten, Alain, M. Lefèbvre, S.
Perelman, and P. Pestieau, The effects of early retirement on youth unemployment: The case of Belgium, IMF working paper number 08/30, February 2008. JP Morgan, European banks: All eyes on funding: LCR, the next undiscounted regulatory headwind, 2011. K Kapetanios, George, Haroon Mumtaz, Ibrahim Stevens, and Konstantinos Theodoridis, Assessing the economy-wide effects of quantitative easing, Bank of England working paper number 443, January 2012. Kapteyn, Arie, Adriaan S. Kalwij, and Asghar Zaidi, The myth of worksharing, IZA discussion paper number 188, August 2000. Kawaguchi, Daiji, and Tetsushi Murao, Labor market institutions and long-term effects of youth unemployment, IZA discussion paper number 8156, April 2014. Kingfisher, European home report 2014, 2014. Koo, Richard C., “The world in balance sheet recession: Causes, cure, and politics”, RealWorld Economics Review, issue number 58, 2011. Kowalski, Przemyslaw, Comparative advantage and trade performance: Policy implications, OECD trade policy paper number 121, October 2011. KPMG International, KPMG’s individual income tax and social security rate survey 2012, October 2012. Krebs, Tom, and Martin Scheffel, “Macroeconomic evaluation of labor market reform in Germany”, IMF Economic Review, volume 61, number 4, December 2013. Kumhof, Michael, and Romain Rancière, Inequality, leverage and crises, IMF working paper number 10/268, November 2010. L Llewellyn Consulting, Financing Europe’s investment and economic growth, June 2014. Lora, Eduardo, and Mauricio Olivera, “What makes reforms likely: political economy determinants of reforms in Latin America”, Journal of Applied Economics, volume VII, number 1, May 2004. McKinsey Global Institute A window of opportunity for Europe 237 .
M Mammen, Kristin, and Christina Paxson, “Women’s work and economic development”, Journal of Economic Perspectives, volume 14, number 4, fall 2000. Mascherini, Massimiliano, Lidia Salvatore, Anja Meierkord, and Jean-Marie Jungblut, NEETs: Young people not in employment, education or training: Characteristics, costs and policy responses in Europe, Eurofound, October 2012. Mayordomo, Sergio, Juan Ignacio Peña, and Eduardo S. Schwartz, Towards a common European Monetary Union risk free rate, NBER working paper number 15353, September 2009. McKinsey & Company, Better for less: Improving public sector performance on a tight budget, July 2011. McKinsey & Company, “The energy advantage: How Germany can benefit in energy efficiency”, in Energy efficiency: A compelling global resource, 2010. McKinsey & Company, McKinsey-Studie zu Industrie 4.0: Deutsche Unternehmen trotz wachsender Konkurrenz zuversichtlich, 2015. McKinsey Center for Government, Education to employment: Getting Europe’s youth into work, January 2014. McKinsey Center for Government, Transforming government performance through lean management, December 2012. McKinsey Financial Services Practice, Breakaway: How leading banks outperform through differentiation: McKinsey global banking annual review 2013, November 2013. McKinsey Global Institute, Beyond austerity: A path to economic growth and renewal in Europe, October 2010. McKinsey Global Institute, A blueprint for addressing the global affordable housing challenge, October 2014. McKinsey Global Institute, Building globally competitive cities: The key to Latin American growth, August 2011. McKinsey Global Institute, Creating economic growth in Denmark through competition, November 2010. McKinsey Global Institute, Debt and deleveraging: Uneven progress on the path to growth, January 2012. McKinsey Global Institute, Debt and (not much) deleveraging, February 2015. McKinsey Global Institute, Disruptive technologies: Advances that will transform life, business, and the global economy, May 2013. McKinsey Global Institute, From poverty to empowerment: India’s imperative for jobs, growth, and effective basic services, February 2014. McKinsey Global Institute, Global flows in a digital age: How trade, finance, people, and data connect the world economy, April 2014. 238 McKinsey Global Institute Bibliography . McKinsey Global Institute, Global growth: Can productivity save the day in an aging world? January 2015. McKinsey Global Institute, Growth and renewal in the Swedish economy: Development, current situation and priorities for the future, May 2012. McKinsey Global Institute, India’s urban awakening: Building inclusive cities, sustaining economic growth, April 2010. McKinsey Global Institute, Internet matters: The Net’s sweeping impact on growth, jobs, and prosperity, May 2011. McKinsey Global Institute, Investing in growth: Europe’s next challenge, December 2012. McKinsey Global Institute, Lions go global: Deepening Africa’s ties to the United States, August 2014. McKinsey Global Institute, Manufacturing the future: The next era of global growth and innovation, November 2012. McKinsey Global Institute, A new dawn: Reigniting growth in Central and Eastern Europe, December 2013. McKinsey Global Institute, Open data: Unlocking innovation and performance with liquid information, October 2013. McKinsey Global Institute, Preparing for China’s urban billion, March 2009. McKinsey Global Institute, QE and ultra-low interest rates: Distributional effects and risks, November 2013. McKinsey Global Institute, Resource revolution: Meeting the world’s energy, materials, food, and water needs, November 2011. McKinsey Global Institute, Trading myths: Addressing misconceptions about trade, jobs, and competitiveness, May 2012. McKinsey Global Institute, Urban America: US cities in the world economy, April 2012. McKinsey Global Institute, Urban world: Cities and the rise of the consuming class, June 2012. McKinsey Global Institute, Urban world: Mapping the economic power of cities, March 2011. McKinsey Global Institute, Urban world: The shifting global business landscape, October 2013. McKinsey Global Institute, The world at work: Jobs, pay, and skills for 3.5 billion people, June 2012. McKinsey Global Institute and McKinsey Infrastructure Practice, Infrastructure productivity: How to save $1 trillion a year, January 2013. McKinsey on Society, How the world’s best-performing school systems come out on top, September 2007. McKinsey Public Sector Practice, The public-sector productivity imperative, March 2011. McKinsey Global Institute A window of opportunity for Europe 239 . Meier, Iwan, and Vefa Tarhan, Corporate investment decision practices and the hurdle rate premium puzzle, SSRN Electronic Journal, January 2007. Menguy, Séverine, “Can eurobonds save the euro?” in States, banks, and the financing of the economy: Monetary policy and regulatory perspective, Morten Balling, Ernest Gnan, and Patricia Jackson, eds., SUERF, 2013. Mersch, Yves, Capital markets union: The “why” and the “how”, speech at the Joint EIB-IMF High Level Workshop in Brussels, October 22, 2014. Monteagudo, Josefa, Aleksander Rutkowski, and Dimitri Lorenzani, The economic impact of the Services Directive: A first assessment following implementation, European Commission economic paper number 456, June 2012. Morgado, António, Tiago Neves Sequeira, Marcelo Santos, Alexandra Ferreira-Lopes, and Ana Balcão Reis, Measuring labour mismatch in Europe, CEFAGE-UE working paper number 2014/13, Center for Advanced Studies in Management and Economics, Universidade de Évora, 2014. Mosca, Ilaria, “Evaluating reforms in the Netherlands’ competitive health insurance system”, Eurohealth, volume 18, number 3, January 2012. Muellbauer, John, Combatting Eurozone deflation: QE for the people, Vox, December 23, 2014. Muller, Patrice, Dimitri Gagliardi, Cecilia Caliandro, Nuray Unlu Bohn, and Demetrius Klitou, Annual report on European SMEs 2013/2014: A partial and fragile recovery, Final report, European Commission, July 2014. N Nath, Chandrika, Autonomous road vehicles, Houses of Parliament PostNote number 443, September 2013, amended April 2014. National Association of State Budget Officers, Capital budgeting in the states, spring 2014. Navaretti, Giorgio Barba, Matteo Bugamelli, Fabiano Schivardi, Carlo Altomonte, Daniel Horgos, and Daniela Maggioni, The global operations of European firms: The second EFIGE policy report, Breugel Blueprint Series, volume XII, July 2011. O Olson, Mancur, The logic of collective action: Public goods and the theory of groups, Harvard University Press, 1965. Onaran, Özlem, and Giorgos Galanis, Is aggregate demand wage-led or profit-led? National and global effects, Conditions of work and employment series number 40, International Labour Organisation, 2012. OECD, Ageing and employment policies: Norway 2013: Working better with age, June 2013. OECD, Better Life Index, 2014. OECD, Demand-side innovation policies, May 2011. 240 McKinsey Global Institute Bibliography . OECD, Economic policy reforms: Going for growth 2013, 2013. OECD, Economic policy reforms: Going for growth 2015, 2015 OECD, Employment outlook 2013, 2013. OECD, Entrepreneurship at a glance 2013, July 2013. OECD, International migration outlook 2011, July 2011. OECD, “Mobility and migration in Europe”, in OECD Economic Surveys: European Union 2012, March 2012. OECD, OECD Pensions outlook 2012, 2012. OECD, Pensions at a glance, 2011. OECD, Pensions at a glance, 2012. OECD, Recruiting immigrant workers: Germany 2013, February 2013. OECD, Recruiting immigrant workers: Sweden 2011, December 2011. OECD, Reviews of innovation policy: Korea, 2009. OECD, The 2012 labour market reform in Spain: A preliminary assessment, December 2013. OECD Committee of Fiscal Affairs Forum on Strategic Management, Principles of good tax administration—practice note, Centre for Tax Policy and Administration, amended May 2001. P Pace, Scott, Gerald P. Frost, Irving Lachow, David R. Frelinger, Donna Fossum, Don Wassem, and Monica M. Pinto, The Global Positioning System: Assessing national policies, Rand Corporation, 1995. Paldam, Martin, “Safe havens in Europe: Switzerland and the ten dwarfs”, European Journal of Comparative Economics, volume 10, number 3, December 2013. Panayotou, Theodore, “Economic growth and the environment”, presented at the spring seminar of the United Nations Economic Commission for Europe in Geneva, March 3, 2003. Pasquier, Sara, and Aurelien Saussay, Progress implementing the IEA 25 energy efficiency policy recommendations: 2011 evaluation, International Energy Agency, March 2012. Pelkmans, Jacques, “The economics of Single Market regulation”, Bruges European Economic Policy Briefings, number 25, College of Europe, 2012. Pelkmans, Jacques, and Andrea Renda, “Does EU regulation hinder or stimulate innovation?” Regulatory Policy, Centre for European Policy Studies special report number 96, November 2014. Pesaran, M.
Hashem, and Ron P. Smith, Counterfactual analysis in macroeconometrics: An empirical investigation into the effects of quantitative easing, IZA discussion paper number 6618, June 2012. McKinsey Global Institute A window of opportunity for Europe 241 . Peterson, George E., Unlocking land values to finance urban infrastructure, World Bank, 2009. Petrella, Andrea, Fostering innovation through public procurement: Rationale, implementation and best practice in Italy and Europe, Bank of Italy Regional Economic Research Department, 2013. PricewaterhouseCoopers and the World Bank/International Finance Corporation, Paying taxes 2013: The global picture, November 2013. R Rajan, Raghuram G., Fault lines: How hidden fractures still threaten the world economy, Princeton University Press, 2010. Rincon-Aznar, Ana, and W. S. Siebert, Employment protection, productivity, wages and jobs in Europe, INDICSER discussion paper number 36, December 2012. Rogers, Howard, The impact of a globalising market on future European gas supply and pricing: The importance of Asian demand and North American supply, Oxford Institute for Energy Studies, January 2012. Rubini, Loris, Klaus Desmet, Facundo Piguillem, and Aránzazu Crespo, Breaking down the barriers to firm growth in Europe: The fourth EFIGE policy report, Bruegel Blueprint Series, volume XVIII, August 2012. S Salomäki, Aino, and Teresa Munzi, Net replacement rate of the unemployed: Comparisons of various approaches, European Union economic paper number 133, February 1999. Sapir, André, “Globalization and the reform of European social models”, Journal of Common Market Studies, volume 44, number 2, June 2006. Sinclair, David, Jessica Watson, and Brian Beach, Working longer: An EU perspective, International Longevity Centre, September 2013. Statistics Finland, Special education 2013: Share of students having received special support diminished, June 2014. Stern, David I., “The rise and fall of the environmental Kuznets curve”, World Development, volume 32, issue 8, August 2004. Sykes, Brooke, Mobile talent? The staying intentions of international students in five EU countries, Migration Policy Group, April 2012. T Tadjeddine, Karim, “‘A duty to modernize’: Reforming the French civil service”, McKinsey Quarterly, April 2011. Tereanu, Eugen, Anita Tuladhar, and Alejandro Simone, Structural balance targeting and output gap uncertainty, IMF working paper number 14/107, June 2014. 242 McKinsey Global Institute Bibliography . Teulings, Coen, and Richard Baldwin, eds., Secular stagnation: Facts, causes and cures, Centre for Economic Policy Research, August 2014. Thévenon, Olivier, Policy drivers of female labour force participation in OECD countries, presented at Seminar on Early Childhood Education and Care in Brussels, December 4, 2013. Tilford, Simon, and Philip Whyte, eds., Innovation: How Europe can take off, Centre for European Reform, July 2011. Tompson, William, and Robert Price, The political economy of reform: Lessons from pensions, product markets and labour markets in ten OECD countries, OECD, 2009. Turner, Adair, “Population ageing: What should we worry about?” Philosophical Transactions of the Royal Society, volume 364, issue 1532, October 2009. U United Kingdom Office for National Statistics, Public service productivity estimates: Total public services, 2010, April 2013. US Energy Information Administration, “Figure MT-46: U.S. exports of liquefied natural gas in five cases, 2005–40”, in Annual Energy Outlook 2014, April 2014. US White House, Executive order: Making open and machine readable the new default for government information, May 9, 2013. V Van Campenhout, Geert, and Tom Van Caneghem, “How did the notional interest deduction affect Belgian SMEs’ capital structure?” Small Business Economics, volume 40, issue 2, February 2013. Van der Ende, Martin, Peter Donker van Heel, Kenneth Walsh, Jena de Wit, and Natalija Ziminiene, European vacancy and recruitment report 2012, European Commission, November 2012. Van de Vijver, Fons, and Norbert K. Tanzer, “Bias and equivalence in cross-cultural assessment: An overview”, Revue européenne de psychologie appliquée, volume 54, issue 2, 2004. VTT Technical Research Centre of Finland, “Smoother passenger traffic across the FinnishRussian border”, press release, April 15, 2014. W Wagenvoort, Rien, and Sanne Zwart, Uncovering the common risk free rate in the European Monetary Union, European Investment Bank economic and financial report number 2010/05, September 2010. Walker, Tom, “Why economists dislike a lump of labor”, Review of Social Economy, volume 65, issue 3, September 2007. World Bank, World development report 2009: Reshaping economic geography, 2008. McKinsey Global Institute A window of opportunity for Europe 243 . World Economic Forum, The competitiveness of cities, August 2014. World Economic Forum, Enhancing Europe’s competitiveness: Fostering innovation-driven entrepreneurship in Europe, June 2014. World Economic Forum, Global competitiveness report 2013–2014, September 2013. World Economic Forum, Global competiveness report 2014–2015, September 2014. Z Zachmann, Georg, and Valeria Cipollone, “Energy competitiveness”, in Manufacturing Europe’s future, Reinhilde Veugelers, ed., Breugel Blueprint Series, volume XXI, 2013. Zipfel, Frank, and Caroline Heinrichs, The impact of tax systems on economic growth in Europe: An overview, DB Research, Deutsche Bank, October 2012. 244 McKinsey Global Institute Bibliography . RELATED MGI AND MCKINSEY RESEARCH Global growth: Can productivity save the day in an aging world? (January 2015) Without action, global economic growth will almost halve in the next 50 years. A new McKinsey Global Institute report offers a solution: a dramatic improvement in productivity. Game changers: Five opportunities for US growth and renewal (July 2013) Five “growth drivers” have the potential to add hundreds of billions of dollars to annual GDP and create millions of new jobs by 2020. Global flows in a digital age: How trade, finance, people, and data connect the world economy (April 2014) The movement of goods and services, finance, and people has reached previously unimagined levels. Global flows are creating new degrees of connectedness among economies—and playing an ever-larger role in determining the fate of nations, companies, and individuals. To be unconnected is to fall behind. McKinsey Insights app Explore insights from McKinsey, MGI, and McKinsey Quarterly—all delivered seamlessly to your mobile devices.
Broaden your knowledge and widen your perspective on our latest thinking on issues facing senior leaders and spanning all industries, functions, and geographies. A new dawn: Reigniting growth in Central and Eastern Europe (December 2013) The nations of Central and Eastern Europe were among the fastest growing in the world before the global financial crisis. Restoring that kind of growth will require a strategy that raises investment, expands high-value exports, unleashes productivity in domestic sectors, revives foreign direct investment, and increases domestic savings. www.mckinsey.com/mgi E-book versions of selected MGI reports are available at MGI’s website, Amazon’s Kindle bookstore, and Apple’s iBooks Store. Download and listen to MGI podcasts on iTunes or at www.mckinsey.com/mgi/publications/multimedia/ Cover image: Thumbs up © iStockphoto. Contents page images: Woodworkers © Getty Images; .scientists © Getty Images; writers © Corbis. Infographic by Darby Films. . McKinsey Global Institute June 2015 Copyright © McKinsey & Company www.mckinsey.com/mgi @McKinsey_MGI McKinseyGlobalInstitute .


