


Description
MARCU M
Commercial Construction
Index
Issue 14
FOURTH QUARTER 2015
IN THIS ISSUE
Nonresidential Construction Data Mixed at Year’s End
Joe’s View
Exhibit 1. Nonresidential Construction Spending,
December 2010 through December 2015 - GRAPH
Exhibit 2. Construction Employment Growth in Twenty Largest
U.S. Metropolitan Areas, December 2015 v.
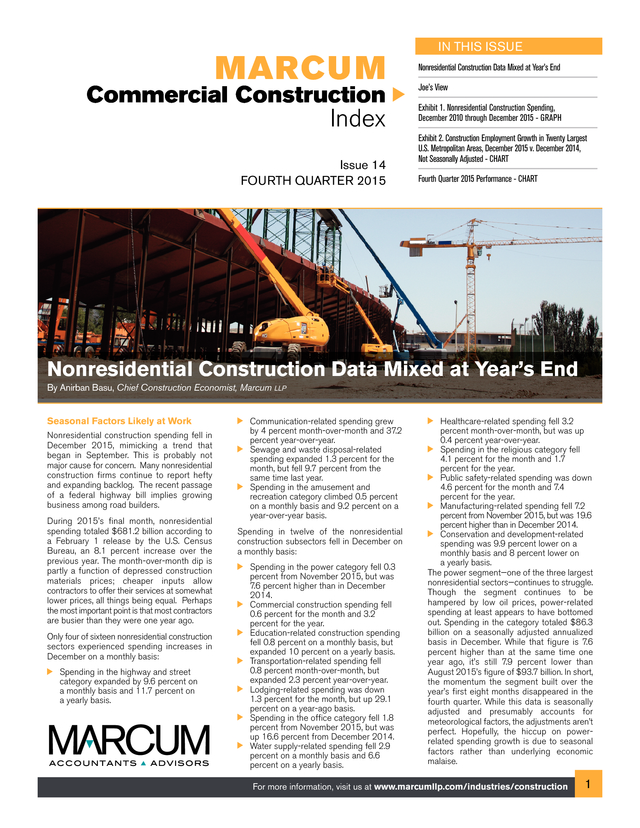
December 2014, Not Seasonally Adjusted - CHART Fourth Quarter 2015 Performance - CHART Nonresidential Construction Data Mixed at Year’s End By Anirban Basu, Chief Construction Economist, Marcum LLP Seasonal Factors Likely at Work Nonresidential construction spending fell in December 2015, mimicking a trend that began in September. This is probably not major cause for concern. Many nonresidential construction firms continue to report hefty and expanding backlog.
The recent passage of a federal highway bill implies growing business among road builders. During 2015’s final month, nonresidential spending totaled $681.2 billion according to a February 1 release by the U.S. Census Bureau, an 8.1 percent increase over the previous year. The month-over-month dip is partly a function of depressed construction materials prices; cheaper inputs allow contractors to offer their services at somewhat lower prices, all things being equal.
Perhaps the most important point is that most contractors are busier than they were one year ago. Only four of sixteen nonresidential construction sectors experienced spending increases in December on a monthly basis: Spending in the highway and street category expanded by 9.6 percent on a monthly basis and 11.7 percent on a yearly basis. Communication-related spending grew by 4 percent month-over-month and 37.2 percent year-over-year. Sewage and waste disposal-related spending expanded 1.3 percent for the month, but fell 9.7 percent from the same time last year. Spending in the amusement and recreation category climbed 0.5 percent on a monthly basis and 9.2 percent on a year-over-year basis. Spending in twelve of the nonresidential construction subsectors fell in December on a monthly basis: Spending in the power category fell 0.3 percent from November 2015, but was 7.6 percent higher than in December 2014. Commercial construction spending fell 0.6 percent for the month and 3.2 percent for the year. Education-related construction spending fell 0.8 percent on a monthly basis, but expanded 10 percent on a yearly basis. Transportation-related spending fell 0.8 percent month-over-month, but expanded 2.3 percent year-over-year. Lodging-related spending was down 1.3 percent for the month, but up 29.1 percent on a year-ago basis. Spending in the office category fell 1.8 percent from November 2015, but was up 16.6 percent from December 2014. Water supply-related spending fell 2.9 percent on a monthly basis and 6.6 percent on a yearly basis. Healthcare-related spending fell 3.2 percent month-over-month, but was up 0.4 percent year-over-year. Spending in the religious category fell 4.1 percent for the month and 1.7 percent for the year. Public safety-related spending was down 4.6 percent for the month and 7.4 percent for the year. Manufacturing-related spending fell 7.2 percent from November 2015, but was 19.6 percent higher than in December 2014. Conservation and development-related spending was 9.9 percent lower on a monthly basis and 8 percent lower on a yearly basis. The power segment–one of the three largest nonresidential sectors–continues to struggle. Though the segment continues to be hampered by low oil prices, power-related spending at least appears to have bottomed out. Spending in the category totaled $86.3 billion on a seasonally adjusted annualized basis in December. While that figure is 7.6 percent higher than at the same time one year ago, it’s still 7.9 percent lower than August 2015’s figure of $93.7 billion.
In short, the momentum the segment built over the year’s first eight months disappeared in the fourth quarter. While this data is seasonally adjusted and presumably accounts for meteorological factors, the adjustments aren’t perfect. Hopefully, the hiccup on powerrelated spending growth is due to seasonal factors rather than underlying economic malaise. For more information, visit us at www.marcumllp.com/industries/construction 1 .
All that said, as any good weatherman could tell you, partly cloudy is always also party sunny, and there is some good news to report. Commercial builders are telling us that their backlogs are good. In fact, for those of you who build the roads that connect this nation, the outlook is actually pretty exciting. Q4 saw a bump in public spending and, specifically, in road building, which, whether by act of Congress or thanks to increased tax revenue, is a good thing for owners and workers alike. Stay Warm, Joseph Natarelli, CPA National Construction Industry Group Leader, Marcum LLP Washington, D.C., state and local governments in much of the country have seen income, sales, and property tax collections rebound. Policymakers in certain parts of the country are now exhibiting greater budgetary confidence, which, in turn, is leading to expanding capital budgets. 30% Private 20% Public 10% 0% -10% -20% -30% Dec-15 Jun-15 Sep-15 Mar-15 Sep-14 Dec-14 Jun-14 Mar-14 Sep-13 Dec-13 Jun-13 Mar-13 Dec-12 Jun-12 Sep-12 Mar-12 Source: Census Bureau Dec-11 -40% Jun-11 I’ll be the first to admit that I am no economist (I will leave that territory to Anirban Basu), so I will spare you my analysis on the presence of inflationary influences out there right now.
Suffice it to say, they are out there. But, what does that mean to you? Well, it could mean that global banks will think twice about how they lend money and, likely, the interest rates at which they lend it. While our domestic consumer spending has buoyed the economy here, do not look abroad for a further bounce. As you will read, from Russia to Brazil to Japan to Canada…times are tough (cue thunder clap and lightning). What may be a bit more surprising is the recent uptick in public sector spending.
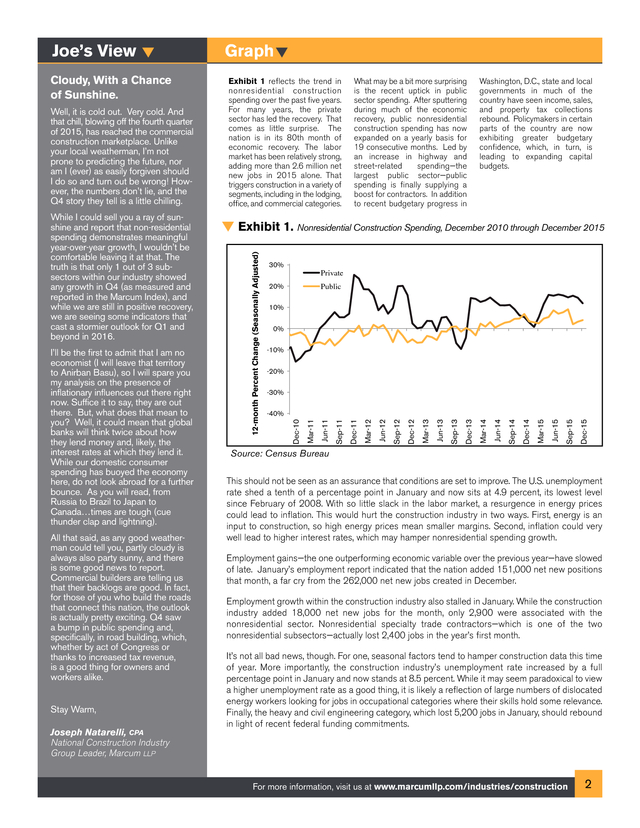
After sputtering during much of the economic recovery, public nonresidential construction spending has now expanded on a yearly basis for 19 consecutive months. Led by an increase in highway and street-related spending–the largest public sector–public spending is finally supplying a boost for contractors. In addition to recent budgetary progress in Exhibit 1.
Nonresidential Construction Spending, December 2010 through December 2015 Sep-11 While I could sell you a ray of sunshine and report that non-residential spending demonstrates meaningful year-over-year growth, I wouldn’t be comfortable leaving it at that. The truth is that only 1 out of 3 subsectors within our industry showed any growth in Q4 (as measured and reported in the Marcum Index), and while we are still in positive recovery, we are seeing some indicators that cast a stormier outlook for Q1 and beyond in 2016. Mar-11 Well, it is cold out. Very cold.
And that chill, blowing off the fourth quarter of 2015, has reached the commercial construction marketplace. Unlike your local weatherman, I’m not prone to predicting the future, nor am I (ever) as easily forgiven should I do so and turn out be wrong! However, the numbers don’t lie, and the Q4 story they tell is a little chilling. Exhibit 1 reflects the trend in nonresidential construction spending over the past five years. For many years, the private sector has led the recovery. That comes as little surprise.
The nation is in its 80th month of economic recovery. The labor market has been relatively strong, adding more than 2.6 million net new jobs in 2015 alone. That triggers construction in a variety of segments, including in the lodging, office, and commercial categories. Dec-10 Cloudy, With a Chance of Sunshine. Graph 12-month Percent Change (Seasonally Adjusted) Joe’s View This should not be seen as an assurance that conditions are set to improve.
The U.S. unemployment rate shed a tenth of a percentage point in January and now sits at 4.9 percent, its lowest level since February of 2008. With so little slack in the labor market, a resurgence in energy prices could lead to inflation.
This would hurt the construction industry in two ways. First, energy is an input to construction, so high energy prices mean smaller margins. Second, inflation could very well lead to higher interest rates, which may hamper nonresidential spending growth. Employment gains–the one outperforming economic variable over the previous year–have slowed of late.
January’s employment report indicated that the nation added 151,000 net new positions that month, a far cry from the 262,000 net new jobs created in December. Employment growth within the construction industry also stalled in January. While the construction industry added 18,000 net new jobs for the month, only 2,900 were associated with the nonresidential sector. Nonresidential specialty trade contractors–which is one of the two nonresidential subsectors–actually lost 2,400 jobs in the year’s first month. It’s not all bad news, though.
For one, seasonal factors tend to hamper construction data this time of year. More importantly, the construction industry’s unemployment rate increased by a full percentage point in January and now stands at 8.5 percent. While it may seem paradoxical to view a higher unemployment rate as a good thing, it is likely a reflection of large numbers of dislocated energy workers looking for jobs in occupational categories where their skills hold some relevance. Finally, the heavy and civil engineering category, which lost 5,200 jobs in January, should rebound in light of recent federal funding commitments. For more information, visit us at www.marcumllp.com/industries/construction 2 .
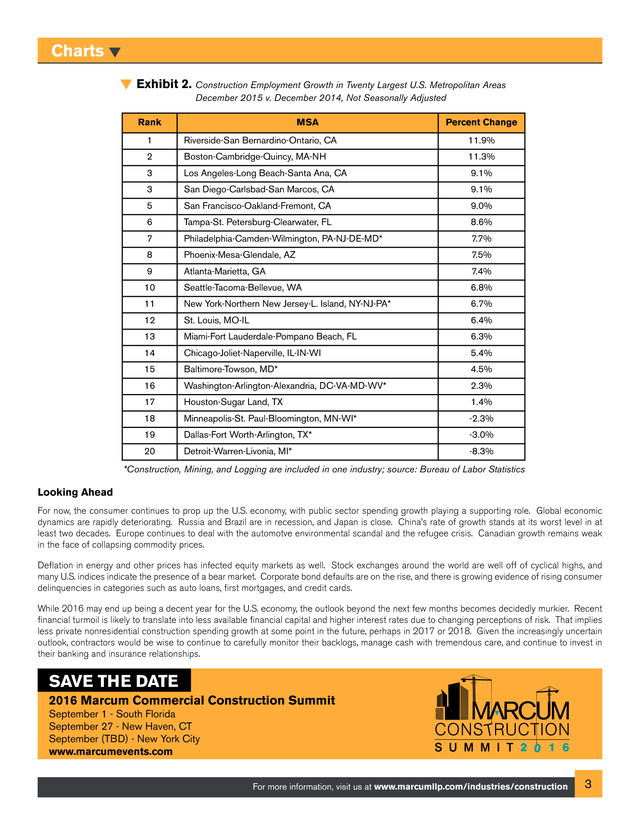
Charts Exhibit 2. Construction Employment Growth in Twenty Largest U.S. Metropolitan Areas December 2015 v. December 2014, Not Seasonally Adjusted Rank MSA 1 Riverside-San Bernardino-Ontario, CA 3 Los Angeles-Long Beach-Santa Ana, CA 2 3 5 6 7 8 9 10 11 12 13 14 15 16 17 18 19 20 Looking Ahead Boston-Cambridge-Quincy, MA-NH San Diego-Carlsbad-San Marcos, CA San Francisco-Oakland-Fremont, CA Tampa-St.
Petersburg-Clearwater, FL Philadelphia-Camden-Wilmington, PA-NJ-DE-MD* Phoenix-Mesa-Glendale, AZ Atlanta-Marietta, GA Percent Change 11.9% 11.3% 9.1% 9.1% 9.0% 8.6% 7.7% 7.5% 7.4% Seattle-Tacoma-Bellevue, WA 6.8% St. Louis, MO-IL 6.4% New York-Northern New Jersey-L. Island, NY-NJ-PA* Miami-Fort Lauderdale-Pompano Beach, FL Chicago-Joliet-Naperville, IL-IN-WI Baltimore-Towson, MD* Washington-Arlington-Alexandria, DC-VA-MD-WV* Houston-Sugar Land, TX 6.7% 6.3% 5.4% 4.5% 2.3% 1.4% Minneapolis-St.
Paul-Bloomington, MN-WI* -2.3% Detroit-Warren-Livonia, MI* -8.3% Dallas-Fort Worth-Arlington, TX* -3.0% *Construction, Mining, and Logging are included in one industry; source: Bureau of Labor Statistics For now, the consumer continues to prop up the U.S. economy, with public sector spending growth playing a supporting role. Global economic dynamics are rapidly deteriorating.
Russia and Brazil are in recession, and Japan is close. China’s rate of growth stands at its worst level in at least two decades. Europe continues to deal with the automotve environmental scandal and the refugee crisis.
Canadian growth remains weak in the face of collapsing commodity prices. Deflation in energy and other prices has infected equity markets as well. Stock exchanges around the world are well off of cyclical highs, and many U.S. indices indicate the presence of a bear market.
Corporate bond defaults are on the rise, and there is growing evidence of rising consumer delinquencies in categories such as auto loans, first mortgages, and credit cards. While 2016 may end up being a decent year for the U.S. economy, the outlook beyond the next few months becomes decidedly murkier. Recent financial turmoil is likely to translate into less available financial capital and higher interest rates due to changing perceptions of risk.
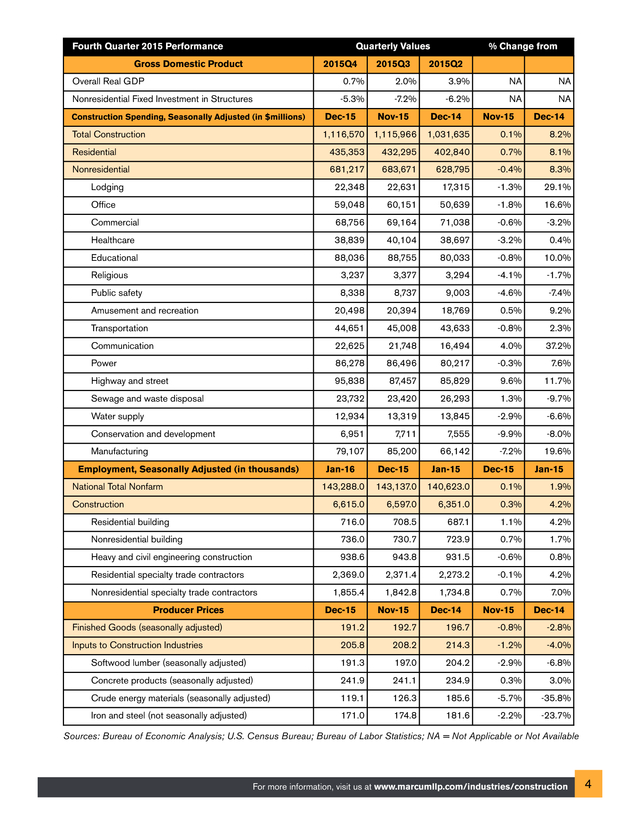
That implies less private nonresidential construction spending growth at some point in the future, perhaps in 2017 or 2018. Given the increasingly uncertain outlook, contractors would be wise to continue to carefully monitor their backlogs, manage cash with tremendous care, and continue to invest in their banking and insurance relationships. SAVE THE DATE 2016 Marcum Commercial Construction Summit September 1 - South Florida September 27 - New Haven, CT September (TBD) - New York City www.marcumevents.com 6 For more information, visit us at www.marcumllp.com/industries/construction 3 . Fourth Quarter 2015 Performance Quarterly Values Gross Domestic Product 2015Q4 Overall Real GDP 0.7% Nonresidential Fixed Investment in Structures Construction Spending, Seasonally Adjusted (in $millions) Total Construction Residential -5.3% Dec-15 2015Q3 2.0% -7.2% Nov-15 1,116,570 1,115,966 435,353 22,348 Nonresidential 432,295 22,631 681,217 Lodging Office 59,048 Healthcare 38,839 Commercial 683,671 2015Q2 3.9% -6.2% Dec-14 1,031,635 402,840 Public safety 40,104 38,697 80,033 8,737 9,003 3,377 71,038 3,294 20,498 20,394 Communication 22,625 21,748 16,494 87,457 85,829 13,319 85,200 44,651 Power 86,496 23,732 23,420 6,951 7,711 95,838 Water supply 12,934 Manufacturing 79,107 Sewage and waste disposal Conservation and development Employment, Seasonally Adjusted (in thousands) National Total Nonfarm Jan-16 Dec-15 18,769 Residential building Nonresidential building Heavy and civil engineering construction Residential specialty trade contractors Nonresidential specialty trade contractors Producer Prices Finished Goods (seasonally adjusted) 2,369.0 1,855.4 Dec-15 191.2 Inputs to Construction Industries 943.8 2,371.4 1,842.8 Nov-15 192.7 205.8 Softwood lumber (seasonally adjusted) Concrete products (seasonally adjusted) Crude energy materials (seasonally adjusted) 208.2 241.9 241.1 171.0 174.8 191.3 119.1 8.3% -3.2% -3.2% 16.6% 0.4% -0.8% 10.0% -4.6% -7.4% -4.1% 0.5% -0.3% 26,293 1.3% -1.7% 9.2% 2.3% 9.6% 11.7% 13,845 -2.9% -6.6% 66,142 -7.2% 7,555 Jan-15 687.1 938.6 8.1% -0.6% 80,217 708.5 730.7 8.2% 37.2% 140,623.0 736.0 Dec-14 4.0% 143,137.0 6,597.0 NA 29.1% -0.8% 143,288.0 6,615.0 NA -1.3% 43,633 716.0 Construction Iron and steel (not seasonally adjusted) 45,008 86,278 Highway and street 0.7% -1.8% Amusement and recreation Transportation 0.1% 50,639 88,755 8,338 Nov-15 60,151 17,315 69,164 3,237 NA -0.4% 88,036 Religious NA 628,795 68,756 Educational % Change from 6,351.0 723.9 -9.9% Dec-15 0.1% 0.3% 1.1% 0.7% 931.5 -0.6% 1,734.8 0.7% 2,273.2 Dec-14 196.7 214.3 197.0 204.2 126.3 185.6 234.9 181.6 -0.1% Nov-15 -0.8% -1.2% -2.9% 0.3% -5.7% -2.2% 7.6% -9.7% -8.0% 19.6% Jan-15 1.9% 4.2% 4.2% 1.7% 0.8% 4.2% 7.0% Dec-14 -2.8% -4.0% -6.8% 3.0% -35.8% -23.7% Sources: Bureau of Economic Analysis; U.S. Census Bureau; Bureau of Labor Statistics; NA = Not Applicable or Not Available For more information, visit us at www.marcumllp.com/industries/construction 4 . Services Marcum LLP is one of the largest independent public accounting and advisory services firms in the nation, with offices in major business markets throughout the U.S., Grand Cayman and China. Headquartered in New York City, Marcum provides a full spectrum of traditional tax, accounting and assurance services; advisory, valuation and litigation support; and an extensive range of specialty and niche industry practices. The Firm serves both privately held and publicly traded companies, as well as high net worth individuals, private equity and hedge funds, with a focus on middlemarket companies and closely held family businesses. Marcum is a member of the Marcum Group, an organization providing a comprehensive array of professional services. Assurance Marcum’s Assurance Division professionals provide a tailored Audit approach to each engagement.
Team members place a strong emphasis on early planning and learning the unique aspects of a client’s business. Doing so ensures that each client receives an effective, cost-efficient and independent audit performed in a timely manner. The Assurance Division works with commercial and SEC clients, governmental and not-forprofit entities and employee retirement plans. A full range of services is offered including: Agreed-Upon Procedures. Attestation. Financial Audits Reviews and Compilations. Breakeven Analyses. Single Audits. Sarbanes-Oxley 404 Compliance. Forecasts and Projections. Internal Audits. Internal Control Reviews. IT Audit and Advisory Services. Strategic and Operational Planning. Tax & Business The Tax & Business Services Division is comprised of dedicated professionals who have been involved with numerous complex transactions at the local, national and international levels. The division offers all forms of regulatory compliance services, planning and specialization in a variety of areas including: Estates, Gifts and Trusts. Family Wealth Planning. Bankruptcy and Insolvency Tax. State and Local Taxation. SEC and Large Corporate Matters. International Taxation. Real Estate Tax Services. IRS Representation. With partner involvement at every level of service, the Tax & Business Services team provides highly personalized advice and guidance to a client base including: High Net Worth Individuals. Family Business Owners. Large Corporations. International Businesses. Foreign Nationals. Tax Exempt Clients. Joseph Natarelli Joseph Natarelli is the national leader of Marcum’s Construction Industry Practice and partner-in-charge of the Firm’s New Haven office.
For nearly a decade, he has served as a technical reviewer for the AICPA’s Audit Risk Alert for Construction Contractors and the AICPA Accounting Guide — Construction Contractors. Joe also served as 2013-2014 chair of the AICPA National Construction Industry Conference. National Construction Industry Services Leaders Advisory Marcum’s Advisory Services Division works with clients across a broad range of industries. The team’s skilled professionals use their experience to help clients address and navigate complex business and personal issues including: Bankruptcy and Fiduciary Services Insolvency and Receivership. Trustee, Reorganization and Financial Advisory Services. Forensic and Litigation Services Forensic Accounting and Fraud Assessment. Damage Determination and Expert Testimony. Marital Dissolution. Regulatory Compliance, including Bank Secrecy Act and Taxation. Due Diligence and Capital Formation. Computer Forensics. Business Valuation. Operational & Process Improvement Business Process Improvement. Internal Controls and Governance. Real Estate Advisory Services. Family Office Services. Risk Management. Anirban Basu Anirban Basu is Marcum’s chief construction economist. He is also a member of the Firm’s National Construction Practice, as well as chairman & CEO of Sage Policy Group, Inc., an economic and policy consulting firm in Baltimore, Maryland. Anirban leads Marcum’s research and analysis of the economic health of the commercial construction industry in America. Additionally, he writes the quarterly Marcum Commercial Construction Index and annual Marcum JOLT Survey analysis. JOSEPH NATARELLI National Construction Industry Goup Leader joseph.natarelli@marcumllp.com 203.781.9710 PHILADELPHIA: CHICAGO: ROBERT MERCADO robert.mercado@marcumllp.com 203.781.9730 NASHVILLE: JAMES LUNDY james.lundy@marcumllp.com 615.245.4050 CALIFORNIA: NEW ENGLAND: NEW YORK: IRA KANTOR ira.kantor@marcumllp.com 631.414.4726 EDWARD REITMEYER edward.reitmeyer@marcumllp.com 484.270.2595 FLORIDA: WHIT FOREHAND whit.forehand@marcumllp.com 407.458.5210 TIM CROSBY tim.crosby@marcumllp.com 847.282.6368 STEVE RAPATTONI steve.rapattoni@marcumllp.com 949.236.5670 5 .
December 2014, Not Seasonally Adjusted - CHART Fourth Quarter 2015 Performance - CHART Nonresidential Construction Data Mixed at Year’s End By Anirban Basu, Chief Construction Economist, Marcum LLP Seasonal Factors Likely at Work Nonresidential construction spending fell in December 2015, mimicking a trend that began in September. This is probably not major cause for concern. Many nonresidential construction firms continue to report hefty and expanding backlog.
The recent passage of a federal highway bill implies growing business among road builders. During 2015’s final month, nonresidential spending totaled $681.2 billion according to a February 1 release by the U.S. Census Bureau, an 8.1 percent increase over the previous year. The month-over-month dip is partly a function of depressed construction materials prices; cheaper inputs allow contractors to offer their services at somewhat lower prices, all things being equal.
Perhaps the most important point is that most contractors are busier than they were one year ago. Only four of sixteen nonresidential construction sectors experienced spending increases in December on a monthly basis: Spending in the highway and street category expanded by 9.6 percent on a monthly basis and 11.7 percent on a yearly basis. Communication-related spending grew by 4 percent month-over-month and 37.2 percent year-over-year. Sewage and waste disposal-related spending expanded 1.3 percent for the month, but fell 9.7 percent from the same time last year. Spending in the amusement and recreation category climbed 0.5 percent on a monthly basis and 9.2 percent on a year-over-year basis. Spending in twelve of the nonresidential construction subsectors fell in December on a monthly basis: Spending in the power category fell 0.3 percent from November 2015, but was 7.6 percent higher than in December 2014. Commercial construction spending fell 0.6 percent for the month and 3.2 percent for the year. Education-related construction spending fell 0.8 percent on a monthly basis, but expanded 10 percent on a yearly basis. Transportation-related spending fell 0.8 percent month-over-month, but expanded 2.3 percent year-over-year. Lodging-related spending was down 1.3 percent for the month, but up 29.1 percent on a year-ago basis. Spending in the office category fell 1.8 percent from November 2015, but was up 16.6 percent from December 2014. Water supply-related spending fell 2.9 percent on a monthly basis and 6.6 percent on a yearly basis. Healthcare-related spending fell 3.2 percent month-over-month, but was up 0.4 percent year-over-year. Spending in the religious category fell 4.1 percent for the month and 1.7 percent for the year. Public safety-related spending was down 4.6 percent for the month and 7.4 percent for the year. Manufacturing-related spending fell 7.2 percent from November 2015, but was 19.6 percent higher than in December 2014. Conservation and development-related spending was 9.9 percent lower on a monthly basis and 8 percent lower on a yearly basis. The power segment–one of the three largest nonresidential sectors–continues to struggle. Though the segment continues to be hampered by low oil prices, power-related spending at least appears to have bottomed out. Spending in the category totaled $86.3 billion on a seasonally adjusted annualized basis in December. While that figure is 7.6 percent higher than at the same time one year ago, it’s still 7.9 percent lower than August 2015’s figure of $93.7 billion.
In short, the momentum the segment built over the year’s first eight months disappeared in the fourth quarter. While this data is seasonally adjusted and presumably accounts for meteorological factors, the adjustments aren’t perfect. Hopefully, the hiccup on powerrelated spending growth is due to seasonal factors rather than underlying economic malaise. For more information, visit us at www.marcumllp.com/industries/construction 1 .
All that said, as any good weatherman could tell you, partly cloudy is always also party sunny, and there is some good news to report. Commercial builders are telling us that their backlogs are good. In fact, for those of you who build the roads that connect this nation, the outlook is actually pretty exciting. Q4 saw a bump in public spending and, specifically, in road building, which, whether by act of Congress or thanks to increased tax revenue, is a good thing for owners and workers alike. Stay Warm, Joseph Natarelli, CPA National Construction Industry Group Leader, Marcum LLP Washington, D.C., state and local governments in much of the country have seen income, sales, and property tax collections rebound. Policymakers in certain parts of the country are now exhibiting greater budgetary confidence, which, in turn, is leading to expanding capital budgets. 30% Private 20% Public 10% 0% -10% -20% -30% Dec-15 Jun-15 Sep-15 Mar-15 Sep-14 Dec-14 Jun-14 Mar-14 Sep-13 Dec-13 Jun-13 Mar-13 Dec-12 Jun-12 Sep-12 Mar-12 Source: Census Bureau Dec-11 -40% Jun-11 I’ll be the first to admit that I am no economist (I will leave that territory to Anirban Basu), so I will spare you my analysis on the presence of inflationary influences out there right now.
Suffice it to say, they are out there. But, what does that mean to you? Well, it could mean that global banks will think twice about how they lend money and, likely, the interest rates at which they lend it. While our domestic consumer spending has buoyed the economy here, do not look abroad for a further bounce. As you will read, from Russia to Brazil to Japan to Canada…times are tough (cue thunder clap and lightning). What may be a bit more surprising is the recent uptick in public sector spending.
After sputtering during much of the economic recovery, public nonresidential construction spending has now expanded on a yearly basis for 19 consecutive months. Led by an increase in highway and street-related spending–the largest public sector–public spending is finally supplying a boost for contractors. In addition to recent budgetary progress in Exhibit 1.
Nonresidential Construction Spending, December 2010 through December 2015 Sep-11 While I could sell you a ray of sunshine and report that non-residential spending demonstrates meaningful year-over-year growth, I wouldn’t be comfortable leaving it at that. The truth is that only 1 out of 3 subsectors within our industry showed any growth in Q4 (as measured and reported in the Marcum Index), and while we are still in positive recovery, we are seeing some indicators that cast a stormier outlook for Q1 and beyond in 2016. Mar-11 Well, it is cold out. Very cold.
And that chill, blowing off the fourth quarter of 2015, has reached the commercial construction marketplace. Unlike your local weatherman, I’m not prone to predicting the future, nor am I (ever) as easily forgiven should I do so and turn out be wrong! However, the numbers don’t lie, and the Q4 story they tell is a little chilling. Exhibit 1 reflects the trend in nonresidential construction spending over the past five years. For many years, the private sector has led the recovery. That comes as little surprise.
The nation is in its 80th month of economic recovery. The labor market has been relatively strong, adding more than 2.6 million net new jobs in 2015 alone. That triggers construction in a variety of segments, including in the lodging, office, and commercial categories. Dec-10 Cloudy, With a Chance of Sunshine. Graph 12-month Percent Change (Seasonally Adjusted) Joe’s View This should not be seen as an assurance that conditions are set to improve.
The U.S. unemployment rate shed a tenth of a percentage point in January and now sits at 4.9 percent, its lowest level since February of 2008. With so little slack in the labor market, a resurgence in energy prices could lead to inflation.
This would hurt the construction industry in two ways. First, energy is an input to construction, so high energy prices mean smaller margins. Second, inflation could very well lead to higher interest rates, which may hamper nonresidential spending growth. Employment gains–the one outperforming economic variable over the previous year–have slowed of late.
January’s employment report indicated that the nation added 151,000 net new positions that month, a far cry from the 262,000 net new jobs created in December. Employment growth within the construction industry also stalled in January. While the construction industry added 18,000 net new jobs for the month, only 2,900 were associated with the nonresidential sector. Nonresidential specialty trade contractors–which is one of the two nonresidential subsectors–actually lost 2,400 jobs in the year’s first month. It’s not all bad news, though.
For one, seasonal factors tend to hamper construction data this time of year. More importantly, the construction industry’s unemployment rate increased by a full percentage point in January and now stands at 8.5 percent. While it may seem paradoxical to view a higher unemployment rate as a good thing, it is likely a reflection of large numbers of dislocated energy workers looking for jobs in occupational categories where their skills hold some relevance. Finally, the heavy and civil engineering category, which lost 5,200 jobs in January, should rebound in light of recent federal funding commitments. For more information, visit us at www.marcumllp.com/industries/construction 2 .
Charts Exhibit 2. Construction Employment Growth in Twenty Largest U.S. Metropolitan Areas December 2015 v. December 2014, Not Seasonally Adjusted Rank MSA 1 Riverside-San Bernardino-Ontario, CA 3 Los Angeles-Long Beach-Santa Ana, CA 2 3 5 6 7 8 9 10 11 12 13 14 15 16 17 18 19 20 Looking Ahead Boston-Cambridge-Quincy, MA-NH San Diego-Carlsbad-San Marcos, CA San Francisco-Oakland-Fremont, CA Tampa-St.
Petersburg-Clearwater, FL Philadelphia-Camden-Wilmington, PA-NJ-DE-MD* Phoenix-Mesa-Glendale, AZ Atlanta-Marietta, GA Percent Change 11.9% 11.3% 9.1% 9.1% 9.0% 8.6% 7.7% 7.5% 7.4% Seattle-Tacoma-Bellevue, WA 6.8% St. Louis, MO-IL 6.4% New York-Northern New Jersey-L. Island, NY-NJ-PA* Miami-Fort Lauderdale-Pompano Beach, FL Chicago-Joliet-Naperville, IL-IN-WI Baltimore-Towson, MD* Washington-Arlington-Alexandria, DC-VA-MD-WV* Houston-Sugar Land, TX 6.7% 6.3% 5.4% 4.5% 2.3% 1.4% Minneapolis-St.
Paul-Bloomington, MN-WI* -2.3% Detroit-Warren-Livonia, MI* -8.3% Dallas-Fort Worth-Arlington, TX* -3.0% *Construction, Mining, and Logging are included in one industry; source: Bureau of Labor Statistics For now, the consumer continues to prop up the U.S. economy, with public sector spending growth playing a supporting role. Global economic dynamics are rapidly deteriorating.
Russia and Brazil are in recession, and Japan is close. China’s rate of growth stands at its worst level in at least two decades. Europe continues to deal with the automotve environmental scandal and the refugee crisis.
Canadian growth remains weak in the face of collapsing commodity prices. Deflation in energy and other prices has infected equity markets as well. Stock exchanges around the world are well off of cyclical highs, and many U.S. indices indicate the presence of a bear market.
Corporate bond defaults are on the rise, and there is growing evidence of rising consumer delinquencies in categories such as auto loans, first mortgages, and credit cards. While 2016 may end up being a decent year for the U.S. economy, the outlook beyond the next few months becomes decidedly murkier. Recent financial turmoil is likely to translate into less available financial capital and higher interest rates due to changing perceptions of risk.
That implies less private nonresidential construction spending growth at some point in the future, perhaps in 2017 or 2018. Given the increasingly uncertain outlook, contractors would be wise to continue to carefully monitor their backlogs, manage cash with tremendous care, and continue to invest in their banking and insurance relationships. SAVE THE DATE 2016 Marcum Commercial Construction Summit September 1 - South Florida September 27 - New Haven, CT September (TBD) - New York City www.marcumevents.com 6 For more information, visit us at www.marcumllp.com/industries/construction 3 . Fourth Quarter 2015 Performance Quarterly Values Gross Domestic Product 2015Q4 Overall Real GDP 0.7% Nonresidential Fixed Investment in Structures Construction Spending, Seasonally Adjusted (in $millions) Total Construction Residential -5.3% Dec-15 2015Q3 2.0% -7.2% Nov-15 1,116,570 1,115,966 435,353 22,348 Nonresidential 432,295 22,631 681,217 Lodging Office 59,048 Healthcare 38,839 Commercial 683,671 2015Q2 3.9% -6.2% Dec-14 1,031,635 402,840 Public safety 40,104 38,697 80,033 8,737 9,003 3,377 71,038 3,294 20,498 20,394 Communication 22,625 21,748 16,494 87,457 85,829 13,319 85,200 44,651 Power 86,496 23,732 23,420 6,951 7,711 95,838 Water supply 12,934 Manufacturing 79,107 Sewage and waste disposal Conservation and development Employment, Seasonally Adjusted (in thousands) National Total Nonfarm Jan-16 Dec-15 18,769 Residential building Nonresidential building Heavy and civil engineering construction Residential specialty trade contractors Nonresidential specialty trade contractors Producer Prices Finished Goods (seasonally adjusted) 2,369.0 1,855.4 Dec-15 191.2 Inputs to Construction Industries 943.8 2,371.4 1,842.8 Nov-15 192.7 205.8 Softwood lumber (seasonally adjusted) Concrete products (seasonally adjusted) Crude energy materials (seasonally adjusted) 208.2 241.9 241.1 171.0 174.8 191.3 119.1 8.3% -3.2% -3.2% 16.6% 0.4% -0.8% 10.0% -4.6% -7.4% -4.1% 0.5% -0.3% 26,293 1.3% -1.7% 9.2% 2.3% 9.6% 11.7% 13,845 -2.9% -6.6% 66,142 -7.2% 7,555 Jan-15 687.1 938.6 8.1% -0.6% 80,217 708.5 730.7 8.2% 37.2% 140,623.0 736.0 Dec-14 4.0% 143,137.0 6,597.0 NA 29.1% -0.8% 143,288.0 6,615.0 NA -1.3% 43,633 716.0 Construction Iron and steel (not seasonally adjusted) 45,008 86,278 Highway and street 0.7% -1.8% Amusement and recreation Transportation 0.1% 50,639 88,755 8,338 Nov-15 60,151 17,315 69,164 3,237 NA -0.4% 88,036 Religious NA 628,795 68,756 Educational % Change from 6,351.0 723.9 -9.9% Dec-15 0.1% 0.3% 1.1% 0.7% 931.5 -0.6% 1,734.8 0.7% 2,273.2 Dec-14 196.7 214.3 197.0 204.2 126.3 185.6 234.9 181.6 -0.1% Nov-15 -0.8% -1.2% -2.9% 0.3% -5.7% -2.2% 7.6% -9.7% -8.0% 19.6% Jan-15 1.9% 4.2% 4.2% 1.7% 0.8% 4.2% 7.0% Dec-14 -2.8% -4.0% -6.8% 3.0% -35.8% -23.7% Sources: Bureau of Economic Analysis; U.S. Census Bureau; Bureau of Labor Statistics; NA = Not Applicable or Not Available For more information, visit us at www.marcumllp.com/industries/construction 4 . Services Marcum LLP is one of the largest independent public accounting and advisory services firms in the nation, with offices in major business markets throughout the U.S., Grand Cayman and China. Headquartered in New York City, Marcum provides a full spectrum of traditional tax, accounting and assurance services; advisory, valuation and litigation support; and an extensive range of specialty and niche industry practices. The Firm serves both privately held and publicly traded companies, as well as high net worth individuals, private equity and hedge funds, with a focus on middlemarket companies and closely held family businesses. Marcum is a member of the Marcum Group, an organization providing a comprehensive array of professional services. Assurance Marcum’s Assurance Division professionals provide a tailored Audit approach to each engagement.
Team members place a strong emphasis on early planning and learning the unique aspects of a client’s business. Doing so ensures that each client receives an effective, cost-efficient and independent audit performed in a timely manner. The Assurance Division works with commercial and SEC clients, governmental and not-forprofit entities and employee retirement plans. A full range of services is offered including: Agreed-Upon Procedures. Attestation. Financial Audits Reviews and Compilations. Breakeven Analyses. Single Audits. Sarbanes-Oxley 404 Compliance. Forecasts and Projections. Internal Audits. Internal Control Reviews. IT Audit and Advisory Services. Strategic and Operational Planning. Tax & Business The Tax & Business Services Division is comprised of dedicated professionals who have been involved with numerous complex transactions at the local, national and international levels. The division offers all forms of regulatory compliance services, planning and specialization in a variety of areas including: Estates, Gifts and Trusts. Family Wealth Planning. Bankruptcy and Insolvency Tax. State and Local Taxation. SEC and Large Corporate Matters. International Taxation. Real Estate Tax Services. IRS Representation. With partner involvement at every level of service, the Tax & Business Services team provides highly personalized advice and guidance to a client base including: High Net Worth Individuals. Family Business Owners. Large Corporations. International Businesses. Foreign Nationals. Tax Exempt Clients. Joseph Natarelli Joseph Natarelli is the national leader of Marcum’s Construction Industry Practice and partner-in-charge of the Firm’s New Haven office.
For nearly a decade, he has served as a technical reviewer for the AICPA’s Audit Risk Alert for Construction Contractors and the AICPA Accounting Guide — Construction Contractors. Joe also served as 2013-2014 chair of the AICPA National Construction Industry Conference. National Construction Industry Services Leaders Advisory Marcum’s Advisory Services Division works with clients across a broad range of industries. The team’s skilled professionals use their experience to help clients address and navigate complex business and personal issues including: Bankruptcy and Fiduciary Services Insolvency and Receivership. Trustee, Reorganization and Financial Advisory Services. Forensic and Litigation Services Forensic Accounting and Fraud Assessment. Damage Determination and Expert Testimony. Marital Dissolution. Regulatory Compliance, including Bank Secrecy Act and Taxation. Due Diligence and Capital Formation. Computer Forensics. Business Valuation. Operational & Process Improvement Business Process Improvement. Internal Controls and Governance. Real Estate Advisory Services. Family Office Services. Risk Management. Anirban Basu Anirban Basu is Marcum’s chief construction economist. He is also a member of the Firm’s National Construction Practice, as well as chairman & CEO of Sage Policy Group, Inc., an economic and policy consulting firm in Baltimore, Maryland. Anirban leads Marcum’s research and analysis of the economic health of the commercial construction industry in America. Additionally, he writes the quarterly Marcum Commercial Construction Index and annual Marcum JOLT Survey analysis. JOSEPH NATARELLI National Construction Industry Goup Leader joseph.natarelli@marcumllp.com 203.781.9710 PHILADELPHIA: CHICAGO: ROBERT MERCADO robert.mercado@marcumllp.com 203.781.9730 NASHVILLE: JAMES LUNDY james.lundy@marcumllp.com 615.245.4050 CALIFORNIA: NEW ENGLAND: NEW YORK: IRA KANTOR ira.kantor@marcumllp.com 631.414.4726 EDWARD REITMEYER edward.reitmeyer@marcumllp.com 484.270.2595 FLORIDA: WHIT FOREHAND whit.forehand@marcumllp.com 407.458.5210 TIM CROSBY tim.crosby@marcumllp.com 847.282.6368 STEVE RAPATTONI steve.rapattoni@marcumllp.com 949.236.5670 5 .


