


Description
INSIGHTS &
PERSPECTIVES
from High Yield Group
MARCH 2016
Fixed-Income Opportunity: Short Duration High Yield
An Income Solution for a Low or Rising Interest-Rate Environment
Generating income is a key objective for many investors, and one that is increasingly difficult to achieve in today’s low interestrate environment. At MacKay Shields, we currently see an opportunity in higher-quality, short duration high-yield bonds. We
believe these bonds have the potential to generate attractive risk-adjusted returns and income, with less interest-rate sensitivity
versus investment-grade alternatives. We view this as an ideal time for investors to diversify their fixed-income exposure through
short duration high yield.
This outlook is based on several factors in today’s fixed-income market:
 Short duration bonds have proven resilient during periods of rising rates.
 Higher-quality, short duration high-yield bonds offer higher spreads than investment-grade alternatives with less interest-rate
sensitivity.
 Valuations in the higher-quality segment of the high-yield market remain attractive.
 Many higher-quality, short duration high-yield bonds have unusually resilient credit profiles.
 Higher-quality, short duration bonds are an attractive complement to leveraged loans.
Following is a discussion of the current market environment as well as the opportunity in higher-quality, short duration high-yield
bonds.
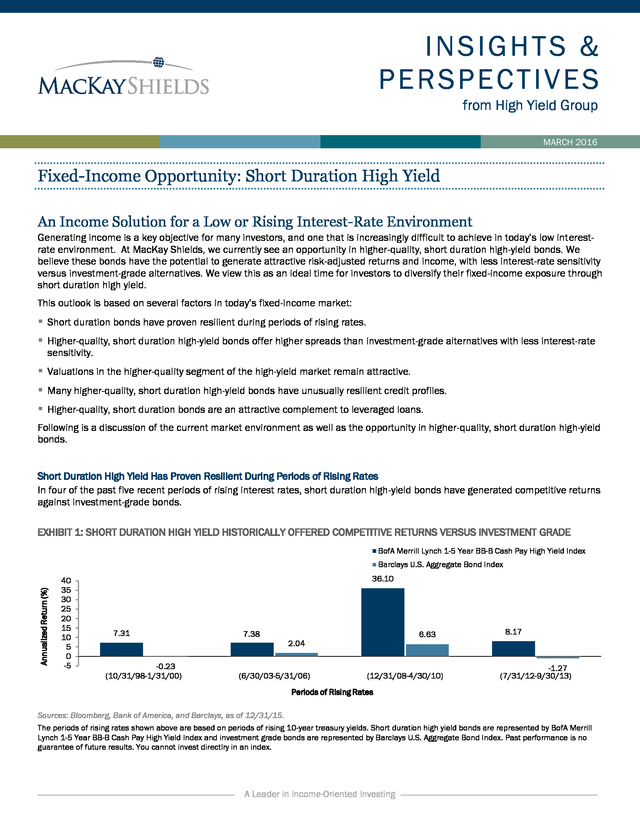
Short Duration High Yield Has Proven Resilient During Periods of Rising Rates
In four of the past five recent periods of rising interest rates, short duration high-yield bonds have generated competitive returns
against investment-grade bonds.
EXHIBIT 1: SHORT DURATION HIGH YIELD HISTORICALLY OFFERED COMPETITIVE RETURNS VERSUS INVESTMENT GRADE
BofA Merrill Lynch 1-5 Year BB-B Cash Pay High Yield Index
Annualized Return (%)
Barclays U.S.
Aggregate Bond Index 40 35 30 25 20 15 10 5 0 -5 36.10 7.31 -0.23 (10/31/98-1/31/00) 7.38 6.63 2.04 (6/30/03-5/31/06) (12/31/08-4/30/10) 8.17 -1.27 (7/31/12-9/30/13) Periods of Rising Rates Sources: Bloomberg, Bank of America, and Barclays, as of 12/31/15. The periods of rising rates shown above are based on periods of rising 10-year treasury yields. Short duration high yield bonds are represented by BofA Merrill Lynch 1-5 Year BB-B Cash Pay High Yield Index and investment grade bonds are represented by Barclays U.S. Aggregate Bond Index.
Past performance is no guarantee of future results. You cannot invest directlry in an index. A Leader in Income-Oriented Investing . INSIGHTS & PERSPECTIVES from High Yield Group Short Duration High Yield Compares Favorably to Investment Grade There are two main risks in investment-grade bonds today. First, their spreads are near historically low levels. Second, their duration is elevated, making them vulnerable if interest rates rise. Interest rates have remained extremely low due to a combination of aggressive Federal Reserve policy and low investor fear of inflation.
However, recently, interest rates have started to move, and investment-grade bonds have been impacted. We believe investors should consider diversifying their fixedincome portfolios with shorter duration fixed-income assets to help mitigate this risk. We believe higher-quality, short duration high-yield bonds compare favorably to investment-grade alternatives, offering a higher yield with less interest-rate risk. It is important to remember, however, that higher yields come with a trade-off of lower-quality credits, which may carry higher credit risk. EXHIBIT 2: SPREADS AND DURATION: HIGHER-QUALITY, SHORT DURATION HIGH-YIELD BONDS VS.
INVESTMENT-GRADE BONDS Short Duration High-Yield Bonds BofA Merrill Lynch 1-5 Year BB-B Cash Pay High Yield Index 7.4% Duration 2.6% 2.50 years Yields Investment-Grade Bonds Barclays U.S. Aggregate Bond Index 5.7 years Sources: MacKay Shields and Barclays, as of 12/31/15. Bps = Basis points.
Past performance is no guarantee of future results. You cannot invest directly in an index. Higher-Quality, High-Yield Bonds Remain Attractively Valued We believe the U.S. high-yield market continues to be an attractive investment opportunity for disciplined investors.
We often refer to the high-yield market as a “tale of two markets.” The larger market segment is comprised of higher-quality bonds with strong credit profiles. These companies generally have significant liquidity, modest leverage, and limited near-term debt maturities. Valuations here remain attractive―spreads for bonds rated BB and B are near their long-term historical average.
In addition, credit profiles for many of these bonds have never been more resilient than they are today. In our opinion this means near-term default risk is relatively low. EXHIBIT 3: HISTORICAL HIGH-YIELD QUALITY MARKET SPREAD A Snapshot of High Yield Bonds — A Tale of Two Markets Higher-Quality High Yield Lower-Quality High Yield Profile Larger segment of the market, typically rated BB and B Smaller segment of the market, with weaker CCC-like credit metrics Credit profiles Generally more resilient – most of these companies have ample liquidity and stronger balance sheets Generally weak – many companies are over levered Future defaults/volatility We believe default rates are likely to be significantly lower compared to the lowerquality segment of the high-yield market We believe most future defaults will occur in this segment A Leader in Income-Oriented Investing 2 . INSIGHTS & PERSPECTIVES from High Yield Group A Complement to Leveraged Loans Expectations for rising rates have led many investors to focus on floating rate loans—another asset class that has the potential to perform well in a rising interest-rate environment. Both high-yield bonds and leveraged loans are below investment-grade credits, but there are key distinctions. Loans pay a floating coupon based on a spread over a pre-determined reference rate―generally, the U.S. Dollar London Interbank Offered Rate (LIBOR), whereas coupons on bonds are generally fixed.
However, loans can generally be redeemed at par at any time by the issuer. High-yield bonds, on the other hand, have upside potential in the event of a tender or early redemption. Higher-quality, short duration high-yield bonds have historically had higher riskadjusted returns than the leveraged loan index as a whole, making them an attractive complement in a fixed-income portfolio. Past performance is no guarantee of future results. EXHIBIT 4: QUALITY SHORT DURATION HIGH YIELD – ALPHA AND BETA VS.
CREDIT SUISSE LEVERAGED LOAN INDEX Alpha BofA Merrill Lynch 1-5 Year BB-B Cash Pay High Yield Index Beta 2.16 0.9 Source: Morningstar Direct (1/1/00 to 12/31/15) Calculation benchmark: Credit Suisse Leveraged Loan Index. MacKay Shields — A Leader in Income-Oriented Investing: Experience and Quality With over 40 years of experience, we are committed to partnering with our clients to deliver:  Tailored, income-oriented investment solutions based on their goals and objectives.  The highest levels of client service. Our People A firm comprised of 168 dedicated employees, including 53 investment professionals.¹ Our Approach Investment teams recognize and integrate the importance of capital preservation into all of their investment philosophies. Long-Term Commitment Similar to our investment approach, we take a long-term perspective toward our clients, their portfolios, and our business. ¹As of December 31, 2015 A Leader in Income-Oriented Investing 3 . INSIGHTS & PERSPECTIVES from High Yield Group Additional Disclosure: Availability of products and services provided by MacKay Shields may be limited by applicable laws and regulations in certain jurisdictions and this document is provided only for persons to whom this document and the products and services of MacKay Shields may otherwise lawfully be issued or made available. None of the products and services provided by MacKay Shields are offered to any person in any jurisdiction where such offering would be contrary to local law or regulation. This document is provided for information purposes only. It does not constitute investment advice and should not be construed as an offer to buy securities.
The contents of this document have not been reviewed by any regulatory authority in any jurisdiction. All investments contain risks and may lose value. Any forward looking statements speak only as of the date they are made, and MacKay Shields assumes no duty and does not undertake to update forward looking statements.
Any opinions expressed are the views and opinions of certain investment professionals at MacKay Shields which are subject to change without notice. Past performance is not indicative of future results. No part of this material may be reproduced in any form, or referred to in any other publication, without the express written permission of MacKay Shields.
© MacKay Shields LLC. Comparison to an Index Comparisons to a financial index are provided for illustrative purposes only. Comparisons to the index are subject to limitations because the composite’s holdings, volatility and other portfolio characteristics may differ materially from the index. Unlike the index, portfolios within the composite are actively managed. There is no guarantee that any of the securities in the index are contained in the composite.
The performance of the index assumes reinvestment of dividends but does not reflect the impact of fees, applicable taxes or trading costs which, unlike the index, may reduce the returns in the composite. Investors cannot invest in an index. All indices are unmanaged.
Because of these differences, the performance of the index should not be relied upon as an accurate measure of comparison. Bank of America Merrill Lynch Bank of America Merrill Lynch, used with permission. Bank of America Merrill Lynch is licensing the Bank of America Merrill Lynch indices and related data "as is," makes no warranties regarding same, does not guarantee the suitability, quality, accuracy, timeliness, and/or completeness of the Bank of America Merrill Lynch indices or data included in, related to, or derived therefrom, assumes no liability in connection with their use, and does not sponsor, endorse, or recommend MacKay Shields LLC, or any of its products or services. Definitions Duration provides a measure of a portfolio’s interest-rate sensitivity. The longer a portfolio’s duration, the more sensitive the portfolio is to shifts in interest rates. Spread to worst is the difference in overall returns between two different classes of securities, or returns from the same class, but different representative securities.
The spread to worst measures the difference from the worst performing security to the best, and can be seen as a measure of dispersion of returns within a given market or between markets. The spread to worst can vary significantly depending on different market and economic variables. Alpha is a measure of performance on a risk-adjusted basis. Alpha takes the volatility (price risk) of a mutual fund and compares its risk-adjusted performance to a benchmark index. Beta is a measure of historical volatility relative to an appropriate index (benchmark) based on its investment objective.
A beta greater than 1.00 indicates volatility greater than the benchmark. High-yield (HY) corporate bonds are represented by the Credit Suisse High Yield Index, which is a market-weighted index that includes publicly traded bonds rated below BBB by S&P and Baa by Moody’s. Short duration high-yield (SD HY) bonds are represented by the BofA Merrill Lynch 1-5 Year BB-B Cash Pay High Yield Index, which is a subset of the BofA Merrill Lynch U.S. Cash Pay High Yield Index, including all securities with a remaining term to final maturity of less than 5 years and rated BB1 through B3, inclusive.
Investment-grade (IG) bonds are represented by the Barclays U.S. Aggregate Bond Index, which is a broad-based index often used to represent investment-grade bonds being traded in the United States. Floating rate loans are represented by the Credit Suisse Leveraged Loan Index.
An investment cannot be made directly into an index. Leveraged loans are loans extended to companies or individuals that already have considerable amounts of debt. Lenders consider leveraged loans to carry a higher risk of default and, as a result, a leveraged loan is more costly to the borrower. Par value is the face value of a bond. Par value for a share refers to the stock value stated in the corporate charter.
Par value is important for a bond or fixedincome instrument because it determines its maturity value as well as the dollar value of coupon payments. Par value for a bond is typically $1,000 or $100. Shares usually have no par value or very low par value, such as 1 cent per share. The market price of a bond may be above or below par, depending on factors such as the level of interest rates and the bond’s credit status.
In the case of equity, par value has very little relation to the shares' market price. London Interbank Offered Rate (LIBOR) is an interest rate at which banks can borrow funds, in marketable size, from other banks in the London interbank market. The LIBOR is fixed on a daily basis by the British Bankers' Association. The LIBOR is derived from a filtered average of the world's most creditworthy banks' interbank deposit rates for larger loans with maturities between overnight and one full year. A Leader in Income-Oriented Investing 4 .


