


Description
The Best of Both Worlds
Combining Momentum and Value Strategies
Marvin I. Kline, CFA
Managing Director, Value Portfolio Manager
Deborah G. George
Managing Director, Client Service
January 2012
There is substantial evidence that both momentum and value strategies have historically generated
above-average returns over time1. Importantly, the excess return that these strategies deliver is
negatively correlated therefore using both strategies in one portfolio can lower risk and improve
portfolio efficiency2.
Additionally, investors are more likely to stick with a portfolio that utilizes strategies that rarely move together. In this paper we will present some of the research produced by academicians and practitioners on the effectiveness of momentum and value strategies. Moreover, we will provide real world evidence of the effectiveness of combining these strategies into a single portfolio. At Logan Capital our Growth team manages growth portfolios that use momentum as one factor in a multi-step process and our Value team manages value portfolios using a high dividend yield strategy.
Both strategies have a long history of outperforming their respective benchmarks. By combining these two strategies into one portfolio, Logan Capital’s Core portfolio has a consistent record generating significantly higher returns than the S&P 500 and superior risk adjusted performance. 1 Asness, C. 1997.
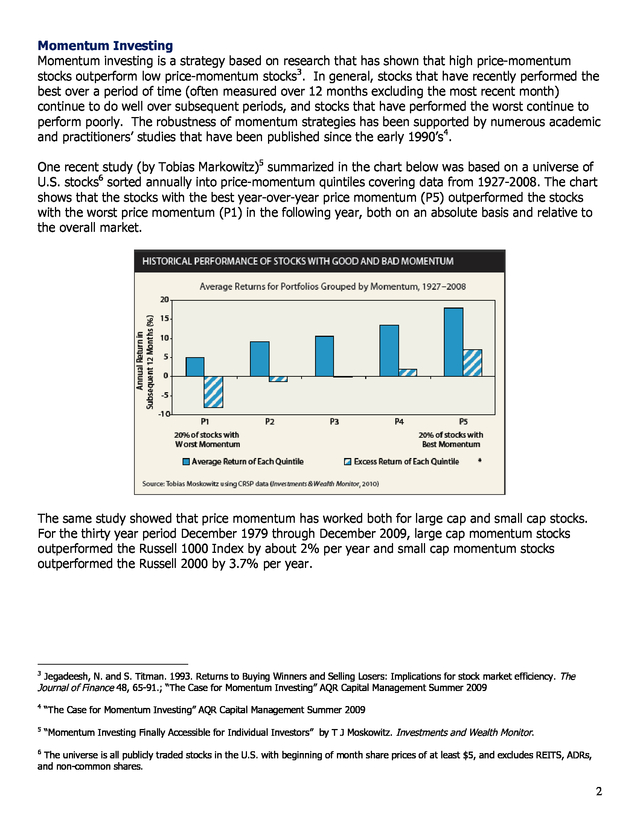
“The Interaction of Value and Momentum Strategies”, Financial Analyst Journal, March/April (1997) 2 “Momentum Investing Finally Accessible for Individual Investors” by T J Moskowitz. Investments and Wealth Monitor. 1 . Momentum Investing Momentum investing is a strategy based on research that has shown that high price-momentum stocks outperform low price-momentum stocks3. In general, stocks that have recently performed the best over a period of time (often measured over 12 months excluding the most recent month) continue to do well over subsequent periods, and stocks that have performed the worst continue to perform poorly. The robustness of momentum strategies has been supported by numerous academic and practitioners’ studies that have been published since the early 1990’s4. One recent study (by Tobias Markowitz)5 summarized in the chart below was based on a universe of U.S. stocks6 sorted annually into price-momentum quintiles covering data from 1927-2008.
The chart shows that the stocks with the best year-over-year price momentum (P5) outperformed the stocks with the worst price momentum (P1) in the following year, both on an absolute basis and relative to the overall market. The same study showed that price momentum has worked both for large cap and small cap stocks. For the thirty year period December 1979 through December 2009, large cap momentum stocks outperformed the Russell 1000 Index by about 2% per year and small cap momentum stocks outperformed the Russell 2000 by 3.7% per year. 3 Jegadeesh, N. and S. Titman.
1993. Returns to Buying Winners and Selling Losers: Implications for stock market efficiency. The Journal of Finance 48, 65-91.; “The Case for Momentum Investing” AQR Capital Management Summer 2009 4 “The Case for Momentum Investing” AQR Capital Management Summer 2009 5 “Momentum Investing Finally Accessible for Individual Investors” by T J Moskowitz.
Investments and Wealth Monitor. 6 The universe is all publicly traded stocks in the U.S. with beginning of month share prices of at least $5, and excludes REITS, ADRs, and non-common shares. 2 . While the evidence that high momentum stocks outperform is persuasive, there is no agreement among researchers as to why momentum strategies work. For example, among those financial theorists who believe in the Efficient Market Hypothesis, the higher returns for high momentum strategies means that they are associated with an additional unique risk factor, which has not yet been identified. Taking a different tack, some Behavioral Economists believe that investors may react slowly to new information, and that it takes time for new information to be incorporated into stock prices. Another possible behavioral explanation is the idea of ‘herding’, which means investors buy more of a stock because they are following the crowd. Herd followers buy a stock simply because it is already going up, which further increases the stock price, which attracts more buyers7.
While there is no general agreement as to why price momentum has been a successful investing strategy, its success has withstood the test of time. Value Investing The value premium is one of the most consistent sources of excess return in equity markets. The value premium refers to the excess return that the value investor can earn by investing in “cheap” stocks. Academic research on value investing goes back to the 1970’s. In an often-cited seminal academic paper published in 1994, entitled “Contrarian Investment, Exploration and Risk”, the authors (Lakonishok, Shleifer, and Vishny) concluded that “value stocks” consistently outperformed “glamour” companies8 (which are generally fast growing companies) by wide margins for the period 1968 through 1994.
In this study stocks were sorted into the value or glamour (i.e., “growth”) category based on price-to-book (“P/B”), price-to-cash flow (“P/CF”), and price-to-earnings (“P/E”) ratios. Stocks that had low P/B, low P/CF or low P/E ratios were classified as value stocks and those stocks that had high values for the same ratios were classified as glamour (growth) stocks. Using the same methodology, the Brandes Institute extended this research through 20109.
Brandes also concluded that value stocks outperformed glamour stocks over the long term, both in the U.S. and globally. An additional factor which some value managers use for stock selection is dividend yield. An abundance of research studies10 have concluded that high dividend yield stocks outperform both low dividend yield stocks and the market over time.
Based on this research some value managers limit their investable universe only to stocks which have above-market yields. As discussed further in this paper, high dividend yield strategies work well among stocks with low momentum. 7 “Momentum-A Contrarian Case for Following the Herd” by J Hancock, GMO White Paper, March 2010 8 Lakonishok, Josef, Andrei Shleifer, and Robert W. Vishny.1994 “Contrarian Investment, Extrapolation, and Risk.” Journal of Finance, vol.
49, no. 5 (December)):1541-78 9 “Value vs. Growth a Global Phenomenon”, The Brandes Institute, December 2010 Siegel, J.
Stocks for the Long Run: The Definitive Guide to Financial Market Returns & Long Term Investment Strategies, 4th edition. 2007; Patel, P, CFA, Yao, S, Carlson, R, CFA, Banerji, A. Global Dividends-Short and Long Term.
Equity Reserch Quantitative Analysis, Credit Suisse, November 2009. 10 3 . How to explain the value premium? Once again for those who believe in the Efficient Market Hypothesis, the higher returns for value strategies means that value strategies should have higher risk. However, as shown in the table below both the large cap value index and small cap value index had higher returns and lower risk (standard deviation) than their respective growth indexes. From 1979-2011, large cap value outperformed large growth by 1.4% per year, and small cap value outperformed small growth by 4.0% per year. Value: Higher Return, Lower Risk January 1979 - December 2011 Russell 1000 Growth Russell 1000 Value Russell 2000 Growth Russell 2000 Value Return 10.4% 11.8% 9.0% 13.0% Standard Deviation 17.8% 15.1% 23.5% 17.8% Since risk measured by standard deviation does not explain the outperformance of value stocks, believers in efficient markets again suggest the higher returns are associated with an additional unique risk factor which has not been identified, while Behavioral Economists offer the theory that value investing works because investors are uncomfortable buying cheap stocks (likely because they may have been recent losers) and for this reason, they earn a return premium11. Combining Value and Momentum in the Real World Empirically, value and momentum are proven strategies that have unique attributes. Momentum and value each deliver excess returns, but because these returns are negatively correlated, the combination can provide higher risk adjusted performance12. Does combining value and momentum outperform in the real world? In this regard our own investment record suggests that the combination results in outperformance.
At Logan Capital two independent investment teams manage our growth and value portfolios. Each team utilizes investment strategies that are consistent with their investment style. Logan’s Growth team uses a multifactor ranking algorithm as an idea generator for possible buy candidates, which are then analyzed both fundamentally and technically. Although 65% of this ranking algorithm is earnings driven, price momentum is also recognized as an important factor which helps to identify growth stocks that are more likely to outperform, and is weighted at 20% in the growth model.
Given that the ranking algorithm is just one part of a multi-step discipline, Logan Growth cannot be considered a “pure” price momentum strategy. However, when we sampled Logan growth portfolios from different time periods we found that the stocks in the portfolio tended to skew toward the top third of the universe ranked by price momentum13. 11 Asness, C. 1997.
“The Interaction of Value and Momentum Strategies”, Financial Analyst Journal, March/April (1997) 12 Asness, C, Moskowitz, T and Pedersen, L Heje, “Value and momentum everywhere” National Bureau of Economic Research Working Papers (2000) 13 In addition, the Logan Growth strategy has a correlation coefficient of 0.88 to the AQR Large Cap Momentum Index from October 1995 to December 2011 as calculated by Zephyr StyleADVISOR. 4 . Logan’s Value team utilizes a large cap high dividend yield strategy. The Value team screens for large cap stocks that have strong fundamentals, then sorts those stocks by dividend yield. Those with the highest dividend yields are candidates for purchase. The Value team does not use high or low price momentum as one of its screening factors.
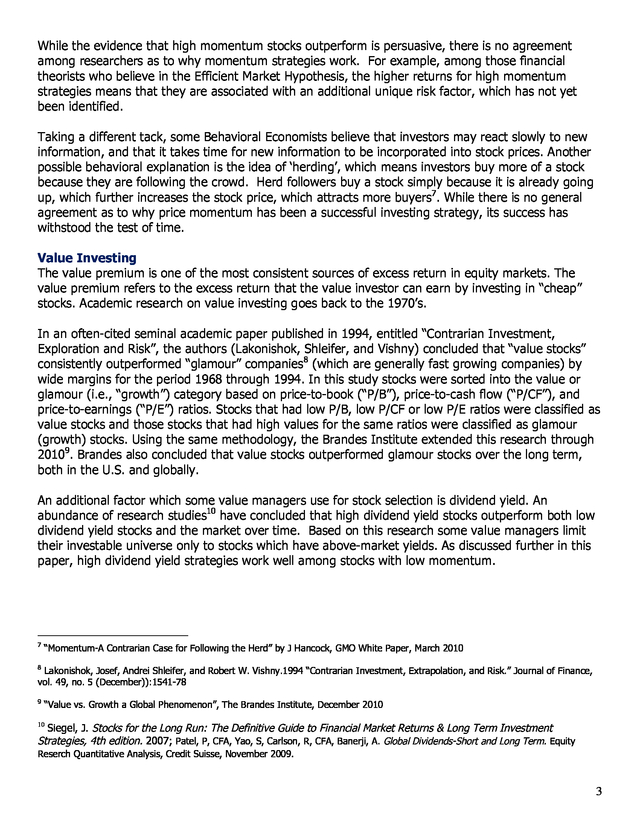
Interestingly, Asness (1997)14 showed that high dividend yield works better among stocks with poor momentum and does not work at all among stocks with high momentum. On the other hand, high price momentum strategies in general work best among low dividend yield stocks. Logan Capital Management has managed a Core strategy since 2001 that is a combination of Logan Growth and Logan Concentrated Value in a 50%/50% weighting, rebalanced semi-annually. Logan’s Growth and Value work well together because consistent with the studies discussed previously, the excess returns compared to the S&P 500 are negatively correlated (correlation: -0.43, January 1996December 2011), as is shown below. Zephyr StyleADVISOR Zephyr StyleADVISOR: Logan Capital Management Exces s Return vs .
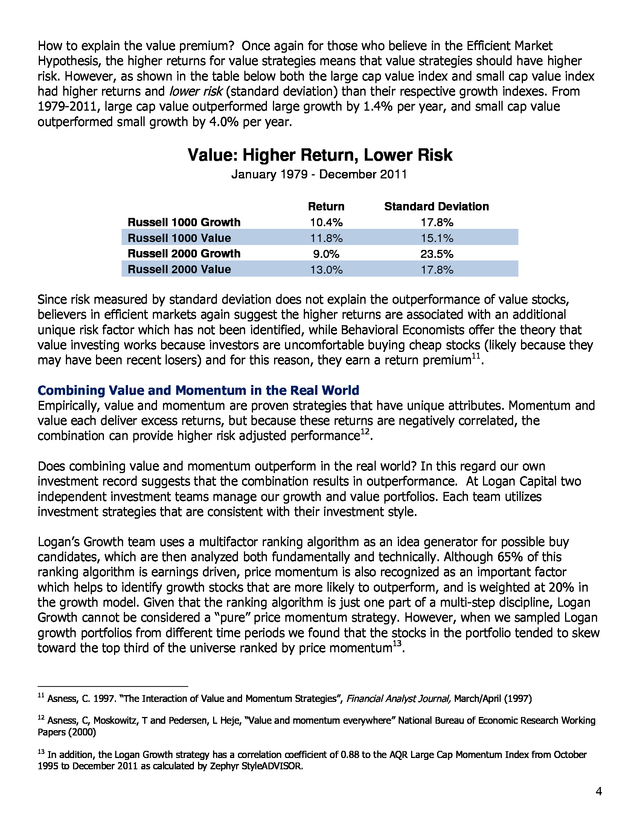
Market Benchm ark / Tim e January 1996 - December 2011 (36-Month Mov ing Windows, Computed Monthly ) 20% Correlation: -0.43 Excess Return vs. S&P 500 15% 10% 5% 0% -5% -10% Dec 1998 Dec 1999 Dec 2001 Dec 2003 Dec 2005 Dec 2007 Dec 2009 Dec 2011 Time Logan Growth Logan Concentrated Value Please see important attached disclosures regarding performance shown above. The graph above shows that the excess returns of the two strategies rarely move together. The superior performance of the combined portfolio – Logan Core -- clearly demonstrates the value of combining strategies with negatively correlated excess returns in one portfolio. The graph below shows Logan Core’s annualized performance for various time periods ended December 2011. 14 Asness, C.
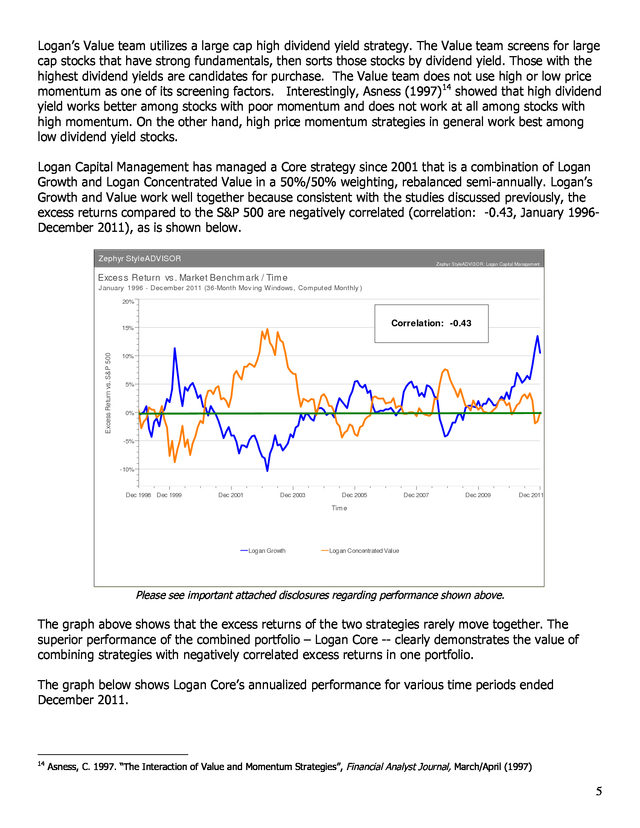
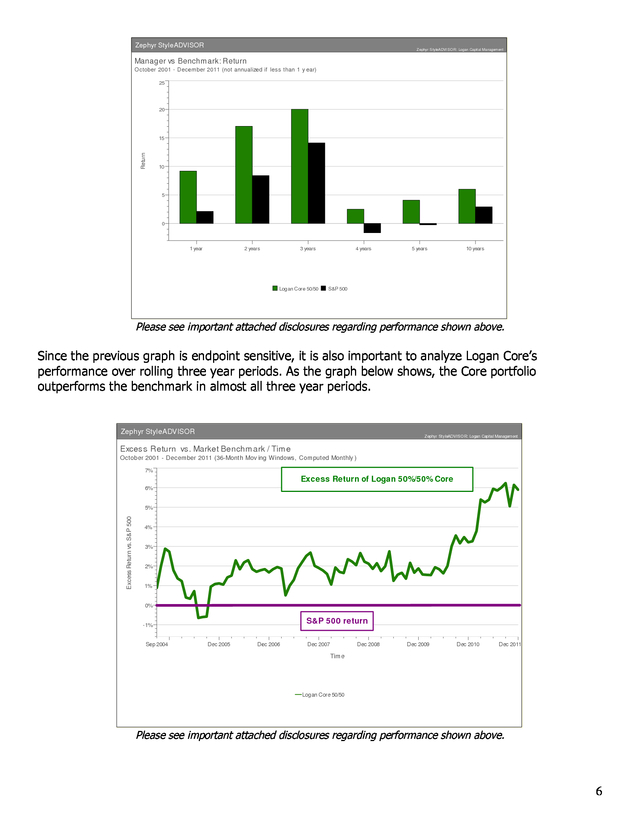
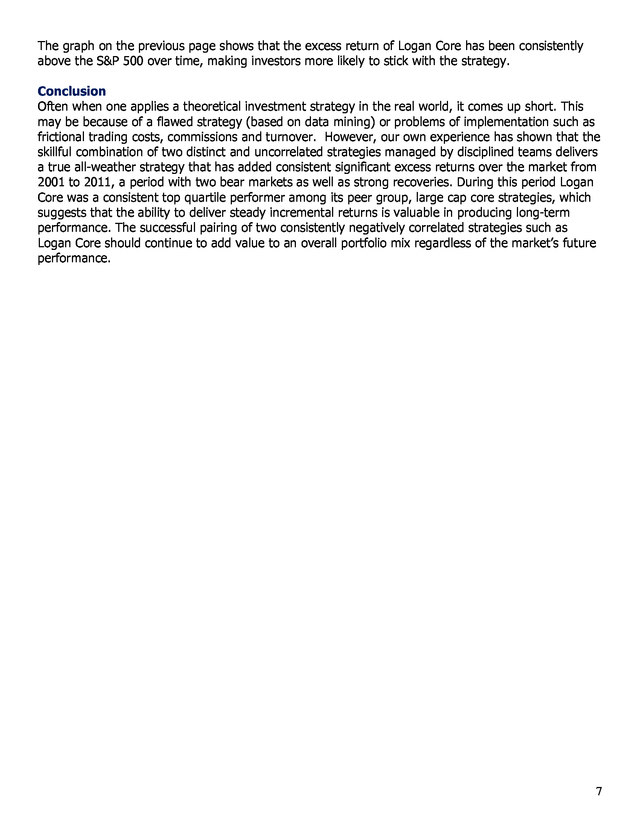
1997. “The Interaction of Value and Momentum Strategies”, Financial Analyst Journal, March/April (1997) 5 . Zephyr StyleADVISOR Z ephyr StyleADVI SOR: Logan Capit al Management Manager vs Benchm ark: Return October 2001 - December 2011 (not annualized if less than 1 y ear) 25 20 Return 15 10 5 0 1 year 2 years 3 years Logan Core 50/50 4 years 5 years 10 years S&P 500 Please see important attached disclosures regarding performance shown above. Since the previous graph is endpoint sensitive, it is also important to analyze Logan Core’s performance over rolling three year periods. As the graph below shows, the Core portfolio outperforms the benchmark in almost all three year periods. Zephyr StyleADVISOR Zephyr StyleADVISOR: Logan Capital Management Exces s Return vs. Market Benchm ark / Tim e October 2001 - December 2011 (36-Month Mov ing Windows, Com puted Monthly ) 7% Excess Return of Logan 50%/50% Core 6% Excess Return vs. S&P 500 5% 4% 3% 2% 1% 0% S&P 500 return -1% Sep 2004 Dec 2005 Dec 2006 Dec 2007 Dec 2008 Dec 2009 Dec 2010 Dec 2011 Tim e Logan Core 50/50 Please see important attached disclosures regarding performance shown above. 6 .
The graph on the previous page shows that the excess return of Logan Core has been consistently above the S&P 500 over time, making investors more likely to stick with the strategy. Conclusion Often when one applies a theoretical investment strategy in the real world, it comes up short. This may be because of a flawed strategy (based on data mining) or problems of implementation such as frictional trading costs, commissions and turnover. However, our own experience has shown that the skillful combination of two distinct and uncorrelated strategies managed by disciplined teams delivers a true all-weather strategy that has added consistent significant excess returns over the market from 2001 to 2011, a period with two bear markets as well as strong recoveries. During this period Logan Core was a consistent top quartile performer among its peer group, large cap core strategies, which suggests that the ability to deliver steady incremental returns is valuable in producing long-term performance.
The successful pairing of two consistently negatively correlated strategies such as Logan Core should continue to add value to an overall portfolio mix regardless of the market’s future performance. 7 . References Asness, C. "The Interaction of Value and Momentum Strategies." Financial Analysts Journal, 1997. Asness, C, Moskowitz, T and Pedersen, L. Value and Momentum Everywhere. Working Paper, National Bureau of Economic Research, 2009. Berger, A CFA, R Israel, T Moskowitz, PhD, Booth School of Business, University of Chicago.
The Case for Momentum Investing. AQR Capital Management, Summer 2009. Brandes Investment Partners. Value vs.
Glamour: a Global Phenomenon. The Brandes Institute, December 2010. Curran, R. "Maybe the Rearview Mirror is Right." The Wall Street Journal, May 3, 2010. Fama, E and K French.
Size, Value and Momentum in International Stock Returns. Working Paper, CSRP, 2011. Hancock, J. Momentum-A Contrarian Case for Following the Herd.
White Paper, GMO, 2010. Israel, R and T Moskowitz. How Tax Efficient are Equity Styles? Working Paper, University of Chicago Booth School of Business, 2010a. Jagadeesh, N and S Titman. "Returns to Buying winners and Selling Losers: Implications for Stock Market Efficiency." Journal of Finance 48, 1993: 65-91. Lakonishok, J, A Hleifer, and R Vishny.
"Contrarian Investment, Extrapolation, and Risk." Journal of Finance 49, 1994: 1541-78. Montier, J "Is Value Really Riskier Than Growth? Dream On." In Value Investing: Tools and Techniques for Intelligent Investment, by J Montier, Chapter 6. 2009. Moskowitz, T "Momentum Investing Finally Accessible for Individual Investors." Investments and Wealth Monitor, July/August 2010. Patel, P, CFA, Yao, S, Carlson, R, CFA, Banerji, A. Global Dividends-Short and Long Term.
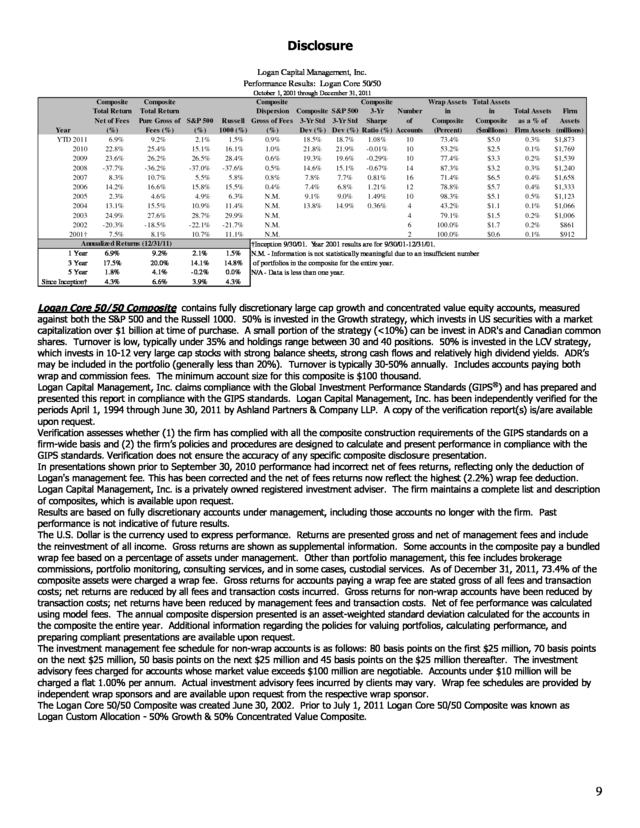
Equity Reserch Quantitative Analysis, Credit Suisse, November 2009 Siegel, J Stocks for the Long Run: The Definitive Guide to Financial Market Returns & Long Term Investment Strategies, 4th edition. 2007 8 . Disclosure Logan Capital Management, Inc. Performance Results: Logan Core 50/50 October 1, 2001 through December 31, 2011 Composite Composite Total Return Total Return Net of Fees Pure Gross of S&P 500 Russell (%) Fees (%) (%) 1000 (%) Year YTD 2011 6.9% 9.2% 2.1% 1.5% 2010 22.8% 25.4% 15.1% 16.1% 2009 23.6% 26.2% 26.5% 28.4% 2008 -37.7% -36.2% -37.0% -37.6% 2007 8.3% 10.7% 5.5% 5.8% 2006 14.2% 16.6% 15.8% 15.5% 2005 2.3% 4.6% 4.9% 6.3% 2004 13.1% 15.5% 10.9% 11.4% 2003 24.9% 27.6% 28.7% 29.9% 2002 -20.3% -18.5% -22.1% -21.7% 2001† 7.5% 8.1% 10.7% 11.1% Annualized Returns (12/31/11) 1 Year 6.9% 9.2% 2.1% 1.5% 3 Year 17.5% 20.0% 14.1% 14.8% 5 Year 1.8% 4.1% -0.2% 0.0% Since Inception† 4.3% 6.6% 3.9% 4.3% Composite Composite Wrap Assets Total Assets Number Dispersion Composite S&P 500 3-Yr in in Total Assets of Composite Composite Gross of Fees 3-Yr Std 3-Yr Std Sharpe as a % of (Percent) ($millions) Firm Assets Dev (%) Dev (%) Ratio (%) Accounts (%) 0.9% 18.5% 18.7% 1.08% 10 73.4% $5.0 0.3% 1.0% 21.8% 21.9% -0.01% 10 53.2% $2.5 0.1% 0.6% 19.3% 19.6% -0.29% 10 77.4% $3.3 0.2% 0.5% 14.6% 15.1% -0.67% 14 87.3% $3.2 0.3% 0.8% 7.8% 7.7% 0.81% 16 71.4% $6.5 0.4% 0.4% 7.4% 6.8% 1.21% 12 78.8% $5.7 0.4% N.M. 9.1% 9.0% 1.49% 10 98.3% $5.1 0.5% N.M. 13.8% 14.9% 0.36% 4 43.2% $1.1 0.1% N.M. 4 79.1% $1.5 0.2% N.M. 6 100.0% $1.7 0.2% N.M. 2 100.0% $0.6 0.1% †Inception 9/30/01. Year 2001 results are for 9/30/01-12/31/01. N.M. - Information is not statistically meaningful due to an insufficient number of portfolios in the composite for the entire year. N/A - Data is less than one year. Firm Assets (millions) $1,873 $1,769 $1,539 $1,240 $1,658 $1,333 $1,123 $1,066 $1,006 $861 $912 Logan Core 50/50 Composite contains fully discretionary large cap growth and concentrated value equity accounts, measured against both the S&P 500 and the Russell 1000. 50% is invested in the Growth strategy, which invests in US securities with a market capitalization over $1 billion at time of purchase.
A small portion of the strategy (<10%) can be invest in ADR's and Canadian common shares. Turnover is low, typically under 35% and holdings range between 30 and 40 positions. 50% is invested in the LCV strategy, which invests in 10-12 very large cap stocks with strong balance sheets, strong cash flows and relatively high dividend yields.
ADR’s may be included in the portfolio (generally less than 20%). Turnover is typically 30-50% annually. Includes accounts paying both wrap and commission fees.
The minimum account size for this composite is $100 thousand. Logan Capital Management, Inc. claims compliance with the Global Investment Performance Standards (GIPS®) and has prepared and presented this report in compliance with the GIPS standards. Logan Capital Management, Inc.
has been independently verified for the periods April 1, 1994 through June 30, 2011 by Ashland Partners & Company LLP. A copy of the verification report(s) is/are available upon request. Verification assesses whether (1) the firm has complied with all the composite construction requirements of the GIPS standards on a firm-wide basis and (2) the firm’s policies and procedures are designed to calculate and present performance in compliance with the GIPS standards. Verification does not ensure the accuracy of any specific composite disclosure presentation. In presentations shown prior to September 30, 2010 performance had incorrect net of fees returns, reflecting only the deduction of Logan's management fee.
This has been corrected and the net of fees returns now reflect the highest (2.2%) wrap fee deduction. Logan Capital Management, Inc. is a privately owned registered investment adviser. The firm maintains a complete list and description of composites, which is available upon request. Results are based on fully discretionary accounts under management, including those accounts no longer with the firm.
Past performance is not indicative of future results. The U.S. Dollar is the currency used to express performance. Returns are presented gross and net of management fees and include the reinvestment of all income.
Gross returns are shown as supplemental information. Some accounts in the composite pay a bundled wrap fee based on a percentage of assets under management. Other than portfolio management, this fee includes brokerage commissions, portfolio monitoring, consulting services, and in some cases, custodial services.
As of December 31, 2011, 73.4% of the composite assets were charged a wrap fee. Gross returns for accounts paying a wrap fee are stated gross of all fees and transaction costs; net returns are reduced by all fees and transaction costs incurred. Gross returns for non-wrap accounts have been reduced by transaction costs; net returns have been reduced by management fees and transaction costs.
Net of fee performance was calculated using model fees. The annual composite dispersion presented is an asset-weighted standard deviation calculated for the accounts in the composite the entire year. Additional information regarding the policies for valuing portfolios, calculating performance, and preparing compliant presentations are available upon request. The investment management fee schedule for non-wrap accounts is as follows: 80 basis points on the first $25 million, 70 basis points on the next $25 million, 50 basis points on the next $25 million and 45 basis points on the $25 million thereafter.
The investment advisory fees charged for accounts whose market value exceeds $100 million are negotiable. Accounts under $10 million will be charged a flat 1.00% per annum. Actual investment advisory fees incurred by clients may vary.
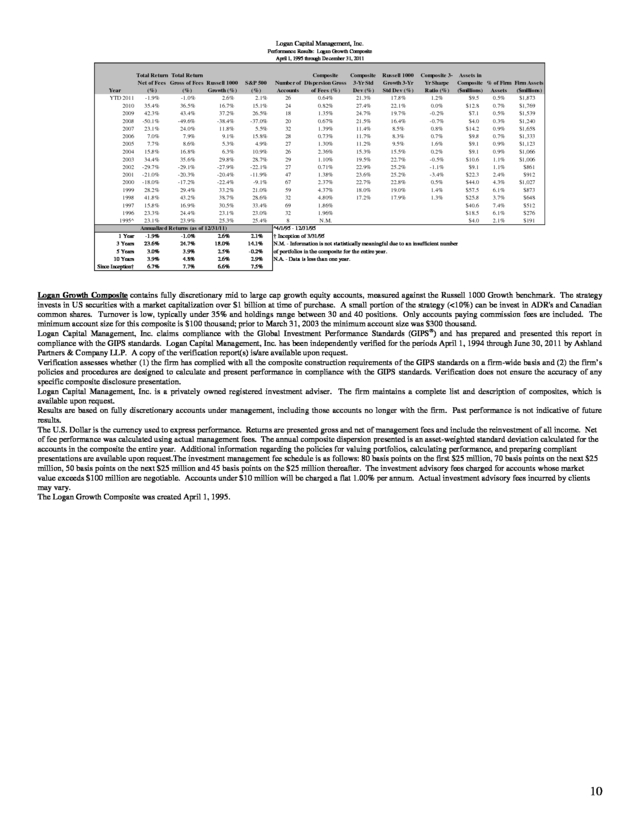
Wrap fee schedules are provided by independent wrap sponsors and are available upon request from the respective wrap sponsor. The Logan Core 50/50 Composite was created June 30, 2002. Prior to July 1, 2011 Logan Core 50/50 Composite was known as Logan Custom Allocation - 50% Growth & 50% Concentrated Value Composite. 9 . Logan Capital Management, Inc. Performance Results: Logan Growth Composite April 1, 1995 through December 31, 2011 Year YTD 2011 2010 2009 2008 2007 2006 2005 2004 2003 2002 2001 2000 1999 1998 1997 1996 1995^ 1 Year 3 Years 5 Years 10 Years Since Inception† Total Return Total Return Net of Fees Gross of Fees Russell 1000 (%) (%) Growth (%) -1.9% -1.0% 2.6% 35.4% 36.5% 16.7% 42.3% 43.4% 37.2% -50.1% -49.6% -38.4% 23.1% 24.0% 11.8% 7.0% 7.9% 9.1% 7.7% 8.6% 5.3% 15.8% 16.8% 6.3% 34.4% 35.6% 29.8% -29.7% -29.1% -27.9% -21.0% -20.3% -20.4% -18.0% -17.2% -22.4% 28.2% 29.4% 33.2% 41.8% 43.2% 38.7% 15.8% 16.9% 30.5% 23.3% 24.4% 23.1% 23.1% 23.9% 25.3% Annualized Returns (as of 12/31/11) -1.9% -1.0% 2.6% 23.6% 24.7% 18.0% 3.0% 3.9% 2.5% 3.9% 4.8% 2.6% 6.7% 7.7% 6.6% S&P 500 (%) 2.1% 15.1% 26.5% -37.0% 5.5% 15.8% 4.9% 10.9% 28.7% -22.1% -11.9% -9.1% 21.0% 28.6% 33.4% 23.0% 25.4% 2.1% 14.1% -0.2% 2.9% 7.5% Composite Composite Russell 1000 Composite 3- Assets in Number of Dispersion Gross 3-Yr Std Growth 3-Yr Yr Sharpe Composite % of Firm Firm Assets Accounts of Fees (%) ($millions) Dev (%) Std Dev (%) Ratio (%) ($millions) Assets 26 0.64% 21.3% 17.8% 1.2% $9.5 0.5% $1,873 24 0.82% 27.4% 22.1% 0.0% $12.8 0.7% $1,769 18 1.35% 24.7% 19.7% -0.2% $7.1 0.5% $1,539 20 0.67% 21.5% 16.4% -0.7% $4.0 0.3% $1,240 32 1.39% 11.4% 8.5% 0.8% $14.2 0.9% $1,658 28 0.73% 11.7% 8.3% 0.7% $9.8 0.7% $1,333 27 1.30% 11.2% 9.5% 1.6% $9.1 0.9% $1,123 26 2.36% 15.3% 15.5% 0.2% $9.1 0.9% $1,066 29 1.10% 19.5% 22.7% -0.5% $10.6 1.1% $1,006 27 0.71% 22.9% 25.2% -1.1% $9.1 1.1% $861 47 1.38% 23.6% 25.2% -3.4% $22.3 2.4% $912 67 2.37% 22.7% 22.8% 0.5% $44.0 4.3% $1,027 59 4.37% 18.0% 19.0% 1.4% $57.5 6.1% $873 32 4.80% 17.2% 17.9% 1.3% $25.8 3.7% $648 69 1.86% $40.6 7.4% $512 32 1.96% $18.5 6.1% $276 8 N.M. $4.0 2.1% $191 ^4/1/95 - 12/31/95 † Inception of 3/31/95 N.M. - Information is not statistically meaningful due to an insufficient number of portfolios in the composite for the entire year. N.A. - Data is less than one year. Logan Growth Composite contains fully discretionary mid to large cap growth equity accounts, measured against the Russell 1000 Growth benchmark. The strategy invests in US securities with a market capitalization over $1 billion at time of purchase.
A small portion of the strategy (<10%) can be invest in ADR's and Canadian common shares. Turnover is low, typically under 35% and holdings range between 30 and 40 positions. Only accounts paying commission fees are included.
The minimum account size for this composite is $100 thousand; prior to March 31, 2003 the minimum account size was $300 thousand. Logan Capital Management, Inc. claims compliance with the Global Investment Performance Standards (GIPS®) and has prepared and presented this report in compliance with the GIPS standards. Logan Capital Management, Inc.
has been independently verified for the periods April 1, 1994 through June 30, 2011 by Ashland Partners & Company LLP. A copy of the verification report(s) is/are available upon request. Verification assesses whether (1) the firm has complied with all the composite construction requirements of the GIPS standards on a firm-wide basis and (2) the firm’s policies and procedures are designed to calculate and present performance in compliance with the GIPS standards. Verification does not ensure the accuracy of any specific composite disclosure presentation. Logan Capital Management, Inc.
is a privately owned registered investment adviser. The firm maintains a complete list and description of composites, which is available upon request. Results are based on fully discretionary accounts under management, including those accounts no longer with the firm. Past performance is not indicative of future results. The U.S.
Dollar is the currency used to express performance. Returns are presented gross and net of management fees and include the reinvestment of all income. Net of fee performance was calculated using actual management fees.
The annual composite dispersion presented is an asset-weighted standard deviation calculated for the accounts in the composite the entire year. Additional information regarding the policies for valuing portfolios, calculating performance, and preparing compliant presentations are available upon request.The investment management fee schedule is as follows: 80 basis points on the first $25 million, 70 basis points on the next $25 million, 50 basis points on the next $25 million and 45 basis points on the $25 million thereafter. The investment advisory fees charged for accounts whose market value exceeds $100 million are negotiable.
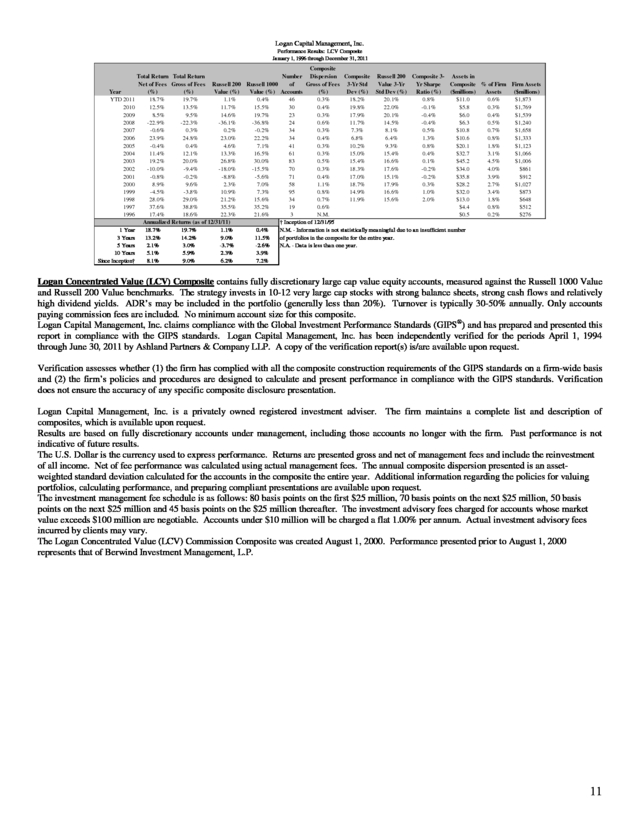
Accounts under $10 million will be charged a flat 1.00% per annum. Actual investment advisory fees incurred by clients may vary. The Logan Growth Composite was created April 1, 1995. 10 . Logan Capital Management, Inc. Performance Results: LCV Composite January 1, 1996 through December 31, 2011 Year YTD 2011 2010 2009 2008 2007 2006 2005 2004 2003 2002 2001 2000 1999 1998 1997 1996 1 Year 3 Years 5 Years 10 Years Since Inception† Composite Total Return Total Return Number Dispersion Composite Russell 200 Composite 3- Assets in of Value 3-Yr Yr Sharpe Composite % of Firm Firm Assets Net of Fees Gross of Fees Russell 200 Russell 1000 Gross of Fees 3-Yr Std Value (%) Accounts (%) Dev (%) Std Dev (%) Ratio (%) ($millions) Assets ($millions) (%) (%) Value (%) 18.7% 19.7% 1.1% 0.4% 46 0.3% 18.2% 20.1% 0.8% $11.0 0.6% $1,873 12.5% 13.5% 11.7% 15.5% 30 0.4% 19.8% 22.0% -0.1% $5.8 0.3% $1,769 8.5% 9.5% 14.6% 19.7% 23 0.3% 17.9% 20.1% -0.4% $6.0 0.4% $1,539 -22.9% -22.3% -36.1% -36.8% 24 0.6% 11.7% 14.5% -0.4% $6.3 0.5% $1,240 -0.6% 0.3% 0.2% -0.2% 34 0.3% 7.3% 8.1% 0.5% $10.8 0.7% $1,658 23.9% 24.8% 23.0% 22.2% 34 0.4% 6.8% 6.4% 1.3% $10.6 0.8% $1,333 -0.4% 0.4% 4.6% 7.1% 41 0.3% 10.2% 9.3% 0.8% $20.1 1.8% $1,123 11.4% 12.1% 13.3% 16.5% 61 0.3% 15.0% 15.4% 0.4% $32.7 3.1% $1,066 19.2% 20.0% 26.8% 30.0% 83 0.5% 15.4% 16.6% 0.1% $45.2 4.5% $1,006 -10.0% -9.4% -18.0% -15.5% 70 0.3% 18.3% 17.6% -0.2% $34.0 4.0% $861 -0.8% -0.2% -8.8% -5.6% 71 0.4% 17.0% 15.1% -0.2% $35.8 3.9% $912 8.9% 9.6% 2.3% 7.0% 58 1.1% 18.7% 17.9% 0.3% $28.2 2.7% $1,027 -4.5% -3.8% 10.9% 7.3% 95 0.8% 14.9% 16.6% 1.0% $32.0 3.4% $873 28.0% 29.0% 21.2% 15.6% 34 0.7% 11.9% 15.6% 2.0% $13.0 1.8% $648 37.6% 38.8% 35.5% 35.2% 19 0.6% $4.4 0.8% $512 17.4% 18.6% 22.3% 21.6% 3 N.M. $0.5 0.2% $276 Annualized Returns (as of 12/31/11) † Inception of 12/31/95 18.7% 19.7% 1.1% 0.4% N.M. - Information is not statistically meaningful due to an insufficient number 13.2% 14.2% 9.0% 11.5% of portfolios in the composite for the entire year. 2.1% 3.0% -3.7% -2.6% N.A. - Data is less than one year. 5.1% 5.9% 2.3% 3.9% 8.1% 9.0% 6.2% 7.2% Logan Concentrated Value (LCV) Composite contains fully discretionary large cap value equity accounts, measured against the Russell 1000 Value and Russell 200 Value benchmarks. The strategy invests in 10-12 very large cap stocks with strong balance sheets, strong cash flows and relatively high dividend yields.
ADR’s may be included in the portfolio (generally less than 20%). Turnover is typically 30-50% annually. Only accounts paying commission fees are included.
No minimum account size for this composite. Logan Capital Management, Inc. claims compliance with the Global Investment Performance Standards (GIPS®) and has prepared and presented this report in compliance with the GIPS standards. Logan Capital Management, Inc.
has been independently verified for the periods April 1, 1994 through June 30, 2011 by Ashland Partners & Company LLP. A copy of the verification report(s) is/are available upon request. Verification assesses whether (1) the firm has complied with all the composite construction requirements of the GIPS standards on a firm-wide basis and (2) the firm’s policies and procedures are designed to calculate and present performance in compliance with the GIPS standards. Verification does not ensure the accuracy of any specific composite disclosure presentation. Logan Capital Management, Inc.
is a privately owned registered investment adviser. The firm maintains a complete list and description of composites, which is available upon request. Results are based on fully discretionary accounts under management, including those accounts no longer with the firm. Past performance is not indicative of future results. The U.S.
Dollar is the currency used to express performance. Returns are presented gross and net of management fees and include the reinvestment of all income. Net of fee performance was calculated using actual management fees.
The annual composite dispersion presented is an assetweighted standard deviation calculated for the accounts in the composite the entire year. Additional information regarding the policies for valuing portfolios, calculating performance, and preparing compliant presentations are available upon request. The investment management fee schedule is as follows: 80 basis points on the first $25 million, 70 basis points on the next $25 million, 50 basis points on the next $25 million and 45 basis points on the $25 million thereafter. The investment advisory fees charged for accounts whose market value exceeds $100 million are negotiable.
Accounts under $10 million will be charged a flat 1.00% per annum. Actual investment advisory fees incurred by clients may vary. The Logan Concentrated Value (LCV) Commission Composite was created August 1, 2000. Performance presented prior to August 1, 2000 represents that of Berwind Investment Management, L.P. 11 .
Additionally, investors are more likely to stick with a portfolio that utilizes strategies that rarely move together. In this paper we will present some of the research produced by academicians and practitioners on the effectiveness of momentum and value strategies. Moreover, we will provide real world evidence of the effectiveness of combining these strategies into a single portfolio. At Logan Capital our Growth team manages growth portfolios that use momentum as one factor in a multi-step process and our Value team manages value portfolios using a high dividend yield strategy.
Both strategies have a long history of outperforming their respective benchmarks. By combining these two strategies into one portfolio, Logan Capital’s Core portfolio has a consistent record generating significantly higher returns than the S&P 500 and superior risk adjusted performance. 1 Asness, C. 1997.
“The Interaction of Value and Momentum Strategies”, Financial Analyst Journal, March/April (1997) 2 “Momentum Investing Finally Accessible for Individual Investors” by T J Moskowitz. Investments and Wealth Monitor. 1 . Momentum Investing Momentum investing is a strategy based on research that has shown that high price-momentum stocks outperform low price-momentum stocks3. In general, stocks that have recently performed the best over a period of time (often measured over 12 months excluding the most recent month) continue to do well over subsequent periods, and stocks that have performed the worst continue to perform poorly. The robustness of momentum strategies has been supported by numerous academic and practitioners’ studies that have been published since the early 1990’s4. One recent study (by Tobias Markowitz)5 summarized in the chart below was based on a universe of U.S. stocks6 sorted annually into price-momentum quintiles covering data from 1927-2008.
The chart shows that the stocks with the best year-over-year price momentum (P5) outperformed the stocks with the worst price momentum (P1) in the following year, both on an absolute basis and relative to the overall market. The same study showed that price momentum has worked both for large cap and small cap stocks. For the thirty year period December 1979 through December 2009, large cap momentum stocks outperformed the Russell 1000 Index by about 2% per year and small cap momentum stocks outperformed the Russell 2000 by 3.7% per year. 3 Jegadeesh, N. and S. Titman.
1993. Returns to Buying Winners and Selling Losers: Implications for stock market efficiency. The Journal of Finance 48, 65-91.; “The Case for Momentum Investing” AQR Capital Management Summer 2009 4 “The Case for Momentum Investing” AQR Capital Management Summer 2009 5 “Momentum Investing Finally Accessible for Individual Investors” by T J Moskowitz.
Investments and Wealth Monitor. 6 The universe is all publicly traded stocks in the U.S. with beginning of month share prices of at least $5, and excludes REITS, ADRs, and non-common shares. 2 . While the evidence that high momentum stocks outperform is persuasive, there is no agreement among researchers as to why momentum strategies work. For example, among those financial theorists who believe in the Efficient Market Hypothesis, the higher returns for high momentum strategies means that they are associated with an additional unique risk factor, which has not yet been identified. Taking a different tack, some Behavioral Economists believe that investors may react slowly to new information, and that it takes time for new information to be incorporated into stock prices. Another possible behavioral explanation is the idea of ‘herding’, which means investors buy more of a stock because they are following the crowd. Herd followers buy a stock simply because it is already going up, which further increases the stock price, which attracts more buyers7.
While there is no general agreement as to why price momentum has been a successful investing strategy, its success has withstood the test of time. Value Investing The value premium is one of the most consistent sources of excess return in equity markets. The value premium refers to the excess return that the value investor can earn by investing in “cheap” stocks. Academic research on value investing goes back to the 1970’s. In an often-cited seminal academic paper published in 1994, entitled “Contrarian Investment, Exploration and Risk”, the authors (Lakonishok, Shleifer, and Vishny) concluded that “value stocks” consistently outperformed “glamour” companies8 (which are generally fast growing companies) by wide margins for the period 1968 through 1994.
In this study stocks were sorted into the value or glamour (i.e., “growth”) category based on price-to-book (“P/B”), price-to-cash flow (“P/CF”), and price-to-earnings (“P/E”) ratios. Stocks that had low P/B, low P/CF or low P/E ratios were classified as value stocks and those stocks that had high values for the same ratios were classified as glamour (growth) stocks. Using the same methodology, the Brandes Institute extended this research through 20109.
Brandes also concluded that value stocks outperformed glamour stocks over the long term, both in the U.S. and globally. An additional factor which some value managers use for stock selection is dividend yield. An abundance of research studies10 have concluded that high dividend yield stocks outperform both low dividend yield stocks and the market over time.
Based on this research some value managers limit their investable universe only to stocks which have above-market yields. As discussed further in this paper, high dividend yield strategies work well among stocks with low momentum. 7 “Momentum-A Contrarian Case for Following the Herd” by J Hancock, GMO White Paper, March 2010 8 Lakonishok, Josef, Andrei Shleifer, and Robert W. Vishny.1994 “Contrarian Investment, Extrapolation, and Risk.” Journal of Finance, vol.
49, no. 5 (December)):1541-78 9 “Value vs. Growth a Global Phenomenon”, The Brandes Institute, December 2010 Siegel, J.
Stocks for the Long Run: The Definitive Guide to Financial Market Returns & Long Term Investment Strategies, 4th edition. 2007; Patel, P, CFA, Yao, S, Carlson, R, CFA, Banerji, A. Global Dividends-Short and Long Term.
Equity Reserch Quantitative Analysis, Credit Suisse, November 2009. 10 3 . How to explain the value premium? Once again for those who believe in the Efficient Market Hypothesis, the higher returns for value strategies means that value strategies should have higher risk. However, as shown in the table below both the large cap value index and small cap value index had higher returns and lower risk (standard deviation) than their respective growth indexes. From 1979-2011, large cap value outperformed large growth by 1.4% per year, and small cap value outperformed small growth by 4.0% per year. Value: Higher Return, Lower Risk January 1979 - December 2011 Russell 1000 Growth Russell 1000 Value Russell 2000 Growth Russell 2000 Value Return 10.4% 11.8% 9.0% 13.0% Standard Deviation 17.8% 15.1% 23.5% 17.8% Since risk measured by standard deviation does not explain the outperformance of value stocks, believers in efficient markets again suggest the higher returns are associated with an additional unique risk factor which has not been identified, while Behavioral Economists offer the theory that value investing works because investors are uncomfortable buying cheap stocks (likely because they may have been recent losers) and for this reason, they earn a return premium11. Combining Value and Momentum in the Real World Empirically, value and momentum are proven strategies that have unique attributes. Momentum and value each deliver excess returns, but because these returns are negatively correlated, the combination can provide higher risk adjusted performance12. Does combining value and momentum outperform in the real world? In this regard our own investment record suggests that the combination results in outperformance.
At Logan Capital two independent investment teams manage our growth and value portfolios. Each team utilizes investment strategies that are consistent with their investment style. Logan’s Growth team uses a multifactor ranking algorithm as an idea generator for possible buy candidates, which are then analyzed both fundamentally and technically. Although 65% of this ranking algorithm is earnings driven, price momentum is also recognized as an important factor which helps to identify growth stocks that are more likely to outperform, and is weighted at 20% in the growth model.
Given that the ranking algorithm is just one part of a multi-step discipline, Logan Growth cannot be considered a “pure” price momentum strategy. However, when we sampled Logan growth portfolios from different time periods we found that the stocks in the portfolio tended to skew toward the top third of the universe ranked by price momentum13. 11 Asness, C. 1997.
“The Interaction of Value and Momentum Strategies”, Financial Analyst Journal, March/April (1997) 12 Asness, C, Moskowitz, T and Pedersen, L Heje, “Value and momentum everywhere” National Bureau of Economic Research Working Papers (2000) 13 In addition, the Logan Growth strategy has a correlation coefficient of 0.88 to the AQR Large Cap Momentum Index from October 1995 to December 2011 as calculated by Zephyr StyleADVISOR. 4 . Logan’s Value team utilizes a large cap high dividend yield strategy. The Value team screens for large cap stocks that have strong fundamentals, then sorts those stocks by dividend yield. Those with the highest dividend yields are candidates for purchase. The Value team does not use high or low price momentum as one of its screening factors.
Interestingly, Asness (1997)14 showed that high dividend yield works better among stocks with poor momentum and does not work at all among stocks with high momentum. On the other hand, high price momentum strategies in general work best among low dividend yield stocks. Logan Capital Management has managed a Core strategy since 2001 that is a combination of Logan Growth and Logan Concentrated Value in a 50%/50% weighting, rebalanced semi-annually. Logan’s Growth and Value work well together because consistent with the studies discussed previously, the excess returns compared to the S&P 500 are negatively correlated (correlation: -0.43, January 1996December 2011), as is shown below. Zephyr StyleADVISOR Zephyr StyleADVISOR: Logan Capital Management Exces s Return vs .
Market Benchm ark / Tim e January 1996 - December 2011 (36-Month Mov ing Windows, Computed Monthly ) 20% Correlation: -0.43 Excess Return vs. S&P 500 15% 10% 5% 0% -5% -10% Dec 1998 Dec 1999 Dec 2001 Dec 2003 Dec 2005 Dec 2007 Dec 2009 Dec 2011 Time Logan Growth Logan Concentrated Value Please see important attached disclosures regarding performance shown above. The graph above shows that the excess returns of the two strategies rarely move together. The superior performance of the combined portfolio – Logan Core -- clearly demonstrates the value of combining strategies with negatively correlated excess returns in one portfolio. The graph below shows Logan Core’s annualized performance for various time periods ended December 2011. 14 Asness, C.
1997. “The Interaction of Value and Momentum Strategies”, Financial Analyst Journal, March/April (1997) 5 . Zephyr StyleADVISOR Z ephyr StyleADVI SOR: Logan Capit al Management Manager vs Benchm ark: Return October 2001 - December 2011 (not annualized if less than 1 y ear) 25 20 Return 15 10 5 0 1 year 2 years 3 years Logan Core 50/50 4 years 5 years 10 years S&P 500 Please see important attached disclosures regarding performance shown above. Since the previous graph is endpoint sensitive, it is also important to analyze Logan Core’s performance over rolling three year periods. As the graph below shows, the Core portfolio outperforms the benchmark in almost all three year periods. Zephyr StyleADVISOR Zephyr StyleADVISOR: Logan Capital Management Exces s Return vs. Market Benchm ark / Tim e October 2001 - December 2011 (36-Month Mov ing Windows, Com puted Monthly ) 7% Excess Return of Logan 50%/50% Core 6% Excess Return vs. S&P 500 5% 4% 3% 2% 1% 0% S&P 500 return -1% Sep 2004 Dec 2005 Dec 2006 Dec 2007 Dec 2008 Dec 2009 Dec 2010 Dec 2011 Tim e Logan Core 50/50 Please see important attached disclosures regarding performance shown above. 6 .
The graph on the previous page shows that the excess return of Logan Core has been consistently above the S&P 500 over time, making investors more likely to stick with the strategy. Conclusion Often when one applies a theoretical investment strategy in the real world, it comes up short. This may be because of a flawed strategy (based on data mining) or problems of implementation such as frictional trading costs, commissions and turnover. However, our own experience has shown that the skillful combination of two distinct and uncorrelated strategies managed by disciplined teams delivers a true all-weather strategy that has added consistent significant excess returns over the market from 2001 to 2011, a period with two bear markets as well as strong recoveries. During this period Logan Core was a consistent top quartile performer among its peer group, large cap core strategies, which suggests that the ability to deliver steady incremental returns is valuable in producing long-term performance.
The successful pairing of two consistently negatively correlated strategies such as Logan Core should continue to add value to an overall portfolio mix regardless of the market’s future performance. 7 . References Asness, C. "The Interaction of Value and Momentum Strategies." Financial Analysts Journal, 1997. Asness, C, Moskowitz, T and Pedersen, L. Value and Momentum Everywhere. Working Paper, National Bureau of Economic Research, 2009. Berger, A CFA, R Israel, T Moskowitz, PhD, Booth School of Business, University of Chicago.
The Case for Momentum Investing. AQR Capital Management, Summer 2009. Brandes Investment Partners. Value vs.
Glamour: a Global Phenomenon. The Brandes Institute, December 2010. Curran, R. "Maybe the Rearview Mirror is Right." The Wall Street Journal, May 3, 2010. Fama, E and K French.
Size, Value and Momentum in International Stock Returns. Working Paper, CSRP, 2011. Hancock, J. Momentum-A Contrarian Case for Following the Herd.
White Paper, GMO, 2010. Israel, R and T Moskowitz. How Tax Efficient are Equity Styles? Working Paper, University of Chicago Booth School of Business, 2010a. Jagadeesh, N and S Titman. "Returns to Buying winners and Selling Losers: Implications for Stock Market Efficiency." Journal of Finance 48, 1993: 65-91. Lakonishok, J, A Hleifer, and R Vishny.
"Contrarian Investment, Extrapolation, and Risk." Journal of Finance 49, 1994: 1541-78. Montier, J "Is Value Really Riskier Than Growth? Dream On." In Value Investing: Tools and Techniques for Intelligent Investment, by J Montier, Chapter 6. 2009. Moskowitz, T "Momentum Investing Finally Accessible for Individual Investors." Investments and Wealth Monitor, July/August 2010. Patel, P, CFA, Yao, S, Carlson, R, CFA, Banerji, A. Global Dividends-Short and Long Term.
Equity Reserch Quantitative Analysis, Credit Suisse, November 2009 Siegel, J Stocks for the Long Run: The Definitive Guide to Financial Market Returns & Long Term Investment Strategies, 4th edition. 2007 8 . Disclosure Logan Capital Management, Inc. Performance Results: Logan Core 50/50 October 1, 2001 through December 31, 2011 Composite Composite Total Return Total Return Net of Fees Pure Gross of S&P 500 Russell (%) Fees (%) (%) 1000 (%) Year YTD 2011 6.9% 9.2% 2.1% 1.5% 2010 22.8% 25.4% 15.1% 16.1% 2009 23.6% 26.2% 26.5% 28.4% 2008 -37.7% -36.2% -37.0% -37.6% 2007 8.3% 10.7% 5.5% 5.8% 2006 14.2% 16.6% 15.8% 15.5% 2005 2.3% 4.6% 4.9% 6.3% 2004 13.1% 15.5% 10.9% 11.4% 2003 24.9% 27.6% 28.7% 29.9% 2002 -20.3% -18.5% -22.1% -21.7% 2001† 7.5% 8.1% 10.7% 11.1% Annualized Returns (12/31/11) 1 Year 6.9% 9.2% 2.1% 1.5% 3 Year 17.5% 20.0% 14.1% 14.8% 5 Year 1.8% 4.1% -0.2% 0.0% Since Inception† 4.3% 6.6% 3.9% 4.3% Composite Composite Wrap Assets Total Assets Number Dispersion Composite S&P 500 3-Yr in in Total Assets of Composite Composite Gross of Fees 3-Yr Std 3-Yr Std Sharpe as a % of (Percent) ($millions) Firm Assets Dev (%) Dev (%) Ratio (%) Accounts (%) 0.9% 18.5% 18.7% 1.08% 10 73.4% $5.0 0.3% 1.0% 21.8% 21.9% -0.01% 10 53.2% $2.5 0.1% 0.6% 19.3% 19.6% -0.29% 10 77.4% $3.3 0.2% 0.5% 14.6% 15.1% -0.67% 14 87.3% $3.2 0.3% 0.8% 7.8% 7.7% 0.81% 16 71.4% $6.5 0.4% 0.4% 7.4% 6.8% 1.21% 12 78.8% $5.7 0.4% N.M. 9.1% 9.0% 1.49% 10 98.3% $5.1 0.5% N.M. 13.8% 14.9% 0.36% 4 43.2% $1.1 0.1% N.M. 4 79.1% $1.5 0.2% N.M. 6 100.0% $1.7 0.2% N.M. 2 100.0% $0.6 0.1% †Inception 9/30/01. Year 2001 results are for 9/30/01-12/31/01. N.M. - Information is not statistically meaningful due to an insufficient number of portfolios in the composite for the entire year. N/A - Data is less than one year. Firm Assets (millions) $1,873 $1,769 $1,539 $1,240 $1,658 $1,333 $1,123 $1,066 $1,006 $861 $912 Logan Core 50/50 Composite contains fully discretionary large cap growth and concentrated value equity accounts, measured against both the S&P 500 and the Russell 1000. 50% is invested in the Growth strategy, which invests in US securities with a market capitalization over $1 billion at time of purchase.
A small portion of the strategy (<10%) can be invest in ADR's and Canadian common shares. Turnover is low, typically under 35% and holdings range between 30 and 40 positions. 50% is invested in the LCV strategy, which invests in 10-12 very large cap stocks with strong balance sheets, strong cash flows and relatively high dividend yields.
ADR’s may be included in the portfolio (generally less than 20%). Turnover is typically 30-50% annually. Includes accounts paying both wrap and commission fees.
The minimum account size for this composite is $100 thousand. Logan Capital Management, Inc. claims compliance with the Global Investment Performance Standards (GIPS®) and has prepared and presented this report in compliance with the GIPS standards. Logan Capital Management, Inc.
has been independently verified for the periods April 1, 1994 through June 30, 2011 by Ashland Partners & Company LLP. A copy of the verification report(s) is/are available upon request. Verification assesses whether (1) the firm has complied with all the composite construction requirements of the GIPS standards on a firm-wide basis and (2) the firm’s policies and procedures are designed to calculate and present performance in compliance with the GIPS standards. Verification does not ensure the accuracy of any specific composite disclosure presentation. In presentations shown prior to September 30, 2010 performance had incorrect net of fees returns, reflecting only the deduction of Logan's management fee.
This has been corrected and the net of fees returns now reflect the highest (2.2%) wrap fee deduction. Logan Capital Management, Inc. is a privately owned registered investment adviser. The firm maintains a complete list and description of composites, which is available upon request. Results are based on fully discretionary accounts under management, including those accounts no longer with the firm.
Past performance is not indicative of future results. The U.S. Dollar is the currency used to express performance. Returns are presented gross and net of management fees and include the reinvestment of all income.
Gross returns are shown as supplemental information. Some accounts in the composite pay a bundled wrap fee based on a percentage of assets under management. Other than portfolio management, this fee includes brokerage commissions, portfolio monitoring, consulting services, and in some cases, custodial services.
As of December 31, 2011, 73.4% of the composite assets were charged a wrap fee. Gross returns for accounts paying a wrap fee are stated gross of all fees and transaction costs; net returns are reduced by all fees and transaction costs incurred. Gross returns for non-wrap accounts have been reduced by transaction costs; net returns have been reduced by management fees and transaction costs.
Net of fee performance was calculated using model fees. The annual composite dispersion presented is an asset-weighted standard deviation calculated for the accounts in the composite the entire year. Additional information regarding the policies for valuing portfolios, calculating performance, and preparing compliant presentations are available upon request. The investment management fee schedule for non-wrap accounts is as follows: 80 basis points on the first $25 million, 70 basis points on the next $25 million, 50 basis points on the next $25 million and 45 basis points on the $25 million thereafter.
The investment advisory fees charged for accounts whose market value exceeds $100 million are negotiable. Accounts under $10 million will be charged a flat 1.00% per annum. Actual investment advisory fees incurred by clients may vary.
Wrap fee schedules are provided by independent wrap sponsors and are available upon request from the respective wrap sponsor. The Logan Core 50/50 Composite was created June 30, 2002. Prior to July 1, 2011 Logan Core 50/50 Composite was known as Logan Custom Allocation - 50% Growth & 50% Concentrated Value Composite. 9 . Logan Capital Management, Inc. Performance Results: Logan Growth Composite April 1, 1995 through December 31, 2011 Year YTD 2011 2010 2009 2008 2007 2006 2005 2004 2003 2002 2001 2000 1999 1998 1997 1996 1995^ 1 Year 3 Years 5 Years 10 Years Since Inception† Total Return Total Return Net of Fees Gross of Fees Russell 1000 (%) (%) Growth (%) -1.9% -1.0% 2.6% 35.4% 36.5% 16.7% 42.3% 43.4% 37.2% -50.1% -49.6% -38.4% 23.1% 24.0% 11.8% 7.0% 7.9% 9.1% 7.7% 8.6% 5.3% 15.8% 16.8% 6.3% 34.4% 35.6% 29.8% -29.7% -29.1% -27.9% -21.0% -20.3% -20.4% -18.0% -17.2% -22.4% 28.2% 29.4% 33.2% 41.8% 43.2% 38.7% 15.8% 16.9% 30.5% 23.3% 24.4% 23.1% 23.1% 23.9% 25.3% Annualized Returns (as of 12/31/11) -1.9% -1.0% 2.6% 23.6% 24.7% 18.0% 3.0% 3.9% 2.5% 3.9% 4.8% 2.6% 6.7% 7.7% 6.6% S&P 500 (%) 2.1% 15.1% 26.5% -37.0% 5.5% 15.8% 4.9% 10.9% 28.7% -22.1% -11.9% -9.1% 21.0% 28.6% 33.4% 23.0% 25.4% 2.1% 14.1% -0.2% 2.9% 7.5% Composite Composite Russell 1000 Composite 3- Assets in Number of Dispersion Gross 3-Yr Std Growth 3-Yr Yr Sharpe Composite % of Firm Firm Assets Accounts of Fees (%) ($millions) Dev (%) Std Dev (%) Ratio (%) ($millions) Assets 26 0.64% 21.3% 17.8% 1.2% $9.5 0.5% $1,873 24 0.82% 27.4% 22.1% 0.0% $12.8 0.7% $1,769 18 1.35% 24.7% 19.7% -0.2% $7.1 0.5% $1,539 20 0.67% 21.5% 16.4% -0.7% $4.0 0.3% $1,240 32 1.39% 11.4% 8.5% 0.8% $14.2 0.9% $1,658 28 0.73% 11.7% 8.3% 0.7% $9.8 0.7% $1,333 27 1.30% 11.2% 9.5% 1.6% $9.1 0.9% $1,123 26 2.36% 15.3% 15.5% 0.2% $9.1 0.9% $1,066 29 1.10% 19.5% 22.7% -0.5% $10.6 1.1% $1,006 27 0.71% 22.9% 25.2% -1.1% $9.1 1.1% $861 47 1.38% 23.6% 25.2% -3.4% $22.3 2.4% $912 67 2.37% 22.7% 22.8% 0.5% $44.0 4.3% $1,027 59 4.37% 18.0% 19.0% 1.4% $57.5 6.1% $873 32 4.80% 17.2% 17.9% 1.3% $25.8 3.7% $648 69 1.86% $40.6 7.4% $512 32 1.96% $18.5 6.1% $276 8 N.M. $4.0 2.1% $191 ^4/1/95 - 12/31/95 † Inception of 3/31/95 N.M. - Information is not statistically meaningful due to an insufficient number of portfolios in the composite for the entire year. N.A. - Data is less than one year. Logan Growth Composite contains fully discretionary mid to large cap growth equity accounts, measured against the Russell 1000 Growth benchmark. The strategy invests in US securities with a market capitalization over $1 billion at time of purchase.
A small portion of the strategy (<10%) can be invest in ADR's and Canadian common shares. Turnover is low, typically under 35% and holdings range between 30 and 40 positions. Only accounts paying commission fees are included.
The minimum account size for this composite is $100 thousand; prior to March 31, 2003 the minimum account size was $300 thousand. Logan Capital Management, Inc. claims compliance with the Global Investment Performance Standards (GIPS®) and has prepared and presented this report in compliance with the GIPS standards. Logan Capital Management, Inc.
has been independently verified for the periods April 1, 1994 through June 30, 2011 by Ashland Partners & Company LLP. A copy of the verification report(s) is/are available upon request. Verification assesses whether (1) the firm has complied with all the composite construction requirements of the GIPS standards on a firm-wide basis and (2) the firm’s policies and procedures are designed to calculate and present performance in compliance with the GIPS standards. Verification does not ensure the accuracy of any specific composite disclosure presentation. Logan Capital Management, Inc.
is a privately owned registered investment adviser. The firm maintains a complete list and description of composites, which is available upon request. Results are based on fully discretionary accounts under management, including those accounts no longer with the firm. Past performance is not indicative of future results. The U.S.
Dollar is the currency used to express performance. Returns are presented gross and net of management fees and include the reinvestment of all income. Net of fee performance was calculated using actual management fees.
The annual composite dispersion presented is an asset-weighted standard deviation calculated for the accounts in the composite the entire year. Additional information regarding the policies for valuing portfolios, calculating performance, and preparing compliant presentations are available upon request.The investment management fee schedule is as follows: 80 basis points on the first $25 million, 70 basis points on the next $25 million, 50 basis points on the next $25 million and 45 basis points on the $25 million thereafter. The investment advisory fees charged for accounts whose market value exceeds $100 million are negotiable.
Accounts under $10 million will be charged a flat 1.00% per annum. Actual investment advisory fees incurred by clients may vary. The Logan Growth Composite was created April 1, 1995. 10 . Logan Capital Management, Inc. Performance Results: LCV Composite January 1, 1996 through December 31, 2011 Year YTD 2011 2010 2009 2008 2007 2006 2005 2004 2003 2002 2001 2000 1999 1998 1997 1996 1 Year 3 Years 5 Years 10 Years Since Inception† Composite Total Return Total Return Number Dispersion Composite Russell 200 Composite 3- Assets in of Value 3-Yr Yr Sharpe Composite % of Firm Firm Assets Net of Fees Gross of Fees Russell 200 Russell 1000 Gross of Fees 3-Yr Std Value (%) Accounts (%) Dev (%) Std Dev (%) Ratio (%) ($millions) Assets ($millions) (%) (%) Value (%) 18.7% 19.7% 1.1% 0.4% 46 0.3% 18.2% 20.1% 0.8% $11.0 0.6% $1,873 12.5% 13.5% 11.7% 15.5% 30 0.4% 19.8% 22.0% -0.1% $5.8 0.3% $1,769 8.5% 9.5% 14.6% 19.7% 23 0.3% 17.9% 20.1% -0.4% $6.0 0.4% $1,539 -22.9% -22.3% -36.1% -36.8% 24 0.6% 11.7% 14.5% -0.4% $6.3 0.5% $1,240 -0.6% 0.3% 0.2% -0.2% 34 0.3% 7.3% 8.1% 0.5% $10.8 0.7% $1,658 23.9% 24.8% 23.0% 22.2% 34 0.4% 6.8% 6.4% 1.3% $10.6 0.8% $1,333 -0.4% 0.4% 4.6% 7.1% 41 0.3% 10.2% 9.3% 0.8% $20.1 1.8% $1,123 11.4% 12.1% 13.3% 16.5% 61 0.3% 15.0% 15.4% 0.4% $32.7 3.1% $1,066 19.2% 20.0% 26.8% 30.0% 83 0.5% 15.4% 16.6% 0.1% $45.2 4.5% $1,006 -10.0% -9.4% -18.0% -15.5% 70 0.3% 18.3% 17.6% -0.2% $34.0 4.0% $861 -0.8% -0.2% -8.8% -5.6% 71 0.4% 17.0% 15.1% -0.2% $35.8 3.9% $912 8.9% 9.6% 2.3% 7.0% 58 1.1% 18.7% 17.9% 0.3% $28.2 2.7% $1,027 -4.5% -3.8% 10.9% 7.3% 95 0.8% 14.9% 16.6% 1.0% $32.0 3.4% $873 28.0% 29.0% 21.2% 15.6% 34 0.7% 11.9% 15.6% 2.0% $13.0 1.8% $648 37.6% 38.8% 35.5% 35.2% 19 0.6% $4.4 0.8% $512 17.4% 18.6% 22.3% 21.6% 3 N.M. $0.5 0.2% $276 Annualized Returns (as of 12/31/11) † Inception of 12/31/95 18.7% 19.7% 1.1% 0.4% N.M. - Information is not statistically meaningful due to an insufficient number 13.2% 14.2% 9.0% 11.5% of portfolios in the composite for the entire year. 2.1% 3.0% -3.7% -2.6% N.A. - Data is less than one year. 5.1% 5.9% 2.3% 3.9% 8.1% 9.0% 6.2% 7.2% Logan Concentrated Value (LCV) Composite contains fully discretionary large cap value equity accounts, measured against the Russell 1000 Value and Russell 200 Value benchmarks. The strategy invests in 10-12 very large cap stocks with strong balance sheets, strong cash flows and relatively high dividend yields.
ADR’s may be included in the portfolio (generally less than 20%). Turnover is typically 30-50% annually. Only accounts paying commission fees are included.
No minimum account size for this composite. Logan Capital Management, Inc. claims compliance with the Global Investment Performance Standards (GIPS®) and has prepared and presented this report in compliance with the GIPS standards. Logan Capital Management, Inc.
has been independently verified for the periods April 1, 1994 through June 30, 2011 by Ashland Partners & Company LLP. A copy of the verification report(s) is/are available upon request. Verification assesses whether (1) the firm has complied with all the composite construction requirements of the GIPS standards on a firm-wide basis and (2) the firm’s policies and procedures are designed to calculate and present performance in compliance with the GIPS standards. Verification does not ensure the accuracy of any specific composite disclosure presentation. Logan Capital Management, Inc.
is a privately owned registered investment adviser. The firm maintains a complete list and description of composites, which is available upon request. Results are based on fully discretionary accounts under management, including those accounts no longer with the firm. Past performance is not indicative of future results. The U.S.
Dollar is the currency used to express performance. Returns are presented gross and net of management fees and include the reinvestment of all income. Net of fee performance was calculated using actual management fees.
The annual composite dispersion presented is an assetweighted standard deviation calculated for the accounts in the composite the entire year. Additional information regarding the policies for valuing portfolios, calculating performance, and preparing compliant presentations are available upon request. The investment management fee schedule is as follows: 80 basis points on the first $25 million, 70 basis points on the next $25 million, 50 basis points on the next $25 million and 45 basis points on the $25 million thereafter. The investment advisory fees charged for accounts whose market value exceeds $100 million are negotiable.
Accounts under $10 million will be charged a flat 1.00% per annum. Actual investment advisory fees incurred by clients may vary. The Logan Concentrated Value (LCV) Commission Composite was created August 1, 2000. Performance presented prior to August 1, 2000 represents that of Berwind Investment Management, L.P. 11 .


